Serie
s 20
, Nu
mb
er 3
2 M
arc
h 2
007
Autopsy Patterns in 2003
Copyright information
All material appearing in this report is in the public domain and may be reproduced or copied without permission; citation as to source, however, is appreciated.
Suggested citation
Hoyert DL, Kung HC, Xu J. Autopsy patterns in 2003. National Center for Health Statistics. Vital Health Stat 20(32). 2007.
Library of Congress Cataloging-in-Publication Data
Autopsy patterns in 2003. p. ; cm. — (DHHS publication; no. (PHS) 2007–1851) (Vital and health
statistics. Series 20; no. 32) Includes bibliographical references. ISBN 0–8406–0613–3
1. Autopsy—United States—Statistics. 2. United States—Statistics, Medical. I. National Center for Health Statistics (U.S.) II. Series. III. Series: Vital and health statistics. Series 20, Data from the national vital statistics system; no. 32.
[DNLM: 1. Autopsy—statistics & numerical data—United States. W2 A N148vt no.32 2005]
RA1063.4.A88 2007 614’.1—dc22
2006035383
For sale by the U.S. Government Printing Office Superintendent of Documents Mail Stop: SSOP Washington, DC 20402-9328 Printed on acid-free paper.
Series 20, Number 32
Autopsy Patterns in 2003
Data on Mortality
U.S. DEPARTMENT OF HEALTH AND HUMAN SERVICES Centers for Disease Control and Prevention National Center for Health Statistics
Hyattsville, Maryland March 2007 DHHS Publication No. (PHS) 2007-1851
National Center for Health Statistics
Edward J. Sondik, Ph.D., Director
Jennifer H. Madans, Ph.D., Acting Co-Deputy Director
Michael H. Sadagursky, Acting Co-Deputy Director
Jennifer H. Madans, Ph.D., Associate Director for Science
Jennifer H. Madans, Ph.D., Acting Associate Director for Planning, Budget, and Legislation
Michael H. Sadagursky, Associate Director for Management and Operations
Lawrence H. Cox, Ph.D., Associate Director for Research and Methodology
Margot A. Palmer, Director for Information Technology
Margot A. Palmer, Acting Director for Information Services
Linda T. Bilheimer, Ph.D., Associate Director for Analysis and Epidemiology
Charles J. Rothwell, M.S., Director for Vital Statistics
Jane E. Sisk, Ph.D., Director for Health Care Statistics
Jane F. Gentleman, Ph.D., Director for Health Interview Statistics
Clifford L. Johnson, Director for Health and Nutrition Examination Surveys
Division of Vital Statistics
Charles J. Rothwell, M.S., Director
James A. Weed, Ph.D., Deputy Director
Robert N. Anderson, Ph.D., Chief, Mortality Statistics Branch
Contents
Abstract . . . . . . . . . . . . . . . . . . . . . . . . . . . . . . . . . . . . . . . . . . . . . . . . . . . . . . . . . . . . . . . . . . . . . . . . . . . . . . . . . . . . . . . . . . . . . . . . . 1
Introduction . . . . . . . . . . . . . . . . . . . . . . . . . . . . . . . . . . . . . . . . . . . . . . . . . . . . . . . . . . . . . . . . . . . . . . . . . . . . . . . . . . . . . . . . . . . . . . 1
Background . . . . . . . . . . . . . . . . . . . . . . . . . . . . . . . . . . . . . . . . . . . . . . . . . . . . . . . . . . . . . . . . . . . . . . . . . . . . . . . . . . . . . . . . . . . . . . 1
Methods . . . . . . . . . . . . . . . . . . . . . . . . . . . . . . . . . . . . . . . . . . . . . . . . . . . . . . . . . . . . . . . . . . . . . . . . . . . . . . . . . . . . . . . . . . . . . . . . . 2
Results . . . . . . . . . . . . . . . . . . . . . . . . . . . . . . . . . . . . . . . . . . . . . . . . . . . . . . . . . . . . . . . . . . . . . . . . . . . . . . . . . . . . . . . . . . . . . . . . . . 2 Comparison with 1993 . . . . . . . . . . . . . . . . . . . . . . . . . . . . . . . . . . . . . . . . . . . . . . . . . . . . . . . . . . . . . . . . . . . . . . . . . . . . . . . . . . . 3 Age and Manner of Death Adjustment. . . . . . . . . . . . . . . . . . . . . . . . . . . . . . . . . . . . . . . . . . . . . . . . . . . . . . . . . . . . . . . . . . . . . . . 4
Conclusion . . . . . . . . . . . . . . . . . . . . . . . . . . . . . . . . . . . . . . . . . . . . . . . . . . . . . . . . . . . . . . . . . . . . . . . . . . . . . . . . . . . . . . . . . . . . . . . 4
References . . . . . . . . . . . . . . . . . . . . . . . . . . . . . . . . . . . . . . . . . . . . . . . . . . . . . . . . . . . . . . . . . . . . . . . . . . . . . . . . . . . . . . . . . . . . . . . 6
Appendix . . . . . . . . . . . . . . . . . . . . . . . . . . . . . . . . . . . . . . . . . . . . . . . . . . . . . . . . . . . . . . . . . . . . . . . . . . . . . . . . . . . . . . . . . . . . . . . . 18 Technical Notes . . . . . . . . . . . . . . . . . . . . . . . . . . . . . . . . . . . . . . . . . . . . . . . . . . . . . . . . . . . . . . . . . . . . . . . . . . . . . . . . . . . . . . . . . 18
Text Figures
1. Percentage of deaths for which autopsies were reported, by race: 47 states and the District of Columbia, 1993 and2003. . . . . . . . . . . . . . . . . . . . . . . . . . . . . . . . . . . . . . . . . . . . . . . . . . . . . . . . . . . . . . . . . . . . . . . . . . . . . . . . . . . . . . . . . . . . . . 4
2. Percentage of deaths for which autopsies were reported, by sex: 47 states and the District of Columbia, 1993 and2003. . . . . . . . . . . . . . . . . . . . . . . . . . . . . . . . . . . . . . . . . . . . . . . . . . . . . . . . . . . . . . . . . . . . . . . . . . . . . . . . . . . . . . . . . . . . . . 5
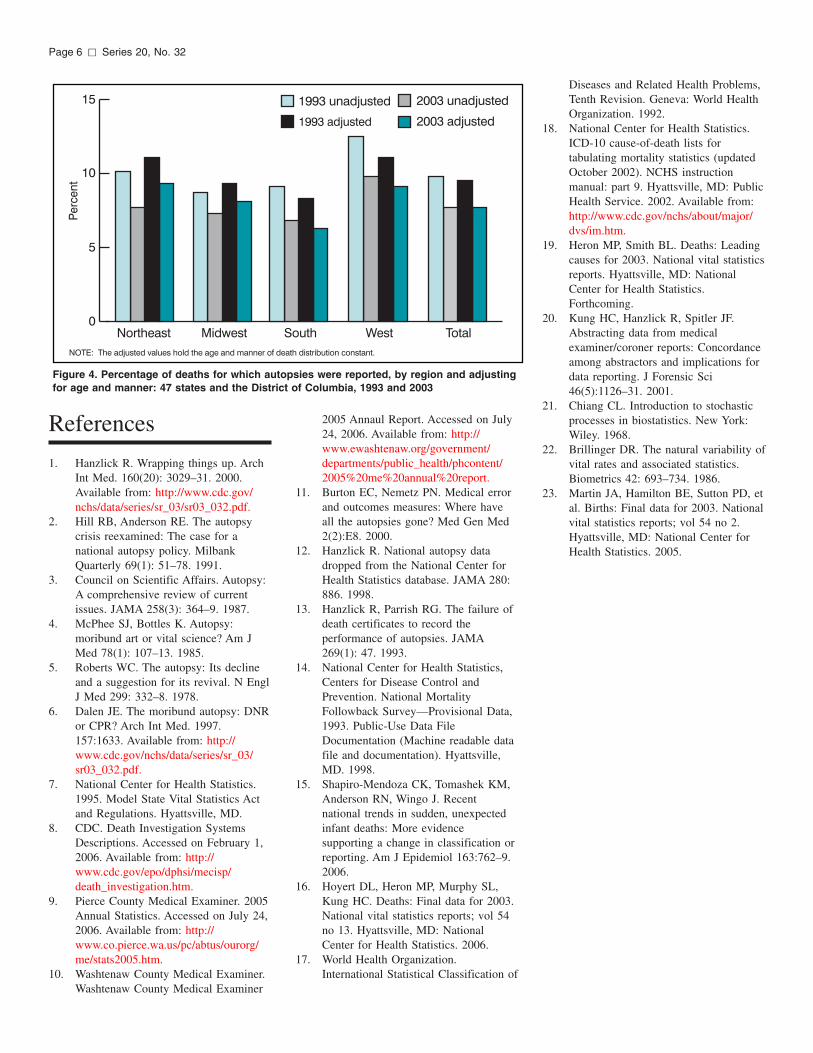
3. Percentage of deaths for which autopsies were reported, by age groups: 47 states and the District of Columbia, 1993and 2003 . . . . . . . . . . . . . . . . . . . . . . . . . . . . . . . . . . . . . . . . . . . . . . . . . . . . . . . . . . . . . . . . . . . . . . . . . . . . . . . . . . . . . . . . . . 5
4. Percentage of deaths for which autopsies were reported, by region and adjusting for age and manner: 47 states andthe District of Columbia, 1993 and 2003 . . . . . . . . . . . . . . . . . . . . . . . . . . . . . . . . . . . . . . . . . . . . . . . . . . . . . . . . . . . . . . . . 6
Text Tables
A. Percentage of responses on the death certificate item on autopsy in agreement with corresponding National MortalityFollowback item: United States, 1993. . . . . . . . . . . . . . . . . . . . . . . . . . . . . . . . . . . . . . . . . . . . . . . . . . . . . . . . . . . . . . . . . . . 2
B. Number of deaths and percentage autopsied for selected causes: 47 states and the District of Columbia, 2003 . . . . . . . . 3 C. Number of infant deaths and percentage autopsied for selected causes: 47 states and the District of Columbia, 2003. . . 4
Detailed Tables
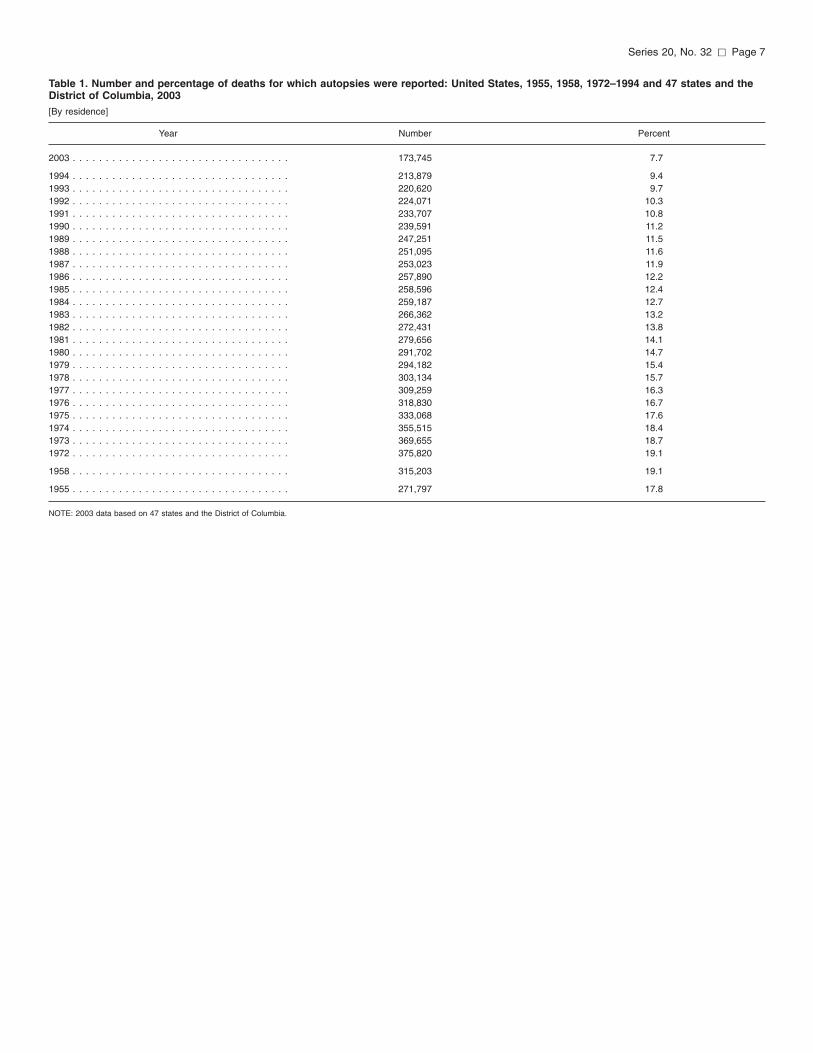
1. Number and percentage of deaths for which autopsies were reported: United States, 1955, 1958, 1972–1994 and47 states and the District of Columbia, 2003 . . . . . . . . . . . . . . . . . . . . . . . . . . . . . . . . . . . . . . . . . . . . . . . . . . . . . . . . . . . . . 7
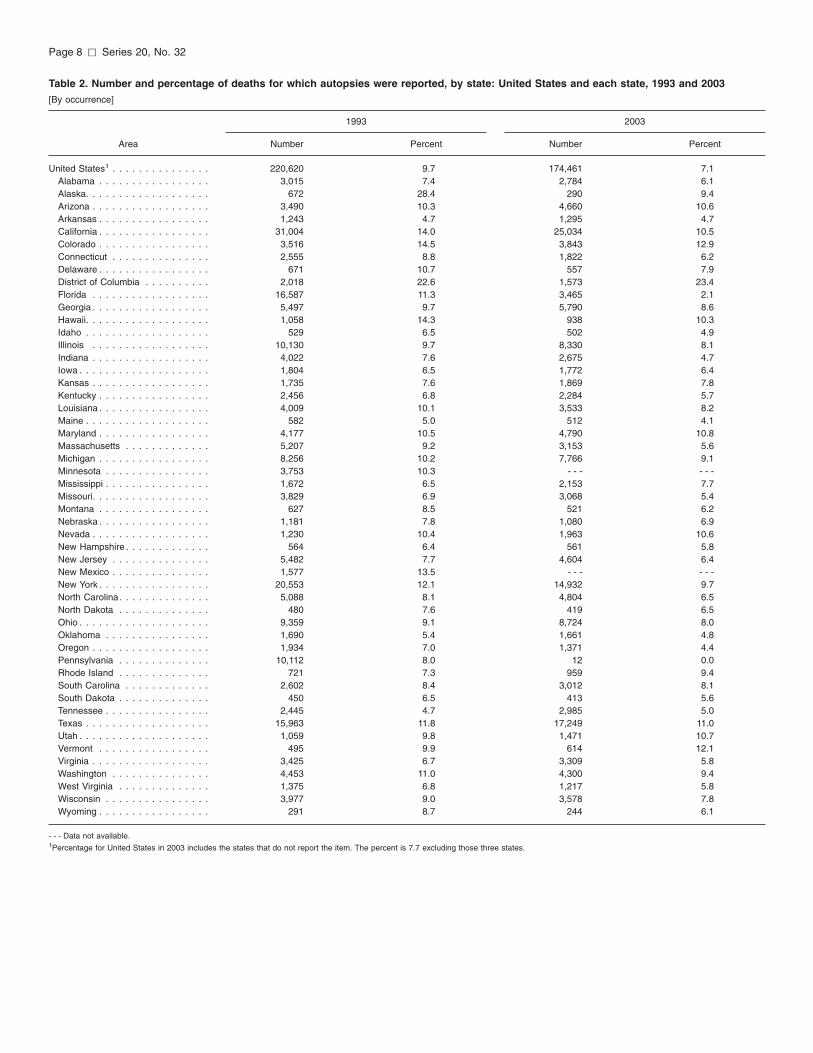
2. Number and percentage of deaths for which autopsies were reported, by state: United States and each state, 1993 and2003. . . . . . . . . . . . . . . . . . . . . . . . . . . . . . . . . . . . . . . . . . . . . . . . . . . . . . . . . . . . . . . . . . . . . . . . . . . . . . . . . . . . . . . . . . . . . . 8
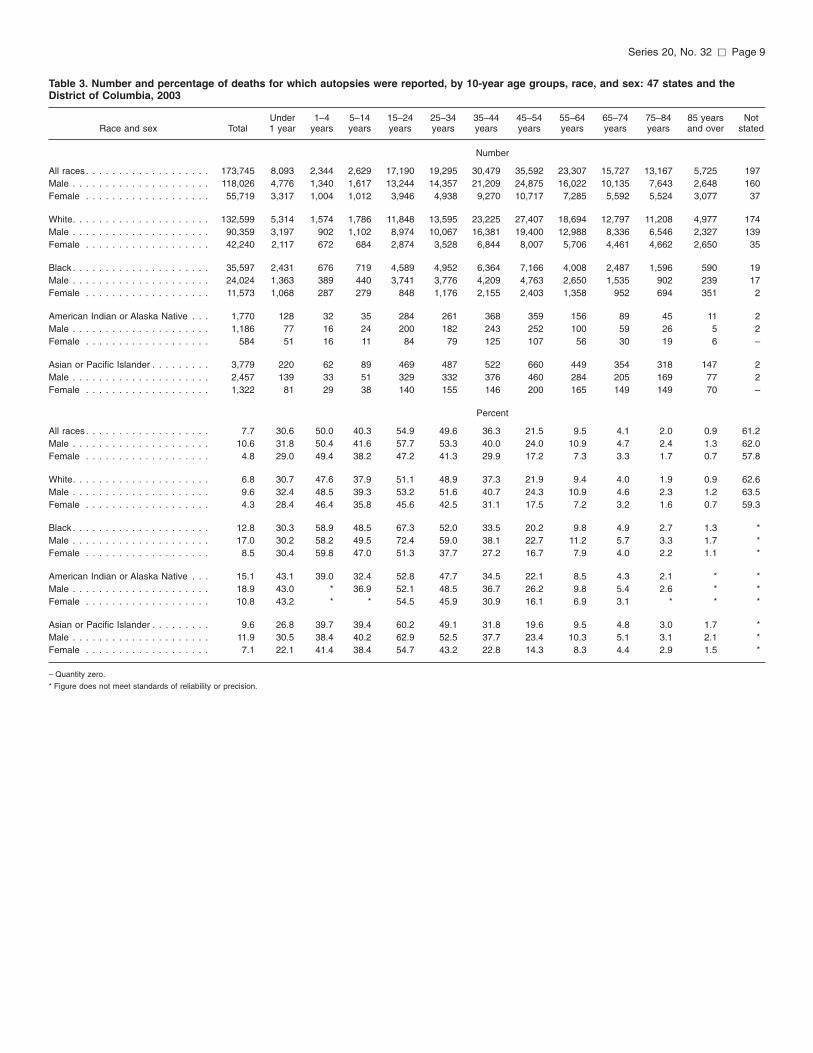
3. Number and percentage of deaths for which autopsies were reported, by 10-year age groups, race, and sex: 47 statesand the District of Columbia, 2003 . . . . . . . . . . . . . . . . . . . . . . . . . . . . . . . . . . . . . . . . . . . . . . . . . . . . . . . . . . . . . . . . . . . . . 9
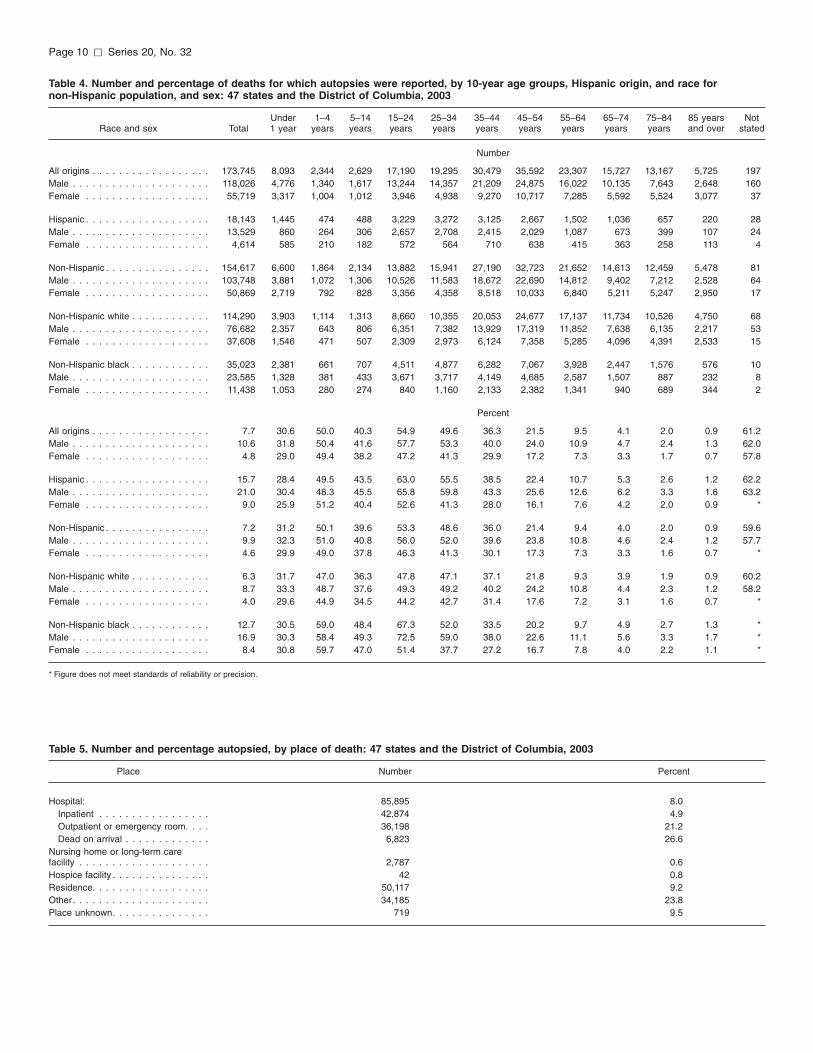
4. Number and percentage of deaths for which autopsies were reported, by 10-year age groups, Hispanic origin, and racefor non-Hispanic population, and sex: 47 states and the District of Columbia, 2003. . . . . . . . . . . . . . . . . . . . . . . . . . . . . . 10
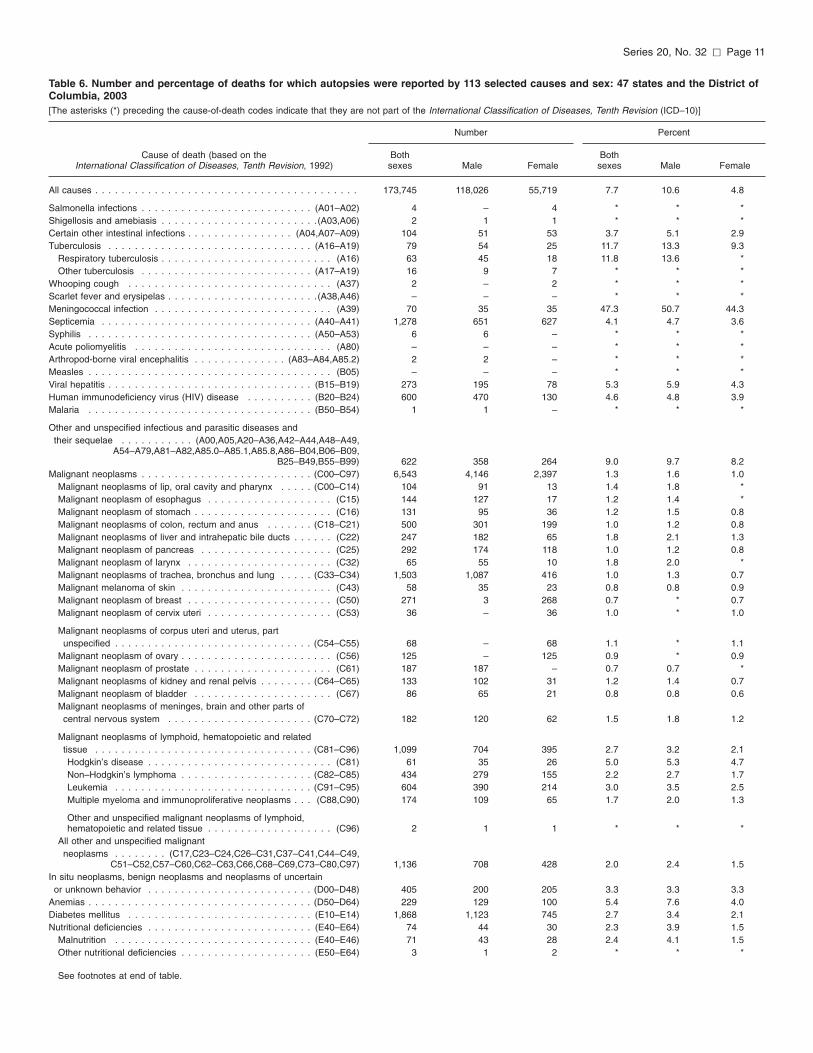
5. Number and percentage autopsied, by place of death: 47 states and the District of Columbia, 2003 . . . . . . . . . . . . . . . . . 10 6. Number and percentage of deaths for which autopsies were reported by 113 selected causes and sex: 47 states and
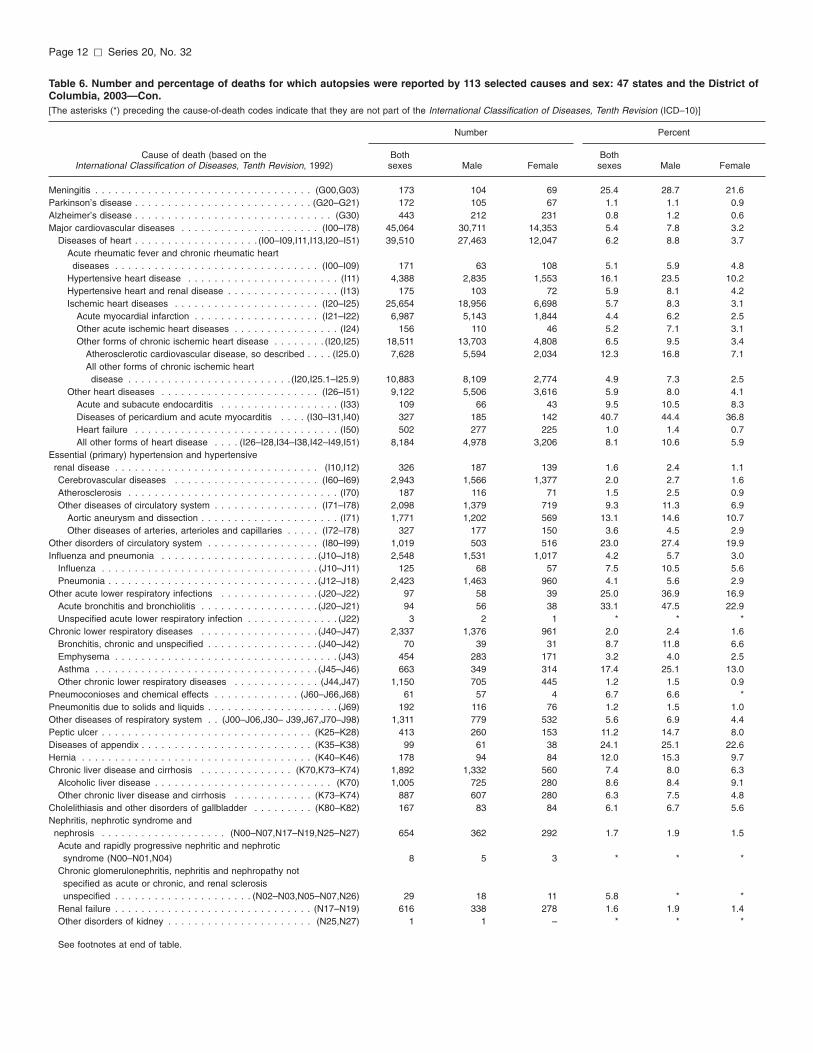
the District of Columbia, 2003. . . . . . . . . . . . . . . . . . . . . . . . . . . . . . . . . . . . . . . . . . . . . . . . . . . . . . . . . . . . . . . . . . . . . . . . . 11
iii

7. Number and percentage of infant deaths for which autopsies were reported, by 130 selected causes and sex: 47 statesand the District of Columbia, 2003 . . . . . . . . . . . . . . . . . . . . . . . . . . . . . . . . . . . . . . . . . . . . . . . . . . . . . . . . . . . . . . . . . . . . . 14
iv
Objectives This report presents information on
autopsy data in 2003 and compares data for 1993 and 2003.
Methods Death certificates are completed by
funeral directors, attending physicians, medical examiners, and coroners. The original records are filed in the state registration offices. Statistical information is compiled into a national database through the Vital Statistics Cooperative Program of the Centers for Disease Control and Prevention’s National Center for Health Statistics. This report focuses on the autopsy item on the death certificate and presents descriptive tabulations.
Results In 2003, autopsies were performed
for 7.7 percent of deaths occurring in 47 states and the District of Columbia. This was less than in 1994, when the data was last available in this database. Decedents with particular characteristics were more likely to be autopsied than others. For example, almost one-third of infant deaths, more than one-half of decedents aged 15–24 years, and almost none of the decedents aged 85 years and over were autopsied.
Keywords: autopsy c vital statistics c National Mortality Followback Survey
Autopsy Patterns in 2003 by Donna L. Hoyert, Ph.D.; Hsiang-Ching Kung, Ph.D.; and Jiaquan Xu, M.D., Division of Vital Statistics
Introduction
Autopsy serves a number of purposes (1–4); however, the prevalence of its use has varied
over time in the United States (1–6). Data from the Centers for Disease Control and Prevention’s National Center for Health Statistics (NCHS) was a source of information on the use of autopsy for 1955, 1958, 1972–94, and again in 2003. This report presents 2003 information on autopsy trends and provides some comparison with data for 1993.
Background
The prevalence of autopsies increased during the first half of the 20th century (2). According to
the literature, physicians and other hospital staff valued autopsies, and hospitals took great pride in having high autopsy rates around the midcentury (1–2). Reinforcing the demand for autopsies among hospitals and physicians, accreditation standards for hospitals and state laws about medico-legal investigations encouraged the performance of autopsies (2,4).
The Joint Commission on Accreditation of Hospitals (JCAH)
This report was prepared in the Division of Vital SCharles J. Rothwell, Director of DVS and Robert N. AHsiang-Ching Kung and Jiaquan Xu of MSB providedMortality Followback Survey. Registration Methods staEvaluation Branch provided consultation to state vital certificate data on which this report is based. Drs. Gresuggestions. This report was edited by Demarius V. MDesign and Publishing Staff; typeset by Jacqueline M.of CoCHIS/NCHM/Division of Creative Services.
standards required that hospitals autopsy 20 to 25 percent of deaths (3). Each of the states and some smaller jurisdictions had laws and regulations that specified when a death should be subject to a medico-legal investigation that may include autopsy. Although state laws varied in specific requirements, deaths that typically required investigation were those due to unusual or suspicious circumstances, violence (accident, suicide, or homicide), those due to natural disease processes when the death occurred suddenly and without warning, when the decedent was not being treated by a physician, or the death was unattended (7,8). This resulted in a relatively substantial percentage of deaths falling potentially under the jurisdiction of medical examiners or coroners who might use autopsy as one of the tools in their investigation. Of all the cases referred to a medical examiner or coroner including those for which the medical examiner or coroner decides not to investigate, 26 percent are autopsied, according to the 1993 National Mortality Followback Survey (NMFS). For those cases for which the medical examiner or coroner accepts jurisdiction and does further investigation, local medical examiner or coroner offices indicate that an autopsy is performed for more than one-half of the accepted cases (9,10).
tatistics (DVS) under the general direction of nderson, Chief, Mortality Statistics Branch (MSB). content related to autopsy data in the National ff and staff of the Data Acquisition and
statistics offices regarding collection of the death g G. Davis and Marcus Nashelsky provided iller, Office of Information Services, Information Davis and graphics produced by John Jeter, both
Page 1
Page 2 [ Series 20, No. 32
Results
For 2003, all states requested information on the death certificate as to whether autopsies
were performed; 47 states and the District of Columbia provided NCHS with data for this field. In 2003, autopsies were reported as performed on 173,745 decedents, or 7.7 percent of the deaths that occurred in 2003 in the 47 states and the District of Columbia (Table 1).
The percentage of deaths autopsied varied by geography (Table 2), with the highest levels in the West and lowest levels in the South. Colorado and the District of Columbia reported the highest levels (12.9 and 23.4 percent, respectively). Of the more than 3,000
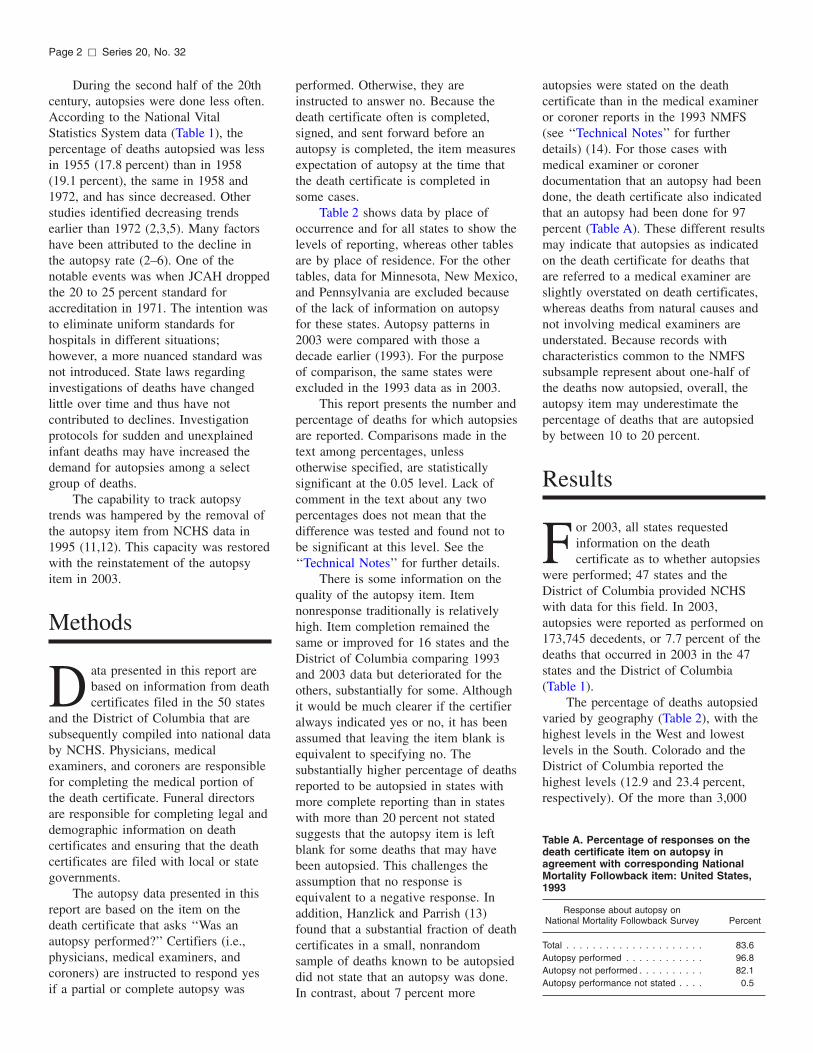
Table A. Percentage of responses on the death certificate item on autopsy in agreement with corresponding National Mortality Followback item: United States, 1993
Response about autopsy on National Mortality Followback Survey Percent
Total . . . . . . . . . . . . . . . . . . . . . 83.6 Autopsy performed . . . . . . . . . . . . 96.8 Autopsy not performed . . . . . . . . . . 82.1 Autopsy performance not stated . . . . 0.5
During the second half of the 20th century, autopsies were done less often. According to the National Vital Statistics System data (Table 1), the percentage of deaths autopsied was less in 1955 (17.8 percent) than in 1958 (19.1 percent), the same in 1958 and 1972, and has since decreased. Other studies identified decreasing trends earlier than 1972 (2,3,5). Many factors have been attributed to the decline in the autopsy rate (2–6). One of the notable events was when JCAH dropped the 20 to 25 percent standard for accreditation in 1971. The intention was to eliminate uniform standards for hospitals in different situations; however, a more nuanced standard was not introduced. State laws regarding investigations of deaths have changed little over time and thus have not contributed to declines. Investigation protocols for sudden and unexplained infant deaths may have increased the demand for autopsies among a select group of deaths.
The capability to track autopsy trends was hampered by the removal of the autopsy item from NCHS data in 1995 (11,12). This capacity was restored with the reinstatement of the autopsy item in 2003.
Methods
Data presented in this report are based on information from death certificates filed in the 50 states
and the District of Columbia that are subsequently compiled into national databy NCHS. Physicians, medical examiners, and coroners are responsible for completing the medical portion of the death certificate. Funeral directors are responsible for completing legal and demographic information on death certificates and ensuring that the death certificates are filed with local or state governments.
The autopsy data presented in this report are based on the item on the death certificate that asks ‘‘Was an autopsy performed?’’ Certifiers (i.e., physicians, medical examiners, and coroners) are instructed to respond yes if a partial or complete autopsy was
performed. Otherwise, they are instructed to answer no. Because the death certificate often is completed, signed, and sent forward before an autopsy is completed, the item measures expectation of autopsy at the time that the death certificate is completed in some cases.
Table 2 shows data by place of occurrence and for all states to show the levels of reporting, whereas other tables are by place of residence. For the other tables, data for Minnesota, New Mexico, and Pennsylvania are excluded because of the lack of information on autopsy for these states. Autopsy patterns in 2003 were compared with those a decade earlier (1993). For the purpose of comparison, the same states were excluded in the 1993 data as in 2003.
This report presents the number and percentage of deaths for which autopsies are reported. Comparisons made in the text among percentages, unless otherwise specified, are statistically significant at the 0.05 level. Lack of comment in the text about any two percentages does not mean that the difference was tested and found not to be significant at this level. See the ‘‘Technical Notes’’ for further details.
There is some information on the quality of the autopsy item. Item nonresponse traditionally is relatively high. Item completion remained the same or improved for 16 states and the District of Columbia comparing 1993 and 2003 data but deteriorated for the others, substantially for some. Although it would be much clearer if the certifier always indicated yes or no, it has been assumed that leaving the item blank is equivalent to specifying no. The substantially higher percentage of deaths reported to be autopsied in states with more complete reporting than in states with more than 20 percent not stated suggests that the autopsy item is left blank for some deaths that may have been autopsied. This challenges the assumption that no response is equivalent to a negative response. In addition, Hanzlick and Parrish (13) found that a substantial fraction of death certificates in a small, nonrandom sample of deaths known to be autopsied did not state that an autopsy was done. In contrast, about 7 percent more
autopsies were stated on the death certificate than in the medical examiner or coroner reports in the 1993 NMFS (see ‘‘Technical Notes’’ for further details) (14). For those cases with medical examiner or coroner documentation that an autopsy had been done, the death certificate also indicated that an autopsy had been done for 97 percent (Table A). These different results may indicate that autopsies as indicated on the death certificate for deaths that are referred to a medical examiner are slightly overstated on death certificates, whereas deaths from natural causes and not involving medical examiners are understated. Because records with characteristics common to the NMFS subsample represent about one-half of the deaths now autopsied, overall, the autopsy item may underestimate the percentage of deaths that are autopsied by between 10 to 20 percent.
Series 20, No. 32 [ Page 3
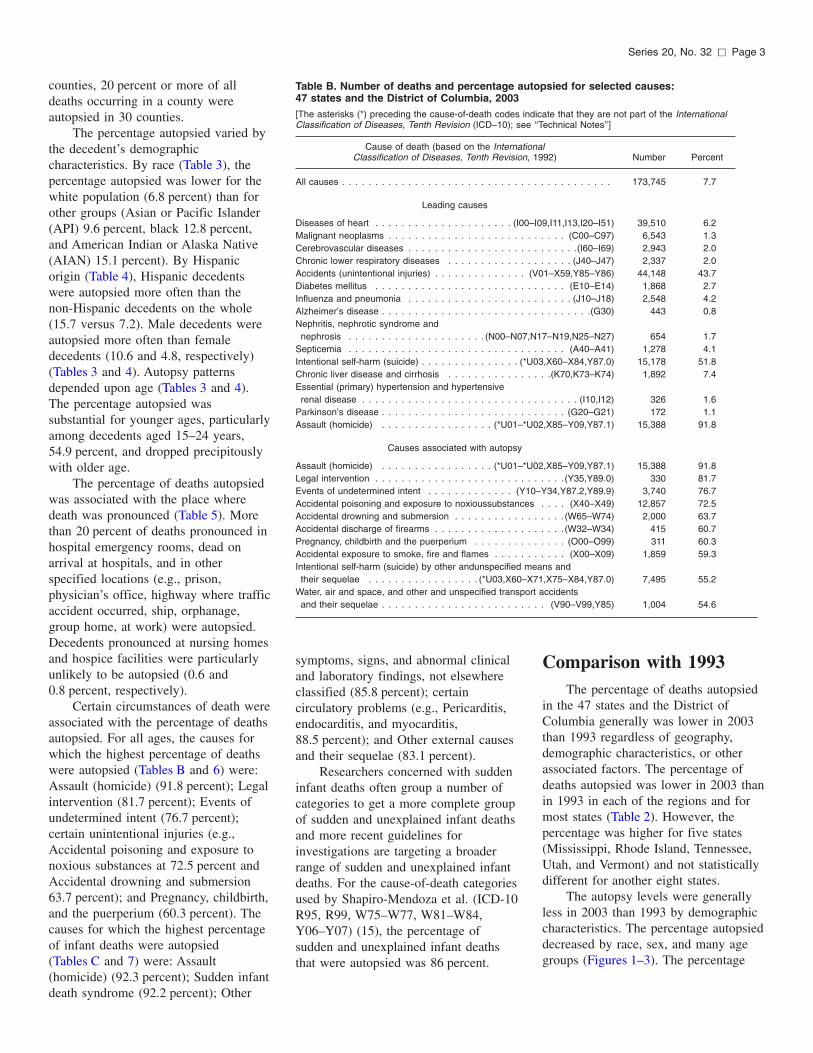
Table B. Number of deaths and percentage autopsied for selected causes: 47 states and the District of Columbia, 2003
[The asterisks (*) preceding the cause-of-death codes indicate that they are not part of the International Classification of Diseases, Tenth Revision (ICD–10); see ‘‘Technical Notes’’]
Cause of death (based on the International Classification of Diseases, Tenth Revision, 1992) Number Percent
All causes . . . . . . . . . . . . . . . . . . . . . . . . . . . . . . . . . . . . . . . . . 173,745 7.7
Leading causes
Diseases of heart . . . . . . . . . . . . . . . . . . . . . (I00–I09,I11,I13,I20–I51) 39,510 6.2Malignant neoplasms . . . . . . . . . . . . . . . . . . . . . . . . . . . (C00–C97) 6,543 1.3Cerebrovascular diseases . . . . . . . . . . . . . . . . . . . . . . . . . .(I60–I69) 2,943 2.0Chronic lower respiratory diseases . . . . . . . . . . . . . . . . . . . (J40–J47) 2,337 2.0Accidents (unintentional injuries) . . . . . . . . . . . . . . (V01–X59,Y85–Y86) 44,148 43.7Diabetes mellitus . . . . . . . . . . . . . . . . . . . . . . . . . . . . . (E10–E14) 1,868 2.7Influenza and pneumonia . . . . . . . . . . . . . . . . . . . . . . . . . (J10–J18) 2,548 4.2Alzheimer’s disease . . . . . . . . . . . . . . . . . . . . . . . . . . . . . . . .(G30) 443 0.8 Nephritis, nephrotic syndrome and
nephrosis . . . . . . . . . . . . . . . . . . . . . (N00–N07,N17–N19,N25–N27) 654 1.7Septicemia . . . . . . . . . . . . . . . . . . . . . . . . . . . . . . . . . (A40–A41) 1,278 4.1Intentional self-harm (suicide) . . . . . . . . . . . . . . . (*U03,X60–X84,Y87.0) 15,178 51.8Chronic liver disease and cirrhosis . . . . . . . . . . . . . . . .(K70,K73–K74) 1,892 7.4Essential (primary) hypertension and hypertensiverenal disease . . . . . . . . . . . . . . . . . . . . . . . . . . . . . . . . . (I10,I12) 326 1.6
Parkinson’s disease . . . . . . . . . . . . . . . . . . . . . . . . . . . . (G20–G21) 172 1.1Assault (homicide) . . . . . . . . . . . . . . . . . (*U01–*U02,X85–Y09,Y87.1) 15,388 91.8
Causes associated with autopsy
Assault (homicide) . . . . . . . . . . . . . . . . . (*U01–*U02,X85–Y09,Y87.1) 15,388 91.8Legal intervention . . . . . . . . . . . . . . . . . . . . . . . . . . . . . (Y35,Y89.0) 330 81.7 Events of undetermined intent . . . . . . . . . . . . . (Y10–Y34,Y87.2,Y89.9) 3,740 76.7Accidental poisoning and exposure to noxioussubstances . . . . (X40–X49) 12,857 72.5Accidental drowning and submersion . . . . . . . . . . . . . . . . . (W65–W74) 2,000 63.7Accidental discharge of firearms . . . . . . . . . . . . . . . . . . . . (W32–W34) 415 60.7Pregnancy, childbirth and the puerperium . . . . . . . . . . . . . . (O00–O99) 311 60.3Accidental exposure to smoke, fire and flames . . . . . . . . . . . (X00–X09) 1,859 59.3Intentional self-harm (suicide) by other andunspecified means and
their sequelae . . . . . . . . . . . . . . . . . (*U03,X60–X71,X75–X84,Y87.0) 7,495 55.2 Water, air and space, and other and unspecified transport accidents and their sequelae . . . . . . . . . . . . . . . . . . . . . . . . . (V90–V99,Y85) 1,004 54.6
counties, 20 percent or more of all deaths occurring in a county were autopsied in 30 counties.
The percentage autopsied varied by the decedent’s demographic characteristics. By race (Table 3), the percentage autopsied was lower for the white population (6.8 percent) than for other groups (Asian or Pacific Islander (API) 9.6 percent, black 12.8 percent, and American Indian or Alaska Native (AIAN) 15.1 percent). By Hispanic origin (Table 4), Hispanic decedents were autopsied more often than the non-Hispanic decedents on the whole (15.7 versus 7.2). Male decedents were autopsied more often than female decedents (10.6 and 4.8, respectively) (Tables 3 and 4). Autopsy patterns depended upon age (Tables 3 and 4). The percentage autopsied was substantial for younger ages, particularly among decedents aged 15–24 years, 54.9 percent, and dropped precipitously with older age.
The percentage of deaths autopsied was associated with the place where death was pronounced (Table 5). More than 20 percent of deaths pronounced in hospital emergency rooms, dead on arrival at hospitals, and in other specified locations (e.g., prison, physician’s office, highway where traffic accident occurred, ship, orphanage, group home, at work) were autopsied. Decedents pronounced at nursing homes and hospice facilities were particularly unlikely to be autopsied (0.6 and 0.8 percent, respectively).
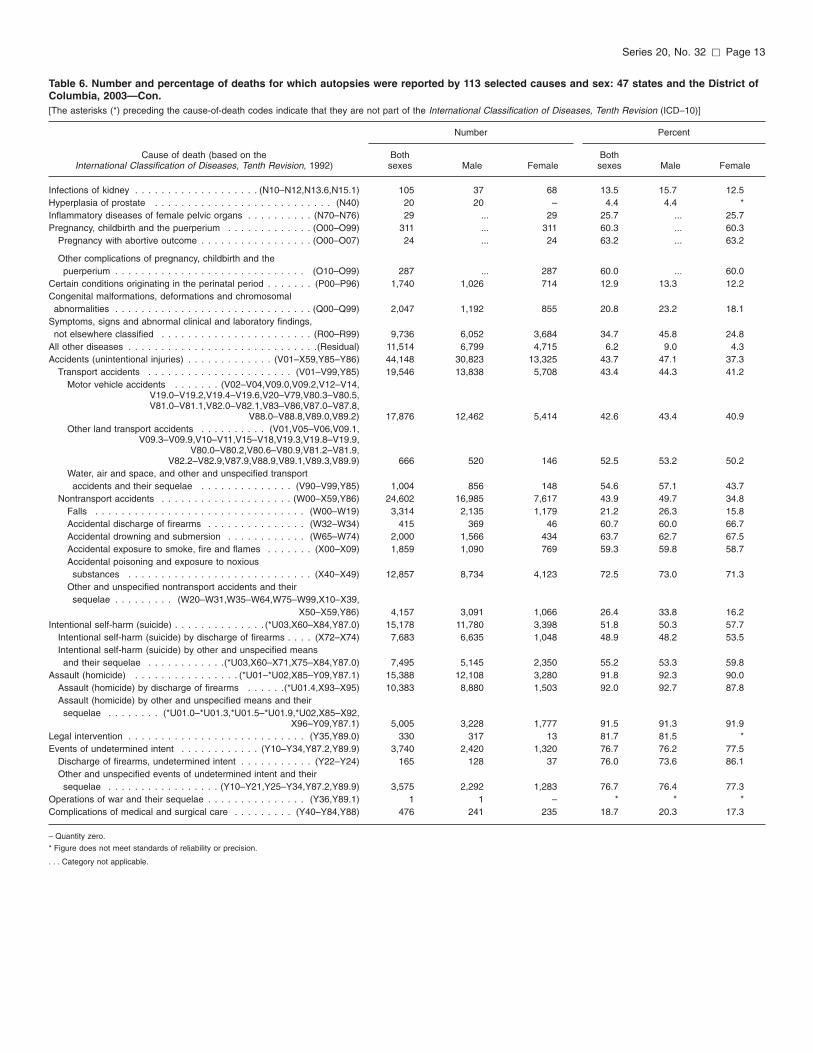
Certain circumstances of death were associated with the percentage of deaths autopsied. For all ages, the causes for which the highest percentage of deaths were autopsied (Tables B and 6) were: Assault (homicide) (91.8 percent); Legal intervention (81.7 percent); Events of undetermined intent (76.7 percent); certain unintentional injuries (e.g., Accidental poisoning and exposure to noxious substances at 72.5 percent and Accidental drowning and submersion 63.7 percent); and Pregnancy, childbirth, and the puerperium (60.3 percent). The causes for which the highest percentage of infant deaths were autopsied (Tables C and 7) were: Assault (homicide) (92.3 percent); Sudden infant death syndrome (92.2 percent); Other
symptoms, signs, and abnormal clinical and laboratory findings, not elsewhere classified (85.8 percent); certain circulatory problems (e.g., Pericarditis, endocarditis, and myocarditis, 88.5 percent); and Other external causes and their sequelae (83.1 percent).
Researchers concerned with sudden infant deaths often group a number of categories to get a more complete group of sudden and unexplained infant deaths and more recent guidelines for investigations are targeting a broader range of sudden and unexplained infant deaths. For the cause-of-death categories used by Shapiro-Mendoza et al. (ICD-10 R95, R99, W75–W77, W81–W84, Y06–Y07) (15), the percentage of sudden and unexplained infant deaths that were autopsied was 86 percent.
Comparison with 1993 The percentage of deaths autopsied
in the 47 states and the District of Columbia generally was lower in 2003 than 1993 regardless of geography, demographic characteristics, or other associated factors. The percentage of deaths autopsied was lower in 2003 than in 1993 in each of the regions and for most states (Table 2). However, the percentage was higher for five states (Mississippi, Rhode Island, Tennessee, Utah, and Vermont) and not statistically different for another eight states.
The autopsy levels were generally less in 2003 than 1993 by demographic characteristics. The percentage autopsied decreased by race, sex, and many age groups (Figures 1–3). The percentage
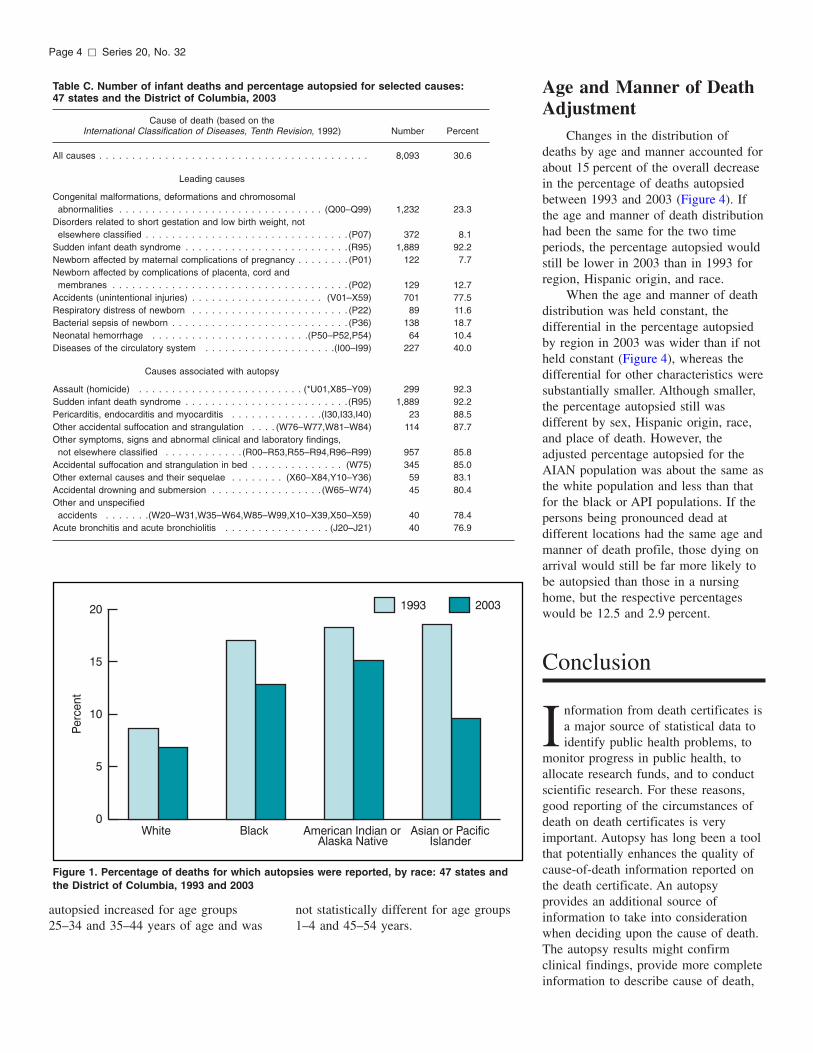
autopsied increased for age groups25–34 and 35–44 years of age and was
not statistically different for age groups1–4 and 45–54 years.
Figure 1. Percentage of deaths for which autopsies were reported, by race: 47 states andthe District of Columbia, 1993 and 2003
Table C. Number of infant deaths and percentage autopsied for selected causes:47 states and the District of Columbia, 2003
Cause of death (based on theInternational Classification of Diseases, Tenth Revision, 1992) Number Percent
All causes . . . . . . . . . . . . . . . . . . . . . . . . . . . . . . . . . . . . . . . . . 8,093 30.6
Leading causes
Congenital malformations, deformations and chromosomalabnormalities . . . . . . . . . . . . . . . . . . . . . . . . . . . . . . . (Q00–Q99) 1,232 23.3
Disorders related to short gestation and low birth weight, notelsewhere classified . . . . . . . . . . . . . . . . . . . . . . . . . . . . . . . (P07) 372 8.1
Sudden infant death syndrome . . . . . . . . . . . . . . . . . . . . . . . . .(R95) 1,889 92.2Newborn affected by maternal complications of pregnancy . . . . . . . . (P01) 122 7.7Newborn affected by complications of placenta, cord and
membranes . . . . . . . . . . . . . . . . . . . . . . . . . . . . . . . . . . . . (P02) 129 12.7Accidents (unintentional injuries) . . . . . . . . . . . . . . . . . . . . (V01–X59) 701 77.5Respiratory distress of newborn . . . . . . . . . . . . . . . . . . . . . . . . (P22) 89 11.6Bacterial sepsis of newborn . . . . . . . . . . . . . . . . . . . . . . . . . . . (P36) 138 18.7Neonatal hemorrhage . . . . . . . . . . . . . . . . . . . . . . . .(P50–P52,P54) 64 10.4Diseases of the circulatory system . . . . . . . . . . . . . . . . . . . .(I00–I99) 227 40.0
Causes associated with autopsy
Assault (homicide) . . . . . . . . . . . . . . . . . . . . . . . . . (*U01,X85–Y09) 299 92.3Sudden infant death syndrome . . . . . . . . . . . . . . . . . . . . . . . . .(R95) 1,889 92.2Pericarditis, endocarditis and myocarditis . . . . . . . . . . . . . .(I30,I33,I40) 23 88.5Other accidental suffocation and strangulation . . . . (W76–W77,W81–W84) 114 87.7Other symptoms, signs and abnormal clinical and laboratory findings,
not elsewhere classified . . . . . . . . . . . . (R00–R53,R55–R94,R96–R99) 957 85.8Accidental suffocation and strangulation in bed . . . . . . . . . . . . . . (W75) 345 85.0Other external causes and their sequelae . . . . . . . . (X60–X84,Y10–Y36) 59 83.1Accidental drowning and submersion . . . . . . . . . . . . . . . . . (W65–W74) 45 80.4Other and unspecified
accidents . . . . . . .(W20–W31,W35–W64,W85–W99,X10–X39,X50–X59) 40 78.4Acute bronchitis and acute bronchiolitis . . . . . . . . . . . . . . . . (J20–J21) 40 76.9
Page 4 [ Series 20, No. 32
Age and Manner of DeathAdjustment
Changes in the distribution ofdeaths by age and manner accounted forabout 15 percent of the overall decreasein the percentage of deaths autopsiedbetween 1993 and 2003 (Figure 4). Ifthe age and manner of death distributionhad been the same for the two timeperiods, the percentage autopsied wouldstill be lower in 2003 than in 1993 forregion, Hispanic origin, and race.
When the age and manner of deathdistribution was held constant, thedifferential in the percentage autopsiedby region in 2003 was wider than if notheld constant (Figure 4), whereas thedifferential for other characteristics weresubstantially smaller. Although smaller,the percentage autopsied still wasdifferent by sex, Hispanic origin, race,and place of death. However, theadjusted percentage autopsied for theAIAN population was about the same asthe white population and less than thatfor the black or API populations. If thepersons being pronounced dead atdifferent locations had the same age andmanner of death profile, those dying onarrival would still be far more likely tobe autopsied than those in a nursinghome, but the respective percentageswould be 12.5 and 2.9 percent.
Conclusion
I nformation from death certificates isa major source of statistical data toidentify public health problems, to
monitor progress in public health, toallocate research funds, and to conductscientific research. For these reasons,good reporting of the circumstances ofdeath on death certificates is veryimportant. Autopsy has long been a toolthat potentially enhances the quality ofcause-of-death information reported onthe death certificate. An autopsyprovides an additional source ofinformation to take into considerationwhen deciding upon the cause of death.The autopsy results might confirmclinical findings, provide more completeinformation to describe cause of death,
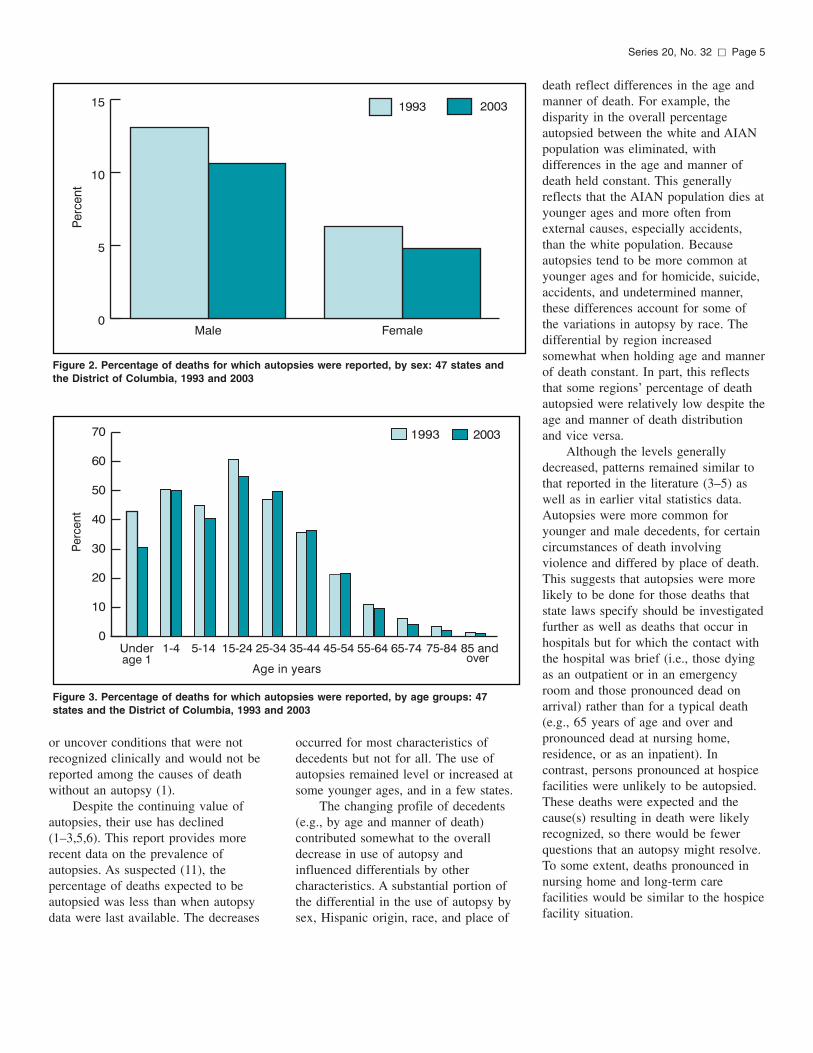
Figure 2. Percentage of deaths for which autopsies were reported, by sex: 47 states andthe District of Columbia, 1993 and 2003
Figure 3. Percentage of deaths for which autopsies were reported, by age groups: 47states and the District of Columbia, 1993 and 2003
Series 20, No. 32 [ Page 5
or uncover conditions that were notrecognized clinically and would not bereported among the causes of deathwithout an autopsy (1).
Despite the continuing value ofautopsies, their use has declined(1–3,5,6). This report provides morerecent data on the prevalence ofautopsies. As suspected (11), thepercentage of deaths expected to beautopsied was less than when autopsydata were last available. The decreases
occurred for most characteristics ofdecedents but not for all. The use ofautopsies remained level or increased atsome younger ages, and in a few states.
The changing profile of decedents(e.g., by age and manner of death)contributed somewhat to the overalldecrease in use of autopsy andinfluenced differentials by othercharacteristics. A substantial portion ofthe differential in the use of autopsy bysex, Hispanic origin, race, and place of
death reflect differences in the age andmanner of death. For example, thedisparity in the overall percentageautopsied between the white and AIANpopulation was eliminated, withdifferences in the age and manner ofdeath held constant. This generallyreflects that the AIAN population dies atyounger ages and more often fromexternal causes, especially accidents,than the white population. Becauseautopsies tend to be more common atyounger ages and for homicide, suicide,accidents, and undetermined manner,these differences account for some ofthe variations in autopsy by race. Thedifferential by region increasedsomewhat when holding age and mannerof death constant. In part, this reflectsthat some regions’ percentage of deathautopsied were relatively low despite theage and manner of death distributionand vice versa.
Although the levels generallydecreased, patterns remained similar tothat reported in the literature (3–5) aswell as in earlier vital statistics data.Autopsies were more common foryounger and male decedents, for certaincircumstances of death involvingviolence and differed by place of death.This suggests that autopsies were morelikely to be done for those deaths thatstate laws specify should be investigatedfurther as well as deaths that occur inhospitals but for which the contact withthe hospital was brief (i.e., those dyingas an outpatient or in an emergencyroom and those pronounced dead onarrival) rather than for a typical death(e.g., 65 years of age and over andpronounced dead at nursing home,residence, or as an inpatient). Incontrast, persons pronounced at hospicefacilities were unlikely to be autopsied.These deaths were expected and thecause(s) resulting in death were likelyrecognized, so there would be fewerquestions that an autopsy might resolve.To some extent, deaths pronounced innursing home and long-term carefacilities would be similar to the hospicefacility situation.
Page 6 [ Series 20, No. 32
Figure 4. Percentage of deaths for which autopsies were reported, by region and adjusting t of Columbia, 1993 and 2003
for age and manner: 47 states and the DistricReferences
1. Hanzlick R. Wrapping things up. Arch Int Med. 160(20): 3029–31. 2000. Available from: http://www.cdc.gov/ nchs/data/series/sr_03/sr03_032.pdf.
2. Hill RB, Anderson RE. The autopsy crisis reexamined: The case for a national autopsy policy. Milbank Quarterly 69(1): 51–78. 1991.
3. Council on Scientific Affairs. Autopsy: A comprehensive review of current issues. JAMA 258(3): 364–9. 1987.
4. McPhee SJ, Bottles K. Autopsy: moribund art or vital science? Am J Med 78(1): 107–13. 1985.
5. Roberts WC. The autopsy: Its decline and a suggestion for its revival. N Engl J Med 299: 332–8. 1978.
6. Dalen JE. The moribund autopsy: DNR or CPR? Arch Int Med. 1997. 157:1633. Available from: http:// www.cdc.gov/nchs/data/series/sr_03/ sr03_032.pdf.
7. National Center for Health Statistics. 1995. Model State Vital Statistics Act and Regulations. Hyattsville, MD.
8. CDC. Death Investigation Systems Descriptions. Accessed on February 1, 2006. Available from: http:// www.cdc.gov/epo/dphsi/mecisp/ death_investigation.htm.
9. Pierce County Medical Examiner. 2005 Annual Statistics. Accessed on July 24, 2006. Available from: http:// www.co.pierce.wa.us/pc/abtus/ourorg/ me/stats2005.htm.
10. Washtenaw County Medical Examiner. Washtenaw County Medical Examiner
2005 Annaul Report. Accessed on July 24, 2006. Available from: http:// www.ewashtenaw.org/government/ departments/public_health/phcontent/ 2005%20me%20annual%20report.
11. Burton EC, Nemetz PN. Medical error and outcomes measures: Where have all the autopsies gone? Med Gen Med 2(2):E8. 2000.
12. Hanzlick R. National autopsy data dropped from the National Center for Health Statistics database. JAMA 280: 886. 1998.
13. Hanzlick R, Parrish RG. The failure of death certificates to record the performance of autopsies. JAMA 269(1): 47. 1993.
14. National Center for Health Statistics, Centers for Disease Control and Prevention. National Mortality Followback Survey—Provisional Data, 1993. Public-Use Data File Documentation (Machine readable data file and documentation). Hyattsville, MD. 1998.
15. Shapiro-Mendoza CK, Tomashek KM, Anderson RN, Wingo J. Recent national trends in sudden, unexpected infant deaths: More evidence supporting a change in classification or reporting. Am J Epidemiol 163:762–9. 2006.
16. Hoyert DL, Heron MP, Murphy SL, Kung HC. Deaths: Final data for 2003. National vital statistics reports; vol 54 no 13. Hyattsville, MD: National Center for Health Statistics. 2006.
17. World Health Organization. International Statistical Classification of
Diseases and Related Health Problems, Tenth Revision. Geneva: World Health Organization. 1992.
18. National Center for Health Statistics. ICD-10 cause-of-death lists for tabulating mortality statistics (updated October 2002). NCHS instruction manual: part 9. Hyattsville, MD: Public Health Service. 2002. Available from: http://www.cdc.gov/nchs/about/major/ dvs/im.htm.
19. Heron MP, Smith BL. Deaths: Leading causes for 2003. National vital statistics reports. Hyattsville, MD: National Center for Health Statistics. Forthcoming.
20. Kung HC, Hanzlick R, Spitler JF. Abstracting data from medical examiner/coroner reports: Concordance among abstractors and implications for data reporting. J Forensic Sci 46(5):1126–31. 2001.
21. Chiang CL. Introduction to stochastic processes in biostatistics. New York: Wiley. 1968.
22. Brillinger DR. The natural variability of vital rates and associated statistics. Biometrics 42: 693–734. 1986.
23. Martin JA, Hamilton BE, Sutton PD, et al. Births: Final data for 2003. National vital statistics reports; vol 54 no 2. Hyattsville, MD: National Center for Health Statistics. 2005.
Series 20, No. 32 [ Page 7
Table 1. Number and percentage of deaths for which autopsies were reported: United States, 1955, 1958, 1972–1994 and 47 states and the District of Columbia, 2003
[By residence]
Year Number Percent
2003 . . . . . . . . . . . . . . . . . . . . . . . . . . . . . . . . . 173,745 7.7
1994 . . . . . . . . . . . . . . . . . . . . . . . . . . . . . . . . . 213,879 9.4 1993 . . . . . . . . . . . . . . . . . . . . . . . . . . . . . . . . . 220,620 9.7 1992 . . . . . . . . . . . . . . . . . . . . . . . . . . . . . . . . . 224,071 10.3 1991 . . . . . . . . . . . . . . . . . . . . . . . . . . . . . . . . . 233,707 10.8 1990 . . . . . . . . . . . . . . . . . . . . . . . . . . . . . . . . . 239,591 11.2 1989 . . . . . . . . . . . . . . . . . . . . . . . . . . . . . . . . . 247,251 11.5 1988 . . . . . . . . . . . . . . . . . . . . . . . . . . . . . . . . . 251,095 11.6 1987 . . . . . . . . . . . . . . . . . . . . . . . . . . . . . . . . . 253,023 11.9 1986 . . . . . . . . . . . . . . . . . . . . . . . . . . . . . . . . . 257,890 12.2 1985 . . . . . . . . . . . . . . . . . . . . . . . . . . . . . . . . . 258,596 12.4 1984 . . . . . . . . . . . . . . . . . . . . . . . . . . . . . . . . . 259,187 12.7 1983 . . . . . . . . . . . . . . . . . . . . . . . . . . . . . . . . . 266,362 13.2 1982 . . . . . . . . . . . . . . . . . . . . . . . . . . . . . . . . . 272,431 13.8 1981 . . . . . . . . . . . . . . . . . . . . . . . . . . . . . . . . . 279,656 14.1 1980 . . . . . . . . . . . . . . . . . . . . . . . . . . . . . . . . . 291,702 14.7 1979 . . . . . . . . . . . . . . . . . . . . . . . . . . . . . . . . . 294,182 15.4 1978 . . . . . . . . . . . . . . . . . . . . . . . . . . . . . . . . . 303,134 15.7 1977 . . . . . . . . . . . . . . . . . . . . . . . . . . . . . . . . . 309,259 16.3 1976 . . . . . . . . . . . . . . . . . . . . . . . . . . . . . . . . . 318,830 16.7 1975 . . . . . . . . . . . . . . . . . . . . . . . . . . . . . . . . . 333,068 17.6 1974 . . . . . . . . . . . . . . . . . . . . . . . . . . . . . . . . . 355,515 18.4 1973 . . . . . . . . . . . . . . . . . . . . . . . . . . . . . . . . . 369,655 18.7 1972 . . . . . . . . . . . . . . . . . . . . . . . . . . . . . . . . . 375,820 19.1
1958 . . . . . . . . . . . . . . . . . . . . . . . . . . . . . . . . . 315,203 19.1
1955 . . . . . . . . . . . . . . . . . . . . . . . . . . . . . . . . . 271,797 17.8
NOTE: 2003 data based on 47 states and the District of Columbia.
Page 8 [ Series 20, No. 32
Table 2. Number and percentage of deaths for which autopsies were reported, by state: United States and each state, 1993 and 2003
[By occurrence]
1993 2003
Area Number Percent Number Percent
United States1 . . . . . . . . . . . . . . . 220,620 9.7 174,461 7.1 Alabama . . . . . . . . . . . . . . . . . 3,015 7.4 2,784 6.1 Alaska. . . . . . . . . . . . . . . . . . . 672 28.4 290 9.4 Arizona . . . . . . . . . . . . . . . . . . 3,490 10.3 4,660 10.6 Arkansas . . . . . . . . . . . . . . . . . 1,243 4.7 1,295 4.7 California . . . . . . . . . . . . . . . . . 31,004 14.0 25,034 10.5 Colorado . . . . . . . . . . . . . . . . . 3,516 14.5 3,843 12.9 Connecticut . . . . . . . . . . . . . . . 2,555 8.8 1,822 6.2 Delaware . . . . . . . . . . . . . . . . . 671 10.7 557 7.9 District of Columbia . . . . . . . . . . 2,018 22.6 1,573 23.4 Florida . . . . . . . . . . . . . . . . . . 16,587 11.3 3,465 2.1 Georgia . . . . . . . . . . . . . . . . . . 5,497 9.7 5,790 8.6 Hawaii. . . . . . . . . . . . . . . . . . . 1,058 14.3 938 10.3 Idaho . . . . . . . . . . . . . . . . . . . 529 6.5 502 4.9 Illinois . . . . . . . . . . . . . . . . . . 10,130 9.7 8,330 8.1 Indiana . . . . . . . . . . . . . . . . . . 4,022 7.6 2,675 4.7 Iowa . . . . . . . . . . . . . . . . . . . . 1,804 6.5 1,772 6.4 Kansas . . . . . . . . . . . . . . . . . . 1,735 7.6 1,869 7.8 Kentucky . . . . . . . . . . . . . . . . . 2,456 6.8 2,284 5.7 Louisiana . . . . . . . . . . . . . . . . . 4,009 10.1 3,533 8.2 Maine . . . . . . . . . . . . . . . . . . . 582 5.0 512 4.1 Maryland . . . . . . . . . . . . . . . . . 4,177 10.5 4,790 10.8 Massachusetts . . . . . . . . . . . . . 5,207 9.2 3,153 5.6 Michigan . . . . . . . . . . . . . . . . . 8,256 10.2 7,766 9.1 Minnesota . . . . . . . . . . . . . . . . 3,753 10.3 - - - - - -Mississippi . . . . . . . . . . . . . . . . 1,672 6.5 2,153 7.7 Missouri. . . . . . . . . . . . . . . . . . 3,829 6.9 3,068 5.4 Montana . . . . . . . . . . . . . . . . . 627 8.5 521 6.2 Nebraska . . . . . . . . . . . . . . . . . 1,181 7.8 1,080 6.9 Nevada . . . . . . . . . . . . . . . . . . 1,230 10.4 1,963 10.6 New Hampshire . . . . . . . . . . . . . 564 6.4 561 5.8 New Jersey . . . . . . . . . . . . . . . 5,482 7.7 4,604 6.4 New Mexico . . . . . . . . . . . . . . . 1,577 13.5 - - - - - -New York . . . . . . . . . . . . . . . . . 20,553 12.1 14,932 9.7 North Carolina. . . . . . . . . . . . . . 5,088 8.1 4,804 6.5 North Dakota . . . . . . . . . . . . . . 480 7.6 419 6.5 Ohio . . . . . . . . . . . . . . . . . . . . 9,359 9.1 8,724 8.0 Oklahoma . . . . . . . . . . . . . . . . 1,690 5.4 1,661 4.8 Oregon . . . . . . . . . . . . . . . . . . 1,934 7.0 1,371 4.4 Pennsylvania . . . . . . . . . . . . . . 10,112 8.0 12 0.0 Rhode Island . . . . . . . . . . . . . . 721 7.3 959 9.4 South Carolina . . . . . . . . . . . . . 2,602 8.4 3,012 8.1 South Dakota . . . . . . . . . . . . . . 450 6.5 413 5.6 Tennessee . . . . . . . . . . . . . . . . 2,445 4.7 2,985 5.0 Texas . . . . . . . . . . . . . . . . . . . 15,963 11.8 17,249 11.0 Utah . . . . . . . . . . . . . . . . . . . . 1,059 9.8 1,471 10.7 Vermont . . . . . . . . . . . . . . . . . 495 9.9 614 12.1 Virginia . . . . . . . . . . . . . . . . . . 3,425 6.7 3,309 5.8 Washington . . . . . . . . . . . . . . . 4,453 11.0 4,300 9.4 West Virginia . . . . . . . . . . . . . . 1,375 6.8 1,217 5.8 Wisconsin . . . . . . . . . . . . . . . . 3,977 9.0 3,578 7.8 Wyoming . . . . . . . . . . . . . . . . . 291 8.7 244 6.1
- - - Data not available. 1Percentage for United States in 2003 includes the states that do not report the item. The percent is 7.7 excluding those three states.
Series 20, No. 32 [ Page 9
Table 3. Number and percentage of deaths for which autopsies were reported, by 10-year age groups, race, and sex: 47 states and the District of Columbia, 2003
Race and sex Total Under 1 year
1–4 years
5–14 years
15–24 years
25–34 years
35–44 years
45–54 years
55–64 years
65–74 years
75–84 years
85 years and over
Not stated
Number
All races . . . . . . . . . . . . . . . . . . . Male . . . . . . . . . . . . . . . . . . . . . Female . . . . . . . . . . . . . . . . . . .
173,745 118,026 55,719
8,093 4,776 3,317
2,344 1,340 1,004
2,629 1,617 1,012
17,190 13,244 3,946
19,295 14,357 4,938
30,479 21,209 9,270
35,592 24,875 10,717
23,307 16,022 7,285
15,727 10,135 5,592
13,167 7,643 5,524
5,725 2,648 3,077
197 160 37
White. . . . . . . . . . . . . . . . . . . . . Male . . . . . . . . . . . . . . . . . . . . . Female . . . . . . . . . . . . . . . . . . .
132,599 90,359 42,240
5,314 3,197 2,117
1,574 902 672
1,786 1,102
684
11,848 8,974 2,874
13,595 10,067 3,528
23,225 16,381 6,844
27,407 19,400 8,007
18,694 12,988 5,706
12,797 8,336 4,461
11,208 6,546 4,662
4,977 2,327 2,650
174 139 35
Black . . . . . . . . . . . . . . . . . . . . . Male . . . . . . . . . . . . . . . . . . . . . Female . . . . . . . . . . . . . . . . . . .
35,597 24,024 11,573
2,431 1,363 1,068
676 389 287
719 440 279
4,589 3,741
848
4,952 3,776 1,176
6,364 4,209 2,155
7,166 4,763 2,403
4,008 2,650 1,358
2,487 1,535
952
1,596 902 694
590 239 351
19 17 2
American Indian or Alaska Native . . . Male . . . . . . . . . . . . . . . . . . . . . Female . . . . . . . . . . . . . . . . . . .
1,770 1,186
584
128 77 51
32 16 16
35 24 11
284 200 84
261 182 79
368 243 125
359 252 107
156 100 56
89 59 30
45 26 19
11 5 6
2 2 –
Asian or Pacific Islander . . . . . . . . . Male . . . . . . . . . . . . . . . . . . . . . Female . . . . . . . . . . . . . . . . . . .
3,779 2,457 1,322
220 139 81
62 33 29
89 51 38
469 329 140
487 332 155
522 376 146
660 460 200
449 284 165
354 205 149
318 169 149
147 77 70
2 2 –
Percent
All races . . . . . . . . . . . . . . . . . . . Male . . . . . . . . . . . . . . . . . . . . . Female . . . . . . . . . . . . . . . . . . .
7.7 10.6 4.8
30.6 31.8 29.0
50.0 50.4 49.4
40.3 41.6 38.2
54.9 57.7 47.2
49.6 53.3 41.3
36.3 40.0 29.9
21.5 24.0 17.2
9.5 10.9 7.3
4.1 4.7 3.3
2.0 2.4 1.7
0.9 1.3 0.7
61.2 62.0 57.8
White. . . . . . . . . . . . . . . . . . . . . Male . . . . . . . . . . . . . . . . . . . . . Female . . . . . . . . . . . . . . . . . . .
6.8 9.6 4.3
30.7 32.4 28.4
47.6 48.5 46.4
37.9 39.3 35.8
51.1 53.2 45.6
48.9 51.6 42.5
37.3 40.7 31.1
21.9 24.3 17.5
9.4 10.9 7.2
4.0 4.6 3.2
1.9 2.3 1.6
0.9 1.2 0.7
62.6 63.5 59.3
Black . . . . . . . . . . . . . . . . . . . . . Male . . . . . . . . . . . . . . . . . . . . . Female . . . . . . . . . . . . . . . . . . .
12.8 17.0 8.5
30.3 30.2 30.4
58.9 58.2 59.8
48.5 49.5 47.0
67.3 72.4 51.3
52.0 59.0 37.7
33.5 38.1 27.2
20.2 22.7 16.7
9.8 11.2 7.9
4.9 5.7 4.0
2.7 3.3 2.2
1.3 1.7 1.1
* * *
American Indian or Alaska Native . . . Male . . . . . . . . . . . . . . . . . . . . . Female . . . . . . . . . . . . . . . . . . .
15.1 18.9 10.8
43.1 43.0 43.2
39.0 * *
32.4 36.9
*
52.8 52.1 54.5
47.7 48.5 45.9
34.5 36.7 30.9
22.1 26.2 16.1
8.5 9.8 6.9
4.3 5.4 3.1
2.1 2.6
*
* * *
* * *
Asian or Pacific Islander . . . . . . . . . Male . . . . . . . . . . . . . . . . . . . . . Female . . . . . . . . . . . . . . . . . . .
9.6 11.9 7.1
26.8 30.5 22.1
39.7 38.4 41.4
39.4 40.2 38.4
60.2 62.9 54.7
49.1 52.5 43.2
31.8 37.7 22.8
19.6 23.4 14.3
9.5 10.3 8.3
4.8 5.1 4.4
3.0 3.1 2.9
1.7 2.1 1.5
* * *
– Quantity zero.
* Figure does not meet standards of reliability or precision.
Page 10 [ Series 20, No. 32
Table 4. Number and percentage of deaths for which autopsies were reported, by 10-year age groups, Hispanic origin, and race fornon-Hispanic population, and sex: 47 states and the District of Columbia, 2003
Under 1–4 5–14 15–24 25–34 35–44 45–54 55–64 65–74 75–84 85 years Not Race and sex Total 1 year years years years years years years years years years and over stated
Number
All origins . . . . . . . . . . . . . . . . . . 173,745 8,093 2,344 2,629 17,190 19,295 30,479 35,592 23,307 15,727 13,167 5,725 197Male . . . . . . . . . . . . . . . . . . . . . 118,026 4,776 1,340 1,617 13,244 14,357 21,209 24,875 16,022 10,135 7,643 2,648 160 Female . . . . . . . . . . . . . . . . . . . 55,719 3,317 1,004 1,012 3,946 4,938 9,270 10,717 7,285 5,592 5,524 3,077 37
Hispanic . . . . . . . . . . . . . . . . . . . 18,143 1,445 474 488 3,229 3,272 3,125 2,667 1,502 1,036 657 220 28 Male . . . . . . . . . . . . . . . . . . . . . 13,529 860 264 306 2,657 2,708 2,415 2,029 1,087 673 399 107 24 Female . . . . . . . . . . . . . . . . . . . 4,614 585 210 182 572 564 710 638 415 363 258 113 4
Non-Hispanic . . . . . . . . . . . . . . . . 154,617 6,600 1,864 2,134 13,882 15,941 27,190 32,723 21,652 14,613 12,459 5,478 81Male . . . . . . . . . . . . . . . . . . . . . 103,748 3,881 1,072 1,306 10,526 11,583 18,672 22,690 14,812 9,402 7,212 2,528 64Female . . . . . . . . . . . . . . . . . . . 50,869 2,719 792 828 3,356 4,358 8,518 10,033 6,840 5,211 5,247 2,950 17
Non-Hispanic white . . . . . . . . . . . . 114,290 3,903 1,114 1,313 8,660 10,355 20,053 24,677 17,137 11,734 10,526 4,750 68 Male . . . . . . . . . . . . . . . . . . . . . 76,682 2,357 643 806 6,351 7,382 13,929 17,319 11,852 7,638 6,135 2,217 53 Female . . . . . . . . . . . . . . . . . . . 37,608 1,546 471 507 2,309 2,973 6,124 7,358 5,285 4,096 4,391 2,533 15
Non-Hispanic black . . . . . . . . . . . . 35,023 2,381 661 707 4,511 4,877 6,282 7,067 3,928 2,447 1,576 576 10 Male . . . . . . . . . . . . . . . . . . . . . 23,585 1,328 381 433 3,671 3,717 4,149 4,685 2,587 1,507 887 232 8 Female . . . . . . . . . . . . . . . . . . . 11,438 1,053 280 274 840 1,160 2,133 2,382 1,341 940 689 344 2
Percent
All origins . . . . . . . . . . . . . . . . . . 7.7 30.6 50.0 40.3 54.9 49.6 36.3 21.5 9.5 4.1 2.0 0.9 61.2 Male . . . . . . . . . . . . . . . . . . . . . 10.6 31.8 50.4 41.6 57.7 53.3 40.0 24.0 10.9 4.7 2.4 1.3 62.0 Female . . . . . . . . . . . . . . . . . . . 4.8 29.0 49.4 38.2 47.2 41.3 29.9 17.2 7.3 3.3 1.7 0.7 57.8
Hispanic . . . . . . . . . . . . . . . . . . . 15.7 28.4 49.5 43.5 63.0 55.5 38.5 22.4 10.7 5.3 2.6 1.2 62.2 Male . . . . . . . . . . . . . . . . . . . . . 21.0 30.4 48.3 45.5 65.8 59.8 43.3 25.6 12.6 6.2 3.3 1.6 63.2 Female . . . . . . . . . . . . . . . . . . . 9.0 25.9 51.2 40.4 52.6 41.3 28.0 16.1 7.6 4.2 2.0 0.9 *
Non-Hispanic . . . . . . . . . . . . . . . . 7.2 31.2 50.1 39.6 53.3 48.6 36.0 21.4 9.4 4.0 2.0 0.9 59.6 Male . . . . . . . . . . . . . . . . . . . . . 9.9 32.3 51.0 40.8 56.0 52.0 39.6 23.8 10.8 4.6 2.4 1.2 57.7 Female . . . . . . . . . . . . . . . . . . . 4.6 29.9 49.0 37.8 46.3 41.3 30.1 17.3 7.3 3.3 1.6 0.7 *
Non-Hispanic white . . . . . . . . . . . . 6.3 31.7 47.0 36.3 47.8 47.1 37.1 21.8 9.3 3.9 1.9 0.9 60.2 Male . . . . . . . . . . . . . . . . . . . . . 8.7 33.3 48.7 37.6 49.3 49.2 40.2 24.2 10.8 4.4 2.3 1.2 58.2 Female . . . . . . . . . . . . . . . . . . . 4.0 29.6 44.9 34.5 44.2 42.7 31.4 17.6 7.2 3.1 1.6 0.7 *
Non-Hispanic black . . . . . . . . . . . . 12.7 30.5 59.0 48.4 67.3 52.0 33.5 20.2 9.7 4.9 2.7 1.3 * Male . . . . . . . . . . . . . . . . . . . . . 16.9 30.3 58.4 49.3 72.5 59.0 38.0 22.6 11.1 5.6 3.3 1.7 * Female . . . . . . . . . . . . . . . . . . . 8.4 30.8 59.7 47.0 51.4 37.7 27.2 16.7 7.8 4.0 2.2 1.1 *
* Figure does not meet standards of reliability or precision.
Table 5. Number and percentage autopsied, by place of death: 47 states and the District of Columbia, 2003
Place Number Percent
Hospital: 85,895 8.0 Inpatient . . . . . . . . . . . . . . . . . 42,874 4.9 Outpatient or emergency room. . . . 36,198 21.2 Dead on arrival . . . . . . . . . . . . . 6,823 26.6
Nursing home or long-term care facility . . . . . . . . . . . . . . . . . . . . 2,787 0.6 Hospice facility . . . . . . . . . . . . . . . 42 0.8 Residence. . . . . . . . . . . . . . . . . . 50,117 9.2 Other. . . . . . . . . . . . . . . . . . . . . 34,185 23.8 Place unknown. . . . . . . . . . . . . . . 719 9.5
Series 20, No. 32 [ Page 11
Table 6. Number and percentage of deaths for which autopsies were reported by 113 selected causes and sex: 47 states and the District of Columbia, 2003 [The asterisks (*) preceding the cause-of-death codes indicate that they are not part of the International Classification of Diseases, Tenth Revision (ICD–10)]
Number Percent
Cause of death (based on the Both Both International Classification of Diseases, Tenth Revision, 1992) sexes Male Female sexes Male Female
All causes . . . . . . . . . . . . . . . . . . . . . . . . . . . . . . . . . . . . . . . . 173,745 118,026 55,719 7.7 10.6 4.8
Salmonella infections . . . . . . . . . . . . . . . . . . . . . . . . . . (A01–A02) 4 – 4 * * * Shigellosis and amebiasis . . . . . . . . . . . . . . . . . . . . . . . .(A03,A06) 2 1 1 * * * Certain other intestinal infections . . . . . . . . . . . . . . . . (A04,A07–A09) 104 51 53 3.7 5.1 2.9 Tuberculosis . . . . . . . . . . . . . . . . . . . . . . . . . . . . . . . (A16–A19) 79 54 25 11.7 13.3 9.3
Respiratory tuberculosis . . . . . . . . . . . . . . . . . . . . . . . . . . (A16) 63 45 18 11.8 13.6 * Other tuberculosis . . . . . . . . . . . . . . . . . . . . . . . . . . (A17–A19) 16 9 7 * * *
Whooping cough . . . . . . . . . . . . . . . . . . . . . . . . . . . . . . . (A37) 2 – 2 * * * Scarlet fever and erysipelas . . . . . . . . . . . . . . . . . . . . . . .(A38,A46) – – – * * * Meningococcal infection . . . . . . . . . . . . . . . . . . . . . . . . . . . (A39) 70 35 35 47.3 50.7 44.3 Septicemia . . . . . . . . . . . . . . . . . . . . . . . . . . . . . . . . (A40–A41) 1,278 651 627 4.1 4.7 3.6 Syphilis . . . . . . . . . . . . . . . . . . . . . . . . . . . . . . . . . . (A50–A53) 6 6 – * * * Acute poliomyelitis . . . . . . . . . . . . . . . . . . . . . . . . . . . . . . (A80) – – – * * * Arthropod-borne viral encephalitis . . . . . . . . . . . . . . (A83–A84,A85.2) 2 2 – * * * Measles . . . . . . . . . . . . . . . . . . . . . . . . . . . . . . . . . . . . . (B05) – – – * * * Viral hepatitis . . . . . . . . . . . . . . . . . . . . . . . . . . . . . . . (B15–B19) 273 195 78 5.3 5.9 4.3 Human immunodeficiency virus (HIV) disease . . . . . . . . . . (B20–B24) 600 470 130 4.6 4.8 3.9 Malaria . . . . . . . . . . . . . . . . . . . . . . . . . . . . . . . . . . (B50–B54) 1 1 – * * *
Other and unspecified infectious and parasitic diseases and their sequelae . . . . . . . . . . . (A00,A05,A20–A36,A42–A44,A48–A49,
A54–A79,A81–A82,A85.0–A85.1,A85.8,A86–B04,B06–B09, B25–B49,B55–B99) 622 358 264 9.0 9.7 8.2
Malignant neoplasms . . . . . . . . . . . . . . . . . . . . . . . . . . (C00–C97) 6,543 4,146 2,397 1.3 1.6 1.0 Malignant neoplasms of lip, oral cavity and pharynx . . . . . (C00–C14) 104 91 13 1.4 1.8 * Malignant neoplasm of esophagus . . . . . . . . . . . . . . . . . . . (C15) 144 127 17 1.2 1.4 * Malignant neoplasm of stomach . . . . . . . . . . . . . . . . . . . . . (C16) 131 95 36 1.2 1.5 0.8 Malignant neoplasms of colon, rectum and anus . . . . . . . (C18–C21) 500 301 199 1.0 1.2 0.8 Malignant neoplasms of liver and intrahepatic bile ducts . . . . . . (C22) 247 182 65 1.8 2.1 1.3 Malignant neoplasm of pancreas . . . . . . . . . . . . . . . . . . . . (C25) 292 174 118 1.0 1.2 0.8 Malignant neoplasm of larynx . . . . . . . . . . . . . . . . . . . . . . (C32) 65 55 10 1.8 2.0 * Malignant neoplasms of trachea, bronchus and lung . . . . . (C33–C34) 1,503 1,087 416 1.0 1.3 0.7 Malignant melanoma of skin . . . . . . . . . . . . . . . . . . . . . . . (C43) 58 35 23 0.8 0.8 0.9 Malignant neoplasm of breast . . . . . . . . . . . . . . . . . . . . . . (C50) 271 3 268 0.7 * 0.7 Malignant neoplasm of cervix uteri . . . . . . . . . . . . . . . . . . . (C53) 36 – 36 1.0 * 1.0
Malignant neoplasms of corpus uteri and uterus, part unspecified . . . . . . . . . . . . . . . . . . . . . . . . . . . . . . (C54–C55) 68 – 68 1.1 * 1.1
Malignant neoplasm of ovary . . . . . . . . . . . . . . . . . . . . . . . (C56) 125 – 125 0.9 * 0.9 Malignant neoplasm of prostate . . . . . . . . . . . . . . . . . . . . . (C61) 187 187 – 0.7 0.7 * Malignant neoplasms of kidney and renal pelvis . . . . . . . . (C64–C65) 133 102 31 1.2 1.4 0.7 Malignant neoplasm of bladder . . . . . . . . . . . . . . . . . . . . . (C67) 86 65 21 0.8 0.8 0.6 Malignant neoplasms of meninges, brain and other parts of central nervous system . . . . . . . . . . . . . . . . . . . . . . (C70–C72) 182 120 62 1.5 1.8 1.2
Malignant neoplasms of lymphoid, hematopoietic and related tissue . . . . . . . . . . . . . . . . . . . . . . . . . . . . . . . . . (C81–C96) 1,099 704 395 2.7 3.2 2.1 Hodgkin’s disease . . . . . . . . . . . . . . . . . . . . . . . . . . . . (C81) 61 35 26 5.0 5.3 4.7 Non–Hodgkin’s lymphoma . . . . . . . . . . . . . . . . . . . . (C82–C85) 434 279 155 2.2 2.7 1.7 Leukemia . . . . . . . . . . . . . . . . . . . . . . . . . . . . . . (C91–C95) 604 390 214 3.0 3.5 2.5 Multiple myeloma and immunoproliferative neoplasms . . . (C88,C90) 174 109 65 1.7 2.0 1.3
Other and unspecified malignant neoplasms of lymphoid, hematopoietic and related tissue . . . . . . . . . . . . . . . . . . . (C96) 2 1 1 * * *
All other and unspecified malignant neoplasms . . . . . . . . (C17,C23–C24,C26–C31,C37–C41,C44–C49,
C51–C52,C57–C60,C62–C63,C66,C68–C69,C73–C80,C97) 1,136 708 428 2.0 2.4 1.5 In situ neoplasms, benign neoplasms and neoplasms of uncertain or unknown behavior . . . . . . . . . . . . . . . . . . . . . . . . . (D00–D48) 405 200 205 3.3 3.3 3.3
Anemias . . . . . . . . . . . . . . . . . . . . . . . . . . . . . . . . . . (D50–D64) 229 129 100 5.4 7.6 4.0 Diabetes mellitus . . . . . . . . . . . . . . . . . . . . . . . . . . . . (E10–E14) 1,868 1,123 745 2.7 3.4 2.1 Nutritional deficiencies . . . . . . . . . . . . . . . . . . . . . . . . . (E40–E64) 74 44 30 2.3 3.9 1.5
Malnutrition . . . . . . . . . . . . . . . . . . . . . . . . . . . . . . (E40–E46) 71 43 28 2.4 4.1 1.5 Other nutritional deficiencies . . . . . . . . . . . . . . . . . . . . (E50–E64) 3 1 2 * * *
See footnotes at end of table.
Page 12 [ Series 20, No. 32
Table 6. Number and percentage of deaths for which autopsies were reported by 113 selected causes and sex: 47 states and the District of Columbia, 2003—Con. [The asterisks (*) preceding the cause-of-death codes indicate that they are not part of the International Classification of Diseases, Tenth Revision (ICD–10)]
Number Percent
Cause of death (based on the Both Both International Classification of Diseases, Tenth Revision, 1992) sexes Male Female sexes Male Female
Meningitis . . . . . . . . . . . . . . . . . . . . . . . . . . . . . . . . . (G00,G03) 173 104 69 25.4 28.7 21.6 Parkinson’s disease . . . . . . . . . . . . . . . . . . . . . . . . . . . (G20–G21) 172 105 67 1.1 1.1 0.9 Alzheimer’s disease . . . . . . . . . . . . . . . . . . . . . . . . . . . . . . (G30) 443 212 231 0.8 1.2 0.6 Major cardiovascular diseases . . . . . . . . . . . . . . . . . . . . . (I00–I78) 45,064 30,711 14,353 5.4 7.8 3.2
Diseases of heart . . . . . . . . . . . . . . . . . . . (I00–I09,I11,I13,I20–I51) 39,510 27,463 12,047 6.2 8.8 3.7 Acute rheumatic fever and chronic rheumatic heart diseases . . . . . . . . . . . . . . . . . . . . . . . . . . . . . . . (I00–I09) 171 63 108 5.1 5.9 4.8
Hypertensive heart disease . . . . . . . . . . . . . . . . . . . . . . . (I11) 4,388 2,835 1,553 16.1 23.5 10.2 Hypertensive heart and renal disease . . . . . . . . . . . . . . . . . (I13) 175 103 72 5.9 8.1 4.2 Ischemic heart diseases . . . . . . . . . . . . . . . . . . . . . . (I20–I25) 25,654 18,956 6,698 5.7 8.3 3.1
Acute myocardial infarction . . . . . . . . . . . . . . . . . . . (I21–I22) 6,987 5,143 1,844 4.4 6.2 2.5 Other acute ischemic heart diseases . . . . . . . . . . . . . . . . (I24) 156 110 46 5.2 7.1 3.1 Other forms of chronic ischemic heart disease . . . . . . . . (I20,I25) 18,511 13,703 4,808 6.5 9.5 3.4
Atherosclerotic cardiovascular disease, so described . . . . (I25.0) 7,628 5,594 2,034 12.3 16.8 7.1 All other forms of chronic ischemic heart disease . . . . . . . . . . . . . . . . . . . . . . . . . (I20,I25.1–I25.9) 10,883 8,109 2,774 4.9 7.3 2.5
Other heart diseases . . . . . . . . . . . . . . . . . . . . . . . . (I26–I51) 9,122 5,506 3,616 5.9 8.0 4.1 Acute and subacute endocarditis . . . . . . . . . . . . . . . . . . (I33) 109 66 43 9.5 10.5 8.3 Diseases of pericardium and acute myocarditis . . . . (I30–I31,I40) 327 185 142 40.7 44.4 36.8 Heart failure . . . . . . . . . . . . . . . . . . . . . . . . . . . . . . . (I50) 502 277 225 1.0 1.4 0.7 All other forms of heart disease . . . . (I26–I28,I34–I38,I42–I49,I51) 8,184 4,978 3,206 8.1 10.6 5.9
Essential (primary) hypertension and hypertensive renal disease . . . . . . . . . . . . . . . . . . . . . . . . . . . . . . . (I10,I12) 326 187 139 1.6 2.4 1.1 Cerebrovascular diseases . . . . . . . . . . . . . . . . . . . . . . (I60–I69) 2,943 1,566 1,377 2.0 2.7 1.6 Atherosclerosis . . . . . . . . . . . . . . . . . . . . . . . . . . . . . . . . (I70) 187 116 71 1.5 2.5 0.9 Other diseases of circulatory system . . . . . . . . . . . . . . . . (I71–I78) 2,098 1,379 719 9.3 11.3 6.9
Aortic aneurysm and dissection . . . . . . . . . . . . . . . . . . . . . (I71) 1,771 1,202 569 13.1 14.6 10.7 Other diseases of arteries, arterioles and capillaries . . . . . (I72–I78) 327 177 150 3.6 4.5 2.9
Other disorders of circulatory system . . . . . . . . . . . . . . . . . (I80–I99) 1,019 503 516 23.0 27.4 19.9 Influenza and pneumonia . . . . . . . . . . . . . . . . . . . . . . . . (J10–J18) 2,548 1,531 1,017 4.2 5.7 3.0
Influenza . . . . . . . . . . . . . . . . . . . . . . . . . . . . . . . . . (J10–J11) 125 68 57 7.5 10.5 5.6 Pneumonia . . . . . . . . . . . . . . . . . . . . . . . . . . . . . . . . (J12–J18) 2,423 1,463 960 4.1 5.6 2.9
Other acute lower respiratory infections . . . . . . . . . . . . . . . (J20–J22) 97 58 39 25.0 36.9 16.9 Acute bronchitis and bronchiolitis . . . . . . . . . . . . . . . . . . (J20–J21) 94 56 38 33.1 47.5 22.9 Unspecified acute lower respiratory infection . . . . . . . . . . . . . . (J22) 3 2 1 * * *
Chronic lower respiratory diseases . . . . . . . . . . . . . . . . . . (J40–J47) 2,337 1,376 961 2.0 2.4 1.6 Bronchitis, chronic and unspecified . . . . . . . . . . . . . . . . . (J40–J42) 70 39 31 8.7 11.8 6.6 Emphysema . . . . . . . . . . . . . . . . . . . . . . . . . . . . . . . . . . (J43) 454 283 171 3.2 4.0 2.5 Asthma . . . . . . . . . . . . . . . . . . . . . . . . . . . . . . . . . . (J45–J46) 663 349 314 17.4 25.1 13.0 Other chronic lower respiratory diseases . . . . . . . . . . . . . (J44,J47) 1,150 705 445 1.2 1.5 0.9
Pneumoconioses and chemical effects . . . . . . . . . . . . . (J60–J66,J68) 61 57 4 6.7 6.6 * Pneumonitis due to solids and liquids . . . . . . . . . . . . . . . . . . . . (J69) 192 116 76 1.2 1.5 1.0 Other diseases of respiratory system . . (J00–J06,J30– J39,J67,J70–J98) 1,311 779 532 5.6 6.9 4.4 Peptic ulcer . . . . . . . . . . . . . . . . . . . . . . . . . . . . . . . . (K25–K28) 413 260 153 11.2 14.7 8.0 Diseases of appendix . . . . . . . . . . . . . . . . . . . . . . . . . . (K35–K38) 99 61 38 24.1 25.1 22.6 Hernia . . . . . . . . . . . . . . . . . . . . . . . . . . . . . . . . . . . (K40–K46) 178 94 84 12.0 15.3 9.7 Chronic liver disease and cirrhosis . . . . . . . . . . . . . . (K70,K73–K74) 1,892 1,332 560 7.4 8.0 6.3
Alcoholic liver disease . . . . . . . . . . . . . . . . . . . . . . . . . . . (K70) 1,005 725 280 8.6 8.4 9.1 Other chronic liver disease and cirrhosis . . . . . . . . . . . . (K73–K74) 887 607 280 6.3 7.5 4.8
Cholelithiasis and other disorders of gallbladder . . . . . . . . . (K80–K82) 167 83 84 6.1 6.7 5.6 Nephritis, nephrotic syndrome and nephrosis . . . . . . . . . . . . . . . . . . . (N00–N07,N17–N19,N25–N27) 654 362 292 1.7 1.9 1.5 Acute and rapidly progressive nephritic and nephrotic syndrome (N00–N01,N04) 8 5 3 * * *
Chronic glomerulonephritis, nephritis and nephropathy not specified as acute or chronic, and renal sclerosis unspecified . . . . . . . . . . . . . . . . . . . . . (N02–N03,N05–N07,N26) 29 18 11 5.8 * *
Renal failure . . . . . . . . . . . . . . . . . . . . . . . . . . . . . . (N17–N19) 616 338 278 1.6 1.9 1.4 Other disorders of kidney . . . . . . . . . . . . . . . . . . . . . . (N25,N27) 1 1 – * * *
See footnotes at end of table.
Series 20, No. 32 [ Page 13
Table 6. Number and percentage of deaths for which autopsies were reported by 113 selected causes and sex: 47 states and the District of Columbia, 2003—Con. [The asterisks (*) preceding the cause-of-death codes indicate that they are not part of the International Classification of Diseases, Tenth Revision (ICD–10)]
Number Percent
Cause of death (based on the Both Both International Classification of Diseases, Tenth Revision, 1992) sexes Male Female sexes Male Female
Infections of kidney . . . . . . . . . . . . . . . . . . . (N10–N12,N13.6,N15.1) 105 37 68 13.5 15.7 12.5 Hyperplasia of prostate . . . . . . . . . . . . . . . . . . . . . . . . . . . (N40) 20 20 – 4.4 4.4 * Inflammatory diseases of female pelvic organs . . . . . . . . . . (N70–N76) 29 ... 29 25.7 ... 25.7 Pregnancy, childbirth and the puerperium . . . . . . . . . . . . . (O00–O99) 311 ... 311 60.3 ... 60.3
Pregnancy with abortive outcome . . . . . . . . . . . . . . . . . (O00–O07) 24 ... 24 63.2 ... 63.2
Other complications of pregnancy, childbirth and the puerperium . . . . . . . . . . . . . . . . . . . . . . . . . . . . . (O10–O99) 287 ... 287 60.0 ... 60.0
Certain conditions originating in the perinatal period . . . . . . . (P00–P96) 1,740 1,026 714 12.9 13.3 12.2 Congenital malformations, deformations and chromosomal abnormalities . . . . . . . . . . . . . . . . . . . . . . . . . . . . . . (Q00–Q99) 2,047 1,192 855 20.8 23.2 18.1
Symptoms, signs and abnormal clinical and laboratory findings, not elsewhere classified . . . . . . . . . . . . . . . . . . . . . . . (R00–R99) 9,736 6,052 3,684 34.7 45.8 24.8
All other diseases . . . . . . . . . . . . . . . . . . . . . . . . . . . . .(Residual) 11,514 6,799 4,715 6.2 9.0 4.3 Accidents (unintentional injuries) . . . . . . . . . . . . . (V01–X59,Y85–Y86) 44,148 30,823 13,325 43.7 47.1 37.3
Transport accidents . . . . . . . . . . . . . . . . . . . . . . (V01–V99,Y85) 19,546 13,838 5,708 43.4 44.3 41.2 Motor vehicle accidents . . . . . . . (V02–V04,V09.0,V09.2,V12–V14,
V19.0–V19.2,V19.4–V19.6,V20–V79,V80.3–V80.5, V81.0–V81.1,V82.0–V82.1,V83–V86,V87.0–V87.8,
V88.0–V88.8,V89.0,V89.2) 17,876 12,462 5,414 42.6 43.4 40.9 Other land transport accidents . . . . . . . . . . (V01,V05–V06,V09.1,
V09.3–V09.9,V10–V11,V15–V18,V19.3,V19.8–V19.9, V80.0–V80.2,V80.6–V80.9,V81.2–V81.9,
V82.2–V82.9,V87.9,V88.9,V89.1,V89.3,V89.9) 666 520 146 52.5 53.2 50.2 Water, air and space, and other and unspecified transport accidents and their sequelae . . . . . . . . . . . . . . (V90–V99,Y85) 1,004 856 148 54.6 57.1 43.7
Nontransport accidents . . . . . . . . . . . . . . . . . . . . (W00–X59,Y86) 24,602 16,985 7,617 43.9 49.7 34.8 Falls . . . . . . . . . . . . . . . . . . . . . . . . . . . . . . . . (W00–W19) 3,314 2,135 1,179 21.2 26.3 15.8 Accidental discharge of firearms . . . . . . . . . . . . . . . (W32–W34) 415 369 46 60.7 60.0 66.7 Accidental drowning and submersion . . . . . . . . . . . . (W65–W74) 2,000 1,566 434 63.7 62.7 67.5 Accidental exposure to smoke, fire and flames . . . . . . . (X00–X09) 1,859 1,090 769 59.3 59.8 58.7 Accidental poisoning and exposure to noxious substances . . . . . . . . . . . . . . . . . . . . . . . . . . . . (X40–X49) 12,857 8,734 4,123 72.5 73.0 71.3
Other and unspecified nontransport accidents and their sequelae . . . . . . . . . (W20–W31,W35–W64,W75–W99,X10–X39,
X50–X59,Y86) 4,157 3,091 1,066 26.4 33.8 16.2 Intentional self-harm (suicide) . . . . . . . . . . . . . . (*U03,X60–X84,Y87.0) 15,178 11,780 3,398 51.8 50.3 57.7
Intentional self-harm (suicide) by discharge of firearms . . . . (X72–X74) 7,683 6,635 1,048 48.9 48.2 53.5 Intentional self-harm (suicide) by other and unspecified means and their sequelae . . . . . . . . . . . .(*U03,X60–X71,X75–X84,Y87.0) 7,495 5,145 2,350 55.2 53.3 59.8
Assault (homicide) . . . . . . . . . . . . . . . . (*U01–*U02,X85–Y09,Y87.1) 15,388 12,108 3,280 91.8 92.3 90.0 Assault (homicide) by discharge of firearms . . . . . .(*U01.4,X93–X95) 10,383 8,880 1,503 92.0 92.7 87.8 Assault (homicide) by other and unspecified means and their sequelae . . . . . . . . (*U01.0–*U01.3,*U01.5–*U01.9,*U02,X85–X92,
X96–Y09,Y87.1) 5,005 3,228 1,777 91.5 91.3 91.9 Legal intervention . . . . . . . . . . . . . . . . . . . . . . . . . . . (Y35,Y89.0) 330 317 13 81.7 81.5 * Events of undetermined intent . . . . . . . . . . . . (Y10–Y34,Y87.2,Y89.9) 3,740 2,420 1,320 76.7 76.2 77.5
Discharge of firearms, undetermined intent . . . . . . . . . . . (Y22–Y24) 165 128 37 76.0 73.6 86.1 Other and unspecified events of undetermined intent and their sequelae . . . . . . . . . . . . . . . . . (Y10–Y21,Y25–Y34,Y87.2,Y89.9) 3,575 2,292 1,283 76.7 76.4 77.3
Operations of war and their sequelae . . . . . . . . . . . . . . . (Y36,Y89.1) 1 1 – * * * Complications of medical and surgical care . . . . . . . . . (Y40–Y84,Y88) 476 241 235 18.7 20.3 17.3
– Quantity zero.
* Figure does not meet standards of reliability or precision.
. . . Category not applicable.
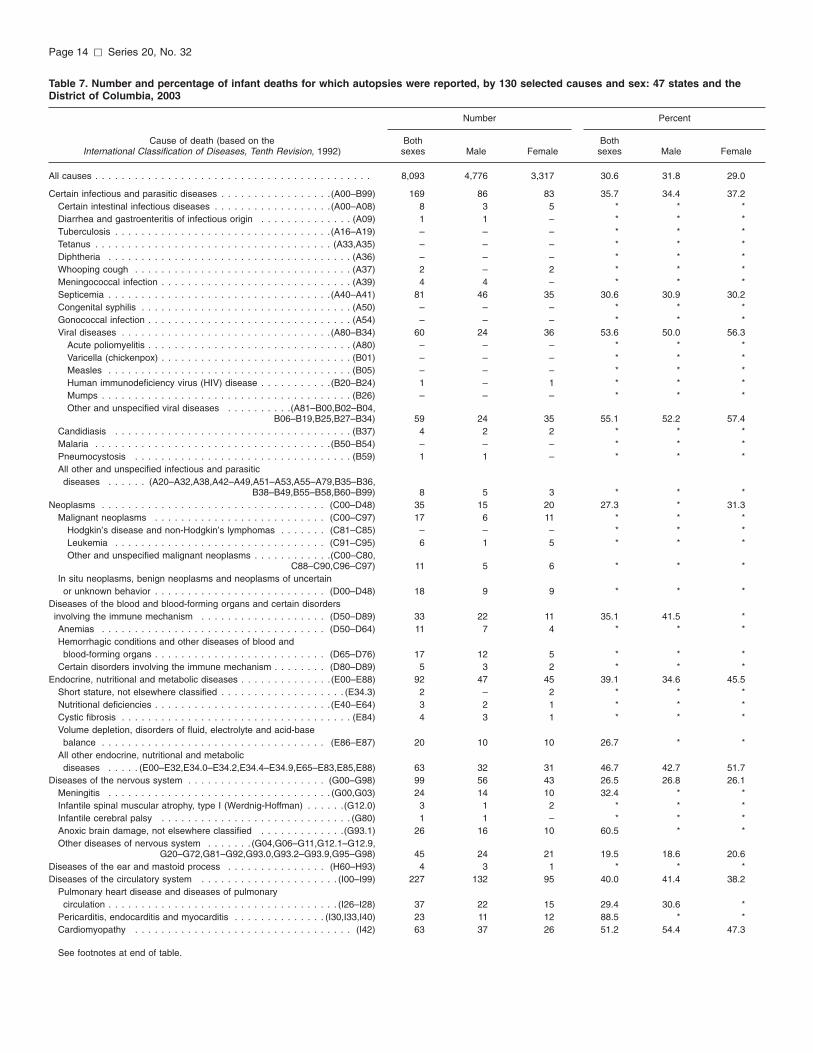
Table 7. Number and percentage of infant deaths for which autopsies were reported, by 130 selected causes and sex: 47 states and theDistrict of Columbia, 2003
Cause of death (based on theInternational Classification of Diseases, Tenth Revision, 1992)
Number Percent
Bothsexes Male Female
Bothsexes Male Female
All causes . . . . . . . . . . . . . . . . . . . . . . . . . . . . . . . . . . . . . . . . . . 8,093 4,776 3,317 30.6 31.8 29.0
Certain infectious and parasitic diseases . . . . . . . . . . . . . . . . .(A00–B99) 169 86 83 35.7 34.4 37.2Certain intestinal infectious diseases . . . . . . . . . . . . . . . . . .(A00–A08) 8 3 5 * * *Diarrhea and gastroenteritis of infectious origin . . . . . . . . . . . . . . (A09) 1 1 – * * *Tuberculosis . . . . . . . . . . . . . . . . . . . . . . . . . . . . . . . . .(A16–A19) – – – * * *Tetanus . . . . . . . . . . . . . . . . . . . . . . . . . . . . . . . . . . . . (A33,A35) – – – * * *Diphtheria . . . . . . . . . . . . . . . . . . . . . . . . . . . . . . . . . . . . . (A36) – – – * * *Whooping cough . . . . . . . . . . . . . . . . . . . . . . . . . . . . . . . . . (A37) 2 – 2 * * *Meningococcal infection . . . . . . . . . . . . . . . . . . . . . . . . . . . . . (A39) 4 4 – * * *Septicemia . . . . . . . . . . . . . . . . . . . . . . . . . . . . . . . . . .(A40–A41) 81 46 35 30.6 30.9 30.2Congenital syphilis . . . . . . . . . . . . . . . . . . . . . . . . . . . . . . . . (A50) – – – * * *Gonococcal infection . . . . . . . . . . . . . . . . . . . . . . . . . . . . . . . (A54) – – – * * *Viral diseases . . . . . . . . . . . . . . . . . . . . . . . . . . . . . . . .(A80–B34) 60 24 36 53.6 50.0 56.3
Acute poliomyelitis . . . . . . . . . . . . . . . . . . . . . . . . . . . . . . . (A80) – – – * * *Varicella (chickenpox) . . . . . . . . . . . . . . . . . . . . . . . . . . . . . (B01) – – – * * *Measles . . . . . . . . . . . . . . . . . . . . . . . . . . . . . . . . . . . . . (B05) – – – * * *Human immunodeficiency virus (HIV) disease . . . . . . . . . . .(B20–B24) 1 – 1 * * *Mumps . . . . . . . . . . . . . . . . . . . . . . . . . . . . . . . . . . . . . . (B26) – – – * * *Other and unspecified viral diseases . . . . . . . . . .(A81–B00,B02–B04,
B06–B19,B25,B27–B34) 59 24 35 55.1 52.2 57.4Candidiasis . . . . . . . . . . . . . . . . . . . . . . . . . . . . . . . . . . . . (B37) 4 2 2 * * *Malaria . . . . . . . . . . . . . . . . . . . . . . . . . . . . . . . . . . . .(B50–B54) – – – * * *Pneumocystosis . . . . . . . . . . . . . . . . . . . . . . . . . . . . . . . . . (B59) 1 1 – * * *All other and unspecified infectious and parasitic
diseases . . . . . . (A20–A32,A38,A42–A49,A51–A53,A55–A79,B35–B36,B38–B49,B55–B58,B60–B99) 8 5 3 * * *
Neoplasms . . . . . . . . . . . . . . . . . . . . . . . . . . . . . . . . . . (C00–D48) 35 15 20 27.3 * 31.3Malignant neoplasms . . . . . . . . . . . . . . . . . . . . . . . . . . (C00–C97) 17 6 11 * * *
Hodgkin’s disease and non-Hodgkin’s lymphomas . . . . . . . (C81–C85) – – – * * *Leukemia . . . . . . . . . . . . . . . . . . . . . . . . . . . . . . . . (C91–C95) 6 1 5 * * *Other and unspecified malignant neoplasms . . . . . . . . . . . .(C00–C80,
C88–C90,C96–C97) 11 5 6 * * *In situ neoplasms, benign neoplasms and neoplasms of uncertain
or unknown behavior . . . . . . . . . . . . . . . . . . . . . . . . . . (D00–D48) 18 9 9 * * *Diseases of the blood and blood-forming organs and certain disorders
involving the immune mechanism . . . . . . . . . . . . . . . . . . . (D50–D89) 33 22 11 35.1 41.5 *Anemias . . . . . . . . . . . . . . . . . . . . . . . . . . . . . . . . . . (D50–D64) 11 7 4 * * *Hemorrhagic conditions and other diseases of blood and
blood-forming organs . . . . . . . . . . . . . . . . . . . . . . . . . . (D65–D76) 17 12 5 * * *Certain disorders involving the immune mechanism . . . . . . . . (D80–D89) 5 3 2 * * *
Endocrine, nutritional and metabolic diseases . . . . . . . . . . . . . .(E00–E88) 92 47 45 39.1 34.6 45.5Short stature, not elsewhere classified . . . . . . . . . . . . . . . . . . . (E34.3) 2 – 2 * * *Nutritional deficiencies . . . . . . . . . . . . . . . . . . . . . . . . . . .(E40–E64) 3 2 1 * * *Cystic fibrosis . . . . . . . . . . . . . . . . . . . . . . . . . . . . . . . . . . . (E84) 4 3 1 * * *Volume depletion, disorders of fluid, electrolyte and acid-base
balance . . . . . . . . . . . . . . . . . . . . . . . . . . . . . . . . . . (E86–E87) 20 10 10 26.7 * *All other endocrine, nutritional and metabolic
diseases . . . . . (E00–E32,E34.0–E34.2,E34.4–E34.9,E65–E83,E85,E88) 63 32 31 46.7 42.7 51.7Diseases of the nervous system . . . . . . . . . . . . . . . . . . . . . (G00–G98) 99 56 43 26.5 26.8 26.1
Meningitis . . . . . . . . . . . . . . . . . . . . . . . . . . . . . . . . . . (G00,G03) 24 14 10 32.4 * *Infantile spinal muscular atrophy, type I (Werdnig-Hoffman) . . . . . .(G12.0) 3 1 2 * * *Infantile cerebral palsy . . . . . . . . . . . . . . . . . . . . . . . . . . . . . (G80) 1 1 – * * *Anoxic brain damage, not elsewhere classified . . . . . . . . . . . . .(G93.1) 26 16 10 60.5 * *Other diseases of nervous system . . . . . . . (G04,G06–G11,G12.1–G12.9,
G20–G72,G81–G92,G93.0,G93.2–G93.9,G95–G98) 45 24 21 19.5 18.6 20.6Diseases of the ear and mastoid process . . . . . . . . . . . . . . . (H60–H93) 4 3 1 * * *Diseases of the circulatory system . . . . . . . . . . . . . . . . . . . . . (I00–I99) 227 132 95 40.0 41.4 38.2
Pulmonary heart disease and diseases of pulmonarycirculation . . . . . . . . . . . . . . . . . . . . . . . . . . . . . . . . . . . (I26–I28) 37 22 15 29.4 30.6 *
Pericarditis, endocarditis and myocarditis . . . . . . . . . . . . . . (I30,I33,I40) 23 11 12 88.5 * *Cardiomyopathy . . . . . . . . . . . . . . . . . . . . . . . . . . . . . . . . . (I42) 63 37 26 51.2 54.4 47.3
See footnotes at end of table.
Page 14 [ Series 20, No. 32

Table 7. Number and percentage of infant deaths for which autopsies were reported, by 130 selected causes and sex: 47 states and theDistrict of Columbia, 2003—Con.
Cause of death (based on theInternational Classification of Diseases, Tenth Revision, 1992)
Number Percent
Bothsexes Male Female
Bothsexes Male Female
Cardiac arrest . . . . . . . . . . . . . . . . . . . . . . . . . . . . . . . . . . . (I46) 8 7 1 * * *Cerebrovascular diseases . . . . . . . . . . . . . . . . . . . . . . . . . (I60–I69) 27 16 11 27.3 * *All other diseases of circulatory system . . . . . . . . . (I00–I25,I31,I34–I38,
I44–I45,I47–I51,I70–I99) 69 39 30 39.0 38.2 40.0Diseases of the respiratory system . . . . . . . . . . . . . . . . . . . . (J00–J98) 407 252 155 60.8 62.5 58.3
Acute upper respiratory infections . . . . . . . . . . . . . . . . . . . . (J00–J06) 11 6 5 * * *Influenza and pneumonia . . . . . . . . . . . . . . . . . . . . . . . . . (J10–J18) 220 132 88 71.4 72.1 70.4
Influenza . . . . . . . . . . . . . . . . . . . . . . . . . . . . . . . . . . (J10–J11) 15 9 6 * * *Pneumonia . . . . . . . . . . . . . . . . . . . . . . . . . . . . . . . . (J12–J18) 205 123 82 73.7 74.1 73.2
Acute bronchitis and acute bronchiolitis . . . . . . . . . . . . . . . . (J20–J21) 40 27 13 76.9 81.8 *Bronchitis, chronic and unspecified . . . . . . . . . . . . . . . . . . . (J40–J42) 16 12 4 * * *Asthma . . . . . . . . . . . . . . . . . . . . . . . . . . . . . . . . . . . . (J45–J46) 6 4 2 * * *Pneumonitis due to solids and liquids . . . . . . . . . . . . . . . . . . . . (J69) 6 3 3 * * *Other and unspecified diseases of respiratory
system . . . . . . . . . . . . . . . (J22,J30–J39,J43–J44,J47–J68,J70–J98) 108 68 40 42.0 44.7 38.1Diseases of the digestive system . . . . . . . . . . . . . . . . . . . . .(K00–K92) 142 89 53 27.3 27.6 26.6
Gastritis, duodenitis, and noninfective enteritis andcolitis . . . . . . . . . . . . . . . . . . . . . . . . . . . . . . . . . (K29,K50–K55) 64 40 24 22.3 22.2 22.4
Hernia of abdominal cavity and intestinal obstruction withouthernia . . . . . . . . . . . . . . . . . . . . . . . . . . . . . . . . (K40–K46,K56) 23 12 11 36.5 * *
All other and unspecified diseases of digestivesystem . . . . . . . . . . . . . . . . . . . . . . (K00–K28,K30–K38,K57–K92) 55 37 18 32.2 34.3 *
Diseases of the genitourinary system . . . . . . . . . . . . . . . . . . (N00–N95) 29 18 11 14.8 * *Renal failure and other disorders of kidney . . . . . . . .(N17–N19,N25,N27) 18 10 8 * * *Other and unspecified diseases of genitourinary
system . . . . . . . . . . . . . . . . . . . (N00–N15,N20–N23,N26,N28–N95) 11 8 3 * * *Certain conditions originating in the perinatal period . . . . . . . . . .(P00–P96) 1,705 1,005 700 12.7 13.2 12.1
Newborn affected by maternal factors and by complications ofpregnancy, labor and delivery . . . . . . . . . . . . . . . . . . . . .(P00–P04) 326 180 146 11.2 11.3 11.0Newborn affected by maternal hypertensive disorders . . . . . . . . (P00.0) 10 7 3 * * *Newborn affected by other maternal conditions which
may be unrelated to present pregnancy . . . . . . . . . . . (P00.1–P00.9) 20 10 10 25.3 * *Newborn affected by maternal complications of pregnancy . . . . . . (P01) 122 77 45 7.7 8.8 6.4
Newborn affected by incompetent cervix . . . . . . . . . . . . . . . (P01.0) 21 11 10 5.0 * *Newborn affected by premature rupture of membranes . . . . . . (P01.1) 52 37 15 7.8 10.3 *Newborn affected by multiple pregnancy . . . . . . . . . . . . . . . (P01.5) 16 8 8 * * *Newborn affected by other maternal complications of
pregnancy . . . . . . . . . . . . . . . . . . . . (P01.2–P01.4,P01.6–P01.9) 33 21 12 15.3 15.1 *Newborn affected by complications of placenta, cord and
membranes . . . . . . . . . . . . . . . . . . . . . . . . . . . . . . . . . (P02) 129 65 64 12.7 11.8 13.8Newborn affected by complications involving
placenta . . . . . . . . . . . . . . . . . . . . . . . . . . . . . (P02.0–P02.3) 64 32 32 11.7 10.7 12.8Newborn affected by complications involving cord . . . . (P02.4–P02.6) 9 2 7 * * *Newborn affected by chorioamnionitis . . . . . . . . . . . . . . . . (P02.7) 56 31 25 13.1 13.4 12.7Newborn affected by other and unspecified abnormalities
of membranes . . . . . . . . . . . . . . . . . . . . . . . . . (P02.8–P02.9) – – – * * *Newborn affected by other complications of labor and
delivery . . . . . . . . . . . . . . . . . . . . . . . . . . . . . . . . . . . . . (P03) 22 7 15 14.9 * *Newborn affected by noxious influences transmitted via
placenta or breast milk . . . . . . . . . . . . . . . . . . . . . . . . . . . (P04) 23 14 9 59.0 * *Disorders related to length of gestation and fetal
malnutrition . . . . . . . . . . . . . . . . . . . . . . . . . . . . . . . . .(P05–P08) 382 233 149 8.2 8.8 7.4Slow fetal growth and fetal malnutrition . . . . . . . . . . . . . . . . . . (P05) 10 7 3 * * *Disorders related to short gestation and low birth weight, not
elsewhere classified . . . . . . . . . . . . . . . . . . . . . . . . . . . . . (P07) 372 226 146 8.1 8.7 7.3Extremely low birth weight or extreme immaturity . . . . . (P07.0,P07.2) 264 166 98 7.6 8.4 6.5Other low birth weight or preterm . . . . . . . . . . . . . . . (P07.1,P07.3) 108 60 48 9.8 9.7 9.8
Disorders related to long gestation and high birth weight . . . . . . . (P08) – – – * * *Birth trauma . . . . . . . . . . . . . . . . . . . . . . . . . . . . . . . . .(P10–P15) 9 4 5 * * *Intrauterine hypoxia and birth asphyxia . . . . . . . . . . . . . . . .(P20–P21) 117 70 47 22.2 24.7 19.3
Intrauterine hypoxia . . . . . . . . . . . . . . . . . . . . . . . . . . . . . . (P20) 33 23 10 32.4 41.1 *Birth asphyxia . . . . . . . . . . . . . . . . . . . . . . . . . . . . . . . . . (P21) 84 47 37 19.8 20.7 18.8
See footnotes at end of table.
Series 20, No. 32 [ Page 15
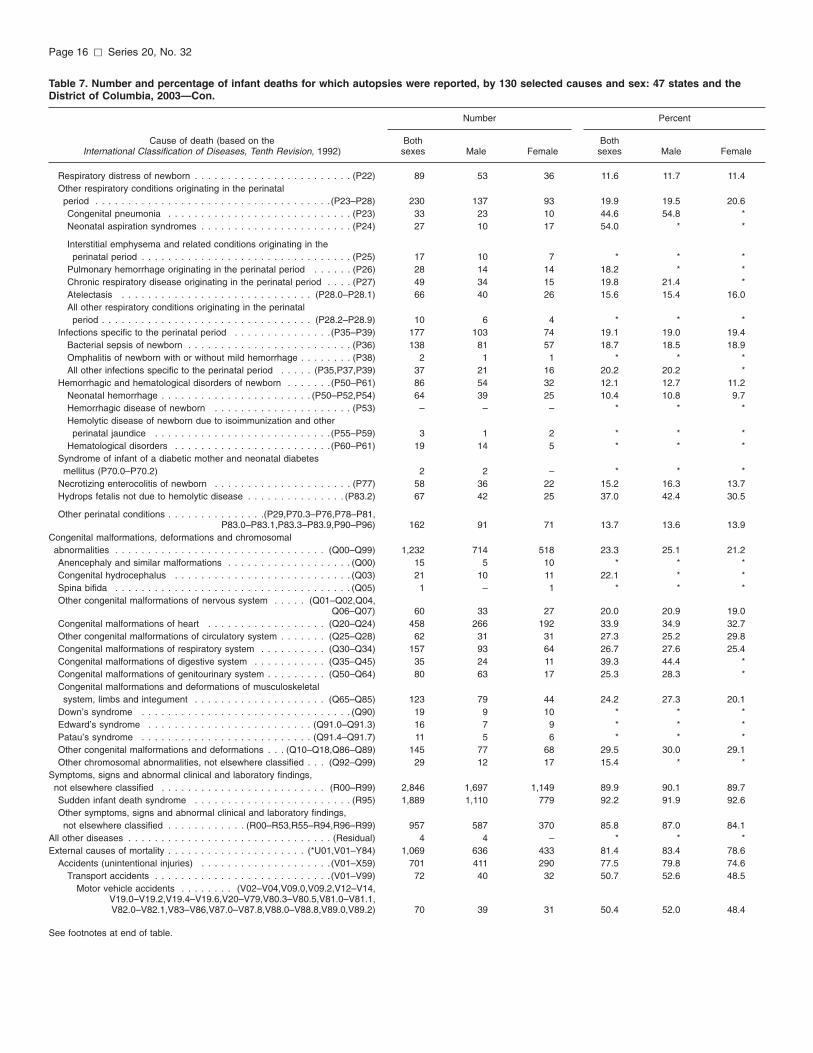
Table 7. Number and percentage of infant deaths for which autopsies were reported, by 130 selected causes and sex: 47 states and theDistrict of Columbia, 2003—Con.
Cause of death (based on theInternational Classification of Diseases, Tenth Revision, 1992)
Number Percent
Bothsexes Male Female
Bothsexes Male Female
Respiratory distress of newborn . . . . . . . . . . . . . . . . . . . . . . . . (P22) 89 53 36 11.6 11.7 11.4Other respiratory conditions originating in the perinatal
period . . . . . . . . . . . . . . . . . . . . . . . . . . . . . . . . . . . .(P23–P28) 230 137 93 19.9 19.5 20.6Congenital pneumonia . . . . . . . . . . . . . . . . . . . . . . . . . . . . (P23) 33 23 10 44.6 54.8 *Neonatal aspiration syndromes . . . . . . . . . . . . . . . . . . . . . . . (P24) 27 10 17 54.0 * *
Interstitial emphysema and related conditions originating in theperinatal period . . . . . . . . . . . . . . . . . . . . . . . . . . . . . . . . (P25) 17 10 7 * * *
Pulmonary hemorrhage originating in the perinatal period . . . . . . (P26) 28 14 14 18.2 * *Chronic respiratory disease originating in the perinatal period . . . . (P27) 49 34 15 19.8 21.4 *Atelectasis . . . . . . . . . . . . . . . . . . . . . . . . . . . . . (P28.0–P28.1) 66 40 26 15.6 15.4 16.0All other respiratory conditions originating in the perinatal
period . . . . . . . . . . . . . . . . . . . . . . . . . . . . . . . . (P28.2–P28.9) 10 6 4 * * *Infections specific to the perinatal period . . . . . . . . . . . . . . .(P35–P39) 177 103 74 19.1 19.0 19.4
Bacterial sepsis of newborn . . . . . . . . . . . . . . . . . . . . . . . . . (P36) 138 81 57 18.7 18.5 18.9Omphalitis of newborn with or without mild hemorrhage . . . . . . . . (P38) 2 1 1 * * *All other infections specific to the perinatal period . . . . . (P35,P37,P39) 37 21 16 20.2 20.2 *
Hemorrhagic and hematological disorders of newborn . . . . . . .(P50–P61) 86 54 32 12.1 12.7 11.2Neonatal hemorrhage . . . . . . . . . . . . . . . . . . . . . . . (P50–P52,P54) 64 39 25 10.4 10.8 9.7Hemorrhagic disease of newborn . . . . . . . . . . . . . . . . . . . . . (P53) – – – * * *Hemolytic disease of newborn due to isoimmunization and other
perinatal jaundice . . . . . . . . . . . . . . . . . . . . . . . . . . .(P55–P59) 3 1 2 * * *Hematological disorders . . . . . . . . . . . . . . . . . . . . . . . .(P60–P61) 19 14 5 * * *
Syndrome of infant of a diabetic mother and neonatal diabetesmellitus (P70.0–P70.2) 2 2 – * * *
Necrotizing enterocolitis of newborn . . . . . . . . . . . . . . . . . . . . . (P77) 58 36 22 15.2 16.3 13.7Hydrops fetalis not due to hemolytic disease . . . . . . . . . . . . . . . (P83.2) 67 42 25 37.0 42.4 30.5
Other perinatal conditions . . . . . . . . . . . . . . .(P29,P70.3–P76,P78–P81,P83.0–P83.1,P83.3–P83.9,P90–P96) 162 91 71 13.7 13.6 13.9
Congenital malformations, deformations and chromosomalabnormalities . . . . . . . . . . . . . . . . . . . . . . . . . . . . . . . . (Q00–Q99) 1,232 714 518 23.3 25.1 21.2Anencephaly and similar malformations . . . . . . . . . . . . . . . . . . . (Q00) 15 5 10 * * *Congenital hydrocephalus . . . . . . . . . . . . . . . . . . . . . . . . . . . (Q03) 21 10 11 22.1 * *Spina bifida . . . . . . . . . . . . . . . . . . . . . . . . . . . . . . . . . . . . (Q05) 1 – 1 * * *Other congenital malformations of nervous system . . . . . (Q01–Q02,Q04,
Q06–Q07) 60 33 27 20.0 20.9 19.0Congenital malformations of heart . . . . . . . . . . . . . . . . . . (Q20–Q24) 458 266 192 33.9 34.9 32.7Other congenital malformations of circulatory system . . . . . . . (Q25–Q28) 62 31 31 27.3 25.2 29.8Congenital malformations of respiratory system . . . . . . . . . . (Q30–Q34) 157 93 64 26.7 27.6 25.4Congenital malformations of digestive system . . . . . . . . . . . (Q35–Q45) 35 24 11 39.3 44.4 *Congenital malformations of genitourinary system . . . . . . . . . (Q50–Q64) 80 63 17 25.3 28.3 *Congenital malformations and deformations of musculoskeletal
system, limbs and integument . . . . . . . . . . . . . . . . . . . . (Q65–Q85) 123 79 44 24.2 27.3 20.1Down’s syndrome . . . . . . . . . . . . . . . . . . . . . . . . . . . . . . . . (Q90) 19 9 10 * * *Edward’s syndrome . . . . . . . . . . . . . . . . . . . . . . . . . (Q91.0–Q91.3) 16 7 9 * * *Patau’s syndrome . . . . . . . . . . . . . . . . . . . . . . . . . . (Q91.4–Q91.7) 11 5 6 * * *Other congenital malformations and deformations . . . (Q10–Q18,Q86–Q89) 145 77 68 29.5 30.0 29.1Other chromosomal abnormalities, not elsewhere classified . . . (Q92–Q99) 29 12 17 15.4 * *
Symptoms, signs and abnormal clinical and laboratory findings,not elsewhere classified . . . . . . . . . . . . . . . . . . . . . . . . . (R00–R99) 2,846 1,697 1,149 89.9 90.1 89.7Sudden infant death syndrome . . . . . . . . . . . . . . . . . . . . . . . . (R95) 1,889 1,110 779 92.2 91.9 92.6Other symptoms, signs and abnormal clinical and laboratory findings,not elsewhere classified . . . . . . . . . . . . (R00–R53,R55–R94,R96–R99) 957 587 370 85.8 87.0 84.1
All other diseases . . . . . . . . . . . . . . . . . . . . . . . . . . . . . . . (Residual) 4 4 – * * *External causes of mortality . . . . . . . . . . . . . . . . . . . . . (*U01,V01–Y84) 1,069 636 433 81.4 83.4 78.6
Accidents (unintentional injuries) . . . . . . . . . . . . . . . . . . . .(V01–X59) 701 411 290 77.5 79.8 74.6Transport accidents . . . . . . . . . . . . . . . . . . . . . . . . . . .(V01–V99) 72 40 32 50.7 52.6 48.5
Motor vehicle accidents . . . . . . . . (V02–V04,V09.0,V09.2,V12–V14,V19.0–V19.2,V19.4–V19.6,V20–V79,V80.3–V80.5,V81.0–V81.1,V82.0–V82.1,V83–V86,V87.0–V87.8,V88.0–V88.8,V89.0,V89.2) 70 39 31 50.4 52.0 48.4
See footnotes at end of table.
Page 16 [ Series 20, No. 32
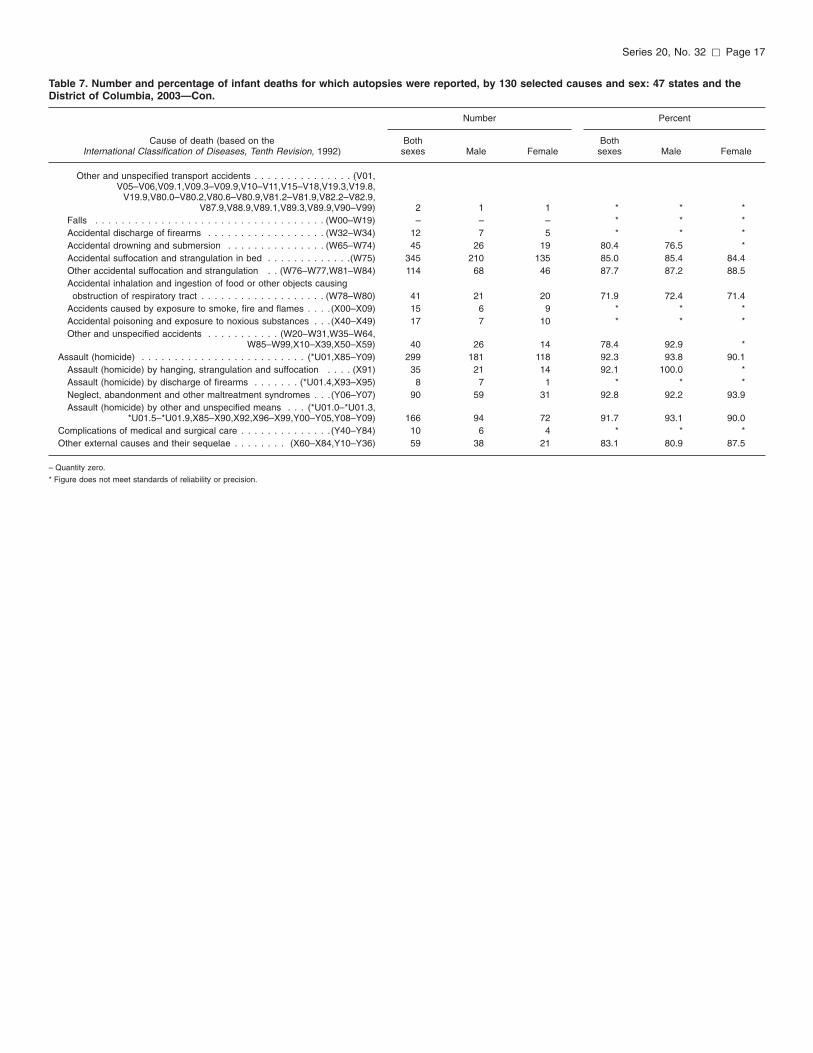
Table 7. Number and percentage of infant deaths for which autopsies were reported, by 130 selected causes and sex: 47 states and theDistrict of Columbia, 2003—Con.
Cause of death (based on theInternational Classification of Diseases, Tenth Revision, 1992)
Number Percent
Bothsexes Male Female
Bothsexes Male Female
Other and unspecified transport accidents . . . . . . . . . . . . . . . (V01,V05–V06,V09.1,V09.3–V09.9,V10–V11,V15–V18,V19.3,V19.8,
V19.9,V80.0–V80.2,V80.6–V80.9,V81.2–V81.9,V82.2–V82.9,V87.9,V88.9,V89.1,V89.3,V89.9,V90–V99) 2 1 1 * * *
Falls . . . . . . . . . . . . . . . . . . . . . . . . . . . . . . . . . . . (W00–W19) – – – * * *Accidental discharge of firearms . . . . . . . . . . . . . . . . . . (W32–W34) 12 7 5 * * *Accidental drowning and submersion . . . . . . . . . . . . . . . (W65–W74) 45 26 19 80.4 76.5 *Accidental suffocation and strangulation in bed . . . . . . . . . . . . .(W75) 345 210 135 85.0 85.4 84.4Other accidental suffocation and strangulation . . (W76–W77,W81–W84) 114 68 46 87.7 87.2 88.5Accidental inhalation and ingestion of food or other objects causing
obstruction of respiratory tract . . . . . . . . . . . . . . . . . . . (W78–W80) 41 21 20 71.9 72.4 71.4Accidents caused by exposure to smoke, fire and flames . . . .(X00–X09) 15 6 9 * * *Accidental poisoning and exposure to noxious substances . . .(X40–X49) 17 7 10 * * *Other and unspecified accidents . . . . . . . . . . . (W20–W31,W35–W64,
W85–W99,X10–X39,X50–X59) 40 26 14 78.4 92.9 *Assault (homicide) . . . . . . . . . . . . . . . . . . . . . . . . . (*U01,X85–Y09) 299 181 118 92.3 93.8 90.1
Assault (homicide) by hanging, strangulation and suffocation . . . . (X91) 35 21 14 92.1 100.0 *Assault (homicide) by discharge of firearms . . . . . . . (*U01.4,X93–X95) 8 7 1 * * *Neglect, abandonment and other maltreatment syndromes . . .(Y06–Y07) 90 59 31 92.8 92.2 93.9Assault (homicide) by other and unspecified means . . . (*U01.0–*U01.3,
*U01.5–*U01.9,X85–X90,X92,X96–X99,Y00–Y05,Y08–Y09) 166 94 72 91.7 93.1 90.0Complications of medical and surgical care . . . . . . . . . . . . . .(Y40–Y84) 10 6 4 * * *Other external causes and their sequelae . . . . . . . . (X60–X84,Y10–Y36) 59 38 21 83.1 80.9 87.5
– Quantity zero.
* Figure does not meet standards of reliability or precision.
Series 20, No. 32 [ Page 17
Page 18 [ Series 20, No. 32
Appendix
Technical Notes
Nature and sources of data
Data in this report are primarily based on information from all death certificates filed in the 50 states and the District of Columbia and are processed by the Centers for Disease Control and Prevention’s National Center for Health Statistics (NCHS). Mortality statistics are based on information coded by the states and provided to NCHS through the Vital Statistics Cooperative Program and from copies of the original certificates received by NCHS from the state registration offices. In 2003, all the states and the District of Columbia participated in this program and submitted part or all of the mortality data for 2003 in electronic data files to NCHS. Additional information on the data is available (16). See later section on the National Mortality Followback Survey for information on the source data for some of the information on the quality of autopsy data.
Cause-of-death classification
The mortality statistics presented in this report were compiled in accordance with the World Health Organization (WHO) regulations, which specify that member nations classify and code causes of death in accordance with the current revision of the International Classification of Diseases (ICD). The ICD provides the basic guidance used in virtually all countries to code and classify causes of death. Effective with deaths occurring in 1999, the United States began using the Tenth Revision of this classification (ICD-10) (16,17). These guidelines on cause-of-death classification incorporate circumstances and manner of death into its structure and refers to the categories in the classification as causes of death.
Tabulation lists for ICD-10 are published in the NCHS Instruction Manual, Part 9, ICD-10 Cause-of-Death Lists for Tabulating Mortality Statistics (Updated October 2002) (18). This
report uses two tabulation lists: the List of 113 Selected Causes of Death for deaths of all ages, and the List of 130 Selected Causes of Infant Death for infants. These lists are also used to rank leading causes of death for the two population groups. More detail regarding ranking procedures can be found in ‘‘Deaths: Leading Causes for 2003’’ (19).
Race and Hispanic origin In order to provide uniformity and
comparability of race data during the transition period between single-race reporting and multiple-race reporting, before all or most of the data are available in the new multiple-race format, it was necessary to ‘‘bridge’’ the responses of those for whom more than one race was reported (multiple race) to one, single race. Additional details on race reporting and the bridging procedure are available (16).
Race and Hispanic origin are reported separately on the death certificate. Therefore, data shown by race include persons of Hispanic and non-Hispanic origin, and data for Hispanic origin include persons of any race. In this report, unless otherwise specified, deaths of Hispanic origin are included in the totals for each race group—white, black, American Indian or Alaska Native (AIAN), and Asian or Pacific Islander (API)—according to the decedent’s race as reported on the death certificate. Data shown for Hispanic persons include all persons of Hispanic origin of any race.
Place death pronounced
Beginning with data for 2003, states are beginning to add a category for deaths occurring in licensed hospice facilities. Unknown place of death includes deaths thought to occur in hospitals but for which the decedent’s status was unknown.
National Mortality Followback Survey
The National Mortality Followback Survey (NMFS) is a survey conducted to provide additional information related to the mortality experience of the United
States beyond that obtained through the vital registration of deaths. The survey was composed of a sample of 22,957 death certificates for individuals aged 15 years or over who died in 1993 in 49 states and the District of Columbia. In the 1993 NMFS, additional information was collected from medical examiner or coroner offices if the death was due to homicide, suicide, accidents, pending and undetermined causes, a medical examiner or coroner certified the death, and the proxy respondent authorized release of the medical examiner or coroner records. Thus, additional information was not collected for deaths from natural causes. A total of 6,671 records were included in this subsample. Of these, 4,696 medical examiner or coroner reports were received (20).
Random variation Mortality data are not subject to
sampling error. Mortality data, even based on complete counts, may be affected by random variation. That is, the number of deaths that actually occurred may be considered as one of a large series of possible results that could have arisen under the same circumstances (21,22). When the number of deaths is small (perhaps less than 100), random variation tends to be relatively large. Therefore, considerable caution must be observed in interpreting statistics based on small numbers of deaths.
To quantify the random variation associated with mortality statistics, deaths, as infrequent events, can be viewed as deriving from a Poisson probability distribution. The Poisson distribution is simple conceptually and computationally, and provides reasonable, conservative variance estimates for mortality statistics when the probability of dying is relatively low (22). Confidence limits for numbers and percentages can be estimated from the actual number of vital events.
When the number of vital events is large, the distribution is assumed to follow a normal distribution (where the relative standard error is small). When the number of events is small and the probability of the event is small, the distribution is assumed to follow a
Series 20, No. 32 [ Page 19
Poisson probability distribution. Considerable caution should be observed in interpreting the occurrence of infrequent events. An asterisk (*) will be shown for any percentage that is based on fewer than 20 deaths in the numerator.
Computing 95 percent confidence intervals for percentages—A 95-percent confidence interval can be computed for a percentage when the following conditions are met (23):
D x p ≥ 5 and D x q ≥ 5
where
D = number of deaths in the denominator p = percent divided by 100 q = 1 – p
For mortality data, these conditions will be met except for very rare events in small subgroups. If the conditions are not met, the variation in the percentage will be so large as to render the confidence intervals meaningless. When these conditions are met the 95 percent confidence interval can be computed using the normal approximation of the binomial. The 95 percent confidence intervals are computed by the following formulas:
Lower limit = p – [1.96 x (√p x q / D)]
Upper limit = p + [1.96 x (√p x q / D)]
where
p = percent divided by 100 q = 1 – p D = number of deaths in the
denominator
Example—Suppose that the percentage of deaths among females aged 15–24 in Arizona that were autopsied was 49.7 percent. This was based on 14,751 deaths in the numerator and 29,682 deaths in the denominator. First we test to make sure we can use the normal approximation of the binomial:
29,682 x 0.497 = 14,752
29,682 x (1 – 0.497) = 29,682 x 0.503 = 14,930
Both 14,752 and 14,930 are greater than 5 so we can proceed. The 95 percent confidence interval would be:
Lower limit = 0.497 – [1.96 x (√0.497 x 0.503 / 29,682) ]
= 0.497 – 0.006 = 0.491 or 49.1 percent
Upper limit = 0.497 + [1.96 x (√0.497 x 0.503 / 29,682) ]
= 0.497 + 0.006 = 0.503 or 50.3 percent
This means that the chances are 95 out of 100 that the actual percentage of deaths of females aged 15–24 years that were autopsied in Arizona would be between 49.1 and 50.3 percent.
Testing differences between two percentages—When testing the difference between two percentages, both percentages must meet the following conditions:
D x p ≥ 5 and D x q ≥ 5
where
D = number of deaths in the denominator p = percent divided by 100 q = 1 – p
When both percentages meet these conditions, then the difference between the two percentages is considered statistically significant if it is greater than the statistic in the formula below. This statistic equals 1.96 times the standard error for the difference between two percentages.
1 1.96 x Π[p x (1 Рp) x S 1 + D]D1 D2
where
D1 = number of deaths in the denominator of the first percentage
D2 = number of deahts in the denominator of the second percentage
[(D1 x p1) + (D2 x p2)]p = (D1 + D2)
p1 = the first percentagep 2 = the second percentage
Example—Is the percentage of deaths to females aged 15–24 years that were autopsied higher in New Mexico (50.2) than in Arizona (49.7)? Suppose that the number in the denominator was 13,714 in New Mexico and 29,682 in Arizona. The necessary conditions are met for both percentages (calculations not shown). The difference between the two percentages is 0.502 – 0.497 = 0.005. The statistic is then calculated as follows:
1.96 x √ ( 0.499 x 0.501) x (0.000106609)
= 1.96 x √0.000026652
= 1.96 x 0.005162563
= 0.010
The difference between the percentages (0.005) is less than this statistic (0.010). Therefore, the difference is not statistically significant at the 95 percent confidence level.
Vital and Health Statistics series descriptions
SERIES 1. Programs and Collection Procedures—These reports describe the data collection programs of the National Center for Health Statistics. They include descriptions of the methods used to collect and process the data, definitions, and other material necessary for understanding the data.
SERIES 2. Data Evaluation and Methods Research—These reports are studies of new statistical methods and include analytical techniques, objective evaluations of reliability of collected data, and contributions to statistical theory. These studies also include experimental tests of new survey methods and comparisons of U.S. methodology with those of other countries.
SERIES 3. Analytical and Epidemiological Studies—These reports present analytical or interpretive studies based on vital and health statistics. These reports carry the analyses further than the expository types of reports in the other series.
SERIES 4. Documents and Committee Reports—These are final reports of major committees concerned with vital and health statistics and documents such as recommended model vital registration laws and revised birth and death certificates.
SERIES 5. International Vital and Health Statistics Reports—These reports are analytical or descriptive reports that compare U.S. vital and health statistics with those of other countries or present other international data of relevance to the health statistics system of the United States.
SERIES 6. Cognition and Survey Measurement—These reports are from the National Laboratory for Collaborative Research in Cognition and Survey Measurement. They use methods of cognitive science to design, evaluate, and test survey instruments.
SERIES 10. Data From the National Health Interview Survey—These reports contain statistics on illness; unintentional injuries; disability; use of hospital, medical, and other health services; and a wide range of special current health topics covering many aspects of health behaviors, health status, and health care utilization. They are based on data collected in a continuing national household interview survey.
SERIES 11. Data From the National Health Examination Survey, the National Health and Nutrition Examination Surveys, and the Hispanic Health and Nutrition Examination Survey— Data from direct examination, testing, and measurement on representative samples of the civilian noninstitutionalized population provide the basis for (1) medically defined total prevalence of specific diseases or conditions in the United States and the distributions of the population with respect to physical, physiological, and psychological characteristics, and (2) analyses of trends and relationships among various measurements and between survey periods.
SERIES 12. Data From the Institutionalized Population Surveys— Discontinued in 1975. Reports from these surveys are included in Series 13.
SERIES 13. Data From the National Health Care Survey—These reports contain statistics on health resources and the public’s use of health care resources including ambulatory, hospital, and long-term care services based on data collected directly from health care providers and provider records.
SERIES 14. Data on Health Resources: Manpower and Facilities— Discontinued in 1990. Reports on the numbers, geographic distribution, and characteristics of health resources are now included in Series 13.
SERIES 15. Data From Special Surveys—These reports contain statistics on health and health-related topics collected in special surveys that are not part of the continuing data systems of the National Center for Health Statistics.
SERIES 16. Compilations of Advance Data From Vital and Health Statistics—Advance Data Reports provide early release of information from the National Center for Health Statistics’ health and demographic surveys. They are compiled in the order in which they are published. Some of these releases may be followed by detailed reports in Series 10–13.
SERIES 20. Data on Mortality—These reports contain statistics on mortality that are not included in regular, annual, or monthly reports. Special analyses by cause of death, age, other demographic variables, and geographic and trend analyses are included.
SERIES 21. Data on Natality, Marriage, and Divorce—These reports contain statistics on natality, marriage, and divorce that are not included in regular, annual, or monthly reports. Special analyses by health and demographic variables and geographic and trend analyses are included.
SERIES 22. Data From the National Mortality and Natality Surveys— Discontinued in 1975. Reports from these sample surveys, based on vital records, are now published in Series 20 or 21.
SERIES 23. Data From the National Survey of Family Growth—These reports contain statistics on factors that affect birth rates, including contraception, infertility, cohabitation, marriage, divorce, and remarriage; adoption; use of medical care for family planning and infertility; and related maternal and infant health topics. These statistics are based on national surveys of women of childbearing age.
SERIES 24. Compilations of Data on Natality, Mortality, Marriage, and Divorce—These include advance reports of births, deaths, marriages, and divorces based on final data from the National Vital Statistics System that were published as National Vital Statistics Reports (NVSR), formerly Monthly Vital Statistics Report. These reports provide highlights and summaries of detailed data subsequently published in Vital Statistics of the United States. Other special reports published here provide selected findings based on final data from the National Vital Statistics System and may be followed by detailed reports in Series 20 or 21.
For answers to questions about this report or for a list of reports published in these series, contact:
Information Dissemination Staff National Center for Health Statistics Centers for Disease Control and Prevention 3311 Toledo Road, Room 5412 Hyattsville, MD 20782
1-866-441-6247E-mail: [email protected]: www.cdc.gov/nchs
FIRST CLASSPOSTAGE & FEES PAID
CDC/NCHSPERMIT NO. G-284
U.S. DEPARTMENT OF HEALTH & HUMAN SERVICES
Centers for Disease Control and Prevention National Center for Health Statistics 3311 Toledo Road Hyattsville, MD 20782
OFFICIAL BUSINESS PENALTY FOR PRIVATE USE, $300
07-0008 (3/2007) CS108449 T27347 DHHS Publication No. (PHS) 2007-1851, Series 20, No. 32
Recommended