University of Central Florida University of Central Florida
STARS STARS
Electronic Theses and Dissertations, 2004-2019
2013
Assessment, Optimization, And Enhancement Of Ultrafiltration Assessment, Optimization, And Enhancement Of Ultrafiltration
(uf) Membrane Processes In Potable Water Treatment (uf) Membrane Processes In Potable Water Treatment
Christopher Boyd University of Central Florida
Part of the Environmental Engineering Commons
Find similar works at: https://stars.library.ucf.edu/etd
University of Central Florida Libraries http://library.ucf.edu
This Doctoral Dissertation (Open Access) is brought to you for free and open access by STARS. It has been accepted
for inclusion in Electronic Theses and Dissertations, 2004-2019 by an authorized administrator of STARS. For more
information, please contact [email protected].
STARS Citation STARS Citation Boyd, Christopher, "Assessment, Optimization, And Enhancement Of Ultrafiltration (uf) Membrane Processes In Potable Water Treatment" (2013). Electronic Theses and Dissertations, 2004-2019. 2712. https://stars.library.ucf.edu/etd/2712
ASSESSMENT, OPTIMIZATION, AND ENHANCEMENT OF ULTRAFILTRATION (UF)
MEMBRANE PROCESSES IN POTABLE WATER TREATMENT
by
CHRISTOPHER C. BOYD B.S. University of Central Florida, 2009 M.S. University of Central Florida, 2011
A dissertation submitted in partial fulfillment of the requirements for the degree of Doctor of Engineering
in the Department of Civil, Environmental, and Construction Engineering in the College of Engineering and Computer Science
at the University of Central Florida Orlando, Florida
Spring Term 2013
Major Professor: Steven. J. Duranceau
©2013 Christopher C. Boyd
ii
ABSTRACT
This dissertation reports on research related to ultrafiltration (UF) membranes in drinking water
applications. A pilot-scale investigation identified seasonal surface water quality impacts on UF
performance and resulted in the development of a dynamic chemically enhanced backwash
protocol for fouling management. Subsequent analysis of UF process data revealed limitations
with the use of specific flux, transmembrane pressure (TMP), and other normalization techniques
for assessing UF process fouling. A new TMP balance approach is presented that identifies the
pressure contribution of membrane fouling and structural changes, enables direct process
performance comparisons at different operating fluxes, and distinguishes between physically and
chemically unresolved fouling. In addition to the TMP balance, a five component optimization
approach is presented for the systematic improvement of UF processes on the basis of TMP
variations. Terms are defined for assessing process event performance, a new process utilization
term is presented to benchmark UF productivity, and new measures for evaluating maintenance
procedures are discussed. Using these tools, a correlation between process utilization and
operating pressures was established and a sustainable process utilization of 93.5% was achieved.
UF process capabilities may be further enhanced by pre-coating media onto the membrane
surface. Silicon dioxide (SiO2) and powdered activated carbon (PAC) are evaluated as pre-
coating materials, and the applicability of the TMP balance for assessing pre-coated membrane
performance is demonstrated. The first use of SiO2 as a support layer for PAC in a membrane
pre-coating application is presented at the laboratory-scale. SiO2-PAC pre-coatings successfully
reduced physically unresolved fouling and enhanced UF membrane organics removal
capabilities.
iii
This dissertation is dedicated to my parents James and Anne, my brother Andrew, and my love
Adriana. Their constant support has made this endeavor possible.
iv
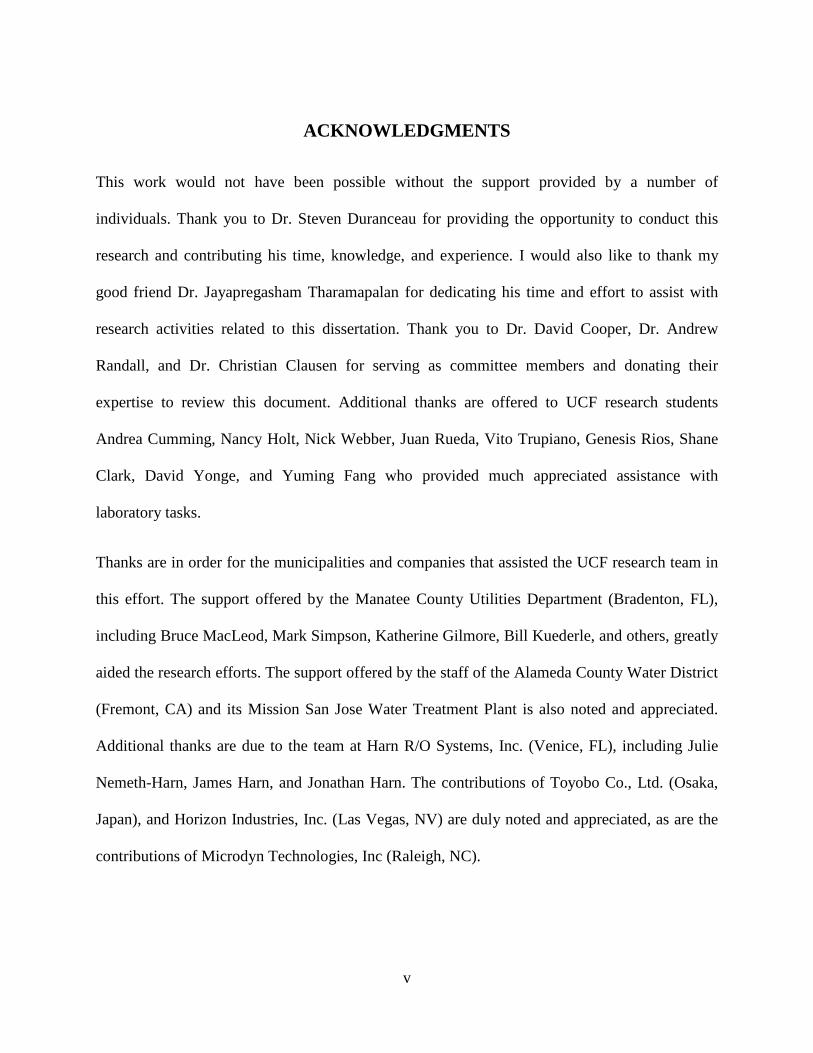
ACKNOWLEDGMENTS
This work would not have been possible without the support provided by a number of
individuals. Thank you to Dr. Steven Duranceau for providing the opportunity to conduct this
research and contributing his time, knowledge, and experience. I would also like to thank my
good friend Dr. Jayapregasham Tharamapalan for dedicating his time and effort to assist with
research activities related to this dissertation. Thank you to Dr. David Cooper, Dr. Andrew
Randall, and Dr. Christian Clausen for serving as committee members and donating their
expertise to review this document. Additional thanks are offered to UCF research students
Andrea Cumming, Nancy Holt, Nick Webber, Juan Rueda, Vito Trupiano, Genesis Rios, Shane
Clark, David Yonge, and Yuming Fang who provided much appreciated assistance with
laboratory tasks.
Thanks are in order for the municipalities and companies that assisted the UCF research team in
this effort. The support offered by the Manatee County Utilities Department (Bradenton, FL),
including Bruce MacLeod, Mark Simpson, Katherine Gilmore, Bill Kuederle, and others, greatly
aided the research efforts. The support offered by the staff of the Alameda County Water District
(Fremont, CA) and its Mission San Jose Water Treatment Plant is also noted and appreciated.
Additional thanks are due to the team at Harn R/O Systems, Inc. (Venice, FL), including Julie
Nemeth-Harn, James Harn, and Jonathan Harn. The contributions of Toyobo Co., Ltd. (Osaka,
Japan), and Horizon Industries, Inc. (Las Vegas, NV) are duly noted and appreciated, as are the
contributions of Microdyn Technologies, Inc (Raleigh, NC).
v
TABLE OF CONTENTS
LIST OF FIGURES ...................................................................................................................... xii
LIST OF TABLES ....................................................................................................................... xiv
LIST OF ABBREVIATIONS ....................................................................................................... xv
CHAPTER 1. GENERAL INTRODUCTION ............................................................................... 1
CHAPTER 2. ASSESSING AND MAINTAINING MEMBRANE PERFORMANCE IN A
POST-SEDIMENTATION ULTRAFILTRATION PROCESS..................................................... 2
2.1. Abstract ................................................................................................................................ 2
2.2. Introduction .......................................................................................................................... 3
2.3. Pilot Description and Methods............................................................................................. 4
2.4. Results and Discussion ........................................................................................................ 6
2.5. Conclusions ........................................................................................................................ 12
2.6. Acknowledgments.............................................................................................................. 13
2.7. References .......................................................................................................................... 14
CHAPTER 3. MEMBRANE FILTRATION PROCESS FOULING EVALUATION USING A
NOVEL TRANSMEMBRANE PRESSURE (TMP) BALANCE APPROACH ......................... 15
3.1. Abstract .............................................................................................................................. 15
3.2. Introduction ........................................................................................................................ 16
3.3. Background ........................................................................................................................ 16
vi
3.3.1. Operational Considerations for Membrane Filtration Processes ................................ 16
3.3.2. Common Approaches to Assessing Membrane Performance ..................................... 18
3.3.3. Limitations of Specific Flux and TMP ....................................................................... 21
3.4. Materials and Methods ....................................................................................................... 23
3.4.1. Pilot Test Plan ............................................................................................................. 23
3.4.2. Test Locations ............................................................................................................. 23
3.4.2.1. Lake Manatee WTP ............................................................................................. 23
3.4.2.2. Mission San Jose WTP ........................................................................................ 24
3.4.3. Membrane Description................................................................................................ 24
3.4.4. UF Pilot Units ............................................................................................................. 24
3.4.5. UF Pilot Operations .................................................................................................... 25
3.4.6. Method of Data Compilation ...................................................................................... 25
3.5. Results and Discussion ...................................................................................................... 26
3.5.1. Development of the TMP Balance Equation .............................................................. 26
3.5.2. Example TMP Balance Calculation ............................................................................ 29
3.5.3. Interpreting the TMP Balance ..................................................................................... 30
3.5.4. Monitoring Performance Using the TMP Balance Method ........................................ 31
3.5.5. Pilot-Scale Application of the TMP Balance Method ................................................ 33
3.5.5.1. Mission San Jose WTP UF Pilot .......................................................................... 33
vii
3.5.5.1.1. Evaluation of Pilot Performance with the TMP Balance Approach ............. 34
3.5.5.1.2. Comparison of Performance with Specific Flux Trends............................... 35
3.5.5.2. Lake Manatee WTP UF Pilot ............................................................................... 37
3.5.5.2.1. Evaluation of Pilot Performance with the TMP Balance Approach ............. 38
3.5.5.2.2. Statistical Comparison of Performance Monitoring Approaches ................. 41
3.6. Conclusions ........................................................................................................................ 43
3.7. Acknowledgments.............................................................................................................. 44
3.8. References .......................................................................................................................... 45
CHAPTER 4. FIVE COMPONENT OPTIMIZATION APPROACH FOR MEMBRANE
FILTRATION PROCESSES USING TRANSMEMBRANE PRESSURE (TMP) VARIATIONS
....................................................................................................................................................... 51
4.1. Abstract .............................................................................................................................. 51
4.2. Introduction ........................................................................................................................ 52
4.3. Methods and Materials ....................................................................................................... 54
4.3.1. UF Pilot Test Location ................................................................................................ 54
4.3.2. UF Membrane and Pilot Unit Description .................................................................. 54
4.3.3. UF Pilot Operations .................................................................................................... 55
4.3.4. UF Pilot Operating History ......................................................................................... 55
4.3.5. Water Quality Testing ................................................................................................. 55
4.3.6. Method of Data Compilation ...................................................................................... 56
viii
4.3.7. Method of Performance Monitoring ........................................................................... 56
4.4. Results and Discussion ...................................................................................................... 58
4.4.1. Characterization of Process Events via Pressure Variation ........................................ 58
4.4.2. Assessment of Cleaning Performance ........................................................................ 59
4.4.3. Process Production Benchmarks ................................................................................. 59
4.4.3.1. UF Process Recovery ........................................................................................... 60
4.4.3.2. UF Process Utilization ......................................................................................... 60
4.4.4. Optimization Approach ............................................................................................... 61
4.4.5. Lake Manatee UF Optimization Study ....................................................................... 62
4.4.5.1. Optimization Test Plan ........................................................................................ 62
4.4.5.2. Feed Water Quality .............................................................................................. 62
4.4.5.3. Optimization Performance Summary .................................................................. 64
4.4.5.4. Process Event Evaluation ..................................................................................... 65
4.4.5.4.1. Filtration ........................................................................................................ 65
4.4.5.4.2. Backwashes ................................................................................................... 65
4.4.5.4.3. Chemical Cleaning ........................................................................................ 67
4.4.5.5. Operating Pressure Assessment ........................................................................... 70
4.4.5.6. Findings................................................................................................................ 71
4.5. Conclusions ........................................................................................................................ 72
ix
4.6. Recommendations .............................................................................................................. 72
4.7. Acknowledgments.............................................................................................................. 73
4.8. References .......................................................................................................................... 74
CHAPTER 5. SILICON DIOXIDE AS A SUPPORT LAYER FOR POWDERED ACTIVATED
CARBON IN THE PRE-COATING ENHANCEMENT OF ULTRAFILTRATION
MEMBRANES ............................................................................................................................. 79
5.1. Abstract .............................................................................................................................. 79
5.2. Introduction ........................................................................................................................ 80
5.3. Materials ............................................................................................................................ 82
5.3.1. UF Membrane Test Equipment ................................................................................... 82
5.3.2. UF Membrane ............................................................................................................. 83
5.3.3. UF Membrane Pre-Coating Materials ......................................................................... 83
5.3.3.1. SiO2 ...................................................................................................................... 83
5.3.3.2. PAC ...................................................................................................................... 83
5.3.4. Surface Water.............................................................................................................. 83
5.4. Methods.............................................................................................................................. 84
5.4.1. UF Membrane Preparation .......................................................................................... 84
5.4.2. UF Membrane Pre-coating Procedure ........................................................................ 84
5.4.3. UF Test Procedure ...................................................................................................... 85
5.4.4. Organic Carbon Analysis ............................................................................................ 85
x

5.4.5. UF Performance Assessment Method: TMP Balance Approach ................................ 85
5.5. Results and Discussion ...................................................................................................... 87
5.5.1. Implementation of the TMP Balance for Pre-Coating Evaluations ............................ 87
5.5.2. TMP Balance Evaluation of SiO2 Pre-Coat Performance........................................... 90
5.5.3. TMP Balance Evaluation of PAC Pre-Coat Performance .......................................... 92
5.5.3.1. Assessment of Pre-Coated PAC Operating Performance .................................... 92
5.5.3.2. Organic Carbon Removal with PAC Pre-Coat .................................................... 95
5.5.4. Combined SiO2 – PAC Pre-Coating Demonstration .................................................. 96
5.6. Conclusions ........................................................................................................................ 99
5.7. Acknowledgments............................................................................................................ 100
5.8. References ........................................................................................................................ 101
CHAPTER 6. GENERAL CONCLUSION ................................................................................ 105
APPENDIX A: SUPPLEMENTAL INFORMATION – ADDITIONAL TMP BALANCE
FUNCTIONALITY FOR MEMBRANE PRE-COATING ........................................................ 107
APPENDIX B: LABORATORY QUALITY CONTROL RECORDS ..................................... 109
APPENDIX C: WATER PRACTICE & TECHNOLOGY PERMISSION LETTER ............... 111
xi
LIST OF FIGURES
Figure 2-1 UF Pilot during Construction (left) and Installed at the Lake Manatee WTP (right) ... 5
Figure 2-2 Water Quality Data (August, 2010 – May, 2011) ......................................................... 8
Figure 2-3 UF Pilot Performance Chart (August – October, 2010) .............................................. 10
Figure 2-4 UF Pilot Performance Chart (November, 2010 – January, 2011) ............................... 10
Figure 2-5 UF Pilot Performance Chart (February – May, 2011) ................................................ 12
Figure 3-1 Relationship between Specific Flux and TMP ............................................................ 22
Figure 3-2 Distinction between Operating Sequences, Cycles, and Periods ................................ 28
Figure 3-3 Graphical Description of the Key Performance Monitoring TMP Balance Values .... 32
Figure 3-4 Mission San Jose WTP UF Pilot – TMP Balance Results .......................................... 36
Figure 3-5 Mission San Jose WTP UF Pilot – Distribution of Operating TMP Balance Values . 36
Figure 3-6 Mission San Jose WTP UF Pilot - Specific Flux per Cycle ........................................ 37
Figure 3-7 Manatee County UF Pilot - TMP Balance Results ..................................................... 38
Figure 3-8 Manatee County UF Pilot – Frequency Distribution of Operating TMP Balance
Values for Cases 1, 2, and 3 .......................................................................................................... 41
Figure 3-9 Manatee UF Pilot – Statistical Comparison for Per Cycle Fouling Assessment ........ 42
Figure 4-1 Post-backwash and Post-CEB TMP Balance Results for the Lake Manatee UF Pilot 64
Figure 4-2 Pressure Distribution of ΔFiltration Values ................................................................ 66
Figure 4-3 Post-backwash TMP Balance Results for Optimization Phases 1 – 6 ........................ 68
Figure 4-4 Non-linear Post-backwash TMP Balance Data for a Phase 5 Cycle ........................... 68
Figure 4-5 Distribution of Operating TMP Balance Values for Optimization Phases 1 - 6 ......... 70
Figure 5-1 UF Membrane Test Units ............................................................................................ 82
xii
Figure 5-2 Intrinsic Resistances of a Pre-Coated UF Membrane ................................................. 88
Figure 5-3 TCTMP versus Volumetric Flux for SiO2 Pre-Coated UF Membranes ..................... 89
Figure 5-4 TCTMP versus Volumetric Flux for PAC Pre-Coated UF Membranes ..................... 89
Figure 5-5 TMP Balance for SiO2 Pre-Coating Experiments ....................................................... 91
Figure 5-6 Images of SiO2 Pre-Coated Membranes ..................................................................... 92
Figure 5-7 Post-Backwash TMP Balance Results ........................................................................ 93
Figure 5-8 TMP Balance for PAC Pre-Coating Experiments ....................................................... 93
Figure 5-9 Images of PAC Pre-Coated Membranes ..................................................................... 94
Figure 5-10 Organic Carbon Removal Values.............................................................................. 96
Figure 5-11 TMP Balance for SiO2-PAC Pre-Coating Experiments ............................................ 98
Figure 5-12 Operating TMP Balance Distribution Comparison Chart ......................................... 98
Figure 5-13 Images of PAC-SiO2 Pre-Coated Membranes .......................................................... 99
xiii

LIST OF TABLES
Table 2-1 Summary of Pilot Test Operating Parameters ................................................................ 6
Table 2-2 Summary of UF Pilot Test CEB Chemical Use ............................................................. 9
Table 3-1 Interpretation of TMP Balance Values ......................................................................... 30
Table 3-2 Definition of the Key Performance Monitoring TMP Balance Values ........................ 32
Table 4-1 Optimization Test Plan for the Lake Manatee UF Pilot ............................................... 63
Table 4-2 Lake Manatee UF Pilot Feed Water Quality Summary ................................................ 63
Table 4-3 Backwash Performance Results for Optimization Phases 1 - 6 ................................... 66
Table 4-4 CEB Performance Results for Optimization Phases 1 - 6 ............................................ 69
Table 5-1 Water Quality Data: Pre-filtered Lake Claire Surface Water ....................................... 84
xiv
LIST OF ABBREVIATIONS
CEB – chemically enhanced backwash
CIP – clean-in-place
DOC – dissolved organic carbon
PAC – powdered activated carbon
PES – polyethersulfone
RP – residual pressure
SiO2 – silicon dioxide
TCF – temperature correction factor
TCTMP – temperature corrected transmembrane pressure
TDS – total dissolved solids
TMP – transmembrane pressure
TOC – total organic carbon
TSS – total suspended solids
UF – ultrafiltration
VFD – variable frequency drive
WTP – water treatment plant
xv
CHAPTER 1. GENERAL INTRODUCTION
In March of 2010, the University of Central Florida began a two year ultrafiltration (UF) pilot
test at the Lake Manatee Water Treatment Plant (WTP) in Manatee County, Florida. In
September of that same year, UCF commenced a second UF pilot study at the Mission San Jose
WTP in Fremont, California. The Lake Manatee and Mission San Jose WTPs were identified as
excellent pilot test locations, because the facilities treated two distinctly different surface waters.
The Lake Manatee WTP treats water from the Lake Manatee Reservoir with alum coagulation,
flocculation, sedimentation, and periodic powdered activated carbon (PAC) dosing for seasonal
taste and odor events. In contrast, the Mission San Jose WTP practices ferric chloride
coagulation with up-flow solids contact clarifiers to treat water from the Sacramento delta.
UF technology offers significant possibilities for meeting anticipated water supply challenges in
the coming years, and the pilot test projects provided an opportunity to evaluate concepts for the
improvement of UF treatment capabilities. The research presented in this dissertation focuses on
methods for improving the efficiency of UF processes, including the implementation of dynamic
cleaning protocols, the provision of new tools for UF membrane performance evaluations, and
the optimization of UF processes for improved filtrate production. In conjunction with the goal
of improving UF process capabilities, a literature review was conducted to identify alternative
applications for UF membranes in drinking water treatment. The pre-coating of UF membranes
was identified as an emerging area of research offering the potential to both improve
contaminant removal and reduce membrane fouling. Accordingly, laboratory scale experiments
were performed to evaluate a new concept for the pre-coating of UF membranes.
1
CHAPTER 2. ASSESSING AND MAINTAINING MEMBRANE PERFORMANCE IN A POST-SEDIMENTATION ULTRAFILTRATION
PROCESS
The following information has been published in the peer-reviewed journal Water Practice &
Technology:
Boyd, C. C., & Duranceau, S. J. (2012). Assessing and maintaining membrane performance in a
post-sedimentation ultrafiltration process. Water Practice & Technology, 7(2). doi:
10.2166/wpt.2012.041
2.1. Abstract
A pilot test program was conducted to evaluate methods for maintaining the productivity of a
hollow fiber ultrafiltration membrane operating at constant flux values of 49.2 and 62.3
gallons/ft2-day. The ultrafiltration pilot filtered settled water from a conventional surface water
treatment plant in Florida. The testing assessed the impact of different chemical maintenance
protocols on UF membrane performance. Seasonal variations in water quality necessitated
changes in the type and combination of cleaning agents used to maintain membrane
performance. Sodium hypochlorite, citric acid, and sodium hydroxide were used during pilot
testing as the fouling characteristics of the water changed with time. Pilot results were used to
develop alternative chemically enhanced backwash strategies that varied with seasonally-
impacted changes in feed water quality. Citric acid, with a target pH of < 3, was found to be
effective in August and September; whereas, a combination of citric acid and sodium hydroxide
chemically enhanced backwashes successfully maintained performance between November,
2010 and May, 2011.
2

2.2. Introduction
Ultrafiltration (UF) is a membrane process that separates suspended solids from water streams,
similar to conventional media filters. However, UF membrane filtration is also capable of
effectively removing colloidal, microbiological, and particulate matter much smaller than
conventional filters are capable of removing. UF membranes can consistently produce filtered
water with turbidity values below 0.05 NTU (Duranceau & Taylor 2011). As a result, UF
technology has gained acceptance within the drinking water community for use in treating
surface water supplies in the production of drinking water. Because the quality of the source
water treated by UF technology affects membrane performance, pilot studies are required to
optimize membrane process operating parameters (American Water Works Association Research
Foundation et al., 1996).
This document describes the results of a UF membrane pilot test conducted at the Lake Manatee
Water Treatment Plant (WTP) in Manatee County, Florida. The pilot test was conducted to
evaluate the performance of a hollow fiber UF membrane manufactured by Toyobo Co., Ltd.
(Durasep UPF0860, Osaka, Japan) for producing drinking water from a difficult-to-treat, highly-
organic, and variable Florida surface water supply. Membrane cleaning requirements were
investigated to develop guidelines for chemical cleaning via chemically enhanced backwashes
(CEBs). Surface water in Florida is known for being low in total hardness, microbially-active,
warm, and highly organic in nature. These water quality characteristics represent significant
daily challenges to conventional treatment plant operations.
The Lake Manatee WTP is owned and operated by the Manatee County Utilities Department
(Bradenton, Florida) and treats surface water using a conventional treatment process that
3
includes alum coagulation, flocculation, sedimentation, media filtration, and disinfection. At the
head of the treatment works, the utility doses powdered activated carbon (PAC) as needed for the
removal of taste and odor compounds. Surface water then flows into rapid mix basins where
alum and lime are added in varying amounts to facilitate coagulation. A polymer is then added
during flocculation to promote the formation of a flocculant that will settle. Following
sedimentation, water is dosed with additional lime for pH adjustment and a small dose of
chlorine before flowing into filter beds to facilitate the removal of unsettled particles. Because
the Lake Manatee WTP also treats a hard groundwater supply, filter bed effluent is blended with
lime-softened groundwater before final disinfection with chloramines, corrosion prevention, and
hydrofluorosilicic acid addition prior to distribution to its drinking water system (Manatee
County Utilities Department, 2009).
2.3. Pilot Description and Methods
The UF pilot, designed by Harn R/O Systems, Inc. (Venice, Florida), incorporates one Toyobo
Durasep UPF0860 hollow fiber UF membrane operated in an inside-out direct configuration.
Toyobo’s Durasep membrane fibers are composed of hydrophilic polyethersulfone (PES)
blended with polyvinylpyrrolidone. The UF hollow fiber membrane has an outside fiber diameter
of 1.3 mm (0.051 inches) and an inside fiber diameter of 0.8 mm (0.031 inches) with an average
pore size diameter of 0.01 μm offering 150,000 dalton cutoff. The pilot is automated and
equipped with onboard pressure gauges and transmitters, feed and backwash pumps with
variable frequency drives (VFDs), feed and filtrate turbidity meters, flow meters, a particle
counter, two chemical feed systems, water sample taps, and an air compressor for pneumatic
valve operation. Data is logged by the pilot at two minute intervals to facilitate data analysis and
4
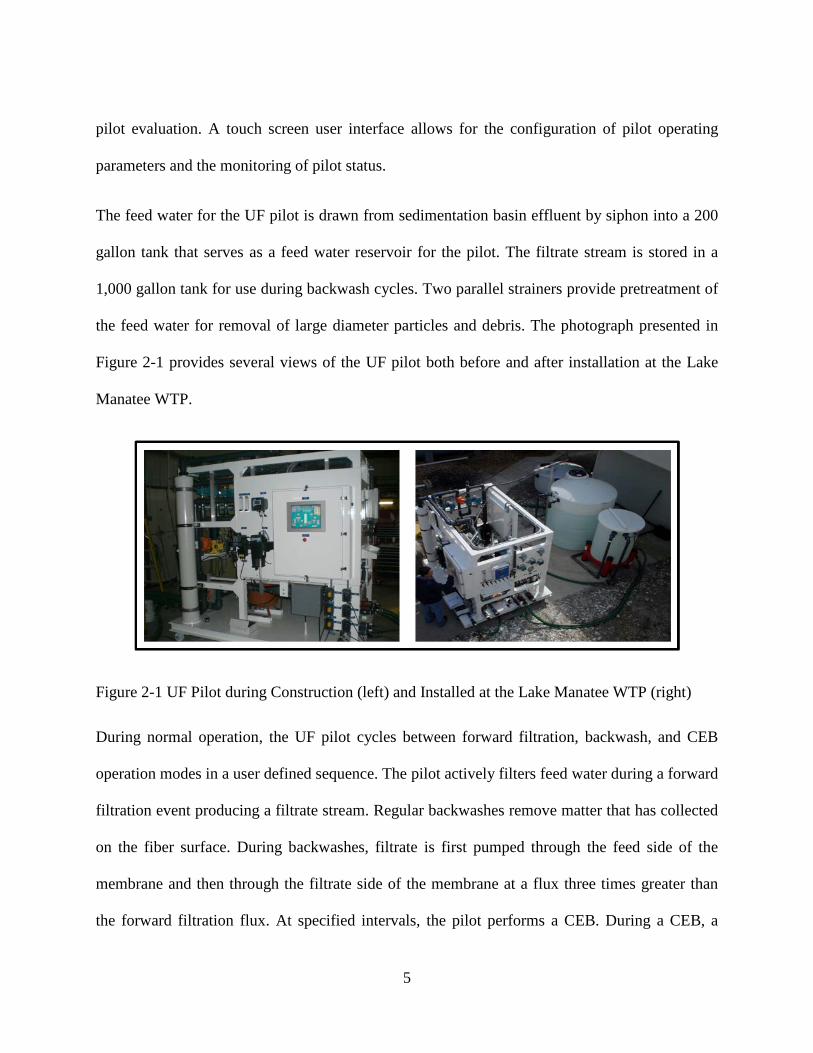
pilot evaluation. A touch screen user interface allows for the configuration of pilot operating
parameters and the monitoring of pilot status.
The feed water for the UF pilot is drawn from sedimentation basin effluent by siphon into a 200
gallon tank that serves as a feed water reservoir for the pilot. The filtrate stream is stored in a
1,000 gallon tank for use during backwash cycles. Two parallel strainers provide pretreatment of
the feed water for removal of large diameter particles and debris. The photograph presented in
Figure 2-1 provides several views of the UF pilot both before and after installation at the Lake
Manatee WTP.
Figure 2-1 UF Pilot during Construction (left) and Installed at the Lake Manatee WTP (right)
During normal operation, the UF pilot cycles between forward filtration, backwash, and CEB
operation modes in a user defined sequence. The pilot actively filters feed water during a forward
filtration event producing a filtrate stream. Regular backwashes remove matter that has collected
on the fiber surface. During backwashes, filtrate is first pumped through the feed side of the
membrane and then through the filtrate side of the membrane at a flux three times greater than
the forward filtration flux. At specified intervals, the pilot performs a CEB. During a CEB, a
5
chemical such as sodium hypochlorite or citric acid is injected into the backwash stream to
remove a targeted foulant, allowed to soak on the membrane fibers, and then rinsed prior to the
restart of forward filtration.
The pilot test plan required evaluation of UF membrane performance at different flux rates,
backwash frequencies, and cleaning schedules to determine a suitable operating condition for the
consistent production of filtrate with turbidity values below 0.1 NTU. This paper presents
selected results from the pilot test at moderate and high filtration flux rates of 49.2 and 62.3
gallons/ft2-day. Table 2-1 provides a summary of the forward filtration and backwash operating
parameters for each flux case. UF membrane performance was assessed by monitoring trends in
specific flux and transmembrane pressure (TMP). The calculation of specific flux was carried out
in accordance with guidelines in Water Treatment Principles and Design (MWH, 2005). Flux
values were corrected to 20 °C using a generic temperature correction factor equation. Prior to
graphing, a statistical analysis and hourly averaging of the data was performed.
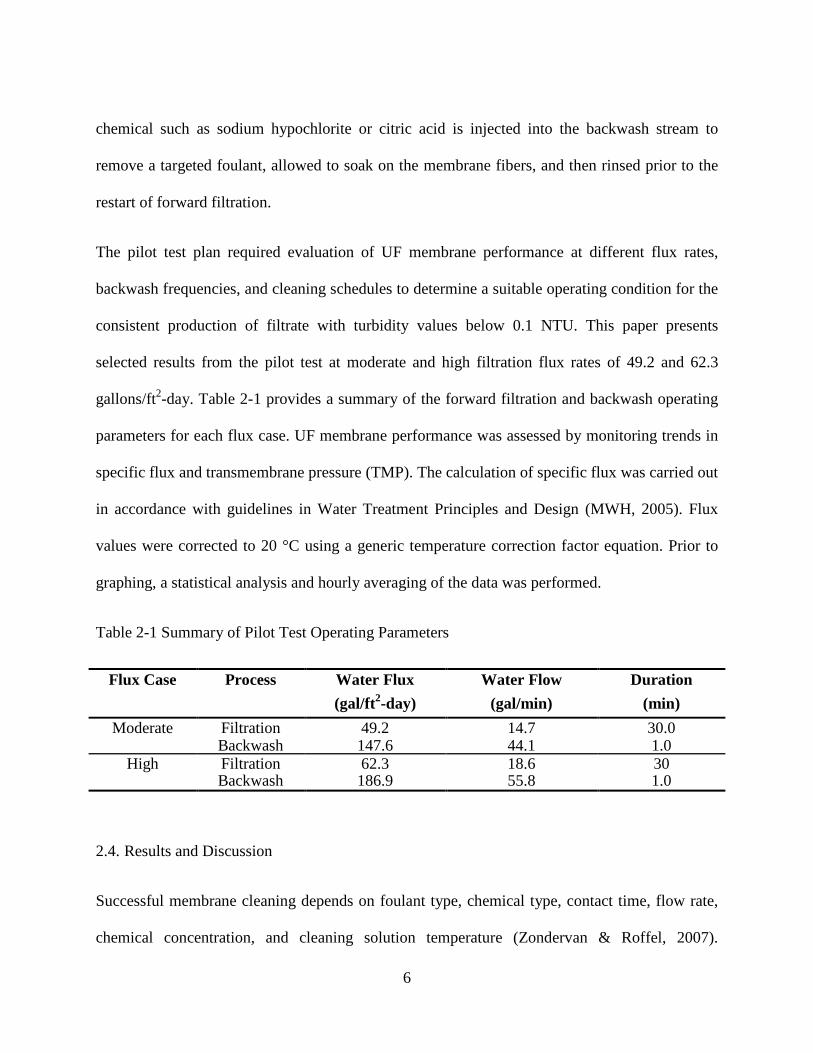
Table 2-1 Summary of Pilot Test Operating Parameters
Flux Case Process Water Flux Water Flow Duration (gal/ft2-day) (gal/min) (min)
Moderate Filtration 49.2 14.7 30.0 Backwash 147.6 44.1 1.0
High Filtration 62.3 18.6 30 Backwash 186.9 55.8 1.0
2.4. Results and Discussion
Successful membrane cleaning depends on foulant type, chemical type, contact time, flow rate,
chemical concentration, and cleaning solution temperature (Zondervan & Roffel, 2007).
6
Although common cleaning chemicals include citric acid, sodium hypochlorite, and sodium
hydroxide, the selection of cleaning agents is often a trial and error process (Strugholtz et al.,
2005). Pilot testing is highly recommended to identify cleaning requirements for UF processes
filtering surface waters. A significant amount of research has focused on understanding foulants
and fouling mechanisms on membrane surfaces; however, Porcelli & Judd (2010) concluded that
an understanding of chemical cleaning is not well developed and that there is significant room
for further research in this area. The research presented herein focuses on the assessment of
chemical protocols to maintain UF membrane performance.
Quantifying changes in water quality allows for the development of correlations between
membrane performance and potential foulants. A typical pilot scale water quality monitoring
plan includes the collection of pH, temperature, conductivity, total suspended solids (TSS), total
dissolved solids (TDS), turbidity, alkalinity, total organic carbon (TOC), and dissolved organic
carbon (DOC) data. For the treatment of settled surface water, as is the case at the Lake Manatee
WTP, seasonal variations in water quality should be taken into account for the development of
UF process operating protocols. Depending on the feed water quality being fed to the UF
membrane, modifications may need to be made to operational parameters such as the backwash
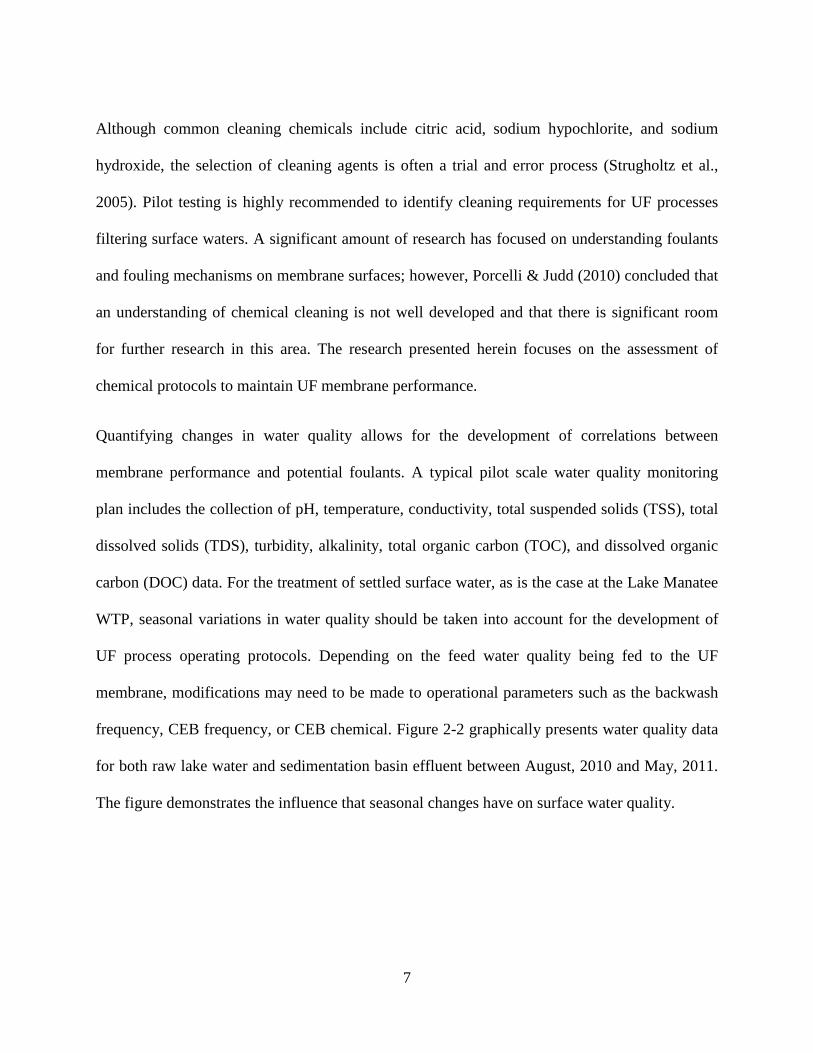
frequency, CEB frequency, or CEB chemical. Figure 2-2 graphically presents water quality data
for both raw lake water and sedimentation basin effluent between August, 2010 and May, 2011.
The figure demonstrates the influence that seasonal changes have on surface water quality.
7
Figure 2-2 Water Quality Data (August, 2010 – May, 2011)
Variations in surface water quality during pilot testing required changes in CEB protocols to
adapt to different fouling scenarios. Table 2-2 provides a summary of the CEB sequences used
between August, 2010 and May, 2011. This table illustrates the complexity of identifying viable
cleaning strategies for UF membranes in surface water applications. Sodium hypochlorite, citric
acid, and sodium hydroxide cleaning agents were tested during pilot operations. Citric acid was
found to be the most effective cleaning chemical from August through late September; whereas,
a combination of citric acid and sodium hydroxide CEBs proved successful at maintaining
membrane performance from November through May, 2011.
Figures 2-3 and 2-4 provide UF membrane performance and chemical maintenance data from
August, 2010 through January, 2011. The UF pilot was operated at a constant flux of 49.2 gal/ft2-
day during this period. Figure 2-3 presents the specific flux and TMP values recorded for the UF
8
pilot following a citric acid chemical cleaning-in-place (CIP) that was successful at removing a
calcium foulant. The calcium foulant, which had deposited on the membrane surface during the
first 80 days of UF pilot runtime, was most likely the result of lime addition in the sedimentation
basin post mix. Regular citric acid CEBs were implemented in August and September with a
target pH of < 3. The citric acid chemical maintenance protocol successfully maintained
membrane performance at an average specific flux of 28.2 gal/ft2-day-psi.
Table 2-2 Summary of UF Pilot Test CEB Chemical Use
Pilot Test Window Flux CEB Chemical(s) Effective Aug. – Sept., 2010 49.2 gal/ft2-day Citric Acid Yes
Oct., 2010 49.2 gal/ft2-day Citric Acid/Sodium Hypochlorite No Nov., 2010 – Jan., 2011 49.2 gal/ft2-day Citric Acid/Sodium Hydroxide Yes
Dec., 2010 49.2 gal/ft2-day Citric Acid No Feb. - May, 2011 62.3 gal/ft2-day Citric Acid/Sodium Hydroxide Yes
Mar., 2011 62.3 gal/ft2-day Sodium Hydroxide No
Stable operation was observed with citric acid CEBs until the latter part of September, when
citric acid alone proved insufficient to clean the UF membrane fibers. A combination of citric
acid and sodium hypochlorite CEBs was attempted in October with a target sodium hypochlorite
residual of 100 mg/L. However, membrane performance did not recover appreciably. Figure 2-3
depicts the decline in UF membrane performance observed in late September and October.
During this period, the TMP increased to approximately 3.35 psi with a corresponding decrease
in specific flux to 12.6 gal/ft2-day-psi.
9

Figure 2-3 UF Pilot Performance Chart (August – October, 2010)
Figure 2-4 UF Pilot Performance Chart (November, 2010 – January, 2011)
10
In early November, the sodium hypochlorite cleaning solution was phased out in favor of sodium
hydroxide to provide a high pH cleaning environment during chemically enhanced backwash
cycles. The sodium hydroxide CEB step improved pilot performance as evidenced by the
stabilization of specific flux trends in January. Figure 2-4 presents the performance chart for the
UF pilot between November, 2010 and January, 2011. Average hourly TMP values ranged
between approximately 1.39 and 3.99 psi with an average specific flux of 21.4 gal/ft2-day-psi. A
CEB interval of once per two days was tested initially, but declines in specific flux prompted a
change to a once per day citric acid and sodium hydroxide CEB sequence. The target pH for
sodium hydroxide CEBs was 11. A citric acid only CEB sequence was tested briefly in
December but proved ineffective a restoring membrane performance.
The high flux phase of the pilot test began in late January of 2011 at 62.3 gal/ft2-day. Increased
fouling rates were anticipated at the higher operating flux, so the once per day CEB maintenance
protocol was continued from the previous testing scenario. Figure 2-5 presents the 81 days of
runtime recorded for the high flux case. For the majority of testing, the UF membrane was
successfully maintained with a citric acid and sodium hydroxide CEB sequence at an average
specific flux of 19.7 gal/ft2-day-psi. However, in the middle of March, a once per day sodium
hydroxide CEB sequence was attempted to identify the contribution of sodium hydroxide to
membrane cleaning. The sodium hydroxide CEB sequence failed to maintain pilot performance
alone, and the citric acid and sodium hydroxide CEB sequence was resumed.
11
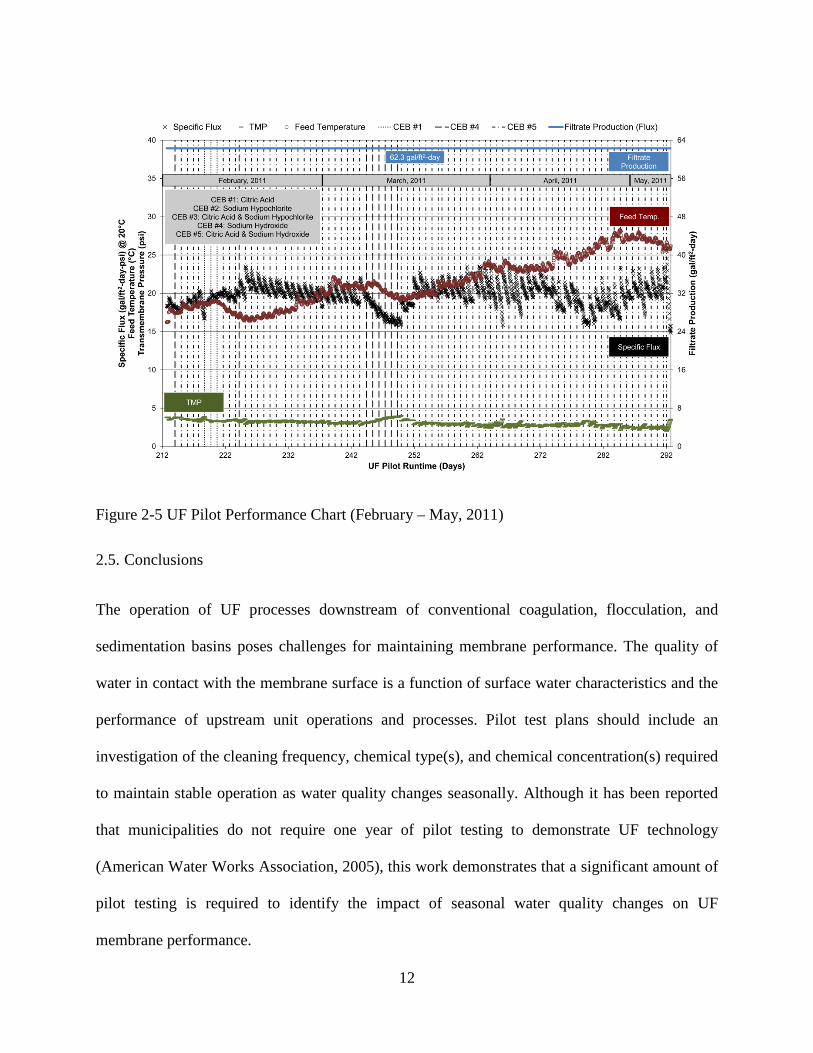
Figure 2-5 UF Pilot Performance Chart (February – May, 2011)
2.5. Conclusions
The operation of UF processes downstream of conventional coagulation, flocculation, and
sedimentation basins poses challenges for maintaining membrane performance. The quality of
water in contact with the membrane surface is a function of surface water characteristics and the
performance of upstream unit operations and processes. Pilot test plans should include an
investigation of the cleaning frequency, chemical type(s), and chemical concentration(s) required
to maintain stable operation as water quality changes seasonally. Although it has been reported
that municipalities do not require one year of pilot testing to demonstrate UF technology
(American Water Works Association, 2005), this work demonstrates that a significant amount of
pilot testing is required to identify the impact of seasonal water quality changes on UF
membrane performance.
12

In order to optimize UF process performance, cleaning protocols should be adaptable to
changing water quality conditions. The CEB chemical or chemical combination that provides
effective cleaning in the summer may be ineffective in the fall months. Customizing cleaning
protocols for different water quality conditions may limit the unnecessary use of chemicals and
improve UF process performance. Sodium hypochlorite, citric acid, and sodium hydroxide CEBs
were used during pilot testing at the Lake Manatee WTP to varying degrees of success. Citric
acid, with a target pH of < 3, was found to be effective in August and September; whereas, a
combination of citric acid and sodium hydroxide CEBs successfully maintained performance
between November, 2010 and May, 2011.
2.6. Acknowledgments
The research reported herein was funded by UCF project agreement number 16208085. A special
thank you is offered to the Manatee County Utilities Department (Bradenton, FL), who served as
hosts for our testing site. This project would not have been possible without the help of Manatee
County Utilities staff, namely Bruce MacLeod, Mark Simpson, Bill Kuederle, Katherine
Gilmore, and others. Thanks are offered to Harn R/O Systems, Inc. (Venice, FL) for construction
and maintenance of the UF pilot skid. The support provided by Julie Harn, James Harn, and
Jonathan Harn of Harn R/O Systems, Inc. was truly outstanding. The assistance and efforts of
UCF graduate students Jayapregasham Tharamapalan, Vito Trupiano, Andrea Cumming, and
Yuming Fang are also appreciated.
13

2.7. References
American Water Works Association. (2005). Microfiltration and ultrafiltration membranes for
drinking water Manual of water supply practices M53 (1st ed.). Denver, CO: American Water
Works Association.
American Water Works Association Research Foundation, Lyonnaise des Eaux, & Water
Research Commission of South Africa. (1996). Water treatment membrane processes. J.
Mallevialle, P.E. Odendall, & M.R. Wiesner (Eds.). New York, NY: McGraw-Hill.
Duranceau, S.J. & Taylor, J.S. (2011). Membranes. In J. K. Edzwald (Ed.), Water quality &
treatment: A handbook on drinking water (6th ed.). New York, NY: McGraw-Hill.
Manatee County Utilities Department. (2009). 2009 Drinking Water Quality Summary. Manatee
County, FL.
MWH. (2005). Water treatment: Principles and design (2nd ed.). In J.C. Crittenden, R.R.
Trussell, D.W. Hand, K.J. Howe, G. Tchobanoglous (Eds.). Hoboken, NJ: John Wiley & Sons.
Porcelli, N., & Judd, S. (2010). Chemical cleaning of potable water membranes: A review.
Separation and Purification Technology, 71, 137–143.
Strugholtz, S., Panglisch, S.S., Lerch, A., Brugger, A. & Gimbel, R. (2005). Evaluation of the
performance of different chemicals for cleaning capillary membranes. Desalination, 179, 191–
202.
Zondervan, E. & Roffel, B. (2007). Evaluation of different cleaning agents used for cleaning
ultra filtration membranes fouled by surface water. Journal of Membrane Science, 304, 40–49.
14

CHAPTER 3. MEMBRANE FILTRATION PROCESS FOULING EVALUATION USING A NOVEL TRANSMEMBRANE PRESSURE (TMP)
BALANCE APPROACH
3.1. Abstract
The successful operation of membrane processes is dependent on the ability to quantitatively
assess process performance on a continuous basis, because membrane fouling reduces process
efficiency and results in increased operation and maintenance costs. A review of current methods
for performance monitoring revealed limitations with the use of specific flux, transmembrane
pressure (TMP) and other normalization techniques on ultrafiltration (UF) membrane processes.
A new and alternative benchmark, termed the TMP balance, is presented to supplement existing
membrane fouling evaluation approaches. The TMP balance defines process performance in
terms of TMP changes relative to a reference condition in order to easily identify pressure
variations associated with membrane fouling and morphology changes. TMP balance values may
be used to distinguish between physically and chemically unresolvable resistance developments,
assess operating pressure requirements, and compare process performance at different constant
flux set-points. A demonstration of the TMP balance approach is provided using over 9000 hours
of runtime data from two surface water UF pilots, and a comparison is made between the TMP
balance and current fouling assessment methods.
Key Words: Balance, Fouling, Membrane, Performance, TMP
15
3.2. Introduction
Ultrafiltration (UF) membrane processes are separation processes that provide a physical barrier
to aqueous particles (Unites States Environmental Protection Agency, 2005) and typically
operate over a low pressure range of less than 1.03 bar (15 psi) (MWH, 2005). Membrane
separation processes have a broad range of industrial and municipal applications including the
filtration of water for potable use (Buckley & Hurt, 1996). A common role of UF membranes in
water treatment is the filtration of surface water. Surface water sources contain a variety of
contaminants harmful to human health, and membrane filtration may be incorporated into a
multiple-barrier treatment approach to improve drinking water quality (Shannon et al., 2008).
Fouling is one of the major operating challenges for membrane processes, and the management
of fouling is critical for maintaining sustainable water production. One important facet of fouling
management is the monitoring of process performance. An investigation of the commonly used
performance monitoring methods revealed limitations with the use of specific flux and other
normalization techniques on low pressure membrane processes. Accordingly, there is a need for
a new method to evaluate membrane performance. This paper reports on the development of the
TMP balance approach, which defines process performance in terms of changes in TMP relative
to a reference condition.
3.3. Background
3.3.1. Operational Considerations for Membrane Filtration Processes
UF membranes may be operated using a constant pressure or constant flux approach in either a
cross-flow or direct flow regime. During constant pressure operation, membrane fouling results
16
in flux decline; whereas, in constant flux processes, fouling manifests as increased operating
pressure. The cross-flow mode of filtration involves the recycle of a percentage of the total feed
flow, which creates shear forces along the fiber surface and reduces fouling (Wiesner &
Chellam, 1992). Direct filtration is more commonly used, because the total feed flow is filtered
through the membrane thereby increasing the efficiency of the process. For full-scale water
treatment, constant flux operation with a direct flow regime is a common operating approach
(Lee et al., 2008).
Fouling, whether organic, inorganic, colloidal, particulate, or biological, limits the operating
efficiency of membrane filtration processes. Extensive research has been conducted on
membrane fouling to elucidate the mechanisms by which fouling occurs (Lee et al., 2004; Kwon
et al., 2005; Peiris et al., 2010; Gao et al., 2011), and the ability to manage membrane fouling
determines the applicability of membrane filtration processes to specific water sources. Common
approaches to fouling management include the incorporation of pretreatment processes and
selection of operating set-points. Coagulation, pre-oxidation, adsorption, and ion exchange are
possible pretreatment choices depending on the source water quality (Huang et al., 2009). The
selection of operating flux and backwash frequency also play an important role in the fouling
rates of polymeric membranes (Chen et al., 2003; Kim & DiGiano, 2006; Bacchin et al., 2006;
Mosqueda-Jimenez et al., 2008). Regardless of the fouling management techniques employed,
membrane fouling ultimately develops during the filtration of natural waters, and such fouling
requires chemical removal (Yuan & Zydney, 2000; Katsoufidou et al., 2008). The chemical
maintenance of membrane processes is conducted with either chemically enhanced backwashes
(CEBs) or clean-in-place (CIP) procedures, and foulant removal is dependent on foulant type,
17
chemical selection, contact time, concentration, flow rate, and temperature (Strugholtz et al.,
2005; Zondervan & Roffel, 2007; Porcelli & Judd, 2010). Cleaning chemicals may be
categorized as either caustic, oxidant, acid, chelating, or surfactant type agents (Liu et al., 2006).
3.3.2. Common Approaches to Assessing Membrane Performance
In UF processes, a pressure (P) gradient develops across the porous membrane barrier during
filtration. This pressure gradient, referred to as the transmembrane pressure (TMP), may be
calculated by Equations 3-1 or 3-2 for direct or cross-flow operation, respectively. TMP values
are influenced by the membrane material, fouling development, and water temperature. A
temperature correction factor (TCF) may be utilized to account for the effects of water viscosity
by normalizing to a standard temperature. For low pressure membrane filtration processes, the
standard temperature is typically 20 °C. Manufacturers often develop membrane specific TCFs
that account for both the influence of temperature on water viscosity and the membrane material
(Duranceau & Taylor, 2011).
𝑇𝑀𝑃 = 𝑃𝑓𝑒𝑒𝑑 − 𝑃𝑓𝑖𝑙𝑡𝑟𝑎𝑡𝑒 ( 3-1 )
𝑇𝑀𝑃 = 𝑃𝑓𝑒𝑒𝑑+𝑃𝑟𝑒𝑡𝑒𝑛𝑡𝑎𝑡𝑒2
− 𝑃𝑓𝑖𝑙𝑡𝑟𝑎𝑡𝑒 ( 3-2 )
Where,
Pfeed is the UF feed pressure, bar (psi)
Pfiltrate is the UF filtrate pressure, bar (psi)
Pretentate is the UF retentate pressure, bar (psi)
18
In constant flux operation, the process response to increased flow resistance is an increase in the
TMP. Laboratory experiments often use TMP to investigate phenomena under controlled
conditions at constant temperature (Liu et al., 2011; Zhang et al., 2012), and pilot scale
investigations have employed TMP to evaluate process performance (Panglisch et al., 1998;
Halpern et al., 2005; Neubrand et al., 2010). TMP values may also be temperature corrected to
account for temperature variations in natural waters (United States Environmental Protection
Agency, 2005; Oriol et al., 2012). In the absence of a membrane specific TCF, generic TCFs
may be employed. Equation 3-3 utilizes a ratio of absolute viscosity values to calculate the
temperature corrected TMP (TCTMP).
𝑇𝐶𝑇𝑀𝑃20°𝐶 = 𝑇𝑀𝑃𝑇(𝑇𝐶𝐹) = 𝑇𝑀𝑃𝑇 �𝜇20°𝐶𝜇𝑇
� ( 3-3 )
Where,
TCTMP20°C is the TMP temperature corrected to 20°C, bar (psi)
TMPT is the TMP at temperature T, bar (psi)
µ20°C is the absolute viscosity at 20°C, cp (lb/ft-s)
µT is the absolute viscosity at temperature T, cp (lb/ft-s)
Membrane performance during constant pressure operation may be assessed by monitoring
trends in the volumetric flux. Equation 3-4, which is a modified form of Darcy’s law, calculates
the clean water volumetric flux for a new membrane (American Water Works Association,
2005). Further modification to the flux equation may be made to incorporate the resistance
contributions of membrane fouling mechanisms using the resistance-in-series model. A variety
19
of membrane related research utilizes the resistance-in-series approach to quantify membrane
performance, such as membrane fouling and chemical cleaning studies (Cho et al., 2000;
Zondervan & Roffel, 2007; Kimura et al., 2008). Equation 3-5 includes resistance terms for pore
adsorption (Ra), pore blocking (Rb) and cake formation (Rc). Flux values may also be corrected
to a set of standard conditions (Howe & Clark, 2002; ASTM International, 2005) using Equation
3-6.
𝐽𝑇 = 𝑄𝐴
= 𝑇𝑀𝑃𝑇𝜇(𝑅𝑀)
( 3-4 )
𝐽𝑇 = 𝑄𝐴
= 𝑇𝑀𝑃𝑇𝜇(𝑅𝑀+𝑅𝑎+𝑅𝑏+𝑅𝑐)
( 3-5 )
𝐽20°𝐶 = (TMP20°𝐶)(TCF)(TMP𝑇) (𝐽𝑇) ( 3-6 )
Where,
J is the volumetric flux, L/m2-hr (gal/ft2-day)
A is the membrane surface area, m2 (ft2)
RM is the intrinsic membrane resistance, m-1 (ft-1)
Ra is the pore adsorption resistance, m-1 (ft-1)
Rb is the pore blocking resistance, m-1 (ft-1)
Rc is the cake formation resistance, m-1 (ft-1)
J20°C is the volumetric flux at standard temperature and pressure, L/m2-hr (gal/ft2-day)
JT is the volumetric flux at temperature T, L/m2-hr (gal/ft2-day)
20
TMP20°C is the transmembrane pressure at the standard condition, bar (psi)
The specific flux (JSP), or membrane permeability, normalizes the flux for temperature and
pressure as shown in Equation 3-7. Pilot-scale investigations typically utilize the specific flux to
identify fouling associated with the treatment of natural waters (Crozes et al., 1997; Panglisch et
al., 1997; Chellam et al., 1998), and calculation of the specific flux is commonly used for full-
scale process performance assessments (American Water Works Association, 2005; MWH,
2005).
𝐽𝑆𝑃 = (𝐽𝑇)(𝑇𝐶𝐹)𝑇𝑀𝑃
( 3-7 )
Where,
JSP = the specific flux, L/m2-hr-bar (gal/ft2-day-psi)
3.3.3. Limitations of Specific Flux and TMP
There are limitations with the use of specific flux and TMP for characterizing the performance of
low pressure UF processes. Figure 3-1 presents the relationship between specific flux and TMP
between 0.070 and 1.03 bar (1.00 and 15.0 psi), which is the typical operating TMP range for
membrane filters (MWH, 2005). Specific flux values decrease exponentially with increasing
TMP over this pressure range, and the non-linearity of the specific flux term means that small
changes in TMP result in disproportionate changes to the specific flux. As a result, the specific
flux exaggerates the extent of membrane fouling for low pressure processes.
A variety of operating decisions are based on TMP. For example, TMP is often used to select
backwash and cleaning intervals for fouling management, and TCTMP may be used to evaluate
21
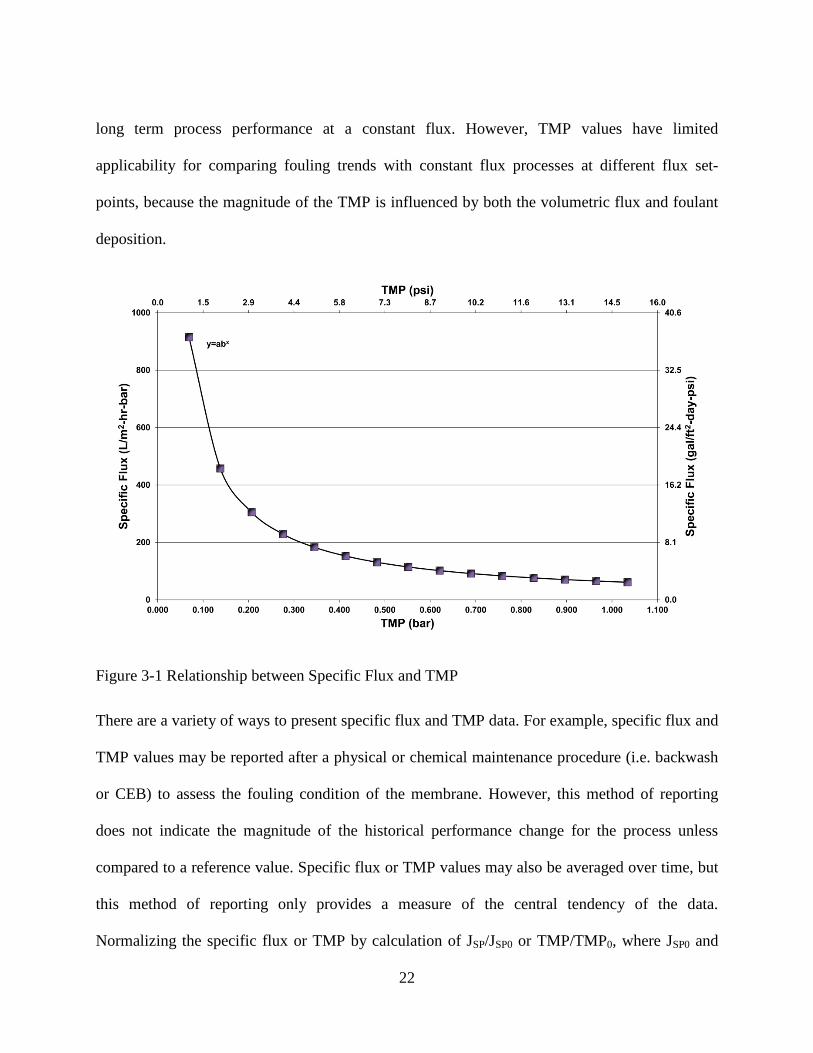
long term process performance at a constant flux. However, TMP values have limited
applicability for comparing fouling trends with constant flux processes at different flux set-
points, because the magnitude of the TMP is influenced by both the volumetric flux and foulant
deposition.
Figure 3-1 Relationship between Specific Flux and TMP
There are a variety of ways to present specific flux and TMP data. For example, specific flux and
TMP values may be reported after a physical or chemical maintenance procedure (i.e. backwash
or CEB) to assess the fouling condition of the membrane. However, this method of reporting
does not indicate the magnitude of the historical performance change for the process unless
compared to a reference value. Specific flux or TMP values may also be averaged over time, but
this method of reporting only provides a measure of the central tendency of the data.
Normalizing the specific flux or TMP by calculation of JSP/JSP0 or TMP/TMP0, where JSP0 and
22
TMP0 are reference values, exaggerates the extent of membrane fouling. This observation is
evidenced by a comparison between these ratios at low and high TMP values. For example, a
TMP increase from 0.070 to 0.345 bar (1.00 to 5.00 psi) represents a 400% change in the
TMP/TMP0 ratio at a reference pressure of 0.070 bar (1.00 psi). However, a 0.345 bar (5.00 psi)
increase from 5.52 to 5.86 bar (80.0 to 85.0) psi represents a 6.25% change in TMP/TMP0 at a
reference pressure of 5.52 bar (80.0 psi). Accordingly, it is apparent that the utility of existing
evaluation techniques would be enhanced by the introduction of a new benchmark for assessing
membrane performance.
3.4. Materials and Methods
3.4.1. Pilot Test Plan
Pilot-scale UF tests were conducted at two surface water treatment plants (WTPs) in the United
States to assess the treatability of settled surface water using hollow-fiber UF membranes. At
each facility, a pilot unit was placed downstream of full-scale coagulation-flocculation-
sedimentation pretreatment basins. One of the primary goals of the testing was to assess the
impacts of changing water quality conditions on membrane filtration performance. Different flux
values and chemical maintenance protocols were evaluated to identify sustainable operating
configurations.
3.4.2. Test Locations
3.4.2.1. Lake Manatee WTP
The Lake Manatee WTP in Manatee County, Florida, which is operated by the Manatee County
Utilities Department, was selected as the first pilot testing site. The facility practices alum
23

coagulation for the removal of organics from the Lake Manatee Reservoir. An organic polymer
is added during flocculation to promote the formation of a settleable floc, and the settled water is
pH adjusted with lime as needed. Additionally, a maintenance dose of chlorine is added in the
post-mix to limit algae growth on the basin walls. During seasonal taste and odor events,
powdered activated carbon is added to the raw water prior to coagulation.
3.4.2.2. Mission San Jose WTP
The second pilot unit was located at the Alameda County Water District’s (ACWD’s) Mission
San Jose WTP in Fremont, California. The Sacramento Delta serves as the primary feed water
source for the Mission San Jose WTP, and water from nearby Lake Del Valle is periodically
blended on an as needed basis. The facility practices ferric chloride coagulation using up-flow
solids contact clarifiers. Raw water is pre-chloraminated prior to ferric chloride injection.
3.4.3. Membrane Description
Pilot testing was conducted with Durasep UPF0860 inside-out hollow fiber UF membranes
manufactured by Toyobo CO., Ltd. The hydrophilic Durasep membranes are composed of
polyvinylpyrrolidone–modified polyethersulfone (PES) with an active surface area of 40 m2 (430
ft2). The membrane fibers have an outside fiber diameter of 1.3 mm (0.051 in) and an inside fiber
diameter of 0.8 mm (0.031 in) with an average pore diameter of 0.01 µm (3.94x10⁻⁷ in)
providing an approximate 150,000 dalton cutoff.
3.4.4. UF Pilot Units
The Manatee County and ACWD UF pilot units were automated and each incorporated one
membrane module. Feed and filtrate turbidity meters, pressure transmitters, and flow meters
24
were installed to record process data on both pilots. Feed and backwash pumps equipped with
variable frequency drives supplied water to the units, and pneumatic valves controlled the
direction of flow. Two chemical feed systems, consisting of separate chemical tanks and pumps,
were installed on each pilot for chemical maintenance procedures.
3.4.5. UF Pilot Operations
The pilot units were operated as constant flux processes in a direct filtration mode. In accordance
with pilot test plans prepared for each location, the units cycled between filtration, backwash,
and CEB events. Filtrate was collected in a tank to provide water for backwashes and CEBs.
During backwashes, filtrate was first pumped out the bottom and then out the top of the module
at a flux equal to three times the filtration flux. The CEB process involved an injection of
chemical during a backwash, followed by a 10 minute soak, and concluding with a rinse. The
CEB chemicals evaluated during testing included sodium hypochlorite, sodium hydroxide, and
citric acid. In the event of a CIP, additional equipment was brought in to allow for the
recirculation of cleaning chemicals.
3.4.6. Method of Data Compilation
The UF pilot units recorded operating data at 2 minute intervals. For the purposes of the
performance evaluations, pressure, temperature, and flow data were compiled and assigned
runtime values. Data points beyond +/- 3 standard deviations from adjacent points were filtered
out of the data set to account for measurements taken during transition periods. Transition
periods were defined as the intervals of time between filtration, backwash, or CEB events when
25
data was logged prior to flux stabilization. The filtered data sets were then used for subsequent
calculations.
3.5. Results and Discussion
3.5.1. Development of the TMP Balance Equation
During the normal operation of membrane filtration processes, the resistance to flow is dynamic
with respect to time, and the total resistance is determined by both the physical membrane
material and the accumulation of foulants at the liquid-membrane interface. Since the TMP is a
function of the total resistance, the condition of the membrane filters may be described by
changes in the TCTMP. Based on this principle, a new approach, termed the TMP balance, was
developed that utilizes TCTMP variations to quantify membrane fouling and structural changes
related to filtration events, backwashes, CEBs, CIPs, and flux changes.
In order to assign meaning to the TMP balance, presented as Equation 3-8, it is necessary to
correlate TMP balance values with the operating history of the process. Accordingly, the factors
that influence the TMP balance are organized into operating sequences (J), cycles (K), and
periods (L), as illustrated in Figure 3-2. An operating sequence consists of consecutive filtration
and backwash events; whereas, an operating cycle is comprised of a series of sequences
culminating in a CEB. Operating periods conclude with a CIP event and generally consist of
many operating cycles. Further classification of TMP balance data may be made according to the
flux case (M) if the flux set-point is changed during operation. This nomenclature allows for
TMP balance values to be chronologically organized according to process events. For example,
26
TMP balance2,1,1,1,1 represents the TMP balance subsequent to two TMP measurements during
the first sequence, cycle, period, and flux case of operation.
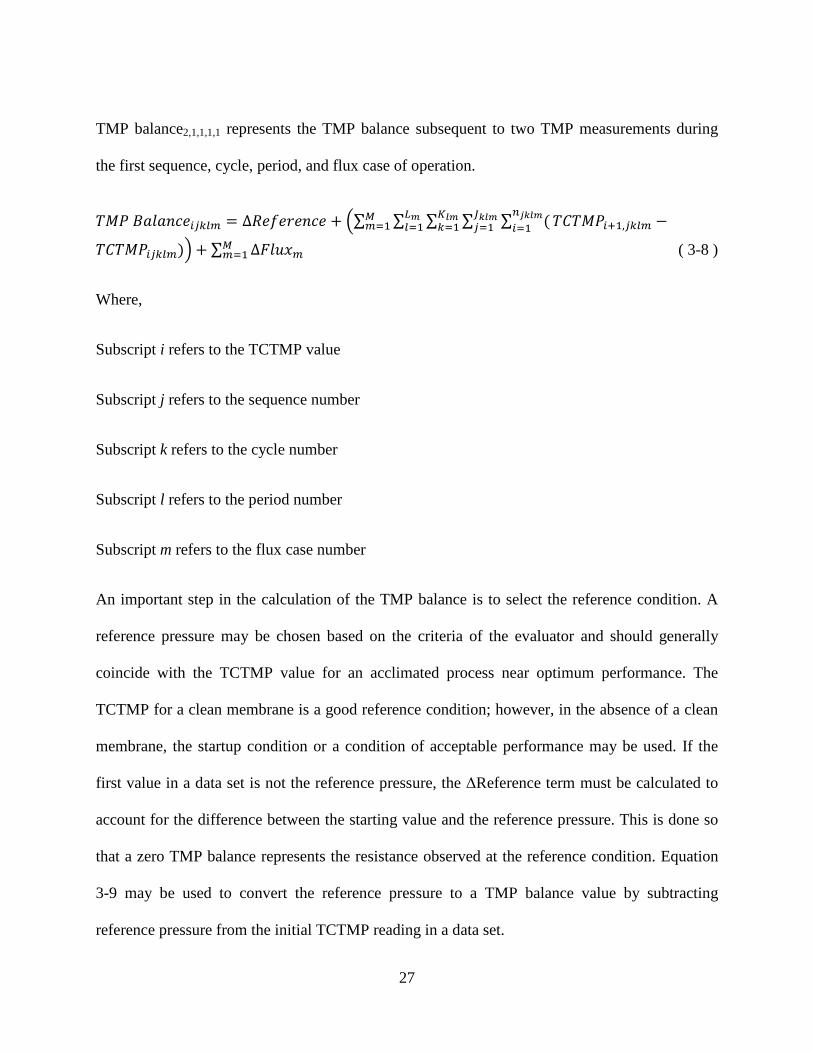
𝑇𝑀𝑃 𝐵𝑎𝑙𝑎𝑛𝑐𝑒𝑖𝑗𝑘𝑙𝑚 = ∆𝑅𝑒𝑓𝑒𝑟𝑒𝑛𝑐𝑒 + �∑ ∑ ∑ ∑ ∑ (𝑛𝑗𝑘𝑙𝑚𝑖=1 𝑇𝐶𝑇𝑀𝑃𝑖+1,𝑗𝑘𝑙𝑚 −𝐽𝑘𝑙𝑚
𝑗=1𝐾𝑙𝑚𝑘=1
𝐿𝑚𝑙=1
𝑀𝑚=1
𝑇𝐶𝑇𝑀𝑃𝑖𝑗𝑘𝑙𝑚)�+ ∑ ∆𝐹𝑙𝑢𝑥𝑚𝑀𝑚=1 ( 3-8 )
Where,
Subscript i refers to the TCTMP value
Subscript j refers to the sequence number
Subscript k refers to the cycle number
Subscript l refers to the period number
Subscript m refers to the flux case number
An important step in the calculation of the TMP balance is to select the reference condition. A
reference pressure may be chosen based on the criteria of the evaluator and should generally
coincide with the TCTMP value for an acclimated process near optimum performance. The
TCTMP for a clean membrane is a good reference condition; however, in the absence of a clean
membrane, the startup condition or a condition of acceptable performance may be used. If the
first value in a data set is not the reference pressure, the ΔReference term must be calculated to
account for the difference between the starting value and the reference pressure. This is done so
that a zero TMP balance represents the resistance observed at the reference condition. Equation
3-9 may be used to convert the reference pressure to a TMP balance value by subtracting
reference pressure from the initial TCTMP reading in a data set.
27
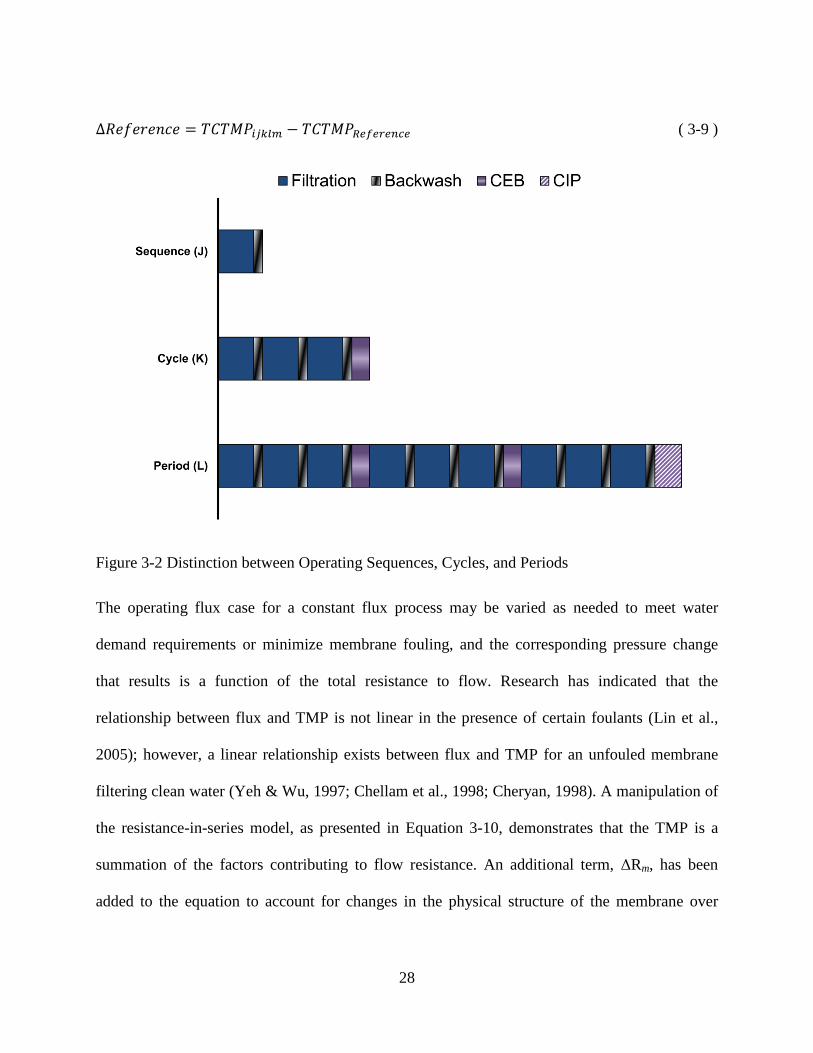
∆𝑅𝑒𝑓𝑒𝑟𝑒𝑛𝑐𝑒 = 𝑇𝐶𝑇𝑀𝑃𝑖𝑗𝑘𝑙𝑚 − 𝑇𝐶𝑇𝑀𝑃𝑅𝑒𝑓𝑒𝑟𝑒𝑛𝑐𝑒 ( 3-9 )
Figure 3-2 Distinction between Operating Sequences, Cycles, and Periods
The operating flux case for a constant flux process may be varied as needed to meet water
demand requirements or minimize membrane fouling, and the corresponding pressure change
that results is a function of the total resistance to flow. Research has indicated that the
relationship between flux and TMP is not linear in the presence of certain foulants (Lin et al.,
2005); however, a linear relationship exists between flux and TMP for an unfouled membrane
filtering clean water (Yeh & Wu, 1997; Chellam et al., 1998; Cheryan, 1998). A manipulation of
the resistance-in-series model, as presented in Equation 3-10, demonstrates that the TMP is a
summation of the factors contributing to flow resistance. An additional term, ΔRm, has been
added to the equation to account for changes in the physical structure of the membrane over
28
time. Physical changes to the membrane have been shown to result from chemical cleaning (Gitis
et al., 2006; Arkhangelsky et al., 2007).
𝑇𝑀𝑃 = 𝐽𝜇(𝑅𝑀) + 𝐽𝜇(𝑅𝑎) + 𝐽𝜇(𝑅𝑏) + 𝐽𝜇(𝑅𝑐) + 𝐽𝜇(∆𝑅𝑀) ( 3-10 )
Where,
∆RM is the change in the intrinsic membrane resistance, m-1 (ft-1)
Since the purpose of the TMP balance is to determine the pressure contribution of membrane
fouling and structural deterioration, it is necessary to exclude the TMP change associated with
the hydraulic resistance of the unaltered membrane material. This is accomplished by calculation
of the ΔFlux term, as presented in Equation 3-11, where the slope term is that of a line describing
the relationship between flux and TMP. The incorporation of the ΔFlux term, which should be
calculated for each individual membrane process, allows for the process performance to be
compared at different operating flux values. For full-scale processes, practical limitations often
preclude the possibility of establishing the flux-TMP relationship for new membranes with clean
water, and an approximation may be made during start-up or following a membrane cleaning.
∆𝐹𝑙𝑢𝑥𝑀 = 𝑠𝑙𝑜𝑝𝑒(𝐹𝑙𝑢𝑥𝑚 − 𝐹𝑙𝑢𝑥𝑚+1) ( 3-11 )
3.5.2. Example TMP Balance Calculation
An example TMP balance calculation is presented in Equations 3-12 and 3-13 for a new constant
flux membrane filtration process, where TCTMP1,1,1,1,1 = 0.100 bar (1.45 psi), TCTMP2,1,1,1,1 =
0.107 bar (1.55 psi), and TCTMP1,2,1,1,1 = 0.103 bar (1.50 psi). For the purposes of the example,
TCTMP1,1,1,1,1 has been selected as the reference pressure. Accordingly, the ΔReference term
calculated using Equation 3-9 is equal to zero. The ΔFlux term, defined in Equation 3-11, is also
29
equal to zero, because a change in the operating flux set-point has not been made. Thus, the TMP
balance at the start of the second sequence (i.e. after one backwash) is + 0.003 bar (+0.05 psi).
𝑇𝑀𝑃 𝐵𝑎𝑙𝑎𝑛𝑐𝑒1,2,1,1,1 = ∆𝑅𝑒𝑓𝑒𝑟𝑒𝑛𝑐𝑒 + �∑ ∑ ∑ ∑ ∑ ��𝑇𝐶𝑇𝑀𝑃2,1,1,1,1 −22,1,1,1𝑖=1
21,1,1𝑗=1
11,1𝑘=1
11𝑙=1
1𝑚=1
𝑇𝐶𝑇𝑀𝑃1,1,1,1,1� + �𝑇𝐶𝑇𝑀𝑃1,2,1,1,1 − 𝑇𝐶𝑇𝑀𝑃2,1,1,1,1���+ ∑ ∆𝐹𝑙𝑢𝑥11𝑚=1 ( 3-12 )
∴ 𝑇𝑀𝑃 𝐵𝑎𝑙𝑎𝑛𝑐𝑒1,2,1,1,1 = 0 + [(0.107 − 0.100) + (0.103 − 0.107)] + 0 =+0.003 𝑏𝑎𝑟 (+0.05 𝑝𝑠𝑖) ( 3-13 )
3.5.3. Interpreting the TMP Balance
TMP balance values are either greater than, equal to, or less than zero, because the TMP balance
reflects the change in resistance relative to the reference condition. The magnitude of the TMP
balance quantifies the resistance change in units of pressure, and the sign denotes position
relative to a zero TMP balance. TMP balance values greater than zero indicate an increase in the
resistance to flow relative to the reference pressure; whereas, TMP balance values of less than
zero indicate decreased resistance to flow. Negative values may occur if the selected reference
condition does not represent a clean membrane. A summary of TMP balance interpretations is
provided in Table 3-1.
Table 3-1 Interpretation of TMP Balance Values
TMP Balance Interpretation > 0 Increased flow resistance relative to the reference pressure 0 No change in flow resistance relative to the reference pressure
< 0 Decreased flow resistance relative to the reference pressure
30
3.5.4. Monitoring Performance Using the TMP Balance Method
Monitoring membrane performance is critical for the successful design and operation of
membrane filtration processes. For example, capital construction costs are determined in part by
the selection of a sustainable operating flux, because the design flux influences membrane
surface area and pump sizing requirements. Operating decisions, such as the frequency of
backwashes and chemical maintenance procedures, are dictated by the fouling condition of the
membranes. These decisions, in turn, influence operating costs relative to the consumption of
energy, backwash water, and cleaning chemicals. The TMP balance provides a tool for
quantifying and easily interpreting process performance to aid in the design and operation of
membrane filters. Performance monitoring should involve quantification of the four items
defined in Table 3-2 and graphically illustrated in Figure 3-3.
Reporting the operating, post-backwash, post-CEB, and post-CIP TMP balance values isolates
the pressure contributions associated with membrane fouling and morphology changes.
Operating TMP balance values are recorded during filtration and quantify the pressures required
to maintain constant flux production. Accordingly, the operating TMP balance may be used to
select an appropriate backwash frequency for the process. After successive filtration events,
resistance develops on the membrane surface that is not removed by routine backwashing
(Yamamura et al., 2007). The post-backwash TMP balance quantifies the pressure contribution
associated with physically unresolved resistance changes and indicates the need for chemical
maintenance. CEB or CIP procedures are used to chemically clean membranes and may be
assessed using post-CEB and post-CIP TMP balance values. Monitoring the post-CEB or post-
31
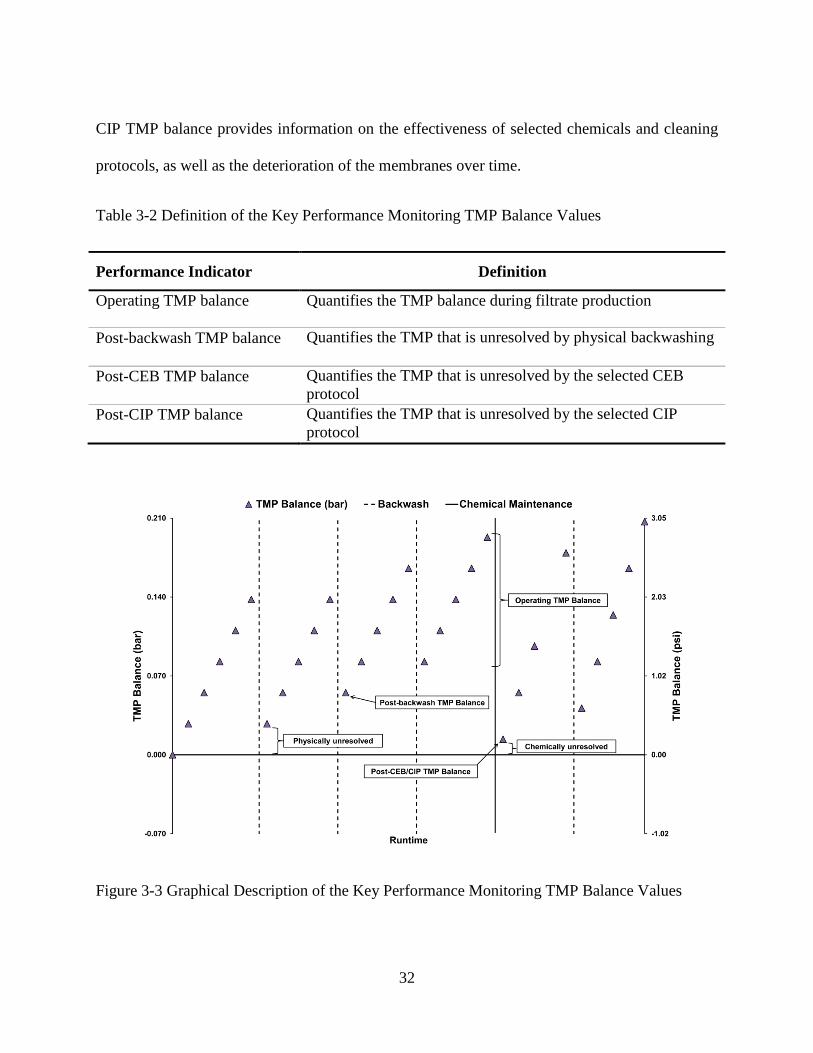
CIP TMP balance provides information on the effectiveness of selected chemicals and cleaning
protocols, as well as the deterioration of the membranes over time.
Table 3-2 Definition of the Key Performance Monitoring TMP Balance Values
Performance Indicator Definition
Operating TMP balance Quantifies the TMP balance during filtrate production
Post-backwash TMP balance Quantifies the TMP that is unresolved by physical backwashing
Post-CEB TMP balance Quantifies the TMP that is unresolved by the selected CEB protocol
Post-CIP TMP balance Quantifies the TMP that is unresolved by the selected CIP protocol
Figure 3-3 Graphical Description of the Key Performance Monitoring TMP Balance Values
32
3.5.5. Pilot-Scale Application of the TMP Balance Method
Data from the Mission San Jose and Lake Manatee WTP UF pilot tests have been compiled and
analyzed to demonstrate the usefulness of the TMP balance approach in assessing the
performance of membrane filtration processes. Collectively, more than 9,000 hours of runtime
data have been selected to assess the operating, post-backwash, post-CEB, and post-CIP TMP
balance levels observed during testing. The results of the analyses are discussed along with
comparisons to specific flux and TCTMP performance monitoring methods. Prior to the TMP
balance analysis, an experiment was performed to calculate the ΔFlux term for the Durasep
UPF0860 membrane over a flux range of 34.0 to 119 L/m2-hr (20.0 to 70.0 gal/ft2-day). The test
was conducted following a chemical cleaning during a period of minimal membrane fouling
development. Using linear regression, the slope of a line describing TMP versus flux was found
to be 0.042 with an R2 of 0.99 using 11 data points. This slope was utilized in Equation 3-11 to
calculate the ΔFlux term for the UF pilots.
3.5.5.1. Mission San Jose WTP UF Pilot
The UF pilot located at the Mission San Jose WTP operated for approximately 2200 hours with
the 40 m2 (430 ft2) Durasep UPF0860 membrane. An initial flux of 68.6 L/m2-hr (40.5 gal/ft2-
day) was selected to gather preliminary data and then increased to 83.0 L/m2-hr (48.9 gal/ft2-day)
after 130 runtime hours. The backwash frequency during testing ranged between 30 to 45
minutes, with a typical backwash event consisting of a flow reversal out the bottom and then top
end of the module, followed by a forward flush. A conservative CEB interval of once per day
was chosen to resolve anticipated membrane fouling, and two different pretreatment
configurations were used during testing as part of the pilot test plan. Scheduled maintenance at
33
the Mission San Jose WTP resulted in approximately two months of downtime after 250 runtime
hours.
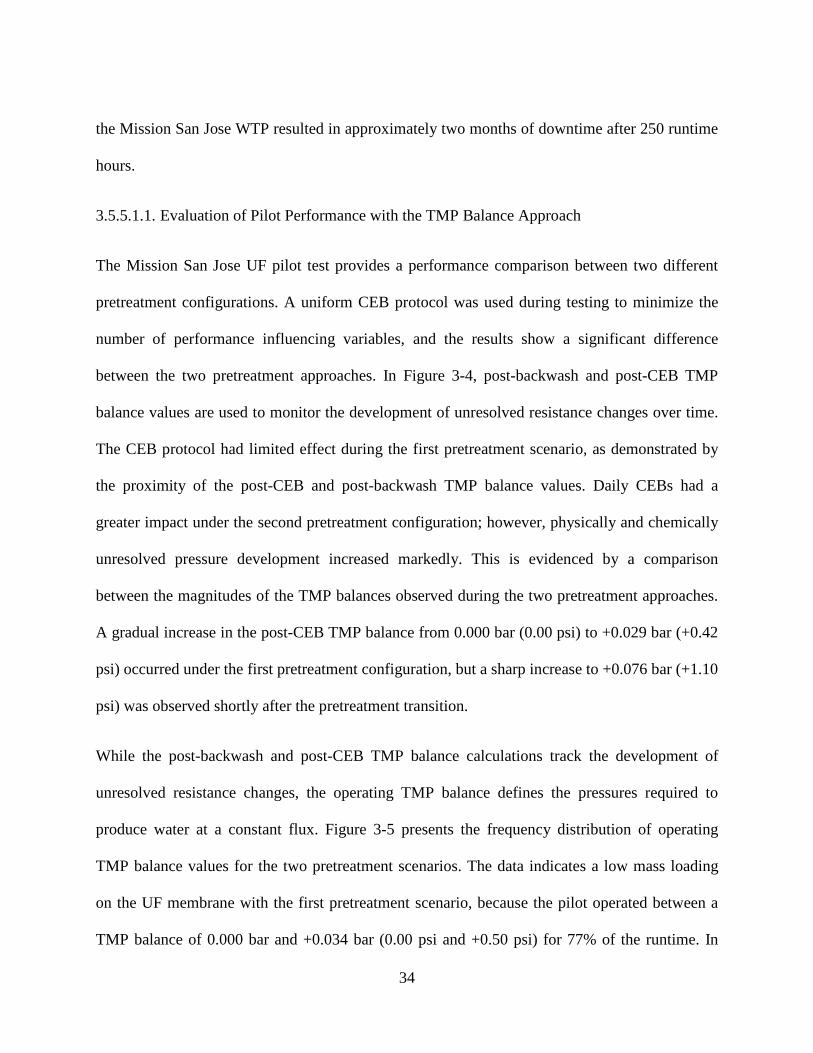
3.5.5.1.1. Evaluation of Pilot Performance with the TMP Balance Approach
The Mission San Jose UF pilot test provides a performance comparison between two different
pretreatment configurations. A uniform CEB protocol was used during testing to minimize the
number of performance influencing variables, and the results show a significant difference
between the two pretreatment approaches. In Figure 3-4, post-backwash and post-CEB TMP
balance values are used to monitor the development of unresolved resistance changes over time.
The CEB protocol had limited effect during the first pretreatment scenario, as demonstrated by
the proximity of the post-CEB and post-backwash TMP balance values. Daily CEBs had a
greater impact under the second pretreatment configuration; however, physically and chemically
unresolved pressure development increased markedly. This is evidenced by a comparison
between the magnitudes of the TMP balances observed during the two pretreatment approaches.
A gradual increase in the post-CEB TMP balance from 0.000 bar (0.00 psi) to +0.029 bar (+0.42
psi) occurred under the first pretreatment configuration, but a sharp increase to +0.076 bar (+1.10
psi) was observed shortly after the pretreatment transition.
While the post-backwash and post-CEB TMP balance calculations track the development of
unresolved resistance changes, the operating TMP balance defines the pressures required to
produce water at a constant flux. Figure 3-5 presents the frequency distribution of operating
TMP balance values for the two pretreatment scenarios. The data indicates a low mass loading
on the UF membrane with the first pretreatment scenario, because the pilot operated between a
TMP balance of 0.000 bar and +0.034 bar (0.00 psi and +0.50 psi) for 77% of the runtime. In
34
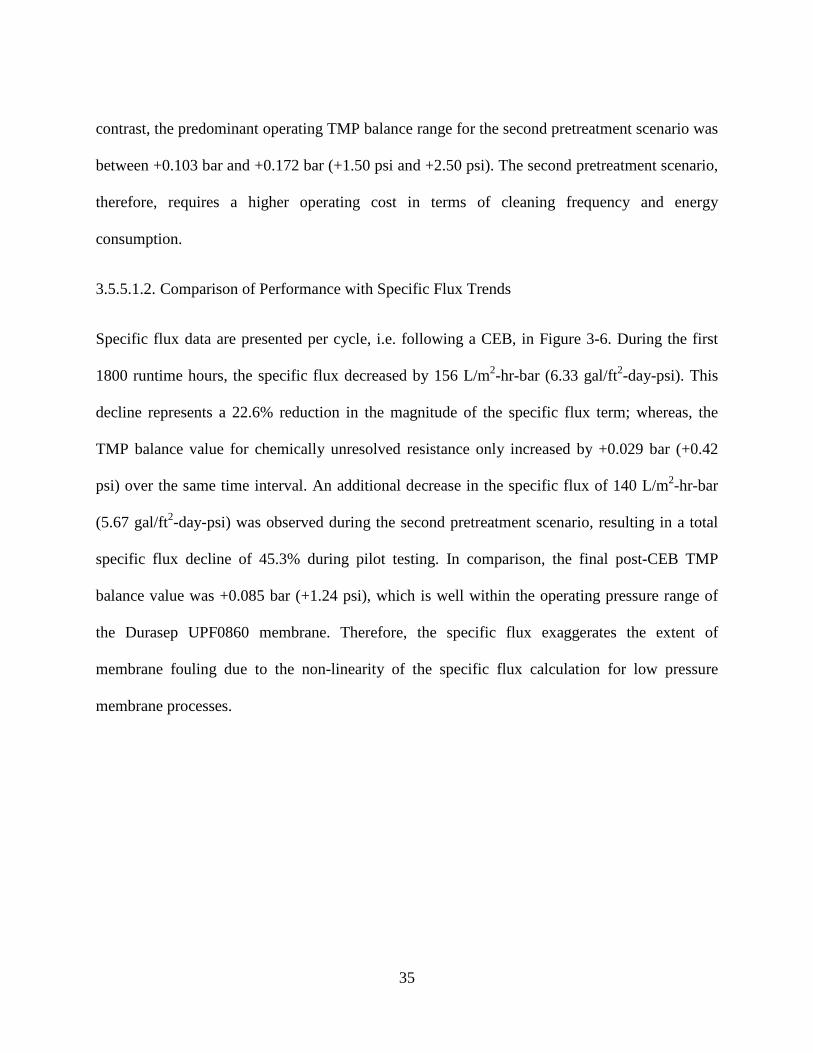
contrast, the predominant operating TMP balance range for the second pretreatment scenario was
between +0.103 bar and +0.172 bar (+1.50 psi and +2.50 psi). The second pretreatment scenario,
therefore, requires a higher operating cost in terms of cleaning frequency and energy
consumption.
3.5.5.1.2. Comparison of Performance with Specific Flux Trends
Specific flux data are presented per cycle, i.e. following a CEB, in Figure 3-6. During the first
1800 runtime hours, the specific flux decreased by 156 L/m2-hr-bar (6.33 gal/ft2-day-psi). This
decline represents a 22.6% reduction in the magnitude of the specific flux term; whereas, the
TMP balance value for chemically unresolved resistance only increased by +0.029 bar (+0.42
psi) over the same time interval. An additional decrease in the specific flux of 140 L/m2-hr-bar
(5.67 gal/ft2-day-psi) was observed during the second pretreatment scenario, resulting in a total
specific flux decline of 45.3% during pilot testing. In comparison, the final post-CEB TMP
balance value was +0.085 bar (+1.24 psi), which is well within the operating pressure range of
the Durasep UPF0860 membrane. Therefore, the specific flux exaggerates the extent of
membrane fouling due to the non-linearity of the specific flux calculation for low pressure
membrane processes.
35
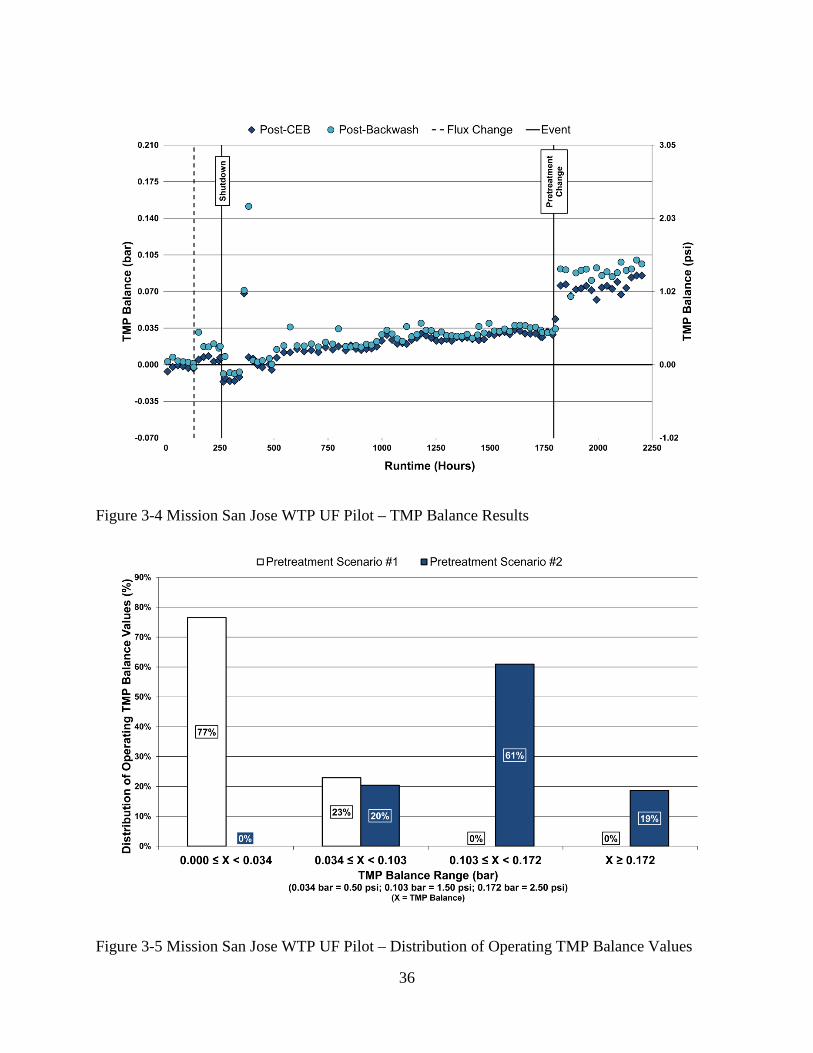
Figure 3-4 Mission San Jose WTP UF Pilot – TMP Balance Results
Figure 3-5 Mission San Jose WTP UF Pilot – Distribution of Operating TMP Balance Values
36
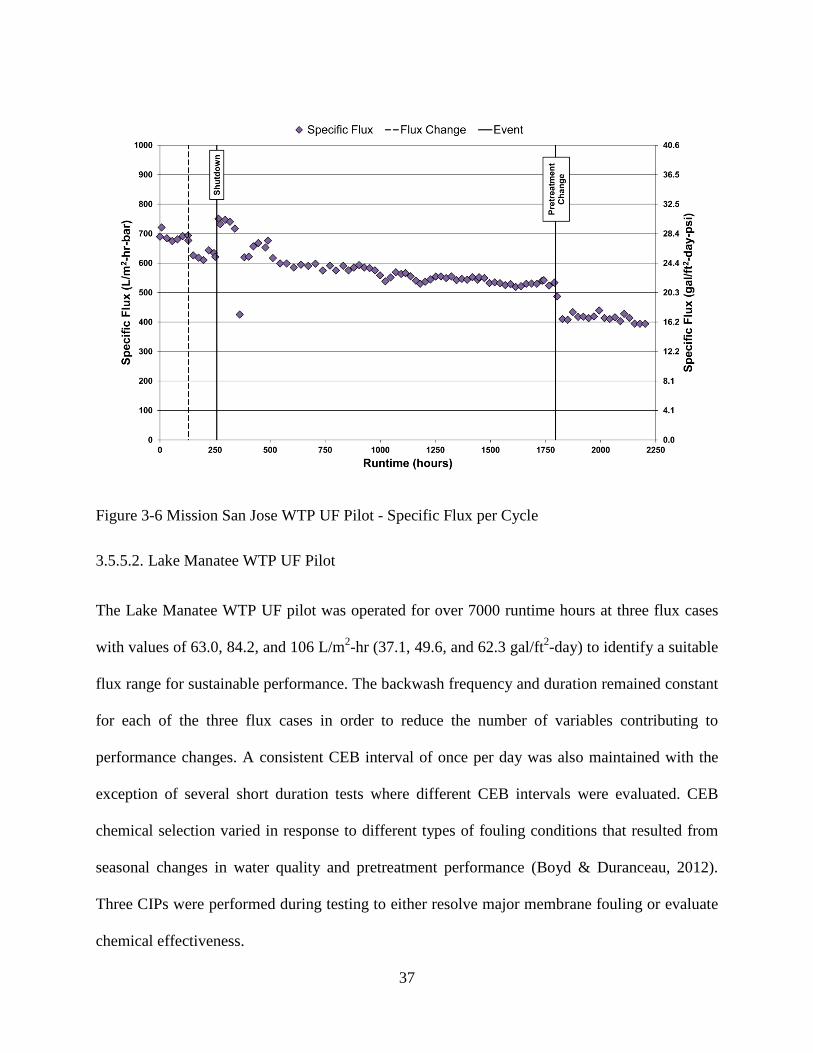
Figure 3-6 Mission San Jose WTP UF Pilot - Specific Flux per Cycle
3.5.5.2. Lake Manatee WTP UF Pilot
The Lake Manatee WTP UF pilot was operated for over 7000 runtime hours at three flux cases
with values of 63.0, 84.2, and 106 L/m2-hr (37.1, 49.6, and 62.3 gal/ft2-day) to identify a suitable
flux range for sustainable performance. The backwash frequency and duration remained constant
for each of the three flux cases in order to reduce the number of variables contributing to
performance changes. A consistent CEB interval of once per day was also maintained with the
exception of several short duration tests where different CEB intervals were evaluated. CEB
chemical selection varied in response to different types of fouling conditions that resulted from
seasonal changes in water quality and pretreatment performance (Boyd & Duranceau, 2012).
Three CIPs were performed during testing to either resolve major membrane fouling or evaluate
chemical effectiveness.
37
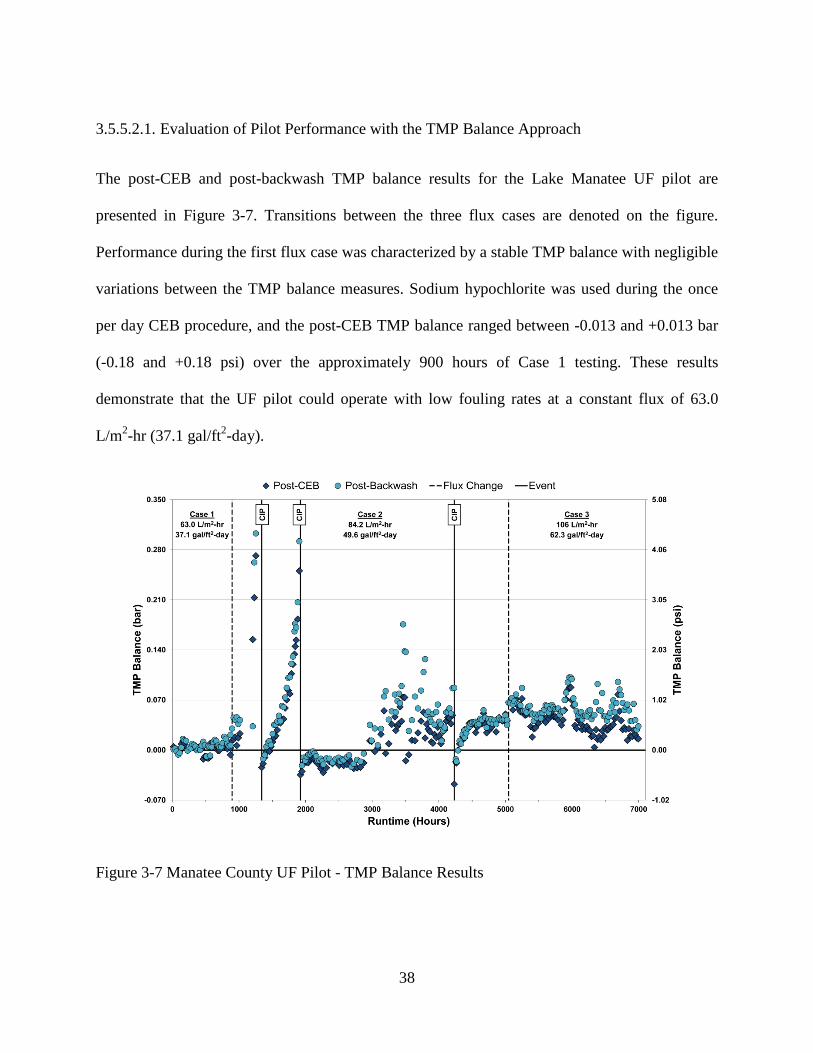
3.5.5.2.1. Evaluation of Pilot Performance with the TMP Balance Approach
The post-CEB and post-backwash TMP balance results for the Lake Manatee UF pilot are
presented in Figure 3-7. Transitions between the three flux cases are denoted on the figure.
Performance during the first flux case was characterized by a stable TMP balance with negligible
variations between the TMP balance measures. Sodium hypochlorite was used during the once
per day CEB procedure, and the post-CEB TMP balance ranged between -0.013 and +0.013 bar
(-0.18 and +0.18 psi) over the approximately 900 hours of Case 1 testing. These results
demonstrate that the UF pilot could operate with low fouling rates at a constant flux of 63.0
L/m2-hr (37.1 gal/ft2-day).
Figure 3-7 Manatee County UF Pilot - TMP Balance Results
38
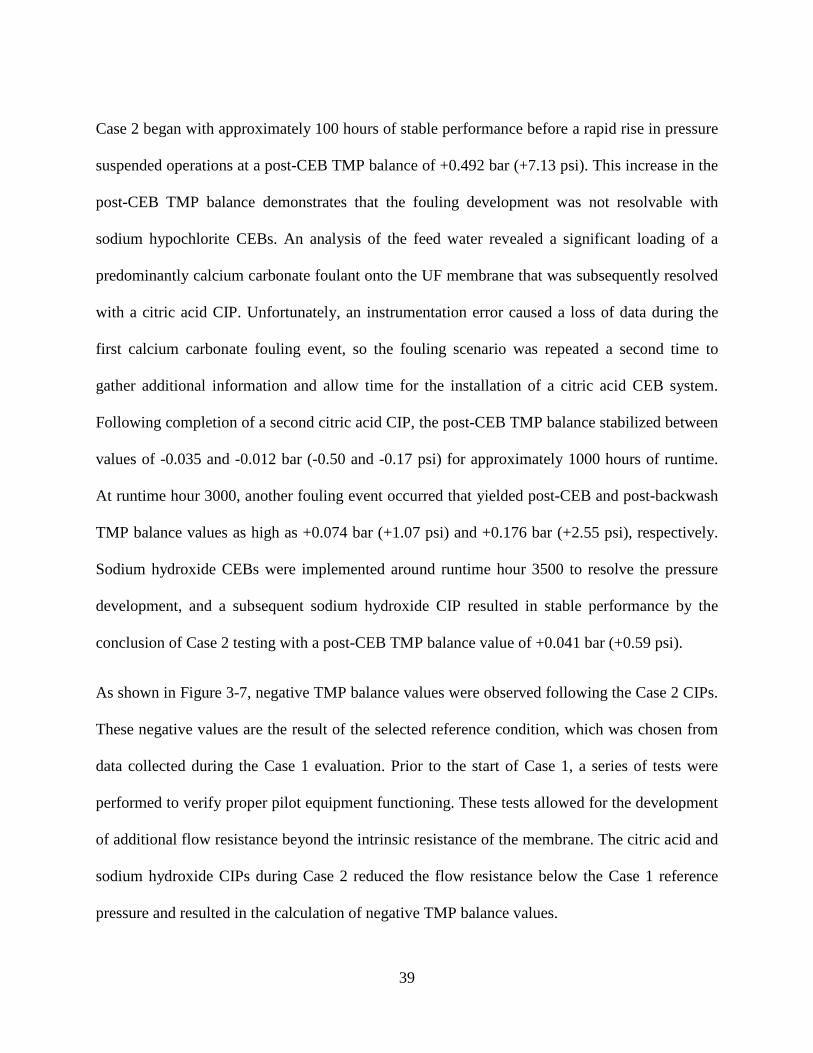
Case 2 began with approximately 100 hours of stable performance before a rapid rise in pressure
suspended operations at a post-CEB TMP balance of +0.492 bar (+7.13 psi). This increase in the
post-CEB TMP balance demonstrates that the fouling development was not resolvable with
sodium hypochlorite CEBs. An analysis of the feed water revealed a significant loading of a
predominantly calcium carbonate foulant onto the UF membrane that was subsequently resolved
with a citric acid CIP. Unfortunately, an instrumentation error caused a loss of data during the
first calcium carbonate fouling event, so the fouling scenario was repeated a second time to
gather additional information and allow time for the installation of a citric acid CEB system.
Following completion of a second citric acid CIP, the post-CEB TMP balance stabilized between
values of -0.035 and -0.012 bar (-0.50 and -0.17 psi) for approximately 1000 hours of runtime.
At runtime hour 3000, another fouling event occurred that yielded post-CEB and post-backwash
TMP balance values as high as +0.074 bar (+1.07 psi) and +0.176 bar (+2.55 psi), respectively.
Sodium hydroxide CEBs were implemented around runtime hour 3500 to resolve the pressure
development, and a subsequent sodium hydroxide CIP resulted in stable performance by the
conclusion of Case 2 testing with a post-CEB TMP balance value of +0.041 bar (+0.59 psi).
As shown in Figure 3-7, negative TMP balance values were observed following the Case 2 CIPs.
These negative values are the result of the selected reference condition, which was chosen from
data collected during the Case 1 evaluation. Prior to the start of Case 1, a series of tests were
performed to verify proper pilot equipment functioning. These tests allowed for the development
of additional flow resistance beyond the intrinsic resistance of the membrane. The citric acid and
sodium hydroxide CIPs during Case 2 reduced the flow resistance below the Case 1 reference
pressure and resulted in the calculation of negative TMP balance values.
39

The Case 3 flux of 106 L/m2-hr (62.3 gal/ft2-day) was selected to test the upper boundary of the
recommended operating flux range for the membrane. Increased fouling rates were observed
initially with an overall downward trend in post-CEB TMP balance values over the
approximately 2000 hours of Case 3 runtime. Two fouling events at runtime hours 5900 and
6700 increased post-CEB TMP balance levels temporarily, but Case 3 concluded with a post-
CEB TMP balance of +0.016 bar (+0.23 psi). Post-backwash TMP balance values were generally
greater than the post-CEB TMP balance for the majority of Case 3. On the final day of testing,
the post-backwash TMP balance was recorded to be +0.033 bar (+0.48 psi). These TMP balance
results indicate that the chemical maintenance protocol was effective at reducing flow resistance.
Operating TMP balance frequency distributions for the three flux cases are presented in Figure 3-
8. The Case 2 (a) and Case 2 (b) columns incorporate TMP balances values with and without the
two calcium carbonate fouling events, respectively. A comparison between the different
operating fluxes reveals that the pilot experienced the lowest operating TMP balance levels at
63.0 L/m2-hr (37.1 gal/ft2-day). When the calcium carbonate fouling is excluded, the Case 2 flux
of 84.2 L/m2-hr (49.6 gal/ft2-day) provided the second lowest operating TMP balance values,
with the highest operating TMP balances occurring at 106 L/m2-hr (62.3 gal/ft2-day). These
results are anticipated, because lower membrane fouling is generally observed at lower operating
fluxes (Wu et al., 1999; Bacchin et al., 2006; Mosqueda-Jimenez et al., 2008). However,
uncertainty remains as to the extent to which the three operating fluxes differ relative to fouling,
because feed water quality and chemical maintenance protocols differed during the duration of
testing. Parallel testing would be required to make a more accurate assessment, but Case 1 most
likely yields the lowest operating cost relative to pressure development.
40
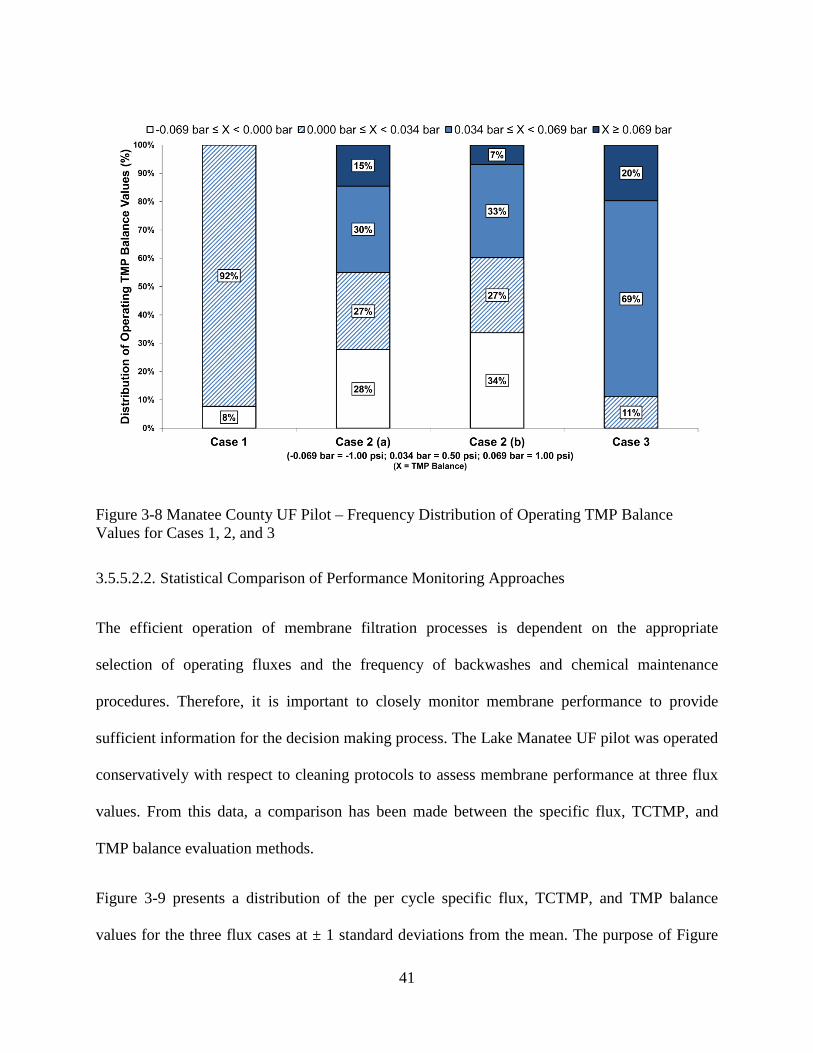
Figure 3-8 Manatee County UF Pilot – Frequency Distribution of Operating TMP Balance Values for Cases 1, 2, and 3
3.5.5.2.2. Statistical Comparison of Performance Monitoring Approaches
The efficient operation of membrane filtration processes is dependent on the appropriate
selection of operating fluxes and the frequency of backwashes and chemical maintenance
procedures. Therefore, it is important to closely monitor membrane performance to provide
sufficient information for the decision making process. The Lake Manatee UF pilot was operated
conservatively with respect to cleaning protocols to assess membrane performance at three flux
values. From this data, a comparison has been made between the specific flux, TCTMP, and
TMP balance evaluation methods.
Figure 3-9 presents a distribution of the per cycle specific flux, TCTMP, and TMP balance
values for the three flux cases at ± 1 standard deviations from the mean. The purpose of Figure
41
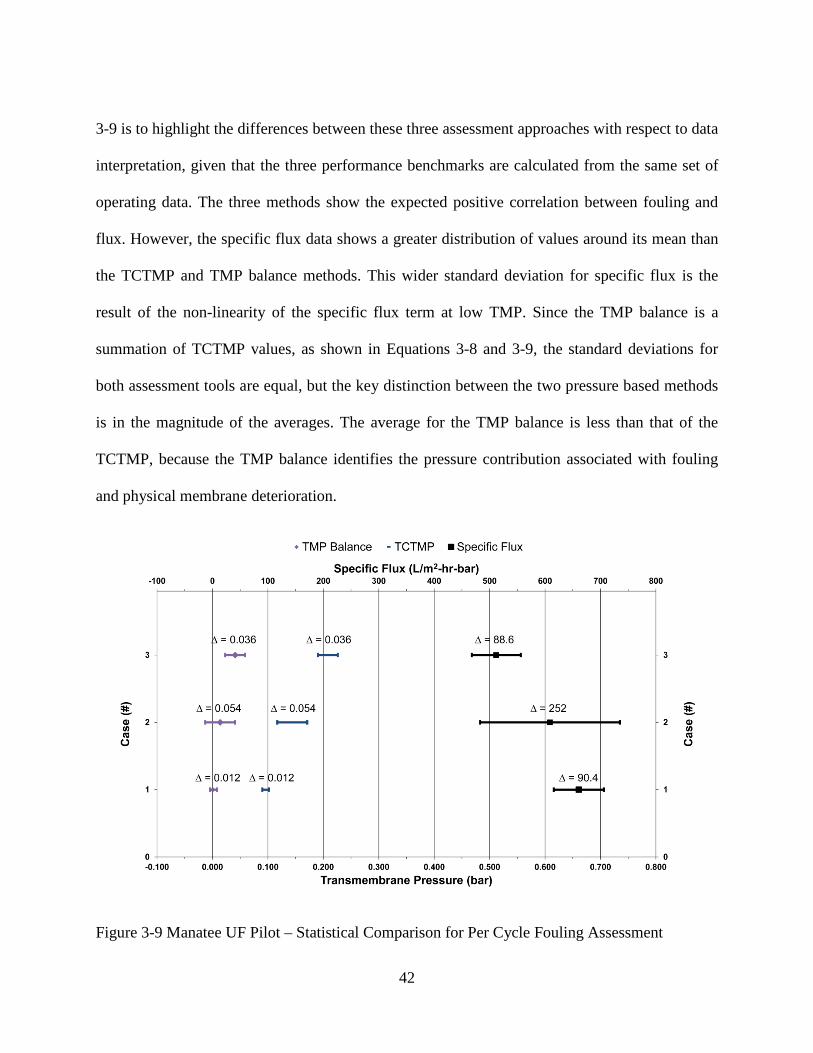
3-9 is to highlight the differences between these three assessment approaches with respect to data
interpretation, given that the three performance benchmarks are calculated from the same set of
operating data. The three methods show the expected positive correlation between fouling and
flux. However, the specific flux data shows a greater distribution of values around its mean than
the TCTMP and TMP balance methods. This wider standard deviation for specific flux is the
result of the non-linearity of the specific flux term at low TMP. Since the TMP balance is a
summation of TCTMP values, as shown in Equations 3-8 and 3-9, the standard deviations for
both assessment tools are equal, but the key distinction between the two pressure based methods
is in the magnitude of the averages. The average for the TMP balance is less than that of the
TCTMP, because the TMP balance identifies the pressure contribution associated with fouling
and physical membrane deterioration.
Figure 3-9 Manatee UF Pilot – Statistical Comparison for Per Cycle Fouling Assessment
42
3.6. Conclusions
The TMP balance provides a new approach for benchmarking membrane process performance
and may be used as an alternative or supplement to traditional specific flux and TMP assessment
techniques. While the specific flux is a valuable tool for normalizing process data with respect to
temperature and pressure, the non-linearity of the specific flux at low TMP values results in
exaggerated fouling trends. TCTMP provides information on the fouling of membrane processes
but is limited as a tool for distinguishing between different types of fouling or comparing
performance at different flux values. The TMP balance approach has been developed to address
these issues, and the principle benefits the TMP balance are as follows:
• The performance of a membrane process is easily interpreted from the TMP balance,
because the TMP balance is reported as a pressure change relative to a reference
condition.
• The TMP balance identifies pressure variations associated with changes to the intrinsic
membrane resistance and fouling layers.
• The TMP balance distinguishes between chemically unresolved, physically unresolved
and operating pressure changes through calculation of post-CEB, post-CIP, post-
backwash, and operating TMP balance values. This information may be used to
determine the frequency of chemical and physical maintenance procedures.
• Calculation of the TMP balance allows for the comparison of process performance at
different flux values.
43
3.7. Acknowledgments
The research reported herein was funded by UCF project agreements 16208085 and 16208088.
Thanks are in order for the companies and municipalities involved in the acquisition,
maintenance, and support activities associated with the two ultrafiltration pilots. The
contributions of Harn R/O Systems, Inc. (Venice, FL), Horizon Industries, Inc. (Las Vegas, NV),
Toyobo Co., Ltd. (Osaka, Japan), the Manatee County Utilities Department (Bradenton, FL), and
the Alameda County Water District (Fremont, CA) are duly recognized and greatly appreciated.
Additional thanks are offered to Dr. Jayapregasham Tharamapalan for his dedicated assistance
with pilot testing activities.
44
3.8. References
American Water Works Association. (2005). Microfiltration and ultrafiltration membranes for
drinking water Manual of water supply practices M53 (1st ed.). Denver, CO: American Water
Works Association.
Arkhangelsky, E., Kuzmenko, D., & Gitis, V. (2007). Impact of chemical cleaning on properties
and functioning of polyethersulfone membranes. Journal of Membrane Science, 305, 176-184.
ASTM International. (2005). ASTM D 5090-90 Standard practice for standardizing ultrafiltration
permeate flow performance data. ASTM International.
Bacchin, P., Aimar, P., & Field, R.W. (2006). Critical and sustainable fluxes: Theory,
experiments and applications. Journal of Membrane Science, 281, 42-69.
Boyd, C.C., & Duranceau, S.J. (2012). Assessing and maintaining membrane performance in a
post-sedimentation ultrafiltration process. Water Practice & Technology, 7(2). doi:
10.2166/wpt.2012.041
Buckley, C. A., & Hurt, Q. E. (1996). Membrane applications: A contaminant-based perspective.
In J. Mallevialle, P.E. Odendaal, & M.R. Wiesner (Eds.), Water treatment membrane process.
New York: McGraw-Hill.
Chellam, S., Jacangelo, J.G., & Bonacquisti, T.P. (1998). Modeling and experimental
verification of pilot-scale hollow fiber, direct flow microfiltration with periodic backwashing.
Environmental Science & Technology, 32(1), 75-81.
45
Chen, J.P., Kim, S.L., & Ting, Y.P. (2003). Optimization of membrane physical and chemical
cleaning by a statistically designed approach. Journal of Membrane Science, 219, 27-45.
Cheryan, M. (1998). Ultrafiltration and Microfiltration Handbook. Lancaster, PA.: Technomic
Publishing Company Incorporated.
Cho, J., Amy, G., & Pellegrino, J. (2000). Membrane filtration of natural organic matter: Factors
and mechanisms affecting rejection and flux decline with charged ultrafiltration (UF) membrane.
Journal of Membrane Science, 164, 89-110.
Crozes, G.F., Jacangelo, J.D., Anselme, C., & Laîné, J.M. (1997). Impact of ultrafiltration
operating conditions on membrane irreversible fouling. Journal of Membrane Science, 124, 63-
76.
Duranceau, S.J. & Taylor, J.S. (2011). Membranes. In J. K. Edzwald (Ed.), Water quality &
treatment: A handbook on drinking water (6th ed.). New York, NY: McGraw-Hill.
Gao, W., Liang, H., Ma, J., Han, M., Han, Z., & Li, G. (2011). Membrane fouling control in
ultrafiltration technology for drinking water treatment production: A review. Desalination, 272,
1-8.
Gitis, V., Haught, R.C., Clark, R.M., Gun, J., & Lev, O. (2006). Application of nanoscale probes
for the evaluation of the integrity of ultrafiltration membranes. Journal of Membrane Science,
276, 185-192.
Halpern, D.F., McArdle, J., & Antrim, B. (2005). UF pretreatment for SWRO: Pilot studies.
Desalination, 182, 323-332.
46
Howe, K.J., & Clark, M.M. (2002). Fouling of microfiltration and ultrafiltration membranes by
natural waters. Environmental Science & Technology, 36(16), 3571-3576.
Huang, H., Schwab, K., & Jacangelo, J.G. (2009). Pretreatment for low pressure membranes in
water treatment: A review. Environmental Science &Technology. 43(9), 3011-3019.
Katsoufidou, K., Yiantsios, S.G., & Karabelas, A.J. (2008). An experimental study of UF
membrane fouling by humic acid and sodium alginate solutions: The effect of backwashing on
flux recovery. Desalination, 220, 214-227.
Kim, J., & DiGiano, F.A. (2006). A two-fiber, bench-scale test of ultrafiltration (UF) for
investigation of fouling rate and characteristics. Journal of Membrane Science, 271, 196-204.
Kimura, K., Maeda, T., Yamamura, H., & Watanabe, Y. (2008). Irreversible membrane fouling
in microfiltration membranes filtering coagulated surface water. Journal of Membrane Science,
320, 356-362.
Kwon, B., Park, N., & Cho, J. (2005). Effect of algae on fouling and efficiency of UF
membranes. Desalination, 179, 203-214.
Lee, E.K., Chen, V., & Fane, A.G.(2008). Natural organic matter (NOM) fouling in low pressure
membrane filtration – effect of membranes and operation modes. Desalination, 218, 257-270.
Lee, N., Amy, G., Croué, J.P., & Buisson, H. (2004). Identification and understanding of fouling
in low-pressure membrane (MF/UF) filtration by natural organic matter (NOM). Water
Research, 38, 4511-4523.
47
Lin, C.-F., Wu, C.-H., & Kuo, S.-W. (2005). Temporal evolution of resistances in the
ultrafiltration of humic substances. Desalination, 172, 99-106.
Liu, C., Caothien, S., Hayes, J., Caothuy, T., Otoyo, T., & Ogawa, T. (2006). Membrane
Chemical Cleaning: From Art to Science. (Pall Corporation). Retrieved from
http://www.pall.com/pdfs/Water-Treatment/mtcpaper.pdf
Liu, T., Chen, Z., Yu, W., Shen, J., & Gregory, J. (2011). Effect of two-stage coagulant addition
on coagulation-ultrafiltration process for treatment of humic-rich water. Water Research, 45,
4260-4268.
Mosqueda-Jimenez, D.B., Huck, P.M., & Basu, O.D. (2008). Fouling characteristics of an
ultrafiltration membrane used in drinking water treatment. Desalination, 230, 79-91.
MWH. (2005). Water treatment: Principles and design (2nd ed.). In J.C. Crittenden, R.R.
Trussell, D.W. Hand, K.J. Howe, & G. Tchobanoglous (Eds.). Hoboken, NJ: John Wiley & Sons.
Neubrand, W., Vogler, S., Ernst, M., & Jekel, M. (2010). Lab and pilot scale investigations on
membrane fouling during the ultrafiltration of surface water. Desalination, 250, 968-972.
Oriol, G.G., Moosa, N., Garcia-Valls, R., Busch, M.., & Garcia-Molina, V. (2012). Optimizing
seawater operating protocols for pressurized ultrafiltration based on advanced cleaning research.
Desalination and Water Treatment, 1-13. doi: 10.1080/19443994.2012.714927
Panglisch, S., Dautzenberg, W., Kiepke, O., Gimbel, R., Gebel, J., Kirsch, A., & Exner, M.
(1998). Ultra- and microfiltration pilot plant investigations. Desalination, 119, 277-288.
48
Panglisch, S., Kiepke, I., Dautzenberg, W., & Gimbel, R. (1997). Optimization of operation and
cleaning of membranes – results on ultra- and microfiltration pilot plant investigations to treat
reservoir water. Desalination, 113, 247-249.
Peiris, R.H., Hallé, C., Budman, H., Moresoli, C., Peldszus, S., Huck, P.M., & Legge, R.L.
(2010). Identifying fouling events in a membrane-based drinking water treatment process using
principal component analysis of fluorescence excitation-emission matrices. Water Research, 44,
185-194.
Porcelli, N., & Judd, S. (2010). Chemical cleaning of potable water membranes: A review.
Separation and Purification Technology, 71, 137-143.
Shannon, M.A., Bohn, P.W., Elimelech, M., Georgiadis, J.G., Mariñas, B.J., & Mayes, A.M.
(2008). Science and technology for water purification in the coming decades. Nature, 452, 301-
310.
Strugholtz, S., Sundaramoorthy, K., Panglisch, S., Lerch, A., Brügger, A., & Gimbel, R. (2005).
Evaluation of the performance of different chemicals for cleaning capillary membranes.
Desalination, 179, 191-202.
United States Environmental Protection Agency. (2005). Membrane filtration guidance manual,
EPA 815-R-06-009, Office of Water, Washington, DC.
Wiesner, M.R., & Chellam, S. (1992). Mass transport considerations for pressure-driven
membrane processes. Journal of the American Water Works Association, 84(1), 88-95.
49
Wu, D., Howell, J.A., & Field, R.W. (1999). Critical flux measurement for model colloids.
Journal of Membrane Science, 152, 89-98.
Yamamura, H., Kimura, K., & Watanabe, Y. (2007). Mechanism involved in the evolution of
physically irreversible fouling in microfiltration and ultrafiltration membranes used for drinking
water treatment. Environmental Science & Technology, 41(19), 6789-6794.
Yeh, H.M., & Wu, H.H. (1997). Membrane filtration in combined hollow-fiber module systems.
Journal of Membrane Science, 124, 93-105.
Yuan, W., & Zydney, A.L. (2000). Humic acid fouling during ultrafiltration. Environmental
Science & Technology, 34 (23), 5043-5050.
Zhang, Y., Tang, C.Y., & Li, G. (2012). The role of hydrodynamic conditions and pH on algal-
rich water fouling of ultrafiltration. Water Research, 46, 4783-4789.
Zondervan, E., & Roffel, B. (2007). Evaluation of different cleaning agents used for cleaning
ultra filtration membranes fouled by surface water. Journal of Membrane Science, 304, 40-49.
50
CHAPTER 4. FIVE COMPONENT OPTIMIZATION APPROACH FOR MEMBRANE FILTRATION PROCESSES USING TRANSMEMBRANE
PRESSURE (TMP) VARIATIONS
4.1. Abstract
The goal of ultrafiltration (UF) process optimization is to identify a set of operating parameters
that allow membrane fouling to be managed and water production goals to be met. The study
described in this paper demonstrates a five component systematic approach for the optimization
of UF membrane processes on the basis of variations in transmembrane pressure. Terms are
defined for assessing the performance of filtration, backwash, and chemical cleaning process
events, and a new process performance benchmark, termed process utilization, is proposed to
define the extent to which UF processes approach ideal performance. New measures for
quantifying backwash and chemically enhanced backwash (CEB) performance are also
presented. Backwash duration was identified as a major factor influencing process recovery and
utilization, and increases in operating pressures and chemically unresolved fouling were
correlated to increases in process recovery and utilization. Also, extending the interval between
CEBs was demonstrated to form a protective fouling layer that improved backwash effectiveness
for the filtration of conventionally pretreated surface water. The five component systematic
optimization approach achieved a sustainable process recovery of 96.1% and process utilization
of 93.5%.
Key words: Ultrafiltration, Optimization, Utilization, Recovery, Transmembrane Pressure, TMP,
TMP Balance
51
4.2. Introduction
The need for advanced water treatment technologies is expected to increase globally as a result
of projected water quality and availability issues; however, cost considerations are a potential
barrier to the widespread implementation of energy intensive technologies such as ultrafiltration
(UF) (Shannon et al., 2008). Accordingly, there is a need to increase the efficiency of UF
processes by employing optimization strategies that reduce operating costs without sacrificing
treated water quality and production reliability. A key component of UF process optimization is
fouling management. Major cost considerations for UF processes, such as energy use and
chemical consumption, are strongly influenced by membrane fouling. As a result, considerable
research efforts have been expended to investigate the mechanisms by which fouling occurs and
identify the constituents that contribute to fouling development such as natural organic matter
(NOM), algae, and biopolymers (Lee et al., 2004; Kwon et al., 2005; Haberkamp et al., 2008).
Membrane fouling may be partially managed by feed water pretreatment. Common pretreatment
approaches for natural waters include coagulation, preoxidation, and adsorption (Howe & Clark,
2006; Huang et al., 2009; Campinas & Rosa, 2010; Gao et al., 2011), because these technologies
generally improve UF process performance by removing or altering foulants prior to filtration. In
conjunction with pretreatment, UF operating parameters significantly affect the development and
severity of membrane fouling. A variety of research has elucidated the interdependence between
operating flux and fouling (Field et al., 1995; Howell, 1995; Wu et al., 1999), and the selection
of a sustainable flux is necessary for efficient long-term operation (Bacchin et al., 2006).
Additional factors of consequence to fouling management include the frequency and duration of
backwash procedures (Kim & DiGiano, 2006; Smith et al., 2006) and the implementation of
52
chemical maintenance programs via chemically enhanced backwashes (CEBs) or clean-in-place
(CIP) events (Yuan & Zydney, 2000; Katsoufidou et al., 2008; Strugholtz et al., 2005;
Zondervan & Roffel, 2007; Porcelli & Judd, 2010; Liu et al., 2006).
The complex interactions between source water quality, pretreatment processes, membrane
fouling, and process operating configurations present a significant challenge to UF performance
improvement efforts. Laboratory studies have demonstrated the use of statistical analysis and
empirical modeling techniques to identify an optimum set of operating conditions using water
quality and operating data (Zularisam et al., 2009; Figueroa et al., 2011; Alventosa-deLara et al.,
2012), and statistical methods have been employed at the pilot-scale to improve the performance
of backwash and chemical cleaning procedures (Chen et al., 2003). However, full-scale
implementation of statistical model based optimization techniques presents challenges in water
treatment. The variability of source waters (Ouyang et al., 2006; Boyd & Duranceau, 2012a) and
the dynamic operation of pretreatment processes yield a constantly changing set of input
conditions for full-scale UF processes. Accordingly, pilot-scale studies are typically used to
determine an acceptable set of UF operating parameters (Decarolis et al., 2001; Jang et al., 2005)
with emphasis on stable operation rather than optimization.
In addition to statistical modeling efforts, optimization research has focused on enhancing the
functionality and implementation of filtration, backwash, and cleaning events. For example, the
incorporation of air injection into routine backwashes increased membrane foulant removal
(Remize et al., 2010) for a direct filtration membrane process, and the initiation of backwashes
based on transmembrane pressure (TMP) reduced backwash water consumption and energy
requirements during the treatment of wastewater effluent (Smith et al., 2006). Performance
53
improvements have also been realized by quantifying energy costs for alternative operating
configurations (Xu & Gao, 2010), identifying threshold filtration and backwash durations for
fouling (Ye et al., 2010), evaluating process changes via trial-and-error procedures, and
upgrading existing process equipment (White & Kosterman, 2010). The variety of optimization
research ideas published in the literature point to the potential for meaningful improvement in the
performance of existing and future UF processes. This paper presents the development of a
systematic optimization approach to improve UF process performance for both pilot- and full-
scale applications and demonstrates the use of new tools for the evaluation of membrane
processes at the pilot-scale during surface water treatment.
4.3. Methods and Materials
4.3.1. UF Pilot Test Location
The Lake Manatee Water Treatment Plant (WTP) in Manatee County, Florida, which is operated
by the Manatee County Utilities Department, was selected as the pilot testing site. The facility
practices alum coagulation for the removal of organics from the Lake Manatee Reservoir. An
organic polymer is added during flocculation to promote the formation of a settleable floc, and
the settled water is pH adjusted with lime as needed. Additionally, a maintenance dose of
chlorine is added in the post-mix to limit algae growth on the basin walls. During seasonal taste
and odor events, powdered activated carbon is added to the raw water prior to coagulation.
4.3.2. UF Membrane and Pilot Unit Description
The fully-automated pilot unit was fitted with a single hydrophilic Durasep UPF0860 inside-out
hollow fiber UF membrane manufactured by Toyobo CO., Ltd. The Durasep membrane was
54

composed of polyvinylpyrrolidone–modified polyethersulfone (PES) with an active surface area
of 40 m2 (430 ft2) providing an approximate 150,000 dalton cutoff. Feed and filtrate turbidity,
pressure, and flow data were recorded at two minute intervals, and two chemical injection
systems were installed for chemical maintenance purposes.
4.3.3. UF Pilot Operations
The UF pilot operated in a constant flux direct flow configuration and filtered settled surface
water from the Lake Manatee WTP. Filtrate was used to perform backwashes and CEBs. During
backwashes, filtrate was first pumped out the bottom and then out the top end of the module at a
flux equal to three times the filtration flux. The CEB process involved an injection of chemical
during a backwash, followed by a 10 minute soak, and concluding with an extended backwash.
4.3.4. UF Pilot Operating History
Prior to the start of optimization testing, the UF pilot and membrane were used in a series of
evaluations over an approximately two year period. CIPs were conducted before the optimization
study commenced to restore membrane performance. The CIP procedure consisted of the
recirculation of chemical for approximately one hour, a thirty minute soak, and a subsequent
rinse. A low pH citric acid CIP was performed first followed by a high pH sodium hypochlorite
CIP. Optimization testing commenced in December, 2011 and concluded in March, 2012.
4.3.5. Water Quality Testing
The water quality sample plan developed for the research called for the collection of pH,
temperature, turbidity, alkalinity, total hardness, total organic carbon (TOC), dissolved organic
carbon (DOC), and UV 254 data. Temperature and turbidity data were automatically recorded at
55
two minute intervals using equipment onboard the UF pilot. Additional water quality data was
provided courtesy of the Manatee County Utilities Department. Alkalinity, hardness, and pH data
were measured daily; whereas, TOC, DOC, and UV 254 analyses were conducted weekly.
4.3.6. Method of Data Compilation
The process data collected during operation was compiled and assigned runtime values. Since the
UF pilot recorded data at two minute intervals, data collected prior to flux stabilization following
backwashes or CEBs was excluded by removing values outside a range of ± 3 standard
deviations from the mean of adjacent points.
4.3.7. Method of Performance Monitoring
UF pilot performance was monitored using the TMP balance approach (refer to Chapter 3) that
identifies changes to membrane fouling resistance and intrinsic membrane resistance based on
variations in temperature corrected TMP (TCTMP) relative to a reference pressure. The
reference pressure is selected according to the application and may be either that of a new
process at steady state, a chemically cleaned process, or a process operating at a level of
acceptable performance. A simplified version of the TMP balance calculation is presented as
Equation 4-1. In the equation, TCTMP measurements are chronologically organized into
sequences (J) and cycles (K). An operating sequence consists of consecutive filtration and
backwash events; whereas, an operating cycle is comprised of a series of sequences culminating
in a CEB. An additional summation may be added to the TMP balance equation to incorporate
CIP events if desired. The ΔReference term, defined mathematically in Equation 4-2, adjusts
56
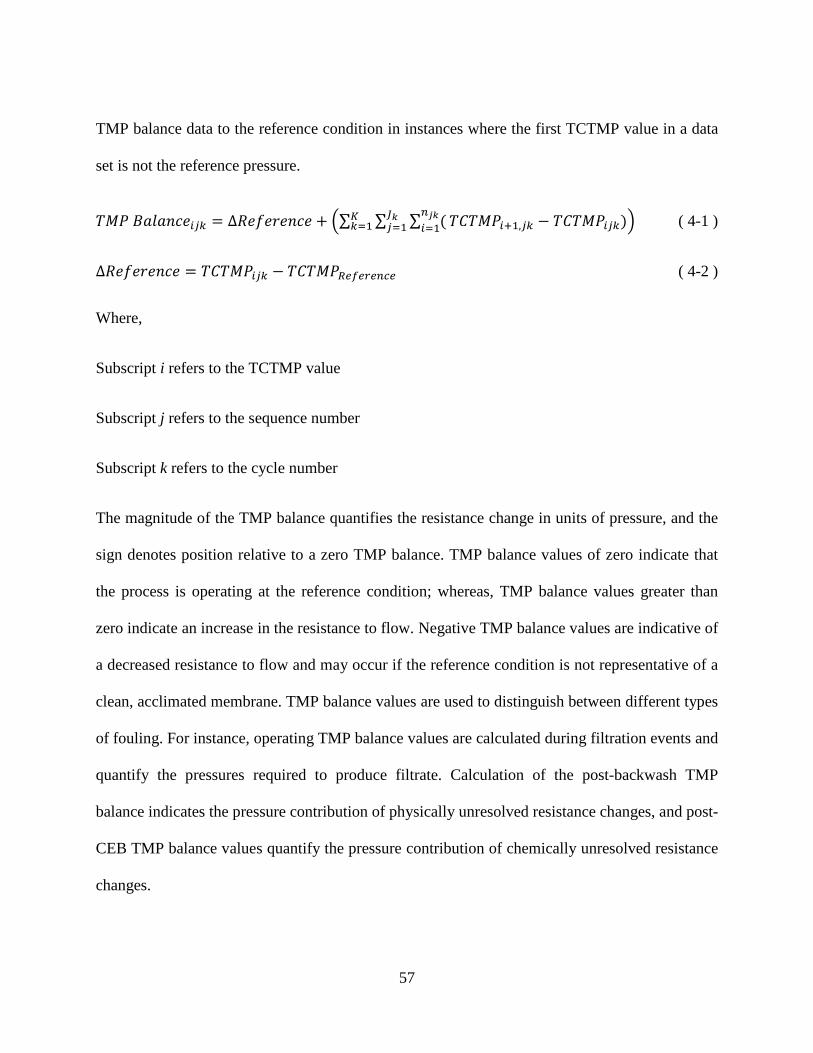
TMP balance data to the reference condition in instances where the first TCTMP value in a data
set is not the reference pressure.
𝑇𝑀𝑃 𝐵𝑎𝑙𝑎𝑛𝑐𝑒𝑖𝑗𝑘 = ∆𝑅𝑒𝑓𝑒𝑟𝑒𝑛𝑐𝑒 + �∑ ∑ ∑ (𝑛𝑗𝑘𝑖=1 𝑇𝐶𝑇𝑀𝑃𝑖+1,𝑗𝑘 − 𝑇𝐶𝑇𝑀𝑃𝑖𝑗𝑘)𝐽𝑘
𝑗=1𝐾𝑘=1 � ( 4-1 )
∆𝑅𝑒𝑓𝑒𝑟𝑒𝑛𝑐𝑒 = 𝑇𝐶𝑇𝑀𝑃𝑖𝑗𝑘 − 𝑇𝐶𝑇𝑀𝑃𝑅𝑒𝑓𝑒𝑟𝑒𝑛𝑐𝑒 ( 4-2 )
Where,
Subscript i refers to the TCTMP value
Subscript j refers to the sequence number
Subscript k refers to the cycle number
The magnitude of the TMP balance quantifies the resistance change in units of pressure, and the
sign denotes position relative to a zero TMP balance. TMP balance values of zero indicate that
the process is operating at the reference condition; whereas, TMP balance values greater than
zero indicate an increase in the resistance to flow. Negative TMP balance values are indicative of
a decreased resistance to flow and may occur if the reference condition is not representative of a
clean, acclimated membrane. TMP balance values are used to distinguish between different types
of fouling. For instance, operating TMP balance values are calculated during filtration events and
quantify the pressures required to produce filtrate. Calculation of the post-backwash TMP
balance indicates the pressure contribution of physically unresolved resistance changes, and post-
CEB TMP balance values quantify the pressure contribution of chemically unresolved resistance
changes.
57

4.4. Results and Discussion
4.4.1. Characterization of Process Events via Pressure Variation
The operation of UF membrane processes may be viewed as a sequence of individual filtration,
backwash, CEB, and CIP events, termed process events. Process events determine the operating
TMP by affecting membrane fouling and integrity and may be quantified numerically by
calculating the pressure difference associated with each event. Equations 4-3 through 4-5 present
the calculations for the ΔFiltration, ΔBackwash, and ΔCEB terms. The process event terms
provide tools for identifying process operating issues and optimizing process performance. For
example, pressure changes during filtration are primarily influenced by mass removal and
compression of the fouling layer. A positive ΔFiltration value denotes increased flow resistance
during filtration, and the magnitude of the ΔFiltration term may be used to make decisions
concerning filtration duration and monitor changes in feed water quality. Negative ΔBackwash
and ΔCEB values indicate a decreased flow resistance resultant from these foulant removal
functions and allow for an assessment of physical and chemical cleaning protocol effectiveness.
∆𝐹𝑖𝑙𝑡𝑟𝑎𝑡𝑖𝑜𝑛 = 𝑇𝐶𝑇𝑀𝑃𝑖𝑗𝑘 − 𝑇𝐶𝑇𝑀𝑃𝑖+𝑛,𝑗𝑘 ( 4-3 )
∆𝐵𝑎𝑐𝑘𝑤𝑎𝑠ℎ = 𝑇𝐶𝑇𝑀𝑃𝑖,𝑗+1,𝑘 − 𝑇𝐶𝑇𝑀𝑃𝑖+𝑛,𝑗𝑘, ( 4-4 )
∆𝐶𝐸𝐵 = 𝑇𝐶𝑇𝑀𝑃𝑖,𝑗,𝑘+1 − 𝑇𝐶𝑇𝑀𝑃𝑖+𝑛,𝑗+𝑜,𝑘 ( 4-5 )
Where,
Subscript n refers to the last TCTMP value of sequence j
Subscript o refers to the last sequence of cycle k
58
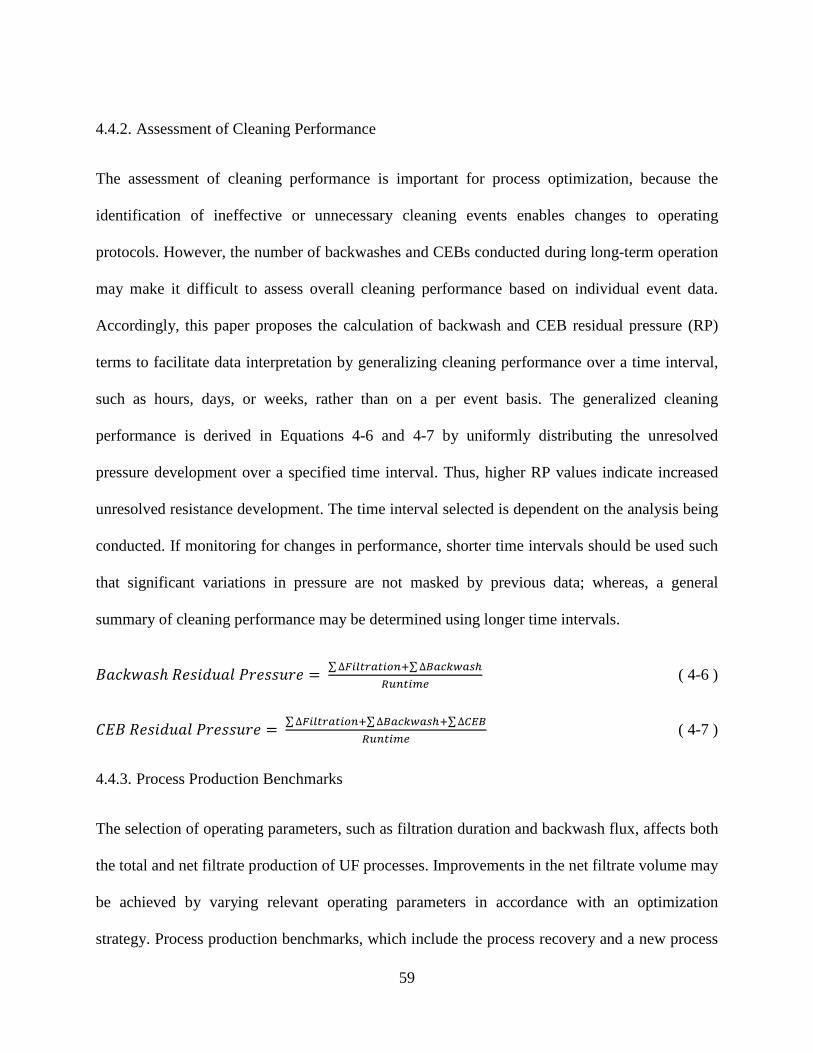
4.4.2. Assessment of Cleaning Performance
The assessment of cleaning performance is important for process optimization, because the
identification of ineffective or unnecessary cleaning events enables changes to operating
protocols. However, the number of backwashes and CEBs conducted during long-term operation
may make it difficult to assess overall cleaning performance based on individual event data.
Accordingly, this paper proposes the calculation of backwash and CEB residual pressure (RP)
terms to facilitate data interpretation by generalizing cleaning performance over a time interval,
such as hours, days, or weeks, rather than on a per event basis. The generalized cleaning
performance is derived in Equations 4-6 and 4-7 by uniformly distributing the unresolved
pressure development over a specified time interval. Thus, higher RP values indicate increased
unresolved resistance development. The time interval selected is dependent on the analysis being
conducted. If monitoring for changes in performance, shorter time intervals should be used such
that significant variations in pressure are not masked by previous data; whereas, a general
summary of cleaning performance may be determined using longer time intervals.
𝐵𝑎𝑐𝑘𝑤𝑎𝑠ℎ 𝑅𝑒𝑠𝑖𝑑𝑢𝑎𝑙 𝑃𝑟𝑒𝑠𝑠𝑢𝑟𝑒 = ∑∆𝐹𝑖𝑙𝑡𝑟𝑎𝑡𝑖𝑜𝑛+∑∆𝐵𝑎𝑐𝑘𝑤𝑎𝑠ℎ𝑅𝑢𝑛𝑡𝑖𝑚𝑒
( 4-6 )
𝐶𝐸𝐵 𝑅𝑒𝑠𝑖𝑑𝑢𝑎𝑙 𝑃𝑟𝑒𝑠𝑠𝑢𝑟𝑒 = ∑∆𝐹𝑖𝑙𝑡𝑟𝑎𝑡𝑖𝑜𝑛+∑∆𝐵𝑎𝑐𝑘𝑤𝑎𝑠ℎ+∑∆𝐶𝐸𝐵𝑅𝑢𝑛𝑡𝑖𝑚𝑒
( 4-7 )
4.4.3. Process Production Benchmarks
The selection of operating parameters, such as filtration duration and backwash flux, affects both
the total and net filtrate production of UF processes. Improvements in the net filtrate volume may
be achieved by varying relevant operating parameters in accordance with an optimization
strategy. Process production benchmarks, which include the process recovery and a new process
59
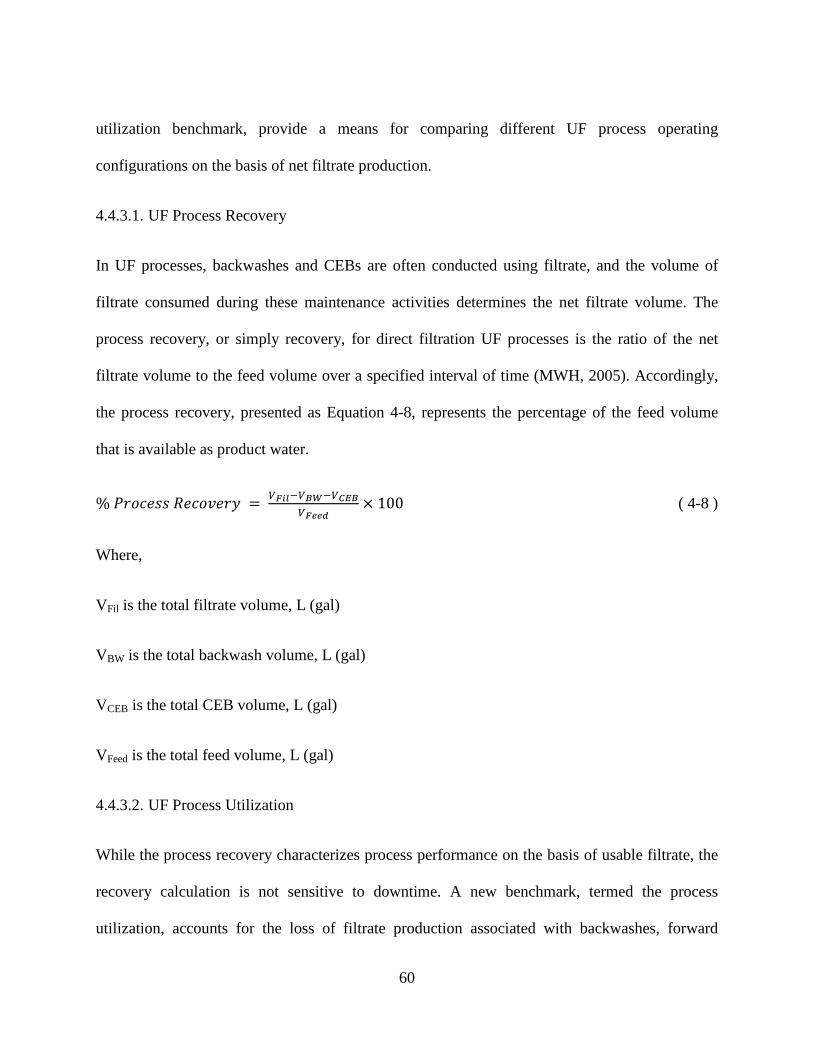
utilization benchmark, provide a means for comparing different UF process operating
configurations on the basis of net filtrate production.
4.4.3.1. UF Process Recovery
In UF processes, backwashes and CEBs are often conducted using filtrate, and the volume of
filtrate consumed during these maintenance activities determines the net filtrate volume. The
process recovery, or simply recovery, for direct filtration UF processes is the ratio of the net
filtrate volume to the feed volume over a specified interval of time (MWH, 2005). Accordingly,
the process recovery, presented as Equation 4-8, represents the percentage of the feed volume
that is available as product water.
% 𝑃𝑟𝑜𝑐𝑒𝑠𝑠 𝑅𝑒𝑐𝑜𝑣𝑒𝑟𝑦 = 𝑉𝐹𝑖𝑙−𝑉𝐵𝑊−𝑉𝐶𝐸𝐵𝑉𝐹𝑒𝑒𝑑
× 100 ( 4-8 )
Where,
VFil is the total filtrate volume, L (gal)
VBW is the total backwash volume, L (gal)
VCEB is the total CEB volume, L (gal)
VFeed is the total feed volume, L (gal)
4.4.3.2. UF Process Utilization
While the process recovery characterizes process performance on the basis of usable filtrate, the
recovery calculation is not sensitive to downtime. A new benchmark, termed the process
utilization, accounts for the loss of filtrate production associated with backwashes, forward
60
flushes, CEBs, valve actuations, and fiber integrity tests. Process utilization values quantify the
extent to which the process approaches ideal performance. As presented in Equation 4-9, the
process utilization is calculated as the ratio of the net filtrate volume to the theoretical maximum
filtrate volume (VFil,MAX) that could be produced assuming constant filtrate production over a
specified time interval.
% 𝑃𝑟𝑜𝑐𝑒𝑠𝑠 𝑈𝑡𝑖𝑙𝑖𝑧𝑎𝑡𝑖𝑜𝑛 = 𝑉𝐹𝑖𝑙−𝑉𝐵𝑊−𝑉𝐶𝐸𝐵𝑉𝐹𝑖𝑙,𝑀𝐴𝑋
× 100 ( 4-9 )
Where,
VFil,MAX is theoretical maximum filtrate volume, L (gal)
4.4.4. Optimization Approach
This study developed and tested a five component systematic UF optimization approach to
improve process recovery and utilization values while maintaining sustainable process operation.
The five component optimization approach is as follows:
1) Develop a test plan to incrementally increase production benchmark values by
systematically varying operating parameters. Optimization test plans should be
realistic for the feed water quality being treated and consider the
recommendations and requirements of the membrane and equipment
manufacturers.
2) Monitor process performance using the TMP balance to check for developments
of physically and chemically unresolved membrane fouling.
61
3) Assess process event performance by using the ΔFiltration, ΔBackwash, and
ΔCEB terms and by calculation of backwash and CEB residual pressure values.
4) Assess the distribution of operating TMP balance values recorded for each
operating configuration.
5) Identify the operating configuration that maximizes process recovery and
utilization while maintaining sustainable process operation.
4.4.5. Lake Manatee UF Optimization Study
4.4.5.1. Optimization Test Plan
The goal of optimization testing was to achieve sustainable UF process performance at a
minimum process recovery of 95% and process utilization of 92%. Typical UF processes operate
at recoveries between 95% and 98% (MWH, 2005). A six-phase test plan, presented in Table 4-
1, was developed to incrementally increase the process recovery at a constant flux of 82.9 L/m2-
hr (48.9 gal/ft2-day). Phase 1 represented the most conservative set of test parameters with a
process recovery of 91.8%, and a significant increase in the recovery was achieved in Phase 2 by
decreasing the duration of the backwash up and backwash down events by 10 seconds each. In
Phase 3, the process recovery was further improved by decreasing the frequency of CEBs from 7
to approximately 3.5 cycles per week. The duration of filtration events was then increased in
Phases 4, 5, and 6 to achieve a process recovery of >95.0% and process utilization of >92%.
4.4.5.2. Feed Water Quality
Feed water quality data for the UF pilot is organized according to optimization test phase in
Table 4-2. TOC, DOC and UV 254 values decreased from December, 2011 to March, 2012;
62
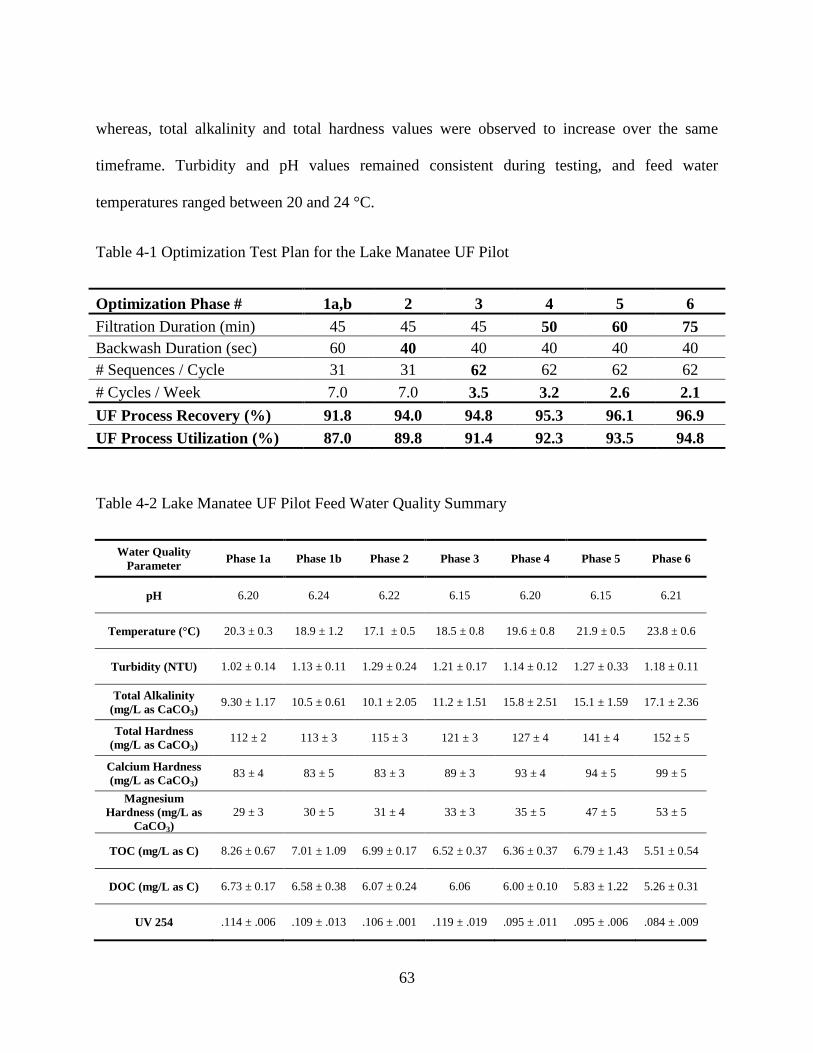
whereas, total alkalinity and total hardness values were observed to increase over the same
timeframe. Turbidity and pH values remained consistent during testing, and feed water
temperatures ranged between 20 and 24 °C.
Table 4-1 Optimization Test Plan for the Lake Manatee UF Pilot
Optimization Phase # 1a,b 2 3 4 5 6 Filtration Duration (min) 45 45 45 50 60 75 Backwash Duration (sec) 60 40 40 40 40 40 # Sequences / Cycle 31 31 62 62 62 62 # Cycles / Week 7.0 7.0 3.5 3.2 2.6 2.1 UF Process Recovery (%) 91.8 94.0 94.8 95.3 96.1 96.9 UF Process Utilization (%) 87.0 89.8 91.4 92.3 93.5 94.8
Table 4-2 Lake Manatee UF Pilot Feed Water Quality Summary
Water Quality Parameter Phase 1a Phase 1b Phase 2 Phase 3 Phase 4 Phase 5 Phase 6
pH 6.20 6.24 6.22 6.15 6.20 6.15 6.21
Temperature (°C) 20.3 ± 0.3 18.9 ± 1.2 17.1 ± 0.5 18.5 ± 0.8 19.6 ± 0.8 21.9 ± 0.5 23.8 ± 0.6
Turbidity (NTU) 1.02 ± 0.14 1.13 ± 0.11 1.29 ± 0.24 1.21 ± 0.17 1.14 ± 0.12 1.27 ± 0.33 1.18 ± 0.11
Total Alkalinity (mg/L as CaCO3)
9.30 ± 1.17 10.5 ± 0.61 10.1 ± 2.05 11.2 ± 1.51 15.8 ± 2.51 15.1 ± 1.59 17.1 ± 2.36
Total Hardness (mg/L as CaCO3)
112 ± 2 113 ± 3 115 ± 3 121 ± 3 127 ± 4 141 ± 4 152 ± 5
Calcium Hardness (mg/L as CaCO3)
83 ± 4 83 ± 5 83 ± 3 89 ± 3 93 ± 4 94 ± 5 99 ± 5
Magnesium Hardness (mg/L as
CaCO3) 29 ± 3 30 ± 5 31 ± 4 33 ± 3 35 ± 5 47 ± 5 53 ± 5
TOC (mg/L as C) 8.26 ± 0.67 7.01 ± 1.09 6.99 ± 0.17 6.52 ± 0.37 6.36 ± 0.37 6.79 ± 1.43 5.51 ± 0.54
DOC (mg/L as C) 6.73 ± 0.17 6.58 ± 0.38 6.07 ± 0.24 6.06 6.00 ± 0.10 5.83 ± 1.22 5.26 ± 0.31
UV 254 .114 ± .006 .109 ± .013 .106 ± .001 .119 ± .019 .095 ± .011 .095 ± .006 .084 ± .009
63

4.4.5.3. Optimization Performance Summary
The performance of UF membrane processes may be monitored using the TMP balance, and
TMP balance values reported after backwash or CEB events quantify the extent of physically or
chemically unresolved pressure development, respectively. Figure 4-1 presents the post-
backwash and post-CEB TMP balance values recorded at the end of each cycle during
optimization testing. The data shows an initial increase in physically and chemically unresolved
pressure development during Phase 1a. The pressure increase was resolved in Phase 1b, and a
gradual increase in the TMP balance was then observed in subsequent test phases as process
benchmark values increased.
Figure 4-1 Post-backwash and Post-CEB TMP Balance Results for the Lake Manatee UF Pilot
64
4.4.5.4. Process Event Evaluation
4.4.5.4.1. Filtration
The magnitude of pressure changes during filtration relates to the quantity and behavior of
accumulated foulant material at the membrane surface. Figure 4-2 presents the distribution of
ΔFiltration values for the UF pilot on a percentage basis. The results indicate that the magnitude
of ΔFiltration measurements increased concurrently with increasing process recovery and
utilization. The lowest ΔFiltration values were observed during Phase 1, and modifications to the
backwash duration and CEB frequency parameters in Phases 2 and 3 increased the percentage of
ΔFiltration values recorded between the pressure range of +0.007 to +0.014 bar (+0.10 to +0.20
psi). In Phases 4 through 6, the percentage of ΔFiltration measurements with values greater than
or equal to +0.014 bar (+0.20 psi) increased as the filtration time was lengthened, and fifty-six
percent of the Phase 6 ΔFiltration data exceeded +0.014 bar (+0.20 psi).
4.4.5.4.2. Backwashes
Backwashes are used to reduce the resistance developed during filtration and typically account
for the majority of UF maintenance water requirements. As such, the optimization of backwash
procedures is critical for increasing UF process recovery. The backwash RP values reported in
Table 4-3 compare UF pilot backwash performance at the different process benchmark values.
The first increase in process recovery was achieved during Phase 2 by decreasing the backwash
duration from 60 to 40 seconds. Shortening the backwash duration increased backwash RP for
Phase 2; however, unanticipated backwash performance improvements were then observed in the
subsequent test phases.
65
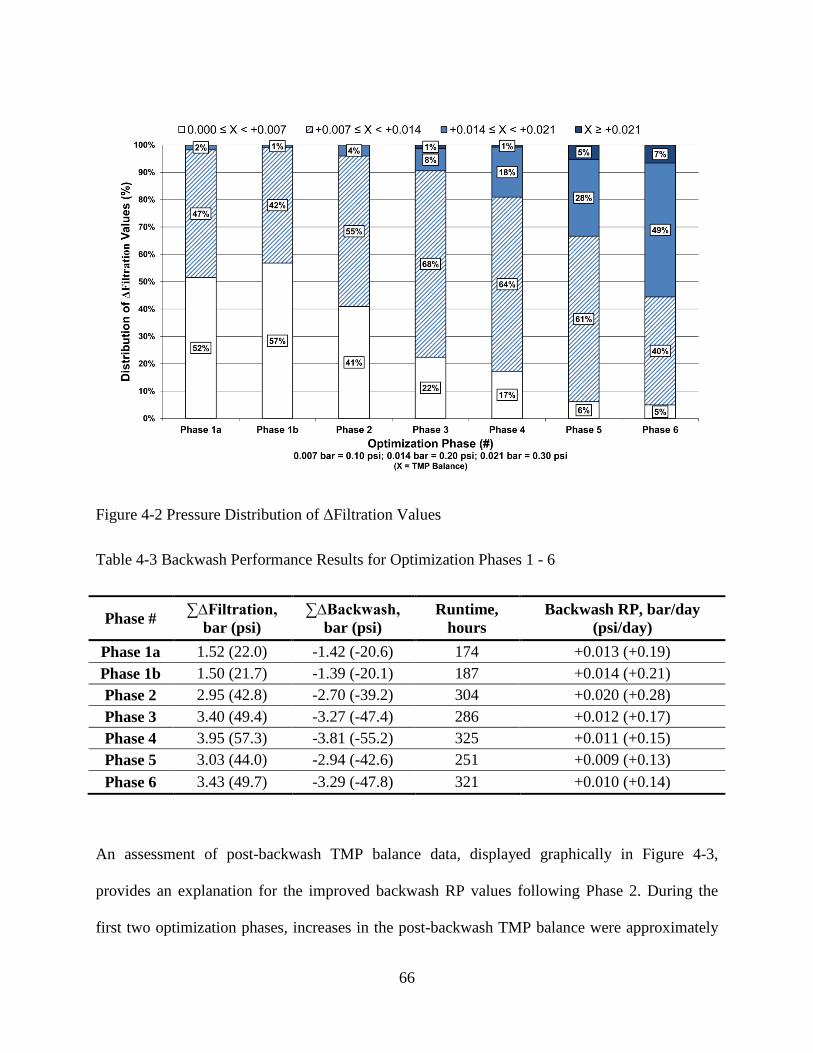
Figure 4-2 Pressure Distribution of ΔFiltration Values
Table 4-3 Backwash Performance Results for Optimization Phases 1 - 6
Phase # ∑∆Filtration, bar (psi)
∑∆Backwash, bar (psi)
Runtime, hours
Backwash RP, bar/day (psi/day)
Phase 1a 1.52 (22.0) -1.42 (-20.6) 174 +0.013 (+0.19) Phase 1b 1.50 (21.7) -1.39 (-20.1) 187 +0.014 (+0.21) Phase 2 2.95 (42.8) -2.70 (-39.2) 304 +0.020 (+0.28) Phase 3 3.40 (49.4) -3.27 (-47.4) 286 +0.012 (+0.17) Phase 4 3.95 (57.3) -3.81 (-55.2) 325 +0.011 (+0.15) Phase 5 3.03 (44.0) -2.94 (-42.6) 251 +0.009 (+0.13) Phase 6 3.43 (49.7) -3.29 (-47.8) 321 +0.010 (+0.14)
An assessment of post-backwash TMP balance data, displayed graphically in Figure 4-3,
provides an explanation for the improved backwash RP values following Phase 2. During the
first two optimization phases, increases in the post-backwash TMP balance were approximately
66
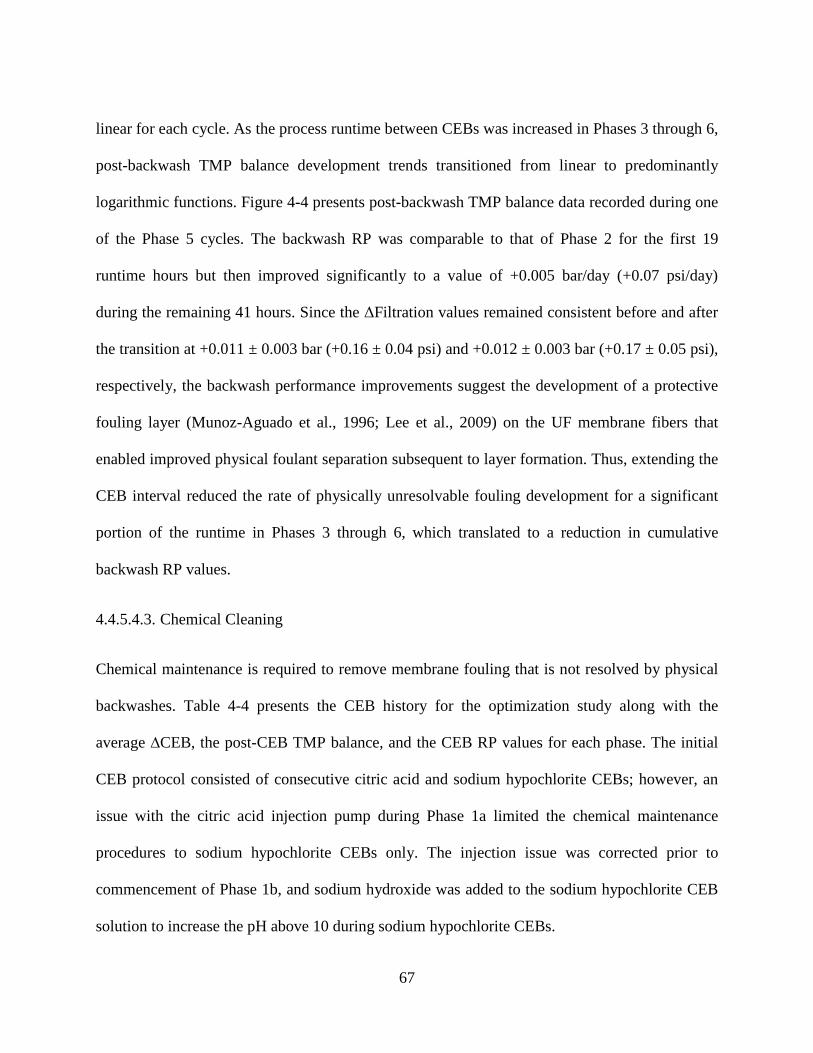
linear for each cycle. As the process runtime between CEBs was increased in Phases 3 through 6,
post-backwash TMP balance development trends transitioned from linear to predominantly
logarithmic functions. Figure 4-4 presents post-backwash TMP balance data recorded during one
of the Phase 5 cycles. The backwash RP was comparable to that of Phase 2 for the first 19
runtime hours but then improved significantly to a value of +0.005 bar/day (+0.07 psi/day)
during the remaining 41 hours. Since the ΔFiltration values remained consistent before and after
the transition at +0.011 ± 0.003 bar (+0.16 ± 0.04 psi) and +0.012 ± 0.003 bar (+0.17 ± 0.05 psi),
respectively, the backwash performance improvements suggest the development of a protective
fouling layer (Munoz-Aguado et al., 1996; Lee et al., 2009) on the UF membrane fibers that
enabled improved physical foulant separation subsequent to layer formation. Thus, extending the
CEB interval reduced the rate of physically unresolvable fouling development for a significant
portion of the runtime in Phases 3 through 6, which translated to a reduction in cumulative
backwash RP values.
4.4.5.4.3. Chemical Cleaning
Chemical maintenance is required to remove membrane fouling that is not resolved by physical
backwashes. Table 4-4 presents the CEB history for the optimization study along with the
average ∆CEB, the post-CEB TMP balance, and the CEB RP values for each phase. The initial
CEB protocol consisted of consecutive citric acid and sodium hypochlorite CEBs; however, an
issue with the citric acid injection pump during Phase 1a limited the chemical maintenance
procedures to sodium hypochlorite CEBs only. The injection issue was corrected prior to
commencement of Phase 1b, and sodium hydroxide was added to the sodium hypochlorite CEB
solution to increase the pH above 10 during sodium hypochlorite CEBs.
67
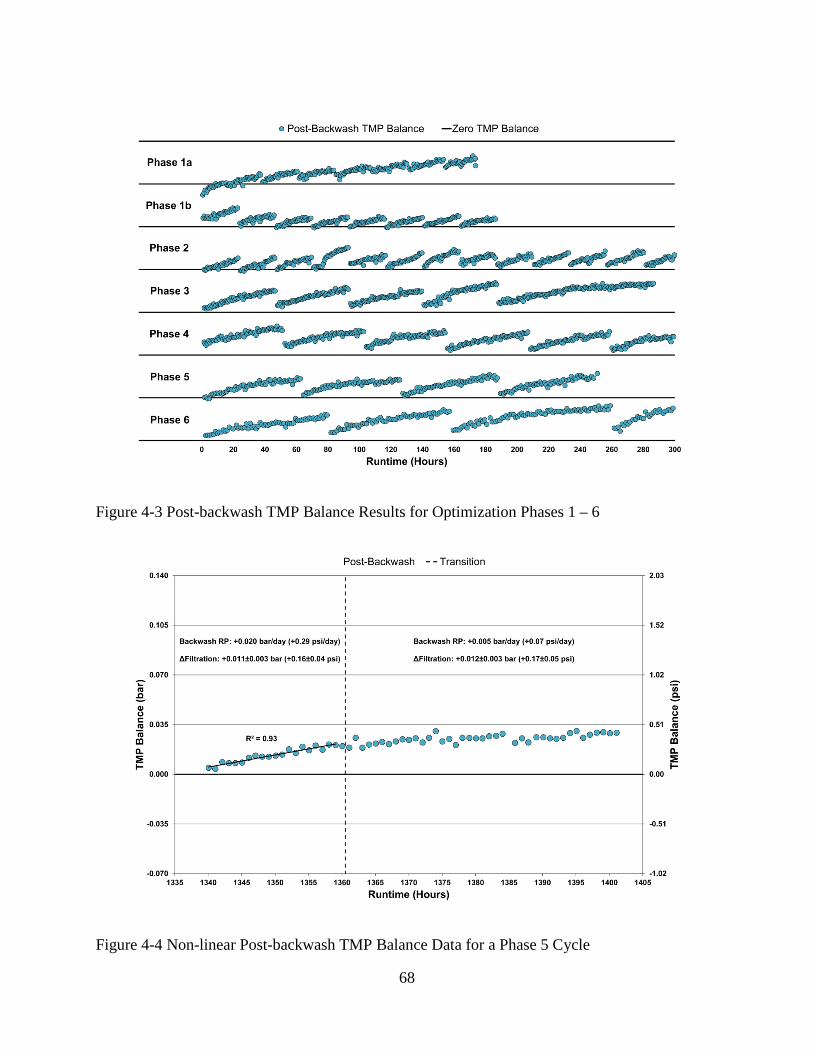
Figure 4-3 Post-backwash TMP Balance Results for Optimization Phases 1 – 6
Figure 4-4 Non-linear Post-backwash TMP Balance Data for a Phase 5 Cycle
68
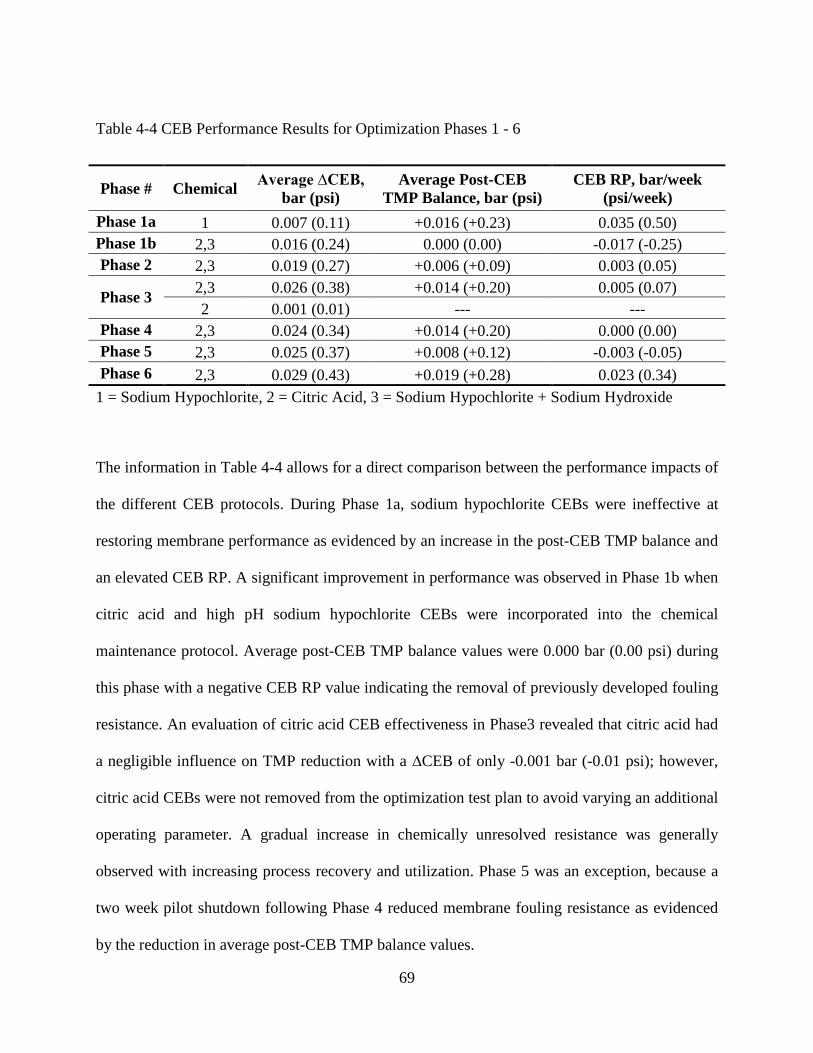
Table 4-4 CEB Performance Results for Optimization Phases 1 - 6
Phase # Chemical Average ∆CEB, bar (psi)
Average Post-CEB TMP Balance, bar (psi)
CEB RP, bar/week (psi/week)
Phase 1a 1 0.007 (0.11) +0.016 (+0.23) 0.035 (0.50) Phase 1b 2,3 0.016 (0.24) 0.000 (0.00) -0.017 (-0.25) Phase 2 2,3 0.019 (0.27) +0.006 (+0.09) 0.003 (0.05)
Phase 3 2,3 0.026 (0.38) +0.014 (+0.20) 0.005 (0.07) 2 0.001 (0.01) --- ---
Phase 4 2,3 0.024 (0.34) +0.014 (+0.20) 0.000 (0.00) Phase 5 2,3 0.025 (0.37) +0.008 (+0.12) -0.003 (-0.05) Phase 6 2,3 0.029 (0.43) +0.019 (+0.28) 0.023 (0.34)
1 = Sodium Hypochlorite, 2 = Citric Acid, 3 = Sodium Hypochlorite + Sodium Hydroxide
The information in Table 4-4 allows for a direct comparison between the performance impacts of
the different CEB protocols. During Phase 1a, sodium hypochlorite CEBs were ineffective at
restoring membrane performance as evidenced by an increase in the post-CEB TMP balance and
an elevated CEB RP. A significant improvement in performance was observed in Phase 1b when
citric acid and high pH sodium hypochlorite CEBs were incorporated into the chemical
maintenance protocol. Average post-CEB TMP balance values were 0.000 bar (0.00 psi) during
this phase with a negative CEB RP value indicating the removal of previously developed fouling
resistance. An evaluation of citric acid CEB effectiveness in Phase3 revealed that citric acid had
a negligible influence on TMP reduction with a ∆CEB of only -0.001 bar (-0.01 psi); however,
citric acid CEBs were not removed from the optimization test plan to avoid varying an additional
operating parameter. A gradual increase in chemically unresolved resistance was generally
observed with increasing process recovery and utilization. Phase 5 was an exception, because a
two week pilot shutdown following Phase 4 reduced membrane fouling resistance as evidenced
by the reduction in average post-CEB TMP balance values.
69
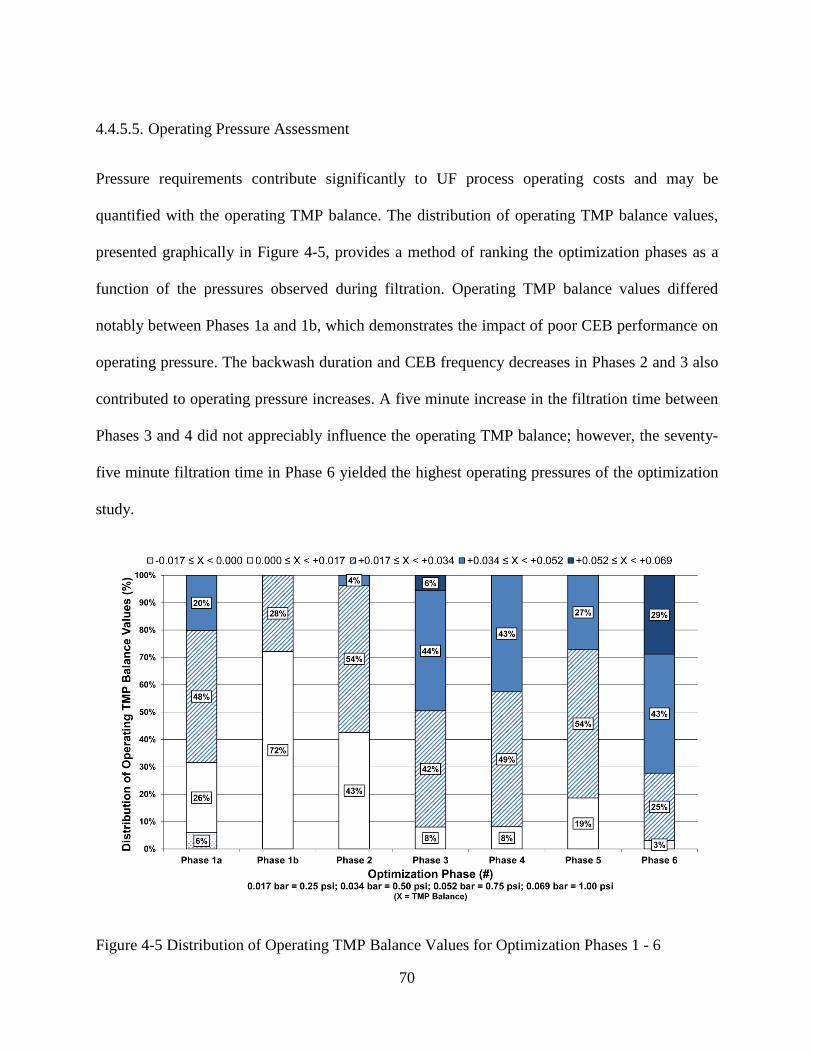
4.4.5.5. Operating Pressure Assessment
Pressure requirements contribute significantly to UF process operating costs and may be
quantified with the operating TMP balance. The distribution of operating TMP balance values,
presented graphically in Figure 4-5, provides a method of ranking the optimization phases as a
function of the pressures observed during filtration. Operating TMP balance values differed
notably between Phases 1a and 1b, which demonstrates the impact of poor CEB performance on
operating pressure. The backwash duration and CEB frequency decreases in Phases 2 and 3 also
contributed to operating pressure increases. A five minute increase in the filtration time between
Phases 3 and 4 did not appreciably influence the operating TMP balance; however, the seventy-
five minute filtration time in Phase 6 yielded the highest operating pressures of the optimization
study.
Figure 4-5 Distribution of Operating TMP Balance Values for Optimization Phases 1 - 6
70
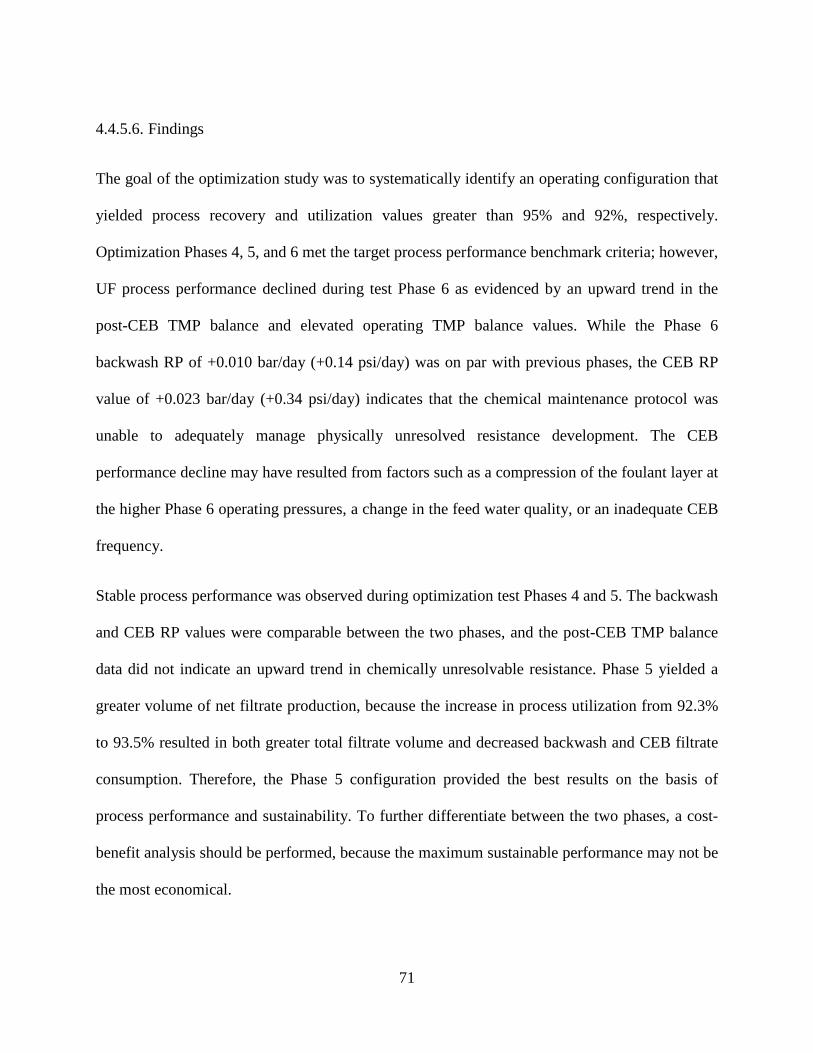
4.4.5.6. Findings
The goal of the optimization study was to systematically identify an operating configuration that
yielded process recovery and utilization values greater than 95% and 92%, respectively.
Optimization Phases 4, 5, and 6 met the target process performance benchmark criteria; however,
UF process performance declined during test Phase 6 as evidenced by an upward trend in the
post-CEB TMP balance and elevated operating TMP balance values. While the Phase 6
backwash RP of +0.010 bar/day (+0.14 psi/day) was on par with previous phases, the CEB RP
value of +0.023 bar/day (+0.34 psi/day) indicates that the chemical maintenance protocol was
unable to adequately manage physically unresolved resistance development. The CEB
performance decline may have resulted from factors such as a compression of the foulant layer at
the higher Phase 6 operating pressures, a change in the feed water quality, or an inadequate CEB
frequency.
Stable process performance was observed during optimization test Phases 4 and 5. The backwash
and CEB RP values were comparable between the two phases, and the post-CEB TMP balance
data did not indicate an upward trend in chemically unresolvable resistance. Phase 5 yielded a
greater volume of net filtrate production, because the increase in process utilization from 92.3%
to 93.5% resulted in both greater total filtrate volume and decreased backwash and CEB filtrate
consumption. Therefore, the Phase 5 configuration provided the best results on the basis of
process performance and sustainability. To further differentiate between the two phases, a cost-
benefit analysis should be performed, because the maximum sustainable performance may not be
the most economical.
71
4.5. Conclusions
In surface water treatment, the feed water source for UF membranes is variable and subject to
both seasonal changes in source water quality and the performance of pretreatment processes.
Accordingly, operating protocols for UF processes should be dynamic to maintain production
targets while minimizing the occurrence of unnecessary maintenance activities. The five
component optimization approach provides tools for identifying UF process operating
configurations that achieve sustainable performance and improve process output. Optimization
of an UF pilot with conventional alum coagulation pretreatment yielded sustainable process
operation at process recovery and utilization values of 96.1% and 93.5%, respectively. This
study also demonstrated the following:
• Backwash and CEB residual pressure calculations successfully identified changes
in physical and chemical maintenance performance.
• A protective fouling layer effect was observed following extension of the CEB
interval. The corresponding improvements in backwash effectiveness were
accompanied by higher operating pressures.
• Post-CEB TMP balance values (i.e. chemically unresolved membrane fouling)
generally increased with increasing process recovery and utilization.
4.6. Recommendations
A cost-benefit analysis using local energy costs, chemical costs, and water rates is recommended
to further differentiate between operating parameter configurations, because the increased
operating pressures at higher process recovery and utilization values may offset the revenue
72
generated by increased water production. However, other factors, such as the benefits of
minimizing chemical waste management requirements and reducing source water consumption
should also be considered. Cleaning chemical optimization studies are recommended to
minimize both the number and concentration of chemicals used during CEB events, as citric acid
CEBs may have been unnecessary in this study. The impact of CEB chemical selection on other
treatment processes should also be considered, as citric acid chemical waste streams are known
to interfere with conventional surface water coagulation during backwash water recycle (Boyd et
al., 2012b).
4.7. Acknowledgments
The research reported herein was funded by UCF project agreement 16208085. Thanks are in
order for the companies and municipalities involved in the acquisition, maintenance, and support
activities associated with the ultrafiltration pilot test. The contributions of Harn R/O Systems,
Inc. (Venice, FL), Horizon Industries, Inc. (Las Vegas, NV), Toyobo Co., Ltd. (Osaka, Japan),
and Bruce MacLeod, Mark Simpson, Katherine Gilmore, Bill Kuederle, and others of the
Manatee County Utilities Department (Bradenton, FL) are duly recognized and greatly
appreciated. Additional thanks are offered to Jayapregasham Tharamapalan for his dedicated
assistance with pilot testing activities.
73
4.8. References
Alventosa-deLara, E., Barredo-Damas, S., Alcaina-Miranda, M.I., & Iborra-Clar, M.I. (2012).
Ultrafiltration technology with a ceramic membrane for reactive dye removal: Optimization of
membrane performance. Journal of Hazardous Materials, 209-210, 492-500.
Bacchin, P., Aimar, P., & Field, R.W. (2006). Critical and sustainable fluxes: Theory,
experiments and applications. Journal of Membrane Science, 281, 42-69.
Boyd, C.C., & Duranceau, S.J. (2012a). Assessing and maintaining membrane performance in a
post-sedimentation ultrafiltration process. Water Practice & Technology, 7(2). doi:
10.2166/wpt.2012.041
Boyd, C.C., Duranceau, S.J., & Tharamapalan, J. (2012b). Impact of carboxylic acid
ultrafiltration recycle streams on coagulation. Journal of Water Supply: Research and
Technology – AQUA, 61(5), 306-318.
Campinas, M., & Rosa, M. J. (2010). Assessing PAC Contribution to the NOM fouling control in
PAC/UF Systems. Water Research, 44, 1636-1644.
Chen, J.P., Kim, S.L., & Ting., Y.P. (2003). Optimization of membrane physical and chemical
cleaning by a statistically designed approach. Journal of Membrane Science, 219, 27-45.
Decarolis, J., Hong, S., & Taylor, J. (2001). Fouling behavior of a pilot scale inside-out hollow
fiber UF membrane during dead-end filtration of tertiary wastewater. Journal of Membrane
Science, 191, 165-178.
74
Field, R.W., Wu, D., Howell, J.A., & Gupta, B.B. (1995). Critical flux concept for
microfiltration fouling. Journal of Membrane Science, 100, 259-272.
Figueroa, R.A.R., Cassano, A., & Drioli, E. (2011). Ultrafiltration of orange press liquor:
Optimization for permeate flux and fouling index by response surface methodology. Separation
and Purification Technology, 80, 1-10.
Gao, W., Liang, H., Ma, J., Han, M., Han, Z., & Li, G. (2011). Membrane fouling control in
ultrafiltration technology for drinking water treatment production: A review. Desalination, 272,
1-8.
Haberkamp, J., Ernst, M., Böckelmann, U., Szewzyk, U., & Jekel, M. (2008). Complexity of
ultrafiltration membrane fouling caused by macromolecular dissolved organic compounds in
secondary effluents. Water Research, 42, 3153-3161.
Howe, K.J., & Clark, M.M. (2006). Effect of coagulation pretreatment on membrane filtration
performance. Journal of the American Water Works Association, 98(4), 133-146.
Howell, J.A. (1995). Sub-critical flux operation of microfiltration. Journal of Membrane Science,
107, 165-171.
Huang, H., Schwab, K., & Jacangelo, J.G. (2009). Pretreatment for low pressure membranes in
water treatment: a review. Environmental Science & Technology, 43(9), 3011-3019.
Jang, N.-Y., Watanabe, Y., & Minegishi, S. (2005). Performance of ultrafiltration membrane
process combined with coagulation/sedimentation. Water Science & Technology, 51(6-7), 209-
219.
75
Katsoufidou, K., Yiantsios, S.G., & Karabelas, A.J. (2008). An experimental study of UF
membrane fouling by humic acid and sodium alginate solutions: The effect of backwashing on
flux recovery. Desalination, 220, 214-227.
Kim, J., & DiGiano, F.A. (2006). A two-fiber, bench-scale test of ultrafiltration (UF) for
investigation of fouling rate and characteristics. Journal of Membrane Science, 271, 196-204.
Kwon, B., Park, N., & Cho, J. (2005). Effect of algae on fouling and efficiency of UF
membranes. Desalination, 179, 203-214.
Lee, B.-B., Choo, K.-H., Chang, D., & Choi, S.-J. (2009). Optimizing the coagulant dose to
control membrane fouling in combined coagulation/ultrafiltration systems for textile wastewater
reclamation. Chemical Engineering Journal, 155, 101-107.
Lee, N., Amy, G., Croué, J.-P., & Buisson, H. (2004). Identification and understanding of
fouling in low-pressure membrane (MF/UF) filtration by natural organic matter (NOM). Water
Research, 38, 4511-4523.
Liu, C., Caothien, S., Hayes, J., Caothuy, T., Otoyo, T., & Ogawa, T. (2006). Membrane
chemical cleaning: From art to science. (Pall Corporation). Retrieved from
http://www.pall.com/pdfs/Water-Treatment/mtcpaper.pdf
Muñoz-Aguado, M.J., Wiley, D.E., & Fane, A.G. (1996). Enzymatic and detergent cleaning of a
polysulfone ultrafiltration membrane fouled with BSA and whey. Journal of Membrane Science,
117, 175-187.
76
MWH. (2005). Water treatment: Principles and design (2nd ed.). In J.C. Crittenden, R.R.
Trussell, D.W. Hand, K.J. Howe, & G. Tchobanoglous (Eds.). Hoboken, NJ: John Wiley & Sons.
Ouyang, Y., Nkedi-Kizza, P., Wu, Q.T., Shinde, D., & Huang, C.H. (2006). Assessment of
seasonal variations in surface water quality. Water Research, 40, 3800-3810.
Porcelli, N., & Judd, S. (2010). Chemical cleaning of potable water membranes: A review.
Separation and Purification Technology, 71, 137-143.
Remize, P.J., Guigui, C., & Cabassud, C. (2010). Evaluation of backwash efficiency, definition
of remaining fouling and characterization of its contribution in irreversible fouling: Case of
drinking water production by air-assisted ultra-filtration. Journal of Membrane Science, 355,
104-111.
Shannon, M.A., Bohn, P.W., Elimelech, M., Georgiadis, J.G., Mariñas, B.J., & Mayes, A.M.
(2008). Science and technology for water purification in the coming decades. Nature, 452, 301-
310.
Smith, P.J., Vigneswaran, S., Ngo, H.H., Ben-Aim, R., & Nguyen, H. (2006) A new approach to
backwash initiation in membrane systems. Journal of Membrane Science, 278, 381-389.
Strugholtz, S., Sundaramoorthy, K., Panglisch, S., Lerch, A., Brügger, A., & Gimbel, R. (2005).
Evaluation of the performance of different chemicals for cleaning capillary membranes.
Desalination, 179, 191-202.
77
White, M.C., & Kosterman, M.J. (2010). Enhancing efficiency of full-scale ultrafiltration
membrane treatment for increased capacity and lower operating costs. Water Practice &
Technology, 5(4). doi: 10.2166/WPT.2010.086
Wu, D., Howell, J.A., & Field, R.W. (1999). Critical flux measurement for model colloids.
Journal of Membrane Science, 152, 89-98.
Xu, J., & Gao, C. (2010). Study of critical flux in ultrafiltration of seawater: New measurement
and sub- and super-critical flux operations. Chemical Engineering Journal, 165, 102-110.
Ye, Y., Sim, L.N., Herulah, B., Chen, V., & Fane, A.G. (2010). Effects of operating conditions
on submerged hollow fibre membrane systems used as pre-treatment for seawater reverse
osmosis. Journal of Membrane Science, 365, 78-88.
Yuan, W., & Zydney, A.L. (2000). Humic acid fouling during ultrafiltration. Environmental
Science & Technology, 34 (23), 5043-5050.
Zondervan, E., & Roffel, B. (2007). Evaluation of different cleaning agents used for cleaning
ultra filtration membranes fouled by surface water. Journal of Membrane Science, 304, 40-49.
Zularisam, A.W., Ismail, A.F., Salim, M.R., Sakinah, M., & Matsuura, T. (2009). Application of
coagulation-ultrafiltration hybrid process for drinking water treatment: Optimization of operating
conditions using experimental design. Separation and Purification Technology, 65, 193-210.
78
CHAPTER 5. SILICON DIOXIDE AS A SUPPORT LAYER FOR POWDERED ACTIVATED CARBON IN THE PRE-COATING
ENHANCEMENT OF ULTRAFILTRATION MEMBRANES
5.1. Abstract
In this study, silicon dioxide (SiO2) and powdered activated carbon (PAC), with particle
diameters of ≤ 45 µm, are evaluated as pre-coating materials for the filtration of an undiluted,
organic surface water. The applicability of the transmembrane pressure (TMP) balance approach
for the analysis of pre-coated membrane performance is also demonstrated. Utilization of the
TMP balance enables the direct comparison of uncoated and pre-coated membranes on the basis
of membrane fouling. Pressure changes for SiO2 pre-coated membranes exceeded an uncoated
control membrane by greater than a factor of three after 100 L/m2 of specific filtrate production;
however, the SiO2 pre-coat was effectively separated from the membrane during backwashing.
PAC provided effective organic carbon removal and reduced membrane fouling initially, but
ineffective separation of pre-coated PAC during backwashing resulted in the consistent
development of physically unresolved membrane fouling. To address performance issues
associated with individual SiO2 and PAC pre-coatings, this study demonstrates the first use of
SiO2 as a support layer for PAC in a membrane pre-coating application. The combined SiO2-
PAC pre-coating successfully reduced physically unresolved membrane fouling and enhanced
UF membrane organics removal capabilities.
Key Words: Silicon Dioxide, Powdered Activated Carbon, Ultrafiltration, Enhancement, Pre-
coat, Pre-deposit, Layer
79
5.2. Introduction
The concept of pre-coating ultrafiltration (UF) membranes with removable media provides
intriguing prospects for reducing fouling and enhancing membrane contaminant removal
capabilities. To date, several researchers have investigated the pre-coating of UF membranes for
drinking water treatment. Galjaard et al. (2001a) discuss a process for depositing solids on
membrane filters called Enhanced Pre-Coat Engineering (EPCE®), and Cai and Benjamin (2011)
refer to a similar pre-coating process as microgranular adsorptive filtration (µGAF). In these
membrane pre-coating process schemes, a thin layer of solids is intentionally deposited onto UF
membrane surfaces prior to filtration. Depending on the media, pre-coating UF membranes may
significantly increase runtimes (Kim et al., 2010), improve backwash effectiveness (Galjaard et
al., 2001b), and decrease permeability loss (Galjaard et al, 2003).
A variety of pre-coating materials have been tested to varying degrees as individual coatings,
including silicon dioxide (SiO2) and powdered activated carbon (PAC). The implementation of
SiO2 membrane pre-coating has faced significant challenges. Published research has reported
accelerated fouling rates for SiO2 pre-coated membranes (Galjaard et al., 2001; Kim et al., 2008),
and the hydrophilicity and negative surface charge of SiO2 particles (Yang et al., 2009) limits the
applicability of SiO2 as an adsorbent for natural organic matter (NOM). Adsorption experiments
with SiO2 have confirmed poor NOM removal capacity (Chen et al., 2006; Bui & Choi, 2010).
Increased fouling rates and negligible NOM removal have rendered SiO2 as a less attractive pre-
coating material in comparison to an adsorbent such as PAC; however, additional research is
warranted for SiO2, because its intrinsic properties suggest alternative pre-coating applications.
80
The integration of PAC with UF membranes combines the adsorption capabilities of PAC with
the solids separation provided by UF membranes. While PAC-UF systems have been extensively
studied in the past, previous applications have involved the use of PAC pretreatment via reactors
or direct feed water injection rather than membrane pre-coating. A number of studies have
reported improved UF membrane performance as the result of PAC addition (Jack & Clark,
1998; Mozia et al., 2005; Kim et al., 2007a; Lee et al., 2007; Smith & Vigneswaran 2009;
Campinas & Rosa, 2010; and Hu et al., 2010); however, the integration of PAC can also reduce
the performance of UF processes and enhance membrane fouling (Lin et al., 1999; Lin et al.,
2000; Lin et al., 2001; Zhang et al., 2003; Li and Chen, 2004; Zhao et al., 2005). From the
perspective of membrane pre-coating, PAC was demonstrated to decrease fouling rates relative
to an uncoated membrane and result in significant natural organic matter (NOM) removal (Kim
et al., 2008). However, the development of physically irreversible fouling is also a documented
issue (Galjaard et al., 2001b).
The goal of the present research study is to identify a new method for enhancing UF contaminant
removal capabilities while protecting the membrane from irreversible fouling. Accordingly, a
new application of SiO2 is proposed in which SiO2 serves as a support layer for PAC. This paper
presents an evaluation of membrane performance with individual SiO2, PAC, and combined
SiO2-PAC pre-coating layers. Process data is assessed using the transmembrane pressure (TMP)
balance approach (refer to Chapter 3), and the applicability of the TMP balance approach for
analyzing pre-coated membrane processes is discussed.
81
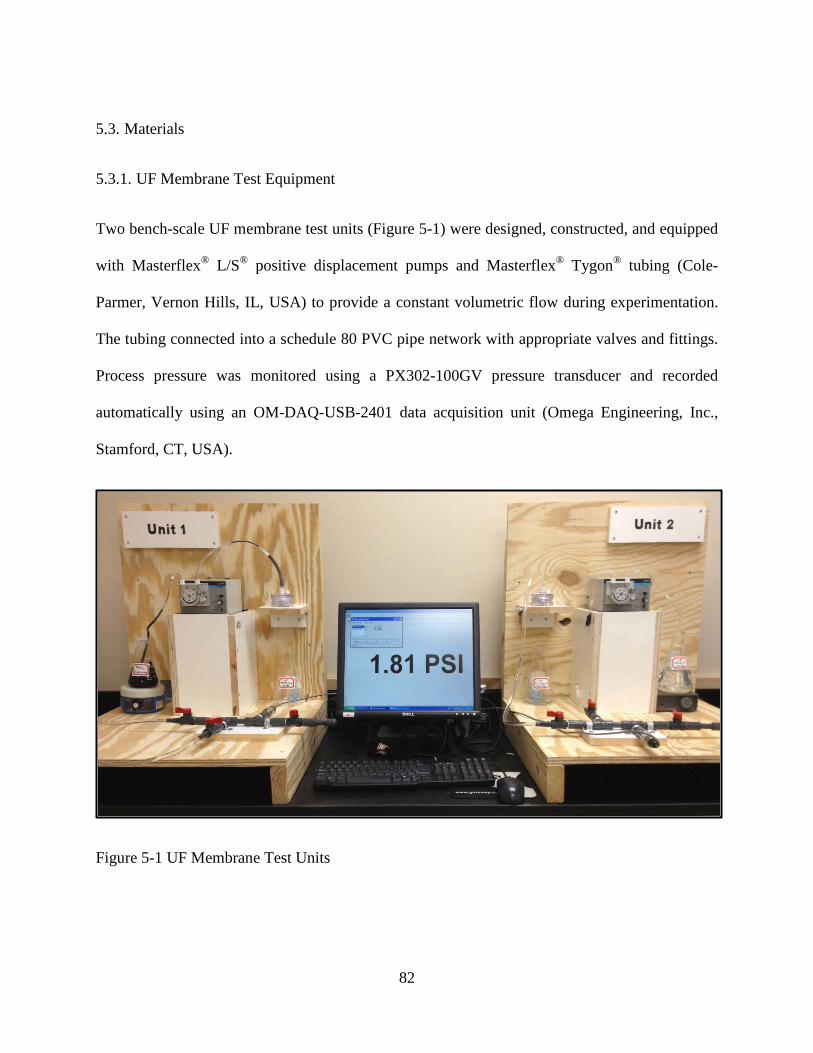
5.3. Materials
5.3.1. UF Membrane Test Equipment
Two bench-scale UF membrane test units (Figure 5-1) were designed, constructed, and equipped
with Masterflex® L/S® positive displacement pumps and Masterflex® Tygon® tubing (Cole-
Parmer, Vernon Hills, IL, USA) to provide a constant volumetric flow during experimentation.
The tubing connected into a schedule 80 PVC pipe network with appropriate valves and fittings.
Process pressure was monitored using a PX302-100GV pressure transducer and recorded
automatically using an OM-DAQ-USB-2401 data acquisition unit (Omega Engineering, Inc.,
Stamford, CT, USA).
Figure 5-1 UF Membrane Test Units
82

5.3.2. UF Membrane
Hydrophilic polyethersulfone (PES) Nadir® UP 150 ultrafiltration membranes (Microdyn-Nadir
GmbH, Wiesbaden, Germany) with a molecular weight cutoff of 150,000 daltons (pore size of ≈
0.04 µm) were selected for testing.
5.3.3. UF Membrane Pre-Coating Materials
5.3.3.1. SiO2
SiO2 experiments were conducted with 100% by weight crystalline SiO2 (Spectrum Chemical
Manufacturing Corp., New Brunswick, NJ, USA) with a nominal particle diameter of 0.45 µm
(325 mesh).
5.3.3.2. PAC
PAC experiments were conducted with Aqua Nuchar (MeadWestvaco Specialty Chemicals,
North Charleston, SC, USA). Londono (2011) demonstrated that Aqua Nuchar remains intact
under turbulent conditions, and a PAC that maintains integrity during pre-coating was desired to
minimize particle size distribution variability during testing. The PAC was sieved to provide a
particle size distribution of ≤ 0.45 µm (325 mesh).
5.3.4. Surface Water
Surface water was collected from Lake Claire located on the University of Central Florida
(Orlando, FL, USA) campus and pre-filtered using glass-fiber filters for the removal of large
diameter particles and debris. The pre-filtered Lake Claire samples were stored within amber
83
glass bottles in a dark cooler at 4 °C and allowed to reach ambient temperature prior to use.
Table 5-1 presents a water quality summary for the pre-filtered Lake Claire surface water.
Table 5-1 Water Quality Data: Pre-filtered Lake Claire Surface Water
pH Temperature Turbidity Alkalinity Total Hardness Organic Carbon UV 254
--- °C NTU mg/L as CaCO3 mg/L as CaCO3 mg/L as C cm-1
7.74 21.0 0.25 39.2 49.1 13.2 0.432
5.4. Methods
5.4.1. UF Membrane Preparation
UF membranes were cut into 47 mm diameter disks from flat sheets, rinsed with distilled water,
and soaked in distilled water for a minimum of 12 hours prior to use.
5.4.2. UF Membrane Pre-coating Procedure
Separate suspensions of SiO2 and PAC were prepared within a fume hood by adding a measured
weight of material to distilled water to achieve a target concentration. The SiO2 and PAC
suspensions were continuously mixed during application to the membrane surface. Pre-coating
occurred at a constant flow rate for a set time interval to achieve target mass loadings of
approximately 80 and 160 g/m2 of membrane surface area. Following pre-coating, distilled water
was pumped through the membrane at a flux of 100 L/m2-hr (58.9 gal/ft2-day) for a minimum of
15 minutes to compact the pre-coated material prior to lake water filtration.
84
5.4.3. UF Test Procedure
Baseline pressure data was established with distilled water prior to lake water filtration. An
Erlenmeyer flask containing undiluted Lake Claire water served as a feed reservoir. Feed water
temperatures were recorded periodically. Experiments were conducted at a target flux of 100
L/m2-hr (58.9 gal/ft2-day), and flows were monitored using a calibration column and stopwatch.
Backwashes were initiated at pre-determined specific filtrate volume intervals, where the specific
filtrate volume is the volume of water produced per unit of membrane surface area. The
backwash procedure consisted of an initial distilled water rinse followed by a five minute
backwash using distilled water at a flux rate of 200 L/m2-hr (117.8 gal/ft2-day). After
backwashing, unresolved membrane fouling was assessed by filtering distilled water for a
minimum of 15 minutes and recording the pressure when stable.
5.4.4. Organic Carbon Analysis
Composite filtrate samples were collected in specific filtrate volume increments of 15 L/m2 and
diluted with distilled water. Organic carbon concentrations were determined by the persulfate-
ultraviolet oxidation method using a Fusion Total Organic Carbon Analyzer™ (Teledyne
Tekmar, Mason, OH, USA). Laboratory quality control measures were conducted in accordance
with the Standard Methods for the Examination of Water and Wastewater (American Public
Health Association et al., 2005).
5.4.5. UF Performance Assessment Method: TMP Balance Approach
UF pilot performance was monitored using the TMP balance approach that identifies changes to
membrane fouling resistance and intrinsic membrane resistance based on variations in
85
temperature corrected TMP (TCTMP) relative to a reference pressure. The reference pressure is
selected according to the application and may be either that of a new process at steady state, a
chemically cleaned process, or a process operating at a level of acceptable performance. A
generic temperature correction factor (TCF) for normalizing TMP values to 20 °C is presented in
Equation 5-1, and Equation 5-2 presents a simplified version of the TMP balance calculation. In
Equation 5-2, TCTMP measurements are chronologically organized into sequences (J); where an
operating sequence consists of consecutive filtration and backwash events. The ΔReference term,
defined mathematically in Equation 5-3, adjusts the first TCTMP value in a data set to the TMP
balance by subtracting the reference pressure.
𝑇𝑒𝑚𝑝𝑒𝑟𝑎𝑡𝑢𝑟𝑒 𝐶𝑜𝑟𝑟𝑒𝑐𝑡𝑖𝑜𝑛 𝐹𝑎𝑐𝑡𝑜𝑟 = 1.002 𝑐𝑒𝑛𝑡𝑖𝑝𝑜𝑖𝑠𝑒1.777−0.052𝑇+6.25×10⁻⁴𝑇2
( 5-1 )
Where,
T = actual water temperature, °C
𝑇𝑀𝑃 𝐵𝑎𝑙𝑎𝑛𝑐𝑒𝑖𝑗 = ∆𝑅𝑒𝑓𝑒𝑟𝑒𝑛𝑐𝑒 + �∑ ∑ (𝑛𝑗𝑖=1 𝑇𝐶𝑇𝑀𝑃𝑖+1,𝑗 − 𝑇𝐶𝑇𝑀𝑃𝑖𝑗)𝐽
𝑗=1 � ( 5-2 )
∆𝑅𝑒𝑓𝑒𝑟𝑒𝑛𝑐𝑒 = 𝑇𝐶𝑇𝑀𝑃𝑖𝑗 − 𝑇𝐶𝑇𝑀𝑃𝑅𝑒𝑓𝑒𝑟𝑒𝑛𝑐𝑒 ( 5-3 )
The magnitude of the TMP balance quantifies the resistance change in units of pressure, and the
sign denotes position relative to a zero TMP balance. TMP balance values greater than zero
indicate an increase in the resistance to flow, and negative TMP balance values indicate a
decreased resistance. TMP balance values may be used to distinguish between different types of
fouling. For instance, operating TMP balance values, calculated during filtration events, quantify
the pressures required to produce filtrate, and post-backwash TMP balance values indicate the
pressure contribution of physically unresolved resistance.
86

5.5. Results and Discussion
5.5.1. Implementation of the TMP Balance for Pre-Coating Evaluations
The TMP balance isolates the pressure contribution of membrane foulants and physical changes
to the membrane material by accounting for the intrinsic resistance of the membrane (RM).
Particle deposition during membrane pre-coating adds an additional layer of resistance to flow,
referred to in this study as the intrinsic pre-coat resistance (RPC). Figure 5-2 presents a graphical
depiction of a pre-coated membrane with the intrinsic resistance factors shown. At a given flux,
the membrane and the pre-coating media offer a resistance to flow that translates into a TMP
value. A modified form of the resistance-in-series model, as presented in Equation 5-4, shows
that the total intrinsic pressure resistance (TMPM-PC) is determined by the summation of the
intrinsic pressure resistances of the membrane (TMPM) and the pre-coat (TMPPC). For pre-coated
membranes, the value of TMPM-PC is used as the reference pressure in Equation 5-3 for adjusting
pressure data to the zero TMP balance baseline. When the intrinsic pressure resistances for
different pre-coating media and masses are quantified, the TMP balance enables different pre-
coating combinations to be directly compared on the basis of fouling relative to the same zero
TMP balance reference.
𝑇𝑀𝑃𝑀−𝑃𝐶 = 𝐽𝜇(𝑅𝑀) + 𝐽𝜇(𝑅𝑃𝐶) = 𝑇𝑀𝑃𝑀 + 𝑇𝑀𝑃𝑃𝐶 ( 5-4 )
Where,
J is the volumetric flux, L/m2-hr (gal/ft2-day)
µ is the absolute viscosity, cp (lb/ft-s)
87
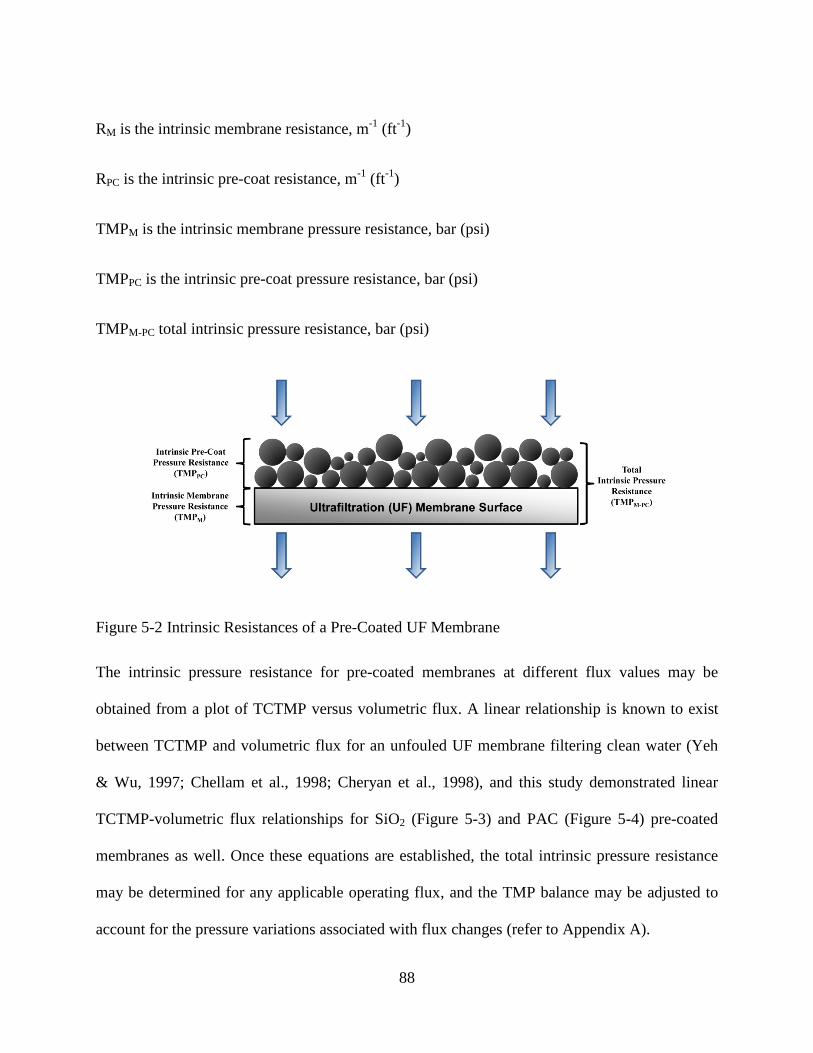
RM is the intrinsic membrane resistance, m-1 (ft-1)
RPC is the intrinsic pre-coat resistance, m-1 (ft-1)
TMPM is the intrinsic membrane pressure resistance, bar (psi)
TMPPC is the intrinsic pre-coat pressure resistance, bar (psi)
TMPM-PC total intrinsic pressure resistance, bar (psi)
Figure 5-2 Intrinsic Resistances of a Pre-Coated UF Membrane
The intrinsic pressure resistance for pre-coated membranes at different flux values may be
obtained from a plot of TCTMP versus volumetric flux. A linear relationship is known to exist
between TCTMP and volumetric flux for an unfouled UF membrane filtering clean water (Yeh
& Wu, 1997; Chellam et al., 1998; Cheryan et al., 1998), and this study demonstrated linear
TCTMP-volumetric flux relationships for SiO2 (Figure 5-3) and PAC (Figure 5-4) pre-coated
membranes as well. Once these equations are established, the total intrinsic pressure resistance
may be determined for any applicable operating flux, and the TMP balance may be adjusted to
account for the pressure variations associated with flux changes (refer to Appendix A).
88
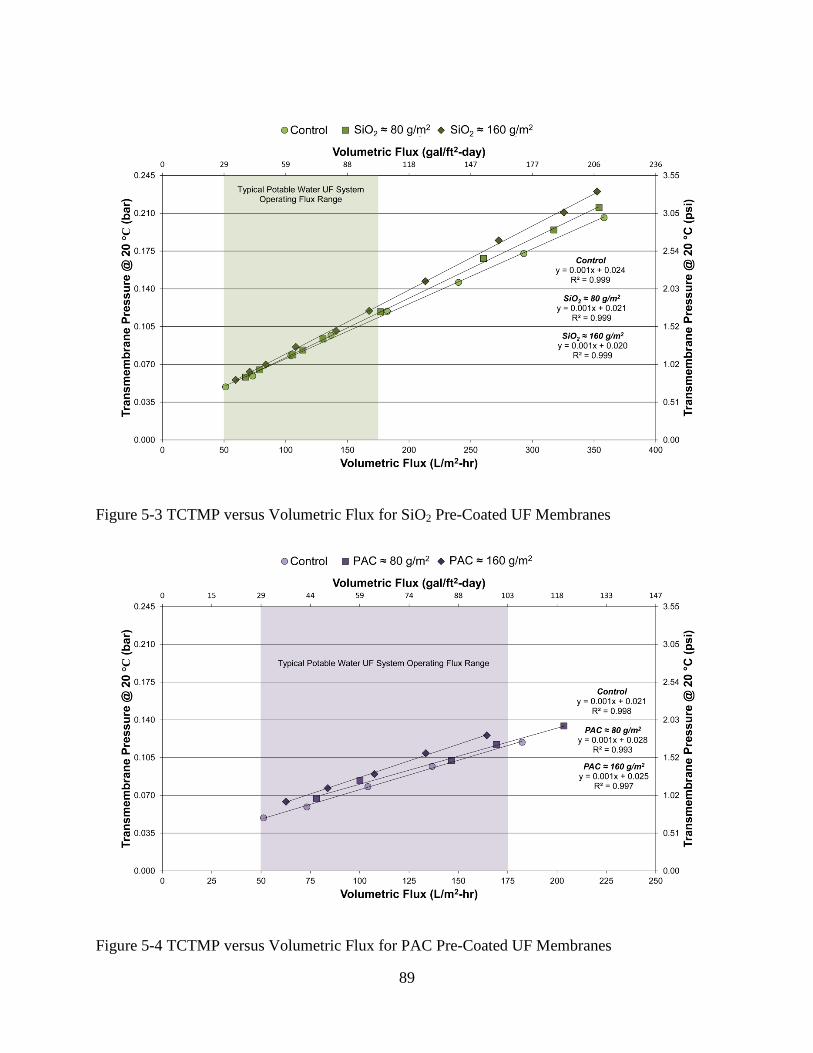
Figure 5-3 TCTMP versus Volumetric Flux for SiO2 Pre-Coated UF Membranes
Figure 5-4 TCTMP versus Volumetric Flux for PAC Pre-Coated UF Membranes
89
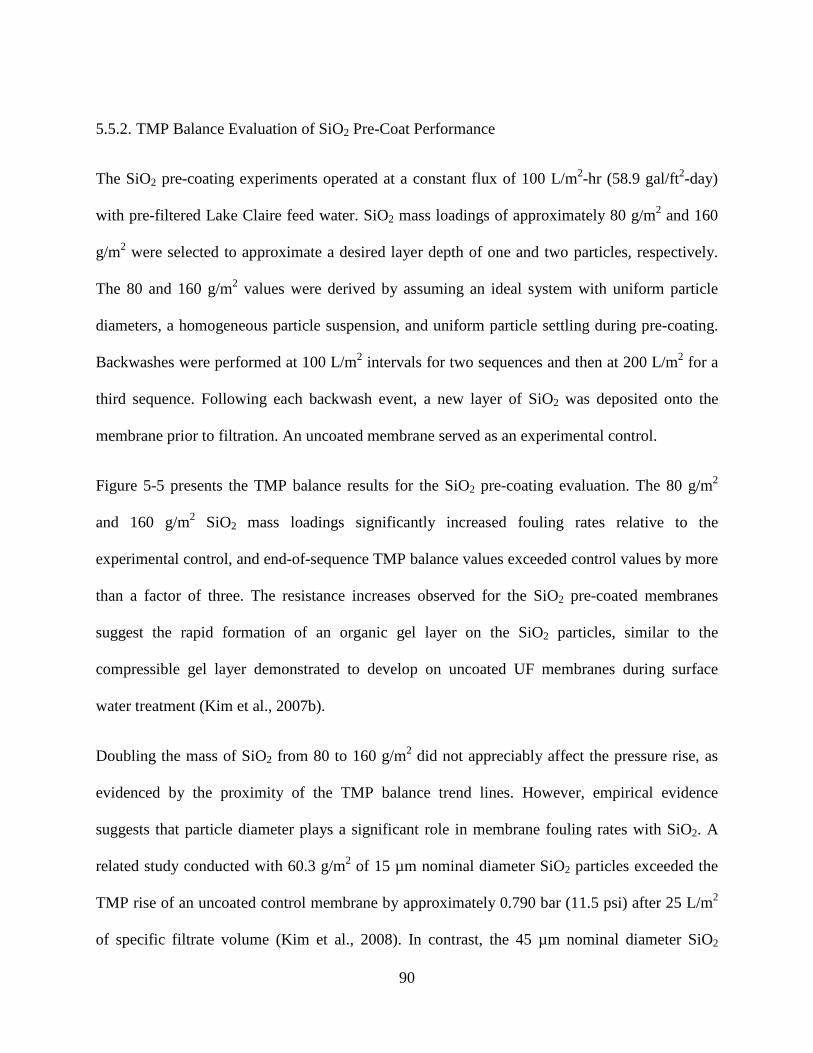
5.5.2. TMP Balance Evaluation of SiO2 Pre-Coat Performance
The SiO2 pre-coating experiments operated at a constant flux of 100 L/m2-hr (58.9 gal/ft2-day)
with pre-filtered Lake Claire feed water. SiO2 mass loadings of approximately 80 g/m2 and 160
g/m2 were selected to approximate a desired layer depth of one and two particles, respectively.
The 80 and 160 g/m2 values were derived by assuming an ideal system with uniform particle
diameters, a homogeneous particle suspension, and uniform particle settling during pre-coating.
Backwashes were performed at 100 L/m2 intervals for two sequences and then at 200 L/m2 for a
third sequence. Following each backwash event, a new layer of SiO2 was deposited onto the
membrane prior to filtration. An uncoated membrane served as an experimental control.
Figure 5-5 presents the TMP balance results for the SiO2 pre-coating evaluation. The 80 g/m2
and 160 g/m2 SiO2 mass loadings significantly increased fouling rates relative to the
experimental control, and end-of-sequence TMP balance values exceeded control values by more
than a factor of three. The resistance increases observed for the SiO2 pre-coated membranes
suggest the rapid formation of an organic gel layer on the SiO2 particles, similar to the
compressible gel layer demonstrated to develop on uncoated UF membranes during surface
water treatment (Kim et al., 2007b).
Doubling the mass of SiO2 from 80 to 160 g/m2 did not appreciably affect the pressure rise, as
evidenced by the proximity of the TMP balance trend lines. However, empirical evidence
suggests that particle diameter plays a significant role in membrane fouling rates with SiO2. A
related study conducted with 60.3 g/m2 of 15 µm nominal diameter SiO2 particles exceeded the
TMP rise of an uncoated control membrane by approximately 0.790 bar (11.5 psi) after 25 L/m2
of specific filtrate volume (Kim et al., 2008). In contrast, the 45 µm nominal diameter SiO2
90
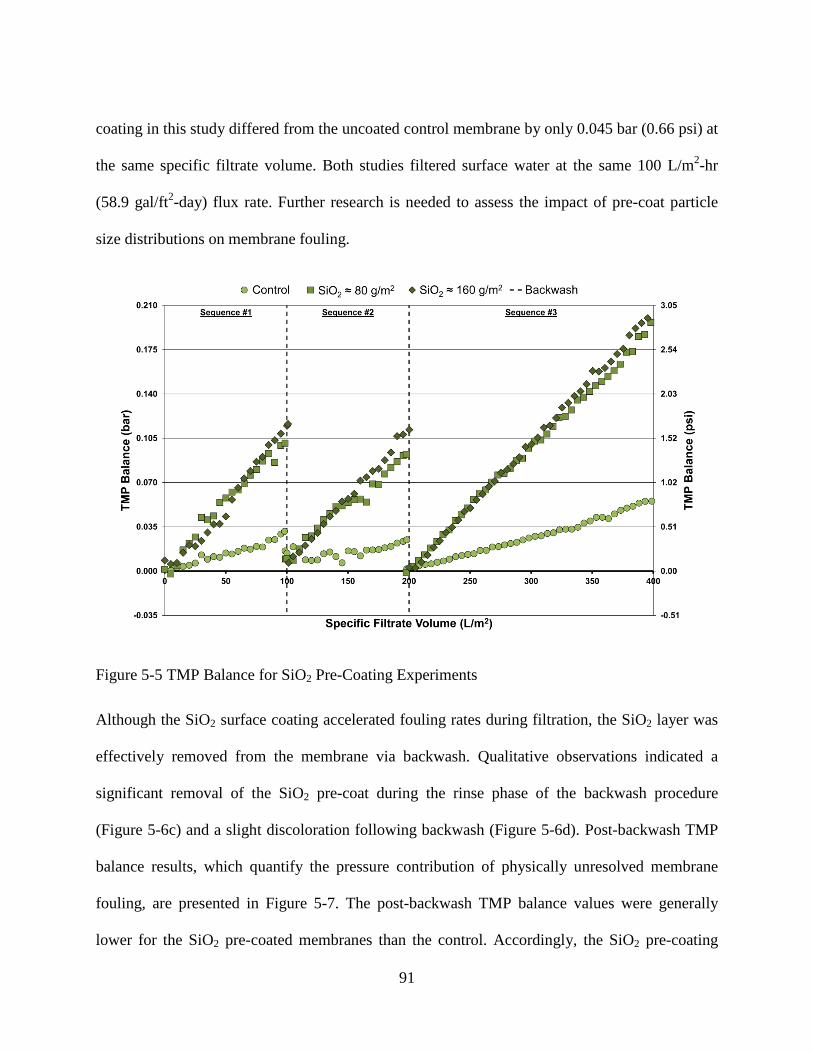
coating in this study differed from the uncoated control membrane by only 0.045 bar (0.66 psi) at
the same specific filtrate volume. Both studies filtered surface water at the same 100 L/m2-hr
(58.9 gal/ft2-day) flux rate. Further research is needed to assess the impact of pre-coat particle
size distributions on membrane fouling.
Figure 5-5 TMP Balance for SiO2 Pre-Coating Experiments
Although the SiO2 surface coating accelerated fouling rates during filtration, the SiO2 layer was
effectively removed from the membrane via backwash. Qualitative observations indicated a
significant removal of the SiO2 pre-coat during the rinse phase of the backwash procedure
(Figure 5-6c) and a slight discoloration following backwash (Figure 5-6d). Post-backwash TMP
balance results, which quantify the pressure contribution of physically unresolved membrane
fouling, are presented in Figure 5-7. The post-backwash TMP balance values were generally
lower for the SiO2 pre-coated membranes than the control. Accordingly, the SiO2 pre-coating
91

may have acted as a sacrificial layer to which physically irreversible membrane foulants
preferentially adhered. Galjaard et al. (2003) achieved a similar protective effect using a
diatomite pre-coat.
Figure 5-6 Images of SiO2 Pre-Coated Membranes
5.5.3. TMP Balance Evaluation of PAC Pre-Coat Performance
5.5.3.1. Assessment of Pre-Coated PAC Operating Performance
The experimental procedure employed during the SiO2 experiments was replicated using PAC at
the 100 L/m2-hr (58.9 gal/ft2-day) volumetric flux. PAC mass loadings of approximately 80 g/m2
and 160 g/m2 were selected to provide a gram for gram comparison with SiO2 rather than on the
basis of surface area coating. As shown in Figure 5-8, the 80 g/m2 PAC pre-coated membrane
yielded lower fouling rates relative to the control during the first sequence. However, gradual
increases in fouling occurred with increasing specific filtrate volume. TMP balance values for
both the 80 g/m2 and 160 g/m2 mass loadings exceeded the control in the third sequence with the
80 g/m2 mass loading exhibiting the most severe fouling.
92
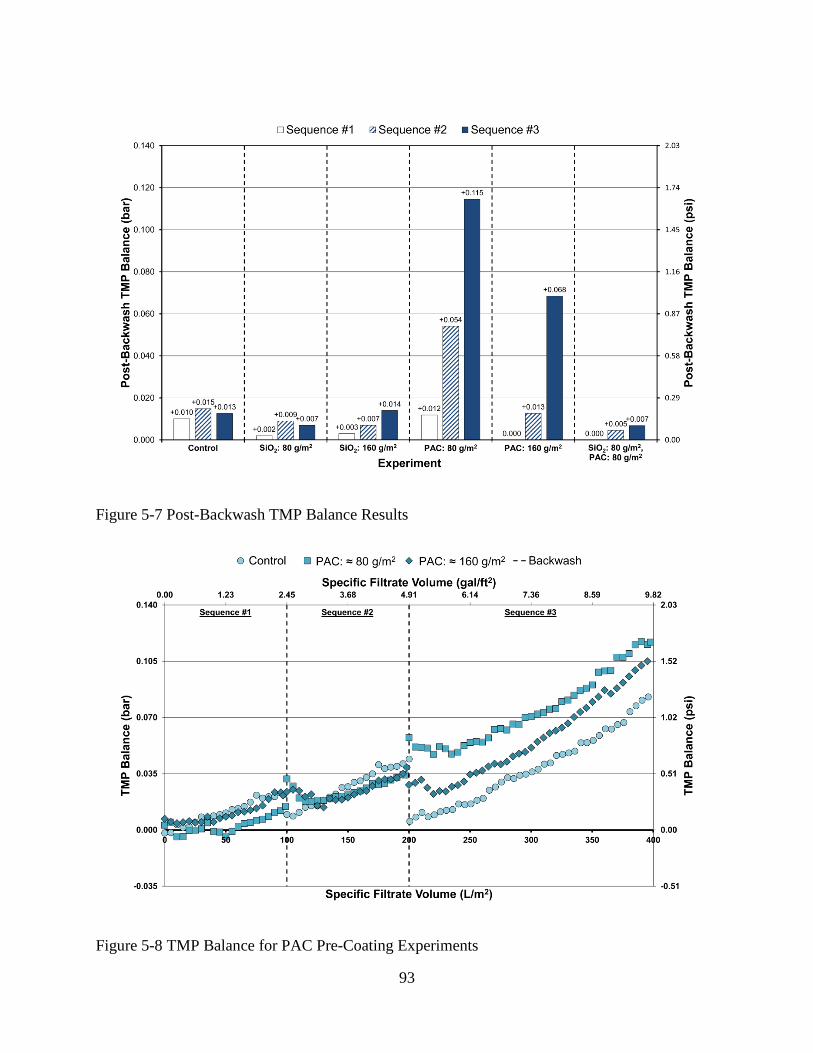
Figure 5-7 Post-Backwash TMP Balance Results
Figure 5-8 TMP Balance for PAC Pre-Coating Experiments
93
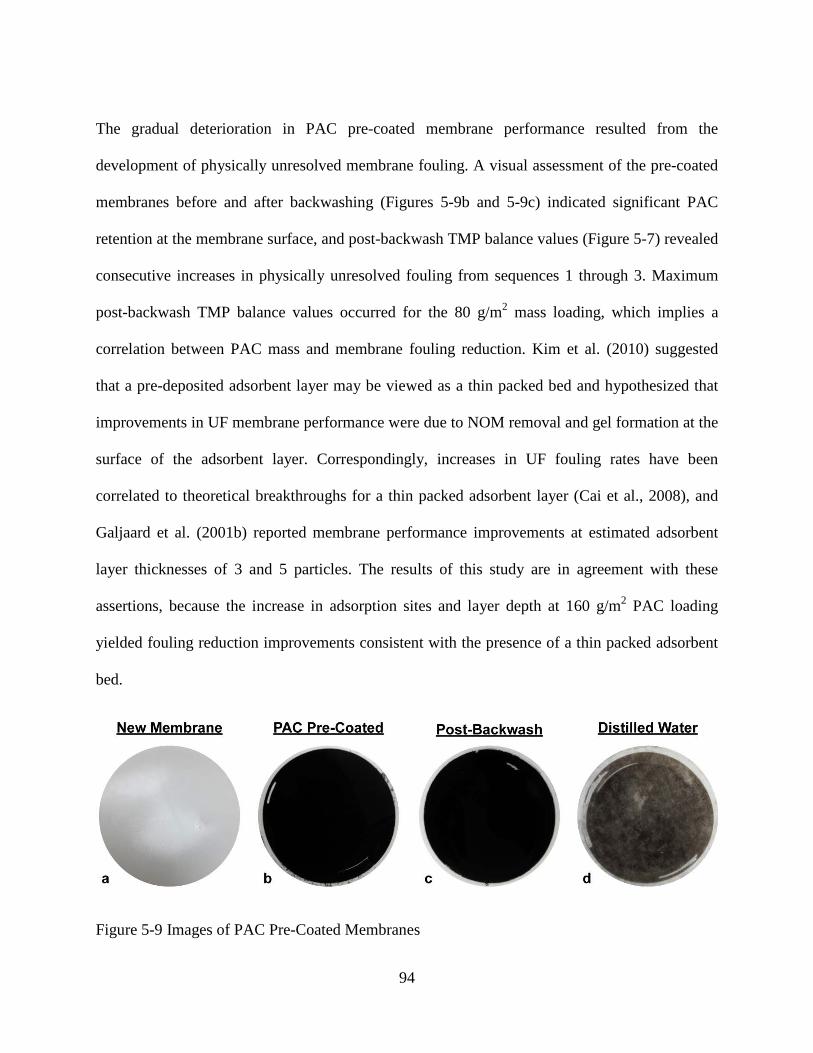
The gradual deterioration in PAC pre-coated membrane performance resulted from the
development of physically unresolved membrane fouling. A visual assessment of the pre-coated
membranes before and after backwashing (Figures 5-9b and 5-9c) indicated significant PAC
retention at the membrane surface, and post-backwash TMP balance values (Figure 5-7) revealed
consecutive increases in physically unresolved fouling from sequences 1 through 3. Maximum
post-backwash TMP balance values occurred for the 80 g/m2 mass loading, which implies a
correlation between PAC mass and membrane fouling reduction. Kim et al. (2010) suggested
that a pre-deposited adsorbent layer may be viewed as a thin packed bed and hypothesized that
improvements in UF membrane performance were due to NOM removal and gel formation at the
surface of the adsorbent layer. Correspondingly, increases in UF fouling rates have been
correlated to theoretical breakthroughs for a thin packed adsorbent layer (Cai et al., 2008), and
Galjaard et al. (2001b) reported membrane performance improvements at estimated adsorbent
layer thicknesses of 3 and 5 particles. The results of this study are in agreement with these
assertions, because the increase in adsorption sites and layer depth at 160 g/m2 PAC loading
yielded fouling reduction improvements consistent with the presence of a thin packed adsorbent
bed.
Figure 5-9 Images of PAC Pre-Coated Membranes
94
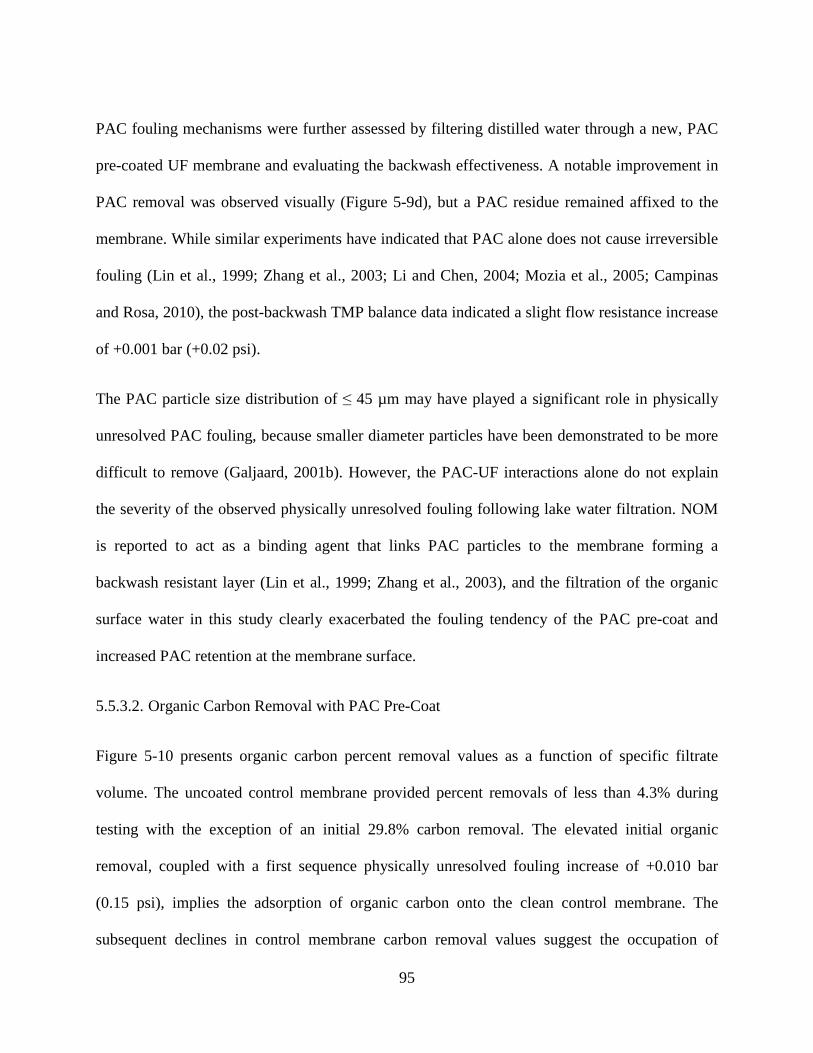
PAC fouling mechanisms were further assessed by filtering distilled water through a new, PAC
pre-coated UF membrane and evaluating the backwash effectiveness. A notable improvement in
PAC removal was observed visually (Figure 5-9d), but a PAC residue remained affixed to the
membrane. While similar experiments have indicated that PAC alone does not cause irreversible
fouling (Lin et al., 1999; Zhang et al., 2003; Li and Chen, 2004; Mozia et al., 2005; Campinas
and Rosa, 2010), the post-backwash TMP balance data indicated a slight flow resistance increase
of +0.001 bar (+0.02 psi).
The PAC particle size distribution of ≤ 45 µm may have played a significant role in physically
unresolved PAC fouling, because smaller diameter particles have been demonstrated to be more
difficult to remove (Galjaard, 2001b). However, the PAC-UF interactions alone do not explain
the severity of the observed physically unresolved fouling following lake water filtration. NOM
is reported to act as a binding agent that links PAC particles to the membrane forming a
backwash resistant layer (Lin et al., 1999; Zhang et al., 2003), and the filtration of the organic
surface water in this study clearly exacerbated the fouling tendency of the PAC pre-coat and
increased PAC retention at the membrane surface.
5.5.3.2. Organic Carbon Removal with PAC Pre-Coat
Figure 5-10 presents organic carbon percent removal values as a function of specific filtrate
volume. The uncoated control membrane provided percent removals of less than 4.3% during
testing with the exception of an initial 29.8% carbon removal. The elevated initial organic
removal, coupled with a first sequence physically unresolved fouling increase of +0.010 bar
(0.15 psi), implies the adsorption of organic carbon onto the clean control membrane. The
subsequent declines in control membrane carbon removal values suggest the occupation of
95
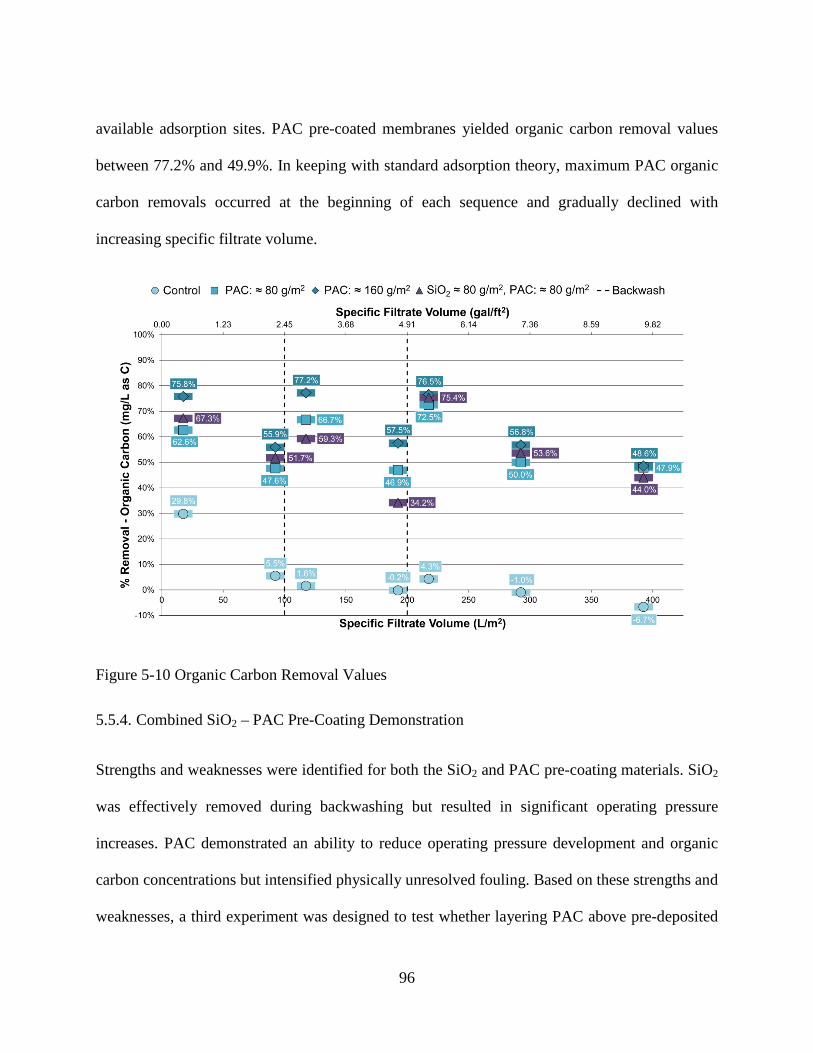
available adsorption sites. PAC pre-coated membranes yielded organic carbon removal values
between 77.2% and 49.9%. In keeping with standard adsorption theory, maximum PAC organic
carbon removals occurred at the beginning of each sequence and gradually declined with
increasing specific filtrate volume.
Figure 5-10 Organic Carbon Removal Values
5.5.4. Combined SiO2 – PAC Pre-Coating Demonstration
Strengths and weaknesses were identified for both the SiO2 and PAC pre-coating materials. SiO2
was effectively removed during backwashing but resulted in significant operating pressure
increases. PAC demonstrated an ability to reduce operating pressure development and organic
carbon concentrations but intensified physically unresolved fouling. Based on these strengths and
weaknesses, a third experiment was designed to test whether layering PAC above pre-deposited
96
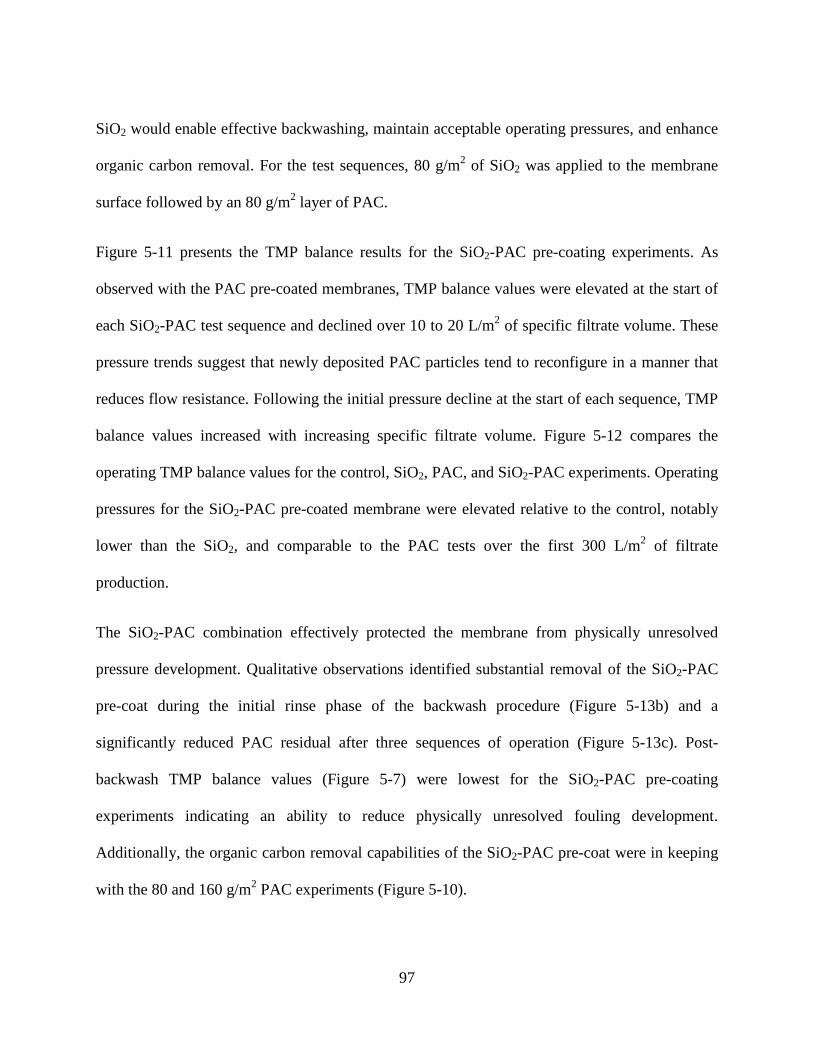
SiO2 would enable effective backwashing, maintain acceptable operating pressures, and enhance
organic carbon removal. For the test sequences, 80 g/m2 of SiO2 was applied to the membrane
surface followed by an 80 g/m2 layer of PAC.
Figure 5-11 presents the TMP balance results for the SiO2-PAC pre-coating experiments. As
observed with the PAC pre-coated membranes, TMP balance values were elevated at the start of
each SiO2-PAC test sequence and declined over 10 to 20 L/m2 of specific filtrate volume. These
pressure trends suggest that newly deposited PAC particles tend to reconfigure in a manner that
reduces flow resistance. Following the initial pressure decline at the start of each sequence, TMP
balance values increased with increasing specific filtrate volume. Figure 5-12 compares the
operating TMP balance values for the control, SiO2, PAC, and SiO2-PAC experiments. Operating
pressures for the SiO2-PAC pre-coated membrane were elevated relative to the control, notably
lower than the SiO2, and comparable to the PAC tests over the first 300 L/m2 of filtrate
production.
The SiO2-PAC combination effectively protected the membrane from physically unresolved
pressure development. Qualitative observations identified substantial removal of the SiO2-PAC
pre-coat during the initial rinse phase of the backwash procedure (Figure 5-13b) and a
significantly reduced PAC residual after three sequences of operation (Figure 5-13c). Post-
backwash TMP balance values (Figure 5-7) were lowest for the SiO2-PAC pre-coating
experiments indicating an ability to reduce physically unresolved fouling development.
Additionally, the organic carbon removal capabilities of the SiO2-PAC pre-coat were in keeping
with the 80 and 160 g/m2 PAC experiments (Figure 5-10).
97
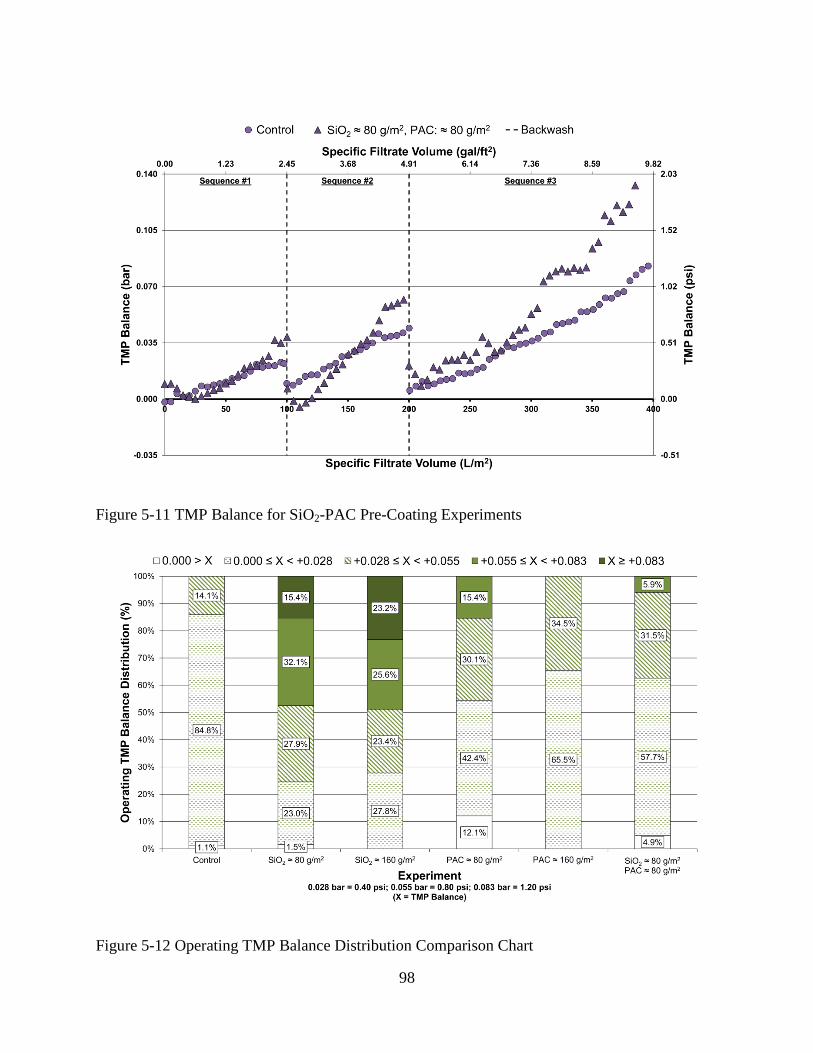
Figure 5-11 TMP Balance for SiO2-PAC Pre-Coating Experiments
Figure 5-12 Operating TMP Balance Distribution Comparison Chart
98

Figure 5-13 Images of PAC-SiO2 Pre-Coated Membranes
5.6. Conclusions
SiO2 and PAC were evaluated as pre-coatings for a PES UF membrane using the TMP balance
approach. SiO2 alone increased fouling rates and operating pressures for the UF process, but the
SiO2 layer was effectively removed from the membrane surface during backwashing. The SiO2
layer also protected the membrane from physically unresolved fouling. PAC alone effectively
removed organic carbon from the feed water but accelerated physically unresolved fouling
development.
For the first time, this study evaluated the concept of layering PAC over a pre-coating of SiO2.
SiO2 was demonstrated to be an effective support layer that provided a barrier between the
membrane fouling PAC and the membrane surface. The SiO2-PAC pre-coating resulted in lower
physically unresolved fouling development than an uncoated membrane at the expense of
increased operating pressure. Adding PAC onto the SiO2 support also significantly enhanced
organic carbon removal with maximum removals of 75.4%. The concept of pre-coating
membranes with a SiO2 support layer provides a new approach for enhancing the removal
99
capabilities of UF membranes and reducing physically unresolved fouling. Future research may
look at the potential for extending UF runtimes with a SiO2-PAC pre-coating via incorporation of
feed water pretreatment processes and by depositing other materials onto the SiO2 support layer
for organic and inorganic contaminant removal.
5.7. Acknowledgments
The research reported herein was funded by UCF project agreement 16208085. Thanks are in
order to David Dickerson (Microdyn Technologies, Inc., Raleigh, NC) for the donation of the
membranes used in this study and to the Manatee County Utilities Department (Bradenton,
Florida) for the donation of the powdered activated carbon used during testing. The contributions
of Andrea Cumming (University of Central Florida, Orlando, FL), Dr. Jayapregasham
Tharamapalan, and Jonathan Harn (Harn R/O Systems, Inc., Venice, FL) are duly recognized and
greatly appreciated.
100
5.8. References
American Public Health Association, American Water Works Association, & Water
Environment Federation. (2005). Standard methods for the examination of water and waste
water (25th ed.). A.D. Eaton, L.S. Clesceri, E.W. Rice, A.E. Greenberg, & M.A.H. Franson
(Eds.), Washington, DC: American Public Health Association.
Bui, T. X., & Choi, H. (2010). Influence of ionic strength, anions, cations, and natural organic
matter on the adsorption of pharmaceuticals to silica. Chemosphere, 80, 681-686.
Cai, Z., Kim, J., & Benjamin, M. M. (2008). NOM removal by adsorption and membrane
filtration using heated aluminum oxide particles. Environmental Science and Technology, 42,
619-623.
Cai, Z., & Benjamin, M. M. (2011). NOM fractionation and fouling of low-pressure membranes
in microgranular adsorptive filtration. Environmental Science and Technology, 45, 8935-8940.
Campinas, M., & Rosa, M. J. (2010). Assessing PAC contribution to the NOM fouling control in
PAC/UF systems. Water Research, 44, 1636-1644.
Chellam, S., Jacangelo, J.G., & Bonacquisti, T.P. (1998). Modeling and experimental
verification of pilot-scale hollow fiber, direct flow microfiltration with periodic backwashing.
Environmental Science & Technology, 32(1), 75-81.
Chen, D., Weavers, L. K., Walker H. W., & Lenhart, J. J. (2006). Ultrasonic control of ceramic
membrane fouling caused by natural organic matter and silica particles. Journal of Membrane
Science, 276, 135-144.
101
Cheryan, M. (1998). Ultrafiltration and Microfiltration Handbook. Lancaster, PA.: Technomic
Publishing Company Incorporated.
Galjaard, G., Van Paassen, J., Buijs, P., & Schoonenberg F. (2001a). Enhanced pre-coat
engineering (EPCE) for micro- and ultrafiltration: The solution for fouling? Water Science and
Technology: Water Supply, 1(5), 151-156.
Galjaard, G., Buijs, P., Beerendonk, E., Schoonenberg, F., & Schippers J. C. (2001b). Pre-
coating (EPCE®) UF membranes for direct treatment of surface water. Desalination, 139, 305-
316.
Galjaard, G., Kruithof, J. C., Scheerman, H., Verdouw, J., & Schippers, J. C. (2003). Enhanced
pre-coat engineering (EPCE®) for micro- and ultrafiltration: Steps to full-scale application.
Water Science and Technology: Water Supply, 3(5-6), 125-132.
Hu, J., Shang, R., & Deng, J. (2010). Evaluation of PAC effect in integrated PAC/UF system for
surface water treatment. 4th International Conference on Bioinformatics and Biomedical
Engineering. 1-4.
Jack, A. M., & Clark, M. M. (1998). Using PAC-UF to treat a low-quality surface water. Journal
of the American Water Works Association, 90(11), 83-95.
Kim, H., Takizawa, S., & Ohgaki, S. (2007a). Application of microfiltration systems coupled
with powdered activated carbon to river water treatment. Desalination, 202, 271-277.
Kim, J., Shi, W., Yuan, Y., & Benjamin, M. M. (2007b). A serial filtration investigation of
membrane fouling by natural organic matter. Journal of Membrane Science, 294, 115-126.
102
Kim, J., Cai, Z., & Benjamin, M. M. (2008). Effects of adsorbents on membrane fouling by
natural organic matter. Journal of Membrane Science, 310, 356-364.
Kim, J., Cai, Z., & Benjamin, M. M. (2010). NOM fouling mechanisms in a hybrid
adsorption/membrane system. Journal of Membrane Science, 349, 35-43.
Lee, C. W., Bae, S. D., Han, S. W., & Kang, L. S. (2007). Application of ultrafiltration hybrid
membrane processes for resuse of secondary effluent. Desalination, 202, 239-246.
Li, C., & Chen, Y. (2004). Fouling of UF membrane by humic substance: Effects of molecular
weight and powder-activated carbon (PAC) pre-treatment. Desalination, 170, 59-67.
Lin, C., Huang, Y., & Hao, O. J. (1999). Ultrafiltration processes for removing humic
substances: Effect of molecular weight fractions and PAC treatment. Water Research, 33(5),
1252-1264.
Lin, C., Lin, T., & Hao, O. J. (2000). Effects of humic substance characteristics on UF
performance. Water Research, 34(4), 1097-1106.
Lin, C., Liu, S., & Hao, O. J. (2001). Effects of functional groups of humic substances on UF
performance. Water Research, 35(10), 2395-2402.
Londono, I. C. (2011). Assessment of causes of irreversible fouling in powdered activated
carbon/ultrafiltration membrane (PAC/UF) systems. Retrieved from The University of British
Columbia.
Mozia, S., Tomaszewska, M., & Morawski, A. W. (2005). Studies on the effect of humic acids
and phenol on adsorption-ultrafiltration process performance. Water Research, 39, 501-509.
103
Smith, P., & Vigneswaran, S. (2009). Effect of backwash and powder activated carbon (PAC)
addition on performance of side stream membrane filtration system (SSMFS) on treatment of
biological treatment effluent. Desalination and Water Treatment, 11, 46-51.
Yang, K., Lin, D., & Xing, B. (2009). Interactions of humic acid with nanosized inorganic
oxides. Langmuir, 25, 3571-3576.
Yeh, H.M., & Wu, H.H. (1997). Membrane filtration in combined hollow-fiber module systems.
Journal of Membrane Science, 124, 93-105.
Zhang, M., Li, C., Benjamin, M. M., & Chang, Y. (2003). Fouling and natural organic matter
removal in adsorbent/membrane systems for drinking water treatment. Environmental Science
and Technology, 37, 1663-1669.
Zhao, P., Takizawa, S., Katayama, H., & Ohgaki, S. (2005). Factors causing PAC cake fouling in
PAC-MF (powdered activated carbon - microfiltration) water treatment systems. Water Science
& Technology, 51(6-7), 231-240.
104
CHAPTER 6. GENERAL CONCLUSION
• Pilot test protocols should provide sufficient time to identify the impacts of seasonal
water quality changes on UF pilot performance.
• Dynamic cleaning protocols should be employed to adapt to changing water quality
conditions to limit the unnecessary use of cleaning chemicals and improve UF process
performance.
• The performance of a membrane process is easily interpreted from the TMP balance,
because the TMP balance is reported as a pressure change relative to a reference
condition.
• The TMP balance identifies pressure variations associated with changes to the intrinsic
membrane resistance and fouling layers.
• The TMP balance distinguishes between chemically unresolved, physically unresolved
and operating pressure changes through calculation of post-CEB, post-CIP, post-
backwash, and operating TMP balance values.
• Calculation of the TMP balance allows for the comparison of process performance at
different flux values.
• Operating protocols for UF processes should be dynamic to maintain production targets
while minimizing the occurrence of unnecessary maintenance activities.
• The five component systematic optimization approach provides tools for identifying UF
process operating configurations that achieve sustainable performance and improve
process output.
105
• Optimization of an UF pilot with conventional alum coagulation pretreatment yielded
sustainable process operation at process recovery and utilization values of 96.1% and
93.5%, respectively.
• Backwash and CEB residual pressure calculations successfully identified changes in
physical and chemical maintenance performance.
• A protective fouling layer effect was observed following extension of the CEB interval.
The corresponding improvements in backwash effectiveness were accompanied by higher
operating pressures.
• Post-CEB TMP balance values (i.e. chemically unresolved membrane fouling) increased
with increased process recovery and utilization.
• SiO2 was effectively removed from the membrane surface during backwashing, but
increased fouling rates and operating pressures for the UF system.
• Membrane fouling with SiO2 was found to be independent of SiO2 mass.
• PAC effectively removed organic carbon from the feed water but resulted in the
development of physically unresolved fouling.
• For the first time, SiO2 was demonstrated to be an effective support layer that provided a
barrier between the membrane fouling PAC and the membrane surface.
• The SiO2-PAC pre-coating resulted in lower physically unresolved fouling development
than an uncoated membrane at the expense of increased operating pressure.
• Adding PAC onto the SiO2 support significantly enhanced organic carbon removal
relative to an uncoated membrane with maximum removals of 75.4%.
106

APPENDIX A: SUPPLEMENTAL INFORMATION – ADDITIONAL TMP BALANCE FUNCTIONALITY FOR MEMBRANE PRE-COATING
107
The linear relationship between TCTMP and volumetric flux enables the TMP balance to
maintain the established zero TMP balance reference when the flux is changed. This is
accomplished by accounting for the associated intrinsic pressure resistance change using the
∆Flux term. In the ∆Flux equation, the subscript m refers to the flux case, which corresponds to
an operating flux value, and the slope is that of the line describing TCTMP versus volumetric
flux for the process. Once the ∆Flux term is calculated, it may be incorporated into the TMP
balance equation as shown below.
∆𝐹𝑙𝑢𝑥 = 𝑠𝑙𝑜𝑝𝑒 (𝐹𝑙𝑢𝑥𝑚 − 𝐹𝑙𝑢𝑥𝑚+1)
𝑇𝑀𝑃 𝐵𝑎𝑙𝑎𝑛𝑐𝑒𝑖𝑗𝑚 = ∆𝑅𝑒𝑓𝑒𝑟𝑒𝑛𝑐𝑒 + �� ��(
𝑛𝑗𝑚
𝑖=1
𝑇𝐶𝑇𝑀𝑃𝑖+1,𝑗𝑚 − 𝑇𝐶𝑇𝑀𝑃𝑖𝑗𝑚)𝐽𝑚
𝑗=1
𝑀
𝑚=1
�+ � ∆𝐹𝑙𝑢𝑥𝑚𝑀
𝑚=1
Where,
Subscript m refers to the flux case
108
APPENDIX B: LABORATORY QUALITY CONTROL RECORDS
109

Laboratory quality control was maintained using sample replicates and spikes. Tables Appendix-
B1 and Appendix-B2 present the relative standard deviation (RSD) and recovery values for the
organic carbon analysis discussed in Chapter 5. Replicate samples were in compliance at RSD
values of ≤ 20%, and spiked samples were in compliance at values between 80% and 120%.
Table Appendix-B1 Organic Carbon Analysis – % RSD for Replicate Samples
Replicate Set # %RSD 1 1.84 2 2.34 3 5.80 4 2.56 5 2.50 6 5.60 7 1.53
Table Appendix-B2 Organic Carbon Analysis – Percent Recovery for Spiked Samples
Spike Set # % Recovery 1 99.9 2 99.6 3 98.4 4 98.8 5 100.1 6 96.8 7 99.1
110
APPENDIX C: WATER PRACTICE & TECHNOLOGY PERMISSION LETTER
111
112
Recommended