16 September 2019
ANGLO AMERICAN PLATINUM DENVER GOLD FORUM 2019

2
CAUTIONARY STATEMENT
Front cover image: Waterval smelters
Disclaimer: This presentation has been prepared by Anglo American Platinum Limited (“Anglo American Platinum”) and comprises the written materials/slides for a presentation concerning Anglo American Platinum. By attending this presentation
and/or reviewing the slides you agree to be bound by the following conditions.
This presentation is for information purposes only and does not constitute an offer to sell or the solicitation of an offer to buy shares in Anglo American Platinum. Further, it does not constitute a recommendation by Anglo American Platinum or any
other party to sell or buy shares in Anglo American Platinum or any other securities. All written or oral forward-looking statements attributable to Anglo American Platinum or persons acting on their behalf are qualified in their entirety by these
cautionary statements.
Forward-Looking Statements
This presentation includes forward-looking statements. All statements, other than statements of historical facts included in this presentation, including, without limitation, those regarding Anglo American Platinum’s financial position, business,
acquisition and divestment strategy, plans and objectives of management for future operations (including development plans and objectives relating to Anglo American Platinum’s products, production forecasts and reserve and resource
positions), are forward-looking statements. By their nature, such forward-looking statements involve known and unknown risks, uncertainties and other factors which may cause the actual results, performance or achievements of Anglo American
Platinum, or industry results, to be materially different from any future results, performance or achievements expressed or implied by such forward-looking statements.
Such forward-looking statements are based on numerous assumptions regarding Anglo American Platinum’s present and future business strategies and the environment in which
Anglo American Platinum will operate in the future. Important factors that could cause Anglo American Platinum’s actual results, performance or achievements to differ materially from those in the forward-looking statements include, among others,
levels of actual production during any period, levels of global demand and commodity market prices, mineral resource exploration and development capabilities, recovery rates and other operational capabilities, the availability of mining and
processing equipment, the ability to produce and transport products profitably, the impact of foreign currency exchange rates on market prices and operating costs, the availability of sufficient credit, the effects of inflation, political uncertainty and
economic conditions in relevant areas of the world, the actions of competitors, activities by governmental authorities such as changes in taxation or safety, health, environmental or other types of regulation in the countries where Anglo American
Platinum operates, conflicts over land and resource ownership rights and such other risk factors identified in Anglo American Platinum’s most recent Annual Report. Forward-looking statements should, therefore, be construed in light of such risk
factors and undue reliance should not be placed on forward-looking statements. These forward-looking statements speak only as of the date of this presentation. Anglo American Platinum expressly disclaims any obligation or undertaking (except
as required by applicable law, the Listings Requirements of the securities exchange of the JSE Limited in South Africa and any other applicable regulations) to release publicly any updates or revisions to any forward-looking statement contained
herein to reflect any change in Anglo American Platinum’s expectations with regard thereto or any change in events, conditions or circumstances on which any such statement is based.
Nothing in this presentation should be interpreted to mean that future earnings per share of Anglo American Platinum will necessarily match or exceed its historical published earnings per share.
Certain statistical and other information about Anglo American Platinum included in this presentation is sourced from publicly available third party sources. As such it presents the views of those third parties, but may not necessarily correspond to
the views held by Anglo American Platinum.
No Investment Advice
This presentation has been prepared without reference to your particular investment objectives, financial situation, taxation position and particular needs. It is important that you view this presentation in its entirety. If you are in any doubt in
relation to these matters, you should consult your stockbroker, bank manager, solicitor, accountant, taxation adviser or other independent financial adviser (where applicable, as authorised in South Africa, under the Financial Advisory and
Intermediary Services Act 37 of 2002).
Alternative performance measures
Throughout this presentation a range of financial and non-financial measures are used to assess our performance, including a number of the financial measures that are not defined under IFRS, which are termed ‘alternative performance
measures’ (APMs). Management uses these measures to monitor Anglo American Platinum’s financial performance alongside IFRS measures because they help illustrate the underlying financial performance and position of the Anglo American
Platinum. These APMs should be considered in addition to, and not as a substitute for, or as superior to, measures of financial performance, financial position or cash flows reported in accordance with IFRS. APMs are not uniformly defined by all
companies, including those in Anglo American Platinum’s industry. Accordingly, it may not be comparable with similarly titled measures and disclosures by other companies.

3
AMS.SJ /
AGGPY
(15)%
(10)%
(5)%
0%
5%
10%
15%
20%
(400)
(200)
0
200
400
600
800
Ang
lo A
meri
can
Pla
tin
um
Sib
an
ye-S
tillw
ate
r
Nort
ham
Imp
ala
Barr
ick G
old
IAM
GO
LD
Ang
loG
old
Asha
nti
New
mo
nt G
old
co
rp
RB
Pla
ts
Eld
ora
do
Gold
Fie
lds
Kin
ross
New
cre
st
Min
ing
Yam
an
a
Agn
ico E
ag
le
Total Resources inc Reserves (LHS) Return on Capital (RHS)
A DIFFERENTIATED PRECIOUS METALS PRODUCER
Largest precious metals Mineral Resource globally…with leading returns(1)(2)(3)Ticker: JSE / ADR
$6 billion
$16 billion
Market Capitalization(5)
Revenue
H1 2019 annualized(4)

4
OUR VALUE PROPOSITION
We own and operate the
best assetsLong term sustainabilityIndustry leading returns
Long-life mineral resource
~70% production in H1
of the primary PGM cost curve
Only open-pit PGM mine
of scale in the world
Optimising assets and
extracting full value (P101)
Strict cost control
Strong balance sheet
and cashflow
Disciplined capital allocation
Sustainable cash dividend –
40% pay-out ratio
Invest in people, environment
and communities
Project studies on value-add
growth optionality
Grow demand for PGMs
through market development
Step-change performance
through FutureSmart™ Mining
technologies and sustainability

5
BENEFITS OF PRODUCING A DIVERSIFIED BASKET OF METALS
Indexed achieved price year-to-date (2 Jan 2019 = 100)
Rhodium +79%
Rand basket +30%
Palladium +24%
Dollar basket +27%
Nickel +70%
Gold +16%
Platinum +17%
Copper (3)%
H1 2019 revenue contribution
Platinum28.8%
Palladium42.8%
Rhodium14.9%
Gold2.6%
Nickel4.1%
Copper1.4% Other
5.4%
80
100
120
140
160
180
200
220
Jan-19 Feb-19 Mar-19 Apr-19 May-19 Jun-19 Jul-19 Aug-19 Sep-19

6
PGMS HAVE SPECIFIC PROPERTIES TO SOLVE GLOBAL ISSUES…
Anglo American Platinum produces ~5 million PGM ounces per annum to enable…
Clean air & emission
reductionDecarbonisation – fuel cell
vehiclesCO2 capture / storage
Cancer medicationPacemakers Food preservation
Energy Storage
Data Storage

PGM MARKET REVIEW
8
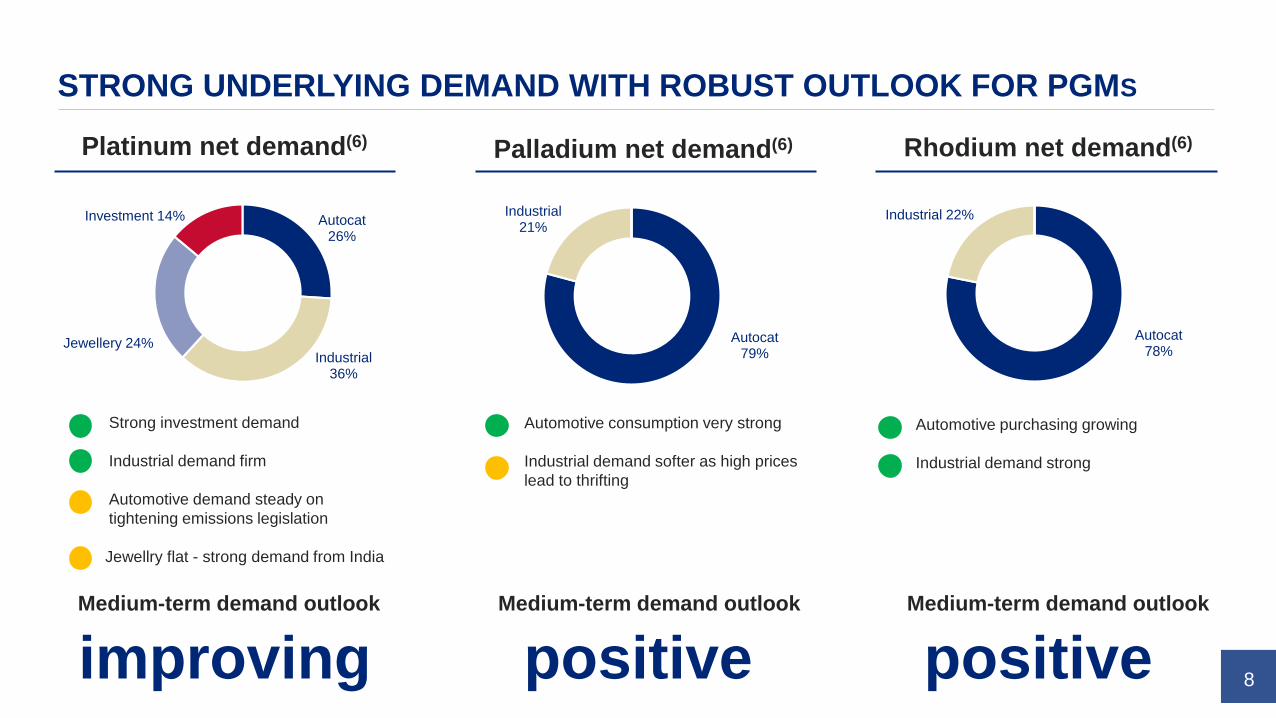
STRONG UNDERLYING DEMAND WITH ROBUST OUTLOOK FOR PGMS
Medium-term demand outlook
improvingMedium-term demand outlook
positiveMedium-term demand outlook
positive
• Strong investment demand
• Industrial demand firm
• Automotive demand steady on
tightening emissions legislation
• Jewellry flat - strong demand from India
• Automotive consumption very strong
• Industrial demand softer as high prices
lead to thrifting
• Automotive purchasing growing
• Industrial demand strong
Autocat26%
Industrial 36%
Jewellery 24%
Investment 14%
Autocat79%
Industrial 21%
Autocat78%
Industrial 22%
Platinum net demand(6) Palladium net demand(6) Rhodium net demand(6)
9
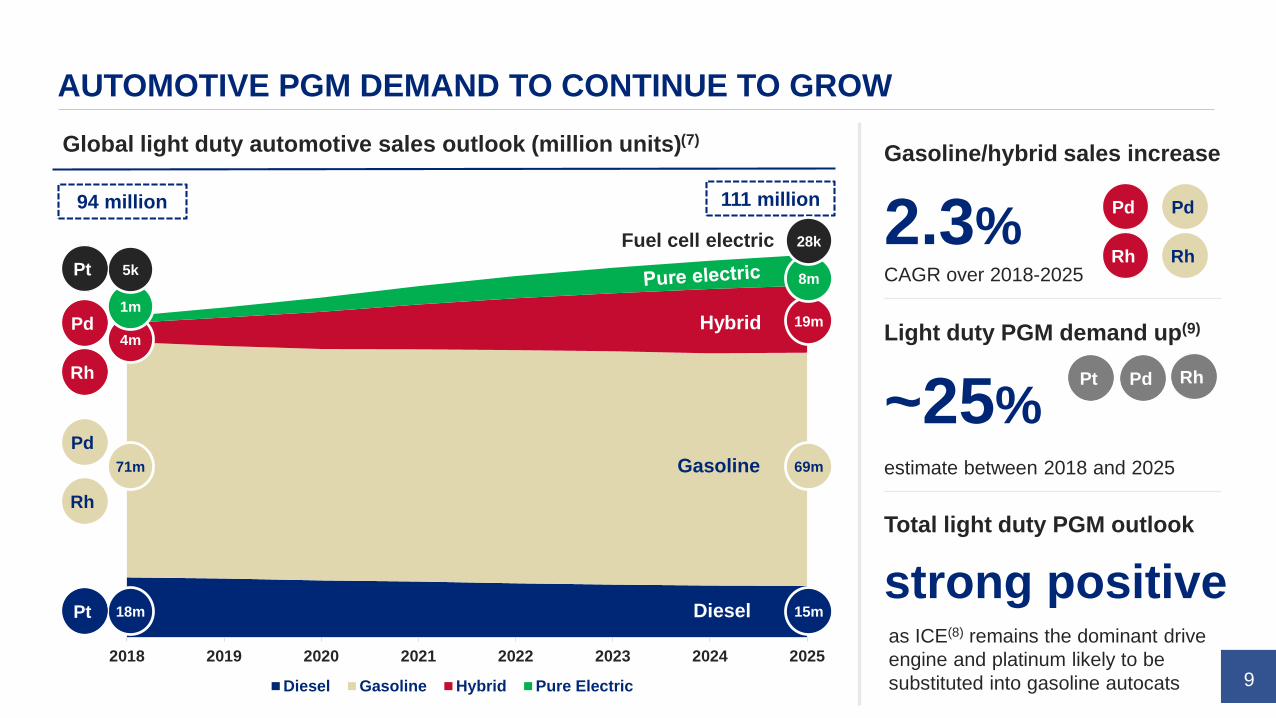
2018 2019 2020 2021 2022 2023 2024 2025
Diesel Gasoline Hybrid Pure Electric
18m DieselPt
Global light duty automotive sales outlook (million units)(7)
15m
Pd
Rh
71m 69m
4mPd
Rh
94 million 111 million
Hybrid 1m
5kPt
Fuel cell electric
Gasoline
19m
8m
28k 2.3%
Gasoline/hybrid sales increase
CAGR over 2018-2025
~25%
Light duty PGM demand up(9)
estimate between 2018 and 2025
strong positive
Total light duty PGM outlook
as ICE(8) remains the dominant drive
engine and platinum likely to be
substituted into gasoline autocats
AUTOMOTIVE PGM DEMAND TO CONTINUE TO GROW
Pd
Rh
Pd
Rh
Pt Pd Rh

10
Europe Japan North America China India Rest of World
2018 2025
Forecast light duty gasoline PGM loadings(9)
“CLEAN AIR” EMISSIONS LEGISLATION INCREASING PGM LOADINGS
15%
Average global loadings increase
between 2018 and 2025
increase
Auto PGM demand forecast to
despite falling vehicle sales
strong positive
Total light duty PGM outlook
tighter emissions legislations result in
significant increases in PGM loadings
11
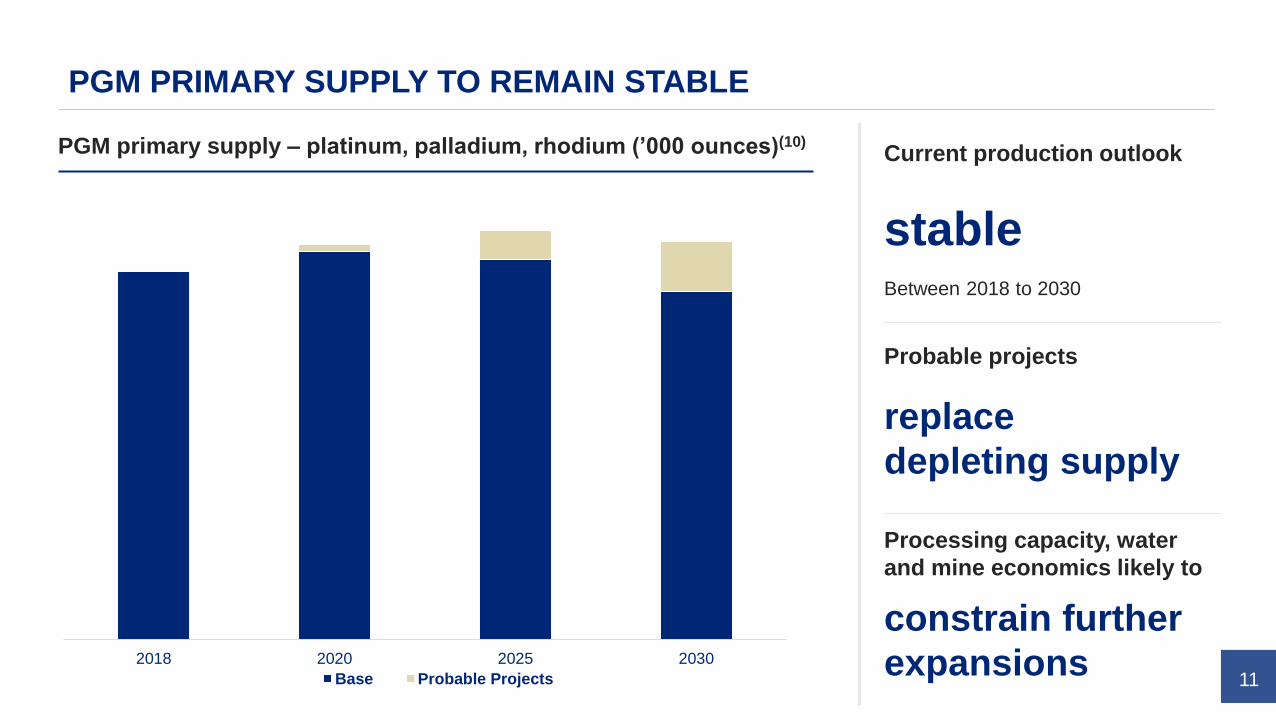
PGM PRIMARY SUPPLY TO REMAIN STABLE
PGM primary supply – platinum, palladium, rhodium (’000 ounces)(10)
1354814268 13978
12818
2018 2020 2025 2030
Base Probable Projects
13,548stable
Current production outlook
Between 2018 to 2030
replace
depleting supply
Probable projects
constrain further
expansions
Processing capacity, water
and mine economics likely to
12
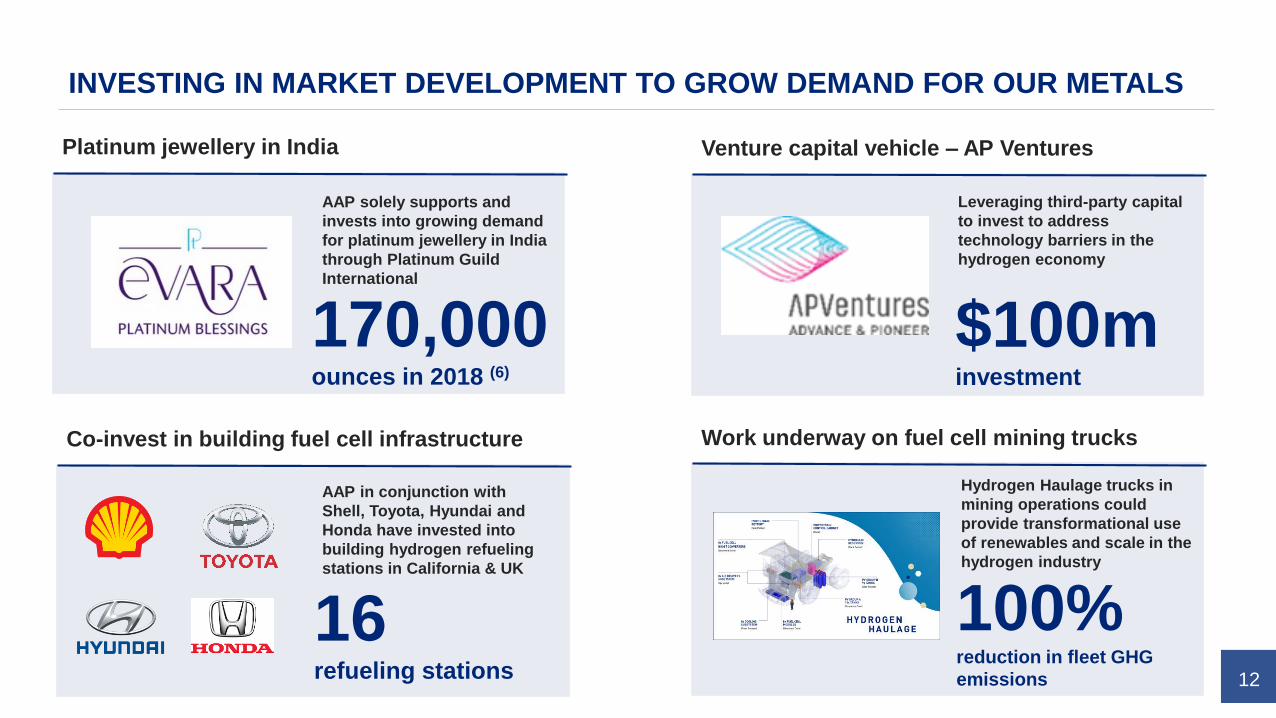
INVESTING IN MARKET DEVELOPMENT TO GROW DEMAND FOR OUR METALS
Platinum jewellery in India
Co-invest in building fuel cell infrastructure
Venture capital vehicle – AP Ventures
Work underway on fuel cell mining trucks
Leveraging third-party capital
to invest to address
technology barriers in the
hydrogen economy
AAP solely supports and
invests into growing demand
for platinum jewellery in India
through Platinum Guild
International
170,000 ounces in 2018 (6)
$100m investment
AAP in conjunction with
Shell, Toyota, Hyundai and
Honda have invested into
building hydrogen refueling
stations in California & UK
16refueling stations
Hydrogen Haulage trucks in
mining operations could
provide transformational use
of renewables and scale in the
hydrogen industry
100% reduction in fleet GHG
emissions
OPERATIONAL & FINANCIAL REVIEW
14
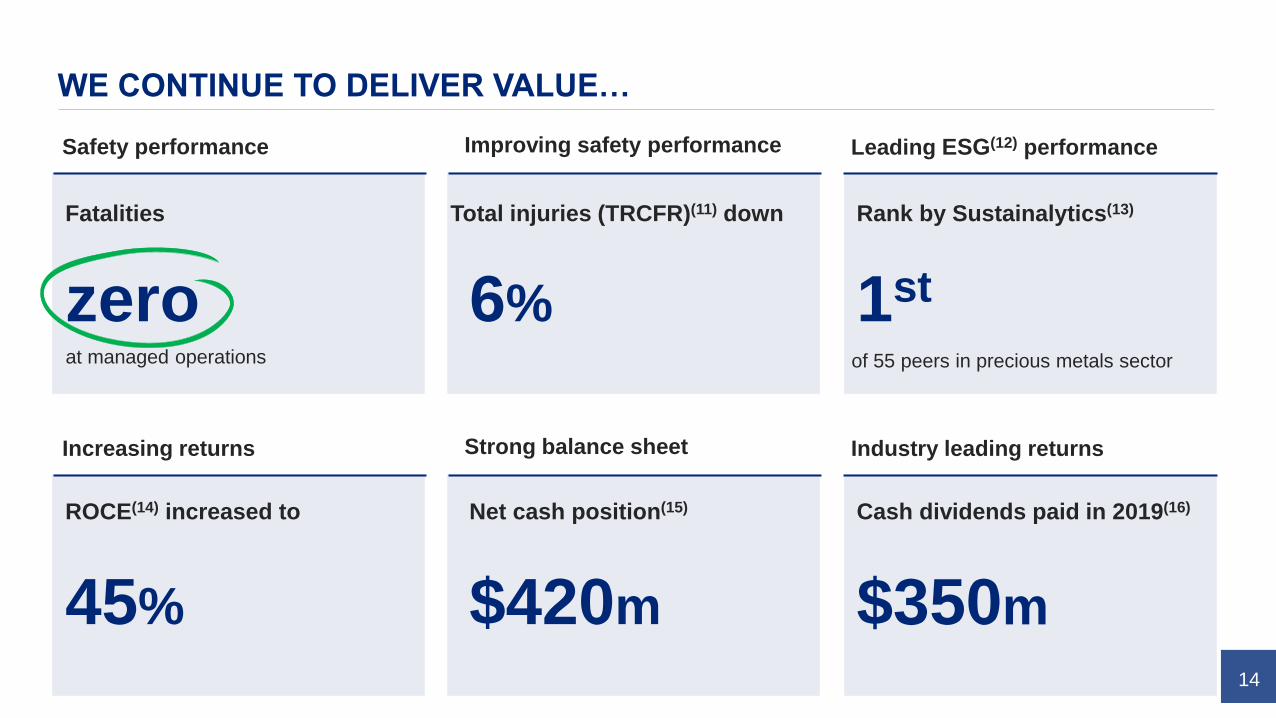
WE CONTINUE TO DELIVER VALUE…
$420m
zero
Fatalities
$350m
1st
Improving safety performanceSafety performance Leading ESG(12) performance
45%
ROCE(14) increased to
6%
Total injuries (TRCFR)(11) down Rank by Sustainalytics(13)
Net cash position(15) Cash dividends paid in 2019(16)
Strong balance sheetIncreasing returns Industry leading returns
of 55 peers in precious metals sectorat managed operations

15
OWNING AND OPERATING THE BEST ASSETS FROM MINE TO MARKET
Mogalakwena Amandelbult Mototolo & Der
BrochenUnki
Modikwa JV
Kroondal JVProcessing
$2.5bnReplacement cost
for smelters and
refineries
Manage and
operate for
own capacity
Growth &
replacement
options
Strategic
asset on
Great Dyke
Only global
open-pit PGM
mine
Rhodium rich
– turnaround
strategy
underway
Cash
generative &
contribute to
POC
57%EBITDA Margin
in H1 2019
25%Reduction in
AISC by 2022 to
H1 cost curve
Marketing
100%Wholly owned
post acquisition
Sales to end
users &
trading
capability
4xMineral
Resource to
Reserve ratio
$92mCash
contribution in
H1 2019
2.345mPGM ounces sold
in H1 2019
>30years life of mine
>30years life of mine
>100years life of mine
>30years life of mine
(17) (17) (17) (17)

16
0
100
200
300
400
500
600
700
800
Ang
lo A
meri
can
Pla
tin
um
Sib
an
ye-S
tillw
ate
r
Nort
ham
Imp
ala
Barr
ick G
old
IAM
GO
LD
Ang
loG
old
Asha
nti
New
mo
nt G
old
co
rp
RB
Pla
ts
Eld
ora
do
Gold
Fie
lds
Kin
ross
New
cre
st
Min
ing
Yam
an
a
Agn
ico E
ag
le
THE LARGEST PRECIOUS METALS MINERAL RESOURCE GLOBALLY
Mineral Resources(2) - million ounces (Platinum, Palladium, Rhodium & Gold)
Predominantly gold resources
Predominantly PGM resources

17
(292)
56
237
672
182
376
517
(400)
(200)
0
200
400
600
800
1,000
Mo
gala
kw
ena
Unki
Mo
toto
lo
Am
and
elb
ult
To
tal O
wn
Min
es
Jo
int
Ven
ture
s
Com
pan
y
FOCUS ON STRICT COST CONTROL
All-in-sustaining cost per operation ($/platinum ounce produced)(18)
~70%
Production in H1 PGM cost curve
32%
Company EBITDA margin
43%
Own mine EBITDA margin
H1 2019 average achieved platinum price - $831

18
133
300
600
77
92
14
7
(64)(140)
(42)
H1 2018 H1 2019 H1 2019 FCF(Estimate at spot)
Free Cash flow (FCF) Customer Prepayment increase
Investment & proceeds Dividend
IFRS 16 Leases
STRONG FREE CASH FLOW LEADING TO STRONG BALANCE SHEET
Net cash(15) (~$ million)
$215m improvement~$300m
Stronger free cash flow(19) from operations (~$ million)
35
205
420
H1 2018 2018 H1 2019

19
MAINTAINING DISCIPLINED CAPITAL ALLOCATION
H1 2019 allocation of capital(20)Capital allocation framework
Discretionary capital options
Portfolio upgrade Future project optionsAdditional shareholder
returns
$380m
$140m
0.2
• Attributable free cash flow(19) of $360m
• Add back discretionary spend of $20m
• Paid H2 2018 dividend of $140m
• H1 2019 dividend declared of $210m
• Low capital expenditure, fast payback
projects
• Strengthening balance sheet
$20m
$220m

UNLOCKING
FURTHER VALUE

21
PROGRESSING STRATEGY TO UNLOCK FURTHER VALUE
FutureSmartTM Mining &
P101 Project studies underwayFast Payback Projects
• Achieve and beat world best
practice - P101
• FutureSmart™ Mining is step-
change technologies and
sustainability working together
• Digitalisation and modernisation
• Chrome expansions (Amandelbult &
Modikwa)
• Modernisation (15E Amandelbult)
• Concentrator Debottlenecking (all
operations)
• Copper Leach Circuit (Base Metals
Refinery)
• Mogalakwena expansion options
• Mototolo / Der Brochen life
extension or expansion

22
FOCUS NOW ON THE NEXT PHASE OF VALUE DELIVERY…
Driving an uplift in EBITDA(21) margin (excluding expansion projects) at 2018 price/FX
2012 2018 2023
11%
20%
+5-8pp
25%-28%
5-8 percentage points
Margin uplift
3-5 years
Time to implement
Driven by
• Fast payback, value-enhancing
project delivery
• Operational efficiency to beat best in
class (P101)
• FutureSmart™ technology and
innovation
23
…CONTINUING TO MINE IN A SOCIALLY RESPONSIBLE & SUSTAINABLE WAY
$175m
zero
Level 3 to 5 since 2013 (22)
CO2 emissionsEnvironmental incidents
83%
Reduction since 2013 (23)
31%
Reduction since 2013 (25)
To global best practice (26)
SO2 abatement investmentTotal waste to landfill
$140m69%
TRCFR(11) reduction since 2013 (24) Total spend since 2013 (27)
Contribution to communitiesReduction in injuries
Global ESG recognition (28)
24
TO CONCLUDE…
Zero fatalities YTD – remain focused on elimination of fatalities & improved safety
Robust fundamentals leading to strong PGM basket price
Own and operate the best assets, with the largest global PGM Mineral Resource
ESG performance is a core strategic objective and receiving global recognition
Continuous focus on the next phase of value delivery & studying growth options
✓
✓
✓
✓
✓
Disciplined capital allocation – paying a sustainable cash dividend
✓
✓Strong cash flow generation leading to a strong balance sheet

Q&A
APPENDIX
27
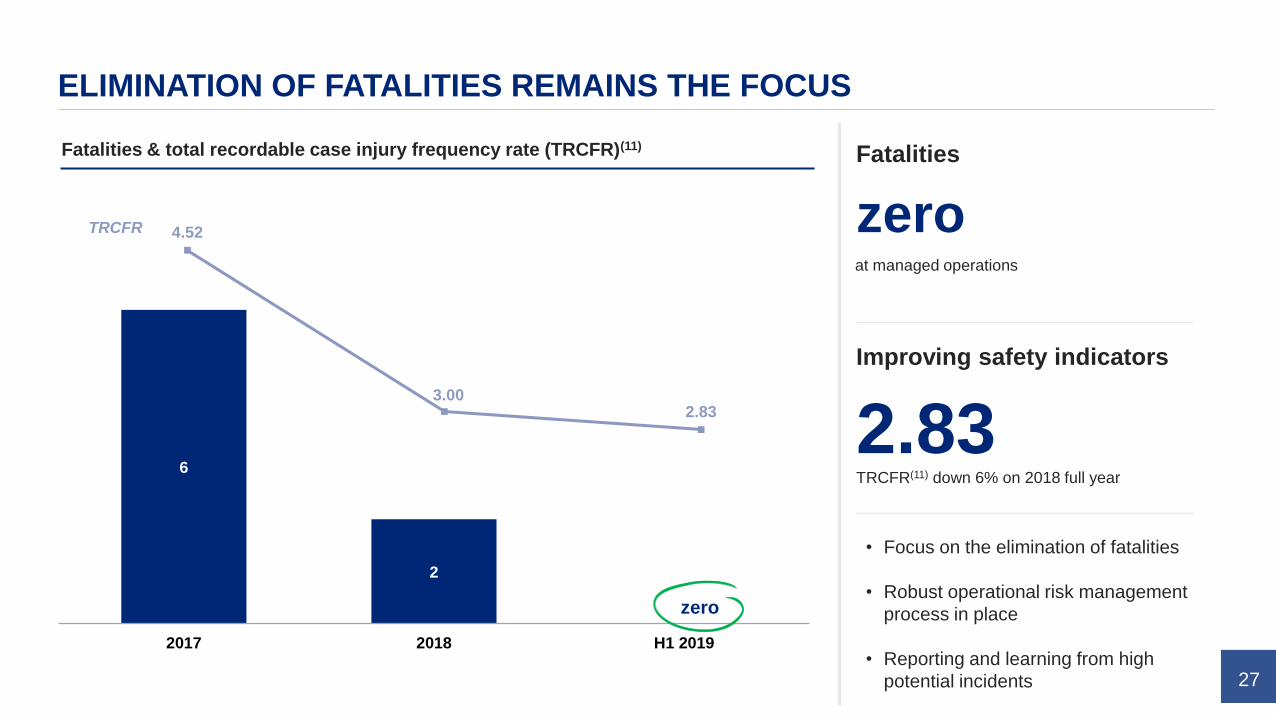
ELIMINATION OF FATALITIES REMAINS THE FOCUS
Fatalities & total recordable case injury frequency rate (TRCFR)(11)
zero
Fatalities
2.83
Improving safety indicators
at managed operations
TRCFR(11) down 6% on 2018 full year
• Focus on the elimination of fatalities
• Robust operational risk management
process in place
• Reporting and learning from high
potential incidents
6
2
0
2017 2018 H1 2019
4.52
3.002.83
TRCFR
zero

28
TAILINGS STORAGE FACILITY (TSF) MANAGEMENT
Industry leading dam safety management with multiple levels of oversight
9
Own-managed TSFs
6
Levels of assurance & oversight
4 upstream, 1 downstream, 1 hybrid, 3 dry stack
2 internal, 2 external, 2 independent
Group Technical
Specialists
Internal risk
assurance
Independent Technical Review Panel
BU Technical Standard expert
Engineer of Record
Operation
Environmental incidents(22)
zeroLevel 4 to 5 since 2013

29
PLATINUM DEMAND BALANCED ACROSS 3 KEY DEMAND SEGMENTS
Pt
Forecast net demand 2019 (000 ounces)(29)
Pd
Autocat 26%
Industrial 36%
Jewellery 24%
Investment 14%
Autocat 79%
Industrial 21%
10%
Net platinum demand increase
10%
Net palladium demand increase
8%
Net rhodium demand increase

30
Chemical 35%
Dental25%
Electrical 25%
Other15%Chemical
25%
Glass15%
Electrical8%Petroleum & gas-
to-liquid10%
Fuel cells2%
Other40%
INDUSTRIAL DEMAND REMAINS STRONG
Pt Pd
Forecast net demand 2019 (000 ounces)(30)
healthy
Platinum outlook
neutral
Palladium outlook
positive
Rhodium outlook
following 14% growth in 2018

31
JEWELLERY: 2019 FORECAST MIXED
Forecast net demand 2019 (000 ounces)(31)
China48%
North America 15%
Europe12%
India12%
Japan8%
ROW5%
short term
negative
China still challenging
neutral
Europe, Japan, North America
strong
positive
Strong growth from India

32
CAGR over 2019-2025, excluding impact
of substitution
PLATINUM DEMAND FROM AUTOMOTIVE SECTOR RESILIENT
Forecast platinum auto demand(33)Platinum auto demand split(32)
Europe Light Duty Diesel
43%
RoW Light Duty Diesel30%
Global Light Duty
Gasoline8%
Global Heavy Duty Diesel19%
2018 2025
Gasoline pt:pd Substitution at 10%
Global Light Duty Gasoline
Global Heavy Duty Diesel
RoW Light Duty Diesel
Europe Light Duty Diesel
c.3 Moz
0.1%
Total platinum demand decrease
strong positive
Heavy duty diesel outlook
substitution
Increase in palladium and
rhodium prices could lead to
due to tighter emissions regulation
and increased demand
of platinum into gasoline autocatalysts

33
FUEL CELL DEVELOPMENT ACCELERATING
OEMs continue
investing
• Hyundai Motor to invest €64m & Kia Motors to invest €16m in collaboration on high-performance EV and FCEV
prototypes by 2020
• Audi to invest additional resources in hydrogen fuel-cell development to meet future zero-emission transportation
needs, with a focus on the China
• Toyota to work with Chinese company Re-Fire Technology to deliver key fuel cell technology to China’s FAW and
Higer buses, as well as BAIC to provide fuel cell equipment and hydrogen tanks for use in buses
Supply chain
scaling
• Engine manufacturer, Cummins purchases fuel cell manufacturer, Hydrogenics Corporation for $290m
• Bosch to cooperate with stack manufacturer, Powercell, in large-scale production of fuel cells for trucks and cars
• The Plastic Omnium Group opened two new hydrogen storage R&D centers to focus on emissions control and fuel
systems, including high-pressure hydrogen tanks and fuel cells
Governments
increasing support
• During the G20 summit in Japan, representatives from Japan, Europe & US signed a joint statement of future
cooperation on hydrogen and fuel cell technologies
• UK commits to bring all greenhouse gas emissions to net zero by 2050, widening the opportunity for adoption of fuel
cells powered by clean hydrogen across a number of applications
• Australian federal government promised A$1bn in funding for their Hydrogen Strategy to fund research and commercial
development in their hydrogen sector
• China to push ahead with the development of their hydrogen energy and fuel cell vehicle industry, as part of wider
efforts to promote green energy in the world’s largest auto market
Significant orders
placed &
opportunities
growing
• German Transport Authority, RMV, has ordered the world's largest fleet of passenger fuel cell trains from Alstom,
offering an new way to decarbonise their transport system
• UK commits to eliminate all diesel-only trains from the nation’s transport network by 2040 to reduce carbon
emissions, creating a opportunity for the use of hydrogen passenger trains

34
NET INVESTMENT IN PLATINUM CONTINUES
Net platinum investment demand (’000 ounces)(34)
198
5
198
6
198
7
198
8
198
9
199
0
199
1
199
2
199
3
199
4
199
5
199
6
199
7
199
8
199
9
200
0
200
1
200
2
200
3
200
4
200
5
200
6
200
7
200
8
200
9
201
0
201
1
201
2
201
3
201
4
201
5
201
6
201
7
201
8
201
9 (
f)
~750koz
Total platinum investment
140koz
Total palladium disinvestment
positive
Platinum growth outlook
in H1 2019
in H1 2019
due to market development
35
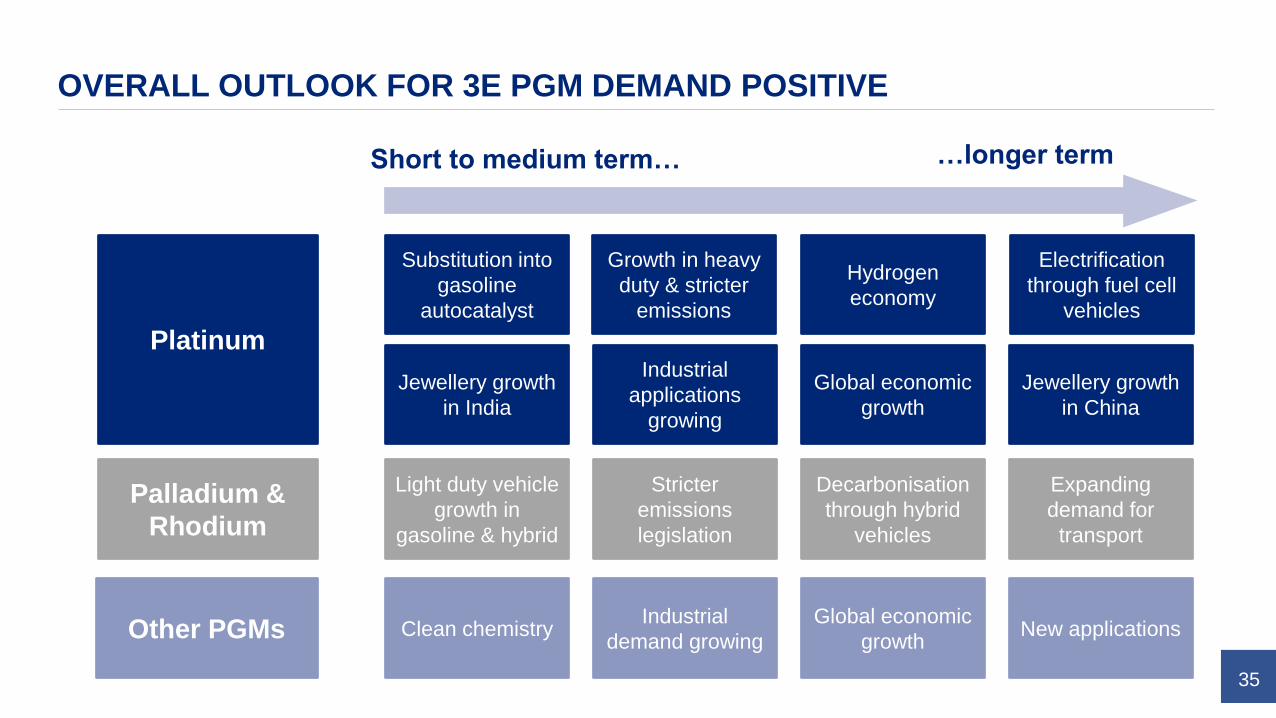
OVERALL OUTLOOK FOR 3E PGM DEMAND POSITIVE
Platinum
Palladium &
Rhodium
Other PGMs
Substitution into
gasoline
autocatalyst
Growth in heavy
duty & stricter
emissions
Industrial
applications
growing
Jewellery growth
in India
Hydrogen
economy
Electrification
through fuel cell
vehicles
Jewellery growth
in China
Global economic
growth
Stricter
emissions
legislation
Light duty vehicle
growth in
gasoline & hybrid
Expanding
demand for
transport
Decarbonisation
through hybrid
vehicles
Industrial
demand growingClean chemistry New applications
Global economic
growth
Short to medium term… …longer term

36
OPERATING IN SOUTH AFRICA
Best PGM deposits in the world based in Southern Africa
AAP adheres to the finalised Mining Charter – amended MPRDA has been withdrawn
All mining rights confirmed and converted – “Once empowered always empowered”
Black Economic Empowerment (BEE) status at 44.7% - above requirements with ongoing
transformation
Much improved labour relations – wage negotiations remain ongoing
Eskom – has headwinds – looking at alternative power sources including solar
South African Government has experience and understands importance of the mining
industry
✓
✓
✓
✓
✓
✓
✓

37
ALL-IN SUSTAINING COST (AISC)
Mogalakwena Amandelbult Unki MototoloJoint ventures
(AAP share)
Company
(ex-trading)(26)
US$ Costs (million)
Cash operating costs 322 380 77 79 161 1,769
Other costs and marketing 54 49 28 9 14 176
Capitalised waste costs 80 - - - - 80
Sustaining capital 59 19 7 11 10 126
a Total Cost 516 448 112 98 185 2,152
Total revenue excluding platinum revenue
PGMs excluding platinum 488 271 76 83 170 1,463
Base metals , chrome and other 96 46 18 3 4 167
b Total revenue ex. platinum 584 317 94 87 174 1,630
c = a - b All-in sustaining costs (68) 131 18 12 11 522
d Platinum ounces sold (000) 231.3 194.4 39.7 50.3 95.9 1,009.4
e = c ÷ d *
1,000AISC per platinum ounce sold (292) 672 456 237 116 517

38
RAND BASKET PRICE
Mogalakwena Amandelbult Unki Mototolo JVs (AAP share) Other(27) Company
(ex-trading)(28)
Net sales revenue ($ million)
from platinum 192.7 161.7 33.0 41.8 79.8 330.5 839.6
from palladium 400.5 142.4 55.8 49.5 100.1 324.7 1,073.0
from rhodium 48.5 102.2 11.9 26.2 55.2 179.4 423.3
base metals & other 134.2 76.7 26.3 10.7 18.9 108.0 374.7
a Total revenue 775.9 483.0 126.9 128.3 254.0 942.6 2,710.7
Sales volume (000 ounces)
b platinum ounces sold 231.3 194.4 39.7 50.3 95.9 397.9 1,009.4
other PGMs sold 339.8 182.1 52.5 58.0 116.1 402.1 1,150.6
c Total PGMs sold 571.1 376.4 92.1 108.2 212.0 800.0 2,160.0
d = a ÷ b * 1,000 US$ basket per platinum ounce 3,354 2,485 3,200 2,552 2,648 2,369 2,685
e = a ÷ c * 1,000 US$ basket per PGM ounce 1,358 1,283 1,377 1,185 1,198 1,178 1,255
f US Dollar / ZAR exchange rate 14.26 14.26 14.26 14.26 14.26 14.26 14.26
g = d x f Rand basket per platinum ounce 47,841 35,450 45,646 36,403 37,770 33,793 38,305
h = e x f Rand basket per PGM ounce 19,376 18,303 19,646 16,907 17,089 16,806 17,901

39
FOOT NOTES
(1) Source: Bloomberg, company disclosure, Company analysis
(2) Mineral Resources classified as Measured, Indicated and Inferred, inclusive of Ore Reserves
(3) Return on Capital measure defined by Bloomberg as [(Net income + Minority Interest + Interest Expense)*(1-Effective Tax Rate/100)] / Average Total Capital * 100
(4) Revenue calculated as annualised H1 2019 revenue of R42.8billion, translated at the average achieved FX rate of 14.26 ZAR:1 USD
(5) Market Capitalisation as at 11 September 2019 of R228.779 billion, translated at the average achieved FX rate of 14.26 ZAR:1 USD
(6) Source: Johnson Matthey
(7) Source: LMC Automotive
(8) ICE stands for Internal Combustion Engine
(9) Source: Johnson Matthey, Company analysis
(10) Source: Johnson Matthey, SNL, Company analysis
(11) Total recordable case injury frequency rate (TRCFR) is a measure of the rate of all injuries requiring treatment above first aid per 1,000,000 hours worked
(12) ESG stands for environmental, social and governance
(13) Sustainalytics is a global leader in ESG and Corporate Governance research and ratings. Over the last 25 years, they have brought together leading ESG research and client servicing professionals.
Today, Sustainalytics supports hundreds of the world’s foremost investors who incorporate ESG and corporate governance insights into their investment processes.
(14) ROCE stands for return on capital employed
(15) Net cash position at 30 June 2019 was R6.0billion, translated at the period end FX rate of 14.17 ZAR:1 USD.
(16) Total cash dividends paid equates to H2 2018 dividend paid of R2.0 billion and H1 2019 dividend paid of R3.0 billion, translated at the period end FX rate of 14.17 ZAR:1 USD
(17) Life of mine estimated based on current production levels. Despite the long life of mine, the Company will need to renew mining rights in c.20 years.
(18) AISC stands for all-in sustaining costs: defined as cash operating costs, overhead costs, other income and expenses, all sustaining capital expenditure, capitalised waste stripping and allocated marketing
and market development costs net of revenue from all metals other than platinum
(19) Free cash flow is defined as cash flow from operations, less capital, less project capital, less cash tax and net interest paid
(20) All numbers translated at the average achieved FX rate of 14.26 ZAR:1 USD
(21) EBITDA stands for earnings before interest, tax, depreciation and amortisation
(22) Level 4-5 environmental incidents are defined as high or major impact to the receiving environment, and have high or major sensitivity to the impact. Anglo American has redefined its environmental
incidents scale with levels 4 and 5 incidents now classified as high and major significant incidents (previously defined as level 3 to 5)
(23) Total waste to landfill reduction from 2013 to H1 2019 annualised
(24) TRCFR figure reduction from 2013 to H1 2019
(25) CO2 emissions reduction from 2013 to H1 2019 annualised
(26) Total investment into SO2 abatement of R2.5bn, translated at the average achieved FX rate of 14.26 ZAR:1 USD
(27) Total spend of R2.0bn since 2013, translated at the average achieved FX rate of 14.26 ZAR:1 USD
(28) Global recognition includes highest rating scores achieved on environmental and social aspects from ISS-Oekom, included in the FTSE4Good Index since June 2015; first place ranking by Sustainalytics
on ESG in the precious metals sector globally; best Emerging Market performer as rated by Vigeo Eiris; and included in the FTSE/JSE Responsible Investment Index
(29) Source: Johnson Matthey
(30) Source: Johnson Matthey
(31) Source: Johnson Matthey, Platinum Guild International
(32) Source: LMC Automotive
(33) Source: Johnson Matthey, LMC Automotive, Company analysis
(34) Source: Johnson Matthey, Bloomberg, Company analysis
Recommended