Embed Size (px)
Citation preview

AN
GL
O A
ME
RIC
AN
PL
AT
INU
M L
IMIT
ED
AN
NU
AL R
ES
ULTS
2019
ANGLO AMERICAN PLATINUM LIMITED
ANNUAL RESULTS 2019
RE-IMAGINING MINING TO IMPROVEPEOPLE’S LIVES

KEY FEATURES
1 Performance highlights
2 2019 Annual results commentary
16 Summarised consolidated statement of comprehensive income
17 Summarised consolidated statement of financial position
18 Summarised consolidated statement of cash flows
19 Summarised consolidated statement of changes in equity
20 Notes to the summarised consolidated financial statements
37 Auditor’s report
CONTENTS
www.angloamericanplatinum.com/investors/annual-reporting/2019
SUPPORTING DOCUMENTATION ON THE WEBSITEFull annual financial statements (AFS)Full Ore Reserves and Mineral Resources reportEnvironmental, social and governance (ESG) report
38 Sustainability commitments
40 Group performance data
IBC Administration
NET SALES REVENUE
R99.6bnR99.6bn
R74.6bn
2019
2018
NET CASH
R17.3bnR17.3bn
R2.9bn
2019
2018
BASIC EARNINGS PER SHARE
7,046 cents7,046 cents
2,631 cents
2019
2018
EBITDA
R30.0bnR30.0bn
R14.5bn
2019
2018
ROCE
58.0%58.0%
23.8%
2019
2018
DIVIDEND DECLARED PER SHARE■ Interim ■ Final
5,260 cents2019
2018
4,160 cents
cents
1,100
751374
HEADLINE EARNINGS PER SHARE
7,087 cents7,087 cents
2,893 cents
2019
2018
OPERATING FREE CASH FLOW
R16.9bnR16.9bn
R5.6bn
2019
2018
FATALITY-FREEOwn managed operations
00
2
2019
2018
Anglo American Platinum Limited Annual Results 2019 1
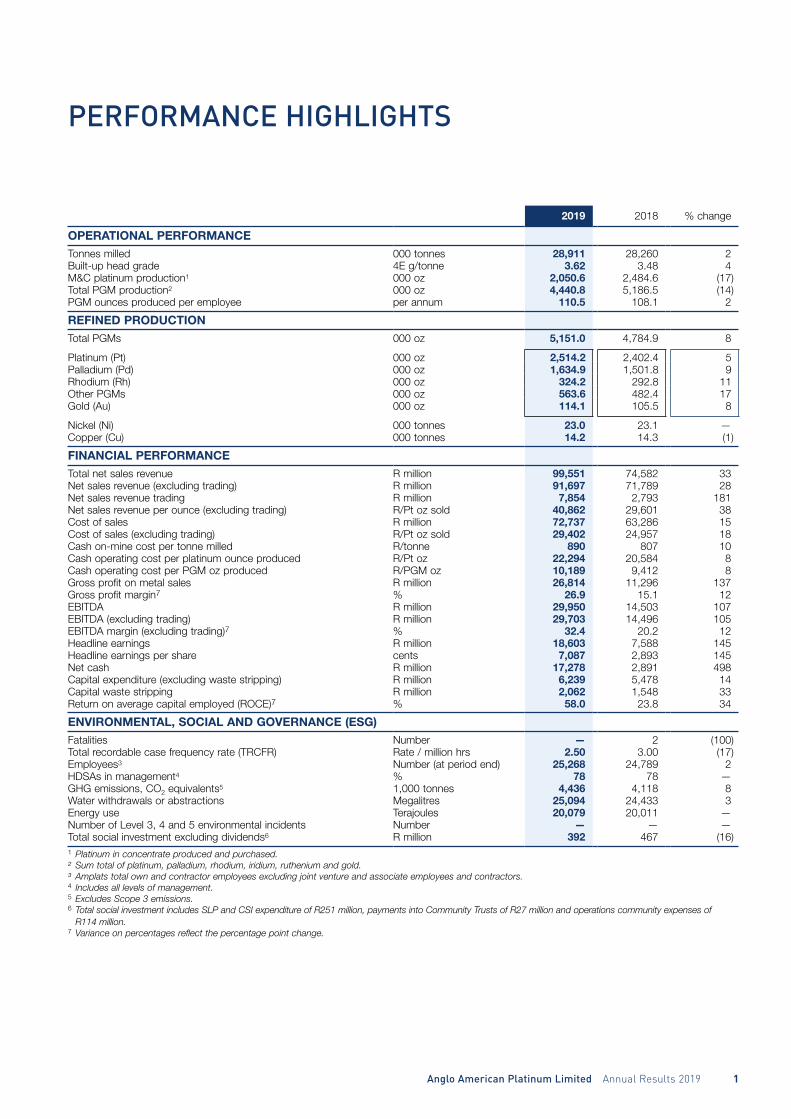
PERFORMANCE HIGHLIGHTS
2019 2018 % change
OPERATIONAL PERFORMANCETonnes milled 000 tonnes 28,911 28,260 2 Built-up head grade 4E g/tonne 3.62 3.48 4 M&C platinum production1 000 oz 2,050.6 2,484.6 (17)Total PGM production2 000 oz 4,440.8 5,186.5 (14)PGM ounces produced per employee per annum 110.5 108.1 2
REFINED PRODUCTIONTotal PGMs 000 oz 5,151.0 4,784.9 8
Platinum (Pt) 000 oz 2,514.2 2,402.4 5 Palladium (Pd) 000 oz 1,634.9 1,501.8 9 Rhodium (Rh) 000 oz 324.2 292.8 11 Other PGMs 000 oz 563.6 482.4 17 Gold (Au) 000 oz 114.1 105.5 8
Nickel (Ni) 000 tonnes 23.0 23.1 —Copper (Cu) 000 tonnes 14.2 14.3 (1)
FINANCIAL PERFORMANCETotal net sales revenue R million 99,551 74,582 33 Net sales revenue (excluding trading) R million 91,697 71,789 28 Net sales revenue trading R million 7,854 2,793 181 Net sales revenue per ounce (excluding trading) R/Pt oz sold 40,862 29,601 38 Cost of sales R million 72,737 63,286 15 Cost of sales (excluding trading) R/Pt oz sold 29,402 24,957 18 Cash on-mine cost per tonne milled R/tonne 890 807 10 Cash operating cost per platinum ounce produced R/Pt oz 22,294 20,584 8Cash operating cost per PGM oz produced R/PGM oz 10,189 9,412 8Gross profit on metal sales R million 26,814 11,296 137 Gross profit margin7 % 26.9 15.1 12 EBITDA R million 29,950 14,503 107 EBITDA (excluding trading) R million 29,703 14,496 105EBITDA margin (excluding trading)7 % 32.4 20.2 12 Headline earnings R million 18,603 7,588 145Headline earnings per share cents 7,087 2,893 145Net cash R million 17,278 2,891 498Capital expenditure (excluding waste stripping) R million 6,239 5,478 14 Capital waste stripping R million 2,062 1,548 33 Return on average capital employed (ROCE)7 % 58.0 23.8 34
ENVIRONMENTAL, SOCIAL AND GOVERNANCE (ESG)Fatalities Number — 2 (100)Total recordable case frequency rate (TRCFR) Rate / million hrs 2.50 3.00 (17)Employees3 Number (at period end) 25,268 24,789 2 HDSAs in management4 % 78 78 —GHG emissions, CO2 equivalents5 1,000 tonnes 4,436 4,118 8 Water withdrawals or abstractions Megalitres 25,094 24,433 3Energy use Terajoules 20,079 20,011 —Number of Level 3, 4 and 5 environmental incidents Number — — —Total social investment excluding dividends6 R million 392 467 (16)1 Platinum in concentrate produced and purchased.² Sum total of platinum, palladium, rhodium, iridium, ruthenium and gold.³ Amplats total own and contractor employees excluding joint venture and associate employees and contractors.4 Includes all levels of management.5 Excludes Scope 3 emissions.6 Total social investment includes SLP and CSI expenditure of R251 million, payments into Community Trusts of R27 million and operations community expenses of
R114 million.7 Variance on percentages reflect the percentage point change.
ANNUAL RESULTS 2019 ANNUAL RESULTS COMMENTARY
2 Anglo American Platinum Limited Annual Results 2019
2019 ANNUAL RESULTS
Anglo American Platinum Limited Annual Results 2019 3
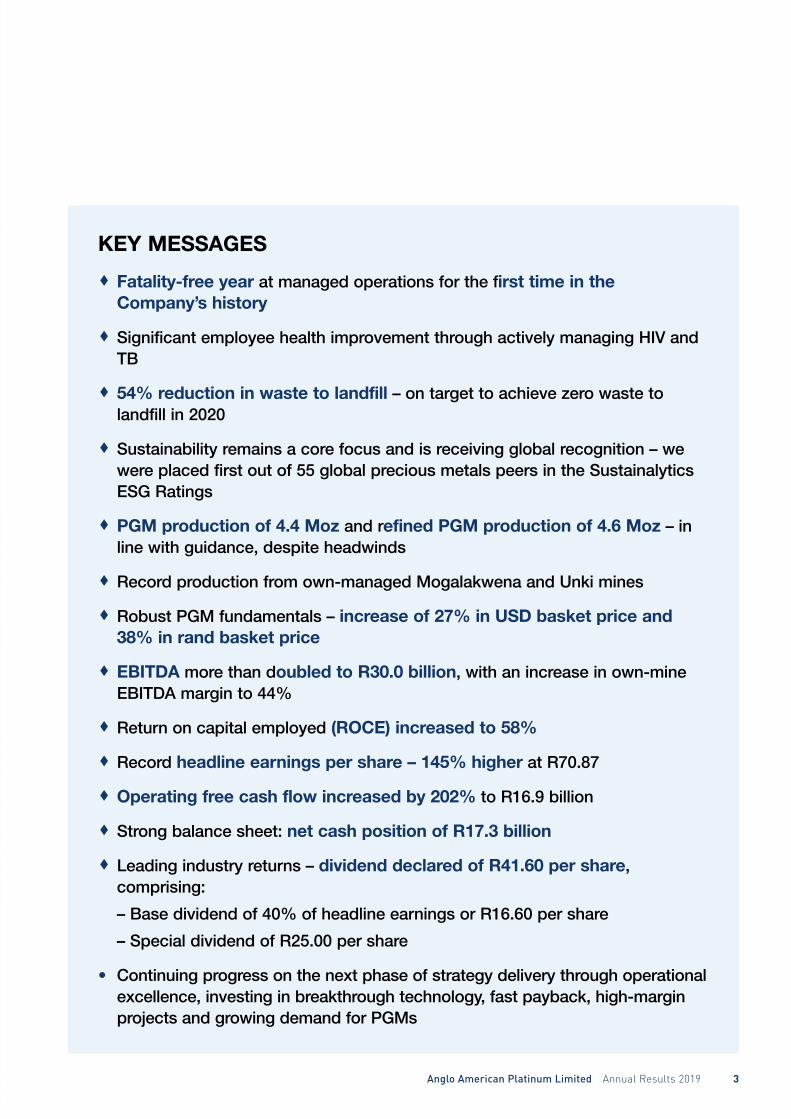
KEY MESSAGES
Fatality-free year at managed operations for the first time in the Company’s history
Significant employee health improvement through actively managing HIV and TB
54% reduction in waste to landfill – on target to achieve zero waste to landfill in 2020
Sustainability remains a core focus and is receiving global recognition – we were placed first out of 55 global precious metals peers in the Sustainalytics ESG Ratings
PGM production of 4.4 Moz and refined PGM production of 4.6 Moz – in line with guidance, despite headwinds
Record production from own-managed Mogalakwena and Unki mines
Robust PGM fundamentals – increase of 27% in USD basket price and 38% in rand basket price
EBITDA more than doubled to R30.0 billion, with an increase in own-mine EBITDA margin to 44%
Return on capital employed (ROCE) increased to 58%
Record headline earnings per share – 145% higher at R70.87
Operating free cash flow increased by 202% to R16.9 billion
Strong balance sheet: net cash position of R17.3 billion
Leading industry returns – dividend declared of R41.60 per share, comprising:
– Base dividend of 40% of headline earnings or R16.60 per share
– Special dividend of R25.00 per share
• Continuing progress on the next phase of strategy delivery through operational excellence, investing in breakthrough technology, fast payback, high-margin projects and growing demand for PGMs

ANNUAL RESULTS 2019 ANNUAL RESULTS COMMENTARY
4 Anglo American Platinum Limited Annual Results 2019
Chris Griffith, CEO of Anglo American Platinum commented:
“For the first time in Anglo American Platinum’s history, we have had no workplace fatalities at our managed operations in the year. Our intense focus on eliminating fatalities is yielding positive results and, while we are proud of this milestone, we also need to eliminate injuries and extend our safety efforts to our non-managed operations. We are deeply saddened to have lost one of our colleagues, Thomas Maluleke, at our independently managed Modikwa JV operation in March. We express our deepest condolences to Mr Maluleke’s family, friends and colleagues.
Anglo American Platinum has delivered another strong set of operational and financial results. The world-class Mogalakwena again achieved record production, up 4% in 2019. Unki mine in Zimbabwe also had an outstanding performance with record production, up 5%. The turnaround plan at Amandelbult is progressing, and we saw a 12% improvement in H2 over H1, which we expect to continue into 2020. Mototolo production decreased, largely due to a three-week strike, as well as difficult ground conditions and the start of access to the contiguous ground as development ramped up.
Overall, PGM production was up 1%, despite the impact of Eskom power outages, which led to the loss of 38,000 PGM ounces of production. These outages also impacted refined production, which led to a build-up in work-in-progress inventory of 89,000 PGM ounces, which will be refined in 2020.
Despite the temporary build-up in work-in-progress inventory, operating free cash flow increased 202% to R16.9 billion, benefiting from the strong fundamentals of the commodity basket we mine, with a 38% increase in the rand basket price. This has further strengthened the Company’s cash position to R17.3 billion.
We continue to progress the next phase of our strategy, focusing on optimising value at our operations through world-best operating practices, modernisation and by investing in breakthrough projects to reach new benchmark (known as P101) levels of productivity and the implementation of FutureSmart MiningTM technologies, digitalisation and sustainability. We expect these efforts to lead to an EBITDA margin increase of 5-8 percentage points by 2023 from our 2018 base – this year, we achieved a 2 percentage point margin expansion. We continue to assess the project studies for expansion at Mogalakwena and Mototolo/Der Brochen, as well as investing in market development to stimulate incremental demand for our platinum group metals.
Anglo American Platinum is committed to delivering PGM-industry-leading returns and has doubled EBITDA to R30.0 billion, with an increase in the own-mine EBITDA margin to 44%; and an increase in ROCE to 58%. Given the strong cash generation, the Board has declared a final dividend for H2 2019 of R11.2 billion or R41.60/share. This comprises the base dividend of 40% payout of headline earnings of R16.60/share, as well as a special dividend of R25.00/share.
This is a safer, more resilient and productive business today as a result of the actions we have taken in recent years, and I’m pleased to say that there is considerable additional value that can be unlocked.”

Anglo American Platinum Limited Annual Results 2019 5
STRATEGIC OVERVIEWThe next phase of our strategy has been formulated to maximise margins, returns and cash flows within a changing market and competitor landscape. We continue to see further material upside value in the Company, with work under way to extract and deliver the full potential from existing operations and progress growth options of our world-class resources.
Next phase of value deliveryWe are working to reset operational performance benchmarks across our business, recognising the further latent potential that exists in our operations, and despite the material improvements we have made in recent years. Whether it’s extending the operating hours of a haul truck or shortening the lost time between shift changes, or to completely rethinking established practices, Anglo American Platinum believes there is substantial additional value to be gained by focusing on best-practice benchmarks to take performance beyond benchmark (also known as P101).
We are looking for breakthrough opportunities, which enable a step-change in production or value, through new technology deployment known as FutureSmart MiningTM. Examples include our current trial of bulk-ore sorting at Mogalakwena, which aims to increase grade delivered to the concentrator plant, and our deployment of extra-low-profile mechanised equipment at Tumela 15E, a separate mechanised section of the mine which will lead to safer and more efficient mechanised production.
The Company is committed to investing in fast payback, high-margin, high-value projects, which will contribute to expanding our EBITDA margin from 20% in 2018 to 25-28% by 2023 (at 2018 prices and foreign exchange rates and excluding the impact from expansion projects). The Company achieved a 2 percentage point expansion in 2019, with the EBITDA margin increasing to 22% (at 2019 achieved prices and foreign exchange rates, the EBITDA margin was 32%). The Company remains committed to investing in projects such as the copper debottlenecking at Rustenburg Base Metals Refinery, the Unki concentrator debottlenecking, and modernisation of Amandelbult, among other projects in execution. These projects are focused on maximising value, not necessarily volume, with our disciplined capital allocation focused on generating strong returns.
Mogalakwena expansionMogalakwena remains the world’s most significant PGM operation and the only major open-pit PGM operation globally. The mine is in the lowest quartile of the primary PGM producer cash cost curve and, as a palladium-rich resource, will benefit from current and medium-term structural deficits in the palladium market.
Given the size of the resource, the project studies have identified several options to expand PGM production, by investing in additional concentrator capacity, deployment of new technology to improve throughput and recoveries as well as developing the underground resource to maximise long-term value. The pre-feasibility study is in progress and the preferred option will be advanced to feasibility stage during Q2 2020.
Mototolo/Der BrochenThe acquisition of 100% of Mototolo mine unlocks significant synergies between this mine and the adjacent Der Brochen resource. Project studies are under way to assess the most value-accretive options for the replacement and potential growth of this new PGM complex. By combining the Mototolo JV area with the down-dip and adjacent Der Brochen resource, the ability to mine into the contiguous resource, which only requires extending existing infrastructure, has significantly
extended the life-of-mine from the current five years to potentially beyond 30 years.
We have two project studies under way. The most advanced study is the replacement of Mototolo into the Der Brochen ground, which is in feasibility study. The study is focused on establishing Der Brochen South Shaft, replacing the Lebowa shaft which is coming to the end of life-of-mine. This replacement project will utilise the current concentrator infrastructure, and therefore be a low-cost replacement project. The potential expansion of Mototolo/Der Brochen is also being evaluated and is in pre-feasibility B stage. Breakthrough technology is being assessed to enable an increase in throughput and improve grade to the concentrator, which could result in both replacement and potential growth in production.
Developing the market for PGMsMarket development is a key strategic priority where latent demand across jewellery, investment and industrial segments remains a large and growing opportunity to create new and additional demand for PGMs. The Company focuses on growing jewellery demand through the Platinum Guild International (PGI); investment demand through the World Platinum Investment Council (WPIC); industrial demand through own investments and our funding of AP Ventures; and through advocacy, research and development.
SAFETY, HEALTH, ENVIRONMENT AND SOCIAL INVESTMENT
Safety – best ever performance in 2019The safety, health and well-being of our employees remains a core value. We are committed to eliminating fatalities, to reducing (and ultimately eliminating) injuries from the workplace, and to preventing any adverse effects on employee health. While our safety and health performance during the year reflects our progress in building a culture of zero harm at our operations, we are mindful that much more needs to be done to create our desired safety culture, building safety leadership and a culture of safety consciousness and operational discipline.
We are implementing the following key systems, processes and initiatives for safety and health:
• Resilient management systems – The benefit of integrating health and safety into a single management system is evident in improved planning and scheduling of work and tasks, which allows for better risk prevention and aligns with the goal of zero harm.
• Effective risk management – Implementing an operational risk management (ORM) system enables employees to identify, prioritise and control risks that threaten their ability to meet safety objectives. ORM ensures an emphasis on improving safety performance and eliminating fatalities. We conduct operational risk assessments that focus on the most significant risks identified at the respective operations, and commission specialists to audit compliance to critical controls and ensure best practice.
• Incident management – Reporting and investigating health and safety incidents are essential to managing risks and tracking progress in hazard prevention and control measures. The Company has in-house systems to learn from incidents and promote reporting of high-potential incidents and high-potential hazards to heighten awareness, facilitate organisational learning and effect more robust controls.
• Engagement – The Company plays an integral part in the broader industry’s initiatives to improve safety and health and maintains constructive and collaborative relationships with regulators, including the Department of Mineral Resources and Energy (DMRE).
Our intense focus on eliminating fatal risks has ensured our managed operations have been fatality-free since 18 October 2018. This important milestone on our safety journey is complemented by a steady
ANNUAL RESULTS 2019 ANNUAL RESULTS COMMENTARY
6 Anglo American Platinum Limited Annual Results 2019
reduction in the number and severity of injuries and improvements across all key safety performance indicators, including our lowest total recordable injury frequency rate (TRCFR).
HealthAnglo American Platinum has demonstrated its commitment to a zero-harm approach which extends to the health and well-being of its employees. Among other interventions, the Company has responded to the HIV and tuberculosis (TB) prevalence among our employees. This is evidenced by adopting health policies, allocating resources aimed at enrolling employees living with HIV on treatment programmes and reducing the incidence of TB and its associated complications.
The Company met and exceeded the 90:90:90 targets on HIV set by UNAIDS. The UNAIDS target includes 90% of employees knowing their status and 90% of HIV-positive employees taking anti-retroviral therapy (ART), with 90% viral load suppression. At the end of 2019, 97% of employees knew their status. The uptake of ART by HIV-positive employees increased to 91%, of whom 90% have viral load suppression.
We have intensified the proactive management of TB and roll-out of isoniazid prophylaxis (treatment for TB). The combined HIV and TB initiatives contributed to the TB incidence declining from 1,020 per 100,000 people in 2014 to 328 in 2019, significantly below the South African national average of 567. Deaths related to TB reduced to three cases (five cases in 2018).
EnvironmentWe had no high or major environmental incidents (categorised as level 4 and 5).
In responding to the global challenge of climate change, our activities focus on radically reducing our energy consumption through FutureSmart MiningTM methods and technology adoption, as well as switching to low-carbon energy sourcing and increasing renewables in our energy mix. Aligned with this approach, we have set 2030 targets to improve energy efficiency and reduce absolute greenhouse gas (GHG) emissions by 30%, against a 2016 baseline. We have steadily decreased our energy and GHG intensities by 7% since 2016. Including the new operations of Mototolo mine post-acquisition and building the Unki smelter, GHG intensities have reduced by 4% since 2016.
The implementation of best-practice water-treatment and recovery technologies continues to drive progress in improving our water-use volumes and intensities. Our risk-based approach to water management focuses on implementing site-wide and regional water balances, supported by a water information and management system to optimise recycling and re-use. Currently, 44% of water brought onto site is from treated effluent and grey water (obtained by investing in municipality waste-water treatment).
We have made considerable progress in reducing our hazardous and non-hazardous waste to landfill by securing the services of an external waste expert who supported us in developing a waste strategy and related solutions to achieve our ambition of zero waste to landfill by the end of 2020. In 2019, we recorded a 54% reduction in total waste to landfill.
Our most material air-quality priority relates to sulphur dioxide (SO2) emissions from our three smelters in South Africa. In 2018, construction began on the abatement project at Polokwane smelter, which is using innovative technology to capture SO2 gas from the furnace and convert it to sulphuric acid. With a capital investment of R2.5 billion, the technology will ultimately reduce SO2 emissions by an estimated 96%, to comply with increasingly stringent limits and become global best practice. Once construction and commissioning have been completed, and the project proven to be effective, a similar plant will be constructed at the Mortimer smelter.
Tailings storage facilities (TSFs)Tailings storage facilities (TSFs) are a management focus and subject to a rigorous risk-management programme. Anglo American Platinum deploys industry-leading minerals residue facility management which are subject to Anglo American plc technical standards. These standards include six levels of assurance and oversight (two internal, two external and two independent) over each of the nine own-managed tailings storage facilities.
We implement standards that exceed current International Council on Mining and Metals (ICMM) and regulatory requirements in all host jurisdictions. This best-in-class standard sets minimum requirements for design criteria, monitoring, inspection and surveillance, and was peer-reviewed by international specialists.
Our approach, status and actions have been disclosed on our website at: https://www.angloamericanplatinum.com/sustainability/managing-tailings-safely
Social and community investmentAnglo American Platinum engages continuously with stakeholders: host communities, communities in labour-sending areas, the media, government, non-governmental organisations (NGOs), members of our supply chain and our joint venture (JV) partners. We focus on the concerns and opinions of our stakeholders and respond appropriately to support both our social capital and licence to operate. Our approach is based on being transparent and responding timeously and professionally to their concerns. This strategy is designed to both minimise value destruction (negative social capital impacts) and maximise value creation (positive social capital impacts). Dedicated teams continue to focus on improved outcomes by implementing our social performance strategy, clarifying roles, ensuring appropriate resourcing, and establishing systems (including digital support) to manage social processes, governance, risk and compliance.
We remain focused on delivering on our commitments for 2016-2020 social and labour plans (SLPs) and have initiated stakeholder engagements to develop and co-create the SLPs 2021-2025. To date, our flagship projects have created over 1,200 jobs, and more than 8,000 learners have benefited from our education support programme. The SLPs, regional socio-economic development (SED), Alchemy (community share scheme) and Zimele (building and growing small businesses in our communities) strategies aim to deliver lasting benefits for the communities in which we operate. In 2019, we spent R619 million on communities, with R392 million spent on SLPs and corporate social investment, and R227 million paid in dividends through the Amandelbult chrome plant community share scheme and the Alchemy community share schemes.
ESG performanceIn 2019, Anglo American Platinum demonstrated leading environmental, social and governance (ESG) performance, due to strong management of issues encountered by the business.
The key ESG achievements for 2019 include:
1. Ranked by Sustainalytics as the first-placed performer out of 55 global peers in the precious metals sector. This stems from the Company’s leading position on social and environmental issues. Our ESG-related disclosure follows best practice, signalling strong accountability to investors and the public owing to strong oversight at Board and executive levels.
2 Ranked as the ESG leader among the top five sub-sector peers by FTSE Russell in December 2019. The Company received the highest overall ESG rating of 4.8, the highest environmental score (4.7), the highest social score (4.7) and highest governance score (5.0) among the top 5 sub-sector peers in the platinum and
Anglo American Platinum Limited Annual Results 2019 7
precious metals sector. The Company maintained its membership in the FTSE4Good Index.
3 Maintained inclusion in the Top 30 FTSE/JSE Responsible Investment Index.
4 Maintained inclusion in the Vigeo Eiris Best Emerging Markets performers ranking for 2019, on account of leading ESG performance.
5 After period end, Anglo American Platinum was included in the Bloomberg Gender-Equality Index for 2020, reflecting our significant progress in creating an inclusive and diverse workplace.
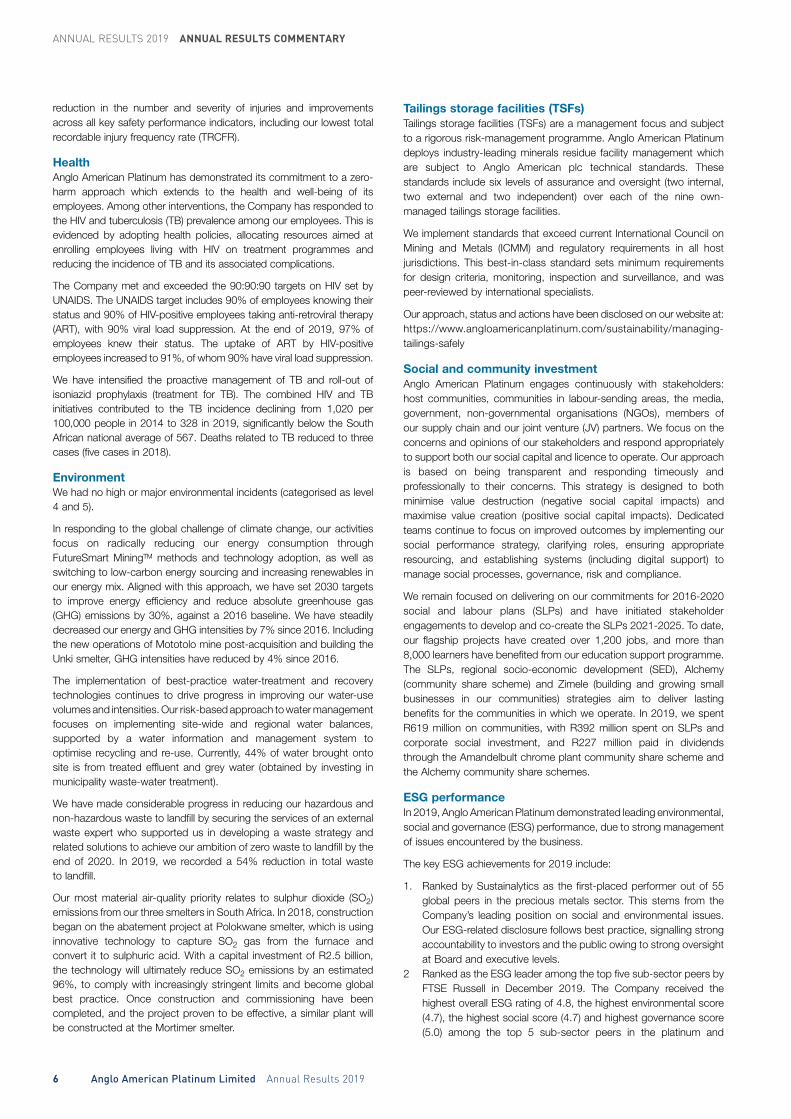
OPERATIONAL PERFORMANCEProduction numbers have been adjusted in the previous periods to enable a fair comparison between each period as follows:
• Exclude Sibanye-Stillwater 4E ounces (expressed as platinum, palladium, rhodium and gold) from purchase-of-concentrate (POC) from third parties as this production moved from POC to tolled production at the end of Q1 2019
• Include Mototolo production as own mined production on a 100% basis (previously 50:50 joint venture)
• Include Union production as POC from third parties (previously own-mined production)
• Include Bafokeng Rasimone Platinum Mine (BRPM) production as POC from third parties (previously 33% interest in joint venture treated as POC from joint ventures).
Total production (metal in concentrate)
Total production (M&C) 2019 2018 %
PGMs 4,440,800 4,409,400 1Platinum 2,050,600 2,020,400 1Palladium 1,385,900 1,379,200 —
Anglo American Platinum delivered steady PGM production (expressed as platinum, palladium, rhodium, gold, iridium and ruthenium metal in concentrate), increasing by 1% to 4,440,800 ounces, with record production from Mogalakwena and Unki. This strong performance was despite power disruptions in Q1 and Q4 2019, an unprotected strike at Mototolo in Q2 2019, maintenance of a cracked mill and rebuild of the rope shovel at Mogalakwena.
The 4E built-up head grade of 3.62g/tonne was 4% higher, largely owing to higher grade from Mogalakwena as high-grade ore stockpiles were drawn down, as well as higher grades at Amandelbult arising from a higher proportion of underground tonnes milled relative to lower-grade surface tonnes.
Mogalakwena
Production (M&C) 2019 2018 %
PGMs 1,215,000 1,170,000 4Platinum 517,500 495,100 5Palladium 557,900 540,900 3
Mogalakwena’s PGM production increased 4% to a record 1,215,000 ounces. Production in 2019 was impacted by load shedding, the shutdown of a secondary mill at North concentrator in H1 2019 in order to repair a crack, and lower equipment availability caused by a major rebuild on the rope shovel in October and November.
The shovel rebuild led to a decrease in overall tonnes mined for 2019. The start of a new mining cut resulted in higher waste tonnes mined, leading to a decrease in ore mined over the period, partially offset by a drawdown from ore stockpiles. Ore tonnes mined were further affected by rock-fall risk-mitigation measures at the Zwartfontein pit in the final quarter of 2019.
Greater mining equipment availability, the purchase of additional trucks, as well as mining the exposed ore tonnage area, will increase ore tonnes and total tonnes mined in 2020.
Key financials 2019 2018 %
EBITDA (R million) 14,375 8,249 74Economic free cash flow (R million) 9,935 4,039 146Cash operating cost per platinum ounce R19,208 R18,522 4Cash operating cost/PGM ounce R8,181 R7,838 4AISC1 (US$/Pt oz) (429) 286 (250)
1 All-in sustaining costs (AISC) (includes operating costs as defined above, all sustaining capital expenditure, capitalised waste stripping and allocated marketing and market development costs net of revenue from all metals other than platinum) per platinum ounce sold.
The mine delivered an EBITDA margin of 56% (2018: 46%). Return on capital employed increased to 55% from 31%. All-in sustaining costs reduced by 250% to negative $429 per platinum ounce due to the strong revenue generated from metals other than platinum.
Cash operating costs (costs after allowing for off-mine smelting and refining activities) increased by 8% to R10.0 billion, driven by increases in input cost inflation and maintenance costs. Cash operating costs, including capitalised waste stripping, increased by 12% to R12.0 billion.
Cash operating costs per platinum ounce increased 4% to R19,208 owing to input cost inflation and the drawdown of ore stockpiles, which contributed R1,166 per platinum ounce to the increase, partly offset by an increase in capitalised waste benefiting unit cost by R993 per platinum ounce. Cash operating cost per PGM ounce (metal-in-concentrate) was R8,181.
Amandelbult
Production (M&C) 2019 2018 %
PGMs 893,300 868,800 3Platinum 453,600 442,700 2Palladium 208,900 205,100 2Chrome (tonnes) 908,700 831,900 9
Total PGM production increased by 3%, reflecting the strategy to ramp-up the Dishaba UG2 section, and an improved safety performance that meant fewer safety-related stoppages. As Amandelbult transitions mining from Tumela upper section to Dishaba lower section, the complex is becoming primarily a UG2 mine, benefiting from high chrome and rhodium metal content.
Production from the chrome plant increased by 9%, yielding 908,700 tonnes of chrome concentrate on a 100% basis. This was due in part to the commissioning of the new Merensky chrome plant, which enabled a 14% increase in plant feed, partly offset by a reduction in plant yield to 15.1% (2018: 15.7%).
Amandelbult Chrome generated attributable economic free cash flow of R384 million (2018: R664 million). This was due to a 1% decline in sales volume to 798,100 tonnes and a 17% decline in the achieved chrome price. Sales volumes were affected by delays in rail infrastructure implementation and failures from providers on railing commitments. The average chrome price (CIF China equivalent) for the year decreased to USD148 per tonne (2018: USD178 per tonne).

ANNUAL RESULTS 2019 ANNUAL RESULTS COMMENTARY
8 Anglo American Platinum Limited Annual Results 2019
Key financials 2019 2018 %
EBITDA (R million) 5,132 2,031 153Economic free cash flow (R million) 3,278 603 444Cash operating cost per platinum ounce R24,923 R22,752 10Cash operating cost/PGM ounce R12,654 R11,441 11AISC1 (US$/Pt oz) 390 794 (51)
1 All-in sustaining costs (AISC) (includes operating costs as defined above, all sustaining capital expenditure and allocated marketing and market development costs net of revenue from all metals other than platinum) per platinum ounce sold.
Amandelbult delivered an EBITDA margin of 30%, up from 15% in 2018. Economic free cash flow increased by a strong 444%, benefiting from the increase in rhodium prices. Rhodium contributed 25% of total revenue for Amandelbult, from 16% in 2018. Amandelbult produced 29% of the Company’s total rhodium production in 2019. Return on capital employed increased to 49% from 17%. All-in sustaining costs reduced 51% to USD390 per platinum ounce sold for the year.
Cash operating costs increased by 9% to R10.8 billion (2018: R9.9 billion) on input cost inflation driven primarily by wages and electricity, and additional costs in developing ore reserves, which were equipped to provide an increase in immediately stopeable ore reserves (IMS) from four months in 2018 to nine months in 2019. As a result, cash operating costs per platinum ounce increased 11% to R24,923. Cash operating costs per PGM ounce (metal-in-concentrate) increased to R12,654.
Unki
Production (M&C) 2019 2018 %
PGMs 201,700 192,800 5Platinum 89,400 85,900 4Palladium 79,200 75,500 5
Total PGM production increased by 5%, a record performance. This was driven by improved underground mining efficiencies, resulting in improved ore deliveries to the concentrator, and a 9% increase in tonnes milled as a result of improved feed rate and mill run-time. These increases were mitigated by a 2% decrease in 4E built-up head grade.
Key financials 2019 2018 %
EBITDA (R million) 1,520 835 82Economic free cash flow (R million) 1,064 5252 103Cash operating cost per platinum ounce $1,823 $1,814 —Cash operating cost/PGM ounce $808 $809 —AISC1 (US$/Pt oz) 88 616 (86)
1 All-in sustaining costs (AISC) (includes operating costs as defined above, all sustaining capital expenditure and allocated marketing and market development costs net of revenue from all metals other than platinum) per platinum ounce sold.
2 Excluding the sale of treasury bills of R218 million in 2018.
Unki’s economic free cash flow increased to R1,064 million from R525 million, due to improved metal prices and increased volume. All-in sustaining costs reduced by 86% to USD88 per platinum ounce sold.
The mine delivered an EBITDA margin of 35%, against 29% in 2018. Return on capital employed increased to 24% from 9% in 2018.
Unki is a dollar-denominated operation. USD costs increased 5%, but owing to the weakening of the rand, ZAR cash operating costs were
up 14% to R2.4 billion. Cash operating cost per platinum ounce was maintained at USD1,823, but in rand terms rose 9% to R26,437 from R24,180. Cash operating costs per PGM ounce (metal-in-concentrate) were the same as 2018 at USD808 per PGM ounce, but in rand terms were 9% higher at R11,721 (2018: R10,784).
Mototolo
Production (M&C) 2019 2018 %
PGMs 242,300 287,700 (16)Platinum 112,000 132,400 (15)Palladium 68,700 82,900 (17)
Total PGM production decreased by 16% to 242,300 ounces. In 2018, the mine had a one-off benefit of 20,800 PGM ounces (platinum 9,800 and palladium 6,100) from stockpiled material that was toll-concentrated at Bokoni. Normalised for this benefit, PGM production was down 9% year on year.
Production was largely affected by a three-week unprotected strike in H1, as well as the impact of transitioning through a difficult ground area with adverse geological features.
Key financials 2019 2018 %
EBITDA (R million)1 1,956 591 231Economic free cash flow (R million)1 1,358 200 579Cash operating cost per platinum ounce R21,078 R19,518 8Cash operating cost/PGM ounce R9,747 R8,979 9AISC2 (US$/Pt oz)1 73 684 (89)
1 2018 Financial results reflect the 50% mined share from January 2018 to October 2018 and 100% ownership share from November 2010 onward.
2 All-in sustaining costs (AISC) (includes operating costs as defined above, all sustaining capital expenditure and allocated marketing and market development costs net of revenue from all metals other than platinum) per platinum ounce sold.
The mine delivered an EBITDA margin of 43%, and the return on capital employed increased to 54%. All-in sustaining costs reduced 89% to USD73 per platinum ounce sold.
Cash operating costs were R2.4 billion. At R21,078, cash operating costs per platinum ounce were up 8% primarily owing to lower mining volume, exacerbated by above CPI wage and electricity increases. Cash operating costs per PGM ounce (metal-in-concentrate) were R9,747 against R8,979 in 2018.
Joint ventures
JV mined production (M&C) 2019 2018 %
PGMs 459,000 477,000 (4)Platinum 205,800 213,300 (4)Palladium 134,500 140,000 (4)
Joint-venture mined production is comprised of 50% of the production from Kroondal and Modikwa joint-venture mines. The remaining 50% of their production is purchase of concentrate.
Total PGM production decreased by 4% due to safety stoppages and the low availability of mechanised machinery which required maintenance in 2019 at Modikwa. In 2018, Modikwa had also benefited from 12,300 PGM ounces from purchased ore tonnes from Mototolo. Production at Kroondal was the same as in 2018, benefiting from increased underground production efficiencies, as well as improved concentrator throughput, but counter-balanced by the impact of power outages.

Anglo American Platinum Limited Annual Results 2019 9
Purchase of concentrate
Production (M&C) 2019 2018 %
PGMs 1,429,600 1,413,100 1Platinum 672,400 651,000 3Palladium 336,700 334,800 1
Effective 1 January 2019, 4E material from Sibanye-Stillwater is processed under a toll arrangement (with metal produced returned to Sibanye-Stillwater), and therefore is no longer disclosed under purchase-of-concentrate.
Purchase-of-concentrate from joint-venture mines decreased 4% year on year. Purchase of PGM concentrate from third parties rose 4% due to increased volumes received from Bafokeng-Rasimone Platinum Mine and Siyanda Resources (Union), excluding 4E ounces from Sibanye-Stillwater in the prior period.
Refined production
Refined production 2019 2018 %
PGMs 4,480,700 4,029,300 11Platinum 2,112,300 1,947,400 8Palladium 1,428,200 1,280,800 12
Tolling material
Refined production 2019 2018 %
4E 496,900 — 100Platinum 303,200 — 100Palladium 154,400 — 100
Refined PGM production (excluding 4E material tolled that was previously purchase-of-concentrate) increased 11% to 4,480,700 PGM ounces, despite the impact of power outages during the year. Including 4E material that is now toll-treated, refined production was up 8%. The smelters and precious metals refinery had record performances in 2019, reflecting how our focus on operational efficiency to reach and beat world benchmarks is delivering results.
Despite the record performance, power outages resulted in an impact on refined production of 74,700 PGM ounces in Q1 2019, and a further 70,200 PGM ounces in Q4 2019. A load-shedding related event, resulting in a total power outage at the Rustenburg processing facilities in December 2019, had a further impact on refined production of 71,100 PGM ounces, with the combined total impact on refined production amounting to 216,000 PGM ounces for the year. The strong operational performance of the processing assets allowed for 127,000 PGM ounces to be refined in 2019, with 89,000 PGM ounces built up in work-in-progress inventory, which will be refined in 2020.
Sales volumes
Sales volumes (excluding trading) 2019 2018 %
PGMs 4,429,100 4,462,600 (1)Platinum 2,100,300 1,963,400 7Palladium 1,453,500 1,288,400 13Other PGMs and gold 875,300 1,210,800 (28)
Sales volumes (Trading) 2019 2018 %
PGMs 349,000 223,100 56Platinum 46,100 94,000 (51)Palladium 262,200 124,500 111
PGM sales volumes (excluding traded volumes and 4E material now toll-treated) decreased by 1% owing to lower minor metal sales (which
were particularly strong in 2018). Platinum sales volumes increased by 7% and palladium sales volumes by 13%. Refined production was supplemented by a drawdown in refined inventory due to the impact of power outages in Q4 2019.
FINANCIAL PERFORMANCE
2019 overviewAnglo American Platinum delivered a strong financial performance in 2019, benefiting from higher PGM basket prices driven by robust PGM market fundamentals. EBITDA more than doubled to R30.0 billion, resulting in an EBITDA margin of 32% (2018: 20%). We achieved record headline earnings of R18.6 billion (2018: R7.6 billion), with headline earnings per share of 7,087 cents (2018: 2,893 cents), an increase of 145%.
The balance sheet strengthened substantially to end the year with net cash of R17.3 billion, a R14.4 billion improvement from net cash of R2.9 billion at 31 December 2018.
Return on capital employed increased to 58% (2018: 24%) on the back of the strong earnings.
Key financials 2019 2018%
change
Dollar basket price/platinum ounce sold 2,819 2,219 27Rand basket price/platinum ounce sold 40,862 29,601 38Revenue (R billion) 99.6 74.6 33EBITDA (R billion) 30.0 14.5 107EBITDA margin % 32 20 12ppHeadline earnings (R billion) 18.6 7.6 145Headline earnings per share (R/share) 70.87 28.93 145Basic earnings (R billion) 18.5 6.9 168Basic earnings per share (R/share) 70.46 26.31 168Operating free cash flow (R billion) 16.9 5.7 199Net cash (R billion) 17.3 2.9 497Dividend per share (R/share) 52.60 11.25 368ROCE % 58.0 23.8 34pp
Sales revenue
Net sales revenue increased by 33% to R99.6 billion (2018: R74.6 billion). Revenue, excluding sales of purchased metals and tolling, increased by 26%. This was on the back of a 38% increase in the rand basket price to R40,862 per platinum ounce sold (compared to R29,601 in 2018), compensated by a decrease in platinum sales volumes as a result of the transition of Sibanye 4E metal from POC to toll arrangement. The 27% increase in the USD basket price was attributed to a 48% increase in the palladium price and a 73% increase in the rhodium price. The stronger USD basket price, coupled with a 9% weaker average rand/dollar exchange rate of R14.50 (2018: R13.33), resulted in a 38% higher rand basket price of USD2,819 per platinum ounce sold (2018: USD2,219).
Platinum sales volumes were 9% lower and other PGMs sales were down 14% due to the move of Sibanye 4E metal from a POC to a toll arrangement. In addition, we returned to more stable levels of minor metal sales, after a particularly strong year in 2018. Revenue generated from trading third-party metal increased by R5.1 billion to R7.9 billion. Revenue from tolling was R1.1 billion for the year.
Cost of salesCost of sales increased by 15% from R63.3 billion in 2018 to R72.7 billion as a result of increased cash operating costs and a higher cost of metals purchased, partly offset by lower purchase-of-concentrate costs.

ANNUAL RESULTS 2019 ANNUAL RESULTS COMMENTARY
10 Anglo American Platinum Limited Annual Results 2019
On-mine costs (mines and concentrators) increased by 10% to R28.7 billion as a result of input cost inflation (mainly labour and electricity) and increased maintenance costs, particularly at Mogalakwena due to maintenance on the heavy machinery equipment (HME) fleet and the secondary mill repair at North concentrator. Processing costs rose 10% to R9.4 billion in 2019 as a result of higher input costs of electricity and labour, as well as maintenance costs.
Due to the rope shovel rebuild and concentrator maintenance at Mogalakwena, ore stockpiles were drawn down to supplement production, resulting in a lower ore stockpile measurement for the year.
Given the increase in cash operating costs, the unit cost of production per platinum ounce before accounting for ore stockpile drawdowns and load shedding rose by 5% to R21,587 from R20,584. After accounting for the impact of load shedding and ore stockpile drawdowns, the unit cost rose 8% to R22,294. Unit cost per PGM ounce produced was R10,189, up from R9,412 in 2018.
Trading cost increased to R7.5 billion from R2.9 billion following an increase in purchased metal volume.
Costs associated with the purchase of concentrate reduced by R3.5 billion to R22.9 billion from R26.4 billion as Sibanye-Stillwater’s Rustenburg mines moved to a tolling arrangement from a purchase-of-concentrate agreement, and the Company no longer purchased concentrate from Mototolo as it became a 100% own-managed operation. This was offset to some extent by an increase in purchase-of-concentrate costs arising from higher prices and weaker exchange rates.
Other costs increased by R1.5 billion from R3.5 billion in 2018, primarily reflecting an increase in royalties on higher revenue.
The all-in sustaining cost per platinum ounce sold was USD293 (2018: USD756), compared to an achieved platinum price of USD861 per ounce, reflecting higher revenue from metals other than platinum.
Earnings before interest, taxation, depreciation and amortisation (EBITDA)EBITDA more than doubled to R30.0 billion from R14.5 billion in 2018. This was the result of higher USD palladium and rhodium prices and the weaker rand/USD exchange rate contributing R12.4 billion and R4.9 billion respectively, partially offset by CPI and higher royalties totalling R2.8 billion Our improved operational performance resulted in a R1.0 billion increase in sales over 2018.
The EBITDA margin achieved was 32% (2018: 20%), made up of own-mining operations of 44% (2018: 32%), JV operations of 41% (2018: 27%) and purchase-of-concentrate and toll of 14% (2018:10%).
Capital expenditureDisciplined capital expenditure prioritises maintaining asset integrity and focusing on maximising value as opposed to volume.
Capital expenditure for 2019, excluding capitalised interest and capitalised waste stripping, increased R1.3 billion to R6.0 billion from R4.7 billion in 2018.
Capital expenditure 2019 2018%
change
Stay-in-business (R billion) 4.0 3.2 23SO2 abatement (R billion) 0.8 0.4 114Projects (R billion) 0.6 1.0 (34)Breakthrough (R billion) 0.6 0.1 332Capitalised waste stripping (R billion) 2.1 1.5 33
Stay-in-business (SIB) capex increased by R0.8 billion to R4.0 billion and was focused on Mogalakwena HME and smelter rebuilds. As previously guided, the SO2 abatement project for the Polokwane smelter began in
2018 (capital spend to date of R1.2 billion), and this will continue through 2020. The Mortimer smelter’s SO2 abatement project is expected to begin in 2021.
Our focus is to invest in low-capex, fast-payback, value-accretive projects. Project capital was R0.6 billion in 2019. This was related to Amandelbult chrome plant module 3, Tumela 15E mechanised mining section and Modikwa UG2. A further R0.6 billion was spent on projects to set and exceed benchmark performance; e.g. modernisation and digitalisation at Amandelbult and the copper debottlenecking project at the Base Metal Refinery.
In 2019, R89 million was spent on project studies on expansion opportunities at Mogalakwena and Der Brochen.
In 2019, waste mined decreased to 67 million tonnes in (2018: 71 million tonnes) 2, and the cost of mining 41 million tonnes (2018: 36 million tonnes) was capitalised.
Working capitalWe continue to focus on optimising working capital levels. Trade working capital (inventory, trade debtors, trade creditors and the customer pre-payment) at 31 December 2019 was R3.1 billion, equivalent to three days, compared to R4.9 billion at 31 December 2018 (15 days). The net decrease is mainly due to an increase in the customer pre-payment of R3.2 billion driven by higher metal prices and a weakening rand compared to December 2018. This was partly offset by higher work-in-progress inventory due to the impact of power outages, increased unit costs and lower creditors after paying the Sibanye-Stillwater trade creditor for 4E metal as the agreement transitioned from a POC to a toll arrangement.
In 2019, the Company recorded a net stock count gain of R1.0 billion (2018: stock count loss of R0.5 billion). This comprised a stock count gain of 82,000 platinum ounces and 50,000 palladium ounces, valued at R1.4 billion, partially offset by stock count losses of 12,000 rhodium ounces and 300 nickel tonnes, valued at R0.4 billion.
Net debt and liquidityThe Company ended the year with a record net cash position of R17.3 billion compared to net cash of R2.9 billion at the end of 2018. This was the result of operations generating cash of R28.6 billion and an increase in the customer pre-payment of R3.2 billion. These cash flows were used to fund capital expenditure and capitalised waste stripping, collectively amounting to R8.0 billion; pay taxation and interest of R3.7 billion; associates, acquisitions and minor investments of R0.5 billion; and to pay dividends to shareholders of R4.9 billion. In addition, we adopted IFRS 16 Leases on 1 January 2019, resulting in financial liabilities increasing to R0.4 billion.
Excluding the current value of the customer pre-payment of R9.4 billion, the Company is in a net cash position of R7.9 billion (net debt of R3.2 billion in 2018). Liquidity headroom is at R38.4 billion, comprising both undrawn committed facilities of R20.2 billion and cash of R18.2 billion. The Company operates comfortably within its debt covenants.
DividendThe Company dividend policy targets a payout ratio of 40% of headline earnings. Shareholder returns are prioritised, while maintaining a strong, flexible capital structure which ensures that an appropriate level of capital is allocated to maintain asset integrity, life-extension projects and long-term value-accretive growth prospects. In line with our capital allocation framework, the Board has declared a second-half cash dividend of R11.2 billion or R41.60 per share to our shareholders, comprising:
• R16.60 per share, representing 40% of headline earnings, in line with our dividend policy, and
• R25.00 per share, being a special cash dividend.
Anglo American Platinum Limited Annual Results 2019 11
This brings the aggregate 2019 dividend to R14.2 billion or R52.60 per share, equivalent to a 76% payout on full-year 2019 headline earnings.
The dividend applies to all shareholders on the register on 6 March 2020 and is payable on 9 March 2020.
Kwanda North and Central Block acquisitionAnglo American Platinum completed the acquisition and inclusion of resources specified in the Kwanda North and Central Block prospecting rights into Mogalakwena's mining right for a total consideration of R541 million, consisting of R300 million in cash and waiving of a loan of R241 million. The cash consideration consisted of R30 million for resources specified in Kwanda North and R270 million for Central Block prospecting rights. The loan of R241 million was waived and capitalised to mining assets as part of the acquisition price for this transaction.
Material post balance sheet event
Settlement of BRPM deferred considerationAnglo American Platinum disposed of its 33% interest in Bafokeng Rasimone Platinum Mine (BRPM) to Royal Bafokeng Platinum (RBPlat) for a total sales consideration of R1.9 billion, plus an additional R0.3 billion for the repayment of our contribution into the BRPM JV from the date of signature of the sale agreement. An upfront consideration of R0.6 billion was settled on the completion date (11 December 2018). The outstanding purchase consideration of R1.6 billion was deferred and left on loan account and escalated at RBPlat’s borrowing rate plus a premium of 2%.
An amount of R1.85 billion was received on 30 January 2020 as early settlement of the deferred consideration.
The Company retains its right to purchase 50% of the BRPM JV’s concentrate for the life of mine, and RBPlat retains the right to sell its 50% of the concentrate to Anglo American Platinum.
PGM MARKET REVIEWAnglo American Platinum produces the full range of PGMs; namely, platinum, palladium, rhodium, ruthenium and iridium, as well as by-products including gold, nickel, copper and chrome.
PricesIn USD terms, the achieved basket price was up 27% year on year to USD2,819 per platinum ounce (2018: USD2,219). The rand depreciated 9% during the year, leading to the rand basket price increasing by 38% to R40,862 per platinum ounce (2018: R29,601). The dollar platinum price ended the year at USD971, 22% higher than at the beginning of the year, while the average achieved price over the year declined by 1% to USD861 (2018: USD871). The average achieved palladium price increased by 48% to USD1,518 per ounce (2018: USD1,029), and the average achieved rhodium price increased by 73% to USD3,808 per ounce (2018: USD2,204).
PlatinumOverall, platinum showed growth in demand in 2019, despite a lower average price year on year. Strong investment demand of 1.1 million ounces helped the price. The decline in diesel’s share of light-duty vehicle sales in Europe slowed in 2019. Demand from the heavy-duty automotive sector was maintained at 2018 levels. Chinese jewellery demand remained soft. Primary supply from mine production fell by around 100,000 ounces, but this was more than offset by an increase in recycling of end-of-life catalytic converters in the automotive industry. Overall, platinum was in a moderate deficit in 2019, primarily driven by strong investment demand.
PalladiumThe palladium price increased sharply in 2019, particularly in the second half, driven by robust demand. As a result, palladium was in
deficit for the eighth consecutive year. The palladium price hit a series of nominal highs throughout the year and peaked at USD2,000 in December. The average market price for the year was USD1,539, 50% above prior-year levels (2018: USD1,029). In late November, palladium reached a price of double that of platinum, and in December its premium rose to a record USD1,050 an ounce. Demand for the metal remains concentrated in the automotive industry, where gross demand increased by 10% in 2019, despite a year-on-year decline in global light-duty vehicle sales. This increase in palladium demand from the automotive sector was driven by tighter emissions legislation, leading to higher average PGM loadings on light-duty vehicles. The increase in demand from the automotive sector more than offset a 1% decrease in industrial demand for this metal. Unlike in recent years, palladium disinvestment was limited to just 116,000 ounces in 2019 (2018: 574,000 ounces).
RhodiumThe rhodium price was exceptionally strong in 2019, with the average market price increasing by 76.2% to USD3,914 (2018: USD2,221). The peak price during the year of USD6,150 per ounce wasthe highest since 2008. The price increase was attributable to an increase in global average loadings on light-duty vehicles, particularly from China. Gross automotive demand increased by 14.4% to exceed 1 million ounces, which more than compensated for the 15% decrease in industrial demand.
Minor metalsThe prices of iridium and ruthenium increased in 2019 to an average of USD1,480 per ounce (2018: USD1,284) and USD258 per ounce (2018: USD241), respectively. Demand from the chemical industry for both metals was strong, given construction of new capacity in the chlor-alkali sector in China. However, a decline in demand by the hard-disk sector impacted demand for ruthenium and put pressure on its price in the second half of the year.
AutomotiveThe global light-duty vehicle sector contracted in 2019, with sales decreasing by 4.4% from 2018 to 90.3 million units (source: LMC automotive global light-vehicle sales update). The Chinese automotive market was the primary cause of this decline, with car sales decreasing by 8.3% year on year to 25.4 million units. Sales in the US decreased by 1.4% to 17.0 million units. In Western Europe, light-duty vehicle sales increased by 0.8%, largely due to strong sales in Germany. Elsewhere in Europe, sales showed varying levels of weakness, with the major markets of Spain and the UK contracting.
Gross automotive demand for platinum declined by 54,000 ounces or 1.8% year on year. Diesel’s share of the light-duty vehicle market in Western Europe continues to decline, from 36.4% in 2018 to 32.0% in 2019, although the rate of decline has slowed. Diesel cars continue to struggle against a backdrop of negative consumer opinion and a growing number of diesel bans being considered in major cities. Several automotive producers have also announced intentions to reduce the number of diesel models available or remove diesel vehicles from their fleets. However, average CO2 emissions in Europe have increased in the past year after several years of decline. The upcoming EU regulations around CO2 emissions and significant fines for non-compliance could ensure that producers keep diesel vehicles, which produce relatively less CO2 than gasoline vehicles, in their fleets in the medium term. Diesels are likely to remain the primary engine technology in heavy-duty vehicles, while tighter emissions legislation in China and India will generate additional platinum demand to offset some of the demand lost in the light-duty vehicle sector.
Globally, gross demand for palladium from the automotive sector rose 10.2% and demand for rhodium increased by 14.4%. Both metals
ANNUAL RESULTS 2019 ANNUAL RESULTS COMMENTARY
12 Anglo American Platinum Limited Annual Results 2019
benefited from tightening emission standards in China and Europe in particular, with demand growing despite decreasing vehicle sales volumes.
With the price of palladium reaching double that of platinum in late 2019, the concept of replacing palladium in some gasoline catalytic converters with platinum has become increasingly relevant. However, there is still only limited evidence that automotive manufacturers have started this substitution process to any great extent. Instead, they appear to be focused on the need to ensure compliance with relevant emissions legislation, with the cost of these metals only a secondary consideration. It is therefore unlikely that there will be any meaningful progress in replacing palladium with platinum in gasoline autocatalytic converters in 2020, although this substitution is highly likely to occur at some point.
IndustrialIndustrial demand for platinum declined by 5.6% in 2019, or 137,000 ounces, with the main driver being lower demand from the glass and petroleum sectors in China. This decline comes after the significant capacity expansion in these industries over the past three years and the return to more sustainable levels of demand in 2019.
Industrial demand for palladium declined by 102,000 ounces, with decreasing demand from the chemical, dental and electrical sectors contributing to the decline. In some limited cases, the significant increase in price has led to palladium being thrifted in limited applications. Industrial and other demand for rhodium declined by 24,000 ounces; as with platinum, this drop reflects a return to more normal purchasing levels from the glass industry.
JewelleryGross global jewellery demand declined in 2019, decreasing by 7.9% or 179,000 ounces to 2.1 million ounces of platinum. In China, the largest single market, gross platinum demand from the jewellery sector shrank 15% or 197,000 ounces to 1.1 million ounces. Decreased consumer confidence has affected the jewellery sector heavily, creating a challenging environment for both platinum and gold. A lack of innovative designs and the increasing popularity of lower-carat gold products are also affecting sales of platinum jewellery. Supported by the Platinum Guild International (PGI), the platinum jewellery sector in China is changing its approach, with some early positive signs, but this process will take time to complete as manufacturers develop new products and designs.
Gross Indian jewellery demand grew strongly again in 2019, increasing by 10%. PGI continues to position platinum as an attractive and modern jewellery metal for consumers in India and has introduced a number of new product lines including a jewellery line for men.
Jewellery demand was relatively stable in Europe, Japan and North America. In all three markets, platinum retains a strong brand equity, supporting ongoing demand.
InvestmentNet investment demand for platinum was exceptionally strong in 2019 at 1.1 million ounces (2018: 67,000 ounces). Platinum’s significant discount to gold, its multi-year low price, and potential for substitution stimulated substantial exchange-traded fund or ETF buying, particularly in the first quarter of the year. Investment from Japan was relatively low at just 70,000 ounces, compared to particularly strong demand of 220,000 ounces in 2018 and 171,000 ounces in 2017. Physical investment in platinum outside Japan strengthened, aided by the World Platinum Investment Council’s work on improving the availability of platinum investment products in key markets.
Palladium suffered another year of disinvestment, although at a much lower level than in recent years. Net disinvestment totalled 116,000
ounces, as investors looked to realise profits from their holdings or, in some cases, take physical metal instead to benefit from high palladium lease rates.
Recycling and secondary supplySecondary supply of platinum from recycling automotive scrap increased by 12.9% in 2019 to 1.5 million ounces. Palladium recoveries from autocatalyst recycling grew by 11.3%, a similar rate of growth to 2018. Growth in this sector reflects historical consumption patterns rather than being influenced by current price movements. The increase in 2019 was also due to processing pipeline stocks that built up in 2018.
Platinum jewellery recycling was 708,000 ounces, down from 720,000 in 2018. The relatively low sales of platinum jewellery in China have depressed recycling rates – much metal is recycled from old jewellery given in part exchange for new pieces – and this was reflected in a fall of almost 40,000 ounces in jewellery recycling in China.
Long-dated demand from fuel cellsAlthough platinum demand from fuel cells currently remains limited in scale, interest in this technology is gaining traction. Demand for platinum from the fuel cell industry increased by 12.4% in 2019 to more than 50,000 ounces.
Some recent commercial successes for hydrogen fuel cell technology, in both stationary and mobile applications, include uses as diverse as trains, heavy-duty trucks and forklift trucks. The Paris-based International Energy Agency (IEA) has described 2019 as a year of “unprecedented momentum” for hydrogen, with 50 policies or targets introduced globally to support its development. The adoption of hydrogen as a fuel should support the mass adoption of fuel cell technology.
OEMs (original equipment manufacturers) and governments have set a range of targets for fuel cell electric vehicle use. If infrastructure requirements are met, there is the potential for several million fuel cell electric vehicles to be on the road by 2030. Importantly, China continues to devote considerable effort to commercialising fuel cell and hydrogen technology. The potential for these initiatives in China and elsewhere could lead to annual demand of several hundred thousand ounces by the end of the next decade.
MARKET DEVELOPMENTGrowing the market for PGMs remains a strategic priority for Anglo American Platinum. Market development continues to evolve as we find new ways and new partners to grow demand for each of our metals. Today, we have a broad range of programmes under way that support both near- and long-term demand creation.
JewelleryJewellery market development is done through PGI which is funded by the industry, except in India, where Anglo American Platinum exclusively funds PGI India.
ChinaThe coming years will be critical for platinum jewellery development in China to stimulate long-term demand growth. The market is changing as consumer preferences evolve, specifically as the purchasing power of women and millennials grows. These consumers prefer branded jewellery collections over the generic designs prevalent in China. PGI has developed marketing programmes to both safeguard platinum’s strong equity in bridal jewellery and target love-gifting occasions, a large segment for future growth – especially in China’s fast-growing lower-tier cities.
In October 2019, PGI opened its first showroom in Shenzhen, China, to showcase cutting-edge design trends. The state-of-the-art showroom is part of a comprehensive strategy in China to accelerate the manufacture

Anglo American Platinum Limited Annual Results 2019 13
and distribution of new-generation platinum jewellery designs targeting younger consumers. Going forward, PGI will continue to lead innovation in jewellery by driving a wider variety of product designs through its partnerships with platinum jewellery manufacturers.
IndiaAfter successfully introducing platinum jewellery into the Indian market, PGI India continues to drive the high-margin opportunity that platinum presents. Existing programmes, such as Platinum Day of Love and Evara-branded franchises, continue to perform and retail sales by PGI India’s strategic partners again grew in 2019. During the year, PGI India also successfully entered the men’s jewellery segment with the launch of Men of Platinum, which offers a largely untapped segment for platinum jewellery.
JapanThis is the most mature platinum jewellery market in the world, with the highest per capita consumption and share of the market. Platinum retains its cachet as a premium metal and Japanese consumers’ preferred precious metal for fine jewellery.
USAPlatinum sales continue to rise on the back of a strong economy and historically low platinum prices in the US. Platinum has a unique opportunity to leverage diamond jewellery sales, as recognition of this metal as the most secure setting for a diamond grows. PGI’s Platinum Crown initiative has boosted sales of platinum prongs by over 10% among participating partners.
Investment demandInvestment-demand-creation activities are undertaken by the industry-funded World Platinum Investment Council (WPIC). In 2019, WPIC continued to make progress with greater dissemination of platinum investment education to more investors globally and with 15 active product partnerships to increase investment in platinum across North America, Europe, China and Japan.
Key initiatives launched in 2019 include:
• Together with Anglo American Platinum, WPIC hosted and participated in a hydrogen and fuel cell summit in Shanghai, with more than 20 corporate sponsors. The purpose was to raise investor awareness against the background of increased Chinese government support for fuel cell electric vehicle developments. In particular, the intention was to draw the link directly between the long-term value of platinum and the hydrogen economy.
• WPIC successfully positioned itself as an important provider of platinum market information in China and attracted key media partners (Wall Street CN, Gold Topnews and Puoke Financial) in disseminating platinum market research and investment content for Chinese investors.
• In early December 2018, WPIC finalised an agreement with Bank of China, one of the world’s largest banks, to collaborate across China to increase platinum investment. Since then, 1,400 Bank of China employees, serving many of the country’s largest provinces and client bases, have taken part in WPIC training sessions to raise awareness of platinum as an investment.
• An educational series developed by WPIC and hosted by the Chicago Mercantile Exchange Group was launched to help make the investment case for platinum in the US.
Industrial and other market development initiativesAnglo American Platinum continues to innovate in finding new ways and opportunities to grow demand for PGMs. Activities include investing in primary research and development; investing in early-stage companies commercialising PGM technologies; and working towards a favourable policy environment for these technologies.
Following on the successful launch of AP Ventures LLP in 2018, two new strategic partners, the Mirai Creation Fund II, backed by Toyota, and French automotive supplier, Plastic Omnium (with an investment of USD30 million) invested in AP Ventures in 2019. These investments, from major global organisations, further validate our market-development approach, and position AP Ventures as the premier hydrogen and fuel cell-focused venture capital fund globally.
Our global advocacy activities continue to make an impact in creating conducive policy environments for hydrogen and fuel cell technologies in the major early-adopter markets of China, the EU, United Kingdom and the US. This work involves actively participating in several industry associations, including the global Hydrogen Council and Chinese International Fuel Cell and Hydrogen Association, with Anglo American Platinum being a founding member of both bodies.
2019 also saw several other exciting initiatives launched, including:
• Sponsorship of the University of Warwick’s research into anti-cancer therapies, with the recent announcement that it has discovered a compound, named Organo-Osmium FY26. This new organo-metal compound enables cancer cells to be seen through nano-imaging, and targeted and killed, from the inside, with Organo-Osmium FY26 attacking the weakest parts of the cells. It is the first time that an osmium-based compound has been seen to target the disease in this way.
• The launch of Lion Battery Technologies Inc (Lion) in conjunction with Platinum Group Metals Ltd to accelerate the development of next-generation battery technology using platinum and palladium. Lion has entered into an agreement with Florida International University to further advance a research programme that uses platinum and palladium to unlock the potential of lithium air and lithium sulphur battery chemistries to increase their discharge capacities and cyclability.
• Conclusion of an agreement between Anglo American Platinum and OxMet Technologies (Oxmet) to build a PGM alloy ‘computational and experimental engine’ and develop, as a start, new platinum alloys for the jewellery sector. OxMet is an Oxford University spin-off specialising in advanced analytical modelling of the performance of millions of alloy formulations simultaneously, as well as manufacturing these alloys. This collaboration is to address the lack of innovation on platinum jewellery alloys, which remains an inhibitor to accelerated adoption of platinum by jewellery manufacturers globally.
The Company aims to integrate demand stimulation with developing skills and building capacity in South Africa. In 2019, we held the 20th annual PlatAfrica jewellery design and manufacturing awards in partnership with PGI India and Metal Concentrators. This reflects our strategy to actively grow the market for platinum jewellery in South Africa and our successful partnership with Metal Concentrators, which manages our metal financing scheme that provides platinum to local jewellery manufacturers on favourable financial terms.
GOVERNMENT AND INDUSTRY POLICY
Wage negotiationsThe Company signed a three-year wage agreement with the recognised unions at its operations, namely the Association of Mineworkers and Construction Union (AMCU), National Union of Mineworkers (NUM) and UASA – The Union (UASA). The agreement will increase the total labour cost-to-company by 7.4% in year one, 6.1% in year two and 6.3% in year three, or 6.6% on average over the three years.
Current position on Mining Charter IIIThe Company has consistently affirmed its support for South Africa’s transformation objectives in the mining industry and consistently acknowledged its role in promoting transformation in South Africa.
ANNUAL RESULTS 2019 ANNUAL RESULTS COMMENTARY
14 Anglo American Platinum Limited Annual Results 2019
We acknowledge that this third charter (MCIII) is a significant improvement on the prior version. However, we still have some significant concerns that we believe may continue to affect the sustainability of the mining industry in South Africa. In addition, we are concerned that MCIII will, in certain respects, be difficult to implement legally and practically, and that may have unintended adverse consequences for the industry.
Anglo American Platinum believes more work needs to be done, in consultation with all stakeholders, to create a mining charter that promotes both investment for the long term and transformation. We look forward to ongoing discussions with the Minister, the Department of Mineral Resources and Energy, and other industry stakeholders to work towards this.
Anglo American Platinum notes the filing by the Minerals Council South Africa on 27 March 2019 of an application for the judicial review and setting aside of certain clauses of the 2018 mining charter.
MINERAL RESERVES AND RESOURCES STATEMENT
Ore ReservesThe combined South African and Zimbabwean Ore Reserves have decreased by 2.5% from 151.6 (4E) Moz to 147.9 (4E) Moz in the review period, primarily due to the disposal of our interest in the Bafokeng Rasimone Platinum Mine joint venture to RBPlats, and annual production, partially offset by an increase in Ore Reserves at Mogalakwena and Dishaba mine at the Amandelbult complex, due to converting Mineral Resources to Ore Reserves as well as the transfer and conversion of adjacent Der Brochen project Mineral Resources to the Mototolo mine complex.
Mineral Resources (inclusive of ore reserves)The combined South African and Zimbabwean Mineral Resources, inclusive of Ore Reserves, decreased by 5.5% from 760.5 (4E) Moz to 718.6 (4E) Moz in the review period. This was primarily the result of disposing of the interest in the Bafokeng Rasimone Platinum Mine joint venture to RBPlats (11.9 (4E) Moz of Merensky reef and -10.7 (4E) Moz of UG2 reef), downgrading some lower-grade Platreef material to mineralisation as a result of a change in Mineral Resources reporting methodology at Mogalakwena Mine (-14.7 (4E) Moz) and annual depletion (-3.5 (4E) Moz).
Anglo American Platinum prepared its Mineral Resource and Ore Reserve statements for all its operations with reference to SAMREC Code guidelines and definitions (the SAMREC Code, 2016 Edition). The lead Competent Person with overall responsibility for the compilation of the 2019 Mineral Resources and Mineral Reserves Report is the executive head: technical, safety and sustainability, Dr Gordon Smith (PrEng). He confirms that the information on Mineral Resources and Ore Reserves in this report complies with the SAMREC Code and that it may be published in the form and context in which it was intended.
Anglo American Platinum completed the purchase of Kwanda North and Central Block prospecting rights on 27 August 2019. These prospecting rights are adjacent to and have been incorporated into the Mogalakwena mining right. The incorporated prospecting rights are, pending further exploration and evaluation work, categorised as mineralisation and do not impact on the 2019 reported Mineral Resources.
The full reserves and resources statement will be available on 1 March 2020 on the Company website at https://www.angloamericanplatinum.com.
BOARD CHANGESNorman Mbazima was appointed Chairman on 17 April 2019.
Peter Mageza, who has been a member of the Board for the past five years, was appointed as Lead Independent Director on 17 April 2019.
Craig Miller, who assumed his role of Finance Director on 1 April 2019, was appointed as an Executive Director.
OUTLOOK
Market outlookThe three major PGMs – platinum, palladium and rhodium – should again be in a combined fundamental deficit in 2020. Primary mine supply should decline modestly, while tightening emissions regulations are likely to boost automotive demand for palladium and rhodium in the light-duty sector and platinum in the heavy-duty sector.
Platinum is expected to be in surplus in 2020. The outlook for gross global automotive demand for platinum is relatively flat year on year, although the risks to this forecast are largely to the downside. The diesel engine’s share of the European light-duty vehicle market is expected to continue declining, but at a significantly slower rate than in recent years. Production and sales of heavy-duty vehicles are expected to decrease globally in 2020. However, demand for platinum from the sector should remain robust due to stricter emissions legislation in several regions leading to higher PGM loadings. Industrial demand is likely to remain strong but lower than 2019 as global economic growth continues to moderate.
The jewellery demand outlook remains mixed. Platinum jewellery sales in China are expected to decrease again in 2020. In contrast, Indian demand should increase further, and we expect a healthy performance in other key jewellery markets. Investment demand is unlikely to match the significant volumes in 2019 but should be positive, aided by continuing market development work from WPIC.
Primary supply should decrease year on year, but will be offset by a marginal increase in recycling flows, leading to flat supply overall and a return to surplus for this metal.
Palladium should again be in a substantial deficit in 2020. Automotive demand for palladium seems set to increase, even with little or no growth in vehicle sales, as average vehicle size increases and emissions rules tighten, both leading to an increase in PGM loadings per vehicle. Although palladium is trading at a substantial premium to platinum, there is only limited evidence of research efforts to replace palladium with platinum in gasoline catalytic converters. Even if this R&D process were to progress in 2020, gross automotive palladium demand should increase in 2020. Mine production is expected to decrease year on year, but more palladium will be recovered from recycling. Given the current volume of ETFs available, net disinvestment is expected to be minimal compared to recent years and palladium is expected to remain in a deficit.
Rhodium demand growth should continue in 2020. Although vehicle sales are unlikely to grow meaningfully this year, tighter emissions rules and rising vehicle sizes should translate to incremental automotive demand. Industrial demand could fall back due to some price sensitivity in the glass sector. Primary supplies are expected to remain relatively flat, but the volume of recycled metal should increase in 2020, with rhodium likely to remain in a widening fundamental surplus.
Anglo American Platinum Limited Annual Results 2019 15
Operational outlookPGM production guidance (metal-in-concentrate) is 4.2 million to 4.6 million PGM ounces for 2020, including the platinum outlook of 2.0 million to 2.2 million ounces and palladium outlook of around 1.4 million ounces.
Refined production guidance is expected to be 4.2 million to 4.7 million PGM ounces, including the backlog of work-in-progress which should be largely refined in 2020. The guidance for platinum is 2.0 million to 2.2 million ounces and for palladium 1.4 million to 1.5 million ounces. Sales volumes will be in line with refined production.
Significant headwinds exist, and we highlight that further load shedding in 2020 could impact our ability to meet this guidance.
Financial outlookUnit cost guidance for 2020 is R10,600 to R11,000/PGM ounce and R22,800 to R24,000 per platinum ounce.
Total capital expenditure guidance for 2020 excluding capitalised waste stripping is R6.8 billion to R7.5 billion. The increase is mainly attributable to breakthrough project initiatives to achieve and exceed best practice in 2023 and beyond. Capitalised waste stripping guidance is R2.4 billion to R2.6 billion. The Board has committed to paying a sustainable dividend based on a pay-out ratio of 40% of normalised headline earnings at each reporting period.
The financial information on which the guidance is based has not been reviewed or reported on by the Company’s auditors.
Johannesburg, South Africa13 February 2020
For further information, please contact:
InvestorsEmma ChapmanHead of Investor Relations+27 (0)11 373 [email protected]
MediaJana MaraisMedia Relations+27 (0)11 638 [email protected]

ANNUAL RESULTS 2019 SUMMARISED PRELIMINARY AUDITED GROUP FINANCIAL RESULTS
16 Anglo American Platinum Limited Annual Results 2019
SUMMARISED CONSOLIDATED STATEMENT OF COMPREHENSIVE INCOMEfor the year ended 31 December 2019
2019 20181
Notes Rm Rm
Gross sales revenue 99,571 74,582Commissions paid (20) —
Net sales revenue 2 99,551 74,582Cost of sales 3 (72,737) (63,286)
Gross profit on metal sales 3 26,814 11,296Market development and promotional expenditure (788) (796)Other net (expenditure)/income 5 (388) 342Loss on impairment and scrapping of property, plant and equipment (173) (21)
Operating profit 25,465 10,821Fair value remeasurements of other financial assets and liabilities 248 931Interest expensed (572) (738)Interest received 349 265Impairment of non-current financial assets (77) (234)Losses from associates (net of taxation) (56) (15)Losses from joint ventures (net of taxation) (52) (25)Dividends received — 42Impairment of investment in associate Bafokeng Rasimone Platinum Mine (BRPM) — (1,133)Impairment of Richtrau 123 Proprietary Limited — (5)Loss on disposal of Union Mine and Masa Chrome — (850)Profit on step acquisition of Mototolo business — 396Profit on disposal of Platinum Group Metals Investment Programme (PGMIP) — 249Losses from joint ventures (net of taxation) — 15
Profit before taxation 6 25,305 9,719Taxation (6,736) (2,640)
Profit for the year 18,569 7,079Total other comprehensive income, post-tax 33 650
Items that may be reclassified subsequently to profit or loss (192) 880
Deferred foreign exchange translation gains/(losses) (192) 880
Items that will not be reclassified subsequently to profit or loss 225 (230)
Net (losses)/gains on equity investments at fair value through other comprehensive income (FVTOCI) 279 (261)Tax effects (54) 31
Total comprehensive income for the year 18,603 7,729
Profit attributed to:Owners of the Company 18,497 6,903Non-controlling interests 72 176
18,569 7,079
Total comprehensive income attributed to:Owners of the Company 18,531 7,553Non-controlling interests 72 176
18,603 7,729
EARNINGS PER SHAREEarnings per ordinary share (cents)– Basic 7,046 2,631– Diluted 7,021 2,622
Headline earnings 8 18,603 7,588
1 Restated. Refer to note 20.

Anglo American Platinum Limited Annual Results 2019 17
SUMMARISED CONSOLIDATED STATEMENT OF FINANCIAL POSITIONas at 31 December 2019
2019 20181
Notes Rm Rm
ASSETSNon-current assets 57,177 54,252
Property, plant and equipment 9 43,504 39,708Capital work-in-progress 8,501 7,780Other financial assets 10 2,558 4,109Inventories 12 1,006 650Investments held by environmental trusts 798 1,183Investment in associates and joint ventures 11 413 407Goodwill 397 397Other non-current assets — 18
Current assets 46,843 35,138
Inventories 12 22,446 21,988Cash and cash equivalents 18,546 9,541Trade and other receivables 1,686 1,607Other assets 1,633 1,347Other financial assets 10 2,532 276Taxation — 379
Total assets 104,020 89,390
EQUITY AND LIABILITIESShare capital and reservesShare capital 27 27Share premium 22,691 22,746Retained earnings 35,039 21,564Foreign currency translation reserve 2,452 2,644Remeasurements of equity investments irrevocably designated at FVTOCI 441 216Non-controlling interests 192 231
Shareholders' equity 60,842 47,428
Non-current liabilities 14,646 17,078
Deferred taxation 11,120 8,238Environmental obligations 1,898 1,925Other financial liabilities 924 762Lease liabilities 404 100Interest-bearing borrowings 13 281 6,038Employee benefits 19 15
Current liabilities 28,532 24,884
Trade and other payables 16,246 15,647Other liabilities 11,306 8,423Other financial liabilities 609 639Lease liabilities 164 17Interest-bearing borrowings 13 42 129Taxation 96 —Share-based payment provision 69 29
Total equity and liabilities 104,020 89,390
1 Restated. Refer to note 20.
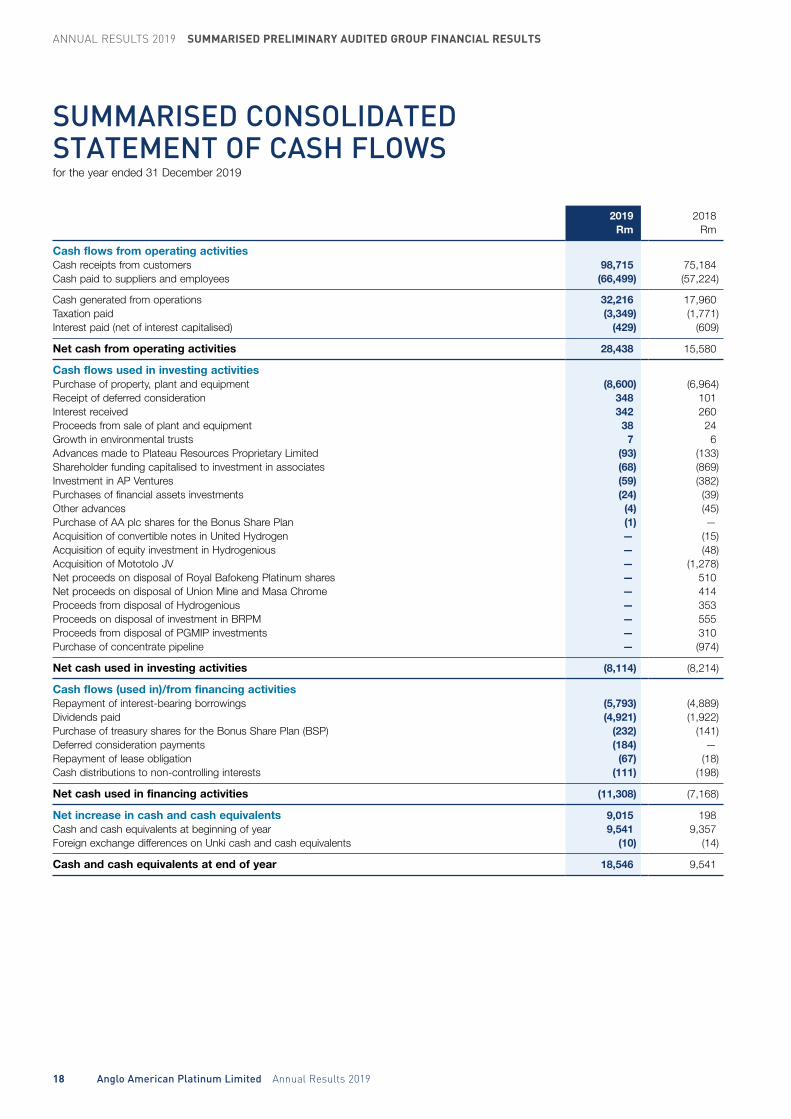
ANNUAL RESULTS 2019 SUMMARISED PRELIMINARY AUDITED GROUP FINANCIAL RESULTS
18 Anglo American Platinum Limited Annual Results 2019
SUMMARISED CONSOLIDATED STATEMENT OF CASH FLOWSfor the year ended 31 December 2019
2019 2018Rm Rm
Cash flows from operating activitiesCash receipts from customers 98,715 75,184Cash paid to suppliers and employees (66,499) (57,224)
Cash generated from operations 32,216 17,960Taxation paid (3,349) (1,771)Interest paid (net of interest capitalised) (429) (609)
Net cash from operating activities 28,438 15,580
Cash flows used in investing activitiesPurchase of property, plant and equipment (8,600) (6,964)Receipt of deferred consideration 348 101Interest received 342 260Proceeds from sale of plant and equipment 38 24Growth in environmental trusts 7 6Advances made to Plateau Resources Proprietary Limited (93) (133)Shareholder funding capitalised to investment in associates (68) (869)Investment in AP Ventures (59) (382)Purchases of financial assets investments (24) (39)Other advances (4) (45)Purchase of AA plc shares for the Bonus Share Plan (1) —Acquisition of convertible notes in United Hydrogen — (15)Acquisition of equity investment in Hydrogenious — (48)Acquisition of Mototolo JV — (1,278)Net proceeds on disposal of Royal Bafokeng Platinum shares — 510Net proceeds on disposal of Union Mine and Masa Chrome — 414Proceeds from disposal of Hydrogenious — 353Proceeds on disposal of investment in BRPM — 555Proceeds from disposal of PGMIP investments — 310Purchase of concentrate pipeline — (974)
Net cash used in investing activities (8,114) (8,214)
Cash flows (used in)/from financing activitiesRepayment of interest-bearing borrowings (5,793) (4,889)Dividends paid (4,921) (1,922)Purchase of treasury shares for the Bonus Share Plan (BSP) (232) (141)Deferred consideration payments (184) —Repayment of lease obligation (67) (18)Cash distributions to non-controlling interests (111) (198)
Net cash used in financing activities (11,308) (7,168)
Net increase in cash and cash equivalents 9,015 198Cash and cash equivalents at beginning of year 9,541 9,357Foreign exchange differences on Unki cash and cash equivalents (10) (14)
Cash and cash equivalents at end of year 18,546 9,541

Anglo American Platinum Limited Annual Results 2019 19
SUMMARISED CONSOLIDATED STATEMENT OF CHANGES IN EQUITYfor the year ended 31 December 2019
Remeasure-ments
Foreign of equitycurrency investments
translation irrevocably Non-Share Share reserve designated Retained controlling
capital premium (FCTR) at FVTOCI earnings interests TotalRm Rm Rm Rm Rm Rm Rm
Balance at 31 December 2017 27 22,673 1,764 429 16,634 (526) 41,001Total comprehensive (loss)/income for the year1 880 (261) 6,903 176 7,698Deferred taxation charged directly to equity 31 6 37Cash distributions to minorities (198) (198)Shares acquired in terms of the BSP -treated as treasury shares (—)* (141) (141)Shares vested in terms of the BSP — * 214 (214) —Equity-settled share-based compensation 180 180Shares forfeited to cover tax expense on vesting (11) (11)Transfer of reserve upon disposal of investments 17 (17) —Dividends paid2 (1,922) (1,922)Disposal of business 779 779Retirement benefit 5 5
Balance at 31 December 2018 27 22,746 2,644 216 21,564 231 47,428
Change in adoption of IFRS 16 Leases — — — — (136) — (136)
Total equity at 1 January 2019 – restated 27 22,746 2,644 216 21,428 231 47,292Total comprehensive (loss)/income for the year (192) 279 18,497 72 18,656
Profit for the year 18,497 72 18,569Other comprehensive income for the year (192) 279 87
Deferred taxation charged directly to equity (54) 33 (21)Dividends paid2 (4,921) (4,921)Retirement benefit (2) (2)Cash distributions to minorities (111) (111)Shares acquired in terms of the BSP – treated as treasury shares (—)* (232) (232)Shares vested in terms of the BSP — * 177 (177) —Equity-settled share-based compensation 188 188Shares forfeited to cover tax expense on vesting (7) (7)
Balance at 31 December 2019 27 22,691 2,452 441 35,039 192 60,842
* Less than R500,000.1 Restated. Refer to note 20.
Per share Rm
2 Dividends paid 4,921
Interim 2019 R11.00 2,925
Final 2018 R7.51 1,996

ANNUAL RESULTS 2019 SUMMARISED PRELIMINARY AUDITED GROUP FINANCIAL RESULTS
20 Anglo American Platinum Limited Annual Results 2019
NOTES TO THE SUMMARISED CONSOLIDATED FINANCIAL STATEMENTSfor the year ended 31 December 2019
1. The summarised consolidated financial statements are presented in accordance with the framework concepts and the measurement and recognition requirements of International Financial Reporting Standards (IFRS), the SAICA Financial Reporting Guides as issued by the Accounting Practices Committee, Financial Reporting Pronouncements as issued by the Financial Reporting Standards Council, as well as the requirements of the Companies Act of South Africa and the JSE Limited’s Listings Requirements for preliminary reports. The summarised consolidated financial statements also contain, at a minimum, the information required by International Accounting Standard 34 Interim Financial Reporting. The accounting policies applied in the preparation of the consolidated financial statements from which the summarised consolidated financial statements were derived are in terms of IFRS and consistent with those applied in the financial statements for the year ended 31 December 2018, except for IFRS 16 Leases which became effective on 1 January 2019.
The directors take full responsibility for the preparation of the preliminary report and that the summarised financial information has been correctly extracted from the underlying audited consolidated financial statements. The preparation of the Group’s audited results and the summarised consolidated financial statements for the year ended 31 December 2019 were supervised by the finance director, Mr CW Miller CA(SA).
The consolidated financial statements from which the summarised consolidated financial statements have been extracted were audited by the Company’s auditors, Deloitte & Touche. The consolidated financial statements and the auditor’s unmodified report on the consolidated financial statements are available for inspection at the Company’s registered office. The consolidated financial statements are also available on the Company’s website www.angloamericanplatinum.com/investors/annual-reporting.
Net sales revenue EBITDA
2019 2018 2019 2018 Rm Rm Rm Rm
2. SEGMENTAL INFORMATIONSegment revenue and resultsOperationsMogalakwena Mine 25,845 18,106 14,375 8,249Amandelbult Mine 17,424 13,192 5,132 2,031Mototolo Mine 4,506 2,030 1,956 591Unki Platinum Mine 4,403 2,884 1,520 835Modikwa Platinum Mine1 2,988 2,138 1,080 566Kroondal Platinum Mine1 5,824 3,833 2,499 1,052Other mined — 286 (462) (395)
Total – mined 60,989 42,469 26,099 12,929Tolling and purchase of concentrate 30,708 29,368 4,392 2,884Trading2 7,854 2,793 247 7Market development and promotional expenditure — — (788) (796)Other3 — (48) — (521)
99,551 74,582 29,950 14,503
Depreciation (4,441) (4,168)Marketing development and promotional expenditure 788 796Other income and expenses 409 109Loss from associates and joint ventures 108 40Restructuring — 16
Gross profit on metal sales 26,814 11,296
1 The Group’s share (excluding purchase of concentrate).2 Includes purchases of third-party refined metal and leasing.3 Includes associate’s loss, restructuring costs and inter-segmental transactions.
Information reported to the Executive Committee of the Group for purposes of resource allocation and assessment of segment performance is done on a mine-by-mine basis.
The Group’s mining, smelting and refining operations are all located in South Africa with the exception of Unki Platinum Mine, which is located in Zimbabwe.
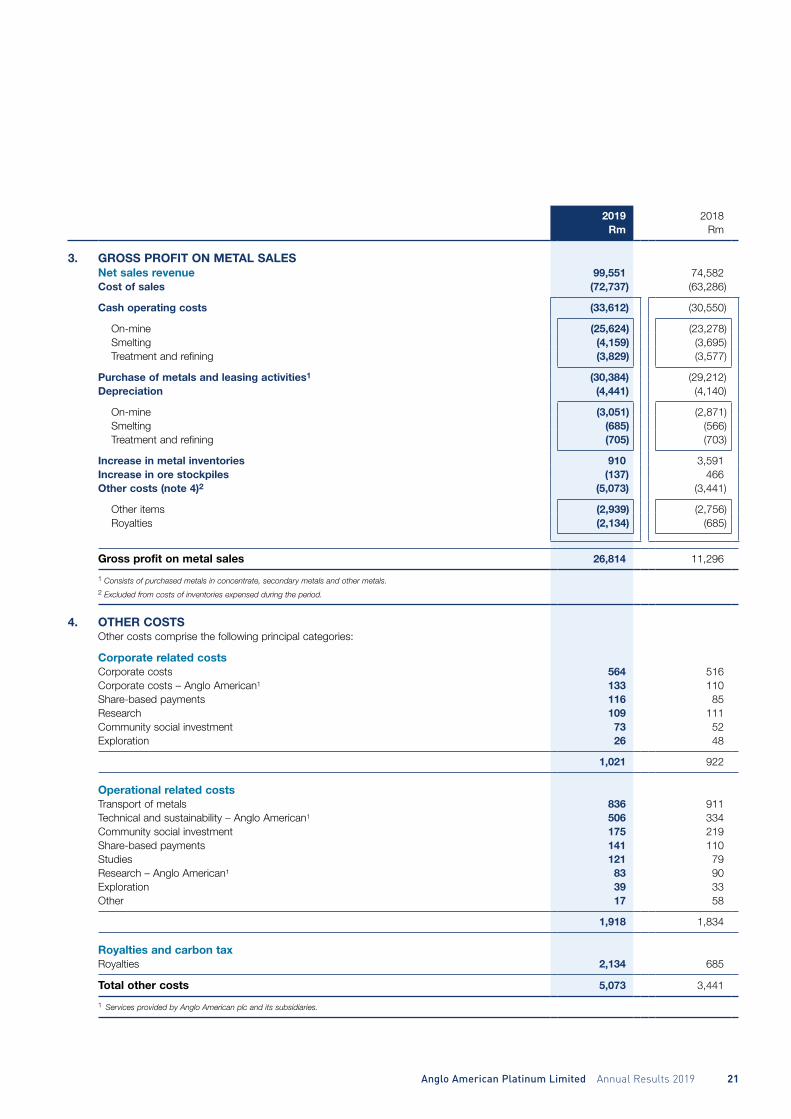
Anglo American Platinum Limited Annual Results 2019 21
2019 2018Rm Rm
3. GROSS PROFIT ON METAL SALESNet sales revenue 99,551 74,582Cost of sales (72,737) (63,286)
Cash operating costs (33,612) (30,550)
On-mine (25,624) (23,278)Smelting (4,159) (3,695)Treatment and refining (3,829) (3,577)
Purchase of metals and leasing activities1 (30,384) (29,212)Depreciation (4,441) (4,140)
On-mine (3,051) (2,871)Smelting (685) (566)Treatment and refining (705) (703)
Increase in metal inventories 910 3,591Increase in ore stockpiles (137) 466Other costs (note 4)2 (5,073) (3,441)
Other items (2,939) (2,756)Royalties (2,134) (685)
Gross profit on metal sales 26,814 11,296
1 Consists of purchased metals in concentrate, secondary metals and other metals.2 Excluded from costs of inventories expensed during the period.
4. OTHER COSTSOther costs comprise the following principal categories:
Corporate related costsCorporate costs 564 516Corporate costs – Anglo American1 133 110Share-based payments 116 85Research 109 111Community social investment 73 52Exploration 26 48
1,021 922
Operational related costsTransport of metals 836 911Technical and sustainability – Anglo American1 506 334Community social investment 175 219Share-based payments 141 110Studies 121 79Research – Anglo American1 83 90Exploration 39 33Other 17 58
1,918 1,834
Royalties and carbon taxRoyalties 2,134 685
Total other costs 5,073 3,441
1 Services provided by Anglo American plc and its subsidiaries.
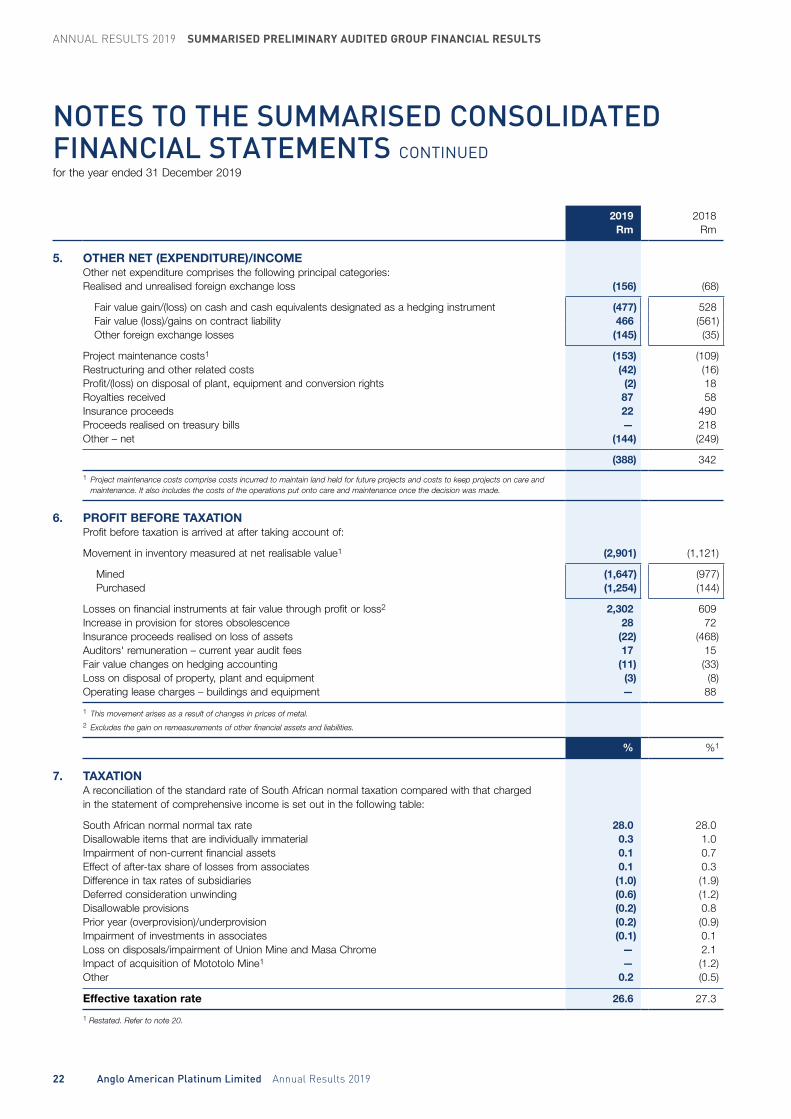
ANNUAL RESULTS 2019 SUMMARISED PRELIMINARY AUDITED GROUP FINANCIAL RESULTS
22 Anglo American Platinum Limited Annual Results 2019
NOTES TO THE SUMMARISED CONSOLIDATED FINANCIAL STATEMENTS CONTINUEDfor the year ended 31 December 2019
2019 2018Rm Rm
5. OTHER NET (EXPENDITURE)/INCOMEOther net expenditure comprises the following principal categories:Realised and unrealised foreign exchange loss (156) (68)
Fair value gain/(loss) on cash and cash equivalents designated as a hedging instrument (477) 528Fair value (loss)/gains on contract liability 466 (561)Other foreign exchange losses (145) (35)
Project maintenance costs1 (153) (109)Restructuring and other related costs (42) (16)Profit/(loss) on disposal of plant, equipment and conversion rights (2) 18Royalties received 87 58Insurance proceeds 22 490Proceeds realised on treasury bills — 218Other – net (144) (249)
(388) 342
1 Project maintenance costs comprise costs incurred to maintain land held for future projects and costs to keep projects on care and maintenance. It also includes the costs of the operations put onto care and maintenance once the decision was made.
6. PROFIT BEFORE TAXATIONProfit before taxation is arrived at after taking account of:
Movement in inventory measured at net realisable value1 (2,901) (1,121)
Mined (1,647) (977)Purchased (1,254) (144)
Losses on financial instruments at fair value through profit or loss2 2,302 609Increase in provision for stores obsolescence 28 72Insurance proceeds realised on loss of assets (22) (468)Auditors' remuneration – current year audit fees 17 15Fair value changes on hedging accounting (11) (33)Loss on disposal of property, plant and equipment (3) (8)Operating lease charges – buildings and equipment — 88
1 This movement arises as a result of changes in prices of metal.2 Excludes the gain on remeasurements of other financial assets and liabilities.
% %1
7. TAXATIONA reconciliation of the standard rate of South African normal taxation compared with that charged in the statement of comprehensive income is set out in the following table:
South African normal normal tax rate 28.0 28.0Disallowable items that are individually immaterial 0.3 1.0Impairment of non-current financial assets 0.1 0.7Effect of after-tax share of losses from associates 0.1 0.3Difference in tax rates of subsidiaries (1.0) (1.9)Deferred consideration unwinding (0.6) (1.2)Disallowable provisions (0.2) 0.8Prior year (overprovision)/underprovision (0.2) (0.9)Impairment of investments in associates (0.1) 0.1Loss on disposals/impairment of Union Mine and Masa Chrome — 2.1Impact of acquisition of Mototolo Mine1 — (1.2)Other 0.2 (0.5)
Effective taxation rate 26.6 27.3
1 Restated. Refer to note 20.

Anglo American Platinum Limited Annual Results 2019 23
2019 2018Rm Rm
8. RECONCILIATION BETWEEN PROFIT AND HEADLINE EARNINGSProfit attributable to shareholders 18,497 6,903AdjustmentsLoss on impairment and scrapping of property, plant and equipment 173 21
Tax effect thereon (48) (6)Non-controlling interest share — (1)Insurance proceeds on loss of assets (22) (468)
Tax effect thereon 6 131Net loss on disposal of property, plant and equipment (note 6) (3) (8)
Tax effect thereon — 2Fair value gain on existing interest in Mototolo Mine1 — (396)
Tax effect thereon — (25)Profit on disposal of PGMIP investments — (249)
Tax effect thereon — —Impairment of investments in associates — 1,138
Tax effect thereon — (253)Profit on disposal of associates — (15)
Tax effect thereon — —Disposal of Union Mine and Masa Chrome — 850
Tax effect thereon — (32)Non-controlling interest’s share — (3)
Headline earnings 18,603 7,588
Attributable headline earnings per ordinary share (cents)Headline 7,087 2,893Diluted 7,061 2,822
1 Restated. Refer to note 20.
9. PROPERTY, PLANT AND EQUIPMENTCostOpening balance 78,200 74,982Transfer from capital work in progress 7,125 4,924Acquistion of Mototolo JV1 — 1,399Additions at cost 1,220 273Disposals/scrapping of assets (1,146) (4,385)(Reductions)/additions to decommissioning asset (7) 12Foreign currency translation differences (179) 995
Closing balance 85,213 78,200
Accumulated depreciationOpening balance 38,492 38,385Charge for the year 4,454 4,168Disposals/scrapping of assets (1,113) (4,364)Foreign currency translation differences (124) 303
Closing balance 41,709 38,492
Carrying amount 43,504 39,708
1 Restated. Refer to note 20.

ANNUAL RESULTS 2019 SUMMARISED PRELIMINARY AUDITED GROUP FINANCIAL RESULTS
24 Anglo American Platinum Limited Annual Results 2019
NOTES TO THE SUMMARISED CONSOLIDATED FINANCIAL STATEMENTS CONTINUEDfor the year ended 31 December 2019
2019 2018Rm Rm
10. OTHER FINANCIAL ASSETSNon-current financial assetsLoans carried at amortised costLoan to ARM Mining Consortium Limited 68 44Loans to Plateau Resources Proprietary Limited (Plateau) — 224Other 100 100
168 368
Equity investments irrevocably designated at FVTOCIInvestment in Ballard Power Systems lnc. 480 175Investment in Wesizwe Platinum Limited (Wesizwe) 108 89Investment in SA SME Fund 40 —Investment in Anglo Plc shares 17 30Investment in Primus Power — 22
644 316
Other financial assets mandatorily measured at fair value through profit or lossDeferred consideration on sale of Rustenburg Mine 1,566 1,730Deferred consideration on sale of Pandora Joint Venture 181 149Deferred consideration on sale of BRPM — 1,546
1,746 3,425
Total other financial assets 2,558 4,109
Current financial assetsOther financial assets mandatorily measured at fair value through profit or lossDeferred consideration on sale of BRPM – short-term portion 1,840 —Deferred consideration on sale of Rustenburg Mine – short-term portion 673 265Fair value of derivatives 19 11
2,532 276
11. INVESTMENT IN ASSOCIATES AND JOINT VENTURESA. Associates
UnlistedPeglerae Hospital Proprietary Limited
Carrying value of investment 57 59Bokoni Platinum Holdings Proprietary Limited (Bokoni Holdco)
Carrying value of investment — —Primus Power
Carrying value of investment — 5
57 64
The listed equity investment in Atlatsa Resources Corporation was disposed of during the year (2018 market value: R131 million).

Anglo American Platinum Limited Annual Results 2019 25
11. INVESTMENT IN ASSOCIATES AND JOINT VENTURES continuedB. Joint ventures
Unlisted investment: AP Ventures (APV)On 17 July 2018 AAP announced that its wholly owned subsidiary, Anglo Platinum Marketing Limited (APML), had subscribed for interests in two UK-based venture capital funds (the Funds), with a total aggregate commitment equivalent to USD100 million. AAP’s commitment to the Funds is matched by a USD100 million commitment from South Africa’s Public Investment Corporation SOC Limited (PIC). APML and the PIC comprise the Limited Partners (LPs).
APV comprises two funds, APV Fund I and APV Fund II. Fund I is closed to other investors with APML and PIC holding equal ownership interest of 49.5% each and 1% held by General Partners, who have power and authority over APV. APV is a legally separate entity from the Limited Partners. The two Limited Partners invested R328 million each into Fund I on 21 September 2018.
APV is independently managed by the General Partners. The General Partners (GPs) are responsible for the day-to-day investment, disinvestments, financing and distribution decisions.
The GPs are required to hold at all times the 1% of the capital contributed by the LPs. The removal of the GPs require 75% of committed capital by Limited Partners to approve the decision. This demonstrates that the Limited Partners require unanimous consent to remove the General Partners and therefore the investment in Fund I is that of a joint venture and is equity accounted by APML from 1 October 2018.
APV has a 31 March year end, measures its investments at fair value through profit or loss and therefore unaudited internal valuations as at 30 November 2019 were used for equity accounting purposes.
The movement for the year in the Group’s investment in joint ventures was as follows:
2019 2018Rm Rm
Opening balance 343 —Loss from joint ventures (after taxation) (52) (25)Investment in AP Ventures 59 382Foreign exchange translation losses/gain in FCTR 5 (14)
Closing balance 355 343
Total balance for associates and joint ventures 413 407
12. INVENTORIESRefined metals 4,466 3,972
At cost 3,778 2,990At net realisable values 688 982
Work-in-process 14,310 13,893
At cost 12,685 9,851At net realisable values 1,625 4,042
Total metal inventories 18,776 17,865Ore stockpiles 2,119 2,256Stores and materials at cost less obsolescence provision 2,557 2,517
23,453 22,638Less: Non-current inventories (1,006) (650)
22,446 21,988
There are no inventories pledged as security to secure any borrowings of the Group.

ANNUAL RESULTS 2019 SUMMARISED PRELIMINARY AUDITED GROUP FINANCIAL RESULTS
26 Anglo American Platinum Limited Annual Results 2019
NOTES TO THE SUMMARISED CONSOLIDATED FINANCIAL STATEMENTS CONTINUEDfor the year ended 31 December 2019
2019 2019 2018 2018Facility Utilised Facility Utilisedamount amount amount amount
Rm Rm Rm Rm
13. INTEREST-BEARING BORROWINGSUnsecured financial liabilities measured at amortised costThe Group has the following borrowing facilities:
Committed facilities 20,540 323 20,499 6,078
ABSA Bank Limited 1,600 — 1,600 —Anglo American SA Finance Limited 9,100 — 9,100 5,536BNP Paribas 1,000 — 1,000 —FirstRand Bank Limited 2,657 — 2,657 —Nedbank Limited 3,623 223 3,662 262Rand Merchant Bank 360 100 280 280Standard Bank of South Africa Limited 2,200 — 2,200 —
Uncommitted facilities 6,403 — 6,438 89
Anglo American SA Finance Limited 5,000 — 5,000 89Bank of Nova Scotia 561 — 575 —Nedbank London1 842 — 863 —
Total interest-bearing borrowings 26,943 323 26,937 6,167
Current interest-bearing borrowings 42 129Non-current interest-bearing borrowings 281 6,038
323 6,167
Weighted average borrowing rate (%) 9.67 8.69
1 USD60 million uncommitted facility.
Borrowing powersThe borrowing powers in terms of the memorandum of incorporation of the holding company and its subsidiaries are unlimited. Committed facilities are defined as the bank’s obligation to provide funding until maturity of the facility, by which time the renewal of the facility is negotiated.
An amount of R17,240 million (2018: R16,937 million) of the facilities is committed for one to five years; R1,000 million (2018: R1,000 million) is committed for a rolling period of 364 days; R2,300 million (2018: R2,300 million) is committed for a rolling period of 18 months. The Company has adequate committed facilities to meet its future funding requirements.
Uncommitted facilities are callable on demand.
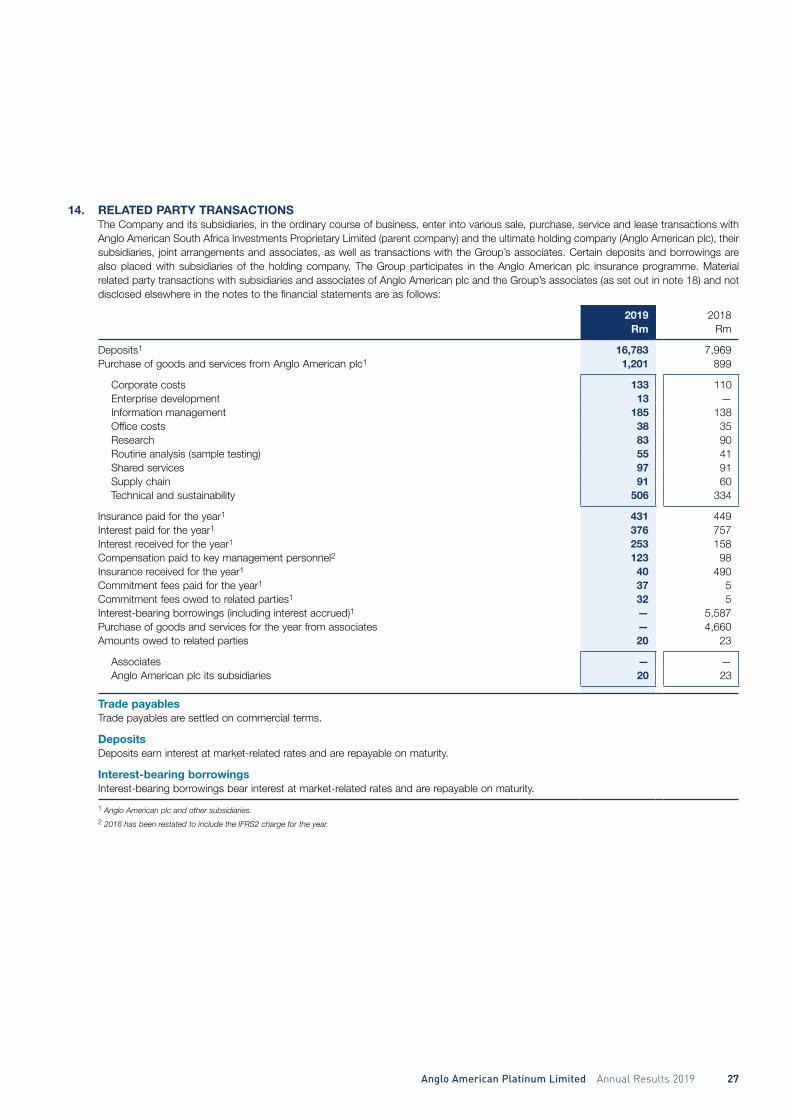
Anglo American Platinum Limited Annual Results 2019 27
14. RELATED PARTY TRANSACTIONSThe Company and its subsidiaries, in the ordinary course of business, enter into various sale, purchase, service and lease transactions with Anglo American South Africa Investments Proprietary Limited (parent company) and the ultimate holding company (Anglo American plc), their subsidiaries, joint arrangements and associates, as well as transactions with the Group’s associates. Certain deposits and borrowings are also placed with subsidiaries of the holding company. The Group participates in the Anglo American plc insurance programme. Material related party transactions with subsidiaries and associates of Anglo American plc and the Group’s associates (as set out in note 18) and not disclosed elsewhere in the notes to the financial statements are as follows:
2019 2018Rm Rm
Deposits1 16,783 7,969Purchase of goods and services from Anglo American plc1 1,201 899
Corporate costs 133 110Enterprise development 13 —Information management 185 138Office costs 38 35Research 83 90Routine analysis (sample testing) 55 41Shared services 97 91Supply chain 91 60Technical and sustainability 506 334
Insurance paid for the year1 431 449Interest paid for the year1 376 757Interest received for the year1 253 158Compensation paid to key management personnel2 123 98Insurance received for the year1 40 490Commitment fees paid for the year1 37 5Commitment fees owed to related parties1 32 5Interest-bearing borrowings (including interest accrued)1 — 5,587Purchase of goods and services for the year from associates — 4,660Amounts owed to related parties 20 23
Associates — —Anglo American plc its subsidiaries 20 23
Trade payablesTrade payables are settled on commercial terms.
DepositsDeposits earn interest at market-related rates and are repayable on maturity.
Interest-bearing borrowingsInterest-bearing borrowings bear interest at market-related rates and are repayable on maturity.
1 Anglo American plc and other subsidiaries.2 2018 has been restated to include the IFRS2 charge for the year.

ANNUAL RESULTS 2019 SUMMARISED PRELIMINARY AUDITED GROUP FINANCIAL RESULTS
28 Anglo American Platinum Limited Annual Results 2019
NOTES TO THE SUMMARISED CONSOLIDATED FINANCIAL STATEMENTS CONTINUEDfor the year ended 31 December 2019
2019 2018Rm Rm
15. COMMITMENTS AND CONTINGENT LIABILITIESCommitmentsProperty, plant and equipmentContracted for 2,207 1,580Not yet contracted for 2,785 3,123
Authorised by the directors 4,992 4,703Project capital 1,572 1,324
– Within one year 773 875– Thereafter 799 449
Stay-in-business capital 3,420 3,378
– Within one year 2,166 3,138– Thereafter 1,254 240
Capital commitments relating to the Group's share in associatesContracted for — —Not yet contracted for — —
— —
OtherOperating lease rentals – buildings and equipment1 — 1,658
Due within one year — 67Due within two to five years — 331Due after five years — 1,260
1 IFRS 16 came into effect on 1 January 2019 and as a result no operating leases exist after this date.
The Group has a commitment to fund the care and maintenance costs of its associate, Bokoni Mine, in 2020 for an amount of R220 million. This funding is contingent on the Group’s financial director reviewing the costs to ensure they are for approved care and maintenance costs before they are paid over to Bokoni. 51% of the committed funding is accounted for as a loan to Plateau Resources when the funds are paid to Bokoni.
Contingent liabilitiesLetters of comfort have been issued to financial institutions to cover banking facilities. There are no encumbrances of Group assets.
The Group is the subject of various legal claims, which are individually immaterial and are not expected, in aggregate, to result in material losses.
The Group has, in the case of some of its mines, provided the Department of Mineral Resources with guarantees that cover the difference between closure cost and amounts held in the environmental trusts. At 31 December 2019, these guarantees amounted to R 2,973 million (2018: R2,598 million).

Anglo American Platinum Limited Annual Results 2019 29
16. FINANCIAL INSTRUMENTSCategories of financial instruments
Amortised Faircost FVTPL FVTOCI Total valueRm Rm Rm Rm Rm
2019Financial assetsInvestments held by environmental trusts — 798 — 798 798Other financial assets 168 4,278 644 5,090 5,090Trade and other receivables 1,685 — — 1,685 1,685Cash and cash equivalents 18,546 — — 18,546 18,546
20,399 5,076 644 26,119 26,119
2018Financial assetsInvestments held by environmental trusts — 1,183 — 1,183 1,183Other financial assets 368 3,701 316 4,385 4,385Trade and other receivables 1,607 — — 1,607 1,607Cash and cash equivalents 9,541 — — 9,541 9,541
11,516 4,884 316 16,716 16,716
AmortisedFVTPL costs (AC) Total Fair value
Rm Rm Rm Rm
2019Financial liabilitiesNon-current interest-bearing borrowings — (281) (281) (281)Non-current lease liabilities — (404) (404) (404)Current interest-bearing borrowings — (42) (42) (42)Current lease liabilities — (164) (164) (164)Trade and other payables (8,722) (7,524) (16,246) (16,246)Other financial liabilities (1,533) — (1,533) (1,533)
(10,255) (8,415) (18,670) (18,670)
2018Financial liabilitiesNon-current interest-bearing borrowings — (6,038) (6,038) (6,038)Non-current lease liabilities — (100) (100) (100)Current interest-bearing borrowings — (129) (129) (129)Current lease liabilities — (17) (17) (17)Trade and other payables (9,703) (5,944) (15,647) (15,647)Other financial liabilities (940) (461) (1,401) (1,401)
(10,643) (12,689) (23,332) (23,332)
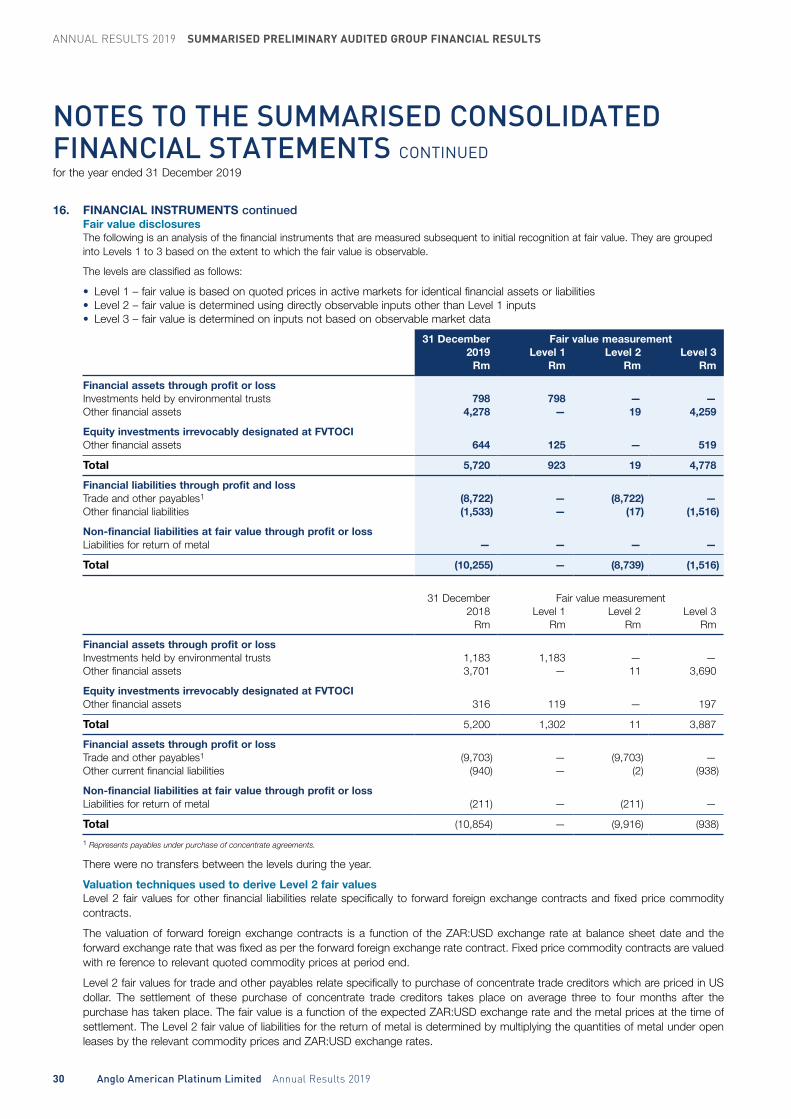
ANNUAL RESULTS 2019 SUMMARISED PRELIMINARY AUDITED GROUP FINANCIAL RESULTS
30 Anglo American Platinum Limited Annual Results 2019
NOTES TO THE SUMMARISED CONSOLIDATED FINANCIAL STATEMENTS CONTINUEDfor the year ended 31 December 2019
16. FINANCIAL INSTRUMENTS continuedFair value disclosuresThe following is an analysis of the financial instruments that are measured subsequent to initial recognition at fair value. They are grouped into Levels 1 to 3 based on the extent to which the fair value is observable.
The levels are classified as follows:
• Level 1 – fair value is based on quoted prices in active markets for identical financial assets or liabilities • Level 2 – fair value is determined using directly observable inputs other than Level 1 inputs • Level 3 – fair value is determined on inputs not based on observable market data
31 December Fair value measurement2019 Level 1 Level 2 Level 3
Rm Rm Rm Rm
Financial assets through profit or lossInvestments held by environmental trusts 798 798 — —Other financial assets 4,278 — 19 4,259
Equity investments irrevocably designated at FVTOCIOther financial assets 644 125 — 519
Total 5,720 923 19 4,778
Financial liabilities through profit and lossTrade and other payables1 (8,722) — (8,722) —Other financial liabilities (1,533) — (17) (1,516)
Non-financial liabilities at fair value through profit or lossLiabilities for return of metal — — — —
Total (10,255) — (8,739) (1,516)
31 December Fair value measurement2018 Level 1 Level 2 Level 3
Rm Rm Rm Rm
Financial assets through profit or lossInvestments held by environmental trusts 1,183 1,183 — —Other financial assets 3,701 — 11 3,690
Equity investments irrevocably designated at FVTOCIOther financial assets 316 119 — 197
Total 5,200 1,302 11 3,887
Financial assets through profit or lossTrade and other payables1 (9,703) — (9,703) —Other current financial liabilities (940) — (2) (938)
Non-financial liabilities at fair value through profit or lossLiabilities for return of metal (211) — (211) —
Total (10,854) — (9,916) (938)
1 Represents payables under purchase of concentrate agreements.
There were no transfers between the levels during the year.
Valuation techniques used to derive Level 2 fair valuesLevel 2 fair values for other financial liabilities relate specifically to forward foreign exchange contracts and fixed price commodity contracts.
The valuation of forward foreign exchange contracts is a function of the ZAR:USD exchange rate at balance sheet date and the forward exchange rate that was fixed as per the forward foreign exchange rate contract. Fixed price commodity contracts are valued with re ference to relevant quoted commodity prices at period end.
Level 2 fair values for trade and other payables relate specifically to purchase of concentrate trade creditors which are priced in US dollar. The settlement of these purchase of concentrate trade creditors takes place on average three to four months after the purchase has taken place. The fair value is a function of the expected ZAR:USD exchange rate and the metal prices at the time of settlement. The Level 2 fair value of liabilities for the return of metal is determined by multiplying the quantities of metal under open leases by the relevant commodity prices and ZAR:USD exchange rates.
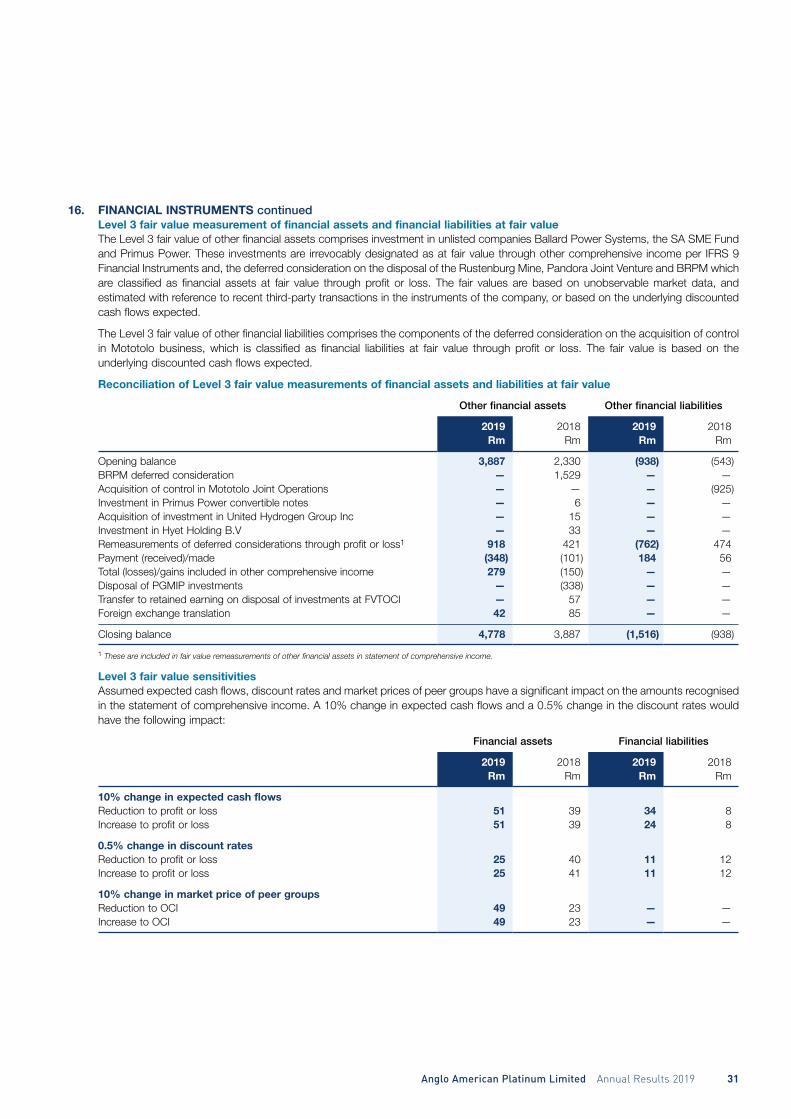
Anglo American Platinum Limited Annual Results 2019 31
16. FINANCIAL INSTRUMENTS continuedLevel 3 fair value measurement of financial assets and financial liabilities at fair valueThe Level 3 fair value of other financial assets comprises investment in unlisted companies Ballard Power Systems, the SA SME Fund and Primus Power. These investments are irrevocably designated as at fair value through other comprehensive income per IFRS 9 Financial Instruments and, the deferred consideration on the disposal of the Rustenburg Mine, Pandora Joint Venture and BRPM which are classified as financial assets at fair value through profit or loss. The fair values are based on unobservable market data, and estimated with reference to recent third-party transactions in the instruments of the company, or based on the underlying discounted cash flows expected.
The Level 3 fair value of other financial liabilities comprises the components of the deferred consideration on the acquisition of control in Mototolo business, which is classified as financial liabilities at fair value through profit or loss. The fair value is based on the underlying discounted cash flows expected.
Reconciliation of Level 3 fair value measurements of financial assets and liabilities at fair value
Other financial assets Other financial liabilities
2019 2018 2019 2018Rm Rm Rm Rm
Opening balance 3,887 2,330 (938) (543)BRPM deferred consideration — 1,529 — —Acquisition of control in Mototolo Joint Operations — — — (925)Investment in Primus Power convertible notes — 6 — —Acquisition of investment in United Hydrogen Group Inc — 15 — —Investment in Hyet Holding B.V — 33 — —Remeasurements of deferred considerations through profit or loss1 918 421 (762) 474Payment (received)/made (348) (101) 184 56Total (losses)/gains included in other comprehensive income 279 (150) — —Disposal of PGMIP investments — (338) — —Transfer to retained earning on disposal of investments at FVTOCI — 57 — —Foreign exchange translation 42 85 — —
Closing balance 4,778 3,887 (1,516) (938)
1 These are included in fair value remeasurements of other financial assets in statement of comprehensive income.
Level 3 fair value sensitivitiesAssumed expected cash flows, discount rates and market prices of peer groups have a significant impact on the amounts recognised in the statement of comprehensive income. A 10% change in expected cash flows and a 0.5% change in the discount rates would have the following impact:
Financial assets Financial liabilities
2019 2018 2019 2018Rm Rm Rm Rm
10% change in expected cash flowsReduction to profit or loss 51 39 34 8Increase to profit or loss 51 39 24 8
0.5% change in discount ratesReduction to profit or loss 25 40 11 12Increase to profit or loss 25 41 11 12
10% change in market price of peer groupsReduction to OCI 49 23 — —Increase to OCI 49 23 — —
ANNUAL RESULTS 2019 SUMMARISED PRELIMINARY AUDITED GROUP FINANCIAL RESULTS
32 Anglo American Platinum Limited Annual Results 2019
NOTES TO THE SUMMARISED CONSOLIDATED FINANCIAL STATEMENTS CONTINUEDfor the year ended 31 December 2019
17. IMPAIRMENT OF ASSETS AND INVESTMENTSEquity investments in Atlatsa Resources and Bokoni Holdco and associated loansAAP no longer holds a shareholding in Atlatsa in 2019 (2018: 22.76%) but still holds a 49.00% shareholding in Bokoni Holdco, which is equity accounted as an associate.
On 21 July 2017 Atlatsa Resources announced the placement of Bokoni Platinum Mine on care and maintenance, which was effected on 1 October 2017. AAP committed to support Bokoni while on care and maintenance until the end of December 2019. A total of R139 million was advanced during the year ended 31 December 2019.
All funding advanced has been impaired to the extent that it comprises a loan to Atlatsa for its 51% share of the funding requirements. The 49% effective shareholder contribution to Bokoni was capitalised to the investment. Equity-accounted losses were applied thereto.
BokoniR68 million (49%) of the care and maintenance funding was capitalised to the investment in Bokoni and equity-accounted losses to the same value were applied against this amount. The equity-accounted losses impact headline earnings.
AtlatsaR71 million (51%) of the care and maintenance funding for 2019 was capitalised as a loan to Atlatsa. R54 million hereof was impaired leaving a carrying value of R241 million which was recovered through the acquisition of the Kwanda North and Central Block prospecting rights for R541 million.
18. CHANGES IN ACCOUNTING POLICIESIFRS 16The Group adopted IFRS 16 Leases on 1 January 2019, using a modified retrospective approach whereby the comparative impact was recognised in retained earnings. This resulted in an increase in property, plant and equipment (right-of-use asset) of R491 million, in financial liabilities (lease liability) of R593 million and a decrease in retained earnings of R136 million.
IFRS 16 introduces new or amended requirements with respect to lease accounting. It introduces significant changes to lessee accounting by removing the distinction between operating and finance lease and requiring the recognition of a right-of-use asset and a lease liability at commencement for all leases, except for short-term leases and leases of low value assets when such recognition exemptions are adopted. In contrast to lessee accounting, the requirements for lessor accounting have remained largely unchanged.
The impact of the adoption of IFRS 16 on the Group’s consolidated financial statements is described below.
The Group has applied IFRS 16 using the cumulative catch-up approach which:
• Requires the Group to recognise the cumulative effect of initially applying IFRS 16 as an adjustment to the opening balance of retained earnings at the date of initial application.
• Does not permit restatement of comparatives, which continue to be presented under IAS 17 and IFRIC 4.
The Group has made use of the practical expedient available on transition to IFRS 16 not to reassess whether a contract is or contains a lease. Accordingly, the definition of a lease in accordance with IAS 17 and IFRIC 4 will continue to be applied to those leases entered or changed before 1 January 2019.
The Group has used the following practical expedients when applying the cumulative catch-up approach to leases previously classified as operating leases applying IAS 17.
• The Group has applied a single discount rate to a portfolio of leases with reasonably similar characteristics. • The Group has elected not to recognise right-of-use assets and lease liabilities to leases for which the lease term ends within 12 months of the date of initial application.
• The Group has excluded initial direct costs from the measurement of the right-of-use asset at the date of initial application. • The Group has used hindsight when determining the lease term when the contract contains options to extend or terminate the lease.
For leases that were classified as finance leases applying IAS 17, the carrying amount of the leased assets and obligations under finance leases measured applying IAS 17 immediately before the date of initial application is reclassified to right-of-use assets and lease liabilities respectively without any adjustments, except in cases where the Group has elected to apply the low-value lease recognition exemption. The right-of-use asset and the lease liability are accounted for applying IFRS 16 from 1 January 2019.
The weighted average lessees incremental borrowing rate applied to lease liabilities recognised in the statement of financial position on 1 January 2019 is 8.69%.
Anglo American Platinum Limited Annual Results 2019 33
18. CHANGES IN ACCOUNTING POLICIES continuedThe following table shows the operating lease commitments disclosed applying IAS 17 at 31 December 2018, discounted using the incremental borrowing rate at the date of initial application and the lease liabilities recognised in the statement of financial position at the date of initial application.
Rm
Operating lease commitments at 31 December 2018 1,658Effect of discounting the above amounts (1,182)Finance lease liabilities recognised under IAS 17 at 31 December 2018 117
Lease liabilities recognised at 1 January 2019 593
19. CHANGES IN ACCOUNTING ESTIMATESEnvironmental obligationsDuring the annual review of environmental liabilities, the discount periods of certain operations were revised to align with revised life of mine plans. This resulted in an overall increase in discounting period for the purposes of determining the Group’s environmental obligations. This was accounted for as a change in accounting estimate and therefore adjusted prospectively, reducing the obligation at year end by R303 million.
As this comprised a change in the timing of the rehabilitation of related assets, the decrease was first recognised as a reduction in the related decommissioning asset in terms of IFRIC 1 Changes in Existing Decommissioning, Restoration and Similar Liabilities. This resulted in a decrease in the decommissioning asset of R7 million to reduce it to a Rnil balance. The remainder of the reduction was recognised in profit or loss.
This is a once-off adjustment and it does not impact the future periods, except for the future depreciation on relevant decommissioning asset being Rnil, giving rise to an increased future gross profit on metal sales and operating profit.
InventoryDuring the current period, the Group changed its estimate of the quantities of inventory based on the outcome of a physical count of in-process metals. The Group runs a theoretical metal inventory system based on inputs, the results of previous counts and outputs. Due to the nature of in-process inventories being contained in weirs, pipes and other vessels, physical counts only take place once per annum, except in the Precious Metal Refinery, where the physical count is usually conducted every three years. The Precious Metals Refinery physical count was conducted in 2020
This change in estimate had the effect of increasing the value of inventory disclosed in the financial statements by R961 million (31 December 2018: decrease of R485 million). This results in the recognition of an after tax gain of R692 million (31 December 2018: after tax loss of R349 million).
20. BUSINESS COMBINATIONIn 2018, AAP signed a binding SPA to acquire Glencore’s 40% in the unincorporated Mototolo Mine joint venture (JV) which will increased its interest to 90%, structured in two phases, which can be completed independently of one another. AAP held an existing interest of 50% in the JV.
Phase 1 for the acquisition of 40% of the business was subject to competition commission approval, which was granted and therefore, became unconditional on 1 November 2018. Phase 2 for the transfer of Glencore’s Thorncliff mining right requires DMR section 102 approval.
Phase 1 of the transaction was completed on 1 November 2018, acquisition date, from which date AAP obtained control of the Mototolo Mine and was therefore consolidated for two months ended 31 December 2018. On the acquisition date Kagiso, Glencore’s BEE partner in Mototolo mine, sold its 10% interest in Mototolo Mine to AAP thereby granting AAP 100% ownership of the Mototolo Mine.
Mototolo Mine is engaged in mining operations and was acquired to continue the expansion of the Group’s operations in mining.
Rm
Consideration transferredUpfront cash payment 1,278
Glencore’s 40% interest 1,011Kagiso’s 10% interest 267
Existing purchase of concentrate (POC) liability derecognised (486)Contingent deferred consideration 925
1,717
The consideration is made up of an upfront payment of R1,278 million (R267 million for Kagiso and R1,011 million for Glencore’s interest) which was paid on 1 November 2018 and the remaining balance paid monthly on a deferred basis over a period of 72 months at equal instalments of R12.6 million. The contingent deferred consideration is remeasured based on the actual PGM 4E prices realised from the effective date of the transaction to 31 December 2024, with resulting changes recognised in profit or loss and included in headline earnings. The maximum amount payable is limited to R22 billion. This is, however, unlikely to be reached as the PGM 4E prices will have to increase significantly. Refer to note 16 for sensitivity analysis of financial liabilities.

ANNUAL RESULTS 2019 SUMMARISED PRELIMINARY AUDITED GROUP FINANCIAL RESULTS
34 Anglo American Platinum Limited Annual Results 2019
NOTES TO THE SUMMARISED CONSOLIDATED FINANCIAL STATEMENTS CONTINUEDfor the year ended 31 December 2019
20. BUSINESS COMBINATION continuedAcquisition-related costs to the value of R13 million were incurred, excluded from consideration transferred and recognised as an expense in profit or loss.
The purchase of concentrate liability, that was payable to Glencore for concentrate delivered to AAP, will not be required to be made and therefore comprise a purchase price adjustment.
Provisional Finalamount Adjustments amount
Rm Rm Rm
Assets acquired and liabilities assumed on 1 November 2018Non-current assets 2,889 59 2,948
Property, plant and equipment1 1,803 (67) 1,736Mining right 121 126 247Environmental trust assets 893 — 893Capital work in progress 72 — 72
Current assets 130 — 130
Trade and other receivables2 7 — 7Inventory 123 — 123Other assets — — —Cash and cash equivalents — — —
Total assets 3,019 59 3,078
Non-current liabilities 136 — 136
Environmental obligations 136 — 136
Current liabilities 301 — 301
Trade and other payables 239 — 239Other liabilities 62 — 62
Total liabilities 437 — 437
Net asset 2,582 59 2,641
Property plant and equipment is made up as follows:Mining infrastructure and development (including goodwill) 1,192 (290) 902Plant and equipment (including chrome plant) 484 (3) 481Land and buildings 12 (1) 11Decommissioning asset 5 — 5
1,693 (294) 1,399
1 Property, plant and equipment acquired includes the chrome plant with a fair value of R61 million purchased from Glencore. This is included in the business combination accounting because it was negotiated as part of the acquisition of the acquiree’s business. The chrome plant will continue to be operated by Glencore at its own costs to obtain the chrome concentrate that was part of an existing chrome supply contract. A new chrome supply agreement was entered into on the same commercial terms until 31 December 2024, at the end of the life of the mining right related to the chrome business. The fair value of the mining right related to the chrome business has therefore taken into account the fact that the chrome business is not transferred to AAP.
2 The receivables acquired (which primarily comprised trade receivables) in this transaction with a fair value of R7 million had a gross contractual amounts of R7 million. The best estimate at acquisition date of the contractual cash flows not expected to be collected are Rnil.

Anglo American Platinum Limited Annual Results 2019 35
20. BUSINESS COMBINATION continuedProvisional Final
amount Adjustments amountRm Rm Rm
Fair value of the existing 50% interest in the JVCarrying value (50% of the net asset value before acquisition) 924 — 924Fair value 1,260 60 1,320
Gain on existing shareholding recognised in profit or loss 336 60 396
Excess of consideration transferred over net asset acquiredConsideration transferred 1,717 — 1,717Plus: Fair value of the existing shareholding 1,260 60 1,320
2,977 60 3,037Less: Fair value of the identifiable assets and liabilities (2,582) (58) (2,640)Less: Deferred tax (42) 42 —
Goodwill1 353 44 397
Net cash flows on acquisition of Mototolo MineConsideration paid in cash 1,717 — 1,717Less: Cash and cash equivalents acquired — — —
1,717 — 1,717
1 Goodwill represents synergies/improvements arising from the utilisation of the acquired Mototolo infrastructure to mine and process Der Brochen and other adjacent properties.
The following transaction is recognised separately from the business combination accounting:AAP and Glencore had an existing chrome supply agreement that continues post the business combination on the same commercial terms to the end of December 2024. This is treated separately from the business combination accounting because it is not settled as part of the business combination. This transaction is accounted for in terms of IFRS 15 Revenue from Contracts with Customers with revenue recognised and presented in the statement of comprehensive income.
A reconciliation between property, plant and equipment assumed on 1 November and that disclosed as part of property, plant and equipment is as follows:
Provisional Finalamount Adjustments amount
Rm Rm Rm
Assets acquired and liabilities assumed on 1 November 2018Non-current assets Property, plant and equipment 1,803 (67) 1,736Mining right 121 126 247Less: Assets already included in property, plant and equipment before acquisition (584) — (584)Goodwill on acquisition 353 44 397
1,693 103 1,796Less: Goodwill disclosed separately — (397) (397)
Property, plant and equipment disclosed 1,693 (294) 1,399

ANNUAL RESULTS 2019 SUMMARISED PRELIMINARY AUDITED GROUP FINANCIAL RESULTS
36 Anglo American Platinum Limited Annual Results 2019
NOTES TO THE SUMMARISED CONSOLIDATED FINANCIAL STATEMENTS CONTINUEDfor the year ended 31 December 2019
21. ACQUISITION AND DISPOSAL TRANSACTIONSBafokeng Rasimone Platinum Mine (BRPM)On 4 July 2018 AAP signed a binding agreement to dispose of its 33% interest in the unincorporated BRPM joint venture to Royal Bafokeng Platinum (RB Plat) structured in two phases, which will be completed independently. Phase 1 is for the sale of AAP’s 33% interest in BRPM. Shareholder and lender approvals were obtained and the capital raise by RB Plat was completed on 26 September 2018. Phase 2 is for the transfer of AAP’s 33% interest in the mining rights, which required section 11 DMR approval and was obtained on 26 June 2019.
This phase of the transaction has no accounting implications as it was an equity accounted associate with no separate mining rights recognised in the Group’s accounts.
Acquisition of Kwanda North and Central Block rightsThe Group and Atlatsa completed the acquisition and inclusion of the resources specified in the Kwanda North and Central Block prospecting rights into Mogalakwena’s mining right on 27 August 2019 for a total consideration of R541 million consisting of R300 million in cash and the waiving of a loan to Plateau of R241 million. Cash consideration consisted of R30 million for resources specified in Kwanda North and R270 million for Central Block prospecting rights. The loan to Plateau of R241 million was waived and capitalised to mining assets as part of the acquisition price for this transaction.
22. POST-BALANCE SHEET EVENTSSettlement of BRPM deferred considerationThe Group disposed of its 33% interest in Bafokeng Rasimone Platinum Mine (BRPM) to Royal Bafokeng Platinum (RBPlat) for a total purchase consideration of R1,863 billion, plus an additional R315 million for the repayment of RPM’s contribution into the BRPM JV from date of signature. The upfront consideration of R555 million was settled on completion date (R11 December 2018). The outstanding purchase consideration of R1.6 billion was deferred and left on loan account and escalated at RBPlat’s borrowing rate plus a premium of 2%. The deferred consideration was to be paid in three equal tranches after 1.5 years, 2.5 years and 3.5 years from the completion date.
During October 2019, RBPlat entered into a gold streaming agreement with Triple Flag and stated their intention to utilise the proceeds to early settle the deferred consideration owed to the Group. An amount of R1.85 billion was received on 30 January 2020 for the early settlement of the deferred consideration.
Dividend declaredA final dividend of R11.2 billion (R41.60 per share) for the year ended 31 December 2019 was declared after year end, payable on Monday, 9 March 2020 to shareholders recorded in the register at the close of business on Friday, 6 March 2020.
23. AUDIT BY COMPANY’S AUDITORSThe consolidated financial statements from which the summarised consolidated financial statements have been extracted have been audited by the Company’s auditors, Deloitte & Touche and are consistent in all material respects with the consolidated financial statements. The audit of the summarised consolidated financial statements was performed in accordance with ISA 810 (Revised) , Engagement to Report on Summary Financial Statements. The auditor’s report does not necessarily report on all the information contained in this announcement. Shareholders are therefore advised that, in order to obtain a full understanding of the nature of the auditors’ engagement, they should obtain a copy of the auditor’s report together with the accompanying financial information from the Company’s registered office. The consolidated financial statements, their unmodified report on the consolidated financial statements and the summarised consolidated financial statements are available for inspection at the Company’s registered office and on the Company’s website. Any reference to future financial performance, included in this announcement, has not been reviewed or reported on by the Company’s auditors.
Anglo American Platinum Limited Annual Results 2019 37
INDEPENDENT AUDITOR’S REPORT ON SUMMARISED CONSOLIDATED FINANCIAL STATEMENTS TO THE SHAREHOLDERS OF ANGLO AMERICAN PLATINUM LIMITED Opinion The summarised consolidated financial statements of Anglo American Platinum Limited, which comprise the summarised consolidated statement of financial position as at 31 December 2019, the summarised consolidated statements of comprehensive income, changes in equity and cash flows for the year then ended, and related notes, are derived from the audited consolidated financial statements of Anglo American Platinum Limited for the year ended 31 December 2019. In our opinion, the accompanying summarised consolidated financial statements are consistent, in all material respects, with the audited consolidated financial statements of Anglo American Platinum Limited, in accordance with the requirements of the JSE Limited Listings Requirements for preliminary reports, set out in note 1 to the summarised consolidated financial statements, and the requirements of the Companies Act of South Africa as applicable to summarised financial statements. Other Matter We have not audited future financial performance and expectations by management included in the accompanying summarised consolidated financial statements and accordingly do not express any opinion thereon. Summarised Consolidated Financial Statements The summarised consolidated financial statements do not contain all the disclosures required by the International Financial Reporting Standards and the requirements of the Companies Act of South Africa as applicable to annual financial statements. Reading the summarised consolidated financial statements and the auditor’s report thereon, therefore, is not a substitute for reading the audited consolidated financial statements of Anglo American Platinum Limited and the auditor’s report thereon. The Audited Consolidated Financial Statements and Our Report Thereon We expressed an unmodified audit opinion on the audited consolidated financial statements in our report dated 15 February 2020. That report also includes:
• The communication of other key audit matters as reported in the auditor’s report of the audited financial statements. Directors’ Responsibility for the Summarised Consolidated Financial Statements The directors are responsible for the preparation of the summarised consolidated financial statements in accordance with the requirements of the JSE Limited Listings Requirements for preliminary reports, set out in note 1 to the summarised consolidated financial statements, and the requirements of the Companies Act of South Africa as applicable to summarised financial statements. The Listings Requirements require preliminary reports to be prepared in accordance with the framework concepts and the measurement and recognition requirements of International Financial Reporting Standards (IFRS), the SAICA Financial Reporting Guides as issued by the Accounting Practices Committee, and Financial Pronouncements as issued by the Financial Reporting Standards Council, and to also, as a minimum, contain the information required by IAS 34, Interim Financial Reporting. Auditor’s Responsibility Our responsibility is to express an opinion on whether the summarised consolidated financial statements are consistent, in all material respects, with the consolidated audited financial statements based on our procedures, which were conducted in accordance with International Standard on Auditing (ISA) 810 (Revised), Engagements to Report on Summarised Financial Statements. Deloitte & Touche
Registered Auditors Per: Graeme Berry Partner 15 February 2020 Woodlands Office Park
Johannesburg

ANNUAL RESULTS 2019 GROUP PERFORMANCE DATA
38 Anglo American Platinum Limited Annual Results 2019
SUSTAINABILITY COMMITMENTS for the year ended 31 December 2019
Objective areas 2019 target 2019 performance – year end
Safety and health Zero fatalities Zero fatalities
TRCFR (per million hours) lower than 3.45 (2019 improvement target)
2.50 TRCFR per million hours worked
LTIFR (per million hours) lower than 1.79 (15% BU improvement target)
Note: No longer a targeted metric for Anglo American Platinum
2.14 LTIFR per million hours worked
HIV management: 90% of at risk population knowing their status
97% of employees know their HIV status
HIV management: 90% of HIV-positive undergoing treatment (on ART)
91% of known HIV-positive employees are on ART
TB incidence rate of below 600 per 100,000 TB incidence rate of 328 per 100,000 employees
Medical Surveillance: 100% annual medical surveillance of persons potentially at risk of exposure to airborne pollutants (Cat A)
100% annual medical surveillance of Cat A employees (Excludes Unki)
Mineral policy and legislative compliance
26% ownership of Reserves and Resources by historically disadvantaged South Africans (HDSAs)
44.7% measured as the HDSA shareholding in the businesses that we control and the portion of our business transferred to HDSAs
HDSA procurement expenditure:
Capital Goods (40%) 71%Services (70%) 70%Consumables (50%) 76%
According to MC3 Targets (2019 – 2024)
HDSA in:Top management (Board): 50% 27%Women in top management (Board): 20% 18%Executive management (Exco): 50% 50%Women at Exco level: 20% 33%Senior management: 60% 51%Women in senior management: 25% 16%Middle management: 60% 71%Women in middle management: 25% 27%Junior management: 70% 82%Women in junior management: 30% 24%Core Skills: 60% 88%
Maintain ISO 14001 certification: 100% renewal of certificates for RBMR and PMR
Rustenburg Base Metals Refinery (RMBR) and Precious Metals Refinery (PMR), which are responsible for product delivery and compliance to external requirements, have maintained certification in 2019 for their environmental management systems against the new ISO 14001:2015 standard.
Zero Level 4 and 5 environmental incidents On target – No level 4 or 5 environmental incidents reported
Zero environmental legal non-compliance directives On target - No directives received
Labour relations and our performance
Target of 106 PGM ounces produced per employee Achieved – 110.5 PGM ounces produced per employee
Labour unavailability to be below 19.07% The total absence rate for 2019 is 18.37% (2018 = 20%) including annual leave of ~8.3% in line with 2018. Absenteeism improved mainly due to improved sick and AWOP absenteeism.

Anglo American Platinum Limited Annual Results 2019 39
Objective areas 2019 target 2019 performance – year end
Community development
Implementation of second generation SLP In progress – 42 of the 74 projects from all our sites have been completed. The 32 are at different stages of implementation and due for completion at the end of 2020 with the exception of Twickenham which are due in 2021.
1% after-tax profit to be spent on community development
Total spend amounted to R251 million (excluding Unki spend R9 million)
Access to and allocation of natural resources
3% reduction target for Energy consumption to be achieved for the period 2016 – 2020, driving a 1% reduction per annum.
• 2018 absolute consumption target of 21.2 million GJ
• Energy consumption of 20.01 million GJ
• 2019 energy intensity target of 0.83 GJ per tonne milled
• Energy intensity of 0.80 GJ per tonne milled.
5% reduction in CO² emissions per unit of production for the period 2016 – 2020, equating to a 1% reduction per annum.
Note: Not a 2018 targeted metric for Anglo American Platinum
CO² equivalent emissions of 4.4 Mt CO²e or 0.18 t CO²e per tonne milled(Scope 1 and 2 only)
9.5% reduction in water consumption (2.7 Mm³) against the 2020 BAU projected demand (28.5 Mm³).
• 2018 total new water abstraction or withdrawal target of 29.6 Mm³
• Total water withdrawal of 25.1 Mm3
• 2019 potable water abstraction target of 7.4 Mm³ • Potable water withdrawal of 7.6 Mm3 • 2019 total new water withdrawal intensity target
of 1.17 m3 per tonne milled • Total water withdrawal intensity of 1.00 m3
per tonne milled
Achieved/on targetNot achieved/below targetIn progress

ANNUAL RESULTS 2019 GROUP PERFORMANCE DATA
40 Anglo American Platinum Limited Annual Results 2019
GROUP PERFORMANCE DATAfor the year ended 31 December 2019
Glossary of terms Description/Definition
Average in service employees The average number of employees costed on both working cost and SIB, in service over the full financial year
All-in sustaining costs Includes cash operating costs, other indirect costs, other direct and allocated net expenses, direct and allocated sustaining capex, capitalised waste stripping and allocated marketing and market development costs net of revenue from all metals other than platinum – presented before project and restructuring costs and abnormal activities
Attributable economic free cash flow
Cash flow after all cash expenses (mining, overhead, marketing and market development), sustaining (SIB) and capitalised waste
Attributable net cash flow Cash flow after all cash expenses (mining, overhead, marketing and market development), sustaining (SIB), capitalised waste and project capital expenses
Cash-on mine costs Includes all direct mining, concentrating plus on-mine and allocated centralised services costs
Cash operating costs Includes all direct mining, concentrating, on-mine and allocated centralised services, allocated smelting, treatment and refining costs
Cash on-mine cost per tonne milled Cash-on mine costs over tonnes milled – mined volume metric only
Cash operating cost per PGM oz produced
Cash operating costs for mined volume over PGM ounces produced from mined volume. Excludes Purchase of concentrate (POC) and project costs for Twickenham
Cash operating cost per platinum ounce produced
Cash operating costs for mined volume over Pt ounces produced from mined volume –excludes purchase of concentrate (POC) and project costs for Twickenham
EBITDA Earnings before interest, tax, depreciation and amortisation adjusted to exclude scrapping of property, plant and equipment. Prior years recalculated for comparability
EBIT Earnings before interest and tax adjusted to exclude scrapping of property, plant and equipment. Prior years recalculated for comparability
Headcount (as at period ended) Includes AAP own and contractors excluding JV employees and contractors as at 31 December costed to working costs and stay-in business capital
Other PGMs + Gold Sum total of rhodium, iridium, ruthenium and gold
PGMs Sum total of platinum, palladium, rhodium, iridium, ruthenium and gold
PGM ounces produced per employee PGM ounces produced from mined volume (both own and JV mines) expressed as output per average employee for both Own mines and attributable JV employees
POC Purchase of concentrate
Produced ounces M&C Metal in concentrate delivered to the smelters for onward processing
Rand basket price per PGM oz sold – average
Net sales revenue from all metals (PGMs, base metals and other metals) over PGM ounces sold – excluding trading
Rand basket price per Pt oz sold – average
Net sales revenue from all metals (PGMs, base metals and other metals) over Pt ounces sold – excluding trading
Rand basket price per PGM oz sold – mined
Net sales revenue from all metals (PGMs, base metals and other metals) over PGM ounces sold for mined volume from own mines and attributable mined volumes from JVs – excluding trading
Rand basket price per Pt oz sold – mined
Net sales revenue from all metals (PGMs, base metals and other metals) over Pt ounces sold for mined volume from own mines and attributable mined volumes from JVs – excluding trading
Rand Basket Price per PGM oz sold – POC
Net sales revenue from all metals (PGMs, base metals and other metals) over PGM ounces sold for total POC volume – excluding trading
Rand Basket Price per Pt oz sold – POC
Net sales revenue from all metals (PGMs, base metals and other metals) over Pt ounces sold for total POC volume – excluding trading
ROCE Return on capital employed calculated as EBIT over average capital employed
Stay–in–business (SIB) SIB capital reported on asset analysis includes on-mine sustaining capital as well as allocated off-mine smelting, treatment and refining sustaining capital expenditure
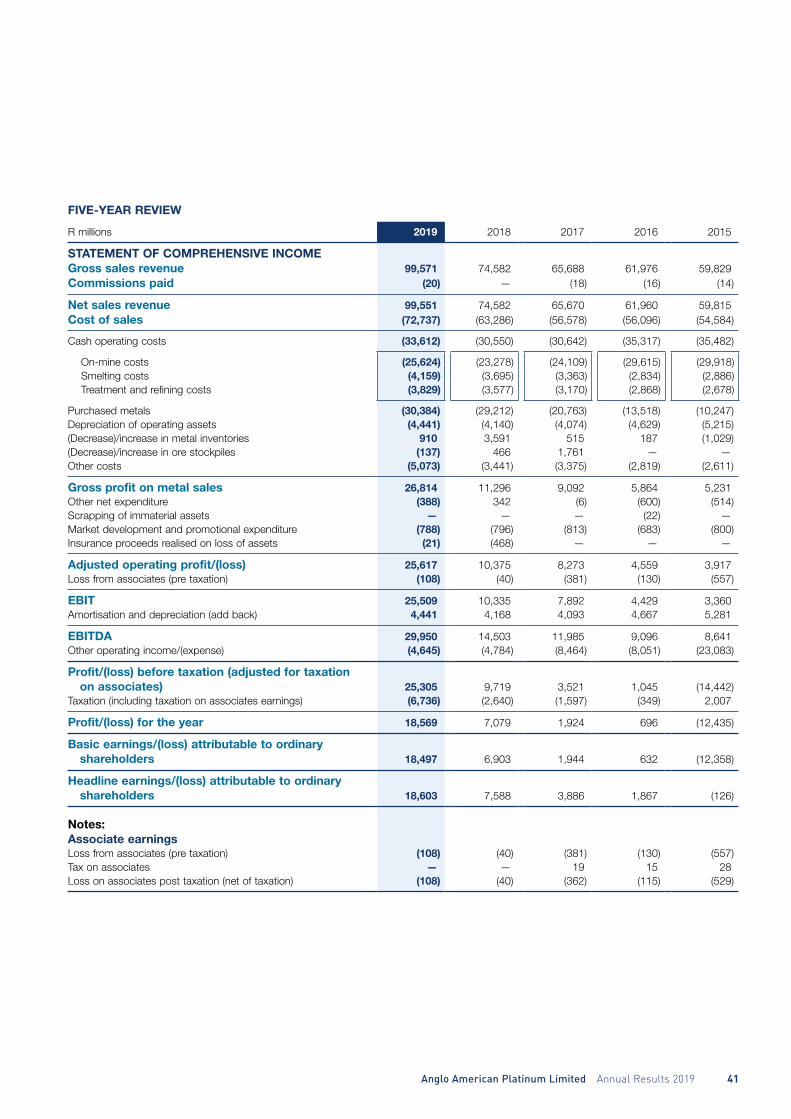
Anglo American Platinum Limited Annual Results 2019 41
FIVE-YEAR REVIEW
R millions 2019 2018 2017 2016 2015
STATEMENT OF COMPREHENSIVE INCOMEGross sales revenue 99,571 74,582 65,688 61,976 59,829Commissions paid (20) — (18) (16) (14)
Net sales revenue 99,551 74,582 65,670 61,960 59,815Cost of sales (72,737) (63,286) (56,578) (56,096) (54,584)
Cash operating costs (33,612) (30,550) (30,642) (35,317) (35,482)
On-mine costs (25,624) (23,278) (24,109) (29,615) (29,918)Smelting costs (4,159) (3,695) (3,363) (2,834) (2,886)Treatment and refining costs (3,829) (3,577) (3,170) (2,868) (2,678)
Purchased metals (30,384) (29,212) (20,763) (13,518) (10,247)Depreciation of operating assets (4,441) (4,140) (4,074) (4,629) (5,215)(Decrease)/increase in metal inventories 910 3,591 515 187 (1,029)(Decrease)/increase in ore stockpiles (137) 466 1,761 — —Other costs (5,073) (3,441) (3,375) (2,819) (2,611)
Gross profit on metal sales 26,814 11,296 9,092 5,864 5,231Other net expenditure (388) 342 (6) (600) (514)Scrapping of immaterial assets — — — (22) —Market development and promotional expenditure (788) (796) (813) (683) (800)Insurance proceeds realised on loss of assets (21) (468) — — —
Adjusted operating profit/(loss) 25,617 10,375 8,273 4,559 3,917Loss from associates (pre taxation) (108) (40) (381) (130) (557)
EBIT 25,509 10,335 7,892 4,429 3,360Amortisation and depreciation (add back) 4,441 4,168 4,093 4,667 5,281
EBITDA 29,950 14,503 11,985 9,096 8,641Other operating income/(expense) (4,645) (4,784) (8,464) (8,051) (23,083)
Profit/(loss) before taxation (adjusted for taxation on associates) 25,305 9,719 3,521 1,045 (14,442)Taxation (including taxation on associates earnings) (6,736) (2,640) (1,597) (349) 2,007
Profit/(loss) for the year 18,569 7,079 1,924 696 (12,435)
Basic earnings/(loss) attributable to ordinary shareholders 18,497 6,903 1,944 632 (12,358)
Headline earnings/(loss) attributable to ordinary shareholders 18,603 7,588 3,886 1,867 (126)
Notes:Associate earningsLoss from associates (pre taxation) (108) (40) (381) (130) (557)Tax on associates — — 19 15 28Loss on associates post taxation (net of taxation) (108) (40) (362) (115) (529)

ANNUAL RESULTS 2019 GROUP PERFORMANCE DATA
42 Anglo American Platinum Limited Annual Results 2019
GROUP PERFORMANCE DATA CONTINUEDfor the year ended 31 December 2019
FIVE-YEAR REVIEW
R millions 2019 2018 2017 2016 2015
Reconciliation of profit before tax to EBITDAProfit/(loss) before taxation (adjusted for taxation on associates) 25,305 9,719 3,521 1,045 (14,442)Adjusted for:Share-based payment expense for faciliation of BEE investment — — — 156 —Loss on disposal of Rustenburg Mine — — — 1,681 —Loss on scrapping of property, plant and equipment — — — — —Loss on revaluation of investment in Wesizwe Platinum Limited 173 21 1,699 — 10,242Impairment of investments in associates — 1,138 2,145 283 4,082Impairment of non-current financial assets 77 234 777 111 1,792Loss on disposal of Union Mine and Masa Chrome — 850 — — 775Insurance proceeds realised on loss of assets (21) (468) — — —Gain on step acquistion of Mototolo JV — (396) — — —Profit on disposal of PGMIP — (249) — — —Profit on disposal of long-dated resources — — (1,066) — —Profit on disposal of associates — (15) (135) — —Net investment (expense)/income (25) (500) 951 1,153 911Amortisation and depreciation 4,441 4,168 4,093 4,667 5,281
EBITDA 29,950 14,503 11,985 9,096 8,641
STATEMENT OF FINANCIAL POSITIONAssetsProperty, plant and equipment 43,504 39,708 36,597 38,574 39,869Capital work-in-progress 8,501 7,780 5,361 4,892 6,548Investment in associates and joint ventures 413 407 2,464 3,963 3,883Investments held by environmental trusts 798 1,183 970 907 882Other financial assets 2,558 4,109 3,507 3,326 1,023Other non-current assets — 18 39 — —Goodwill 397 397 — — —Inventory 1,006 650 — — —Current assets 46,843 35,138 31,318 26,035 20,715Non-current assets held for sale — — 558 — —
Total assets 104,020 89,390 80,814 77,697 72,920
Equity and liabilitiesShareholder’s equity 60,842 47,428 41,001 39,782 39,244Long-term interest-bearing borrowings 281 6,038 9,362 9,398 12,124Lease liabilities 404 100 98 96 94Other financial liabilities 924 762 239 219 —Environmental obligations 1,898 1,925 1,693 1,938 2,404Employees’ service benefit obligations 19 15 17 17 14Deferred taxation 11,120 8,238 7,455 7,519 7,928Current liabilities 28,532 24,884 20,374 18,728 11,112Liabilities associated with non-current assets held for sale — — 575 — —
Total equity and liabilities 104,020 89,390 80,814 77,697 72,920

Anglo American Platinum Limited Annual Results 2019 43
R millions 2019 2018 2017 2016 2015
STATEMENT OF CASH FLOWSNet cash from operating activities 28,438 15,580 13,121 11,400 8,264Net cash used in investing activities (8,114) (8,214) (7,118) (5,829) (6,064)
Purchase of property, plant and equipment (including interest capitalised) (8,600) (6,964) (4,969) (5,018) (5,152)Other 486 (1,250) (2,149) (811) (912)
Net cash from/(used in) financing activities (11,308) (7,168) (2,103) (1,786) (1,730)
Proceeds from/(repayment of) interest-bearing borrowings (5,793) (4,889) (1,659) (1,668) (1,487)Cash dividend paid (4,921) (1,922) — — —Other (594) (357) (444) (118) (243)
Net increase/(decrease) in cash and cash equivalents 9,015 198 3,900 3,785 470Cash and cash equivalents at beginning of year 9,541 9,357 5,457 1,672 1,202Foreing exchange differences on Unki cash and cash equivalents1 (10) (14) — — —
Cash and cash equivalents at end of year 18,546 9,541 9,357 5,457 1,672
RATIO ANALYSISGross profit margin % 26.9 15.1 13.8 9.5 8.7Adjusted operating profit as a % of average operating assets 37.5 16.6 14 7.7 6.3Return on average shareholders’ equity (%) 34.3 16.0 4.8 1.8 (27.9)Return on average capital employed (%) (ROCE) 58.0 23.8 17.6 8.9 5.8Return on average attributable capital employed (%) 66.1 26.6 19 9.4 6.1Current ratio 1.6:1 1.4:1 1.5:1 1.4:1 1.9:1Gearing ratio (net debt to total capital) (%) (40.9) (7.4) 4.3 15.5 24.5Interest cover – EBITDA 57.6 15.7 9.8 6.4 6.8Debt coverage ratio 36.2 2.9 1.4 1.1 0.8Interest-bearing debt to shareholders’ equity (%) 1.5 13.2 27.3 32.1 36.8Net asset value as a % of market capitalisation 17.3 32.8 43.2 55.8 78.5Effective tax rate% 26.6 27.2 45.6 (34.3) (13.7)
SHARE PERFORMANCENumber of ordinary shares in issue (millions) 262.5a 262.4a 262.2a 262.0a 261.7a
Weighted average number of ordinary shares in issue (millions) 262.5a 262.3a 262.2a 261.9a 261.4a
Headline earnings/(loss) per ordinary share (cents) 7,087 2,893 1,482 713 (48)Dividends per share 52.6 11.25 3.49 — —
Interim 11.00 3.74 — — —Final 41.60 7.51 3.49 — —
Market capitalisation (R millions) 351,447 144,544 94,911 71,307 49,983Net asset value per ordinary share 226.3 176.5 152.7 148.3 146.4Number of ordinary shares traded (millions) 70.7 64.2 82.1 113.9 100.6Highest price traded (cents) 139,353 54,650 42,000 48,780 40,526Lowest price traded (cents) 52,786 30,500 26,512 15,646 15,905Closing price (cents) 130,733 53,793 35,346 26,441 18,534Value traded (R millions) 60,753 25,755 26,974 39,336 28,154
a Net of 854,112 (2018: 978,316) shares held in respect of the Group's share scheme, and the 6 290 365 shares issued as part of the community economic empowerment transaction.

ANNUAL RESULTS 2019 GROUP PERFORMANCE DATA
44 Anglo American Platinum Limited Annual Results 2019
GROUP PERFORMANCE DATA CONTINUEDfor the year ended 31 December 2019
SALIENT FEATURES
2019 2018 2017 2016 2015
Average market prices achievedPlatinum US$/oz 861 871 947 993 1,051Palladium US$/oz 1,518 1,029 876 610 703Rhodium US$/oz 3,808 2,204 1,094 680 958Iridium US$/oz 1,462 1,207 864 563 526Ruthenium US$/oz 238 238 72 40 46Gold US$/oz 1,396 1,260 1,253 1,244 1,156Nickel US$/tonne 14,050 12,972 10,314 9,611 11,726Copper US$/tonne 5,949 6,424 6,221 4,761 5,180Chrome US$/tonne 121 178 177 141 99
% contribution of net revenuePGMs % 92.6 89.9 88.9 89.7 90.6
Platinum % 28.7 39.2 48.1 56.7 55.4Palladium % 39.9 30.3 28.0 22.0 23.8Rhodium % 18.0 12.6 6.5 4.9 6.3Iridium % 2.2 2.0 2.1 2.3 1.9Ruthenium % 1.4 3.3 1.2 0.5 0.4Gold % 2.5 2.5 3.0 3.3 2.8
Nickel % 4.5 5.6 5.4 6.1 6.1Copper % 1.2 1.7 2.0 1.6 1.9Chrome % 1.4 2.5 3.3 2.3 1.1Other metals % 0.2 0.3 0.4 0.3 0.3
Exchange ratesAverage achieved on sales ZAR/US$ 14.50 13.33 13.33 14.63 12.71Closing exchange rate at end of period ZAR/US$ 14.03 14.38 12.31 13.73 15.47
Basket prices achieved – excluding tradingPlatinum – Dollar basket price US$/Pt oz 2,819 2,219 1,966 1,753 1,905PGM – Dollar basket price US$/PGM oz 1,347 1,030 915 837 918PGM – Dollar basket price – Mined volume US$/PGM oz 1,401 1,097 972 857 931PGM – Dollar basket price – Purchased volume US$/PGM oz 1,251 948 835 781 879Platinum – Rand basket price Rand/Pt oz 40,862 29,601 26,213 25,649 24,203PGM – Rand basket price Rand/PGM oz 19,534 13,734 12,198 12,249 11,667PGM – Rand basket price – Mined volume Rand/PGM oz 20,310 14,622 12,965 12,541 11,831PGM – Rand basket price – Purchased volume Rand/PGM oz 18,147 12,639 11,139 11,432 11,168
Total PGM ounces sold – excluding trading 4,633.7 5,224.9 5,382.2 5,058.1 5,126.7
Platinum 000 ounces 2,215.1 2,424.2 2,504.6 2,415.7 2,471.4Palladium 000 ounces 1,520.7 1,513.1 1,571.7 1,532.1 1,597.6Other PGMs+Gold 000 ounces 897.9 1,287.6 1,305.9 1,110.3 1,057.7
Total PGM ounces sold – trading 349.0 223.1 — — —
Platinum 000 ounces 46.1 94.0 — — —Palladium 000 ounces 262.2 124.5 — — —Rhodium 000 ounces 20.3 — — — —Gold 000 ounces 20.5 4.6 — — —

Anglo American Platinum Limited Annual Results 2019 45
2019 2018 2017 2016 2015
Financials – excluding tradingNet sales revenue R million 91,697 71,789 65,670 61,960 59,815
from platinum R million 27,625 28,108 31,590 35,156 33,116from palladium R million 33,486 20,934 18,421 13,644 14,222from rhodium R million 16,556 9,401 4,242 3,062 3,772from other PGMs and gold R million 5,572 5,757 4,089 3,781 3,072from base and other metals R million 7,088 5,734 5,171 4,898 4,960from chrome R million 1,370 1,855 2,157 1,419 673
Total operating costs R million (61,994) (57,293) (53,685) (52,864) (51,174)EBITDA R million 29,703 14,496 11,985 9,096 8,641EBITDA margin % 32.4 20.2 18.3 14.7 14.4EBIT R million 25,262 10,327 7,892 4,429 3,360ROCE % 57.3 23.6 17.6 8.9 5.8Attributable economic free cash flow R million 18,258 4,736 5,095 5,385 5,972Attributable net cash flow R million 17,170 3,856 4,471 4,785 4,774
Costs and unit costsCash operating costs R million 30,285 27,243 26,427 33,744 33,697Cash on-mine cost per tonne milled R/tonne 890 807 742 729 751Cash operating cost per PGM oz produced R/PGM oz 10,189 9,412 8,871 9,298 9,202Cash operating cost per PGM oz produced $/PGM oz 703 710 666 633 720Stay-in-business capital R million 4,875 4,189 3,336 2,750 2,535Capitalised waste stripping R million 2,062 1,548 784 1,297 999All-in sustaining costs net of metal revenue credits other than Pt $ million 649 1,768 2,000 2,002 2,054All-in sustaining costs per platinum ounce sold $/Pt oz 293 756 826 860 887Cash operating cost per platinum ounce produced R/Pt oz 22,294 20,584 19,203 19,545 19,266Cash operating cost per platinum ounce produced $/Pt oz 1,538 1,553 1,443 1,330 1,508
Reconciling items for AISC and free cash flowAllocated marketing and market development costs $/Pt oz sold 24 24 24 19 25Abnormal income/(expense) included in operating and net cash flow– Disposal of treasury bills R million — 218 228 — —
Head count (as at period ended)Total employees (AAP own and contractors excluding JVs) 25,268 24,789 28,692 28,250 45,520
Own enrolled 22,960 22,845 26,453 26,062 42,773Contractors 2,308 1,944 2,239 2,188 2,747
ProductivityPGM ounces produced per employee per annum 110.5 108.1 93.9 80.8 73.7

ANNUAL RESULTS 2019 GROUP PERFORMANCE DATA
46 Anglo American Platinum Limited Annual Results 2019
GROUP PERFORMANCE DATA CONTINUEDfor the year ended 31 December 2019
GROSS PROFIT ON METAL SALES AND EBITDA
2019POC
Mined and Toll Trading Total
Net sales revenue 60,989 30,708 7,854 99,551
Cost of sales (38,520) (26,610) (7,607) (72,737)
Cash operating costs (31,267) (2,345) — (33,612)
– On-mine (25,624) — — (25,624)– Smelting (2,963) (1,197) — (4,159)– Treatment and refining (2 680) (1,149) — (3,829)
Depreciation (4,059) (382) — (4,441)
– On-mine (3,053) — — (3,053)– Smelting (499) (186) — (685)– Treatment and refining (509) (196) — (705)– Other costs 2 — — 2
Purchase of metals and leasing activities 61 (22,838) (7,607) (30,384)Increase in metal inventories 1,750 (840) — 910Increase in ore stockpiles (137) — — (137)Other costs (4,868) (205) — (5,073)
Gross profit on metal sales 22,469 4,098 247 26,814Gross profit margin % 37 13 — 27
Add back depreciation 4,058 383 — 4,441Other income and expenses (322) (87) — (409)Loss on associates (108) — — (108)
Operating EBITDA 26,099 4,392 247 30,738Operating EBITDA margin % 43 14 3 31
Marketing and market development costs (524) (264) — (788)Restructuring — — — —
EBITDA 25,575 4,128 247 29,950EBITDA margin % 42 13 3 30

Anglo American Platinum Limited Annual Results 2019 47
2018
Mined POC Trading Total
Net sales revenue 42,421 29,368 2,793 74,582
Cost of sales (33,577) (26,923) (2,786) (63,286)
Cash operating costs (28,165) (2,385) — (30,550)
– On-mine (23,278) — — (23,278)– Smelting (2,417) (1,278) — (3,695)– Treatment and refining (2,470) (1,107) — (3,577)
Depreciation (3,751) (417) — (4,168)
– On-mine (2,871) — — (2,871)– Smelting (368) (198) — (566)– Treatment and refining (496) (207) — (703)– Other costs (16) (12) — (28)
Purchase of metals and leasing activities (36) (26,390) (2,786) (29,212)Increase in metal inventories 1,145 2,446 — 3,591Increase in ore stockpiles 466 — — 466Other costs (3,236) (177) — (3,413)
Gross profit on metal sales 8,844 2,445 7 11,296Gross profit margin % 21 8 — 15
Add back depreciation 3,751 417 — 4,168Other income and expenses (132) 22 — (110)Profit and loss on associates (40) — — (40)
Operating EBITDA 12,424 2,884 7 15,315Operating EBITDA margin % 29 10 — 21
Marketing and market development costs (471) (325) — (796)Restructuring (16) — — (16)
EBITDA 11,937 2,559 7 14,503EBITDA margin % 28 9 — 19

ANNUAL RESULTS 2019 GROUP PERFORMANCE DATA
48 Anglo American Platinum Limited Annual Results 2019
GROUP PERFORMANCE DATA CONTINUEDfor the year ended 31 December 2019
REFINED PRODUCTION
2019 2018 2017 2016 2015
Total operationsRefined production from mining operationsTotal PGMs 000 oz 3,037.3 2,696.1 2,975.5 3,482.9 3,766.2
Platinum 000 oz 1,410.8 1,292.4 1,419.5 1,688.4 1,836.9Palladium 000 oz 1,074.6 950.9 1,035.3 1,090.6 1,238.2Rhodium 000 oz 179.4 151.9 179.8 227.0 225.8Other PGMs 000 oz 285.3 227.7 261.9 391.1 373.8Gold 000 oz 87.2 73.2 79.0 85.8 91.5
Nickel 000 tonnes 16.4 16.7 18.9 21.0 21.9Copper 000 tonnes 11.6 11.1 12.1 11.9 14.9Chrome tonnes (100%) 000 tonnes 908.7 859.0 978.8 751.6 566.5
Refined production from purchases (including toll refined metal)Total PGMs 000 oz 2,113.8 2,088.8 2,140.7 1,304.3 1,215.2
Platinum 000 oz 1,103.3 1,110.0 1,092.4 646.3 621.9Palladium 000 oz 560.3 550.9 633.1 373.6 356.7Rhodium 000 oz 144.9 140.9 143.4 90.4 79.4Other PGMs 000 oz 278.4 254.7 235.4 171.6 135.7Gold 000 oz 26.9 32.3 36.4 22.4 21.5
Nickel 000 tonnes 6.6 6.4 7.2 4.4 3.9Copper 000 tonnes 2.6 3.2 3.7 2.2 2.2Chrome tonnes (100%) 000 tonnes — — — — —
Total refined production (including toll refined metal)Total PGMs 000 oz 5,151.0 4,784.9 5,116.2 4,787.2 4,981.4
Platinum 000 oz 2,514.2 2,402.4 2,511.9 2,334.7 2,458.8Palladium 000 oz 1,634.9 1,501.8 1,668.4 1,464.2 1,594.9Rhodium 000 oz 324.2 292.8 323.2 317.4 305.2Other PGMs 000 oz 563.6 482.4 497.3 562.7 509.5Gold 000 oz 114.1 105.5 115.4 108.2 113.0
Nickel 000 tonnes 23.0 23.1 26.1 25.4 25.8Copper 000 tonnes 14.2 14.3 15.8 14.1 17.1Chrome tonnes (100%) 000 tonnes 908.7 859.0 978.8 751.6 566.5
SPLIT OF TOTAL REFINED PRODUCTIONPlatinum 49 50 49 49 49Palladium % 32 31 33 31 32Rhodium % 6 6 6 7 6Other PGMs % 11 11 10 11 11Gold % 2 2 2 2 2
Base MetalsNickel % 61 61 61 63 59Copper % 37 38 37 35 39Other Base Metals % 2 1 2 2 2
PLATINUM PIPELINE CALCULATIONOwn mined volume 000 oz 1,060.4 1,035.3 1,130.9 1,473.7 1,507.7JV mined volume 000 oz 317.8 288.3 245.3 252.8 241.3Projects mined volume 000 oz — — — 3.4 13.0Purchase of concentrate 000 oz 672.4 1,161.1 1,021.2 651.9 575.2
M&C platinum production 000 oz 2,050.6 2,484.7 2,397.5 2,381.9 2,337.3Pipeline stock adjustment 000 oz 83.3 26.3 77.2 59.9 133.3Pipeline movement 000 oz 77.0 (108.6) 20.4 (111.7) (11.9)
Refined platinum production (excl. toll refined metal) 000 oz 2,210.9 2,402.4 2,495.0 2,330.1 2,458.7

Anglo American Platinum Limited Annual Results 2019 49
TOTAL MINED VOLUME(All statistics represent attributable contribution for mined production i.e. excluding POC and trading)
2019 2018 2017 2016 2015
ProductionTotal development km 52.5 51.2 67.7 97.5 106.4Immediately available ore reserves months 43.0 39.8 34.3 30.7 29.5Square metres 000 m² 2,108 1,992 2,222 3,299 3,613
Tonnes milled 000 tonnes 28,932 28,260 29,698 40,574 39,849
Surface tonnes 000 tonnes 15,070 15,305 15,548 20,385 17,738Underground tonnes 000 tonnes 13,862 12,955 14,150 20,189 22,111
UG2 tonnes milled to total Merensky and UG2 % 97.1 96.5 92.7 87.2 84.2
Built-up head grade 4E g/tonne 3.62 3.48 3.46 3.16 3.23
Surface tonnes 4E g/tonne 3.36 3.09 2.92 2.42 2.50Merensky Underground tonnes 4E g/tonne 5.01 5.56 4.81 4.59 4.83UG2 Underground tonnes 4E g/tonne 3.96 3.97 4.05 3.87 3.69
Total production (M&C)PGMs 000 ounces 3,011.2 2,894.6 2,979.1 3,638.1 3,696.3
Platinum 000 ounces 1,378.2 1,323.6 1,376.2 1,729.9 1,762.0Palladium 000 ounces 1,049.2 1,013.5 1,008.7 1,150.4 1,157.3Rhodium 000 ounces 186.0 177.9 190.0 240.6 245.8Iridium 000 ounces 63.0 59.6 64.6 84.5 85.2Ruthenium 000 ounces 252.1 241.5 262.6 346.4 358.8Gold 000 ounces 82.7 78.5 77.0 86.2 87.2
Nickel 000 tonnes 20.7 20.5 20.6 24.0 24.6Copper 000 tonnes 13.5 13.3 13.5 15.6 16.1Chrome 000 tonnes 908.7 859.0 978.8 751.6 566.5
Total PGM ounces refined 3,037.3 2,696.1 2,975.5 3,482.9 3,766.2
Platinum 000 ounces 1,410.8 1,292.4 1,419.5 1,688.4 1,836.9Palladium 000 ounces 1,074.6 950.9 1,035.3 1,090.6 1,238.2Other PGMs+Gold 000 ounces 551.9 452.8 520.7 703.9 691.1
Total PGM ounces sold – excluding trading 3,002.8 2,901.2 3,130.6 3,729.3 3,860.3
Platinum 000 ounces 1,401.6 1,304.6 1,422.3 1,759.4 1,838.3Palladium 000 ounces 1,092.3 959.7 998.3 1,163.6 1,236.0Other PGMs+Gold 000 ounces 508.9 636.9 710.0 806.3 786.0
Employees and efficienciesOwn employees average 23,639 23,568 27,757 40,890 45,787Contractor employees average 3,607 3,204 3,976 4,148 4,394PGM ounces produced per employee per annum 110.5 108.1 93.9 80.8 73.7
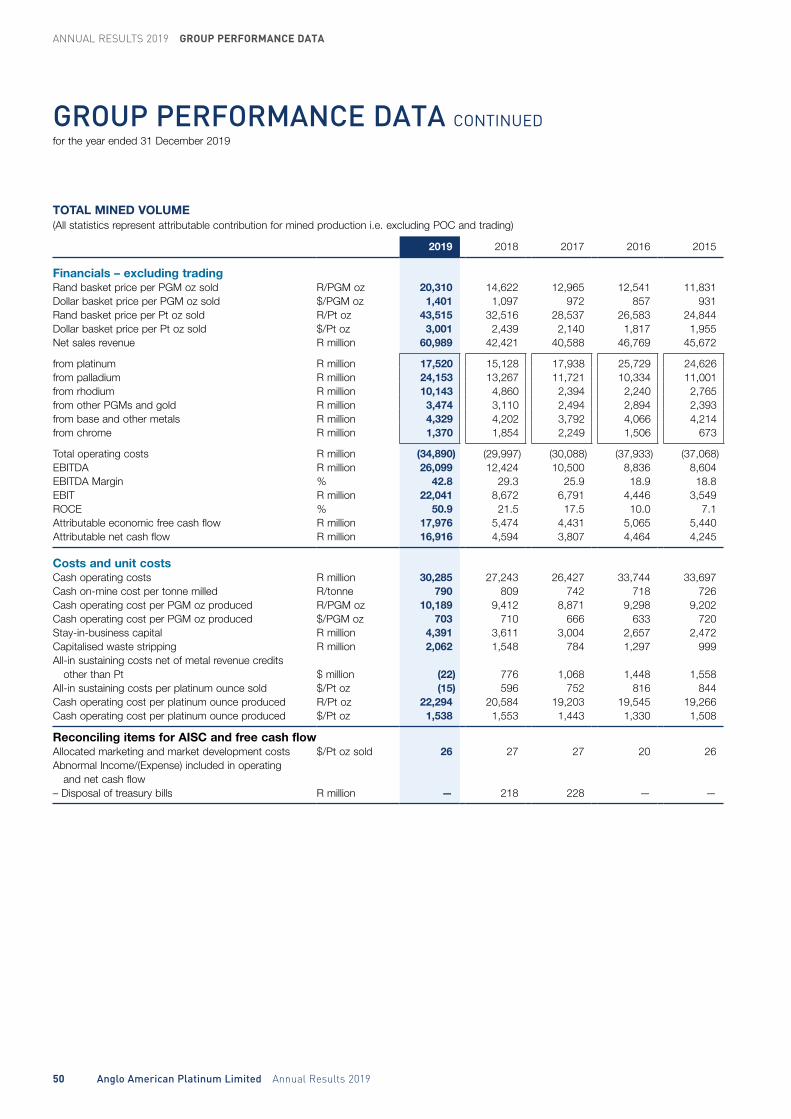
ANNUAL RESULTS 2019 GROUP PERFORMANCE DATA
50 Anglo American Platinum Limited Annual Results 2019
GROUP PERFORMANCE DATA CONTINUEDfor the year ended 31 December 2019
TOTAL MINED VOLUME(All statistics represent attributable contribution for mined production i.e. excluding POC and trading)
2019 2018 2017 2016 2015
Financials – excluding tradingRand basket price per PGM oz sold R/PGM oz 20,310 14,622 12,965 12,541 11,831Dollar basket price per PGM oz sold $/PGM oz 1,401 1,097 972 857 931Rand basket price per Pt oz sold R/Pt oz 43,515 32,516 28,537 26,583 24,844Dollar basket price per Pt oz sold $/Pt oz 3,001 2,439 2,140 1,817 1,955Net sales revenue R million 60,989 42,421 40,588 46,769 45,672
from platinum R million 17,520 15,128 17,938 25,729 24,626from palladium R million 24,153 13,267 11,721 10,334 11,001from rhodium R million 10,143 4,860 2,394 2,240 2,765from other PGMs and gold R million 3,474 3,110 2,494 2,894 2,393from base and other metals R million 4,329 4,202 3,792 4,066 4,214from chrome R million 1,370 1,854 2,249 1,506 673
Total operating costs R million (34,890) (29,997) (30,088) (37,933) (37,068)EBITDA R million 26,099 12,424 10,500 8,836 8,604EBITDA Margin % 42.8 29.3 25.9 18.9 18.8EBIT R million 22,041 8,672 6,791 4,446 3,549ROCE % 50.9 21.5 17.5 10.0 7.1Attributable economic free cash flow R million 17,976 5,474 4,431 5,065 5,440Attributable net cash flow R million 16,916 4,594 3,807 4,464 4,245
Costs and unit costsCash operating costs R million 30,285 27,243 26,427 33,744 33,697Cash on-mine cost per tonne milled R/tonne 790 809 742 718 726Cash operating cost per PGM oz produced R/PGM oz 10,189 9,412 8,871 9,298 9,202Cash operating cost per PGM oz produced $/PGM oz 703 710 666 633 720Stay-in-business capital R million 4,391 3,611 3,004 2,657 2,472Capitalised waste stripping R million 2,062 1,548 784 1,297 999All-in sustaining costs net of metal revenue credits other than Pt $ million (22) 776 1,068 1,448 1,558All-in sustaining costs per platinum ounce sold $/Pt oz (15) 596 752 816 844Cash operating cost per platinum ounce produced R/Pt oz 22,294 20,584 19,203 19,545 19,266Cash operating cost per platinum ounce produced $/Pt oz 1,538 1,553 1,443 1,330 1,508
Reconciling items for AISC and free cash flowAllocated marketing and market development costs $/Pt oz sold 26 27 27 20 26Abnormal Income/(Expense) included in operating and net cash flow– Disposal of treasury bills R million — 218 228 — —

Anglo American Platinum Limited Annual Results 2019 51
TOTAL PURCHASED VOLUME(All statistics represent attributable contribution for purchased production)
2019 2018 2017 2016 2015
Total production (M&C)PGMs 000 ounces 1,429.6 2,291.9 2,028.6 1,335.6 1,159.2
Platinum 000 ounces 672.4 1,161.1 1,021.2 651.9 575.2Palladium 000 ounces 336.7 597.3 548.6 388.2 322.3Rhodium 000 ounces 98.0 168.6 142.4 93.0 80.0Iridium 000 ounces 56.4 60.4 50.7 32.8 28.9Ruthenium 000 ounces 249.0 269.9 229.9 147.3 132.5Gold 000 ounces 17.0 34.6 35.7 22.4 20.3
Nickel 000 tonnes 8.9 8.1 8.3 4.8 4.6Copper 000 tonnes 3.5 3.8 4.1 2.8 2.4Chrome 000 tonnes — — — — —
Total PGM ounces refined 1,612.7 2,080.5 2,061.9 1,285.1 1,215.1
Platinum 000 ounces 800.1 1,109.9 1,075.5 641.7 621.8Palladium 000 ounces 405.9 550.9 587.7 360.1 356.7Other PGMs+Gold 000 ounces 406.7 419.7 398.7 283.3 236.6
Total PGM ounces sold – excluding trading 1,630.8 2,323.7 2,251.7 1,328.8 1,266.5
Platinum 000 ounces 813.5 1,119.6 1,082.3 656.3 633.1Palladium 000 ounces 428.5 553.4 573.4 368.6 361.6Other PGMs+Gold 000 ounces 388.8 650.7 596.0 303.9 271.8
Financials – excluding tradingRand basket price per PGM oz sold R/PGM oz 18,147 12,639 11,139 11,432 11,168Dollar basket price per PGM oz sold $/PGM oz 1,251 948 835 781 879Rand basket price per Pt oz sold R/Pt oz 37,746 26,232 23,174 23,147 22,341Dollar basket price per Pt oz sold $/Pt oz 2,603 1,967 1,738 1,582 1,758Net sales revenue R million 30,708 29,368 25,082 15,191 14,144
from platinum R million 10,106 12,981 13,653 9,427 8,490from palladium R million 9,332 7,668 6,699 3,310 3,222from rhodium R million 6,413 4,541 1,848 822 1,007from other PGMs and gold R million 2,098 2,647 1,595 887 679from base and other metals R million 2,760 1,531 1,287 745 746
Total operating costs R million (26,316) (26,484) (22,773) (13,786) (12,311)EBITDA R million 4,392 2,884 2,309 1,405 1,833EBITDA margin % 14.3 9.8 9.2 9.2 13.0EBIT R million 4,009 2,467 1,926 1,127 1,606ROCE % 501.1 70.9 30.6 17.0 18.7Attributable economic free cash flow R million 1,070 75 1,530 1,482 2,377Attributable net cash flow R million 1,041 75 1,530 1,482 2,375
Costs and unit costsCash operating costs R million 25,222 28,747 22,798 13,494 11,214Cash operating cost per PGM oz produced R/PGM oz 17,203 12,543 11,239 10,103 9,673Cash operating cost per PGM oz produced $/PGM oz 1,186 947 844 687 757Stay-in business capital R million 483 579 332 93 63All-in sustaining costs net of metal revenue credits other than Pt $ million 656 992 932 555 496All-in sustaining costs per platinum ounce sold $/Pt oz 806 888 863 856 779Cash operating cost per platinum ounce produced R/Pt oz 36,574 24,760 22,324 20,699 19,494Cash operating cost per platinum ounce produced $/Pt oz 2,522 1,869 1,677 1,408 1,525
Reconciling items for AISC and free cash flowAllocated marketing and market development costs $/Pt oz sold 22 22 22 17 23
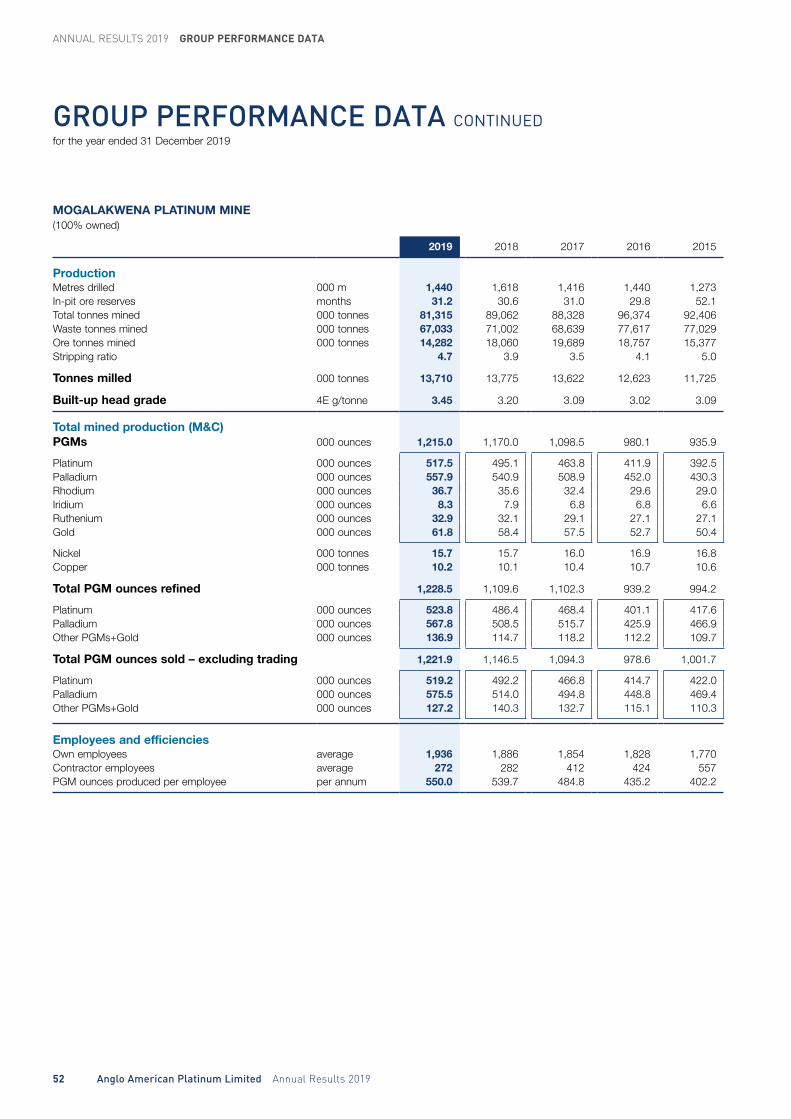
ANNUAL RESULTS 2019 GROUP PERFORMANCE DATA
52 Anglo American Platinum Limited Annual Results 2019
GROUP PERFORMANCE DATA CONTINUEDfor the year ended 31 December 2019
MOGALAKWENA PLATINUM MINE(100% owned)
2019 2018 2017 2016 2015
ProductionMetres drilled 000 m 1,440 1,618 1,416 1,440 1,273In-pit ore reserves months 31.2 30.6 31.0 29.8 52.1Total tonnes mined 000 tonnes 81,315 89,062 88,328 96,374 92,406Waste tonnes mined 000 tonnes 67,033 71,002 68,639 77,617 77,029Ore tonnes mined 000 tonnes 14,282 18,060 19,689 18,757 15,377 Stripping ratio 4.7 3.9 3.5 4.1 5.0
Tonnes milled 000 tonnes 13,710 13,775 13,622 12,623 11,725
Built-up head grade 4E g/tonne 3.45 3.20 3.09 3.02 3.09
Total mined production (M&C)PGMs 000 ounces 1,215.0 1,170.0 1,098.5 980.1 935.9
Platinum 000 ounces 517.5 495.1 463.8 411.9 392.5Palladium 000 ounces 557.9 540.9 508.9 452.0 430.3Rhodium 000 ounces 36.7 35.6 32.4 29.6 29.0Iridium 000 ounces 8.3 7.9 6.8 6.8 6.6Ruthenium 000 ounces 32.9 32.1 29.1 27.1 27.1Gold 000 ounces 61.8 58.4 57.5 52.7 50.4
Nickel 000 tonnes 15.7 15.7 16.0 16.9 16.8Copper 000 tonnes 10.2 10.1 10.4 10.7 10.6
Total PGM ounces refined 1,228.5 1,109.6 1,102.3 939.2 994.2
Platinum 000 ounces 523.8 486.4 468.4 401.1 417.6Palladium 000 ounces 567.8 508.5 515.7 425.9 466.9Other PGMs+Gold 000 ounces 136.9 114.7 118.2 112.2 109.7
Total PGM ounces sold – excluding trading 1,221.9 1,146.5 1,094.3 978.6 1,001.7
Platinum 000 ounces 519.2 492.2 466.8 414.7 422.0Palladium 000 ounces 575.5 514.0 494.8 448.8 469.4Other PGMs+Gold 000 ounces 127.2 140.3 132.7 115.1 110.3
Employees and efficienciesOwn employees average 1,936 1,886 1,854 1,828 1,770Contractor employees average 272 282 412 424 557PGM ounces produced per employee per annum 550.0 539.7 484.8 435.2 402.2

Anglo American Platinum Limited Annual Results 2019 53
2019 2018 2017 2016 2015
Financials – excluding tradingRand Basket Price per PGM oz sold R/PGM oz 21,152 15,792 14,730 14,538 13,840Dollar Basket Price per PGM oz sold $/PGM oz 1,459 1,184 1,105 994 1,089Rand Basket Price per Pt oz sold R/Pt oz 49,780 36,788 34,528 34,309 32,850Dollar Basket Price per Pt oz sold $/Pt oz 3,433 2,759 2,590 2,345 2,585Net sales revenue R million 25,845 18,106 16,118 14,227 13,864
from platinum R million 6,486 5,704 5,886 6,040 5,663from palladium R million 12,712 7,075 5,817 3,994 4,185from rhodium R million 1,966 970 398 271 353from other PGMs and gold R million 1,469 1,162 1,125 1,100 866from base and other metals R million 3,213 3,195 2,892 2,822 2,797
Total operating costs R million (11,470) (9,857) (8,418) (8,446) (7,634)EBITDA R million 14,375 8,249 7,700 5,781 6,230EBITDA Margin % 55.6 45.6 47.8 40.6 44.9EBIT R million 12,466 6,325 5,969 3,959 4,615ROCE % 55.3 30.8 31.8 22.4 26.9Attributable economic free cash flow R million 9,935 4,039 3,977 3,158 4,378Attributable net cash flow R million 9,715 3,916 3,756 3,122 4,325
Costs and unit costsCash operating costs R million 9,940 9,171 7,280 7,611 6,869Cash on-mine cost per tonne milled R/tonne 496 456 351 428 409Cash operating cost per PGM oz produced R/PGM oz 8,181 7,838 6,628 7,766 7,340Cash operating cost per PGM oz produced $/PGM oz 564 592 498 528 574Stay-in-business capital R million 2,162 1,765 1,409 1,174 1,058Capitalised waste stripping R million 2,062 1,548 784 1,297 999All-in sustaining costs net of metal revenue credits other than Pt $ million (223) 140 158 208 116All-in sustaining costs per platinum ounce sold $/Pt oz (429) 286 340 498 269Cash operating cost per platinum ounce produced R/Pt oz 19,208 18,522 15,696 18,477 17,502Cash operating cost per platinum ounce produced $/Pt oz 1,325 1,398 1,179 1,257 1,369
Reconciling items for AISC and free cash flowAllocated marketing and market development costs $/Pt oz sold 29 31 32 26 35

ANNUAL RESULTS 2019 GROUP PERFORMANCE DATA
54 Anglo American Platinum Limited Annual Results 2019
GROUP PERFORMANCE DATA CONTINUEDfor the year ended 31 December 2019
AMANDELBULT PLATINUM MINE(100% owned)
2019 2018 2017 2016 2015
ProductionTotal development km 36.8 35.4 36.9 36.1 36.2Immediately available ore reserves months 31.0 25.0 27.2 24.2 24.6Square metres 000 m² 804 785 781 805 845
Tonnes milled 000 tonnes 7,057 6,961 7,049 7,058 6,501
Surface tonnes 000 tonnes 1,289 1,494 1,490 1,369 584Underground tonnes 000 tonnes 5,768 5,467 5,559 5,689 5,917
UG2 tonnes milled to total Merensky and UG2 % 94.4 93.2 84.5 84.3 81.9
Built-up head grade 4E g/tonne 4.05 3.98 3.86 4.07 4.12
Surface tonnes 4E g/tonne 2.48 2.15 1.73 2.47 2.01Merensky underground tonnes 4E g/tonne 5.06 5.56 4.81 4.77 4.63UG2 underground tonnes 4E g/tonne 4.39 4.38 4.24 4.41 4.26
Total mined production (M&C)PGMs 000 ounces 893.3 868.8 858.0 884.6 837.8
Platinum 000 ounces 453.6 442.7 438.0 458.6 429.5Palladium 000 ounces 208.9 205.1 202.5 207.3 198.9Rhodium 000 ounces 81.2 77.3 74.9 74.7 71.1Iridium 000 ounces 29.2 27.5 27.3 27.1 25.4Ruthenium 000 ounces 115.7 111.0 109.8 110.3 106.0Gold 000 ounces 4.8 5.2 5.5 6.6 6.9
Nickel 000 tonnes 1.2 1.3 1.4 1.6 1.7Copper 000 tonnes 0.5 0.6 0.6 0.8 0.9Chrome (100%) 000 tonnes 908.7 831.9 654.4 234.7 —
Total PGM ounces refined 886.8 811.5 852.4 849.2 817.2
Platinum 000 ounces 461.2 439.0 456.3 449.1 432.1Palladium 000 ounces 211.8 197.3 210.1 197.1 205.0Other PGMs+Gold 000 ounces 213.8 175.2 186.0 203.0 180.1
Total PGM ounces sold – excluding trading 866.4 915.6 919.5 890.5 814.9
Platinum 000 ounces 457.9 445.3 458.5 466.3 425.7Palladium 000 ounces 215.3 200.8 203.6 209.3 200.9Other PGMs+Gold 000 ounces 193.2 269.5 257.4 214.9 188.3
Employees and efficienciesOwn employees average 14,232 14,490 14,108 13,879 14,173Contractor employees average 1,431 1,300 1,714 1,147 765PGM ounces produced per employee per annum 57.0 55.0 54.2 58.9 56.1
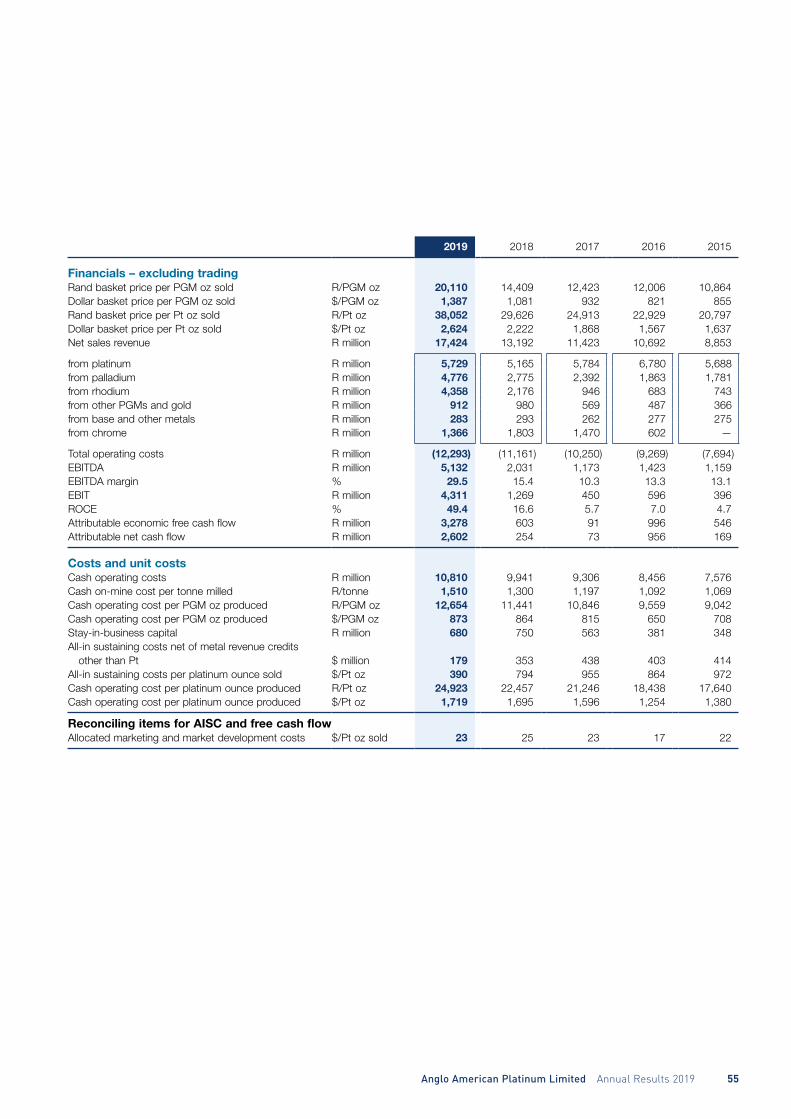
Anglo American Platinum Limited Annual Results 2019 55
2019 2018 2017 2016 2015
Financials – excluding tradingRand basket price per PGM oz sold R/PGM oz 20,110 14,409 12,423 12,006 10,864Dollar basket price per PGM oz sold $/PGM oz 1,387 1,081 932 821 855Rand basket price per Pt oz sold R/Pt oz 38,052 29,626 24,913 22,929 20,797Dollar basket price per Pt oz sold $/Pt oz 2,624 2,222 1,868 1,567 1,637Net sales revenue R million 17,424 13,192 11,423 10,692 8,853
from platinum R million 5,729 5,165 5,784 6,780 5,688from palladium R million 4,776 2,775 2,392 1,863 1,781from rhodium R million 4,358 2,176 946 683 743from other PGMs and gold R million 912 980 569 487 366from base and other metals R million 283 293 262 277 275from chrome R million 1,366 1,803 1,470 602 —
Total operating costs R million (12,293) (11,161) (10,250) (9,269) (7,694)EBITDA R million 5,132 2,031 1,173 1,423 1,159EBITDA margin % 29.5 15.4 10.3 13.3 13.1EBIT R million 4,311 1,269 450 596 396ROCE % 49.4 16.6 5.7 7.0 4.7Attributable economic free cash flow R million 3,278 603 91 996 546Attributable net cash flow R million 2,602 254 73 956 169
Costs and unit costsCash operating costs R million 10,810 9,941 9,306 8,456 7,576Cash on-mine cost per tonne milled R/tonne 1,510 1,300 1,197 1,092 1,069Cash operating cost per PGM oz produced R/PGM oz 12,654 11,441 10,846 9,559 9,042Cash operating cost per PGM oz produced $/PGM oz 873 864 815 650 708Stay-in-business capital R million 680 750 563 381 348All-in sustaining costs net of metal revenue credits other than Pt $ million 179 353 438 403 414All-in sustaining costs per platinum ounce sold $/Pt oz 390 794 955 864 972Cash operating cost per platinum ounce produced R/Pt oz 24,923 22,457 21,246 18,438 17,640Cash operating cost per platinum ounce produced $/Pt oz 1,719 1,695 1,596 1,254 1,380
Reconciling items for AISC and free cash flowAllocated marketing and market development costs $/Pt oz sold 23 25 23 17 22
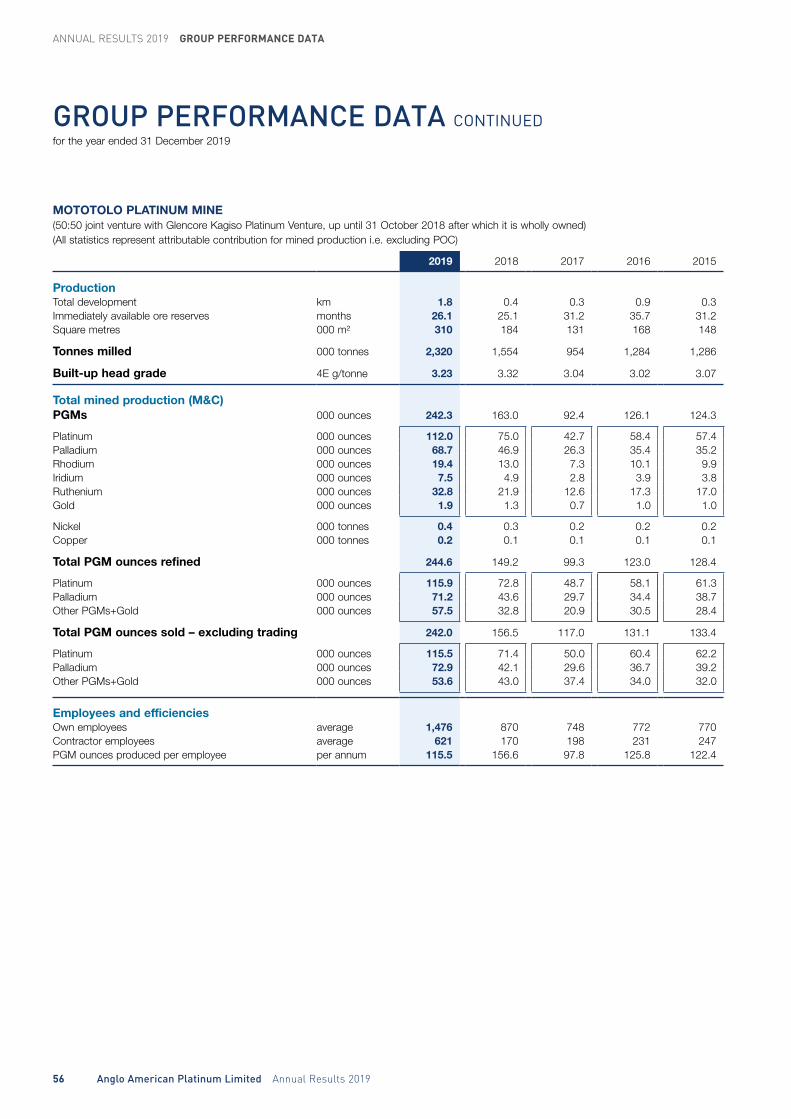
ANNUAL RESULTS 2019 GROUP PERFORMANCE DATA
56 Anglo American Platinum Limited Annual Results 2019
GROUP PERFORMANCE DATA CONTINUEDfor the year ended 31 December 2019
MOTOTOLO PLATINUM MINE(50:50 joint venture with Glencore Kagiso Platinum Venture, up until 31 October 2018 after which it is wholly owned)(All statistics represent attributable contribution for mined production i.e. excluding POC)
2019 2018 2017 2016 2015
ProductionTotal development km 1.8 0.4 0.3 0.9 0.3Immediately available ore reserves months 26.1 25.1 31.2 35.7 31.2Square metres 000 m² 310 184 131 168 148
Tonnes milled 000 tonnes 2,320 1,554 954 1,284 1,286
Built-up head grade 4E g/tonne 3.23 3.32 3.04 3.02 3.07
Total mined production (M&C)PGMs 000 ounces 242.3 163.0 92.4 126.1 124.3
Platinum 000 ounces 112.0 75.0 42.7 58.4 57.4Palladium 000 ounces 68.7 46.9 26.3 35.4 35.2Rhodium 000 ounces 19.4 13.0 7.3 10.1 9.9Iridium 000 ounces 7.5 4.9 2.8 3.9 3.8Ruthenium 000 ounces 32.8 21.9 12.6 17.3 17.0Gold 000 ounces 1.9 1.3 0.7 1.0 1.0
Nickel 000 tonnes 0.4 0.3 0.2 0.2 0.2Copper 000 tonnes 0.2 0.1 0.1 0.1 0.1
Total PGM ounces refined 244.6 149.2 99.3 123.0 128.4
Platinum 000 ounces 115.9 72.8 48.7 58.1 61.3Palladium 000 ounces 71.2 43.6 29.7 34.4 38.7Other PGMs+Gold 000 ounces 57.5 32.8 20.9 30.5 28.4
Total PGM ounces sold – excluding trading 242.0 156.5 117.0 131.1 133.4
Platinum 000 ounces 115.5 71.4 50.0 60.4 62.2Palladium 000 ounces 72.9 42.1 29.6 36.7 39.2Other PGMs+Gold 000 ounces 53.6 43.0 37.4 34.0 32.0
Employees and efficienciesOwn employees average 1,476 870 748 772 770Contractor employees average 621 170 198 231 247PGM ounces produced per employee per annum 115.5 156.6 97.8 125.8 122.4
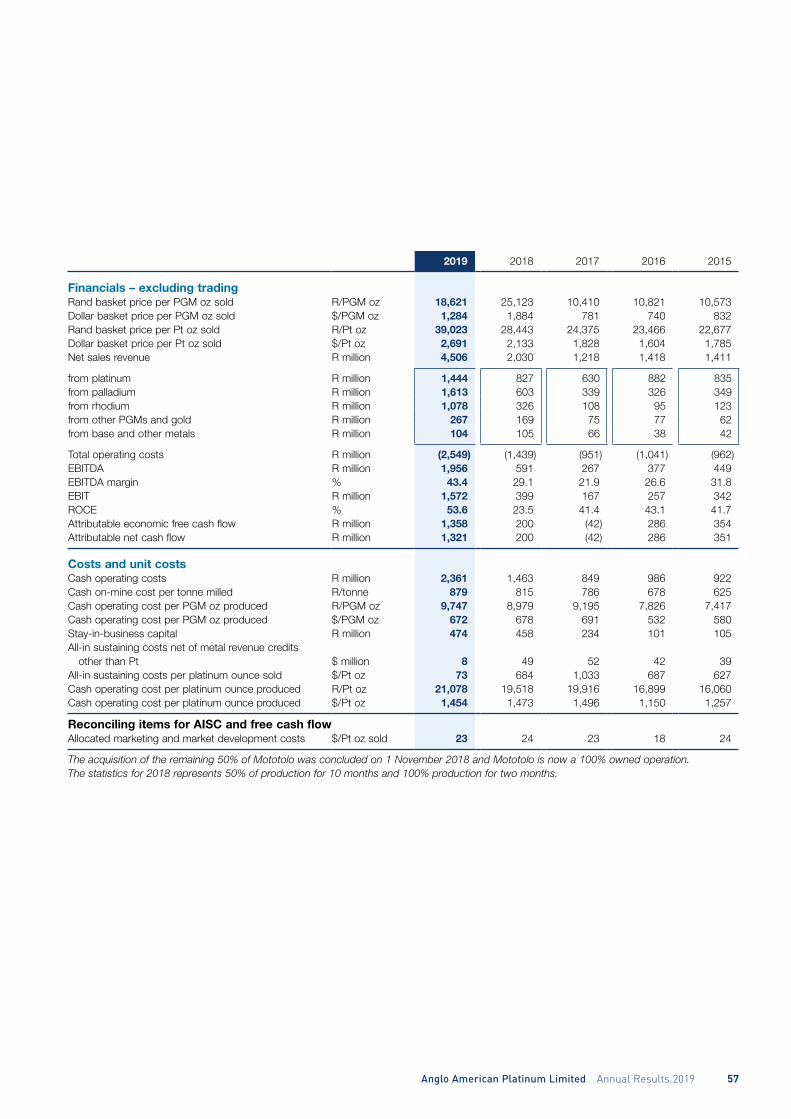
Anglo American Platinum Limited Annual Results 2019 57
2019 2018 2017 2016 2015
Financials – excluding tradingRand basket price per PGM oz sold R/PGM oz 18,621 25,123 10,410 10,821 10,573Dollar basket price per PGM oz sold $/PGM oz 1,284 1,884 781 740 832Rand basket price per Pt oz sold R/Pt oz 39,023 28,443 24,375 23,466 22,677Dollar basket price per Pt oz sold $/Pt oz 2,691 2,133 1,828 1,604 1,785Net sales revenue R million 4,506 2,030 1,218 1,418 1,411
from platinum R million 1,444 827 630 882 835from palladium R million 1,613 603 339 326 349from rhodium R million 1,078 326 108 95 123from other PGMs and gold R million 267 169 75 77 62from base and other metals R million 104 105 66 38 42
Total operating costs R million (2,549) (1,439) (951) (1,041) (962)EBITDA R million 1,956 591 267 377 449EBITDA margin % 43.4 29.1 21.9 26.6 31.8EBIT R million 1,572 399 167 257 342ROCE % 53.6 23.5 41.4 43.1 41.7Attributable economic free cash flow R million 1,358 200 (42) 286 354Attributable net cash flow R million 1,321 200 (42) 286 351
Costs and unit costsCash operating costs R million 2,361 1,463 849 986 922Cash on-mine cost per tonne milled R/tonne 879 815 786 678 625Cash operating cost per PGM oz produced R/PGM oz 9,747 8,979 9,195 7,826 7,417Cash operating cost per PGM oz produced $/PGM oz 672 678 691 532 580Stay-in-business capital R million 474 458 234 101 105All-in sustaining costs net of metal revenue credits other than Pt $ million 8 49 52 42 39All-in sustaining costs per platinum ounce sold $/Pt oz 73 684 1,033 687 627Cash operating cost per platinum ounce produced R/Pt oz 21,078 19,518 19,916 16,899 16,060Cash operating cost per platinum ounce produced $/Pt oz 1,454 1,473 1,496 1,150 1,257
Reconciling items for AISC and free cash flowAllocated marketing and market development costs $/Pt oz sold 23 24 23 18 24
The acquisition of the remaining 50% of Mototolo was concluded on 1 November 2018 and Mototolo is now a 100% owned operation.The statistics for 2018 represents 50% of production for 10 months and 100% production for two months.
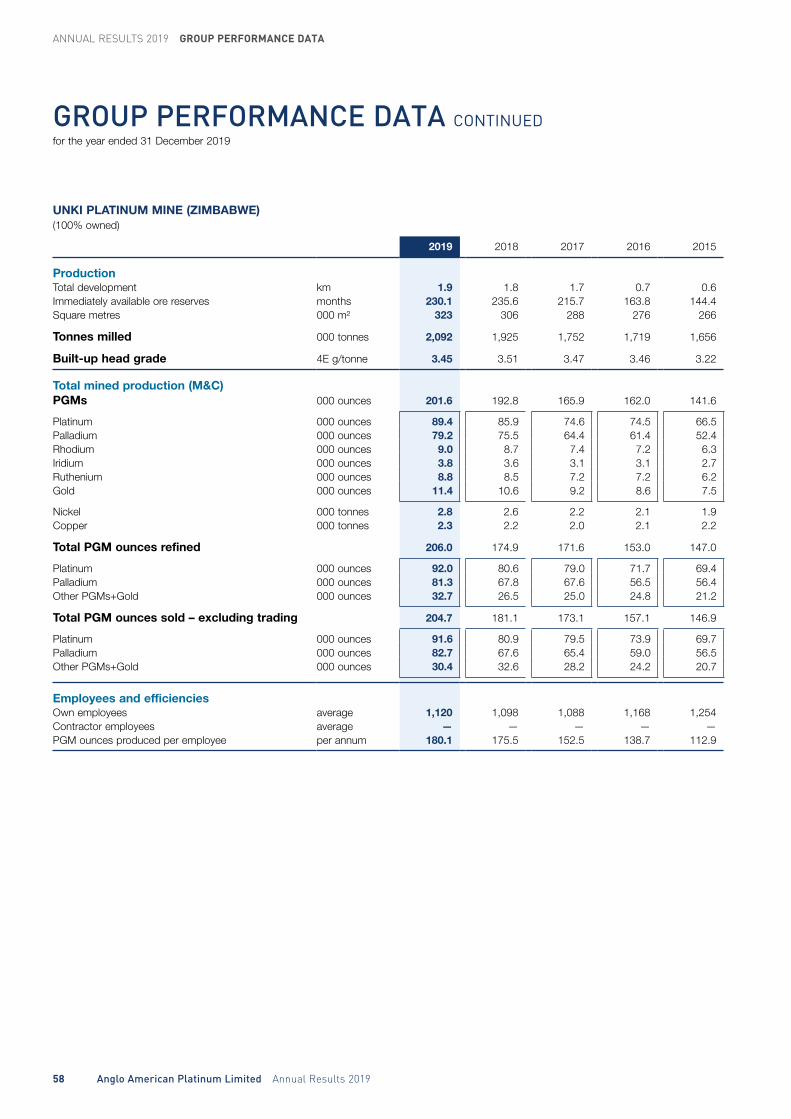
ANNUAL RESULTS 2019 GROUP PERFORMANCE DATA
58 Anglo American Platinum Limited Annual Results 2019
GROUP PERFORMANCE DATA CONTINUEDfor the year ended 31 December 2019
UNKI PLATINUM MINE (ZIMBABWE)(100% owned)
2019 2018 2017 2016 2015
ProductionTotal development km 1.9 1.8 1.7 0.7 0.6Immediately available ore reserves months 230.1 235.6 215.7 163.8 144.4Square metres 000 m² 323 306 288 276 266
Tonnes milled 000 tonnes 2,092 1,925 1,752 1,719 1,656
Built-up head grade 4E g/tonne 3.45 3.51 3.47 3.46 3.22
Total mined production (M&C)PGMs 000 ounces 201.6 192.8 165.9 162.0 141.6
Platinum 000 ounces 89.4 85.9 74.6 74.5 66.5Palladium 000 ounces 79.2 75.5 64.4 61.4 52.4Rhodium 000 ounces 9.0 8.7 7.4 7.2 6.3Iridium 000 ounces 3.8 3.6 3.1 3.1 2.7Ruthenium 000 ounces 8.8 8.5 7.2 7.2 6.2Gold 000 ounces 11.4 10.6 9.2 8.6 7.5
Nickel 000 tonnes 2.8 2.6 2.2 2.1 1.9Copper 000 tonnes 2.3 2.2 2.0 2.1 2.2
Total PGM ounces refined 206.0 174.9 171.6 153.0 147.0
Platinum 000 ounces 92.0 80.6 79.0 71.7 69.4Palladium 000 ounces 81.3 67.8 67.6 56.5 56.4Other PGMs+Gold 000 ounces 32.7 26.5 25.0 24.8 21.2
Total PGM ounces sold – excluding trading 204.7 181.1 173.1 157.1 146.9
Platinum 000 ounces 91.6 80.9 79.5 73.9 69.7Palladium 000 ounces 82.7 67.6 65.4 59.0 56.5Other PGMs+Gold 000 ounces 30.4 32.6 28.2 24.2 20.7
Employees and efficienciesOwn employees average 1,120 1,098 1,088 1,168 1,254Contractor employees average — — — — —PGM ounces produced per employee per annum 180.1 175.5 152.5 138.7 112.9
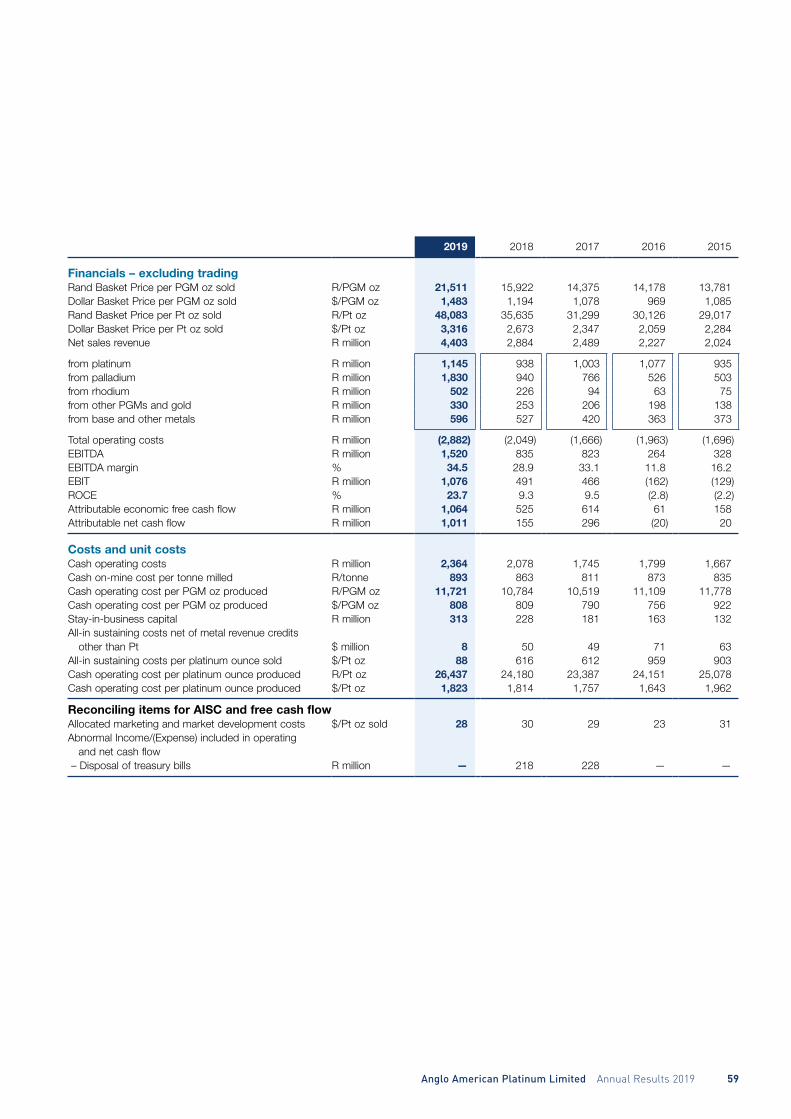
Anglo American Platinum Limited Annual Results 2019 59
2019 2018 2017 2016 2015
Financials – excluding tradingRand Basket Price per PGM oz sold R/PGM oz 21,511 15,922 14,375 14,178 13,781Dollar Basket Price per PGM oz sold $/PGM oz 1,483 1,194 1,078 969 1,085Rand Basket Price per Pt oz sold R/Pt oz 48,083 35,635 31,299 30,126 29,017Dollar Basket Price per Pt oz sold $/Pt oz 3,316 2,673 2,347 2,059 2,284Net sales revenue R million 4,403 2,884 2,489 2,227 2,024
from platinum R million 1,145 938 1,003 1,077 935from palladium R million 1,830 940 766 526 503from rhodium R million 502 226 94 63 75from other PGMs and gold R million 330 253 206 198 138from base and other metals R million 596 527 420 363 373
Total operating costs R million (2,882) (2,049) (1,666) (1,963) (1,696)EBITDA R million 1,520 835 823 264 328EBITDA margin % 34.5 28.9 33.1 11.8 16.2EBIT R million 1,076 491 466 (162) (129)ROCE % 23.7 9.3 9.5 (2.8) (2.2)Attributable economic free cash flow R million 1,064 525 614 61 158Attributable net cash flow R million 1,011 155 296 (20) 20
Costs and unit costsCash operating costs R million 2,364 2,078 1,745 1,799 1,667Cash on-mine cost per tonne milled R/tonne 893 863 811 873 835Cash operating cost per PGM oz produced R/PGM oz 11,721 10,784 10,519 11,109 11,778Cash operating cost per PGM oz produced $/PGM oz 808 809 790 756 922Stay-in-business capital R million 313 228 181 163 132All-in sustaining costs net of metal revenue credits other than Pt $ million 8 50 49 71 63All-in sustaining costs per platinum ounce sold $/Pt oz 88 616 612 959 903Cash operating cost per platinum ounce produced R/Pt oz 26,437 24,180 23,387 24,151 25,078Cash operating cost per platinum ounce produced $/Pt oz 1,823 1,814 1,757 1,643 1,962
Reconciling items for AISC and free cash flowAllocated marketing and market development costs $/Pt oz sold 28 30 29 23 31Abnormal Income/(Expense) included in operating and net cash flow – Disposal of treasury bills R million — 218 228 — —

ANNUAL RESULTS 2019 GROUP PERFORMANCE DATA
60 Anglo American Platinum Limited Annual Results 2019
GROUP PERFORMANCE DATA CONTINUEDfor the year ended 31 December 2019
MODIKWA PLATINUM MINE(50:50 joint venture with ARM Mining Consortium Limited)(All statistics represent attributable contribution for mined production i.e. excluding POC)
2019 2018 2017 2016 2015
ProductionTotal development km 5.9 5.9 6.0 6.2 8.1Immediately available ore reserves months 13.5 17.4 24.8 27.6 20.6Square metres 000 m² 174 200 216 206 181
Tonnes milled 000 tonnes 1,118 1,214 1,116 1,019 956
Built-up head grade 4E g/tonne 4.04 4.19 4.46 4.53 4.42
Total mined production (M&C)PGMs 000 ounces 145.5 164.7 162.7 148.0 135.5
Platinum 000 ounces 57.1 65.0 63.3 57.4 52.4Palladium 000 ounces 54.5 61.3 61.3 56.1 51.5Rhodium 000 ounces 11.6 13.1 13.0 11.9 10.9Iridium 000 ounces 4.0 4.5 4.5 4.1 3.7Ruthenium 000 ounces 16.9 19.2 19.0 17.0 15.6Gold 000 ounces 1.4 1.6 1.6 1.5 1.4
Nickel 000 tonnes 0.3 0.3 0.3 0.3 0.3Copper 000 tonnes 0.2 0.2 0.2 0.2 0.2
Total PGM ounces refined 151.9 150.8 157.1 142.4 136.9
Platinum 000 ounces 61.3 63.0 63.3 56.7 54.2Palladium 000 ounces 58.6 57.2 61.8 53.6 54.9Other PGMs+Gold 000 ounces 32.0 30.6 32.0 32.1 27.8
Total PGM ounces sold – excluding trading 152.9 166.3 166.0 151.9 143.6
Platinum 000 ounces 61.4 63.7 63.1 58.6 54.5Palladium 000 ounces 60.3 57.7 59.5 56.8 55.0Other PGMs+Gold 000 ounces 31.2 44.9 43.4 36.5 34.1
Employees and efficienciesOwn employees average 2,054 2,009 2,000 1,879 2,010Contractor employees average 187 306 410 466 513PGM ounces produced per employee per annum 65.0 71.2 67.6 63.1 53.7
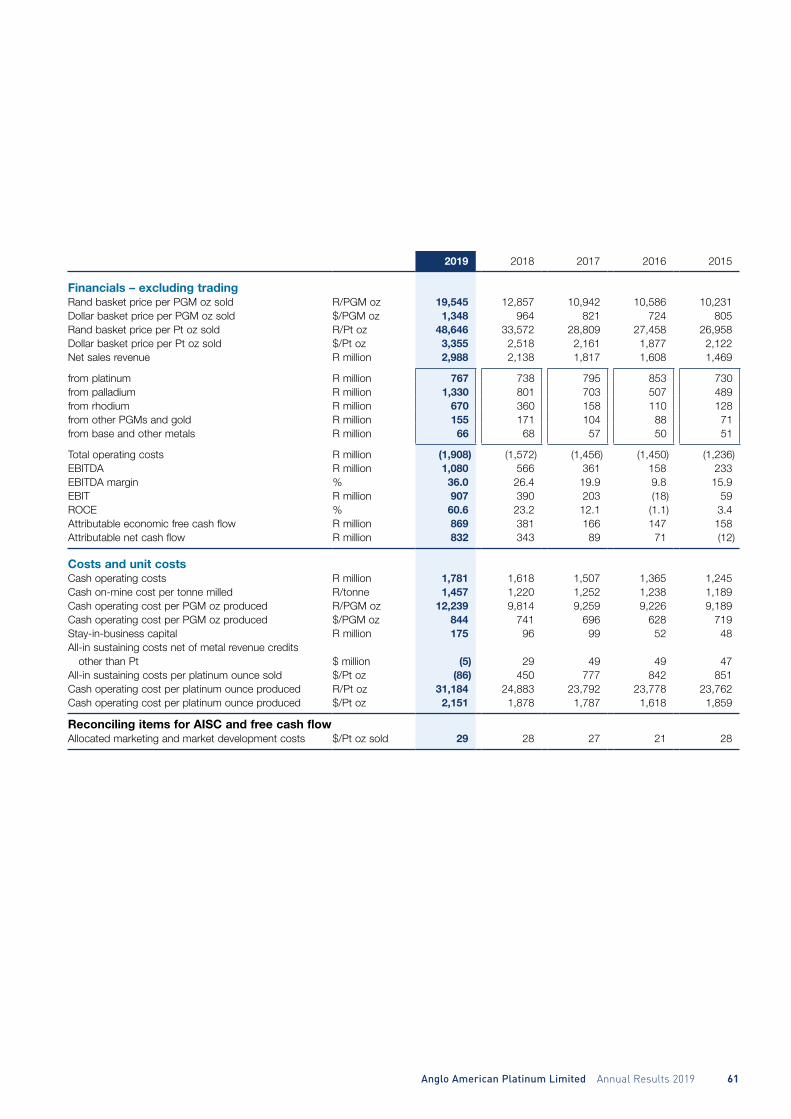
Anglo American Platinum Limited Annual Results 2019 61
2019 2018 2017 2016 2015
Financials – excluding tradingRand basket price per PGM oz sold R/PGM oz 19,545 12,857 10,942 10,586 10,231Dollar basket price per PGM oz sold $/PGM oz 1,348 964 821 724 805Rand basket price per Pt oz sold R/Pt oz 48,646 33,572 28,809 27,458 26,958Dollar basket price per Pt oz sold $/Pt oz 3,355 2,518 2,161 1,877 2,122Net sales revenue R million 2,988 2,138 1,817 1,608 1,469
from platinum R million 767 738 795 853 730from palladium R million 1,330 801 703 507 489from rhodium R million 670 360 158 110 128from other PGMs and gold R million 155 171 104 88 71from base and other metals R million 66 68 57 50 51
Total operating costs R million (1,908) (1,572) (1,456) (1,450) (1,236)EBITDA R million 1,080 566 361 158 233EBITDA margin % 36.0 26.4 19.9 9.8 15.9EBIT R million 907 390 203 (18) 59ROCE % 60.6 23.2 12.1 (1.1) 3.4Attributable economic free cash flow R million 869 381 166 147 158Attributable net cash flow R million 832 343 89 71 (12)
Costs and unit costsCash operating costs R million 1,781 1,618 1,507 1,365 1,245Cash on-mine cost per tonne milled R/tonne 1,457 1,220 1,252 1,238 1,189Cash operating cost per PGM oz produced R/PGM oz 12,239 9,814 9,259 9,226 9,189Cash operating cost per PGM oz produced $/PGM oz 844 741 696 628 719Stay-in-business capital R million 175 96 99 52 48All-in sustaining costs net of metal revenue credits other than Pt $ million (5) 29 49 49 47All-in sustaining costs per platinum ounce sold $/Pt oz (86) 450 777 842 851Cash operating cost per platinum ounce produced R/Pt oz 31,184 24,883 23,792 23,778 23,762Cash operating cost per platinum ounce produced $/Pt oz 2,151 1,878 1,787 1,618 1,859
Reconciling items for AISC and free cash flowAllocated marketing and market development costs $/Pt oz sold 29 28 27 21 28

ANNUAL RESULTS 2019 GROUP PERFORMANCE DATA
62 Anglo American Platinum Limited Annual Results 2019
GROUP PERFORMANCE DATA CONTINUEDfor the year ended 31 December 2019
KROONDAL PLATINUM MINE(50:50 pooling and sharing agreement with Sibanye Platinum Limited)(All statistics represent attributable contribution for mined production i.e. excluding POC)
2019 2018 2017 2016 2015
ProductionTotal development km 6.1 6.0 9.4 12.6 12.4Square metres 000 m² 496 478 484 471 467
Tonnes milled 000 tonnes 2,636 2,625 2,517 2,391 2,344
Built-up head grade 4E g/tonne 3.60 3.66 3.64 3.70 3.69
Total mined production (M&C)PGMs 000 ounces 313.5 312.2 292.9 288.1 275.7
Platinum 000 ounces 148.6 148.3 139.3 137.0 131.5Palladium 000 ounces 80.0 78.6 73.9 72.5 69.1Rhodium 000 ounces 28.1 28.1 26.4 25.9 24.6Iridium 000 ounces 10.4 10.4 9.8 9.8 9.3Ruthenium 000 ounces 45.1 45.5 42.3 41.8 40.1Gold 000 ounces 1.3 1.3 1.2 1.1 1.1
Nickel 000 tonnes 0.3 0.3 0.3 0.3 0.2Copper 000 tonnes 0.1 0.1 0.1 0.1 0.1
Total PGM ounces refined 319.5 281.3 286.3 275.6 279.5
Platinum 000 ounces 156.5 141.7 142.7 133.7 138.8Palladium 000 ounces 83.8 72.4 75.8 68.4 74.9Other PGMs+Gold 000 ounces 79.2 67.2 67.8 73.5 65.8
Total PGM ounces sold – excluding trading 315.0 314.1 312.2 290.8 289.7
Platinum 000 ounces 156.1 142.8 142.8 138.4 139.9Palladium 000 ounces 85.6 72.7 73.0 72.4 75.2Other PGMs+Gold 000 ounces 73.3 98.6 96.4 80.0 74.6
Employees and efficienciesOwn employees average 2,745 2,712 2,800 2,926 2,857Contractor employees average 1,097 1,131 1,032 1,085 1,239PGM ounces produced per employee per annum 81.6 81.2 76.5 71.9 67.3

Anglo American Platinum Limited Annual Results 2019 63
2019 2018 2017 2016 2015
Financials – excluding tradingRand basket price per PGM oz sold R/PGM oz 18,486 12,206 10,356 10,663 10,391Dollar basket price per PGM oz sold $/PGM oz 1,275 915 777 729 818Rand basket price per Pt oz sold R/Pt oz 37,319 26,843 22,651 22,406 21,523Dollar basket price per Pt oz sold $/Pt oz 2,573 2,013 1,699 1,532 1,694Net sales revenue R million 5,824 3,833 3,233 3,101 3,010
from platinum R million 1,950 1,656 1,800 2,016 1,874from palladium R million 1,893 1,010 858 644 669from rhodium R million 1,568 752 328 236 295from other PGMs and gold R million 342 355 196 160 126from base and other metals R million 71 60 51 45 46
Total operating costs R million (3,325) (2,781) (2,587) (2,447) (2,305)EBITDA R million 2,499 1,052 646 654 705EBITDA margin % 42.9 27.4 20.0 21.1 23.4EBIT R million 2,210 741 128 246 395ROCE % 151.3 54.4 8.3 13.2 20.0Attributable economic free cash flow R million 2,174 757 284 412 475Attributable net cash flow R million 2,173 757 284 412 474
Costs and unit costsCash operating costs R million 3,029 2,772 2,630 2,369 2,221Cash on-mine cost per tonne milled R/tonne 1,065 979 977 928 883Cash operating cost per PGM oz produced R/PGM oz 9,663 8,878 8,979 8,221 8,053Cash operating cost per PGM oz produced $/PGM oz 666 670 675 559 630Stay-in business capital R million 239 186 225 237 234All-in sustaining costs net of metal revenue credits other than Pt $ million (12) 71 117 112 113All-in sustaining costs per platinum ounce sold $/Pt oz (77) 495 819 806 807Cash operating cost per platinum ounce produced R/Pt oz 20,379 18,696 18,881 17,286 16,882Cash operating cost per platinum ounce produced $/Pt oz 1,405 1,411 1,419 1,176 1,321
Reconciling items for AISC and free cash flowAllocated marketing and market development costs $/Pt oz sold 22 22 21 17 23
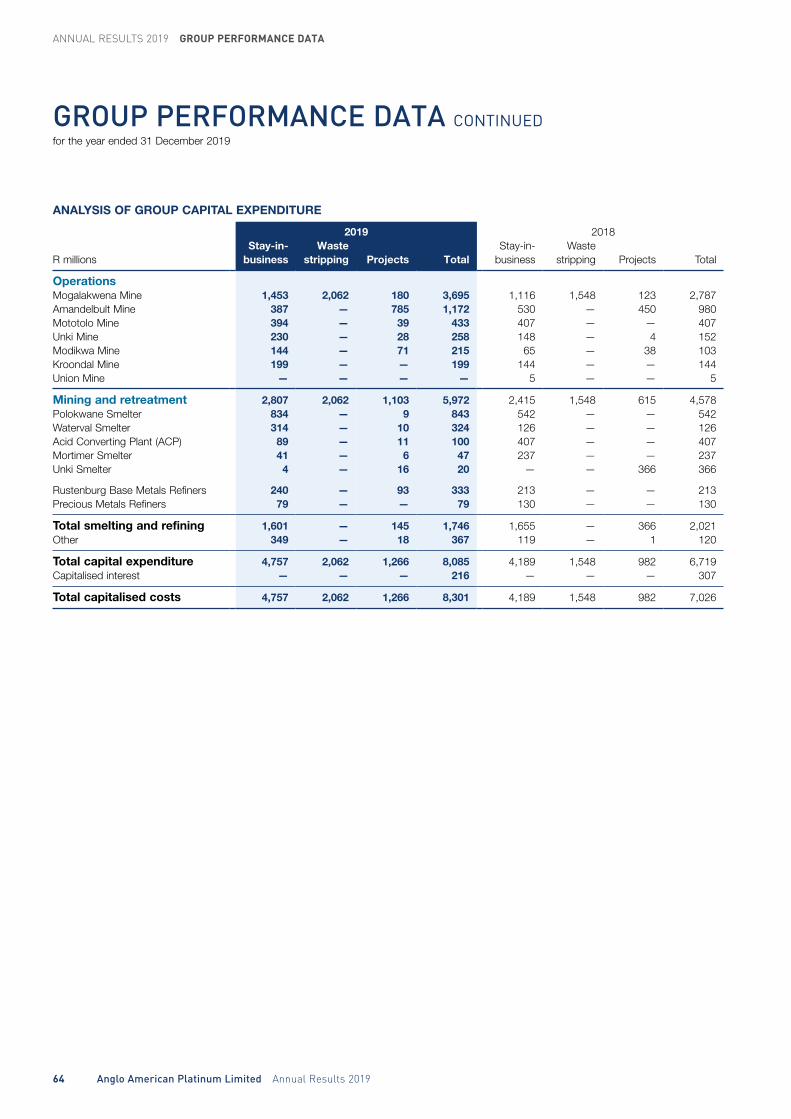
ANNUAL RESULTS 2019 GROUP PERFORMANCE DATA
64 Anglo American Platinum Limited Annual Results 2019
GROUP PERFORMANCE DATA CONTINUEDfor the year ended 31 December 2019
ANALYSIS OF GROUP CAPITAL EXPENDITURE
2019 2018Stay-in- Waste Stay-in- Waste
R millions business stripping Projects Total business stripping Projects Total
OperationsMogalakwena Mine 1,453 2,062 180 3,695 1,116 1,548 123 2,787Amandelbult Mine 387 — 785 1,172 530 — 450 980Mototolo Mine 394 — 39 433 407 — — 407Unki Mine 230 — 28 258 148 — 4 152Modikwa Mine 144 — 71 215 65 — 38 103Kroondal Mine 199 — — 199 144 — — 144Union Mine — — — — 5 — — 5
Mining and retreatment 2,807 2,062 1,103 5,972 2,415 1,548 615 4,578Polokwane Smelter 834 — 9 843 542 — — 542Waterval Smelter 314 — 10 324 126 — — 126Acid Converting Plant (ACP) 89 — 11 100 407 — — 407Mortimer Smelter 41 — 6 47 237 — — 237Unki Smelter 4 — 16 20 — — 366 366
Rustenburg Base Metals Refiners 240 — 93 333 213 — — 213Precious Metals Refiners 79 — — 79 130 — — 130
Total smelting and refining 1,601 — 145 1,746 1,655 — 366 2,021Other 349 — 18 367 119 — 1 120
Total capital expenditure 4,757 2,062 1,266 8,085 4,189 1,548 982 6,719Capitalised interest — — — 216 — — — 307
Total capitalised costs 4,757 2,062 1,266 8,301 4,189 1,548 982 7,026

DISCLAIMERCertain elements made in this annual report constitute forward looking statements. Forward looking statements are typically identified by the use of forward looking terminology such as ‘believes’, ‘expects’, ‘may’, ‘will’, ‘could’, ‘should’, ‘intends’, ‘estimates’, ‘plans’, ‘assumes’, or ‘anticipates’ or the negative thereof or other variations thereon or comparable terminology, or by discussions of, eg future plans, present or future events, or strategy that involve risks and uncertainties. Such forward looking statements are subject to a number of risks and uncertainties, many of which are beyond the Company’s control and all of which are based on the Company’s current beliefs and expectations about future events. Such statements are based on current expectations and, by their current nature, are subject to a number of risks and uncertainties that could cause actual results and performance to differ materially from any expected future results or performance, expressed or implied, by the forward looking statement. No assurance can be given that such future results will be achieved; actual events or results may differ materially as a result of risks and uncertainties facing the Company and its subsidiaries.
DIRECTORS
Executive directorsCI Griffith (Chief executive officer)CW Miller (Finance director)
Independent non-executive directorsRMW Dunne (British)NP Mageza (Lead independent director)NT MoholiD NaidooJM Vice
Non-executive directorsN Mbazima (Non-executive chairman)M Cutifani (Australian)S Pearce (Australian)AM O’Neill (British)
COMPANY SECRETARYElizna [email protected]
Telephone +27 (0) 11 638 3425Facsimile +27 (0) 11 373 5111
FINANCIAL, ADMINISTRATIVE, TECHNICAL ADVISERSAnglo Operations Proprietary Limited
CORPORATE AND DIVISIONAL OFFICE, REGISTERED OFFICE AND BUSINESS AND POSTAL ADDRESSES OF THE COMPANY SECRETARY AND ADMINISTRATIVE ADVISERS55 Marshall Street, Johannesburg 2001PO Box 62179, Marshalltown 2107
Telephone +27 (0) 11 373 6111Facsimile +27 (0) 11 373 5111 +27 (0) 11 834 2379
SPONSORMerrill Lynch South Africa (Pty) LtdThe Place, 1 Sandton Drive, Sandton 2196
REGISTRARSComputershare Investor Services Proprietary LimitedRosebank Towers, 15 Bierman AvenueRosebank, 2196PO Box 61051Marshalltown 2107
Telephone +27 (0) 11 370 5000Facsimile +27 (0) 11 688 5200
AUDITORSDeloitte & ToucheBuildings 1 and 2, Deloitte PlaceThe Woodlands, Woodlands DriveWoodmeadSandton 2196
INVESTOR RELATIONSEmma [email protected]
Telephone +27 (0) 11 373 6239
LEAD COMPETENT PERSONGordon [email protected]
Telephone +27 (0) 11 373 6334
FRAUD LINE – SPEAKUPAnonymous whistleblower facility0800 230 570 (South Africa)www.yourvoice.angloamerican.com
HR-RELATED QUERIESJob opportunities: www.angloamericanplatinum.com/ careers/job-opportunities
Bursaries, email: [email protected]
Career information: www.angloamericanplatinum.com/ careers/working-at-anglo-american-platinum

AN
GL
O A
ME
RIC
AN
PL
AT
INU
M L
IMIT
ED
AN
NU
AL R
ES
ULTS
2019
Anglo American Platinum LimitedIncorporated in the Republic of South AfricaDate of incorporation: 13 July 1946Registration number: 1946/022452/06JSE code: AMS – ISIN: ZAE000013181
www.angloamericanplatinum.com
A member of the Anglo American plc group
www.angloamerican.com
Find us on Facebook
Follow us on Twitter