Huang and Fery 1
Aiding Route Decision for Hazardous Material Transportation
Bo Huang*
Department of Geomatics EngineeringUniversity of Calgary2500 University Drive NWCalgary, AB, T2N 1N4CanadaTel: 403-220-7377Fax: 403-284-1980E-mail: [email protected]
Pierre FeryDepartment of Civil EngineeringNational University of Singapore1 Engineering Drive 2, E1A #07-03Singapore 117576Tel: +65-6874-5035E-mail: [email protected]
Words equivalent: 7499
* Corresponding author
Huang and Fery 2
Abstract. This research attempts to build a framework for determination of optimal routes for hazardous material transportation. Previous works have suggested incorporation of many conflicting objectives in the analysis, such as travel cost, population exposure, environmental risk or security concerns. Multiplying the number of objectives leads to complex shortest path problems that often have several efficient solutions. The present study puts emphasis on providing an overview of the possible tradeoffs between routes without generating all of them. A simple characterization of the efficient routes is used to select the best ones with no need for any input from the decision-maker. A case study with 8 objective functions has been carried out on a road network in Singapore. A geographical information system (GIS) is used to quantify road link attributes, which are assumed linear and deterministic for the sake of simplicity. The proposed algorithm derives four significantly different routes, which conform to intuition.
Huang and Fery 3
INTRODUCTION
Hazardous material (HAZMAT) transportation has received considerable attention since the 1980’s, mainly due to growing safety concerns in most developed countries. Some resounding tragic accidents raised the question on how to limit the possible damages generated by an ever-growing number of shipments crossing the densely populated neighborhoods. While public agencies have addressed the problem with series of regulations and safety measures, transportation researchers have strived to model the risk associated with shipment of hazardous substances and to propose various methods to design suitable routes that present interesting tradeoffs between transportation costs and accident risks.
After a slight slow-down mainly due to the difficulty of gathering accurate and relevant data, HAZMAT transportation research has recently gained renewed emphasis. There are probably two reasons for this. The first is related to the development of Intelligent Transportation Systems that aim at providing convenient tools for mid-term, short-term and possibly real-time decision-making in complex transportation networks. Among those are Geographical Information Systems (GIS), which can facilitate the complex task of risk assessment by enabling visualization, query and handling of spatially related databases. The second arises from security concerns after the tragic events of September 11th, 2001. It is realized that the harmful potential of hazardous substances may jeopardize both facilities and convoys, as they are likely targets for terrorist attacks or hijacking.
Despite the new interest caused by the availability of more powerful risk assessment tools and the increasing complexity of designing HAZMAT routes, this problem has yet to receive more attention that it deserves. This research attempts to address this issue by building up a decision-helping tool to provide the decision-maker with a set of suitable routes from which he can choose according to his own preferences. A GIS is used to quantify each of the identified routing criteria and to display the resulting set of proposed paths. The main difficulty lies within the generation of a number of efficient routes, which, on the one hand, should be small enough to be handled by a decision maker and on the other hand, large enough to give an overview of all the possible tradeoffs among conflicting objectives.
The remainder of this paper is organized as follows. First, a brief literature review highlights the main issues associated with HAZMAT transportation under multi-objective constraints. Then, a theoretical approach of our problem is developed based on the theory of Pareto optimality. The third section is devoted to a practical case study in Singapore, with emphasis on the identification and estimation of routing criteria within the GIS environment. The last section finally provides our concluding remarks.
LITERATURE REVIEW
Limitations of early works
List et al. (1) provided a thorough survey of the literature prior to 1991 regarding risk analysis, routing / scheduling of shipments, and facility location. A few years later, Erkut and Verter (2) attempted to give a synthetic overview of the issues related to transport of hazardous substances. Both studies highlighted some areas as important directions for further research.
First, they emphasized the need to improve the traditional risk assessment methodology, suggesting that “careful incorporation of a wider variety of risk measures for routing/siting decisions will improve their relevance” (3). Besides incident probability and population exposure, the evaluation of HAZMAT route safety should consider additional factors such as the existence of sensitive environments, emergency response capabilities, burden on commerce, congestion delays or property risks (4).
Second, they recommended that HAZMAT routing analyses adequately integrate the road network with its surroundings, since risk levels strongly depend on the characteristics of the regions traversed by the shipments. As early as 1993 (5, 6), researchers argued that the development of Geographical Information Systems (GIS) could successfully address this issue by providing means to analyze network topology and spatial features together. However, interesting developments in this direction were long to appear (see for instance, 7, 8and 9).
One difficulty in HAZMAT transportation studies is the explicit treatment of uncertainties associated with risk measures. The use of risk profiles to represent the probabilistic nature of HAZMAT incidents (10, 11) leads to complex mathematical models, which usually require deterrent algorithms (12, 13). A usual alternative
Huang and Fery 4
is to account for the stochastic nature of risk by computing the expected mean, variance, and possibly higher-order moments, of the adverse consequences of an incident (14), which is efficient provided that all estimates remain additive across links.
The concerns raised in (1) and (2) advocate a multiplication of objectives for the HAZMAT routing problem. An appropriate path should minimize the transportation costs incurred by the vehicles as well as the expected value, and possibly the variance, of a wealth of risk estimates including population exposure, environmental risk, property risk, economical burden of an incident and so forth. This approach requires to address the multi-objective nature of the problem and highlight the trade-offs between conflicting objectives.
Multi-objective shortest path
In multi-objective problems, it is very unlikely that a single solution be optimal with respect to each objective. For instance, the shortest path may not be the one with minimum risk to the surrounding population. Actually, the fastest route may even be the worst route from a safety perspective, since higher road qualities are usually found in densely populated areas. Due to the multi-objective nature of the problem, there are a number of “equivalent” solutions, in the sense that none of them is better than any other for every objective. These solutions are called Pareto-optimal or non-dominated (a mathematical definition is provided in the next section).
There are mainly two approaches for finding the best path under multiple objectives: either generate all the Pareto-optimal solutions (Pareto front) and let the decision-maker choose from this set, or ask him/her to state his preferences in order to focus directly on the paths of interest.
The former approach (generating approach) can rely on multi-objective linear programming (MOLP) provided that some linearity conditions are satisfied (15, 16, 17 provide interesting examples), or on specialized multi-objective shortest path algorithms, such as those reported by Skriver (18). While the latter approach can account for non-additive objective functions (19) and stochastic or time-varying attributes (13), they face the same computational problems as MOLP techniques, i.e. the number of Pareto-optimal paths can be very large and the computational time may grow exponentially with the network size (20) and the number of objectives m.
The latter approach is sometimes called utility-based as it relies on the assumption that the decision-maker’s preferences derive from an underlying utility function that can be stated beforehand (21, 22) or through an interactive procedure (23, 24). However, articulating quantitative preferences for incommensurable objectives may be a rather delicate issue involving ethical questions, such as the price of life or the liability of emergency response teams, which are difficult to quantify. To overcome this, the utility-based techniques are often usedrepeatedly to generate several solutions by varying some key parameters. This yields a partial set of non-dominated paths, which may be biased by the very assumption of a utility function. Because most utility functions cannot capture all the Pareto-optimal solutions, the partial set created may miss some interesting paths and may not present all the possible tradeoffs to the decision-maker.
In view of past works, both generating techniques and preference-based approaches have pros and cons. An alternative approach would be to construct enough, but not too many, efficient solutions that give an appropriate approximation of the Pareto-front. The next section describes such an approach proposed in this paper.
THEORETICAL FRAMEWORK
Characterization of Pareto-optimal paths
Consider m objective functions f1, f2, …,fm and denote p and q two feasible paths from origin to destination, with vector of attributes (f1(p), f2(p), …, fm(p)) and (f1(q), f2(q), …, fm(q)) respectively. Path p dominates path q if and only if:
( ) ( )qfpfmk kk ≤≤≤∀ ,1 and ( ) ( )qfpfk kk <∃ |
which indicates that path p is always better than or equivalent to path q and it is strictly better with respect to at least one attribute. Conversely, q is non-dominated, or Pareto-optimal, if and only if, for all paths p in the feasible domain:
( ) ( )pfqfmkk kk <≤≤∃ |1, or ( ) ( )pfqfmk kk ≤≤≤∀ ,1
Huang and Fery 5
In what follows, we shall say that p dominates q if and only if ( ) ( )qfpfmk kk ≤≤≤∀ ,1 and drop the
second condition with strict inequality.
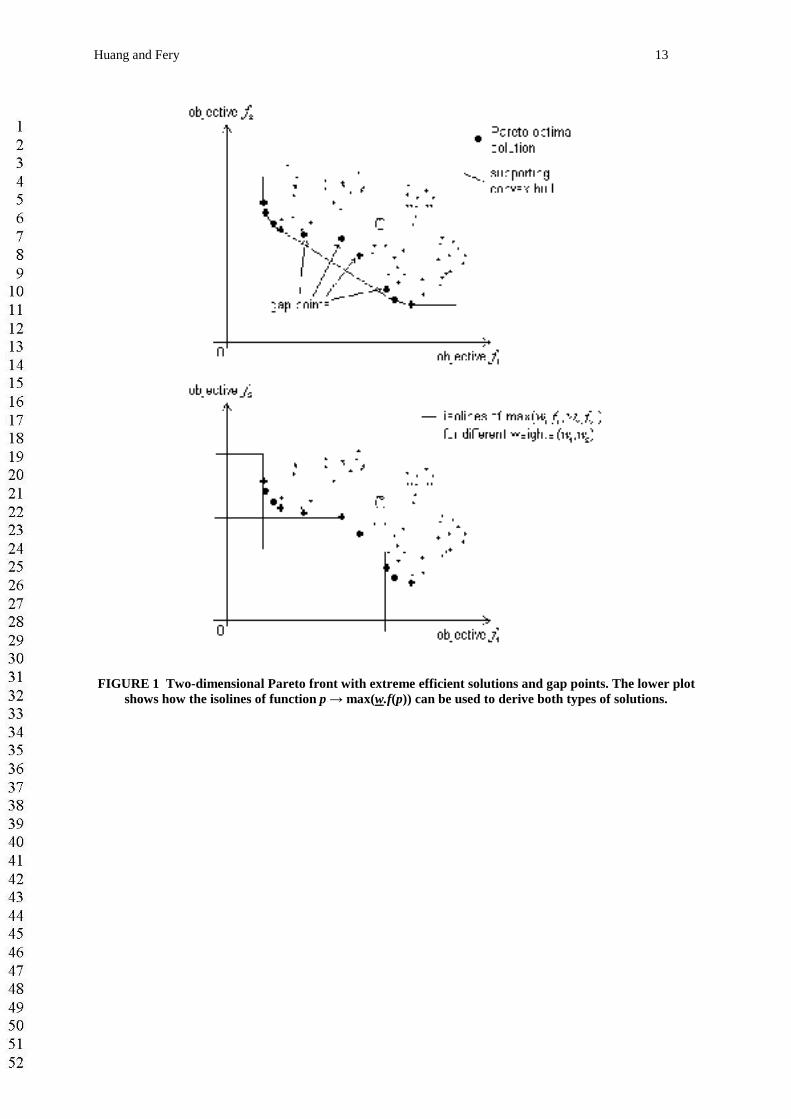
FIGURE 1 shows that the set of Pareto-optimal solutions, or Pareto front, comprises extreme efficient points, which lie on the convex hull of the feasible domain, and possibly “gap points” in the concave parts, which may be interesting solutions as well. Many researchers use a weighted average of the objectives to convert the problem into a single objective problem but this approach fails to find the so-called “gap points”. In order to explore every region of the Pareto front, the following objective function is proposed:
( ) ( )( )pfwwpf kkmk≤≤
=1max,
where ( )mwwww ,...,, 21= is a set of positive weighting factors, which can be varied to derive the whole set of
non-dominated solutions. Although these factors may be interpreted as representing the preferences of the decision-maker, they are merely used here as control parameters.
Assuming that all objective functions are strictly positive, the following result provides a characterization of non-dominated paths using a single objective function:
q is non-dominated ⇔ for every path p, there exists 0≥w such that ( ) ( )wpfwqf ,, <
Proof:⇒ q non-dominated implies that for every path p, ( ) ( )pfqfmkk kk <≤≤∃ |1, . Please bear in mind that
we adopted a weak definition of dominance. Define a positive vector w as ( )0,...,0,1,0,...,0,0 =kw . Since all
fk are strictly positive, it follows ( ) ( ) ( ) ( )wpfpfqfwqf kk ,, =<= . Hence, for every path p, there exists w
≥ 0 such that ( ) ( )wpfwqf ,, <⇐ Let us prove the counterpart of this implication. Assume that q is dominated by some path p, i.e. such that ( ) ( )qfpfmk kk ≤≤≤∀ ,1 . For every choice of positive weights w, it holds the following
( ) ( )qfwpfwmk kkkk ≤≤≤∀ ,1 , hence ( ) ( )wqfwpf ,, ≤ . Conversely, if for every path p, there exists w ≥0 such that f(q,w) < f(p,w), then q is non-dominated.
A geometrical interpretation in two dimensions shows that the isolines of function f are square wedges and that the inside region of the wedge corresponds to the set of paths dominating the summit of the square angle. The shape of the isolines of f is perfectly appropriate to explore both convex and concave parts of the Pareto front, while ensuring Pareto-optimality of the points encountered. Hence, an approximation of the Pareto front can be obtained by solving several instances of the following problem:
( )( )( )pfw kkmkp ≤≤1
maxmin (1)
where w = (w1, w2, …, wm) defines the search direction. Figuratively, solving this problem is equivalent to scanning the Pareto front along a specific aiming line joining (0,0,…,0) and (1/w1,1/w2,…,1/wm). This approach is an application of the theory of achievement scalarizing function, developed by Wierzbicki (25) as early as 1977.
Calculating the desired Pareto-optimal path
Problem (1) can be regarded as a shortest path problem with objective function as the utility granted to each path, that is:
( ) ( ) ( )( )pfwwpfpU kkmk≤≤
==1max,
Unlike the weighted average method, which comes down to a standard shortest path algorithm, this problem cannot be solved within polynomial computational time. As minimizing U(p) is another way of finding Pareto-optimal paths, it does not suppress the intrinsic complexity of the task. In other words, problem (1) faces the same difficulties as any multi-objective shortest path algorithm.
For simplicity, this research assumed that all objectives kf are linear functions of the link attributes,
which allows formulating problem (1) as a linear program. Denote a set of arcs in the network by its matrix
representation ( )ijxX = with 1=ijx if arc (i,j) is in the path, and 0 otherwise. Similarly, denote ( )kij
k cC = the
cost matrix corresponding to objective k: ( ) ( ) ∑== ijkij
tkk xcXCTrXf . . Problem (1) becomes exactly:
Huang and Fery 6
αminsubject to:
mkxcwji
ijkijk ,...,1
,
=∀≤∑ α
=−∑∑
otherwise0
noden destinatio theisif1
nodeorigin theisif1
j
j-
xxi
ji
i
ij
and xij ∈{0,1} ∀i,j
Two methods were used to validate the framework. In the first method, this problem was solved using a Branch & Bound algorithm provided by Lindo, which is a numerical solver dedicated to linear programs. In the second method, problem (1) was tackled by a custom-made node-labeling algorithm inspired from that proposed by Granat and Guerriero (24). The computational experiments show that the node-labeling algorithm usually performs much faster than the Branch & Bound procedure because it makes use of the network connectivity properties to examine each variable in turn. However, it requires much more memory space, which can be a critical issue for some applications. Further research is needed to determine the behavior of both algorithms when averaged over different types of real-road networks.
Approximation of the Pareto front
Using several sets of weighting factors w, problem (1) allows to find some non-dominated paths pertaining to the Pareto front. The coverage quality of the approximate Pareto front obtained is of great importance to providing the decision-maker with an unbiased overview of the possible tradeoffs. An appropriate coverage should achieve a compromise between the amount of information provided and the computational time required to obtain it, that is:
• Be sufficiently well distributed. For instance, the probability that an interesting path lies outside the convex cone enclosing the calculated set of non-dominated paths should be small.
• Reflect major inflexions of the Pareto front, especially, concave regions and saddle points (in dimension higher than 2).
• Avoid paths with too much similarity in their attributes and routes.• Be reasonably small compared to the number of objectives, so that a decision-maker can easily handle
it. This constraint may not seem important in two dimensions since a graphical representation enables quick visual inspection of the proposed set, but it becomes a critical issue in dimensions higher than 3, when partial representations may be misleading.
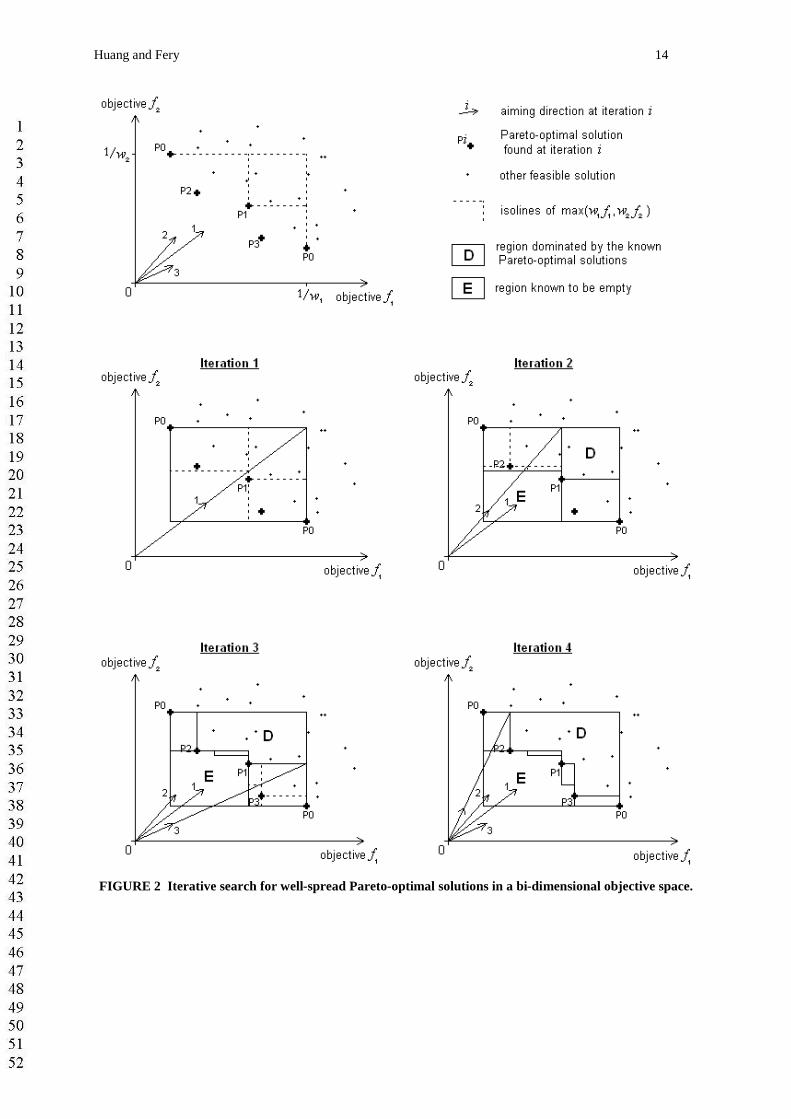
The proposed procedure to derive a good approximate Pareto front first calculates the paths that are optimal for one objective, thus defining the frame of the exploration domain. At every subsequent step, a new search direction is defined to explore the largest empty sub-region between two known solutions (FIGURE 2). The particular shape of the isolines of the max function ensures that, in absence of additional non-dominated paths lying in an empty sub-region, all known solutions are reached at the same time and no unexplored gap can subsist in this sub-region. The algorithm stops when an adequate number of non-dominated paths has been found or when the level information gathered, measured in volumes of remaining unexplored regions, is sufficient to the decision-maker.
Goodness of the selected paths
In order to help the decision-maker to make his choice when facing many alternatives, a confidence indicator is calculated for each path, which quantifies the compromise made when choosing this path over the others. To some extent, all path attributes are random, so the Pareto front is the extreme minimal frontier of a set of multi-dimensional stochastic variables. Under some classic assumptions (26), the generalized extreme value distribution is suitable to model the asymptotic behavior of these minima. In other words, each component fk can be assumed to follow a Gumbel distribution along the Pareto front:
( )
−
−=≤b
xaxfP k expexp
where a and b are location and scale parameters, and are related to the mean µ, the standard deviation σ and the Euler constant (γ ≈ 0.577215) by:
Huang and Fery 7
=
+=
6
222 b
baπσ
γµ
In practice, the algorithm evaluates the mean and variance of attribute fk based on all the solutions found. Then, for every path p, the probability that an additional non-dominated path would have smaller attribute fk is:
( ) ( )( ) ( )
−
−=≤=b
pfapffPpP k
kkk expexp
The smaller this probability, the better the path with respect to objective k. Conversely, the quality of path p on the k-th objective is ( ) ( )pPpQ kk −= 1 . This procedure converts m incommensurable objectives fk into
probabilities Qk, thus providing a common measurement scale among the various attributes. We then define the overall quality of the path Q(p) as the geometrical mean of these probabilities:
( ) ( ) ( ) ( )mm pQpQpQp ...Q 21=
The higher this indicator, the more evenly distributed is the vector of probabilities (Q1,…, Qm). Hence, tradeoffs between incompatible objectives yield higher values of the indicator. If the decision-maker is able to state his preferences in terms of a vector of priorities (γ1,…,γm), the quality index can be modified to suit his needs as follows:
( ) ( )mmmQQQ
γγγγγγ +++=
...1
212121 ...Q
CASE STUDY
Methodology
The theoretical framework presented in the previous section was implemented within a GIS environment by building up a decision-helping tool for routing petrochemical vehicles in Singapore. The GIS platform ArcView 3.1, developed by ESRI, allows to perform geographical analysis of the impact zone associated with every road segment. Databases and shapefiles provide sufficient information to locate residential, commercial and industrial buildings, to estimate the area of sensitive environments or to calculate the response time from the nearest fire station for instance. Once the link attributes have been quantified, all relevant data are exported towards a Dynamic Link Library, coded in C++ language, that calculates an approximate Pareto-front for the specified routing problem. For each link, eight attributes were calculated:
• travel time (TRAVTIME),• probability of an accident with release of material (ACCPROB),• expected population at risk (RISK),• expected population with special needs at risk (SPECRISK),• expected areas of sensitive environment at risk (ENVRISK),• expected burden on economy: industrial, commercial and transportation facilities at risk
(ECONBURDEN),• expected additional damage due to delay in emergency response (ADDDAMAGE),• danger index to account for risks of hijacking and intentional release by terrorists (DANGER).
As mentioned previously, the model is limited by the restriction that all attributes must be additive along paths. That is why most objectives are expected values, which are additive under the assumption that accident probabilities are independent from one link to another.
Quantification of link attributes
Operating costs
The cost of operating a truck usually involves many factors ranging from fuel consumption, driver wages and maintenance to insurance and amortization costs, which, under different accounting policies, may yield different definitions of cost. For simplicity, this study assumes that operating costs are an increasing function of the travel time only, and the travel time is directly used as one objective of the minimization problem.
Huang and Fery 8
While road lengths are readily available within the geographical database, travel times need to be estimated for each road segment. In absence of actual, time-varying travel time profiles for Singapore road network, the expected travel time of each link was calculated as a function of length, functional speed, and average time delay if the link terminates at a signalized intersection. Due to the small size of Singapore Island, the road network is represented with great accuracy so that short road segments allowing for turn moves can be taken into account with suitable time penalties.
Risk estimates
Numerous models have been proposed to measure the risk of transporting hazardous material along a stretch of road (3, 14). The common feature of all approaches is that a risk indicator is composed of the probability of some undesirable event and the possible adverse consequences. Denote qi the probability of an accident with release of hazmat along the i-th link of path p, which comprises n(p) links, and Ci the number of injuries and fatalities due to this accident. Under some reasonable assumptions, notably that qi<<1 for every link, a simple and tractable model would define the expected consequence of an accident along path p as:
( ) ( )( ) ( )
∑∑ ∏==
−
=
≈−=pn
i
ii
pn
i
i
i
j
jip CqCqqCE11
1
1
1
To be more precise, qi could be refined as the conditional probability of a release with level of consequences Ci, given that an accident occurred on link i. In addition, Ci could be taken as a stochastic quantity that may vary with road traffic, weather conditions and many other fluctuant parameters. Since the purpose of this paper is not to define an accurate measure of risk, these considerations are left to a later article. This simplistic linear model is regarded as a relative indicator of risk, which is sufficient to choose between several alternatives (4).
In absence of specific statistics for Singapore, numerical values of accident rates were taken from Harwood et al. (27) and adapted to Singapore network based on our knowledge of local traffic conditions. Population figures were calculated from the exact number of buildings (residential, commercial and offices) within a distance of 800 meters from the road segment. This value does not account for the decreasing probability of fatalities as people live further from the road where the release occurs, nor does it account for any site-specific features such as a privileged direction of dispersion. The level of details provided by the geographical database could enable such a complex analysis (6, 7) but assessing the effects of a release of hazardous materials in the urban environment is beyond the scope of this paper. Instead, the present study makes use of the simplistic idea that a release would affect a potential impact area, which is isotropic and the dimension of which depends on the type of material spilled.
Additional risk components are estimated by following the same framework as suggested in the US DOT guidelines for hazmat routing (4). An indicator for special populations is derived based on the location of schools, hospitals, touring attractions and religious buildings. Environmental risk is calculated from the area of sensitive environment (nature reserves, water catchment areas, reservoirs and lakes, parks and protected coastline) that falls within the impact zone of the network. The expected burden on economy from an accident is again calculated as the product of accident probability with the number of industrial, commercial and transportation facilities potentially at risk, assuming that a facility within the impact zone will be out of serviceuntil the area has been cleaned up. If land-use prices were available, it would also be possible to include a measure of the expected property damage caused by an accident.
Emergency response capabilities
The present study limits the measure of emergency response capabilities to the capacity of quickly dispatching hazmat response teams to the accident site. This means that evacuation of injured people towards hospitals and clean-up operations do not form here the decisive factors in assessing the impact of a hazmat spill.
Assuming a fixed delay to notify the incident, the magnitude of consequences will depend on the subsequent reaction time. Denote ( )tD the level of damage at time t. The additional damage ( )tDδ caused by a
delay tδ in reaction time is assumed to be proportional to the current magnitude of consequences and the delay
as follows:
( ) ( )τδδ ttD
tD.= (2)
Huang and Fery 9
where τ is the characteristic time of effect of the pollutant on the environment, which depends on the nature and harmfulness of the substance, as well as physical and geographical factors such as weather conditions, terrain aspect, soil permeability or population density. Rewriting (2) as:
( )( ) ttD
tD δτ
δ 1=
and integrating on both sides of the equality sign yields the magnitude of consequences with a reaction time t:
( )
=τt
DtD expmin
where Dmin corresponds to the existing damage when the accident is reported. Note that ( )tD represents here the
existing damage when the response teams reach the incident site and does not account for subsequent evolutions during the containment and cleanup phases.
Although the exponential increase of the consequences with time conforms to intuition and explains why a quick response is essential, List (28) found from an empirical study that the probability of injury caused by a release seems proportional to the response time, which would mean that the consequences vary linearly with the response time. A closer look at List’s paper shows that the linear regression performed only included values of reaction time up to 15 minutes, which is much smaller than the expected time of two hours for a complete release, and the author is himself doubtful about the generalization of this result. Since the analysis is only valid for short reaction times, the exponential model may fit the same data provided the characteristic time τ is adequate. In fact, if τt is small enough, the exponential function has a limited development that would yield a
similar linear behavior.
Based on these considerations, the expected additional damage due to the delay between the notification and the response is then:
Ep(Additional Damage)( )
∑=
−
=
pn
i
iii
tDq
1
min 18
exp
where 8≈τ hours was chosen to be compatible with the results presented by List (28). For simplicity, it is assumed here that only one fire station is needed to contain an incident and that ti is merely the travel time required to reach link i from the closest fire station. Unlike most works on emergency response, this travel time is calculated based on the actual shortest path distance in the network and not on the Euclidian (straight-line) distance.
Security concerns
In consideration for security issues, one can identify three types of threat related to terrorist activities: theft of containment by means of deception or force, release or ignition of the material near a potential target, and legalacquisition for later use of hazmat as a weapon (29). The latter point does not present any immediate risk for hazmat transportation, as it is more an issue for industry regulation bodies. The present study only focuses on the first two types of threat.
Assume that a terrorist group wants to take control of some hazmat shipment. We make the hypothesis that the hijack is more likely to occur in areas with rare traffic. Therefore, an arbitrary score can be assigned to each link to reflect the likelihood of such event in those areas. Furthermore, as soon as the truck leaves its normal route, police can attempt to intercept the vehicle before it disappears or before its containment is used as a weapon. In such a pursuit-evasion game, the terrorist may prefer roads with a high average speed and no traffic halts to avoid being seized. In this study, such road segments receive a higher score, which is incorporated in the overall “danger index”.
Now, assume that an attack would use hazmat as a weapon to cause maximum damage or fatalities. This can happen after the terrorists have taken control of some hazmat shipments or even without the need to gain such control as a normal shipment could be intercepted or diverted while very near a potential target. The present work assumes that likely targets are crowded places such as shopping centers, tourist sites, stadiums, subway stations, etc. and places of vital importance (water catchment area, power plants, etc) or with high symbolic value (government offices, embassies, international schools, etc.). Once again, an indicator can be constructed to account for the linear density of such targets along each link of the network and a linear combination with the other indicators sums up all the security concerns into one single danger index.
Huang and Fery 10
Results
Given the eight objectives described above, the present study attempted to derive the best efficient routes from Jurong Island, the petrochemical hub of Singapore, to the industrial park of Hougang. The main road network of Singapore was discretized so that every attribute could be deemed constant along each link, resulting in 12586 links and 9712 nodes. Despite these large figures, there are not more than 160 non-dominated routes mostly because the driving code restricts many turn moves and thus prevents the number of feasible paths from increasing tremendously. Many of these Pareto-optimal routes overlap and present such a degree of similarity that they could be deemed belonging to the same transportation corridor. Ideally, one sample of each corridor should be sufficient to provide the decision-maker with an overview of the possible routes.
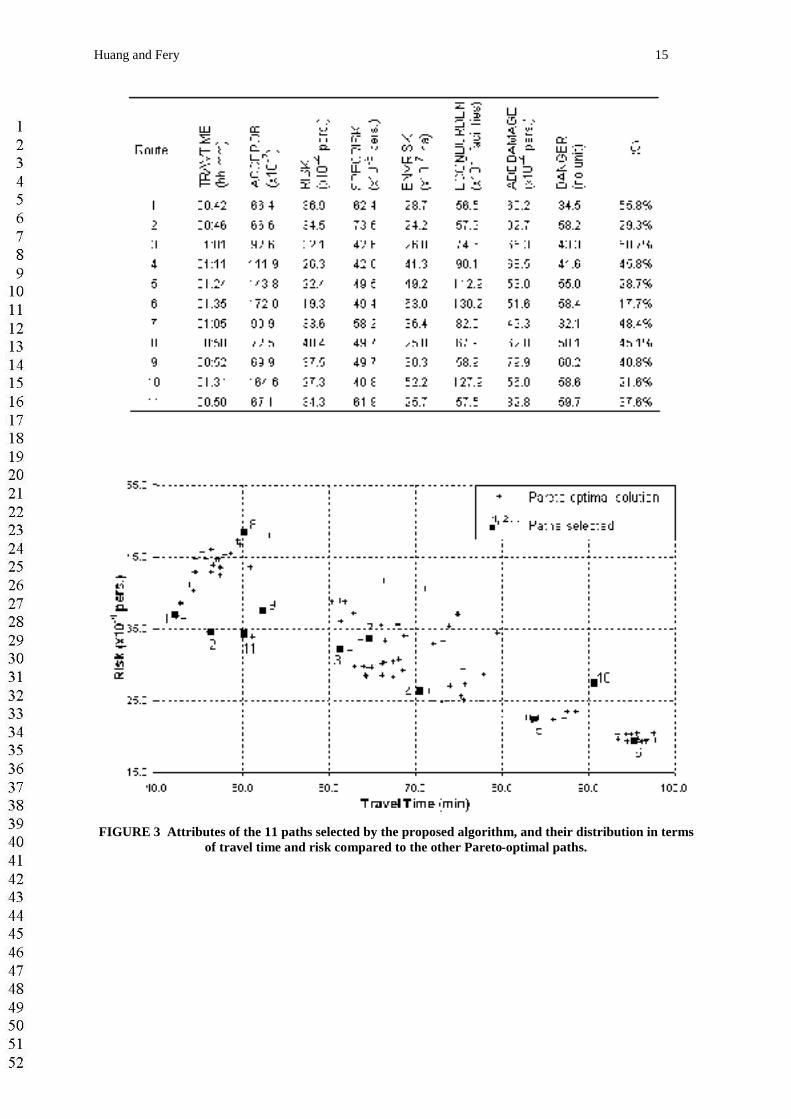
The proposed algorithm was set to stop when 70% of the objective space was explored. This resulted in the calculation of 11 Pareto-optimal paths, which proved a posteriori to be sufficiently dissimilar. The attributes of each route are shown on FIGURE 3, together with the quality (Q) of the trade-offs achieved. Note from the lower part of FIGURE 3 that the selected routes are rather well distributed in the chart (TRAVTIME, RISK). Although they are not displayed here, the same observation holds on the other partial plots of the objective space.
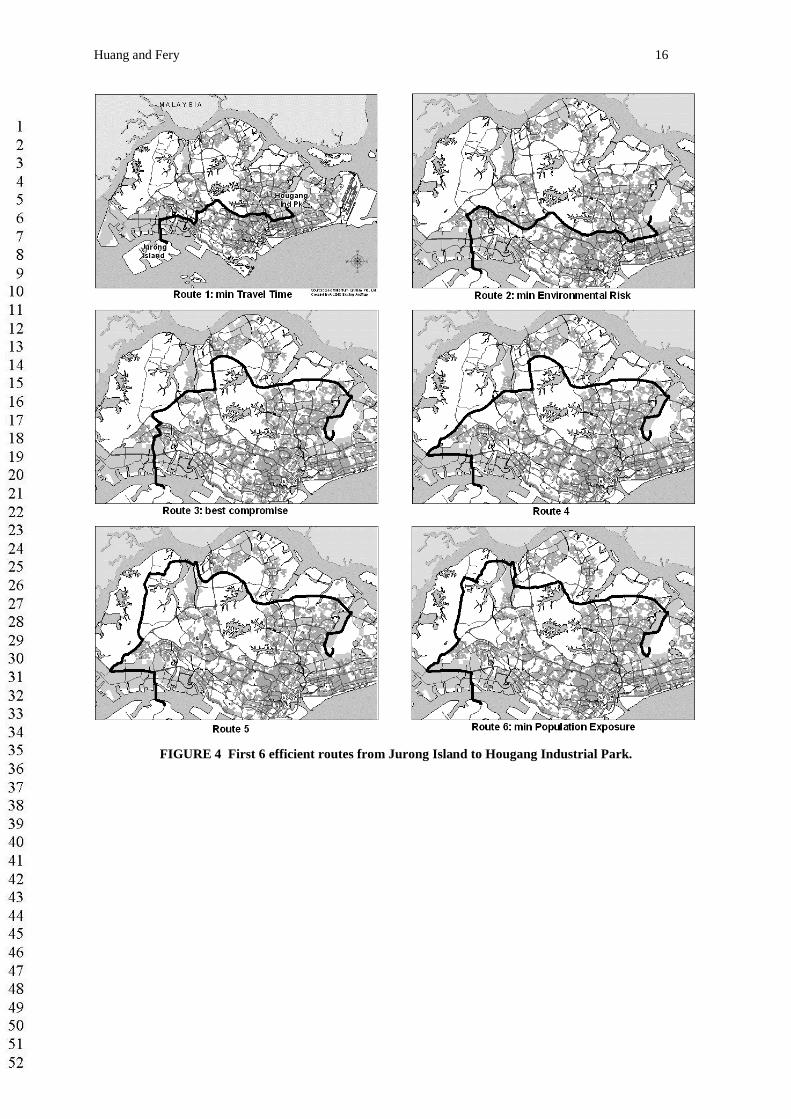
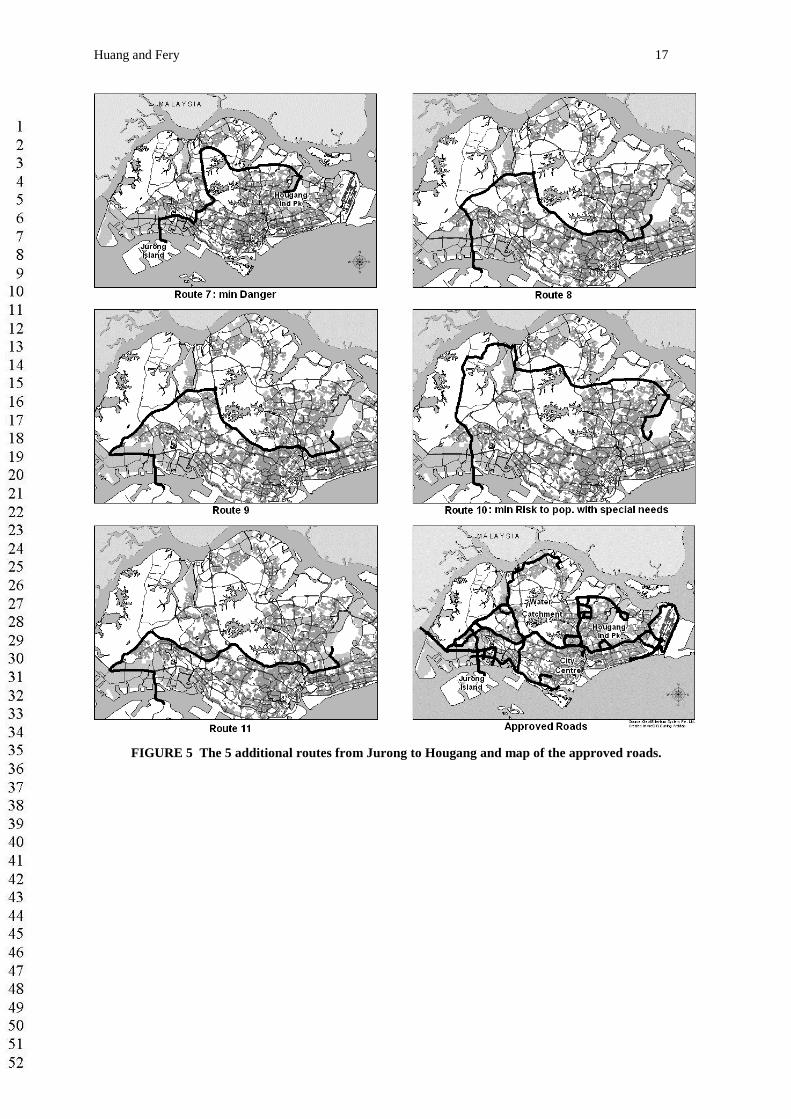
FIGURES 4 and 5 show the shapes of the 11 selected paths and the map of roads approved by the Singapore government for HAZMAT transportation. Route 1 is the fastest path and has reasonably good attributes, but Route 3 seems to offer the best compromise despite a longer travel time. Route 2 minimizes the expected environmental risk at the expense of security concerns, while Route 7 reduces the risk of terrorist attacks. Routes 5, 6 and 10 are circuitous routes through lower-density areas, which minimize the overall risk despite higher accident probabilities. Finally, Routes 4, 8, 9 and 11 are additional variants that may offer interesting trade-offs to the decision-maker. Although the proposed paths carefully avoid the city center and the water catchment area, they do not exactly match the approved roads because the authority may use another set of criteria which are not made public.
CONCLUSIONS
In the attempt to build an efficient decision support system for transportation of hazardous materials, one major difficulty is the proper trading-off of all relevant factors. The present research has proposed a novel perspective on the multi-objective shortest path problem in order to come out with a representative set of efficient paths. Avoiding the pitfalls of preference-based techniques and the burden of generating the complete set of possible solutions, the proposed approach provides decision-makers with an overview of the solution space, even when the number of objectives increases substantially. An application study for the route choice of hazmat trucks in Singapore showed how the proposed framework could easily be adapted within a GIS environment.
However, to be operational, the decision tool presented here requires further improvements on computational efficiency and results accuracy. In order to handle non-linear objective functions and, possibly, the constraints of real-time operations, the Branch & Bound algorithm clearly needs to be replaced by an efficient node-labeling algorithm. Besides, a more realistic quantification of risk should be achieved using site-specific data and suitable dispersion models.
From a general perspective, this research has observed a mismatch of interests between the traditional field of network optimization and that of decision-making under risk. While hazmat transportation requires competencies in both areas, former research works usually focused on one side of the coin only. The present work does not claim to fill up the existing gap but we hope that it will constitute a forward step towards better integration of decision-making techniques in engineering practices.
REFERENCES
1. List, G.F., Mirchandani, P.B., Turnquist, M.A. and K.G. Zografos. Modeling and Analysis for Hazardous Materials Transportation: Risk Analysis, Routing / Scheduling and Facility Location. Transportation Science, Vol. 25, No. 2, pp. 100-114, 1991.
2. Erkut, E. and V. Verter. Hazardous Materials Logistics. In Drezner, Z. (Ed.), Facility Location: A Survey of Applications and Methods. Springer Series in Operations Research, Springer-Verlag, New-York, 1995.
3. Erkut, E. and V. Verter. Modeling of transport risk for hazardous materials. Operations Research, Vol. 46, No. 5, pp. 625-642, 1998.
Huang and Fery 11
4. U.S. Department of Transportation. Guidelines for Applying Criteria to designate Routes for Transporting Hazardous Materials. Report FHWA-SA-94-083, Office of Highway Safety, Federal Highway Administration, Washington, DC, September 1994.
5. Lassarre, S., Fedra, K. and E. Weigkricht. Computer-Assisted Routing of Dangerous Goods for Haute-Normandie. Journal of Transportation Engineering, Vol. 119, No. 2, pp. 200-210, 1993.
6. Lepofsky, M., Abkowitz, M. and P. Cheng. Transportation Hazard Analysis in Integrated GIS Environment. Journal of Transportation Engineering, Vol. 119, No. 2, pp. 239-254, 1993.
7. Zhang, J., Hodgson, J. and E. Erkut. Using GIS to assess the risks of hazardous materials transport in networks. European Journal of Operational Research, Vol. 121, pp. 316-329, 2000.
8. Frank, W.C., Thill, J.-C. and R. Batta. Spatial decision support system for hazardous material truck routing. Transportation Research Part C, Vol. 8, pp. 337-359, 2000.
9. Huang, B., Cheu, R.L. and Y.S. Liew. GIS-AHP Model for HAZMAT Routing with Security Considerations. IEEE 6th International Conference on Intelligent Transportation Systems, October 2003, Shanghai, China.
10. Abkowitz, M. and P.D.-M. Cheng. Developing a risk/cost framework for routing truck movements of hazardous materials. Accident Analysis & Prevention, Vol. 20, No. 1, pp. 39-51, 1988.
11. Alp, E. Risk-based transportation planning practice: Overall methodology and a case example. INFOR, Vol. 33, No. 1, pp. 4-19, 1995.
12. Wijeratne, A.B., Turnquist, M.A. and P.B. Mirchandani. Multiobjective routing of hazardous materials in stochastic networks. European Journal of Operational Research, Vol. 65, pp. 33-43, 1993.
13. Miller-Hooks, E. and H.S. Mahmassani. Optimal Routing of Hazardous Substances in Time-Varying, Stochastic Transportation Networks. Amarillo National Resource Center for Plutonium Report ANRCP-1998-8, Amarillo, TX, July 1998.
14. Erkut, E. and A. Ingolfsson. Catastrophe Avoidance Models for Hazardous Materials Route Planning. Transportation Science, Vol. 34, No. 2, pp. 165-179, 2000.
15. Evans, G.W. An overview of techniques for solving multiobjective mathematical programs. Management Science, Vol. 30, No. 11, pp. 1268-1282, 1984.
16. Zografos, K.G. and C.F. Davis. Multi-Objective Programming approach for Routing Hazardous Materials. Journal of Transportation Engineering, Vol. 115, No. 6, pp. 661-673, 1989.
17. Yang, X. and M. Gen. Evolution Program for Bicriteria Transportation Problem. Computers and Industrial Engineering, Vol. 27, Nos. 1-4, pp. 481-484, 1994.
18. Skriver, A.J.V. A classification of bicriterion shortest path (BSP) algorithms. Asia-Pacific Journal of Operational Research, Vol. 17, pp. 199-212, 2000.
19. Mirchandani, P. and H. Soroush. Optimal Paths in Probabilistic Networks: A Case with Temporary Preferences. Computers & Operations Research, Vol. 12, pp. 365-381, 1985.
20. Martins, E.Q.V. and J.L.E. Dos Santos. The labelling algorithm for the multiobjective shortest path problem. CISUC, Dept. of Mathematics, University of Coimbra, Portugal, Nov. 1999.
21. Henig, M.I. The shortest path problem with two objective functions. European Journal of Operational Research, Vol. 25, pp. 281-291, 1985.
22. Mirchandani, P.B. and M.M. Wiecek. Routing with Nonlinear Multiattribute Cost Functions. Applied Mathematics and Computation, Vol. 54, pp. 215-239, 1993.
23. Current, J.R., Revelle, C.S. and J.L. Cohon. An interactive approach to identify the best compromise solution for two-objective shortest path problems. Computers & Operations Research, Vol. 17, No. 2, pp. 187-198, 1990.
24. Granat, J. and F. Guerriero. The interactive analysis of the multicriteria shortest path problem by the reference point method. European Journal of Operational Research, Vol. 151, pp. 103-118, 2003.
25. Wierzbicki, A.P. A mathematical basis for satisficing decision making. Mathematical Modelling, Vol. 3, pp. 391-405, 1982.
26. Coles, S. Multivariate Extremes. Chapter 8 in An Introduction to Statistical Modeling of Extreme Values. (Springer Series in Statistics), Springer-Verlag, London, 2001.
27. Harwood, D.W., Viner, J.G. and E.R. Russell. Procedure for Developing Truck Accident and Release Rates for Hazmat Routing. Journal of Transportation Engineering, Vol. 119, No. 2, pp. 189-199, 1993.
28. List, G.F. Siting Emergency Response Teams: Tradeoffs Among Response Time, Risk, Risk Equity and Cost, pp. 117-134. In Moses, L.N. and D. Lindstrom (eds). Transportation of Hazardous Materials – Issues in Law, Social Science, and Engineering. Kluwer Academic Publishers, Boston, 1993.
29. U.S. Department of Transportation. Hazmat Safety & Security, Field Operational Test, Task 1: Risk/Threat Assessment. Federal Motor Carrier Safety Administration, Washington, DC, 2002.
Huang and Fery 12
LIST OF FIGURES
• FIGURE 1 Two-dimensional Pareto front with extreme efficient solutions and gap points. The lower plot shows how the isolines of function p→ max(w.f(p)) can be used to derive both types of solutions.
• FIGURE 2 Iterative search for well-spread Pareto-optimal solutions in a bi-dimensional objective space.• FIGURE 3 Attributes of the 11 paths selected by the proposed algorithm, and their distribution in terms of
travel time and risk compared to the other Pareto-optimal paths.• FIGURE 4 First 6 efficient routes from Jurong Island to Hougang Industrial Park.• FIGURE 5 The 5 additional routes from Jurong to Hougang and map of the approved roads.
Huang and Fery 13
FIGURE 1 Two-dimensional Pareto front with extreme efficient solutions and gap points. The lower plot shows how the isolines of function p → max(w.f(p)) can be used to derive both types of solutions.
Huang and Fery 14
FIGURE 2 Iterative search for well-spread Pareto-optimal solutions in a bi-dimensional objective space.
Huang and Fery 15
FIGURE 3 Attributes of the 11 paths selected by the proposed algorithm, and their distribution in terms of travel time and risk compared to the other Pareto-optimal paths.
Huang and Fery 16
FIGURE 4 First 6 efficient routes from Jurong Island to Hougang Industrial Park.
Huang and Fery 17
FIGURE 5 The 5 additional routes from Jurong to Hougang and map of the approved roads.
Recommended