United States Agency for International Development Cooperative Agreement No. EEM-A-00-06-00024-00
Global Climate Change: Carbon Reporting Initiative
The AFOLU Carbon Calculator
AFOLU CARBON CALCULATOR THE AFFORESTATION/ REFORESTATION TOOL:
UNDERLYING DATA AND METHODS
Winrock International
December, 2014
This publication was produced for review by the United States Agency for International Development.
Prepared by Winrock International under the Cooperative Agreement No. EEM-A-00-06-00024-00.

1 AFOLU CARBON CALCULATOR
AFOLU CARBON
CALCULATOR THE AFFORESTATION/ REFORESTATION TOOL: UNDERLYING
DATA AND METHODS
DISCLAIMER
The author’s views expressed in this publication do
not necessarily reflect the views of the United
States Agency for International Development or
the United States Government.
Cite report as:
Winrock International. 2014. AFOLU Carbon
Calculator. The Afforestation/Reforestation Tool:
Underlying Data and Methods. Prepared by Winrock
International under the Cooperative Agreement No.
EEM-A-00-06-00024-00.

2 AFOLU CARBON CALCULATOR
TABLE OF CONTENTS
List of Figures ...................................................................................................................................................................... 3
List of Tables ....................................................................................................................................................................... 3
1. Scope ........................................................................................................................................................................... 4
2. Applicability ................................................................................................................................................................ 4
3. Approach to the A/R tool ...................................................................................................................................... 4
4. Data Sources.............................................................................................................................................................. 4
4.1. Tropical Native Forests ................................................................................................................................. 4
4.2. Mangrove Forests ............................................................................................................................................ 5
4.3. Plantation Forests ............................................................................................................................................ 6
5. Uncertainty of Estimates ......................................................................................................................................... 6
5.1 Combining uncertainties for multiplication ................................................................................................. 8
5.2 Combining uncertainties for addition and subtraction ............................................................................. 9
6. Calculation Methods .............................................................................................................................................. 10
6.1. Chapman-Richards Model ........................................................................................................................... 10
6.2. Tropical Native Forests ............................................................................................................................... 11
6.3. Mangrove Forests .......................................................................................................................................... 12
6.4. Plantation Forests .......................................................................................................................................... 13
6.5. Hypothetical Example ................................................................................................................................... 14
7. Overriding Default Data ....................................................................................................................................... 15
8. References ................................................................................................................................................................ 15
ANNEX I-Native tropical forests ................................................................................................................................ 19
ANNEX II--Mangroves ................................................................................................................................................... 21
ANNEX III--Plantations .................................................................................................................................................. 22

3 AFOLU CARBON CALCULATOR
LIST OF FIGURES
Figure 1: Aboveground biomass accumulation curve for Rain Forest, fitted using 107 data points taken
from 20 studies of secondary forest . Upper and lower curves represent upper and lower bounds of
95% CI. ............................................................................................................................................................................... 11
Figure 2: Aboveground biomass accumulation curve for Moist Forest, fitted using 70 data points taken
from 9 studies of secondary forest. Upper and lower curves represent upper and lower bounds of 95%
CI. ........................................................................................................................................................................................ 11
Figure 3: Aboveground biomass accumulation curve for Dry Forest, fitted using four data points taken
from two studies of secondary forest. Upper and lower curves represent upper and lower bounds of
95% CI. ............................................................................................................................................................................... 12
Figure 4: Aboveground biomass accumulation curve for A/R mangrove forest, fitted using 18 data points
taken from eight studies of A/R mangroves. Upper and lower curves represent upper and lower bounds
of 95% CI. .......................................................................................................................................................................... 13
LIST OF TABLES
Table 1 Key parameters used to estimate the carbon benefits of afforestation / reforestation and an
assessment of their uncertainties ................................................................................................................................... 8
Table 2 Literature based growth parameters for estimating biomass accumulation in tropical forests
using a Chapman-Richards logistic growth equation. .............................................................................................. 12
Table 3 Tree species available in the A/R Tool per climate type and their respective modeled parameters
based on the Chapman-Richards equation. ............................................................................................................... 14
Table 4 Key information on literature about aboveground biomass of secondary tropical forest compiled
for developing growth models under the A/R tool. Values reported in literature are rounded to nearest
ton here. ............................................................................................................................................................................ 19
Table 5 Key information on mangrove biomass literature compiled for developing growth models under
the A/R tool. ..................................................................................................................................................................... 21
Table 6 Tree species available per climate zone that can be selected in the A/R tool. .................................. 22

4 AFOLU CARBON CALCULATOR
1. SCOPE
This document describes the underlying data sources and calculation methods employed in the
Afforestation/Reforestation (A/R) Tool of the AFOLU Carbon Calculator (http://afolucarbon.org/). The
A/R Tool is designed for project activities that aim at sequestering atmospheric carbon by planting
forests in non-forested areas.
2. APPLICABILITY
This A/R Tool is applicable to afforestation or reforestation activities that will sequester and store
atmospheric carbon. The forestation activities can be composed of plantings of heterogeneous native
species or monocultures of a single species. Most of the key commercial species employed in silvicultural
systems worldwide are included in the database.
Plantings of timber species along with agricultural species are not covered in this A/R Tool, but can be
included by using the Agroforestry Tool.
3. APPROACH TO THE A/R TOOL
The approach employed in the A/R Tool reflects an improvement from the standard IPCC Tier 1
approach, in which biomass carbon accumulates linearly for the first 20 years, after which the rate
declines to another lower constant rate. In the biomass accumulation rates are curvilinear directly
correlated to the time since tree establishment (age in years).
The A/R Tool employs models based on the Chapman-Richards growth equation (Richards 1959;
Pienaar and Turnbull 1973) to estimate the rate of aboveground biomass carbon accumulation in planted
forests, whether for native or commercial species.
Data from published literature were compiled and the Chapman-Richards growth model applied to
represent the rate at which carbon is sequestered in planted forests. The model captures slow carbon
accumulation at earlier ages, increasing as the forests mature, and peaking and tapering off when a
mature age is reached. The model’s slope and inflexion points vary by species and climate type.
4. DATA SOURCES
4.1. TROPICAL NATIVE FORESTS
An extensive literature search was conducted on the topic of biomass accumulation in secondary
tropical forests. Studies were included in the analysis only if details of the methodological approach,
including description of methods, were included.

5 AFOLU CARBON CALCULATOR
Information on average aboveground biomass stock of secondary forests was compiled from 31 selected
studies conducted on tropical forest stands of various ages following abandonment of the previous land
use. The study areas were categorized based on FAO ecological zones as follows:
Rain Forest: Tropical rainforest with no real dry season
Moist Forest: Tropical moist deciduous forest, subtropical moist deciduous forest, and tropical
mountain forests
Dry Forest: Tropical and subtropical dry forest
Studies were assigned to one of the three categories based knowledge of their location and precipitation
regime (details of data are in Annex 1).
The average of plot level values for aboveground biomass at a given stand age from the studies provided
data points for fitting the Chapman-Richards equation in the analyses. Data on total aboveground
biomass were associated with the respective climate type and plotted against stand age. These data were
used to derive values for the parameters MAX, k and m used in the Chapman Richards equation for
estimating aboveground tree biomass as a function of age in secondary forests in Dry Forest, Moist
Forest, and Rain Forest categories.
Below ground carbon stocks are derived using the following equation from Mokany et al (2006):
𝐵𝐺𝐶 = 0.489 ∗ 𝐴𝐺𝐶0.890
Where:
BGC = Below-ground carbon stocks (t C ha-1)
AGC = Above-ground carbon stocks (t C ha-1)
4.2. MANGROVE FORESTS
A literature review was conducted of published, peer-reviewed studies on the biomass accumulation
rates of A/R mangrove forests across various geographical regions. Around a dozen studies were
initially reviewed, but approximately half were discarded from the analysis due to issues with
methodological approach and applicability (e.g. experimentation with species composition, flooding
regimes, excavation of study sites, etc). Ultimately, eight studies on biomass accumulation in A/R
mangrove forests were selected. These studies assessed the growth of an array of mangrove species at
various ages, ranging from 2 to 28 years, conducted in seven geographical locations throughout the
world. Data on aboveground biomass, belowground biomass, plantation age, and total biomass in tons
of carbon per hectare (t C ha-1) were aggregated and analyzed to develop a growth model (details of
data are in Annex 2).

6 AFOLU CARBON CALCULATOR
4.3. PLANTATION FORESTS
Data on growth parameters for various species planted commercially were summarized for 61 countries
in FAO’s Global Planted Forests Assessment (2005). We have cross-referenced the countries in the
FAO database with the AFOLU Carbon Calculator database and selected the applicable species to such
countries. The species available for A/R project activities per climate zone and data are given in Annex 3.
The Mokany et al. (2006) equation described above is used to calculate the below-ground carbon stocks
in the roots.
5. UNCERTAINTY OF ESTIMATES
Uncertainty is a property of a parameter estimate and reflects the degree of lack of knowledge of the
true parameter value because of factors such as bias, random error, quality and quantity of data, state of
knowledge of the analyst, and knowledge of underlying processes. Uncertainty can be expressed as the
size of the half width of a specified confidence interval as a percentage of the mean value. For example, if
the area of forest land converted to cropland (mean value) is 100 ha, with a 95% confidence interval
ranging from 90 to 110 ha, we can say that the uncertainty in the area estimate is ±10% of the mean
(from GOFC-GOLD 2013).
Uncertainty is an unavoidable attribute of practically any type of data including land area and estimates of
carbon stocks and many other parameters used in the estimation of the AFOLU carbon benefits from
activities on the land. Identification of the sources and quantification of the magnitude of uncertainty will
help to better understand the contribution of each source to the overall accuracy and precision of the
final estimate.
The proper manner of dealing with uncertainty is fundamental in the IPCC and UNFCCC contexts. The
IPCC defines estimates that are consistent with good practice as those which contain neither over- nor
underestimates so far as can be judged, and in which uncertainties are reduced as far as practicable. The
first step in an uncertainty analysis is to identify the potential sources of uncertainty. Many sources are
possible including measurement errors due to human errors or errors in calibration; measurement
errors in the predictor variables; modelling errors due to inability of the model to fully describe the
phenomenon; parameter uncertainty, and residual uncertainty; erroneous definitions or classifications
that lead to double-counting or non-counting; unrepresentative samples; and variability resulting from
the use of samples rather than censuses. In this section, the potential sources of uncertainty are
identified and an assessment of their likely range of uncertainties used in the calculation of the carbon
benefit in this tool is presented (Table 1). A brief primer of the steps involved in assessing total
uncertainties for each carbon benefit estimate is provided with a couple of simple examples to
demonstrate the process. These analyses are not provided in the tools.
The reader is referred to the GOFC-GOLD 2013 sourcebook for more details on all sources of
uncertainty and how to reduce them. In general, with the use of current medium to high resolution
remote sensing data, the suite of algorithms for interpreting the imagery, and the standard methods for

7 AFOLU CARBON CALCULATOR
accuracy assessment of the products, data on land cover and land cover change are likely to be relatively
accurate for forest to non-forest, but less so for forest type of percent tree cover. Assessing
uncertainties in the estimates of C stocks, and consequently of C stock changes (i.e. the emission
factors), can be more challenging than estimating uncertainties of the area and area changes. This is
particularly true for tropical forests which are often characterized by a high degree of spatial variability
and therefore require additional resources to acquire samples that are adequate to produce accurate
and precise estimates of the C stocks in a given pool.
In addition to the uncertainties associated with each parameter, when parameters are combined as in
e.g. estimating emissions from combining area planted and carbon accumulation rates that vary by age,
then overall error of the product will change. Uncertainties in individual parameter estimates can be
combined using either (1) error propagation (IPCC Tier 1) or (2) Monte Carlo simulation (IPCC Tier 2).
Tier 1 method is based on simple error propagation, and cannot therefore handle all kinds of
uncertainty estimates. The key assumptions of Tier 1 method are (from GOFC-GOLD 2013):
estimation of carbon emissions and removals is based on addition, subtraction and multiplication
there are no correlations across parameters (or if there is, they can be aggregated in a manner
that the correlations become unimportant)
none of the parameter estimates has an uncertainty greater than about ±60%
uncertainties are symmetric and follow normal distributions
However, even in the case that not all of the conditions are satisfied, the method can be used to obtain
approximate results. In the case of asymmetric distributions, the uncertainty bound with the greater
absolute value should be used in the calculation. The Tier 2 method is based on Monte Carlo simulation,
which is able to deal with any kind of models, correlations and distribution. However, application of Tier
2 methods requires more resources than that of Tier 1.
The key parameters are low to medium uncertainty, with high certainty associated with younger forests
and tropical native dry forests. The low uncertainty for tropical rain and moist forests is due to the
relatively large data base for these forest types, whereas for tropical dry forests the data based is small.
The other parameter used in the calculations is area planted—it is assumed that this will be well known
with an uncertainty of about 5% or less.
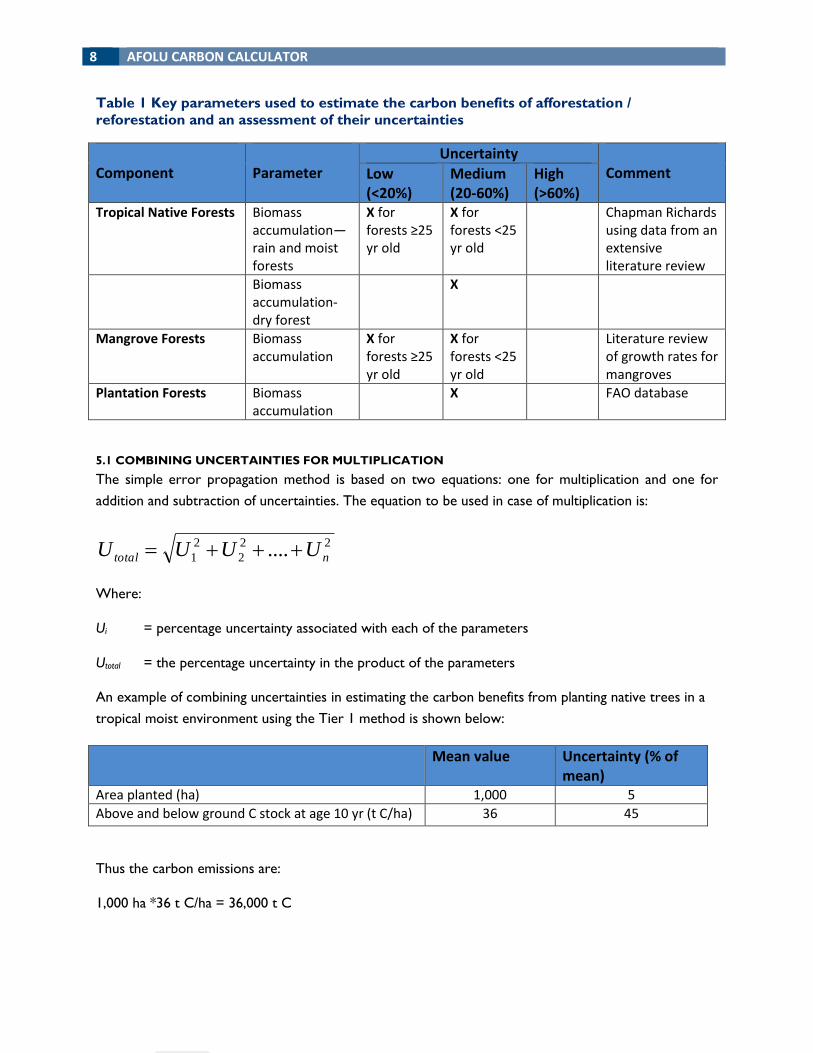
8 AFOLU CARBON CALCULATOR
Table 1 Key parameters used to estimate the carbon benefits of afforestation /
reforestation and an assessment of their uncertainties
Component
Parameter
Uncertainty Comment Low
(<20%) Medium (20-60%)
High (>60%)
Tropical Native Forests Biomass accumulation—rain and moist forests
X for forests ≥25 yr old
X for forests <25 yr old
Chapman Richards using data from an extensive literature review
Biomass accumulation-dry forest
X
Mangrove Forests Biomass accumulation
X for forests ≥25 yr old
X for forests <25 yr old
Literature review of growth rates for mangroves
Plantation Forests Biomass accumulation
X FAO database
5.1 COMBINING UNCERTAINTIES FOR MULTIPLICATION
The simple error propagation method is based on two equations: one for multiplication and one for
addition and subtraction of uncertainties. The equation to be used in case of multiplication is:
Where:
Ui = percentage uncertainty associated with each of the parameters
Utotal = the percentage uncertainty in the product of the parameters
An example of combining uncertainties in estimating the carbon benefits from planting native trees in a
tropical moist environment using the Tier 1 method is shown below:
Mean value Uncertainty (% of mean)
Area planted (ha) 1,000 5
Above and below ground C stock at age 10 yr (t C/ha) 36 45
Thus the carbon emissions are:
1,000 ha *36 t C/ha = 36,000 t C
22
2
2
1 .... ntotal UUUU

9 AFOLU CARBON CALCULATOR
And the uncertainty = %4554+5 22
5.2 COMBINING UNCERTAINTIES FOR ADDITION AND SUBTRACTION
In the case of addition and subtraction, for example when carbon emissions are summed up, the
following equation will be applied:
n
nn
totalxxx
xUxUxUU
...
*...**
21
22
22
2
11
Where:
Ui = percentage uncertainty associated with each of the parameters
xi = the value of the parameter
Utotal = the percentage uncertainty in the sum of the parameters
An example of this application is in the combination of carbon stock estimates (addition) shown below:
Therefore the total stock is 138 t C/ha and the uncertainty =
718113
7*%218*%3113*%11222
=±9%
Using this simple error propagation method is applicable to the calculations used in this AR tool. The
Monte Carlo type analysis is more complicated to apply, but gives more reliable results particularly
where uncertainties are large, distributions are non-normal, or correlations exist. Furthermore, Tier 2
method can be applied to models or equations, which are not based only on addition, subtraction and
multiplication. (The reader is referred to Chapter 5 of IPCC GPG LULUCF for more details on how to
implement the Monte Carlo analysis).

10 AFOLU CARBON CALCULATOR
6. CALCULATION METHODS
6.1. CHAPMAN-RICHARDS MODEL
The Chapman-Richards function is a widely applied and widely cited growth model. The function is a
sigmoid-shaped biological growth model and the field data are used to calibrate it to the growth rate of
the forest type. The model itself is simple and is defined on a case-by-case basis by fitting the input data.
The model is profoundly sound both statistically and professionally. This growth model was selected
because it requires minimum input from the users. Users are required to simply fill in the total area of
the A/R project activity and the management effectiveness (more details on the effectiveness rating
estimation can be found in the Effectiveness Tool) of the plantation. The effectiveness rating can be
overridden with proper justification if desired by the users.
Total Benefit (t CO2) = (AGC+BGC)
Above-ground Benefit (t CO2) = Area* (AGC) *(44/12)* Effectiveness
AGC = MAX* [1–EXP(-k* Age)]^[1/(1-m)]
Below-ground Benefit (t CO2) = Area* (0.489*AGC.890) *(44/12)* Effectiveness
Where:
Area = area of A/R project activity; hectares, ha
AGC = Above-ground carbon stock, t C ha-1
44/12 = conversion factor from carbon to carbon dioxide equivalent
Effectiveness = management effectiveness rating (%)
MAX = asymptote maximum peak biomass yield; tons dry mass per hectare, or t d.m. ha-1
k = parameter used in modeling tree growth; dimensionless
Age: = age of forest; years (user-defined)
m = parameter used in modeling tree growth; dimensionless
Parameters in blue can be entered by the user, while parameters in red have default values under
Advanced Inputs, but can be changed by the user. Parameters in black are fixed within the calculations.
The age of the forest is optional and can be entered under Advanced Inputs of the Tool, but if not
specified by the users, it will default to one year initially. Belowground biomass is estimated using
Mokany et al., (2006) root to shoot biomass ratios. Default IPCC conversion factors from biomass to
carbon and to carbon dioxide were used.
The data obtained from literature were stratified by forest type (native or commercial plantations –
various) and by climate type, and then used with the Chapman-Richards model to develop logistic
growth curves. A different growth model was developed for each forest type in its respective climate
region.

11 AFOLU CARBON CALCULATOR
6.2. TROPICAL NATIVE FORESTS
Three models were developed by climate types (Figures 1, 2 and 3). According to the model used,
highest maximum biomass was achieved by forests in the Rain Forest category, followed by forests in
the Moist Forest category. Forests in the Dry Forest category had the lowest biomass. Maximum
biomass values used to fit curves to data for each category were based on values found by Brown and
Lugo (1982) for mature forests. The biomass accumulation curve for forests in the Rain Forest category
(Figure 1) approaches a maximum of 370 t C ha-1.
Figure 1: Aboveground biomass accumulation curve for Rain Forest, fitted using 107 data
points taken from 20 studies of secondary forest . Upper and lower curves represent upper
and lower bounds of 95% CI.
The biomass accumulation curve for forests in the Moist Forest category (Figure 2) approaches a
maximum of about 290 t C ha-1, and an R2 value of 0.50.
Figure 2: Aboveground biomass accumulation curve for Moist Forest, fitted using 70 data
points taken from 9 studies of secondary forest. Upper and lower curves represent upper
and lower bounds of 95% CI.

12 AFOLU CARBON CALCULATOR
The biomass accumulation curve for forests in the Dry Forests category (Figure 3) approaches a
maximum of 90 tC ha-1.
Figure 3: Aboveground biomass accumulation curve for Dry Forest, fitted using four data
points taken from two studies of secondary forest. Upper and lower curves represent
upper and lower bounds of 95% CI.
Growth parameters developed for each of the three tropical forest types are summarized in Table 2.
Table 2 Literature based growth parameters for estimating biomass accumulation in
tropical forests using a Chapman-Richards logistic growth equation.
Forest type MAX k m
Rain Forest 370 0.035 0.40 Moist Forest 290 0.039 0.55 Dry Forest 90 0.037 0.50
Growth parameters for Dry Forest, Moist Forest, and Rain Forest are assigned to each administrative
unit based on the dominant FAO ecological zone in which non-forest area is located within the
administrative unit (according to a MODIS forest/non-forest land cover map).
6.3. MANGROVE FORESTS
A growth model for secondary mangrove forests was developed using the Chapman-Richards equation
applying data from the literature review (data are in Annex 2). The maximum biomass stock is assumed
is assumed to be 145 t C ha-1.

13 AFOLU CARBON CALCULATOR
Figure 4: Aboveground biomass accumulation curve for A/R mangrove forest, fitted using
18 data points taken from eight studies of A/R mangroves. Upper and lower curves
represent upper and lower bounds of 95% CI.
6.4. PLANTATION FORESTS
Species and climate specific logistic growth models based on the Chapman-Richards equation were
developed using the FAO (2005) data and the IPCC (2006) climate zones. First, a climate type was
associated to each administrative unit of countries in the AFOLU Carbon Calculator based on the IPCC
(2006) climate zones. Then countries recorded in the FAO (2006) database were cross-referenced with
countries in the AFOLU Carbon Calculator database, and species listed in such countries were selected
and a climate type associated based on the country of occurrence.
The parameters from the FAO database used in modeling biomass carbon accumulation on plantation
forests were: mean annual increment (m3 ha-1 yr-1), rotation length (years) and harvest volume (m3 ha-1).
Growth models were developed for each species in each admin unit based on the predominant climate
type in that admin unit. Various iterations of the model were ran with the input parameters available
per species, and the models that resulted in the greatest fit (greatest r2) were selected as the best
approach for each of the species. The species available for A/R project activities per climate zone along
with parameters modeled for estimating carbon accumulation are shown in Table 3.
-50.0
0.0
50.0
100.0
150.0
200.0
250.0
300.0
350.0
0 5 10 15 20 25 30 35 40 45
Bio
mas
s (t
C/h
a)
Stand age (yrs)
data points
tC/ha
95% CIUpper
r2 = 0.7

14 AFOLU CARBON CALCULATOR
Table 3 Tree species available in the A/R Tool per climate type and their respective
modeled parameters based on the Chapman-Richards equation.
Climate Type Species MAX K m
Cool temperate
Beech (Fagus) 350 0.021 0.63
Larch (Larix) 481 0.024 0.63
Spruce (Picea) 608 0.031 0.63
Pine all (Pinus) 186 0.027 0.63
Chestnut (Castanea) 177 0.072 0.63
Cunninghamia 222 0.113 0.63
Warm temperate
Pine all (Pinus) 251 0.098 0.63
Slash pine (Pinus elliotti) 178 0.101 0.63
Loblolly pine (Pinus taeda) 217 0.101 0.63
Pinus radiata 368 0.110 0.63
Tropical dry
Acacia all 65 0.158 0.63
Acacia nilotica 91 0.115 0.63
Acacia senegal 60 0.092 0.63
Acacia seyal 85 0.127 0.63
Ailantus excels 91 0.169 0.63
Cypress (Cupressus) 217 0.063 0.63
Khaya sp. 83 0.072 0.63
Teak (Tectona grandis) 81 0.063 0.63
Slash pine (Pinus elliotti) 260 0.085 0.63
Pinus patula 260 0.085 0.63
Pinus radiata 251 0.080 0.63
Tropical moist/wet
Agathis sp. 325 0.101 0.63
Araucaria angustifolia 356 0.127 0.63
Gmelina sp. 477 0.127 0.63
Rubber (Hevea brasiliensis) 244 0.169 0.63
Pine all (Pinus) 155 0.195 0.63
Mahogany (Swietenia macrophylla) 207 0.087 0.63
Teak (Tectona grandis) 315 0.056 0.63
Eucalyptus all 312 0.241 0.63
6.5. HYPOTHETICAL EXAMPLE
To illustrate how this tool works a hypothetical A/R project activity is presented: the project is planting
500 hectares of native forest species in Svay Rieng administration unit in Cambodia. First, users have to

15 AFOLU CARBON CALCULATOR
select the geographic location of the project, which in this example is in Svay Rieng, Cambodia, an admin
unit classified as Moist Tropical Forest.
The tool requires the user to enter the area of the A/R project activity — in this case 500 ha. Then the
user has to respond to a simple questionnaire to estimate the effectiveness rating of the A/R project
activity. In this example, planting has been completed, but the area has experienced flooding, which
caused some minor mortality of seedlings. No human or livestock incursion into the planted areas
happened, and the management practices of watering plants and controlling pests have been sufficient to
ensure full growth rates, resulting in an estimated effectiveness rating of 90%.
By entering the input parameters above in the equation, we have:
AGC = 290* [1–EXP(-0.039* 1)]^[1/(1-0.55)] = 0.205 t C ha-1
BGC = 0.489*AGC0.890 = 0.119 t C ha-1
Benefit (t CO2) = 500* (0.205+0.119)*(44/12)* 0.9
A/R Benefits = 535 t CO2e
In this example, the A/R project activity that is 90% effective in planting 500 ha of native forests in Svay
Rieng, Cambodia, has resulted in a carbon benefit of approximately 535 t CO2e for the first year.
7. OVERRIDING DEFAULT DATA
The ability to override the A/R Tool’s default database is very limited. Users may change:
The type of species planted: from native to mangrove or any of the plantation species according
to the climate type in which the A/R project activity is implemented
The age of the planted forest
The carbon accumulation rate of the planted forest
8. REFERENCES
Alves, DS, Soares, JV, Amaral, S, Mello EMK, Almeida, SAS, da Silva, OF, Silveira, AM. 1997. Biomass of
primary and secondary vegetation in Rondônia, Western Brazilian Amazon. Global Change Biology (3):
451-461.
Bartholomew, WV, Meyer, J, Laudelot, H. 1953. Mineral nutrient immobilization under forest and grass
fallow in the Yangambi (Belgian Congo) region. Publications de L’Institut National pour L’Étude
Agronomique du Congo Belge, Série Scientifique No. 57, 27 pp.
Brown, S, Lugo, AE. 1982. The storage and production of organic matter in tropical forests and their
role in the global carbon cycle. Biotropica 14: 16-187.

16 AFOLU CARBON CALCULATOR
Chazdon, R. 2003. Tropical forest recovery: Legacies of human impact and natural disturbances.
Perspectives in Plant Ecology, Evolution and Systematics (6): 57-71.
Chen L., Zeng X., Yam N.F.Y., Lu W., Luo Z., Du X., Want J. 2012. Comparing carbon sequestration
and stand structure of monoculture and mixed mangrove plantations of Sonneratia caseolaris and S.
apetala in Southern China. Forest Ecology and Management 284, 222-229.
Drew, WB, Aksornkoae, S, Kaitpraneet, W. 1978. An assessment of productivity in successional stages
from abandoned swidden (rai) to dry evergreen forest in northeastern Thailand. Forest Research
Bulletin No. 56, Kasetsart University, Bangkok.
Eaton, J, Lawrence, D. 2009. Loss of carbon sequestration potential after several decades of shifting
cultivation in the Southern Yucatan. Forest Ecology and Management 258: 949-958.
Ewel, JJ, 1971. Biomass changes in early tropical succession. Turrialba 21: 110-112.
Ewel JJ, 1975. Biomass of second growth tropical moist forest. Pp. 143-150 in Golley, FB, McGinnis, JT,
Clements, RG, Child, GI, Duever, MJ (eds). Mineral cycling in a tropical moist forest ecosystem.
University of Georgia Press, Athens, GA.
Ewel , JJ, Chai, P, Lim, MT. 1983. Biomass and floristics of three young second-growth forests in
Sarawak. The Malaysian Forester 46: 347-346.
FAO. 2005. Planted forests database: Global planted forests assessment. Available at:
http://www.fao.org/forestry/plantedforests/67507/en/
Feldpausch, T, Rondon, M, Fernandes, E, Riha, S, Wandelli, E. 2004. Carbon and nutrient accumulation
in secondary forests regenerating on pastures in Central Amazonia. Ecological Applications 14: 164-
176.
Folster, H, de las Salas, G. 1976. Litter fall and mineralization in three tropical evergreen stands,
Colombia. Acta Científica Venezolana 27: 196-202.
Folster, H, de las Salsa, G, Khanna, P. 1976. A tropical evergreen forest site with perched water table,
Magdalena Valley, Colombia. Biomass and bioelement inventory of primary and secondary vegetation.
Oecologia Plantarium 11. 297-320.
Fonseca, W, Rey, JM, Alice, FE. 2011. Carbon accumulation in the biomass and soil of different aged
secondary forests in the humid tropics of Costa Rica. Forest Ecology and Management 262: 1400-1408.
Greenland, DJ, Kowal, JML. 1960 Nutrient content of the moist tropical forest of Ghana. Plant and Soil
12 (2): 154-174.
Hughes, RF, Kauffman, JB, Jaramillo, VJ. 1999. Biomass, carbon, and nutrient dynamics of secondary
forests in a humid tropical region of Mexico. Ecology (80): 1892-1907.

17 AFOLU CARBON CALCULATOR
IPCC. 2006. Guidelines for National Greenhouse Gas Inventories. Volume 4: Agriculture, Forestry and
Other Land Uses. Prepared by the National Greenhouse Gas Inventories Programme, Eggleston H.S.,
Buendia L., Miwa K., Ngara T. and Tanabe K. (eds). Published: IGES, Japan. Volume 4 Agriculture,
Forestry and Other Land Use. Paustian, K, Ravindranath, N.H. and Van Amstel, A (coordinating lead
authors). Available at: http://www.ipcc-nggip.iges.or.jp/public/2006gl/vol4.html
Jepsen, M. 2006. Above-ground carbon stocks in tropical fallows, Sarawak, Malaysia. Forest Ecology and
Management (225): 287-295.
Johnson, C, Zarin, D, Johnson, A. 2000. Post-disturbance aboveground biomass accumulation in global
secondary forests. Ecology 81(5): 1395-1401.
Johnson, CM, Vieira, ICG, Zarin, DJ, Frizano, J, Johnson, AH. 2001. Carbon and nutrient storage in
primary and secondary forests in eastern Amazônia. Forest Ecology and Management (47):2425.
Kairo J.G., Bosire J., Langat J., Kirui B., Koedam N. 2009. Allometry and biomass distribution in
replanted mangrove plantations at Gazi Bay, Kenya. Aquatic Conservation: Marine and Freshwater
Ecosystems 19, S63-S69.
Kairo J.G., Lan'at J.K.S., Dahdouh-Guebas F., Bosire J., Karachi M. 2008. Structural development and
productivity of replanted mangrove plantations in Kenya. Forest Ecology and Management 255, 2670-
2677.
Kauffman, J, Hughes, R, Heider, C. 2009. Carbon pool and biomass dynamics associated with
deforestation, land use, and agricultural abandonment in the neotropics. Ecological Applications 19(5):
1211-1222.
Kenzo, T, Ichie, T, Hattori, D, Kendawang, JJ, Sakurai, K, Ninomiya, I. 2010. Changes in above- and
belowground biomass in early successional tropical secondary forests after shifting cultivation in
Sarawak, Malaysia. Forest Ecology and Management (260): 875-882.
Komiyama A., Ong J.E., Poungparn S. 2008. Allometry, biomass and productivity of mangrove forests: a
review. Aquatic Botany 89, 128-137.
Lawrence, D. 2005. Biomass accumulation after 10-200 years of shifting cultivation in Bornean rain
forest. Ecology 86: 26-33.
Maury-Lechon, G. 1982. Regeneration forestière en Guyane francaise: recur sur 25 ha de coupe
papetière en fôret dense humide (Arbocel). Revue Bois et Fôrets des Tropiques 197 (3): 3-21.
Mokany, K., R. J. Raison, and A. S. Prokushkin. 2006. Critical analysis of root:shoot ratios in terrestrial
biomes. Global Change Biology, 12: 84-96.
Nye, PH, Greenland, DJ. 1960. The soil under shifting cultivation. Technical Comment No. 51.
Commonwealth Bureau of Soils, Harpenden, England.

18 AFOLU CARBON CALCULATOR
Omeja, P, Obua, J, Rwetsiba, A, Chapman, C. 2012. Biomass accumulation in tropical lands with
different disturbances histories: Contrasts within one landscape and across regions. Forest Ecology and
Management 269: 293-300.
Pienaar, L.V. and K.J. Turnbull. 1973. The Chapman-Richards Generalization of Von Bertalanffy’s
Growth Model for Basal Area Growth and Yield in Even-Aged Stands. Forest Science 19 (1): 2-22.
Read, L, Lawrence, D. 2003. Recovery of biomass following shifting cultivation in dry tropical forests of
the Yucatan. Ecological Applications 13: 85-97.
Ren H., Chen H., Li Z., Han W. 2009. Biomass accumulation and carbon storage of four different aged
Sonneratia apetala plantations in Southern China. Plant Soil 327, 279-29.
Richards, F.J. 1959. A flexible growth function for empirical use. Journal of Experimental Botany
10(29):290-300.
Sabhasri, S. 1978. Effects of forest fallow cultivation on forest production and soil. Pp. 160-184. In
Kunstadter, P, Chapman, EC, Sabhasri S. (eds). Economic development and marginal agriculture in
northern Thailand. University Press of Hawaii, Honolulu.
Silver, W, Ostertag, R, Lugo, A. 2000. The potential for carbon sequestration through reforestation of
abandoned tropical agricultural and pasture lands. Restoration Ecology (8): 394-407.
For questions and comments:
Felipe M. Casarim Carbon Specialist, Ecosystem Services
Winrock International | 2121 Crystal Drive, Suite 500 | Arlington, VA 22202, USA | www.winrock.org
office 703.302.6538 | fax 703.302.6512 | e-mail [email protected]

19 AFOLU CARBON CALCULATOR
ANNEX I-NATIVE TROPICAL FORESTS
Table 4 Key information on literature about aboveground biomass of secondary tropical
forest compiled for developing growth models under the A/R tool. Values reported in
literature are rounded to nearest ton here.
Country Average Annual
Precipitation (mm/yr)
Climate Type
Disturbance History
Biomass (t/ha) Reference
Min Max
India 964 DF Cleared - 64 Singh 1975
Uganda 1707 DF Shifting cultivation
17 34 Omeja et al. 2012
Mexico 900, 1150 MF Shifting cultivation
11 98 Read and Lawrence 2003
Mexico 900, 1150 MF Shifting cultivation
8 30 Eaton and Lawrence 2009
Nigeria 1830 MF Shifting cultivation
3 - Nye and Greenland 1960
Ghana 1650 MF Cultivated 30 - 50 yrs
- 219 Greenland and Kowal 1960
Guatemala 1972 MF Shifting cultivation
4 14 Tergas and Popenoe 1971
India 2200 MF Shifting cultivation
5 148 Toky and Ramakrishnan 1983
Thailand 1150 MF Shifting cultivation
5 60 Drew et al. 1978
Thailand 1400 MF Shifting cultivation
26 63 Sabhasri 1978
Vietnam 1277 MF Shifting cultivation
4 109 Tran et al. 2010
DRC 2000 RF Shifting cultivation
11 122 Bartholomew et al. 1953
Brazil 1750 RF Pasture 1 87 Uhl et al. 1988
Brazil 2290 RF Cropland 4 176 Alves et al. 1997
Brazil 2500 RF Slash-and-burn agriculture
50 120 Johnson et al. 2001
Colombia 3000 RF Cleared and burned not cultivated
19 203 Folster and de las Salas 1976, Folster et al. 1976
Colombia and Venezuela
3500 RF Slash-and-burn agriculture
44 197 Saldarriaga et al. 1988
French Guiana 2588 RF Clear cut for - 33 Maury-Lechon

20 AFOLU CARBON CALCULATOR
Country Average Annual
Precipitation (mm/yr)
Climate Type
Disturbance History
Biomass (t/ha) Reference
Min Max
logging 1982
Guatemala 2000 RF Shifting cultivation
8 72 Snedaker 1970
Malaysia 2800 RF Shifting cultivation
- 99 Kenzo et al. 2010
Malaysia 3577 RF Shifting cultivation
4 57 Jepsen 2006
Mexico 3640 RF Cut and cleared, cultivated 1 year
4 44 Williams-Linera 1983
Panama 2000 RF Shifting cultivation
13 57 Ewel 1971, 1975
Peru 2200 RF Cropland 9 16 Szott et al. 1994
Venezuela 3520 RF Shifting cultivation
58 150 Saldarriaga et al. 1986
Venezuela 3520 RF Shifting cultivation
7 34 Uhl 1987
Brazil 1825 RF Shifting cultivation
51 136 Salimon and Brown 2000
Brazil 2200 RF n.a. 16 128 Feldpausch et al.
2004
Costa Rica 5130 RF Agriculture 29 103 Fonseca et al. 2011
Malaysia 4200 RF Shifting cultivation
20 50 Ewel et al. 1983
Mexico 4000 RF Cropland and pasture
23 292 Hughes et al. 1999
RF: Rain Forest; MF: Moist Forest; DF: Dry Forest

21 AFOLU CARBON CALCULATOR
ANNEX II--MANGROVES
Table 5 Key information on mangrove biomass literature compiled for developing growth
models under the A/R tool.
Authors Geographic Location Mangrove Age
(yr) Total Biomass*
t C ha-1
Chen et al. (2012) Shenzhen Bay, Guangdong Province, China
2 31.44
2 18.74
2 26.46
Ren et al. (2009) Leizhou Bay, South China
4 22.51
5 33.70
8 45.07
10 50.81
Liaoa Qiongshan, Hainan, China
6 23.63**
6 12.28**
11 18.05**
Zana Futian, Guangdong, China 6 30.88**
Kairo et al. (2009) Gazi Bay, Kenya
5 12.43**
8 7.18**
5 4.11**
8 2.27**
Kairo et al. (2008) Gazi Bay, Kenya 12 65.50**
Ong J.E.b Matang, Malaysia 28 130.01**
Christensen B.b Phuket, Thailand 15 97.60** *The carbon fraction of biomass of 47% was used.
**BGB estimated using average R/S ratio of 0.31 generated from Chen L. et al (2012) and Ren H. et al.
(2009) BGB values.
a Source of this data is Ren et al. (2009)
b Source of this data is Komiyama et al. (2008)

22 AFOLU CARBON CALCULATOR
ANNEX III--PLANTATIONS
Table 6 Tree species available per climate zone that can be selected in the A/R tool.
Climate Type Species
Cool temperate
Beech (Fagus)
Larch (Larix)
Spruce (Picea)
Pine all (Pinus)
Chestnut (Castanea)
Cunninghamia
Warm temperate
Pine all (Pinus)
Slash pine (Pinus elliotti)
Loblolly pine (Pinus taeda)
Pinus radiata
Tropical dry
Acacia all
Acacia nilotica
Acacia senegal
Acacia seyal
Ailantus excels
Cypress (Cupressus)
Khaya sp.
Teak (Tectona grandis)
Slash pine (Pinus elliotti)
Pinus patula
Pinus radiata
Tropical moist/wet
Agathis sp.
Araucaria angustifolia
Gmelina sp.
Rubber (Hevea brasiliensis)
Pine all (Pinus)
Mahogany (Swietenia macrophylla)
Teak (Tectona grandis)
Eucalyptus all
Recommended