A LEGIBILITY EQUATION FOR DETERMINING IDEAL VIEWING AREAS IN LECTURE HALLS
by
Hongyi Cai
A dissertation submitted in partial fulfillment of the requirements for the degree of
Doctor of Philosophy (Architecture)
in The University of Michigan 2008
Doctoral Committee:
Associate Professor Jong-Jin Kim, Chair Emeritus Professor Leon A. Pastalan Professor Jean D. Wineman Research Professor Paul A. Green

© Hongyi Cai 2008
All Rights Reserved

ii
ACKNOWLEDGEMENTS
I wish to thank those people who have helped this dissertation study including:
1. Prof. Jong-Jin Kim. As my dissertation committee chair and academic
advisor, Prof. Kim over the past 4 years has devoted tremendous effort to all
aspects of this dissertation research study. I deeply appreciate his help in both
my academic and personal life from the bottom of my heart.
2. Prof. Paul A. Green. Prof. Green has worked closely with me for over 3
years on every detail of this study. He has provided laboratory, facilities, and
equipments, and has also cooperated on financial aid applications and
publications. My endless appreciation is due to Prof. Green.
3. Prof. Jean Wineman. Prof. Wineman has supported this study in applying for
funding, process supervision, and academic guidance.
4. Prof. Leon Pastalan. Prof. Pastalan has guided this study in terms of
architecture and the human factors, particularly the aging effort on legibility.
5. Dr. Michael Flannagan and Mr. Brandon Schoettle. They have provided
access to the laboratory supplies and the luminance meter.
Moreover, the most cordial thanks are due to my wife, Dongmiao, my parents and
parents-in-law, my sisters and brothers-in-law, and all other family members in China,
who have sustained me regardless of my situation.

iii
TABLE OF CONTENTS
ACKNOWLEDGEMENTS……………….………………………………………………ii
LIST OF FIGURES……………………..………………………….……………………vii
LIST OF TABLES………...………………….……………..…………………..………xvi
LIST OF APPENDICES……...…………………….………………..……………..….xviii
ABSTRACT…………………………………...…………………..…………..……..…xix
CHAPTER
1 Introduction…………………………………………….……………………………1
1.1 Background
1.2 Purposes of the Study
1.3 Significance of the study
1.4 Framework of the study
1.5 Assumptions and Limitations
1.6 Summary

iv
2 Literature Review…………………….……….……………………………………15
2.1 Fundamental Theories on Visual Perception of Text
2.2 Architectural Guidelines for Determining Ideal Viewing Areas of Lecture Halls
2.3 A Review of 95 Legibility Equations
2.4 Summary
3 Research Problems and Steps to Their Solutions…………….....………………….60
3.1 Research Problems
3.2 Steps to Solve These Problems
3.3 Summary
4 Step 1: Survey of Lecture Halls……………...…………..………………………...71
4.1 Lecture Halls Selected for Survey
4.2 Procedure and Equipments
4.3 Viewing Conditions Surveyed in the 38 Lecture Halls
4.4 Summary

v
5 Step 2: Derivation of an Equation to Predict the Spatial Legibility of Text and Its Verification…...……………….…..……………………….82
5.1 Derivation of an Equation to Predict the Spatial Legibility of Text
5.2 Verification of the Derived Equation
5.2.1 Physiological and Photochemical Foundation
5.2.2 Pilot Experiment
5.2.3 Main Experiment
5.3 Improvement of the Derived Equation
5.4 Summary
6 Step 3: Testing Ambient Light Effect on Legibility of Text……..……..………...147
6.1 Theoretical Foundation for the Ambient-Light Hypothesis
6.2 Laboratory Experiment to Test the Ambient-Light Hypothesis
6.3 Summary
7 Step 4: A Computation Program and Its Application in Lecture Halls…………...163
7.1 Development of a Computation Program
7.2 Architectural Application of the Computation Program in Lecture Halls
7.3 Verification of the Computation-Program-Aided Design Method
7.4 Summary

vi
8 Conclusions……………………...……..………………..………………………..201
8.1 Key Outcomes of the Study
8.2 Architectural Implications of the Key Outcomes and Their Limitations
8.3 Recommendations for Future Research
APPENDICES……………………………………………….…………………………215
REFERENCES………………………………………...……………………………….249

vii
LIST OF FIGURES
Figure
1 Private tutorial space led by Confucius………..…….…………………………..2
2 Illustration of the ideal viewing area for reading a single viewing material at the same legibility level…………………….……………....7
3 Framework of this study………………………...…………………..………….11
4 Cross-sectional diagram of the human eye in recognizing the letter A……..….17
5 Layers of the retina in center fovea……………………………………………..17
6 Spatial mosaic of cones in the fovea………………...………………………….18
7 Retinal images of text (E, S) and a disc formed in the fovea with underlying activated cones (bright spots)…………...…………………….19
8 Field luminance vs. pupil size……………..……………………………………23
9 Log visual acuity as a function of log pupil diameter………..…………………23

viii
10 Age-related variation of visual acuity…………………………………………..25
11 CIE Standard Photopic Observer (solid line), representing the relative spectral sensitivity of the cones……...…………………………….26
12 Relative energy level required to produce perceptions of equal brightness for an observer adapted to multiple luminance levels………...………………..27
13 Best current estimates of the amount of light transmitted by the ocular media as a function of wavelength……………..………………………..27
14 Ideal horizontal viewing area of matte projection screen………...…………….33
15 Horizontal ideal viewing area of text presented at a single point on a matte screen……………………..…………………………………..35
16 Overlapped ideal viewing area (shadowed area) of a whole single screen……..36
17 Different shapes of the overlapped horizontal ideal viewing area (shaded) of three matte screens symmetrically mounted on one plane with equal spacing…………………………………………………...37
18 Different shape and size of the horizontal ideal viewing area (shaded) of three matte screens symmetrically mounted on three different planes with equal spacing……………………………………….38
19 Ideal viewing area of TV monitors with different mounting heights…...………39
20 Overlapped ideal viewing area (shaded) of multiple random displays…...…….40

ix
21 Ideal longitudinal section profiles of lecture halls………………...……………41
22 Ascending profile for the seats that provide good viewing for the projection……………………………….……………………………….42
23 Typical longitudinal section profiles of lecture halls with large capacity to obtain both good viewing conditions and satisfactory acoustical performance………….…………………………………43
24 Example of sightline construction…………………………...…………………44
25 Distribution of 77 legibility equations by year…………...…………………….47
26 Range of target luminance explored in the supporting research of Equations 4, 43, 56, 66, 67, 69, 70, 76, 92, and 93 as listed in Appendix C…………………...…………………………………….48
27 Range of background luminance explored in the supporting research of Equations 43, 57, 58, 63, 69, 70, and 88 as listed in Appendix C……..……….49
28 Range of illuminance explored in the supporting research of Equations 31-36, 39, 40, 69-78, 80-85, 88 and 91 as listed in Appendix C……………….50
29 Horizontal and vertical ideal viewing area of text……………...………………62
30 Three-dimensional ideal viewing sphere of a single text………...……….…….63
31 Ideal viewing area of a single text along the viewing plane at the observer’s eye height parallel to the sloped floor in lecture hall, obtained by slicing the 3D ideal viewing sphere with this viewing plane………………...……………………………………….63

x
32 A 300 ft fiber glass tape and a 50 ft sonic laser tape to measure distance, and a recently calibrated Minolta LS-100 luminance meter to measure the brightness…………...………………………..74
33 Example pattern for measuring the background luminance (Lb) of text presented on a display that is 4 m wide by 3 m high…...………………….75
34 Example pattern for measuring the surrounding luminance (Ls) of text presented on a display that is 4m wide by 3.5m high, measuring points are distributed inside the viewing field (120 ×35 ) of the observer’s binocular eyes……………..……………………75
35 Surveyed maximum viewing distance Dmax in all 38 lecture halls, At a range 9.96 m-25.74 m with an average 15.50 m…………...…...…………77
36 Surveyed maximum horizontal viewing angle φmax, maximum vertical viewing angle αmax, and maximum incident angle ξmax in all 38 lecture halls………………….……………………78
37 Range of background luminance Lb of text presented on all visual media in the 38 lecture halls except for projection screens……...……………..79
38 Range of surrounding luminance Ls measured in the 38 lecture halls…...……..80
39 Definition of solid angle ω…………………………...…………………………83
40 Different measurements of normal area A: text (A=W×H), graphics with established forms (A=W ×H ), and random graphics (A=summation of all details)…………….………………84
41 Off-the-display-axis viewing of target and the incident angle ξ……...………...85
xi
42 Illustration of the constant-solid-angle hypothesis……………..………………87
43 Spatial mosaic of the retinal images of letter A and B, when viewed perpendicularly or not, as well as their underlying activated cones……..……..92
44 Solid angles subtended by targets with different orientations viewed at different distances, and those subtended by their retinal images…………….95
45 Constant area of retinal images of a legible disk viewed with different orientations or different normal size at different viewing distances……....……96
46 Lighting laboratory at UMTRI………………………...…….………………….98
47 Experimental settings in the laboratory at UMTRI…………..…………………99
48 Illustration and verification of the experimental set up matches that claimed by the constant-solid-angle hypothesis……………..……..…….100
49 Dimmable fluorescent fixture (two T8 tubes, daylight) with simulated ideal diffusive surface, and 7 horizontal and 7 vertical viewing angles…...….102
50 Luminance meter mounted on a tripod in the pilot experiment………….……104
51 Index of legibility difficulty for standard highway alphabet letters A-Z….......105
52 A total of 49 E-chart sheets used as viewing materials in the pilot experiment………………………………………………..……….106
53 Minimum angle of resolution (MAR) subtended by the threshold legible stroke to the effective center of the eye’s optics………..………..……107

xii
54 Two levels of ambient light provided in the pilot experiment when text is viewed perpendicularly………………...………………………..……..111
55 Letter Es with different contrast adjusted from 0-100 in AutoCAD……..…....112
56 Snellen chart and eyesight E-chart used to screen potential subjects according to the requirements………………...………...…………....114
57 Background luminance of letter Es viewed at different incident angles under two different levels of ambient light (zero, or that by T12 lamps), at mean 187.5 cd/m2 with standard deviation 5.5 cd/m2……………………....121
58 Threshold legible height of letter Es viewed at different incident angles under two different levels of ambient light (zero, or that by T12 lamps)…......122
59 Solid angles subtended by the threshold legible letter Es viewed at different incident angles under two different levels of ambient light (zero, or that by T12 lamps)…………………………..……………..…..123
60 Revised experimental settings in the main experiment…………………..……127
61 No coverage (left) and coverage (right) of the bright fringe of the dimmable fixture surface, using a dark cloth strip………...………………..…128
62 Viewing scenarios of 16 tests in the laboratory with constant background luminance Lb=120.7 cd/m2, image contrast C%=97.9, and zero ambient light……………………………………………...………….131
63 Mean background luminances of E-charts viewed at each of 16 tests…..……132

xiii
64 Random order of 12 tests in the main experiment in the later three sessions, and the fixed order of the four tests (0 , 30 , 60 , 75 ) in the first session, as indicated by the dash line…………………..………….134
65 Threshold legible heights of letter Es recognized at 16 incident angles by subjects at different eyesight levels (20/20, 20/16, 20/12.5)…...............….135
66 Calculated solid angles subtended by the threshold legible letter Es recognized at 16 incident angles by 20 subjects at three eyesight levels………………………………..……………………….136
67 Ratios of the observed threshold legible heights of letter Es to the predicted ones versus 16 incident angles……………..……………………….138
68 Ratios of the solid angles subtended by these observed threshold legible letter Es to the predicted ones to hold the constant-solid-angle hypothesis versus 16 incident angles…………….……………………………138
69 Simple scattergram of Hobserved / Hpredicted ratios versus 16 incident angles..…..139
70 Simple scattergram of the ωobserved/ωpredicted ratios versus 16 incident angles…141
71 Surrounding luminance in the field of view…………...……………………...149
72 Modified laboratory settings to test the ambient-light hypothesis………...…..151
73 Four levels of ambient light provided in the experiment…………..………….152
74 Range of background luminance of four tests in the experiment by each subject at different eyesight levels (20/20, 20/16, or 20/12.5), at mean 124.2 cd/m2 with standard deviation of 0.66 cd/m2……….…………156

xiv
75 Legible heights of letter Es at different ambient light levels……….…………161
76 The 3D ideal viewing space of a single letter E with normal orientation, and recognized by a young observer with 20/20 eyesight………...…………..173
77 For comparison to the one plotted using (36), shape of the 3D ideal viewing space of the same letter E plotted using (37) before improvement of the algorithm…………………………………………176
78 Plan view and section views of the 3D ideal viewing space of the single letter E as shown in Fig.77 previously…………..……………………..178
79 Plan and section view of the 3D ideal viewing space of the single letter E as shown in Fig.76 previously……………………..…………..180
80 Nine points where text is presented to calculate the overlapped 2D ideal viewing are of a single visual medium……………..…….………….183
81 Sample lecture hall inside of which text is presented on three visual media and viewed by observers located along the viewing plane parallel to the sloped floor…………...……………...185
82 Predicted overlapped 2D ideal viewing area of text presented on whiteboard, projection screen, and tack board, simultaneously viewed by an observer with 20/20 eyesight who sits along the sloped floor with his eyes at 1.2m above the floor………….……….………..188
83 Ideal viewing area used to arrange seats in the sample lecture hall, viewed along the plane parallel to the sloped floor at eye height 1.2 m…...….189
84 Experimental settings in the lecture hall………...…………………………….192

xv
85 E-charts as the viewing materials……………………..………………………193
86 Predicted ideal seat location in the lecture hall as the overlapped small area………………………..…………………………195
87 Observed ideal seat locations chosen by the 21 subjects……………..……….198
xvi
LIST OF TABLES
Table
1 Classification of 95 legibility equations into 9 categories……...…..…………..46
2 Qualitative lighting conditions preset in some legibility equations…………….50
3 Explored ranges of contrast in the supporting research…...………...………….51
4 Explored horizontal and vertical viewing angles….……………...…...………..52
5 Explored color contrast in the previous legibility equations….……….……….53
6 Different types of viewing media examined in supporting research...……...….55
7 Surface luminance of projection screens measured in 6 lecture halls..……...…79
8 Total of 16 incident angles ξ examined in the pilot experiment.……….…..…103
9 Heights of 7 lines of letter Es on E-charts viewed perpendicularly……...…....109

xvii
10 MAR and geometries of eyesight E-chart…………..……...………………….115
11 Preset values of non-examined factors in the pilot and main experiments…………………...……………………..….116
12 A total of 32 tests in the pilot experiment………………………….………...117
13 Total 16 incident angles ξ examined in the main experiment………...…...…..129
14 Procedure and duration of the main experiment……………..………………..132
15 Predicted threshold legible heights of letter Es at 16 incident angles and the predicted solid angles subtended by these threshold legible letter Es at three eyesight levels to hold the constant-solid-angle hypothesis………………..………………….140
16 Steps to carry out the experiment and duration…………..……...……………154
17 Measured surface luminances in cd/m2 and their contribution (Lambient) to the adaptation luminance………………...……………………….158
18 Calculated adaptation luminances and the contribution of ambient light in the whole surrounding environment at each test…..……...…………..159
19 Geometries of three viewing materials………………….…………………….186

xviii
LIST OF APPENDICES
APPENDIX
A Guidelines for Achieving Favorable Viewing Conditions in Lecture Halls…..216
B Glossary of All Signs Used in This Study, Particularly the 95 Legibility Equations Listed in Appendix C………….………………...218
C Comparison of Existing 95 Legibility Equations……………………………..222
D Total of 38 Surveyed Lecture Halls…………………..………………………231
E Surveyed Viewing Conditions of Text Presented in the 38 Lecture Halls…....234
F Predicted Ranges of Height of 7 Lines of Letter Es on E-Charts Viewed by Observers with Eyesight 20/20, 20/16, and 20/12.5 at a Total of 25 Incident Angles………………...…………………………….237
G Code of the Computation Program Developed in MatLab……...……………240

xix
ABSTRACT
A LEGIBILITY EQUATION FOR DETERMINING IDEAL VIEWING AREAS IN LECTURE HALLS
by
Hongyi Cai
Chair: Jong-Jin Kim
Text presented in modern lecture halls often simultaneously appears on multiple visual
media (e.g., blackboard, projection screens, TV) that have different locations, geometries,
orientations, and lighting conditions. An ideal viewing area inside which all text is legible
to the entire audience is needed for appropriate seating arrangement in lecture hall design.
This area has been roughly defined by the architectural guidelines summarized from the
experience gained in practice as a fan-shaped plan. For better accuracy and reliability,
this ideal viewing area could be calculated using equations that predict the spatial
legibility of text viewed from any directions across the lecture hall. Among the 95
legibility equations ever published in the literature, only the Reinwald formula (pre-1980)
examines not-perpendicular-to-the-display viewing situations, but it fails to examine all
factors that are usually considered. Thus, a new equation is needed.

xx
This study first uses ten assumptions to narrow down the research scope as achromatic
text (fonts not examined) with high pixel resolution presented on matte surfaces under
uniform and glare-free fluorescent lighting and recognized by subjects aged 20-29 with
threshold (just readable) 100% accuracy. Then, this study applies a hypothesis — the
solid angle subtended by the legible viewing target (not only text) is a constant at
different viewing angles (perpendicular or not) under the same viewing condition — to
develop the demanded equation from the existing Howett’s equation (1983). This derived
equation examines seven critical factors: acuity; viewing distance; viewing angles; visual
angle of text; text height, width, and strokewidth; luminance contrast; and target,
background, and surrounding luminance. Unfortunately, it does not examine the
surrounding luminance of the ambient environment, which may reduce its accuracy.
The constant-solid-angle hypothesis is verified consistent with how retinal images of text
activate cones in the centre fovea of an observer’s eyes. In addition, this hypothesis is
tested in the lighting laboratory at the University of Michigan Transportation Research
Institute using legibility data collected from 3 human subjects participating in a pilot
experiment and 20 subjects participating in the follow-up main experiment. Both
experimental setups abide by the typical viewing conditions surveyed in 38 lecture halls
at the University of Michigan. In the main experiment, each subject sits in a fixed chair
for about 100 minutes (157 minutes in the pilot experiment) with head on a chin rest to
recognize the orientations of letter Es on 16 exchangeable E-chart sheets installed 20 feet
away at 16 incident angles. The outcomes show that the constant-solid-angle hypothesis
holds when 0 ξ 65.7 , but it does not hold when 65.7 < ξ 82.8 (the largest angle

xxi
examined in this study). Based on these outcomes, the derived equation is thus
accordingly improved.
To test the influence of ambient light on legibility of text, this study develops a second
hypothesis from an equation proposed by Moon and Spencer (1945) that calculates the
adaptation luminance of viewing environment. This hypothesis claims that ambient light
in the viewing environment should have a small influence (less than 9%) on the legibility
level of text viewed with constant background luminance and luminance contrast in a
glare-free environment. The ambient-light hypothesis is then tested in the same
laboratory using 20 human subjects with a modified setup at four different ambient light
levels. The collected legibility data show that changing the ambient light levels of the
viewing scenario does not affect the threshold legible (with 100% accuracy) heights of
letter Es viewed at stable 124.2 cd/m2 and constant contrast (C%= 97.91).
The validated equation is then improved to expand its examined incident angle ξ from
0 - 82.8 to the entire range of 0 - 90 , by assuming zero legibility distance of text viewed
in lecture halls when 82.8 <ξ 90 , based on two facts. The improved equation is then
used as the underlying algorithm for developing a computation-program-aided design
method in MatLab. This method allows architects to find an overlapped two-dimensional
ideal viewing area of text viewed in modern lecture halls along any viewing plane, such
as that parallel to the sloped floor at eye height level. Before this method can be
recommended for practice, it is verified using a field experiment carried out in the lecture
hall in the Art & Architecture building at the University of Michigan. This method proves

xxii
accurate and reliable when17 of the 21 subjects choose the predicted seat during the test,
three other subjects choose the immediately adjacent seat of the predicted one.
The key outcomes of this study — the derived legibility equation, the preliminary
computation program, and the finding that ambient light has a negligible effect on the
legibility of text — can help architects and interior designers design new lecture halls or
improve existing ones with enhanced legibility, lighting quality, and energy saving.
Continuous research studies over the next 5-10 years will first solve the deficiencies in
the preliminarily developed computation program, and then overcome the ten
assumptions used here to examine more types of real viewing situations in architecture
and other fields.

1
CHAPTER 1
Introduction
Characters have been used to impart information to people ever since they were
invented, for example, in ancient Rome, Greece, or China. To serve their purpose,
characters must be legible to the intended viewers at a large enough size and contrast. An
ideal geometrical relationship also exists between the observers and the visual media on
which characters are presented. Basically, observers must not be too far away from the
characters to miss details, and too off axis (i.e., off the display normal) to extremely
distort the characters thus losing useful information. Finding the ideal viewing distances
and viewing angles of characters presented in large spaces will help architects and other
professionals determine seating arrangements. The instructional spaces are typically large
spaces where characters are commonly presented in the front and recognized by a large
number of observers.
In China, the instructional spaces can be traced back to the tutorial space led by
Confucius, an ancient Chinese philosopher (551 B.C. - 479 B.C.), as illustrated in Figure
1. Later, four famous instructional spaces called “Shu Yuan” were built from 484 to 1009,
which have survived a long history, including (a) Song Yang Shu Yuan (嵩阳书院),

2
(b) Bai Lu Dong Shu Yuan (白鹿洞书院), (c) Yue Lu Shu Yuan (岳麓书院), and (d) Ying
Tian Shu Yuan (应天书院) (Anonymous, 2006, 宋代四大书院简介 (Introduction of the
four Shu Yuan in Song dynasty)). Similar instructional spaces could also be found in
ancient Rome and Greece. About 200 B.C., the Romans borrowed some aspects of the
ancient Greek system of education and began educating their children in school
(Crystalinks, n.d., Ancient Roman education, para. 9). In all these ancient instructional
spaces, characters were observed by many observers at varying distances and from a
variety of viewing angles.
Figure 1. Private tutorial space led by Confucius
(Meilin, 2007, 壁画作品(孔子教学) (fresco (Confucius was tutoring)), http://xcmeilin.com/jiashownews.asp?id=12 )
Instructional spaces to date include, in order of the capacity of seats, seminar
rooms ( 19), small standard classrooms (20-49), large classrooms (50-100), small
lecture halls (75-149), large lecture halls (150-299), and lecture theatres ( 300)
(Sources: Hauf et al., 1961; Duncan, 1966; Kemper, 1979; Allen et al., 1991, 1996;

3
Niemeyer, 2003; Higher Education General Information Survey (HEGIS); Classification
of Instructional Programs (CIP 2000); University of Michigan
(http://www.umich.edu/~ofa/Space/RmTyp100.htm); and University of Alaska
(http://www.uaf.edu/provost/SPAM/Codes.htm)). The larger spaces — small lecture halls,
large lecture halls, and lecture theatres — emerged in the 1960s due to the baby boom.
Then, the large increase in enrollments and the shortage of faculties and facilities
required larger spaces and the large scale use of visual aids and media (Hauf et al., 1961).
According to these sources, small lecture halls, large lecture halls, and lecture theatres
share with one another at least five characteristics that distinguish them from other
smaller instructional spaces:
1. Large capacity ( 75 seats).
2. Teaching-learning activities inside, which are not tied to a specific subject or
discipline, where the audience views materials presented in the front space
(Hauf et al., 1961).
3. Large scale use of visual aids and media, including blackboards, chalkboards,
marker boards, tack boards, projection screens, TV monitors, overhead
projectors, slide projectors, media players, and video/data projectors, etc.
4. Fixed and compact seating arrangement. Seats are fixed in tiers in the
audience area, with 18 ft2 per seat for small lecture halls, 16 ft2 per seat for
large lecture halls, and 14 ft2 per seat for lecture theatres (minimum 12 ft2 per
seat required by code).
5. Fan-shaped, sloped or tiered floor. Small lecture halls may use a flat floor
when their capacity is less than 100 seats.

4
These five characteristics make the three instructional spaces a special group to be
examined in this study. For convenience, this study uses “lecture halls” as a general term
to cover the small lecture halls, large lecture halls, and lecture theatres. Nowadays,
lecture halls have become the primary scene for teaching and conferences.
1.1 Background
In good lecture hall design, architects must satisfy many requirements. A good
lecture hall must facilitate the visual perception of material, enhance acoustical
performance, provide a pleasant environment (air quality, temperature, and humidity),
empower faculty to use visual aids and media, emphasize flexibility, encourage
interaction, make technology simple and friendly, expand connectivity with other spaces,
and contain costs (Allen, 1991; Niemeyer, 2003). Among these requirements, good
viewing conditions is primary, since most of the information audience receives in lecture
hall is through visual perception. Then how can favorable viewing conditions in lecture
halls be achieved? Since the 1960s, architects have gained some empirical experience in
practice, as summarized in Appendix A by Hauf et al. (1961), Duncan (1966), Kemper
(1979), Allen et al. (1991, 1996), and Niemeyer (2003).
The guidelines listed in Appendix A have been followed by architects in achieving
good viewing conditions in lecture halls since the 1960s. These empirical guidelines,

5
however, have been challenged in modern lecture halls by the upgraded information
technologies largely applied in recent decades to meet increasing pedagogical
requirements and empower speakers with more capability and flexibility to illustrate their
ideas (Niemeyer, 2003). In modern lecture halls, multiple types of visual media with
different geometries are commonly installed in the front space at different locations with
different mounting heights and orientations, on which materials are often simultaneously
presented and observed by the entire audience. Lighting conditions in modern lecture
halls are also frequently dimmed at multiple light levels. Under these complicated
viewing situations, architects need a more precise and reliable design method than the
empirical guidelines for ensuring good viewing conditions in modern lecture halls so that
observers sitting in the far and peripheral seats will still have a good view.
Then how can architects ensure good viewing conditions inside modern lecture
halls? Theoretically, good viewing conditions can be achieved with (a) good lighting,
(b) an ideal viewing area inside which the entire audience can clearly read materials
presented on all visual media, (c) legible materials of adequate size and contrast, and
(d) good eyesight of the observers. In modern lecture hall design, the audience is always
assumed to have average vision (with or without correction). The size and contrast of the
viewing materials presented in lecture halls is also assumed to be within a reasonable
range and out of control of architects. Therefore, more likely than not, architects may
achieve good viewing conditions in lecture halls by providing good lighting conditions
and ideal viewing areas inside. Lighting conditions can be conveniently renovated once
the lecture hall has been built, but the ideal viewing areas for arranging fixed seats in tiers

6
is usually restricted by the shape and size of the lecture halls. The architects’ primary goal
must be to determine the ideal viewing areas at the very beginning stage of lecture hall
design. This study concerns finding the ideal viewing areas of characters presented inside
lecture halls, particularly the modern ones.
What shape must the ideal viewing area take? The answer lies in the spatial
legibility of characters viewed across the lecture hall. The spatial legibility of characters
means the three-dimensional (3D) distribution of the legibility levels of characters
viewed in a space, or their two-dimensional (2D) distribution along a viewing plane.
Legibility of text or graphics refers to the observer’s decipherability of the spatial mosaic
of strokes of text or details of graphics at a specific scenario, to recognize the established
forms of these characters and the embedded meanings thereof (Gove et al., 1986).
According to Cornog & Rose (1967) and Sanders & McCormick (1993), legibility is the
attribute of characters that distinguish each one from others by the features such as stroke
width, height-to-width ratio, fonts, form of characters, contrast, and illumination, which
determine the speed and accuracy for reading or identifying the characters. In lecture
halls, materials are viewed by observers sitting in the peripheral seats in the audience area
at the possible range of angles ±0 - 90 , either horizontally rotated or vertically tilted.
Such rotated or tilted characters, according to people’s daily experience, are not as legible
as those viewed perpendicularly. The larger the incident angle (0 -90 ) between the
display’s normal and observer’s sightline, the more difficult it is to recognize the
distorted characters. To maintain the legibility level of characters, either their size or
contrast, or both, need to be increased when they are viewed not perpendicularly to the

7
display. Alternatively, the observer would have to approach the materials to decrease the
viewing distance. Usually, the size and contrast of materials presented in lecture halls
does not change with seat locations. Thus, observers at peripheral area have to choose
front seats to read tiny materials. The larger the viewing angle, the shorter the viewing
distance. At 90 , the viewing distance would have to be zero. Figure 2 (a) illustrates how
the viewing distance must decrease to maintain the legibility level of characters viewed at
increased viewing angles. If all these viewing positions at different viewing angles are
connected, a closed contour is formed, as illustrated in Figure 2 (b), on which characters
are viewed at the same legibility level. The area encircled by this contour is then defined
as the ideal viewing area for a single material. The material is guaranteed legible to
observers sitting inside this ideal viewing area. Any viewing positions inside the contour
will have higher legibility levels than those directly on the contour. Any viewing
positions closer to the material will have higher legibility levels.
θ
position 1
position 2
position 3
viewing material
D1
D2
D3 ideal viewing area(for illustration purposes, not accurate)
D1>D2>D3
(a) (b)
Figure 2. Illustration of the ideal viewing area for reading a single material at the same legibility level (no unit, not to scale)

8
1.2 Purposes of the Study
This study concerns the development of a new quantitative design method to help
architects find the ideal viewing areas of characters presented in modern lecture halls. To
enhance accuracy and reliability, this study addresses this issue in light of the spatial
legibility of characters viewed not perpendicularly to the observers. The goal of this study
is to develop a program-aided design method for architects to find an overlapped ideal
viewing area in modern lecture halls for reading materials simultaneously presented on
multiple displays, which are installed in the front space at different locations, with
different geometries, mounting heights, and orientations. To accomplish this goal, this
study will:
1. set up ten assumptions to narrow the research scope
2. identify the gap between the available empirical guidelines, to be summarized
in the next chapter, and the required quantitative design method for
determining the ideal viewing areas in modern lecture halls
3. bridge this gap by determining the ideal viewing areas in modern lecture halls
in light of the spatial legibility of characters presented inside
4. develop and validate a computation-program-aided design method for
architects to find the ideal viewing areas in modern lecture halls, and
5. prepare for future research studies to improve this program-aided method to
an advanced level.

9
1.3 Significance of the Study
This study has been needed for a long time. First, architects have rarely used the
spatial legibility of characters as a vehicle for determining favorable viewing conditions
in lecture halls. Instead, they tend to use the empirical guidelines as summarized in
Appendix A, which probably match some rules that could be quantitatively interpreted in
light of legibility for good viewing conditions. This study is believed to be the first
attempt to use the spatial legibility of characters to find the ideal viewing areas in modern
lecture halls. Second, very few studies in the literature predict the spatial legibility of
characters viewed not perpendicularly to the observers. This study is also believed to be
the first attempt in the past century to extensively examine all critical factors, including
viewing angles, viewing distance, lighting levels, contrast, character size,
height-to-strokewidth ratio, and observer’s acuity, to calculate the spatial legibility of
characters. The outcomes of this study will have wide application in practice and
stimulate further research.
This study will directly benefit architecture. The approach proposed here to
calculate the spatial legibility of characters using legibility equations has never before
been introduced to the field. It will benefit architectural design and foster new thinking.
Using this approach, architects, interior designers, lighting designers, and other
professionals can predict appropriate lighting levels, target sizes, contrasts, display
locations, mounting heights, and orientations to create and evaluate good viewing
conditions in lecture halls or other large architectural spaces. Such predictions can guide

10
better design with enhanced lighting and legibility, while minimizing energy consumption
and decreasing costs. In addition, with this approach, a computation-program-aided
design method is developed to find an overlapped ideal viewing area of multiple displays
in modern lecture halls. Upon validation, this program-aided method will supplement and
even replace the empirical guidelines as summarized in Appendix A with enhanced
accuracy, flexibility, and reliability. This method will allow architects, interior designers,
lighting designers, and other professionals to predict ideal viewing areas not only in
modern lecture halls but also in other large architectural spaces where reading characters
is important, such as large commercial interiors, factories, public spaces, libraries, and
museums.
The outcomes of this study will also have wide application to other fields, such as
traffic and transportation, signs, advertisement, safety and security, electronic displays,
where legible characters are crucial. Generally, clientele, designers, and researchers in
any field in need of knowledge for predicting the spatial legibility of characters will
benefit from this study.
1.4 Framework of the Study
This study overlaps with four fields. First, architects must determine good
viewing conditions in modern lecture halls in light of the spatial legibility levels of
characters viewed by observers sitting across lecture halls. Second, the legibility of

11
characters has been thoroughly studied in the Human Factors and engineering fields in
the past century (summarized in the following chapter), though nearly all of them
assumed the characters were viewed perpendicularly to the observers. The spatial
legibility levels of characters viewed not perpendicularly to the observers have not been
comprehensively examined using all critical factors, such as viewing angles and lighting
conditions. Third, many lighting researchers such as Blackwell (1946, 1959, 1972), as
cited by CIE, 1981 (CIE 19/1, 2), Adrian (1982), Clear & Berman (1985, 1990, 2001),
Rea (1986, 1987), and Veitch & Newsham (1995, 1998), have examined lighting quality
for better visual perception of characters. Their outcomes have been widely used in
buildings with enhanced lighting. Fourth, there are physical, physiological, and
psychobiological fundamentals of the visual discrimination of characters. To examine the
ideal viewing areas in modern lecture halls, this study overlaps all four fields of
knowledge at one point — the spatial legibility of characters viewed in lecture halls, as
shown in Figure 3.
Expected outcomesArchitecture
Visualperception
Legi
bilit
y
Ligh
ting
Thisstudy
1. Ideal viewing distances and angles for recognizing fixed characters2. Appropriate size and contrast of characters for fixed viewing distance and angles3. Ideal viewing areas of mutiple displays4. Appropriate size, location, and orientations of different displays
A program-aided design method for:
Figure 3. Framework of this study

12
As predicted, the primary outcome of this study is a computation-program-aided
design method for architects to find ideal viewing areas in modern lecture halls. This
program-aided method can determine (a) the ideal viewing distances and viewing angles
for recognizing fixed characters, (b) the appropriate size and contrast of characters for
fixed viewing distance and viewing angles, (c) the ideal viewing areas of multiple
displays in lecture halls or other large spaces, and (d) the appropriate size, location, and
orientations of different displays installed in buildings or their surroundings.
1.5 Assumptions and Limitations
This study makes 10 assumptions to narrow the research scope, as listed below.
1. For the viewing target, this study examines only text, more specifically, a
single letter. Other common viewing targets such as graphics, words, and
sentences are not examined. Thus, the spacing between letters within words is
also not examined.
2. The font of text will not be examined in this study, but the
height-to-strokewidth ratio of letters will be examined.
3. Text is always assumed to be of high pixel resolution, even those presented on
projection screens.
4. The color of text is not examined.
5. The visual media where text is presented are assumed to be of ideal diffusive

13
surface. Specular reflection from TV monitors, etc., is not considered.
6. Target lighting is assumed to be uniform.
7. Viewing situations with glare and light trespass rare in lecture halls are not
considered.
8. Only fluorescent T8, daylight, typical in most lecture halls, is examined; other
light spectra are not examined.
9. The reading performance of text is assumed to be of threshold (just readable)
100% accuracy. No error or guessing is allowed in this study.
10. The target population is assumed to be 20-29 years of age. Thus, the aging
effect on the legibility of text is not examined.
The outcomes of this study cannot be used for graphics, chromatic text, words or
sentences, erroneous reading performances, or different age groups, but might be
carefully extended to other similar situations besides lecture halls, such as classrooms,
where reading text is important. Follow-up research studies are needed to overcome these
ten assumptions and extend the outcomes to more general applications in the future.
1.6 Summary
Architects have been seeking better design methods for creating and maintaining
favorable viewing conditions in modern lecture halls, which have been lately complicated
by the large scale use of visual media with upgraded information technologies. Finding

14
the ideal viewing areas of characters presented on those visual media must be the primary
goal if architects are to design good lecture halls. This task cannot be easily accomplished
in modern lecture halls using the empirical guidelines architects have followed for
decades due to the lack of a legibility index. A quantitative design method is needed to
determine ideal viewing areas in light of the spatial legibility of characters viewed by
observers sitting across modern lecture halls. Using ten assumptions to narrow the
research scope, this study will develop a computation-program-aided design method to
predict an overlapped ideal viewing area of text presented on multiple displays installed
in the front space of modern lecture halls with different locations, sizes, mounting heights,
orientations, and lighting conditions. Future studies are needed to overcome these ten
assumptions and improve the program-aided design method to a more advanced level.

15
CHAPTER 2
Literature Review
Since the emergence of lecture halls in the 1960s, numerous architects, interior
designers, and educators, have gradually gained experience finding their appropriate size,
shape, and slope angle of the floor for arranging seats for the entire audience. Hauf
(1961), Duncan (1966), Conway (1990), and Allen et al. (1991, 1996) have summarized
the empirical experience into rules of thumb for defining the ideal viewing areas of text
presented in lecture halls. These rules of thumb, as will be detailed later, have been
widely accepted in lecture hall design and have proven useful in practice. However, these
empirical guidelines lack the spatial legibility of text and cannot calculate the complex
viewing situations in modern lecture halls, where text is often viewed simultaneously on
multiple displays, using legibility equations. On the other hand, since Erdmann (1898),
numerous researchers have thoroughly studied the legibility of Roman characters under a
wide range of viewing conditions, as will be reviewed later. Many quantitative studies
have proposed equations for predicting legibility. Thus far, unfortunately, architects have
rarely used these equations in their practice to design buildings with enhanced legibility.
The empirical architectural guidelines for defining the ideal viewing areas in lecture halls,
and all legibility equations published ever since, are comprehensively reviewed in this

16
chapter. Both methods have their roots in visual perception. Therefore, the fundamental
theories of the visual perception of text are reviewed first.
2.1 Fundamental Theories of the Visual Perception of Text
2.1.1 Visual Perception of Text
The human eye is the organ specialized in visual perception. The structure of the
eye includes ocularmotor (e.g., ciliary muscle), optical (e.g., cornea, iris, pupil, lens), and
neurological components (e.g., retina, fovea, blind point, optic nerve), as shown in Figure
4. For legibility, text is fixated by the observer on the center fovea of his/her retina and
then discriminated by the 50k or so cones (there are no rods in the center fovea of human
eye) (Wolken, 1966; Hendee & Wells, 1993; Wandell, 1995; Boff, Kaufman, and Thomas,
1986). Figure 4 illustrates the visual perception of the letter A. Incident light from the
letter A passes through the ocular media and then reaches the center fovea to form an
inverted image on the retina. During this process, a large amount of light is absorbed and
scattered by the cornea, lens, aqueous and vitreous humors inside the eye (Boff &
Lincoln, 1988). The remaining incident light then passes to the ganglion cells, amacrine
cells, bipolar cells, and horizontal cells, and finally reaches the cones in the center fovea,
as shown in Figure 5 (Wolken, 1966). Only 10% of the incident light is left to activate the
cones, which fire signals to the cortex nerves in the brain for visual encoding of the letter
A (Mouroulis, 1999; Wolken, 1966).

17
Figure 4. Cross-sectional diagram of the human eye in recognizing the letter A
(Boff & Lincoln, 1988, Figure 1, p. 54)
The direction of incident light
Figure 5. Layers of the retina in center fovea (Remington, 2005, Figure 4-1, p. 56) 1 retinal pigment epithelial layer; 2 photoreceptor layer (cones); 3 external limiting
membrane; 4 outer nuclear layer; 5 outer plexiform layer; 6 inner nuclear layer; 7 inner plexiform layer; 8 ganglion cell layer; 9 nerve fiber layer; 10 internal limiting membrane.
iris cornea
pupil
lens
retina sclera
fovea
optic nerve ciliary muscle
blind spot

18
How do the activated foveal cones discriminate text with different fonts and sizes?
The answer lies in the geometrical characteristics of the cones in the center fovea that has
a diameter of 0.5 mm and subtends 1.7 (Wandell, 1995). As illustrated in Figure 6, the
foveal cones are very tightly packed and form a two-dimensional triangular array without
any strong orientation dependencies (Wandell, 1995). According to Wandell (1995), the
peak cone density is 1.6 ×10⁵ per mm2, the size of the inner segments of cones in the
fovea is 2.3 µm, and the intercone spacing is 2.5 µm, so that the minimum discernible
visual angle subtended by one cone is 0.5 min arc. This dense representation of the foveal
cones suggests that the spatial mosaic of the cones must be very important for the visual
encoding (recognition) of text with different fonts and sizes (Wolken, 1966; Hendee &
Wells, 1993; Wandell, 1995; Boff et al., 1986).
Figure 6. Spatial mosaic of cones in the fovea (Wandell, 1995, Figure 3.4, p. 49)
When viewed, the strokes of the retinal image of text strike the underlying foveal
cones and activate them if the strokes are wider than one cone (0.5 min arc) and the
incident light is strong enough (minimum 50 -150 quanta striking the cornea is needed for

19
threshold vision (Pirenne, 1967). Legibility of text is eventually determined by the
number of activated cones and their spatial distribution in the center fovea. Figure 7
illustrates that different text, or graphics, have a different number and spatial distribution
of activated cones, and thus, different patterns for the visual encoding of characters.
Figure 7. Retinal images of text (E, S) and a disc formed in the fovea with
underlying activated cones (bright spots) (Wandell, 1995, Figure 3.4, p. 49).
2.1.2 Factors Affecting Visual Perception of Text in Lecture Halls
Geometric, viewer, and lighting related factors all affect the recognition of text in
lecture halls along with the viewing duration. Geometric factors include viewing distance,
image size (width, height, strokewidth), and image orientation (perpendicular to the
observers or not). Viewer related factors include aberrations and imperfections of human
eyes, age, and visual acuity level. Lighting related factors include target and background
20
luminance, ambient light, image luminance contrast, spectrum of lamps, and color
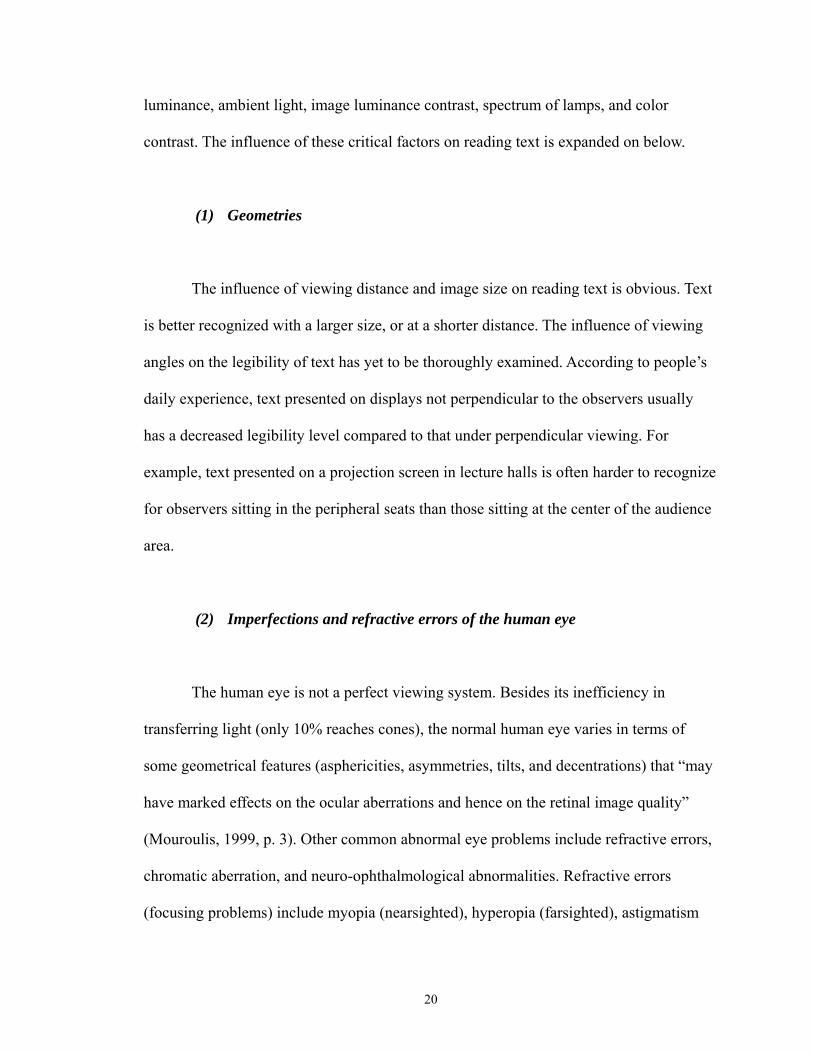
contrast. The influence of these critical factors on reading text is expanded on below.
(1) Geometries
The influence of viewing distance and image size on reading text is obvious. Text
is better recognized with a larger size, or at a shorter distance. The influence of viewing
angles on the legibility of text has yet to be thoroughly examined. According to people’s
daily experience, text presented on displays not perpendicular to the observers usually
has a decreased legibility level compared to that under perpendicular viewing. For
example, text presented on a projection screen in lecture halls is often harder to recognize
for observers sitting in the peripheral seats than those sitting at the center of the audience
area.
(2) Imperfections and refractive errors of the human eye
The human eye is not a perfect viewing system. Besides its inefficiency in
transferring light (only 10% reaches cones), the normal human eye varies in terms of
some geometrical features (asphericities, asymmetries, tilts, and decentrations) that “may
have marked effects on the ocular aberrations and hence on the retinal image quality”
(Mouroulis, 1999, p. 3). Other common abnormal eye problems include refractive errors,
chromatic aberration, and neuro-ophthalmological abnormalities. Refractive errors
(focusing problems) include myopia (nearsighted), hyperopia (farsighted), astigmatism
21
(multiple foci are formed), and presbyopia (near objects focus behind the retina), which
are caused in later life and can be corrected by wearing glasses or contact lens (Boff &
Lincoln, 1988; Rea, 2000). Chromatic aberration, commonly called abnormal color vision,
is inborn or due to diseases. This research study examines only normal color vision.
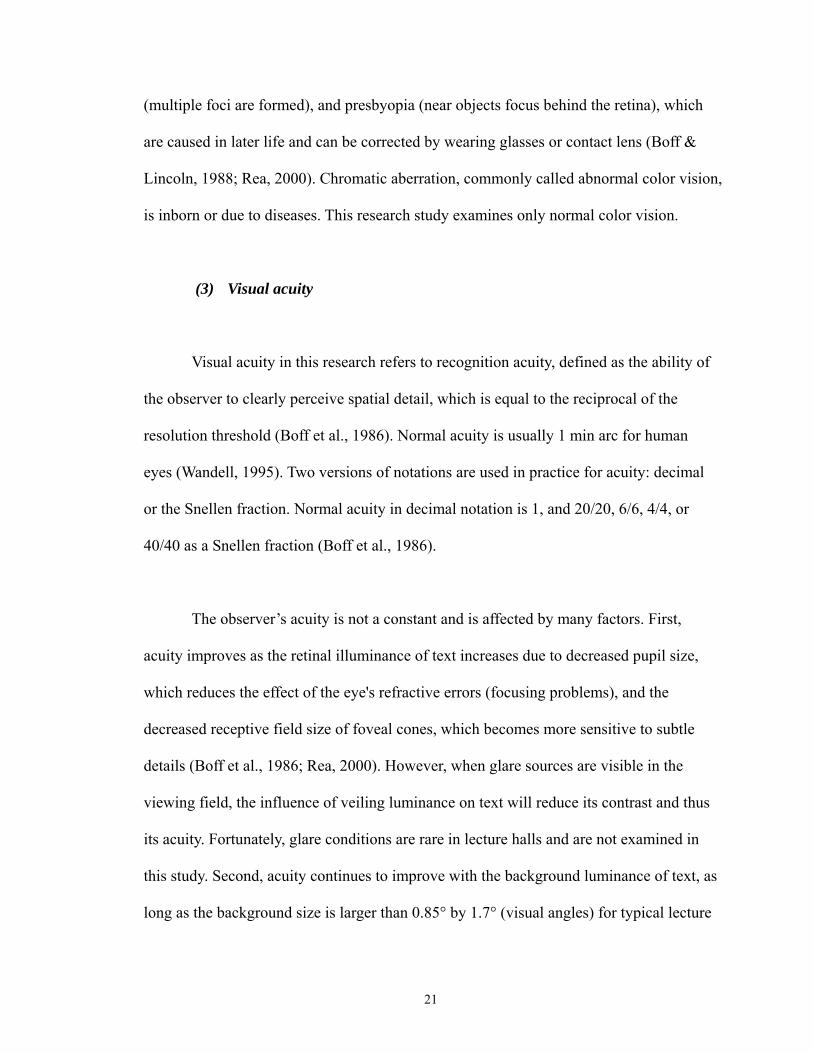
(3) Visual acuity
Visual acuity in this research refers to recognition acuity, defined as the ability of
the observer to clearly perceive spatial detail, which is equal to the reciprocal of the
resolution threshold (Boff et al., 1986). Normal acuity is usually 1 min arc for human
eyes (Wandell, 1995). Two versions of notations are used in practice for acuity: decimal
or the Snellen fraction. Normal acuity in decimal notation is 1, and 20/20, 6/6, 4/4, or
40/40 as a Snellen fraction (Boff et al., 1986).
The observer’s acuity is not a constant and is affected by many factors. First,
acuity improves as the retinal illuminance of text increases due to decreased pupil size,
which reduces the effect of the eye's refractive errors (focusing problems), and the
decreased receptive field size of foveal cones, which becomes more sensitive to subtle
details (Boff et al., 1986; Rea, 2000). However, when glare sources are visible in the
viewing field, the influence of veiling luminance on text will reduce its contrast and thus
its acuity. Fortunately, glare conditions are rare in lecture halls and are not examined in
this study. Second, acuity continues to improve with the background luminance of text, as
long as the background size is larger than 0.85° by 1.7° (visual angles) for typical lecture

22
halls (Rea, 2000). Third, at the photopic light level ( 3.4 cd/m2) typical in lecture halls,
the highest acuity level is obtained in the center fovea where text is fixated for legibility;
other locations on retina have decreased acuity (Boff et al., 1986; Rea, 2000). Fourth,
slightly decreased pupil size also enhances acuity, as detailed in the next section. Fifth,
text is always viewed in lecture halls with exposure time much longer than the threshold
500 ms, after which visual acuity is maximized (Rea, 2000). Sixth, the accommodation
errors when text is viewed at a long distance in lecture halls blur the retinal image, thus
decreasing the acuity (Boff et al., 1986). Seventh, acuity also changes considerably over
the life span of an individual. An acuity of 1 min arc is approached at 36 months of age
and 0.75 min arc during the first 5 years (Boff et al., 1986). Beyond the twenties, acuity
decreases (Boff et al., 1986).
(4) Pupil size
Normal pupil diameter is about 2-5 mm at photopic light levels and 3-8 mm for
young people (Boff et al., 1986; Rea, 2000). Pupil size varies because the iris constricts
and dilates in response to luminances within the field of view (Rea, 2000). Pupil size
decreases as the field luminance increases in the range of typical lecture halls, as
illustrated in Figure 8, and approaches 2 mm at 6366.0 cd/m2 (Reeves, 1920). A very
small pupil degrades the retinal image by low retinal illumination and diffraction effects,
while a very large pupil also degrades the quality of the retinal image by the increased
effects of spherical and chromatic aberration (Boff et al., 1986). In between, an optimal
pupil size exists to maximize the acuity of the observer, as shown in Figure 9 (Leibowitz,

23
1952). In addition, older people tend to have smaller pupils under comparable conditions
(Rea, 2000).
318.3 , 2.8175.1 , 3.131.8 , 4
3.2 , 5
0
2
4
6
0.0 50.0 100.0 150.0 200.0 250.0 300.0 350.0
Field luminance in cd/m2 in the range of typical lecture halls
Figure 8. Field luminance vs. pupil size (Reeves, 1920, Table II, p. 39)
Pupil diameter in mm
Figure 9. Log visual acuity as a function of log pupil diameter (Leibowitz, 1952, Figure 3, p. 421)
1 2 3 4 5
Log
visu
al a
cuity
in m
in-1
Pupi
l dia
met
er in
mm
0.3
0.2
0.1
0.0
-0.1
-0.2
-0.1
Different curves at different field luminance in millilamberts

24
(5) Age
The aging of the observer’s eye causes extra errors and decreases the ability to
resolve fine details. First, the amplitude of accommodation decreases rapidly with age.
By age 45, most people lose the ability for near acuity (presbyopia); by age 60, nearly no
accommodation ability remains (Weale, 1992; Rea, 2000). Second, pupil size also
increases rapidly in the early years of life and peaks at around age 10, and then slowly
decreases to a fixed value around 70 (Weale, 1992, Figure 2.1, p. 48). The constricted
pupil size reduces the ocular aperture but enlarges the depth of focus (Weale, 1992). The
increased depth of focus somewhat compensates for the lack of focusing ability in the
elderly (Rea, 2000). Third, visual acuity increases at early ages and peak in the twenties
(approximately 20-29), as shown in Figure 10, then declines sharply in later life (Weale,
1992). Fourth, the optical power of the lens of the human eye in dioptres declines at early
ages, and then keeps constant in adults (Weale, 1992). Fifth, the crystalline lens of the
human eye yellows progressively with age, thus increasing the absorption and diffusion
of short wavelengths (Weale, 1992). Sixth, the axial fluorescence increases with age,
while the cornea keeps constant in scattering light throughout life (Weale, 1992). Seventh,
the density of photoreceptors in the retina also decreases with age since the
photoreceptors are not replaced once lost (Weale, 1992). Although rods are quickly lost
between 61 and 82 years of age, the number of cones is constant until the age of 70 or 80,
and then declines (Weale, 1992).

25
Age (years)
Figure 10. Age-related variation of visual acuity (Weale, 1992, Figure 5.1, p. 228)
(6) Spectrum of light sources
Light spectrum affects reading text in lecture halls due to the spectral sensitivity
(sensitivity to different light wavelengths) of three different types of cone: S-, M-, and
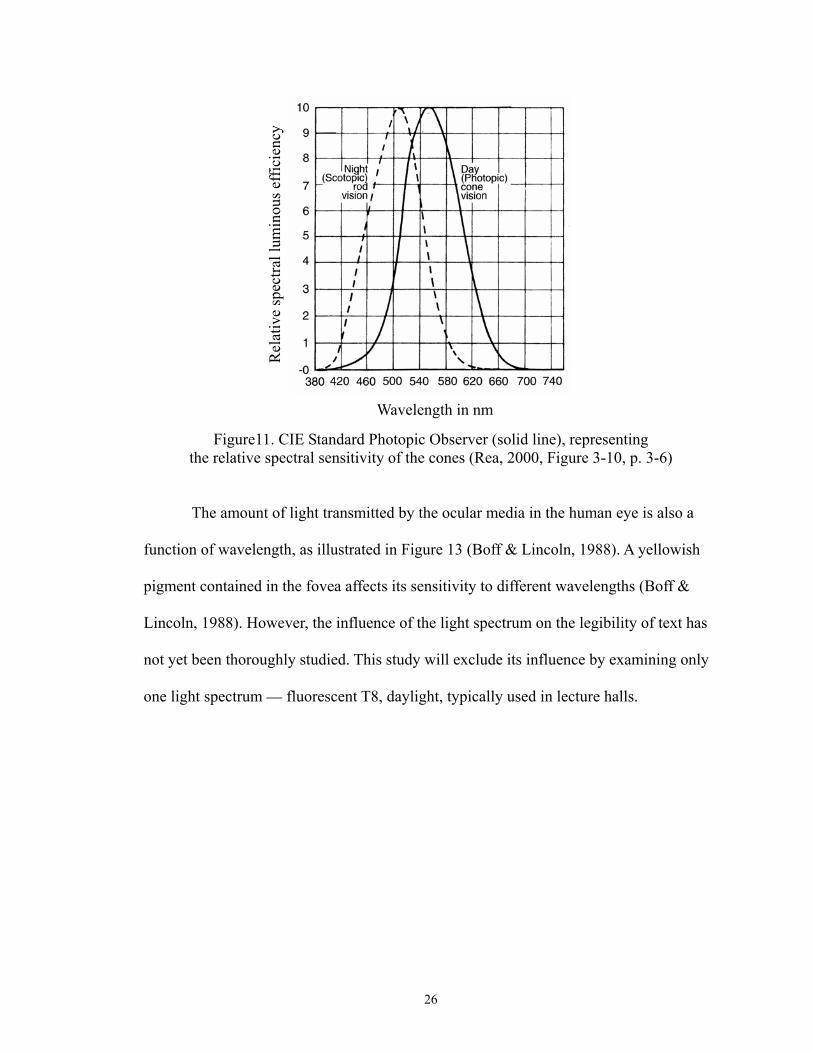
L-cones in the fovea. Figure 11 shows the 2-degree standard photopic observer developed
by CIE (1931) to represent the relative spectral sensitivity of the foveal cones. At the
photopic level ( 3.4 cd/m2), the human eye has maximum sensitivity to a target of 555
nm wavelength. The light of other wavelengths will be perceived dimmer; thus, higher
intensity is required to produce equal brightness, as depicted in Figure 12 (Boff &
Lincoln, 1988).
1.0
0.67
1.2
0.5 V
isua
l acu
ity in
log
scal
e
0 20 40 60 80 29
26
Figure11. CIE Standard Photopic Observer (solid line), representing
the relative spectral sensitivity of the cones (Rea, 2000, Figure 3-10, p. 3-6)
The amount of light transmitted by the ocular media in the human eye is also a
function of wavelength, as illustrated in Figure 13 (Boff & Lincoln, 1988). A yellowish
pigment contained in the fovea affects its sensitivity to different wavelengths (Boff &
Lincoln, 1988). However, the influence of the light spectrum on the legibility of text has
not yet been thoroughly studied. This study will exclude its influence by examining only
one light spectrum — fluorescent T8, daylight, typically used in lecture halls.
Rel
ativ
e sp
ectra
l lum
inou
s effi
cien
cy
Wavelength in nm

27
Figure 12. Relative energy level required to produce perceptions of equal brightness for an observer adapted to multiple luminance levels (Boff & Lincoln, 1988, Figure 1, p.124)
Wavelength in nm
Figure 13. Best current estimates of the amount of light transmitted by the ocular media as a function of wavelength (Boff & Lincoln, 1988, Figure 1, p. 36)
Tran
smitt
ance
1.0
0.8
0.6
0.4
0.2
0.0 400 600 800 1000 1200
Log
spec
tral r
adia
nce
(wat
t/ω⋅m
2 )
Wavelength (nm)

28
(7) Chromatic contrast
Chromatic contrast (color difference) between text and its background also affects
legibility levels. For observers with normal color vision, text with larger chromatic
contrast has higher readability1, while text with a color combination of positive polarity
(for example, dark text on light background) is more legible (Wang et al., 2003, cited by
Hall & Hanna, 2003; Pastoor, 1990). Then what color combinations have greater
legibility? Generally, color combinations with higher luminance contrast will have better
legibility, regardless of the specific color combinations (Radl, 1980, and Bruce & Foster,
1982, cited by Hall & Hanna, 2003). Black/white and black/yellow are the most legible
color combinations (Luckiesh, 1923, cited by Tinker, 1963; Tinker & Paterson, 1931, and
Hackman & Tinker, 1957, cited by Rehe, 1974; Smith, Farquhar and Thomas, 1965;
Tinker 1963; MacNeill, 1965, cited by Adams et al., 1988; Adams et al., 1988;
Clements-Smith et al., 1993, cited by Nilsson, 1999; and Nilsson, 1999). Other good
color combinations include white/green (Luckiesh, 1923; Tinker, 1963; Woods et al.,
1970, cited by Adams et al., 1988; Clements-Smith et al., 1993), white/blue (Luckiesh,
1923; Tinker, 1963; Gurney et al., 1977, cited by Adams et al., 1988; Clements-Smith et
al., 1993), green/yellow, blue/yellow, black/red (Clements-Smith et al., 1993), and
black/green, blue/grey, as well as black/gray (Tinker, 1963). However, to narrow the
research scope, this study does not examine color and chromatic contrast. Text presented
in this study is always printed black/white or grey/white.
1 Unlike legibility, readability refers to the recognition of the stylistic and grammatical complexity of prose, which depends more on the spacing of characters and groups of characters, their combination into sentences or other forms, the spacing between lines, and margins than on the specific features of the individual characters (Sanders & McCormick, 1993; Foster, 1980).

29
(8) Light level and luminance contrast
Lecture halls are typically at the photopic light level ( 3.4 cd/m2), where foveal
cones dominate for discriminating text. The luminance contrast of text viewed in lecture
halls is usually high to enhance legibility under different light levels. Light level and
luminance contrast of text affect its legibility by means of the retinal image, whose
intensity and quality determine the number of activated foveal cones and the intensity of
signal sent to the brain. On the other hand, the sensitivity of human eye to luminance
contrast and its sensitivity to absolute light level are complementary measures (Wandell,
1995). Weber’s law (1) predicts that the detectable luminance contrast (the threshold to
the absolute light level) is proportional to the intensity of the adapting field (adaptation
luminance) (Boff & Lincoln, 1988).
at IkI ×= (1)
where
Ia = Intensity of the adapting field (adaptation luminance)
It = Amount of intensity above Ia to be just detectable (threshold luminance
contrast)
k = Constant
According to Weber’s law, sensitivity to contrast is greater in low than in high
adaptation luminance. The adaptation luminance is dominated by the luminances of the
viewing target and its immediate background within 1.5 subtended to the observer’s eyes

30
(foveal luminance), is also affected by the surrounding luminances (Moon & Spencer,
1945). Thus, the sensitivity of the observer’s eye to text in lecture halls will vary with the
lighting conditions inside. For instance, the lowered sensitivity of the human eye at
higher adaptation luminance partially contributes to the “washing out” effect of text
presented on the projection screen when the previously dimmed lecture halls are lit up.
(9) Ambient light
First, ambient light has proven to be effective nowadays for the visual perception
of text mainly through transient adaptation. To view text, the observer’s eyes adjust their
operating characteristics as a result of the brightnesses within the field of view, that is, the
adaptation luminance (Rea, 2000). The surrounding luminance from the ambient
environments with an off-axis viewing angle 1.5 contributes with small portion to the
adaptation luminance (Moon & Spencer, 1945). A lower level of ambient light decreases
the adaptation luminance, in turn, according to Weber’s law, increasing the contrast
sensitivity of the observer’s eyes to read text. For example, the general lighting in lecture
halls is usually dimmed for better visibility of the projection screens. In this case,
however, the better legibility of text is more largely due to the increased contrast of text,
since the general lighting (ambient light) in the seating area usually adds light to the
projection screens and then washes out the text lit using the projector light. On the other
hand, dimming a lecture hall is usually not helpful for increasing the legibility of text
written on the blackboard. In the later case, the general lighting in audience area might
add some light on the text and thus increase their legibility levels.
31
Second, ambient light has an influence on text reading also through pupillary
changes. Within the typical range of light levels in lecture halls, as illustrated in Figure 8
before, higher levels of ambient light will decrease pupil size, thus maximizing acuity by
enhancing the view depth and upgrading the retinal image due to the lowered diffraction
effect. Consequently, when read text presented on externally lit visual media, such as
blackboards, books, magazines, but not projection screens, people usually feel more
comfortable in their eyes with ambient light on than in total darkness. Of course, as
claimed by Leibowitz (1952) in Figure 9 before, an optimal pupil size exists for
maximizing the acuity of the observer, depending on the adaptation luminance, which has
a partial contribution from ambient light.
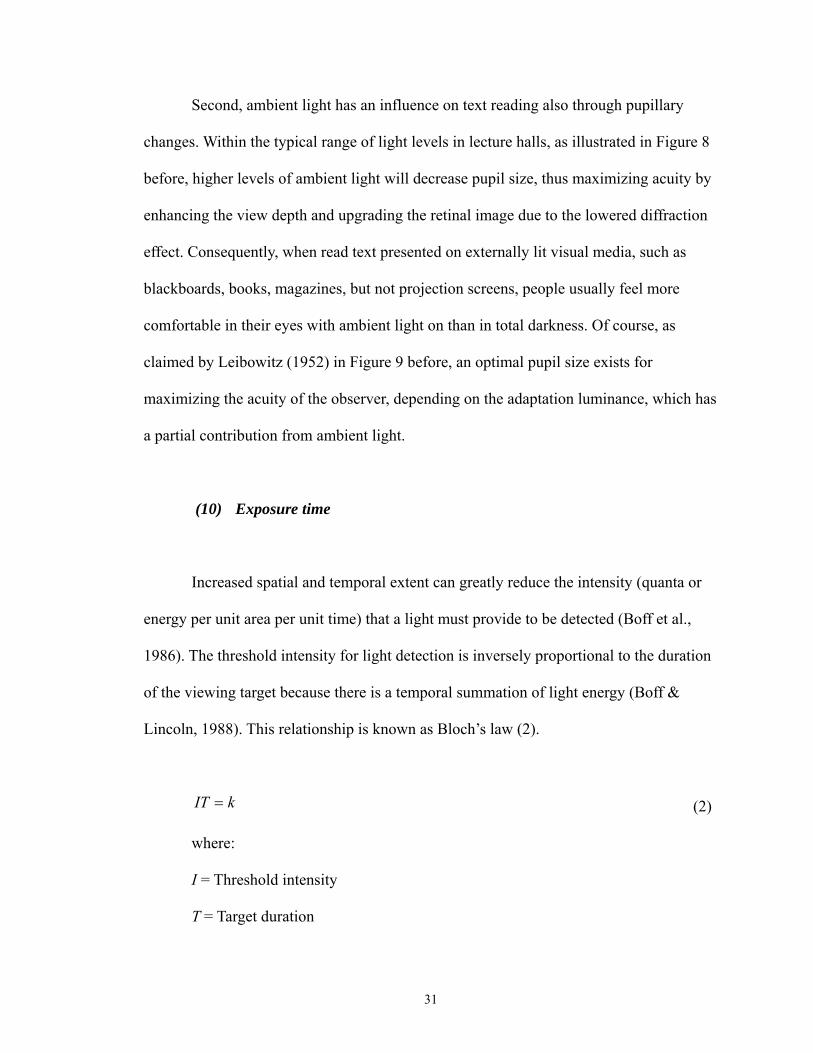
(10) Exposure time
Increased spatial and temporal extent can greatly reduce the intensity (quanta or
energy per unit area per unit time) that a light must provide to be detected (Boff et al.,
1986). The threshold intensity for light detection is inversely proportional to the duration
of the viewing target because there is a temporal summation of light energy (Boff &
Lincoln, 1988). This relationship is known as Bloch’s law (2).
kIT = (2)
where:
I = Threshold intensity
T = Target duration

32
k = Constant, equal to the product of the critical duration and the threshold
intensity at critical duration (critical intensity)
Up to some critical duration, sensitivity increases (threshold intensity decreases)
in inverse proportion to exposure duration, where Bloch’s law holds. However, above the
critical duration, increasing the length of exposure has no effect (Boff & Lincoln, 1988).
The typical value of this critical duration is 20 - 100 ms, which varies with target
characteristics and viewing conditions (Boff & Lincoln, 1988). In most situations, text is
exposed for a long enough time (> 500ms) in lecture halls after the observer’s eyes have
adapted to the surrounding level.
2.2 Architectural Guidelines for Determining Ideal Viewing Areas of Lecture Halls
The experiences gained in practice since the 1960s to determine ideal viewing
areas in lecture halls were summarized into empirical guidelines by Hauf, Koppes, Green,
and Gassman (1961), Duncan (1966), Conway (1990), and Allen et al. (1991). Similar
experiences for sport stadiums, sport halls, indoor and outdoor facilities were also
standardized by the German Institute for Standardization and National Standards
Authority of Ireland. These empirical guidelines and standards have defined the ideal
viewing areas of lecture halls because of their ideal plan shape and ideal longitudinal
section profile.

33
2.2.1 Ideal Plan Shape of Lecture Halls
The ideal plan shape of lecture halls is primarily determined by the audience
seating area. It is also compromised by other architectural considerations. For good visual
perception, the seating area must be coincident with an ideal viewing area of displays
mounted in the front space, including blackboards, screens, TV monitors, and so on.
Conventionally, this ideal viewing area of displays has been defined as fan-shaped, with
ranges of viewing distances and horizontal viewing angles. For instance, the DIN 108
Standard defines this fan-shaped area to view drawn or written black/white slides
projected on matte screens as Figure 14, with viewing distance varying between 2 and 6
times of the screen width (w) and a horizontal viewing angle within ± 30 of the center
line of screen.
2w
6w
w 30
Figure 14. Ideal horizontal viewing area of matte projection screen
(DIN 108, cited by Duncan, 1966)

34
For the ideal viewing area of general matte projection screens installed in lecture
halls, Duncan (1966) recommended the maximum viewing angles on either side of the
center line as 30 , the maximum elevation of the eye to the top of the screen as 35 , and
the critical angle of depression of the projector as 12 . Likewise, Hauf et al. (1961)
defined the fan-shaped ideal viewing area with viewing distance varying between 2w and
6-7w (screen width), horizontal viewing angle ±30 -60 , and maximum angle of
elevation 15 . Similarly, Allen et al. (1991) recommended a minimum 1.5w and optimum
2w from the first row of seats to the screen, and a maximum 6w for optical projection, or
4w for electronic projection due to lower (12.5%-25%) resolution. Allen et al. also
recommended a maximum 35 from the horizontal subtended by the top of the screen
from any seating position. However, some compromises may have to be made in the first
few rows of seats to allow sufficient space for chalkboard/marker board and a reasonable
screen size, and yet not have the front seats too far from the front of the room (Allen et al.,
1991). Conway (1990) suggested that the maximum viewing distance is 6w, while the
minimum is 1.5-2w.
Similarly, for the ideal horizontal viewing area of TV monitors used in lecture
halls, Hauf et al. (1961) recommended that the viewing distance be between 4w (monitor
width) and 12w (14w for less optimum condition), and that the horizontal viewing angle
be ±35 -40 (±45 for less optimum condition), with the maximum angle of elevation
15 to the bottom of image (30 for less optimum condition). In addition, Allen et al.
(1991) claimed that the farthest viewing distance should be no more than one foot per
diagonal inch of the monitor size.

35
This study has summarized these similar definitions of ideal viewing area in
lecture halls into a more general one by integrating all the varying parameters (viewing
distances and angles). This general definition will provide a single or overlapped ideal
horizontal viewing area for reading text presented on: (a) a single point of a matte screen,
(b) a whole matte screen, (c) three screens symmetrically mounted on one plane, (d) three
screens symmetrically mounted on three different planes, (e) a single TV monitor, and
(f) multiple displays randomly mounted in lecture halls. They are expounded below
separately.
2.2.1.1 A Single Point of Matte Screen
For text presented at a single point on a single matte screen in lecture halls, the
horizontal ideal viewing area is fan-shaped: viewing distance is 2w-6w (screen width),
with a horizontal viewing angle φ of ±30 -60 , as illustrated in Figure 15.
w
2w
6w
φ
Figure 15. Horizontal ideal viewing area of text presented at a single point on a matte screen (Hauf et al, 1961, the fold-out diagram, after p. 11-14)
φ = ±30 -60

36
2.2.1.2 A Whole Matte Screen
For text presented on a whole matte screen, the ideal viewing area is overlapped
at three critical points: middle point, left edge, and right edge, as illustrated in the shaded
area in Figure 16. In this overlapped area, the viewing distance is 2w-6w (screen width),
while the horizontal viewing angle φ is ±30 -60 .
w w
φ
2w
6w
φ
Figure 16. Overlapped ideal viewing area (shadowed area) of a whole single screen
(Hauf et al., 1961, the fold-out diagram, after p. 11-14)
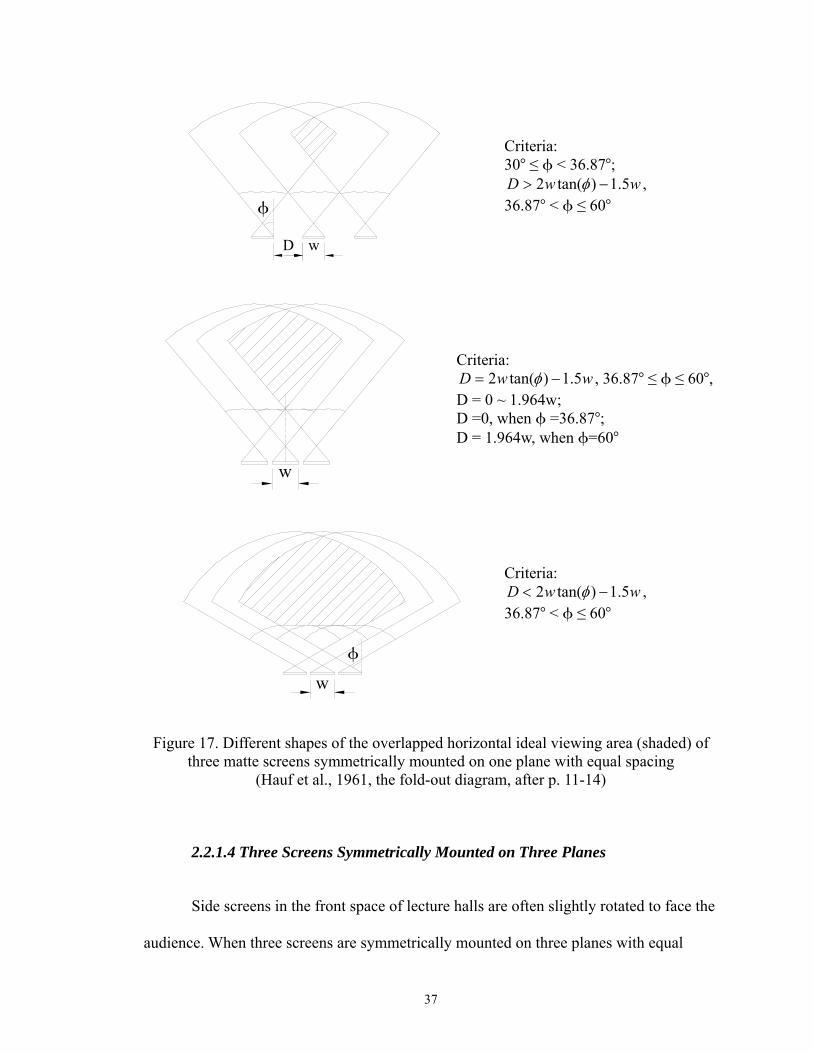
2.2.1.3 Three Screens Symmetrically Mounted on One Plane
Multiple screens are often viewed simultaneously in the front space of modern
lecture halls. When three screens are symmetrically mounted in the front space of lecture
halls on one plane with equal spacing, the shape and size of their overlapped ideal
viewing area vary with the viewing angle φ and the spacing D between screens, as shown
in Figure 17.
φ = ±30 -60
37
wD
φ
w
w
φ
Figure 17. Different shapes of the overlapped horizontal ideal viewing area (shaded) of
three matte screens symmetrically mounted on one plane with equal spacing (Hauf et al., 1961, the fold-out diagram, after p. 11-14)
2.2.1.4 Three Screens Symmetrically Mounted on Three Planes
Side screens in the front space of lecture halls are often slightly rotated to face the
audience. When three screens are symmetrically mounted on three planes with equal
Criteria: 30 ≤ φ < 36.87 ;
wwD 5.1)tan(2 −> φ , 36.87 < φ ≤ 60
Criteria: wwD 5.1)tan(2 −= φ , 36.87 ≤ φ ≤ 60 ,
D = 0 ~ 1.964w; D =0, when φ =36.87 ; D = 1.964w, when φ=60
Criteria:wwD 5.1)tan(2 −< φ ,
36.87 < φ ≤ 60

38
spacing, their overlapped ideal viewing area depends on the viewing angle φ, the spacing
D between screens, and the rotating angle θ of side screens, as illustrated in Figure 18.
wDφθ
wφ
θ
wφ
θ
Figure 18. Different shape and size of the horizontal ideal viewing area (shaded) of three
matte screens symmetrically mounted on three different planes with equal spacing (Hauf et al., 1961, the fold-out diagram, after p. 11-14)
Criteria:
wwwD 5.0)cos(
cos)tan(2 −+
−+>θφ
φθφ ;
30 < φ ≤ 60 ; θ =10 or other value
Criteria:
wwwD 5.0)cos(
cos)tan(2 −+
−+=θφ
φθφ ;
30 ≤ φ ≤ 60 ; θ =10 or other value
Criteria:
wwwD 5.0)cos(
cos)tan(2 −+
−+<θφ
φθφ ;
30 < φ ≤ 60 ; θ =10 or other value

39
2.2.1.5 TV Monitor
Due to smaller size, greater brightness, and specular surface of TV monitors, their
ideal viewing area has larger dimensions (optimum 4w-12w, or less optimum 4w-14w),
but smaller horizontal viewing angles (optimum ±35 -40 , or less optimum±45 ), as
illustrated in Figure 19 (Hauf et al., 1961).
w
4w
12w
Eye70-8015
(a) Optimum TV monitor horizontal viewing area with viewing distance 4w-12w, horizontal viewing angle ±35 -40 , and max. elevation angle 15 to the bottom of image
w
Eye
4w
14w
90
30
(b) Less optimum TV monitor horizontal viewing area with max. distance may be increased to 14w, horizontal angle to ±45 , and max. elevation angle to 30
Figure 19. Ideal viewing area of TV monitors with different mounting heights
(Hauf et al., 1961, no Figure number, p. 11-19, 11-20)

40
2.2.1.6 Multiple Displays Randomly Mounted in Lecture Halls
In reality, observers in lecture halls often need to view multiple displays (e.g.,
blackboards, tack boards, screens, TV monitors) mounted in different locations, with
different geometries, mounting heights, and orientations. Their ideal viewing area could
still be determined by overlapping all ideal viewing areas of each display, as illustrated in
Figure 20.
side whiteboard
projection screentackboard TV
Figure 20. Overlapped ideal viewing area (shaded) of multiple random displays
2.2.1.7 Evaluation of the Plan Shape of Lecture Hall
The ideal viewing areas defined using these empirical guidelines and standards
are often compromised by practical considerations when architects determine the plan
shape of lecture halls. To evaluate the efficacy of the final plan shape and size of lecture
halls in light of ideal viewing, the DIN 108 standard proposed an index η, which is the

41
ratio of usable area to total area, the higher, the better, as shown in (3) (Duncan, 1966). In
lecture halls, the usable area refers to the area within the ideal viewing limitations.
areatotalareausable
__
=η (3)
where:
η = Proportion of usable area to total area. The larger, the better.
2.2.2 Ideal Longitudinal Section Profile of Lecture Halls
Lecture halls also have an ideal longitudinal section profile for best viewing
materials presented in the front space. The standard DIN 108 recommends the viewing
distance range to be between 2H to 6H (H is height of the projection screen) with a
vertical viewing angle α within ±30 to center line of screen, as illustrated in Figure 21.
HH
6H
6H
2m
30°
H
6H
2H
2.5m
Figure 21. Ideal longitudinal section profiles of lecture halls
(Duncan 1966, Figure 4, p. 18)

42
For better viewing from the rear seats, the floor of lecture halls with a capacity
greater than 100 should be stepped or sloped to some degree (Hauf et al., 1961). Duncan
(1966) proposed a mathematical formula (4) for describing the ascending profile for the
seat arrangement in lecture halls and other large instructional spaces, as shown in Figure
22.
⎟⎠⎞
⎜⎝⎛ −= 5
5 12 Cx
Cxxy (4)
where:
y = Vertical height to the center point of projection screen
x = Horizontal distance to the center point of screen
C = Constant
2H
6H
H
αα x
y
Figure 22. Ascending profile for the seats that provide good viewing
for the projection (Duncan, 1966, Figure 9, p. 20)
In addition, acoustics also determine the ideal longitudinal section profile of
lecture halls. Figure 23 illustrates the typical longitudinal section profiles of lecture halls

43
with a large capacity for obtaining good viewing and acoustical conditions.
(a) Medium-sized lecture halls with stepped profile, volume 1815 m3 (3.9 m3 per seat),
plan area 360 m2 (0.7 m2 per seat) (Duncan, 1966, Figure 12, p. 21)
(b) Section profile for lecture hall with good viewing conditions
and favorable projection of sound (Duncan, 1966, Figure 10, p. 21)
(c) Large lecture theatre with stepped profile, volume 6250 m3 (5.8 m3 per seat),
plan area 800 m2(0.7 m2 per seat) (Duncan, 1966, Figure 11, p. 21)
Figure 23. Typical longitudinal section profiles of lecture halls with large capacity to obtain both good viewing conditions and satisfactory acoustical performance
(for demonstration only, no dimensions)

44
In addition, a European Standard ISEN 13200-1-2004 (the English version of
German standard DIN 13200-1) has specified that between the eye of a spectator and his
focus point P at sport stadiums, sport halls, indoor and outdoor facilities, no constructive
obstacle is allowed, as illustrated in Figure 24 and (5) (National Standards Authority of
Ireland, ISEN 13200-1-2004, 2004). Although this standard does not cover lecture halls,
this rule can still be referred to for sightline construction in lecture halls.
)120( −×
=C
BaD (5)
where:
D = Distance recommended from the spectator to the nearest point P of focus
(mm)
haA += , and h = 0 ~ 1000 mm
Figure 24. Example of sightline construction
(ISEN 13200-1-2004, Figure 6, p. 14)

45
2.3 A Review of 95 Legibility Equations
With initial studies appearing over a century ago (e.g., Erdmann, 1898; Scott,
1903; Dearborn, 1906; Dodge, 1907), researchers have thoroughly studied the legibility
of Roman characters under a wide range of viewing conditions in such fields as traffic
signs, driving interface, electronic displays, instrument panels, safety and security, and
wayfinding. Many quantitative studies have proposed equations to predict the legibility of
text. This study includes a comprehensive review of the literature on the legibility of
Roman characters, to find every equation ever published on that topic in authoritative
sources (e.g., books, journal articles, conference papers, and technical reports). A total of
95 equations have been identified and reviewed.
2.3.1 The 95 Legibility Equations
The 95 legibility equations appear in the appendices. Appendix B contains
definitions of all terms used in the equations. The actual equations, applicable conditions,
units, and other notes are compared in Appendix C. These 95 equations include (1) those
that define measures (e.g., visual angle, acuity, legibility index, legibility potential,
luminance contrast), or equations to interpret the relationships between these indices, a
total of 26 equations, and (2) predictions based on test data in the laboratory or field, a
total of 69 regression equations, which have been further categorized into 8 subgroups
based on their dependent measure, as shown in Table 1.

46
In addition, to give readers the whole picture of the historical development of
these 95 legibility equations, Figure 25 shows the published years for 77 of the 95
legibility equations for which data was available by 2005. The earliest equations
(Equations 86, 87 in Appendix C) appeared in 1925. As shown in Figure 25, research on
legibility equations appeared at a fairly stable rate until the late 1960s, after which output
increased, with peaks in 1972 (8 equations) and 1976 (9 equations).
Table 1. Classification of 95 legibility equations into 9 categories
Group Category Dependent Measure Number
1 1 Common definitions; relationships between indices 26
2 Legible distance; height of text or graphics 22
3 Visual size; legibility potential 14
4 Luminance contrast 5
5 Legibility index 1
6 Reaction time 10
7 Exposure or performance time 7
8 Error rate; percentage of performance 5
2
9 Lighting and acuity level 5

47
1935 19
4119
44
1959 19
6919
7119
7219
7419
7619
7819
8019
8319
8619
8819
91 1992
1994
1995
1998 20
02
1982
1925
1942
1989
0123456789
10
1925
1929
1933
1937
1941
1945
1949
1953
1957
1961
1965
1969
1973
1977
1981
1985
1989
1993
1997
2001
2005
Developed year
Nu
mbe
r of
equ
atio
ns
Figure 25. Distribution of 77 legibility equations by year
2.3.2 Critical Variables Explored in the 95 Equations
A total of 26 independent factors and 7 dependent factors have been explored in
the 95 legibility equations. Among them, 10 critical factors affecting legibility are
identified: (a) age and (b) acuity of observer; (c) viewing distance; (d) horizontal and
vertical viewing angles; (e) visual angle of text; (f) font; (g) text height, width, and
strokewidth; (h) luminance contrast; (i) target luminance, background luminance, and
adapting luminance; and (j) color contrast. Theoretically, an ideal legibility equation
should holistically examine these 10 critical factors to correctly predict legibility.
However, each of the 95 equations has examined at least 2 but at most 7 variables
(Equation 85 in Appendix C). Other non-examined factors must be given preset values to
delimit the research scope. Values taken for granted, intangible assumptions, and
unspecified or not quantified preconditions of non-examined factors, as used by some
earlier researchers, would have harmed the validity of the equations they developed.

48
2.3.3 Explored Range of Viewing Conditions
The ranges of viewing conditions explored in the supporting research studies of
the 95 equations, to which they are presumed to apply, are summarized below.
2.3.3.1 Luminance and Illuminance Levels
Good lighting conditions are indispensable for legibility. The supporting research
studies of Equations 4, 31-36, 39-40, 43, 56-58, 63, 66, 67, 69-78, 80-85, 88, 91-93, as
listed in Appendix C, have quantitatively examined lighting conditions. Figure 26 shows
that the target luminance (Lt) explored in these research studies ranges from 0.016 cd/m2
to 31850 cd/m2. Likewise, as shown in Figure 27, the explored background luminance (Lb)
ranges from 0.0016 cd/m2 to 31850 cd/m2. The adapting luminance (La) was examined
only in Equation 43 (15.42 cd/m2), and Equations 69, 70 (3.426-34260 cd/m2).
0.01
0.1
1
10
100
1000
10000
100000
0 10 20 30 40 50 60 70 80 90equation number
lum
inan
ce in
cd/
m2 Lt
Figure 26. Range of target luminance explored in the supporting research of Equations 4, 43, 56, 66, 67, 69, 70, 76, 92, and 93 as listed in Appendix C
# Lt in cd/m2 4 0.25-400 43 0.65-2055.6, 1.13-479.6456 0.016-31850
66,67 35, 50, 70 69,70 13.7, 41.11, 82.22
76 0.34-68.52 92,93 0.25-400

49
0.001
0.01
0.1
1
10
100
1000
10000
100000
40 45 50 55 60 65 70 75 80 85 90equation number
lum
inan
ce in
cd/
m2 Lb
0
Figure 27. Range of background luminance explored in the supporting research of Equations 43, 57, 58, 63, 69, 70, and 88 as listed in Appendix C
Some research studies explored their lighting conditions in illuminance (I) rather
than luminance (Lt, Lb, La), probably due to the lack of awareness that luminance rather
than illuminance activates the visual perception of text. As shown in Figure 28,
illuminance explored in Equations 31-36, 39, 40, 69-78, 80-85, 88 and 91, as listed in
Appendix C, ranges from 0 lx (Equations 35, 36) to 1 million lx (Equations 69, 70).
In addition, the supporting research studies of Equations 14, 29, 43, 56, 57, 61, 62,
64, 66-68, 83-85, 89, 90, as shown in Appendix C, have qualitatively described their
lighting conditions, as listed in Table 2.
# Lb in cd/m2 43 0.127-15.25
57, 63 0.032-31850 58 0.0016-318.5
69, 70 3.426-256.95 88 0, 30, 61, 91, 122
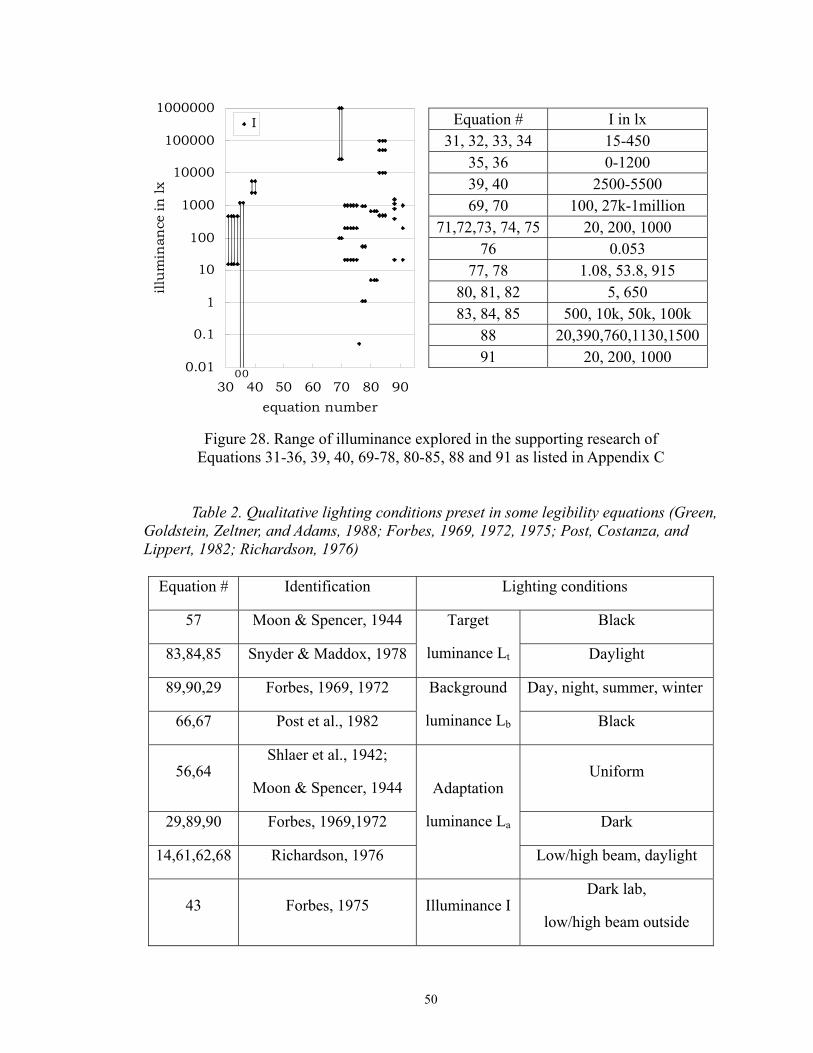
50
0.01
0.1
1
10
100
1000
10000
100000
1000000
30 40 50 60 70 80 90equation number
illu
min
ance
in lx
I
00
Figure 28. Range of illuminance explored in the supporting research of
Equations 31-36, 39, 40, 69-78, 80-85, 88 and 91 as listed in Appendix C
Table 2. Qualitative lighting conditions preset in some legibility equations (Green, Goldstein, Zeltner, and Adams, 1988; Forbes, 1969, 1972, 1975; Post, Costanza, and Lippert, 1982; Richardson, 1976)
Equation # Identification Lighting conditions
57 Moon & Spencer, 1944 Black
83,84,85 Snyder & Maddox, 1978
Target
luminance Lt Daylight
89,90,29 Forbes, 1969, 1972 Day, night, summer, winter
66,67 Post et al., 1982
Background
luminance Lb Black
56,64 Shlaer et al., 1942;
Moon & Spencer, 1944 Uniform
29,89,90 Forbes, 1969,1972 Dark
14,61,62,68 Richardson, 1976
Adaptation
luminance La
Low/high beam, daylight
43 Forbes, 1975 Illuminance IDark lab,
low/high beam outside
Equation # I in lx 31, 32, 33, 34 15-450
35, 36 0-1200 39, 40 2500-5500 69, 70 100, 27k-1million
71,72,73, 74, 75 20, 200, 1000 76 0.053
77, 78 1.08, 53.8, 915 80, 81, 82 5, 650 83, 84, 85 500, 10k, 50k, 100k
88 20,390,760,1130,150091 20, 200, 1000

51
In summary, the explored luminance and illuminance levels focus on the
magnitude range of 1-1000 (in cd/m2 or lx). This range covers both mesopic (0.001–3.4
cd/m2) and photopic ( 3.4 cd/m2) vision, where a cone-rod breaking effect exists in the
transition between them.
2.3.3.2 Luminance Contrast
Luminance contrast has a crucial effect on the legibility of text. Table 3 lists the
range of luminance contrast examined in Equations 43, 63, 69, 70, 77, and 78, as listed in
Appendix C. In addition, Forbes & Holmes (1939), Kuntz & Sleight (1950), and Zwahlen
& Schnell (1995) qualitatively described the luminance contrast in their research studies
as positive/negative to develop Equations 49-55 in Appendix C.
Table 3. Explored ranges of contrast in the supporting research (Green et al., 1988; Forbes, 1975; Boreczky, Green, Bos, and Kerst, 1988)
Equation # Identification Luminance contrast
63 Hecht, Peskin, and Patt,1935 0.04 - 0.8(Cmin)
43 Forbes,1975 30%,50%,80%; 3.1-25.1(Cr)
69, 70 Rogers, Spiker, and Cicinelli,1986 2, 4, 8(exp.1), 1.2-7.5(exp.2,3)
77, 78 Boreczky, Green, Bos, and Kerst,1988 1.5, 2.4, 20

52
2.3.3.3 Viewing Angles
Although text in practice is commonly viewed not perpendicular to the viewer,
this situation has rarely been examined in the literature. Only Reinwald (pre-1980),
Snyder & Maddox (1978), and Payne (1983) examined viewing angles, as shown in
Table 4. Snyder & Maddox, and Payne did not propose any equations, but Reinwald
developed the famous Reinwald formula (Equation 27 in Appendix C).
Table 4. Explored horizontal and vertical viewing angles (Shurtleff, 1980; Reger, 1989; Green et al., 1988)
Equation # Identification Horizontal φ Vertical α
27 Reinwald, before 1980 ±0 -90 ±0 -90
83,84,85 Snyder and Maddox, 1978 0 , ±45 0 , -15
88 Payne, 1983 0 , 15 , 30 , 45 , 60
2.3.3.4 Spectral Effect
Only Moon & Spencer (1944) and Hecht (1935) examined the effect of the light
spectrum (incandescent lamps, red light) on legibility and developed Equations 57, 58, 63,
as listed in Appendix C. Allen et al. (1966) also examined the spectrum of fluorescent
lamps but did not develop any equation. Other HID (High Intensity Discharge) lamps
were rarely examined before.

53
2.3.3.5 Color Contrast
Color contrast has been proven effective on legibility by Richardson (1976),
Forbes (1975), Moon & Spencer (1944), and Boreczky et al. (1988), as listed in Table 5.
No typical color contrast was used in the supporting research studies of these equations.
Table 5. Explored color contrast in the previous legibility equations
Equation # Identification Color contrast (∆E)
57 Moon & Spencer, 1944 Black/White
43 Forbes, 1975 White/Green; Black/Yellow
14, 61, 62,
68 Richardson, 1976
Black/Orange; Black/Silver; Black/Yellow;
Blue/Silver; Red/Silver
77, 78 Boreczky et al., 1988 White/Black, Yellow/Black, White/Blue,
Green/Black, Blue-Green/Black
2.3.4 Intended Applications of the 95 Equations
The intended applications of the 95 legibility equations depend on how they were
developed. Since Equations 1-25, as listed in Appendix C, are common definitions or
mathematically derived, they are believed generally applicable to any field. Equations 37
and 45 in Appendix C (the Bond’s rule) are used as a rule of thumb for rough estimation
in many viewing situations. In contrast, the application of the 69 regression equations
might be constrained to their developing situations. For example, Equation 94 was
54
developed when 1≤ Lb ≤ 1000 cd/m2; 10 ≤ C% ≤ 90; 0.2 ≤ Ac ≤ 2.0 min-1. Thus, Howett’s
equation (Equations 47, 48, and 95 in Appendix C), which was derived from Equation 94,
would have better applied in those conditions. Appendix C lists the detailed applications
of all 69 regression equations. In addition, the majority of the 95 legibility equations deal
with suprathreshold performance, and are thus also applicable only in suprathreshold
viewing situations. Only Equations 86 and 87 have examined threshold performance;
their detailed applicable conditions are listed in Appendix C.
Different viewing media were also used to develop equations, including roadway
signs, architectural signs, vehicle instrument panels, dot matrix displays, electronic
displays such as LCD, LED, CRT. Each equation is supposed to be used for the same type
of visual media on which it was developed. For example, Equations 4, 5, 39-44, 49-55,
61, 62, 65, 79, 89, 90, 92, and 93 in Appendix C were developed based on roadway signs,
highway signs, and traffic signs, and should thus be applied in traffic situations. Table 6
lists the equations with their viewing media. Some equations might be carefully extended
to similar visual media used to develop them. In terms of viewing angles, only Equations
18-25, 66-67, and 88, as listed in Appendix C, are applicable to common
not-perpendicular-to-the-display viewing situations. Among them, the Reinwald formula
(Equation 27 in Appendix C) is the only one to date that examines the effect of both
horizontal and vertical viewing angles on legibility distance. However, the Reinwald
formula does not examine other critical factors that are usually considered, such as
lighting and contrast, acuity of observers. Its application is thus limited in practice.

55
Table 6. Different types of viewing media examined in supporting research
Equation # Viewing media
4, 5, 39-44, 49-55, 61, 62,
65, 79, 89, 90, 92, 93 Roadway signs, traffic signs, reflective signs
26, 29, 37 Outdoor signs
6, 35, 36, 71-78, 91 Alphanumeric information signs, instrument panels,
numerical speedometers
41, 79-81, 83-85 Matrix pixels, dot matrix
30-34, 70, 80-82, 88 Electronic displays: LCD, CRT
45 Newsprints, magazine ads, letterheads, etc. in room
63, 64 Large contiguous surfaces with uniform surround
luminance
23, 24 Uniform color spaces
66, 67 Colored patches on video displays
56, 57, 60 Landolt rings
14, 58, 59 Bars
38 Neon advertising
42 Blur techniques of symbol highway signs
The majority of the 95 legibility equations have quantitatively specified their
viewing conditions where they are supposed to be applied. However, Equations 13, 30-36,
40, 56, 57, 63, 64, as listed in Appendix C, have only intangibly described their viewing
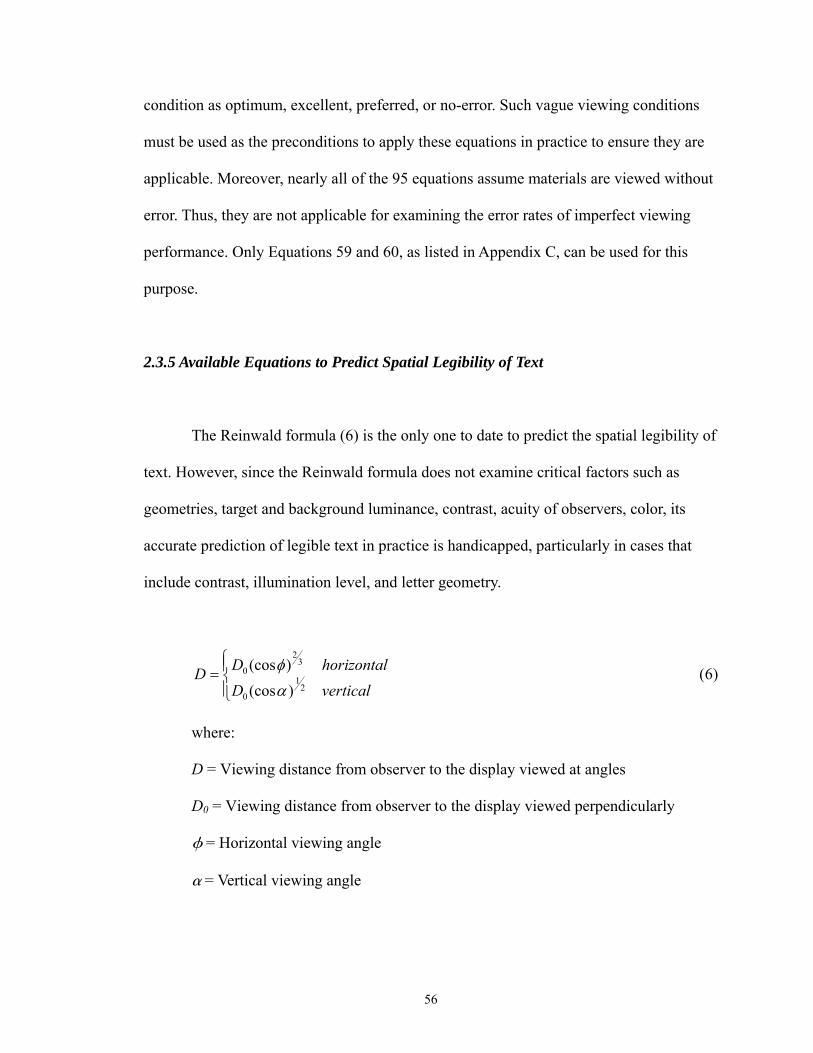
56
condition as optimum, excellent, preferred, or no-error. Such vague viewing conditions
must be used as the preconditions to apply these equations in practice to ensure they are
applicable. Moreover, nearly all of the 95 equations assume materials are viewed without
error. Thus, they are not applicable for examining the error rates of imperfect viewing
performance. Only Equations 59 and 60, as listed in Appendix C, can be used for this
purpose.
2.3.5 Available Equations to Predict Spatial Legibility of Text
The Reinwald formula (6) is the only one to date to predict the spatial legibility of
text. However, since the Reinwald formula does not examine critical factors such as
geometries, target and background luminance, contrast, acuity of observers, color, its
accurate prediction of legible text in practice is handicapped, particularly in cases that
include contrast, illumination level, and letter geometry.
⎪⎩
⎪⎨⎧
=verticalDhorizontalDD
21
0
32
0
)(cos)(cos
αφ (6)
where:
D = Viewing distance from observer to the display viewed at angles
D0 = Viewing distance from observer to the display viewed perpendicularly
φ = Horizontal viewing angle
α = Vertical viewing angle

57
In addition, among the 95 legibility equations, Howett’s equation (7) is probably
one of the best equations for predicting the legibility of text viewed perpendicularly, for
two reasons. First, this equation examines the maximum number of parameters, including
geometries, background luminance, and contrast of text, and the Snellen eyesight of the
observer. Second, Howett’s equation (1983) was mathematically derived from Kaneko’s
equation (8) (Kaneko and Ito, 1978, cited by Howett, 1983).
( ) 532.0%
213.04101.4 −−− ⋅⋅⋅⎟⎠⎞
⎜⎝⎛⋅××= CLS
SwHDH bd (7)
where:
H = Character height
D = Legibility distance
Sw = Strokewidth of character, or detail of graphics
Sd = Denominator in the Snellen ratio
Lb = Background luminance
C% = Luminance contrast percent
532.0%
213.006298.0 CLA bc = (8)
where:
Ac = Visual acuity, the reciprocal of the finest legible detail
Lb = Background luminance
C% = Luminance contrast percent

58
Neither Kaneko’s equation nor Howett’s equation examines the ambient light of
the viewing environments, even though ambient light has been proven effective on visual
perception. In addition, Howett’s equation examines only single letter, A~Z, and is thus
not applicable to words or sentences. Furthermore, the aging effect on the legibility of
text is believed to be indirectly evaluated in Howett’s equation through the parameter of
acuity level, since aged people usually have decreased eyesight. Using this parameter,
Howett’s equation is able to examine all levels of eyesight.
2.4 Summary
Since the emergence of lecture halls in the 1960s, architects have had to
accurately and conveniently define ideal viewing areas in order to appropriately arrange
seats in the audience area. The empirical experience gained in practice have been
summarized into architectural guidelines for architects to define the ideal viewing area as
a fan-shaped plan and the optimum shapes of longitudinal sections. Although these
empirical guidelines are convenient to use and have proven useful in practice, they have
never incorporated a scientific and quantitative index, which is the spatial legibility of
text. Ideal viewing areas in modern lecture halls could be precisely found by using
legibility equations to calculate the spatial legibility of text presented on multiple displays
mounted at different locations with different geometries, mounting heights, orientations,
and lighting conditions.
59
Through a comprehensive review of the literature on the legibility of Roman
characters, all of the 95 legibility equations ever published have been identified and
reviewed. Ten critical factors for determining the legibility levels of text viewed in
lecture halls have been identified as (a) age and (b) acuity of observer; (c) viewing
distance; (d) horizontal and vertical viewing angles; (e) visual angle of text; (f) font; (g)
text height, width, and strokewidth; (h) luminance contrast; (i) target luminance,
background luminance, and adapting luminance; and (j) color contrast. By reviewing the
95 legibility equations, also in light of the fundamentals of visual perception of text, a
good legibility equation for calculating the ideal viewing areas in lecture halls should be
able to predict the legible size or distance of text viewed at different angles, lighting
levels, by examining all critical factors.
Among the 95 equations, only the Reinwald formula can be used to predict the
legible distances of text viewed from different viewing angles. Unfortunately, this
equation does not examine other critical factors that are usually examined, and thus is
insufficient for determining the ideal viewing areas in lecture halls. On the other hand,
Howett’s equation, which was mathematically derived from Kaneko’s equation, examines
the most number of critical factors, a total of 6, but not viewing angles.

60
CHAPTER 3
Research Problems and Steps to Their Solution
The goal of this study is to provide solutions for two principal research demands.
First, architects need to determine ideal viewing areas in modern lecture halls, where
observers can read text simultaneously presented on multiple visual media mounted at
different locations with different geometries, orientations, and lighting conditions. Such
complicated viewing situations require that architects ensure that every single seat in the
audience area, particularly those in the back row and off axis, has a very good view (with
enough legibility of the text presented on all displays). However, as reviewed in Chapter
2, the conventional guidelines that architects have been using for decades cannot
guarantee that because the guidelines were developed based not on a legibility index but
on experience, making them too imprecise for finding an overlapped ideal viewing area
in modern lecture halls. Therefore, a new reliable and quantitative design method is
necessary for better accuracy and flexibility.
Second, the expected quantitative design method for determining ideal viewing
areas should be undertaken in light of the spatial legibility of text viewed in modern
lecture halls, calculated using legibility equations. As reviewed in Chapter 2, a total of 95

61
legibility equations have been commonly used in the human factors and engineering
fields. Thus far, however, architects have rarely used them to design buildings with
enhanced legibility, especially lecture halls, although “spatial legibility in architecture” as
a topic for wayfinding has been dealt with for years (e.g., Watanabe, A., 1999, A Study on
the Spatial Legibility in Architecture by Wayfinding Experiment, which won the AIJ
(Architectural Institute of Japan) Prizes 1999). To meet these two research demands, this
study will develop a preliminary computation-program-aided design method for solving
three major research problems identified in the literature review of Chapter 2, as detailed
below.
3.1 Research Problems
3.1.1 Problem 1: Architects Lack a Quantitative Method for Finding Ideal Viewing Areas
Research problem 1: Architects lack a quantitative method for precisely defining
ideal viewing areas in modern lecture halls, taking into account the spatial legibility of
text.
What is an ideal viewing area of text presented in lecture halls and how should it
be defined? When text is viewed at different angles by observers sitting on a viewing
plane, for example, horizontal or vertical, a two-dimensional ideal viewing area of text is
shaped by the gradually decreased legibility distance (the distance from the observer’s
eye to the legible text) at increasing viewing angles ±0 - 90 , as illustrated in Figure 29.

62
Figure 29. Horizontal and vertical ideal viewing area of text
(for illustrative purposes, not to scale, no units)
In reality, however, text is commonly viewed by observers randomly sitting in a
three-dimensional space at various incident angles between the display normal and the
sightline of the observer, rather than strictly on a plane. The incident angle in 3D viewing
is jointly determined by both horizontal and vertical viewing angles. For such
not-perpendicular-to-the-display viewing of a single text, there is a 3D ideal viewing
sphere, as illustrated in Figure 30. This ideal viewing sphere is actually the spatial
distribution of the legibility distances of single text along three dimensions. Although the
3D ideal viewing sphere gives architects a good feeling about its size and shape, it is
rather impractical for architects to use directly in the drawings of lecture hall design.
Architects tend to prefer an ideal viewing area along the viewing plane at eye height level
parallel to the sloped floor for seating arrangements. Architects may also demand ideal
viewing areas along other viewing planes, for example, the vertical plane for the ideal
section profile or the horizontal plane for the ideal plan shape of modern lecture halls.
Geometrically, such an ideal viewing area along a specified viewing plane can be
obtained by slicing the 3D ideal viewing sphere with the viewing plane, as illustrated in
Figure 31.
Display normal
Horizontal ideal viewing area
Vertical ideal viewing area
Display normal

63
(a) 3D view (b) side view
Figure 30. Three-dimensional ideal viewing sphere of a single text
(for illustrative purposes, not to scale, no units)
(a) view perpendicular (b) section view to the viewing plane
Figure 31. Ideal viewing area of a single text along the viewing plane
at the observer’s eye height parallel to the sloped floor in lecture hall, obtained by slicing the 3D ideal viewing sphere with this viewing plane
(for illustrative purposes, not to scale, no units)
Display normal
Display normal
Ideal viewing sphere of text
Ideal viewing area along the viewing plane
3D ideal viewing sphere
Sloped floor

64
For the same text viewed under the same viewing conditions, in contrast to its
constant 3D ideal viewing sphere, the shape and size of its 2D ideal viewing area varies
with the location and orientation of the viewing plane. In lecture hall design, fortunately,
architects usually require that the ideal viewing area be along the viewing plane parallel
to the sloped floor at the observer’s eye height, as shown in Figure 31.
Then how can this ideal viewing area in lecture halls be determined? This ideal
viewing area is shaped by slicing the 3D ideal viewing sphere of text with the specified
viewing plane at the observer’s eye height parallel to the sloped floor, as shown in Figure
31. Apparently, this task goes beyond the conventional architectural guidelines
summarized in Chapter 2.2, for three reasons. First, these empirical guidelines are not
based on the spatial legibility of text but on experience, and are thus not quantitative and
sufficiently precise. For example, these guidelines give the same legibility distance of a
single text viewed at angles ±30 -60 , as shown in Figure 15, which is clearly different
from the prediction using legibility equations, such as the Reinwald formula, (6)
previously. Second, these guidelines assume the viewing plane is either horizontal or
vertical; the viewing plane parallel to the sloped floor at eye height level as specified in
lecture halls is not considered. Third, except for the screen width, viewing distance, and
viewing angles, these guidelines do not consider other critical factors that are usually
considered for legibility, e.g., lighting, acuity. The inability of these guidelines is more
obvious in modern lecture halls where text is presented on multiple visual media having
different locations, geometries, orientations, and lighting conditions. Therefore, architects
need a quantitative and reliable method for precisely defining ideal viewing areas of

65
modern lecture halls, in light of the spatial legibility of text. This quantitative method
should use an equation as the underlying algorithm that predicts the spatial legibility of
text from all critical factors that are usually considered.
3.1.2 Problem 2: No Equation Predicts Spatial Legibility of Text from 7 Factors
Research problem 2: The equation that predicts the spatial legibility of text from
all seven critical factors is not available in the literature.
Recall from Chapter 2, there are ten critical factors that could be examined by the
demanded legibility equation to predict the ideal viewing areas of text in lecture halls.
Restricted by the ten assumptions used in this study, seven critical factors still remain,
including (a) acuity of observer; (b) viewing distance; (c) viewing angles; (d) visual angle
of text; (e) text height, width, and strokewidth; (f) luminance contrast; and (g) target
luminance, background luminance, and surrounding luminance. However, no legibility
equation has ever appeared in the literature to predict the spatial legibility of text based
on all seven critical factors.
As thoroughly reviewed in Chapter 2, the majority of these legibility researchers
assumed in their studies that materials were viewed perpendicularly. Only Reinwald
(pre-1980) and Payne (1983), as cited by Shurtleff, 1980; Reger, 1989; and Green et al.,
1988, examined the common not-perpendicular-to-the-display viewing conditions.
Among the 95 legibility equations, the Reinwald formula, (6) previously, is the only one

66
that examines the spatial legibility of text. This equation examines only legibility distance
and horizontal and vertical viewing angles; other critical factors, such as luminances,
contrast, text size, are not considered. Therefore, its predictability of the spatial legibility
of text in modern lecture halls is handicapped, where all seven critical factors need to be
holistically examined for accuracy. Consequently, a new equation is needed to predict the
spatial legibility of text based on all seven critical factors.
3.1.3 Problem 3: Ambient Light Is Not Examined In the Derived Equation
Research problem 3: The derived equation for predicting the spatial legibility of
text fails to examine the surrounding luminance of the ambient environments.
The required equation for predicting the spatial legibility of text based on all
seven critical factors will be derived later in this study based on the existing Howett’s
equation (1983), as (7) previously. However, Howett’s equation does not examine the
surrounding luminance (Ls) of the ambient environments, even though ambient light has
been proven effective nowadays on visual perception, as reviewed in Chapter 2.
Nevertheless, it is not yet clear whether the surrounding luminance (Ls) has a large effect
on the legibility of text, when its background luminance and luminance contrast remain
constant. If the surrounding luminance affects legibility of text, then its absence in the
equation to be derived might seriously harm its accurate prediction of the spatial
legibility of text viewed in modern lecture halls. Otherwise, its absence is tolerable.
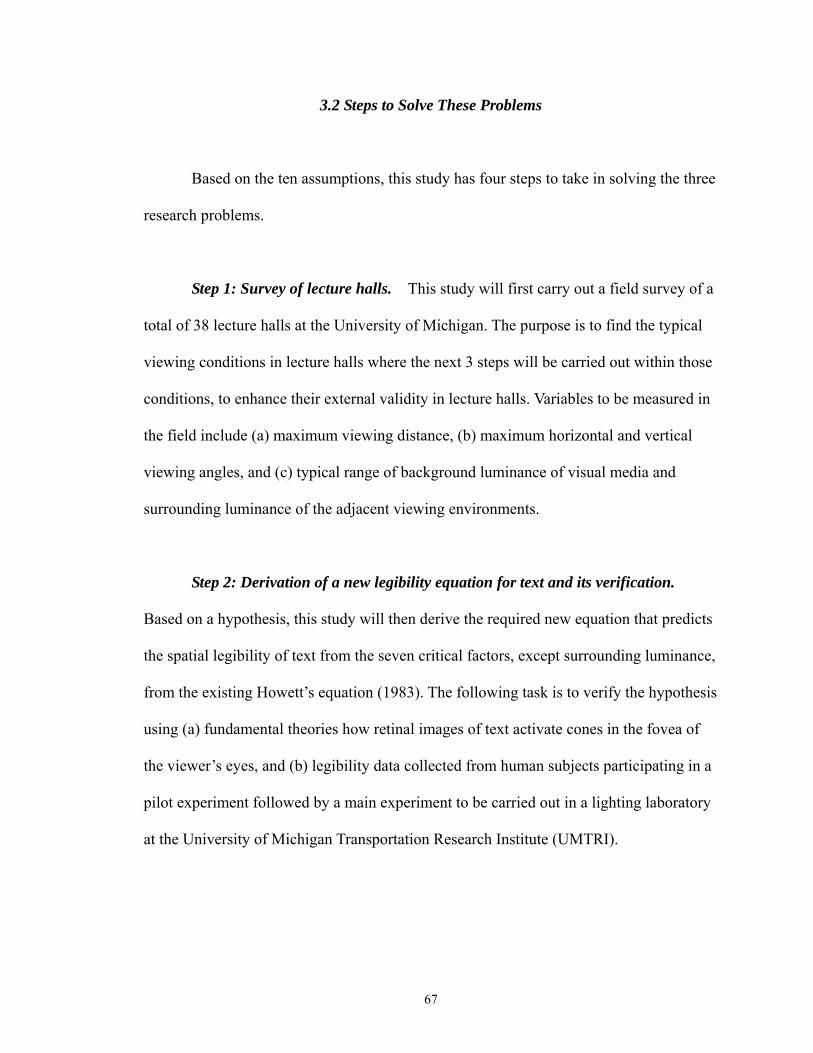
67
3.2 Steps to Solve These Problems
Based on the ten assumptions, this study has four steps to take in solving the three
research problems.
Step 1: Survey of lecture halls. This study will first carry out a field survey of a
total of 38 lecture halls at the University of Michigan. The purpose is to find the typical
viewing conditions in lecture halls where the next 3 steps will be carried out within those
conditions, to enhance their external validity in lecture halls. Variables to be measured in
the field include (a) maximum viewing distance, (b) maximum horizontal and vertical
viewing angles, and (c) typical range of background luminance of visual media and
surrounding luminance of the adjacent viewing environments.
Step 2: Derivation of a new legibility equation for text and its verification.
Based on a hypothesis, this study will then derive the required new equation that predicts
the spatial legibility of text from the seven critical factors, except surrounding luminance,
from the existing Howett’s equation (1983). The following task is to verify the hypothesis
using (a) fundamental theories how retinal images of text activate cones in the fovea of
the viewer’s eyes, and (b) legibility data collected from human subjects participating in a
pilot experiment followed by a main experiment to be carried out in a lighting laboratory
at the University of Michigan Transportation Research Institute (UMTRI).

68
Step 3: Testing ambient light effect on legibility. Theoretically, ambient light
may contribute only little to the adaptation luminance of text viewed in lecture halls.
Thus, the surrounding luminance might have little effect on the legibility of text when the
background luminance and contrast of the text are kept constant. This is the second
hypothesis used in this study. This hypothesis will be tested using legibility data collected
from human subjects participating in a third laboratory experiment to be carried out at
UMTRI.
Step 4: Development of a computation program and its application in lecture
halls. After the derived equation that predicts the spatial legibility of text from all seven
critical factors has been verified, it will then be used to develop a computation program in
MatLab. This program will calculate an overlapped ideal viewing area of text
simultaneously presented on multiple displays, which are mounted at different locations,
with different geometries, orientations, and lighting conditions, along any viewing plane.
This program can be used in any fields, such as architecture, transportation,
advertisement, electronic displays, where reading text at different viewing angles is
important. This program is then applied in modern lecture halls to develop a
computation-program-aided design method for architects to determine an overlapped
ideal viewing area of multiple displays at the observer’s eye height level along the sloped
floor. To verify the external validity of this method, a field experiment will be carried out
using human subjects in the lecture hall in the Art & Architecture building at the
University of Michigan.

69
3.3 Summary
Using ten assumptions, this study will solve three problems, including:
1. Architects lack a quantitative and reliable method to precisely determine ideal
viewing areas of lecture halls, in light of the spatial legibility of text.
2. The equation that predicts the spatial legibility of text based on all seven
critical factors is not available in the literature. A new equation is needed.
3. The equation to be derived from the existing Howett’s equation (1983), using
a hypothesis, does not examine the surrounding luminance of the ambient
environment. The influence of the surrounding luminance on legibility of text
is not clear, however, when the background luminance and contrast of text
viewed remain unchanged.
This study will use four steps to develop a computation-program-aided design
method for architects to determine an overlapped ideal viewing area of text presented on
multiple displays installed in modern lecture halls.
Step 1: Field survey of a total of 38 lecture halls at the University of Michigan, to
find the typical viewing conditions in lecture halls where the next 3 steps will be carried
out under those conditions.
Step 2: Derivation of a new legibility equation that predicts the spatial legibility
of text based on seven critical factors, except surrounding luminance, from the existing
Howett’s equation (1983), and verification of the hypothesis used for this derivation,
using fundamental theories and laboratory experiments.

70
Step 3: Testing the ambient light effect on legibility using a third laboratory
experiment.
Step 4: Development of a computation program in MatLab, and its application in
lecture halls, to calculate an overlapped ideal viewing area of text simultaneously
presented on multiple displays, and verification of this computation-program-aided
design method using a field experiment.

71
CHAPTER 4
Step 1: Survey of Lecture Halls
As the first step in solving these research problems, this study measures the
viewing conditions of text presented in a total of 38 lecture halls at the University of
Michigan. The purpose of this survey is to determine a boundary of typical viewing
conditions of text presented in lecture halls, including (a) the maximum viewing distance
Dmax from the observer’s eye to the displays, (b) the maximum horizontal viewing angle
φmax and the maximum vertical viewing angle αmax , which are then used to calculate the
maximum incident angle ξmax between the observer’s visual line and the display normal,
(c) the typical range of background luminance (Lb) of text, that is, surface luminance of
the visual media, and (d) the typical range of surrounding luminance (Ls) of text. To
strengthen their outcomes, the viewing conditions in all experiments to be carried out
later must match these surveyed ranges.
4.1 Lecture Halls Selected for Survey
The surveyed 38 lecture halls are carefully chosen from the list on the University
of Michigan Postsecondary Education Facilities Inventory & Classification Manual,

72
using five standards listed below:
1. Large capacity ( 75 seats). Specifically, small lecture halls have 75-149 seats.
Large lecture halls have 150-299 seats. Lecture theatres have 300 seats.
2. Teaching-learning activities inside that are not tied to a specific subject or
discipline, where the audience focuses their vision on some focal points
(visual materials) in the front space.
3. At least two visual media are used inside, including blackboard, chalkboard,
marker board, tack board, projection screens, or TV monitor.
4. Fixed and compact seating arrangement.
5. Sloped or tiered floor, or flat floor (in small lecture halls).
Appendix D lists the 38 lecture halls in terms of their capacity, room area in
square feet, campus location, number of visual media, and year built. By capacity, the 38
lecture halls include 16 small lecture halls, 15 large lecture halls, and seven lecture
theatres, as shown in Appendix D. Among the 38 lecture halls, 24 have two visual media
installed, most are blackboard/whiteboard and projection screen, while nine lecture halls
use three visual media, and five lecture halls use four media. The years in which 35 of the
38 surveyed lecture halls were built are known. Among them, two lecture halls were built
before 1900, 12 lecture halls were built from 1915 to 1958, while 20 lecture halls were
built from 1960 to 1991; only one lecture hall was built after 2000, in 2004. Therefore,
the ranges of viewing conditions surveyed in the 38 lecture halls are sufficient for this
study to find the general viewing conditions in typical lecture halls.

73
4.2 Procedure and Equipments
Four steps are used to field measure the typical viewing conditions of text
presented in the 38 lecture halls.
Step 1. Find the number and type of visual media installed in the lecture hall,
which will determine how many different instructional methods, and correspondingly,
different viewing conditions, might have been used.
Step 2. Measure the maximum viewing distance Dmax from the most off-axis
back row seat to the far end of the visual media using a 300 ft fiber glass tape, as shown
in Figure 32. Then take pictures from this seat location to demonstrate the real view of
these displays at the maximum viewing distance.
Step 3. Find the most off-axis seat(s) where text presented on the far end edge of
the visual media are viewed at the maximum incident angle ξmax, and then measure the
geometrical relationships between this seat(s) and the visual media, to calculate the
maximum horizontal viewing angle φmax and the maximum vertical viewing angle αmax.
In addition to the 300 ft fiber glass tape, a 50 ft sonic laser tape is used to facilitate
measuring heights, as shown in Figure 32. Finally, take pictures at this seat(s) location to
show the real off-axis view of displays at the maximum viewing angle ξmax.
74
Figure 32. A 300 ft fiber glass tape and a 50 ft sonic laser tape to measure distance,
and a recently calibrated Minolta LS-100 luminance meter to measure the brightness
Step 4. Turn on different lighting conditions used for different instructional
modes, one by one (e.g., blackboard mode versus projection screen mode). Under each of
these lighting conditions, measure the minimum and maximum surface luminance of the
visual media, that is, the background luminance (Lb) of text presented, using a recently
calibrated Minolta LS-100 luminance meter, as illustrated in Figure 32, by following the
measurement pattern illustrated in Figure 33. Then measure the minimum and maximum
surrounding luminance (Ls) of text using another measurement pattern shown in Figure
34. Finally, take pictures of the lecture hall interior under different viewing conditions.

75
1m 1m 1m0.5m
1m1m
0.5m
4m
3m
0.5m
0.5m
Figure 33. Example pattern for measuring the background luminance (Lb) of text
presented on a display that is 4 m wide by 3 m high
center inseating area
display
display
57�120�
sloped floor
78�
plan view section view 3D view
Figure 34. Example pattern for measuring the surrounding luminance (Ls) of text presented on a display that is 4 m wide by 3.5 m high, measuring points are distributed
inside the viewing field (120 ×135 ) of the observer’s binocular eyes
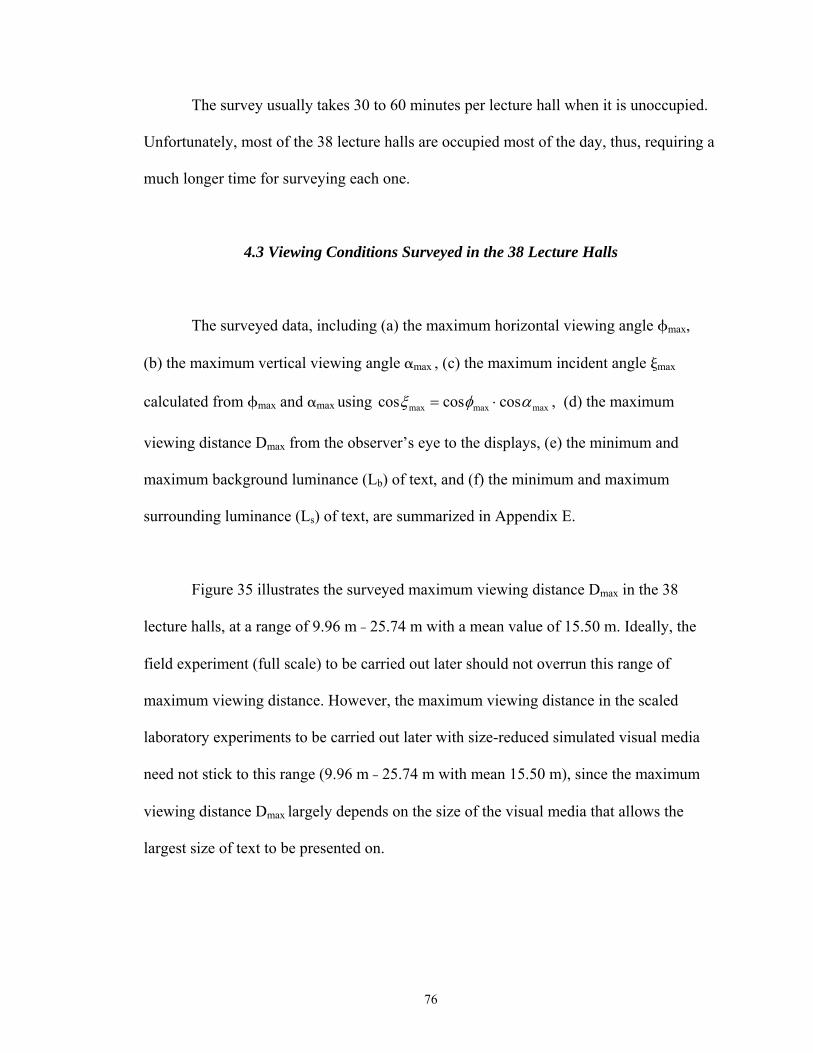
76
The survey usually takes 30 to 60 minutes per lecture hall when it is unoccupied.
Unfortunately, most of the 38 lecture halls are occupied most of the day, thus, requiring a
much longer time for surveying each one.
4.3 Viewing Conditions Surveyed in the 38 Lecture Halls
The surveyed data, including (a) the maximum horizontal viewing angle φmax,
(b) the maximum vertical viewing angle αmax , (c) the maximum incident angle ξmax
calculated from φmax and αmax using maxmaxmax coscoscos αφξ ⋅= , (d) the maximum
viewing distance Dmax from the observer’s eye to the displays, (e) the minimum and
maximum background luminance (Lb) of text, and (f) the minimum and maximum
surrounding luminance (Ls) of text, are summarized in Appendix E.
Figure 35 illustrates the surveyed maximum viewing distance Dmax in the 38
lecture halls, at a range of 9.96 m - 25.74 m with a mean value of 15.50 m. Ideally, the
field experiment (full scale) to be carried out later should not overrun this range of
maximum viewing distance. However, the maximum viewing distance in the scaled
laboratory experiments to be carried out later with size-reduced simulated visual media
need not stick to this range (9.96 m - 25.74 m with mean 15.50 m), since the maximum
viewing distance Dmax largely depends on the size of the visual media that allows the
largest size of text to be presented on.

77
5.00
10.00
15.00
20.00
25.00
30.00
EE
131
1M
oder
n la
ng.
122
0C
hem
istr
y 12
00C
oole
y G
906
EE
100
1H
utc
hin
s h
all 1
20H
utc
hin
s h
all 1
50E
E 1
500
Com
pute
r 16
70D
enn
ison
296
CC
litt
le 1
528
DA
NA
104
0D
enta
l G55
0C
hem
istr
y 16
40A
rch
210
4D
OW
101
3D
enta
l G32
2E
ast
hal
l 136
0C
C li
ttle
254
8B
. FX
B 1
109
GG
bro
wn
150
4E
ast
hal
l 132
4M
oder
n la
ng.
140
0D
enn
ison
182
Ch
emis
try
1400
Mod
ern
lan
g. 1
200
An
gle
hal
l DIO
E 1
610
Med
ical
533
0H
utc
hin
s h
all 1
00K
rau
s E
d. 2
140
Ch
emis
try
1210
Edu
cati
on 1
202
Ch
emis
try
1800
Den
tal G
005
Ch
rysl
er 2
20A
ngl
e h
all B
Lorc
h h
all 1
40
Lecture halls
Max
imu
m v
iew
ing
dist
ance
in m
eter
s
Dmax
Figure 35. Surveyed maximum viewing distance Dmax in all 38 lecture halls,
at a range 9.96 m -25.74 m with an average 15.50 m
For viewing angles, Figure 36 illustrates the maximum horizontal viewing angle
φmax and the maximum vertical viewing angle αmax, which are calculated using the
geometrical relationships measured in the 38 lecture halls. As shown in Figure 36, the
maximum horizontal viewing angle φmax ranges from 43.5 to 80.4 with a mean value of
64.1 , while the maximum vertical viewing angle αmax ranges from 22.2 to 68.5 , with a
mean value of 43.6 . Therefore, observers in the 38 lecture halls usually have wider
horizontal viewing fields than vertical ones. Ideally, the laboratory and field experiments
to be carried out later should have their viewing angles (1) αmax < φmax, and (2) fit in the
ranges of 43.5 ≤ φmax ≤ 80.4 and 22.2 ≤ αmax ≤ 68.5 . In addition, for the maximum
incident angle ξmax, calculated using maxmaxmax coscoscos αφξ ⋅= , Figure 36 shows its
range in the 38 lecture halls as 48.3 ≤ ξmax ≤ 86.5 , with a mean value of 71.6 .

78
20.0
30.0
40.0
50.0
60.0
70.0
80.0
90.0
Coo
ley
G90
6E
ast
hal
l 136
0C
C li
ttle
254
8M
edic
al 5
330
Lorc
h h
all 1
40C
C li
ttle
152
8A
ngl
e h
all D
Ch
rysl
er 2
20C
hem
istr
y 16
40A
ngl
e h
all B
Den
tal G
322
EE
150
0C
hem
istr
y 12
10K
rau
s E
d. 2
140
Edu
cati
on 1
202
Ch
emis
try
1200
Den
nis
on 2
96G
G b
row
n 1
504
Hu
tch
ins
hal
l 120
EE
100
1D
enta
l G55
0C
hem
istr
y 18
00C
hem
istr
y 14
00M
oder
n la
ng.
122
0D
enta
l G00
5C
ompu
ter
1670
IOE
161
0A
rch
210
4B
. FX
B 1
109
DO
W 1
013
DA
NA
104
0H
utc
hin
s h
all 1
50E
ast
hal
l 132
4D
enn
ison
182
Hu
tch
ins
hal
l 100
EE
131
1M
oder
n la
ng.
120
0M
oder
n la
ng.
140
0
Lecture halls
max
imu
m v
iew
ing
angl
es in
deg phi_max
alpha_maxksi_max
Figure 36. Surveyed maximum horizontal viewing angle φmax, maximum vertical viewing angle αmax, and maximum incident angle ξmax, maxmaxmax coscoscos αφξ ⋅= , in all 38 lecture halls, usually αmax < φmax, 48.3 ≤ ξmax ≤ 86.5 , with a mean value of 71.6
Figure 37 lists the measured minimum and maximum background luminances Lb
of text presented on all visual media in the 38 lecture halls, except for the projection
screens, due to the inaccessibility of the coded projectors in most of the lecture halls (32
of 38). Based on Figure 37, the range of background luminance Lb of text presented in
typical lecture halls is 2.81 cd/m2 ± 4.73 cd/m2 ≤ Lb ≤ 86.00 cd/m2 ±102.28 cd/m2.
Fortunately, the typical brightness of projection screens used in practice also falls in this
range for two facts. First, the standard ANSI/SMPTE 196M-2003 for the indoor theatre
and review room projection-screen luminance and viewing conditions requires a nominal
screen luminance as 55 cd/m2 with a range of 41 cd/m2 to 75 cd/m2 allowed and a
minimum 34 cd/m2 for theatres, with 55 cd/m2 ± 7 cd/m2 for review rooms (Society of

79
Motion Picture and Television Engineers, 2003). Second, as listed in Table 7, the surface
brightness of projection screens measured in 6 lecture halls also falls in the range
2.81 cd/m2 ± 4.73 cd/m2 ≤ Lb ≤ 86.00 cd/m2 ±102.28 cd/m2.
0.01
0.10
1.00
10.00
100.00
1000.00K
rau
s E
d. 2
140
EE
100
1D
enta
l G00
5C
oole
y G
906
DO
W 1
013
EE
150
0M
oder
n la
ng.
140
0M
oder
n la
ng.
120
0A
ngl
e h
all D
DA
NA
104
0C
hem
istr
y 12
00H
utc
hin
s h
all 1
50A
ngl
e h
all B
Ch
emis
try
1400
Lorc
h h
all 1
40E
ast
hal
l 132
4D
enta
l G55
0H
utc
hin
s h
all 1
00D
enn
ison
182
Ch
emis
try
1210
EE
131
1C
ompu
ter
1670
Med
ical
533
0A
rch
210
4C
hem
istr
y 18
00M
oder
n la
ng.
122
0C
hem
istr
y 16
40G
G b
row
n 1
504
IOE
161
0E
duca
tion
120
2H
utc
hin
s h
all 1
20C
C li
ttle
152
8C
hry
sler
220
Den
tal G
322
CC
litt
le 2
548
B. F
XB
110
9D
enn
ison
296
Eas
t h
all 1
360
Lecture halls
Ran
ge o
f Lb
in c
d/m
2 mean Lb
Figure 37. Range of background luminance Lb of text presented on all visual media in the 38 lecture halls except for projection screens
Table 7. Surface luminance of projection screens measured in 6 lecture halls
Lecture halls Lb in
cd/m2 Chemistry
1210
Chemistry
140
Education 1202
(overhead
projector)
EE1311
Hutchins Hall
120 (overhead
projector)
Lorch Hall
140
min 29.24 19.5 59.95 33.38 39.41 29.47
max 48.17 33.27 104.6 47.72 173.8 34.45
mean 39.01 26.38 84.42 43.43 87.38 32.55

80
Figure 38 illustrates the range of surrounding luminance Ls measured at each
point of the pattern shown in Figure 34 in the 38 lecture halls. The Ls in the 38 lecture
halls has a range of 1.50 cd/m2 ± 3.15 cd/m2 ≤ Ls ≤ 77.87 cd/m2 ±76.78 cd/m2, which is
then used to guide the experiments to be carried out later in this study.
0.00
0.01
0.10
1.00
10.00
100.00
1000.00
Kra
us
Ed.
214
0H
utc
hin
s h
all 1
50Lo
rch
hal
l 140
An
gle
hal
l BH
utc
hin
s h
all 1
20E
E 1
001
Eas
t h
all 1
324
Ch
emis
try
1640
Com
pute
r 16
70E
E 1
311
Hu
tch
ins
hal
l 100
Den
tal G
550
EE
150
0D
enn
ison
182
Coo
ley
G90
6C
hem
istr
y 12
10C
hem
istr
y 14
00D
enta
l G00
5C
hem
istr
y 18
00M
oder
n la
ng.
122
0M
edic
al 5
330
Ch
emis
try
1200
Arc
h 2
104
DO
W 1
013
GG
bro
wn
150
4C
C li
ttle
152
8C
hry
sler
220
CC
litt
le 2
548
IOE
161
0D
enn
ison
296
Den
tal G
322
Eas
t h
all 1
360
B. F
XB
110
9E
duca
tion
120
2A
ngl
e h
all D
Mod
ern
lan
g. 1
200
Mod
ern
lan
g. 1
400
DA
NA
104
0Lecture halls
Ran
ge o
f su
rrou
ndi
ng
lum
inan
ce L
sin
cd/
m2
mean Ls
Figure 38. Range of surrounding luminance Ls measured in the 38 lecture halls

81
4.4 Summary
Based on the field measurements in the 38 lecture halls at the University of
Michigan, the typical viewing conditions of common lecture halls are found as:
1. For the maximum viewing distance, 9.96 m ≤ Dmax ≤ 25.74 m, with mean
15.50m.
2. For the horizontal and vertical viewing angles,
αmax < φmax, 43.5 ≤ φmax ≤ 80.4 and 22.2 ≤ αmax ≤ 68.5 ; for the incident
angle, 48.3 ≤ ξmax ≤ 86.5 , with mean 71.6 .
3. The range 2.81 cd/m2 ± 4.73 cd/m2 ≤ Lb ≤ 86.00 cd/m2 ±102.28 cd/m2 is for
the background luminance of text.
4. For the surrounding luminance measured at each point following the
measuring pattern shown in Figure 34,
1.50 cd/m2 ± 3.15 cd/m2 ≤ Ls ≤ 77.87 cd/m2 ±76.78 cd/m2.
These typical viewing conditions should be abided by in the next steps of this
study to carefully design the experiments by matching their viewing conditions to these
ranges.

82
CHAPTER 5
Step 2: Derivation of an Equation to Predict the Spatial Legibility of Text and Its Verification
Based on a hypothesis, this study derives a new equation to predict the spatial
legibility of text based on seven critical factors, including (a) acuity of observer,
(b) viewing distance, (c) viewing angles, (d) visual angle subtended by text, (e) text
height, width, and strokewidth, (f) luminance contrast, and (g) target luminance and
background luminance. This hypothesis is then verified using (a) fundamental theories of
how retinal images of text activate cones in the fovea of a viewer’s eyes, and
(b) laboratory data from human subjects.
5.1 Derivation of an Equation to Predict the Spatial Legibility of Text
This equation utilizes the definition of solid angle ω subtended by any characters
to the observer’s eyes. The solid angle is defined as (9), and is illustrated in Figure 39. In
Figure 39, an area A at viewing distance D away subtends a solid angle ω to the eye
located at point P, with an incident angle ξ between the sightline OP and the normal axis
of the area A.

83
ξω cos2DA
= (9)
where:
ω = Solid angle subtended by the character to the observer’s eyes
ξ = Incident angle, the angle between the display normal and observer’s sightline
A = Normal character area
D = Viewing distance
Area A
ξω
O
P
D
Figure 39. Definition of solid angle ω (Rea, 2000, Figure 9-1, p. 9-2)
The normal character area (an notated as A), as used in (9), is measured
differently for letters or graphics. The spatial distribution (orientations and spacing) of
strokes of letters A~Z determines which letter it is. Even for the same letter, its spatial
distribution of strokes also varies with its font. Thus, for the legibility of letters, the
spatial mosaics of strokes are as crucial as their size. This is also true for some symbols
with established forms (e.g., , , ∞, ×, ÷). Therefore, the normal area (A) of letters or
symbols should be defined as the product of width multiplied by height to count the
orientations and spacing of strokes or details, as shown in Figures 40 (a) and 40 (b). In
practice, geometries of text have often been measured using height and width. On the

84
other hand, for random graphics without established forms, the normal area (A) is defined
as the summation of areas of all details, as shown in Figure 40 (c).
A >A=WxH A=W'xH' A=shaded area,
not W"xH"
W
H
W'
H'
W"
H"
(a) letters (b) graphics with (c) random graphics established forms
Figure 40. Different measurements of normal area A: text (A=W×H), graphics with established forms (A=W ×H ), and random graphics (A=summation of all details)
Restricted by the ten assumptions, only text (single letters) is examined here. The
normal area of text is expressed in (10).
HWA ⋅= (10)
where:
A = Normal text area
W= Normal text width
H = Normal text height
Based on the geometrical relationship shown in Figure 41, the incident angle ξ ,
which is the angle between display normal (OA) and observer’s sightline (OP), can be
substituted with the horizontal viewing angles φ and the vertical angle α, using (11).

85
αφξ coscoscos = (11)
where:
ξ = Incident angle
φ = Horizontal viewing angle
α = Vertical viewing angle
α
φξ
Target
O
P
BA
Figure 41. Off-the-display-axis viewing of target and the incident angle ξ (Target is located at O, observer’s eye is at P, OA is display normal, B is an assistant
point, angle <OAP = <OAB = <ABP = <OBP = 90 )
Substitute (10) and (11) into (9), and we get (12):
αφξω coscoscos 22 DHW
DA ⋅
== (12)
where:
ω = Solid angle subtended by the legible text to the observer’s eyes
A = Normal text area
W= Normal text width
H = Normal text height
D = Viewing distance
αφξ coscoscos = Incident angle ξ = <AOP; Horizontal viewing angle φ = <AOB; Vertical viewing angle α = <BOP; cos<AOP=OA/OP; cos<AOB=OA/OB; cos<BOP=OB/OP

86
ξ = Incident angle
φ = Horizontal viewing angle
α = Vertical viewing angle
When text is viewed perpendicular to the observer, φ = 0, α = 0, the solid angle ω
subtended by the text is calculated using (13).
20
0 DHW ⋅
=ω (13)
where:
ω0 = Solid angle subtended by text viewed perpendicular to the display
W = Normal text width
H = Normal text height
D0 = Viewing distance when text is perpendicular to the observer
This study then uses a hypothesis to derive the target equation to predict the
spatial legibility of text, which is detailed below and illustrated in Figure 42.
Constant-solid-angle hypothesis. The solid angle ω subtended by the legible
viewing target (not only text) is a constant at different viewing angles (perpendicular or
not) under the same viewing condition, that is, with the same target viewed by the same
observer at the same recognition performance (threshold 100% accurate) under the same
lighting conditions, but with different viewing distances at different viewing angles.

87
17mm
ω
AA
D0
eye
D
ω0
H
W
Figure 42. Illustration of the constant-solid-angle hypothesis (Same target A with normal height H and width W, viewed either perpendicular or not at different distances, with the same threshold of 100% accurate recognition performance)
According to the constant-solid-angle hypothesis, the solid angle ω0 subtended by
the target A viewed perpendicularly at distance D0, as shown in Figure 42, equals the
solid angle ω subtended by the same target A viewed not perpendicularly at decreased
distance D. The target A forms two upside down retinal images on the center fovea of the
observer’s eye, when viewed at viewing distances D0 and D, respectively. These two
retinal images have different shapes but an equal area, thus subtending equal solid angles
to the effective center of the eye’s optics at 17 mm from the retina (Wandell, 1995).
Based on the constant-solid-angle hypothesis and Figure 42, we gets (14):
020
2 coscos ωαφω =⋅
=⋅
=D
HWD
HW (14)
where:
ω = Solid angle subtended by text viewed not perpendicularly
ω0 = Solid angle subtended by the same text viewed perpendicularly at the same
recognition performance (threshold 100% accurate)
W = Normal text width (the same text viewed perpendicularly or not)

88
H = Normal text height (the same text viewed perpendicularly or not)
D = Legibility distance when text is viewed not perpendicular to the observer
D0 = Legibility distance when text is viewed perpendicularly, D0 > D
φ = Horizontal viewing angle
α = Vertical viewing angle
Equation (14) was further derived as (15):
αφ coscos0DD = (15)
where:
D = Legibility distance when text is viewed not perpendicularly
D0 = Legibility distance when text is viewed perpendicularly
φ = Horizontal viewing angle
α = Vertical viewing angle
Equation (15) describes how the legibility distance (D) of text viewed not
perpendicular to the observer varies with the viewing angles from the original legibility
distance (D0) when text is viewed perpendicularly. Therefore, using (15), the equation to
predict the spatial legibility of text viewed not perpendicularly can be derived from an
existing equation that predicts the legibility of text viewed perpendicularly. Among the 95
legibility equations ever published, Howett’s equation, (7) previously, can serve this
purpose best because (a) Howett’s equation predicts the legibility of letters, (b) it has the
maximum number of critical factors examined, including geometries, background
luminance, contrast, and the Snellen eyesight of the observer, and (c) Howett’s equation

89
was also mathematically derived from Kaneko’s equation (1978), as thoroughly reviewed
in Chapter 2. Howett’s equation can be re-expressed as (16).
532.0%
213.011
0 5.2443 CLSSwHHD bd ⋅⋅⋅⎟
⎠⎞
⎜⎝⎛⋅⋅= −
−
(16)
Where:
H = Normal character height
D0 = Legibility distance when text is viewed perpendicularly
Sw = Strokewidth of text
H/Sw = Height-to-strokewidth-ratio of text
Sd = Denominator in the Snellen ratio of observer’s eyesight
Lb = Background luminance
C% = Luminance contrast percent
Substitute (16) into (15), to get (17). Equation (18) is a different expression of
(17).
( ) ( ) 5.05.0532.0%
213.011
coscos5.2443 αφ ⋅⋅⋅⋅⋅⎟⎠⎞
⎜⎝⎛⋅⋅= −
−
CLSSwHHD bd (17)
( ) ( ) 5.05.0532.0%
213.04 coscos101.4 −−−−− ⋅⋅⋅⋅⋅⎟⎠⎞
⎜⎝⎛⋅⋅×= αφCLS
SwHDH bd (18)
where:
D = Legibility distance of text viewed not perpendicular to the display
H = Normal text height
Sw = Strokewidth of text

90
H/Sw = Height-to-strokewidth-ratio of text
Sd = Denominator in the Snellen ratio of observer’s eyesight
Lb = Background luminance
C% = Luminance contrast percent
φ = Horizontal viewing angle
α = Vertical viewing angle
Equation (17) or (18) is the target equation for predicting the spatial legibility of
text from all seven critical factors that must be examined in this study. Unfortunately, (17)
or (18) does not consider (a) text width and (b) ambient light of the viewing
environments. The absence of text width in (17) or (18) derives from the fact that
Howett’s equation deals only with strokewidth. This neglect might not be a problem in
practice since what is usually required is text height rather than text width. In any case,
text width can be easily calculated as long as the height-to-width ratio of different fonts is
given. The effect of the missing factor of ambient light in (17) or (18) will be checked
later using legibility data collected from human subjects in the UMTRI laboratory.
Outcomes will then be used to improve the derived equation. However, before (17) or (18)
can be recommended to architectural practice for predicting the spatial legibility of text,
the constant-solid-angle hypothesis must be proven using fundamental theories of visual
perception and legibility data collected from human subjects in the UMTRI laboratory.
Equation (17) or (18) can be traced back to Kaneko’s equation, (8) in Chapter 2,
which was developed when 1 Lb 1000 cd/m2; 10 C% 90; 0.2 Ac 2.0 min-1.
Thus, (17) or (18) would better hold under those viewing conditions. In lecture halls, the

91
audience usually has an acuity level 0.2 Ac 2.0 min-1 with normal 1.0 min-1. The
background luminance Lb of text presented on visual media in lecture halls is also
commonly 1 Lb 1000 cd/m2 (2.81 cd/m2 ± 4.73 cd/m2 ≤ Lb ≤ 86.00 cd/m2 ±102.28
cd/m2 as surveyed). In addition, text presented in lecture halls often has high contrast for
better legibility. Therefore, (17) or (18) can likely be used in lecture halls, except for text
with contrast percent C% > 90. In this exceptional situation, further research is needed to
investigate the predictability of the derived equation (17) or (18).
5.2 Verification of the Derived Equation
The constant-solid-angle hypothesis is then verified using two different
approaches: (a) fundamental theories as to how retinal images of text activate cones in the
fovea of viewer’s eyes, and (b) legibility data collected from human subjects participating
in a pilot experiment and a main experiment carried out in the laboratory.
5.2.1 Physiological and Photochemical Foundation
The constant-solid-angle hypothesis is consistent with how retinal images of
characters activate cones in the center fovea of an observer’s eyes. When characters (text
or graphics) are viewed, either perpendicularly or not, they form a retinal image in the
center fovea of a viewer’s eyes, which then activates the underlying foveal cones to fire
signals to the cortex nerves in the brain. The legibility level of characters viewed is
eventually determined by (a) the spatial distribution of the activated cones on the retina,
92
and (b) the number of the activated foveal cones and the strength of signals they fired.
Different characters have different shapes and structures of their strokes or details, and
thus, a different spatial mosaic of activated foveal cones when viewed. For example, as
illustrated in Figure 43 (a), the spatial mosaic of activated foveal cones of the letter A is
different from that of the letter B, both viewed perpendicularly. The viewing angle also
affects the spatial mosaic of the activated foveal cones. When the target is viewed not
perpendicularly, its projected image perpendicular to the viewing line, rather than itself,
forms the retinal image that is distorted as a result of the viewing angle. Correspondingly,
the spatial mosaic of activated foveal cones is also distorted, as shown in Figure 43 (b).
spatial mosaic of retinal image A and its activated cones
spatial mosaic of retinal image B and its activated cones
spatial mosaic of distorted retinal image A due to viewing angles and its activated cones
(a) viewed perpendicularly (b) viewed at angles
Figure 43. Spatial mosaic of the retinal images of letter A and B, when viewed perpendicularly or not, as well as their underlying activated cones
(Wandell, 1995, Figure 3.4, p. 49)

93
While the spatial mosaic of the activated foveal cones determines which character
it is, the number of the activated foveal cones and the strength of signals fired by them to
the neurons jointly determine the legibility levels of characters viewed (how clear and
sharp the character is), because of the one-to-many relationship between the foveal cones
and optic-tract neurons (Wandell, 1995). In addition, since foveal cones are very tightly
packed as a triangle lattice without any strong orientation dependencies, and the cone
threshold is very low 3.18×10⁻⁴ cd/m2 (cone will not be activated to fire a signal until the
incoming light intensity reaches this threshold value), the number of activated foveal
cones is in proportion to the area of the retinal image of legible characters at mesopic and
photopic light levels (Boff & Lincoln, 1988). The area of the retinal image is solely
determined by the geometrical relationships between the target and the observer’s eye,
including viewing distance, target size, location, and orientations (viewing angles). The
strength of the signal fired by the activated foveal cones depends on the observer’s acuity,
age, and lighting conditions of the viewing environment (e.g., reflectance, luminance
contrast, target or background luminance, surrounding luminance, lighting uniformity,
possible glare or light trespass, color difference, spectrum of lamps). Therefore, four
practical ways to increase the legibility levels of text (or graphics) include:
1. Increase the viewer’s eyesight by wearing glasses or contact lens.
2. Increase the lighting conditions in the visual environment to enhance the
quality of the retinal image and thus increase the strength of the fired signals.
3. Increase the target size or decrease the viewing distance to increase the area of
the retinal image and have more foveal cones activated.

94
4. Decrease the viewing angles, with perpendicular viewing having the
maximum area of the foveal cones activated, as illustrated in Figure 43.
Inside the observer’s eye, as illustrated in Figure 44, the area of the retinal image
of text (or graphics) viewed can be measured using solid angle ω subtended by this area
to the effective center of the eye’s optics at an average 17 mm (Wandell, 1995).
Geometrically, this solid angle ω equals the solid angle ω subtended by the target
character outside the observer’s eye. Thus, the solid angle ω can be used to measure the
area of the retinal image. In addition, the solid angle ω can be used to assess the legibility
levels of characters viewed by the same observer under the same lighting conditions such
that the foveal cones fire signals at a stable rate of strength. Specifically, as illustrated in
Figure 44, if two targets A1 (perpendicular to the observer) and A2 (not perpendicular to
the observer) are viewed by the same observer at different viewing distances D1 and D2,
such that they subtend equal solid angles to the observer’s eye, ω = ω1 = ω2, their retinal
images have an equivalent area (A1 = A2 ) but different shapes. If these two targets are
viewed under the same lighting conditions, they will have equivalent legibility levels due
to the same number of activated foveal cones and the stable signal firing rate of strength.
In contrast, if target A1 would like to have the same legibility levels as target A2,
assessed using the same recognition performance (e.g., threshold 100% accurate), they
shall subtend equivalent solid angles to the same observer’s eye (ω1 = ω2), when viewed
under the same viewing condition.

95
'21 ωωω == '2'1 AA =
17mm
ωωA1'A2
A1
D1
eye
D2
A2'
2
ω1
Figure 44. Solid angles subtended by targets with different orientations viewed at
different distances, and those subtended by their retinal images
Figure 44 also illustrates the relationship between viewing distances and
orientations of the viewing targets to subtend an equal solid angle to the observer’s eye.
In Figure 44, the rotated and/or tilted target A2 has a decreased projected area
perpendicular to the observer’s eye. Thus, target A2 should be viewed at decreased
viewing distance D2 to have an equivalent solid angle as that subtended by target A1 at
distance D1. In practice, the decreased projected target area is usually due to three
changes: (a) decreased size when viewed perpendicularly, (b) rotated or tilted target at
viewing angles, or (c) both. After these changes, if viewing distances are appropriately
decreased, observers can still have equivalent recognition performance (e.g., threshold
100% accuracy) due to an equivalent area of retinal images, and thus, viewing targets still
have an equivalent solid angle ω subtended to the observer’s eye.
Figure 45 illustrates the equivalent area of retinal images of a disk, thus, an
equivalent solid angle subtended, when it is viewed (a) perpendicularly with normal size
at the original distance, (b) perpendicularly with decreased normal size at a decreased

96
distance, (c) not perpendicularly with the original normal size but at a decreased distance,
and (d) not perpendicularly with a decreased normal size at a decreased distance.
Original perpendicular viewing of disk and its retinal image.
(1) Alternative perpendicular viewing, decreased size and distance
(2) Alternative not perpendicular viewing, same size, decreased distance
(3) Alternative not perpendicular viewing, decreased size and distance
A A A A
Figure 45. Constant area of retinal images of a legible disk viewed with different
orientations or different normal size at different viewing distances
Therefore, no matter how the target character (not only text) changes in size,
orientation, and viewing distance, as long as it is viewed by the same observer at the
same recognition performance (e.g., threshold 100% accurate) under the same lighting
conditions, the equivalent area of retinal images of the target guarantees that the solid
angle ω subtended by the legible viewing target is a constant at different viewing angles
(perpendicular or not) under the same viewing condition. This is what has been claimed
by the constant-solid-angle hypothesis. This hypothesis assumes that the distortion of text
viewed at extremely large angles does not degrade its recognition. This assumption might
be incorrect thus needs further verification from the laboratory data.

97
5.2.2 Pilot Experiment
The constant-solid-angle hypothesis is then tested in the lighting laboratory at the
University of Michigan Transportation Research Institute (UMTRI) using legibility data
collected from human subjects. A pilot experiment is first planned to (a) verify that the
equipment for the main experiment works properly, (b) verify that the experiment can be
conducted in the time allotted and that the data are reliable, (c) preliminarily verify that
the constant-solid-angle hypothesis holds using three human subjects, and
(d) preliminarily check that ambient light has little influence on legibility.
5.2.2.1 Laboratory Settings and Installation of Facilities
The pilot experiment is carried out in room 338 at the University of Michigan
Transportation Research Institute (UMTRI), as shown in Figure 46. This rectangular
lighting laboratory has black walls and ceiling to reduce light reflectance, a white floor
that needs coverage to prevent reflectance glare, and unshielded ceiling lamps that
probably have a direct glare on the observer’s eyes.

98
Figure 46. Lighting laboratory at UMTRI
The experimental set up is illustrated in Figure 47. Exchangeable viewing
materials are presented on the opalescent surface of a specially designed visual medium
— a dimmable fluorescent light box (T8, daylight) that is painted black and mounted on a
movable base put on a desk at one end of the laboratory. The dimmable fixture can be
rotated and tilted to provide different viewing angles between the display normal and the
observer’s sightline. The materials are recognized by subjects sitting in a chair at 6.1
meters (20 feet) away with their chins on a chin rest (to fix the viewing distance) at
different viewing angles but the same recognition performance (threshold 100%
accurate).

99
Subject
Dimmablefixture
SubjectDimmablefixture
Plan view
Section view
Chin-reston desk
rotate (yaw)
tilt (pitch)
Figure 47. Experimental settings in the laboratory at UMTRI
Note that this experimental set up uses variable sizes of materials viewed at
different viewing angles but a constant viewing distance for better experimental
arrangement rather than the same material viewed at different viewing angles and
variable viewing distances, as claimed by the constant-solid-angle hypothesis. Such
modification of the experimental set-up will not affect the verification of the hypothesis
since the solid angle ω subtended by the viewing materials, and thus the inverted retinal
image formed on the observer’s center fovea, are exactly the same when the materials are
viewed of either way. This idea is illustrated and verified in Figure 48.
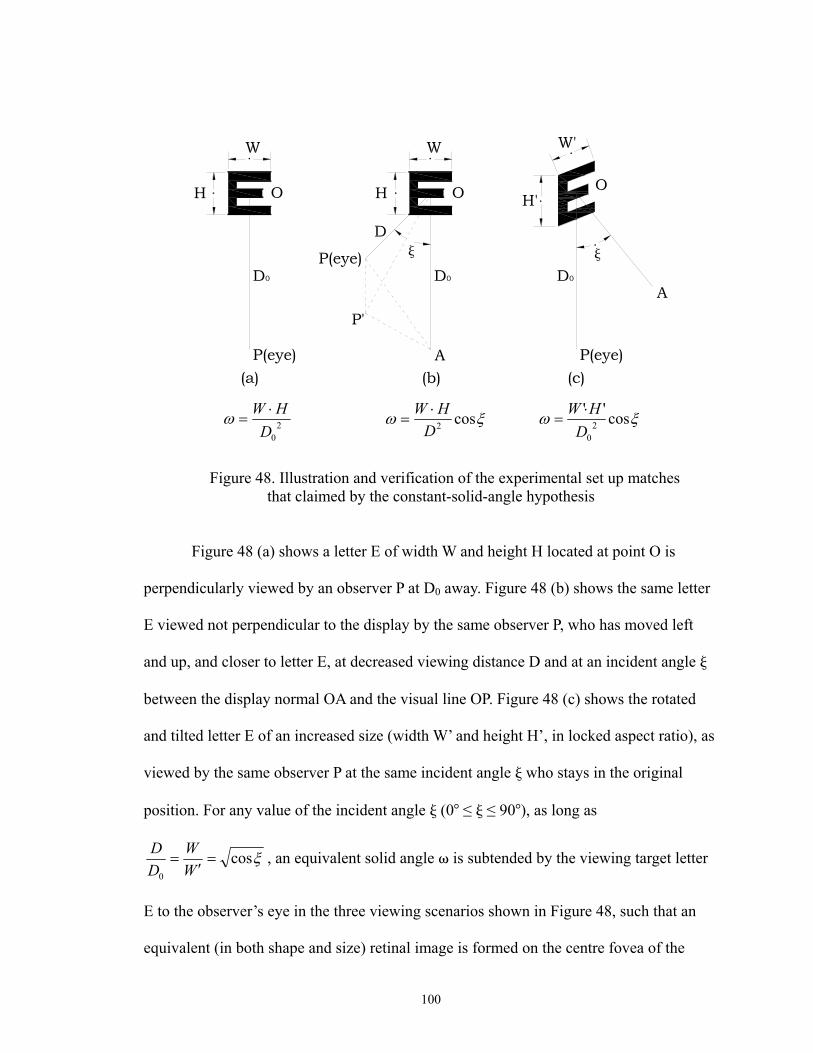
100
Figure 48. Illustration and verification of the experimental set up matches
that claimed by the constant-solid-angle hypothesis
Figure 48 (a) shows a letter E of width W and height H located at point O is
perpendicularly viewed by an observer P at D0 away. Figure 48 (b) shows the same letter
E viewed not perpendicular to the display by the same observer P, who has moved left
and up, and closer to letter E, at decreased viewing distance D and at an incident angle ξ
between the display normal OA and the visual line OP. Figure 48 (c) shows the rotated
and tilted letter E of an increased size (width W’ and height H’, in locked aspect ratio), as
viewed by the same observer P at the same incident angle ξ who stays in the original
position. For any value of the incident angle ξ (0 ≤ ξ ≤ 90 ), as long as
ξcos0
=′
=WW
DD , an equivalent solid angle ω is subtended by the viewing target letter
E to the observer’s eye in the three viewing scenarios shown in Figure 48, such that an
equivalent (in both shape and size) retinal image is formed on the centre fovea of the
20DHW ⋅
=ω ξω cos2DHW ⋅
= ξω cos''2
0DHW ⋅
=

101
observer’s eyes. For example, given ξ = 45 , then D = 0.84D0, W = 1.19W.
A close look at the dimmable fixture is shown in Figure 49. This fixture is lit by
two fluorescent T8 tubes (daylight). Its surface luminance (Lb) can be dimmed from
1150 cd/m2 to 16 cd/m2 (1% dimming), with a mean uniformity of 89.5% (min/max) at 5
different light levels (22.2, 63.5, 117.0, 485.7, and 1150 cd/m2). This fixture can be
horizontally rotated at 7 angles (φ = 0 , 15 , 30 , 45 , 60 , 75 , and 85 ) and vertically
tilted at 7 angles (α = 0 , 17 , 31.5 , 46.5 , 61 , 75 , and 85 ). The pilot experiment
examines four horizontal angles (φ = 0 , 30 , 60 , 75 ) and four vertical angles (α = 0 ,
31.5 , 61 , 75 ), for a total of 4×4 =16 incident angles ξ, calculated using
αφξ coscoscos = , as listed in Table 8. Additionally, by dimming the surface luminance
of the fixture to a constant 187.5 cd/m2 for all 16 incident angles in the pilot experiment,
this fixture has a simulated ideal diffusive surface whose surface brightness is
independent of viewing angles.

102
Figure 49. Dimmable fluorescent fixture (two T8 tubes, daylight) with simulated
ideal diffusive surface, and 7 horizontal and 7 vertical viewing angles
Remote control Dimmer
Horizontal angle 30 Vertical angle 31.5
Real view when testing
2 T8 tubes

103
Table 8. Total of 16 incident angles ξ examined in the pilot experiment (calculated using αφξ coscoscos = )
Incident angle ξ
in deg
Horz. angle φ
in deg (yaw)
Vert. angle α
in deg (pitch)
0 0 0
30 30 0
31.5 0 31.5
42.4 30 31.5
60 60 0
61 0 61
64.8 60 31.5
65.2 30 61
75 75 0
75 0 75
76 60 61
77 30 75
77.3 75 31.5
82.6 60 75
82.8 75 61
86.2 75 75
In addition, the Minolta LS-100 luminance meter is used to measure luminance in
the pilot experiment, and later in the main experiment, the field experiment, and other test

104
scenarios. Figure 50 illustrates this meter in the laboratory when mounted on a tripod for
better manipulation. In addition, the 300ft fiber glass measuring tape and the 50ft sonic
laser tape have been used in both laboratory and field experiments for measuring
distances. A piece of black cloth was used to cover the desk on which the fixture is placed,
as shown in Figure 50. A wood pointer is also used to help the observers locate the target
text when reading the materials.
Figure 50. Luminance meter mounted on a tripod in the pilot experiment
5.2.2.2 Viewing Materials
The derived equation in this study predicts the legible height of letters if the
height-to-strokewidth ration (H/Sw) is known, which in fact is defined for each font.
Therefore, to simplify the experimental design, the viewing materials used in the pilot
and main experiments are letters with a fixed height-to-strokewidth ratio. Among the
letters A-Z, some letters are more easily recognizable than others by the same observer
under the exact same viewing condition, as shown in Figure 51 (Zwahlen & Schnell,
1999).

105
0.85 0.
920.
92 0.95 0.97 1 1 1.
01 1.03
1.03
1.04
1.04
1.04
1.04
1.05
1.05
1.05 1.07
1.07
1.08 1.
131.
13 1.15 1.
191.
31.
41
0.8
0.9
1
1.1
1.2
1.3
1.4
1.5
1.6
B G H S R E N Z D V F J P Y K O Q C U X M W T L A I
Letter A-Z
Diff
icu
lty
inde
x
difficulty index
Figure 51. Index of legibility difficulty for standard highway alphabet letters A-Z (Zwahlen & Schnell, 1999, Figure 2, p. 144)
In this study, to exclude the individual distraction of different letters on legibility,
a single letter is preferred to a group of letters as viewing materials. The eventual choice
is the letter E because of its popularity in practice, with a height-to-width ratio H/W = 1,
and a height-to-strokewidth ratio H/Sw = 5. Seven lines of letter Es with gradually
increasing sizes, random orientations, and positive contrast of black/white constitute an
E-chart, which is printed on letter or A3 size transparencies. These E-charts are the
viewing materials used in this study. To double check the observer’s reading performance,
usually two E-charts with identical ranges of letter E heights but different orientations are
attached side by side on one clear acrylic sheet and tested together in the laboratory, as
shown in Figure 52. These exchangeable E-chart sheets are then attached to the simulated
ideal diffusive surface of the dimmable fixture and read by observers sitting 6.1 m away.
At a single test in this pilot experiment, one E-chart sheet (each sheet has two E-charts
side by side) is viewed by the observer with one of three eyesight levels (20/20, 20/16, or
20/12.5) at one incident angle (total 16 incident angles examined) subtended between the
Easier to read Harder to read
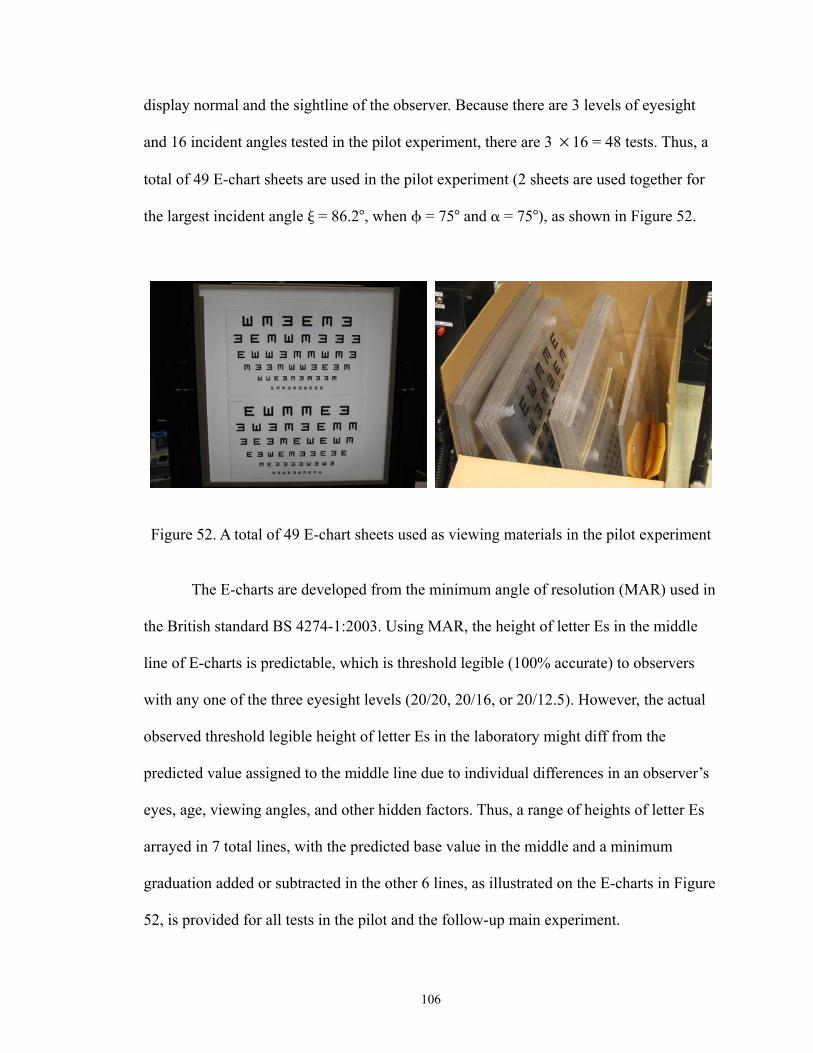
106
display normal and the sightline of the observer. Because there are 3 levels of eyesight
and 16 incident angles tested in the pilot experiment, there are 3 ×16 = 48 tests. Thus, a
total of 49 E-chart sheets are used in the pilot experiment (2 sheets are used together for
the largest incident angle ξ = 86.2 , when φ = 75 and α = 75 ), as shown in Figure 52.
Figure 52. A total of 49 E-chart sheets used as viewing materials in the pilot experiment
The E-charts are developed from the minimum angle of resolution (MAR) used in
the British standard BS 4274-1:2003. Using MAR, the height of letter Es in the middle
line of E-charts is predictable, which is threshold legible (100% accurate) to observers
with any one of the three eyesight levels (20/20, 20/16, or 20/12.5). However, the actual
observed threshold legible height of letter Es in the laboratory might diff from the
predicted value assigned to the middle line due to individual differences in an observer’s
eyes, age, viewing angles, and other hidden factors. Thus, a range of heights of letter Es
arrayed in 7 total lines, with the predicted base value in the middle and a minimum
graduation added or subtracted in the other 6 lines, as illustrated on the E-charts in Figure
52, is provided for all tests in the pilot and the follow-up main experiment.

107
There are a total of five steps in developing these E-charts, as detailed below.
Step 1. This study calculates the threshold legible (100% accurate) strokewidth
of letter Es viewed perpendicularly to the observer at 6.1m (20ft), using (19). As shown
in Figure 53, this retinal area subtends the minimum angle of resolution (MAR, in min
arc, 2D) to the effective center of the eye’s optics. The retinal image of this stroke strikes
a critical number of foveal cones to fire signals to the brain needed for sharp recognition.
A smaller stroke will not activate the foveal cones and thus not be legible.
DMARSw ⋅⋅= 000291.0 (19)
where:
Sw = Threshold legible (100% accurate) strokewidth of the letter E, in mm
MAR = Minimum angle of resolution of the observer’s eye, in min arc.
MAR = 1 min arc for eyesight 20/20, 0.8 for 20/16, 0.63 for 20/12.5.
D = Viewing distance, at a constant 6100 mm
MAR
effective center of the eye's optics
retina
eye ball
retinal area of stroke
Figure 53. Minimum angle of resolution (MAR) subtended by the threshold legible stroke to the effective center of the eye’s optics

108
Step 2. This study calculates the threshold legible (100% accurate) height of
letter Es in the middle line of the E-charts viewed perpendicularly by the same observer,
using (20), since the height-to-strokewidth ratio of letter Es equals 5 (H/Sw = 5).
DMARH ⋅⋅= 00145.0 (20)
where:
H = Threshold legible (100% accurate) height of letter E, in mm
MAR = Minimum angle of resolution of the observer’s eye, in min arc.
MAR = 1 min arc for eyesight 20/20, 0.8 for 20/16, 0.63 for 20/12.5.
D = Viewing distance, at constant 6100 mm
Step 3. The minimum graduation of heights (increases or decreases) of letter Es
in the other 6 lines on the E-charts viewed perpendicularly by the same observer is
determined in Step 3. Reflecting the discrimination power of the observer’s eyes, the
minimum angle of resolution (MAR) varies with the observer’s acuity, age, and lighting
conditions of the environment, but is independent of the geometries of the viewing
materials and viewing angles. Thus, at a constant lighting condition in the pilot
experiment with an equivalent background luminance level (187.5 cd/m2), MAR is stable
for E-charts viewed by the same observer at all 16 incident angles. Consequently, the
threshold legible strokewidth calculated using (19) is actually the minimum graduation of
heights of letter Es that can be recognized with 100% accuracy. Using this strokewidth as
equal linear steps, the backup threshold legible heights of letter Es in the other 6 lines on
the E-charts can be calculated using (21).

109
SwnHH ⋅±=' (21)
where:
H = Threshold legible (100% accurate) height of letter E in the middle line, in mm
H = Threshold legible height of letter Es in the other 6 lines on the E-charts
Sw = Threshold legible strokewidth of the letter E, in mm
n = Natural number 1, 2, 3
Step 4. This study then calculates the ranges of heights of letter Es on the
E-charts viewed perpendicular to the observers with each of the three different eyesight
levels (20/20, 20/16. 20/12.5), as shown in Table 9.
Table 9. Heights of 7 lines of letter Es on E-charts viewed perpendicularly
Eyesight 20/20 20/16 20/12.5
MAR 1 minarc 0.8 0.63 7 lines of Es
Threshold Sw 1.78mm 1.42 1.12
Line 1, top H + 3Sw 14.17mm 11.34 8.93
Line 2 H + 2Sw 12.4mm 9.92 7.81
Line 3 H + Sw 10.62mm 8.5 6.69
Line 4, middle H 8.85mm 7.08 5.57
Line 5 H − Sw 7.07mm 5.66 4.45
Line 6 H − 2Sw 5.29mm 4.24 3.34
Line 7, bottom H − 3Sw 3.52mm 2.82 2.22

110
Step 5. In this step, the ranges of heights of letter Es on the E-charts viewed at
other non-zero incident angles can be predicted. In light of the derived legibility equation
(18), the threshold legible (100% accurate) height of letter Es viewed not perpendicularly
can be calculated using (22). The results are listed respectively in Appendix F for the
three eyesight levels (20/20, 20/16, 20/12.5), which are the geometries for making
E-charts. If the observed threshold legible heights (100% accuracy) in the pilot and main
experiment match the predicted heights at the middle lines of all E-charts, the
constant-solid-angle hypothesis is verified.
( ) ( ) 5.05.0 coscos' −− ⋅⋅= αφHH (22)
where:
H = Height of 7 lines of letter Es viewed perpendicularly, as shown in Table 9
H = Height of 7 lines of letter Es viewed not perpendicularly
φ = horizontal viewing angle, φ = 0 , 30 , 60 , 75
α = vertical viewing angle, α = 0 , 31.5 , 61 , 75
5.2.2.3 Lighting Conditions
In the pilot experiment, target lighting is provided by the dimmable fixture, with a
constant surface luminance of 187.5 cd/m2 at all 16 incident angles (perpendicular or not)
to simulate the ideal diffusive surface. In addition, to preliminarily check the influence of
ambient light on the legibility of text at all 16 incident angles, two levels of ambient light

111
are provided: (1) zero ambient light, (2) ambient light (value is measured later in the
laboratory) provided by T12 lamps mounted on the ground behind the dimmable fixture,
as shown in Figure 54. At either ambient light level, the background luminance (Lb) of
the E-charts, namely the surface luminance of the dimmable fixture, has been dimmed to
a constant 187.5 cd/m2 at different viewing angles. To prevent the reflectance glare, as
shown in Figure 54, dark blue carpets are placed on the floor between the observer and
the fixture. Unfortunately, the carpets are too narrow and thus do not serve this purpose
very well, a situation that is improved in the main experiment.
(a) zero ambient light (b) ambient light provided by T12 lamps
Figure 54. Two levels of ambient light provided in the pilot experiment
when text is viewed perpendicularly
In terms of the luminance contrast of letter Es, the positive contrast of black/white
commonly used in lecture halls is adopted in the pilot and the main experiments. In
AutoCAD, the white is in RGB (255, 255, 255) with luminance scale 100 (not in cd/m2),
while the black is in RGB (0, 0, 0) with scale 0, as illustrated in Figure 55.

112
0/100 10/100 20/100 30/100 40/100 50/100
60/100 70/100 80/100 90/100 100/100
Figure 55. Letter Es with different contrast adjusted from 0-100 in AutoCAD
The percent luminance contrast of a letter E on a sample E-chart attached on the
surface of the dimmable fixture viewed perpendicularly in the laboratory has a mean
value of 97.9 (C%) when measured at five levels of background luminance (1200, 505.3,
123.1, 68.1, and 23.8 cd/m2). Theoretically, the luminance contrast of target letter Es is
independent of the light levels and viewing angles. To double check, the measured
luminance contrast of the letter E on the sample E-chart has a mean value of 98.5 (C%)
with a uniformity ratio of 0.99 (min/max) at 7 viewing angles (φ = 0 , 15 , 30 , 45 , 60 ,
75 , and 85 , while α = 0 ) and 14 background luminance levels (488.6−34.76 cd/m2).
Therefore, as long as the E-charts are printed black/white (0/100) in AutoCAD, this study
assumes that the luminance contrast (C%) of the letter Es remains approximately
97.9 ~ 98.5 (usually 97.9 is used), at different light levels and viewing angles, as tested in
the pilot and the main experiments.
Recall that Kaneko’s equation, which is the origin of the derived legibility
equation in this study, was developed with 10 C% 90. The percent luminance
contrast (97.9) tested in the pilot experiment does not fall in this range. However, the

113
contrast (97.9) selected in this study represents the common viewing situation in lecture
halls. It is used only as a sample to verify the hypothesis that is supposed to hold for the
whole range of luminance contrasts 0 C% 100.
5.2.2.4 Subjects
The participants in the pilot experiment, as well as the follow-up main experiment,
must be 20-29 years old, with binocular eyesight 20/20 or better (20/20, 20/16, or
20/12.5), with or without glasses, and normal color vision. According to the curve of the
age-related variation of visual acuity shown in Figure 10 previously, at age 20-29, people
have the maximum acuity levels in their life span. Although color is not examined in this
study, the requirement of normal color vision is intended to avoid the possible but
unknown negative effect of abnormal color vision on the legibility of letter Es printed on
black/white. The recruited potential subjects are strictly screened upon arrival to find
those meeting the requirements. As shown in Figure 56, one purchased Snellen chart and
two self-made eyesight E-charts based on the British standard BS 4274-1:2003 are used
for this purpose. In terms of the sample size of the pilot experiment, four subjects are
recruited and three of them have participated in the pilot experiment; one failed the
requirements.

114
+0.1(logMAR);1.25 min arc;11.06mm;20/25;
0.0(logMAR);1.00 min arc;8.85mm;20/20;
-0.1(logMAR);0.80 min arc;7.08mm;20/16;
-0.2(logMAR);0.63 min arc;5.57mm;20/12.5;
-0.3(logMAR);0.50 min arc;4.42mm;20/10;
Standard Visual Acuity Test Charts 187.5 cd/m2(Lb); 97.91(C%); 0(phi); 0(alpha); 6.1m(D);
+0.2(logMAR); 1.6 min arc; 14.15mm; 20/32;
+0.3(logMAR); 2.0 min arc; 17.69mm; 20/40;
20/25
20/20
20/16
20/12.5
20/10
20/32
20/40
Figure 56. Snellen chart and eyesight E-chart used to screen potential subjects
according to the requirements (drawings are not at the same scale)
Similar to the previous E-chart making, the eyesight E-chart is developed using
the previous (19) and (20), based on the minimum angle of resolution (MAR) for
different eyesight levels provided in the BS 4274-1:2003. The calculated geometries are
shown in Table 10. All eyesight E-charts are viewed perpendicularly to the observer at
187.5 cd/m2.
20/15 20/13 20/10

115
Table 10. MAR and geometries of eyesight E-chart
Eyesight MAR Viewing distance (D) Strokewidth (Sw) Height (H)
20/40 2 6100 mm 3.55 mm 17.69 mm
20/32 1.6 6100 2.84 14.15
20/25 1.25 6100 2.22 11.06
20/20 1 6100 1.78 8.85
20/16 0.8 6100 1.42 7.08
20/12.5 0.63 6100 1.12 5.57
20/10 0.5 6100 0.89 4.42
5.2.2.5 Factors Examined
To test the constant-solid-angle hypothesis, the solid angle subtended by the
legible letter Es viewed at each of a total of 16 incident angles must be examined in the
laboratory. In actuality, a solid angle is rarely measured in practice. Instead, it is
calculated from the threshold legible height (H) of letter Es measured at a constant
viewing distance (6.1m) but at different incident angles (ξ), using (23), which is
developed from (12) previously. One more factor also examined in this pilot experiment
is the surrounding luminance (Ls) to preliminarily check the effect of ambient light on the
legibility of text. To enhance the internal validity of this study, other non-examined
factors all have preset values as listed in Table 11.

116
ξω cos61002
2H= (23)
where:
ω = Solid angle subtended by the legible text to the observer’s eyes
H = Normal text height
ξ = Incident angle
Table 11. Preset values of non-examined factors in the pilot and main experiments
Non-examined factors Preset values
Color contrast Black/white
Average luminance contrast (C%) 97.9
Constant height-to-width ratio 1
Height-to-strokewidth ratio 5
Legibility distance 6.1 m, constant
Background luminance (Lb) 187.5 cd/m2, constant
Recognition performance Threshold legible with 100% accuracy
Recognition time 500 ms
Spectrum of fluorescent T8, daylight
Subjects age 20-29
Subject eyesight 20/20 or better, with or without glasses
Subject color vision Normal

117
5.2.2.6 Experimental Tests, Procedures, and Duration
In the pilot experiment, there are a total of 32 experimental tests divided into 4
sessions, as shown in Table 12. Among all 32 tests, the background luminance (Lb) of the
E-charts remains a constant 187.5 cd/m2 by dimming the fluorescent fixture. These 32
tests are carried out in 10 steps in the laboratory. The duration of the experiment is about
157 minutes, or roughly 2.5 hours.
Table 12. A total of 32 tests in the pilot experiment
Tests Sessions Incident angle ξ
in deg
Vert. angle α
in deg (pitch)
Horz. angle φ
in deg (yaw)
Ambient
light level
1 0 0 0 zero
2 0 0 0 T12 lamps
3 30 0 30 zero
4 30 0 30 T12 lamps
5 60 0 60 zero
6 60 0 60 T12 lamps
7 75 0 75 zero
8
1
75 0 75 T12 lamps
9 31.5 31.5 0 zero
10 31.5 31.5 0 T12 lamps
11 42.4 31.5 30 zero
12
2
42.4 31.5 30 T12 lamps

118
Table 12 (continued)
Tests Sessions Incident angle ξ
in deg
Vert. angle α
in deg (pitch)
Horz. angle φ
in deg (yaw)
Ambient
light level
13 64.8 31.5 60 zero
14 64.8 31.5 60 T12 lamps
15 77.3 31.5 75 zero
16
2
77.3 31.5 75 T12 lamps
17 61 61 0 zero
18 61 61 0 T12 lamps
19 65.2 61 30 zero
20 65.2 61 30 T12 lamps
21 76 61 60 zero
22 76 61 60 T12 lamps
23 82.8 61 75 zero
24
3
82.8 61 75 T12 lamps
25 75 75 0 zero
26 75 75 0 T12 lamps
27 77 75 30 zero
28 77 75 30 T12 lamps
29 82.6 75 60 zero
30 82.6 75 60 T12 lamps
31 86.2 75 75 zero
32
4
86.2 75 75 T12 lamps

119
The 10 steps are listed below.
(1) Prepare for eyesight test and the first session. Before the scheduled
potential subject comes to the laboratory, the experimenter has dimmed the surface
luminance of the fluorescent fixture to a constant 187.5 cd/m2 for all 4 incident angles at
the first session with a vertical viewing angle α = 0 , using the remote control (maximum
4 different light levels can be preset and recalled). The equipment prepared for the first
trial (incident angle ξ = 0 ) is also used to test the subjects’ eyesight.
(2) Screen subjects upon arrival, 10 minutes. The subject is screened upon
arrival to meet the requirements. To test the subject’s acuity, the Snellen chart is first used
under the general lighting of all ceiling lamps in the laboratory; then two self-made
eyesight E-charts are used at a background luminance of 187.5 cd/m2 ( 120 cd/m2 as
required by the British standard BS 4274-1:2003). The experimenter asks whether the
subject has abnormal color vision and what his/her age is. Only qualified subjects
continue.
(3) Explain, sign consent form, 5 minutes. The experimenter explains the pilot
experiment to the subject and answers any questions. After approval, the experiment is
videotaped. The camcorder is mounted on a tripod placed behind the subject at the other
end of the laboratory. Refusing to be videotaped does not make the subject illegible to
participate. After explanation, the subject signs the consent form.

120
(4) Carry out the first session, 28 minutes. The first session includes 8 tests at 4
different viewing angles and 2 levels of ambient light, as shown in Table 12. The average
duration of each test is 1.83 min, including 20 seconds to prepare (exchanging E charts
and adjusting the viewing angles for different tests) and 10 seconds to record the data.
Before each test starts, the subject has 2 min (appropriate due to the small fluctuation in
the lighting conditions) to adapt their eyes to the light environment.
(5) Prepare for the second session, 10 minutes. The subject then has a
10-minute break out of the laboratory while the experimenter prepares for the second
session by dimming the surface luminance of the fluorescent fixture to 187.5 cd/m2 at 4
viewing angles to be examined during the second session.
(6) Carry out the second session, 28 minutes. Similar to the first session.
(7) Prepare for the third session, 10 minutes. Likewise, the subject has another
10-minute break while the experimenter prepares for the third session.
(8) Carry out the third session, 28 minutes.
(9) Prepare for the fourth session, 10 minutes.
(10) Carry out the fourth session, 28 minutes.

121
5.2.2.7 Data analysis
For all 32 tests, as illustrated in Figure 57, the mean background luminance of the
E-charts is 187.5 cd/m2 at a statistical significance level of 0.94 (very probably true), with
a standard deviation of 5.5 cd/m2. Figure 58 shows the threshold legible heights of letter
Es viewed at an eyesight level of either 20/12.5 or 20/20 at 16 incident angles under two
levels of ambient light (zero, or that provided by T12 lamps). Figure 59 illustrates the
solid angles subtended by those threshold legible letter Es collected in Figure 58 at 16
incident angles. In both figures, the legibility data are sorted by incident angles increasing
from zero to the largest viewing angle.
200.0
195.0
190.0
185.0
180.0
175.0
170.0
90.075.060.045.030.015.00.0
Figure 57. Background luminance of letter Es viewed at different incident angles
under two different levels of ambient light (zero, or that by T12 lamps), at mean 187.5 cd/m2 with standard deviation 5.5 cd/m2
187.5cd/m2
Bac
kgro
un
d lu
min
ance
in
cd/
m2
Incident angle ξ in deg

122
Subject 1 with eyesight 20/12.5
0.00
5.00
10.00
15.00
20.00
25.00
30.00
35.00
0.0 15.0 30.0 45.0 60.0 75.0 90.0
Incident angle in deg
Legi
ble
hei
ght
in m
m
zero ambient lightT12 lamps
Subject 2 with eyesight 20/12.5
0.00
5.00
10.00
15.00
20.00
25.00
30.00
0.0 15.0 30.0 45.0 60.0 75.0 90.0
Incident angle in deg
Legi
ble
hei
ght
in m
m
zero ambient lightT12 lamps
Subject 3 with eyesight 20/20
0.00
5.00
10.00
15.00
20.00
25.00
30.00
35.00
40.00
0.0 15.0 30.0 45.0 60.0 75.0 90.0Incident angle in deg
Legi
ble
hei
ght
in m
m
zero ambient lightT12 lamps
Figure 58. Threshold legible height of letter Es viewed at different incident angles under two different levels of ambient light (zero, or that by T12 lamps)

123
Subject 1 with eyesight 20/12.5
0.60
0.80
1.00
1.20
1.40
1.60
1.80
0.0 15.0 30.0 45.0 60.0 75.0 90.0
Incident angle in deg
Sol
id a
ngl
e su
bten
ded
in s
r x
10-6
zero ambient lightT12 lamps
Subject 2 with eyesight 20/12.5
0.40
0.60
0.80
1.00
1.20
1.40
0.0 15.0 30.0 45.0 60.0 75.0 90.0Incident angle in deg
Sol
id a
ngl
e su
bten
ded
in s
r x
10-6
zero ambient lightT12 lamps
Subject 3 with eyesight 20/20
1.50
2.00
2.50
3.00
3.50
4.00
4.50
0.0 15.0 30.0 45.0 60.0 75.0 90.0Incident angle in deg
Sol
id a
ngl
e su
bten
ded
in s
r x
10-6
zero ambient lightT12 lamps
Figure 59. Solid angles subtended by the threshold legible letter Es viewed at different incident angles under two different levels of ambient light (zero, or that by T12 lamps)
65.2

124
5.2.2.8 Preliminary Findings and Expected Improvements
Preliminary finding (1): The constant-solid-angle hypothesis probably holds
when 0 ξ 66.7 . The solid angle subtended by the threshold legible letter Es remains
almost constant when the incident angle ξ ranges from 0 to approximately 66.7 . The
angle 66.7 is averaged using three critical incident angles ((65.2 +75 +60 )/3=66.7 ) at
the three breaking points as indicated by arrows in Figure 59, where the
constant-solid-angle hypothesis no longer holds. When incident angle ξ is larger than
66.7 till 90 , the hypothesis does not hold. When 66.7 < ξ 90 , larger characters have
been recognized with threshold legibility (100% accuracy). Such larger characters
subtend larger solid angles to the observer’s eyes. The larger the incident angle ξ between
66.7 and 90 , the larger the solid angle subtended by the threshold legible letter Es. This
might be due to: (a) glare caused by the high bright fringe of the fixture surface on the far
end facing the observer; (b) extremely distorted letter Es that are inconsistent with the
observer’s reading habits and are thus harder to recognize; (c) eye fatigue of the observer
at the later stage of experiment when larger viewing angles are tested.
Preliminary finding (2): Ambient light probably has a very limited effect on the
legibility of text as long as the background luminance remains constant. As long as
the background luminance remains constant, as illustrated in Figure 58, the legible
heights of letter Es viewed under zero ambient light or T12 lamps are almost the same.
However, the limited change might be due to the fact that the ambient light level
provided by T12 lamps in the pilot study is too low, as illustrated in Figure 54 (b).
Therefore, the ambient light will be enhanced in the main experiment by turning on the

125
ceiling lamps of the laboratory. The absence of surrounding luminance in the derived
legibility equation might well be tolerable for its accurate predictability of legibility at
different ambient lights.
The pilot experiment also suggests that several improvements need to be made in
the follow-up main experiment.
1. The background luminance of the E-charts will be changed from 187.5 cd/m2
to 120 cd/m2 to more closely match the one surveyed in the 38 lecture halls at
the University of Michigan
(2.81 cd/m2 ± 4.73 cd/m2 ≤ Lb ≤ 86.00 cd/m2 ±102.28 cd/m2) and meet the
requirement of threshold background luminance ( 120 cd/m2) for testing
eyesight according to the British standard BS 4274-1:2003.
2. In terms of viewing angles, a reduced range of four vertical angles (α = 0 ,
31.5 , 46.5 , 61 ) will be used in the main experiment to replace the four
angles used in the pilot experiment (α = 0 , 31.5 , 61 , 75 ) to match the actual
range of maximum vertical viewing angles (mean 43.6 with standard
deviation of 11.8 ) surveyed in the 38 lecture halls. Note that the wider
vertical viewing angles were purposely used in the pilot experiment to extend
the experimental conditions.
3. As indicated in Figure 59, the apparent inconsistent performance of the three
subjects during the pilot experiment suggests stricter screening of potential
subjects to find their true acuity level to increase their reading performance.
Subject 3 performed worse than the other two subjects largely due to the

126
experimenter’s haste in measuring her acuity level. Her actual eyesight might
be 20/25 rather than 20/20. Therefore, more eyesight charts should be used
and a longer time should be taken in the follow-up main experiment to double
check the potential subject’s eyesight.
4. A black cloth should cover the bright fringe of the dimmable fixture surface
on the far end facing the observer to prevent direct glare. Likewise, wider
coverage of the white floor between the fixture and the observer are needed in
order to reduce the reflective glare from the fixture to the observer’s eye.
5. The order of viewing angles tested in all trials should be randomly arranged to
avoid possible fatigue of the observer’s eyes at larger incident angles, to
distinguish its influence on the reading performance of text from that of larger
incident angles.
5.2.3 Main Experiment
The main experiment carried out in the same laboratory uses 20 subjects with
different eyesight levels (20/20, 20/16, or 20/12.5) to verify the constant-solid-angle
hypothesis under zero ambient light level. Zero ambient light is used to (a) exclude its
unverified effect on the legibility of text, (b) prevent reflective glare from the illuminated
back half of the laboratory or highlighted ceiling reflected on the opalescent surface of
the dimmable fixture and direct glare from the ceiling lamps in front of the observers, and
(c) avoid the addition of ambient light on the E-charts, which might wash out the image

127
contrast, degrade the retinal image, and produce reflectance glare when the E-charts are
viewed at large viewing angles.
5.2.3.1 Improvements in the Experimental Settings
The revised experimental set up is shown in Figure 60, with the full ceiling lights
of the laboratory turned off during the experiment. Wider dark cloth has replaced the
previous narrow carpet to cover whiter floor between the fixture and the observer. At
large viewing angles, the bright fringe of the dimmable fixture surface on the far end
facing the observer is also covered to prevent direct glare, as shown in Figure 61. The
new range of 16 incident angles ξ is shown in Table 13, which is more evenly distributed.
The surface luminance of the fixture (Lb) is dimmed to a constant 120 cd/m2 at all 16
viewing angles.
Figure 60. Revised experimental settings in the main experiment

128
Figure 61. No coverage (left) and coverage (right) of the bright fringe
of the dimmable fixture surface, using a dark cloth strip
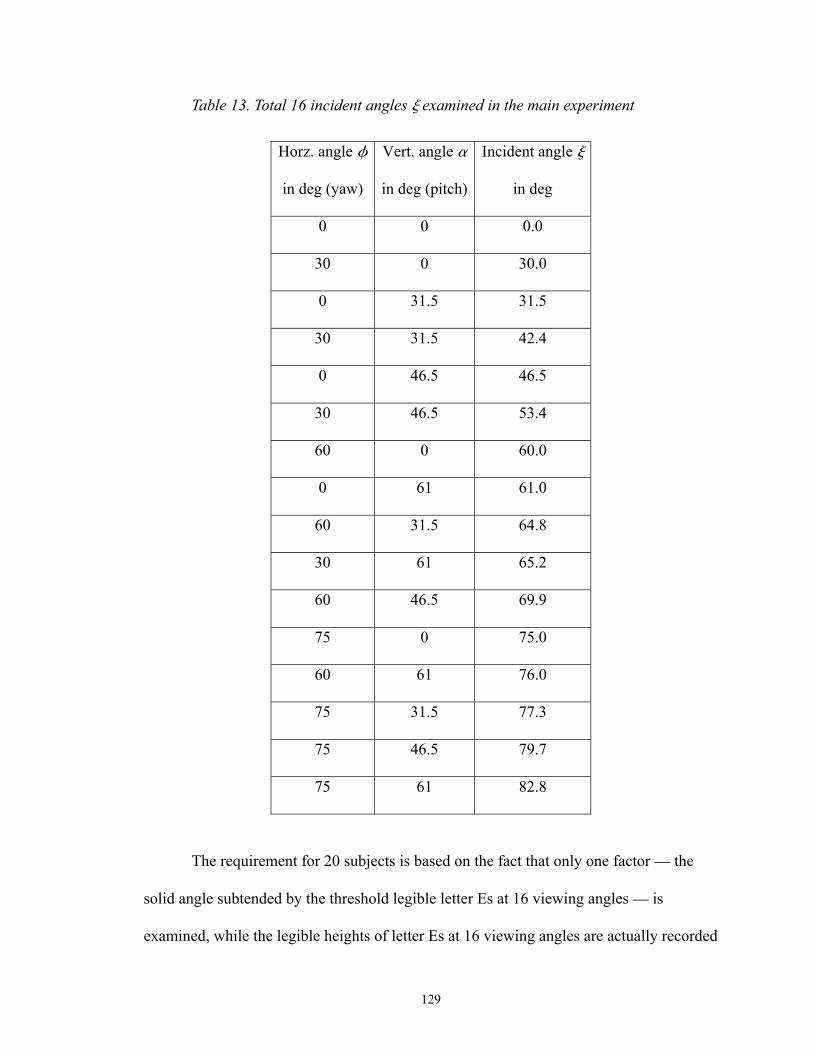
129
Table 13. Total 16 incident angles ξ examined in the main experiment
Horz. angle φ
in deg (yaw)
Vert. angle α
in deg (pitch)
Incident angle ξ
in deg
0 0 0.0
30 0 30.0
0 31.5 31.5
30 31.5 42.4
0 46.5 46.5
30 46.5 53.4
60 0 60.0
0 61 61.0
60 31.5 64.8
30 61 65.2
60 46.5 69.9
75 0 75.0
60 61 76.0
75 31.5 77.3
75 46.5 79.7
75 61 82.8
The requirement for 20 subjects is based on the fact that only one factor — the
solid angle subtended by the threshold legible letter Es at 16 viewing angles — is
examined, while the legible heights of letter Es at 16 viewing angles are actually recorded

130
in the laboratory. After consultation with Dr. Brenda Gillespie of the Center for Statistical
Consulting and Research (CSCAR) at the University of Michigan, it is determined that a
sample size of 20 will enable the main experiment (a binomial test: height versus viewing
angle) with a nominal 0.05 one-sided significance level to have 93% power to detect the
difference between the null hypothesis proportion (π0 of 0.99) and the alternative
proportion (πA of 0.80). This main experiment recruits 42 subjects; 22 are screened by
the requirements but only 20 qualified subjects participate in the experiment.
The E-charts used in this main experiment are updated with the new range of 16
viewing angles as listed in Table 13. The corresponding ranges of heights of 7 lines of
letter Es for different eyesight levels (20/20, 20/16, 20/12.5) at these 16 viewing angles
are listed in Appendix F. Likewise, a total of 48 E-chart sheets are used in the main
experiment for 3 levels of eyesight at 16 viewing angles.
5.2.3.2 Viewing Scenarios of 16 Tests
Figure 62 illustrates the viewing scenarios of 16 tests in the laboratory with a
constant background luminance (Lb) of 120 cd/m2, an image contrast (C%) of 97.9, and
zero ambient light. Due to unavoidable fluctuations when manually dimming fixture
surface luminance, 120.7 cd/m2 has actually been observed as the average background
luminance in a total of 320 tests for 20 subjects, with 16 tests each (20×16 = 320), as
illustrated in Figure 63. The experimenter collects the heights (H) of the threshold legible
letter Es recognized with 100% accuracy by the 20 subjects sitting 6.1 m away at 16

131
viewing angles under a constant lighting condition (image background luminance
Lb=120.7 cd/m2, image contrast C%=97.9, and zero ambient light). Solid angles
subtended by these legible letter Es are then calculated from these heights using (23)
previously to verify the constant-solid-angle hypothesis.
Figure 62. Viewing scenarios of 16 tests in the laboratory with constant background
luminance Lb=120.7 cd/m2, image contrast C%= 97.9, and zero ambient light
α=0 , φ=0 α=0 , φ=30 α=0 , φ=60 α=0 , φ=75
α=31.5 , φ=0 α=31.5 , φ=30 α=31.5 , φ=60 α=31.5 , φ=75
α=46.5 , φ=0 α=46.5 , φ=30 α=46.5 , φ=60 α=46.5 , φ=75
α=61 , φ=30 α=61 , φ=0 α=61 , φ=60 α=61 , φ=75

132
110.0
115.0
120.0
125.0
130.0
0.0
30.0
31.5
42.4
46.5
53.4
60.0
61.0
64.8
65.2
69.9
75.0
76.0
77.3
79.7
82.8
Incident angle ξ in deg
Bac
kgro
un
d lu
min
ance
Lb
in c
d/m
2
Avg background luminance
Figure 63. Mean background luminances of E-charts viewed at each of 16 tests
5.2.3.3 Experimental Procedures and Random Tests
Table 14 lists the procedures and duration for carrying out the 16 tests, which are
divided into 4 sessions in this main experiment. The duration of the main experiment is
approximately 100 minutes. Except for the first session, which is carried out first and has
a fixed order for its 4 tests (ξ = 0 , 30 , 60 , 75 ), as shown in Figure 64, the other three
sessions and the order of the 12 tests are randomly arranged to counteract the negative
effect of eye fatigue on the reading performance of text at larger incident angles.
Table 14. Procedure and duration of the main experiment
Order Procedures Minutes
1 Prepare for eyesight test and the first session n/a
2 Screen subjects 10
3 Paperwork, explain 5

133
Table 14 (continued)
Order Procedures Minutes
Trial Session φ in deg α in deg ξ in deg
1 0 0 0.0
2 30 0 30.0
3 60 0 60.0
4
4
1
75 0 75.0
10
5 Dimming fixture, subject has break 15
0 31.5 31.5
30 31.5 42.4
60 31.5 64.8 6 Random 2
75 31.5 77.3
10
7 Dimming fixture, subject has break 15
0 46.5 46.5
30 46.5 53.4
60 46.5 69.9 8 Random 3
75 46.5 79.7
10
9 Dimming fixture, subject has break 15
0 61 61.0
30 61 65.2
60 61 76.0 10 Random 4
75 61 82.8
10
Total 100

134
90.075.060.045.030.015.00.0
1614121086420
Incident angle ξ in deg
Figure 64. Random order of 12 tests in the main experiment in the later three sessions,
and the fixed order of the four tests (0 , 30 , 60 , 75 ) in the first session, as indicated by the dash line
5.2.3.4 Data Analysis
Figure 65 lists the threshold legible heights of letter Es recognized at each
incident angle with 100% accuracy separately by 5 subjects with eyesight 20/20, by 7
subjects with eyesight 20/16, and by 8 subjects with eyesight 20/12.5, a total of 20
subjects. Figure 66 lists the calculated solid angles subtended by those threshold legible
letter Es.
Test
ord
er n
um
ber

135
5 subjects with eyesight 20/20
0.005.00
10.0015.0020.0025.0030.0035.0040.00
0.0
30.0
31.5
42.4
46.5
53.4
60.0
61.0
64.8
65.2
69.9
75.0
76.0
77.3
79.7
82.8
Incident angle in deg
Thre
shol
d le
gibl
eh
eigh
t in
mm
Avg legible height
7 subjects with eyesight 20/16
0.005.00
10.0015.0020.0025.0030.0035.00
0.0
30.0
31.5
42.4
46.5
53.4
60.0
61.0
64.8
65.2
69.9
75.0
76.0
77.3
79.7
82.8
Incident angle in deg
Thre
shol
d le
gibl
eh
eigh
t in
mm
Avg legible height
8 subjects with eyesight 20/12.5
0.005.00
10.0015.00
20.0025.0030.00
0.0
30.0
31.5
42.4
46.5
53.4
60.0
61.0
64.8
65.2
69.9
75.0
76.0
77.3
79.7
82.8
Incident angle in deg
Thre
shol
d le
gibl
eh
eigh
t in
mm
Avg legible height
Figure 65. Threshold legible heights of letter Es recognized at 16 incident angles
by subjects at different eyesight levels (20/20, 20/16, 20/12.5)

136
5 subjects with eyesight 20/20
1.00
1.50
2.00
2.50
3.00
3.50
4.00
4.50
0.0
30.0
31.5
42.4
46.5
53.4
60.0
61.0
64.8
65.2
69.9
75.0
76.0
77.3
79.7
82.8
Incident angle in deg
Sol
id a
ngl
e su
bten
ded
in s
r x
10-6
Avg solid angle
7 subjects with eyesight 20/16
0.50
1.00
1.50
2.00
2.50
3.00
3.50
4.00
0.0
30.0
31.5
42.4
46.5
53.4
60.0
61.0
64.8
65.2
69.9
75.0
76.0
77.3
79.7
82.8
Incident angle in deg
Sol
id a
ngl
e su
bten
ded
in s
r x
10-6
Avg solid angle
8 subjects with eyesight 20/12.5
0.00
0.50
1.00
1.50
2.00
2.50
0.0
30.0
31.5
42.4
46.5
53.4
60.0
61.0
64.8
65.2
69.9
75.0
76.0
77.3
79.7
82.8
Incident angle in deg
Sol
id a
ngl
e su
bten
ded
in s
r x
10-6
Avg solid angle
Figure 66. Calculated solid angles subtended by the threshold legible letter Es recognized at 16 incident angles by 20 subjects at three eyesight levels

137
To test the constant-solid-angle hypothesis, the legibility data collected from 20
subjects need a ratio of the observed legibility data in the laboratory to the theoretically
predicted ones based on the constant-solid-angle hypothesis. This ratio must be
independent of the three eyesight levels (20/20, 20/16, 20/12.5). If the required ratios
calculated for all 16 viewing angles all equal 1, the constant-solid-angle hypothesis is
thus validated.
In the main experiment, two correlated ratios are used.
H observed / H predicted . Ratio of the observed threshold legible heights of letter Es
in the laboratory to those of the predicted letter Es that subtend a constant solid angle for
16 viewing angles for all three eyesight levels, as shown in Figure 67.
ω observed / ω predicted . Ratio of the solid angles ω subtended by the observed
threshold legible letter Es for all 16 incident angles to the predicted constant solid angle
based on the constant-solid-angle hypothesis, as shown in Figure 68.
According to (23), these two correlated ratios are in the relationship as in (24).
predicted
observed
predicted
observed
HH
ωω
=⎟⎟⎠
⎞⎜⎜⎝
⎛2
(24)
where
H = Threshold legible height of letter Es
ω = Solid angles subtended by the threshold legible letter Es

1.00
1.00
0.97
0.99
1.00
0.99
1.11
0.98
1.08
1.05
1.01
1.27
1.18
1.26
1.331.
43
0.6
0.8
1.0
1.2
1.4
1.6
1.8
0.0
30.0
31.5
42.4
46.5
53.4
60.0
61.0
64.8
65.2
69.9
75.0
76.0
77.3
79.7
82.8
030
030
030
600
6030
6075
6075
7575
00
31.5
31.5
46.5
46.5
061
31.5
6146
.50
6131
.546
.561
Hobserved/Hpredicted
Avg
rat
io o
f obs
erve
d h
eigh
t to
th
e pr
edic
ted
one
In
cide
nt
angl
e (ξ
), a
nd
its
hor
izon
tal (
φ) a
nd
vert
ical
por
tion
(α) i
n d
eg
Figu
re 6
7. R
atio
s of t
he o
bser
ved
thre
shol
d le
gibl
e he
ight
s of l
ette
r Es t
o th
e pr
edic
ted
ones
ver
sus 1
6 in
cide
nt a
ngle
s
1.00
1.00
0.95
0.98
1.00
0.98
1.24
2.07
1.80
1.61
1.41
1.64
1.02
1.11
1.18
0.97
0.50
1.00
1.50
2.00
2.50
3.00
0.0
30.0
31
.5
42.4
46
.5
53.4
60
.0
61.0
64
.8
65.2
69
.9
75.0
76
.0
77.3
79
.7
82.8
030
030
030
600
6030
6075
6075
7575
00
31.5
31.5
46.5
46.5
061
31.5
6146
.50
6131
.546
.561
ωobserved/ωpredicted
Avg
rat
io o
f obs
erve
d so
lid a
ngl
e to
th
e pr
edic
ted
one
In
cide
nt
angl
e (ξ
), a
nd
its
hor
izon
tal (
φ) a
nd
vert
ical
por
tion
(α) i
n d
eg
Figu
re 6
8. R
atio
s of t
he so
lid a
ngle
s sub
tend
ed b
y th
ese
obse
rved
thre
shol
d le
gibl
e le
tter E
s to
the
pred
icte
d on
es
to h
old
the
cons
tant
-sol
id-a
ngle
hyp
othe
sis v
ersu
s 16
inci
dent
ang
les
ξ φ
α ξ φ
α
138

139
Table 15 lists the predicted threshold legible heights of letter Es viewed at 16
incident angles and their subtended constant solid angle based on the constant-solid-angle
hypothesis, respectively for three eyesight levels (20/20, 20/16, 20/12.5). The predicted
constant solid angle for all 16 incident angles is determined in the laboratory as the ones
subtended by the threshold letter Es viewed at zero incident angle.
Figure 69 illustrates the scattergram of the average Hobserved /Hpredicted ratios of the
threshold legible heights of letter Es collected from the 20 subjects at each of the 16
incident angles, while Figure 70 illustrates the scattergram of the average
ωobserved/ωpredicted ratios versus 16 incident angles. Such average ratios can counteract the
individual differences of the subjects’ eyes and age and provide 93% power for detecting
the constant-solid-angle hypothesis in the main experiment with a nominal 0.05 one-sided
significance level.
90.075.060.045.030.015.00.0
1.60
1.40
1.20
1.00
0.80
R Sq Linear = 0.88
Incident angle ξ in deg
Figure 69. Simple scattergram of Hobserved / Hpredicted ratios versus 16 incident angles
Hob
serv
ed /
Hpr
edic
ted
577.0024.0 −⋅= ξpredicted
observed
HH
65.7

Tabl
e 15
. Pre
dict
ed th
resh
old
legi
ble
heig
hts o
f let
ter E
s at 1
6 in
cide
nt a
ngle
s and
the
pred
icte
d so
lid a
ngle
s sub
tend
ed
by th
ese
thre
shol
d le
gibl
e le
tter E
s at t
hree
eye
sigh
t lev
els t
o ho
ld th
e co
nsta
nt-s
olid
-ang
le h
ypot
hesi
s
α
φ
ξ Fo
r eye
sigh
t 20/
20
For e
yesi
ght 2
0/16
Fo
r eye
sigh
t 20/
12.5
V
ert.
angl
es
in d
eg
Hor
z.
angl
es
in d
eg
Inci
dent
an
gles
in
deg
Thre
shol
d le
gibl
e he
ight
in m
m
Subt
ende
d so
lid a
ngle
in
sr ×
10-6
Thre
shol
d le
gibl
e he
ight
in
mm
Subt
ende
d so
lid a
ngle
in
sr ×
10-6
Thre
shol
d le
gibl
e he
ight
in m
m
Subt
ende
d so
lid a
ngle
in
sr ×
10-6
0
0 0.
0 8.
85
2.10
7.
08
1.35
5.
57
0.83
0
30
30.0
9.
51
2.10
7.
61
1.35
5.
99
0.83
31
.5
0 31
.5
9.58
2.
10
7.67
1.
35
6.03
0.
83
31.5
30
42
.4
10.3
0 2.
10
8.24
1.
35
6.48
0.
83
46.5
0
46.5
10
.67
2.10
8.
53
1.35
6.
71
0.83
46
.5
30
53.4
11
.46
2.10
9.
17
1.35
7.
21
0.83
0
60
60.0
12
.52
2.10
10
.01
1.35
7.
88
0.83
61
0
61.0
12
.71
2.10
10
.17
1.35
8.
00
0.83
31
.5
60
64.8
13
.55
2.10
10
.84
1.35
8.
53
0.83
61
30
65
.2
13.6
6 2.
10
10.9
3 1.
35
8.60
0.
83
46.5
60
69
.9
15.0
9 2.
10
12.0
7 1.
35
9.49
0.
83
0 75
75
.0
17.4
0 2.
10
13.9
2 1.
35
10.9
5 0.
83
61
60
76.0
17
.98
2.10
14
.38
1.35
11
.31
0.83
31
.5
75
77.3
18
.84
2.10
15
.07
1.35
11
.86
0.83
46
.5
75
79.7
20
.97
2.10
16
.77
1.35
13
.20
0.83
61
75
82
.8
24.9
8 2.
10
19.9
9 1.
35
15.7
2 0.
83
140

141
90.075.060.045.030.015.00.0
2.20
2.00
1.80
1.60
1.40
1.20
1.00
0.80
R Sq Linear = 0.876
Incident angle ξ in deg
Figure 70. Simple scattergram of the ωobserved/ωpredicted ratios versus 16 incident angles
As shown in Figure 69, the trendline of the average Hobserved /Hpredicted ratios
approximately form a horizontal line at 1 (Hobserved /Hpredicted = 1) with fluctuations less
than 0.1 when incident angle ξ is smaller than a critical value around 65 . From this
critical value till 82.8 , which is the maximum viewing angle tested in the laboratory, the
average Hobserved /Hpredicted ratios increase linearly with the incident angle, following (25)
as regressed in SPSS with R2 = 0.88. The breaking point is at the critical value, which has
been calculated to be 65.7 when (25) equals 1.
577.0024.0 −⋅= ξpredicted
observed
HH (25)
where
Hobserved /Hpredicted = Ratio of the observed threshold legible height of letter Es in
the experiment to the predicted one based on the
constant-solid-angle hypothesis.
ωob
serv
ed /
ωpr
edic
ted
141.3062.0 −⋅= ξωω
predicted
observed
66.8

142
ξ = Incident angle, 65.7 < ξ 82.8 (the largest viewing angle tested in the
laboratory)
In terms of the statistical significance of the horizontal line (Hobserved /Hpredicted = 1)
when 0 ξ 65.7 , note that in the main experiment, as well as in other experiments
using E-charts as viewing materials, the minimum increase of Hobserved /Hpredicted ratio is
0.2, equals the ratio of the threshold legible strokewidth of letter Es to its height.
Therefore, since the fluctuations of the observed average Hobserved /Hpredicted ratios are less
than half the minimum increase (0.2) when 0 ξ 65.7 , the Hobserved /Hpredicted = 1 is
assumed to have 93% power provided by the sample size of 20 in the main experiment to
interpret the real legibility data when incident angle ξ 65.7 .
Likewise, as shown in Figure 70, the average ωobserved/ωpredicted ratios remain at 1
(ωobserved/ωpredicted = 1) with 93% power (N = 20), when incident angle 0 ξ 66.8 .
The average ωobserved/ωpredicted ratios increase linearly using (26) with R2 = 0.876, when
incident angle 66.8 < ξ 82.8 .
141.3062.0 −⋅= ξωω
predicted
observed (26)
where
ωobserved/ωpredicted = Ratio of the solid angle subtended by those observed threshold
legible letter Es to the predicted constant one based on the
constant-solid-angle hypothesis.
ξ = Incident angle, 66.8 < ξ 82.8

143
5.2.3.5 Outcomes
1. The constant-solid-angle hypothesis holds when 0 ξ 65.7 ; it does not
hold when 65.7 < ξ 82.8 (the largest incident angle examined in the main
experiment). For viewing angles 82.8 < ξ 90 , which are rare in lecture
halls, the constant-solid-angle hypothesis most likely does not hold either, but
further experimentation is needed to verify. The reasons for choosing 65.7 as
shown in Figure 69 as the critical angle rather than 66.8 as shown in Figure
70 include: (a) the smaller critical angle 65.7 is more conservative and thus
more reliable; (b) the threshold legible height rather than the solid angle is
normally measured in practice; thus the 65.7 associated with height should be
used; (c) the derived legibility equation in this study will be improved later in
light of the legible height of letter Es, rather than the subtended solid angle;
thus, the 65.7 associated with the threshold legible height is more
appropriate.
2. The negative effect of extremely large horizontal viewing angles (φ = 60 , 75 )
against the observer’s reading habit explains the jumping points (higher than
the adjacent before and after points) at angles ξ = 60 , 64.8 , 75 , as shown in
Figures 67, 68, 69, or 70.
3. Under the same viewing condition, the threshold legible height of letter Es is
determined by the subjects’ eyesight level, as well as affected by individual
differences such as age and light scattering characteristics (astigmatism) inside
eyes, which explain the data span (errors) at most of the viewing angles, as
shown in Figures 65, 66, 67, or 68.

144
4. The slightly improved reading performance (with average
Hobserved /Hpredicted < 1) at angles ξ = 31.5 , 42.4 , 46.5 , 61 , as shown in Figure
67, is probably due to the rewarding effect of the decreased pupil size that
enhances the visual depth as a result of the slight amount of ambient light,
which results from the light reflected from the white surfaces of the laboratory
ceiling lamps that have actually been turned off when the dimming fixture is
tilted up.
5.3 Improvement of the Derived Equation
Based on the the pilot and main laboratory experiments, the constant-solid-angle
hypothesis holds only when the incident angle 0 ξ 65.7 ; it does not hold when
65.7 < ξ 82.8 , or possibly even to 90 . Therefore, the derived legibility equation in
this study, (17) or (18) previously, should be improved to match the observed legibility
data collected in the laboratory so that it can better predict the reading performance of
text in reality. Improvement requires two steps. First, re-express (25) as (27).
( )577.0024.0 −⋅= ξpredictedobserved HH (27)
where
Hobserved = Observed threshold legible height of letter Es in practice
Hpredicted = Predicted threshold legible height which holds the constant-solid-angle
hypothesis, which is calculated using (17) previously

145
ξ = Incident angle, 65.7 < ξ 82.8
Second, substitute (27) into (17) when the incident angle 65.7 < ξ 82.8 ,
getting (28), which is the improved legibility equation. For incident angles between 82.8
and 90 , which have not yet been tested in the laboratory, (28) becomes inapplicable.
Fortunately, text is rarely viewed at such extremely large viewing angles between 82.8
and 90 in lecture halls or other viewing scenarios.
( )
( ) ( )⎪⎪⎩
⎪⎪⎨
⎧
≤<−⋅⋅⋅⋅⋅⎟⎠⎞
⎜⎝⎛⋅⋅
≤≤⋅⋅⋅⋅⎟⎠⎞
⎜⎝⎛⋅⋅
=−−
−
−−
0015.0532.0%
213.011
005.0532.0%
213.011
8.827.65577.0024.0cos5.2443
7.650cos5.2443
ξξξ
ξξ
CLSSwHH
CLSSwHH
D
bd
bd
(28)
where:
D = Legibility distance when text is viewed not perpendicular to the observer
H = Normal text height
Sw = Strokewidth of text
Sd = Denominator in the Snellen ratio of observer’s acuity level
Lb = Background luminance
C% = Luminance contrast percent
ξ = Incident angle between the display normal and the sightline of observer

146
5.4 Summary
A new equation for predicting the spatial legibility of text from seven critical
factors is derived from the existing Howett’s equation (1983), based on a
constant-solid-angle hypothesis, as
( ) ( ) 5.05.0532.0%
213.04 coscos101.4 −−−−− ⋅⋅⋅⋅⋅⎟⎠⎞
⎜⎝⎛⋅⋅×= αφCLS
SwHDH bd (D = Legibility
distance of text viewed not perpendicular to the display, H = Normal text height, H/Sw =
Height-to-strokewidth-ratio of text, Sd = Denominator in the Snellen ratio of observer’s
eyesight, Lb = Background luminance, C% = Luminance contrast percent, φ = Horizontal
viewing angle, α = Vertical viewing angle). This hypothesis is then verified consistent
with how retinal images of text activate cones in the centre fovea of an observer’s eyes.
In addition, this hypothesis is tested in the lighting laboratory at the University of
Michigan Transportation Research Institute (UMTRI) using legibility data collected from
3 human subjects participating in a pilot experiment and 20 subjects participating in the
follow-up main experiment. The outcomes show that the constant-solid-angle hypothesis
holds when the incident angle 0 ξ 65.7 , which is the viewing angle between the
display normal and the sightline of the observer, calculated using αφξ coscoscos = ,
but does not hold when 65.7 < ξ 82.8 (the largest incident angle examined in the
main experiment). Consequently, the legibility equation is improved as:
( )
( ) ( )⎪⎪⎩
⎪⎪⎨
⎧
≤<−⋅⋅⋅⋅⋅⎟⎠⎞
⎜⎝⎛⋅⋅
≤≤⋅⋅⋅⋅⎟⎠⎞
⎜⎝⎛⋅⋅
=−−
−
−−
0015.0532.0%
213.011
005.0532.0%
213.011
8.827.65577.0024.0cos5.2443
7.650cos5.2443
ξξξ
ξξ
CLSSwHH
CLSSwHH
D
bd
bd
147
CHAPTER 6
Step 3: Testing Ambient Light Effect on Legibility of Text
The verified and improved legibility equation (28) in Chapter 5 does not examine
the factor of ambient light. However, as described in Chapter 2, the ambient light can
affect the quality of the retinal image of text viewed. Therefore, its effect on the legibility
of text should be examined.
6.1 Theoretical Foundation for the Ambient-Light Hypothesis
Based on the model proposed by Moon and Spencer (1945) for calculating the
adaptation luminance, this study has developed an ambient-light hypothesis.
Ambient-light hypothesis. Without glare sources in the periphery (beyond 1 or
1.5 visual angle) of an observer’s field of view, ambient light in the viewing
environment should have a small influence (less than 9%) on the legibility level of text
when viewed with constant background luminance and luminance contrast.

148
This hypothesis is developed based on the adaptation luminance. Adaptation
luminance refers to the average luminance of those objects and surfaces in the immediate
vicinity of the observer, including the luminance of the observer’s fixation point, which
covers approximately one visual degree (1.5 by some authors), and the surrounding
luminances (Matković, 1997). Moon and Spencer (1945) proposed an equation to
calculate the adaptation luminance, as (29). According to (29), an observer’s eyes
primarily adapt to the luminance of their fixation point (1 , visual angle), while the
surrounding luminance beyond 1 in the viewing field also contributes to the adaptation
luminance (Matković, 1997).
( ) φθθθθφθ
π θθ ddLKLLffa )sin()cos(,913.0 2 ⋅⋅+⋅= ∫∫ > (29)
where:
La = Adaptation luminance in cd/m2
Lf = Average foveal luminance in cd/m2
L(θ, φ) = Surrounding luminance in the direction (θ, φ), as shown in Figure 71
θf = Foveal half angle, 0.5
K = 0.0096

149
Eye Line of sight Z
L(θ, φ)
φθ
Y
dω
Figure 71. Surrounding luminance in the field of view (Moon & Spencer, 1943, Figure 1, p. 445)
As claimed by Matković (1997), it is obvious from (29) that the surrounding
luminances located in the periphery (beyond 1 or 1.5 ) of the observer’s field of view
contribute less than 9% to the adaptation luminance, which is dominated by the foveal
luminance. If there are no bright sources at the periphery, this influence will be negligible
(Matković, 1997). If there are some glare sources at the periphery of the viewing field,
they reduce contrast visibility because light scattered in the lens obscures the fovea, thus,
substantially lowering the legibility of text. Therefore, the veiling luminance (Lv) should
be taken into consideration in this glare situation by using (30), as proposed by IESNA
(IESNA, 2000, RP-8-00, p. 23). Since this study does not examine glare and light
trespass, (29) is more appropriate than (30) for examining the influence of ambient light
on the legibility of text.
vba LLL += (30)
where:
La = Adaptation luminance

150
Lb = Background luminance of target
Lv = Veiling luminance, if glare sources are visible at the periphery.
Based on (29), the adaptation luminance of letter Es viewed in the laboratory is
dominated by the immediate background luminance of the E-charts, which has been fixed
at 187.5 cd/m2 in the pilot experiment and 120.7 cd/m2 in the main experiment, while the
ambient light should contribute little (less than 9%). According to Weber’s law, (1)
previously, adaptation luminance dominates the discrimination sensitivities of the
observer’s eyes to the details of text viewed, as well as the pupillary changes that affect
the view depth and quality of the retinal image. Therefore, with constant background
luminance of the E-charts in the laboratory, the discrimination sensitivities and pupillary
diameter of an observer’s eyes would remain almost constant within a very small range of
fluctuation, less than 9%, due to the variation of ambient light. Consequently, the ambient
light would have a small effect (less than 9%) on the legibility of text when viewed with
constant background luminance and luminance contrast in this study, as claimed by the
ambient-light hypothesis.
6.2 Laboratory Experiment to Test the Ambient-Light Hypothesis
A third laboratory experiment is designed to test the ambient-light hypothesis,
using legibility data collected from 20 human subjects in the same lighting laboratory at
the University of Michigan Transportation Research Institute (UMTRI). Restricted by the
10 assumptions used in this study, also aiming to focus on key variables, this experiment

151
examines the influence of ambient light on the legibility of text viewed only
perpendicularly to the observers.
6.2.1 Laboratory Settings
Three modifications to the set up from the previous experiments are made, as
shown in Figure 72. First, the previous black background wall is now covered with an
off-white canvas drop cloth to provide more significant surrounding luminance when
changing the ambient light. Second, diffusive white sheets of paper of letter-size are
attached behind the ceiling lamps to prevent direct glare to the observer’s eyes and
provide more uniform lighting on the background drop cloth. Third, two floor standing
fixtures with two T12 lamps each are mounted behind the dimmable fixture on both sides.
Subjects sit 6.1m away (20 ft) and recognize a total of 12 E-chart sheets perpendicularly
presented at different ambient light levels.
Figure 72. Modified laboratory settings to test the ambient-light hypothesis
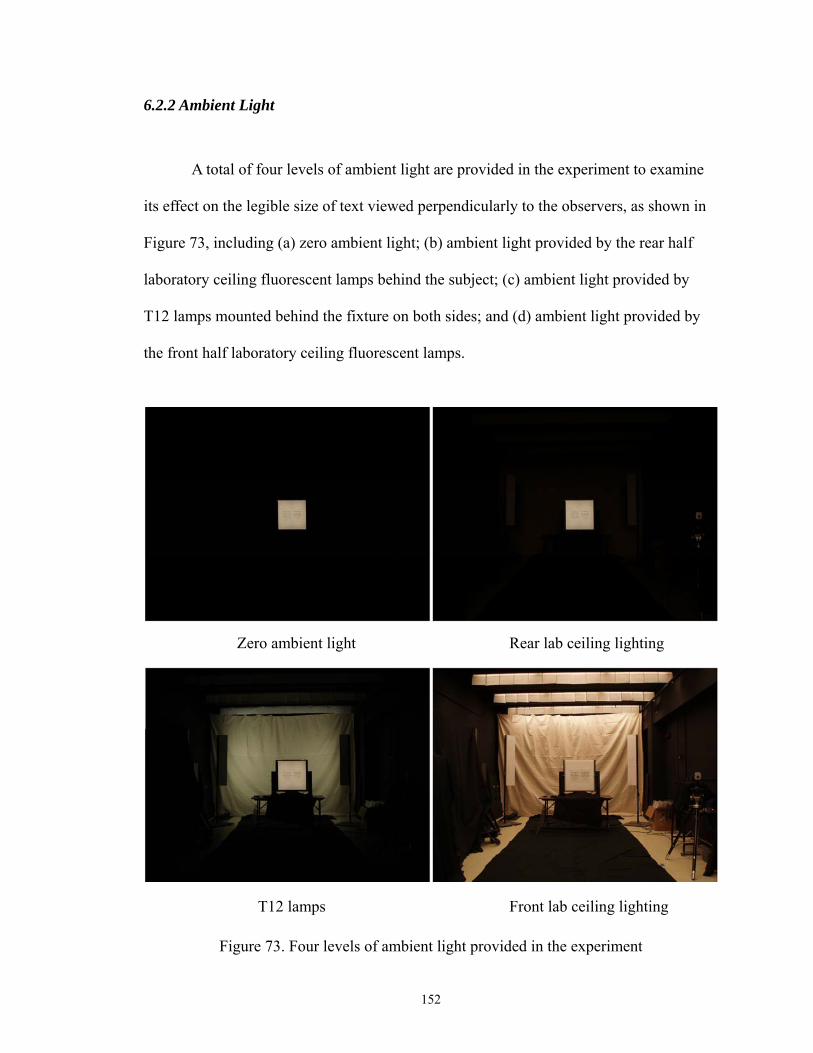
152
6.2.2 Ambient Light
A total of four levels of ambient light are provided in the experiment to examine
its effect on the legible size of text viewed perpendicularly to the observers, as shown in
Figure 73, including (a) zero ambient light; (b) ambient light provided by the rear half
laboratory ceiling fluorescent lamps behind the subject; (c) ambient light provided by
T12 lamps mounted behind the fixture on both sides; and (d) ambient light provided by
the front half laboratory ceiling fluorescent lamps.
Figure 73. Four levels of ambient light provided in the experiment
Zero ambient light Rear lab ceiling lighting
T12 lamps Front lab ceiling lighting

153
During the course of the experiment, when changing ambient light levels, by
dimming the fluorescent fixture, the background luminance (Lb) of viewing materials
remains at 124.2 cd/m2 with a standard deviation of 0.66 cd/m2 for all tests. The
luminance contrast of letter Es is also kept constant 97.9 (C%).
6.2.3 Subjects
The 20 subjects participating in this experiment are also required to be 20-29
years of age, with binocular eyesight of 20/20 or better (20/16, or 20/12.5), with or
without glasses, and normal color vision, to avoid the negative effect of age and color
deficient eyes. A total of 22 potential subjects are screened upon arrival: one fails the
eyesight requirement (20/25); a second subject with a superior eyesight level (> 20/10)
has participated in this experiment to satisfy the experimenter, though his data is not
included in the main analysis.
6.2.4 Factors Examined
The only dependent factor examined in this experiment is the legible size of letter
Es (height H) recorded for each test of the experiment. The only independent factor is the
surrounding luminance (Ls) at the periphery of the viewing field provided by each of the
four levels of ambient light. All other factors are fixed values. For example, the letter Es
on E-charts are printed black/white, with an average luminance contrast of 97.9 (C%). The

154
incident angle remains zero for perpendicular viewing. The legibility distance is a
constant 6.1m (20 ft). The background luminances (Lb) are 124.2 cd/m2 with a standard
deviation of 0.66 cd/m2 at different ambient light levels. The recognition performance is
at threshold legibility with 100% accuracy. Only the spectrum of fluorescent T8, daylight,
is examined.
6.2.5 Experimental Procedure and Duration
As shown in Table 16, the experiment has four steps and is completed by each
subject in approximately 30 minutes. Each subject is paid $10. The subject who has failed
the vision requirement is paid $5.
Table 16. Steps to carry out the experiment and duration
Step # Activities Time (min)
1 Prepare for eyesight test and four experimental tests Not counted
2 Screen subjects upon arrival 5
3 Explain and sign consent form 5
4 Carry out four tests (legible height of Es is recorded at each test) 20
Total 30
The four steps to carry out this experiment are explained below.

155
Step 1: Prepare for eyesight test and four experimental tests. Before each
subject arrives, the experimenter manually dims the surface luminance of the fluorescent
fixture to 124.2 cd/m2 with a standard deviation of 0.66 cd/m2 at four different ambient
light levels, to prepare for the eyesight test and the four experimental tests afterwards.
Step 2: Screen subjects upon arrival. Each subject is screened upon arrival to
determine whether they meet the requirements. Under the laboratory full ceiling lighting,
one purchased Snellen chart is first used; then two self-made eyesight E-charts are used at
an average background luminance 124.2 cd/m2. Only the qualified subjects continue to
the next steps.
Step 3: Explain and sign consent form. The experimenter then explains the
procedure to the subject, answers any questions the subject might have, and then asks the
subject to sign the consent form. In addition, the experimenter asks for the subject’s
approval to videotape the whole experiment. Refusing to be videotaped does not rule out
the subject’s eligibility to participate in the experiment.
Step 4: Carry out the 4 tests. The experimenter then starts to test the subject’s
reading performance. The legible sizes of letter Es at four tests with different ambient
light levels are tested. To smooth the transient adaptation of the subject’s eyes, the order
of the four tests is preset from the highest (front laboratory lighting) to the lowest (no
ambient light). Between tests, the subject has a 5-minute break to allow his/her eyes to
fully adapt to the ambient light. For each test, the threshold legible height of letter Es

156
with 100% accuracy is recorded.
6.2.6 Data analysis
The range of background luminances of E-charts viewed during the four tests
carried out by each of the 21 subjects (with one outlier) is shown in Figure 74. Based on
Figure 74, all materials are viewed at a mean 124.2 cdm2 with a standard deviation of
0.66 cd/m2 in this experiment for all tests for 21 subjects (subject #21 is with superior
vision > 20/10).
118
120
122
124
126
128
130
1 2 3 4 5 6 7 8 9 10 11 12 13 14 15 16 17 18 19 20 21
Experiment by each subject
Bac
kgro
un
d lu
min
ance
of
fou
r te
sts
in c
d/m
2
mean
20/20 20/16 20/12.5 better than 20/10
Figure 74. Range of background luminance of four tests in the experiment
by each subject at different eyesight levels (20/20, 20/16, or 20/12.5), at mean 124.2 cd/m2 with standard deviation of 0.66 cd/m2
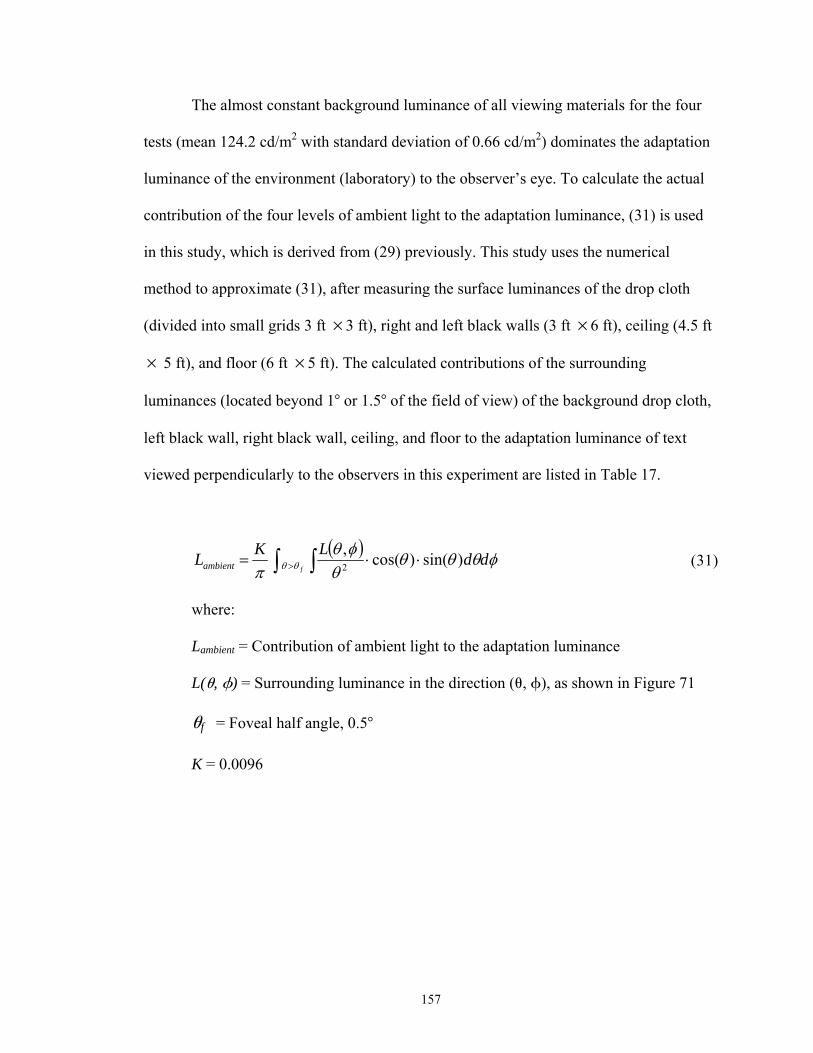
157
The almost constant background luminance of all viewing materials for the four
tests (mean 124.2 cd/m2 with standard deviation of 0.66 cd/m2) dominates the adaptation
luminance of the environment (laboratory) to the observer’s eye. To calculate the actual
contribution of the four levels of ambient light to the adaptation luminance, (31) is used
in this study, which is derived from (29) previously. This study uses the numerical
method to approximate (31), after measuring the surface luminances of the drop cloth
(divided into small grids 3 ft ×3 ft), right and left black walls (3 ft ×6 ft), ceiling (4.5 ft
× 5 ft), and floor (6 ft ×5 ft). The calculated contributions of the surrounding
luminances (located beyond 1 or 1.5 of the field of view) of the background drop cloth,
left black wall, right black wall, ceiling, and floor to the adaptation luminance of text
viewed perpendicularly to the observers in this experiment are listed in Table 17.
( ) φθθθθφθ
π θθ ddLKLfambient )sin()cos(,
2 ⋅⋅= ∫∫ > (31)
where:
Lambient = Contribution of ambient light to the adaptation luminance
L(θ, φ) = Surrounding luminance in the direction (θ, φ), as shown in Figure 71
θf = Foveal half angle, 0.5
K = 0.0096

158
Table 17. Measured surface luminances in cd/m2 and their contribution (Lambient) to the adaptation luminance
Surfaces Luminance
Front lab
ceiling
lighting
T12
lamps
Rear lab
ceiling
lighting
Zero
ambient
light
Mean measured 122.42 45.10 2.03 0
Min measured 3.42 0.65 0.27 0
Max measured 381.90 108.40 5.38 0
Back drop
cloth
Lambient calculated 3.53 1.97 0.08 0
Mean 6.38 1.26 0.17 0
Min 1.92 0.00 0.05 0
Max 16.08 9.99 0.43 0
Left dark
wall
Lambient 0.03 0.00 0.00 0
Mean 7.71 1.36 0.19 0
Min 0.91 0.00 0.04 0
Max 36.05 12.03 1.05 0
Right dark
wall
Lambient 0.03 0.01 0.00 0
Mean 107.92 5.44 1.14 0
Min 2.06 0.02 0.07 0
Max 273.40 47.74 3.99 0 Ceiling
Lambient 0.52 0.02 0.01 0
Mean 45.56 3.33 1.13 0
Min 1.75 0.00 0.15 0
Max 115.40 32.88 5.52 0 Floor
Lambient 0.38 0.02 0.01 0

159
In addition, Table 18 illustrates (a) the contribution of ambient light (Lambient) to
the adaptation luminance, (b) the foveal luminance (Lf), which is the mean background
luminance of the fixture surface, (c) the adaptation luminance (La), calculated using (32)
that is derived from (29) and (31), and (d) the percentage Lambient/La, at each level of
ambient light in this experiment.
∑+⋅= ambientfa LLL 913.0 (32)
where:
La = Adaptation luminance
Lambient = Contribution of ambient light to the adaptation luminance
Lf = Foveal luminance (the mean background luminance 124.2cd/m2)
Table 18. Calculated adaptation luminances and the contribution of ambient light in the whole surrounding environment at each test
Four different ambient
light levels
Lambient
in cd/m2
Lf
in cd/m2
La
in cd/m2 Lambient/La
Front lab ceiling lighting 4.48 124.20 117.88 3.80%
T12 lamps 2.02 124.20 115.42 1.75%
Rear lab ceiling lighting 0.10 124.20 113.49 0.08%
Zero ambient light 0.00 124.20 113.39 0%

160
In sum, of all the surrounding surfaces, the background drop cloth makes the
maximum contribution of its surrounding luminance to the adaptation luminance (e.g.,
3.53 cd/m2 for front laboratory ceiling lighting), though the contribution is still very small
(3.0%). Those from the dark side walls and dark floor approach zero. Thus, the
contribution of the surrounding environment at each ambient light level to the adaptation
luminance is very small, with a maximum of only 3.80% even under the bright front
laboratory ceiling lighting.
The threshold legible heights of letter Es recorded at three different eyesight
levels (20/20, 20/16, 20/12.5) and four levels of ambient light by all 21 subjects (one
outlier, with eyesight >20/10) are listed in Figure 75. As shown in Figure 75, the three
subjects with acuity 20/20 have a constant threshold legible height of 8.85mm of text
viewed at all four ambient light levels. For the six subjects with acuity 20/16, five have
the same threshold legible height of text (7.08mm) at all four ambient light levels, while
one has his threshold legible height as 7.08mm at three ambient light levels but 8.50mm
under the rear laboratory ceiling lighting. Ten of 11 subjects with acuity 20/12.5 have an
equivalent threshold legible height of 5.57mm at all four ambient light levels, while one
subject has better reading performance (4.45mm) in darkness. The subject with super
acuity (> 20/10) maintains the threshold legible height at 3.33mm for all four ambient
light levels.

161
23456789
10
front labceilinglighting
T12lamps
rear labceilinglighting
zeroambient
light
Ambient light levels
Legi
ble
hei
ght
in m
m 20/20,n=3
20/16,n=1
20/16,n=5
20/12.5,n=1
20/12.5,n=10
> 20/10,n=1
Figure 75. Legible heights of letter Es at different ambient light levels
6.2.7 Conclusions
Two conclusions can be drawn based on the data analysis:
1. When the background luminance (foveal luminance) of text remains constant,
changing the ambient light levels of the viewing scenario does not change the
reading performance of text. Over the range examined, as shown in Table 17,
ambient light has a very small effect on the legibility of text.
2. The adaptation luminance of text is determined primarily by the foveal
luminance. The contribution of ambient luminance to the adaptation is very
small, as long as no glare sources are visible at the periphery of the field of
view.

162
6.3 Summary
The influence of ambient light on the legibility of text is tested to validate the
legibility equation, (28) in Chapter 5, which does not examine ambient light as a factor.
First, a hypothesis (ambient-light hypothesis) is theoretically developed from a model
proposed by Moon and Spencer (1945) to calculate the adaptation luminance. This
hypothesis claims that ambient light in the viewing environment should have a small
influence (less than 9%) on the legibility level of text viewed with constant background
luminance and luminance contrast in a glare-free environment. This hypothesis is then
tested in the laboratory using 20 human subjects at four different ambient light levels,
including (a) zero ambient light, (b) ambient light provided by the rear half laboratory
ceiling fluorescent lamps behind the subject, (c) ambient light provided by T12 lamps
mounted behind the fixture on both sides, and (d) ambient light provided by the front half
laboratory ceiling fluorescent lamps. Legibility data collected from the 20 subjects show
that when the background luminance of text remains at 124.2 cd/m2 with a standard
deviation of 0.66 cd/m2, changing the ambient light levels of the viewing scenario does
not affect the threshold legible heights of letter Es (with 100% accuracy). Therefore,
ambient light has a negligible effect on the legibility of text.
163
CHAPTER 7
Step 4: A Computation Program and Its Application in Lecture Halls
Thus far, this study has derived, verified, and improved the legibility equation,
(28) previously, to predict the spatial legibility of text viewed at incident angles
0 ξ 82.8 . The absence of ambient light as a factor examined in (28) has also been
shown to not influence the accurate prediction of the legibility of text. Equation (28) is
therefore used as the underlying algorithm for a computation program to be developed in
this chapter.
7.1 Development of a Computation Program
Equation (28) has wide applications in many fields where the legibility of text is
concerned. Generally, it can be used to determine for observers of varied ages and
eyesight levels:
1. ideal viewing distances and viewing angles for recognizing given text with
fixed geometries, contrast, font, etc., under different lighting conditions.
2. appropriate size, contrast, and font of text presented at a fixed viewing
164
distance and viewing angles, under various lighting conditions.
3. three-dimensional (3D) ideal viewing space, or 2D ideal viewing areas along a
specific viewing plane of text presented on a single or multiple displays,
inside of which text is guaranteed legible with 100% accuracy.
4. appropriate size, location, and orientations of different displays installed in
buildings or their surroundings on which text is presented under multiform
viewing conditions.
This study adopts (28) to predict the spatial distribution of many consecutive
viewing spots from which text presented in lecture halls on a single or multiple displays
is viewed at an equivalent legibility level — threshold (just readable) with 100%
accuracy. Using (28), these viewing spots can be accurately located on x-y-z coordinates
by calculating their legibility distances at different viewing angles. Geometrically, these
viewing spots distributed in three dimensions confine a 3D ideal viewing space. Viewing
spots located right on the surface of this space have a threshold legibility level (just
legible with 100% accuracy) of text. Inside the 3D ideal viewing space, the closer to the
text the viewing spots are, the more legible the text is.
Although the 3D ideal viewing space of text directly shows its geometry and
shape, the spatial distribution of those viewing spots located actually on a specific
viewing plane where observers usually locate, such as that parallel to the sloped floor in
lecture halls at eye height level, is probably more useful in practice. Such distribution of
viewing spots along the specific viewing plane defines a 2D ideal viewing area inside of
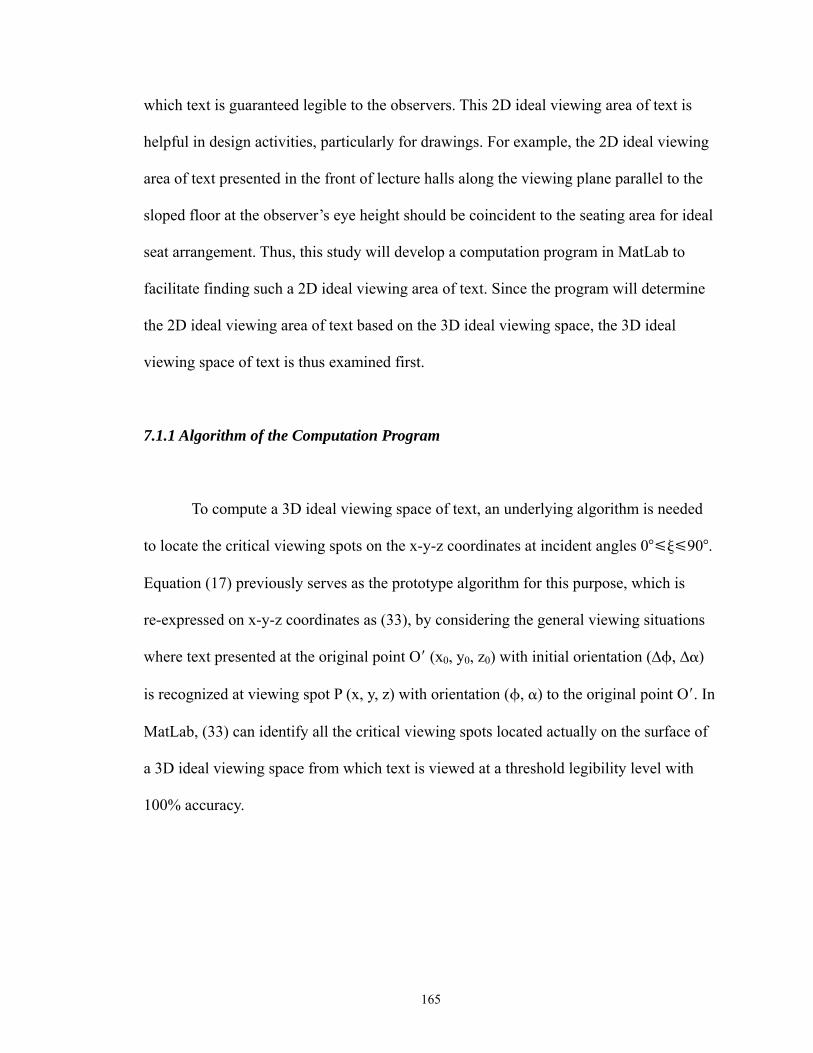
165
which text is guaranteed legible to the observers. This 2D ideal viewing area of text is
helpful in design activities, particularly for drawings. For example, the 2D ideal viewing
area of text presented in the front of lecture halls along the viewing plane parallel to the
sloped floor at the observer’s eye height should be coincident to the seating area for ideal
seat arrangement. Thus, this study will develop a computation program in MatLab to
facilitate finding such a 2D ideal viewing area of text. Since the program will determine
the 2D ideal viewing area of text based on the 3D ideal viewing space, the 3D ideal
viewing space of text is thus examined first.
7.1.1 Algorithm of the Computation Program
To compute a 3D ideal viewing space of text, an underlying algorithm is needed
to locate the critical viewing spots on the x-y-z coordinates at incident angles 0 ξ 90 .
Equation (17) previously serves as the prototype algorithm for this purpose, which is
re-expressed on x-y-z coordinates as (33), by considering the general viewing situations
where text presented at the original point O (x0, y0, z0) with initial orientation (∆φ, ∆α)
is recognized at viewing spot P (x, y, z) with orientation (φ, α) to the original point O . In
MatLab, (33) can identify all the critical viewing spots located actually on the surface of
a 3D ideal viewing space from which text is viewed at a threshold legibility level with
100% accuracy.

166
( ) ( )( ) ( ) ( )( ) ( ) ( )
( )⎪⎪⎪
⎩
⎪⎪⎪
⎨
⎧
⋅⋅⋅⎟⎠⎞
⎜⎝⎛⋅×=
∆⋅+∆⋅∆+⋅⋅⋅⋅+=∆⋅−∆⋅∆+⋅⋅⋅⋅+=
∆+⋅⋅⋅+=
−−
532.0%
213.011
0
5.05.000
5.05.000
5.15.000
5.2443
)cos(sin)sin()cos(coscoscos)sin(sin)cos()cos(coscoscos
)sin(coscos
CLSSwHHD
DzzDyyDxx
bd
αααφφααφαααφφααφ
φφαφ
(33)
where:
x = Legibility distance of text projected on x coordinate
y = Legibility distance of text projected on y coordinate
z = Legibility distance of text projected on z coordinate
D0 = Legibility distance when text is viewed at zero incident angle ξ =0
H = Normal text height
Sw = Strokewidth of text
Sd = Denominator in the Snellen ratio of observer’s eyesight
Lb = Background luminance
C% = Luminance contrast percent
φ = Horizontal viewing angle, -90 φ 90
α = Vertical viewing angle, -90 α 90
∆φ = Initial horizontally rotated angle of the visual media, positive for clockwise
∆α = Initial vertically tilted angle of the visual media, positive for clockwise
Although (17) has been improved to (28), it does not examine the incident angles
82.8 <ξ 90 , which will be examined in the future. To compute a complete 3D ideal
viewing space of text, (28) is then improved to (34) to expand its examined viewing

167
angles from 0 - 82.8 to the entire range of 0 - 90 , by assuming zero legibility distance
when the incident angle is beyond 82.8 till 90 .
( )
( ) ( )
⎪⎪⎪
⎪⎪⎪
⎨
⎧
≤<
≤<−⎟⎠⎞
⎜⎝⎛
≤≤⎟⎠⎞
⎜⎝⎛
= −−−
−−
00
0015.0532.0%
213.011
005.0532.0%
213.011
908.820
8.827.65577.0024.0cos5.2443
7.650cos5.2443
ξ
ξξξ
ξξ
CLSSwHH
CLSSwHH
D bd
bd
(34)
where:
D = Legibility distance when text is viewed at any incident angle 0 ξ 90
H = Normal text height
Sw = Strokewidth of text
Sd = Denominator in the Snellen ratio of observer’s acuity level
Lb = Background luminance
C% = Luminance contrast percent
ξ = Incident angle between the display normal and the sightline of observer
Such improvement is based on two facts. First, in reality, text is rarely viewed at
incident angles 82.8 <ξ 90 . Also, such an extremely distorted viewing of text should be
purposely avoided in practice for better legibility. According to the lecture hall survey,
only four lecture halls have their maximum viewing angles of visual media larger than
the critical angle 82.8 , as shown in Appendix E, including the Modern Language
Building 1200 (84.4 ) and 1400 (86.5 ), EE 1311 (83.7 ), and Hutchins Hall 100 (83.5 ).

168
Second, legibility distance for recognizing the same text viewed at an equivalent
legibility level decreases rapidly at incident angles 82.8 <ξ 90 that the assumption of
zero legibility distance at this range of incident angle ξ is appropriate because: (a) the
shape of the 3D ideal viewing space of text predicted using (34) remains almost
unchanged compared to that computed using (33), as illustrated in Figure 76 and 77 later,
and (b) zero legibility distance improves the 3D ideal viewing space of text in a
conservative manner by enhancing the legibility levels of text viewed at any incident
angles 82.8 <ξ 90 .
Accordingly, (33) is updated with the improved algorithm (34), and is
re-expressed on x-y-z coordinates as (35).
( ) ( ) ( )( ) ( ) ( ) ( ) ( )( )( ) ( ) ( ) ( ) ( )( )
( )⎪⎪⎪⎪⎪
⎩
⎪⎪⎪⎪⎪
⎨
⎧
≤<=′
≤<−⋅⋅⋅⋅⎟⎠⎞
⎜⎝⎛⋅×=′
≤≤⋅⋅⋅⎟⎠⎞
⎜⎝⎛⋅×=′
∆+∆∆+⋅⋅⋅′+=∆−∆∆+⋅⋅⋅′+=
∆+⋅⋅⋅′+=
−−−
−−
oo
oo
oo
908.820
8.827.65577.0024.05.2443
7.6505.2443
cossinsincoscoscoscossinsincoscoscoscoscos
sincoscos
0
1532.0%
213.011
0
532.0%
213.011
0
5.05.000
5.05.000
5.15.000
ξ
ξξ
ξ
αααφφααφαααφφααφ
φφαφ
D
CLSSwHHD
CLSSwHHD
DzzDyyDxx
bd
bd
(35)
where:
x = Legibility distance of text projected on x coordinate
y = Legibility distance of text projected on y coordinate
z = Legibility distance of text projected on z coordinate

169
0D′ = Modified legibility distance of text viewed at zero incident angle ξ =0 ,
which remains constant for 0 ξ 65.7 , then is modified with the incident
angle ξ for the extremely distorted viewing situation when 65.7 <ξ 82.8 ,
and is assumed to approach zero when 82.8 <ξ 90
H = Normal text height
Sw = Strokewidth of text
Sd = Denominator in the Snellen ratio of observer’s eyesight
Lb = Background luminance
C% = Luminance contrast percent
ξ = Incident angle between the display normal and the sightline of the observer,
0 ξ 90 , αφξ coscoscos =
φ = Horizontal viewing angle, -90 φ 90
α = Vertical viewing angle, -90 α 90
∆φ = Initial horizontally rotated angle of the visual media, positive for clockwise
∆α = Initial vertically tilted angle of the visual media, positive for clockwise
7.1.2 Shape of the 3D Ideal Viewing Space of Text
Using (35), the shape of the 3D ideal viewing space of text can be plotted in
MatLab. According to (35), the shape of the 3D ideal viewing spaces of different text
— which have different geometries, contrasts, fonts, etc., and are presented on different
visual media with different locations, mounting heights, initial orientation (∆φ, ∆α), and
viewed under different lighting conditions — should be homomorphous to each other, but

170
with different sizes, orientations, and locations. This study adopts a simple viewing
situation to plot an example 3D ideal viewing space of text in MatLab. In this sample
viewing scenario, a single letter E (H = 8.85mm, H/Sw = 5, C% = 97.9, Lb = 120cd/m2)
is presented at the origin point O (x0 = 0, y0 = 0, z0 = 0) with normal orientation
(∆φ = 0, ∆α = 0), and recognized by a young observer with 20/20 eyesight. By assigning
this sample viewing situation to (35), this study derives (36) as the algorithm for plotting
the 3D ideal viewing space of the sample letter E, as illustrated in Figure 76.
( ) ( )( ) ( )( ) ( )
( )⎪⎪⎪⎪
⎩
⎪⎪⎪⎪
⎨
⎧
≤<=′≤<−×=′
≤≤=′⋅⋅⋅′=
⋅⋅′=⋅⋅⋅′=
−
oo
oo
oo
908.8208.827.65577.0024.087.6
7.65087.6sincoscos
coscossincoscos
0
10
0
5.05.00
5.15.10
5.15.00
ξξξ
ξααφ
αφφαφ
DDD
DzDyDx
(36)
where:
x = Legibility distance of text projected on x coordinate, in meters
y = Legibility distance of text projected on y coordinate, in meters
z = Legibility distance of text projected on z coordinate, in meters
0D′ = Modified legibility distance of text viewed at zero incident angle ξ =0
φ = Horizontal viewing angle, -90 φ 90
α = Vertical viewing angle, -90 α 90
ξ = Incident angle between the display normal and the sightline of the observer,
0 ξ 90 , αφξ coscoscos =
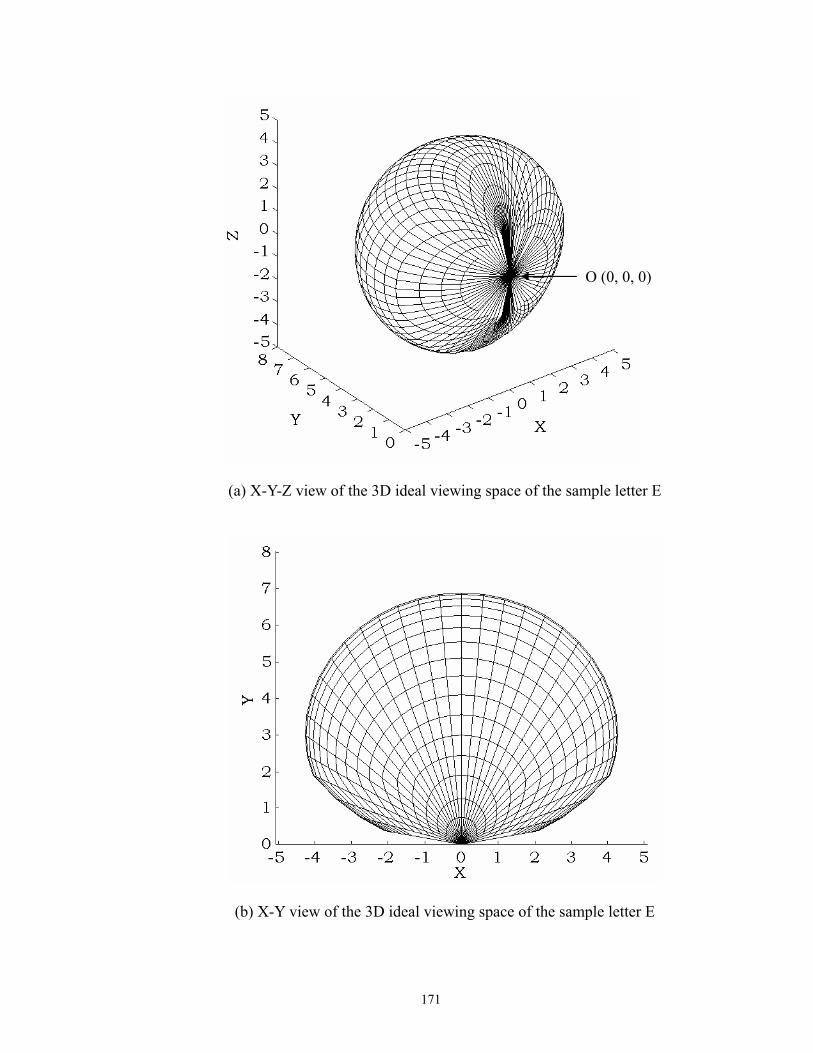
171
(a) X-Y-Z view of the 3D ideal viewing space of the sample letter E
(b) X-Y view of the 3D ideal viewing space of the sample letter E
O (0, 0, 0)

172
(c) X-Z view of the 3D ideal viewing space of the sample letter E
(d) Alternative X-Z view of the 3D ideal viewing space of the sample letter E

173
(e) Y-Z view of the 3D ideal viewing space of the sample letter E
Figure 76. The 3D ideal viewing space of a single letter E (H=8.85mm, H/Sw=5, C%=97.9, Lb=120cd/m2) presented at O (x0 = 0, y0 = 0, z0 = 0) with normal orientation
(∆φ=0, ∆α=0), and recognized by a young observer with 20/20 eyesight
The next step is to show the small differences between the shapes of the 3D ideal
viewing space of the sample letter E computed using algorithms before and after the
assumption of zero legibility distance at incident angles 82.8 <ξ 90 . The shape of the
3D ideal viewing space of the same letter E predicted using (37), which is derived from
(33), is plotted in MatLab, as shown in Figure 77. After comparing Figure 76 and 77,
particularly their X-Y and Y-Z view, only a small difference can be discerned on the
immediate portions near the origin point O (0, 0, 0) where the letter E is presented with
incident angle 65.7 <ξ 90 . Such small differences sustain the previous assumption of
zero legibility distance when incident angle ξ ranges beyond 82.8 till 90 for enhanced
legibility without sacrificing the accurate prediction of the 3D ideal viewing space of text.

174
( ) ( )( ) ( )( ) ( )
⎪⎪⎩
⎪⎪⎨
⎧
=⋅⋅⋅=
⋅⋅=⋅⋅⋅=
87.6sincoscos
coscossincoscos
0
5.05.00
5.15.10
5.15.00
DDzDyDx
ααφαφ
φαφ
(37)
where:
x = Legibility distance of text projected on x coordinate, in meters
y = Legibility distance of text projected on y coordinate, in meters
z = Legibility distance of text projected on z coordinate, in meters
0D = Legibility distance of text viewed at zero incident angle ξ =0
φ = Horizontal viewing angle, -90 φ 90
α = Vertical viewing angle, -90 α 90
(a) X-Y-Z view of the 3D ideal viewing space of the same letter E plotted using (37), which is the algorithm before the improvement

175
(b) X-Y view of the 3D ideal viewing space of the same letter E plotted using (37)
(c) X-Z view of the 3D ideal viewing space of the same letter E plotted using (37)
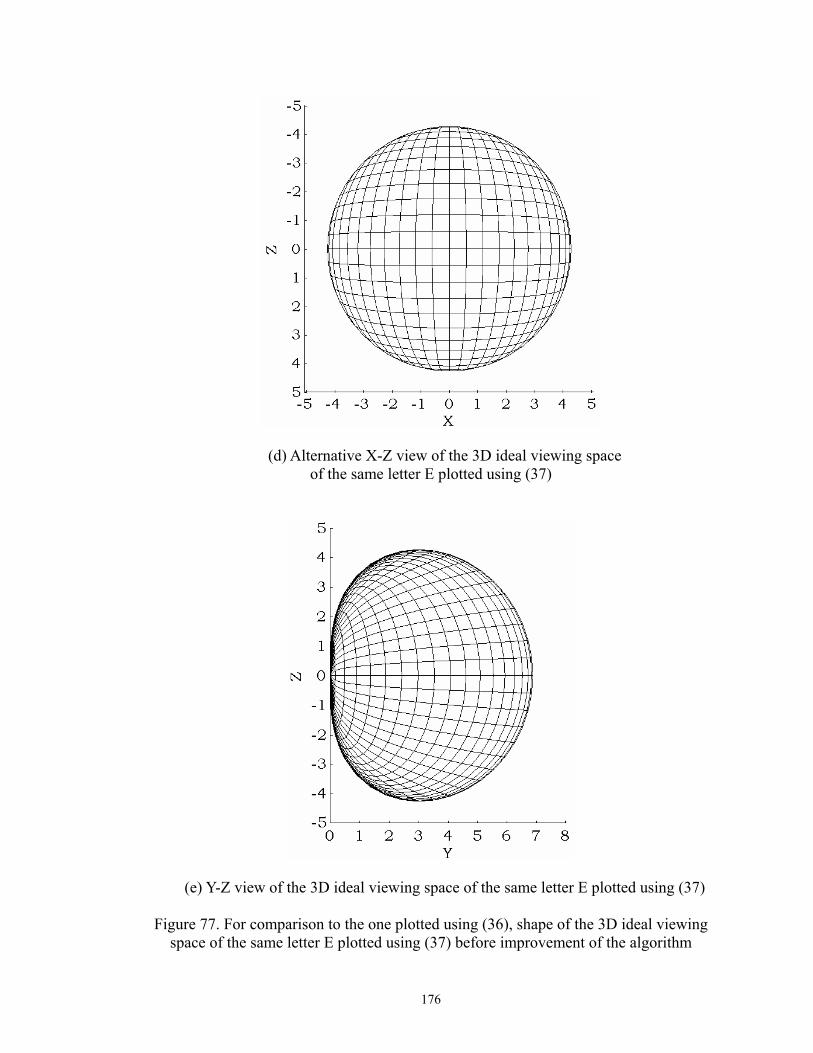
176
(d) Alternative X-Z view of the 3D ideal viewing space of the same letter E plotted using (37)
(e) Y-Z view of the 3D ideal viewing space of the same letter E plotted using (37)
Figure 77. For comparison to the one plotted using (36), shape of the 3D ideal viewing space of the same letter E plotted using (37) before improvement of the algorithm

177
7.1.3 2D Ideal Viewing Area of Text Viewed along a Viewing Plane
Theoretically, the 2D ideal viewing area of text viewed in practice along a specific
viewing plane is geometrically shaped by slicing the 3D ideal viewing space using this
plane. Specifically, the section view (y-z coordinates) of the 3D ideal viewing space of
text is formed by slicing it with a vertical viewing plane, and plan view (x-y coordinates)
with a horizontal plane. However, in practice, the viewing plane is often tilted, similar to
the one parallel to the sloped floor of the lecture halls at the observer’s eye height, which
slices the 3D ideal viewing space of text and forms a sloped 2D ideal viewing area. Then
how can the 2D ideal viewing area of text viewed along any viewing plane as desired in
practice be found, including but not limited to the plan and section view? The
straightforward solution is to find an algorithm to describe the required 2D ideal viewing
area of text on x-y-z coordinates, and then plot this area using this algorithm in a
mathematical software program such as Graph or MatLab. This solution is useful for
finding the plan and section view of the 3D ideal viewing space of text viewed in the
simplified situations where text is presented with a normal orientation (∆φ = 0, ∆α = 0).
For instance, based on the unimproved algorithm (37), this study generates algorithms
(38) and (39) to describe the plan and section views, by assuming 0=α and 0=φ
respectively, of the 3D ideal viewing space of the previous single letter E (H = 8.85mm,
H/Sw = 5, C% = 97.9, Lb = 120 cd/m2, located at the origin point O (x0 = 0, y0 = 0, z0 = 0)
with normal orientation (∆φ=0, ∆α=0), and recognized by a young observer with 20/20
eyesight). Using (38) and (39), respectively, the plan and section views of the 3D ideal
viewing space of the single letter E are plotted in Graph, as illustrated in Figure 78.

178
Plan view (x-y coordinates, α=0)
( )( )⎩
⎨⎧
⋅=⋅⋅=
5.1
5.0
cos87.6sincos87.6
φφφ
yx (38)
Section view (y-z coordinates, φ=0)
( )( )⎩
⎨⎧
⋅⋅=⋅=
ααα
sincos87.6cos87.6
5.0
5.1
zy (39)
where:
x = Legibility distance of text projected on x coordinate, in meters
y = Legibility distance of text projected on y coordinate, in meters
z = Legibility distance of text projected on z coordinate, in meters
φ = Horizontal viewing angle, -90 φ 90
α = Vertical viewing angle, -90 α 90
X
Y
O
Q1P1
φ
Y
Z
P2
Q2
Oα
(a) Plan View (b) Section View
OP1=OP2=6.87m
Figure 78. Plan and section views of the 3D ideal viewing space of the single letter E (H = 8.85mm, H/Sw = 5, C% = 97.9, Lb = 120cd/m2), presented at the origin point
O (x0 = 0, y0 = 0, z0 = 0) with normal orientation (∆φ=0, ∆α=0), and recognized by a young observer with 20/20 eyesight, as shown in Figure 77 previously

179
Similarly, based on the improved algorithm (36), this study generates (40) and (41)
to describe the plan and section views, respectively, of the single letter E, and plot Figure
79 in MatLab.
Plan view (x-y coordinates, α=0)
( )( )
( )⎪⎪⎪
⎩
⎪⎪⎪
⎨
⎧
≤<=′≤<−×=′
≤≤=′⋅′=
⋅⋅′=
−
oo
oo
oo
908.8208.827.65577.0024.087.6
7.65087.6cos
sincos
0
10
0
5.10
5.00
ξξξ
ξφ
φφ
DDD
DyDx
(40)
Section view (y-z coordinates, φ=0)
( )( )
( )⎪⎪⎪
⎩
⎪⎪⎪
⎨
⎧
≤<=′≤<−×=′
≤≤=′⋅⋅′=
⋅′=
−
oo
oo
oo
908.8208.827.65577.0024.087.6
7.65087.6sincos
cos
0
10
0
5.00
5.10
ξξξ
ξαα
α
DDD
DzDy
(41)
where:
x = Legibility distance of text projected on x coordinate, in meters
y = Legibility distance of text projected on y coordinate, in meters
z = Legibility distance of text projected on z coordinate, in meters
0D′ = Modified legibility distance of text viewed at zero incident angle ξ =0
φ = Horizontal viewing angle, -90 φ 90
α = Vertical viewing angle, -90 α 90
ξ = Incident angle between the display normal and the sightline of the observer,
0 ξ 90 , αφξ coscoscos =

180
(a) Plan view (α=0, unit in meters)
(b) Section view (φ=0, unit in meters)
Figure 79. Plan and section views of the 3D ideal viewing space of the single letter E (H = 8.85 mm, H/Sw = 5, C% = 97.9, Lb = 120 cd/m2) presented at the origin
point O (x0 = 0, y0 = 0, z0 = 0) with normal orientation (∆φ=0, ∆α=0), and recognized by a young observer with 20/20 eyesight, as shown in Figure 76 previously
φ=65.7
φ=82.8
α=82.8
α=65.7

181
Comparing Figure 78 and Figure 79, their small differences further sustain the
previous assumption of zero legibility distance at incident angles 82.8 <ξ 90 , thus
validating the improved algorithm (36).
However, when the general viewing situation is considered where text is
presented at the original point O (x0, y0, z0) with initial orientation (∆φ, ∆α) and
recognized by observers with different eyesight levels, it is difficult to generate a
prototype algorithm in light of (35) previously to describe the 2D ideal viewing area of
text along any tilted viewing plane, and then plot it out in Graph or MatLab. Therefore,
finding the 2D ideal viewing area of text viewed in general situations should be
facilitated by a computation program, which calculates and plots the 2D ideal viewing
area by geometrically slicing the specified viewing plane (horizontal, vertical, or tilted)
across the 3D ideal viewing space of text presented in any viewing situations. This study
has developed this computation program in MatLab.
7.1.4 Computation Program to Find the 2D Ideal Viewing Area
The computation program developed in MatLab has used (35) previously as the
underlying algorithm. The program code appears in Appendix G. In daily life, text is often
simultaneously presented on a wide variety of displays: instrument panels, TV monitors,
computers screens, blackboards, projection screens, billboards, warning placards,
architectural or roadway signs, maps, books, magazines, etc. Considering such popular

182
multitask viewing conditions in practice, this program calculates an overlapped 2D ideal
viewing area of text presented on multiple visual media installed with different
geometries, locations, mounting heights, and orientations, under different lighting
conditions, and viewed by observers located along any viewing plane, similar to that
parallel to the sloped floor of lecture halls at eye height level.
As preliminarily developed in this study, this program makes three presumptions.
1. Text presented on multiple visual media is viewed by an identical observer
each time to compute a 2D ideal viewing area. For a mass audience, like that
in lecture halls, their average eyesight level is used in the computation
program, that is, usually 20/20, which is the normal eyesight level of the
population. Better eyesight levels might also be used to predict smaller 2D
ideal viewing areas with enhanced legibility.
2. Text presented on different visual media is assumed to have different
geometries (height, height-to-strokewidth ratio) and be under different
lighting conditions (background luminance, luminance contrast percent),
while text presented on the same visual medium is assumed to be identical in
their geometries and under uniform lighting conditions. In practice, however,
even on the same visual medium, text might be of different sizes and the
lighting might be uneven. In such cases, the visual medium can be divided
into several uniform pieces and then individually calculated in the program.
3. Thus far, the visual media is assumed to be rectangular in shape and without
depth. The overlapped 2D ideal viewing area of text presented on a single

183
rectangular display is computed using nine critical points, as illustrated in
Figure 80. Most visual media used in practice are rectangular in shape. For
those not rectangular, similar calculating points can be found for computing
their overlapped ideal viewing areas.
top left top middle top right
middle leftcenter
middle right
bottom left bottom middle bottom right
DISPLAY
Figure 80. Nine points where text is presented to calculate the overlapped 2D ideal
viewing area of a single visual medium
The flow of this computation program is listed below.
1. Input the number of visual media
2. Input the observer’s eyesight level
3. Input the text geometries (height, height-to-strokewidth ratio), and the lighting
conditions (background luminance, luminance contrast percent) where text is
presented on each visual media
4. Calculate the on-axis legibility distance of text presented on each visual media
5. Input the geometries (heights, widths, locations on x-y-z coordinates) and
initial orientations (∆φ, ∆α) of each visual media

184
6. Find the x-y-z coordinates of the nine calculating points on each media
7. Define the viewing plane where the observer’s eyes are located
8. Draw the 3D ideal viewing spaces of text presented on each calculating point
on each visual media, and then slice them all with the specified viewing plane
9. Plot the overlapped 2D ideal viewing area of text presented on all visual
media
10. Display the parameters of the 2D ideal viewing area.
7.2 Architectural Application of the Computation Program in Lecture Halls
The developed computation program can be used in any field where reading text
is important, such as architecture, wayfinding, driving safety, transportation,
manufacturing, advertising, and exhibitions. This study uses it to facilitate modern lecture
hall design, where architects need to precisely know the ideal shape and size of the
audience area for arranging seats along the flat or sloped floor. The required overlapped
ideal viewing area of text presented on multiple displays inside modern lecture halls can
be determined using this program, by slicing the viewing plane parallel to the sloped
floor of lecture halls at eye height level through all the 3D ideal viewing spaces of text
presented on each single display. For instance, given 3 visual media installed in the front
of a sample lecture hall with sloped floor, including a whiteboard, a middle projection
screen, and a side tack board, and viewed by a standard observer with 20/20 eyesight
sitting along the slopped floor. Size of the sample lecture hall is 16m (width)×20m

185
(length)×8m (height), with the original point O(0m, 0m, 0m) preset to the bottom center
of the front wall, as shown in Figure 81. The sloped angle of the floor is θ=18 . The
distance in y-coordinate from the original point O to the start edge of the sloped viewing
plane is 3.5m. The eye height of the seated observers on the floor is 1.2m. Table 19 lists
all the geometries of the visual materials presented inside the lecture, along with their
lighting conditions.
O (0, 0, 0)
1 whiteboard
21
31 3
2
O
seating area
viewing plane
2 projection screen3 tack board
3.5m
18�
20m
16m
8m
Figure 81. Sample lecture hall inside of which text is presented on three visual media and
viewed by observers located along the viewing plane parallel to the sloped floor

186
Table 19. Geometries of three viewing materials
Geometries Whiteboard Projection screen Tack board
Text height 40mm 40mm 40mm
Height-to-strokewidth ratio 5 4.8 5.5
Background luminance Lb 65cd/m2 55cd/m2 70cd/m2
Luminance contrast percent 93% 85% 90%
Size of visual media 6m (width) ×
2.2m (height)
4m (width) ×
3m (height)
1m (width) ×
1.5m (height)
Original point of media (0m, 0m, 1.5m) (4m, 0.5m, 3.2m) (-5m, 2m, 1.5m)
Initial orientation ∆φ=0 , ∆α=0 ∆φ=0 , ∆α=0 ∆φ=30 , ∆α=15
After running the program using all these inputs, the predicted overlapped 2D
ideal viewing area is shown in Figure 82. This ideal viewing area should be fit into the
audience area shown in Figure 81 previously, as illustrated in Figure 83, to arrange seats
from which text simultaneously presented on all these visual media is guaranteed legible.

187
(a) X-Y plan view of the predicted overlapped 2D ideal viewing area of text (unit in meters)
(b) X-Y-Z view of the predicted overlapped 2D ideal viewing area of text exactly on the viewing plane, which is parallel to the sloped floor at eye height level of 1.2m
(unit in meters)
O (0, 0, 0)
Overlapped ideal viewing area
Overlapped ideal viewing area
O (0, 0, 0)

188
(c) Y-Z section view of the predicted overlapped 2D ideal viewing area of text
(unit in meters)
Figure 82. Predicted overlapped 2D ideal viewing area of text presented on whiteboard, projection screen, and tack board, simultaneously viewed by an observer with 20/20
eyesight who sits along the sloped floor with his eyes at 1.2m above the floor

189
21
3.7
18.2
8-8
Ideal viewingarea to arrangeseats
Lecture hall boundary alongthe viewing plane
(a) Process to determine the ideal viewing area for arranging seats
Ideal viewing areato arrange seats
21m 14.5m
3.7m
O(0,0)8m
Audience area
(b) Determined ideal viewing area to arrange seats (unit in meters)
Figure 83. Ideal viewing area used to arrange seats in the sample lecture hall, viewed along the plane parallel to the sloped floor at eye height 1.2 m

190
7.3 Verification of the Computation-Program-Aided Design Method
The previous example, as illustrated in Figure 82 and Figure 83, has demonstrated
the applicability and the procedure for using the computation-program-aided design
method in lecture hall design to determine the ideal viewing area, inside of which
observers can clearly read text simultaneously presented on multiple displays with 100%
accuracy. Before this innovative design method is recommended to architects in practice,
the external validity of this preliminarily developed computation program to be used in
lecture halls is verified using a field experiment carried out in the lecture hall in the Art &
Architecture Building. This field experiment collected legibility data from 21 human
subjects who read viewing materials presented at three different locations in the lecture
hall.
7.3.1 Subject Requirements and Screening
Subjects (N = 21) must be 20-29 years of age, with exactly binocular eyesight
20/12.5 (with or without glasses), and normal color vision. This experiment uses 20/12.5
eyesight rather than 20/20, that is, the normal acuity level of the population, because:
(a) 20/12.5 eyesight is used just as a sample to test the computation-program-aided design
method; the experimental results could be tested by other eyesight levels as well,
(b) much more subjects recruited in previous experiments have 20/12.5 eyesight than

191
20/20, and (c) observers with 20/12.5 eyesight have less common abnormal eye problems,
therefore, more reliable results. All participants are strictly screened upon arrival using
two self-made eyesight E charts based on the British standard BS 4274-1:2003, as shown
in Figure 56 previously. These charts are mounted on the whiteboard in the front of the
lecture hall, and lit with a table lamp to have uniform background luminance of at least
120 cd/m2. Potential participants sit 20 ft away from the eyesight charts, with their gaze
line perpendicular to the charts. To double check, all have their eyesight tested using two
charts. In addition, potential participants are also asked if they have abnormal color
vision. Since viewing targets in this experiment are achromatic letter Es, the requirement
of normal color vision in this experiment is to preclude any potential negative effect of
chromatic aberration on achromatic text.
7.3.2 Field Experiment Settings
The lecture hall (room 2104) in the Art & Architecture building is carefully
chosen to do the test. The viewing materials include 3 E-charts (four lines of letter Es
with the same height but random orientations, different from those used in previous
experiment) printed on matte paper and presented in the lecture hall at different locations
with different orientations, as illustrated in Figure 84. Subjects are asked to find the right
seat(s) location to clearly read all three E-charts at the same time with threshold 100%
accuracy.

192
E-chart 1, ∆φ=0, ∆α=0
E-ch
art 2
, ∆φ
=90,
∆α
=0
E-ch
art 3
, ∆φ
= -9
0, ∆α
= 0
(0m,0m,1.59m)x
y
E-chart 2
Eye height level
18.76°y
z
(0,0,0)
seating area
E-chart 1
x-y plan view y-z section view
E-chart 1 E-chart 2 E-chart 3
170mm
170mm
E-chart 3
1.2m
o o
oo
oo
P1
(-5.
21m
, 8.2
m, 3
.47m
)P2
(5.2
1m, 7
.0m
, 3.4
7m)
P3
Figure 84. Experimental settings in the lecture hall
For the location of the viewing materials, as shown in Figure 84, E-chart 1 is
installed on the whiteboard in the front of lecture hall and centered at point
P1 (0m, 0m, 1.59m) with initial orientation (∆φ=0 , ∆α=0 ). E-chart 2 is installed on the
west side wall and centered at point P2 (-5.21m, 8.2m, 3.47m) with initial orientation
(∆φ=90 , ∆α=0 ). E-chart 3 is installed on the east side wall and centered at point
P3 (5.21m, 7.0m, 3.47m) with initial orientation (∆φ= -90 , ∆α=0 ). As illustrated in
Figure 85, different E-charts have different letter size (6.6mm, 8.7mm, and 5.2mm) and
different contrast (90%, 86%, and 53.3%). These letter Es are printed on matte paper.
Each E-chart, including letter Es and margins, is 170mm wide by 170mm high, and
subtends about 1.5 to the observer’s eyes within the center foveal area when viewed at
about 6.7 meters (Moon & Spencer, 1943). Excluding the margins, the actual distributed
area of all letter Es is 125.4mm wide by 85.6mm high in E-chart 1, 147.9mm by 93.3mm
in E-chart 2, and 98.8mm by 76.8mm in E-chart 3.

193
Whiteboard E-chart 1H=6.6mmC%=90
West wall E-chart 2H=8.7mmC%=86
East wall E-chart 3H=5.2mmC%=53.3
170mm17
0mm
Figure 85. E-charts as the viewing materials
7.3.3 Predicted Ideal Seat Location
The ideal seat location where subjects can simultaneously read all three E-charts
with 100% accuracy is then predicted using the computation-program-aided design
method as the overlapped small area shown in Figure 86, which is located at the center
point PPred (2.2m, 5.94m, 2m) with size about 0.2m by 0.2m. This predicted area is so
small that it can be occupied within only one seat. Following field measurement in the
lecture hall, the predicted location is actually the fourth fixed seat counting from the east
side wall in the second row. In other words, as predicted using the
computation-program-aided design method, sitting only in this seat can the subjects with
20/12.5 acuity clearly read all three E-charts.

194
(a) Predicted ideal seat location at the XY plan view (unit: meters)
(b) Zoom in of predicted ideal seat location (unit: meters)
Ppred (2.2m, 5.94m, 2m)
Ppred (2.2m, 5.94m, 2m)
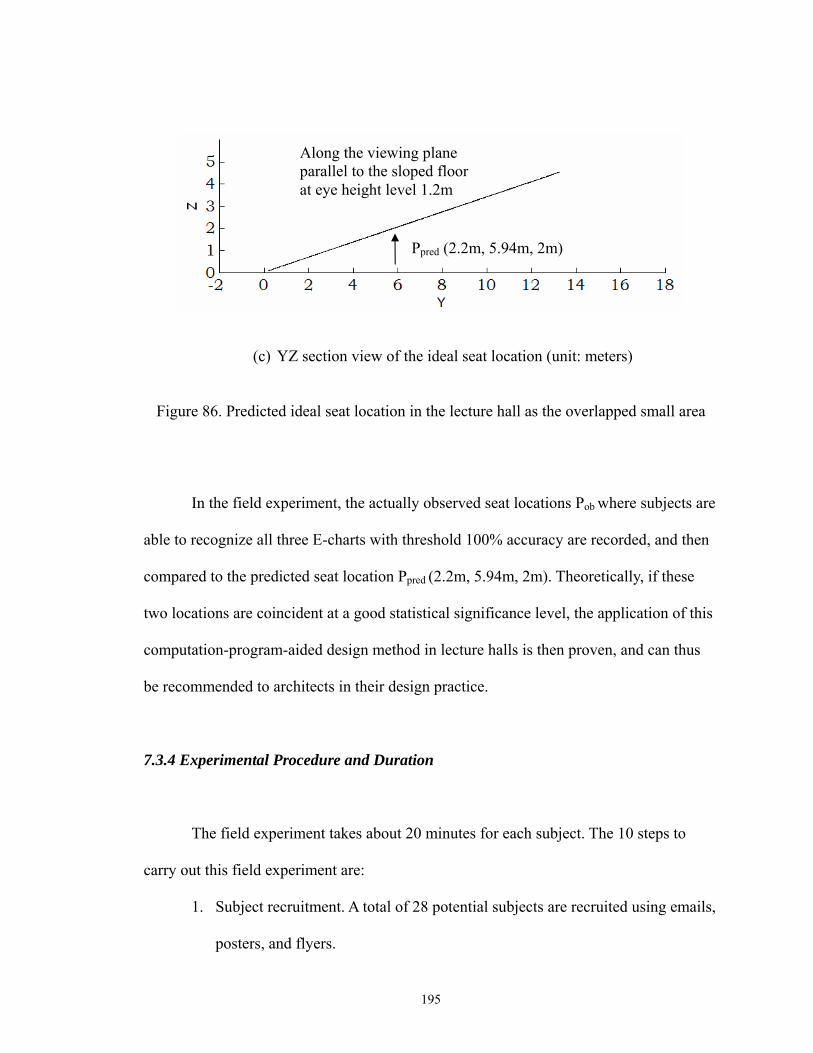
195
(c) YZ section view of the ideal seat location (unit: meters)
Figure 86. Predicted ideal seat location in the lecture hall as the overlapped small area
In the field experiment, the actually observed seat locations Pob where subjects are
able to recognize all three E-charts with threshold 100% accuracy are recorded, and then
compared to the predicted seat location Ppred (2.2m, 5.94m, 2m). Theoretically, if these
two locations are coincident at a good statistical significance level, the application of this
computation-program-aided design method in lecture halls is then proven, and can thus
be recommended to architects in their design practice.
7.3.4 Experimental Procedure and Duration
The field experiment takes about 20 minutes for each subject. The 10 steps to
carry out this field experiment are:
1. Subject recruitment. A total of 28 potential subjects are recruited using emails,
posters, and flyers.
Along the viewing plane parallel to the sloped floor at eye height level 1.2m
Ppred (2.2m, 5.94m, 2m)

196
2. Experiment installation. The three E-charts are mounted in the lecture halls at
their preset locations and orientations.
3. Screening subjects. All 28 subjects are screened upon arrival; 7 fail the
requirements. The 21 subjects with eyesight 20/12.5 and normal color vision
participate in this experiment.
4. Subjects sign the consent form once the experimenter explains the procedures
and answers any questions.
5. Before the experiment starts, subjects sit in the lecture hall for 5 minutes to
adapt their eyes to the preset light levels.
6. The experimenter demonstrates the selection pattern for subjects to choose an
ideal seat location in lecture halls to simultaneously read three E-charts with
100% accuracy.
7. Experiment starts. The experimenter asks the subjects to find the ideal seat(s)
location where he/she is able to clearly read all three E-charts with 100%
accuracy. In this experiment, at least 1, at most 4, on the average 3 times have
been tried by each subject to find the final ideal seat location. During this
process, the experimenter double checks the reading performance of the
subjects.
8. The final seat location the subject finds is then recorded for each subject.
9. Subjects are paid and dismissed.
10. Data analysis.

197
7.3.5 Factors Examined
Only one parameter is recorded in this field experiment — seat location, which is
the combination of viewing distances and viewing angles. Other non-examined factors all
have preset values. Only one light level is examined — the typical fluorescent lighting
conditions in the lecture hall for blackboard teaching and/or class discussion, with both
blackboard lighting and audience area lighting. Subjects are actually 20-28 years old
(20-29 as required), mostly 22~23, and all have the same Snellen acuity level of 20/12.5.
The viewing materials of the E-charts are printed black/white on matte paper. Letter Es
have constant height-to-strokewidth ratio of 5, but different heights (6.6mm, 8.7mm,
5.2mm) and different contrast (90%, 86%, and 53.3%) for E-charts 1, 2, and 3,
respectively.
7.3.6 Data Analysis and Results
The distribution of the observed ideal seat locations are illustrated in Figure 87,
which is the XY plan view of the lecture hall tested. The predicted ideal seat location is
lightly shadowed as the fourth fixed seat counting from the east side wall in the second
row. Of the 21 subjects, 17 (81% of 21) choose the predicted ideal seat location during
the test, while 3 other subjects (14% of 21) choose the immediately adjacent one, the fifth
fixed seat counting from the east wall in the second row. Only one subject (5% of 21)
insists that he can see all three E-charts the best in the sixth seat counting from the east
wall in the second row.
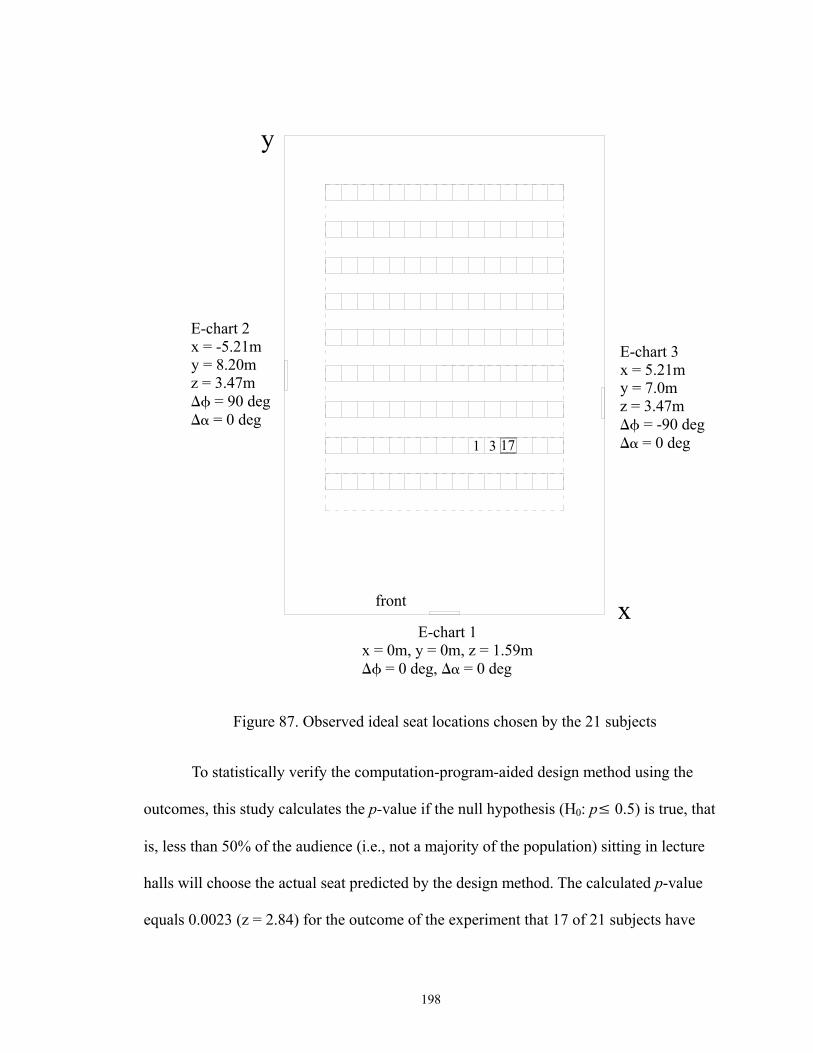
198
E-chart 1x = 0m, y = 0m, z = 1.59m∆φ = 0 deg, ∆α = 0 deg
E-chart 2x = -5.21my = 8.20mz = 3.47m∆φ = 90 deg∆α = 0 deg
E-chart 3x = 5.21my = 7.0mz = 3.47m∆φ = -90 deg∆α = 0 deg
x
y
1731
front
Figure 87. Observed ideal seat locations chosen by the 21 subjects
To statistically verify the computation-program-aided design method using the
outcomes, this study calculates the p-value if the null hypothesis (H0: p≤ 0.5) is true, that
is, less than 50% of the audience (i.e., not a majority of the population) sitting in lecture
halls will choose the actual seat predicted by the design method. The calculated p-value
equals 0.0023 (z = 2.84) for the outcome of the experiment that 17 of 21 subjects have

199
chosen the predicted seat. Therefore, the outcome (17 of 21 subjects choose the predicted
seat) is considered to be very statistically significant to reject the null hypothesis
(H0: p≤ 0.5) even at the significance level of 0.01 (usually α = 0.05 in conventional
criteria). In addition, given an error allowance of one seat, which might still be acceptable
in lecture hall design for determining the ideal viewing area, 20 of 21 subjects have
chosen the predicted seat or its immediately adjacent one in the experiment. For a stricter
null hypothesis H0: p≤ 0.8, that is, less than 80% of the audience sitting in lecture halls
will choose the predicted seat or its immediately adjacent one, the calculated p-value
equals 0.003 (z = 2.75) for the outcome that 20 of 21 subjects choose the predicted seat or
its immediately adjacent one. According to the p-value of 0.003, the outcome (20 of 21
subjects choose the right seats) is very statistically significant at the level of 0.05 to reject
the stricter null hypothesis (H0: p≤ 0.8). Consequently, the computation-program-aided
design method has proven to be an accurate and fully reliable tool for predicting the
overlapped ideal viewing area of text viewed in modern lecture halls.
7.4 Summary
After the derived and verified equation (28) is further improved to (34) to predict
the legibility levels of text viewed at any incident angles 0 ξ 90 , (34) is then used as
the underlying algorithm to develop a computation-program-aided design method in
MatLab. This program-aided method is specifically used to find an overlapped 2D ideal
viewing area of text presented on multiple visual media installed with different

200
geometries, locations, mounting heights, and orientations, under different lighting
conditions and viewed by observers with different eyesight levels located along any
viewing plane, similar to that parallel to the sloped floor in modern lecture halls at eye
height level. This program-aided method can be used in many fields where
simultaneously reading text presented on multiple displays is very important for functions
such as navigation, well-being, productivity, safety, and security. Its application in
modern lecture hall design is to help architects find ideal viewing areas of text for
arranging seats in the audience area. Before this computation-program-aided design
method can be recommended to architects in practice, its external validity is verified
using a field experiment carried out in the lecture hall in the Art & Architecture Building.
This experiment has proven that the program-aided method is accurate and reliable with
the outcomes that 17 of the 21 subjects choose the predicted ideal seat location during the
test, while 3 other subjects choose the immediately adjacent seat of the predicted one.

201
CHAPTER 8
Conclusions
8.1 Key Outcomes of the Study
In summary, this research study presents three key outcomes that have been
proven using (a) fundamental theories of visual recognition and legibility of text, and
(b) legibility data collected from human subjects in the laboratory and field experiments.
Key outcome 1. The equation below, also (28) previously, for predicting the
legibility levels of text presented on matte surfaces of various visual media under uniform
fluorescent target lighting without glare, and recognized by young observers (aged 20-29)
at incident angles 0 - 82.8 with a threshold (just readable) 100% accuracy.

202
( )
( ) ( )⎪⎪⎩
⎪⎪⎨
⎧
≤<−⋅⋅⋅⋅⋅⎟⎠⎞
⎜⎝⎛⋅⋅
≤≤⋅⋅⋅⋅⎟⎠⎞
⎜⎝⎛⋅⋅
=−−
−
−−
0015.0532.0%
213.011
005.0532.0%
213.011
8.827.65577.0024.0cos5.2443
7.650cos5.2443
ξξξ
ξξ
CLSSwHH
CLSSwHH
D
bd
bd
where:
D = Legibility distance when text is viewed not perpendicular to the observer
H = Normal text height
Sw = Strokewidth of text
Sd = Denominator in the Snellen ratio of the observer’s acuity level
Lb = Background luminance
C% = Luminance contrast percent
ξ = Incident angle between the display normal and the sightline of the observer
This legibility equation examines seven critical factors, including the viewing
angle, which is rarely examined in the literature. It can predict legibility distance, legible
height of text, height-to-strokewidth ratio of text, observer’s eyesight in the Snellen
fraction, background luminance of text (surface luminance of display), luminance
contrast of text, and incident angle between 0 and 82.8 . This equation cannot be used,
however, for extremely distorted text viewed beyond 82.8 till 90 . In addition, this
equation would better hold within viewing conditions 1 Lb 1000 cd/m2;
10 C% 90; 0.2 Ac 2.0 min-1, which can be traced back to Kaneko’s equation. In
general, this new legibility equation is applicable in multiple fields where reading text is
important, such as instruction and presentation, traffic and transportation, navigation and

203
wayfinding, advertising, safety and security, when the restricted viewing conditions are
met.
Key Outcome 2. Adaptation luminance of text is primarily determined by the
foveal luminance, with very small contribution from the ambient luminance, given no
glare sources are visible at the periphery of the viewing field. When the background
luminance of text (that is, surface luminance of displays) remains constant, changing the
ambient light levels of the viewing scenario does not change the reading performance of
text. Therefore, ambient light has a negligible effect on the legibility of text.
This conclusion seems to go against people’s common experience of turning on
the ambient light to comfort their eyes when reading text. It actually does not, though, for
two reasons. First, ambient light used in daily life usually has a small portion reflected to
the display surface and increases the background luminance of the text viewed, thus
enhancing its legibility. Second, ambient light might have a positive psychological effect,
which has not yet been proven, to comfort the observer’s eyes by balancing the
brightness distribution in the viewing field. In this study, many subjects tested in the
laboratory experiments have reported such feelings to the experimenter when the ambient
light is turned on and the display surface luminance is dimmed to a constant level.
Therefore, the key outcome 2 can be useful for enhancing the legibility of text viewed in
various fields to save energy, but only if the comfort of observer’s eyes is not sacrificed.
Further research is required.

204
Key Outcome 3. The computation-program-aided design method for architects to
predict an overlapped 2D ideal viewing area of text presented in modern lecture halls on
multiple visual media installed with different geometries, locations, mounting heights,
and orientations, under different lighting conditions and viewed by observers located
along any viewing plane, similar to that parallel to the sloped floor of lecture halls at eye
height level. The program code appears in Appendix G.
This program-aided design method presumes: (a) identical young observer (aged
20-29) each time to compute a 2D ideal viewing area, (b) identical geometries and
uniform lighting conditions of text presented on the minimum calculating unit of display,
(c) rectangular visual media without depth, (d) a threshold (just readable) 100% accuracy
of reading performance. For a mass audience, their acuity level is usually chosen to be
20/20, which is the normal eyesight level of population. In addition to lecture halls, this
method can also be used in other scenarios with multitask viewing conditions of text.
However, this program-aided design method cannot be used for chromatic text, observers
in other age groups, specular displays, viewing situations with glare and light trespass, or
a light spectrum other than fluorescent lamps.

205
8.2 Architectural Implications of the Key Outcomes and Their Limitations
The key outcomes of this study will help architects, interior designers, lighting
designers, and other professionals design new lecture halls or improve existing ones with
enhanced legibility, lighting quality, and energy savings. The innovative design
methods—the derived legibility equation and the preliminary computation program—will
benefit architectural design and foster new thinking in creating and maintaining legible
environments. The applications of these key outcomes for lecture hall design are detailed
in the following five areas.
(1) Calculating ideal viewing distances or angles for recognizing fixed text
Fixed text presented in lecture halls, such as signage and placards, usually have
known—either assigned or measured—sizes (e.g., height H, strokewidth Sw) and lighting
conditions (e.g., background luminance Lb, luminance contrast percent C%). For an
observer with known acuity, the ideal viewing distance D to recognize the fixed text at a
given incident angle ξ with threshold 100% accuracy can be calculated directly using the
equation developed from this study, (28) previously. In lecture hall design, the entire
audience is usually the primary concern rather than the individual; therefore, the standard
Snellen acuity level 20/20 of the population is recommended for calculating the ideal
viewing distance. On the other hand, when ideal viewing angles are desired for fixed text
viewed at a known distance, they are calculated using (42) re-expressed from (28).

206
( )⎪⎪
⎩
⎪⎪
⎨
⎧
≤<⋅⋅⋅⎟⎠⎞
⎜⎝⎛⋅⋅⋅×=
−
≤≤⎥⎥⎦
⎤
⎢⎢⎣
⎡⋅⋅⋅⎟
⎠⎞
⎜⎝⎛⋅⋅⋅×=
−−−−
−−−−
oo
oo
8.827.651068.1577.0024.0
cos
7.6501068.1arccos
064.1%
426.022
2272
064.1%
426.022
227
ξξ
ξ
ξξ
CLSSwHHD
CLSSwHHD
bd
bd
(42)
where:
ξ = Incident angle between the display normal and the sightline of the observer
D = Legibility distance when text is viewed not perpendicular to the observer
H = Normal text height
Sw = Strokewidth of text
Sd = Denominator in the Snellen ratio of the observer’s acuity level
Lb = Background luminance
C% = Luminance contrast percent
The predicted ideal viewing distances and viewing angles of fixed text will allow
architects and interior designers to arrange them more efficiently in lecture halls.
However, equation (28) or (42) cannot be used for incident angles beyond 82.8 until 90 .
In addition, its application in lecture halls is restricted to text presented with background
luminance 1 Lb 1000 cd/m2 and luminance contrast percent 10 C% 90, and
viewed by observers with acuity 0.2 Ac 2.0 min-1. This study has found that, inside
typical lecture halls, background luminance Lb of text usually falls in the range of
1 – 1000 cd/m2, while observers’ acuity Ac falls in the range of 0.2 – 2.0 min-1. The
luminance contrast percent C% of text, however, may fall in the range of 90 – 100,
particularly for text in black/white.

207
(2) Calculating the legible size of text viewed at fixed distances and angles
For creating legible environments, architects and interior designers need to know
the threshold legible (just readable with 100% accuracy) size of text viewed at known
distance D, incident angle ξ, and lighting conditions. In lecture hall design, text is often
presented on fixed displays installed at different locations with different mounting
heights and orientations. The viewing distance D and viewing angle ξ of each display are
determined if the observer is located in the audience area. The background luminance Lb
and luminance contrast percent C% of text are either assigned or measurable before or
after the lighting design and installation. Therefore, the threshold legible strokewidth Sw
of text viewed by an observer with specific acuity or by the entire audience with standard
20/20 acuity can be calculated using (43), re-expressed from (28) previously.
( )( ) ( )⎩
⎨⎧
≤<−⋅⋅⋅⋅⋅⋅×≤≤⋅⋅⋅⋅⋅×
= −−−−
−−−−
oo
oo
8.827.65577.0024.0cos101.47.650cos101.4
5.0532.0%
213.04
5.0532.0%
213.04
ξξξξξ
CLSDCLSDSw
bd
bd
(43)
where:
Sw = Threshold legible strokewidth of text
D = Legibility distance when text is viewed not perpendicular to the observer
Sd = Denominator in the Snellen ratio of the observer’s acuity level
Lb = Background luminance
C% = Luminance contrast percent
ξ = Incident angle between the display normal and the sightline of the observer

208
With predicted threshold legible strokewidth Sw, the threshold legible height H
and width W of the text can be easily calculated using the height-to-strokewidth ratio
H/Sw and height-to-width ratio H/W, which are determined by text font. However,
extremely distorted incident angles 82.8 < ξ 90 , which are rare in lecture halls, are not
examined in (43). Likewise, the unexamined luminance contrast percent 90 < C% 100
in (43) may pose problems for predicting the threshold legible size of text in black/white.
(3) Calculating the threshold lighting conditions for energy savings
Among all functional and aesthetical considerations for lighting lecture halls,
creating legible yet energy efficient environments is the top one. In practice, architects
and lighting designers often seek energy efficient lighting solutions that will not sacrifice
good viewing conditions inside lecture halls. This study has provided them a quantitative
and reliable method. For text with assigned or measured size (e.g., H, H/Sw) to be legible
when viewed at known distances D and angles ξ in lecture halls, the minimum required
background luminance Lb and luminance contrast percent C% can be calculated using (44)
for energy savings without sacrificing legibility. The calculated mathematical product of
Lb and C% of the threshold legible text can provide architects the bottom line for energy
savings in lecture hall design. For external validity of this method, the standard acuity
20/20 of the population is recommended for the calculation rather than any individual
acuity levels.
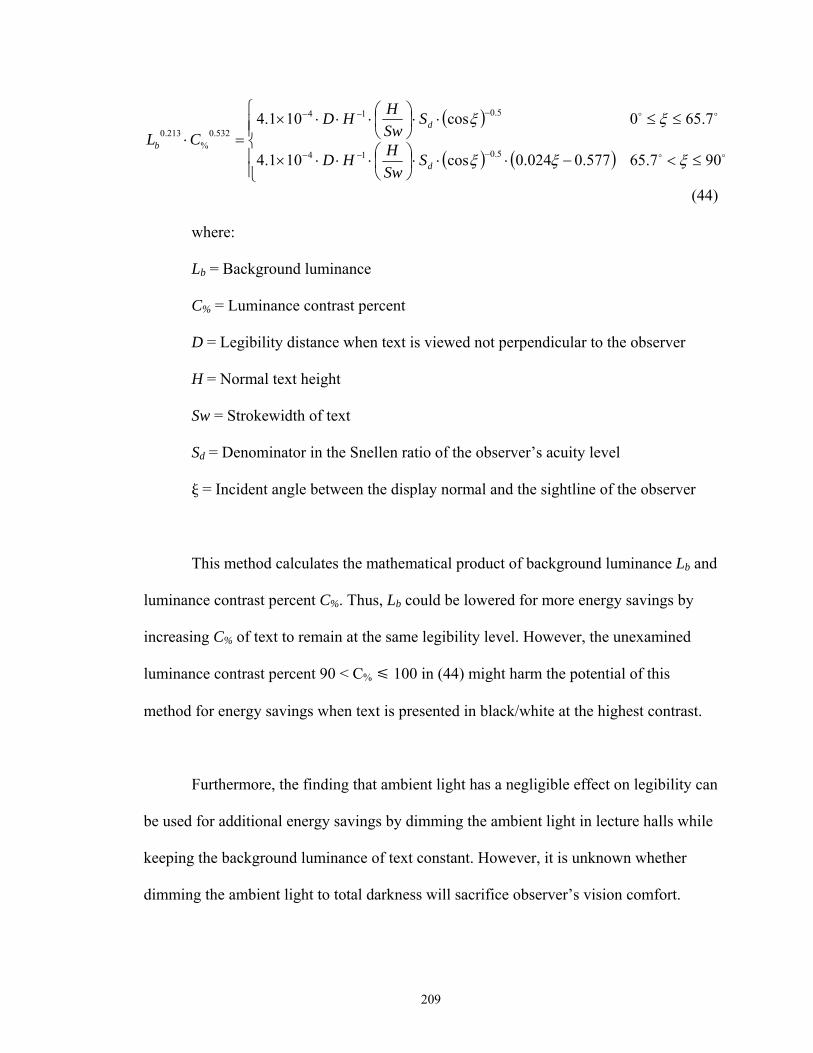
209
( )
( ) ( )⎪⎪⎩
⎪⎪⎨
⎧
≤<−⋅⋅⋅⎟⎠⎞
⎜⎝⎛⋅⋅⋅×
≤≤⋅⋅⎟⎠⎞
⎜⎝⎛⋅⋅⋅×
=⋅−−−
−−−
oo
oo
907.65577.0024.0cos101.4
7.650cos101.4
5.014
5.014
532.0%
213.0
ξξξ
ξξ
d
d
b
SSwHHD
SSwHHD
CL
(44)
where:
Lb = Background luminance
C% = Luminance contrast percent
D = Legibility distance when text is viewed not perpendicular to the observer
H = Normal text height
Sw = Strokewidth of text
Sd = Denominator in the Snellen ratio of the observer’s acuity level
ξ = Incident angle between the display normal and the sightline of the observer
This method calculates the mathematical product of background luminance Lb and
luminance contrast percent C%. Thus, Lb could be lowered for more energy savings by
increasing C% of text to remain at the same legibility level. However, the unexamined
luminance contrast percent 90 < C% 100 in (44) might harm the potential of this
method for energy savings when text is presented in black/white at the highest contrast.
Furthermore, the finding that ambient light has a negligible effect on legibility can
be used for additional energy savings by dimming the ambient light in lecture halls while
keeping the background luminance of text constant. However, it is unknown whether
dimming the ambient light to total darkness will sacrifice observer’s vision comfort.

210
(4) Calculating the ideal viewing areas of multiple fixed displays
As demonstrated in Chapter 7.2, architects can use the program-aided design
method to calculate ideal viewing areas of multiple displays installed in lecture halls for
better seating arrangement, more reasonable shape of lecture halls, and more efficient
allocation of interior spaces. Ten inputs are required from architects to run this
preliminary program and output the overlapped drawing including:
1. Number of visual media
2. Height and width of each visual media in meters
3. x-y-z coordinates of the center point of visual media in meters
4. Initial horizontal and vertical viewing angles of the visual media in degrees
5. The denominator of observer’s Snellen eyesight
6. Height and height-to-strokewidth ratio of text to be viewed in mm
7. Background luminance and luminance contrast percent of the text in cd/m2
8. The angle of the sloped viewing plane in degrees
9. The y-coordinate distance of the sloped viewing plane from original point to
the start edge in meters
10. The height of observers’ eyes on the sloped floor in meters
These required values might be easily measured or assigned for fixed visual
media installed in lecture halls when the viewing plane on which observers’ eyes are
located is known. For acuity level, the population’s standard acuity of 20/20 or better is
recommended. This preliminary program usually takes up to 10 minutes to calculate for 3

211
visual media. However, when the number of visual media is larger than 4 or 5, this
preliminary program begins to consume too much computer memory and takes hours to
output the drawing.
(5) Determining appropriate sizes, locations, and orientations of visual media
In lecture hall design, one of the primary tasks of architects and interior designers
is the arrangement of visual media in the front space. By adjusting the 10 inputs as listed
previously, the program can help them find the appropriate locations, sizes, orientations,
and mounting heights of different visual media. The adjustment is a back-and-forth
process. Architects may need to run the preliminary program many times before
achieving a satisfactory result, which could take an uncomfortably long time. To expedite
the adjustment, there are three guidelines architects might follow.
1. Find out the adjustable and nonadjustable inputs. Not all of the 10 inputs are
adjustable in every lecture hall. Nonadjustable inputs are less dependent on
the visual media, such as the number of visual media, observer’s acuity level
and eye height, text font (for height-to-strokewidth ratio), the location and
sloped angle of the viewing plane.
2. Determine reasonable ranges of each input before the adjustment; then set up
the most favorable and the worst viewing conditions within these ranges.
3. Begin with the worst viewing conditions and adjust only one input each time
by half of the remaining adjustable range of each step.

212
8.3 Recommendations for Future Research
Continuous research studies over the next 5-10 years will first solve the
deficiencies in the preliminarily developed computation program, and then overcome the
ten assumptions used here to examine more types of real viewing situations to read not
only text but also graphics in architecture and other fields. Subtasks include:
1. Investigate the predictability of the derived equation, (17) or (18) previously,
for text with a luminance contrast percent C% > 90. Then examine the spatial
legibility of text viewed extremely off axis at incident angles beyond 82.8 till
90 , to improve the derived equation, (34) previously. In addition, find the
calculating points for visual media not in rectangular shape to compute their
overlapped ideal viewing areas. All the outcomes are then used to improve the
computation program developed here.
2. Investigate the spatial legibility of different viewing targets, including
different fonts, words, graphics, chromatic characters, and Asian characters
(e.g., Chinese, Japanese, Korean).
3. Examine the spatial legibility of text and graphics presented on non-diffusive
surfaces, including, for example, computer screens, TV monitors, and
projection screens.
4. Study the spatial legibility of text and graphics under unfavorable lighting
conditions, including, for example, nonuniform target lighting, glare, and the
spectrum of lamps other than fluorescent ones.

213
5. Analyze the aging effect on the spatial legibility of text and graphics.
6. Test the influence of imperfect reading performance, other than the threshold
(just readable) 100% accuracy, on the legibility levels of characters, when
error rate or guessing is allowed.
7. Investigate the possible positive psychological effect of comforting the
observer’s eyes by balancing the brightness distribution in the viewing field,
and then quantify this effect, together with the developed legibility equation,
on legibility enhancement and energy savings.
8. Use these new outcomes to develop an advanced software program based on
the computation program developed here. This software can be used by
architects or professionals in other fields to determine for observers of varying
ages and eyesight levels (a) ideal viewing distance and viewing angles for
recognizing fixed characters, (b) appropriate size, contrast, font, and color of
characters for fixed viewing distance and viewing angles, (c) ideal viewing
areas of multiple displays in large spaces, and (d) appropriate size, location,
and orientations of different displays installed in buildings or their
surroundings.
9. Redefine the Legibility Index (LI') in light of the solid angle subtended by the
characters viewed (this portion of the work has already been carried out in
another related research study carried out by this author), and then develop a
practical method and a corresponding legibility meter for assessing the spatial
legibility of text and graphics, based on the redefined Legibility Index. As we
continue to test and popularize the Legibility Index (LI') in practice, we plan

214
to develop a "Standard Legibility Index (LIS)" to assess the legibility levels of
standard viewing characters recognized in different scenarios by a standard
observer with 20/20 eyesight, explore the principles and potentials of a
legibility meter in a lighting laboratory, develop a tentative legibility meter in
the laboratory, and if successful, improve the legibility meter in laboratory
testing and practical application.

215
APPENDICES

216
APPENDIX A
Guidelines for Achieving Favorable Viewing Conditions in Lecture Halls (Hauf et al, 1961; Duncan, 1966; Kemper, 1979; Allen et al, 1991 & 1996; and Niemeyer, 2003)
Aspects Guidelines for achieving favorable viewing conditions
Shape of
lecture
halls
Rectangular small lecture halls have an ideal ratio of 1.5 (depth)×1 (width).
For large lecture halls, a fan-shape or a semicircular shape is preferred.
Lecture halls with a capacity over 100 need sloped or tiered floors and
staggered seating to improve sightlines. The sloped floors should be no more
than a 1/12 ratio. For flat-floor lecture halls with capacity over 100, a
platform in the front of the room is considered.
Layout of
the front
space
Architects should cover the front space of lecture halls with boards and
screens but not overlap them. No protrusions of the front wall into the room
are allowed. Adequate space in the front center should be reserved to
accommodate overhead projectors, screens, etc., or walking spaces for the
pacing speaker, and open space for presentations, displays, and experiments.
Architects should calculate audience sightlines to make sure all boards and
screens can be seen from top to bottom.
Projection
screens
Front projection screens are recommended over rear projection screens for
higher resolution, better color fidelity, and better contrast ratios. Matte
screen is preferred to glass-beaded and lenticular screens for wider viewing
angles. Multiple screens are preferred than one very large screen for more
flexibility and reduced obstruction of the writing board, with a minimum of
6 chalkboard remaining exposed. In addition, lecture halls with capacity
over 200 need two or more 10 , 12 , or 14 motorized screens. Screen size
should be determined for the maximum viewing distance within the room.
Screen size 6 high is required for maximum viewing distance 35-40 .
Likewise, 6.75 (H) screen for 40-45 maximum viewing distance (Dmax),
7.5 (H) for 45-50 (Dmax), 8.25 (H) for 50-55 (Dmax), 9 (H) for 55-60 (Dmax),
and 10.5 (H) for 60-70 (Dmax).

217
Appendix A (continued) Aspects Guidelines for achieving favorable viewing conditions
Viewing
materials
Projected images must be large enough; text must be at least 12 point to be
readable in the back row.
Lighting
conditions
Four lighting zones are needed for lecture halls: (a) audience seating area,
(b) front presentation area, (c) center of board/screen, and (d) both sides of
board. No light trespass (no more than 3-5 fc) on the screen is allowed.
During the course of lecture hall presentation, 40-50 fc is required for
audience interaction. Normally 60-70 fc is required at the writing area,
reduced to 5-10 fc when dimming. Use separate pairs of front lectern
spotlights. Lights for the lower chalkboard and upper chalkboard/screen
should be separated. Projection screen should be mounted to clear any
chalkboard or marker board lights. Surface reflectances are 80% or higher
for ceilings, 50-70% for walls, 20-40% for floors, and 25-45% for desktops.

218
APPENDIX B
Glossary of All Signs Used in This Study, Particularly
the 95 Legibility Equations Listed in Appendix C
∆E = Color contrast
∆L* = Color difference at *L coordinates of CIELUV
∆u* = Color difference at *u coordinates of CIELUV
∆v* = Color difference at *v coordinates of CIELUV
φ = Horizontal viewing angle, ±0 -90
α = Vertical viewing angle, ±0 -90
ξ = Incident angle between display normal and the viewing line, 0 -90
ω = Solid angle
A = Target area
Ac = Visual acuity
Ag = Age
Ahorz = Horizontal area
ALC = Letter copy area in a sign design
AS = Snellen visual acuity
AV = Vistech visual acuity
Avert = Vertical area
C = Luminance contrast
Ca = Absolute luminance contrast
Cr = Luminance ratio
Cm = Luminance modulation
Cmin = Minimum perceptible contrast
C∞=Minimum perceptible contrast for target luminance Lt approaching infinity

219
Appendix B (continued)
Cth = Threshold contrast of luminance
C% = Luminance contrast percent
d = Size of graphic details
dL = Color difference at 'L coordinates of CIELAB
du = Color difference at 'u coordinates of CIELAB
dv = Color difference at 'v coordinates of CIELAB
D = Viewing distance
DL = Legible distance
D0 = Viewing distance at normal angle (0 degree)
De = No-error viewing distance
DER= Expected recognition or clear sight distance
Dmin = Minimum required visibility distance
Dop = Optimum viewing distance
Dp = Preferred viewing distance
E = Error rates
fh = Horizontal fundamental spatial frequency
fv = Vertical fundamental spatial frequency
G = Acceptable glare
H = Character height
H = Character height for all upper case letters
Hr = Required letter size
Hmin = Minimum legible character height
H/Sw = Height to strokewidth ratio
It = Target illuminance,
Ia = Ambient illuminance level

220
Appendix B (continued)
La = Adapting luminance
k = Constants, k1, k2, …
L = Luminance level
La = Adaptation luminance
Lb = Background luminance
Lg = Greater luminance
Ll = Lesser luminance
Lmax = Maximum luminance
Lmin = Minimum luminance
Ls = Surrounding luminance
Lt = Target luminance
LI = Legibility index
LIth = Threshold legibility index
LIp = Preferred legibility index
LP = Legibility potential
NSp = Negative space
P = Percentage of performance
r = Height-to-width ratio of character
RS = Reading speed
RT = Response time
S = General off-axis viewing target size
Sp = Spacing between characters within word
Sd = Denominator in the Snellen ratio
Sw = Strokewidth of the character
s/p = Scotopic to photopic output ratio

221
Appendix B (continued)
T = Exposure time or performance time
Tglance = Glance time
Tlong = Long exposure time
Tp = Perception time
TR = Reading time
TS = Searching time
v = Visual angle of strokewidth or details
V = Visual angle
VI = Visibility index as the visibility meter reading in density units
Vmin = Minimum perceptible visual angle
W = Character width
y = Fraction of total answers that were correct
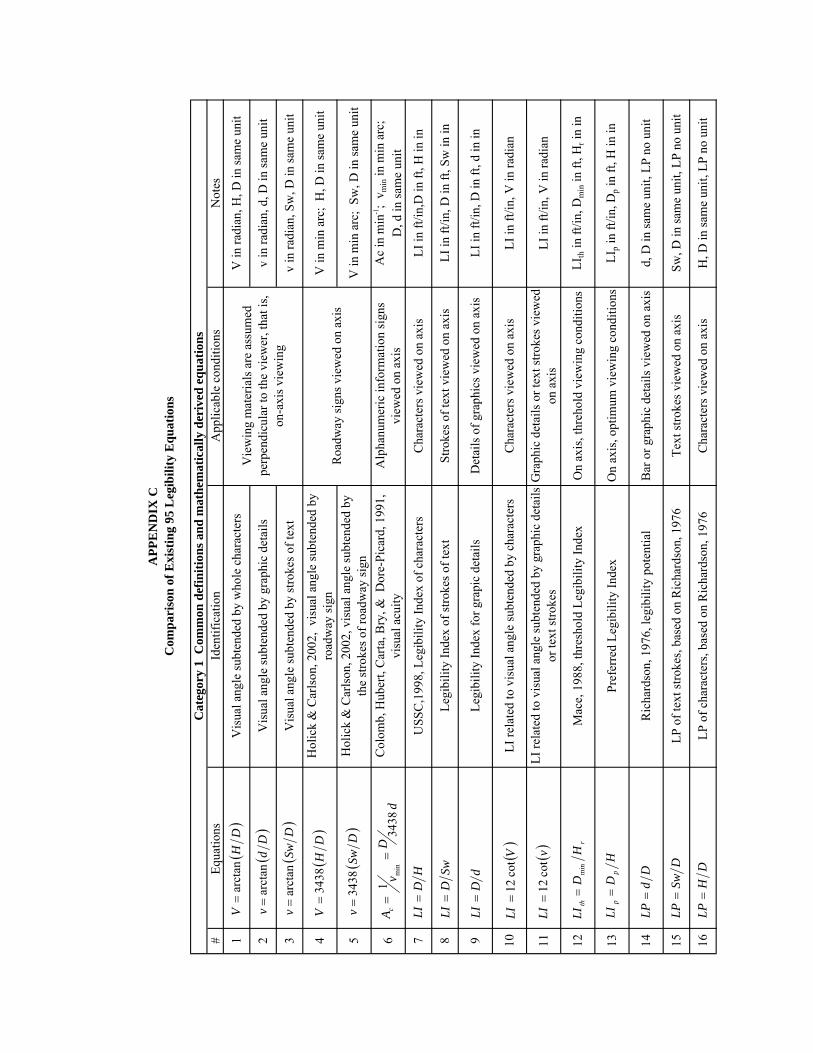
#Eq
uatio
ns
Iden
tific
atio
nA
pplic
able
con
ditio
nsN
otes
v in
radi
an, S
w, D
in sa
me
unit
Com
pari
son
of E
xist
ing
95 L
egib
ility
Equ
atio
ns
Cat
egor
y 1
Com
mon
def
initi
ons a
nd m
athe
mat
ical
ly d
eriv
ed e
quat
ions
V in
radi
an, H
, D in
sam
e un
it
v in
radi
an, d
, D in
sam
e un
it
LI in
ft/in
, V in
radi
an
LI in
ft/in
, D in
ft, d
in in
93 4 5
LI in
ft/in
, D in
ft, S
w in
in8
V in
min
arc
; H
, D in
sam
e un
it
LI in
ft/in
,D in
ft, H
in in
Cha
ract
ers v
iew
ed o
n ax
is
LI in
ft/in
, V in
radi
an
LIth
in ft
/in, D
min
in ft
, Hr i
n in
d, D
in sa
me
unit,
LP
no u
nit
LIp i
n ft/
in, D
p in
ft, H
in in
10 13 1611 12 14 15
Hol
ick
& C
arls
on, 2
002,
vis
ual a
ngle
subt
ende
d by
the
stro
kes o
f roa
dway
sign
Col
omb,
Hub
ert,
Car
ta, B
ry, &
Dor
e-Pi
card
, 199
1,vi
sual
acu
ityA
lpha
num
eric
info
rmat
ion
sign
svi
ewed
on
axis
V in
min
arc
; Sw
, D in
sam
e un
it
Ac
in m
in-1;
v min
in m
in a
rc;
D, d
in sa
me
unit
Sw, D
in sa
me
unit,
LP
no u
nit
H, D
in sa
me
unit,
LP
no u
nit
1 762
LI re
late
d to
vis
ual a
ngle
subt
ende
d by
cha
ract
ers
LI re
late
d to
vis
ual a
ngle
subt
ende
d by
gra
phic
det
ails
or te
xt st
roke
s
Cha
ract
ers v
iew
ed o
n ax
is
Gra
phic
det
ails
or t
ext s
troke
s vie
wed
on a
xis
USS
C,1
998,
Leg
ibili
ty In
dex
of c
hara
cter
s
Legi
bilit
y In
dex
for g
rapi
c de
tails
Legi
bilit
y In
dex
of st
roke
s of t
ext
Pref
erre
d Le
gibi
lity
Inde
xO
n ax
is, o
ptim
um v
iew
ing
cond
ition
s
LP o
f cha
ract
ers,
base
d on
Ric
hard
son,
197
6C
hara
cter
s vie
wed
on
axis
Vis
ual a
ngle
subt
ende
d by
stro
kes o
f tex
t
Vis
ual a
ngle
subt
ende
d by
gra
phic
det
ails
Vis
ual a
ngle
subt
ende
d by
who
le c
hara
cter
s
Text
stro
kes v
iew
ed o
n ax
isLP
of t
ext s
troke
s, ba
sed
on R
icha
rdso
n, 1
976
Det
ails
of g
raph
ics v
iew
ed o
n ax
is
Stro
kes o
f tex
t vie
wed
on
axis
Hol
ick
& C
arls
on, 2
002,
vis
ual a
ngle
subt
ende
d by
road
way
sign
Bar
or g
raph
ic d
etai
ls v
iew
ed o
n ax
isR
icha
rdso
n, 1
976,
legi
bilit
y po
tent
ial
On
axis
, thr
ehol
d vi
ewin
g co
nditi
ons
Mac
e, 1
988,
thre
shol
d Le
gibi
lity
Inde
x
APP
EN
DIX
C
Vie
win
g m
ater
ials
are
ass
umed
perp
endi
cula
r to
the
view
er, t
hat i
s,on
-axi
s vie
win
g
Roa
dway
sign
s vie
wed
on
axis
()
Dd
var
ctan
=
()
DH
Var
ctan
=
()
DSw
var
ctan
=
()
DH
V34
38=
()
DSw
v34
38=
dD
vA c
3438
1m
in=
=
HD
LI=
SwD
LI=
dD
LI=
rth
HD
LIm
in=
HD
LIp
p=
Dd
LP=
DSw
LP=
DH
LP=
()
VLI
cot
12=
() v
LIco
t12
=

#Eq
uatio
ns
Iden
tific
atio
nA
pplic
able
con
ditio
nsN
otes
#Eq
uatio
ns
Iden
tific
atio
nA
pplic
able
con
ditio
nsN
otes
Cr ≥
1
Cm
≤
1
D in
met
er, V
in m
illira
dian
s
Expe
cted
reco
gniti
on d
ista
nce
= sm
all d
imen
sion
of s
ign
inft×
1200
Cha
ract
er su
bten
ded
with
10
min
arc
; D, H
in in
ches
No
othe
r crit
ical
fact
ors a
reex
amin
ed e
xcep
t for
vie
win
gdi
stan
ce a
nd o
ff-a
xis a
ngle
s
Lum
inan
ce ra
tio
Perf
orm
ance
to e
rror
rate
CIE
, 197
6, C
IELA
B c
olor
con
trast
CIE
, 197
6, C
IELU
V c
olor
con
trast
LP n
o un
it, L
I in
ft/in
1917 2421 282318 20 22 25 26
Cat
e gor
y 2
Equ
atio
ns fo
r pr
edic
ting
view
ing/
legi
bilit
y di
stan
ces,
or le
gibl
e he
ight
s of c
hara
cter
s
27
Cha
ract
ers i
n si
gn d
esig
n w
hen
view
ed o
n ax
is
29 30
USS
C, 1
998,
neg
ativ
e sp
ace
vers
us th
ele
tter c
opy
area
Rei
nwal
d fo
rmul
a, th
e on
ly e
xist
ing
off-
axis
legi
bilit
y eq
uatio
n; c
ited
byR
eger
(198
9) a
nd S
hurtl
eff (
1980
)
Off
-axi
s vie
win
g w
ith th
e sa
me
read
ing
perf
orm
ance
Opt
imum
vie
win
g di
stan
ce, w
ith20
/20
acui
ty, n
o-er
ror
read
abili
ty, o
n LC
D/L
ED
Cha
ract
ers,
grap
hic
deta
ils, t
ext
stro
kes v
iew
ed o
n ax
is
Perio
dic
patte
rns w
ith m
ax.a
ndm
in. i
n ea
ch c
ycle
Any
con
ditio
ns
Any
uni
form
col
or sp
ace
Leng
th o
f sig
n fa
ce is
stan
dard
ized
as 2
5.4m
mD
ER =
smal
ler o
ne o
f exp
ecte
dre
cogn
ition
dis
tanc
e or
cle
arsi
ght d
ista
nce
Any
con
ditio
ns
Flet
cher
197
2, c
ited
by D
unca
n &
Kon
z, 1
974
Lum
inan
ce c
ontra
st
Abs
olut
e lu
min
ance
con
trast
ALC
is th
e le
tter c
opy
area
insi
gn d
esig
n
Perc
ent l
umin
ance
con
trast
Any
con
ditio
n
Col
or c
ontra
st ∆
E vs
.lu
min
ance
con
trast
C
P, E
≤
1
LP v
ersu
s LI,
V, a
nd v
Forb
es, 1
972,
out
door
sign
s
Jaco
bs, 1
973,
cite
d by
Bry
ant (
1982
)
Def
initi
on o
f mod
ulat
ion
[]2/1
22
2*)
(*)
(*)
(v
uL
E∆
+∆
+∆
=∆
0029
1.0
HD
op=(
)(
)(
)(
)[
]2/12
22
'16
7'
367
155
''
dvdu
Cv
YuE
++
=∆
ERLS
SBD
CC
D×
+=
2)
%(
)%
(
⎪ ⎩⎪ ⎨⎧=
vert
ical
Dho
rizo
ntal
DD
21
0
32
0
)(c
os)
(cosαφ
EP
−=
1
⎩⎨⎧≥
lines
mul
tiple
Alin
eon
eA
NSp
LC
LC
_25.2
_2
CC
100
%=
vV
LILP
tan
tan
121=
==
()
bb
ta
LL
LC
−= (
)g
lg
LL
LC
−=
lg
rL
LC
=
()(
)m
inm
axm
inm
axL
LL
LC
m+
−=
()
100
%×
−=
gl
gL
LL
C
VD
4.25
=
App
endi
x C
(con
tinue
d)

#Eq
uatio
ns
Iden
tific
atio
nA
pplic
able
con
ditio
nsN
otes
Pref
erre
d vi
ewin
g di
stan
ce, w
/ost
roke
wid
th e
xam
ined
DL,
H in
met
er
Lum
inan
ce ≥
5
fl re
quire
d;D
L in
ft, H
in in
Am
bien
t illu
min
atio
n va
ries
from
1.5
fc to
45
fc;
De,
Dp
in ft
, H in
mm
Cha
ract
ers p
rese
nted
on
inst
rum
ent p
anel
s;D
e, D
p, H
in c
m
On-
axis
vie
win
g;H
, D in
inch
es
41 42 43 463932 3633 34 37 3835D
unca
n &
Kon
z, 1
976,
intru
men
t pan
els,
cite
d by
Gre
en e
t al (
1988
)
No-
erro
r vie
win
g
Pref
erre
d vi
ewin
g
Dun
can
& K
onz,
197
4,LC
D/L
ED v
iew
ing
No-
erro
r vie
win
g di
stan
ce, w
/ost
roke
wid
th e
xam
ined
Com
mon
ly a
ccep
ted
for d
aylig
htop
erat
ions
No-
erro
r vie
win
g di
stan
ce, w
ithSw
/H e
xam
ined
Neo
n lig
ht fo
r adv
ertis
ing
40 4431
Adl
er &
Stra
ub, 1
971,
sign
heig
ht v
s.vie
win
g di
stan
ce
Hig
hway
sign
s, da
ylig
ht, c
hara
cter
heig
ht 3
inch
esH
ighw
ay si
gns,
dayl
ight
, no
erro
rvi
sion
15%
incr
ease
of l
ette
r hei
ght t
obe
legi
ble
DL
(max
) = 5
5 ft/
in
For r
oadw
ay si
gns w
ith h
eigh
t of
3 in
ches
onl
y; D
L in
ft, S
w a
ndH
in in
, v in
min
arc
Vis
ual s
ize ≤
7
deg;
D, H
in sa
me
unit
DL
in m
eter
; W/H
ratio
is fr
om0.
46-1
.0
k1: i
llum
inat
ion
and
view
ing
cond
ition
s, k2
: im
porta
nce
leve
l
Smith
,197
9, c
hara
cter
s, ci
ted
byG
reen
et a
l (19
88)
Blu
r tec
hniq
ues;
sym
bol o
nhi
ghw
ay si
gns
Pete
rs &
Ada
ms,
1959
, cite
d by
Gre
en e
t al (
1988
)
USS
C,1
998,
traf
fic si
gns
All
uppe
r cas
e le
tters
vie
wed
on
axis
New
s prin
ts e
tc. r
ead
on a
xis i
n a
room
; lig
htin
g ef
fect
on
legi
bilit
yig
nore
d
BR
T =
blur
reco
gniti
onth
resh
old;
DL
in m
eter
Schi
eber
, 199
4
Hig
h lu
min
ance
= "
glan
ce",
low
lum
inan
ce =
"lo
ng"
Forb
es, 1
975,
exp
osur
e tim
evs
.legi
bilit
y; tr
affic
sign
s
Uhl
aner
, 194
1, h
ighw
ay si
gns
Col
lins &
Hal
l, 19
92
45
Ligh
t ref
lect
ing
mat
rix p
ixle
sva
riabl
e m
essa
ge ro
ad si
gns
Gle
eson
neo
n ad
verti
sing
Pref
erre
d vi
ewin
g di
stan
ce, w
ithSw
/H e
xam
ined
DH
×=
007
.0
HD
p82.0
16.1+
−=
21
0022
.0k
kD
H+
+=
HD
e14.2
81.2+
=
HH
15.1'=
HD
L50
=
HD
L50
0=
BRT
DL
×−
=8.
2132
6
)(
5.1)
(gl
ance
Llo
ngL
TD
TD
×=
292
5.
134
265
.24
722
7.
116
vv
DL
−+
=
()
HSw
HD
e64.
8728.2
98.7−
+=
()
HSw
HD
p30.
3287.0
75.0−
+=
()
()2
3370
1.12
3622
7.
116
HSw
HSw
DL
−+
=
()
()2
32.205.7
97.0H
WH
WD
L−
+−
=
)1(
()
3.23
36.
347.
666
+−
=Sw
HH
De
()
7.22
1.10
2.26
3+
−=
SwH
HD
p
App
endi
x C
(con
tinue
d)

#Eq
uatio
ns
Iden
tific
atio
nA
pplic
able
con
ditio
nsN
otes
#E q
uatio
ns
Iden
tific
atio
nA
pplic
able
con
ditio
nsN
otes
k1,
k2=
con
stan
t
k is
con
stan
t for
diff
eren
t exp
erim
ents
Cat
egor
y 3
Equ
atio
ns fo
r pr
edic
ting
visu
al si
ze &
legi
bilit
y po
tent
ial
D, H
and
Sw
in th
esa
me
unit
k =
con
stan
t
Sw/H
ratio
, pos
itive
con
trast
Avg
. W/H
, pos
itive
con
trast
5348 5452
How
ett,
1983
, NB
S m
etho
d to
pred
ict c
hara
cter
hei
ght
Der
ived
from
equ
atio
n 94
;1≤
Lb ≤
100
0 cd
/m2 ;
10 ≤
C%
≤ 9
0;0.
2 ≤
Ac ≤
2.0
min
-1
504947 51
Avg
. Sp/
H, p
ositi
ve c
ontra
st
Sw/H
ratio
, neg
ativ
e co
ntra
st55
Zwah
len
et a
l., 1
995,
text
ual
info
rmat
ion
pres
ente
d on
traf
ficsi
gns,
licen
se p
late
, etc
. to
calc
ulat
eth
e vi
sual
ang
le a
s fun
ctio
n of
eith
erch
arac
ter h
eigh
t, w
idth
,stro
kew
idth
,ra
tios,
or sp
acin
g di
men
sion
.Se
cond
-ord
er p
olyn
omia
l lea
st-
quar
es fu
nctio
n w
ere
esta
blis
hed.
Vin
min
of a
rc.
Avg
. W/H
, ne
gativ
e co
ntra
st
Avg
. Sp/
H, n
egat
ive
cont
rast
(6)
(5)
(4)
(3)
(2)
k2 =
0.0
75 fo
r em
erge
ncy
labe
ls, c
ount
ers,
scal
es, l
egen
d lig
hts
0.0
for o
ther
(uni
mpo
rtant
) pan
el m
arki
ngs
⎪⎪ ⎩⎪⎪ ⎨⎧
=
1991
,11.
2119
93,
36.19
1951
,38.
1819
56,
11.19
Zwah
len
Mac
eFo
rbes
Solo
mon
k⎩⎨⎧
=19
93,
26.919
91/
1994
,10
1M
ace
Zwah
len
k
⎩⎨⎧=
1939
,26.9
1950
/19
48,
3.10
2Fo
rbes
Berg
erk
⎪⎪ ⎩⎪⎪ ⎨⎧
=
lette
rESo
lom
onBa
erw
ald
lette
rCSo
lom
onZw
ahle
n
k
,19
56,
24.11
1960
,51.
10,
1956
,65.
1119
91,
65.15
⎩⎨⎧=
1960
,51.8
1991
,05.
11Ba
erw
ald
Zwah
len
k
Foot
note
s (1)
– (6
)
k1 =
0.0
6 fo
r illu
min
atio
n >
1.0
fc, f
avor
able
read
ing
cond
ition
s
0.16
for i
llum
inat
ion
> 1.
0 fc
, unf
avor
able
con
ditio
ns o
r
illu
min
atio
n <
1.0
fc, f
avor
able
con
ditio
ns
0.26
for i
llum
inat
ion
< 1.
0 fc
, unf
avor
able
con
ditio
ns
()
()2
37.21
63.35
HW
HW
kV
+−
=
()
()2
193.1
26.1H
WH
Wk
V+
−=
()
()2
289.7
03.14
HW
HW
kV
+−
=
()
()2
74.88
76.49
HSp
HSp
kV
+−
=
()
()2
7.11
87.9H
SpH
Spk
V+
−=
()
()2
25.13
892.
2357.4
HSw
HSw
V+
−=
()
()2
94.85
21.31
89.6H
SwH
SwV
+−
=
(1)
()
DA
SwH
HS×
××
×=
−510
45.1
()
532
.0%
213
.04
101.4
−−
−⋅
⋅⋅ ⎟ ⎠⎞
⎜ ⎝⎛ ⋅×
×=
CL
SSwH
DH
bd
)2(
)3(
)4(
)5(
)6(
App
endi
x C
(con
tinue
d)
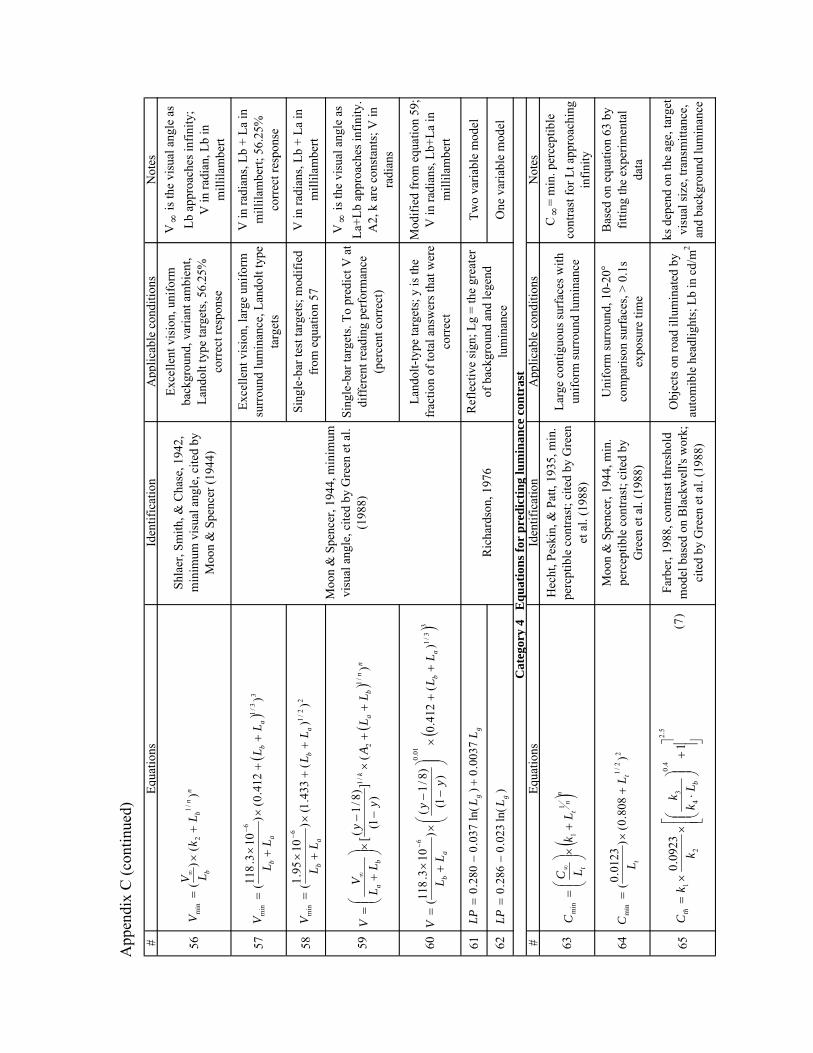
#Eq
uatio
ns
Iden
tific
atio
nA
pplic
able
con
ditio
nsN
otes
#E q
uatio
ns
Iden
tific
atio
nA
pplic
able
con
ditio
nsN
otes
Obj
ects
on
road
illu
min
ated
by
auto
mib
le h
eadl
ight
s; L
b in
cd/
m2
Sing
le-b
ar te
st ta
rget
s; m
odifi
edfr
om e
quat
ion
57
Larg
e co
ntig
uous
surf
aces
with
unifo
rm su
rrou
nd lu
min
ance
Sing
le-b
ar ta
rget
s. To
pre
dict
V a
tdi
ffer
ent r
eadi
ng p
erfo
rman
ce(p
erce
nt c
orre
ct)
64
ks d
epen
d on
the
age,
targ
etvi
sual
size
, tra
nsm
ittan
ce,
and
back
grou
nd lu
min
ance
Farb
er, 1
988,
con
trast
thre
shol
dm
odel
bas
ed o
n B
lack
wel
l's w
ork;
cite
d by
Gre
en e
t al.
(198
8)65
Uni
form
surr
ound
, 10-
20co
mpa
rison
surf
aces
, > 0
.1s
expo
sure
tim
e
Ref
lect
ive
sign
; Lg
= th
e gr
eate
rof
bac
kgro
und
and
lege
ndlu
min
ance
Bas
ed o
n eq
uatio
n 63
by
fittin
g th
e ex
perim
enta
lda
ta
Moo
n &
Spe
ncer
, 194
4, m
in.
perc
eptib
le c
ontra
st; c
ited
byG
reen
et a
l. (1
988)
V in
radi
ans,
Lb +
La
inm
illila
mbe
rt
5756
Exce
llent
vis
ion,
uni
form
back
grou
nd, v
aria
nt a
mbi
ent,
Land
olt t
ype
targ
ets,
56.2
5%co
rrec
t res
pons
e
Shla
er, S
mith
, & C
hase
, 194
2,m
inim
um v
isua
l ang
le, c
ited
byM
oon
& S
penc
er (1
944)
Moo
n &
Spe
ncer
, 194
4, m
inim
umvi
sual
ang
le, c
ited
by G
reen
et a
l.(1
988)
Exce
llent
vis
ion,
larg
e un
iform
surr
ound
lum
inan
ce, L
ando
lt ty
peta
rget
s
V in
radi
ans,
Lb +
La
inm
illila
mbe
rt; 5
6.25
%co
rrec
t res
pons
e
V∞
is th
e vi
sual
ang
le a
sLb
app
roac
hes i
nfin
ity;
V in
radi
an, L
b in
mill
ilam
bert
6358 6260
Cat
e gor
y 4
Equ
atio
ns fo
r pr
edic
ting
lum
inan
ce c
ontr
ast
61
C∞
= m
in. p
erce
ptib
leco
ntra
st fo
r Lt a
ppro
achi
ngin
finity
Ric
hard
son,
197
6
Land
olt-t
ype
targ
ets;
y is
the
frac
tion
of to
tal a
nsw
ers t
hat w
ere
corr
ect
Hec
ht, P
eski
n, &
Pat
t, 19
35, m
in.
perc
ptib
le c
ontra
st; c
ited
by G
reen
et a
l. (1
988)
59
V∞
is th
e vi
sual
ang
le a
sLa
+Lb
appr
oach
es in
finity
.A
2, k
are
con
stan
ts; V
inra
dian
s
Two
varia
ble
mod
el
One
var
iabl
e m
odel
Mod
ified
from
equ
atio
n 59
;V
in ra
dian
s, Lb
+La
inm
illila
mbe
rt(
)33/1
01.06
)(
412
.0)
1()8/1
()
103.
118
(a
ba
b
LL
yy
LL
V+
+×
⎟⎟ ⎠⎞⎜⎜ ⎝⎛
−−×
+×=
−
gg
LL
LP00
37.0
)ln
(03
7.0
280
.0+
−=
22/1
6
min
))
(43
3.1(
)10
95.1 (a
ba
b
LL
LL
V+
+×
+×=
−
)ln
(02
3.0
286
.0gL
LP−
=
()
nn
ba
k
ba
LL
Ay
yL
LV
V)
(]
)1(
)8/1( [
/12
/1+
+×
−−× ⎟⎟ ⎠⎞
⎜⎜ ⎝⎛+
=∞
nn
bb
Lk
LVV
)(
)(
/12
min
+×
=∞
()
33/
16
min
)41
2.0(
)10
3.11
8(
ab
ab
LL
LL
V+
+×
+×=
−
5.24.0
4
3
21
109
23.0
⎥⎥ ⎦⎤
⎢⎢ ⎣⎡+
⎟⎟ ⎠⎞⎜⎜ ⎝⎛
⋅×
×=
bth
Lk
kk
kC
()n
nt
t
Lk
LCC
11
min
+× ⎟⎟ ⎠⎞
⎜⎜ ⎝⎛=
∞
22/
1m
in)
808
.0()
0123
.0 (t
t
LL
C+
×=
)7(
App
endi
x C
(con
tinue
d)

#Eq
uatio
ns
Iden
tific
atio
nA
pplic
able
con
ditio
nsN
otes
#E q
uatio
ns
Iden
tific
atio
nA
pplic
able
con
ditio
nsN
otes
#Eq
uatio
ns
Iden
tific
atio
nA
pplic
able
con
ditio
nsN
otes
69
Res
pons
e tim
e as
func
tion
of d
ispl
ay p
aram
eter
s,C
RT
unde
r diff
eren
tad
apta
tion
leve
ls
Rog
ers,
Spik
er &
Cic
inel
li, 1
986,
resp
onse
tim
e; s
elf-
lum
inou
sdi
spla
ys in
airc
raft
cock
pits
; cite
dby
Gre
en e
t al.
(198
8)
68C
ritic
al d
etai
l sub
tend
sro
ughl
y 1/
5 of
the
angl
esu
bten
ded
by c
hara
cter
Gen
eral
form
ula
Post
, Cos
tanz
a, &
Lip
pert,
198
2,lu
min
ance
con
trast
and
col
orco
ntra
st; C
olor
ed p
atac
hes o
n vi
deo
disp
lays
Onl
y lu
min
ance
diff
eren
ce
Cat
egor
y 6
Equ
atio
ns fo
r pr
edic
ting
reac
tion
time
Min
imum
ang
ular
reso
lutio
n v≈
V/5
as
rule
of t
hum
b;LI
in ft
/in
Lum
inan
ce, h
ue, a
ndsa
tura
tion
diff
eren
ce
Cat
egor
y 5
Equ
atio
ns fo
r pr
edic
ting
legi
bilit
y in
dex
Ach
rom
atic
con
trast
isre
pres
ente
d by
lum
inan
ce m
odul
atio
n6766 70
Ric
hard
son,
197
6, d
etai
l ang
lere
late
d to
legi
bilit
y in
dex
ofch
arac
ter
RT
in se
c; th
ree
expe
riem
nts i
n se
ries
wer
e co
nduc
ted
Con
stan
ts to
be
solv
ed in
futu
re st
udie
s
)(
065
.0)
(13
5.0
)(
9778
.302
26.0
22
22
dvdu
dLC
m+
++
=
LPv
LI60
1)
5ta
n(12
1≈
=
)(
0914
.0)
(18
24.0
)(
7746
.210
53.0
22
22
dvdu
dLC
m+
++
=
()(
)(
)cr
bb
aa
CL
Lk
RT−
−=
⎪ ⎩⎪ ⎨⎧
====
−
−
−
22
22
21
/25
78
/3.
3431
/4.3
100
mcd
IC
mcd
IC
mcd
IC
RT
ar
ar
ar
Foot
note
(7)
k1 =
targ
et si
ze fa
ctor
,
w
hen
d is
targ
et d
iam
eter
(min
of a
rc)
k3 =
the
effe
ct o
f age
on
slop
e of
RC
S fu
nctio
n of
lum
inan
ce,
whe
n s =
adj
ustm
ent p
aram
eter
due
to a
ge
K4,
⎩⎨⎧>
−≤
×=
1000
06.0
106
.010
log
37.03
21
dd
dd
k5.2
4.0
4
32
110
0⎟⎟ ⎠⎞
⎜⎜ ⎝⎛+
⎟⎟ ⎠⎞⎜⎜ ⎝⎛
=k
kk
sd
k−
−=
log
6235
.059.0
3
() (
)(
)⎪⎪ ⎩⎪⎪ ⎨⎧
≤<
−−
≤<
−−
≤<
−≤
<
=
8064
6401
75.0
4154
.064
4444
0134
.014
74.0
4430
3001
053
.030
200
log
4
gg
gg
gg
g AA
AA
AA
A
k(
) ()
⎪ ⎩⎪ ⎨⎧
≤<
−+
≤<
−≤
<=
8064
6400
667
.008
12.0
6444
4400
406
.044
200
gg
gg
g AA
AA
As
App
endi
x C
(con
tinue
d)

#Eq
uatio
ns
Iden
tific
atio
nA
pplic
able
con
ditio
nsN
otes
Text
on
auto
mob
ilein
stru
men
t pan
els,
on-a
xis
view
ing
at n
orm
al a
ngle
s;vi
sibi
lity
inde
x m
easu
red
byLu
ckie
sh-M
oss v
isib
ility
met
er; T
p an
d R
T in
sec,
VI
is re
adin
g in
den
sity
uni
t
73
Mou
rant
& L
ango
lf, 1
976,
visu
al se
arch
, reg
ress
ed b
yG
reen
et a
l., 1
988
Saut
er &
Ker
chae
rt, 1
972,
cite
d by
Gre
en e
t al.,
198
8
Bor
eczk
y, G
reen
, Bos
, &K
erst
, 198
8, re
spon
se ti
me
to in
stru
men
t clu
ster
s and
dist
ance
targ
ets;
ass
umed
aw
orki
ng k
now
ledg
e of
chro
mat
icity
and
∆E
as a
mea
sure
of c
hrom
inan
ce(c
olor
diff
eren
ce)
7472 78R
espo
nse
time
on n
umer
ical
spee
ddom
eter
, if a
ge is
not
afa
ctor
77
Text
on
auto
mob
ilein
stru
men
t pan
els
Res
pons
e tim
e on
num
eric
alsp
eedo
met
er, a
ge is
cons
ider
red;
Eac
h un
it ∆E
(9-1
06) i
ncre
ase
resu
lted
in a
2.1
ms d
ecre
ase
in R
T
RT
in m
s; k
A =
age
gro
up(1
for o
ld, 2
for y
oung
); H
in m
m (5
-19m
m);
kL =
loca
tion
(1 fo
r cen
ter,
2fo
r sid
es);
C is
from
1.5
:1to
20:
1; I
in lu
x (1
.08
to91
5 lu
x)
71 7675Q
uadr
atic
ver
sion
of
equa
tion
74 to
fit b
ette
r
RT
in se
c, H
in in
,L
in fl
Alte
rnat
ive
vers
ion
ofeq
uatio
n 72
with
alo
garit
hmic
rela
tions
hip
Prel
imin
ary
findi
ngs
Alte
rnat
ive
vers
ion
ofeq
uatio
n 72
to b
ette
r fit
exte
rme
data
poi
nts
42.0)
81.0 ()
75.1 (2
+−
=VI
VIT p
56.0)
55.0 ()
58.1 (2
+−
=VI
VIRT
665
.5)
052
.7 ()
38.3 ()
547
.0(
23
+−
+−
=VI
VIVI
RT
527
.1)
log(
996
.2+
−=
VIRT
415
.1) )
log(79
3.3
() )
log(
39.4(
2+
−=
VIVI
RT
rt
CL
HRT
/94.2
)lo
g(70.0
03.13
82.5+
−−
=
)1
(45
38))
(ln(
58.9
) )ln
(1(6.
89)
(20
2)
1(
1050
)(
320
1054
2H
I
Ck
Hk
RT
t
rL
A
+−
++
+−
=
)1
(45
38))
(ln(
58.9
) )ln
(1(6.
89)
(20
2)
1(
1050
574
2H
I
Ck
HRT
t
rL
+−
++
+=
App
endi
x C
(con
tinue
d)

#Eq
uatio
ns
Iden
tific
atio
nA
pplic
able
con
ditio
nsN
otes
82
Col
lins &
Hal
l, 19
92,
expo
sure
tim
e79 8481
Der
ived
equ
atio
ns fr
omSn
yder
& M
addo
x (1
978)
,ci
ted
by R
eger
, 198
9 as
inG
reen
et a
l.'s r
evie
w (1
988)
8580
Men
u se
arch
task
mod
el;
Ts in
sec
T in
ms,
h is
pix
el h
eigh
tas
a p
ropo
rtion
of l
ette
rhe
ight
Ran
dom
sear
ch ta
skm
odel
; Ts i
n se
c
Ran
dom
cha
ract
ers o
nel
ectro
nic
disp
lay,
CR
T,ra
ndom
sear
ch ta
sk
Dot
mat
rix c
hara
cter
s on
elec
troni
c di
spla
y, C
RT,
read
ing
task
Tink
er re
adin
g ta
skm
odel
; mos
t sen
sitiv
e to
dot e
lem
ent d
esig
n; T
R in
sec
Dot
mat
rix c
hara
cter
s on
elec
troni
c di
spla
y, C
RT,
men
u se
arch
task
Ref
lect
ing
mat
rix p
ixle
s,va
riabl
e m
essa
ge ro
ad si
gns
Tink
er sp
eed
of re
adin
gta
sk
Rea
ding
spee
d; D
in m
;∆E
= c
alcu
late
d co
lor
cont
rast
usi
ng li
pper
t’seq
uatio
n (1
986)
Men
u se
arch
task
Info
rmat
ion
trans
fer
asso
ciat
ed w
ith d
ot-m
atrix
addr
esse
d di
spla
ys,
varia
bles
bas
ed o
n sp
atia
lfr
eque
ncy
and
MTF
mea
sure
men
ts
Der
ived
equ
atio
ns fr
omSn
yder
& M
addo
x (1
978)
,ci
ted
by R
eger
, 198
9 as
inG
reen
et a
l.'s r
evie
w (1
988)
Info
rmat
ion
trans
fer
asso
ciat
ed w
ith d
ot-m
atrix
addr
esse
d di
spla
ys,
varia
bles
bas
ed o
n sp
atia
lfr
eque
ncy
and
MTF
mea
sure
men
ts
Snyd
er &
Mad
dox,
197
8, C
RT
read
ing
and
sear
chin
g tim
e,ci
ted
by G
reen
et a
l., 1
988;
Sim
ulat
ed c
hara
cter
s fro
mth
ree
elec
troni
c di
spla
ys w
ere
show
n on
a h
igh-
reso
lutio
nC
RT;
ele
men
t siz
e in
mm
,ill
umin
atio
n in
lux,
vie
win
gdi
stan
ce in
cm
/inch
, exp
osur
etim
e in
mse
c
Cat
egor
y 7
Equ
atio
ns fo
r pr
edic
ting
expo
sure
tim
e or
per
form
ance
tim
e
83
()
()
AC
De
SwC
EHSw
DRS
mm
0064
2.0
1877
3.2
0126
9.0
0123
9.0
5287
1.0
0093
1.0
0430
9.0
1960
9.0
4026
6.0
+−
++
−∆
+
⎟ ⎠⎞⎜ ⎝⎛
+−
=
⎟ ⎠⎞⎜ ⎝⎛
+⎟ ⎠⎞
⎜ ⎝⎛+ ⎟ ⎠⎞
⎜ ⎝⎛−
=HW
HSwHSw
T7.
2622
457
5388
527
2
()
()
()
horz
Ave
rtho
rzv
RA
Af
T
10
2
log
825
.4
221
.064.3
1423.0
43.1
−
++
−+
=
()
vert
mhv
SA
Cff
T19
3.0
log
72.214
024
.078.0
10
2+ ⎟⎟ ⎠⎞
⎜⎜ ⎝⎛+
−+
=
()
()
⎟⎟ ⎠⎞⎜⎜ ⎝⎛
−−
+−
−
−+
−−
=
mhv
h
horz
ff
S
Cff
f
AT
vh
043
.014
982
.014
734
.0
642
.0lo
g89.
192
log
49.13
85.
48
22
1010
vert
h
mh
Af
Cf
mh
RC
fT
1010
10
log
112
.1lo
g97
3.
14
log
369
.437
9.2
3111
.074.5
+−
++
+=
⎟⎟ ⎠⎞⎜⎜ ⎝⎛
()
vert
v
Av
cve
rt
f
mh
mhS
ff
A
CfCf
T
10
10
10
log
487
.505
4.0
339
.0
log
916
.5lo
g15
9.2
027
.027.7
+−
−−
+ ⎟⎟ ⎠⎞⎜⎜ ⎝⎛
+ ⎟⎟ ⎠⎞⎜⎜ ⎝⎛
+=
App
endi
x C
(con
tinue
d)
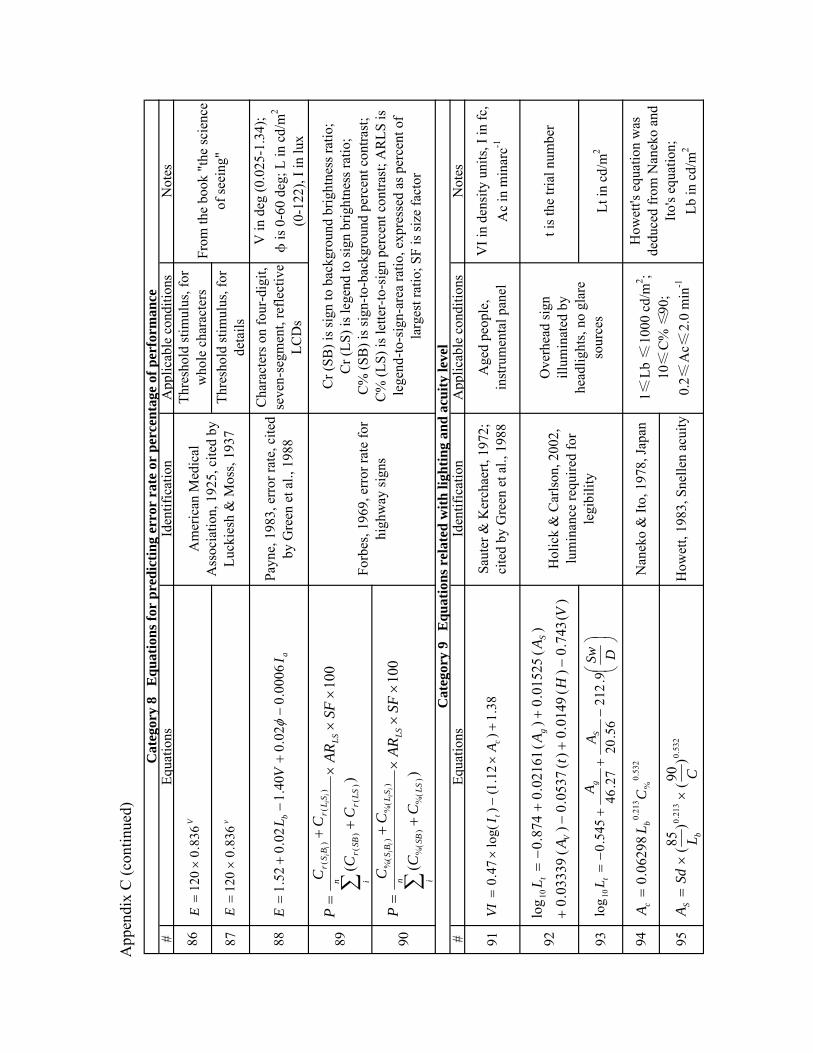
#Eq
uatio
ns
Iden
tific
atio
nA
pplic
able
con
ditio
nsN
otes
#E q
uatio
ns
Iden
tific
atio
nA
pplic
able
con
ditio
nsN
otes
How
ett's
equ
atio
n w
asde
duce
d fr
om N
anek
o an
dIto
's eq
uatio
n;Lb
in c
d/m
2
Nan
eko
& It
o, 1
978,
Japa
n1≤
Lb ≤
100
0 cd
/m2 ;
10≤
C%
≤ 9
0;0.
2≤ A
c≤ 2
.0 m
in-1
How
ett,
1983
, Sne
llen
acui
ty
Age
d pe
ople
,in
stru
men
tal p
anel
Saut
er &
Ker
chae
rt, 1
972;
cite
d by
Gre
en e
t al.,
198
8
Thre
shol
d st
imul
us, f
orw
hole
cha
ract
ers
Cha
ract
ers o
n fo
ur-d
igit,
seve
n-se
gmen
t, re
flect
ive
LCD
s
Cat
egor
y 8
Equ
atio
ns fo
r pr
edic
ting
erro
r ra
te o
r pe
rcen
tage
of p
erfo
rman
ce
Cr (
SB) i
s sig
n to
bac
kgro
und
brig
htne
ss ra
tio;
Cr (
LS) i
s leg
end
to si
gn b
right
ness
ratio
;C
% (S
B) i
s sig
n-to
-bac
kgro
und
perc
ent c
ontra
st;
C%
(LS)
is le
tter-
to-s
ign
perc
ent c
ontra
st; A
RLS
isle
gend
-to-s
ign-
area
ratio
, exp
ress
ed a
s per
cent
of
larg
est r
atio
; SF
is si
ze fa
ctor
Lt in
cd/
m2
t is t
he tr
ial n
umbe
r
87 9588 929190 9389 94
Cat
egor
y 9
Equ
atio
ns r
elat
ed w
ith li
ghtin
g an
d ac
uity
leve
l
Forb
es, 1
969,
err
or ra
te fo
rhi
ghw
ay si
gns
86
V in
deg
(0.0
25-1
.34)
;φ
is 0
-60
deg;
L in
cd/
m2
(0-1
22),
I in
lux
Payn
e, 1
983,
err
or ra
te, c
ited
by G
reen
et a
l., 1
988
Thre
shol
d st
imul
us, f
orde
tails
Am
eric
an M
edic
alA
ssoc
iatio
n, 1
925,
cite
d by
Luck
iesh
& M
oss,
1937
Hol
ick
& C
arls
on, 2
002,
lum
inan
ce re
quire
d fo
rle
gibi
lity
Ove
rhea
d si
gnill
umin
ated
by
head
light
s, no
gla
reso
urce
s
VI i
n de
nsity
uni
ts, I
in fc
,A
c in
min
arc-1
From
the
book
"th
e sc
ienc
eof
seei
ng"
532
.021
3.0
)90 (
)85 (
CL
SdA
bS
××
=
100
)(
)%
()
%(
)%
()
%(
××
×++
=
∑SF
ARC
C
CC
PLS
n iLS
SB
SL
BS
ii
ii
ab
IV
LE
0006
.002.0
40.102.0
52.1−
+−
+=
φ
)(
743
.0)
(01
49.0
)(
0537
.0)
(03
339
.0
)(
0152
5.0
)(
0216
1.0
874
.0lo
g 10
VH
tA
AA
L
V
Sg
t
−+
−+
++
−=
⎟ ⎠⎞⎜ ⎝⎛
−+
+−
=DSw
AA
LS
gt
9.21
256.
2027.
4654
5.0
log 10
VE
836
.012
0×
=
vE
836
.012
0×
=
100
)(
)(
)(
)(
)(
××
×++
=
∑SF
ARC
C
CC
PLS
n iLS
rSB
r
SL
rB
Sr
ii
ii
38.1)
12.1()
log(
47.0+
×−
×=
ct
AI
VI
532
.0%
213
.006
298
.0C
LA
bc=
App
endi
x C
(con
tinue
d)

Bui
ldin
gR
mnb
rC
apac
ityR
msq
rft
Cam
pus l
ocat
ion
Med
ia #
Yea
rN
umbe
r
Coo
ley
Mor
timer
E M
emor
ial
G90
680
1525
Nor
th C
ampu
s2
1953
Den
tal a
nd W
K K
ello
gg In
stitu
teG
550
9817
87C
entra
l Cam
pus
219
40
Den
tal a
nd W
K K
ello
gg In
stitu
teG
322
100
2023
Cen
tral C
ampu
s2
1940
Elec
trica
l Eng
& C
ompu
ter S
ci B
ldg
1311
108
1366
Nor
th C
ampu
s2
1986
Den
niso
n D
avid
M B
uild
ing
296
110
2035
Cen
tral C
ampu
s2
1963
Elec
trica
l Eng
& C
ompu
ter S
ci B
ldg
1001
110
1177
Nor
th C
ampu
s2
1986
Hut
chin
s Hal
l12
011
115
91C
entra
l Cam
pus
219
33
Mod
ern
Lang
uage
s Bui
ldin
g12
2011
812
64C
entra
l Cam
pus
419
72
Littl
e C
lare
nce
Coo
k Sc
ienc
e B
ldg
1528
120
2462
Cen
tral C
ampu
s2
1960
Che
mis
try &
Dow
Will
ard
H L
ab16
4012
017
62C
entra
l Cam
pus
319
89
Com
pute
r Sci
ence
& E
ng. B
ldg
1670
120
1981
Nor
th C
ampu
s2
2004
Elec
trica
l Eng
& C
ompu
ter S
ci B
ldg
1500
130
1660
Nor
th C
ampu
s2
1986
Che
mis
try &
Dow
Will
ard
H L
ab12
0013
013
46C
entra
l Cam
pus
219
89
Littl
e C
lare
nce
Coo
k Sc
ienc
e B
ldg
2548
133
1565
Cen
tral C
ampu
s2
1960
Indu
stria
l & O
pera
tions
Eng
in B
ldg
1610
144
2670
Nor
th C
ampu
s2
1963
East
Hal
l13
6014
519
26C
entra
l Cam
pus
318
83
16
APP
EN
DIX
D
Tot
al o
f 38
Surv
eyed
Lec
ture
Hal
ls

App
endi
x D
(con
tinue
d)
Bui
ldin
gR
mnb
rC
apac
ityR
msq
rft
Cam
pus l
ocat
ion
Med
ia #
Yea
rN
umbe
r
Bro
wn
Geo
rge
Gra
nger
Mem
oria
l Lab
1504
150
2759
Nor
th C
ampu
s2
1958
Bag
noud
Fra
ncoi
s-X
avie
r Bld
g11
0915
023
07N
orth
Cam
pus
319
91
Art
& A
rchi
tect
ure
Bui
ldin
g21
0415
417
69N
orth
Cam
pus
219
74
Dow
Her
bert
H B
uild
ing
1013
164
2792
Nor
th C
ampu
s2
1982
Hut
chin
s Hal
l15
017
227
41C
entra
l Cam
pus
219
33
Ang
ell H
all A
udito
rium
sD
178
2666
Cen
tral C
ampu
s3
1952
Dan
a Sa
mue
l Tra
sk B
uild
ing
1040
198
2391
Cen
tral C
ampu
s4
?
Che
mis
try &
Dow
Will
ard
H L
ab14
0020
620
01C
entra
l Cam
pus
219
89
Med
ical
Sci
ence
Uni
t I53
3022
033
53M
edic
al C
ampu
s3
1958
Chr
ysle
r Cnt
r Con
t Eng
inee
r Ed
220
234
2947
Nor
th C
ampu
s3
1967
Educ
atio
n, S
choo
l of
1202
236
2237
Cen
tral C
ampu
s2
?
Che
mis
try &
Dow
Will
ard
H L
ab12
1025
024
29C
entra
l Cam
pus
219
89
Den
tal a
nd W
K K
ello
gg In
stitu
teG
005
280
2711
Cen
tral C
ampu
s2
1940
Ang
ell H
all A
udito
rium
sB
284
3400
Cen
tral C
ampu
s2
1952
Den
niso
n D
avid
M B
uild
ing
182
286
2779
Cen
tral C
ampu
s4
1963
15

App
endi
x D
(con
tinue
d)
Bui
ldin
gR
mnb
rC
apac
ityR
msq
rft
Cam
pus l
ocat
ion
Med
ia #
Yea
rN
umbe
r
East
Hal
l13
2431
530
07C
entra
l Cam
pus
218
83
Mod
ern
Lang
uage
s Bui
ldin
g14
0031
839
76C
entra
l Cam
pus
319
72
Hut
chin
s Hal
l10
037
241
63C
entra
l Cam
pus
319
33
Lorc
h H
all
140
374
3238
Cen
tral C
ampu
s3
?
Kra
us E
dwar
d H
enry
Bui
ldin
g21
4042
934
90C
entra
l Cam
pus
219
15
Che
mis
try &
Dow
Will
ard
H L
ab18
0050
061
10C
entra
l Cam
pus
419
89
Mod
ern
Lang
uage
s Bui
ldin
g12
0055
154
50C
entra
l Cam
pus
419
72
7

APP
EN
DIX
E
Surv
eyed
Vie
win
g C
ondi
tions
of T
ext P
rese
nted
in th
e 38
Lec
ture
Hal
ls
L b in
cd/
m2
Ls in
cd/
m2
Lect
ure
halls
φ
max
in d
eg
αm
ax
in d
eg
ξ max
in d
eg
Dm
ax
in m
eter
s m
in
max
m
in
max
Coo
ley
G90
6 43
.5
23.6
48
.3
10.9
1 1.
70
3.94
0.
65
38.6
1
East
Hal
l 136
0 48
.3
30.1
54
.9
15.2
0 1.
28
398.
70
0.45
16
3.50
CC
Litt
le 2
548
48.3
40
.6
59.7
15
.21
13.2
2 24
0.20
3.
26
87.9
8
Med
ical
533
0 54
.9
40.0
63
.9
17.5
8 2.
16
49.6
2 0.
66
51.1
0
Lorc
h H
all 1
40
57.9
38
.4
65.4
25
.74
1.53
34
.45
0.10
7.
09
CC
Litt
le 1
528
62.9
27
.9
66.3
13
.64
0.58
17
9.10
0.
08
83.1
3
Ang
le H
all D
57
.2
42.1
66
.3
16.9
5 1.
01
14.3
4 0.
13
219.
80
Chr
ysle
r 220
61
.8
33.8
66
.9
19.2
7 0.
13
208.
50
0.09
87
.94
Che
mis
try 1
640
62.9
31
.4
67.1
14
.48
3.21
83
.76
0.08
16
.55
Ang
le H
all B
60
.2
39.0
67
.3
19.4
0 2.
09
20.6
8 0.
37
7.91
Den
tal G
322
58.1
43
.2
67.3
14
.98
5.86
24
4.10
9.
58
153.
10
EE 1
500
65.6
22
.2
67.5
13
.41
1.07
8.
78
0.28
33
.93
234

App
endi
x E
(con
tinue
d)
L b in
cd/
m2
Ls in
cd/
m2
Lect
ure
halls
φ
max
in d
eg
αm
ax
in d
eg
ξ max
in d
eg
Dm
ax
in m
eter
s m
in
max
m
in
max
Che
mis
try 1
210
56.0
47
.9
68.0
18
.29
0.08
48
.17
0.01
39
.38
Kra
us E
d. 2
140
61.8
41
.4
69.2
18
.13
0.16
1.
89
0.84
5.
70
Educ
atio
n 12
02
59.2
47
.0
69.6
18
.65
24.9
7 11
9.50
15
.58
186.
80
Che
mis
try 1
200
64.4
37
.2
69.9
10
.33
0.04
17
.55
0.01
53
.81
Den
niso
n 29
6 67
.1
34.8
71
.4
13.5
7 7.
95
343.
90
1.37
10
3.10
GG
Bro
wn
1504
68
.5
31.4
71
.8
15.5
6 2.
54
101.
00
0.02
78
.87
Hut
chin
s Hal
l 120
56
.6
55.5
71
.8
12.5
4 2.
03
173.
80
1.57
10
.24
EE 1
001
68.5
34
.4
72.4
11
.98
0.20
4.
55
1.08
10
.82
Den
tal G
550
68.3
35
.3
72.4
13
.83
0.21
40
.35
0.05
33
.22
Che
mis
try 1
800
52.7
60
.9
72.9
18
.90
11.0
5 60
.42
3.64
42
.18
Che
mis
try 1
400
66.0
43
.7
72.9
16
.13
0.05
33
.27
0.01
41
.34
Mod
ern
Lang
. 122
0 59
.5
56.6
73
.8
10.0
4 4.
33
71.3
6 8.
55
39.8
1
Den
tal G
005
68.6
43
.4
74.6
18
.98
0.20
4.
83
0.19
45
.48
Com
pute
r 167
0 69
.9
40.8
74
.9
13.5
2 0.
95
49.2
6 0.
17
16.6
4
IOE
1610
68
.7
45.0
75
.1
17.1
7 0.
37
124.
20
0.12
93
.91
Arc
h 21
04
64.7
53
.3
75.2
14
.76
0.16
65
.26
0.06
65
.00
235

App
endi
x E
(con
tinue
d)
L b in
cd/
m2
Ls in
cd/
m2
Lect
ure
halls
φ
max
in d
eg
αm
ax
in d
eg
ξ max
in d
eg
Dm
ax
in m
eter
s m
in
max
m
in
max
B. F
XB
110
9 71
.1
39.6
75
.6
15.3
8 3.
15
297.
20
1.72
19
5.10
DO
W 1
013
69.3
46
.8
76.0
14
.95
2.56
6.
72
0.15
70
.54
DA
NA
104
0 75
.3
28.5
77
.1
13.7
1 0.
36
16.8
8 0.
09
267.
60
Hut
chin
s Hal
l 150
66
.8
59.2
78
.4
13.3
8 1.
04
17.9
9 0.
35
6.60
East
Hal
l 132
4 71
.1
51.6
78
.4
15.6
8 0.
83
35.9
5 0.
03
16.0
9
Den
niso
n 18
2 71
.8
58.3
80
.6
16.0
0 2.
25
40.4
8 1.
17
37.0
4
Hut
chin
s Hal
l 100
72
.1
68.2
83
.5
17.8
2 4.
94
36.5
9 1.
89
23.6
9
EE 1
311
77.0
60
.6
83.7
9.
96
2.32
47
.72
2.42
22
.40
Mod
ern
Lang
. 120
0 80
.2
54.9
84
.4
16.2
9 0.
03
12.3
0 0.
09
247.
30
Mod
ern
Lang
. 140
0 80
.4
68.5
86
.5
15.9
0 0.
22
10.7
9 0.
04
255.
90
236
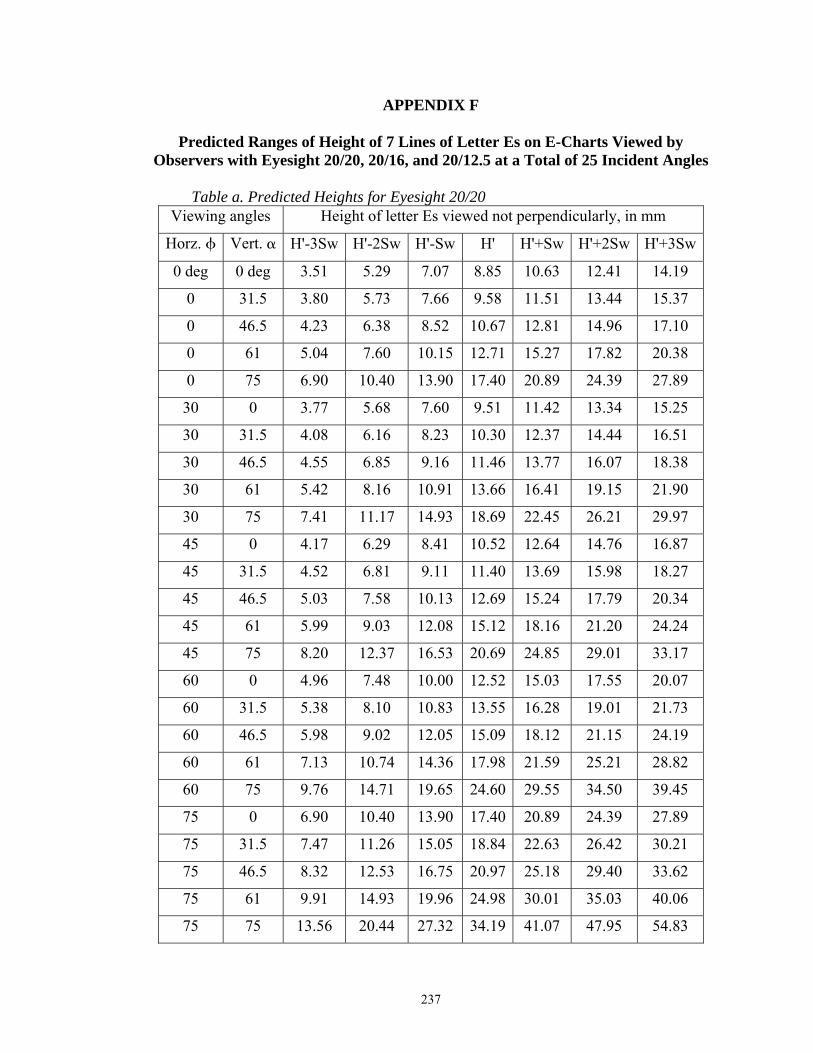
237
APPENDIX F
Predicted Ranges of Height of 7 Lines of Letter Es on E-Charts Viewed by Observers with Eyesight 20/20, 20/16, and 20/12.5 at a Total of 25 Incident Angles
Table a. Predicted Heights for Eyesight 20/20
Viewing angles Height of letter Es viewed not perpendicularly, in mm
Horz. φ Vert. α H'-3Sw H'-2Sw H'-Sw H' H'+Sw H'+2Sw H'+3Sw
0 deg 0 deg 3.51 5.29 7.07 8.85 10.63 12.41 14.19
0 31.5 3.80 5.73 7.66 9.58 11.51 13.44 15.37
0 46.5 4.23 6.38 8.52 10.67 12.81 14.96 17.10
0 61 5.04 7.60 10.15 12.71 15.27 17.82 20.38
0 75 6.90 10.40 13.90 17.40 20.89 24.39 27.89
30 0 3.77 5.68 7.60 9.51 11.42 13.34 15.25
30 31.5 4.08 6.16 8.23 10.30 12.37 14.44 16.51
30 46.5 4.55 6.85 9.16 11.46 13.77 16.07 18.38
30 61 5.42 8.16 10.91 13.66 16.41 19.15 21.90
30 75 7.41 11.17 14.93 18.69 22.45 26.21 29.97
45 0 4.17 6.29 8.41 10.52 12.64 14.76 16.87
45 31.5 4.52 6.81 9.11 11.40 13.69 15.98 18.27
45 46.5 5.03 7.58 10.13 12.69 15.24 17.79 20.34
45 61 5.99 9.03 12.08 15.12 18.16 21.20 24.24
45 75 8.20 12.37 16.53 20.69 24.85 29.01 33.17
60 0 4.96 7.48 10.00 12.52 15.03 17.55 20.07
60 31.5 5.38 8.10 10.83 13.55 16.28 19.01 21.73
60 46.5 5.98 9.02 12.05 15.09 18.12 21.15 24.19
60 61 7.13 10.74 14.36 17.98 21.59 25.21 28.82
60 75 9.76 14.71 19.65 24.60 29.55 34.50 39.45
75 0 6.90 10.40 13.90 17.40 20.89 24.39 27.89
75 31.5 7.47 11.26 15.05 18.84 22.63 26.42 30.21
75 46.5 8.32 12.53 16.75 20.97 25.18 29.40 33.62
75 61 9.91 14.93 19.96 24.98 30.01 35.03 40.06
75 75 13.56 20.44 27.32 34.19 41.07 47.95 54.83

238
Appendix F (continued)
Table b. Predicted Heights for Eyesight 20/16 Viewing angles Height of letter Es viewed not perpendicularly, in mm
Horz. φ Vert. α H'-3Sw H'-2Sw H'-Sw H' H'+Sw H'+2Sw H'+3Sw
0 deg 0 deg 2.82 4.24 5.66 7.08 8.50 9.92 11.34
0 31.5 3.05 4.59 6.13 7.67 9.21 10.74 12.28
0 46.5 3.40 5.11 6.82 8.53 10.25 11.96 13.67
0 61 4.05 6.09 8.13 10.17 12.21 14.25 16.29
0 75 5.54 8.33 11.13 13.92 16.71 19.50 22.29
30 0 3.03 4.56 6.08 7.61 9.13 10.66 12.19
30 31.5 3.28 4.93 6.59 8.24 9.89 11.54 13.20
30 46.5 3.65 5.49 7.33 9.17 11.01 12.85 14.69
30 61 4.35 6.54 8.74 10.93 13.12 15.31 17.50
30 75 5.96 8.96 11.96 14.95 17.95 20.95 23.95
45 0 3.35 5.04 6.73 8.42 10.11 11.80 13.49
45 31.5 3.63 5.46 7.29 9.12 10.95 12.78 14.60
45 46.5 4.04 6.08 8.11 10.15 12.18 14.22 16.25
45 61 4.82 7.24 9.67 12.09 14.52 16.94 19.37
45 75 6.59 9.91 13.23 16.55 19.87 23.19 26.51
60 0 3.99 6.00 8.00 10.01 12.02 14.03 16.04
60 31.5 4.32 6.49 8.67 10.84 13.02 15.19 17.37
60 46.5 4.81 7.23 9.65 12.07 14.49 16.91 19.33
60 61 5.73 8.61 11.50 14.38 17.26 20.15 23.03
60 75 7.84 11.79 15.73 19.68 23.63 27.58 31.52
75 0 5.54 8.33 11.13 13.92 16.71 19.50 22.29
75 31.5 6.00 9.03 12.05 15.07 18.09 21.12 24.14
75 46.5 6.68 10.05 13.41 16.77 20.14 23.50 26.87
75 61 7.96 11.97 15.98 19.99 24.00 28.00 32.01
75 75 10.90 16.38 21.87 27.36 32.84 38.33 43.81

239
Appendix F (continued)
Table c. Predicted Heights for Eyesight 20/12.5 Viewing angles Height of letter Es viewed not perpendicularly, in mm
Horz. φ Vert. α H'-3Sw H'-2Sw H'-Sw H' H'+Sw H'+2Sw H'+3Sw
0 deg 0 deg 2.21 3.33 4.45 5.57 6.69 7.81 8.93
0 31.5 2.39 3.61 4.82 6.03 7.25 8.46 9.67
0 46.5 2.66 4.01 5.36 6.71 8.06 9.41 10.76
0 61 3.17 4.78 6.39 8.00 9.61 11.22 12.83
0 75 4.34 6.55 8.75 10.95 13.15 15.35 17.55
30 0 2.37 3.58 4.78 5.99 7.19 8.39 9.60
30 31.5 2.57 3.88 5.18 6.48 7.79 9.09 10.39
30 46.5 2.86 4.31 5.76 7.21 8.66 10.12 11.57
30 61 3.41 5.14 6.87 8.60 10.32 12.05 13.78
30 75 4.67 7.03 9.40 11.76 14.13 16.50 18.86
45 0 2.63 3.96 5.29 6.62 7.96 9.29 10.62
45 31.5 2.85 4.29 5.73 7.17 8.62 10.06 11.50
45 46.5 3.17 4.77 6.38 7.98 9.59 11.19 12.80
45 61 3.77 5.69 7.60 9.51 11.43 13.34 15.25
45 75 5.17 7.78 10.40 13.02 15.64 18.26 20.87
60 0 3.13 4.71 6.29 7.88 9.46 11.05 12.63
60 31.5 3.38 5.10 6.82 8.53 10.25 11.96 13.68
60 46.5 3.77 5.68 7.59 9.49 11.40 13.31 15.22
60 61 4.49 6.76 9.04 11.31 13.59 15.86 18.14
60 75 6.14 9.26 12.37 15.48 18.60 21.71 24.82
75 0 4.34 6.55 8.75 10.95 13.15 15.35 17.55
75 31.5 4.70 7.09 9.47 11.86 14.24 16.63 19.01
75 46.5 5.24 7.89 10.54 13.20 15.85 18.50 21.16
75 61 6.24 9.40 12.56 15.72 18.89 22.05 25.21
75 75 8.54 12.87 17.19 21.52 25.85 30.18 34.50

APP
EN
DIX
G
C
ode
of th
e C
ompu
tatio
n Pr
ogra
m D
evel
oped
in M
atL
ab
%th
e nu
mbe
r of v
iew
ing
med
ia a
nd th
e m
atrix
P o
f all
para
met
ers ;
sy
ms k
P ;
k =
inpu
t('To
tal n
umbe
r of v
isua
l med
ia?
\n')
; P
= ze
ros(
k*9,
6) ;
%
calc
ulat
e th
e on
-axi
s leg
ibili
ty d
ista
nce
D0
; sy
ms H
t Rhs
w S
d Lb
Cp
D0
;
form
at sh
ort g
; Sd
= in
put('
The
deno
min
ator
of S
nelle
n ey
esig
ht o
f the
obs
erve
r? \n
') ;
for k
= 1
:k
disp
('For
the
visu
al m
edia
of n
umbe
r:') ;
di
sp(k
) ;
Ht =
inpu
t('Th
e he
ight
of t
ext t
o be
vie
wed
in m
m?
\n')
;
R
hsw
= in
put('
The
heig
ht-to
-stro
kew
idth
ratio
of t
he te
xt?
\n')
;
Lb
= in
put('
The
back
grou
nd lu
min
ance
leve
l of t
he te
xt in
cd/
m2?
\n')
;
C
p =
inpu
t('Th
e lu
min
ance
con
trast
per
cent
of t
ext?
\n')
;
D
0 =
2443
.5*H
t*(R
hsw
^-1)
*(Sd
^-1)
*(Lb
^0.2
13)*
(Cp^
0.53
2)/1
000
; %
on-
axis
vie
win
g di
stan
ce in
met
er
P((9
*(k-
1)+1
):9*k
,4) =
D0
;
end
240

% T
he g
eom
etrie
s and
ang
les o
f vis
ual m
edia
sy
ms x
c yc
zc
; sy
ms x
tl yt
l ztl
xtm
ytm
ztm
xtr
ytr z
tr xm
l ym
l zm
l xm
r ym
r zm
r xbl
ybl
zbl
xbm
ybm
zbm
xbr
ybr
zbr
; sy
ms h
w d
elta
phi d
elta
alph
a ;
for k
= 1
:k ;
disp
('For
the
visu
al m
edia
of n
umbe
r:') ;
di
sp(k
) ;
h =
inpu
t('he
ight
of t
he v
isua
l med
ia in
met
ers?
\n')
;
w
= in
put('
wid
th o
f the
vis
ual m
edia
in m
eter
s? \n
') ;
xc =
inpu
t('x-
coor
dina
te o
f the
cen
ter p
oint
of v
isua
l med
ia in
met
ers?
\n')
;
yc
= in
put('
y-co
ordi
nate
of t
he c
ente
r poi
nt o
f vis
ual m
edia
in m
eter
s? \n
') ;
zc =
inpu
t('z-
coor
dina
te o
f the
cen
ter p
oint
of v
isua
l med
ia in
met
ers?
\n')
;
de
ltaph
i = in
put('
initi
al h
oriz
onta
l vie
win
g an
gle
of th
e vi
sual
med
ia in
deg
rees
? \n
') ;
delta
alph
a =
inpu
t('in
itial
ver
tical
vie
win
g an
gle
of th
e vi
sual
med
ia in
deg
rees
? \n
') ;
% o
ther
8 p
oint
s coo
rdin
ates
in m
eter
s cal
cula
ted
from
the
cent
er p
oint
;
% to
p le
ft po
int ;
xt
l = x
c - (
w/2
)*co
s(de
ltaph
i) +
(h/2
)*si
n(de
ltaal
pha)
*sin
(del
taph
i) ;
ytl =
yc
+ (w
/2)*
sin(
delta
phi)
+ (h
/2)*
sin(
delta
alph
a)*c
os(d
elta
phi)
;
zt
l = z
c +
(h/2
)*co
s(de
ltaal
pha)
;
241

% to
p m
iddl
e po
int ;
xt
m =
xc
+ (h
/2)*
sin(
delta
alph
a)*s
in(d
elta
phi)
;
yt
m =
yc
+ (h
/2)*
sin(
delta
alph
a)*c
os(d
elta
phi)
;
zt
m =
zc
+ (h
/2)*
cos(
delta
alph
a) ;
%
top
right
poi
nt ;
xtr =
xc
+ (w
/2)*
cos(
delta
phi)
+ (h
/2)*
sin(
delta
alph
a)*s
in(d
elta
phi)
;
yt
r = y
c - (
w/2
)*si
n(de
ltaph
i) +
(h/2
)*si
n(de
ltaal
pha)
*cos
(del
taph
i) ;
ztr =
zc
+ (h
/2)*
cos(
delta
alph
a) ;
%
mid
dle
left
poin
t ;
xml =
xc
- (w
/2)*
cos(
delta
phi)
;
ym
l = y
c +
(w/2
)*si
n(de
ltaph
i) ;
zml =
zc
;
% m
iddl
e rig
ht p
oint
;
xm
r = x
c +
(w/2
)*co
s(de
ltaph
i) ;
ymr =
yc
- (w
/2)*
sin(
delta
phi)
;
zm
r = z
c ;
%
bot
tme
left
poin
t ;
xb
l = x
c - (
w/2
)*co
s(de
ltaph
i) - (
h/2)
*sin
(del
taal
pha)
*sin
(del
taph
i) ;
ybl =
yc
+ (w
/2)*
sin(
delta
phi)
- (h/
2)*s
in(d
elta
alph
a)*c
os(d
elta
phi)
;
242

zbl =
zc
- (h/
2)*c
os(d
elta
alph
a) ;
%
bot
tom
mid
dle
poin
t ;
xbm
= x
c - (
h/2)
*sin
(del
taal
pha)
*sin
(del
taph
i) ;
ybm
= y
c - (
h/2)
*sin
(del
taal
pha)
*cos
(del
taph
i) ;
zbm
= z
c - (
h/2)
*cos
(del
taal
pha)
;
% b
otto
m ri
ght p
oint
;
xb
r = x
c +
(w/2
)*co
s(de
ltaph
i) - (
h/2)
*sin
(del
taal
pha)
*sin
(del
taph
i) ;
ybr =
yc
- (w
/2)*
sin(
delta
phi)
- (h/
2)*s
in(d
elta
alph
a)*c
os(d
elta
phi)
;
zb
r = z
c - (
h/2)
*cos
(del
taal
pha)
;
% in
put a
ll x,
y a
nd z
coo
rdin
ates
to m
atrix
p ;
P((9
*(k-
1) +
1),1
) = x
tl ;
P((9
*(k-
1) +
1),2
) = y
tl ;
%th
e co
ordi
nate
s of t
op le
ft po
ints
;
P(
(9*(
k-1)
+ 1
),3) =
ztl
;
P(
(9*(
k-1)
+ 2
),1) =
xtm
;
P(
(9*(
k-1)
+ 2
),2) =
ytm
;
%
the
coor
dina
tes o
f top
mid
dle
poin
ts ;
P((9
*(k-
1) +
2),3
) = z
tm ;
P((9
*(k-
1) +
3),1
) = x
tr ;
P((9
*(k-
1) +
3),2
) = y
tr ;
%th
e co
ordi
nate
s of t
op ri
ght p
oint
s ;
P((9
*(k-
1) +
3),3
) = z
tr ;
P((9
*(k-
1) +
4),1
) = x
ml ;
243

P((9
*(k-
1) +
4),2
) = y
ml ;
%th
e co
ordi
nate
s of m
iddl
e le
ft po
ints
;
P(
(9*(
k-1)
+ 4
),3) =
zm
l ;
P((9
*(k-
1) +
5),1
) = x
c ;
P((9
*(k-
1) +
5),2
) = y
c ;
%th
e co
ordi
nate
s of c
ente
r poi
nts ;
P(
(9*(
k-1)
+ 5
),3) =
zc
;
P(
(9*(
k-1)
+ 6
),1) =
xm
r ;
P((9
*(k-
1) +
6),2
) = y
mr ;
%
the
coor
dina
tes o
f mid
dle
right
poi
nts ;
P(
(9*(
k-1)
+ 6
),3) =
zm
r ;
P((9
*(k-
1) +
7),1
) = x
bl ;
P((9
*(k-
1) +
7),2
) = y
bl ;
%th
e co
ordi
nate
s of b
otto
m le
ft po
ints
;
P(
(9*(
k-1)
+ 7
),3) =
zbl
;
P(
(9*(
k-1)
+ 8
),1) =
xbm
;
P(
(9*(
k-1)
+ 8
),2) =
ybm
;
%
the
coor
dina
tes o
f bot
tom
mid
dle
poin
ts ;
P((9
*(k-
1) +
8),3
) = z
bm ;
P((9
*(k-
1) +
9),1
) = x
br ;
P((9
*(k-
1) +
9),2
) = y
br ;
%th
e co
ordi
nate
s of b
otto
m ri
ght p
oint
s ;
P((9
*(k-
1) +
9),3
) = z
br ;
%
inpu
t del
taph
i and
del
taal
pha
into
mat
rix p
P(
(9*(
k-1)
+1):9
*k,5
) = d
elta
phi*
pi/1
80 ;
%th
e de
lta p
hi fo
r all
9 po
ints
on
each
vis
ual m
edia
;
P(
(9*(
k-1)
+1):9
*k,6
) = d
elta
alph
a*pi
/180
; %
the
delta
alp
ha fo
r all
9 po
ints
on
each
vis
ual m
edia
;
en
d
244

% in
put t
he p
aram
eter
s to
defin
e th
e vi
ewin
g pl
ane
sym
s set
a yv
zv
; se
ta =
inpu
t('Th
e an
gle
of sl
oped
vie
win
g pl
ane
in d
egre
es?
if ho
rizon
tal v
iew
ing
plan
e, in
put z
ero.
\n')
; yv
= in
put('
The
dist
ance
in y
-coo
rdin
ate
in m
eter
s fro
m o
rigin
al p
oint
to th
e st
art e
dge
of th
e sl
oped
vie
win
g pl
ane?
\n')
; zv
= in
put('
The
heig
ht in
met
ers o
f the
eye
s of t
he o
bser
vers
on
the
floor
? \n
') ;
% st
art t
o dr
aw th
e id
eal v
iew
ing
spac
e of
text
s pre
sent
ed o
n ea
ch v
isua
l med
ium
; %
def
ine
volu
me
-50
met
er ~
+ 5
0 m
eter
on
x y
z co
ordi
nate
s;
[x,y
,z] =
mes
hgrid
(-50
:1:5
0,-5
0:1:
50,-5
0:1:
50);
% d
efin
e so
me
angl
es ;
phi1
= (-
90:1
:90)
*pi/1
80 ;
%th
e ra
nge
of h
oriz
onta
l vie
win
g an
gle
phi ;
al
pha1
= (-
90:1
:90)
*pi/1
80 ;
%th
e ra
nge
of v
ertic
al v
iew
ing
angl
e al
pha
; %
defin
e th
e le
ngth
of x
y z
; le
n1 =
leng
th(p
hi1)
; le
n2 =
leng
th(a
lpha
1) ;
xi =
zer
os(le
n1,le
n2) ;
yi
= x
i ;
zi =
xi ;
245

% se
t the
val
ues o
f x, y
, z fo
r the
con
tour
of c
ente
r poi
nt o
f firs
t scr
een
; fo
r k =
1:k
fo
r j =
1:9
fo
r m =
1:le
n1
for n
= 1
:len2
ph
it =
phi1
(m) ;
alp
hat =
alp
ha1(
n) ;
ks
i = a
cos(
cos(
phit)
*cos
(alp
hat))
*180
/pi ;
if
(ksi
>=
0) &
& (k
si <
= 65
.7)
xi(m
,n) =
P((
9*(k
-1)+
j),1)
+ P
((9*
(k-1
)+j),
4)*(
cos(
phit)
)^0.
5*(c
os(a
lpha
t))^1
.5*s
in(p
hit +
P(
(9*(
k-1)
+j),5
)) ;
y
i(m,n
) = P
((9*
(k-1
)+j),
2) +
P((
9*(k
-1)+
j),4)
*(co
s(ph
it))^
0.5*
(cos
(alp
hat))
^0.5
*(co
s(al
phat
)*co
s(ph
it +
P((9
*(k-
1)+j
),5))
*cos
(P((
9*(k
-1)+
j),6)
)-si
n(al
phat
)*si
n(P(
(9*(
k-1)
+j),6
)));
zi(m
,n) =
P((
9*(k
-1)+
j),3)
+ P
((9*
(k-1
)+j),
4)*(
cos(
phit)
)^0.
5*(c
os(a
lpha
t))^0
.5*(
cos(
alph
at)*
cos(
phit+
P(
(9*(
k-1)
+j),5
))*s
in(P
((9*
(k-1
)+j),
6))+
sin(
alph
at)*
cos(
P((9
*(k-
1)+j
),6))
);
e
lsei
f (ks
i <=
82.8
)
x
i(m,n
) = P
((9*
(k-1
)+j),
1) +
((
0.02
4*ks
i-0.5
77)^
-1)*
P((9
*(k-
1)+j
),4)*
(cos
(phi
t))^0
.5*(
cos(
alph
at))
^1.5
* si
n(ph
it +
P((9
*(k-
1)+j
),5))
;
y
i(m,n
) = P
((9*
(k-1
)+j),
2) +
((
0.02
4*ks
i-0.5
77)^
-1)*
P((9
*(k-
1)+j
),4)*
(cos
(phi
t))^0
.5*(
cos(
alph
at))
^0.5
* (c
os(a
lpha
t)*co
s(ph
it +
P((9
*(k-
1)+j
),5))
*cos
(P((
9*(k
-1)+
j),6)
)-si
n(al
phat
)*si
n(P(
(9*(
k-1)
+j),6
)));
zi(m
,n) =
P((
9*(k
-1)+
j),3)
+
246

((0.
024*
ksi-0
.577
)^-1
)*P(
(9*(
k-1)
+j),4
)*(c
os(p
hit))
^0.5
*(co
s(al
phat
))^0
.5*
(cos
(alp
hat)*
cos(
phit+
P((9
*(k-
1)+j
),5))
*sin
(P((
9*(k
-1)+
j),6)
)+
sin(
alph
at)*
cos(
P((9
*(k-
1)+j
),6))
);
e
lse
xi(m
,n) =
P((
9*(k
-1)+
j),1)
;
y
i(m,n
) = P
((9*
(k-1
)+j),
2) ;
zi(m
,n) =
P((
9*(k
-1)+
j),3)
;
end
en
d
e
nd
%
plo
t the
con
tour
of c
ente
r poi
nt o
f the
firs
t scr
een
;
v
= z
- y*t
an(s
eta*
pi/1
80)+
yv*
tan(
seta
*pi/1
80) -
zv
; %
Cre
ate
volu
me
data
: def
ines
the
plan
e fu
nctio
n
fig
ure(
1) ;
hold
on
;
co
ntou
rslic
e(x,
y,z,
v,xi
,yi,z
i,[0
0]) ;
vi
ew(0
,90-
seta
);
ax
is e
qual
;
ax
is ([
-10
10 -2
18]
) ;
xlab
el('x
') ;
ylab
el('y
') ;
zlab
el('z
') ;
end
end
247

% d
ispl
ay th
e pa
ram
eter
s ;
disp
(' ');
di
sp ('
Res
ults
') ;
disp
(' ');
di
sp ('
list o
f the
par
amet
ers o
f eve
ry 9
vie
win
g po
ints
on
each
vis
ual m
edia
');
disp
(' ');
di
sp('
x0
y0
z
0
D
0
d
elta
phi
del
taal
pha')
; di
sp (P
) ;
248

249
REFERENCES
Adams, S., Goldstein, S., Zeltner, K., Ratanaproeksa, P., & Green, P. (1988). Legibility Abstracts from the UMTRI Library. Ann Arbor, MI: University of Michigan Transportation Research Institute.
Adler, B., & Straub, A. L. (1971). Legibility and Brightness in Sign Design. Highway Research Record, 366, 37-47.
Adrian, W. K. (1982). The Integration of Visual Performance Criteria into the Illumination Design Process. Canada: Ministry of Supply and Services, Public Works of Canada, Cat. No. W63-7/82.
Allen, R. L., Ault, D. K., Bowen, J. T., Clabaugh, S., Cuttill, W. J., Dewitt, B. B., et al. (1991). Design of General-Purpose Classrooms and Lecture Halls. University Park, PA: Penn State University.
Allen, R.L., Bowen, J.T., Clabaugh, S., DeWitt, B.B., Francis, J., Kerstetter, J.P., & Rieck, D.A. (1996). Classroom Design Manual (3rd ed.). College Park, MD: University of Maryland.
Allen, T. M., Smith, G. M., Janson, M. H., & Dyer, F. N. (1966). Sign Brightness in Relation to Legibility. Lansing, MI: Michigan State Highway Commission, Office of Testing and Research, Research Laboratory Division.
Anonymous. (2006). 宋代四大书院简介 (Introduction of the Four Shu Yuan in Song Dynasty). 旅游特刊: 大宋文化 (Travel Special: Song Culture), 1. Retrieved July 16, 2007, from http://kaifeng.yiyou.com/html/15/378.html.

250
Berger, C. (1950). Experiments on the Legibility of Symbols of Different Width and Height. Acta Ophthalmologica, 28 (4), 423-434.
Berman, S., & Clear, R. (2001). Additivity Constraints and Visual Task Considerations in Mesopic Photometry. Journal of the Illuminating Engineering Society, 30(1), 90 -104.
Boff, K. R., Kaufman, L., & Thomas, J. P. (Eds.) (1986). Handbook of Perception and Human Performance, Vol. 1, Sensory Processes and Perception. New York, NY: Wiley.
Boff, K. R., & Lincoln, J. E. (1988). Engineering Data Compendium: Human Perception and Performance. Wright-Patterson Air Force Base, OH: Harry G. Armstrong Aerospace Medical Research Laboratory.
Boreczky, J., Green, P., Bos, T., & Kerst, J. (1988). Effects of Size, Location, Contrast, Illumination, and Color on the Legibility of Numeric Speedometers. Final Report. Ann Arbor, MI: University of Michigan Transportation Research Institute.
Boyce, P. R. (1995a, July). Illuminance Selection Based on Visual Performance - And Other Fairy Stories. 1995 Illuminating Engineering Society Annual Conference. New York, NY.
British Standards Institution (BSI). (2003). British Standard: BS 4274-1:2003. Visual Acuity Test Types – Part 1: Test Charts for Clinical Determination of Distance Visual Acuity – Specification. ILI, NJ.
Bryant, J. F. M. (1982). The Design of Symbolic Signs to Ensure Legibility. Australian Road Research Board. Eleventh Conference Proceedings (1982). Part 5. Safety. 161-171. Vermont South, Australia.
Clear, R., & Berman, S. (1985). Target Size, Visibility, and Roadway Performance. Journal of the Illuminating Engineering Society, 15(1), 167-180.
Collins, J. J., & Hall, R. D. (1992). Legibility and Readability of Light Reflecting Matrix Variable Message Road Signs. Lighting Research and Technology, 24(3),143-148.

251
Colomb, M., Hubert, R., Carta, V., Bry, M., & Dore-Picard. (1991). Variable-message Signs: Legibility and Recognition of Symbols. Strategic Highway Research Program and Traffic Safety on Two Continents. Proceedings of the Conference. Part 1: Opening; Motorist Information Systems; Accident Studies and Safety Management. 45-62.
Conway, K. (1990). Master Classrooms: Classroom Design with Technology in Mind. University of North Carolina at Chapel Hill: Academic Computing Publications, Inc.
Cornog, D.Y., & Rose, F. C. (1967). Legibility of Alphanumeric Texts and Other Symbols II, A Reference Handbook. Washington D.C.: Institute of Applied Technology. National Bureau of Standards. Miscellaneous 262-2.
Crystalinks. (n.d.). Ancient Roman Education. Retrieved July 17, 2007, from http://www.crystalinks.com/romeducation.html
Duncan, C. J. (Ed.) (1966). Modern Lecture Theatres. London: Oriel academic.
Duncan, J., & Konz, S. (1974). Effect of Ambient Illumination on Legibility of Displays of Liquid-Crystals and Light-Emitting Diodes. 18th Annual Meeting Proceedings. Human Factors Society, Santa Monica, CA. 102-108.
Forbes, T. W. (1969). Factors in Visibility and Legibility of Highway Signs and Markings. Visual Factors in Transportation Systems. East Lansing: Michigan State University. (NTIS, 12-29).
Forbes, T. W. (1972). Visibility and Legibility of Highway Signs. Human Factors in Highway Traffic Safety Research (pp. 95-109). New York: Wiley.
Forbes, T. W. (1975). Luminance and Contrast for Sign Legibility - Additional Results and Applications. East Lansing: Michigan State University.
Forbes, T.W., & Holmes, R. S. (1939). Legibility Distances of Highway Destination Signs In Relation To Letter Height, Letter Width and Reflectorization. Highway Research Board Proceedings, 19, 321-355.

252
Foster, J. J. (1980). Legibility Research 1972-1978: A Summary. Manchester, England: Manchester Polytechnic
Gleeson Neon Advertising. (n.d.) Design of Neon Lighting, Key Design Considerations,
1st Rule. Retrieved Jan 16, 2005, from http://www.gleeson-neon.com.au/html/design.html.
Gove, P. B., & Merriam-Webster editorial staff. (1986). Webster’s Third New International Dictionary of the English Language Unabridged. Springfield, MA: Merriam-Webster.
Green, P., Goldstein, S., Zeltner, K., & Adams, S. (1988). Legibility of Text on Instrument Panels: A Literature Review. Final Report. Ann Arbor, MI: University of Michigan Transportation Research Institute.
Hall, R. H., & Hanna, P. (2003). The Impact of Web Page Text-Background Color Combinations on Readability, Retention, Aesthetics, and Behavioral Intention, Under Review, Behavior and Information Technology. Laboratory for Information, Technology Evaluation, Tech. Rep. # LITE-2003-04.
Hauf, H. D., Koppes, W. F., Green, A. C., & Gassman, M. C. (1961). New Space for Learning-Designing College Facilities to Utilize Instructional Aids and Media. Report of a Research Project Conducted By the School Of Architecture. Troy, NY: Rensselaer Polytechnic Institute.
Hecht, S. (1935). The Theory of Visual Intensity Discrimination. Journal of General Physiology, 18, 767-789.
Hendee, W. R., & Wells, P.N.T. (Eds.) (1993). The Perception of Visual Information. New York, NY: Springer-Verlag.
Holick, A. J., & Carlson, P. J. (2002). Model of Overhead-Sign Luminance Needed for Legibility. Transportation Research Record, 1801, 80-86.
Howett, G. L. (1983). Size of Letters Required for Visibility As a Function of Viewing Distance and Observer Visual Acuity. Washington D.C.: National bureau of standards.

253
Institute of Education Science National Center for Education Statistics. (n.d.). Classification of Instructional Programs (CIP 2000). US Department of Education. Retrieved October 18, 2005, from http://nces.ed.gov/pubs2002/cip2000/.
International Archive of Education Data. (n.d.). Higher Education General Information Survey (HEGIS): Institutional Characteristics. Retrieved October 17, 2005, from http://webapp.icpsr.umich.edu/cocoon/IAED-SERIES/00030.xml?token=6.
International Commission on Illumination. (1981). CIE 19/2.1. Tech. Rep. An Analytic Model for Describing the Influence of Lighting Parameters upon Visual Performance, 1, Technical Foundations. (Reprint 1997). CIE TC-3.1.
International Commission on Illumination. (1981). CIE 19/2.2. Tech. Rep. An Analytic Model for Describing the Influence of Lighting Parameters upon Visual Performance, 2, Summary and Application Guidelines. (Reprint 1997). CIE TC-3.1.
Kemper, A.M. (1979). Architectural Handbook, Environmental Analysis, Architectural Programming, Design and Technology, and Construction. New York, NY: Wiley-Interscience.
Kuhn, B.T., Garvey, P.M., & Pietrucha, M.T. (2004). Sign Legibility: Impact of Color and Illumination on Typical On-Premeise Sign Font Legibility. University Park, PA: Pennsylvania Transportation Institute, Pennsylvania State University.
Kuntz, J.E., & Sleight, R.B. (1950). Legibility of Numerals: The Optimal Ratio of Height to Width Ratio of Stroke. American Journal of Psychology, 63 (4), 567-575.
Leibowitz, H. (1952). The Effect of Pupil Size on Visual Acuity for Photometrically Equated Text Fields at Various Levels of Luminance. Journal of the Optical Society of America, 42(6), 416-422.
Luckiesh, M., & Moss, F. K. (1937). The Science of Seeing. New York, NY: Van Nostrand.

254
Mace, D. J. (1988). Sign Legibility and Conspicuity. Transportation Research Board Special Report, 2 (218), 270-293.
Matković, K. (1997). Adaptation and Veiling Luminance, Human Vision, Color Science Basics. Tone Mapping Techniques and Color Image Difference in Global Illumination. Retrieved March 26, 2006, from http://www.cg.tuwien.ac.at/research/theses/matkovic/node19.html.
Meilin. (2007). 壁画作品(孔子教学) (fresco (Confucius was tutoring)). Retrieved July16, 2007, from http://xcmeilin.com/jiashownews.asp?id=12.
Moon, P., & Spencer, D. E. (1943). Specification of Foveal Adaptation. Journal of the Optical Society of America, 33(8), 444-456.
Moon, P., & Spencer, D. E. (1944). Visual Data Applied to Lighting Design. Journal of the Optical Society of America, 34 (10), 605-617.
Moon, P., & Spencer, D.E. (1945). The Visual Effect of Non-Uniform Surrounds. Journal of the Optical Society of America, 35(3), 233-248.
Mouroulis, P. (1999). Visual Instrumentation: Optical Design and Engineering Principles. New York: McGraw-Hill.
National Standards Authority of Ireland (NSAI). (2004). Standard I.S. En 13200-1:2004, Spectator Facilities - Part 1: Layout Criteria for Spectator Viewing Area –Specification. Ireland: European Committee for Standardization.
Nakane, Y., & Ito, K. (1978). Study on Standard Visual Acuity Curves for Better Seeing in Lighting Design. Journal of Light and Visual Environment, 2(1), 38-44.
Niemeyer, D. (2003). Hard Factors on Smart Classroom Design, Ideas, Guidelines, and Layouts. Lanham, MD: The Scarecrow Press.
Nilsson, T. (1999). Legibility and Visual Effectiveness of Some Proposed and Current Health Warnings on Cigarette Packages. Ottawa (ON): Health Canada

255
Office of Space Analysis, University of Michigan. (2005). Departmental Space Inventory Survey---Room Type Codes & Definitions, Postsecondary Education Facilities Inventory and Classification Manual Modified for University of Michigan Use. Retrieved June 13, 2005, from http://www.umich.edu/~ofa/Space/RmTyp100.htm.
Pastoor, S. (1990). Legibility and Subjective Preference for Color Combinations in Text. The Journal of the Human Factors and Ergonomics Society, 32(2), 157-172.
Pirenne, M. H. (1967). Vision and the Eye. London: Chapman and Hall.
Post, D. L., Costanza, E. B., & Lippert, T. M. (1982). Expressions of Color Contrast as Equivalent Achromatic Contrast. Proceedings of the Human Factors and Ergonomics Society 26th Annual Meeting, 581-585. Santa Monica, CA: Human Factors and Ergonomics Society.
Rea, M.S. (1986). Toward a Model of Visual Performance: Foundations and Data. Journal of the Illuminating Engineering Society, 15(2), 41-57.
Rea, M.S. (1987). Toward a Model of Visual Performance: A Review of Methodologies. Journal of the Illuminating Engineering Society, 16 (1), 128-142.
Rea, M.S. (Ed. in chief) (2000). The IESNA Lighting Handbook: Reference & Application. 9th Ed. New York, NY: Illuminating Engineering Society of North America.
Reeves, P. (1920). The Response of the Average Pupil to Various Intensities of Light. Journal of the Optical Society of America, 4 (2), 35-43.
Reger, J. J. (1989). Legibility Prediction for Flat-Panel Displays Under Fluorescent and Daylight Illumination. Blacksburg, VA: Virginia Polytechnic Institute and State University.
Rehe, R. F. (1974). Typography: How to Make It Most Legible. Carmel, IN: Design Research International.

256
Remington, L. A. (2005). Clinical Anatomy Of the Visual System, 2nd ed.. St. Louis, MO: Elsevier Inc.
Richardson, W. C. (1976). Comparison of Legibility Potential of Reflective Sign Components. Executive Summary. Columbus, OH: Ohio Department of Transportation, Bureau of Traffic.
Richardson, W. C. (1976). Comparison of Legibility Potential of Reflective Sign Components, Final Report. Columbus, OH: Ohio Department of Transportation, Bureau of Traffic.
Sanders, M. S. & McCormick, E. J. (1993). Human Factors in Engineering and Design, 7th Ed. New York: McGraw-Hill.
Schieber, F. (1994). Using the "Blur Tolerance" Technique to Predict and Optimize the Legibility Distance of Symbolvhighway Signs. Human Factors and Ergonomics Society. 38th Annual Meeting. People and Technology in Harmony. Proceedings, 2, 912-915. Santa Monica, CA: Human Factors and Ergonomics Society.
Shurtleff, D. A. (1980). How to Make Displays Legible. La Mirada, CA: Human Interface Design.
Smith, S. L., Farquhar, B. B., & Thomas, D. W. (1965). Color Coding in Formatted Displays. Journal of Applied Psychology, 49(6), 393-398.
Stevenson, S. (2004). Room Use Codes, Space Types, and Assignment Guidelines. Office of the Provost, University of Alaska Fairbanks. Retrieved July 23, 2007, from http://www.uaf.edu/provost/SPAM/Codes.htm
The society of Motion Picture and Television Engineers. (2003). SMPTE 196M-2003, SMPTE Standard for Motion-Picture Film-Indoor Theater and Review Room Projection-Screen Luminance and Viewing Conditions. White Plains, NY.
The Standard Practice Subcommittee of the IESNA Roadway Lighting Committee. (2000). ANSI/IESNA RP-8-00, American National Standard Practice for Roadway Lighting. New York, NY: IESNA Roadway Lighting Committee

257
Tinker, M. A. (1963). Color of Print and Background. Legibility of Print, 128-152. Ames, IA: Iowa State University Press.
Uhlaner, J. E. (1941). The Effect of Thickness of Stroke on the Legibility of Letters. Iowa Academy of Science Proceedings, 48, 319-324. Ames, IA: Iowa State College.
United States Sign Council (USSC). (1998). Sign Legibility: Overview and Calculation Methodology; Sign Legibility Index. Member Resource Folio/Legislative Information.
Veitch, J. A., & Newsham, G.R. (1995). Quantifying Lighting Quality Based on Experimental Investigations of End User Performance and Preference. The 3rd European Conference on Energy-Efficient Lighting. Newcastle-upon-Tyne, UK.
Veitch, J. A., & Newsham, G. R. (1998). Determinants of Lighting Quality I: State of the Science. Journal of the Illuminating Engineering Society, 27 (1), 92-106.
Wandell, B. A. (1995). Foundation of Vision. Sunderland, MA: Sinauer Associates.
Weale, R. A. (1992). The Senescence of Human Vision. New York: Oxford University Press.
Wolken, J.J. (1966). Vision, Biophysics and Biochemistry of the Retinal Photoreceptors. Springfield, IL: Charles C Thomas.
Zwahlen, H. T., Schnell, T., & Fenk, J. (1995). A Combined Age-Background Luminance Contrast Multiplication Function to Adjust the Human Contrast Threshold More Accurately In Visibility and Legibility Evaluations. Proceedings of the PAL-Progress in Automobile Lighting-Symposium, Vol. 1, 240-247. Darmstadt, German: Darmstadt Technical University.
Zwahlen, H. T., & Schnell, T. (1999). Legibility of Traffic Sign Text and Symbols. Transportation Research Record, 1692, 142-151.
Recommended