4Q & FY2011 Results Presentation
Disclaimer This presentation may contain forward-looking statements that involve known and unknown risks, uncertainties, assumptions and other
factors which may cause the actual results, performance or achievements of Ying Li or the Group, or industry results, to be materially
different from any future results, performance or achievements expressed or implied by such forward-looking statements. Among the factors
include but not limited to the Group’s business and operating strategies, general industry and economic conditions, cost of capital and
capital availability, competitive conditions, interest rate trends, availability of real estate properties, shift in customers demand, changes in
operating expenses, environment risks, foreign exchange rates, government policies changes and the continued availability of financing in the
amounts and the term necessary to support future business activities.
Ying Li expressly disclaims any obligation or undertaking to release publicly any updates or revisions to any forward-looking statement
contained herein to reflect any changes in Ying Li’s of the Group’s expectations with regard thereto or any changes in events, conditions or
circumstances on which any such statement is based, subject to compliance with all applicable laws and regulation and/or the rules of SGX-ST
and/or any other regulatory or supervisory body.
Industry data, graphical representation and other information relating to the PRC, Chongqing and the property industry contained in this
presentation have been compiled from various publicly available official and non-official sources generally believed to be reliable but not
guaranteed. While Ying Li or the Group has taken reasonable steps to ensure that the information is extracted accurately and in its proper
context, Ying Li or the Group advised no assurance as to the accuracy or completeness of such included information and should not be unduly
relied upon.
This presentation may include pictures of artist’s impressions on certain property projects and should not be perceive as the actual
representative of the developed or to be developed properties.
The past performance of Ying Li is not necessarily indicative of the future performance of Ying Li.
2

1. 4Q & FY2011 Financial Results
2. Economy Updates & Outlook
Agenda
3. Business Updates & Outlook
4. Appendix
3
4Q & FY2011 Financial Results
4
4Q & FY2011 – Revenue 4Q 2011
(RMB’000) 4Q 2010
(RMB’000) %
CHANGE JAN TO DEC 2011
(RMB’000) JAN TO DEC 2010
(RMB’000) %
CHANGE
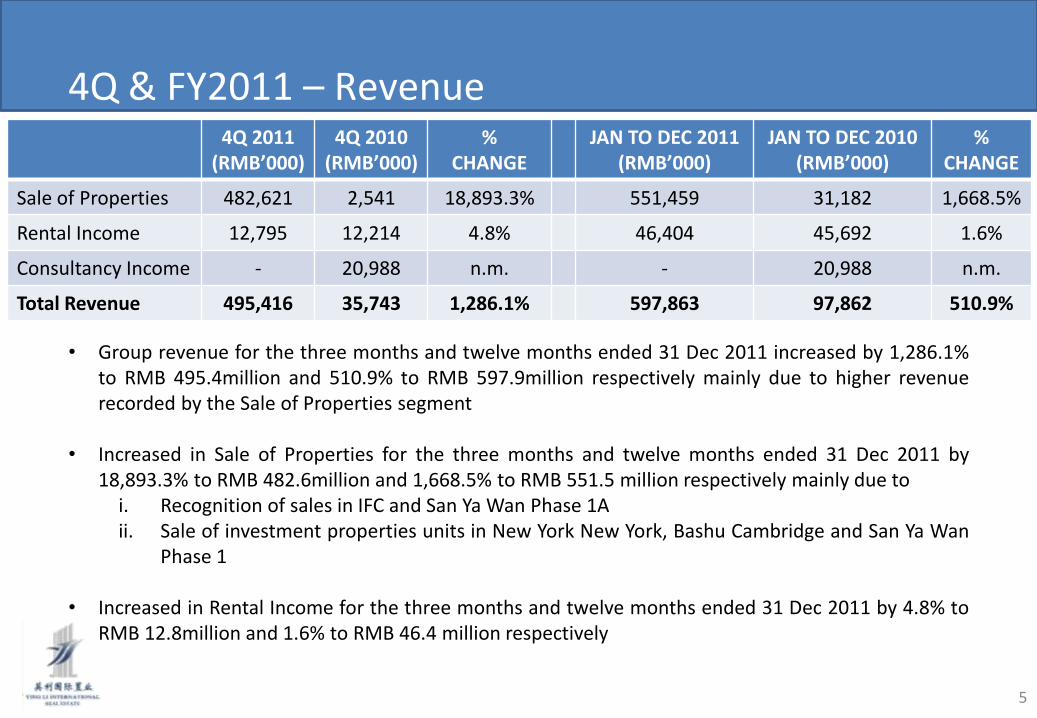
Sale of Properties 482,621 2,541 18,893.3% 551,459 31,182 1,668.5%
Rental Income 12,795 12,214 4.8% 46,404 45,692 1.6%
Consultancy Income - 20,988 n.m. - 20,988 n.m.
Total Revenue 495,416 35,743 1,286.1% 597,863 97,862 510.9%
5
• Group revenue for the three months and twelve months ended 31 Dec 2011 increased by 1,286.1% to RMB 495.4million and 510.9% to RMB 597.9million respectively mainly due to higher revenue recorded by the Sale of Properties segment
• Increased in Sale of Properties for the three months and twelve months ended 31 Dec 2011 by
18,893.3% to RMB 482.6million and 1,668.5% to RMB 551.5 million respectively mainly due to i. Recognition of sales in IFC and San Ya Wan Phase 1A ii. Sale of investment properties units in New York New York, Bashu Cambridge and San Ya Wan
Phase 1
• Increased in Rental Income for the three months and twelve months ended 31 Dec 2011 by 4.8% to RMB 12.8million and 1.6% to RMB 46.4 million respectively
4Q & FY2011 – Gross Profit and Margin
• NA
4Q 2011 (RMB’000)
GP MARGIN
%
4Q 2010 (RMB’000)
GP MARGIN
%
JAN TO DEC 2011
(RMB’000)
GP MARGIN
%
JAN TO DEC 2010
(RMB’000)
GP MARGIN
%
Sale of Properties
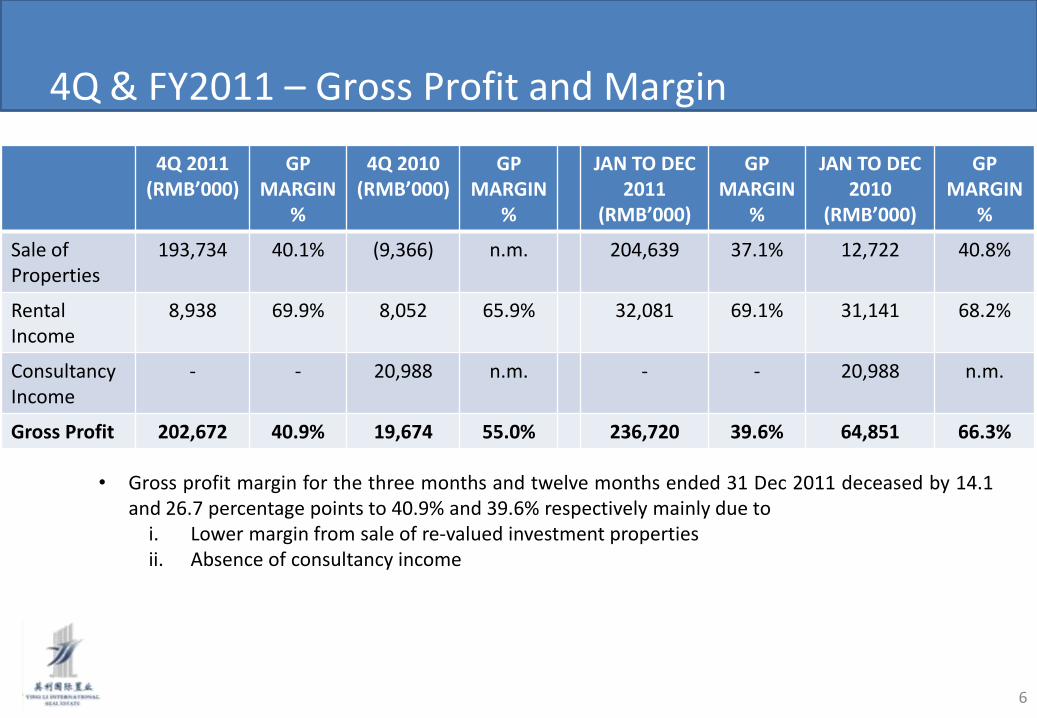
193,734 40.1% (9,366) n.m. 204,639 37.1% 12,722 40.8%
Rental Income
8,938 69.9% 8,052 65.9% 32,081 69.1% 31,141 68.2%
Consultancy Income
- - 20,988 n.m. - - 20,988 n.m.
Gross Profit 202,672 40.9% 19,674 55.0% 236,720 39.6% 64,851 66.3%
6
• Gross profit margin for the three months and twelve months ended 31 Dec 2011 deceased by 14.1 and 26.7 percentage points to 40.9% and 39.6% respectively mainly due to
i. Lower margin from sale of re-valued investment properties ii. Absence of consultancy income
4Q & FY2011 – Profit attributable to owners of the parent
Profit attributable to : 4Q 2011 (RMB’000)
4Q 2010 (RMB’000)
% CHANGE
FY2011 (RMB’000)
FY2010 (RMB’000)
% CHANGE
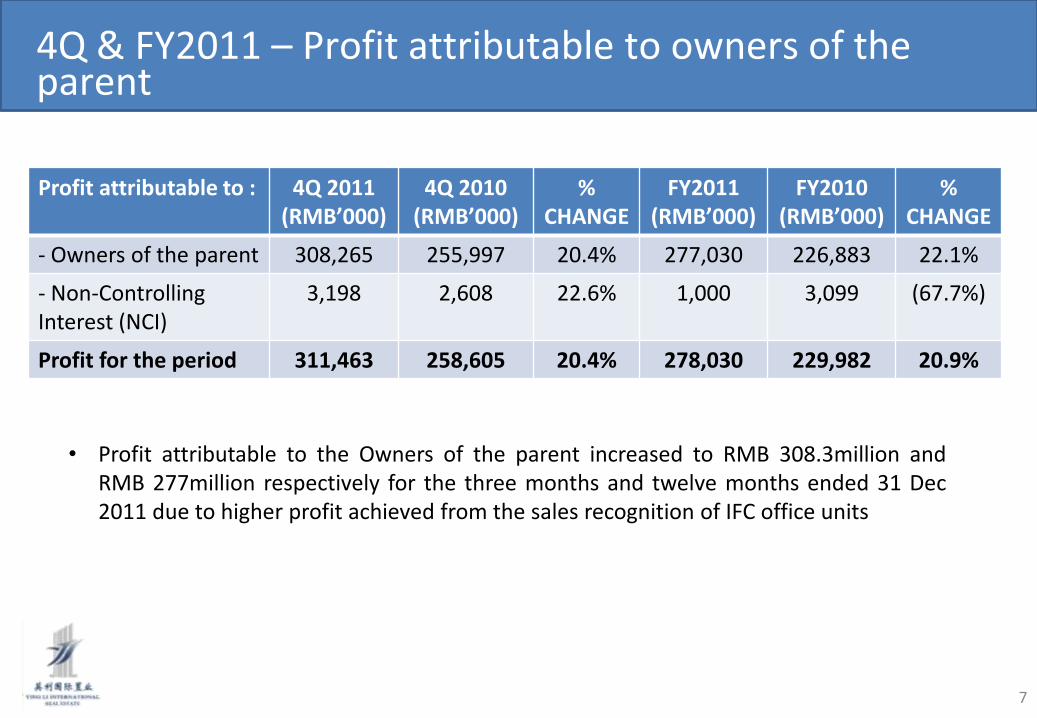
- Owners of the parent 308,265 255,997 20.4% 277,030 226,883 22.1%
- Non-Controlling Interest (NCI)
3,198 2,608 22.6% 1,000 3,099 (67.7%)
Profit for the period 311,463 258,605 20.4% 278,030 229,982 20.9%
7
• Profit attributable to the Owners of the parent increased to RMB 308.3million and RMB 277million respectively for the three months and twelve months ended 31 Dec 2011 due to higher profit achieved from the sales recognition of IFC office units

4Q & FY2011 –Statements of Financial Position (RMB’000) 30 Dec 11 30 Dec 10
Total Assets 5,934,825 5,220,736
Total Liabilities 3,057,821 2,669,954
Total Equity 2,877,004 2,550,782
Net Gearing 56.9% 41.1%
8
• Increase in Total assets by RMB 714.1 million to RMB 5,934.8million due to increase in i. Investment and development cost of IFC and Ying Li International Plaza ii. Fair value iii. Trade and other receivables due to the sale of IFC office units iv. Prepayment of long term expense
• Increase in Total liabilities by RMB 387.9million to RMB 3,057.8 million due to increase in i. Borrowings for the incremental additional project cost incurred on for IFC and Ying Li
International Plaza ii. Income and deferred tax iii. Trade and other payables
• Increase in Total equity by RMB 326.2million to RMB 2,877.0 million due to increase i. Higher operating profit ii. Translation exchange gain iii. Issuance of new shares

Economy Update & Outlook
9
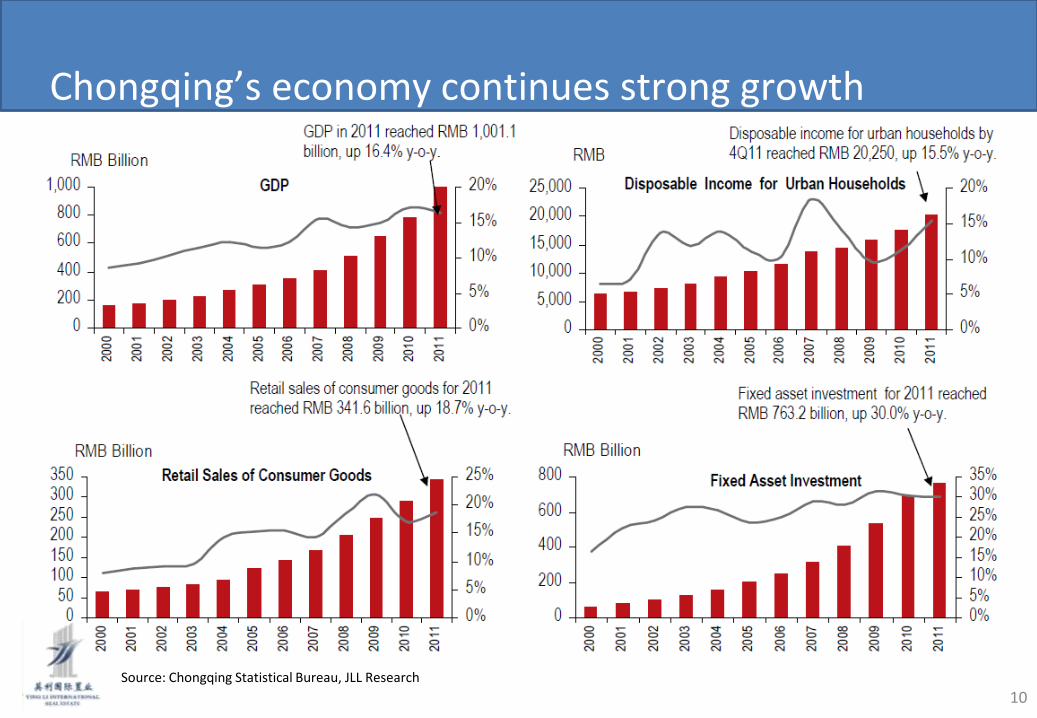
Chongqing’s economy continues strong growth
Source: Chongqing Statistical Bureau, JLL Research
10
0
5
10
15
20
25
30
35
40
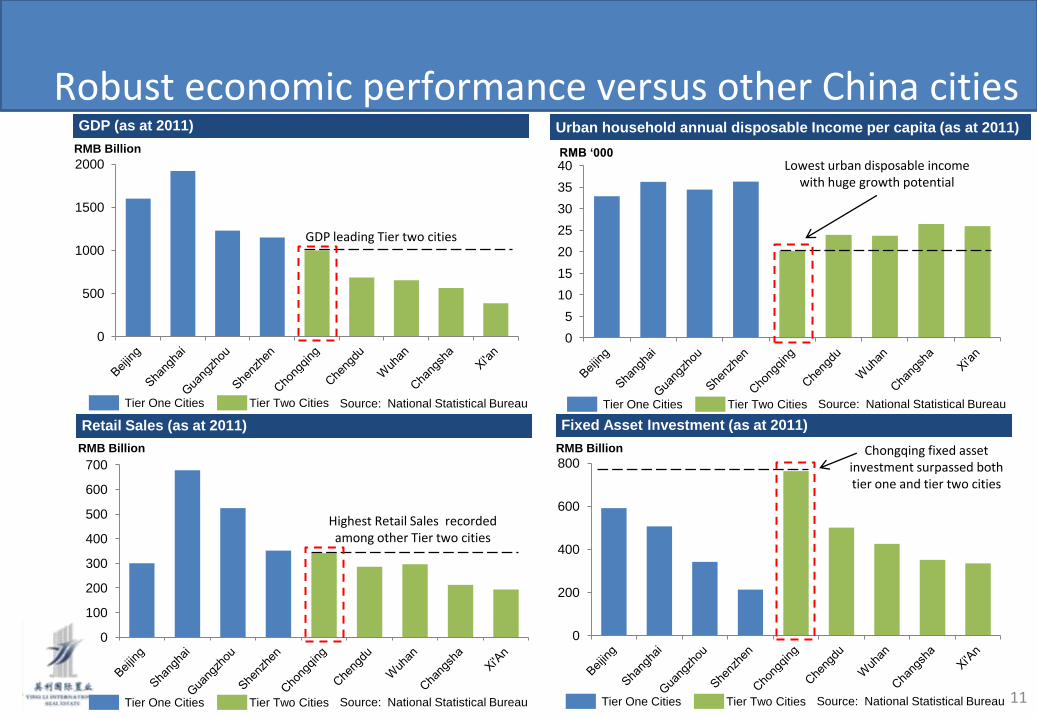
Robust economic performance versus other China cities
0
500
1000
1500
2000
GDP (as at 2011)
RMB Billion
0
100
200
300
400
500
600
700
Retail Sales (as at 2011)
RMB Billion
Urban household annual disposable Income per capita (as at 2011)
RMB ‘000
Tier One Cities Tier Two Cities Source: National Statistical Bureau
Tier One Cities Tier Two Cities Source: National Statistical Bureau
Tier One Cities Tier Two Cities Source: National Statistical Bureau
GDP leading Tier two cities
Highest Retail Sales recorded among other Tier two cities
Lowest urban disposable income with huge growth potential
0
200
400
600
800
Fixed Asset Investment (as at 2011)
RMB Billion
Tier One Cities Tier Two Cities Source: National Statistical Bureau
Chongqing fixed asset investment surpassed both tier one and tier two cities
11
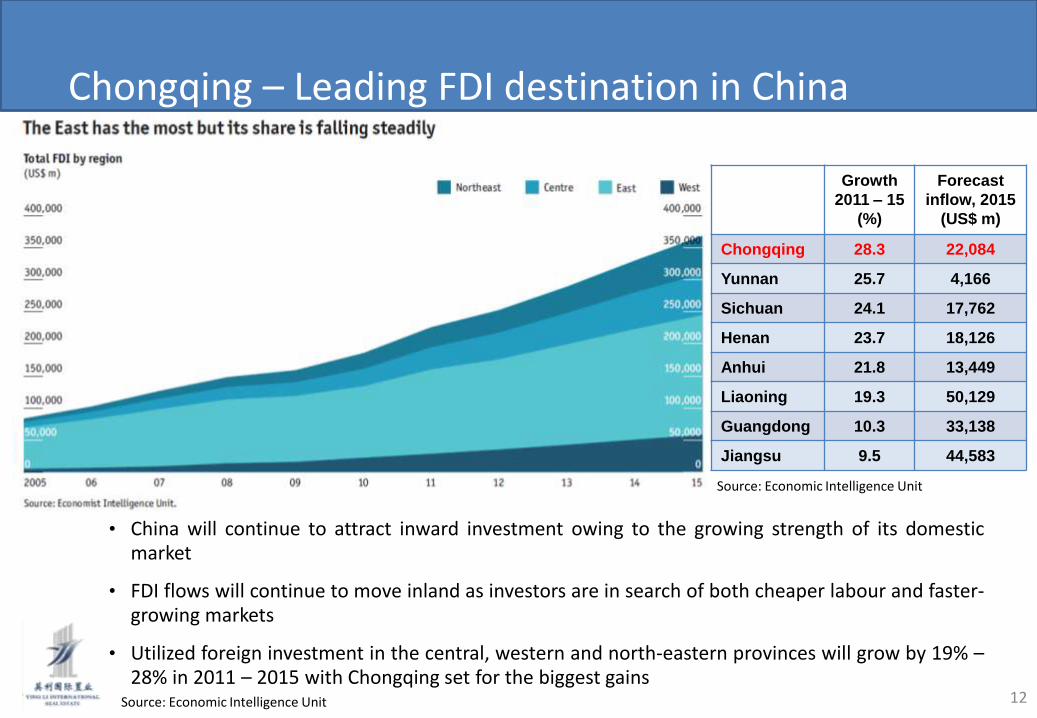
Chongqing – Leading FDI destination in China
Growth
2011 – 15
(%)
Forecast
inflow, 2015
(US$ m)
Chongqing 28.3 22,084
Yunnan 25.7 4,166
Sichuan 24.1 17,762
Henan 23.7 18,126
Anhui 21.8 13,449
Liaoning 19.3 50,129
Guangdong 10.3 33,138
Jiangsu 9.5 44,583
Source: Economic Intelligence Unit
• China will continue to attract inward investment owing to the growing strength of its domestic market
• FDI flows will continue to move inland as investors are in search of both cheaper labour and faster-growing markets
• Utilized foreign investment in the central, western and north-eastern provinces will grow by 19% – 28% in 2011 – 2015 with Chongqing set for the biggest gains
Source: Economic Intelligence Unit 12

Chongqing’s investment landscape
• Chongqing’s Investment Landscape for 4Q 2011
• According to Chongqing Municipal Banking Regulatory Commission, Chongqing has established itself as the financial center in Central and Western China by having the most complete banking institutions with over 72 banks
• IKEA invested US$ 144million to develop its largest China flagship store in Chongqing with a total build up area of approximately 90,000sqm
• Microsoft to develop cloud computing services platform and establish China’s first software services training and certification centre in the Chongqing Economic and Technology Development Zone
• Taiwan Compeq Manufacturing Co., Ltd, one of the top 10 global printed circuit board manufacturer, to build their second China PCB production base in Chongqing with an investment of US$ 300million
• Geely invested US$ 123million to build a third gearbox factory in Chongqing with the capacity of 300,000 units a year
• Korea SK Group, one of Global 500 companies, to invest more than US$ 100million to build the new-energy high-end function material base in Chongqing
• Hong Kong opened its Chongqing Liaison Office to enhance economic and trade co-operation between the two cities, and assist Hong Kong enterprises to capitalize on the western region’s development opportunities
13
Chongqing’s property landscape
• Chongqing’s Property Landscape for 4Q 2011
• The commercial property market grew steadily propelled by domestic consumption and various services industries expanding in the local market*
• Average Grade A office availability ratio dropped 8.95 percentage point q-o-q to 20.47% this quarter with overall rents risen by 0.45% q-o-q and 15.14% y-o-y, to RMB 75.99 per sq.m per month^
• Yuzhong District’s Grade A office availability ratio remains stable at 6.52%^
• Luxury apartments average prices dropped by 6.9% q-o-q to RMB11,891 per sq.m as developers carried out more price discounts, whereas leasing market continued to be active with rental rate growing by 0.8% q-o-q to RMB 31.4 per sq.m per month*
• Prime retail market average ground floor rental rate increased by 1.1% q-o-q to RMB 22.8 per sq.m per day as retailers continue to venture and expand to tap into the pent-up shopping demand from the growing middle class*
* Source: CBRE research ^ Source: DTZ research
14
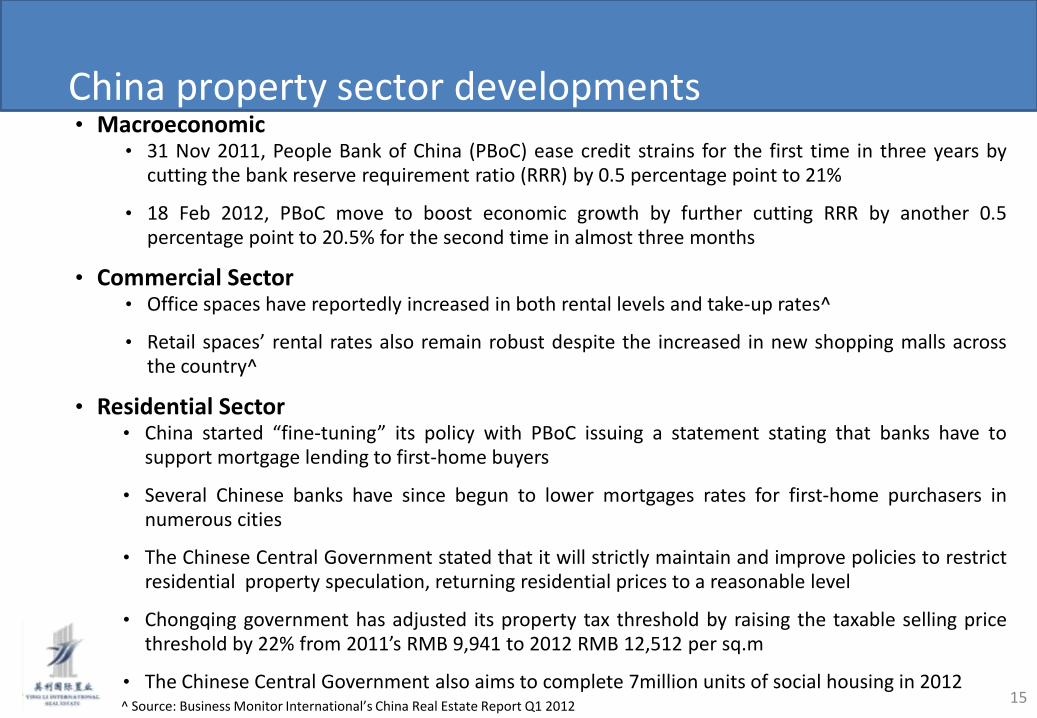
China property sector developments • Macroeconomic
• 31 Nov 2011, People Bank of China (PBoC) ease credit strains for the first time in three years by cutting the bank reserve requirement ratio (RRR) by 0.5 percentage point to 21%
• 18 Feb 2012, PBoC move to boost economic growth by further cutting RRR by another 0.5 percentage point to 20.5% for the second time in almost three months
• Commercial Sector • Office spaces have reportedly increased in both rental levels and take-up rates^
• Retail spaces’ rental rates also remain robust despite the increased in new shopping malls across the country^
• Residential Sector • China started “fine-tuning” its policy with PBoC issuing a statement stating that banks have to
support mortgage lending to first-home buyers
• Several Chinese banks have since begun to lower mortgages rates for first-home purchasers in numerous cities
• The Chinese Central Government stated that it will strictly maintain and improve policies to restrict residential property speculation, returning residential prices to a reasonable level
• Chongqing government has adjusted its property tax threshold by raising the taxable selling price threshold by 22% from 2011’s RMB 9,941 to 2012 RMB 12,512 per sq.m
• The Chinese Central Government also aims to complete 7million units of social housing in 2012 ^ Source: Business Monitor International’s China Real Estate Report Q1 2012
15
Business Update & Outlook
16

Business Update – IFC IFC Retail Mall
RETAIL MALL
• Soft opening of IFC retail mall on 18 Dec 2011
• Leased out over 80% of the retail space to both international and domestic brands
• New tenants such as Rimowa, Folli Follie, Marlboro Classics
*Photo as at February 2012
17
Business Update – IFC
*Photos as at February 2012
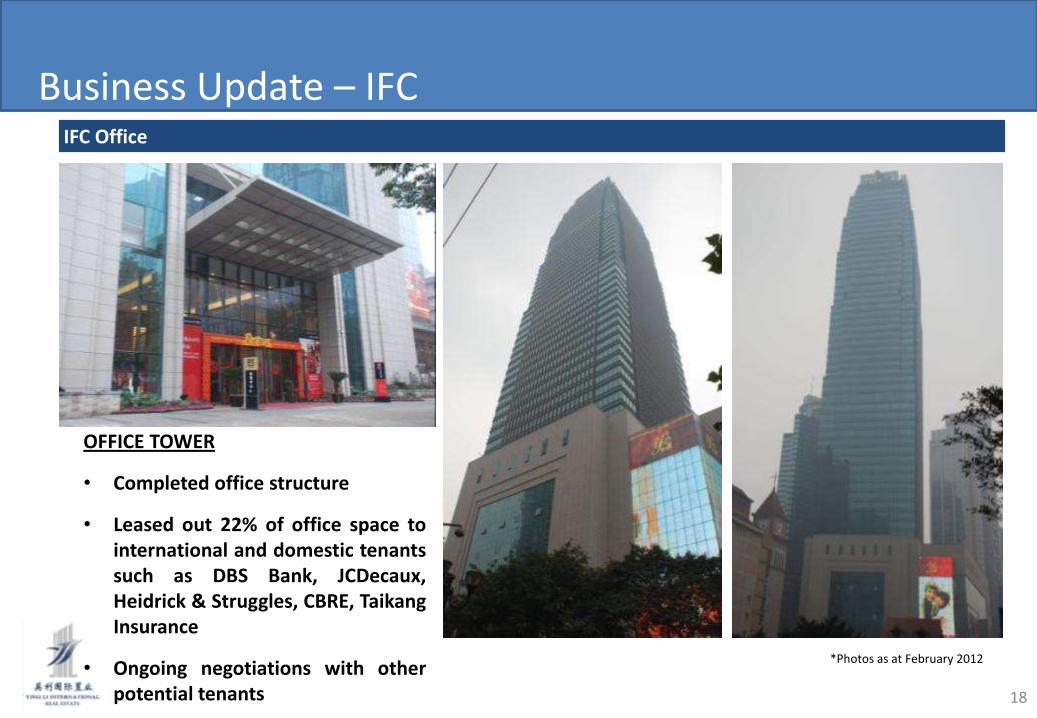
IFC Office
OFFICE TOWER
• Completed office structure
• Leased out 22% of office space to international and domestic tenants such as DBS Bank, JCDecaux, Heidrick & Struggles, CBRE, Taikang Insurance
• Ongoing negotiations with other potential tenants 18
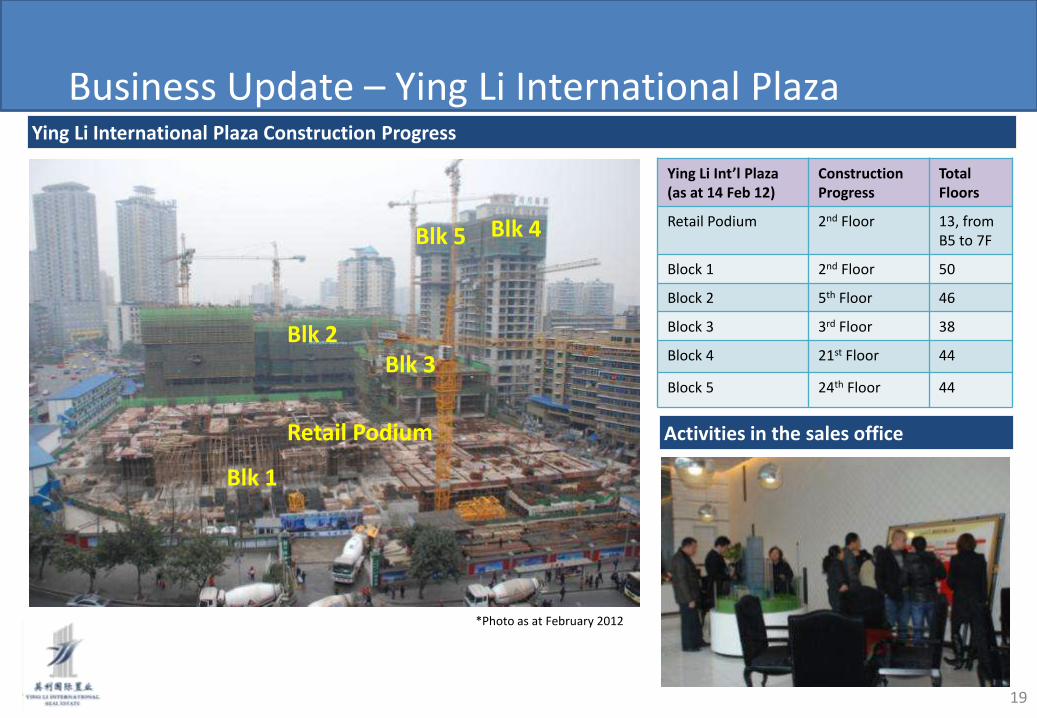
Business Update – Ying Li International Plaza Ying Li International Plaza Construction Progress
*Photo as at February 2012
Ying Li Int’l Plaza (as at 14 Feb 12)
Construction Progress
Total Floors
Retail Podium 2nd Floor 13, from B5 to 7F
Block 1 2nd Floor 50
Block 2 5th Floor 46
Block 3 3rd Floor 38
Block 4 21st Floor 44
Block 5 24th Floor 44
19
Activities in the sales office
Blk 4 Blk 5
Blk 2 Blk 3
Blk 1
Retail Podium
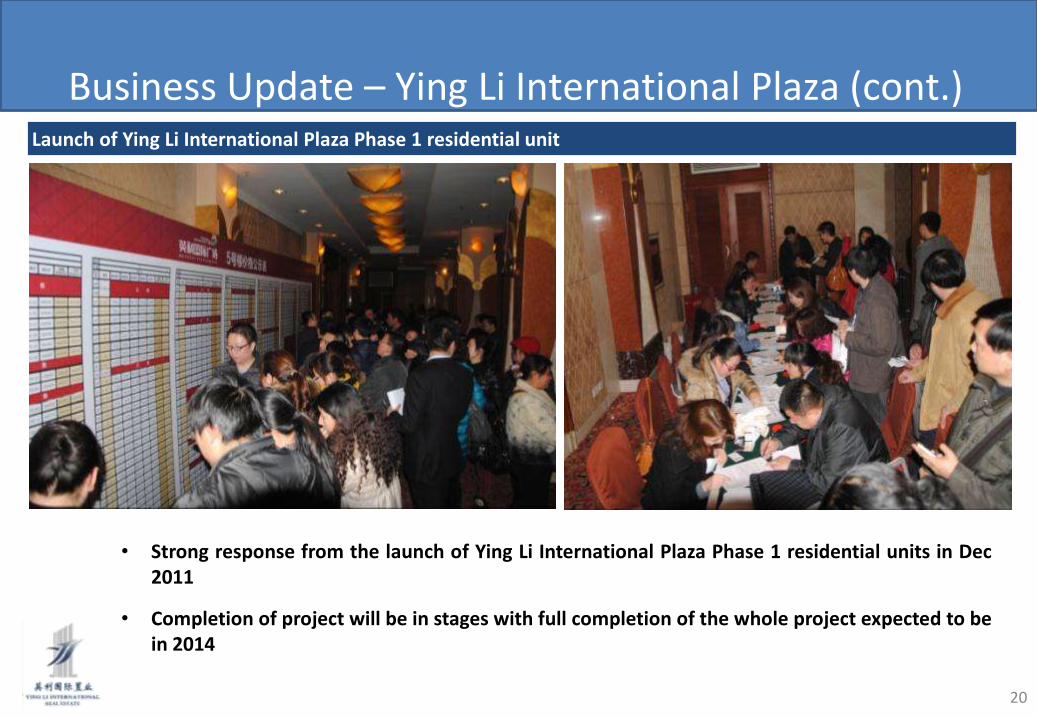
Business Update – Ying Li International Plaza (cont.) Launch of Ying Li International Plaza Phase 1 residential unit
• Strong response from the launch of Ying Li International Plaza Phase 1 residential units in Dec 2011
• Completion of project will be in stages with full completion of the whole project expected to be in 2014
20
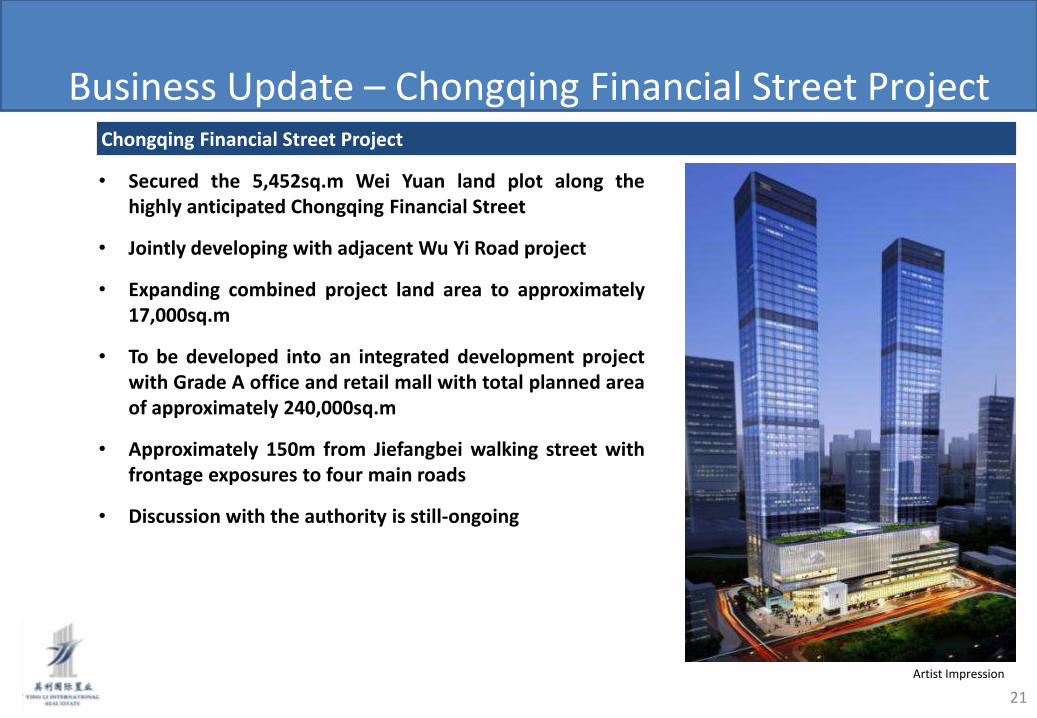
Business Update – Chongqing Financial Street Project Chongqing Financial Street Project
• Secured the 5,452sq.m Wei Yuan land plot along the highly anticipated Chongqing Financial Street
• Jointly developing with adjacent Wu Yi Road project
• Expanding combined project land area to approximately 17,000sq.m
• To be developed into an integrated development project with Grade A office and retail mall with total planned area of approximately 240,000sq.m
• Approximately 150m from Jiefangbei walking street with frontage exposures to four main roads
• Discussion with the authority is still-ongoing
Artist Impression
21
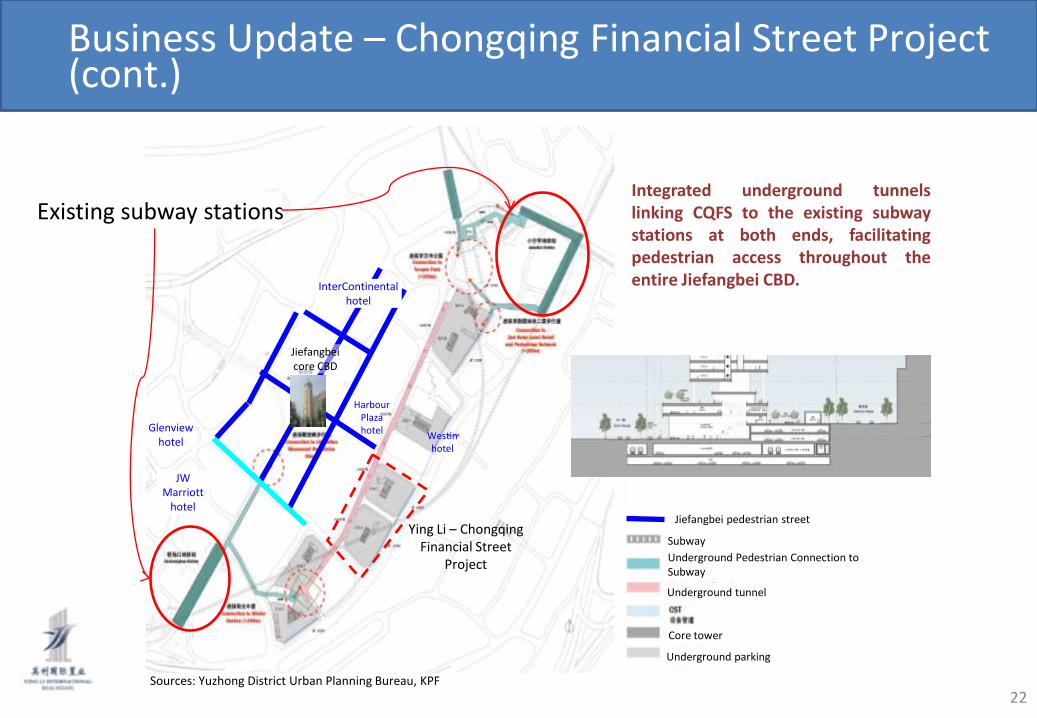
Business Update – Chongqing Financial Street Project (cont.)
Sources: Yuzhong District Urban Planning Bureau, KPF
Existing subway stations
Ying Li – Chongqing Financial Street
Project
JW Marriott
hotel
Glenview hotel
Westin hotel
Jiefangbei core CBD
Jiefangbei pedestrian street
Subway
Integrated underground tunnels linking CQFS to the existing subway stations at both ends, facilitating pedestrian access throughout the entire Jiefangbei CBD.
Underground tunnel
Underground parking
Underground Pedestrian Connection to Subway
Core tower
Harbour Plaza hotel
InterContinental hotel
22
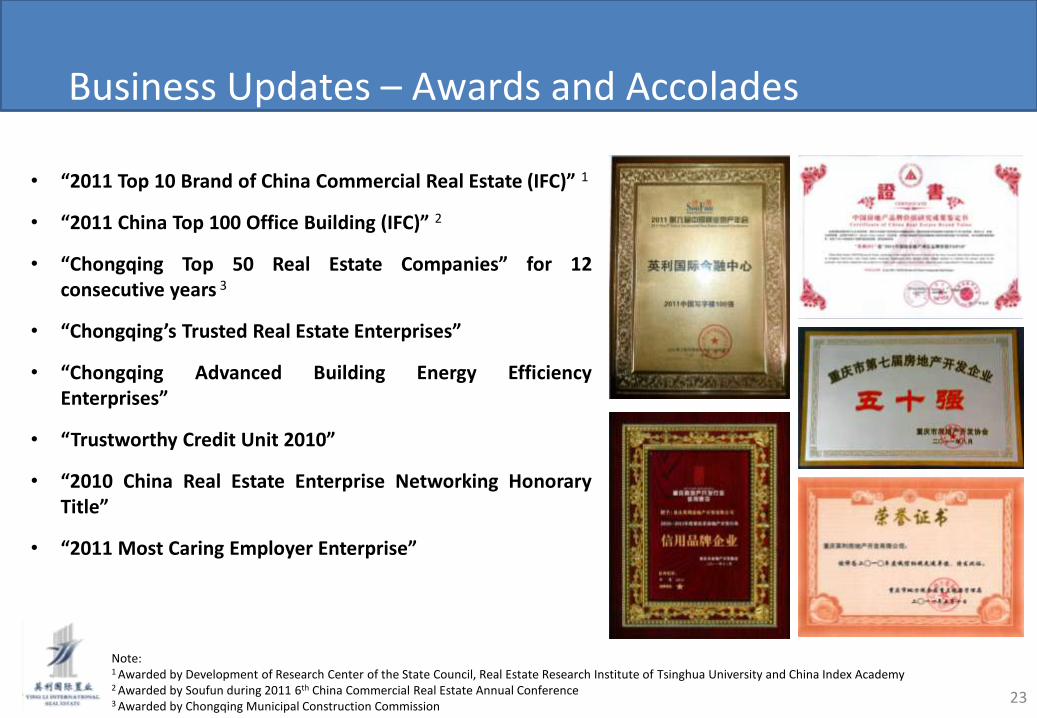
Business Updates – Awards and Accolades
• “2011 Top 10 Brand of China Commercial Real Estate (IFC)” 1
• “2011 China Top 100 Office Building (IFC)” 2
• “Chongqing Top 50 Real Estate Companies” for 12 consecutive years 3
• “Chongqing’s Trusted Real Estate Enterprises”
• “Chongqing Advanced Building Energy Efficiency Enterprises”
• “Trustworthy Credit Unit 2010”
• “2010 China Real Estate Enterprise Networking Honorary Title”
• “2011 Most Caring Employer Enterprise”
Note: 1 Awarded by Development of Research Center of the State Council, Real Estate Research Institute of Tsinghua University and China Index Academy
2 Awarded by Soufun during 2011 6th China Commercial Real Estate Annual Conference 3 Awarded by Chongqing Municipal Construction Commission
23
Please visit our website at www.yingligj.com for more information.
For further information, please contact:
Mr. Liew Kah Khong Head, Strategic Development & Investor Relations Tel : (65) 6334 9059 Email : [email protected]
Mr. Ronald Ng Manager, Investor Relations Tel : (65) 6334 9056 Email : [email protected]
Thank You
24
Appendix
25
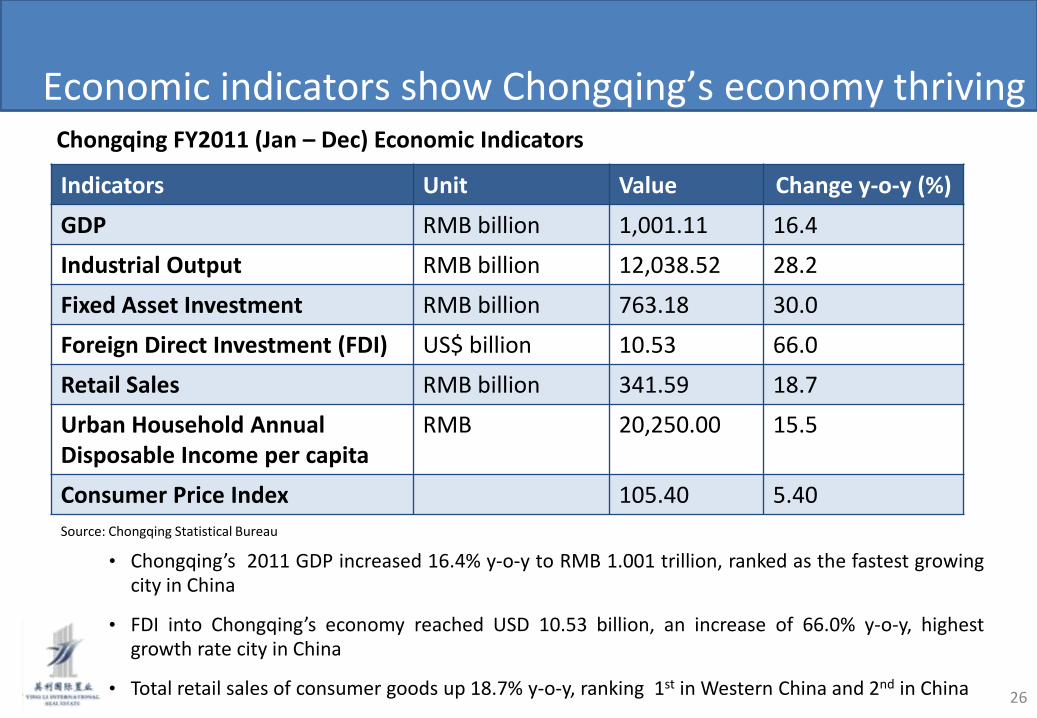
Economic indicators show Chongqing’s economy thriving
Indicators Unit Value Change y-o-y (%)
GDP RMB billion 1,001.11 16.4
Industrial Output RMB billion 12,038.52 28.2
Fixed Asset Investment RMB billion 763.18 30.0
Foreign Direct Investment (FDI) US$ billion 10.53 66.0
Retail Sales RMB billion 341.59 18.7
Urban Household Annual Disposable Income per capita
RMB 20,250.00 15.5
Consumer Price Index 105.40 5.40
Chongqing FY2011 (Jan – Dec) Economic Indicators
Source: Chongqing Statistical Bureau
• Chongqing’s 2011 GDP increased 16.4% y-o-y to RMB 1.001 trillion, ranked as the fastest growing city in China
• FDI into Chongqing’s economy reached USD 10.53 billion, an increase of 66.0% y-o-y, highest growth rate city in China
• Total retail sales of consumer goods up 18.7% y-o-y, ranking 1st in Western China and 2nd in China 26
Recommended