
2018 LOCAL CAPACITY TECHNICAL
ANALYSIS
FINAL REPORT AND STUDY RESULTS
May 1, 2017

1
Local Capacity Technical Study Overview and Results
I. Executive Summary This Report documents the results and recommendations of the 2018 Local
Capacity Technical (LCT) Study. The LCT Study assumptions, processes, and criteria
were discussed and recommended through the 2018 Local Capacity Technical Study
Criteria, Methodology and Assumptions Stakeholder Meeting held on October 31, 2016.
On balance, the assumptions, processes, and criteria used for the 2018 LCT Study mirror
those used in the 2007-2017 LCT Studies, which were previously discussed and
recommended through the LCT Study Advisory Group (“LSAG”)1, an advisory group
formed by the CAISO to assist the CAISO in its preparation for performing prior LCT
Studies.
The 2018 LCT study results are provided to the CPUC for consideration in its 2018
resource adequacy requirements program. These results will also be used by the CAISO
as “Local Capacity Requirements” or “LCR” (minimum quantity of local capacity
necessary to meet the LCR criteria) and for assisting in the allocation of costs of any
CAISO procurement of capacity needed to achieve the Reliability Standards
notwithstanding the resource adequacy procurement of Load Serving Entities (LSEs).2
The load forecast used in this study is based on the final adopted California Energy
Demand Updated Forecast, 2017-2027 developed by the CEC; namely the mid-demand
baseline with low additional achievable energy efficiency (AAEE), re-posted on
2/27/2017: http://www.energy.ca.gov/2016_energypolicy/documents/2016-12-
08_workshop/LSE-BA_Forecasts.php.
1 The LSAG consists of a representative cross-section of stakeholders, technically qualified to assess the issues related to the study assumptions, process and criteria of the existing LCT Study methodology and to recommend changes, where needed. 2 For information regarding the conditions under which the CAISO may engage in procurement of local capacity and the allocation of the costs of such procurement, please see Sections 41 and 43 of the current CAISO Tariff, at: http://www.caiso.com/238a/238acd24167f0.html.

2
Below is a comparison of the 2018 vs. 2017 total LCR: 2018 Local Capacity Requirements
Qualifying Capacity 2018 LCR Need Based on
Category B***
2018 LCR Need Based on Category C*** with operating
procedure
Local Area Name QF/
Muni (MW)
Market (MW)
Total (MW)
Existing Capacity Needed
Deficiency
Total (MW)
Existing Capacity Needed**
Deficiency
Total (MW)
Humboldt 14 196 210 121 0 121 169 0 169 North Coast / North Bay 118 751 869 634 0 634 634 0 634
Sierra 1176 949 2125 1215 0 1215 1826 287* 2113 Stockton 139 466 605 358 0 358 398 321* 719 Greater Bay 1008 6095 7103 3910 0 3910 5160 0 5160 Greater Fresno 364 3215 3579 1949 0 1949 2081 0 2081 Kern 15 551 566 0 0 0 453 0 453 LA Basin 1556 9179 10735 6873 0 6873 7525 0 7525 Big Creek/ Ventura 430 5227 5657 2023 0 2023 2321 0 2321
San Diego/ Imperial Valley 202 4713 4915 4032 0 4032 4032 0 4032
Total 5022 31342 36364 21115 0 21115 24599 608 25207 2017 Local Capacity Requirements
Qualifying Capacity 2017 LCR Need Based on
Category B***
2017 LCR Need Based on Category C*** with operating
procedure
Local Area Name QF/
Muni (MW)
Market (MW)
Total (MW)
Existing Capacity Needed
Deficiency
Total (MW)
Existing Capacity Needed**
Deficiency
Total (MW)
Humboldt 20 198 218 110 0 110 157 0 157 North Coast / North Bay 128 722 850 721 0 721 721 0 721
Sierra 1176 890 2066 1247 0 1247 1731 312* 2043 Stockton 149 449 598 340 0 340 402 343* 745 Greater Bay 1070 8792 9862 4260 232* 4492 5385 232* 5617 Greater Fresno 231 3072 3303 1760 0 1760 1760 19* 1779 Kern 60 491 551 137 0 137 492 0 492 LA Basin 1615 8960 10575 6873 0 6873 7368 0 7368 Big Creek/ Ventura 543 4920 5463 1841 0 1841 2057 0 2057
San Diego/ Imperial Valley 239 5071 5310 3570 0 3570 3570****
4635 0 3570**** 4635
Total 5231 33565 38796 20859 232 21091 23643 906 24549

3
* No local area is “overall deficient”. Resource deficiency values result from a few deficient sub-areas; and since there are no resources that can mitigate this deficiency the numbers are carried forward into the total area needs. Resource deficient sub-area implies that in order to comply with the criteria, at summer peak, load may be shed immediately after the first contingency. ** Since “deficiency” cannot be mitigated by any available resource, the “Existing Capacity Needed” will be split among LSEs on a load share ratio during the assignment of local area resource responsibility. ***TPL 002 Category B is generally equivalent to TPL 001-4 Category P1. TPL 003 Category C is generally equivalent to TPL 001-4 P2 through P7. Current LCR study report is compliant with existing language in the ISO Tariff section 40.3.1.1 Local Capacity Technical Study Criteria to be revised at a later date. ****In the 2017 LCR report, the San Diego-Imperial Valley study and the LA Basin-San Diego overall study had inconsistent assumptions regarding LA Basin resources, resulting in lower LCR value reported for the overall San Diego-Imperial Valley LCR area (3,570 MW). This value should have been reported as 4,635 MW based on the 2017 LCR requirements for the LA Basin and San Diego subarea.
Overall, the LCR needs have increased by about 660 MW or about 2.7% from
2017 to 2018. Based on the corrected 2017 LCR requirement for San Diego-Imperial
Valley, the LCR needs have actually decreased by about 400 MW or about 1.5%.
The LCR needs have decreased in the following areas: Kern due to downward
trend for load; North Coast/North Bay and Bay Area due to downward trend for load and
new transmission projects and Stockton due to new transmission project. The LCR
needs have increased in Sierra, Fresno and Big Creek/Ventura due to load increase;
Humboldt due to new limiting contingency; LA Basin due to change in assumptions
regarding Aliso Canyon.
San Diego/Imperial Valley technical requirements are going down since the
correct 2017 LCR need should have been 4635 MW (with Aliso Canyon). Last year the
San Diego-Imperial Valley study and the LA Basin-San Diego overall LCR studies had
inconsistent assumptions regarding LA Basin resources, it used Aliso Canyon restriction
for LA Basin-San Diego, however it did not used the same restriction in the San Diego-
Imperial Valley area study. The 2017 misalignment gives the appearance that the San
Diego-Imperial Valley needs are actually going up between the two years. Particular
attention should also be paid to the sensitivities discussed in section IV.C.10 beginning
on page 63.
The write-up for each Local Capacity Area lists important new projects included
in the base cases as well as a description of reason for changes between 2018 and
2017 LCRs.

4
Table of Contents
I. Executive Summary .............................................................................................................. 1
II. Study Overview: Inputs, Outputs and Options .................................................................. 5
A. Objectives ............................................................................................................................ 5 B. Key Study Assumptions ....................................................................................................... 5
1. Inputs and Methodology ................................................................................................. 5 C. Grid Reliability ................................................................................................................... 7 D. Application of N-1, N-1-1, and N-2 Criteria....................................................................... 8 E. Performance Criteria .......................................................................................................... 8 F. The Two Options Presented In This LCT Report .............................................................. 15
1. Option 1- Meet LCR Performance Criteria Category B ............................................... 15 2. Option 2- Meet LCR Performance Criteria Category C and Incorporate Suitable Operational Solutions ............................................................................................................ 16
III. Assumption Details: How the Study was Conducted ...................................................... 17
A. System Planning Criteria .................................................................................................. 17 1. Power Flow Assessment: .............................................................................................. 18 2. Post Transient Load Flow Assessment: ........................................................................ 19 3. Stability Assessment: .................................................................................................... 19
B. Load Forecast ................................................................................................................... 19 1. System Forecast ............................................................................................................ 19 2. Base Case Load Development Method ......................................................................... 20
C. Power Flow Program Used in the LCT analysis .............................................................. 21
IV. Local Capacity Requirement Study Results ..................................................................... 22
A. Summary of Study Results ................................................................................................. 22 B. Summary of Zonal Needs .................................................................................................. 24 C. Summary of Results by Local Area ................................................................................... 26
1. Humboldt Area.............................................................................................................. 26 2. North Coast / North Bay Area ...................................................................................... 28 3. Sierra Area .................................................................................................................... 31 4. Stockton Area................................................................................................................ 35 5. Greater Bay Area .......................................................................................................... 39 6. Greater Fresno Area ...................................................................................................... 45 7. Kern Area ...................................................................................................................... 49 8. LA Basin Area .............................................................................................................. 51 9. Big Creek/Ventura Area ............................................................................................... 60 10. San Diego-Imperial Valley Area .................................................................................. 63 11. Valley Electric Area ...................................................................................................... 74
V. Appendix A – List of physical resources by PTO, local area and market ID ............... 75
VI. Appendix B – Effectiveness factors for procurement guidance.................................... 128
5
II. Study Overview: Inputs, Outputs and Options
A. Objectives
As was the objective of the previous annual LCT Studies, the intent of the 2018
LCT Study is to identify specific areas within the CAISO Balancing Authority Area that
have limited import capability and determine the minimum generation capacity (MW)
necessary to mitigate the local reliability problems in those areas.
B. Key Study Assumptions
1. Inputs and Methodology
The CAISO incorporated into its 2018 LCT study the same criteria, input
assumptions and methodology that were incorporated into its previous years LCR studies.
These inputs, assumptions and methodology were discussed and agreed to by
stakeholders at the 2018 LCT Study Criteria, Methodology and Assumptions Stakeholder
Meeting held on October 31, 2016.
The following table sets forth a summary of the approved inputs and methodology
that have been used in the previous LCT studies as well as this 2018 LCT Study:

6
Summary Table of Inputs and Methodology Used in this LCT Study:
Issue: How are they incorporated into this LCT study:
Input Assumptions:
Transmission System Configuration
The existing transmission system has been modeled, including all projects operational on or before June 1, of the study year and all other feasible operational solutions brought forth by the PTOs and as agreed to by the CAISO.
Generation Modeled The existing generation resources has been modeled and also includes all projects that will be on-line and commercial on or before June 1, of the study year
Load Forecast Uses a 1-in-10 year summer peak load forecast
Methodology:
Maximize Import Capability Import capability into the load pocket has been maximized, thus minimizing the generation required in the load pocket to meet applicable reliability requirements.
QF/Nuclear/State/Federal Units Regulatory Must-take and similarly situated units like QF/Nuclear/State/Federal resources have been modeled on-line at qualifying capacity output values for purposes of this LCT Study.
Maintaining Path Flows Path flows have been maintained below all established path ratings into the load pockets, including the 500 kV. For clarification, given the existing transmission system configuration, the only 500 kV path that flows directly into a load pocket and will, therefore, be considered in this LCR Study is the South of Lugo transfer path flowing into the LA Basin.
Performance Criteria:
Performance Level B & C, including incorporation of PTO operational solutions
This LCT Study is being published based on Performance Level B and Performance Level C criterion, yielding the low and high range LCR scenarios. In addition, the CAISO will incorporate all new projects and other feasible and CAISO-approved operational solutions brought forth by the PTOs that can be operational on or before June 1, of the study year. Any such solutions that can reduce the need for procurement to meet the Performance Level C criteria will be incorporated into the LCT Study.
Load Pocket:
Fixed Boundary, including limited reference to published effectiveness factors
This LCT Study has been produced based on load pockets defined by a fixed boundary. The CAISO only publishes effectiveness factors where they are useful in facilitating procurement where excess capacity exists within a load pocket.
Further details regarding the 2018 LCT Study methodology and assumptions are
provided in Section III, below.

7
C. Grid Reliability
Service reliability builds from grid reliability because grid reliability is reflected in
the Reliability Standards of the North American Electric Reliability Council (NERC) and
the Western Electricity Coordinating Council (“WECC”) Regional Criteria (collectively
“Reliability Standards”). The Reliability Standards apply to the interconnected electric
system in the United States and are intended to address the reality that within an
integrated network, whatever one Balancing Authority Area does can affect the reliability
of other Balancing Authority Areas. Consistent with the mandatory nature of the
Reliability Standards, the CAISO is under a statutory obligation to ensure efficient use
and reliable operation of the transmission grid consistent with achievement of the
Reliability Standards.3 The CAISO is further under an obligation, pursuant to its FERC-
approved Transmission Control Agreement, to secure compliance with all “Applicable
Reliability Criteria.” Applicable Reliability Criteria consists of the Reliability Standards as
well as reliability criteria adopted by the CAISO (Grid Planning Standards).
The Reliability Standards define reliability on interconnected electric systems using
the terms “adequacy” and “security.” “Adequacy” is the ability of the electric systems to
supply the aggregate electrical demand and energy requirements of their customers at
all times, taking into account physical characteristics of the transmission system such as
transmission ratings and scheduled and reasonably expected unscheduled outages of
system elements. “Security” is the ability of the electric systems to withstand sudden
disturbances such as electric short circuits or unanticipated loss of system elements. The
Reliability Standards are organized by Performance Categories. Certain categories
require that the grid operator not only ensure that grid integrity is maintained under certain
adverse system conditions (e.g., security), but also that all customers continue to receive
electric supply to meet demand (e.g., adequacy). In that case, grid reliability and service
reliability would overlap. But there are other levels of performance where security can be
maintained without ensuring adequacy.
3 Pub. Utilities Code § 345

8
D. Application of N-1, N-1-1, and N-2 Criteria
The CAISO will maintain the system in a safe operating mode at all times. This
obligation translates into respecting the Reliability Criteria at all times, for example during
normal operating conditions Category A (N-0) the CAISO must protect for all single
contingencies Category B (N-1) and common mode Category C5 (N-2) double line
outages. Also, after a single contingency, the CAISO must re-adjust the system to
support the loss of the next most stringent contingency. This is referred to as the N-1-1
condition.
The N-1-1 vs N-2 terminology was introduced only as a mere temporal
differentiation between two existing NERC Category C events. N-1-1 represents NERC
Category C3 (“category B contingency, manual system adjustment, followed by another
category B contingency”). The N-2 represents NERC Category C5 (“any two circuits of a
multiple circuit tower line”) as well as requirement R1.1 of the WECC Regional Criteria3
(“two adjacent circuits”) with no manual system adjustment between the two
contingencies.
E. Performance Criteria
As set forth on the Summary Table of Inputs and Methodology, this LCT Report is
based on NERC performance level B and performance level C standard. The NERC
Standards refer mainly to system being stable and both thermal and voltage limits be
within applicable ratings. However, the CAISO also tests the electric system in regards
to the dynamic and reactive margin compliance with the existing WECC regional criteria
that further specifies the dynamic and reactive margin requirements for the same NERC
performance levels. These performance levels can be described as follows:
a. LCR Performance Criteria- Category B
Category B describes the system performance that is expected immediately
following the loss of a single transmission element, such as a transmission circuit, a

9
generator, or a transformer.
Category B system performance requires that system is stable and all thermal and
voltage limits must be within their “Applicable Rating,” which, in this case, are the
emergency ratings as generally determined by the PTO or facility owner. Applicable
Rating includes a temporal element such that emergency ratings can only be maintained
for certain duration. Under this category, load cannot be shed in order to assure the
Applicable Ratings are met; however there is no guarantee that facilities are returned to
within normal ratings or to a state where it is safe to continue to operate the system in a
reliable manner such that the next element out will not cause a violation of the Applicable
Ratings.
b. LCR Performance Criteria- Category C
The Reliability Standards require system operators to “look forward” to make sure
they safely prepare for the “next” N-1 following the loss of the “first” N-1 (stay within
Applicable Ratings after the “next” N-1). This is commonly referred to as N-1-1. Because
it is assumed that some time exists between the “first” and “next” element losses,
operating personnel may make any reasonable and feasible adjustments to the system
to prepare for the loss of the second element, including, operating procedures,
dispatching generation, moving load from one substation to another to reduce equipment
loading, dispatching operating personnel to specific station locations to manually adjust
load from the substation site, or installing a “Special Protection Scheme” that would
remove pre-identified load from service upon the loss of the “next “ element.4 All Category
4 A Special Protection Scheme is typically proposed as an operational solution that does not require
additional generation and permits operators to effectively prepare for the next event as well as ensure
security should the next event occur. However, these systems have their own risks, which limit the extent
to which they could be deployed as a solution for grid reliability augmentation. While they provide the value
of protecting against the next event without the need for pre-contingency load shedding, they add points of
potential failure to the transmission network. This increases the potential for load interruptions because
10
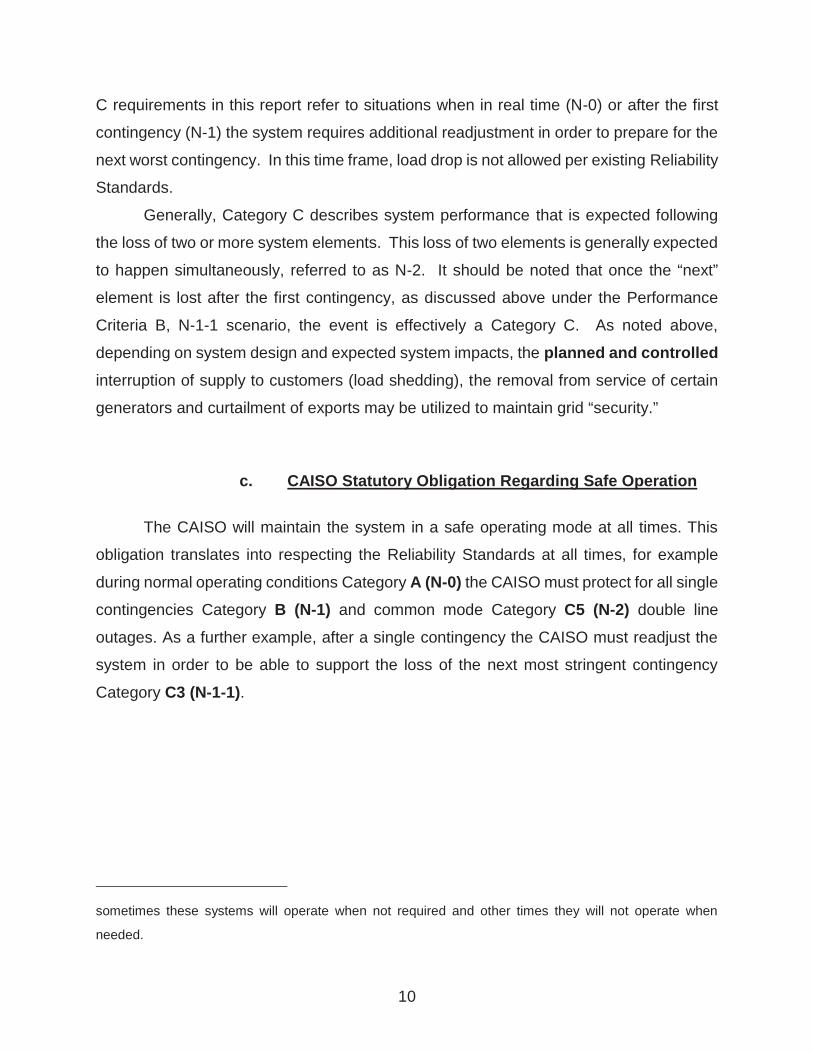
C requirements in this report refer to situations when in real time (N-0) or after the first
contingency (N-1) the system requires additional readjustment in order to prepare for the
next worst contingency. In this time frame, load drop is not allowed per existing Reliability
Standards.
Generally, Category C describes system performance that is expected following
the loss of two or more system elements. This loss of two elements is generally expected
to happen simultaneously, referred to as N-2. It should be noted that once the “next”
element is lost after the first contingency, as discussed above under the Performance
Criteria B, N-1-1 scenario, the event is effectively a Category C. As noted above,
depending on system design and expected system impacts, the planned and controlled
interruption of supply to customers (load shedding), the removal from service of certain
generators and curtailment of exports may be utilized to maintain grid “security.”
c. CAISO Statutory Obligation Regarding Safe Operation
The CAISO will maintain the system in a safe operating mode at all times. This
obligation translates into respecting the Reliability Standards at all times, for example
during normal operating conditions Category A (N-0) the CAISO must protect for all single
contingencies Category B (N-1) and common mode Category C5 (N-2) double line
outages. As a further example, after a single contingency the CAISO must readjust the
system in order to be able to support the loss of the next most stringent contingency
Category C3 (N-1-1).
sometimes these systems will operate when not required and other times they will not operate when
needed.

11
Figure 1: Temporal graph of LCR Category B vs. LCR Category C:
The following definitions guide the CAISO’s interpretation of the Reliability Standards
governing safe mode operation and are used in this LCT Study:
Applicable Rating: This represents the equipment rating that will be used under certain contingency
conditions.
Normal rating is to be used under normal conditions.
Long-term emergency ratings, if available, will be used in all emergency conditions as
long as “system readjustment” is provided in the amount of time given (specific to each
element) to reduce the flow to within the normal ratings. If not available normal rating is
to be used.
Short-term emergency ratings, if available, can be used as long as “system readjustment”
First N-1occurs
LoadingWithin A/R(normal)
LoadingWithin A/R(emergency)
---------------------Example (30 min)--------------
Manual adjust per NERCC3 in order to support theLoss of the next element.
“LCR Category B”
Secondtrip
occurs
A (N-0) C3 (N-1-1)B (N-1)
Planned andControlled Load SheddingAllowed
LoadingWithin A/R(emergency)
“LCR Category C”
Load Shedding Not Allowed
C5 (N-2)A (N-0)LoadingWithin A/R(emergency)
Loading within A/R (normal) as well as making sure the system can support the loss of the most stringent next single element or credible double and be within post-contingency A/R (emergency).

12
is provided in the “short-time” available in order to reduce the flow to within the long-term
emergency ratings where the element can be kept for another length of time (specific to
each element) before the flow needs to be reduced the below the normal ratings. If not
available long-term emergency rating should be used.
Temperature-adjusted ratings shall not be used because this is a year-ahead study not a
real-time tool, as such the worst-case scenario must be covered. In case temperature-
adjusted ratings are the only ratings available then the minimum rating (highest
temperature) given the study conditions shall be used.
CAISO Transmission Register is the only official keeper of all existing ratings mentioned
above.
Ratings for future projects provided by PTO and agree upon by the CAISO shall be used.
Other short-term ratings not included in the CAISO Transmission Register may be used
as long as they are engineered, studied and enforced through clear operating procedures
that can be followed by real-time operators.
Path Ratings need to be maintained within their limits in order to assure that proper
capacity is available in order to operate the system in real-time in a safe operating zone.
Controlled load drop:
This is achieved with the use of a Special Protection Scheme.
Planned load drop:
This is achieved when the most limiting equipment has short-term emergency
ratings AND the operators have an operating procedure that clearly describes the actions
that need to be taken in order to shed load.
Special Protection Scheme:
All known SPS shall be assumed. New SPS must be verified and approved by the
CAISO and must comply with the new SPS guideline described in the CAISO Planning
Standards.
System Readjustment: This represents the actions taken by operators in order to bring the system within

13
a safe operating zone after any given contingency in the system.
Actions that can be taken as system readjustment after a single contingency (Category
B):
1. System configuration change – based on validated and approved operating
procedures
2. Generation re-dispatch
a. Decrease generation (up to 1150 MW) – limit given by single contingency
SPS as part of the CAISO Grid Planning standards (ISO G4)
b. Increase generation – this generation will become part of the LCR need
Actions, which shall not be taken as system readjustment after a single contingency
(Category B):
1. Load drop – based on the intent of the CAISO/WECC and NERC standards for
category B contingencies.
The NERC Transmission Planning Standards footnote mentions that load shedding
can be done after a category B event in certain local areas in order to maintain compliance
with performance criteria. However, the main body of the criteria spells out that no
dropping of load should be done following a single contingency. All stakeholders and the
CAISO agree that no involuntary interruption of load should be done immediately after a
single contingency. Further, the CAISO and stakeholders now agree on the viability of
dropping load as part of the system readjustment period – in order to protect for the next
most limiting contingency. After a single contingency, it is understood that the system is
in a Category B condition and the system should be planned based on the body of the
criteria with no shedding of load regardless of whether it is done immediately or in 15-30
minute after the original contingency. Category C conditions only arrive after the second
contingency has happened; at that point in time, shedding load is allowed in a planned
and controlled manner.
A robust California transmission system should be, and under the LCT Study is being,

14
planned based on the main body of the criteria, not the footnote regarding Category B
contingencies. Therefore, if there are available resources in the area, they are looked to
meet reliability needs (and included in the LCR requirement) before resorting to
involuntary load curtailment. The footnote may be applied for criteria compliance issues
only where there are no resources available in the area.
Time allowed for manual readjustment:
Tariff Section 40.3.1.1, requires the CAISO, in performing the Local Capacity
Technical Study, to apply the following reliability criterion:
Time Allowed for Manual Adjustment: This is the amount of time required for the
Operator to take all actions necessary to prepare the system for the next Contingency.
The time should not be more than thirty (30) minutes.
The CAISO Planning Standards also impose this manual readjustment
requirement. As a parameter of the Local Capacity Technical Study, the CAISO must
assume that as the system operator the CAISO will have sufficient time to:
(1) make an informed assessment of system conditions after a contingency has
occurred;
(2) identify available resources and make prudent decisions about the most
effective system redispatch;
(3) manually readjust the system within safe operating limits after a first
contingency to be prepared for the next contingency; and
(4) allow sufficient time for resources to ramp and respond according to the
operator’s redispatch instructions. This all must be accomplished within 30 minutes.
Local capacity resources can meet this requirement by either (1) responding with
sufficient speed, allowing the operator the necessary time to assess and redispatch
resources to effectively reposition the system within 30 minutes after the first contingency,
or (2) have sufficient energy available for frequent dispatch on a pre-contingency basis to
ensure the operator can meet minimum online commitment constraints or reposition the

15
system within 30 minutes after the first contingency occurs. Accordingly, when evaluating
resources that satisfy the requirements of the CAISO Local Capacity Technical Study, the
CAISO assumes that local capacity resources need to be available in no longer than 20
minutes so the CAISO and demand response providers have a reasonable opportunity to
perform their respective and necessary tasks and enable the CAISO to reposition the
system within the 30 minutes in accordance with applicable reliability criteria.
F. The Two Options Presented In This LCT Report
This LCT Study sets forth different solution “options” with varying ranges of
potential service reliability consistent with CAISO’s Planning Standard. The CAISO
applies Option 2 for its purposes of identifying necessary local capacity needs and the
corresponding potential scope of its backstop authority. Nevertheless, the CAISO
continues to provide Option 1 as a point of reference for the CPUC and Local Regulatory
Authorities in considering procurement targets for their jurisdictional LSEs.
1. Option 1- Meet LCR Performance Criteria Category B
Option 1 is a service reliability level that reflects generation capacity that must be
available to comply with reliability standards immediately after a NERC Category B given
that load cannot be removed to meet this performance standard under Reliability Criteria.
However, this capacity amount implicitly relies on load interruption as the only means of
meeting any Reliability Standard that is beyond the loss of a single transmission element
(N-1). These situations will likely require substantial load interruptions in order to maintain
system continuity and alleviate equipment overloads prior to the actual occurrence of the
second contingency.5
5 This potential for pre-contingency load shedding also occurs because real time operators must prepare
for the loss of a common mode N-2 at all times.

16
2. Option 2- Meet LCR Performance Criteria Category C and Incorporate Suitable Operational Solutions
Option 2 is a service reliability level that reflects generation capacity that is needed
to readjust the system to prepare for the loss of a second transmission element (N-1-1)
using generation capacity after considering all reasonable and feasible operating
solutions (including those involving customer load interruption) developed and approved
by the CAISO, in consultation with the PTOs. Under this option, there is no expected load
interruption to end-use customers under normal or single contingency conditions as the
CAISO operators prepare for the second contingency. However, the customer load may
be interrupted in the event the second contingency occurs.
As noted, Option 2 is the local capacity level that the CAISO requires to reliably
operate the grid per NERC, WECC and CAISO standards. As such, the CAISO
recommends adoption of this Option to guide resource adequacy procurement.

17
III. Assumption Details: How the Study was Conducted
A. System Planning Criteria
The following table provides a comparison of system planning criteria, based on
the performance requirements of the NERC Reliability Standard, used in the study:
Table 4: Criteria Comparison
Contingency Component(s) ISO Grid Planning Standard
Old RMR Criteria
Local Capacity Criteria
A – No Contingencies X X X
B – Loss of a single element 1. Generator (G-1) 2. Transmission Circuit (L-1) 3. Transformer (T-1) 4. Single Pole (dc) Line 5. G-1 system readjusted L-1
X X X X X
X X X2 X X
X1 X1
X1,2 X1 X
C – Loss of two or more elements 1. Bus Section 2. Breaker (failure or internal fault) 3. L-1 system readjusted G-1 3. G-1 system readjusted T-1 or T-1 system readjusted G-1 3. L-1 system readjusted T-1 or T-1 system readjusted L-1 3. G-1 system readjusted G-1 3. L-1 system readjusted L-1 3. T-1 system readjusted T-1 4. Bipolar (dc) Line 5. Two circuits (Common Mode or Adjacent Circuit) L-2 6. SLG fault (stuck breaker or protection failure) for G-1 7. SLG fault (stuck breaker or protection failure) for L-1 8. SLG fault (stuck breaker or protection failure) for T-1 9. SLG fault (stuck breaker or protection failure) for Bus section WECC-R1.2. Two generators (Common Mode) G-2
X X X X X X X X X X X X X X X3
X X X X X
X X
X D – Extreme event – loss of two or more elements Any B1-4 system readjusted (Common Mode or Adjacent Circuit) L-2 All other extreme combinations D1-14.
X4
X4
X3
1 System must be able to readjust to a safe operating zone in order to be able to support the loss of the next contingency. 2 A thermal or voltage criterion violation resulting from a transformer outage may not be cause for a local area reliability requirement if the violation is considered marginal (e.g. acceptable loss of facility life or low voltage), otherwise, such a violation will necessitate creation of a requirement. 3 Evaluate for risks and consequence, per NERC standards. No voltage collapse or dynamic instability allowed. 4 Evaluate for risks and consequence, per NERC standards.

18
A significant number of simulations were run to determine the most critical
contingencies within each Local Capacity Area. Using power flow, post-transient load
flow, and stability assessment tools, the system performance results of all the
contingencies that were studied were measured against the system performance
requirements defined by the criteria shown in Table 4. Where the specific system
performance requirements were not met, generation was adjusted such that the minimum
amount of generation required to meet the criteria was determined in the Local Capacity
Area. The following describes how the criteria were tested for the specific type of analysis
performed.
1. Power Flow Assessment:
Contingencies Thermal Criteria3 Voltage Criteria4 Generating unit 1, 6 Applicable Rating Applicable Rating Transmission line 1, 6 Applicable Rating Applicable Rating Transformer 1, 6 Applicable Rating5 Applicable Rating5 (G-1)(L-1) 2, 6 Applicable Rating Applicable Rating Overlapping 6, 7 Applicable Rating Applicable Rating
1 All single contingency outages (i.e. generating unit, transmission line or transformer) will be simulated on Participating Transmission Owners’ local area systems.
2 Key generating unit out, system readjusted, followed by a line outage. This over-lapping outage is considered a single contingency within the ISO Grid Planning Criteria. Therefore, load dropping for an overlapping G-1, L-1 scenario is not permitted.
3 Applicable Rating – Based on ISO Transmission Register or facility upgrade plans including established Path ratings.
4 Applicable Rating – ISO Grid Planning Criteria or facility owner criteria as appropriate including established Path ratings.
5 A thermal or voltage criterion violation resulting from a transformer outage may not be cause for a local area reliability requirement if the violation is considered marginal (e.g. acceptable loss of facility life or low voltage), otherwise, such a violation will necessitate creation of a requirement.
6 Following the first contingency (N-1), the generation must be sufficient to allow the operators to bring the system back to within acceptable (normal) operating range (voltage and loading) and/or appropriate OTC following the studied outage conditions.
7 During normal operation or following the first contingency (N-1), the generation

19
must be sufficient to allow the operators to prepare for the next worst N-1 or common mode N-2 without pre-contingency interruptible or firm load shedding. SPS/RAS/Safety Nets may be utilized to satisfy the criteria after the second N-1 or common mode N-2 except if the problem is of a thermal nature such that short-term ratings could be utilized to provide the operators time to shed either interruptible or firm load. T-2s (two transformer bank outages) would be excluded from the criteria.
2. Post Transient Load Flow Assessment:
Contingencies Reactive Margin Criteria 2 Selected 1 Applicable Rating
1 If power flow results indicate significant low voltages for a given power flow contingency, simulate that outage using the post transient load flow program. The post-transient assessment will develop appropriate Q/V and/or P/V curves.
2 Applicable Rating – positive margin based on the higher of imports or load increase by 5% for N-1 contingencies, and 2.5% for N-2 contingencies.
3. Stability Assessment:
Contingencies Stability Criteria 2 Selected 1 Applicable Rating
1 Base on historical information, engineering judgment and/or if power flow or post transient study results indicate significant low voltages or marginal reactive margin for a given contingency.
2 Applicable Rating – ISO Grid Planning Criteria or facility owner criteria as appropriate.
B. Load Forecast
1. System Forecast
The California Energy Commission (CEC) derives the load forecast at the system
and Participating Transmission Owner (PTO) levels. This relevant CEC forecast is then
distributed across the entire system, down to the local area, division and substation level.
The PTOs use an econometric equation to forecast the system load. The predominant
parameters affecting the system load are (1) number of households, (2) economic activity

20
(gross metropolitan products, GMP), (3) temperature and (4) increased energy efficiency
and distributed generation programs.
2. Base Case Load Development Method
The method used to develop the loads in the base case is a melding process that
extracts, adjusts and modifies the information from the system, distribution and municipal
utility forecasts. The melding process consists of two parts: Part 1 deals with the PTO
load and Part 2 deals with the municipal utility load. There may be small differences
between the methodologies used by each PTO to disaggregate the CEC load forecast to
their level of local area as well as bar-bus model.
a. PTO Loads in Base Case
The methods used to determine the PTO loads are, for the most part, similar. One
part of the method deals with the determination of the division6 loads that would meet the
requirements of 1-in-5 or 1-in-10 system or area base cases and the other part deals with
the allocation of the division load to the transmission buses.
i. Determination of division loads
The annual division load is determined by summing the previous year division load
and the current division load growth. Thus, the key steps are the determination of the
initial year division load and the annual load growth. The initial year for the base case
development method is based heavily on recorded data. The division load growth in the
system base case is determined in two steps. First, the total PTO load growth for the year
is determined, as the product of the PTO load and the load growth rate from the system
load forecast. Then this total PTO load growth is allocated to the division, based on the
relative magnitude of the load growth projected for the divisions by the distribution
planners. For example, for the 1-in-10 area base case, the division load growth
determined for the system base case is adjusted to the 1-in-10 temperature using the
load temperature relation determined from the latest peak load and temperature data of
6 Each PTO divides its territory in a number of smaller area named divisions. These are usually smaller and compact areas that have the same temperature profile.

21
the division.
ii. Allocation of division load to transmission bus level
Since the base case loads are modeled at the various transmission buses, the
division loads developed must be allocated to those buses. The allocation process is
different depending on the load types. For the most part, each PTO classifies its loads
into four types: conforming, non-conforming, self-generation and generation-plant loads.
Since the non-conforming and self-generation loads are assumed to not vary with
temperature, their magnitude would be the same in the system or area base cases of the
same year. The remaining load (the total division load developed above, less the quantity
of non-conforming and self-generation load) is the conforming load. The remaining load
is allocated to the transmission buses based on the relative magnitude of the distribution
forecast. The summation of all loads in the base case is generally higher than the load
forecast because some load, i.e., self-generation and generation-plant, are behind the
meter and must be modeled in the base cases. However, for the most part, metered or
aggregated data with telemetry is used to come up with the load forecast.
b. Municipal Loads in Base Case The municipal utility forecasts that have been provided to the CEC and PTOs for the
purposes of their base cases were also used for this study.
C. Power Flow Program Used in the LCT analysis
The technical studies were conducted using General Electric’s Power System
Load Flow (GE PSLF) program version 19.0 and PowerGem’s Transmission Adequacy
and Reliability Assessment (TARA) program version 870. This GE PSLF program is
available directly from GE or through the Western System Electricity Council (WECC) to
any member and TARA program is commercially available.
To evaluate Local Capacity Areas, the starting base case was adjusted to reflect
the latest generation and transmission projects as well as the one-in-ten-year peak load
forecast for each Local Capacity Area as provided to the CAISO by the PTOs.
Electronic contingency files provided by the PTOs were utilized to perform the
22
numerous contingencies required to identify the LCR. These contingency files include
remedial action and special protection schemes that are expected to be in operation
during the year of study. An CAISO created EPCL (a GE programming language
contained within the GE PSLF package) routine and/or TARA software were used to run
the combination of contingencies; however, other routines are available from WECC with
the GE PSFL package or can be developed by third parties to identify the most limiting
combination of contingencies requiring the highest amount of generation within the local
area to maintain power flows within applicable ratings.
IV. Local Capacity Requirement Study Results
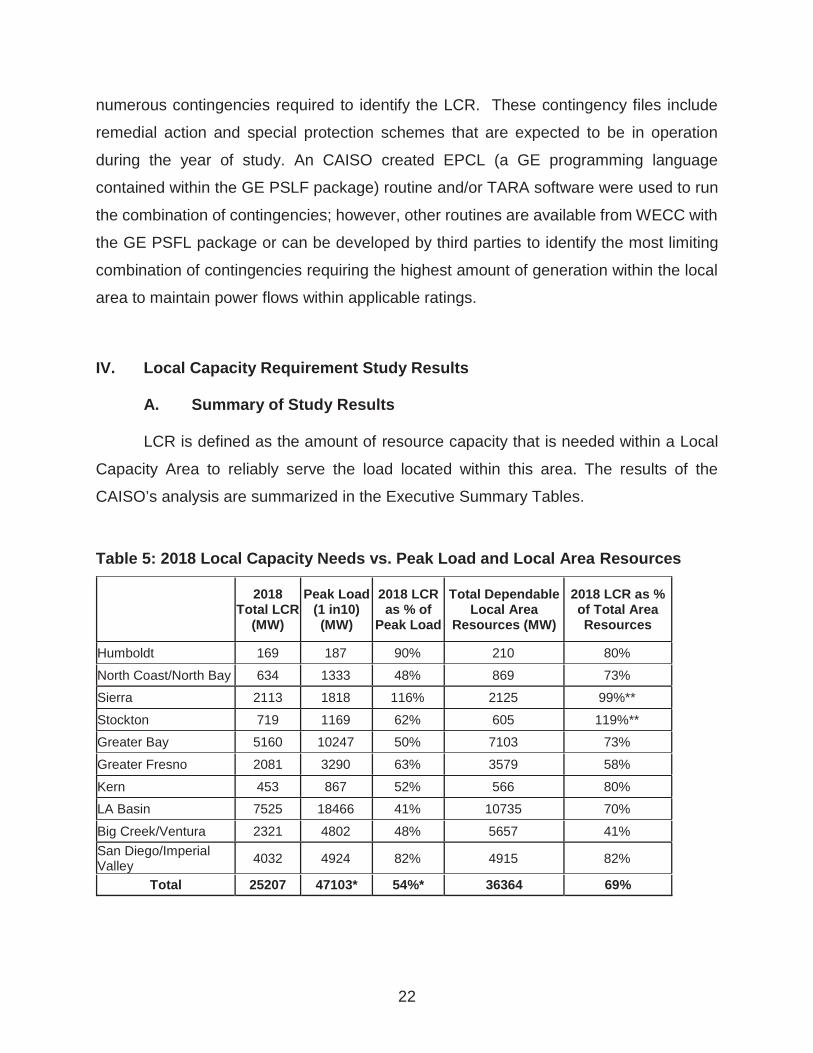
A. Summary of Study Results
LCR is defined as the amount of resource capacity that is needed within a Local
Capacity Area to reliably serve the load located within this area. The results of the
CAISO’s analysis are summarized in the Executive Summary Tables.
Table 5: 2018 Local Capacity Needs vs. Peak Load and Local Area Resources
2018 Total LCR
(MW)
Peak Load (1 in10) (MW)
2018 LCR as % of
Peak Load
Total Dependable Local Area
Resources (MW)
2018 LCR as % of Total Area Resources
Humboldt 169 187 90% 210 80%
North Coast/North Bay 634 1333 48% 869 73%
Sierra 2113 1818 116% 2125 99%**
Stockton 719 1169 62% 605 119%**
Greater Bay 5160 10247 50% 7103 73%
Greater Fresno 2081 3290 63% 3579 58%
Kern 453 867 52% 566 80%
LA Basin 7525 18466 41% 10735 70%
Big Creek/Ventura 2321 4802 48% 5657 41% San Diego/Imperial Valley 4032 4924 82% 4915 82%
Total 25207 47103* 54%* 36364 69%

23
Table 6: 2017 Local Capacity Needs vs. Peak Load and Local Area Resources
2017 Total LCR
(MW)
Peak Load (1 in10) (MW)
2017 LCR as % of
Peak Load
Total Dependable Local Area
Resources (MW)
2017 LCR as % of Total Area Resources
Humboldt 157 188 84% 218 72%
North Coast/North Bay 721 1311 55% 850 85%
Sierra 2043 1757 116% 2066 99%**
Stockton 745 1157 64% 598 125%**
Greater Bay 5617 10477 54% 9862 57%**
Greater Fresno 1779 2964 60% 3303 54%**
Kern 492 1139 43% 551 89%
LA Basin 7368 18890 39% 10575 70%
Big Creek/Ventura 2057 4719 44% 5463 38% San Diego/Imperial Valley 3570 4840 74% 5310 67%
Total 24549 47442* 52%* 38796 63% * Value shown only illustrative, since each local area peaks at a time different from the system coincident peak load. ** Resource deficient LCA (or with sub-area that is deficient) – deficiency included in LCR. Resource deficient area implies that in order to comply with the criteria, at summer peak, load may be shed immediately after the first contingency.
Tables 5 and 6 shows how much of the Local Capacity Area load is dependent on
local resources and how many local resources must be available in order to serve the
load in those Local Capacity Areas in a manner consistent with the Reliability Criteria.
These tables also indicate where new transmission projects, new resource additions or
demand side management programs would be most useful in order to reduce the
dependency on existing, generally older and less efficient local area resources.
The term “Qualifying Capacity” used in this report is the latest “Net Qualifying
Capacity” (“NQC”) posted on the CAISO web site at:
http://www.caiso.com/planning/Pages/ReliabilityRequirements/Default.aspx The NQC
list includes the area (if applicable) where each resource is located for units already
operational. Neither the NQC list nor this report incorporates Demand Side Management
programs and their related NQC. Resources scheduled to become operational before
6/1/2018 have been included in this 2018 LCR Report and added to the total NQC values
for those respective areas (see detail write-up for each area).
24
The first column, “Qualifying Capacity,” reflects two sets of resources. The first set
is comprised of resources that would normally be expected to be on-line such as
Municipal and Regulatory Must-take resources (state, federal, QFs, wind and nuclear
units). The second set is “market” resources and it also includes net-seller and solar
resources. The second column, “2018 LCR Requirement Based on Category B” identifies
the local capacity requirements, and deficiencies that must be addressed, in order to
achieve a service reliability level based on Performance Criteria-Category B. The third
column, “2018 LCR Requirement Based on Category C with Operating Procedure”, sets
forth the local capacity requirements, and deficiencies that must be addressed, necessary
to attain a service reliability level based on Performance Criteria-Category C with
operational solutions.
B. Summary of Zonal Needs
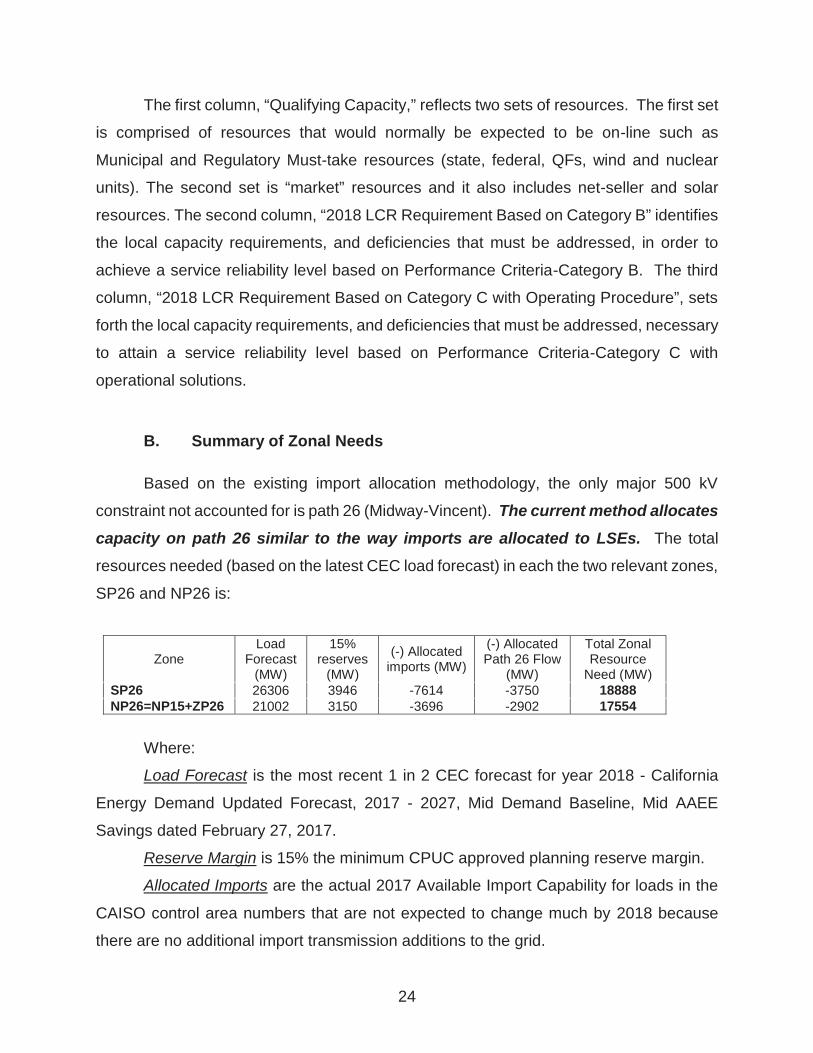
Based on the existing import allocation methodology, the only major 500 kV
constraint not accounted for is path 26 (Midway-Vincent). The current method allocates capacity on path 26 similar to the way imports are allocated to LSEs. The total
resources needed (based on the latest CEC load forecast) in each the two relevant zones,
SP26 and NP26 is:
Zone Load
Forecast (MW)
15% reserves
(MW)
(-) Allocated imports (MW)
(-) Allocated Path 26 Flow
(MW)
Total Zonal Resource
Need (MW) SP26 26306 3946 -7614 -3750 18888 NP26=NP15+ZP26 21002 3150 -3696 -2902 17554
Where:
Load Forecast is the most recent 1 in 2 CEC forecast for year 2018 - California
Energy Demand Updated Forecast, 2017 - 2027, Mid Demand Baseline, Mid AAEE
Savings dated February 27, 2017.
Reserve Margin is 15% the minimum CPUC approved planning reserve margin.
Allocated Imports are the actual 2017 Available Import Capability for loads in the
CAISO control area numbers that are not expected to change much by 2018 because
there are no additional import transmission additions to the grid.

25
Allocated Path 26 flow The CAISO determines the amount of Path 26 transfer
capacity available for RA counting purposes after accounting for (1) Existing
Transmission Contracts (ETCs) that serve load outside the CAISO Balancing Area7 and
(2) loop flow8 from the maximum path 26 rating of 4000 MW (North-to-South) and 3000
MW (South-to-North).
Both NP 26 and SP 26 load forecast, import allocation and zonal results refer to
the CAISO Balancing Area only. This is done in order to be consistent with the import
allocation methodology.
All resources that are counted as part of the Local Area Capacity Requirements
fully count toward the Zonal Need. The local areas of San Diego, LA Basin and Big
Creek/Ventura are all situated in SP26 and the remaining local areas are in NP26.
Changes compared to last year’s results:
The load forecast went down in Southern California by about 960 MW and up in
Northern California by about 300 MW.
The Import Allocations went up in Southern California by about 200 MW and down
in Northern California by about 550 MW.
The Path 26 transfer capability has not changed and is not envisioned to change
in the near future. As such, the LSEs should assume that their load/share ratio
allocation for path 26 will stay at the same levels as 2017. If there are any changes,
they will be heavily influenced by the pre-existing “grandfathered contracts” and
when they expire most of the LSEs will likely see their load share ratio going up,
while the owners of these grandfathered contracts may see their share decreased
to the load-share ratio.
7 The transfer capability on Path 26 must be de-rated to accommodate ETCs on Path 26 that are used to serve load outside of the CAISO Balancing Area. These particular ETCs represent physical transmission capacity that cannot be allocated to LSEs within the CAISO Balancing Area. 8 “Loop flow” is a phenomenon common to large electric power systems like the Western Electricity Coordinating Council. Power is scheduled to flow point-to-point on a Day-ahead and Hour-ahead basis through the CAISO. However, electric grid physics prevails and the actual power flow in real-time will differ from the pre-arranged scheduled flows. Loop flow is real, physical energy and it uses part of the available transfer capability on a path. If not accommodated, loop flow will cause overloading of lines, which can jeopardize the security and reliability of the grid.

26
C. Summary of Results by Local Area
Each Local Capacity Area’s overall requirement is determined by also achieving
each sub-area requirement. Because these areas are a part of the interconnected
electric system, the total for each Local Capacity Area is not simply a summation of the
sub-area needs. For example, some sub-areas may overlap and therefore the same
units may count for meeting the needs in both sub-areas.
1. Humboldt Area Area Definition: The transmission tie lines into the area include:
1) Bridgeville-Cottonwood 115 kV line #1 2) Humboldt-Trinity 115 kV line #1 3) Willits-Garberville 60 kV line #1 4) Trinity-Maple Creek 60 kV line #1
The substations that delineate the Humboldt Area are:
1) Bridgeville and Low Gap are in, Cottonwood and First Glen are out 2) Humboldt is in, Trinity is out 3) Willits and Lytonville are out, Kekawaka and Garberville are in 4) Trinity is out, Ridge Cabin and Maple Creek are in
Load: Total 2018 busload within the defined area: 184 MW with -8 MW of AAEE and 11 MW of
losses resulting in total load + losses of 187 MW.
List of physical units: See Appendix A.
Major new projects modeled: 1. Humboldt 115/60 kV #1 and #2 transformer replacement
2. Bridgeville 115/60 kV #1 transformer replacement
3. Garberville Reactive Support
27
Critical Contingency Analysis Summary: Humboldt Overall: The most critical contingency for the Humboldt area is the outage of the Bridgeville-
Cottonwood 115 kV line overlapping with an outage of the Humboldt – Humboldt Bay
115 kV line. The area limitation is the overload on the Trinity – Humboldt 115 kV line.
This contingency establishes a LCR of 169 MW in 2018 as the minimum capacity
necessary for reliable load serving capability within this area.
The single most critical contingency is an outage of the Bridgeville-Cottonwood 115 kV
line with one of the Humboldt Bay 115 kV units out of service. The limitation is the
overload on the Humboldt–Trinity 115 kV line and establishes a LCR of 121 MW.
Effectiveness factors: For most helpful procurement information please read procedure 2210Z Effectiveness
Factors under 7110 (T-138Z) posted at: http://www.caiso.com/Documents/2210Z.pdf
Changes compared to last year’s results: Compared to 2017 the total load forecast has decreased by 1 MW and the LCR needs
have increased by 12 MW due to different limiting contingency.
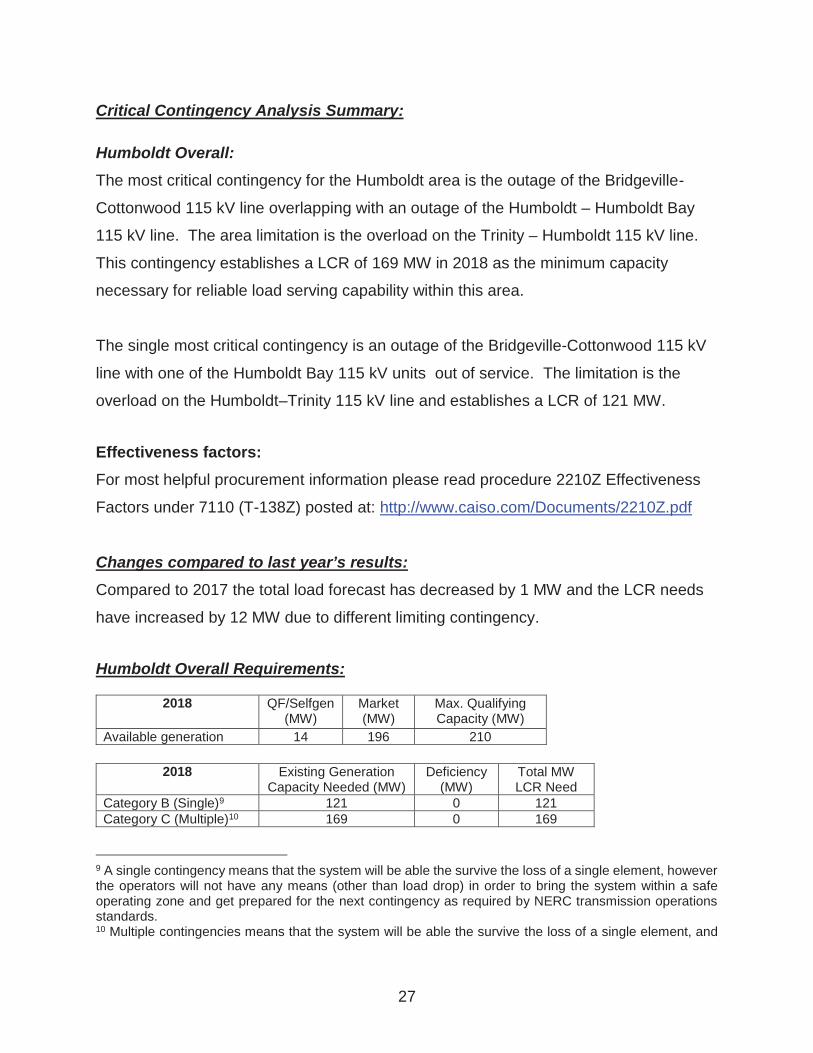
Humboldt Overall Requirements:
2018 QF/Selfgen (MW)
Market (MW)
Max. Qualifying Capacity (MW)
Available generation 14 196 210
2018 Existing Generation Capacity Needed (MW)
Deficiency (MW)
Total MW LCR Need
Category B (Single)9 121 0 121 Category C (Multiple)10 169 0 169
9 A single contingency means that the system will be able the survive the loss of a single element, however the operators will not have any means (other than load drop) in order to bring the system within a safe operating zone and get prepared for the next contingency as required by NERC transmission operations standards. 10 Multiple contingencies means that the system will be able the survive the loss of a single element, and

28
2. North Coast / North Bay Area Area Definition:
The transmission tie facilities coming into the North Coast/North Bay area are:
1) Cortina-Mendocino 115 kV Line 2) Cortina-Eagle Rock 115 kV Line 3) Willits-Garberville 60 kV line #1 4) Vaca Dixon-Lakeville 230 kV line #1 5) Tulucay-Vaca Dixon 230 kV line #1 6) Lakeville-Sobrante 230 kV line #1 7) Ignacio-Sobrante 230 kV line #1
The substations that delineate the North Coast/North Bay area are:
1) Cortina is out, Mendocino and Indian Valley are in 2) Cortina is out, Eagle Rock, Highlands and Homestake are in 3) Willits and Lytonville are in, Garberville and Kekawaka are out 4) Vaca Dixon is out Lakeville is in 5) Tulucay is in Vaca Dixon is out 6) Lakeville is in, Sobrante is out 7) Ignacio is in, Sobrante and Crocket are out
Load: Total 2018 busload within the defined area: 1407 MW with -27 MW of AAEE, -79 MW of
NTM-PV, and 32 MW of losses resulting in total load + losses of 1333 MW.
List of physical units: See Appendix A.
Major new projects modeled: None.
the operators will have enough generation (other operating procedures) in order to bring the system within a safe operating zone and get prepared for the next contingency as required by NERC transmission operations standards.
29
Critical Contingency Analysis Summary: Eagle Rock Sub-area The most critical contingency is the outage of Cortina-Mendocino 115 kV line and
Geysers #5-Geysers #3 115 kV line. The sub-area area limitation is thermal
overloading of the Eagle Rock-Cortina 115 kV line. This limiting contingency
establishes a LCR of 209 MW in 2018 as the minimum capacity necessary for reliable
load serving capability within this sub-area.
The most critical single contingency is the outage of the Cortina-Mendocino 115 kV line
with Geysers 11 generation unit out of service. The sub-area area limitation is thermal
overloading of Eagle Rock-Cortina 115 kV line. This limiting contingency establishes a
LCR of 191 MW in 2018.
Effectiveness factors:
See Appendix B - Table titled Eagle Rock.
For other helpful procurement information please read procedure 2210Z Effectiveness
Factors under 7120 (T-151Z) posted at: http://www.caiso.com/Documents/2210Z.pdf
Fulton Sub-area The most critical contingency is the outage of Lakeville-Fulton 230 kV line #1 and
Fulton-Ignacio 230 kV line #1. The sub-area limitation is thermal overloading of
Lakeville #2 60 kV line (Lakeville-Petaluma-Cotati 60 kV line), which was previously
normally open at Cotati Substation. If the Lakeville #2 60 kV line is open, the limiting
element is Santa Rosa-Corona 115 kV line and there is no additional LCR need beyond
what is needed for the Eagle Rock sub-area. This limiting contingency establishes a
LCR of 430 MW in 2018 as the minimum capacity necessary for reliable load serving
capability within this sub-area. All of the resources needed to meet the Eagle Rock sub-
area count towards the Fulton sub-area LCR need.

30
Effectiveness factors: See Appendix B – Table titled Fulton.
Lakeville Sub-area The most limiting contingency is the outage of Vaca Dixon-Tulucay 230 kV line with
DEC power plant out of service. The area limitation is thermal overloading of Vaca
Dixon-Lakeville 230 kV. This limiting contingency establishes a LCR of 634 MW in 2018
as the minimum capacity necessary for reliable load serving capability within this sub-
area. The LCR resources needed for Eagle Rock and Fulton sub-areas can be counted
toward fulfilling the requirement of Lakeville sub-area.
Effectiveness factors: See Appendix B – Table tilted Lakeville.
Changes compared to last year’s results: The 2018 load forecast went up by 22 MW compared to the 2017 and total LCR need
went down by 87 MW mainly due to load decrease in the Bay Area.
North Coast/North Bay Overall Requirements:
2018 QF/Selfgen (MW)
Muni (MW)
Market (MW)
Max. Qualifying Capacity (MW)
Available generation 5 113 751 869
2018 Existing Generation Capacity Needed (MW)
Deficiency (MW)
Total MW LCR Need
Category B (Single)11 634 0 634 Category C (Multiple)12 634 0 634
11 A single contingency means that the system will be able the survive the loss of a single element, however the operators will not have any means (other than load drop) in order to bring the system within a safe operating zone and get prepared for the next contingency as required by NERC transmission operations standards. 12 Multiple contingencies means that the system will be able the survive the loss of a single element, and the operators will have enough generation (other operating procedures) in order to bring the system within a safe operating zone and get prepared for the next contingency as required by NERC transmission operations standards.

31
3. Sierra Area
Area Definition: The transmission tie lines into the Sierra Area are:
1) Table Mountain-Rio Oso 230 kV line 2) Table Mountain-Palermo 230 kV line 3) Table Mt-Pease 60 kV line 4) Caribou-Palermo 115 kV line 5) Drum-Summit 115 kV line #1 6) Drum-Summit 115 kV line #2 7) Spaulding-Summit 60 kV line 8) Brighton-Bellota 230 kV line 9) Rio Oso-Lockeford 230 kV line 10) Gold Hill-Eight Mile Road 230 kV line 11) Lodi STIG-Eight Mile Road 230 kV line 12) Gold Hill-Lake 230 kV line
The substations that delineate the Sierra Area are:
1) Table Mountain is out Rio Oso is in 2) Table Mountain is out Palermo is in 3) Table Mt is out Pease is in 4) Caribou is out Palermo is in 5) Drum is in Summit is out 6) Drum is in Summit is out 7) Spaulding is in Summit is out 8) Brighton is in Bellota is out 9) Rio Oso is in Lockeford is out 10) Gold Hill is in Eight Mile is out 11) Lodi STIG is in Eight Mile Road is out 12) Gold Hill is in Lake is out
Load: Total 2018 busload within the defined area: 1862 MW with -30 MW of AAEE, -107 MW
of BTM-PV and 93 MW of losses resulting in total load + losses of 1818 MW.
List of physical units: See Appendix A.
Major new projects modeled: None.

32
Critical Contingency Analysis Summary: Placerville Sub-area The most critical contingency is the loss of the Gold Hill-Clarksville 115 kV line followed
by loss of the Gold Hill-Missouri Flat #2 115 kV line. The area limitation is thermal
overloading of the Gold Hill-Missouri Flat #1 115 kV line. This limiting contingency
establishes a LCR of 78 MW (includes 48 MW of deficiency) in 2018 as the minimum
capacity necessary for reliable load serving capability within this sub-area.
Effectiveness factors: All units within this area are needed therefore no effectiveness factor is required.
Placer Sub-area The most critical contingency is the loss of the Gold Hill-Placer #1 115 kV line followed
by loss of the Gold Hill-Placer #2 115 kV line. The area limitation is thermal overloading
of the Drum-Higgins 115 kV line. This limiting contingency establishes a LCR of 85 MW
in 2018 as the minimum capacity necessary for reliable load serving capability within
this sub-area.
The single most critical contingency is the loss of the Gold Hill-Placer #1 115 kV line
with Chicago Park unit out of service. The area limitation is thermal overloading of the
Drum-Higgins 115 kV line. This limiting contingency establishes a local capacity need
of 82 MW in 2018.
Effectiveness factors:
All units within this area have the same effectiveness factor. Pease Sub-area The most critical contingency is the loss of the Palermo-East Nicolaus 115 kV line with
Yuba City Energy Center unit out of service. The area limitation is thermal overloading
of the Palermo-Pease 115 kV line. This limiting contingency establishes a LCR of
101 MW in 2018 as the minimum capacity necessary for reliable load serving capability
within this sub-area.
33
Effectiveness factors:
All units within this area have the same effectiveness factor.
Bogue Sub-area No requirement due to the Palermo-Rio Oso reconductoring project.
South of Rio Oso Sub-area The most critical contingency is the loss of the Rio Oso-Gold Hill 230 line followed by
loss of the Rio Oso-Brighton 230 kV line or vice versa. The area limitation is thermal
overloading of the Rio Oso-Atlantic 230 kV line. This limiting contingency establishes a
LCR of 787 MW (includes 47 MW of deficiency) in 2018 as the minimum capacity
necessary for reliable load serving capability within this sub-area.
The single most critical contingency is the loss of the Rio Oso-Gold Hill 230 line with the
Ralston unit out of service. The area limitation is thermal overloading of the Rio Oso-
Atlantic 230 kV line. This limiting contingency establishes a LCR of 446 MW in 2018.
Effectiveness factors:
See Appendix B - Table titled Rio Oso.
For other helpful procurement information please read procedure 2210Z Effectiveness
Factors under 7230 (T-165Z) posted at: http://www.caiso.com/Documents/2210Z.pdf
Drum-Rio Oso Sub-area The most critical contingency is the loss of the Rio Oso #2 230/115 transformer followed
by loss of the Rio Oso-Brighton 230 kV line. The area limitation is thermal overloading
of the Rio Oso #1 230/115 kV transformer. This limiting contingency establishes in
2018 a LCR of 575 MW as the minimum capacity necessary for reliable load serving
capability within this sub-area.
The single most critical contingency is the loss of the Palermo #2 230/115 transformer.

34
The area limitation is thermal overloading of the Rio Oso #1 230/115 kV transformer.
This limiting contingency establishes in 2018 a LCR of 347 MW .
Effectiveness factors:
For helpful procurement information please read procedure 2210Z Effectiveness
Factors under 7230 (T-165Z) posted at: http://www.caiso.com/Documents/2210Z.pdf
South of Palermo Sub-area The most critical contingency is the loss of the Double Circuit Tower Line Table
Mountain-Rio Oso and Colgate-Rio Oso 230 kV lines. The area limitation is thermal
overloading of the Pease-Rio Oso 115 kV line. This limiting contingency establishes a
LCR of 1625 MW (includes 196 MW of deficiency) in 2018 as the minimum capacity
necessary for reliable load serving capability within this sub-area.
The most critical single contingency is the loss of the Table Mountain-Rio Oso 230 kV
line with Belden unit out of service. The area limitation is thermal overloading of the
Pease-Rio Oso 115 kV line and establishes in 2018 a LCR of 1215 MW .
Effectiveness factors: All units within the South of Palermo are needed therefore no effectiveness factor is
required.
South of Table Mountain Sub-area The most critical contingency is the loss of the Table Mountain-Rio Oso 230 kV and
Table Mountain-Palermo double circuit tower line outage. The area limitation is thermal
overloading of the Caribou-Palermo 115 kV line. This limiting contingency establishes
in 2018 a LCR of 1826 MW as the minimum capacity necessary for reliable load serving
capability within this area.
The units required for the South of Palermo sub-area satisfy the single contingency
requirement for this sub-area.
35
Effectiveness factors:
See Appendix B - Table titled South of Table Mountain.
For other helpful procurement information please read procedure 2210Z Effectiveness
Factors under 7230 (T-165Z) posted at: http://www.caiso.com/Documents/2210Z.pdf
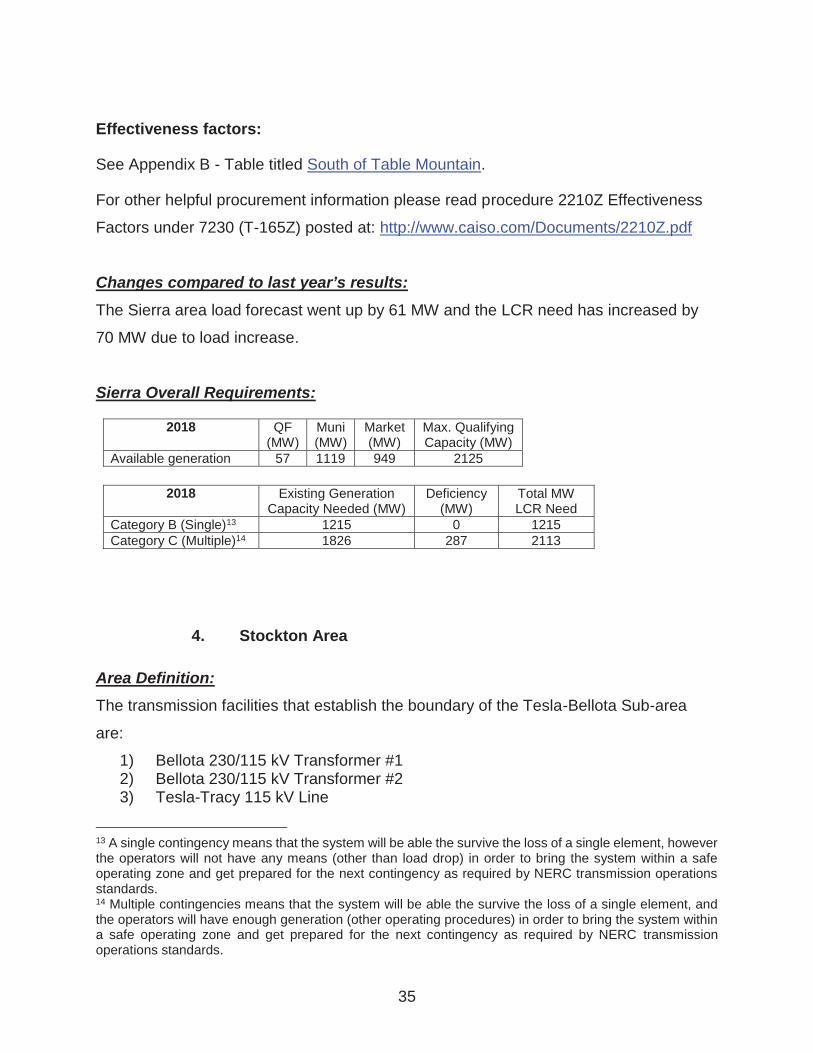
Changes compared to last year’s results: The Sierra area load forecast went up by 61 MW and the LCR need has increased by
70 MW due to load increase.
Sierra Overall Requirements:
2018 QF (MW)
Muni (MW)
Market (MW)
Max. Qualifying Capacity (MW)
Available generation 57 1119 949 2125
2018 Existing Generation Capacity Needed (MW)
Deficiency (MW)
Total MW LCR Need
Category B (Single)13 1215 0 1215 Category C (Multiple)14 1826 287 2113
4. Stockton Area Area Definition: The transmission facilities that establish the boundary of the Tesla-Bellota Sub-area
are:
1) Bellota 230/115 kV Transformer #1 2) Bellota 230/115 kV Transformer #2 3) Tesla-Tracy 115 kV Line
13 A single contingency means that the system will be able the survive the loss of a single element, however the operators will not have any means (other than load drop) in order to bring the system within a safe operating zone and get prepared for the next contingency as required by NERC transmission operations standards. 14 Multiple contingencies means that the system will be able the survive the loss of a single element, and the operators will have enough generation (other operating procedures) in order to bring the system within a safe operating zone and get prepared for the next contingency as required by NERC transmission operations standards.

36
4) Tesla-Salado 115 kV Line 5) Tesla-Salado-Manteca 115 kV line 6) Tesla-Schulte #1 115 kV Line 7) Tesla-Schulte #2 115 kV Line
The substations that delineate the Tesla-Bellota Sub-area are:
1) Bellota 230 kV is out Bellota 115 kV is in 2) Bellota 230 kV is out Bellota 115 kV is in 3) Tesla is out Tracy is in 4) Tesla is out Salado is in 5) Tesla is out Salado and Manteca are in 6) Tesla is out Schulte is in 7) Tesla is out Schulte is in
The transmission facilities that establish the boundary of the Lockeford Sub-area are:
1) Lockeford-Industrial 60 kV line 2) Lockeford-Lodi #1 60 kV line 3) Lockeford-Lodi #2 60 kV line 4) Lockeford-Lodi #3 60 kV line
The substations that delineate the Lockeford Sub-area are:
1) Lockeford is out Industrial is in 2) Lockeford is out Lodi is in 3) Lockeford is out Lodi is in 4) Lockeford is out Lodi is in
The transmission facilities that establish the boundary of the Weber Sub-area are:
1) Weber 230/60 kV Transformer #1 2) Weber 230/60 kV Transformer #2 3) Weber 230/60 kV Transformer #2a
The substations that delineate the Weber Sub-area are:
1) Weber 230 kV is out Weber 60 kV is in 2) Weber 230 kV is out Weber 60 kV is in 3) Weber 230 kV is out Weber 60 kV is in
Load: Total 2018 busload within the defined area: 1213 MW with -26 MW of AAEE, -38 MW of
BTM-PV, and 20 MW of losses resulting in total load + losses of 1169 MW.
List of physical units: See Appendix A.

37
Major new projects modeled: 1. Weber-Stockton “A” #1 & #2 60 kV Reconductoring
2. Ripon 115 kV Line
Critical Contingency Analysis Summary:
Stockton overall
The requirement for this area is driven by the sum of requirements for the Tesla-Bellota,
Lockeford and Weber Sub-areas.
Stanislaus Sub-area The critical contingency for the Stanislaus area is the loss of Bellota-Riverbank-Melones
115 kV circuit with Stanislaus PH out of service. The area limitation is thermal
overloading of the River Bank Jct.-Manteca 115 kV line. This limiting contingency
establishes a local capacity need of 158 MW in 2018 as the minimum capacity
necessary for reliable load serving capability within this sub-area.
Effectiveness factors: All units within this sub-area have the same effectiveness factor.
Tesla-Bellota Sub-area The two most critical contingencies listed below together establish a local capacity need
of 620 MW (includes 276 MW of deficiency) in 2018 as the minimum capacity necessary
for reliable load serving capability within this sub-area.
The most critical contingency for the Tesla-Bellota pocket is the loss of Schulte-Kasson-
Manteca 115 kV and Schulte-Lammers 115 kV. The area limitation is thermal overload
of the Tesla-Tracy 115 kV line above its emergency rating. This limiting contingency
establishes a local capacity need of 514 MW (includes 276 MW of deficiency) in 2018.
The second most critical contingency for the Tesla-Bellota pocket is the loss of Tesla-
Tracy 115 kV and Tesla-Schulte #1 115 kV lines. The area limitation is thermal

38
overload of the Tesla-Schulte #2 115 kV line. This limiting contingency establishes a
2018 local capacity need of 344 MW.
The single most critical contingency for the Tesla-Bellota pocket is the loss of Tesla-
Schulte #1 115 kV line and the loss of the GWF Tracy unit #3. The area limitation is
thermal overload of the Tesla-Schulte #2 115 kV line. This single contingency
establishes a local capacity need of 358 MW in 2018.
All of the resources needed to meet the Stanislaus sub-area count towards the Tesla-
Bellota sub-area LCR need.
Effectiveness factors: All units within this sub-area are needed therefore no effectiveness factor is required.
Lockeford Sub-area The critical contingency for the Lockeford area is the loss of Lockeford-Industrial 60 kV
circuit and Lockeford-Lodi #2 60 kV circuit. The area limitation is thermal overloading of
the Lockeford-Lodi Jct. section of the Lockeford-Lodi #3 60 kV circuit. This limiting
contingency establishes a 2018 local capacity need of 68 MW (including 45 MW of
deficiency) as the minimum capacity necessary for reliable load serving capability within
this sub-area.
Effectiveness factors: All units within this sub-area are needed therefore no effectiveness factor is required.
Weber Sub-area The critical contingency for the Weber area is the loss of Stockton A-Weber #1 & #2 60
kV lines. The area limitation is thermal overloading of the Stockton A-Weber #3 60 kV
line. This limiting contingency establishes a local capacity need of 31 MW in 2018 as
the minimum capacity necessary for reliable load serving capability within this sub-area.

39
Effectiveness factors: All units within this sub-area have the same effectiveness factor.
Changes compared to last year’s results: Overall the Stockton area load forecast went up by 12 MW. The overall requirement for
the Stockton area decreased by 26 MW mainly due to decrease in deficiency resulting
from new transmission project.
Stockton Overall Requirements:
2018 QF (MW)
MUNI (MW)
Market (MW)
Max. Qualifying Capacity (MW)
Available generation 16 123 466 605
2018 Existing Generation Capacity Needed (MW)
Deficiency (MW)
Total MW LCR Need
Category B (Single)15 358 0 358 Category C (Multiple)16 398 321 719
5. Greater Bay Area Area Definition: The transmission tie lines into the Greater Bay Area are:
1) Lakeville-Sobrante 230 kV 2) Ignacio-Sobrante 230 kV 3) Parkway-Moraga 230 kV 4) Bahia-Moraga 230 kV 5) Lambie SW Sta-Vaca Dixon 230 kV 6) Peabody-Birds Landing SW Sta 230 kV 7) Tesla-Kelso 230 kV
15 A single contingency means that the system will be able the survive the loss of a single element, however the operators will not have any means (other than load drop) in order to bring the system within a safe operating zone and get prepared for the next contingency as required by NERC transmission operations standards. 16 Multiple contingencies means that the system will be able the survive the loss of a single element, and the operators will have enough generation (other operating procedures) in order to bring the system within a safe operating zone and get prepared for the next contingency as required by NERC transmission operations standards.

40
8) Tesla-Delta Switching Yard 230 kV 9) Tesla-Pittsburg #1 230 kV 10) Tesla-Pittsburg #2 230 kV 11) Tesla-Newark #1 230 kV 12) Tesla-Newark #2 230 kV 13) Tesla-Ravenswood 230 kV 14) Tesla-Metcalf 500 kV 15) Moss Landing-Los Banos 500 kV 16) Moss Landing-Coburn 230 kV 17) Moss Landing-Las Aguillas 230 kV 18) Oakdale TID-Newark #1 115 kV 19) Oakdale TID-Newark #2 115 kV
The substations that delineate the Greater Bay Area are:
1) Lakeville is out Sobrante is in 2) Ignacio is out Crocket and Sobrante are in 3) Parkway is out Moraga is in 4) Bahia is out Moraga is in 5) Lambie SW Sta is in Vaca Dixon is out 6) Peabody is out Birds Landing SW Sta is in 7) Tesla and USWP Ralph are out Kelso is in 8) Tesla and Altmont Midway are out Delta Switching Yard is in 9) Tesla and Tres Vaqueros are out Pittsburg is in 10) Tesla and Flowind are out Pittsburg is in 11) Tesla is out Newark is in 12) Tesla is out Newark and Patterson Pass are in 13) Tesla is out Ravenswood is in 14) Tesla is out Metcalf is in 15) Los Banos is out Moss Landing is in 16) Coburn is out Moss Landing is in 17) Las Aguillas is out Moss Landing is in 18) Oakdale TID is out Newark is in 19) Oakdale TID is out Newark is in
Load: Total 2018 bus load within the defined area is 10,309 MW with -207 MW of AAEE, -328
MW of Behind the meter DG, 209 MW of losses and 264 MW of pumps resulting in total
load + losses + pumps of 10,247 MW. The expanded Bay Area also includes Moss
Landing area load according to the Area Definition as delineated above.
List of physical units: See Appendix A.

41
Major new projects modeled: 1. NRS-Scott #1 115 kV line reconductoring
2. A few small renewable resources
3. Pittsburg Power Plant retirement
4. Moss Landing Units 6 & 7 retirement
Critical Contingency Analysis Summary: Oakland Sub-area The most critical contingency is an outage of the C-X #2 and #3 115 kV cables. The
area limitation is thermal overloading of the Moraga – Claremont #1 or #2 115 kV line.
This limiting contingency establishes a LCR of 56 MW in 2018 as the minimum capacity
necessary for reliable load serving capability within this sub-area.
The Oakland resources are required in order to meet local reliability requirements in the
Oakland sub-area based on actual real-time data that shows a need of at least 98 MW
for a 1 in 3 heat wave (2015/16). Further, the real-time data also showed that at times
all three Oakland generators are on-line simultaneously in order to maintain local
reliability. The local capacity technical study was intended to model a 1 in 10 heat wave
resulting in an increased local capacity need beyond that observed in real-time. The
discrepancy is due to load forecast distribution among substations in the area. ISO will
work with PG&E and CEC to correct this discrepancy in future base cases.
Effectiveness factors: All units within this area have the same effectiveness factor.
Llagas Sub-area The most critical contingency is an outage Metcalf D-Morgan Hill 115 kV Line with one
of the Gilroy Peaker off-line. The area limitation is thermal overloading of the Morgan
Hill-Llagas 115 kV line as well as voltage drop (5%) at the Morgan Hill substation. As
documented within a CAISO Operating Procedure, this limitation is dependent on power
flowing in the direction from Metcalf to Llagas/Morgan Hill. This limiting contingency

42
establishes a LCR of 105 MW in 2018 as the minimum capacity necessary for reliable
load serving capability within this sub-area.
Effectiveness factors: All units within this area have the same effectiveness factor.
San Jose Sub-area The most critical contingency is an outage of Metcalf-Evergreen #2 115 kV Line
overlapped with Metcalf-El Patio #1 or #2 115 kV Line. The area limitation is thermal
overloading of the Metcalf-Evergreen #1 115 kV Line. This limiting contingency
establishes a LCR of 488 MW in 2018 as the minimum capacity necessary for reliable
load serving capability within this sub-area.
Effectiveness factors: See Appendix B – Table titled San Jose.
For other helpful procurement information please read procedure 2210Z Effectiveness
Factors under 7320 (T-133Z) posted at: http://www.caiso.com/Documents/2210Z.pdf
South Bay-Moss Landing Sub-area The most critical contingency is an outage of the Tesla-Metcalf 500 kV and Moss
Landing-Los Banos 500 kV. The area limitation is thermal overloading of the Las
Aguillas-Moss Landing 230 kV. This limiting contingency establishes a LCR of 2221 MW
in 2018 as the minimum capacity necessary for reliable load serving capability within
this sub-area.
Resources in San Jose and Llagas sub-areas are also included in this sub-area.
Effectiveness factors: For thermal overloads, resources in the Moss Landing area are more effective than the
resources in the South Bay. For voltage support, resources in the South Bay are more
effective than the resources in the Moss Landing area. Minimum requirement assumes
at least two blocks of Combined Cycle at Moss Landing.

43
Pittsburg and Oakland Sub-area Combined No requirement is identified in this sub-area
Contra Costa Sub-area The most critical contingency is an outage of Kelso-Tesla 230 kV with the Gateway off
line. The area limitation is thermal overloading of the Delta Switching Yard-Tesla 230
kV line. This limiting contingency establishes a LCR of 1063 MW in 2018 as the
minimum capacity necessary for reliable load serving capability within this sub-area.
Effectiveness factors: For most helpful procurement information please read procedure 2210Z Effectiveness
Factors under 7320 (T-133Z) posted at: http://www.caiso.com/Documents/2210Z.pdf
Ames and Pittsburg Sub-areas Combined
The two most critical contingencies listed below together establish a local capacity need of 2412 MW in 2018 as follows: 634 MW in NCNB and 1778 MW in the Bay Area with 596 MW in Ames and 1182 MW in Pittsburg as the minimum capacity necessary for reliable load serving capability within these sub-areas.
The most critical contingency in the Bay Area is an outage of DCTL Newark-
Ravenswood & Tesla-Ravenswood 230 kV. The area limitation is thermal overloading
of Newark-Ames #1, #2, #3 and Newark- Ames Distribution 115 kV lines.
The most critical contingency in North Coast/North Bay area is an outage of Vaca
Dixon-Tulucay 230 kV line with Delta Energy Center power plant out of service. The
area limitation is thermal overloading of Vaca Dixon-Lakeville 230 kV line.
Effectiveness factors: Resources must satisfy both constraints simultaneously, therefore no effectiveness
factor is provided. For other helpful procurement information please read procedure
2210Z Effectiveness Factors under 7320 (T-133Z) posted at:
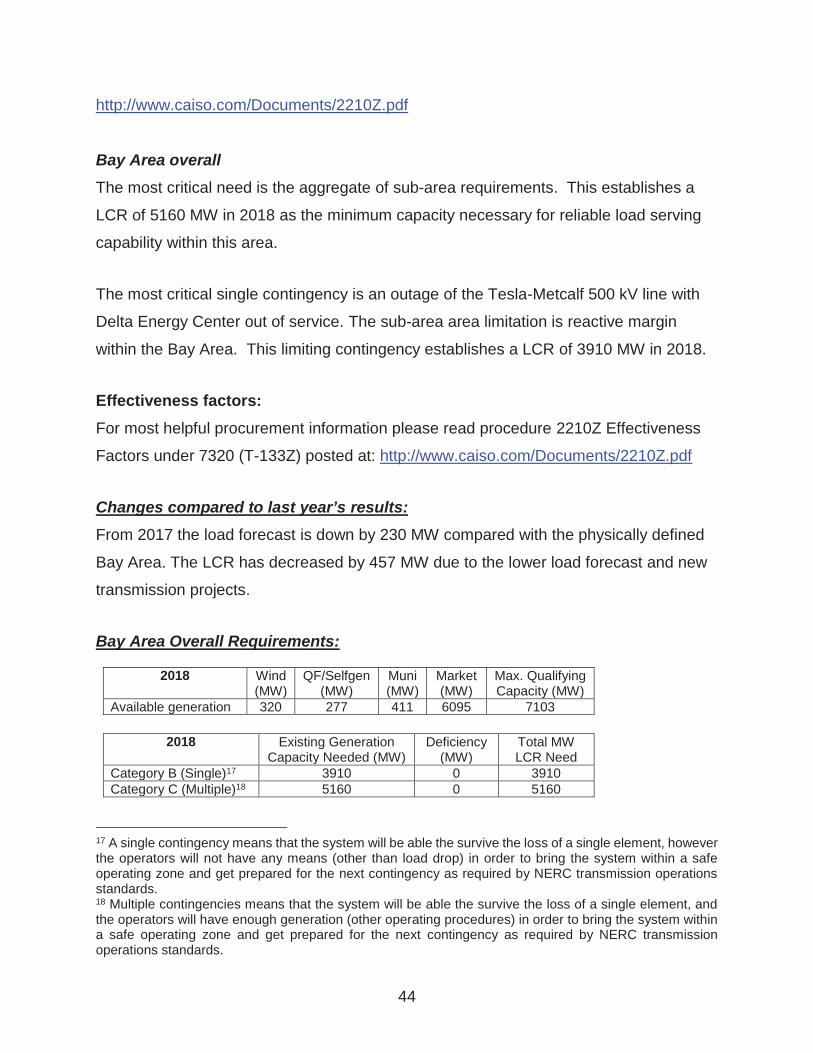
44
http://www.caiso.com/Documents/2210Z.pdf
Bay Area overall The most critical need is the aggregate of sub-area requirements. This establishes a
LCR of 5160 MW in 2018 as the minimum capacity necessary for reliable load serving
capability within this area.
The most critical single contingency is an outage of the Tesla-Metcalf 500 kV line with
Delta Energy Center out of service. The sub-area area limitation is reactive margin
within the Bay Area. This limiting contingency establishes a LCR of 3910 MW in 2018.
Effectiveness factors: For most helpful procurement information please read procedure 2210Z Effectiveness
Factors under 7320 (T-133Z) posted at: http://www.caiso.com/Documents/2210Z.pdf
Changes compared to last year’s results: From 2017 the load forecast is down by 230 MW compared with the physically defined
Bay Area. The LCR has decreased by 457 MW due to the lower load forecast and new
transmission projects.
Bay Area Overall Requirements:
2018 Wind (MW)
QF/Selfgen (MW)
Muni (MW)
Market (MW)
Max. Qualifying Capacity (MW)
Available generation 320 277 411 6095 7103
2018 Existing Generation Capacity Needed (MW)
Deficiency (MW)
Total MW LCR Need
Category B (Single)17 3910 0 3910 Category C (Multiple)18 5160 0 5160
17 A single contingency means that the system will be able the survive the loss of a single element, however the operators will not have any means (other than load drop) in order to bring the system within a safe operating zone and get prepared for the next contingency as required by NERC transmission operations standards. 18 Multiple contingencies means that the system will be able the survive the loss of a single element, and the operators will have enough generation (other operating procedures) in order to bring the system within a safe operating zone and get prepared for the next contingency as required by NERC transmission operations standards.

45
6. Greater Fresno Area Area Definition: The transmission facilities coming into the Greater Fresno area are:
1) Gates-Mustang #1 230 kV Line 2) Gates- Mustang #2 230 kV Line 3) Gates #1 230/70 kV Transformer Bank 4) Los Banos #3 230/70 kV Transformer Bank 5) Los Banos #4 230/70 kV Transformer Bank 6) Panoche-Tranquility #1 230 kV Line 7) Panoche- Tranquility #2 230 kV Line 8) Panoche #1 230/115 kV Transformer 9) Panoche #2 230/115 kV Transformer 10) Warnerville-Wilson 230 kV Line 11) Wilson-Melones 230 kV Line 12) Smyrna-Corcoran 115kV Line 13) Coalinga #1-San Miguel 70 kV Line
The substations that delineate the Greater Fresno area are:
1) Gates is out Henrietta is in 2) Gates is out Henrietta is in 3) Gates 230 kV is out Gates 70 kV is in 4) Los Banos 230 kV is out Los Banos 70 kV is in 5) Los Banos 230 kV is out Los Banos 70 kV is in 6) Panoche is out Helm is in 7) Panoche is out Mc Mullin is in 8) Panoche 115 kV is in Panoche 230 kV is out 9) Panoche 115 kV is in Panoche 230 kV is out 10) Warnerville is out Wilson is in 11) Wilson is in Melones is out 12) Quebec SP is out Corcoran is in 13) Coalinga is in San Miguel is out
Load: 2018 total busload within the defined area is 3189 MW with -46 MW of AAEE, 101 MW
of losses and -139 MW DG resulting in a total (load plus losses) of 3290 MW.
List of physical units: See Appendix A.

46
Major new projects modeled: 1. A few new renewable resources were added.
Critical Contingency Analysis Summary: Hanford Sub-area
The most critical contingency for the Hanford sub-area is the loss of the Gates-Mustang
#1 and #2 230 kV lines, which would thermally overload the McCall-Kingsburg #1 115
kV line. This limiting contingency establishes a local capacity need of 150 MW in 2018
as the minimum generation capacity necessary for reliable load serving capability within
this sub-area.
Effectiveness factors: All units within this sub-area have the same effectiveness factor.
Coalinga Sub-area
The most critical contingency for the Coalinga sub-area is the loss of the Gates #5
230/70 kV transformer followed by the Panoche-Schindler #1 and #2 115 kV double
circuit tower line, which could cause voltage instability in the pocket. This limiting
contingency establishes a local capacity need of 28 MW in 2018 as the minimum
generation capacity necessary for reliable load serving capability within this sub-area.
Effectiveness factors: All units within this sub-area have the same effectiveness factor.
Borden Sub-area
The most critical contingency for the Borden sub-area is the loss of the Borden #4
230/70 kV transformer followed by the Friant-Coppermine 70 kV line, which could cause
overload on the Borden #1 230/70 kV transformer. This limiting contingency establishes
a local capacity need of 18 MW in 2018 as the minimum generation capacity necessary
for reliable load serving capability within this sub-area.
47
Effectiveness factors: All units within this sub-area have the same effectiveness factor.
Reedley Sub-area
The most critical contingency for the Reedley sub-area is the loss of the McCall-
Reedley (McCall-Wahtoke) 115 kV line followed by the Sanger-Reedley 115 kV line,
which could thermally overload the Kings River-Sanger-Reedley (Sanger-Rainbow Tap)
115 kV line. This limiting contingency establishes a local capacity need of 19 MW in
2018 as the minimum generation capacity necessary for reliable load serving capability
within this sub-area.
There is no single critical contingency in this sub-area.
Effectiveness factors: All units within this sub-area are needed therefore no effectiveness factor is required.
Herndon Sub-area
The most critical contingency is the loss of Herndon-Woodward 115 kV line and Herndon-
Manchester 115 kV lines. This contingency could thermally overload the Herndon-Barton
115 kV line. This limiting contingency established an LCR of 880 MW in 2018 as the
minimum generation capacity necessary for reliable load serving capability within this
sub-area.
The second most critical contingency is the loss of Herndon-Barton 115 kV line with
Balch 1 generating unit out of service. This contingency would thermally overload the
Herndon-Manchester 115 kV line and establishes an LCR of 425 MW.
Effectiveness factors:
See Appendix B - Table titled Herndon.
For other helpful procurement information please read procedure 2210Z Effectiveness

48
Factors under 7430 (T-129) posted at: http://www.caiso.com/Documents/2210Z.pdf
Overall (Wilson) Sub-area The most critical contingency is the loss of the Common mode (DCTL) Wilson-Gregg
230 kV line and Borden-Gregg 230 kV line. This contingency would thermally overload
the Panoche-Oro Loma 115 kV line. This limiting contingency establishes a LCR of
2081 MW in 2018 as the minimum generation capacity necessary for reliable load
serving capability within this area.
The second most critical contingency is the Loss of Panoche-Mendota 115 kV line
followed by the loss of one Helms Unit. This contingency would thermally overload the
Panoche-Oro Loma 115 kV line and establishes an LCR of 1949 MW in 2018.
Effectiveness factors: For most helpful procurement information please read procedure 2210Z Effectiveness
Factors under 7430 (T-129) posted at: http://www.caiso.com/Documents/2210Z.pdf
Changes compared to last year’s results: From 2018 the load forecast has increased by 326 MW and the LCR by 302 MW.
Fresno Area Overall Requirements:
2018 QF/Selfgen (MW)
Muni (MW)
Market (MW)
Max. Qualifying Capacity (MW)
Available generation 48 316 3215 3579
2018 Existing Generation Capacity Needed (MW)
Deficiency (MW)
Total MW LCR Need
Category B (Single) 19 1949 0 1949 Category C (Multiple) 20 2081 0 2081
19 A single contingency means that the system will be able the survive the loss of a single element, however the operators will not have any means (other than load drop) in order to bring the system within a safe operating zone and get prepared for the next contingency as required by NERC transmission operations standards. 20 Multiple contingencies means that the system will be able the survive the loss of a single element, and the operators will have enough generation (other operating procedures) in order to bring the system within

49
7. Kern Area Area Definition: The transmission facilities coming into the Kern PP sub-area are:
1) Midway-Kern PP #1 230 kV Line 2) Midway-Kern PP #3 230 kV Line 3) Midway-Kern PP #4 230 kV Line 4) Famoso-Charca 115 kV Line (Normal Open) 5) Wasco-Famoso 70 kV Line (Normal Open) 6) Maricopa-Copus 70 kV Line (Normal Open) 7) Copus-Old River 70 kV Line (Normal Open) 8) Kern Canyo-Magunden-Weedpatch 70 kV Line (Normal Open) 9) Wheeler Ridge-Lamont 115 kV Line (Normal Open)
The substations that delineate the Kern-PP sub-area are:
1) Midway 230 kV is out Bakersfield and Stockdale 230 kV are in 2) Midway 230 kV is out Kern and Stockdale 230 kV are in 3) Midway 230 kV is out Kern PP 230 kV is in 4) Charca 115kV is out Famoso 115 kV is in 5) Wasco 70 kV is out Mc Farland 70 kV is in 6) Basic School Junction 70 kV is out, Copus 70 kV is in 7) Lakeview 70 kV is out, San Emidio Junction 70 kV is in 8) Magunden Junction 70 kV is out, Magunden 70 kV is in 9) Wheeler Ridge 115 kV is out, Adobe Solar 115 kV is in
Load: 2018 total busload within the defined area is 907 MW with -13 MW of AAEE, 7 MW of
losses and -34 MW DG resulting in a total (load plus losses) of 867 MW.
List of physical units: See Appendix A.
Major new projects modeled: 1. Upgrade terminal equipment on Kern PP #4 230/115kV transformer
a safe operating zone and get prepared for the next contingency as required by NERC transmission operations standards.

50
Critical Contingency Analysis Summary: West Park Sub-area
No requirement due to decrease in load forecast.
Kern Oil Sub-area
The most critical contingency is the Kern PP-Live Oak 115 kV Line and Kern PP-7th
Standard 115 kV Line resulting in the thermal overload of the Kern PP-Magunden-Witco
115 kV Line. This limiting contingency establishes a LCR of 133 MW in 2018 as the
minimum generation capacity necessary for reliable load serving capability within this
sub-area.
Effectiveness factors: All units within this sub-area have the same effectiveness factor.
South Kern PP Sub-area
The South Kern PP sub-area requirement is smaller than the Kern Oil sub-area
therefore the need is already satisfied by resources located in the Kern Oli sub-area.
South Kern Overall The most critical contingency is the outage of the Midway-Kern #3 and #4 230 kV lines,
which thermally overloads the Midway-Kern #1 230 kV line. This limiting contingency
establishes a LCR of 453 MW in 2018 as the minimum generation capacity necessary
for reliable load serving capability within this sub-area.
Effectiveness factors: All units within this sub-area have the same effectiveness factor.
For other helpful procurement information please read procedure 2210Z Effectiveness
Factors under 7450 (New) posted at: http://www.caiso.com/Documents/2210Z.pdf
Changes compared to last year’s results: Kern area load forecast has gone down by 272 MW and The LCR requirement has
decreased by 39 MW. The downward shift in load also resulted in the elimination of the

51
Westpark sub-area.
Kern Area Overall Requirements:
2018 QF/Selfgen (MW)
Market (MW)
Max. Qualifying Capacity (MW)
Available generation 15 551 566
2018 Existing Generation Capacity Needed (MW)
Deficiency (MW)
Total MW LCR Need
Category B (Single) 21 0 0 0 Category C (Multiple) 22 453 0 453
8. LA Basin Area
Area Definition: The transmission tie lines into the LA Basin Area are:
1) San Onofre - San Luis Rey #1, #2, & #3 230 kV Lines 2) San Onofre – Talega #1 & #2 230 kV Lines 3) Lugo - Mira Loma #2 & #3 500 kV Lines 4) Lugo – Rancho Vista #1 500 kV line 5) Sylmar - Eagle Rock 230 kV Line 6) Sylmar - Gould 230 kV Line 7) Vincent – Mira Loma 500 kV Line 8) Vincent - Mesa Cal 230 kV Line 9) Vincent - Rio Hondo #1 & #2 230 kV Lines 10) Eagle Rock - Pardee 230 kV Line 11) Devers - RedBluff #1 and #2 500 kV Lines 12) Mirage – Coachela Valley 230 kV Line 13) Mirage - Ramon 230 kV Line 14) Mirage - Julian Hinds 230 kV Line
21 A single contingency means that the system will be able the survive the loss of a single element, however the operators will not have any means (other than load drop) in order to bring the system within a safe operating zone and get prepared for the next contingency as required by NERC transmission operations standards. 22 Multiple contingencies means that the system will be able the survive the loss of a single element, and the operators will have enough generation (other operating procedures) in order to bring the system within a safe operating zone and get prepared for the next contingency as required by NERC transmission operations standards.

52
These substations form the boundary surrounding the LA Basin area: 1) San Onofre is in San Luis Rey is out 2) San Onofre is in Talega is out 3) Mira Loma is in Lugo is out 4) Rancho Vista is in Lugo is out 5) Eagle Rock is in Sylmar is out 6) Gould is in Sylmar is out 7) Mira Loma is in Vincent is out 8) Mesa Cal is in Vincent is out 9) Rio Hondo is in Vincent is out 10) Eagle Rock is in Pardee is out 11) Devers is in RedBluff is out 12) Mirage is in Coachela Valley is out 13) Mirage is in Ramon is out 14) Mirage is in Julian Hinds is out
Load:
The total 2018 1-in-10 heat wave peak load modeled within the electrically defined
area23 includes 18,215 MW net managed peak load with 146 MW of peak shift, 22 MW
pump load and 83 MW of losses resulting in total net load + losses + pumps with peak
shift of 18,466 MW. The electrically defined LA Basin LCR area does not include
Saugus substation load, which is 755 MW. When this load is added to the electrically
defined LA Basin load, the total geographically-defined LA Basin load is 19,221 MW,
which correlates with the CEC’s Mid Demand Baseline with Low AAEE Savings with
peak shift forecast for 2018.
List of physical units: See Appendix A.
Major new projects modeled: 1. San Luis Rey (2-225 MVAR), San Onofre (1-240 MVAR), Miguel (2-225 MVAR)
and Santiago (3-81 MVAR) synchronous condensers
2. Imperial Valley Phase Shifting Transformers (230/230kV 2x400 MVA)
3. Huntington Beach Units 3 & 4 synchronous condensers retired at the end of 2017
23 The electrically defined area load is the LA Basin load minus Saugus substation load. When Saugus load (located in the LA County) is added to the electrically defined area load, its resulting total demand will match with the CEC demand forecast for the LA Basin planning area.

53
4. Encina Unit 1 retired at the end of Q1 2017 (to allow generation interconnection
related works for the new Carlsbad Energy Center); Carlsbad Energy Center’s in-
service date is delayed until Q4 2018.
5. Sycamore – Penasquitos 230 kV transmission line
Critical Contingency Analysis Summary:
El Nido sub-area: The most critical contingency for the El Nido sub-area is the loss of the La Fresa –
Hinson 230 kV line followed by the loss of the La Fresa – Redondo #1 and #2 230 kV
lines, which would cause voltage collapse. This limiting contingency establishes an LCR
of 227 MW in 2018 as the minimum capacity necessary for reliable load serving
capability within this sub-area.
Effectiveness factors: All units have the same effectiveness factor.
Western Sub-Area: The most critical contingency for the Western sub-area is the loss of Serrano – Villa
Park #2 230 kV line followed by the loss of the Serrano – Lewis #1 or #2 230 kV line or
vice versa, which would result in thermal overload of the remaining Serrano – Villa Park
230 kV line. This limiting contingency establishes an LCR of 3,621 MW in 2018 as the
resource capacity necessary for reliable load serving capability within this sub-area.
Effectiveness factors: See Appendix B - Table titled Western LA Basin.
For other helpful procurement information please read procedure 2210Z Effectiveness
Factors under 7630 (G-219Z) posted at: http://www.caiso.com/Documents/2210Z.pdf
There are numerous other combinations of contingencies in the area that could
overload a significant number of 230 kV lines in this sub-area and have less LCR need.
As such, anyone of them (combination of contingencies) could become binding for any

54
given set of procured resources. As a result, effectiveness factors may not be the best
indicator towards informed procurement.
Eastern LA Basin Sub-area: The two most limiting contingencies for the Eastern LA Basin subarea are the following:
The thermal loading concern is caused by an overlapping contingency of the Palo Verde
– Colorado River 500 kV line, system readjustment, then followed by Serrano – Valley
500 kV line or vice versa. This overlapping contingency could result in an overloading
concern on the Iron Mountain – Eagle Mountain 230 kV line. The limiting contingency
establishes an LCR need of 2,361 MW in 2018 as the resource capacity necessary for
reliable load serving capability within this sub-area.
The post-transient voltage instability concern is caused by an overlapping contingency of
Serrano – Valley 500 kV line, system readjustment, followed by a simultaneous N-2 of
the Devers – Red Bluff 500 kV lines. The voltage instability concern requires the same
amount of LCR need as in the thermal constraint discussed above.
Effectiveness factors: Resources must satisfy both constraints simultaneously, therefore no effectiveness factor
is provided.
West of Devers Sub-area:
Satisfied by the need in the larger Eastern LA Basin sub-area.
Valley Sub-area:
Satisfied by the need in the larger Eastern LA Basin sub-area.
Valley-Devers Sub-Area: This sub-area has been eliminated due to the new Paloverde-Delaney-Colorado River
500 kV lines.
55
Overall LA Basin Area and San Diego-Imperial Valley Area Combined: The LCR needs of the LA Basin area and San Diego-Imperial Valley area have been
considered through a coordinated study process to ensure that the resource needs for
each LCR area not only satisfy its own area reliability need but also provide support to
the other area if needed. With the retirement of the San Onofre Nuclear Generating
Station, and the impending retirement of other once-through cooled generation in the LA
Basin and San Diego areas, the two areas are electrically interdependent on each
other. Resource needs in one area are dependent on the amount of resources that are
dispatched for the adjacent area and vice versa. The SDG&E system, being the
southernmost electrical area in the ISO’s southern system and smaller of the overall LA
Basin-San Diego-Imperial Valley area, is evaluated first for its LCR needs. The LCR
needs for the LA Basin and its subareas are then evaluated after the initial
determination of the LCR needs for the overall San Diego-Imperial Valley area. The
LCR needs in the overall San Diego-Imperial Valley area are then re-checked to ensure
that the initial determination is still adequate. This iterative process is needed due to the
interaction of resources on the LCR needs in the LA Basin-San Diego-Imperial Valley
area. With this process, the LCR needs for the respective areas are coordinated within
the overall LA Basin-San Diego-Imperial Valley area. It is important to note that the San
Diego subarea is a part or subset of the overall San Diego-Imperial Valley area.
An additional consideration is whether the Aliso Canyon gas storage constraint needs to
be evaluated to determine the LCR needs for the LA Basin and the San Diego-Imperial
Valley for 2018. At this time, the ISO is not performing analyses that would involve
balancing resources between the LA Basin and San Diego areas similar to the 2017
LCR due to the benefits of the enhanced balancing rules as the CPUC has recognized
the effectiveness of tighter non-core balancing rules. Based on the recent CPUC Public
Utilities Code Section 715 report24, dated January 17, 2017, on page 15, the CPUC
indicated that the 150 mmcf potential imbalance has been offset by the new balancing
24 http://www.cpuc.ca.gov/uploadedFiles/CPUC_Public_Website/Content/News_Room/News_and_Updates/AlisoGas1-9-715.pdf

56
rules and directly reduces the amount of the original curtailment identified in the four
summer technical scenarios involving various levels of gas facility outages. However, as
Southern California Gas Company has informed the CPUC in its February 17, 2017
Storage Safety Enhancement Plan, it is important to note that there are potential
deliverability impacts due to tubing flow only operation of the remaining gas storage
fields at Goleta, Playa Del Rey and Honor Rancho. More study is necessary to
understand the meaning and the extent of the tubing only production limitation.
As mentioned above, the overall LA Basin-San Diego-Imperial Valley LCR needs were
determined by evaluating the LCR needs in the San Diego-Imperial Valley LCR area
first, and then determining the LCR needs for the LA Basin. The total LCR needs for the
combined LA Basin-San Diego-Imperial Valley area are the sum of the LCR needs for
the LA Basin and the San Diego-Imperial Valley area.
The following is the discussion of the LCR needs for each of these respective areas:
1. Overall San Diego-Imperial Valley Area:
The most critical contingency resulting in thermal loading concerns for the overall San
Diego-Imperial Valley area is the G-1/N-1 (Category B) overlapping outage that involves
the loss of the TDM combined cycled power plant (593 MW), system readjustment,
followed by the loss of the Imperial Valley – North Gila 500 kV line or vice versa
(Category C). This overlapping contingency could thermally overload the Imperial Valley
– El Centro 230 kV line (i.e., the “S” line)25. This contingency establishes a total local
capacity need of 4,032 MW in 2018 as the resource capacity necessary for reliable load
serving capability within the overall San Diego – Imperial Valley area.
The corresponding LA Basin LCR need associated with this contingency and level of
LCR need for the San Diego – Imperial Valley is 7,300 MW.
25 The “S” line is owned and operated by the Imperial Irrigation District (IID) that connects the IID electrical grid with the ISO BAA’s SDG&E-owned electrical grid.

57
2. Overall LA Basin Area:
As discussed earlier, to determine whether the aforementioned LCR need in the LA
Basin is adequate for the LA Basin LCR area, the ISO performed contingency analyses
in the LA Basin after the evaluation of the LCR need for the San Diego-Imperial Valley
LCR. The most critical contingency resulting in thermal loading concerns for the overall
LA Basin is the loss of the Lugo – Victorville 500 kV line, system readjustment, followed
by the loss of Sylmar – Gould 230 kV line or vice versa. This overlapping contingency
could thermally overload the Sylmar - Eagle Rock 230 kV line. This establishes a total
local capacity need in LA Basin area of 7,525 MW in 2018 as the minimum resource
capacity necessary for reliable load serving capability within this sub-area.
The overall combined LA Basin-San Diego-Imperial Valley area LCR need has a total of
11,557 MW in 2018 time frame as follows: 7,525 MW in the LA Basin and 4,032 MW in
the San Diego-Imperial Valley area as the minimum capacity necessary for reliable load
serving capability within these areas. The most limiting constraint for this overall
combined LA Basin-San Diego-Imperial Valley area is the thermal loading concerns on
the Sylmar – Eagle Rock 230 kV line under an N-1-1 overlapping contingency. This is
closely followed by the limiting constraint on the “S” line between IID and SDG&E under
an overlapping G-1/N-1 contingency or vice versa.
Effectiveness factors: See Appendix B - Table titled LA Basin.
For other helpful procurement information please read procedure 2210Z Effectiveness
Factors under 7570 (T-144Z), 7580 (T-139Z), 7590 (T-137Z, 6750) and 7680 (T-130Z)
posted at: http://www.caiso.com/Documents/2210Z.pdf
Sensitivity assessment with Imperial Valley solar generation unavailable at 7 p.m. for a peak load day
The purpose of performing this sensitivity study was to evaluate the potential impact to the LCR requirements for the LA Basin-San Diego-Imperial Valley area for the scenario

58
in which the Imperial Valley solar generation is unavailable to provide resource needs to mitigate loading concern on the Imperial Valley – El Centro 230 kV line under an overlapping G-1/N-1 contingency of the combined cycled TDM generation, system readjustment, followed by an outage on the Imperial Valley – North Gila 500 kV line. Since the solar generation in the Imperial Valley area are effective in mitigating this line overloading concern, its unavailability at the time of the area peak load at 7 p.m. could affect the LCR requirements in the overall LA Basin, San Diego subarea, and the overall San Diego – Imperial Valley area. This analysis is for risk assessment purposes. The existing practice is to establishing local capacity requirements for use in the resource adequacy (RA) process based on individual resource net qualifying capacity (NQC) as dictated by accounting rules of Local Regulatory Agencies (LRA).
For this sensitivity assessment, the ISO reviewed the availability of the solar central plants in the Imperial Valley area at 7 p.m. on September 26, 2016, using archived data from the ISO Energy Management System (EMS). This date had high loads for SDG&E in 2016. The Imperial Valley solar generation had either 0 MW output or was negligible (i.e., less than 1% of its maximum output which is within 2% tolerance of the archived real-time data). The study case was modified by reducing Imperial Valley solar generation from its NQC values to no output. The limiting contingency is the overlapping G-1/N-1 of TDM combined cycled generation, system readjustment, followed by the loss of the Imperial Valley – North Gila 500 kV line. This contingency could cause an overloading concern on the Imperial Valley – El Centro 230 kV line. The LCR requirements for the combined LA Basin-San Diego-Imperial Valley area, based on this scenario are: LA Basin LCR needs at 7,604 MW and San Diego-Imperial Valley area LCR needs at 4,142 MW (including San Diego sub-area LCR needs at 3,145 MW).
The following are key observations when comparing the LCR needs of the sensitivity study to the LCR needs based on the currently established NQC values:
With less solar generating resources being available in the Imperial Valley at 7 p.m., the next effective generating resources are located in the San Diego sub-area. This increases the San Diego sub-area LCR needs to 3,145 MW (an increase of about 750 MW as there are no further resources in the Imperial Valley area that can be dispatched, and the next available resources are located in the San Diego sub-area).
The total LCR needs for the overall San Diego – Imperial Valley area increase to 4,142 MW, representing an increase of 101 MW as less effective generating

59
resources in the San Diego sub-area are dispatched due to unavailability of more effective solar generation at 7 p.m. timeframe.
The LA Basin LCR needs were increased slightly by about 79 MW, with the same reason for the increase as in the second bullet discussion above.
Please refer to section IV.C.10 for further discussion of the San Diego – Imperial Valley local capacity requirements. Changes compared to last year’s results: Compared with 2017, the latest CEC-adopted adjusted peak demand forecast for 2018
is reduced by 627 MW for geographic LA Basin and reduced by 424 MW based on the
electrical definition. The LCR need has increased by 157 MW, mainly due to change in
assumptions regarding the Aliso Canyon gas storage constraint (used in 2017 and not
in 2018) see discussion above.
LA Basin Overall Requirements:
2018 QF (MW)
Wind (MW)
Muni (MW)
Market (MW)
Preferred Res. (MW)
20 Min. DR (MW)
Mothball(MW)
Max. Qualifying Capacity (MW)
Available generation 321 59 1176 8279 144 321 435 10735
2018 Existing Generation
Capacity Needed (MW) Deficiency
(MW) Total MW LCR
Need Category B (Single)26 6,873 0 6,873 Category C (Multiple)27 7,525 0 7,525
26 A single contingency means that the system will be able the survive the loss of a single element, however the operators will not have any means (other than load drop) in order to bring the system within a safe operating zone and get prepared for the next contingency as required by NERC transmission operations standards. 27 Multiple contingencies means that the system will be able the survive the loss of a single element, and the operators will have enough generation (other operating procedures) in order to bring the system within a safe operating zone and get prepared for the next contingency as required by NERC transmission operations standards.

60
9. Big Creek/Ventura Area Area Definition: The transmission tie lines into the Big Creek/Ventura Area are:
1) Antelope #1 and #2 500/230 kV Transformers 2) Sylmar-Pardee #1 230 kV Line 3) Sylmar-Pardee #2 230 kV Line 4) Vincent-Pardee #1 230 kV Line 5) Vincent-Pardee #2 230 kV Line 6) Vincent-Santa Clara 230 kV Line
These sub-stations form the boundary surrounding the Big Creek/Ventura area: 1) Antelope 500 kV is out Antelope 230 KV is in 2) Sylmar is out Pardee is in 3) Sylmar is out Pardee is in 4) Vincent is out Pardee is in 5) Vincent is out Pardee is in 6) Vincent is out Santa Clara is in
Load: Total 2018 busload within the defined area28 is 4,661 MW with (108) MW of AAEE,
(169) MW29 of BTM PV impact, 51 MW of losses and 369 MW of pumps resulting in
total net managed load + losses + pumps of 4,802 MW.
List of physical units: See Appendix A.
Major new projects modeled: None
28 The Big Creek Ventura LCA includes the Saugus Substation. 29 The BTM PV impact value includes a downward adjustment by 68 MW due to peak shift.

61
Critical Contingency Analysis Summary:
Rector Sub-area The most critical contingency for the Rector sub-area is the loss of one of the Rector-
Vestal 230 kV lines with the Eastwood unit out of service, which would thermally
overload the remaining Rector-Vestal 230 kV line. This limiting contingency establishes
a LCR of 515 MW in 2018 as the minimum capacity necessary for reliable load serving
capability within this sub-area.
Effectiveness factors: See Appendix B - Table titled Rector.
Vestal Sub-area The most critical contingency for the Vestal sub-area is the loss of one of the
Magunden-Vestal 230 kV lines with the Eastwood unit out of service, which would
thermally overload the remaining Magunden-Vestal 230 kV line. This limiting
contingency establishes a LCR of 848 MW in 2018 as the minimum capacity necessary
for reliable load serving capability within this sub-area.
Effectiveness factors: For helpful procurement information please read procedure 2210Z Effectiveness
Factors under 7500 posted at: http://www.caiso.com/Documents/2210Z.pdf
S. Clara sub-area
The most critical contingency for the S.Clara sub-area is the loss of the Pardee to
S.Clara 230 kV line followed by the loss of the Moorpark to S.Clara #1 and #2 230 kV
lines, which would cause voltage collapse. This limiting contingency establishes a LCR
of 250 MW in 2018 as the minimum capacity necessary for reliable load serving
capability within this sub-area.
Effectiveness factors: The generators inside the sub-area have the same effectiveness factors.

62
Moorpark sub-area The most critical contingency for the Moorpark sub-area is the loss of one of the Pardee
to Moorpark 230 kV lines followed by the loss of the remaining two Moorpark to Pardee
230 kV lines, which would cause voltage collapse. This limiting contingency establishes
a LCR of 504 MW in 2018 as the minimum capacity necessary for reliable load serving
capability within this sub-area.
Effectiveness factors: The generators inside the sub-area have the same effectiveness factors.
Big Creek/Ventura overall: The most critical contingency is the loss of the Lugo-Victorville 500 kV followed by
Sylmar-Pardee #1 or #2 230 kV line, which could thermally overload the remaining
Sylmar-Pardee 230 kV line. This limiting contingency establishes a LCR of 2,321 MW
in 2018 as the minimum generation capacity necessary for reliable load serving
capability within this area.
The most critical single contingency is the loss of Ormond Beach Unit #2 followed by
Sylmar-Pardee #1 (or # 2) line, which could thermally overload the remaining Sylmar-
Pardee 230 kV line. This limiting contingency establishes a LCR of 2,023 MW in 2018.
Effectiveness factors: For helpful procurement information please read procedure 2210Z Effectiveness
Factors under 7680 (T-130Z), 7510 (T-163Z), 7550 (T-159Z) and 8610 (T-131Z) posted
at: http://www.caiso.com/Documents/2210Z.pdf
Changes compared to last year’s results: Compared with 2017 the load forecast is up by 83 MW and the LCR need has increased
by 264 MW.
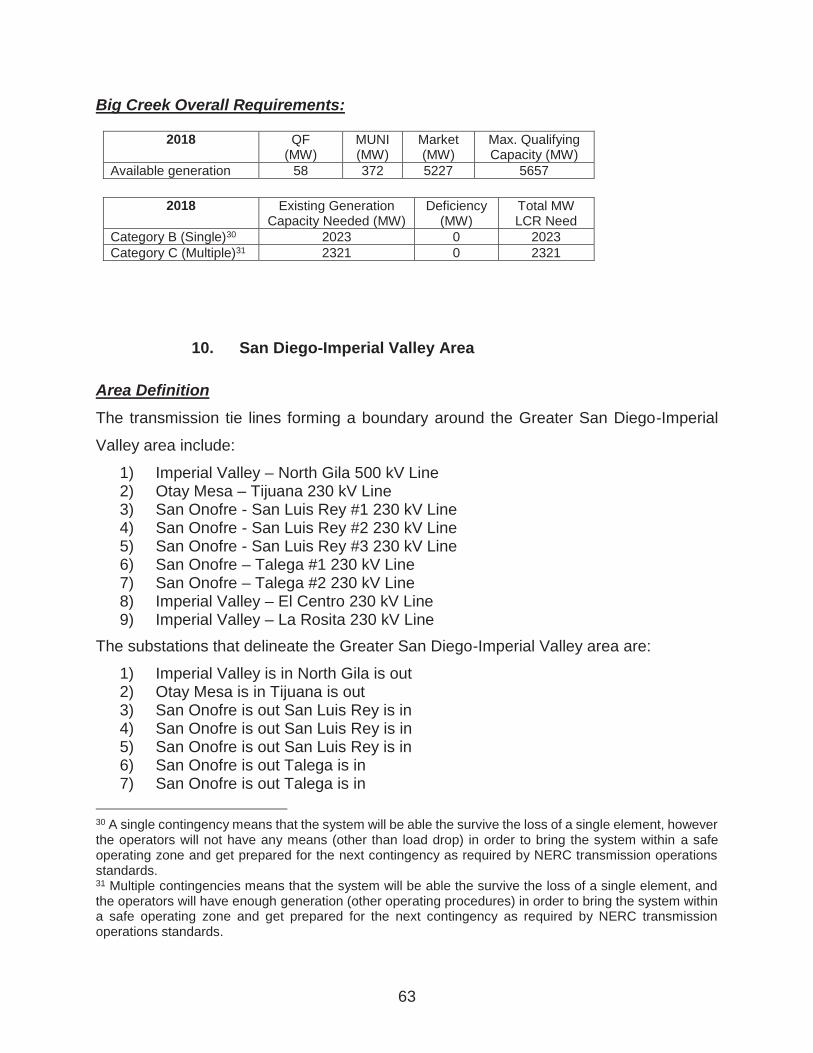
63
Big Creek Overall Requirements:
2018 QF (MW)
MUNI (MW)
Market (MW)
Max. Qualifying Capacity (MW)
Available generation 58 372 5227 5657
2018 Existing Generation Capacity Needed (MW)
Deficiency (MW)
Total MW LCR Need
Category B (Single)30 2023 0 2023 Category C (Multiple)31 2321 0 2321
10. San Diego-Imperial Valley Area Area Definition The transmission tie lines forming a boundary around the Greater San Diego-Imperial
Valley area include:
1) Imperial Valley – North Gila 500 kV Line 2) Otay Mesa – Tijuana 230 kV Line 3) San Onofre - San Luis Rey #1 230 kV Line 4) San Onofre - San Luis Rey #2 230 kV Line 5) San Onofre - San Luis Rey #3 230 kV Line 6) San Onofre – Talega #1 230 kV Line 7) San Onofre – Talega #2 230 kV Line 8) Imperial Valley – El Centro 230 kV Line 9) Imperial Valley – La Rosita 230 kV Line
The substations that delineate the Greater San Diego-Imperial Valley area are:
1) Imperial Valley is in North Gila is out 2) Otay Mesa is in Tijuana is out 3) San Onofre is out San Luis Rey is in 4) San Onofre is out San Luis Rey is in 5) San Onofre is out San Luis Rey is in 6) San Onofre is out Talega is in 7) San Onofre is out Talega is in
30 A single contingency means that the system will be able the survive the loss of a single element, however the operators will not have any means (other than load drop) in order to bring the system within a safe operating zone and get prepared for the next contingency as required by NERC transmission operations standards. 31 Multiple contingencies means that the system will be able the survive the loss of a single element, and the operators will have enough generation (other operating procedures) in order to bring the system within a safe operating zone and get prepared for the next contingency as required by NERC transmission operations standards.
64
8) Imperial Valley is in El Centro is out 9) Imperial Valley is in La Rosita is out
Load:
The CEC-adopted demand forecast for 2018 from the 2017-2027 Mid Baseline, Low
AAEE savings for 1-in-10 heat wave forecast is 4,786 MW32 (this is the net value that
includes loads, 125 MW of losses and 81 MW AAEE). The total adjusted demand after
including 138 MW peak shift adjustment modeled in the study is 4,924 MW.
List of physical units: See Appendix A.
Major new projects modeled: 1. 2nd Encina 230/138 bank #61
2. Encina power plant unit #1 retirement
3. TL6906 Mesa Rim rearrangement
4. Salt Creek 69 kV substation
5. Vine 69 kV substation
6. Bay Boulevard 230 kV substation
7. Sycamore - Penasquitos 230 kV line (In-service by June 30, 2018)
8. Imperial Valley phase shifting transformers
9. Miguel synchronous condensers (2x225 Mvar)
10. San Luis Rey synchronous condensers (2x225 Mvar)
11. San Onofre synchronous condenser (1x225 Mvar)
12. New capacitors at Pendlenton and Basilone 69 kV substations
13. Storage projects at Escondido (3x10 MW) and El Cajon (7.5 MW)
Critical Contingency Analysis Summary:
El Cajon Sub-area: The most critical contingency for the El Cajon sub-area is the loss of the El Cajon
32 CEC-adopted 2016 IEPR demand forecast for 2017-2027, March 2017, for Mid Demand Baseline Case with Low AAEE Savings.

65
Energy Center unit followed by the loss of Miguel-Granite-Los Coches 69 kV line
(TL632) or vice versa, which could thermally overload the El Cajon – Los Coches 69 kV
line (TL631). This limiting contingency establishes a LCR of 75 MW in 2018 as the
minimum generation capacity necessary for reliable load serving capability within this
sub-area.
Effectiveness factors: All units within this sub-area have the same effectiveness factor.
Mission Sub-area The ISO approved three transmission projects (reconductoring of the Mission-Mesa
Heights (TL676) and Kearny-Mission (TL663) 69 kV lines, and TL600 loop-in to Mesa
Heights substation) in the 2010-2011 and 2015~2016 TPPs, which will ultimately
eliminate local capacity requirement for the four remaining peaking units at Kearney in
the Mission sub-area. Without these three projects in-service by the summer of 2018,
the most critical contingency for the Mission sub-area was the loss of TL663 followed by
the loss of TL676 or vice versa, which could thermally overload the Kearny-Clairmont
Tap 69 kV line (TL600). This limiting contingency could establish an LCR of 28 MW in
2018 as the minimum generation capacity necessary for reliable load serving capability
within this sub-area. However, the ISO concurred in SDG&E’s proposal to implement a
remedial action scheme (RAS) as an interim solution to eliminate the Mission LCR sub-
area since SDG&E provided several reasons for needing the removal of the Kearny
peakers33. The proposed Mesa Heights RAS will be in service by summer 2018 to
mitigate the need for the Kearney peakers.
Esco Sub-area The most critical contingency for the Esco sub-area is the loss of one of the two
Sycamore-Pomerado 69 kV lines (TL6915 or TL6924) followed by the loss of Esco -
33 In SDG&E’s comments submitted on the draft 2018 Local Capacity Technical Report they provided information regarding the age and condition of the existing equipment and the need to expand the distribution facilities at Kearny Substation which supported the need to rebuild Kearny substation. This substation work requires that the four Kearny peaking generation units be removed by the end of 2017.
66
Escondido 69kV line (TL6908), which could thermally overload the remaining
Sycamore-Pomerado 69 kV line. This limiting contingency establishes a LCR of 8 MW
in 2018 as the minimum generation capacity necessary for reliable load serving
capability within this sub-area.
It is recommended to retain 137 MW of generation resources in the sub-area, if the in-
service date for Sycamore - Penasquitos 230 kV line project is expected to be later than
June 1, 2018.
Effectiveness factors: The only unit within this sub-area is needed so no effectiveness factor is required.
Pala Sub-area The most critical contingency for the Pala sub-area is the loss of Pendleton – San Luis
Rey 69 kV line (TL6912) followed by the loss of Lilac - Pala 69kV line (TL6932) which
could thermally overload the Melrose – Morro Hill Tap 69 kV line (TL694). This limiting
contingency establishes a LCR of 23 MW in 2018 as the minimum generation capacity
necessary for reliable load serving capability within this sub-area.
Effectiveness factors: All the units within this sub-area have the same effectiveness factor.
Border Sub-area The most critical contingency for the Border sub-area is the loss of Bay Boulevard –
Otay 69kV line #1 (TL645) followed by Bay Boulevard - Otay 69kV line #2 (TL646),
which could overload the Imperial Beach – Bay Boulevard 69 kV line (TL647). This
limiting contingency establishes a local capacity need of 50 MW in 2018 as the
minimum capacity necessary for reliable load serving capability within this sub-area.
Effectiveness factors: All units within this sub-area have the same effectiveness factor.

67
Miramar Sub-area No local capacity requirement is identified in 2018 due to the Sycamore - Penasquitos
230 kV line project.
It is recommended to retain 38 MW of Miramar Energy Facility in the sub-area, if the in-
service date for Sycamore - Penasquitos 230 kV line project is expected to be later than
June 1, 2018.
Effectiveness factors: All units within this sub-area have the same effectiveness factor.
Overall LA Basin Area and San Diego-Imperial Valley Area Combined: The LCR needs of the LA Basin area and San Diego-Imperial Valley area have been
considered through a coordinated study process to ensure that the resource needs for
each LCR area not only satisfy its own area reliability need but also provide support to
the other area if needed. With the retirement of the San Onofre Nuclear Generating
Station, and the impending retirement of other once-through cooled generation in the LA
Basin and San Diego areas, the two areas are electrically interdependent on each
other. Resource needs in one area are dependent on the amount of resources that are
dispatched for the adjacent area and vice versa. The SDG&E system, being the
southernmost electrical area in the ISO’s southern system and smaller of the overall LA
Basin-San Diego-Imperial Valley area, is evaluated first for its LCR needs. The LCR
needs for the LA Basin and its subareas are then evaluated after the initial
determination of the LCR needs for the overall San Diego-Imperial Valley area. The
LCR needs in the overall San Diego-Imperial Valley area are then re-checked to ensure
that the initial determination is still adequate. This iterative process is needed due to the
interaction of resources on the LCR needs in the LA Basin-San Diego-Imperial Valley
area. With this process, the LCR needs for the respective areas are coordinated within
the overall LA Basin-San Diego-Imperial Valley area. It is important to note that the San
Diego subarea is a part or subset of the overall San Diego-Imperial Valley area.

68
An additional consideration is whether the Aliso Canyon gas storage constraint needs to
be evaluated to determine the LCR needs for the LA Basin and the San Diego-Imperial
Valley for 2018. At this time, the ISO is not performing analyses that would involve
balancing resources between the LA Basin and San Diego areas similar to the 2017
LCR due to the benefits of the enhanced balancing rules as the CPUC has recognized
the effectiveness of tighter non-core balancing rules. Based on the recent CPUC Public
Utilities Code Section 715 report34, dated January 17, 2017, on page 15, the CPUC
indicated that the 150 mmcf potential imbalance has been offset by the new balancing
rules and directly reduces the amount of the original curtailment identified in the four
summer technical scenarios involving various levels of gas facility outages. However, as
Southern California Gas Company has informed the CPUC in its February 17, 2017
Storage Safety Enhancement Plan, it is important to note that there are potential
deliverability impacts due to tubing flow only operation of the remaining gas storage
fields at Goleta, Playa Del Rey and Honor Rancho. More study is necessary to
understand the meaning and the extent of the tubing only production limitation.
As mentioned above, the overall LA Basin-San Diego-Imperial Valley LCR needs were
determined by evaluating the LCR needs in the San Diego-Imperial Valley LCR area
first, and then determining the LCR needs for the LA Basin. The total LCR needs for the
combined LA Basin-San Diego-Imperial Valley area are the sum of the LCR needs for
the LA Basin and the San Diego-Imperial Valley area.
The following is the discussion of the LCR needs for each of these respective areas:
1. Overall San Diego-Imperial Valley Area:
The most critical contingency resulting in thermal loading concerns for the overall San
Diego-Imperial Valley area is the G-1/N-1 (Category B) overlapping outage that involves
the loss of the TDM combined cycled power plant (593 MW), system readjustment,
followed by the loss of the Imperial Valley – North Gila 500 kV line or vice versa
34 http://www.cpuc.ca.gov/uploadedFiles/CPUC_Public_Website/Content/News_Room/News_and_Updates/AlisoGas1-9-715.pdf

69
(Category C). This overlapping contingency could thermally overload the Imperial Valley
– El Centro 230 kV line (i.e., the “S” line) . This contingency establishes a total local
capacity need for of 4,032 MW in 2018 as the resource capacity necessary for reliable
load serving capability within the overall San Diego – Imperial Valley area.
The corresponding LA Basin LCR need associated with this contingency and level of
LCR need for the San Diego – Imperial Valley is 7,300 MW.
Effectiveness factors: See Appendix B - Table titled San Diego.
For other helpful procurement information please read procedure 2210Z Effectiveness
Factors under 7820 (T-132Z) posted at: http://www.caiso.com/Documents/2210Z.pdf
2. San Diego Sub-area:
The San Diego sub-area is part of the overall San Diego-Imperial Valley LCR area. The
LCR need for the San Diego sub-area can either be caused by the larger need for the
San Diego-Imperial Valley area (as discussed in item #1 above), or be caused by other
outages that exclusively affect the San Diego sub-area only. The ultimate San Diego
sub-area LCR need will be determined by the larger requirement of these analyses.
For the outages that exclusively affect the San Diego sub-area only, it is the overlapping
N-1-1 of the ECO-Miguel 500 kV line, system readjustment, followed by the outage of
the Ocotillo-Suncrest 500 kV line. The limiting constraint is the post-transient voltage
instability, causing an LCR need of 2,157 MW in 2018 for the San Diego sub-area. The
LCR need for the San Diego sub-area based on this 500 kV line N-1-1 contingency is
smaller than the need determined in item #1 above. The addition of the synchronous
condenser projects in Orange County and San Diego areas help mitigate this
contingency which used to be the primary driver of LCR need for the San Diego sub-
area.
3. Overall LA Basin Area:
As discussed earlier, to determine whether the aforementioned LCR need in the LA

70
Basin is adequate for the LA Basin LCR area, the ISO performed contingency analyses
in the LA Basin after the evaluation of the LCR need for the San Diego-Imperial Valley
LCR. The most critical contingency resulting in thermal loading concerns for the overall
LA Basin is the loss of the Lugo – Victorville 500 kV line, system readjustment, followed
by the loss of Sylmar – Gould 230 kV line or vice versa. This overlapping contingency
could thermally overload the Sylmar - Eagle Rock 230 kV line. This establishes a total
local capacity need in LA Basin area of 7,525 MW in 2018 as the minimum resource
capacity necessary for reliable load serving capability within this sub-area.
The overall combined LA Basin-San Diego-Imperial Valley area LCR need has a total of
11,557 MW in 2018 time frame as follows: 7,525 MW in the LA Basin and 4,032 MW in
the San Diego-Imperial Valley area as the minimum capacity necessary for reliable load
serving capability within these areas. The most limiting constraint for this overall
combined LA Basin-San Diego-Imperial Valley area is the thermal loading concerns on
the Sylmar – Eagle Rock 230 kV line under an N-1-1 overlapping contingency. This is
closely followed by the limiting constraint on the “S” line between IID and SDG&E under
an overlapping G-1/N-1 contingency or vice versa.
Sensitivity assessment with Imperial Valley solar generation unavailable at 7 p.m. for a peak load day
The purpose of performing this sensitivity study was to evaluate the potential impact to the LCR requirements for the LA Basin-San Diego-Imperial Valley area for the scenario in which the Imperial Valley solar generation is unavailable to provide resource needs to mitigate loading concern on the Imperial Valley – El Centro 230 kV line under an overlapping G-1/N-1 contingency of the combined cycled TDM generation, system readjustment, followed by an outage on the Imperial Valley – North Gila 500 kV line. Since the solar generation in the Imperial Valley area are effective in mitigating this line overloading concern, its unavailability at the time of the area peak load at 7 p.m. could affect the LCR requirements in the overall LA Basin, San Diego subarea, and the overall San Diego – Imperial Valley area. This analysis is for risk assessment purposes. The existing practice is to establishing local capacity requirements for use in the resource adequacy (RA) process based on individual resource net qualifying capacity (NQC) as

71
dictated by accounting rules of Local Regulatory Agencies (LRA).
For this sensitivity assessment, the ISO reviewed the availability of the solar central plants in the Imperial Valley area at 7 p.m. on September 26, 2016, using archived data from the ISO Energy Management System (EMS). This date had high loads for SDG&E in 2016. The Imperial Valley solar generation had either 0 MW output or was negligible (i.e., less than 1% of its maximum output which is within 2% tolerance of the archived real-time data). The study case was modified by reducing Imperial Valley solar generation from its NQC values to no output. The limiting contingency is the overlapping G-1/N-1 of TDM combined cycled generation, system readjustment, followed by the loss of the Imperial Valley – North Gila 500 kV line. This contingency could cause an overloading concern on the Imperial Valley – El Centro 230 kV line. The LCR requirements for the combined LA Basin-San Diego-Imperial Valley area, based on this scenario are: LA Basin LCR needs at 7,604 MW and San Diego-Imperial Valley area LCR needs at 4,142 MW (including San Diego sub-area LCR needs at 3,145 MW).
The following are key observations when comparing the LCR needs of the sensitivity study to the LCR needs based on the currently established NQC values:
With less solar generating resources being available in the Imperial Valley at 7 p.m., the next effective generating resources are located in the San Diego sub-area. This increases the San Diego sub-area LCR needs to 3,145 MW (an increase of about 750 MW as there are no further resources in the Imperial Valley area that can be dispatched, and the next available resources are located in the San Diego sub-area).
The total LCR needs for the overall San Diego – Imperial Valley area increase to 4,142 MW, representing an increase of 101 MW as less effective generating resources in the San Diego sub-area are dispatched due to unavailability of more effective solar generation at 7 p.m. timeframe.
The LA Basin LCR needs were increased slightly by about 79 MW, with the same reason for the increase as in the second bullet discussion above.
Sensitivity assessment without the Sycamore – Penasquitos 230 kV line
This study is a sensitivity assessment showing the LCR needs without the Sycamore – Penasquitos 230 kV line. Currently this project is to be in service at the end of June,

72
2018, after the June 1, 2018 in-service date required by existing practice.
The Bay Blvd. Substation project was proposed to replace the existing South Bay Substation located approximately 0.5 miles to the north of the site of the new substation after the retirement of the once-through-cooled South Bay Power Plant.
With the addition of the new Bay Blvd. Substation, but without the new Sycamore – Penasquitos 230 kV transmission line in service, the ISO has identified the following overloading concern under a P6 (N-1-1) contingency of the Miguel – Miguel Tap – Bay Blvd. – Otay Mesa 230 kV line, followed by an outage of the Mission – Old Town Tap – Silvergate – Old Town 230 kV line. The reliability concerns occur as the loads previously served from the South Bay 138 kV transmission are transferred to the 230 kV transmission system serving Mission, Old Town, Silvergate and Bay Blvd. substations. Under the above mentioned P6 contingency conditions, the Miguel and Otay Mesa source for the Bay Blvd. Substation is removed, forcing power to flow on the remaining source to come from Mission Substation, overloading the remaining Mission-Old Town 230 kV line. This loading concern will be mitigated upon implementation of the Sycamore-Penasquitos 230 kV line, as this new line will provide a strong source to the Penasquitos and Old Town substations, relieving the overloading conditions on the Mission-Old Town 230 kV line. The following is a summary of the overloading conditions under this P6 (N-1-1) contingency.
1. With no dispatch of the Encina generation, the Mission – Old Town 230 kV line is loaded up to 137% of its line rating (the Mission – Old Town has the same rating under normal and emergency conditions) as a result of an overlapping N-1-1 outage of Miguel – Miguel Tap – Bay Blvd. – Otay Mesa 230 kV line, followed by an outage of the Mission – Old Town Tap – Silvergate – Old Town 230 kV line.
2. The above loading concern will be reduced to about 117% with the dispatch of entire Encina generation, system adjustment that includes implementation of all 20-minute “fast” demand response and all of battery energy storage with potential load curtailment impact of approximately 199 MW from three substations (i.e., Old Town, Pacific Beach and Sampson).
3. To mitigate the above loading concern, the following additional interim measure would need to be implemented as part of the system adjustment between the first and second contingency:

73
Curtail 643 MW of generation from Otay Mesa and a small portion of Pio Pico to reduce the potential overloading concern on the Mission – Old Town 230 kV line upon the second N-1 contingency;
With the generation curtailment above, the amount of load that would need to be curtailed is approximately 145 MW from Station “B” and Old Town Substation. This amount of load curtailment is the deficiency identified for the new Old Town sub-area.
Dispatch all available resources in the San Diego sub-area.
The total LCR need for the San Diego – Imperial Valley area would be 4,308 MW, which includes an estimated 145 MW deficiency.
Net Qualifying Capacity at time of net peak demand35
The expectation of the Resource Adequacy (RA) program is to provide resources “when needed and where needed” in order to ensure safe and reliable operation of the grid in real time. The current Qualifying Capacity (QC) rules of Local Regulatory Agencies (LRAs) – and correspondingly Net Qualifying Capacity rules of the ISO - have not adjusted to changes in real time conditions and more specifically the shift of load to later hours of the day (6 or 7 p.m.). This misalignment between capacity determinations and peak demands on the transmission system may result in critical local resources not being available during the most stressed demand conditions (net peak). As the ISO is mandated to maintain local and system reliability at all hours of the day during the entire year, this misalignment increases the probability that other procurement, such as Capacity Procurement Mechanism (CPM) or Reliability Must Run (RMR), may be needed.
Changes compared to last year’s results: The 2018 adjusted peak shift demand for the San Diego area is higher by about 84 MW
when compared to last year study. The overall LCR needs for the San Diego-Imperial
Valley are increased over the reported 2017 LCR value (3,570 MW) by 462 MW.
However in the 2017 LCR report, the San Diego-Imperial Valley study and the LA
Basin-San Diego overall study had inconsistent assumptions regarding LA Basin
35 In this context the net peak demand is also referred to as net peak sales, and is a reference to the load less behind the meter generation.
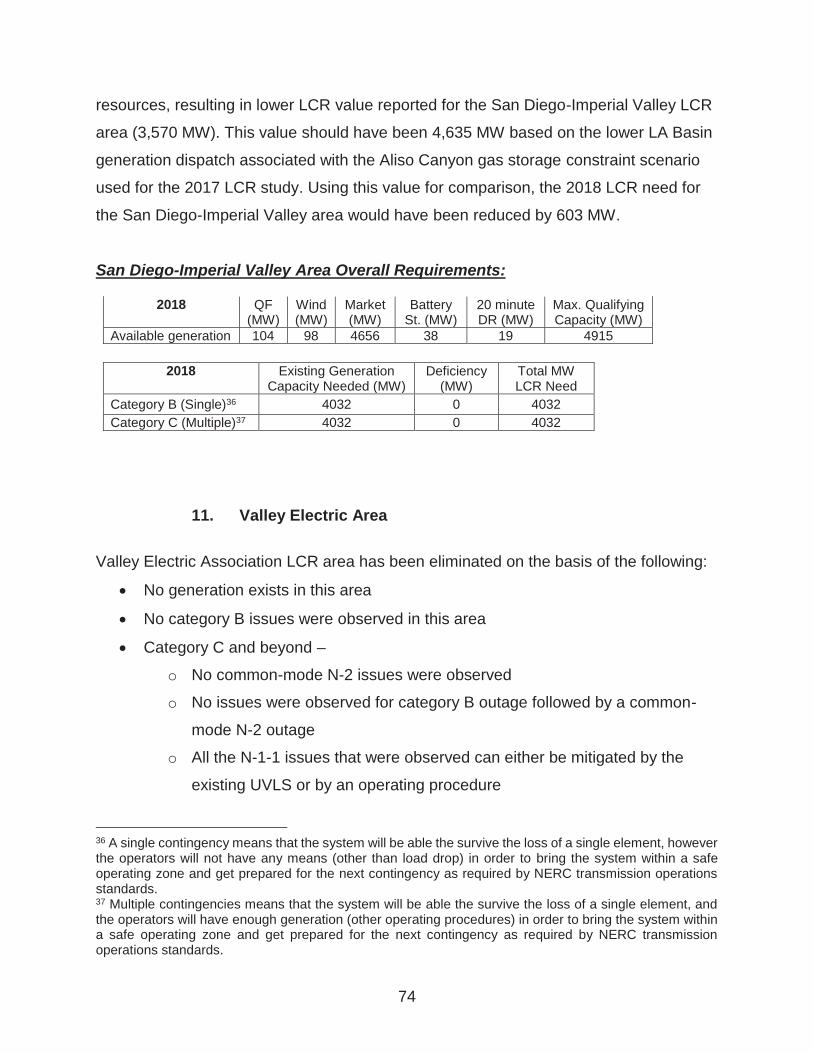
74
resources, resulting in lower LCR value reported for the San Diego-Imperial Valley LCR
area (3,570 MW). This value should have been 4,635 MW based on the lower LA Basin
generation dispatch associated with the Aliso Canyon gas storage constraint scenario
used for the 2017 LCR study. Using this value for comparison, the 2018 LCR need for
the San Diego-Imperial Valley area would have been reduced by 603 MW.
San Diego-Imperial Valley Area Overall Requirements:
2018 QF (MW)
Wind (MW)
Market (MW)
Battery St. (MW)
20 minute DR (MW)
Max. Qualifying Capacity (MW)
Available generation 104 98 4656 38 19 4915
2018 Existing Generation Capacity Needed (MW)
Deficiency (MW)
Total MW LCR Need
Category B (Single)36 4032 0 4032 Category C (Multiple)37 4032 0 4032
11. Valley Electric Area
Valley Electric Association LCR area has been eliminated on the basis of the following:
No generation exists in this area
No category B issues were observed in this area
Category C and beyond –
o No common-mode N-2 issues were observed
o No issues were observed for category B outage followed by a common-
mode N-2 outage
o All the N-1-1 issues that were observed can either be mitigated by the
existing UVLS or by an operating procedure
36 A single contingency means that the system will be able the survive the loss of a single element, however the operators will not have any means (other than load drop) in order to bring the system within a safe operating zone and get prepared for the next contingency as required by NERC transmission operations standards. 37 Multiple contingencies means that the system will be able the survive the loss of a single element, and the operators will have enough generation (other operating procedures) in order to bring the system within a safe operating zone and get prepared for the next contingency as required by NERC transmission operations standards.

App
endi
x A
- L
ist o
f phy
sica
l res
ourc
es b
y PT
O, l
ocal
are
a an
d m
arke
t ID
75
V.
App
endi
x A
– Li
st o
f phy
sica
l res
ourc
es b
y PT
O, l
ocal
are
a an
d m
arke
t ID
PTO
M
KT/
SCH
ED
RES
OU
RC
E ID
B
US
# B
US
NA
ME
kV
NQ
C
UN
IT
ID
LCR
AR
EA
NA
ME
LCR
SU
B-A
REA
N
AM
E N
QC
C
omm
ents
C
AIS
O T
ag
PG
&E
A
LME
GT_
1_U
NIT
1
3811
8 A
LMD
AC
T1
13.8
23
.80
1 B
ay A
rea
Oak
land
MU
NI
PG
&E
A
LME
GT_
1_U
NIT
2
3811
9 A
LMD
AC
T2
13.8
24
.40
1 B
ay A
rea
Oak
land
MU
NI
PG
&E
B
AN
KP
P_2
_NS
PIN
38
820
DE
LTA
A
13.2
11
.55
1 B
ay A
rea
Con
tra C
osta
P
umps
M
UN
I P
G&
E
BA
NK
PP
_2_N
SP
IN
3882
0 D
ELT
A A
13
.2
11.5
5 2
Bay
Are
a C
ontra
Cos
ta
Pum
ps
MU
NI
PG
&E
B
AN
KP
P_2
_NS
PIN
38
820
DE
LTA
A
13.2
11
.55
3 B
ay A
rea
Con
tra C
osta
P
umps
M
UN
I P
G&
E
BA
NK
PP
_2_N
SP
IN
3881
5 D
ELT
A B
13
.2
11.5
5 4
Bay
Are
a C
ontra
Cos
ta
Pum
ps
MU
NI
PG
&E
B
AN
KP
P_2
_NS
PIN
38
815
DE
LTA
B
13.2
11
.55
5 B
ay A
rea
Con
tra C
osta
P
umps
M
UN
I P
G&
E
BA
NK
PP
_2_N
SP
IN
3877
0 D
ELT
A C
13
.2
11.5
5 6
Bay
Are
a C
ontra
Cos
ta
Pum
ps
MU
NI
PG
&E
B
AN
KP
P_2
_NS
PIN
38
770
DE
LTA
C
13.2
11
.55
7 B
ay A
rea
Con
tra C
osta
P
umps
M
UN
I P
G&
E
BA
NK
PP
_2_N
SP
IN
3876
5 D
ELT
A D
13
.2
11.5
5 8
Bay
Are
a C
ontra
Cos
ta
Pum
ps
MU
NI
PG
&E
B
AN
KP
P_2
_NS
PIN
38
765
DE
LTA
D
13.2
11
.55
9 B
ay A
rea
Con
tra C
osta
P
umps
M
UN
I P
G&
E
BA
NK
PP
_2_N
SP
IN
3876
0 D
ELT
A E
13
.2
11.5
5 10
B
ay A
rea
Con
tra C
osta
P
umps
M
UN
I P
G&
E
BA
NK
PP
_2_N
SP
IN
3876
0 D
ELT
A E
13
.2
11.5
5 11
B
ay A
rea
Con
tra C
osta
P
umps
M
UN
I P
G&
E
BR
DS
LD_2
_HIW
IND
32
172
HIG
HW
IND
S 34
.5
37.7
1 1
Bay
Are
a C
ontra
Cos
ta
Aug
NQ
C
Win
d P
G&
E
BR
DS
LD_2
_MTZ
UM
2 32
179
MN
TZU
MA
2 0.
69
23.3
8 1
Bay
Are
a C
ontra
Cos
ta
Aug
NQ
C
Win
d P
G&
E
BR
DS
LD_2
_MTZ
UM
A
3218
8 H
IGH
WN
D3
0.69
8.
86
1 B
ay A
rea
Con
tra C
osta
A
ug N
QC
W
ind
PG
&E
B
RD
SLD
_2_S
HIL
O1
3217
6 S
HIL
OH
34
.5
48.2
0 1
Bay
Are
a C
ontra
Cos
ta
Aug
NQ
C
Win
d P
G&
E
BR
DS
LD_2
_SH
ILO
2 32
177
SH
ILO
H 2
34
.5
40.6
2 1
Bay
Are
a C
ontra
Cos
ta
Aug
NQ
C
Win
d P
G&
E
BR
DS
LD_2
_SH
LO3A
32
191
SH
ILO
H3
0.5
8 23
.03
1 B
ay A
rea
Con
tra C
osta
A
ug N
QC
W
ind
PG
&E
B
RD
SLD
_2_S
HLO
3B
3219
4 S
HIL
OH
4 0.
58
35.2
0 1
Bay
Are
a C
ontra
Cos
ta
Aug
NQ
C
Win
d
PG
&E
C
ALP
IN_1
_AG
NEW
35
860
OLS
-AG
NE
9.
11
28.0
0 1
Bay
Are
a S
an J
ose,
Sou
th
Bay
-Mos
s La
ndin
g A
ug N
QC
M
arke
t
PG
&E
C
AY
TNO
_2_V
AS
CO
30
531
0162
-WD
23
0 4.
30
FW
Bay
Are
a C
ontra
Cos
ta
Aug
NQ
C
Mar
ket
PG
&E
C
LRM
TK_1
_QF
0.
00
B
ay A
rea
Oak
land
N
ot m
odel
ed
QF/
Sel
fgen
P
G&
E
CO
CO
PP
_2_C
TG1
3318
8 M
AR
SH
CT1
16
.4
200.
80
1 B
ay A
rea
Con
tra C
osta
A
ug N
QC
M
arke
t P
G&
E
CO
CO
PP
_2_C
TG2
3318
8 M
AR
SH
CT2
16
.4
199.
90
2 B
ay A
rea
Con
tra C
osta
A
ug N
QC
M
arke
t P
G&
E
CO
CO
PP
_2_C
TG3
3318
9 M
AR
SH
CT3
16
.4
199.
50
3 B
ay A
rea
Con
tra C
osta
A
ug N
QC
M
arke
t P
G&
E
CO
CO
PP
_2_C
TG4
3318
9 M
AR
SH
CT4
16
.4
201.
40
4 B
ay A
rea
Con
tra C
osta
A
ug N
QC
M
arke
t
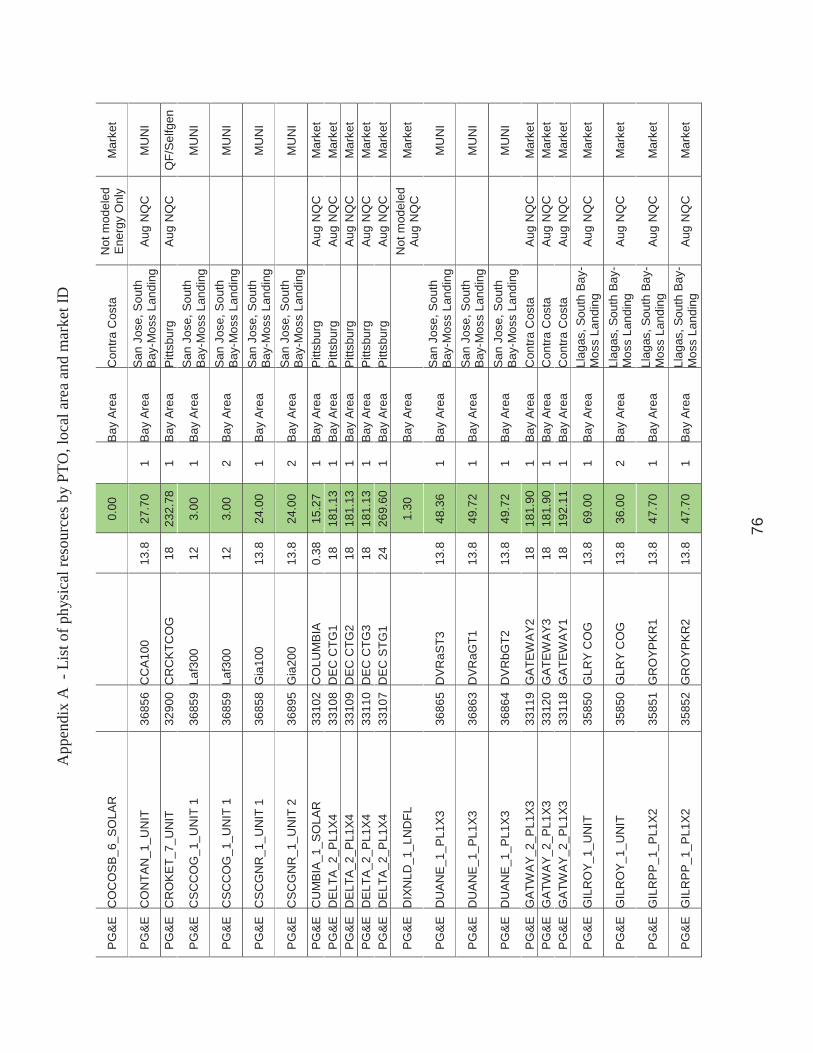
App
endi
x A
- L
ist o
f phy
sica
l res
ourc
es b
y PT
O, l
ocal
are
a an
d m
arke
t ID
76
PG
&E
C
OC
OS
B_6
_SO
LAR
0.00
Bay
Are
a C
ontra
Cos
ta
Not
mod
eled
E
nerg
y O
nly
Mar
ket
PG
&E
C
ON
TAN
_1_U
NIT
36
856
CC
A10
0 13
.8
27.7
0 1
Bay
Are
a S
an J
ose,
Sou
th
Bay
-Mos
s La
ndin
g A
ug N
QC
M
UN
I
PG
&E
C
RO
KE
T_7_
UN
IT
3290
0 C
RC
KTC
OG
18
23
2.78
1
Bay
Are
a P
ittsb
urg
Aug
NQ
C
QF/
Sel
fgen
PG
&E
C
SC
CO
G_1
_UN
IT 1
36
859
Laf3
00
12
3.00
1
Bay
Are
a S
an J
ose,
Sou
th
Bay
-Mos
s La
ndin
g
MU
NI
PG
&E
C
SC
CO
G_1
_UN
IT 1
36
859
Laf3
00
12
3.00
2
Bay
Are
a S
an J
ose,
Sou
th
Bay
-Mos
s La
ndin
g
MU
NI
PG
&E
C
SC
GN
R_1
_UN
IT 1
36
858
Gia
100
13.8
24
.00
1 B
ay A
rea
San
Jos
e, S
outh
B
ay-M
oss
Land
ing
M
UN
I
PG
&E
C
SC
GN
R_1
_UN
IT 2
36
895
Gia
200
13.8
24
.00
2 B
ay A
rea
San
Jos
e, S
outh
B
ay-M
oss
Land
ing
M
UN
I
PG
&E
C
UM
BIA
_1_S
OLA
R
3310
2 C
OLU
MB
IA
0.38
15
.27
1 B
ay A
rea
Pitt
sbur
g A
ug N
QC
M
arke
t P
G&
E
DE
LTA
_2_P
L1X4
33
108
DE
C C
TG1
18
181.
13
1 B
ay A
rea
Pitt
sbur
g A
ug N
QC
M
arke
t P
G&
E
DE
LTA
_2_P
L1X4
33
109
DE
C C
TG2
18
181.
13
1 B
ay A
rea
Pitt
sbur
g A
ug N
QC
M
arke
t P
G&
E
DE
LTA
_2_P
L1X4
33
110
DE
C C
TG3
18
181.
13
1 B
ay A
rea
Pitt
sbur
g A
ug N
QC
M
arke
t P
G&
E
DE
LTA
_2_P
L1X4
33
107
DEC
STG
1 24
26
9.60
1
Bay
Are
a P
ittsb
urg
Aug
NQ
C
Mar
ket
PG
&E
D
IXN
LD_1
_LN
DFL
1.30
Bay
Are
a
Not
mod
eled
A
ug N
QC
M
arke
t
PG
&E
D
UA
NE
_1_P
L1X3
36
865
DV
RaS
T3
13.8
48
.36
1 B
ay A
rea
San
Jos
e, S
outh
B
ay-M
oss
Land
ing
M
UN
I
PG
&E
D
UA
NE
_1_P
L1X3
36
863
DVR
aGT1
13
.8
49.7
2 1
Bay
Are
a S
an J
ose,
Sou
th
Bay
-Mos
s La
ndin
g
MU
NI
PG
&E
D
UA
NE
_1_P
L1X3
36
864
DVR
bGT2
13
.8
49.7
2 1
Bay
Are
a S
an J
ose,
Sou
th
Bay
-Mos
s La
ndin
g
MU
NI
PG
&E
G
ATW
AY_
2_P
L1X3
33
119
GAT
EWA
Y2
18
181.
90
1 B
ay A
rea
Con
tra C
osta
A
ug N
QC
M
arke
t P
G&
E
GA
TWA
Y_2_
PL1
X3
3312
0 G
ATEW
AY3
18
18
1.90
1
Bay
Are
a C
ontra
Cos
ta
Aug
NQ
C
Mar
ket
PG
&E
G
ATW
AY_
2_P
L1X3
33
118
GAT
EWA
Y1
18
192.
11
1 B
ay A
rea
Con
tra C
osta
A
ug N
QC
M
arke
t
PG
&E
G
ILR
OY_
1_U
NIT
35
850
GLR
Y C
OG
13
.8
69.0
0 1
Bay
Are
a Ll
agas
, Sou
th B
ay-
Mos
s La
ndin
g A
ug N
QC
M
arke
t
PG
&E
G
ILR
OY_
1_U
NIT
35
850
GLR
Y C
OG
13
.8
36.0
0 2
Bay
Are
a Ll
agas
, Sou
th B
ay-
Mos
s La
ndin
g A
ug N
QC
M
arke
t
PG
&E
G
ILR
PP
_1_P
L1X2
35
851
GR
OYP
KR
1 13
.8
47.7
0 1
Bay
Are
a Ll
agas
, Sou
th B
ay-
Mos
s La
ndin
g A
ug N
QC
M
arke
t
PG
&E
G
ILR
PP
_1_P
L1X2
35
852
GR
OYP
KR
2 13
.8
47.7
0 1
Bay
Are
a Ll
agas
, Sou
th B
ay-
Mos
s La
ndin
g A
ug N
QC
M
arke
t
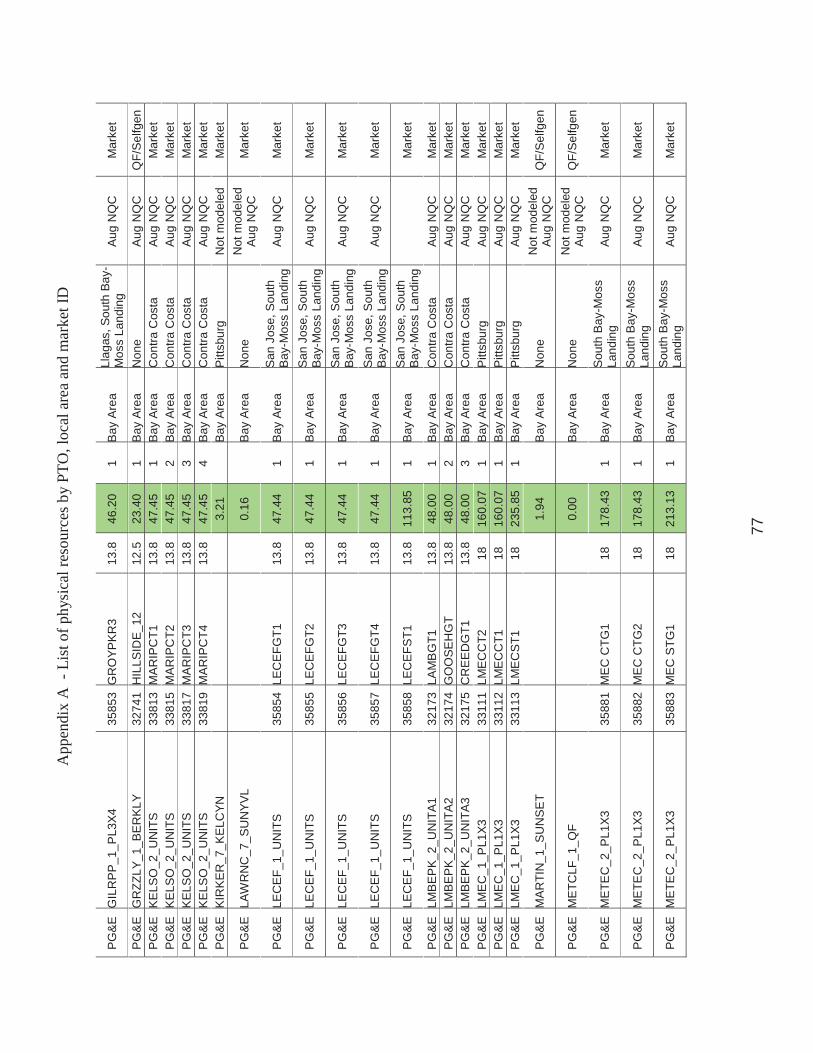
App
endi
x A
- L
ist o
f phy
sica
l res
ourc
es b
y PT
O, l
ocal
are
a an
d m
arke
t ID
77
PG
&E
G
ILR
PP
_1_P
L3X4
35
853
GR
OYP
KR
3 13
.8
46.2
0 1
Bay
Are
a Ll
agas
, Sou
th B
ay-
Mos
s La
ndin
g A
ug N
QC
M
arke
t
PG
&E
G
RZZ
LY_1
_BE
RK
LY
3274
1 H
ILLS
IDE
_12
12.5
23
.40
1 B
ay A
rea
Non
e A
ug N
QC
Q
F/S
elfg
en
PG
&E
K
ELS
O_2
_UN
ITS
33
813
MA
RIP
CT1
13
.8
47.4
5 1
Bay
Are
a C
ontra
Cos
ta
Aug
NQ
C
Mar
ket
PG
&E
K
ELS
O_2
_UN
ITS
33
815
MA
RIP
CT2
13
.8
47.4
5 2
Bay
Are
a C
ontra
Cos
ta
Aug
NQ
C
Mar
ket
PG
&E
K
ELS
O_2
_UN
ITS
33
817
MA
RIP
CT3
13
.8
47.4
5 3
Bay
Are
a C
ontra
Cos
ta
Aug
NQ
C
Mar
ket
PG
&E
K
ELS
O_2
_UN
ITS
33
819
MA
RIP
CT4
13
.8
47.4
5 4
Bay
Are
a C
ontra
Cos
ta
Aug
NQ
C
Mar
ket
PG
&E
K
IRK
ER
_7_K
ELC
YN
3.
21
B
ay A
rea
Pitt
sbur
g N
ot m
odel
ed
Mar
ket
PG
&E
LA
WR
NC
_7_S
UN
YVL
0.
16
B
ay A
rea
Non
e N
ot m
odel
ed
Aug
NQ
C
Mar
ket
PG
&E
LE
CE
F_1_
UN
ITS
35
854
LEC
EFG
T1
13.8
47
.44
1 B
ay A
rea
San
Jos
e, S
outh
B
ay-M
oss
Land
ing
Aug
NQ
C
Mar
ket
PG
&E
LE
CE
F_1_
UN
ITS
35
855
LEC
EFG
T2
13.8
47
.44
1 B
ay A
rea
San
Jos
e, S
outh
B
ay-M
oss
Land
ing
Aug
NQ
C
Mar
ket
PG
&E
LE
CE
F_1_
UN
ITS
35
856
LEC
EFG
T3
13.8
47
.44
1 B
ay A
rea
San
Jos
e, S
outh
B
ay-M
oss
Land
ing
Aug
NQ
C
Mar
ket
PG
&E
LE
CE
F_1_
UN
ITS
35
857
LEC
EFG
T4
13.8
47
.44
1 B
ay A
rea
San
Jos
e, S
outh
B
ay-M
oss
Land
ing
Aug
NQ
C
Mar
ket
PG
&E
LE
CE
F_1_
UN
ITS
35
858
LEC
EFS
T1
13.8
11
3.85
1
Bay
Are
a S
an J
ose,
Sou
th
Bay
-Mos
s La
ndin
g
Mar
ket
PG
&E
LM
BE
PK
_2_U
NIT
A1
3217
3 LA
MB
GT1
13
.8
48.0
0 1
Bay
Are
a C
ontra
Cos
ta
Aug
NQ
C
Mar
ket
PG
&E
LM
BE
PK
_2_U
NIT
A2
3217
4 G
OO
SEH
GT
13.8
48
.00
2 B
ay A
rea
Con
tra C
osta
A
ug N
QC
M
arke
t P
G&
E
LMB
EP
K_2
_UN
ITA
3 32
175
CR
EE
DG
T1
13.8
48
.00
3 B
ay A
rea
Con
tra C
osta
A
ug N
QC
M
arke
t P
G&
E
LME
C_1
_PL1
X3
3311
1 LM
EC
CT2
18
16
0.07
1
Bay
Are
a P
ittsb
urg
Aug
NQ
C
Mar
ket
PG
&E
LM
EC
_1_P
L1X3
33
112
LME
CC
T1
18
160.
07
1 B
ay A
rea
Pitt
sbur
g A
ug N
QC
M
arke
t P
G&
E
LME
C_1
_PL1
X3
3311
3 LM
EC
ST1
18
23
5.85
1
Bay
Are
a P
ittsb
urg
Aug
NQ
C
Mar
ket
PG
&E
M
AR
TIN
_1_S
UN
SE
T
1.94
Bay
Are
a N
one
Not
mod
eled
A
ug N
QC
Q
F/S
elfg
en
PG
&E
M
ETC
LF_1
_QF
0.
00
B
ay A
rea
Non
e N
ot m
odel
ed
Aug
NQ
C
QF/
Sel
fgen
PG
&E
M
ETE
C_2
_PL1
X3
3588
1 M
EC
CTG
1 18
17
8.43
1
Bay
Are
a S
outh
Bay
-Mos
s La
ndin
g A
ug N
QC
M
arke
t
PG
&E
M
ETE
C_2
_PL1
X3
3588
2 M
EC
CTG
2 18
17
8.43
1
Bay
Are
a S
outh
Bay
-Mos
s La
ndin
g A
ug N
QC
M
arke
t
PG
&E
M
ETE
C_2
_PL1
X3
3588
3 M
EC
STG
1 18
21
3.13
1
Bay
Are
a S
outh
Bay
-Mos
s La
ndin
g A
ug N
QC
M
arke
t

App
endi
x A
- L
ist o
f phy
sica
l res
ourc
es b
y PT
O, l
ocal
are
a an
d m
arke
t ID
78
PG
&E
M
ISS
IX_1
_QF
0.
01
B
ay A
rea
Non
e N
ot m
odel
ed
Aug
NQ
C
QF/
Sel
fgen
PG
&E
M
LPTA
S_7
_QFU
NTS
0.01
Bay
Are
a S
an J
ose,
Sou
th
Bay
-Mos
s La
ndin
g N
ot m
odel
ed
Aug
NQ
C
QF/
Sel
fgen
PG
&E
M
OS
SLD
_1_Q
F
0.00
Bay
Are
a
Not
mod
eled
A
ug N
QC
M
arke
t
PG
&E
M
OS
SLD
_2_P
SP
1 36
221
DU
KM
OSS
1 18
16
3.20
1
Bay
Are
a S
outh
Bay
-Mos
s La
ndin
g
Mar
ket
PG
&E
M
OS
SLD
_2_P
SP
1 36
222
DU
KM
OSS
2 18
16
3.20
1
Bay
Are
a S
outh
Bay
-Mos
s La
ndin
g
Mar
ket
PG
&E
M
OS
SLD
_2_P
SP
1 36
223
DU
KM
OSS
3 18
18
3.60
1
Bay
Are
a S
outh
Bay
-Mos
s La
ndin
g
Mar
ket
PG
&E
M
OS
SLD
_2_P
SP
2 36
224
DU
KM
OSS
4 18
16
3.20
1
Bay
Are
a S
outh
Bay
-Mos
s La
ndin
g
Mar
ket
PG
&E
M
OS
SLD
_2_P
SP
2 36
225
DU
KM
OSS
5 18
16
3.20
1
Bay
Are
a S
outh
Bay
-Mos
s La
ndin
g
Mar
ket
PG
&E
M
OS
SLD
_2_P
SP
2 36
226
DU
KM
OSS
6 18
18
3.60
1
Bay
Are
a S
outh
Bay
-Mos
s La
ndin
g
Mar
ket
PG
&E
N
EWA
RK
_1_Q
F
0.02
Bay
Are
a N
one
Not
mod
eled
A
ug N
QC
Q
F/S
elfg
en
PG
&E
O
AK
C_1
_EB
MU
D
1.
51
B
ay A
rea
Oak
land
N
ot m
odel
ed
Aug
NQ
C
MU
NI
PG
&E
O
AK
C_7
_UN
IT 1
32
901
OA
KLN
D 1
13
.8
55.0
0 1
Bay
Are
a O
akla
nd
M
arke
t P
G&
E
OA
K C
_7_U
NIT
2
3290
2 O
AK
LND
2
13.8
55
.00
1 B
ay A
rea
Oak
land
Mar
ket
PG
&E
O
AK
C_7
_UN
IT 3
32
903
OA
KLN
D 3
13
.8
55.0
0 1
Bay
Are
a O
akla
nd
M
arke
t P
G&
E
OX
MTN
_6_L
ND
FIL
3346
9 O
X_M
TN
4.16
1.
45
1 B
ay A
rea
Am
es
M
arke
t P
G&
E
OX
MTN
_6_L
ND
FIL
3346
9 O
X_M
TN
4.16
1.
45
2 B
ay A
rea
Am
es
M
arke
t P
G&
E
OX
MTN
_6_L
ND
FIL
3346
9 O
X_M
TN
4.16
1.
45
3 B
ay A
rea
Am
es
M
arke
t P
G&
E
OX
MTN
_6_L
ND
FIL
3346
9 O
X_M
TN
4.16
1.
45
4 B
ay A
rea
Am
es
M
arke
t P
G&
E
OX
MTN
_6_L
ND
FIL
3346
9 O
X_M
TN
4.16
1.
45
5 B
ay A
rea
Am
es
M
arke
t P
G&
E
OX
MTN
_6_L
ND
FIL
3346
9 O
X_M
TN
4.16
1.
45
6 B
ay A
rea
Am
es
M
arke
t P
G&
E
OX
MTN
_6_L
ND
FIL
3346
9 O
X_M
TN
4.16
1.
45
7 B
ay A
rea
Am
es
M
arke
t P
G&
E
PA
LALT
_7_C
OB
UG
4.50
Bay
Are
a N
one
Not
mod
eled
M
UN
I
PG
&E
R
ICH
MN
_7_B
AYE
NV
2.00
Bay
Are
a N
one
Not
mod
eled
A
ug N
QC
M
arke
t
PG
&E
R
US
CTY
_2_U
NIT
S
3530
4 R
US
ELC
T1
15
180.
15
1 B
ay A
rea
Am
es
No
NQ
C -
Pm
ax
Mar
ket

App
endi
x A
- L
ist o
f phy
sica
l res
ourc
es b
y PT
O, l
ocal
are
a an
d m
arke
t ID
79
PG
&E
R
US
CTY
_2_U
NIT
S
3530
5 R
US
ELC
T2
15
180.
15
2 B
ay A
rea
Am
es
No
NQ
C -
Pm
ax
Mar
ket
PG
&E
R
US
CTY
_2_U
NIT
S
3530
6 R
US
ELS
T1
15
237.
09
3 B
ay A
rea
Am
es
No
NQ
C -
Pm
ax
Mar
ket
PG
&E
R
VR
VEW
_1_U
NIT
A1
3317
8 R
VE
C_G
EN
13
.8
48.7
0 1
Bay
Are
a C
ontra
Cos
ta
Aug
NQ
C
Mar
ket
PG
&E
S
RIN
TL_6
_UN
IT
3346
8 S
RI I
NTL
9.
11
0.52
1
Bay
Are
a N
one
Aug
NQ
C
QF/
Sel
fgen
P
G&
E
STA
UFF
_1_U
NIT
33
139
STA
UFE
R
9.11
0.
07
1 B
ay A
rea
Non
e A
ug N
QC
Q
F/S
elfg
en
PG
&E
S
TOIL
S_1
_UN
ITS
32
921
CH
EV
GE
N1
13.8
0.
00
1 B
ay A
rea
Pitt
sbur
g A
ug N
QC
M
arke
t P
G&
E
STO
ILS
_1_U
NIT
S
3292
2 C
HE
VG
EN
2 13
.8
0.00
1
Bay
Are
a P
ittsb
urg
Aug
NQ
C
Mar
ket
PG
&E
S
TOIL
S_1
_UN
ITS
32
923
CH
EV
GE
N3
13.8
0.
00
3 B
ay A
rea
Pitt
sbur
g A
ug N
QC
M
arke
t P
G&
E
TID
WTR
_2_U
NIT
S
3315
1 FO
STE
R W
12
.5
4.95
1
Bay
Are
a P
ittsb
urg
Aug
NQ
C
Net
Sel
ler
PG
&E
TI
DW
TR_2
_UN
ITS
33
151
FOS
TER
W
12.5
4.
95
2 B
ay A
rea
Pitt
sbur
g A
ug N
QC
N
et S
elle
r P
G&
E
TID
WTR
_2_U
NIT
S
3315
1 FO
STE
R W
12
.5
3.77
3
Bay
Are
a P
ittsb
urg
Aug
NQ
C
Net
Sel
ler
PG
&E
U
NC
HE
M_1
_UN
IT
3292
0 U
NIO
N C
H
9.11
10
.95
1 B
ay A
rea
Pitt
sbur
g A
ug N
QC
Q
F/S
elfg
en
PG
&E
U
NO
CA
L_1_
UN
ITS
32
910
UN
OC
AL
12
0.
27
1 B
ay A
rea
Pitt
sbur
g A
ug N
QC
Q
F/S
elfg
en
PG
&E
U
NO
CA
L_1_
UN
ITS
32
910
UN
OC
AL
12
0.
27
2 B
ay A
rea
Pitt
sbur
g A
ug N
QC
Q
F/S
elfg
en
PG
&E
U
NO
CA
L_1_
UN
ITS
32
910
UN
OC
AL
12
0.
27
3 B
ay A
rea
Pitt
sbur
g A
ug N
QC
Q
F/S
elfg
en
PG
&E
U
SWN
DR
_2_S
MU
D
3216
9 S
OLA
NO
WP
21
22.4
3 1
Bay
Are
a C
ontra
Cos
ta
Aug
NQ
C
Win
d P
G&
E
USW
ND
R_2
_SM
UD
2 32
186
SO
LAN
O
34.
5 43
.15
1 B
ay A
rea
Con
tra C
osta
A
ug N
QC
W
ind
PG
&E
U
SWN
DR
_2_U
NIT
S
3216
8 E
XNC
O
9.11
4.
00
1 B
ay A
rea
Con
tra C
osta
A
ug N
QC
W
ind
PG
&E
U
SWP
JR_2
_UN
ITS
39
233
GR
NR
DG
0.
69
17.3
5 1
Bay
Are
a C
ontra
Cos
ta
Aug
NQ
C
Win
d P
G&
E
WN
DM
AS
_2_U
NIT
1
3317
0 W
IND
MS
TR
9.11
3.
52
1 B
ay A
rea
Con
tra C
osta
A
ug N
QC
W
ind
PG
&E
ZO
ND
_6_U
NIT
35
316
ZON
D S
YS
9.11
1.
52
1 B
ay A
rea
Con
tra C
osta
A
ug N
QC
W
ind
PG
&E
ZZ
_IB
MC
TL_1
_UN
IT 1
35
637
IBM
-CTL
E
115
0.00
1
Bay
Are
a S
an J
ose,
Sou
th
Bay
-Mos
s La
ndin
g N
o N
QC
- hi
st.
data
M
arke
t
PG
&E
ZZ
_IM
HO
FF_1
_UN
IT 1
33
136
CC
CS
D
12
.5
0.00
1
Bay
Are
a P
ittsb
urg
No
NQ
C -
hist
. da
ta
QF/
Sel
fgen
PG
&E
ZZ
_LFC
51_
2_U
NIT
1
3531
0 P
PA
SSW
ND
21
7.
20
1 B
ay A
rea
Non
e N
o N
QC
- es
t. da
ta
Win
d
PG
&E
ZZ
_MA
RK
HM
_1_C
ATL
ST
3586
3 C
ATA
LYS
T 9.
11
0.00
1
Bay
Are
a S
an J
ose,
Sou
th
Bay
-Mos
s La
ndin
g
QF/
Sel
fgen
PG
&E
ZZ
_NA
36
209
SLD
EN
RG
12
.5
0.00
1
Bay
Are
a S
outh
Bay
-Mos
s La
ndin
g
QF/
Sel
fgen
PG
&E
ZZ
_NA
35
861
SJ-
SC
L W
4.
3 6.
50
1 B
ay A
rea
San
Jos
e, S
outh
B
ay-M
oss
Land
ing
No
NQ
C -
hist
. da
ta
QF/
Sel
fgen
PG
&E
ZZ
_SE
AWS
T_6_
LAP
OS
3531
2 FO
RE
BA
YW
22
4.30
1
Bay
Are
a C
ontra
Cos
ta
No
NQ
C -
est.
data
W
ind

App
endi
x A
- L
ist o
f phy
sica
l res
ourc
es b
y PT
O, l
ocal
are
a an
d m
arke
t ID
80
PG
&E
ZZ
_SH
ELR
F_1_
UN
ITS
33
141
SH
ELL
1
12.5
0.
00
1 B
ay A
rea
Pitt
sbur
g N
o N
QC
- hi
st.
data
N
et S
elle
r
PG
&E
ZZ
_SH
ELR
F_1_
UN
ITS
33
142
SH
ELL
2
12.5
0.
00
1 B
ay A
rea
Pitt
sbur
g N
o N
QC
- hi
st.
data
N
et S
elle
r
PG
&E
ZZ
_SH
ELR
F_1_
UN
ITS
33
143
SH
ELL
3
12.5
0.
00
1 B
ay A
rea
Pitt
sbur
g N
o N
QC
- hi
st.
data
N
et S
elle
r
PG
&E
ZZ
_ZA
NK
ER
_1_U
NIT
1
3586
1 S
J-S
CL
W
4.3
0.00
R
N
Bay
Are
a S
an J
ose,
Sou
th
Bay
-Mos
s La
ndin
g N
o N
QC
- hi
st.
data
Q
F/S
elfg
en
PG
&E
ZZ
Z_N
ew U
nit
3562
2 SW
IFT
115
4.00
B
T B
ay A
rea
Sou
th B
ay-M
oss
Land
ing
No
NQ
C -
Pm
ax
Mar
ket
PG
&E
ZZ
Z_N
ew U
nit
3052
4 03
54-W
D
230
1.83
EW
B
ay A
rea
Con
tra C
osta
N
o N
QC
- P
max
M
arke
t
PG
&E
ZZ
Z_N
ew U
nit
3530
2 N
UM
MI-L
V
12.6
0.
00
RN
B
ay A
rea
E
nerg
y O
nly
Mar
ket
PG
&E
ZZ
Z_N
ew U
nit
3585
9 H
GS
T-LV
12
.4
0.00
R
N
Bay
Are
a
Ene
rgy
Onl
y M
arke
t
PG
&E
ZZ
ZZZZ
_CO
CO
PP
_7_U
NIT
6
3311
6 C
.CO
S 6
18
0.
00
RT
Bay
Are
a C
ontra
Cos
ta
Ret
ired
Mar
ket
PG
&E
ZZ
ZZZZ
_CO
CO
PP
_7_U
NIT
7
3311
7 C
.CO
S 7
18
0.
00
RT
Bay
Are
a C
ontra
Cos
ta
Ret
ired
Mar
ket
PG
&E
ZZ
ZZZZ
_GW
FPW
1_6_
UN
IT
3313
1 G
WF
#1
9.11
0.
00
1 B
ay A
rea
Pitt
sbur
g, C
ontra
C
osta
R
etire
d Q
F/S
elfg
en
PG
&E
ZZ
ZZZZ
_GW
FPW
2_1_
UN
IT 1
33
132
GW
F #2
13
.8
0.00
1
Bay
Are
a P
ittsb
urg
Ret
ired
QF/
Sel
fgen
PG
&E
ZZ
ZZZZ
_GW
FPW
3_1_
UN
IT 1
33
133
GW
F #3
13
.8
0.00
1
Bay
Are
a P
ittsb
urg,
Con
tra
Cos
ta
Ret
ired
QF/
Sel
fgen
PG
&E
ZZ
ZZZZ
_GW
FPW
4_6_
UN
IT 1
33
134
GW
F #4
13
.8
0.00
1
Bay
Are
a P
ittsb
urg,
Con
tra
Cos
ta
Ret
ired
QF/
Sel
fgen
PG
&E
ZZ
ZZZZ
_GW
FPW
5_6_
UN
IT 1
33
135
GW
F #5
13
.8
0.00
1
Bay
Are
a P
ittsb
urg
Ret
ired
QF/
Sel
fgen
PG
&E
ZZ
ZZZZ
_MO
SS
LD_7
_UN
IT 6
36
405
MO
SS
LND
6 22
0.
00
1 B
ay A
rea
Sou
th B
ay-M
oss
Land
ing
Ret
ired
Mar
ket
PG
&E
ZZ
ZZZZ
_MO
SS
LD_7
_UN
IT 7
36
406
MO
SS
LND
7 22
0.
00
1 B
ay A
rea
Sou
th B
ay-M
oss
Land
ing
Ret
ired
Mar
ket
PG
&E
ZZ
ZZZZ
_PIT
TSP
_7_U
NIT
5
3310
5 P
TSB
5
18
0.00
1
Bay
Are
a P
ittsb
urg
Ret
ired
Mar
ket
PG
&E
ZZ
ZZZZ
_PIT
TSP
_7_U
NIT
6
3310
6 P
TSB
6
18
0.00
1
Bay
Are
a P
ittsb
urg
Ret
ired
Mar
ket
PG
&E
ZZ
ZZZZ
_PIT
TSP
_7_U
NIT
7
3000
0 P
TSB
7
20
0.00
1
Bay
Are
a P
ittsb
urg
Ret
ired
Mar
ket

App
endi
x A
- L
ist o
f phy
sica
l res
ourc
es b
y PT
O, l
ocal
are
a an
d m
arke
t ID
81
PG
&E
ZZ
ZZZZ
_UN
TDQ
F_7_
UN
ITS
33
466
UN
TED
CO
9.
11
0.00
1
Bay
Are
a N
one
Ret
ired
QF/
Sel
fgen
PG
&E
A
DE
RA
_1_S
OLA
R1
3431
9 Q
644
0.48
0.
00
1 Fr
esno
W
ilson
, Her
ndon
A
ug N
QC
M
arke
t P
G&
E
AD
ME
ST_
6_S
OLA
R
3431
5 A
DA
MS
_E
12.5
0.
00
1 Fr
esno
W
ilson
, Her
ndon
E
nerg
y O
nly
Mar
ket
PG
&E
A
GR
ICO
_6_P
L3N
5 34
608
AG
RIC
O
13.8
20
.00
3 Fr
esno
W
ilson
, Her
ndon
Mar
ket
PG
&E
A
GR
ICO
_7_U
NIT
34
608
AG
RIC
O
13.8
7.
45
2 Fr
esno
W
ilson
, Her
ndon
Mar
ket
PG
&E
A
GR
ICO
_7_U
NIT
34
608
AG
RIC
O
13.8
43
.05
4 Fr
esno
W
ilson
, Her
ndon
Mar
ket
PG
&E
A
VE
NA
L_6_
AV
PA
RK
3426
5 A
VE
NA
L P
12
0.
00
1 Fr
esno
W
ilson
, Coa
linga
E
nerg
y O
nly
Mar
ket
PG
&E
A
VE
NA
L_6_
SA
ND
DG
34
263
SA
ND
DR
AG
12
0.
00
1 Fr
esno
W
ilson
, Coa
linga
E
nerg
y O
nly
Mar
ket
PG
&E
A
VE
NA
L_6_
SU
NC
TY
3425
7 S
UN
CTY
D
12
0.00
1
Fres
no
Wils
on, C
oalin
ga
Ene
rgy
Onl
y M
arke
t
PG
&E
B
ALC
HS
_7_U
NIT
1
3462
4 B
ALC
H
13.2
33
.00
1 Fr
esno
W
ilson
, Her
ndon
A
ug N
QC
M
arke
t
PG
&E
B
ALC
HS
_7_U
NIT
2
3461
2 B
LCH
13
.8
52.5
0 1
Fres
no
Wils
on, H
ernd
on
Aug
NQ
C
Mar
ket
PG
&E
B
ALC
HS
_7_U
NIT
3
3461
4 B
LCH
13
.8
52.5
0 1
Fres
no
Wils
on, H
ernd
on
Aug
NQ
C
Mar
ket
PG
&E
C
AN
TUA
_1_S
OLA
R
3434
9 C
AN
TUA
_D
12.5
6.
76
1 Fr
esno
W
ilson
A
ug N
QC
M
arke
t
PG
&E
C
AN
TUA
_1_S
OLA
R
3434
9 C
AN
TUA
_D
12.5
6.
76
2 Fr
esno
W
ilson
A
ug N
QC
M
arke
t
PG
&E
C
AP
MA
D_1
_UN
IT 1
34
179
MA
DE
RA
_G
13.8
4.
29
1 Fr
esno
W
ilson
Mar
ket
PG
&E
C
HE
VC
O_6
_UN
IT 1
34
652
CH
V.C
OA
L 9.
11
1.00
1
Fres
no
Wils
on, C
oalin
ga
Aug
NQ
C
QF/
Sel
fgen
PG
&E
C
HE
VC
O_6
_UN
IT 2
34
652
CH
V.C
OA
L 9.
11
0.75
2
Fres
no
Wils
on, C
oalin
ga
Aug
NQ
C
QF/
Sel
fgen
PG
&E
C
HW
CH
L_1_
BIO
MA
S
3430
5 C
HW
CH
LA2
13.8
7.
60
1 Fr
esno
W
ilson
, Her
ndon
A
ug N
QC
M
arke
t
PG
&E
C
HW
CH
L_1_
UN
IT
3430
1 C
HO
WC
OG
N
13.8
48
.00
1 Fr
esno
W
ilson
, Her
ndon
Mar
ket
PG
&E
C
OLG
A1_
6_S
HE
LLW
34
654
CO
LNG
AG
N
9.11
34
.70
1 Fr
esno
W
ilson
, Coa
linga
A
ug N
QC
N
et S
elle
r

App
endi
x A
- L
ist o
f phy
sica
l res
ourc
es b
y PT
O, l
ocal
are
a an
d m
arke
t ID
82
PG
&E
C
OR
CA
N_1
_SO
LAR
1
0.35
Fres
no
Wils
on, H
ernd
on,
Han
ford
N
ot M
odel
ed
Aug
NQ
C
Mar
ket
PG
&E
C
OR
CA
N_1
_SO
LAR
2
0.19
Fres
no
Wils
on, H
ernd
on,
Han
ford
N
ot M
odel
ed
Aug
NQ
C
Mar
ket
PG
&E
C
RE
SS
Y_1_
PA
RK
ER
34
140
CR
ES
SE
Y 11
5 0.
67
Fr
esno
W
ilson
N
ot m
odel
ed
Aug
NQ
C
MU
NI
PG
&E
C
RN
EV
L_6_
CR
NV
A
3463
4 C
RA
NE
VLY
12
0.
90
1 Fr
esno
W
ilson
, Bor
den
Aug
NQ
C
Mar
ket
PG
&E
C
RN
EV
L_6_
SJQ
N 2
34
631
SJ2
GE
N
9.11
3.
20
1 Fr
esno
W
ilson
, Bor
den
Aug
NQ
C
Mar
ket
PG
&E
C
RN
EV
L_6_
SJQ
N 3
34
633
SJ3
GE
N
9.11
4.
20
1 Fr
esno
W
ilson
, Bor
den
Aug
NQ
C
Mar
ket
PG
&E
D
INU
BA
_6_U
NIT
34
648
DIN
UB
A E
13
.8
7.59
1
Fres
no
Wils
on, H
ernd
on,
Ree
dley
Mar
ket
PG
&E
E
EK
TMN
_6_S
OLA
R1
3462
7 K
ETT
LEM
N
0.34
0.
00
1 Fr
esno
W
ilson
E
nerg
y O
nly
Mar
ket
PG
&E
E
LCA
P_1
_SO
LAR
1.27
Fres
no
Wils
on
Not
Mod
eled
A
ug N
QC
M
arke
t
PG
&E
E
LNID
P_6
_BIO
MA
S
3433
0 E
LNID
O
13.8
7.
22
1 Fr
esno
W
ilson
A
ug N
QC
M
arke
t P
G&
E
EXC
HE
C_7
_UN
IT 1
34
306
EXC
HQ
UE
R
13.8
94
.50
1 Fr
esno
W
ilson
A
ug N
QC
M
UN
I P
G&
E
EXC
LSG
_1_S
OLA
R
3462
3 Q
678
0.5
41.5
4 1
Fres
no
Wils
on
Aug
NQ
C
Mar
ket
PG
&E
FR
ES
HW
_1_S
OLA
R1
3466
9 Q
529A
4.
16
0.00
1
Fres
no
Wils
on, H
ernd
on
Ene
rgy
Onl
y M
arke
t P
G&
E
FRE
SH
W_1
_SO
LAR
1 34
669
Q52
9A
0.48
0.
00
2 Fr
esno
W
ilson
, Her
ndon
E
nerg
y O
nly
Mar
ket
PG
&E
FR
IAN
T_6_
UN
ITS
34
636
FRIA
NTD
M
6.6
6.74
2
Fres
no
Wils
on, B
orde
n A
ug N
QC
N
et S
elle
r P
G&
E
FRIA
NT_
6_U
NIT
S
3463
6 FR
IAN
TDM
6.
6 3.
60
3 Fr
esno
W
ilson
, Bor
den
Aug
NQ
C
Net
Sel
ler
PG
&E
FR
IAN
T_6_
UN
ITS
34
636
FRIA
NTD
M
6.6
0.95
4
Fres
no
Wils
on, B
orde
n A
ug N
QC
N
et S
elle
r P
G&
E
GU
ER
NS
_6_S
OLA
R
3446
1 G
UER
NSE
Y
12.5
3.
24
1 Fr
esno
W
ilson
A
ug N
QC
M
arke
t P
G&
E
GU
ER
NS
_6_S
OLA
R
3446
1 G
UER
NSE
Y
12.5
3.
24
2 Fr
esno
W
ilson
A
ug N
QC
M
arke
t
PG
&E
G
WFP
WR
_1_U
NIT
S
3443
1 G
WF_
HE
P1
13.8
42
.20
1 Fr
esno
W
ilson
, Her
ndon
, H
anfo
rd
M
arke
t
PG
&E
G
WFP
WR
_1_U
NIT
S
3443
3 G
WF_
HE
P2
13.8
42
.20
1 Fr
esno
W
ilson
, Her
ndon
, H
anfo
rd
M
arke
t
PG
&E
H
AA
SP
H_7
_PL1
X2
3461
0 H
AA
S 13
.8
72.0
0 1
Fres
no
Wils
on, H
ernd
on
Aug
NQ
C
Mar
ket
PG
&E
H
AA
SP
H_7
_PL1
X2
3461
0 H
AA
S
13.8
72
.00
2 Fr
esno
W
ilson
, Her
ndon
A
ug N
QC
M
arke
t P
G&
E
HE
LMP
G_7
_UN
IT 1
34
600
HE
LMS
18
40
7.00
1
Fres
no
Wils
on
Aug
NQ
C
Mar
ket
PG
&E
H
ELM
PG
_7_U
NIT
2
3460
2 H
ELM
S
18
407.
00
2 Fr
esno
W
ilson
A
ug N
QC
M
arke
t P
G&
E
HE
LMP
G_7
_UN
IT 3
34
604
HE
LMS
18
40
4.00
3
Fres
no
Wils
on
Aug
NQ
C
Mar
ket

App
endi
x A
- L
ist o
f phy
sica
l res
ourc
es b
y PT
O, l
ocal
are
a an
d m
arke
t ID
83
PG
&E
H
EN
RTA
_6_S
OLA
R1
0.
00
Fr
esno
W
ilson
N
ot m
odel
ed
Ene
rgy
Onl
y M
arke
t
PG
&E
H
EN
RTA
_6_S
OLA
R2
0.
00
Fr
esno
W
ilson
N
ot m
odel
ed
Ene
rgy
Onl
y M
arke
t
PG
&E
H
EN
RTA
_6_U
NIT
A1
3453
9 G
WF_
GT1
13
.8
45.3
3 1
Fres
no
Wils
on
M
arke
t P
G&
E
HE
NR
TA_6
_UN
ITA
2 34
541
GW
F_G
T2
13.8
45
.23
1 Fr
esno
W
ilson
Mar
ket
PG
&E
H
EN
RTS
_1_S
OLA
R
3461
7 Q
581
0.38
80
.34
1 Fr
esno
W
ilson
A
ug N
QC
M
arke
t P
G&
E
HU
RO
N_6
_SO
LAR
34
557
HU
RO
N_D
I 12
.5
6.79
1
Fres
no
Wils
on, C
oalin
ga
Aug
NQ
C
Mar
ket
PG
&E
H
UR
ON
_6_S
OLA
R
3455
7 H
UR
ON
_DI
12.5
6.
79
2 Fr
esno
W
ilson
, Coa
linga
A
ug N
QC
M
arke
t P
G&
E
INTT
RB
_6_U
NIT
34
342
INT.
TUR
B
9.11
2.
76
1 Fr
esno
W
ilson
A
ug N
QC
Q
F/S
elfg
en
PG
&E
JA
YNE
_6_W
LSLR
34
639
WES
TLN
DS
0.
48
0.00
1
Fres
no
Wils
on, C
oalin
ga
Ene
rgy
Onl
y M
arke
t P
G&
E
KA
NS
AS
_6_S
OLA
R
3466
6 K
AN
SA
SS
_S
12.5
0.
00
F Fr
esno
W
ilson
E
nerg
y O
nly
Mar
ket
PG
&E
K
ER
KH
1_7_
UN
IT 1
34
344
KE
RC
K1-
1 6.
6 13
.00
1 Fr
esno
W
ilson
, Her
ndon
A
ug N
QC
M
arke
t
PG
&E
K
ER
KH
1_7_
UN
IT 3
34
345
KE
RC
K1-
3 6.
6 12
.80
3 Fr
esno
W
ilson
, Her
ndon
A
ug N
QC
M
arke
t
PG
&E
K
ER
KH
2_7_
UN
IT 1
34
308
KE
RC
KH
OF
13.8
15
3.90
1
Fres
no
Wils
on, H
ernd
on
Aug
NQ
C
Mar
ket
PG
&E
K
ER
MA
N_6
_SO
LAR
1
0.00
Fres
no
Wils
on
Not
mod
eled
E
nerg
y O
nly
Mar
ket
PG
&E
K
ER
MA
N_6
_SO
LAR
2
0.00
Fres
no
Wils
on
Not
mod
eled
E
nerg
y O
nly
Mar
ket
PG
&E
K
ING
CO
_1_K
ING
BR
34
642
KIN
GS
BU
R
9.11
23
.71
1 Fr
esno
W
ilson
, Her
ndon
, H
anfo
rd
Aug
NQ
C
Net
Sel
ler
PG
&E
K
ING
RV
_7_U
NIT
1
3461
6 K
ING
SR
IV
13.8
51
.20
1 Fr
esno
W
ilson
, Her
ndon
, R
eedl
ey
Aug
NQ
C
Mar
ket
PG
&E
K
NG
BR
G_1
_KB
SLR
1
0.00
Fres
no
Wils
on
Not
mod
eled
E
nerg
y O
nly
Mar
ket
PG
&E
K
NG
BR
G_1
_KB
SLR
2
0.00
Fres
no
Wils
on
Not
mod
eled
E
nerg
y O
nly
Mar
ket
PG
&E
K
NTS
TH_6
_SO
LAR
34
694
KE
NT_
S
0.8
0.00
1
Fres
no
Wils
on
Ene
rgy
Onl
y M
arke
t P
G&
E
LEP
RFD
_1_K
AN
SA
S 34
680
Q63
6 12
.5
4.50
1
Fres
no
Wils
on, H
anfo
rd
Aug
NQ
C
Mar
ket
PG
&E
M
ALA
GA
_1_P
L1X2
34
671
KR
CD
PC
T1
13.8
48
.00
1 Fr
esno
W
ilson
, Her
ndon
Mar
ket
PG
&E
M
ALA
GA
_1_P
L1X2
34
672
KR
CD
PC
T2
13.8
48
.00
1 Fr
esno
W
ilson
, Her
ndon
Mar
ket
PG
&E
M
CC
ALL
_1_Q
F 34
219
MC
CA
LL 4
12
.5
0.44
Q
F Fr
esno
W
ilson
, Her
ndon
A
ug N
QC
Q
F/S
elfg
en
PG
&E
M
CSW
AN
_6_U
NIT
S
3432
0 M
CSW
AIN
9.
11
10.0
0 1
Fres
no
Wils
on
Aug
NQ
C
MU
NI

App
endi
x A
- L
ist o
f phy
sica
l res
ourc
es b
y PT
O, l
ocal
are
a an
d m
arke
t ID
84
PG
&E
M
EN
BIO
_6_R
EN
EW1
3433
9 C
ALR
EN
EW
12.5
4.
02
1 Fr
esno
W
ilson
, Her
ndon
A
ug N
QC
N
et S
elle
r
PG
&E
M
EN
BIO
_6_U
NIT
34
334
BIO
PW
R
9.11
19
.24
1 Fr
esno
W
ilson
A
ug N
QC
Q
F/S
elfg
en
PG
&E
M
ER
CE
D_1
_SO
LAR
1
0.00
Fres
no
Wils
on
Not
mod
eled
E
nerg
y O
nly
Mar
ket
PG
&E
M
ER
CE
D_1
_SO
LAR
2
0.00
Fres
no
Wils
on
Not
mod
eled
E
nerg
y O
nly
Mar
ket
PG
&E
M
ER
CFL
_6_U
NIT
34
322
ME
RC
ED
FL
9.11
3.
50
1 Fr
esno
W
ilson
A
ug N
QC
M
arke
t
PG
&E
M
ND
OTA
_1_S
OLA
R1
3431
1 N
OR
THS
TAR
0.
2 50
.90
1 Fr
esno
W
ilson
A
ug N
QC
M
arke
t
PG
&E
M
ND
OTA
_1_S
OLA
R2
0.
00
Fr
esno
W
ilson
N
ot m
odel
ed
Ene
rgy
Onl
y M
arke
t
PG
&E
M
STA
NG
_2_S
OLA
R
3468
3 Q
643W
0.
8 24
.10
1 Fr
esno
W
ilson
A
ug N
QC
M
arke
t
PG
&E
M
STA
NG
_2_S
OLA
R3
3468
3 Q
643W
0.
8 32
.14
1 Fr
esno
W
ilson
A
ug N
QC
M
arke
t
PG
&E
M
STA
NG
_2_S
OLA
R4
3468
3 Q
643W
0.
8 24
.10
1 Fr
esno
W
ilson
A
ug N
QC
M
arke
t
PG
&E
O
NLL
PP
_6_U
NIT
S
3431
6 O
NE
ILP
MP
9.
11
0.37
1
Fres
no
Wils
on
Aug
NQ
C
MU
NI
PG
&E
P
INFL
T_7_
UN
ITS
38
720
PIN
EFL
AT
13.8
70
.00
1 Fr
esno
W
ilson
, Her
ndon
A
ug N
QC
M
UN
I
PG
&E
P
INFL
T_7_
UN
ITS
38
720
PIN
EFL
AT
13.8
70
.00
2 Fr
esno
W
ilson
, Her
ndon
A
ug N
QC
M
UN
I P
G&
E
PIN
FLT_
7_U
NIT
S
3872
0 P
INE
FLA
T 13
.8
70.0
0 3
Fres
no
Wils
on, H
ernd
on
Aug
NQ
C
MU
NI
PG
&E
P
NC
HP
P_1
_PL1
X2
3432
8 S
TAR
GT1
13
.8
55.5
8 1
Fres
no
Wils
on
M
arke
t P
G&
E
PN
CH
PP
_1_P
L1X2
34
329
STA
RG
T2
13.8
55
.58
2 Fr
esno
W
ilson
Mar
ket
PG
&E
P
NO
CH
E_1
_PL1
X2
3414
2 W
HD
_PA
N2
13.8
49
.97
1 Fr
esno
W
ilson
, Her
ndon
Mar
ket
PG
&E
P
NO
CH
E_1
_UN
ITA
1 34
186
DG
_PA
N1
13.8
48
.00
1 Fr
esno
W
ilson
Mar
ket
PG
&E
R
EE
DLY
_6_S
OLA
R
0.
00
Fr
esno
W
ilson
, Her
ndon
, R
eedl
ey
Not
mod
eled
E
nerg
y O
nly
Mar
ket
PG
&E
S
_RIT
A_6
_SO
LAR
1
0.00
Fres
no
Wils
on
Not
mod
eled
E
nerg
y O
nly
Mar
ket
PG
&E
S
CH
ND
R_1
_FIV
PTS
34
353
SC
HIN
DLE
R_D
12
.5
4.25
1
Fres
no
Wils
on, C
oalin
ga
Aug
NQ
C
Mar
ket
PG
&E
S
CH
ND
R_1
_FIV
PTS
34
353
SC
HIN
DLE
R_D
12
.5
2.12
2
Fres
no
Wils
on, C
oalin
ga
Aug
NQ
C
Mar
ket
PG
&E
S
CH
ND
R_1
_WS
TSD
E
3435
3 S
CH
IND
LER
_D
12.5
6.
17
3 Fr
esno
W
ilson
, Coa
linga
A
ug N
QC
M
arke
t P
G&
E
SC
HN
DR
_1_W
STS
DE
34
353
SC
HIN
DLE
R_D
12
.5
3.09
4
Fres
no
Wils
on, C
oalin
ga
Aug
NQ
C
Mar
ket
PG
&E
S
GR
EG
Y_6_
SA
NG
ER
34
646
SA
NG
ER
CO
13
.8
19.4
1 1
Fres
no
Wils
on
Aug
NQ
C
Mar
ket

App
endi
x A
- L
ist o
f phy
sica
l res
ourc
es b
y PT
O, l
ocal
are
a an
d m
arke
t ID
85
PG
&E
S
GR
EG
Y_6_
SA
NG
ER
34
646
SA
NG
ER
CO
13
.8
4.66
2
Fres
no
Wils
on
Aug
NQ
C
Mar
ket
PG
&E
S
TOR
EY_
2_M
DR
CH
2
0.25
Fres
no
Wils
on
Not
mod
eled
A
ug N
QC
M
arke
t
PG
&E
S
TOR
EY_
2_M
DR
CH
3
0.19
Fres
no
Wils
on
Not
mod
eled
A
ug N
QC
M
arke
t
PG
&E
S
TOR
EY_
7_M
DR
CH
W
3420
9 S
TOR
EY
D
12.5
0.
00
1 Fr
esno
W
ilson
A
ug N
QC
N
et S
elle
r P
G&
E
STR
OU
D_6
_SO
LAR
34
563
STR
OU
D_D
12
.5
2.56
1
Fres
no
Wils
on, H
ernd
on
Aug
NQ
C
Mar
ket
PG
&E
S
TRO
UD
_6_S
OLA
R
3456
3 S
TRO
UD
_D
12.5
2.
56
2 Fr
esno
W
ilson
, Her
ndon
A
ug N
QC
M
arke
t
PG
&E
TR
NQ
LT_2
_SO
LAR
34
340
Q64
3X
0.8
160.
69
1 Fr
esno
W
ilson
A
ug N
QC
M
arke
t
PG
&E
U
LTP
FR_1
_UN
IT 1
34
640
ULT
R.P
WR
9.
11
23.9
2 1
Fres
no
Wils
on, H
ernd
on
Aug
NQ
C
QF/
Sel
fgen
P
G&
E
VE
GA
_6_S
OLA
R1
3431
4 Q
548
34.5
0.
00
1 Fr
esno
W
ilson
E
nerg
y O
nly
Mar
ket
PG
&E
W
AUK
NA
_1_S
OLA
R
3469
6 C
OR
CO
RA
NP
V_S
21
0.
40
1 Fr
esno
W
ilson
, Her
ndon
, H
anfo
rd
Aug
NQ
C
Mar
ket
PG
&E
W
AUK
NA
_1_S
OLA
R2
3467
7 Q
558
21
17.4
3 1
Fres
no
Wils
on, H
ernd
on,
Han
ford
N
o N
QC
- P
max
M
arke
t
PG
&E
W
FRE
SN
_1_S
OLA
R
0.
00
Fr
esno
W
ilson
N
ot m
odel
ed
Ene
rgy
Onl
y M
arke
t
PG
&E
W
ISH
ON
_6_U
NIT
S
3465
8 W
ISH
ON
2.
3 4.
51
1 Fr
esno
W
ilson
, Bor
den
Aug
NQ
C
Mar
ket
PG
&E
W
ISH
ON
_6_U
NIT
S
3465
8 W
ISH
ON
2.
3 4.
51
2 Fr
esno
W
ilson
, Bor
den
Aug
NQ
C
Mar
ket
PG
&E
W
ISH
ON
_6_U
NIT
S
3465
8 W
ISH
ON
2.
3 4.
51
3 Fr
esno
W
ilson
, Bor
den
Aug
NQ
C
Mar
ket
PG
&E
W
ISH
ON
_6_U
NIT
S
3465
8 W
ISH
ON
2.
3 4.
51
4 Fr
esno
W
ilson
, Bor
den
Aug
NQ
C
Mar
ket
PG
&E
W
ISH
ON
_6_U
NIT
S
3465
8 W
ISH
ON
2.
3 0.
36
SJ
Fres
no
Wils
on, B
orde
n A
ug N
QC
M
arke
t
PG
&E
W
RG
HTP
_7_A
ME
NG
Y
3420
7 W
RIG
HT
D
12.5
0.
14
QF
Fres
no
Wils
on
Aug
NQ
C
QF/
Sel
fgen
PG
&E
ZZ
_BU
LLR
D_7
_SA
GN
ES
34
213
BU
LLD
12
12.5
0.
00
1 Fr
esno
W
ilson
A
ug N
QC
Q
F/S
elfg
en
PG
&E
ZZ
_GA
TES
_6_P
L1X2
34
553
WH
D_G
AT2
13.8
0.
00
1 Fr
esno
W
ilson
, Coa
linga
Mar
ket
PG
&E
ZZ
_JR
WO
OD
_1_U
NIT
1
3433
2 JR
WC
OG
EN
9.
11
0.00
1
Fres
no
Wils
on
Q
F/S
elfg
en
PG
&E
ZZ
_NA
34
485
FRE
SN
OW
W
12.5
0.
00
1 Fr
esno
W
ilson
N
o N
QC
- hi
st.
data
Q
F/S
elfg
en
PG
&E
ZZ
_NA
34
485
FRE
SN
OW
W
12.5
0.
00
2 Fr
esno
W
ilson
N
o N
QC
- hi
st.
data
Q
F/S
elfg
en

App
endi
x A
- L
ist o
f phy
sica
l res
ourc
es b
y PT
O, l
ocal
are
a an
d m
arke
t ID
86
PG
&E
ZZ
_NA
34
485
FRE
SN
OW
W
12.5
0.
00
3 Fr
esno
W
ilson
N
o N
QC
- hi
st.
data
Q
F/S
elfg
en
PG
&E
ZZ
Z_N
ew U
nit
3430
3 Q
612
13.8
0.
00
1 Fr
esno
W
ilson
, Coa
linga
E
nerg
y O
nly
Mar
ket
PG
&E
ZZ
Z_N
ew U
nit
3465
3 Q
526
33
0.00
1
Fres
no
Wils
on, C
oalin
ga
Ene
rgy
Onl
y M
arke
t
PG
&E
ZZ
Z_N
ew U
nit
3467
3 Q
532
13.8
0.
00
1 Fr
esno
W
ilson
, Coa
linga
E
nerg
y O
nly
Mar
ket
PG
&E
ZZ
Z_N
ew U
nit
3430
0 Q
550
34.5
0.
00
1 Fr
esno
W
ilson
E
nerg
y O
nly
Mar
ket
PG
&E
ZZ
Z_N
ew U
nit
3620
5 Q
648
34.5
0.
00
1 Fr
esno
W
ilson
E
nerg
y O
nly
Mar
ket
PG
&E
ZZ
Z_N
ew U
nit
3960
4 P
ATR
IOTB
0.
32
0.00
1
Fres
no
Wils
on
Ene
rgy
Onl
y M
arke
t
PG
&E
ZZ
Z_N
ew U
nit
3960
1 P
ATR
IOTA
0.
32
0.00
1
Fres
no
Wils
on
Ene
rgy
Onl
y M
arke
t
PG
&E
ZZ
Z_N
ew U
nit
3446
7 G
IFFE
N_D
IST
12.5
10
.00
1 Fr
esno
W
ilson
, Her
ndon
N
o N
QC
- P
max
M
arke
t
PG
&E
ZZ
Z_N
ew U
nit
3464
9 Q
965
0.36
14
.00
1 Fr
esno
W
ilson
, Her
ndon
N
o N
QC
- P
max
M
arke
t
PG
&E
ZZ
Z_N
ew U
nit
3464
4 Q
679
0.48
20
.00
1 Fr
esno
W
ilson
N
o N
QC
- P
max
M
arke
t P
G&
E
ZZZ_
New
Uni
t 34
335
Q72
3 0.
32
50.0
0 1
Fres
no
Wils
on, B
orde
n N
o N
QC
- P
max
M
arke
t P
G&
E
ZZZ_
New
Uni
t 34
688
Q27
2 0.
55
125.
00
1 Fr
esno
W
ilson
N
o N
QC
- P
max
M
arke
t P
G&
E
ZZZ_
New
Uni
t 34
603
JGB
SWLT
12
.5
0.00
S
T Fr
esno
W
ilson
, Her
ndon
E
nerg
y O
nly
Mar
ket
PG
&E
ZZ
Z_N
ew U
nit
3442
0 C
OR
CO
RA
N
115
19.0
0 W
D
Fres
no
Wils
on, H
ernd
on,
Han
ford
N
o N
QC
- P
max
M
arke
t
PG
&E
B
RD
GV
L_7_
BA
KE
R
0.
00
H
umbo
ldt
Non
e N
ot m
odel
ed
Aug
NQ
C
Net
Sel
ler
PG
&E
FA
IRH
V_6
_UN
IT
3115
0 FA
IRH
AV
N
13.8
13
.58
1 H
umbo
ldt
Non
e A
ug N
QC
N
et S
elle
r
PG
&E
FT
SWR
D_6
_TR
FOR
K
0.10
Hum
bold
t N
one
Not
mod
eled
A
ug N
QC
M
arke
t
PG
&E
FT
SWR
D_7
_QFU
NTS
0.00
Hum
bold
t N
one
Not
mod
eled
A
ug N
QC
Q
F/S
elfg
en
PG
&E
G
RS
CR
K_6
_BG
CKW
W
0.
00
H
umbo
ldt
Non
e N
ot m
odel
ed
Ene
rgy
Onl
y Q
F/S
elfg
en
PG
&E
H
UM
BP
P_1
_UN
ITS
3 31
180
HU
MB
_G1
13.8
16
.30
1 H
umbo
ldt
Non
e
Mar
ket
PG
&E
H
UM
BP
P_1
_UN
ITS
3 31
180
HU
MB
_G1
13.8
15
.83
2 H
umbo
ldt
Non
e
Mar
ket
PG
&E
H
UM
BP
P_1
_UN
ITS
3 31
180
HU
MB
_G1
13.8
16
.67
3 H
umbo
ldt
Non
e
Mar
ket

App
endi
x A
- L
ist o
f phy
sica
l res
ourc
es b
y PT
O, l
ocal
are
a an
d m
arke
t ID
87
PG
&E
H
UM
BP
P_1
_UN
ITS
3 31
180
HU
MB
_G1
13.8
16
.20
4 H
umbo
ldt
Non
e
Mar
ket
PG
&E
H
UM
BP
P_6
_UN
ITS
31
181
HU
MB
_G2
13.8
16
.14
5 H
umbo
ldt
Non
e
Mar
ket
PG
&E
H
UM
BP
P_6
_UN
ITS
31
181
HU
MB
_G2
13.8
16
.33
6 H
umbo
ldt
Non
e
Mar
ket
PG
&E
H
UM
BP
P_6
_UN
ITS
31
181
HU
MB
_G2
13.8
16
.24
7 H
umbo
ldt
Non
e
Mar
ket
PG
&E
H
UM
BP
P_6
_UN
ITS
31
182
HU
MB
_G3
13.8
16
.62
8 H
umbo
ldt
Non
e
Mar
ket
PG
&E
H
UM
BP
P_6
_UN
ITS
31
182
HU
MB
_G3
13.8
16
.33
9 H
umbo
ldt
Non
e
Mar
ket
PG
&E
H
UM
BP
P_6
_UN
ITS
31
182
HU
MB
_G3
13.8
15
.95
10
Hum
bold
t N
one
M
arke
t
PG
&E
H
UM
BS
B_1
_QF
0.
00
H
umbo
ldt
Non
e N
ot m
odel
ed
Aug
NQ
C
QF/
Sel
fgen
PG
&E
K
EK
AWK
_6_U
NIT
31
166
KE
KAW
AK
9.
1 0.
00
1 H
umbo
ldt
Non
e A
ug N
QC
N
et S
elle
r
PG
&E
LA
PA
C_6
_UN
IT
3115
8 LP
SA
MO
A
12.5
20
.00
1 H
umbo
ldt
Non
e
Mar
ket
PG
&E
LO
WG
AP
_1_S
UP
HR
0.00
Hum
bold
t N
one
Not
mod
eled
A
ug N
QC
M
arke
t
PG
&E
P
AC
LUM
_6_U
NIT
31
152
PA
C.L
UM
B
13.8
5.
25
1 H
umbo
ldt
Non
e A
ug N
QC
Q
F/S
elfg
en
PG
&E
P
AC
LUM
_6_U
NIT
31
152
PA
C.L
UM
B
13.8
5.
25
2 H
umbo
ldt
Non
e A
ug N
QC
Q
F/S
elfg
en
PG
&E
P
AC
LUM
_6_U
NIT
31
153
PA
C.L
UM
B
2.4
3.15
3
Hum
bold
t N
one
Aug
NQ
C
QF/
Sel
fgen
PG
&E
ZZ
ZZZ_
BLU
LKE
_6_B
LUE
LK
3115
6 B
LUE
LKP
P
12.5
0.
00
1 H
umbo
ldt
Non
e R
etire
d M
arke
t
PG
&E
7S
TDR
D_1
_SO
LAR
1 35
065
7STN
DR
D_1
21
17
.56
FW
Ker
n S
outh
Ker
n P
P,
Ker
n O
il A
ug N
QC
M
arke
t
PG
&E
A
DO
BE
E_1
_SO
LAR
35
021
Q62
2B
34.5
18
.42
1 K
ern
Sou
th K
ern
PP
Aug
NQ
C
Mar
ket
PG
&E
B
DG
RC
K_1
_UN
ITS
35
029
BA
DG
ER
CK
13
.8
44.0
0 1
Ker
n S
outh
Ker
n P
P A
ug N
QC
N
et S
elle
r
PG
&E
B
EA
RM
T_1_
UN
IT
3506
6 P
SE
-BE
AR
13
.8
47.0
0 1
Ker
n S
outh
Ker
n P
P,
Wes
t Par
k A
ug N
QC
N
et S
elle
r
PG
&E
B
KR
FLD
_2_S
OLA
R1
1.
20
K
ern
Sou
th K
ern
PP
Not
mod
eled
A
ug N
QC
M
arke
t
PG
&E
D
EXZ
EL_
1_U
NIT
35
024
DE
XEL
+ 13
.8
13.5
2 1
Ker
n S
outh
Ker
n P
P,
Ker
n O
il A
ug N
QC
N
et S
elle
r
PG
&E
D
ISC
OV
_1_C
HE
VR
N
3506
2 D
ISC
OV
RY
13
.8
2.05
1
Ker
n S
outh
Ker
n P
P,
Ker
n O
il A
ug N
QC
Q
F/S
elfg
en
PG
&E
D
OU
BLC
_1_U
NIT
S
3502
3 D
OU
BLE
C
13.8
51
.60
1 K
ern
Sou
th K
ern
PP
Aug
NQ
C
Net
Sel
ler
PG
&E
K
ER
NFT
_1_U
NIT
S
3502
6 K
ER
NFR
NT
9.11
52
.10
1 K
ern
Sou
th K
ern
PP
Aug
NQ
C
Net
Sel
ler

App
endi
x A
- L
ist o
f phy
sica
l res
ourc
es b
y PT
O, l
ocal
are
a an
d m
arke
t ID
88
PG
&E
K
RN
CN
Y_6_
UN
IT
3501
8 K
ER
NC
NYN
11
11
.50
1 K
ern
Sou
th K
ern
PP
Aug
NQ
C
Mar
ket
PG
&E
LA
MO
NT_
1_S
OLA
R1
3501
9 R
EG
ULU
S
0.4
52.7
5 1
Ker
n S
outh
Ker
n P
P A
ug N
QC
M
arke
t P
G&
E
LAM
ON
T_1_
SO
LAR
3 35
087
Q74
4G3
0.4
12.0
4 3
Ker
n S
outh
Ker
n P
P A
ug N
QC
M
arke
t P
G&
E
LAM
ON
T_1_
SO
LAR
4 35
059
Q74
4G2
0.4
21.4
2 2
Ker
n S
outh
Ker
n P
P A
ug N
QC
M
arke
t P
G&
E
LAM
ON
T_1_
SO
LAR
5 35
054
Q74
4G1
0.4
13.3
9 1
Ker
n S
outh
Ker
n P
P A
ug N
QC
M
arke
t
PG
&E
LI
VO
AK
_1_U
NIT
1
3505
8 P
SE
-LV
OK
9.
1 44
.80
1 K
ern
Sou
th K
ern
PP
, K
ern
Oil
Aug
NQ
C
Net
Sel
ler
PG
&E
M
TNP
OS
_1_U
NIT
35
036
MT
PO
SO
13
.8
31.1
2 1
Ker
n S
outh
Ker
n P
P,
Ker
n O
il A
ug N
QC
N
et S
elle
r
PG
&E
O
LDR
IV_6
_BIO
GA
S
1.
38
K
ern
Sou
th K
ern
PP
Not
mod
eled
A
ug N
QC
M
arke
t
PG
&E
O
LDR
V1_
6_S
OLA
R
3509
1 O
LD_R
VR
1 12
.5
16.6
7 1
Ker
n S
outh
Ker
n P
P A
ug N
QC
M
arke
t P
G&
E
RIO
BR
V_6
_UN
IT 1
3
3502
0 R
IOB
RA
VO
9.
1 0.
20
1 K
ern
Sou
th K
ern
PP
Aug
NQ
C
Mar
ket
PG
&E
S
IER
RA_
1_U
NIT
S
3502
7 H
ISIE
RR
A
9.11
52
.20
1 K
ern
Sou
th K
ern
PP
Aug
NQ
C
Mar
ket
PG
&E
S
KE
RN
_6_S
OLA
R1
3508
9 S
_KE
RN
0.
48
14.7
3 1
Ker
n S
outh
Ker
n P
P A
ug N
QC
M
arke
t
PG
&E
S
KE
RN
_6_S
OLA
R2
3506
9 Q
885
0.36
8.
03
1 K
ern
Sou
th K
ern
PP
Aug
NQ
C
Mar
ket
PG
&E
V
ED
DE
R_1
_SE
KE
RN
35
046
SE
KR
9.
11
12.4
7 1
Ker
n S
outh
Ker
n P
P,
Ker
n O
il A
ug N
QC
Q
F/S
elfg
en
PG
&E
ZZ
Z_N
ew U
nit
3509
2 Q
744G
4 0.
38
25.4
6 1
Ker
n S
outh
Ker
n P
P N
o N
QC
- es
t. da
ta
Mar
ket
PG
&E
ZZ
ZZZZ
_OIL
DAL
_1_U
NIT
1
3502
8 O
ILD
ALE
9.
11
0.00
1
Ker
n S
outh
Ker
n P
P,
Ker
n O
il R
etire
d N
et S
elle
r
PG
&E
ZZ
ZZZZ
_ULT
OG
L_1_
PO
SO
35
035
ULT
R P
WR
9.
11
0.00
1
Ker
n S
outh
Ker
n P
P,
Ker
n O
il R
etire
d Q
F/S
elfg
en
PG
&E
A
DLI
N_1
_UN
ITS
31
435
GEO
.EN
GY
9.
1 8.
00
1 N
CN
B
Eag
le R
ock,
Fu
lton,
Lak
eville
Mar
ket
PG
&E
A
DLI
N_1
_UN
ITS
31
435
GEO
.EN
GY
9.
1 8.
00
2 N
CN
B
Eag
le R
ock,
Fu
lton,
Lak
eville
Mar
ket
PG
&E
C
LOV
DL_
1_S
OLA
R
1.
07
N
CN
B
Eag
le R
ock,
Fu
lton,
Lak
eville
N
ot m
odel
ed
Aug
NQ
C
Mar
ket
PG
&E
C
STO
GA
_6_L
ND
FIL
0.
00
N
CN
B
Fulto
n, L
akev
ille
Not
mod
eled
E
nerg
y O
nly
Mar
ket
PG
&E
FU
LTO
N_1
_QF
0.
01
N
CN
B
Fulto
n, L
akev
ille
Not
mod
eled
A
ug N
QC
Q
F/S
elfg
en
PG
&E
G
EYS
11_7
_UN
IT11
31
412
GE
YSE
R11
13
.8
68.0
0 1
NC
NB
E
agle
Roc
k,
Fulto
n, L
akev
ille
M
arke
t
PG
&E
G
EYS
12_7
_UN
IT12
31
414
GE
YSE
R12
13
.8
50.0
0 1
NC
NB
Fu
lton,
Lak
eville
Mar
ket
PG
&E
G
EYS
13_7
_UN
IT13
31
416
GE
YSE
R13
13
.8
56.0
0 1
NC
NB
La
kevi
lle
M
arke
t P
G&
E
GE
YS14
_7_U
NIT
14
3141
8 G
EYS
ER
14
13.8
50
.00
1 N
CN
B
Fulto
n, L
akev
ille
M
arke
t

App
endi
x A
- L
ist o
f phy
sica
l res
ourc
es b
y PT
O, l
ocal
are
a an
d m
arke
t ID
89
PG
&E
G
EYS
16_7
_UN
IT16
31
420
GE
YSE
R16
13
.8
49.0
0 1
NC
NB
Fu
lton,
Lak
eville
Mar
ket
PG
&E
G
EYS
17_7
_UN
IT17
31
422
GE
YSE
R17
13
.8
56.0
0 1
NC
NB
Fu
lton,
Lak
eville
Mar
ket
PG
&E
G
EYS
18_7
_UN
IT18
31
424
GE
YSE
R18
13
.8
45.0
0 1
NC
NB
La
kevi
lle
M
arke
t P
G&
E
GE
YS20
_7_U
NIT
20
3142
6 G
EYS
ER
20
13.8
40
.00
1 N
CN
B
Lake
ville
Mar
ket
PG
&E
G
YS5X
6_7_
UN
ITS
31
406
GE
YSR
5-6
13.8
42
.50
1 N
CN
B
Eag
le R
ock,
Fu
lton,
Lak
eville
Mar
ket
PG
&E
G
YS5X
6_7_
UN
ITS
31
406
GE
YSR
5-6
13.8
42
.50
2 N
CN
B
Eag
le R
ock,
Fu
lton,
Lak
eville
Mar
ket
PG
&E
G
YS7X
8_7_
UN
ITS
31
408
GE
YSE
R78
13
.8
38.0
0 1
NC
NB
E
agle
Roc
k,
Fulto
n, L
akev
ille
M
arke
t
PG
&E
G
YS7X
8_7_
UN
ITS
31
408
GE
YSE
R78
13
.8
38.0
0 2
NC
NB
E
agle
Roc
k,
Fulto
n, L
akev
ille
M
arke
t
PG
&E
G
YSR
VL_
7_W
SPR
NG
1.45
NC
NB
Fu
lton,
Lak
eville
N
ot m
odel
ed
Aug
NQ
C
QF/
Sel
fgen
PG
&E
H
ILA
ND
_7_Y
OLO
WD
0.00
NC
NB
E
agle
Roc
k,
Fulto
n, L
akev
ille
Not
Mod
eled
. E
nerg
y O
nly
Mar
ket
PG
&E
IG
NA
CO
_1_Q
F
0.00
NC
NB
La
kevi
lle
Not
mod
eled
A
ug N
QC
Q
F/S
elfg
en
PG
&E
IN
DV
LY_1
_UN
ITS
31
436
IND
IAN
V
9.1
1.11
1
NC
NB
E
agle
Roc
k,
Fulto
n, L
akev
ille
Aug
NQ
C
Net
Sel
ler
PG
&E
M
ON
TPH
_7_U
NIT
S
3270
0 M
ON
TIC
LO
9.1
5.43
1
NC
NB
Fu
lton,
Lak
eville
A
ug N
QC
M
arke
t
PG
&E
M
ON
TPH
_7_U
NIT
S
3270
0 M
ON
TIC
LO
9.1
5.43
2
NC
NB
Fu
lton,
Lak
eville
A
ug N
QC
M
arke
t
PG
&E
M
ON
TPH
_7_U
NIT
S
3270
0 M
ON
TIC
LO
9.1
1.63
3
NC
NB
Fu
lton,
Lak
eville
A
ug N
QC
M
arke
t P
G&
E
NC
PA
_7_G
P1U
N1
3810
6 N
CPA
1GY1
13
.8
31.0
0 1
NC
NB
La
kevi
lle
Aug
NQ
C
MU
NI
PG
&E
N
CP
A_7
_GP
1UN
2 38
108
NC
PA1G
Y2
13.8
28
.00
1 N
CN
B
Lake
ville
A
ug N
QC
M
UN
I P
G&
E
NC
PA
_7_G
P2U
N3
3811
0 N
CPA
2GY1
13
.8
0.00
1
NC
NB
Fu
lton,
Lak
eville
A
ug N
QC
M
UN
I P
G&
E
NC
PA
_7_G
P2U
N4
3811
2 N
CPA
2GY2
13
.8
52.7
3 1
NC
NB
Fu
lton,
Lak
eville
A
ug N
QC
M
UN
I
PG
&E
P
OTT
ER
_6_U
NIT
S
3143
3 P
OTT
RV
LY
2.4
5.29
1
NC
NB
E
agle
Roc
k,
Fulto
n, L
akev
ille
Aug
NQ
C
Mar
ket
PG
&E
P
OTT
ER
_6_U
NIT
S
3143
3 P
OTT
RV
LY
2.4
2.40
3
NC
NB
E
agle
Roc
k,
Fulto
n, L
akev
ille
Aug
NQ
C
Mar
ket
PG
&E
P
OTT
ER
_6_U
NIT
S
3143
3 P
OTT
RV
LY
2.4
2.40
4
NC
NB
E
agle
Roc
k,
Fulto
n, L
akev
ille
Aug
NQ
C
Mar
ket
PG
&E
P
OTT
ER
_7_V
EC
INO
0.00
NC
NB
E
agle
Roc
k,
Fulto
n, L
akev
ille
Not
mod
eled
A
ug N
QC
Q
F/S
elfg
en
PG
&E
S
AN
TFG
_7_U
NIT
S
3140
0 S
AN
TA F
E
13.8
31
.50
1 N
CN
B
Lake
ville
Mar
ket
PG
&E
S
AN
TFG
_7_U
NIT
S
3140
0 S
AN
TA F
E
13.8
31
.50
2 N
CN
B
Lake
ville
Mar
ket

App
endi
x A
- L
ist o
f phy
sica
l res
ourc
es b
y PT
O, l
ocal
are
a an
d m
arke
t ID
90
PG
&E
S
MU
DG
O_7
_UN
IT 1
31
430
SM
UD
GE
O1
13.8
47
.00
1 N
CN
B
Lake
ville
Mar
ket
PG
&E
S
NM
ALF
_6_U
NIT
S
3144
6 S
ON
MA
LF
9.1
3.29
1
NC
NB
Fu
lton,
Lak
eville
A
ug N
QC
Q
F/S
elfg
en
PG
&E
U
KIA
H_7
_LA
KE
MN
38
020
CIT
Y U
KH
11
5 0.
49
1 N
CN
B
Eag
le R
ock,
Fu
lton,
Lak
eville
A
ug N
QC
M
UN
I
PG
&E
U
KIA
H_7
_LA
KE
MN
38
020
CIT
Y U
KH
11
5 1.
21
2 N
CN
B
Eag
le R
ock,
Fu
lton,
Lak
eville
A
ug N
QC
M
UN
I
PG
&E
W
DFR
DF_
2_U
NIT
S
3140
4 W
EST
FOR
13
.8
12.5
0 1
NC
NB
Fu
lton,
Lak
eville
Mar
ket
PG
&E
W
DFR
DF_
2_U
NIT
S
3140
4 W
EST
FOR
13
.8
12.5
0 2
NC
NB
Fu
lton,
Lak
eville
Mar
ket
PG
&E
ZZ
ZZZ_
BE
AR
CN
_2_U
NIT
S
3140
2 B
EA
R C
AN
13
.8
0.00
1
NC
NB
Fu
lton,
Lak
eville
R
etire
d M
arke
t P
G&
E
ZZZZ
Z_B
EA
RC
N_2
_UN
ITS
31
402
BE
AR
CA
N
13.8
0.
00
2 N
CN
B
Fulto
n, L
akev
ille
Ret
ired
Mar
ket
PG
&E
ZZ
ZZZZ
_GE
YS17
_2_B
OTR
CK
31
421
BO
TTLE
RK
13
.8
0.00
1
NC
NB
Fu
lton,
Lak
eville
R
etire
d M
arke
t
PG
&E
A
LLG
NY_
6_H
YD
RO
1
0.15
Sie
rra
Sou
th o
f Tab
le
Mou
ntai
n N
ot m
odel
ed
Aug
NQ
C
Mar
ket
PG
&E
A
PLH
IL_1
_SLA
BC
K
0.
00
1 S
ierr
a
Pla
cerv
ille, S
outh
of
Rio
Oso
, Sou
th
of P
aler
mo,
Sou
th
of T
able
Mou
ntai
n
Not
mod
eled
E
nerg
y O
nly
Mar
ket
PG
&E
B
AN
GO
R_6
_HY
DR
O
0.
54
S
ierr
a S
outh
of T
able
M
ount
ain
Not
mod
eled
A
ug N
QC
M
arke
t
PG
&E
B
ELD
EN
_7_U
NIT
1
3178
4 B
ELD
EN
13
.8
119.
00
1 S
ierr
a S
outh
of P
aler
mo,
S
outh
of T
able
M
ount
ain
Aug
NQ
C
Mar
ket
PG
&E
B
IOM
AS
_1_U
NIT
1
3215
6 W
OO
DLA
ND
9.
11
24.3
1 1
Sie
rra
Dru
m-R
io O
so,
Sou
th o
f Pal
erm
o,
Sou
th o
f Tab
le
Mou
ntai
n
Aug
NQ
C
Net
Sel
ler
PG
&E
B
NN
IEN
_7_A
LTA
PH
32
376
BO
NN
IE N
60
1.
00
S
ierr
a
Wei
mer
, Pla
cer,
Dru
m-R
io O
so,
Sou
th o
f Rio
Oso
, S
outh
of P
aler
mo,
S
outh
of T
able
M
ount
ain
Not
mod
eled
A
ug N
QC
M
arke
t
PG
&E
B
OG
UE
_1_U
NIT
A1
3245
1 FR
EC
13.8
45
.00
1 S
ierr
a B
ogue
, Dru
m-R
io
Oso
, Sou
th o
f Ta
ble
Mou
ntai
n A
ug N
QC
M
arke
t
PG
&E
B
OW
MN
_6_H
YDR
O
3248
0 B
OW
MA
N
9.11
1.
98
1 S
ierr
a D
rum
-Rio
Oso
, S
outh
of P
aler
mo,
A
ug N
QC
M
UN
I

App
endi
x A
- L
ist o
f phy
sica
l res
ourc
es b
y PT
O, l
ocal
are
a an
d m
arke
t ID
91
Sou
th o
f Tab
le
Mou
ntai
n
PG
&E
B
UC
KC
K_2
_HYD
RO
0.45
Sie
rra
Sou
th o
f Pal
erm
o,
Sou
th o
f Tab
le
Mou
ntai
n
Not
mod
eled
A
ug N
QC
M
arke
t
PG
&E
B
UC
KC
K_7
_OA
KFL
T
1.30
Sie
rra
Sou
th o
f Pal
erm
o,
Sou
th o
f Tab
le
Mou
ntai
n
Not
mod
eled
A
ug N
QC
M
arke
t
PG
&E
B
UC
KC
K_7
_PL1
X2
3182
0 B
CK
S C
RK
11
31
.03
1 S
ierr
a S
outh
of P
aler
mo,
S
outh
of T
able
M
ount
ain
Aug
NQ
C
Mar
ket
PG
&E
B
UC
KC
K_7
_PL1
X2
3182
0 B
CK
S C
RK
11
26
.97
2 S
ierr
a S
outh
of P
aler
mo,
S
outh
of T
able
M
ount
ain
Aug
NQ
C
Mar
ket
PG
&E
C
AM
PFW
_7_F
AR
WS
T 32
470
CM
P.F
AR
W
9.11
2.
90
1 S
ierr
a S
outh
of T
able
M
ount
ain
Aug
NQ
C
MU
NI
PG
&E
C
HIC
PK
_7_U
NIT
1
3246
2 C
HI.P
AR
K 11
.5
42.0
0 1
Sie
rra
Pla
cer,
Dru
m-R
io
Oso
, Sou
th o
f Rio
O
so, S
outh
of
Pal
erm
o, S
outh
of
Tabl
e M
ount
ain
Aug
NQ
C
MU
NI
PG
&E
C
OLG
AT_
7_U
NIT
1
3245
0 C
OLG
ATE
1 13
.8
161.
65
1 S
ierr
a S
outh
of T
able
M
ount
ain
Aug
NQ
C
MU
NI
PG
&E
C
OLG
AT_
7_U
NIT
2
3245
2 C
OLG
ATE
2 13
.8
161.
68
1 S
ierr
a S
outh
of T
able
M
ount
ain
Aug
NQ
C
MU
NI
PG
&E
C
RE
STA
_7_P
L1X2
31
812
CR
ES
TA
11.5
34
.66
1 S
ierr
a S
outh
of P
aler
mo,
S
outh
of T
able
M
ount
ain
Aug
NQ
C
Mar
ket
PG
&E
C
RE
STA
_7_P
L1X2
31
812
CR
ES
TA
11.5
35
.34
2 S
ierr
a S
outh
of P
aler
mo,
S
outh
of T
able
M
ount
ain
Aug
NQ
C
Mar
ket
PG
&E
D
AV
IS_1
_SO
LAR
1
0.90
Sie
rra
Dru
m-R
io O
so,
Sou
th o
f Pal
erm
o,
Sou
th o
f Tab
le
Mou
ntai
n
Not
mod
eled
A
ug N
QC
M
arke
t
PG
&E
D
AV
IS_1
_SO
LAR
2
0.95
Sie
rra
Dru
m-R
io O
so,
Sou
th o
f Pal
erm
o,
Sou
th o
f Tab
le
Mou
ntai
n
Not
mod
eled
A
ug N
QC
M
arke
t
PG
&E
D
AV
IS_7
_MN
ME
TH
1.
96
S
ierr
a
Dru
m-R
io O
so,
Sou
th o
f Pal
erm
o,
Sou
th o
f Tab
le
Mou
ntai
n
Not
mod
eled
A
ug N
QC
M
arke
t

App
endi
x A
- L
ist o
f phy
sica
l res
ourc
es b
y PT
O, l
ocal
are
a an
d m
arke
t ID
92
PG
&E
D
EA
DC
K_1
_UN
IT
3186
2 D
EAD
WO
OD
9.
11
0.00
1
Sie
rra
Dru
m-R
io O
so,
Sou
th o
f Tab
le
Mou
ntai
n A
ug N
QC
M
UN
I
PG
&E
D
EE
RC
R_6
_UN
IT 1
32
474
DE
ER
CR
K
9.11
7.
00
1 S
ierr
a
Dru
m-R
io O
so,
Sou
th o
f Pal
erm
o,
Sou
th o
f Tab
le
Mou
ntai
n
Aug
NQ
C
Mar
ket
PG
&E
D
RU
M_7
_PL1
X2
3250
4 D
RU
M 1
-2
6.6
13.0
0 1
Sie
rra
Dru
m-R
io O
so,
Sou
th o
f Pal
erm
o,
Sou
th o
f Tab
le
Mou
ntai
n
Aug
NQ
C
Mar
ket
PG
&E
D
RU
M_7
_PL1
X2
3250
4 D
RU
M 1
-2
6.6
13.0
0 2
Sie
rra
Dru
m-R
io O
so,
Sou
th o
f Pal
erm
o,
Sou
th o
f Tab
le
Mou
ntai
n
Aug
NQ
C
Mar
ket
PG
&E
D
RU
M_7
_PL3
X4
3250
6 D
RU
M 3
-4
6.6
13.2
6 1
Sie
rra
Dru
m-R
io O
so,
Sou
th o
f Pal
erm
o,
Sou
th o
f Tab
le
Mou
ntai
n
Aug
NQ
C
Mar
ket
PG
&E
D
RU
M_7
_PL3
X4
3250
6 D
RU
M 3
-4
6.6
15.6
4 2
Sie
rra
Dru
m-R
io O
so,
Sou
th o
f Pal
erm
o,
Sou
th o
f Tab
le
Mou
ntai
n
Aug
NQ
C
Mar
ket
PG
&E
D
RU
M_7
_UN
IT 5
32
454
DR
UM
5
13.8
50
.00
1 S
ierr
a
Dru
m-R
io O
so,
Sou
th o
f Pal
erm
o,
Sou
th o
f Tab
le
Mou
ntai
n
Aug
NQ
C
Mar
ket
PG
&E
D
UTC
H1_
7_U
NIT
1
3246
4 D
TCH
FLT1
11
22
.00
1 S
ierr
a
Pla
cer,
Dru
m-R
io
Oso
, Sou
th o
f Rio
O
so, S
outh
of
Pal
erm
o, S
outh
of
Tabl
e M
ount
ain
Aug
NQ
C
Mar
ket
PG
&E
D
UTC
H2_
7_U
NIT
1
3250
2 D
TCH
FLT2
6.
9 26
.00
1 S
ierr
a
Dru
m-R
io O
so,
Sou
th o
f Pal
erm
o,
Sou
th o
f Tab
le
Mou
ntai
n
Aug
NQ
C
MU
NI
PG
&E
E
LDO
RO
_7_U
NIT
1
3251
3 E
LDR
AD
O1
21.6
11
.00
1 S
ierr
a
Pla
cerv
ille, S
outh
of
Rio
Oso
, Sou
th
of P
aler
mo,
Sou
th
of T
able
Mou
ntai
n
M
arke
t
PG
&E
E
LDO
RO
_7_U
NIT
2
3251
4 E
LDR
AD
O2
21.6
11
.00
1 S
ierr
a
Pla
cerv
ille, S
outh
of
Rio
Oso
, Sou
th
of P
aler
mo,
Sou
th
of T
able
Mou
ntai
n
M
arke
t
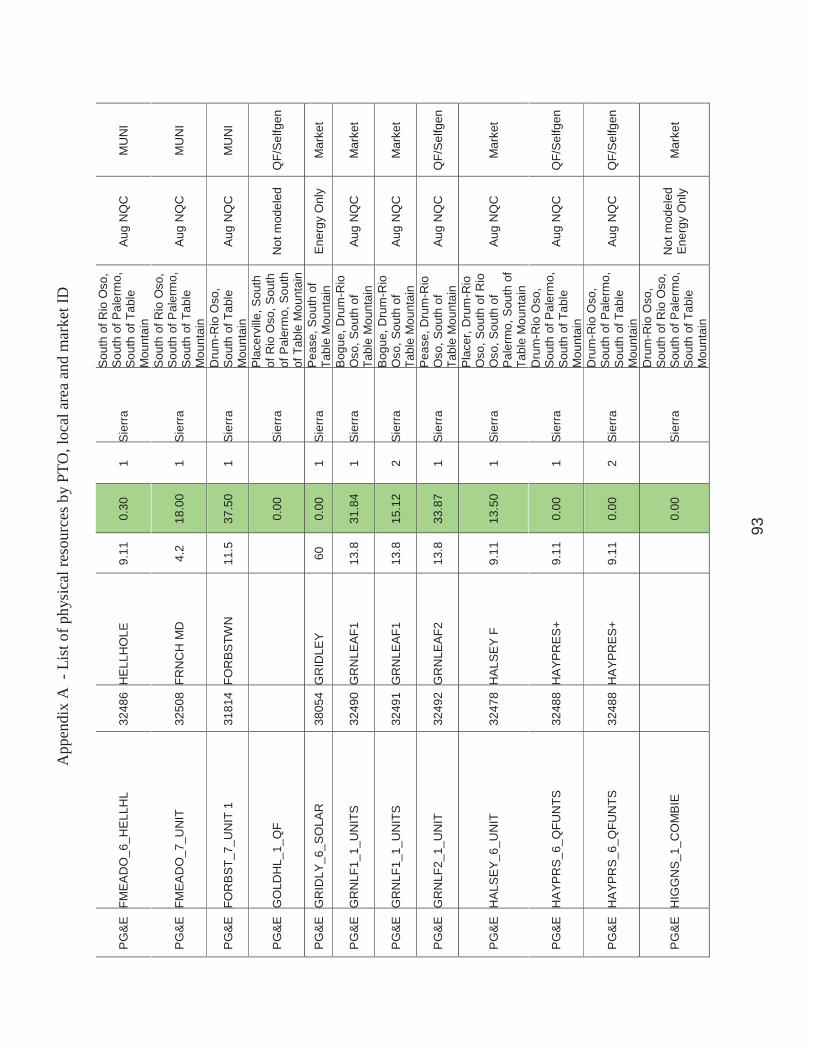
App
endi
x A
- L
ist o
f phy
sica
l res
ourc
es b
y PT
O, l
ocal
are
a an
d m
arke
t ID
93
PG
&E
FM
EA
DO
_6_H
ELL
HL
3248
6 H
ELL
HO
LE
9.11
0.
30
1 S
ierr
a
Sou
th o
f Rio
Oso
, S
outh
of P
aler
mo,
S
outh
of T
able
M
ount
ain
Aug
NQ
C
MU
NI
PG
&E
FM
EA
DO
_7_U
NIT
32
508
FRN
CH
MD
4.
2 18
.00
1 S
ierr
a
Sou
th o
f Rio
Oso
, S
outh
of P
aler
mo,
S
outh
of T
able
M
ount
ain
Aug
NQ
C
MU
NI
PG
&E
FO
RB
ST_
7_U
NIT
1
3181
4 FO
RB
STW
N
11.5
37
.50
1 S
ierr
a D
rum
-Rio
Oso
, S
outh
of T
able
M
ount
ain
Aug
NQ
C
MU
NI
PG
&E
G
OLD
HL_
1_Q
F
0.00
Sie
rra
Pla
cerv
ille, S
outh
of
Rio
Oso
, Sou
th
of P
aler
mo,
Sou
th
of T
able
Mou
ntai
n
Not
mod
eled
Q
F/S
elfg
en
PG
&E
G
RID
LY_6
_SO
LAR
38
054
GR
IDLE
Y
60
0.00
1
Sie
rra
Pea
se, S
outh
of
Tabl
e M
ount
ain
Ene
rgy
Onl
y M
arke
t
PG
&E
G
RN
LF1_
1_U
NIT
S
3249
0 G
RN
LEA
F1
13.8
31
.84
1 S
ierr
a B
ogue
, Dru
m-R
io
Oso
, Sou
th o
f Ta
ble
Mou
ntai
n A
ug N
QC
M
arke
t
PG
&E
G
RN
LF1_
1_U
NIT
S
3249
1 G
RN
LEA
F1
13.8
15
.12
2 S
ierr
a B
ogue
, Dru
m-R
io
Oso
, Sou
th o
f Ta
ble
Mou
ntai
n A
ug N
QC
M
arke
t
PG
&E
G
RN
LF2_
1_U
NIT
32
492
GR
NLE
AF2
13
.8
33.8
7 1
Sie
rra
Pea
se, D
rum
-Rio
O
so, S
outh
of
Tabl
e M
ount
ain
Aug
NQ
C
QF/
Sel
fgen
PG
&E
H
ALS
EY_
6_U
NIT
32
478
HA
LSE
Y F
9.11
13
.50
1 S
ierr
a
Pla
cer,
Dru
m-R
io
Oso
, Sou
th o
f Rio
O
so, S
outh
of
Pal
erm
o, S
outh
of
Tabl
e M
ount
ain
Aug
NQ
C
Mar
ket
PG
&E
H
AYP
RS
_6_Q
FUN
TS
3248
8 H
AYP
RE
S+
9.11
0.
00
1 S
ierr
a
Dru
m-R
io O
so,
Sou
th o
f Pal
erm
o,
Sou
th o
f Tab
le
Mou
ntai
n
Aug
NQ
C
QF/
Sel
fgen
PG
&E
H
AYP
RS
_6_Q
FUN
TS
3248
8 H
AYP
RE
S+
9.11
0.
00
2 S
ierr
a
Dru
m-R
io O
so,
Sou
th o
f Pal
erm
o,
Sou
th o
f Tab
le
Mou
ntai
n
Aug
NQ
C
QF/
Sel
fgen
PG
&E
H
IGG
NS
_1_C
OM
BIE
0.00
Sie
rra
Dru
m-R
io O
so,
Sou
th o
f Rio
Oso
, S
outh
of P
aler
mo,
S
outh
of T
able
M
ount
ain
Not
mod
eled
E
nerg
y O
nly
Mar
ket

App
endi
x A
- L
ist o
f phy
sica
l res
ourc
es b
y PT
O, l
ocal
are
a an
d m
arke
t ID
94
PG
&E
H
IGG
NS
_7_Q
FUN
TS
0.
23
S
ierr
a
Dru
m-R
io O
so,
Sou
th o
f Rio
Oso
, S
outh
of P
aler
mo,
S
outh
of T
able
M
ount
ain
Not
mod
eled
A
ug N
QC
Q
F/S
elfg
en
PG
&E
K
AN
AK
A_1
_UN
IT
0.
00
S
ierr
a D
rum
-Rio
Oso
, S
outh
of T
able
M
ount
ain
Not
mod
eled
A
ug N
QC
M
UN
I
PG
&E
K
ELY
RG
_6_U
NIT
31
834
KE
LLYR
DG
9.
11
11.0
0 1
Sie
rra
Dru
m-R
io O
so,
Sou
th o
f Tab
le
Mou
ntai
n A
ug N
QC
M
UN
I
PG
&E
LI
VE
OK
_6_S
OLA
R
0.
87
S
ierr
a P
ease
, Sou
th o
f Ta
ble
Mou
ntai
n N
ot m
odel
ed
Aug
NQ
C
Mar
ket
PG
&E
LO
DIE
C_2
_PL1
X2
3812
4 LO
DI S
T1
18
95.8
2 1
Sie
rra
Sou
th o
f Rio
Oso
, S
outh
of P
aler
mo,
S
outh
of T
able
M
ount
ain
M
UN
I
PG
&E
LO
DIE
C_2
_PL1
X2
3812
3 LO
DI C
T1
18
184.
18
1 S
ierr
a
Sou
th o
f Rio
Oso
, S
outh
of P
aler
mo,
S
outh
of T
able
M
ount
ain
M
UN
I
PG
&E
M
DFK
RL_
2_P
RO
JCT
3245
6 M
IDLF
OR
K
13.8
66
.49
1 S
ierr
a
Sou
th o
f Rio
Oso
, S
outh
of P
aler
mo,
S
outh
of T
able
M
ount
ain
Aug
NQ
C
MU
NI
PG
&E
M
DFK
RL_
2_P
RO
JCT
3245
8 R
ALS
TON
13
.8
85.4
1 1
Sie
rra
Sou
th o
f Rio
Oso
, S
outh
of P
aler
mo,
S
outh
of T
able
M
ount
ain
Aug
NQ
C
MU
NI
PG
&E
M
DFK
RL_
2_P
RO
JCT
3245
6 M
IDLF
OR
K
13.8
66
.49
2 S
ierr
a
Sou
th o
f Rio
Oso
, S
outh
of P
aler
mo,
S
outh
of T
able
M
ount
ain
Aug
NQ
C
MU
NI
PG
&E
N
AR
OW
1_2_
UN
IT
3246
6 N
AR
RO
WS1
9.
1 12
.00
1 S
ierr
a S
outh
of T
able
M
ount
ain
Aug
NQ
C
Mar
ket
PG
&E
N
AR
OW
2_2_
UN
IT
3246
8 N
AR
RO
WS2
9.
1 28
.51
1 S
ierr
a S
outh
of T
able
M
ount
ain
Aug
NQ
C
MU
NI
PG
&E
N
WC
STL
_7_U
NIT
1
3246
0 N
EWC
STL
E
13.2
12
.00
1 S
ierr
a
Pla
cer,
Dru
m-R
io
Oso
, Sou
th o
f Rio
O
so, S
outh
of
Pal
erm
o, S
outh
of
Tabl
e M
ount
ain
Aug
NQ
C
Mar
ket

App
endi
x A
- L
ist o
f phy
sica
l res
ourc
es b
y PT
O, l
ocal
are
a an
d m
arke
t ID
95
PG
&E
O
RO
VIL
_6_U
NIT
31
888
OR
OV
LLE
9.
11
7.50
1
Sie
rra
Dru
m-R
io O
so,
Sou
th o
f Tab
le
Mou
ntai
n A
ug N
QC
M
arke
t
PG
&E
O
XBO
W_6
_DR
UM
32
484
OXB
OW
F
9.11
6.
00
1 S
ierr
a
Wei
mer
, Dru
m-R
io
Oso
, Sou
th o
f P
aler
mo,
Sou
th o
f Ta
ble
Mou
ntai
n
Aug
NQ
C
MU
NI
PG
&E
P
LAC
VL_
1_C
HIL
IB
3251
0 C
HIL
IBA
R
4.2
8.40
1
Sie
rra
Pla
cerv
ille, S
outh
of
Rio
Oso
, Sou
th
of P
aler
mo,
Sou
th
of T
able
Mou
ntai
n
Aug
NQ
C
Mar
ket
PG
&E
P
LAC
VL_
1_R
CK
CR
E
0.
00
S
ierr
a
Pla
cerv
ille, S
outh
of
Rio
Oso
, Sou
th
of P
aler
mo,
Sou
th
of T
able
Mou
ntai
n
Not
mod
eled
A
ug N
QC
M
arke
t
PG
&E
P
LSN
TG_7
_LN
CLN
D
3240
8 P
LSN
T G
R
60
3.20
Sie
rra
Dru
m-R
io O
so,
Sou
th o
f Rio
Oso
, S
outh
of P
aler
mo,
S
outh
of T
able
M
ount
ain
Not
mod
eled
A
ug N
QC
M
arke
t
PG
&E
P
OE
PH
_7_U
NIT
1
3179
0 P
OE
1
13
.8
60.0
0 1
Sie
rra
Sou
th o
f Pal
erm
o,
Sou
th o
f Tab
le
Mou
ntai
n A
ug N
QC
M
arke
t
PG
&E
P
OE
PH
_7_U
NIT
2
3179
2 P
OE
2
13
.8
60.0
0 1
Sie
rra
Sou
th o
f Pal
erm
o,
Sou
th o
f Tab
le
Mou
ntai
n A
ug N
QC
M
arke
t
PG
&E
R
CK
CR
K_7
_UN
IT 1
31
786
RO
CK
CK
1 13
.8
57.0
0 1
Sie
rra
Sou
th o
f Pal
erm
o,
Sou
th o
f Tab
le
Mou
ntai
n A
ug N
QC
M
arke
t
PG
&E
R
CK
CR
K_7
_UN
IT 2
31
788
RO
CK
CK
2 13
.8
56.9
0 1
Sie
rra
Sou
th o
f Pal
erm
o,
Sou
th o
f Tab
le
Mou
ntai
n A
ug N
QC
M
arke
t
PG
&E
R
IOO
SO
_1_Q
F
0.92
Sie
rra
Dru
m-R
io O
so,
Sou
th o
f Pal
erm
o,
Sou
th o
f Tab
le
Mou
ntai
n
Not
mod
eled
A
ug N
QC
Q
F/S
elfg
en
PG
&E
R
OLL
IN_6
_UN
IT
3247
6 R
OLL
INS
F 9.
11
13.5
0 1
Sie
rra
Wei
mer
, Dru
m-R
io
Oso
, Sou
th o
f P
aler
mo,
Sou
th o
f Ta
ble
Mou
ntai
n
Aug
NQ
C
MU
NI
PG
&E
S
LYC
RK
_1_U
NIT
1
3183
2 S
LY.C
R.
9.11
13
.00
1 S
ierr
a D
rum
-Rio
Oso
, S
outh
of T
able
M
ount
ain
Aug
NQ
C
Mar
ket

App
endi
x A
- L
ist o
f phy
sica
l res
ourc
es b
y PT
O, l
ocal
are
a an
d m
arke
t ID
96
PG
&E
S
PA
ULD
_6_U
NIT
3
3247
2 S
PA
ULD
G
9.11
6.
50
3 S
ierr
a
Dru
m-R
io O
so,
Sou
th o
f Pal
erm
o,
Sou
th o
f Tab
le
Mou
ntai
n
Aug
NQ
C
Mar
ket
PG
&E
S
PA
ULD
_6_U
NIT
12
3247
2 S
PA
ULD
G
9.11
7.
00
1 S
ierr
a
Dru
m-R
io O
so,
Sou
th o
f Pal
erm
o,
Sou
th o
f Tab
le
Mou
ntai
n
Aug
NQ
C
Mar
ket
PG
&E
S
PA
ULD
_6_U
NIT
12
3247
2 S
PA
ULD
G
9.11
4.
40
2 S
ierr
a
Dru
m-R
io O
so,
Sou
th o
f Pal
erm
o,
Sou
th o
f Tab
le
Mou
ntai
n
Aug
NQ
C
Mar
ket
PG
&E
S
PI L
I_2_
UN
IT 1
32
498
SP
ILIN
CF
12.5
9.
79
1 S
ierr
a
Dru
m-R
io O
so,
Sou
th o
f Rio
Oso
, S
outh
of P
aler
mo,
S
outh
of T
able
M
ount
ain
Aug
NQ
C
Net
Sel
ler
PG
&E
S
TIG
CT_
2_LO
DI
3811
4 S
tig C
C
13.8
49
.50
1 S
ierr
a
Sou
th o
f Rio
Oso
, S
outh
of P
aler
mo,
S
outh
of T
able
M
ount
ain
M
UN
I
PG
&E
U
LTR
CK
_2_U
NIT
32
500
ULT
R R
CK
9.
11
21.8
1 1
Sie
rra
Dru
m-R
io O
so,
Sou
th o
f Rio
Oso
, S
outh
of P
aler
mo,
S
outh
of T
able
M
ount
ain
Aug
NQ
C
QF/
Sel
fgen
PG
&E
W
DLE
AF_
7_U
NIT
1
3179
4 W
OO
DLE
AF
13.8
60
.00
1 S
ierr
a D
rum
-Rio
Oso
, S
outh
of T
able
M
ount
ain
Aug
NQ
C
MU
NI
PG
&E
W
HE
ATL
_6_L
ND
FIL
3235
0 W
HE
ATL
ND
60
3.
20
S
ierr
a S
outh
of T
able
M
ount
ain
Not
mod
eled
A
ug N
QC
M
arke
t
PG
&E
W
ISE_
1_U
NIT
1
3251
2 W
ISE
12
14.5
0 1
Sie
rra
Pla
cer,
Dru
m-R
io
Oso
, Sou
th o
f Rio
O
so, S
outh
of
Pal
erm
o, S
outh
of
Tabl
e M
ount
ain
Aug
NQ
C
Mar
ket
PG
&E
W
ISE_
1_U
NIT
2
3251
2 W
ISE
12
3.20
1
Sie
rra
Pla
cer,
Dru
m-R
io
Oso
, Sou
th o
f Rio
O
so, S
outh
of
Pal
erm
o, S
outh
of
Tabl
e M
ount
ain
Aug
NQ
C
Mar
ket
PG
&E
YU
BA
CT_
1_S
UN
SWT
3249
4 YU
BA
CTY
9.
11
23.9
8 1
Sie
rra
Pea
se, D
rum
-Rio
O
so, S
outh
of
Tabl
e M
ount
ain
Aug
NQ
C
Net
Sel
ler

App
endi
x A
- L
ist o
f phy
sica
l res
ourc
es b
y PT
O, l
ocal
are
a an
d m
arke
t ID
97
PG
&E
YU
BA
CT_
6_U
NIT
A1
3249
6 YC
EC
13.8
46
.00
1 S
ierr
a P
ease
, Dru
m-R
io
Oso
, Sou
th o
f Ta
ble
Mou
ntai
n
Mar
ket
PG
&E
ZZ
_NA
32
162
RIV
.DLT
A
9.11
0.
00
1 S
ierr
a
Dru
m-R
io O
so,
Sou
th o
f Pal
erm
o,
Sou
th o
f Tab
le
Mou
ntai
n
No
NQ
C -
hist
. da
ta
QF/
Sel
fgen
PG
&E
ZZ
_UC
DA
VS
_1_U
NIT
32
166
UC
DA
VIS
9.
11
0.00
R
N
Sie
rra
Dru
m-R
io O
so,
Sou
th o
f Pal
erm
o,
Sou
th o
f Tab
le
Mou
ntai
n
No
NQ
C -
hist
. da
ta
QF/
Sel
fgen
PG
&E
B
EA
RD
S_7
_UN
IT 1
34
074
BE
AR
DS
LY
6.9
8.36
1
Sto
ckto
n Te
sla-
Bel
lota
, S
tani
slau
s A
ug N
QC
M
UN
I
PG
&E
C
AM
CH
E_1
_PL1
X3
3385
0 C
AM
AN
CH
E
4.2
0.19
1
Sto
ckto
n Te
sla-
Bel
lota
A
ug N
QC
M
UN
I
PG
&E
C
AM
CH
E_1
_PL1
X3
3385
0 C
AM
AN
CH
E
4.2
0.19
2
Sto
ckto
n Te
sla-
Bel
lota
A
ug N
QC
M
UN
I
PG
&E
C
AM
CH
E_1
_PL1
X3
3385
0 C
AM
AN
CH
E
4.2
0.19
3
Sto
ckto
n Te
sla-
Bel
lota
A
ug N
QC
M
UN
I P
G&
E
CO
GN
AT_
1_U
NIT
33
818
CO
G.N
TNL
12
41.5
8 1
Sto
ckto
n W
eber
A
ug N
QC
N
et S
elle
r P
G&
E
CR
WC
KS
_1_S
OLA
R1
3405
1 Q
539
34.5
0.
00
1 S
tock
ton
Tesl
a-B
ello
ta
Ene
rgy
Onl
y M
arke
t
PG
&E
D
ON
NLS
_7_U
NIT
34
058
DO
NN
ELL
S
13.8
72
.00
1 S
tock
ton
Tesl
a-B
ello
ta,
Sta
nisl
aus
Aug
NQ
C
MU
NI
PG
&E
FR
OG
TN_7
_UTI
CA
0.00
Sto
ckto
n Te
sla-
Bel
lota
, S
tani
slau
s N
ot m
odel
ed
Ene
rgy
Onl
y M
arke
t
PG
&E
LO
CK
FD_1
_BE
AR
CK
0.00
Sto
ckto
n Te
sla-
Bel
lota
N
ot m
odel
ed
Ene
rgy
Onl
y M
arke
t
PG
&E
LO
CK
FD_1
_KS
OLA
R
0.
00
S
tock
ton
Tesl
a-B
ello
ta
Not
mod
eled
E
nerg
y O
nly
Mar
ket
PG
&E
LO
DI2
5_2_
UN
IT 1
38
120
LOD
I25C
T 9.
11
22.7
0 1
Sto
ckto
n Lo
ckef
ord
M
UN
I
PG
&E
P
EO
RIA
_1_S
OLA
R
1.
35
S
tock
ton
Tesl
a-B
ello
ta,
Sta
nisl
aus
Not
mod
eled
A
ug N
QC
M
arke
t
PG
&E
P
HO
EN
X_1_
UN
IT
2.
00
S
tock
ton
Tesl
a-B
ello
ta,
Sta
nisl
aus
Not
mod
eled
A
ug N
QC
M
arke
t
PG
&E
S
CH
LTE
_1_P
L1X3
33
805
GW
FTR
CY1
13
.8
82.9
0 1
Sto
ckto
n Te
sla-
Bel
lota
Mar
ket
PG
&E
S
CH
LTE
_1_P
L1X3
33
807
GW
FTR
CY2
13
.8
82.9
0 1
Sto
ckto
n Te
sla-
Bel
lota
Mar
ket
PG
&E
S
CH
LTE
_1_P
L1X3
33
811
GW
FTR
CY3
13
.8
133.
59
1 S
tock
ton
Tesl
a-B
ello
ta
M
arke
t
PG
&E
S
ND
BA
R_7
_UN
IT 1
34
060
SA
ND
BA
R
13.8
4.
19
1 S
tock
ton
Tesl
a-B
ello
ta,
Sta
nisl
aus
Aug
NQ
C
MU
NI
PG
&E
S
PIF
BD
_1_P
L1X2
33
917
FBE
RB
OR
D
115
1.53
1
Sto
ckto
n Te
sla-
Bel
lota
, S
tani
slau
s A
ug N
QC
M
arke
t

App
endi
x A
- L
ist o
f phy
sica
l res
ourc
es b
y PT
O, l
ocal
are
a an
d m
arke
t ID
98
PG
&E
S
PR
GA
P_1
_UN
IT 1
34
078
SP
RN
G G
P
6 7.
00
1 S
tock
ton
Tesl
a-B
ello
ta,
Sta
nisl
aus
Aug
NQ
C
Mar
ket
PG
&E
S
TAN
IS_7
_UN
IT 1
34
062
STA
NIS
LS
13.8
91
.00
1 S
tock
ton
Tesl
a-B
ello
ta,
Sta
nisl
aus
Aug
NQ
C
Mar
ket
PG
&E
S
TNR
ES
_1_U
NIT
34
056
STN
SLS
RP
13
.8
18.2
3 1
Sto
ckto
n Te
sla-
Bel
lota
A
ug N
QC
N
et S
elle
r
PG
&E
TU
LLC
K_7
_UN
ITS
34
076
TULL
OC
H
6.9
5.08
1
Sto
ckto
n Te
sla-
Bel
lota
A
ug N
QC
M
UN
I
PG
&E
TU
LLC
K_7
_UN
ITS
34
076
TULL
OC
H
6.9
5.72
2
Sto
ckto
n Te
sla-
Bel
lota
A
ug N
QC
M
UN
I
PG
&E
TU
LLC
K_7
_UN
ITS
34
076
TULL
OC
H
6.9
3.75
3
Sto
ckto
n Te
sla-
Bel
lota
A
ug N
QC
M
UN
I
PG
&E
U
LTP
CH
_1_U
NIT
1
3405
0 C
H.S
TN.
13.8
16
.19
1 S
tock
ton
Tesl
a-B
ello
ta,
Sta
nisl
aus
Aug
NQ
C
QF/
Sel
fgen
PG
&E
V
LYH
OM
_7_S
SJI
D
0.
74
S
tock
ton
Tesl
a-B
ello
ta,
Sta
nisl
aus
Not
mod
eled
A
ug N
QC
M
UN
I
PG
&E
W
EBE
R_6
_FO
RW
RD
4.20
Sto
ckto
n W
eber
N
ot m
odel
ed
Aug
NQ
C
Mar
ket
PG
&E
ZZ
_NA
33
687
STK
TN W
W
60
0.00
1
Sto
ckto
n W
eber
N
o N
QC
- hi
st.
data
Q
F/S
elfg
en
PG
&E
ZZ
_NA
33
830
GE
N.M
ILL
9.11
0.
00
1 S
tock
ton
Lock
efor
d N
o N
QC
- hi
st.
data
Q
F/S
elfg
en
SC
E
AC
AC
IA_6
_SO
LAR
29
878
AC
AC
IA_G
0.
48
0.00
E
Q
BC
/Ven
tura
B
ig C
reek
E
nerg
y O
nly
Mar
ket
SC
E
ALA
MO
_6_U
NIT
25
653
ALA
MO
SC
13
.8
15.0
7 1
BC
/Ven
tura
B
ig C
reek
A
ug N
QC
M
UN
I
SC
E
BIG
CR
K_2
_EXE
SWD
24
323
PO
RTA
L
4.8
9.45
1
BC
/Ven
tura
B
ig C
reek
, Rec
tor,
Ves
tal
Aug
NQ
C
Mar
ket
SC
E
BIG
CR
K_2
_EXE
SWD
24
306
B C
RK
1-1
7.2
19.5
8 1
BC
/Ven
tura
B
ig C
reek
, Rec
tor,
Ves
tal
Aug
NQ
C
Mar
ket
SC
E
BIG
CR
K_2
_EXE
SWD
24
311
B C
RK
3-1
13.8
34
.44
1 B
C/V
entu
ra
Big
Cre
ek, R
ecto
r, V
esta
l A
ug N
QC
M
arke
t
SC
E
BIG
CR
K_2
_EXE
SWD
24
308
B C
RK
2-1
13.8
49
.99
1 B
C/V
entu
ra
Big
Cre
ek, R
ecto
r, V
esta
l A
ug N
QC
M
arke
t
SC
E
BIG
CR
K_2
_EXE
SWD
24
317
MA
MO
TH1G
13
.8
92.0
2 1
BC
/Ven
tura
B
ig C
reek
, Rec
tor,
Ves
tal
Aug
NQ
C
Mar
ket
SC
E
BIG
CR
K_2
_EXE
SWD
24
306
B C
RK
1-1
7.2
21.2
6 2
BC
/Ven
tura
B
ig C
reek
, Rec
tor,
Ves
tal
Aug
NQ
C
Mar
ket
SC
E
BIG
CR
K_2
_EXE
SWD
24
311
B C
RK
3-1
13.8
33
.46
2 B
C/V
entu
ra
Big
Cre
ek, R
ecto
r, V
esta
l A
ug N
QC
M
arke
t
SC
E
BIG
CR
K_2
_EXE
SWD
24
308
B C
RK
2-1
13.8
51
.18
2 B
C/V
entu
ra
Big
Cre
ek, R
ecto
r, V
esta
l A
ug N
QC
M
arke
t

App
endi
x A
- L
ist o
f phy
sica
l res
ourc
es b
y PT
O, l
ocal
are
a an
d m
arke
t ID
99
SC
E
BIG
CR
K_2
_EXE
SWD
24
318
MA
MO
TH2G
13
.8
92.0
2 2
BC
/Ven
tura
B
ig C
reek
, Rec
tor,
Ves
tal
Aug
NQ
C
Mar
ket
SC
E
BIG
CR
K_2
_EXE
SWD
24
309
B C
RK
2-2
7.2
18.4
0 3
BC
/Ven
tura
B
ig C
reek
, Rec
tor,
Ves
tal
Aug
NQ
C
Mar
ket
SC
E
BIG
CR
K_2
_EXE
SWD
24
307
B C
RK
1-2
13.8
21
.26
3 B
C/V
entu
ra
Big
Cre
ek, R
ecto
r, V
esta
l A
ug N
QC
M
arke
t
SC
E
BIG
CR
K_2
_EXE
SWD
24
312
B C
RK
3-2
13.8
34
.44
3 B
C/V
entu
ra
Big
Cre
ek, R
ecto
r, V
esta
l A
ug N
QC
M
arke
t
SC
E
BIG
CR
K_2
_EXE
SWD
24
309
B C
RK
2-2
7.2
19.3
9 4
BC
/Ven
tura
B
ig C
reek
, Rec
tor,
Ves
tal
Aug
NQ
C
Mar
ket
SC
E
BIG
CR
K_2
_EXE
SWD
24
307
B C
RK
1-2
13.8
30
.71
4 B
C/V
entu
ra
Big
Cre
ek, R
ecto
r, V
esta
l A
ug N
QC
M
arke
t
SC
E
BIG
CR
K_2
_EXE
SWD
24
312
B C
RK
3-2
13.8
35
.43
4 B
C/V
entu
ra
Big
Cre
ek, R
ecto
r, V
esta
l A
ug N
QC
M
arke
t
SC
E
BIG
CR
K_2
_EXE
SWD
24
310
B C
RK
2-3
7.2
16.7
3 5
BC
/Ven
tura
B
ig C
reek
, Rec
tor,
Ves
tal
Aug
NQ
C
Mar
ket
SC
E
BIG
CR
K_2
_EXE
SWD
24
313
B C
RK
3-3
13.8
35
.92
5 B
C/V
entu
ra
Big
Cre
ek, R
ecto
r, V
esta
l A
ug N
QC
M
arke
t
SC
E
BIG
CR
K_2
_EXE
SWD
24
310
B C
RK
2-3
7.2
18.2
1 6
BC
/Ven
tura
B
ig C
reek
, Rec
tor,
Ves
tal
Aug
NQ
C
Mar
ket
SC
E
BIG
CR
K_2
_EXE
SWD
24
314
B C
RK
4
11.5
49
.60
41
BC
/Ven
tura
B
ig C
reek
, Rec
tor,
Ves
tal
Aug
NQ
C
Mar
ket
SC
E
BIG
CR
K_2
_EXE
SWD
24
314
B C
RK
4
11.5
49
.80
42
BC
/Ven
tura
B
ig C
reek
, Rec
tor,
Ves
tal
Aug
NQ
C
Mar
ket
SC
E
BIG
CR
K_2
_EXE
SWD
24
315
B C
RK
8
13.8
24
.01
81
BC
/Ven
tura
B
ig C
reek
, Rec
tor,
Ves
tal
Aug
NQ
C
Mar
ket
SC
E
BIG
CR
K_2
_EXE
SWD
24
315
B C
RK
8
13.8
43
.30
82
BC
/Ven
tura
B
ig C
reek
, Rec
tor,
Ves
tal
Aug
NQ
C
Mar
ket
SC
E
BIG
CR
K_7
_DA
M7
0.
00
B
C/V
entu
ra
Big
Cre
ek, R
ecto
r, V
esta
l N
ot m
odel
ed
Ene
rgy
Onl
y M
arke
t
SC
E
BIG
CR
K_7
_MA
MR
ES
0.00
BC
/Ven
tura
B
ig C
reek
, Rec
tor,
Ves
tal
Not
mod
eled
E
nerg
y O
nly
Mar
ket
SC
E
BIG
SK
Y_2_
SO
LAR
1 29
703
SP
_AN
TG1
0.8
16.0
7 1
BC
/Ven
tura
B
ig C
reek
A
ug N
QC
M
arke
t
SC
E
BIG
SK
Y_2_
SO
LAR
2 29
703
SP
_AN
TG1
0.8
32.1
3 1
BC
/Ven
tura
B
ig C
reek
A
ug N
QC
M
arke
t
SC
E
BIG
SK
Y_2_
SO
LAR
3 29
704
SP
_AN
TG2
0.8
16.0
7 1
BC
/Ven
tura
B
ig C
reek
A
ug N
QC
M
arke
t
SC
E
BIG
SK
Y_2_
SO
LAR
4 29
704
SP
_AN
TG2
0.8
16.0
6 1
BC
/Ven
tura
B
ig C
reek
A
ug N
QC
M
arke
t
SC
E
BIG
SK
Y_2_
SO
LAR
5 29
704
SP
_AN
TG2
0.8
4.02
1
BC
/Ven
tura
B
ig C
reek
A
ug N
QC
M
arke
t

App
endi
x A
- L
ist o
f phy
sica
l res
ourc
es b
y PT
O, l
ocal
are
a an
d m
arke
t ID
100
SC
E
BIG
SK
Y_2_
SO
LAR
6 29
704
SP
_AN
TG2
0.8
68.2
9 1
BC
/Ven
tura
B
ig C
reek
A
ug N
QC
M
arke
t
SC
E
BIG
SK
Y_2_
SO
LAR
7 29
704
SP
_AN
TG2
0.8
40.1
7 1
BC
/Ven
tura
B
ig C
reek
A
ug N
QC
M
arke
t S
CE
C
ED
UC
R_2
_SO
LAR
1 25
054
WD
T394
_a
0.48
0.
00
EQ
B
C/V
entu
ra
Big
Cre
ek, V
esta
l E
nerg
y O
nly
Mar
ket
SC
E
CE
DU
CR
_2_S
OLA
R2
2505
2 W
DT3
90_a
0.
48
0.00
E
Q
BC
/Ven
tura
B
ig C
reek
, Ves
tal
Ene
rgy
Onl
y M
arke
t
SC
E
CE
DU
CR
_2_S
OLA
R3
2505
8 W
DT6
03L
0.48
0.
00
EQ
B
C/V
entu
ra
Big
Cre
ek, V
esta
l E
nerg
y O
nly
Mar
ket
SC
E
CE
DU
CR
_2_S
OLA
R4
2505
6 W
DT4
39L
0.48
0.
00
EQ
B
C/V
entu
ra
Big
Cre
ek, V
esta
l E
nerg
y O
nly
Mar
ket
SC
E
DE
LSU
R_6
_CR
ES
T
0.00
BC
/Ven
tura
B
ig C
reek
E
nerg
y O
nly
Mar
ket
SC
E
DE
LSU
R_6
_DR
YFR
B
4.
37
B
C/V
entu
ra
Big
Cre
ek
Not
mod
eled
A
ug N
QC
M
arke
t
SC
E
DE
LSU
R_6
_SO
LAR
1
5.39
BC
/Ven
tura
B
ig C
reek
N
ot m
odel
ed
Aug
NQ
C
Mar
ket
SC
E
EA
STW
D_7
_UN
IT
2431
9 EA
STW
OO
D
13.8
19
9.00
1
BC
/Ven
tura
B
ig C
reek
, Rec
tor,
Ves
tal
M
arke
t
SC
E
ED
MO
NS
_2_N
SP
IN
2560
5 E
DM
ON
1AP
14
.4
16.8
6 1
BC
/Ven
tura
B
ig C
reek
P
umps
M
UN
I
SC
E
ED
MO
NS
_2_N
SP
IN
2560
6 E
DM
ON
2AP
14
.4
16.8
6 2
BC
/Ven
tura
B
ig C
reek
P
umps
M
UN
I
SC
E
ED
MO
NS
_2_N
SP
IN
2560
7 E
DM
ON
3AP
14
.4
16.8
6 3
BC
/Ven
tura
B
ig C
reek
P
umps
M
UN
I
SC
E
ED
MO
NS
_2_N
SP
IN
2560
7 E
DM
ON
3AP
14
.4
16.8
6 4
BC
/Ven
tura
B
ig C
reek
P
umps
M
UN
I
SC
E
ED
MO
NS
_2_N
SP
IN
2560
8 E
DM
ON
4AP
14
.4
16.8
6 5
BC
/Ven
tura
B
ig C
reek
P
umps
M
UN
I
SC
E
ED
MO
NS
_2_N
SP
IN
2560
8 E
DM
ON
4AP
14
.4
16.8
6 6
BC
/Ven
tura
B
ig C
reek
P
umps
M
UN
I
SC
E
ED
MO
NS
_2_N
SP
IN
2560
9 E
DM
ON
5AP
14
.4
16.8
6 7
BC
/Ven
tura
B
ig C
reek
P
umps
M
UN
I
SC
E
ED
MO
NS
_2_N
SP
IN
2560
9 E
DM
ON
5AP
14
.4
16.8
6 8
BC
/Ven
tura
B
ig C
reek
P
umps
M
UN
I
SC
E
ED
MO
NS
_2_N
SP
IN
2561
0 E
DM
ON
6AP
14
.4
16.8
6 9
BC
/Ven
tura
B
ig C
reek
P
umps
M
UN
I
SC
E
ED
MO
NS
_2_N
SP
IN
2561
0 E
DM
ON
6AP
14
.4
16.8
6 10
B
C/V
entu
ra
Big
Cre
ek
Pum
ps
MU
NI
SC
E
ED
MO
NS
_2_N
SP
IN
2561
1 E
DM
ON
7AP
14
.4
16.8
5 11
B
C/V
entu
ra
Big
Cre
ek
Pum
ps
MU
NI

App
endi
x A
- L
ist o
f phy
sica
l res
ourc
es b
y PT
O, l
ocal
are
a an
d m
arke
t ID
101
SC
E
ED
MO
NS
_2_N
SP
IN
2561
1 E
DM
ON
7AP
14
.4
16.8
5 12
B
C/V
entu
ra
Big
Cre
ek
Pum
ps
MU
NI
SC
E
ED
MO
NS
_2_N
SP
IN
2561
2 E
DM
ON
8AP
14
.4
16.8
5 13
B
C/V
entu
ra
Big
Cre
ek
Pum
ps
MU
NI
SC
E
ED
MO
NS
_2_N
SP
IN
2561
2 E
DM
ON
8AP
14
.4
16.8
5 14
B
C/V
entu
ra
Big
Cre
ek
Pum
ps
MU
NI
SC
E
GLO
W_6
_SO
LAR
29
896
AP
PIN
V
0.42
0.
00
EQ
B
C/V
entu
ra
Big
Cre
ek
Ene
rgy
Onl
y M
arke
t
SC
E
GO
LETA
_2_Q
F 24
057
GO
LETA
66
0.
05
B
C/V
entu
ra
Ven
tura
, S.C
lara
, M
oorp
ark
Not
mod
eled
A
ug N
QC
Q
F/S
elfg
en
SC
E
GO
LETA
_6_E
LLW
OD
29
004
ELLW
OO
D
13.8
54
.00
1 B
C/V
entu
ra
Ven
tura
, S.C
lara
, M
oorp
ark
M
arke
t
SC
E
GO
LETA
_6_E
XG
EN
24
362
EXG
EN
2 13
.8
2.17
G
1 B
C/V
entu
ra
Ven
tura
, S.C
lara
, M
oorp
ark
Aug
NQ
C
QF/
Sel
fgen
SC
E
GO
LETA
_6_E
XG
EN
24
326
EXG
EN
1 13
.8
1.49
S
1 B
C/V
entu
ra
Ven
tura
, S.C
lara
, M
oorp
ark
Aug
NQ
C
QF/
Sel
fgen
SC
E
GO
LETA
_6_G
AV
OTA
24
057
GO
LETA
66
0.
51
B
C/V
entu
ra
Ven
tura
, S.C
lara
, M
oorp
ark
Not
mod
eled
A
ug N
QC
M
arke
t
SC
E
GO
LETA
_6_T
AJI
GS
24
057
GO
LETA
66
2.
93
B
C/V
entu
ra
Ven
tura
, S.C
lara
, M
oorp
ark
Not
mod
eled
A
ug N
QC
M
arke
t
SC
E
LEB
EC
S_2
_UN
ITS
29
051
PS
TRIA
G1
18
165.
58
G1
BC
/Ven
tura
B
ig C
reek
A
ug N
QC
M
arke
t
SC
E
LEB
EC
S_2
_UN
ITS
29
052
PS
TRIA
G2
18
165.
58
G2
BC
/Ven
tura
B
ig C
reek
A
ug N
QC
M
arke
t
SC
E
LEB
EC
S_2
_UN
ITS
29
054
PS
TRIA
G3
18
165.
58
G3
BC
/Ven
tura
B
ig C
reek
A
ug N
QC
M
arke
t
SC
E
LEB
EC
S_2
_UN
ITS
29
053
PS
TRIA
S1
18
170.
45
S1
BC
/Ven
tura
B
ig C
reek
A
ug N
QC
M
arke
t
SC
E
LEB
EC
S_2
_UN
ITS
29
055
PS
TRIA
S2
18
82.7
9 S
2 B
C/V
entu
ra
Big
Cre
ek
Aug
NQ
C
Mar
ket
SC
E
LITL
RK
_6_S
EP
V01
0.00
BC
/Ven
tura
B
ig C
reek
N
ot m
odel
ed
Ene
rgy
Onl
y M
arke
t
SC
E
LITL
RK
_6_S
OLA
R1
4.
12
B
C/V
entu
ra
Big
Cre
ek
Not
mod
eled
A
ug N
QC
M
arke
t
SC
E
LITL
RK
_6_S
OLA
R2
1.
61
B
C/V
entu
ra
Big
Cre
ek
Not
mod
eled
A
ug N
QC
M
arke
t
SC
E
LITL
RK
_6_S
OLA
R4
2.
41
B
C/V
entu
ra
Big
Cre
ek
Not
mod
eled
A
ug N
QC
M
arke
t

App
endi
x A
- L
ist o
f phy
sica
l res
ourc
es b
y PT
O, l
ocal
are
a an
d m
arke
t ID
102
SC
E
LNC
STR
_6_C
RE
ST
0.
00
B
C/V
entu
ra
Big
Cre
ek
Not
mod
eled
E
nerg
y O
nly
Mar
ket
SC
E
MN
DA
LY_6
_MC
GR
TH
2930
6 M
CG
PKG
EN
13
.8
47.2
0 1
BC
/Ven
tura
V
entu
ra, S
.Cla
ra,
Moo
rpar
k
Mar
ket
SC
E
MN
DA
LY_7
_UN
IT 1
24
089
MA
ND
LY1G
13
.8
215.
00
1 B
C/V
entu
ra
Ven
tura
, S.C
lara
, M
oorp
ark
M
arke
t
SC
E
MN
DA
LY_7
_UN
IT 2
24
090
MA
ND
LY2G
13
.8
215.
29
2 B
C/V
entu
ra
Ven
tura
, S.C
lara
, M
oorp
ark
M
arke
t
SC
E
MN
DA
LY_7
_UN
IT 3
24
222
MA
ND
LY3G
16
13
0.00
3
BC
/Ven
tura
V
entu
ra, S
.Cla
ra,
Moo
rpar
k
Mar
ket
SC
E
MO
OR
PK
_2_C
ALA
BS
25
081
WD
T251
13
.8
4.90
E
Q
BC
/Ven
tura
V
entu
ra, M
oorp
ark
Aug
NQ
C
Mar
ket
SC
E
MO
OR
PK_6
_QF
2995
2 C
AM
GE
N
13.8
26
.07
D1
BC
/Ven
tura
V
entu
ra, S
.Cla
ra,
Moo
rpar
k A
ug N
QC
M
arke
t
SC
E
MO
OR
PK
_7_U
NIT
A1
2409
8 M
OO
RPA
RK
66
2.
12
B
C/V
entu
ra
Ven
tura
, Moo
rpar
k N
ot m
odel
ed
Aug
NQ
C
Mar
ket
SC
E
NE
EN
CH
_6_S
OLA
R
2990
0 A
LPIN
E_G
0.
48
51.7
1 E
Q
BC
/Ven
tura
B
ig C
reek
A
ug N
QC
M
arke
t
SC
E
OA
SIS
_6_C
RE
ST
0.
00
B
C/V
entu
ra
Big
Cre
ek
Not
mod
eled
E
nerg
y O
nly
Mar
ket
SC
E
OA
SIS
_6_S
OLA
R1
0.
00
B
C/V
entu
ra
Big
Cre
ek
Not
mod
eled
E
nerg
y O
nly
Mar
ket
SC
E
OA
SIS
_6_S
OLA
R2
2507
5 S
OLA
RIS
G
0.2
16.0
7 E
Q
BC
/Ven
tura
B
ig C
reek
A
ug N
QC
M
arke
t
SC
E
OM
AR
_2_U
NIT
1
2410
2 O
MA
R 1
G
13.8
74
.30
1 B
C/V
entu
ra
Big
Cre
ek
N
et S
elle
r
SC
E
OM
AR
_2_U
NIT
2
2410
3 O
MA
R 2
G
13.8
75
.90
2 B
C/V
entu
ra
Big
Cre
ek
N
et S
elle
r
SC
E
OM
AR
_2_U
NIT
3
2410
4 O
MA
R 3
G
13.8
78
.40
3 B
C/V
entu
ra
Big
Cre
ek
N
et S
elle
r
SC
E
OM
AR
_2_U
NIT
4
2410
5 O
MA
R 4
G
13.8
77
.25
4 B
C/V
entu
ra
Big
Cre
ek
N
et S
elle
r
SC
E
OR
MO
ND
_7_U
NIT
1
2410
7 O
RM
ON
D1G
26
74
1.27
1
BC
/Ven
tura
V
entu
ra, M
oorp
ark
M
arke
t
SC
E
OR
MO
ND
_7_U
NIT
2
2410
8 O
RM
ON
D2G
26
77
5.00
2
BC
/Ven
tura
V
entu
ra, M
oorp
ark
M
arke
t
SC
E
OS
O_6
_NS
PIN
25
614
OSO
A P
13
.2
2.25
1
BC
/Ven
tura
B
ig C
reek
P
umps
M
UN
I

App
endi
x A
- L
ist o
f phy
sica
l res
ourc
es b
y PT
O, l
ocal
are
a an
d m
arke
t ID
103
SC
E
OS
O_6
_NS
PIN
25
614
OSO
A P
13
.2
2.25
2
BC
/Ven
tura
B
ig C
reek
P
umps
M
UN
I
SC
E
OS
O_6
_NS
PIN
25
614
OSO
A P
13
.2
2.25
3
BC
/Ven
tura
B
ig C
reek
P
umps
M
UN
I
SC
E
OS
O_6
_NS
PIN
25
614
OSO
A P
13
.2
2.25
4
BC
/Ven
tura
B
ig C
reek
P
umps
M
UN
I
SC
E
OS
O_6
_NS
PIN
25
615
OSO
B P
13
.2
2.25
5
BC
/Ven
tura
B
ig C
reek
P
umps
M
UN
I
SC
E
OS
O_6
_NS
PIN
25
615
OSO
B P
13
.2
2.25
6
BC
/Ven
tura
B
ig C
reek
P
umps
M
UN
I
SC
E
OS
O_6
_NS
PIN
25
615
OSO
B P
13
.2
2.25
7
BC
/Ven
tura
B
ig C
reek
P
umps
M
UN
I
SC
E
OS
O_6
_NS
PIN
25
615
OSO
B P
13
.2
2.25
8
BC
/Ven
tura
B
ig C
reek
P
umps
M
UN
I
SC
E
PA
ND
OL_
6_U
NIT
24
113
PA
ND
OL
13
.8
23.3
2 1
BC
/Ven
tura
B
ig C
reek
, Ves
tal
Aug
NQ
C
Mar
ket
SC
E
PA
ND
OL_
6_U
NIT
24
113
PA
ND
OL
13
.8
23.3
2 2
BC
/Ven
tura
B
ig C
reek
, Ves
tal
Aug
NQ
C
Mar
ket
SC
E
PLA
INV
_6_B
SO
LAR
29
918
VLY
FLR
_G
0.2
0.00
E
Q
BC
/Ven
tura
B
ig C
reek
E
nerg
y O
nly
Mar
ket
SC
E
PLA
INV
_6_D
SO
LAR
29
914
DR
YR
CH
G
0.8
8.03
E
Q
BC
/Ven
tura
B
ig C
reek
A
ug N
QC
M
arke
t
SC
E
PLA
INV
_6_N
LRS
R1
16
.07
B
C/V
entu
ra
Big
Cre
ek
Not
mod
eled
A
ug N
QC
M
arke
t
SC
E
PLA
INV
_6_S
OLA
R3
2508
9 TO
T524
_PV
0.
42
0.00
E
Q
BC
/Ven
tura
B
ig C
reek
E
nerg
y O
nly
Mar
ket
SC
E
PLA
INV
_6_S
OLA
RC
25
086
TOT5
21_a
0.
2 0.
00
EQ
B
C/V
entu
ra
Big
Cre
ek
Ene
rgy
Onl
y M
arke
t
SC
E
PM
DLE
T_6_
SO
LAR
1
8.20
BC
/Ven
tura
B
ig C
reek
N
ot m
odel
ed
Aug
NQ
C
Mar
ket
SC
E
RE
CTO
R_2
_KAW
EA
H
2421
2 R
EC
TOR
66
0.
01
B
C/V
entu
ra
Big
Cre
ek, R
ecto
r, V
esta
l N
ot m
odel
ed
Aug
NQ
C
Mar
ket
SC
E
RE
CTO
R_2
_KAW
H 1
24
212
RE
CTO
R
66
0.13
BC
/Ven
tura
B
ig C
reek
, Rec
tor,
Ves
tal
Not
mod
eled
A
ug N
QC
M
arke
t
SC
E
RE
CTO
R_2
_QF
2421
2 R
EC
TOR
66
0.
00
B
C/V
entu
ra
Big
Cre
ek, R
ecto
r, V
esta
l N
ot m
odel
ed
Aug
NQ
C
QF/
Sel
fgen
SC
E
RE
CTO
R_7
_TU
LAR
E
2421
2 R
EC
TOR
66
0.
00
B
C/V
entu
ra
Big
Cre
ek, R
ecto
r, V
esta
l N
ot m
odel
ed
Mar
ket

App
endi
x A
- L
ist o
f phy
sica
l res
ourc
es b
y PT
O, l
ocal
are
a an
d m
arke
t ID
104
SC
E
RS
MS
LR_6
_SO
LAR
1 29
984
DAW
NG
EN
0.
8 20
.00
EQ
B
C/V
entu
ra
Big
Cre
ek
Aug
NQ
C
Mar
ket
SC
E
RS
MS
LR_6
_SO
LAR
2 29
888
TWIL
GH
TG
0.8
17.5
4 E
Q
BC
/Ven
tura
B
ig C
reek
A
ug N
QC
M
arke
t
SC
E
SA
UG
US
_2_T
OLA
ND
24
135
SA
UG
US
66
0.
00
B
C/V
entu
ra
Big
Cre
ek
Not
mod
eled
E
nerg
y O
nly
Mar
ket
SC
E
SA
UG
US
_6_M
WD
FTH
24
135
SA
UG
US
66
7.
40
B
C/V
entu
ra
Big
Cre
ek
Not
mod
eled
A
ug N
QC
M
UN
I
SC
E
SA
UG
US
_6_P
TCH
GN
24
118
PITC
HG
EN
13
.8
19.3
0 D
1 B
C/V
entu
ra
Big
Cre
ek
Aug
NQ
C
MU
NI
SC
E
SA
UG
US
_6_Q
F 24
135
SA
UG
US
66
0.
63
B
C/V
entu
ra
Big
Cre
ek
Not
mod
eled
A
ug N
QC
Q
F/S
elfg
en
SC
E
SA
UG
US
_7_C
HIQ
CN
24
135
SA
UG
US
66
4.
71
B
C/V
entu
ra
Big
Cre
ek
Not
mod
eled
A
ug N
QC
M
arke
t
SC
E
SA
UG
US
_7_L
OP
EZ
2413
5 S
AU
GU
S
66
5.34
BC
/Ven
tura
B
ig C
reek
N
ot m
odel
ed
Aug
NQ
C
QF/
Sel
fgen
SC
E
SH
UTL
E_6
_CR
ES
T
0.00
BC
/Ven
tura
B
ig C
reek
N
ot m
odel
ed
Ene
rgy
Onl
y M
arke
t
SC
E
SN
CLR
A_2
_HO
WLN
G
2508
0 G
FID
8045
13
.8
7.63
E
Q
BC
/Ven
tura
V
entu
ra, S
.Cla
ra,
Moo
rpar
k A
ug N
QC
M
arke
t
SC
E
SN
CLR
A_2
_SP
RH
YD
0.
45
B
C/V
entu
ra
Ven
tura
, S.C
lara
, M
oorp
ark
Not
mod
eled
A
ug N
QC
M
arke
t
SC
E
SN
CLR
A_2
_UN
IT1
16
.31
B
C/V
entu
ra
Ven
tura
, S.C
lara
, M
oorp
ark
Not
mod
eled
A
ug N
QC
M
arke
t
SC
E
SN
CLR
A_6
_OXG
EN
24
110
OX
GE
N
13
.8
33.5
0 D
1 B
C/V
entu
ra
Ven
tura
, S.C
lara
, M
oorp
ark
Aug
NQ
C
QF/
Sel
fgen
SC
E
SN
CLR
A_6
_PR
OC
GN
24
119
PR
OC
GE
N
13.8
44
.52
D1
BC
/Ven
tura
V
entu
ra, S
.Cla
ra,
Moo
rpar
k A
ug N
QC
M
arke
t
SC
E
SN
CLR
A_6
_QF
0.
00
B
C/V
entu
ra
Ven
tura
, S.C
lara
, M
oorp
ark
Not
mod
eled
A
ug N
QC
Q
F/S
elfg
en
SC
E
SN
CLR
A_6
_WIL
LMT
2415
9 W
ILLA
ME
T 13
.8
13.6
1 D
1 B
C/V
entu
ra
Ven
tura
, S.C
lara
, M
oorp
ark
Aug
NQ
C
QF/
Sel
fgen
SC
E
SP
RG
VL_
2_Q
F 24
215
SP
RIN
GV
L 66
0.
12
B
C/V
entu
ra
Big
Cre
ek, R
ecto
r, V
esta
l N
ot m
odel
ed
Aug
NQ
C
QF/
Sel
fgen
SC
E
SP
RG
VL_
2_TU
LE
2421
5 S
PR
ING
VL
66
6.40
BC
/Ven
tura
B
ig C
reek
, Rec
tor,
Ves
tal
Not
mod
eled
A
ug N
QC
M
arke
t
SC
E
SP
RG
VL_
2_TU
LES
C
2421
5 S
PR
ING
VL
66
0.00
BC
/Ven
tura
B
ig C
reek
, Rec
tor,
Ves
tal
Not
mod
eled
A
ug N
QC
M
arke
t
SC
E
SU
NS
HN
_2_L
ND
FL
2995
4 W
DT2
73
13.7
3.
31
1 B
C/V
entu
ra
Big
Cre
ek
Aug
NQ
C
Mar
ket
SC
E
SU
NS
HN
_2_L
ND
FL
2995
4 W
DT2
73
13.7
3.
31
2 B
C/V
entu
ra
Big
Cre
ek
Aug
NQ
C
Mar
ket
SC
E
SU
NS
HN
_2_L
ND
FL
2995
4 W
DT2
73
13.7
3.
31
3 B
C/V
entu
ra
Big
Cre
ek
Aug
NQ
C
Mar
ket
SC
E
SU
NS
HN
_2_L
ND
FL
2995
4 W
DT2
73
13.7
3.
31
4 B
C/V
entu
ra
Big
Cre
ek
Aug
NQ
C
Mar
ket
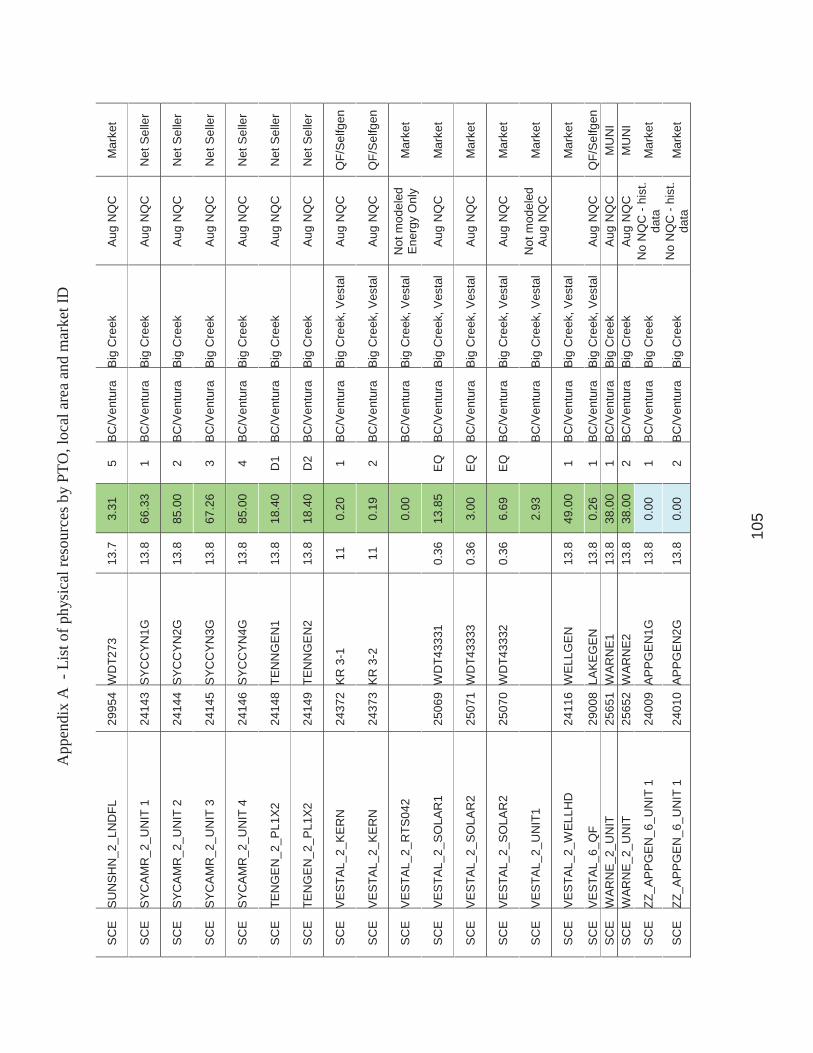
App
endi
x A
- L
ist o
f phy
sica
l res
ourc
es b
y PT
O, l
ocal
are
a an
d m
arke
t ID
105
SC
E
SU
NS
HN
_2_L
ND
FL
2995
4 W
DT2
73
13.7
3.
31
5 B
C/V
entu
ra
Big
Cre
ek
Aug
NQ
C
Mar
ket
SC
E
SYC
AM
R_2
_UN
IT 1
24
143
SYC
CY
N1G
13
.8
66.3
3 1
BC
/Ven
tura
B
ig C
reek
A
ug N
QC
N
et S
elle
r
SC
E
SYC
AM
R_2
_UN
IT 2
24
144
SYC
CY
N2G
13
.8
85.0
0 2
BC
/Ven
tura
B
ig C
reek
A
ug N
QC
N
et S
elle
r
SC
E
SYC
AM
R_2
_UN
IT 3
24
145
SYC
CY
N3G
13
.8
67.2
6 3
BC
/Ven
tura
B
ig C
reek
A
ug N
QC
N
et S
elle
r
SC
E
SYC
AM
R_2
_UN
IT 4
24
146
SYC
CY
N4G
13
.8
85.0
0 4
BC
/Ven
tura
B
ig C
reek
A
ug N
QC
N
et S
elle
r
SC
E
TEN
GE
N_2
_PL1
X2
2414
8 TE
NN
GE
N1
13.8
18
.40
D1
BC
/Ven
tura
B
ig C
reek
A
ug N
QC
N
et S
elle
r
SC
E
TEN
GE
N_2
_PL1
X2
2414
9 TE
NN
GE
N2
13.8
18
.40
D2
BC
/Ven
tura
B
ig C
reek
A
ug N
QC
N
et S
elle
r
SC
E
VE
STA
L_2_
KE
RN
24
372
KR
3-1
11
0.
20
1 B
C/V
entu
ra
Big
Cre
ek, V
esta
l A
ug N
QC
Q
F/S
elfg
en
SC
E
VE
STA
L_2_
KE
RN
24
373
KR
3-2
11
0.
19
2 B
C/V
entu
ra
Big
Cre
ek, V
esta
l A
ug N
QC
Q
F/S
elfg
en
SC
E
VE
STA
L_2_
RTS
042
0.
00
B
C/V
entu
ra
Big
Cre
ek, V
esta
l N
ot m
odel
ed
Ene
rgy
Onl
y M
arke
t
SC
E
VE
STA
L_2_
SO
LAR
1 25
069
WD
T433
31
0.36
13
.85
EQ
B
C/V
entu
ra
Big
Cre
ek, V
esta
l A
ug N
QC
M
arke
t
SC
E
VE
STA
L_2_
SO
LAR
2 25
071
WD
T433
33
0.36
3.
00
EQ
B
C/V
entu
ra
Big
Cre
ek, V
esta
l A
ug N
QC
M
arke
t
SC
E
VE
STA
L_2_
SO
LAR
2 25
070
WD
T433
32
0.36
6.
69
EQ
B
C/V
entu
ra
Big
Cre
ek, V
esta
l A
ug N
QC
M
arke
t
SC
E
VE
STA
L_2_
UN
IT1
2.
93
B
C/V
entu
ra
Big
Cre
ek, V
esta
l N
ot m
odel
ed
Aug
NQ
C
Mar
ket
SC
E
VE
STA
L_2_
WEL
LHD
24
116
WEL
LGE
N
13.8
49
.00
1 B
C/V
entu
ra
Big
Cre
ek, V
esta
l
Mar
ket
SC
E
VE
STA
L_6_
QF
2900
8 LA
KE
GE
N
13.8
0.
26
1 B
C/V
entu
ra
Big
Cre
ek, V
esta
l A
ug N
QC
Q
F/S
elfg
en
SC
E
WAR
NE
_2_U
NIT
25
651
WAR
NE
1
13.8
38
.00
1 B
C/V
entu
ra
Big
Cre
ek
Aug
NQ
C
MU
NI
SC
E
WAR
NE
_2_U
NIT
25
652
WAR
NE
2
13.8
38
.00
2 B
C/V
entu
ra
Big
Cre
ek
Aug
NQ
C
MU
NI
SC
E
ZZ_A
PP
GE
N_6
_UN
IT 1
24
009
AP
PG
EN
1G
13
.8
0.00
1
BC
/Ven
tura
B
ig C
reek
N
o N
QC
- hi
st.
data
M
arke
t
SC
E
ZZ_A
PP
GE
N_6
_UN
IT 1
24
010
AP
PG
EN
2G
13
.8
0.00
2
BC
/Ven
tura
B
ig C
reek
N
o N
QC
- hi
st.
data
M
arke
t

App
endi
x A
- L
ist o
f phy
sica
l res
ourc
es b
y PT
O, l
ocal
are
a an
d m
arke
t ID
106
SC
E
ZZ_A
PP
GE
N_6
_UN
IT 1
24
361
AP
PG
EN
3G
13
.8
0.00
3
BC
/Ven
tura
B
ig C
reek
N
o N
QC
- hi
st.
data
M
arke
t
SC
E
ZZ_N
A
2434
0 C
HA
RM
IN
13.8
0.
00
1 B
C/V
entu
ra
Ven
tura
, S.C
lara
, M
oorp
ark
No
NQ
C -
hist
. da
ta
QF/
Sel
fgen
SC
E
ZZ_N
A
2437
0 K
AWG
EN
13
.8
0.00
1
BC
/Ven
tura
B
ig C
reek
, Rec
tor,
Ves
tal
No
NQ
C -
hist
. da
ta
Mar
ket
SC
E
ZZ_N
A
2442
2 P
ALM
DA
LE
66
0.00
1
BC
/Ven
tura
B
ig C
reek
N
o N
QC
- hi
st.
data
M
arke
t
SC
E
ZZZ_
New
Uni
t 97
676
WD
T120
0AG
1 0.
48
0.00
1
BC
/Ven
tura
V
entu
ra, S
.Cla
ra,
Moo
rpar
k E
nerg
y O
nly
Mar
ket
SC
E
ZZZ_
New
Uni
t 25
076
WD
T109
8 0.
4 50
.00
EQ
B
C/V
entu
ra
Big
Cre
ek
No
NQ
C -
Pm
ax
Mar
ket
SC
E
ALA
MIT
_7_U
NIT
1
2400
1 A
LAM
T1 G
18
17
4.56
1
LA B
asin
W
este
rn
M
arke
t
SC
E
ALA
MIT
_7_U
NIT
2
2400
2 A
LAM
T2 G
18
17
5.00
2
LA B
asin
W
este
rn
M
arke
t
SC
E
ALA
MIT
_7_U
NIT
3
2400
3 A
LAM
T3 G
18
33
2.18
3
LA B
asin
W
este
rn
M
arke
t
SC
E
ALA
MIT
_7_U
NIT
4
2400
4 A
LAM
T4 G
18
33
5.67
4
LA B
asin
W
este
rn
M
arke
t S
CE
A
LAM
IT_7
_UN
IT 5
24
005
ALA
MT5
G
20
497.
97
5 LA
Bas
in
Wes
tern
Mar
ket
SC
E
ALA
MIT
_7_U
NIT
6
2416
1 A
LAM
T6 G
20
49
5.00
6
LA B
asin
W
este
rn
M
arke
t
SC
E
ALT
WD
_1_Q
F 25
635
ALT
WIN
D
115
4.15
Q
1 LA
Bas
in
Eas
tern
, Val
ley-
Dev
ers
Aug
NQ
C
QF/
Sel
fgen
SC
E
ALT
WD
_1_Q
F 25
635
ALT
WIN
D
115
4.14
Q
2 LA
Bas
in
Eas
tern
, Val
ley-
Dev
ers
Aug
NQ
C
QF/
Sel
fgen
SC
E
AN
AH
M_2
_CA
NY
N1
2521
1 C
anyo
nGT
1 13
.8
49.4
0 1
LA B
asin
W
este
rn
M
UN
I
SC
E
AN
AH
M_2
_CA
NY
N2
2521
2 C
anyo
nGT
2 13
.8
48.0
0 2
LA B
asin
W
este
rn
M
UN
I
SC
E
AN
AH
M_2
_CA
NY
N3
2521
3 C
anyo
nGT
3 13
.8
48.0
0 3
LA B
asin
W
este
rn
M
UN
I
SC
E
AN
AH
M_2
_CA
NY
N4
2521
4 C
anyo
nGT
4 13
.8
49.4
0 4
LA B
asin
W
este
rn
M
UN
I
SC
E
AN
AH
M_7
_CT
2520
8 D
owlin
gCTG
13
.8
40.6
4 1
LA B
asin
W
este
rn
Aug
NQ
C
MU
NI
SC
E
AR
CO
GN
_2_U
NIT
S
2401
1 A
RC
O 1
G
13.8
52
.84
1 LA
Bas
in
Wes
tern
A
ug N
QC
N
et S
elle
r

App
endi
x A
- L
ist o
f phy
sica
l res
ourc
es b
y PT
O, l
ocal
are
a an
d m
arke
t ID
107
SC
E
AR
CO
GN
_2_U
NIT
S
2401
2 A
RC
O 2
G
13.8
52
.84
2 LA
Bas
in
Wes
tern
A
ug N
QC
N
et S
elle
r
SC
E
ARC
OG
N_2
_UN
ITS
24
013
AR
CO
3G
13
.8
52.8
4 3
LA B
asin
W
este
rn
Aug
NQ
C
Net
Sel
ler
SC
E
AR
CO
GN
_2_U
NIT
S
2401
4 A
RC
O 4
G
13.8
52
.84
4 LA
Bas
in
Wes
tern
A
ug N
QC
N
et S
elle
r
SC
E
AR
CO
GN
_2_U
NIT
S
2416
3 A
RC
O 5
G
13.8
26
.42
5 LA
Bas
in
Wes
tern
A
ug N
QC
N
et S
elle
r
SC
E
ARC
OG
N_2
_UN
ITS
24
164
AR
CO
6G
13
.8
26.4
2 6
LA B
asin
W
este
rn
Aug
NQ
C
Net
Sel
ler
SC
E
BA
RR
E_2
_QF
2401
6 B
AR
RE
23
0 0.
00
LA
Bas
in
Wes
tern
N
ot m
odel
ed
QF/
Sel
fgen
SC
E
BA
RR
E_6
_PE
AK
ER
29
309
BA
RP
KG
EN
13
.8
47.0
0 1
LA B
asin
W
este
rn
M
arke
t
SC
E
BLA
ST_
1_W
IND
24
839
BLA
ST
115
3.49
1
LA B
asin
E
aste
rn, V
alle
y-D
ever
s A
ug N
QC
W
ind
SC
E
BR
DW
AY_
7_U
NIT
3
2900
7 B
RO
DW
YSC
13
.8
0.00
LA B
asin
W
este
rn
Not
mod
eled
M
UN
I
SC
E
BU
CKW
D_1
_NP
ALM
1 25
634
BUC
KWIN
D
115
1.36
LA B
asin
E
aste
rn, V
alle
y-D
ever
s N
ot m
odel
ed
Aug
NQ
C
Win
d
SC
E
BUC
KWD
_1_Q
F 25
634
BUC
KWIN
D
115
2.64
Q
F LA
Bas
in
Eas
tern
, Val
ley-
Dev
ers
Aug
NQ
C
QF/
Sel
fgen
SC
E
BU
CKW
D_7
_WIN
TCV
25
634
BUC
KWIN
D
115
0.16
W
5 LA
Bas
in
Eas
tern
, Val
ley-
Dev
ers
Aug
NQ
C
Win
d
SC
E
CA
BZO
N_1
_WIN
DA
1 29
290
CA
BA
ZON
33
8.
90
1 LA
Bas
in
Eas
tern
, Val
ley-
Dev
ers
Aug
NQ
C
Win
d
SC
E
CA
PWD
_1_Q
F 25
633
CA
PWIN
D
115
3.45
Q
F LA
Bas
in
Eas
tern
, Val
ley-
Dev
ers
Aug
NQ
C
QF/
Sel
fgen
SC
E
CE
NTE
R_2
_QF
2995
3 S
IGG
EN
13
.8
17.4
0 D
1 LA
Bas
in
Wes
tern
A
ug N
QC
Q
F/S
elfg
en
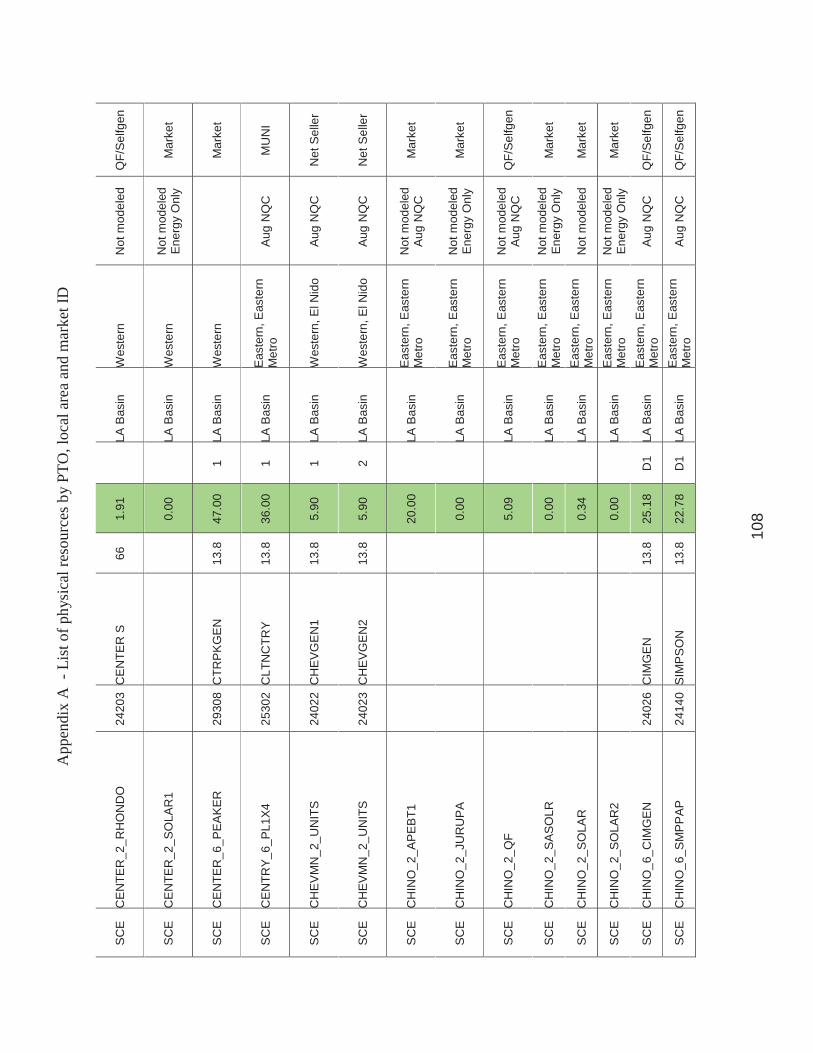
App
endi
x A
- L
ist o
f phy
sica
l res
ourc
es b
y PT
O, l
ocal
are
a an
d m
arke
t ID
108
SC
E
CE
NTE
R_2
_RH
ON
DO
24
203
CE
NTE
R S
66
1.
91
LA
Bas
in
Wes
tern
N
ot m
odel
ed
QF/
Sel
fgen
SC
E
CE
NTE
R_2
_SO
LAR
1
0.00
LA B
asin
W
este
rn
Not
mod
eled
E
nerg
y O
nly
Mar
ket
SC
E
CE
NTE
R_6
_PE
AK
ER
29
308
CTR
PK
GE
N
13.8
47
.00
1 LA
Bas
in
Wes
tern
Mar
ket
SC
E
CE
NTR
Y_6_
PL1
X4
2530
2 C
LTN
CTR
Y
13.8
36
.00
1 LA
Bas
in
Eas
tern
, Eas
tern
M
etro
A
ug N
QC
M
UN
I
SC
E
CH
EV
MN
_2_U
NIT
S
2402
2 C
HE
VG
EN
1
13.8
5.
90
1 LA
Bas
in
Wes
tern
, El N
ido
Aug
NQ
C
Net
Sel
ler
SC
E
CH
EV
MN
_2_U
NIT
S
2402
3 C
HE
VG
EN
2
13.8
5.
90
2 LA
Bas
in
Wes
tern
, El N
ido
Aug
NQ
C
Net
Sel
ler
SC
E
CH
INO
_2_A
PE
BT1
20.0
0
LA B
asin
E
aste
rn, E
aste
rn
Met
ro
Not
mod
eled
A
ug N
QC
M
arke
t
SC
E
CH
INO
_2_J
UR
UP
A
0.
00
LA
Bas
in
Eas
tern
, Eas
tern
M
etro
N
ot m
odel
ed
Ene
rgy
Onl
y M
arke
t
SC
E
CH
INO
_2_Q
F
5.09
LA B
asin
E
aste
rn, E
aste
rn
Met
ro
Not
mod
eled
A
ug N
QC
Q
F/S
elfg
en
SC
E
CH
INO
_2_S
AS
OLR
0.00
LA B
asin
E
aste
rn, E
aste
rn
Met
ro
Not
mod
eled
E
nerg
y O
nly
Mar
ket
SC
E
CH
INO
_2_S
OLA
R
0.
34
LA
Bas
in
Eas
tern
, Eas
tern
M
etro
N
ot m
odel
ed
Mar
ket
SC
E
CH
INO
_2_S
OLA
R2
0.
00
LA
Bas
in
Eas
tern
, Eas
tern
M
etro
N
ot m
odel
ed
Ene
rgy
Onl
y M
arke
t
SC
E
CH
INO
_6_C
IMG
EN
24
026
CIM
GE
N
13
.8
25.1
8 D
1 LA
Bas
in
Eas
tern
, Eas
tern
M
etro
A
ug N
QC
Q
F/S
elfg
en
SC
E
CH
INO
_6_S
MP
PA
P
2414
0 S
IMP
SO
N
13
.8
22.7
8 D
1 LA
Bas
in
Eas
tern
, Eas
tern
M
etro
A
ug N
QC
Q
F/S
elfg
en

App
endi
x A
- L
ist o
f phy
sica
l res
ourc
es b
y PT
O, l
ocal
are
a an
d m
arke
t ID
109
SC
E
CH
INO
_7_M
ILIK
N
2402
4 C
HIN
O
66
1.19
LA B
asin
E
aste
rn, E
aste
rn
Met
ro
Not
mod
eled
A
ug N
QC
M
arke
t
SC
E
CO
LTO
N_6
_AG
UA
M1
2530
3 C
LTN
AG
UA
13
.8
43.0
0 1
LA B
asin
E
aste
rn, E
aste
rn
Met
ro
Aug
NQ
C
MU
NI
SC
E
CO
RO
NS
_2_S
OLA
R
0.
00
LA
Bas
in
Eas
tern
, Eas
tern
M
etro
N
ot m
odel
ed
Ene
rgy
Onl
y M
arke
t
SC
E
CO
RO
NS
_6_C
LRW
TR
2933
8 C
LRW
TRC
T 13
.8
20.7
2 G
1 LA
Bas
in
Eas
tern
, Eas
tern
M
etro
MU
NI
SC
E
CO
RO
NS
_6_C
LRW
TR
2934
0 C
LRW
TRS
T 13
.8
7.28
S
1 LA
Bas
in
Eas
tern
, Eas
tern
M
etro
MU
NI
SC
E
DE
LAM
O_2
_SO
LAR
1
0.75
LA B
asin
W
este
rn
Not
mod
eled
A
ug N
QC
M
arke
t
SC
E
DE
LAM
O_2
_SO
LAR
2
1.11
LA B
asin
W
este
rn
Not
mod
eled
A
ug N
QC
M
arke
t
SC
E
DE
LAM
O_2
_SO
LAR
6
0.00
LA B
asin
Not
mod
eled
E
nerg
y O
nly
SC
E
DE
LAM
O_2
_SO
LRC
1
0.00
LA B
asin
W
este
rn
Not
mod
eled
E
nerg
y O
nly
Mar
ket
SC
E
DE
LAM
O_2
_SO
LRD
0.00
LA B
asin
W
este
rn
Not
mod
eled
E
nerg
y O
nly
Mar
ket
SC
E
DE
VE
RS
_1_Q
F 25
632
TER
AWN
D
115
8.49
Q
F LA
Bas
in
Eas
tern
, Val
ley-
Dev
ers
Aug
NQ
C
QF/
Sel
fgen
SC
E
DE
VE
RS
_1_Q
F 25
639
SE
AWIN
D
115
10.1
8 Q
F LA
Bas
in
Eas
tern
, Val
ley-
Dev
ers
Aug
NQ
C
QF/
Sel
fgen
SC
E
DE
VE
RS
_1_S
EP
V05
0.00
LA B
asin
E
aste
rn, V
alle
y-D
ever
s N
ot m
odel
ed
Ene
rgy
Onl
y M
arke
t
SC
E
DE
VE
RS
_1_S
OLA
R
0.
00
LA
Bas
in
Eas
tern
, Val
ley-
Dev
ers
Not
mod
eled
E
nerg
y O
nly
Mar
ket
SC
E
DE
VE
RS
_1_S
OLA
R1
0.
00
LA
Bas
in
Eas
tern
, Val
ley-
Dev
ers
Not
mod
eled
E
nerg
y O
nly
Mar
ket
SC
E
DE
VE
RS
_1_S
OLA
R2
0.
00
LA
Bas
in
Eas
tern
, Val
ley-
Dev
ers
Not
mod
eled
E
nerg
y O
nly
Mar
ket
SC
E
DM
DV
LY_1
_UN
ITS
25
425
ES
RP
P2
6.9
0.00
8
LA B
asin
E
aste
rn, E
aste
rn
Met
ro
Aug
NQ
C
QF/
Sel
fgen
SC
E
DR
EWS
_6_P
L1X4
25
301
CLT
ND
REW
13
.8
36.0
0 1
LA B
asin
E
aste
rn, E
aste
rn
Met
ro
Aug
NQ
C
MU
NI
SC
E
DV
LCYN
_1_U
NIT
S
2564
8 D
VLC
YN1G
13
.8
50.3
5 1
LA B
asin
E
aste
rn, E
aste
rn
Met
ro
Aug
NQ
C
MU
NI

App
endi
x A
- L
ist o
f phy
sica
l res
ourc
es b
y PT
O, l
ocal
are
a an
d m
arke
t ID
110
SC
E
DV
LCYN
_1_U
NIT
S
2564
9 D
VLC
YN2G
13
.8
50.3
5 2
LA B
asin
E
aste
rn, E
aste
rn
Met
ro
Aug
NQ
C
MU
NI
SC
E
DV
LCYN
_1_U
NIT
S
2560
3 D
VLC
YN3G
13
.8
67.1
3 3
LA B
asin
E
aste
rn, E
aste
rn
Met
ro
Aug
NQ
C
MU
NI
SC
E
DV
LCYN
_1_U
NIT
S
2560
4 D
VLC
YN4G
13
.8
67.1
3 4
LA B
asin
E
aste
rn, E
aste
rn
Met
ro
Aug
NQ
C
MU
NI
SC
E
ELL
IS_2
_QF
2432
5 O
RC
OG
EN
13
.8
0.01
1
LA B
asin
W
este
rn
Aug
NQ
C
QF/
Sel
fgen
SC
E
ELS
EG
N_2
_UN
1011
29
904
ELS
EG
5GT
16.5
13
1.50
5
LA B
asin
W
este
rn, E
l Nid
o A
ug N
QC
M
arke
t
SC
E
ELS
EG
N_2
_UN
1011
29
903
ELS
EG
6ST
13
.8
131.
50
6 LA
Bas
in
Wes
tern
, El N
ido
Aug
NQ
C
Mar
ket
SC
E
ELS
EG
N_2
_UN
2021
29
902
ELS
EG
7GT
16
.5
131.
84
7 LA
Bas
in
Wes
tern
, El N
ido
Aug
NQ
C
Mar
ket
SC
E
ELS
EG
N_2
_UN
2021
29
901
ELS
EG
8ST
13
.8
131.
84
8 LA
Bas
in
Wes
tern
, El N
ido
Aug
NQ
C
Mar
ket
SC
E
ETI
WN
D_2
_CH
MP
NE
0.00
LA B
asin
E
aste
rn, E
aste
rn
Met
ro
Not
mod
eled
E
nerg
y O
nly
Mar
ket
SC
E
ETI
WN
D_2
_FO
NTN
A
2405
5 E
TIW
AN
DA
66
0.21
LA B
asin
E
aste
rn, E
aste
rn
Met
ro
Not
mod
eled
A
ug N
QC
Q
F/S
elfg
en
SC
E
ETI
WN
D_2
_RTS
010
2405
5 E
TIW
AN
DA
66
0.86
LA B
asin
E
aste
rn, E
aste
rn
Met
ro
Not
mod
eled
A
ug N
QC
M
arke
t
SC
E
ETI
WN
D_2
_RTS
015
2405
5 E
TIW
AN
DA
66
1.03
LA B
asin
E
aste
rn, E
aste
rn
Met
ro
Not
mod
eled
A
ug N
QC
M
arke
t
SC
E
ETI
WN
D_2
_RTS
017
2405
5 E
TIW
AN
DA
66
1.41
LA B
asin
E
aste
rn, E
aste
rn
Met
ro
Not
mod
eled
A
ug N
QC
M
arke
t
SC
E
ETI
WN
D_2
_RTS
018
2405
5 E
TIW
AN
DA
66
0.58
LA B
asin
E
aste
rn, E
aste
rn
Met
ro
Not
mod
eled
A
ug N
QC
M
arke
t
SC
E
ETI
WN
D_2
_RTS
023
2405
5 E
TIW
AN
DA
66
1.43
LA B
asin
E
aste
rn, E
aste
rn
Met
ro
Not
mod
eled
A
ug N
QC
M
arke
t
SC
E
ETI
WN
D_2
_RTS
026
2405
5 E
TIW
AN
DA
66
4.82
LA B
asin
E
aste
rn, E
aste
rn
Met
ro
Not
mod
eled
A
ug N
QC
M
arke
t
SC
E
ETI
WN
D_2
_RTS
027
2405
5 E
TIW
AN
DA
66
1.57
LA B
asin
E
aste
rn, E
aste
rn
Met
ro
Not
mod
eled
A
ug N
QC
M
arke
t
SC
E
ETI
WN
D_2
_SO
LAR
1
0.00
LA B
asin
Not
mod
eled
E
nerg
y O
nly
SC
E
ETI
WN
D_2
_SO
LAR
5
0.00
LA B
asin
Not
mod
eled
E
nerg
y O
nly
SC
E
ETI
WN
D_2
_UN
IT1
2407
1 IN
LAN
D
13
.8
19.7
1 1
LA B
asin
E
aste
rn, E
aste
rn
Met
ro
Aug
NQ
C
QF/
Sel
fgen

App
endi
x A
- L
ist o
f phy
sica
l res
ourc
es b
y PT
O, l
ocal
are
a an
d m
arke
t ID
111
SC
E
ETI
WN
D_6
_GR
PLN
D
2930
5 E
TWP
KG
EN
13
.8
46.0
0 1
LA B
asin
E
aste
rn, E
aste
rn
Met
ro
M
arke
t
SC
E
ETI
WN
D_6
_MW
DE
TI
2542
2 E
TI M
WD
G
13.8
0.
89
1 LA
Bas
in
Eas
tern
, Eas
tern
M
etro
A
ug N
QC
M
arke
t
SC
E
ETI
WN
D_7
_MID
VLY
24
055
ETI
WA
ND
A 66
1.
67
LA
Bas
in
Eas
tern
, Eas
tern
M
etro
N
ot m
odel
ed
Aug
NQ
C
QF/
Sel
fgen
SC
E
ETI
WN
D_7
_UN
IT 3
24
052
MTN
VIS
T3
18
320.
00
3 LA
Bas
in
Eas
tern
, Eas
tern
M
etro
Mar
ket
SC
E
ETI
WN
D_7
_UN
IT 4
24
053
MTN
VIS
T4
18
320.
00
4 LA
Bas
in
Eas
tern
, Eas
tern
M
etro
Mar
ket
SC
E
GA
RN
ET_
1_S
OLA
R
2481
5 G
ARN
ET
115
0.00
LA B
asin
E
aste
rn, V
alle
y-D
ever
s N
ot m
odel
ed
Ene
rgy
Onl
y M
arke
t
SC
E
GA
RN
ET_
1_S
OLA
R2
2481
5 G
ARN
ET
115
3.20
LA B
asin
E
aste
rn, V
alle
y-D
ever
s N
ot m
odel
ed
Aug
NQ
C
Mar
ket
SC
E
GA
RN
ET_
1_U
NIT
S
2481
5 G
ARN
ET
115
0.79
G
1 LA
Bas
in
Eas
tern
, Val
ley-
Dev
ers
Aug
NQ
C
Mar
ket
SC
E
GA
RN
ET_
1_U
NIT
S
2481
5 G
ARN
ET
115
0.27
G
2 LA
Bas
in
Eas
tern
, Val
ley-
Dev
ers
Aug
NQ
C
Mar
ket
SC
E
GA
RN
ET_
1_U
NIT
S
2481
5 G
ARN
ET
115
0.62
G
3 LA
Bas
in
Eas
tern
, Val
ley-
Dev
ers
Aug
NQ
C
Mar
ket
SC
E
GA
RN
ET_
1_W
IND
24
815
GAR
NE
T
11
5 0.
40
QF
LA B
asin
E
aste
rn, V
alle
y-D
ever
s A
ug N
QC
W
ind
SC
E
GA
RN
ET_
1_W
IND
S
2481
5 G
ARN
ET
115
3.48
W
2 LA
Bas
in
Eas
tern
, Val
ley-
Dev
ers
Aug
NQ
C
Win
d
SC
E
GA
RN
ET_
1_W
T3W
ND
24
815
GAR
NE
T
11
5 0.
00
W3
LA B
asin
E
aste
rn, V
alle
y-D
ever
s A
ug N
QC
M
arke
t
SC
E
GA
RN
ET_
2_H
YDR
O
2481
5 G
AR
NE
T
11
5 0.
45
LA
Bas
in
Eas
tern
, Val
ley-
Dev
ers
Not
mod
eled
A
ug N
QC
M
arke
t
SC
E
GA
RN
ET_
2_W
IND
1 24
815
GAR
NE
T
11
5 1.
83
QF
LA B
asin
E
aste
rn, V
alle
y-D
ever
s A
ug N
QC
W
ind
SC
E
GA
RN
ET_
2_W
IND
2 24
815
GAR
NE
T
11
5 1.
76
QF
LA B
asin
E
aste
rn, V
alle
y-D
ever
s A
ug N
QC
W
ind
SC
E
GA
RN
ET_
2_W
IND
3 24
815
GAR
NE
T
11
5 2.
22
QF
LA B
asin
E
aste
rn, V
alle
y-D
ever
s A
ug N
QC
W
ind
SC
E
GA
RN
ET_
2_W
IND
4 24
815
GAR
NE
T
11
5 1.
73
QF
LA B
asin
E
aste
rn, V
alle
y-D
ever
s N
ot m
odel
ed
Aug
NQ
C
Win
d
SC
E
GA
RN
ET_
2_W
IND
5 24
815
GAR
NE
T
11
5 0.
53
QF
LA B
asin
E
aste
rn, V
alle
y-D
ever
s A
ug N
QC
W
ind
SC
E
GLN
AR
M_2
_UN
IT 5
29
013
GLE
NA
RM
5_C
T 13
.8
50.0
0 C
T LA
Bas
in
Wes
tern
MU
NI

App
endi
x A
- L
ist o
f phy
sica
l res
ourc
es b
y PT
O, l
ocal
are
a an
d m
arke
t ID
112
SC
E
GLN
AR
M_2
_UN
IT 5
29
014
GLE
NA
RM
5_S
T 13
.8
15.0
0 S
T LA
Bas
in
Wes
tern
MU
NI
SC
E
GLN
AR
M_7
_UN
IT 1
29
005
PA
SA
DN
A1
13
.8
22.0
7 1
LA B
asin
W
este
rn
M
UN
I
SC
E
GLN
AR
M_7
_UN
IT 2
29
006
PA
SA
DN
A2
13
.8
22.3
0 1
LA B
asin
W
este
rn
M
UN
I
SC
E
GLN
AR
M_7
_UN
IT 3
25
042
PA
SA
DN
A3
13
.8
44.8
3 1
LA B
asin
W
este
rn
M
UN
I
SC
E
GLN
AR
M_7
_UN
IT 4
25
043
PA
SA
DN
A4
13.8
42
.42
1 LA
Bas
in
Wes
tern
MU
NI
SC
E
HAR
BGN
_7_U
NIT
S
2406
2 H
ARBO
R G
13
.8
76.2
7 1
LA B
asin
W
este
rn
Mot
hbal
led
Mar
ket
SC
E
HA
RB
GN
_7_U
NIT
S
2406
2 H
ARBO
R G
13
.8
11.8
6 H
P
LA B
asin
W
este
rn
Mot
hbal
led
Mar
ket
SC
E
HA
RB
GN
_7_U
NIT
S
2551
0 H
AR
BO
RG
4
4.16
11
.86
LP
LA B
asin
W
este
rn
Mot
hbal
led
Mar
ket
SC
E
HIN
SO
N_6
_CA
RB
GN
24
020
CA
RB
GE
N1
13.8
14
.65
1 LA
Bas
in
Wes
tern
A
ug N
QC
M
arke
t S
CE
H
INS
ON
_6_C
AR
BG
N
2432
8 C
AR
BG
EN
2
13.8
14
.65
1 LA
Bas
in
Wes
tern
A
ug N
QC
M
arke
t S
CE
H
INS
ON
_6_L
BE
CH
1 24
170
LBE
AC
H12
13
.8
65.0
0 1
LA B
asin
W
este
rn
M
arke
t S
CE
H
INS
ON
_6_L
BE
CH
2 24
170
LBE
AC
H12
13
.8
65.0
0 2
LA B
asin
W
este
rn
M
arke
t S
CE
H
INS
ON
_6_L
BE
CH
3 24
171
LBE
AC
H34
13
.8
65.0
0 3
LA B
asin
W
este
rn
M
arke
t S
CE
H
INS
ON
_6_L
BE
CH
4 24
171
LBE
AC
H34
13
.8
65.0
0 4
LA B
asin
W
este
rn
M
arke
t S
CE
H
INS
ON
_6_S
ER
RG
N
2413
9 S
ER
RFG
EN
13
.8
26.9
3 D
1 LA
Bas
in
Wes
tern
A
ug N
QC
Q
F/S
elfg
en
SC
E
HN
TGB
H_7
_UN
IT 1
24
066
HU
NT1
G
13.8
22
5.75
1
LA B
asin
W
este
rn
M
arke
t
SC
E
HN
TGB
H_7
_UN
IT 2
24
067
HU
NT2
G
13.8
22
5.80
2
LA B
asin
W
este
rn
M
arke
t
SC
E
IND
IGO
_1_U
NIT
1
2919
0 W
INTE
CX2
13
.8
42.0
0 1
LA B
asin
E
aste
rn, V
alle
y-D
ever
s
Mar
ket
SC
E
IND
IGO
_1_U
NIT
2
2919
1 W
INTE
CX1
13
.8
42.0
0 1
LA B
asin
E
aste
rn, V
alle
y-D
ever
s
Mar
ket
SC
E
IND
IGO
_1_U
NIT
3
2918
0 W
INTE
C8
13
.8
42.0
0 1
LA B
asin
E
aste
rn, V
alle
y-D
ever
s
Mar
ket
SC
E
INLD
EM
_5_U
NIT
1
2904
1 IE
EC
-G1
19.5
33
5.00
1
LA B
asin
E
aste
rn, V
alle
y,
Val
ley-
Dev
ers
Aug
NQ
C
Mar
ket
SC
E
INLD
EM
_5_U
NIT
2
2904
2 IE
EC
-G2
19.5
33
5.00
1
LA B
asin
E
aste
rn, V
alle
y,
Val
ley-
Dev
ers
Mot
hbal
led
Mar
ket
SC
E
LAC
IEN
_2_V
EN
ICE
2433
7 V
EN
ICE
13
.8
0.00
1
LA B
asin
W
este
rn, E
l Nid
o A
ug N
QC
M
UN
I

App
endi
x A
- L
ist o
f phy
sica
l res
ourc
es b
y PT
O, l
ocal
are
a an
d m
arke
t ID
113
SC
E
LAG
BE
L_2_
STG
1
9.60
LA B
asin
Not
mod
eled
A
ug N
QC
M
arke
t
SC
E
LAG
BE
L_6_
QF
2995
1 R
EFU
SE
13.8
9.
77
D1
LA B
asin
W
este
rn
Aug
NQ
C
QF/
Sel
fgen
SC
E
LGH
THP
_6_I
CE
GE
N
2407
0 IC
EG
EN
13.8
48
.00
1 LA
Bas
in
Wes
tern
A
ug N
QC
Q
F/S
elfg
en
SC
E
ME
SA
S_2
_QF
2420
9 M
ES
A C
AL
66
0.00
LA B
asin
W
este
rn
Not
mod
eled
A
ug N
QC
Q
F/S
elfg
en
SC
E
MIR
LOM
_2_C
OR
ON
A
2.
30
LA
Bas
in
Eas
tern
, Eas
tern
M
etro
N
ot m
odel
ed
Aug
NQ
C
QF/
Sel
fgen
SC
E
MIR
LOM
_2_O
NTA
RO
2.25
LA B
asin
E
aste
rn, E
aste
rn
Met
ro
Not
mod
eled
A
ug N
QC
M
arke
t
SC
E
MIR
LOM
_2_R
TS03
2
0.30
LA B
asin
E
aste
rn, E
aste
rn
Met
ro
Not
mod
eled
A
ug N
QC
M
arke
t
SC
E
MIR
LOM
_2_R
TS03
3
0.46
LA B
asin
E
aste
rn, E
aste
rn
Met
ro
Not
mod
eled
A
ug N
QC
M
arke
t
SC
E
MIR
LOM
_2_T
EM
ES
C
2.
60
LA
Bas
in
Eas
tern
, Eas
tern
M
etro
N
ot m
odel
ed
Aug
NQ
C
QF/
Sel
fgen
SC
E
MIR
LOM
_6_D
ELG
EN
29
339
DE
LGE
N
13
.8
25.9
3 1
LA B
asin
E
aste
rn, E
aste
rn
Met
ro
Aug
NQ
C
QF/
Sel
fgen
SC
E
MIR
LOM
_6_P
EA
KE
R
2930
7 M
RLP
KG
EN
13
.8
46.0
0 1
LA B
asin
E
aste
rn, E
aste
rn
Met
ro
M
arke
t
SC
E
MIR
LOM
_7_M
WD
LKM
24
210
MIR
ALO
MA
66
4.
80
LA
Bas
in
Eas
tern
, Eas
tern
M
etro
N
ot m
odel
ed
Aug
NQ
C
MU
NI
SC
E
MO
JAV
E_1
_SIP
HO
N
2565
7 M
JVS
PH
N1
13.8
4.
19
1 LA
Bas
in
Eas
tern
, Eas
tern
M
etro
A
ug N
QC
M
arke
t
SC
E
MO
JAV
E_1
_SIP
HO
N
2565
8 M
JVS
PH
N1
13.8
4.
19
2 LA
Bas
in
Eas
tern
, Eas
tern
M
etro
A
ug N
QC
M
arke
t
SC
E
MO
JAV
E_1
_SIP
HO
N
2565
9 M
JVS
PH
N1
13.8
4.
19
3 LA
Bas
in
Eas
tern
, Eas
tern
M
etro
A
ug N
QC
M
arke
t
SC
E
MTW
IND
_1_U
NIT
1
2906
0 M
OU
NTW
ND
115
6.49
S
1 LA
Bas
in
Eas
tern
, Val
ley-
Dev
ers
Aug
NQ
C
Win
d
SC
E
MTW
IND
_1_U
NIT
2
2906
0 M
OU
NTW
ND
115
2.95
S
2 LA
Bas
in
Eas
tern
, Val
ley-
Dev
ers
Aug
NQ
C
Win
d
SC
E
MTW
IND
_1_U
NIT
3
2906
0 M
OU
NTW
ND
115
2.41
S
3 LA
Bas
in
Eas
tern
, Val
ley-
Dev
ers
Aug
NQ
C
Win
d
SC
E
OLI
ND
A_2
_CO
YCR
K
2421
1 O
LIN
DA
66
3.13
LA B
asin
W
este
rn
Not
mod
eled
Q
F/S
elfg
en
SC
E
OLI
ND
A_2
_LN
DFL
2 29
011
BR
EA
PWR
2 13
.8
3.56
C
1 LA
Bas
in
Wes
tern
A
ug N
QC
M
arke
t
SC
E
OLI
ND
A_2
_LN
DFL
2 29
011
BR
EA
PWR
2 13
.8
3.56
C
2 LA
Bas
in
Wes
tern
A
ug N
QC
M
arke
t
SC
E
OLI
ND
A_2
_LN
DFL
2 29
011
BR
EA
PWR
2 13
.8
3.56
C
3 LA
Bas
in
Wes
tern
A
ug N
QC
M
arke
t
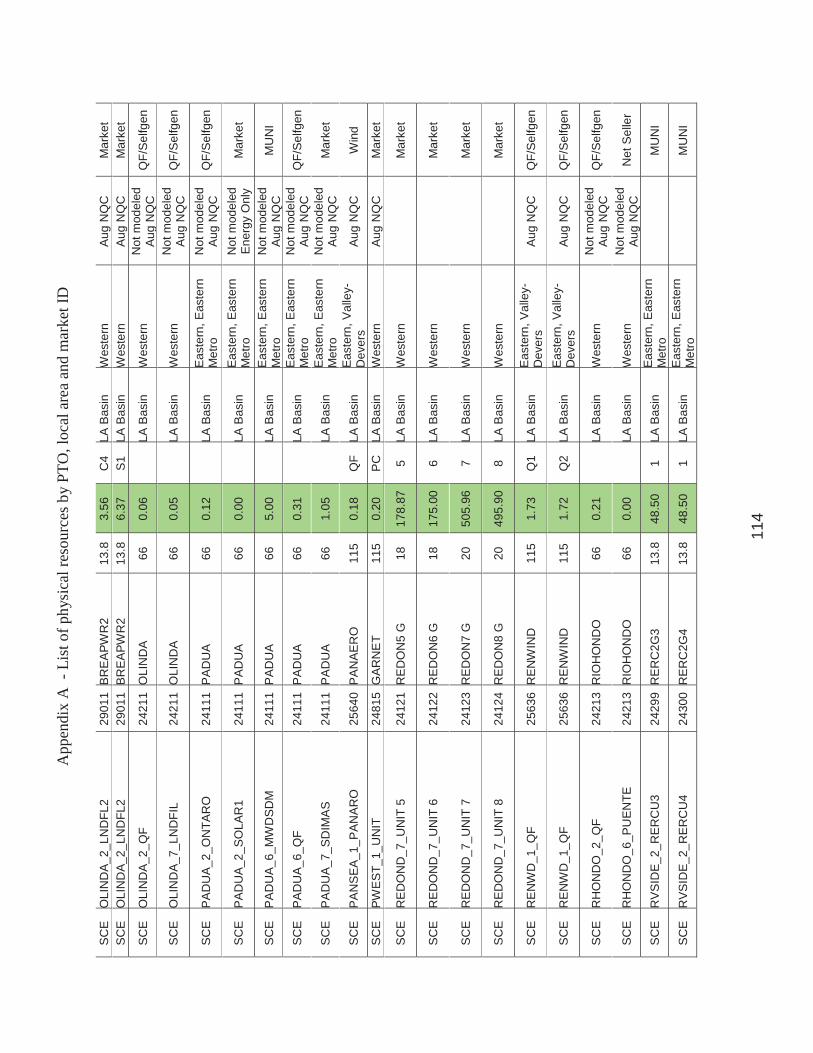
App
endi
x A
- L
ist o
f phy
sica
l res
ourc
es b
y PT
O, l
ocal
are
a an
d m
arke
t ID
114
SC
E
OLI
ND
A_2
_LN
DFL
2 29
011
BR
EA
PWR
2 13
.8
3.56
C
4 LA
Bas
in
Wes
tern
A
ug N
QC
M
arke
t S
CE
O
LIN
DA
_2_L
ND
FL2
2901
1 B
RE
APW
R2
13.8
6.
37
S1
LA B
asin
W
este
rn
Aug
NQ
C
Mar
ket
SC
E
OLI
ND
A_2
_QF
2421
1 O
LIN
DA
66
0.06
LA B
asin
W
este
rn
Not
mod
eled
A
ug N
QC
Q
F/S
elfg
en
SC
E
OLI
ND
A_7
_LN
DFI
L 24
211
OLI
ND
A
66
0.
05
LA
Bas
in
Wes
tern
N
ot m
odel
ed
Aug
NQ
C
QF/
Sel
fgen
SC
E
PA
DU
A_2
_ON
TAR
O
2411
1 P
AD
UA
66
0.12
LA B
asin
E
aste
rn, E
aste
rn
Met
ro
Not
mod
eled
A
ug N
QC
Q
F/S
elfg
en
SC
E
PA
DU
A_2
_SO
LAR
1 24
111
PA
DU
A
66
0.
00
LA
Bas
in
Eas
tern
, Eas
tern
M
etro
N
ot m
odel
ed
Ene
rgy
Onl
y M
arke
t
SC
E
PA
DU
A_6
_MW
DS
DM
24
111
PA
DU
A
66
5.
00
LA
Bas
in
Eas
tern
, Eas
tern
M
etro
N
ot m
odel
ed
Aug
NQ
C
MU
NI
SC
E
PA
DU
A_6
_QF
2411
1 P
AD
UA
66
0.31
LA B
asin
E
aste
rn, E
aste
rn
Met
ro
Not
mod
eled
A
ug N
QC
Q
F/S
elfg
en
SC
E
PA
DU
A_7
_SD
IMA
S
2411
1 P
AD
UA
66
1.05
LA B
asin
E
aste
rn, E
aste
rn
Met
ro
Not
mod
eled
A
ug N
QC
M
arke
t
SC
E
PA
NS
EA
_1_P
AN
AR
O
2564
0 P
AN
AE
RO
11
5 0.
18
QF
LA B
asin
E
aste
rn, V
alle
y-D
ever
s A
ug N
QC
W
ind
SC
E
PWE
ST_
1_U
NIT
24
815
GAR
NE
T
11
5 0.
20
PC
LA
Bas
in
Wes
tern
A
ug N
QC
M
arke
t
SC
E
RE
DO
ND
_7_U
NIT
5
2412
1 R
ED
ON
5 G
18
17
8.87
5
LA B
asin
W
este
rn
M
arke
t
SC
E
RE
DO
ND
_7_U
NIT
6
2412
2 R
EDO
N6
G
18
175.
00
6 LA
Bas
in
Wes
tern
Mar
ket
SC
E
RE
DO
ND
_7_U
NIT
7
2412
3 R
EDO
N7
G
20
505.
96
7 LA
Bas
in
Wes
tern
Mar
ket
SC
E
RE
DO
ND
_7_U
NIT
8
2412
4 R
EDO
N8
G
20
495.
90
8 LA
Bas
in
Wes
tern
Mar
ket
SC
E
RE
NW
D_1
_QF
2563
6 R
EN
WIN
D
115
1.73
Q
1 LA
Bas
in
Eas
tern
, Val
ley-
Dev
ers
Aug
NQ
C
QF/
Sel
fgen
SC
E
RE
NW
D_1
_QF
2563
6 R
EN
WIN
D
115
1.72
Q
2 LA
Bas
in
Eas
tern
, Val
ley-
Dev
ers
Aug
NQ
C
QF/
Sel
fgen
SC
E
RH
ON
DO
_2_Q
F 24
213
RIO
HO
ND
O
66
0.21
LA B
asin
W
este
rn
Not
mod
eled
A
ug N
QC
Q
F/S
elfg
en
SC
E
RH
ON
DO
_6_P
UE
NTE
24
213
RIO
HO
ND
O
66
0.00
LA B
asin
W
este
rn
Not
mod
eled
A
ug N
QC
N
et S
elle
r
SC
E
RV
SID
E_2_
RE
RC
U3
2429
9 R
ER
C2G
3
13.8
48
.50
1 LA
Bas
in
Eas
tern
, Eas
tern
M
etro
MU
NI
SC
E
RV
SID
E_2_
RE
RC
U4
2430
0 R
ER
C2G
4
13.8
48
.50
1 LA
Bas
in
Eas
tern
, Eas
tern
M
etro
MU
NI

App
endi
x A
- L
ist o
f phy
sica
l res
ourc
es b
y PT
O, l
ocal
are
a an
d m
arke
t ID
115
SC
E
RV
SID
E_6_
RE
RC
U1
2424
2 R
ER
C1G
13
.8
48.3
5 1
LA B
asin
E
aste
rn, E
aste
rn
Met
ro
M
UN
I
SC
E
RV
SID
E_6_
RE
RC
U2
2424
3 R
ER
C2G
13
.8
48.5
0 1
LA B
asin
E
aste
rn, E
aste
rn
Met
ro
M
UN
I
SC
E
RV
SID
E_6_
SO
LAR
1 24
244
SP
RIN
GE
N
13.8
6.
03
LA
Bas
in
Eas
tern
, Eas
tern
M
etro
N
ot m
odel
ed
Aug
NQ
C
Mar
ket
SC
E
RV
SID
E_6
_SP
RIN
G
2424
4 S
PR
ING
EN
13
.8
36.0
0 1
LA B
asin
E
aste
rn, E
aste
rn
Met
ro
M
arke
t
SC
E
SA
NIT
R_6
_UN
ITS
24
324
SA
NIG
EN
13
.8
1.20
D
1 LA
Bas
in
Eas
tern
, Eas
tern
M
etro
A
ug N
QC
Q
F/S
elfg
en
SC
E
SA
NTG
O_2
_LN
DFL
1
15.8
8
LA B
asin
Not
mod
eled
A
ug N
QC
M
arke
t
SC
E
SA
NW
D_1
_QF
2564
6 S
AN
WIN
D
115
1.70
Q
1 LA
Bas
in
Eas
tern
, Val
ley-
Dev
ers
Aug
NQ
C
Win
d
SC
E
SA
NW
D_1
_QF
2564
6 S
AN
WIN
D
115
1.70
Q
2 LA
Bas
in
Eas
tern
, Val
ley-
Dev
ers
Aug
NQ
C
Win
d
SC
E
SB
ER
DO
_2_P
SP
3 24
921
MN
TV-C
T1
18
129.
71
1 LA
Bas
in
Eas
tern
, Wes
t of
Dev
ers,
Eas
tern
M
etro
Mar
ket
SC
E
SB
ER
DO
_2_P
SP
3 24
922
MN
TV-C
T2
18
129.
71
1 LA
Bas
in
Eas
tern
, Wes
t of
Dev
ers,
Eas
tern
M
etro
Mar
ket
SC
E
SB
ER
DO
_2_P
SP
3 24
923
MN
TV-S
T1
18
225.
07
1 LA
Bas
in
Eas
tern
, Wes
t of
Dev
ers,
Eas
tern
M
etro
Mar
ket
SC
E
SB
ER
DO
_2_P
SP
4 24
924
MN
TV-C
T3
18
129.
71
1 LA
Bas
in
Eas
tern
, Wes
t of
Dev
ers,
Eas
tern
M
etro
Mar
ket
SC
E
SB
ER
DO
_2_P
SP
4 24
925
MN
TV-C
T4
18
129.
71
1 LA
Bas
in
Eas
tern
, Wes
t of
Dev
ers,
Eas
tern
M
etro
Mar
ket
SC
E
SB
ER
DO
_2_P
SP
4 24
926
MN
TV-S
T2
18
225.
07
1 LA
Bas
in
Eas
tern
, Wes
t of
Dev
ers,
Eas
tern
M
etro
Mar
ket
SC
E
SB
ER
DO
_2_Q
F 24
214
SA
NB
RD
NO
66
0.
12
LA
Bas
in
Eas
tern
, Wes
t of
Dev
ers,
Eas
tern
M
etro
Not
mod
eled
A
ug N
QC
Q
F/S
elfg
en

App
endi
x A
- L
ist o
f phy
sica
l res
ourc
es b
y PT
O, l
ocal
are
a an
d m
arke
t ID
116
SC
E
SB
ER
DO
_2_R
ED
LND
24
214
SA
NB
RD
NO
66
0.
64
LA
Bas
in
Eas
tern
, Wes
t of
Dev
ers,
Eas
tern
M
etro
Not
mod
eled
A
ug N
QC
M
arke
t
SC
E
SB
ER
DO
_2_R
TS00
5 24
214
SA
NB
RD
NO
66
1.
15
LA
Bas
in
Eas
tern
, Wes
t of
Dev
ers,
Eas
tern
M
etro
Not
mod
eled
A
ug N
QC
M
arke
t
SC
E
SB
ER
DO
_2_R
TS00
7 24
214
SA
NB
RD
NO
66
1.
03
LA
Bas
in
Eas
tern
, Wes
t of
Dev
ers,
Eas
tern
M
etro
Not
mod
eled
A
ug N
QC
M
arke
t
SC
E
SB
ER
DO
_2_R
TS01
1 24
214
SA
NB
RD
NO
66
0.
91
LA
Bas
in
Eas
tern
, Wes
t of
Dev
ers,
Eas
tern
M
etro
Not
mod
eled
A
ug N
QC
M
arke
t
SC
E
SB
ER
DO
_2_R
TS01
3 24
214
SA
NB
RD
NO
66
0.
87
LA
Bas
in
Eas
tern
, Wes
t of
Dev
ers,
Eas
tern
M
etro
Not
mod
eled
A
ug N
QC
M
arke
t
SC
E
SB
ER
DO
_2_R
TS01
6 24
214
SA
NB
RD
NO
66
0.
46
LA
Bas
in
Eas
tern
, Wes
t of
Dev
ers,
Eas
tern
M
etro
Not
mod
eled
A
ug N
QC
M
arke
t
SC
E
SB
ER
DO
_2_R
TS04
8 24
214
SA
NB
RD
NO
66
0.
00
LA
Bas
in
Eas
tern
, Wes
t of
Dev
ers,
Eas
tern
M
etro
Not
mod
eled
E
nerg
y O
nly
Mar
ket
SC
E
SB
ER
DO
_2_S
NTA
NA
24
214
SA
NB
RD
NO
66
0.
00
LA
Bas
in
Eas
tern
, Wes
t of
Dev
ers,
Eas
tern
M
etro
Not
mod
eled
A
ug N
QC
Q
F/S
elfg
en
SC
E
SB
ER
DO
_6_M
ILLC
K
2421
4 S
AN
BR
DN
O
66
0.73
LA B
asin
E
aste
rn, W
est o
f D
ever
s, E
aste
rn
Met
ro
Not
mod
eled
A
ug N
QC
Q
F/S
elfg
en
SC
E
SE
NTN
L_2_
CTG
1 29
101
SE
NTI
NE
L_G
1 13
.8
92.0
9 1
LA B
asin
E
aste
rn, V
alle
y-D
ever
s
Mar
ket
SC
E
SE
NTN
L_2_
CTG
2 29
102
SE
NTI
NE
L_G
2 13
.8
92.4
0 1
LA B
asin
E
aste
rn, V
alle
y-D
ever
s
Mar
ket
SC
E
SE
NTN
L_2_
CTG
3 29
103
SE
NTI
NE
L_G
3 13
.8
92.3
6 1
LA B
asin
E
aste
rn, V
alle
y-D
ever
s
Mar
ket
SC
E
SE
NTN
L_2_
CTG
4 29
104
SE
NTI
NE
L_G
4 13
.8
91.9
8 1
LA B
asin
E
aste
rn, V
alle
y-D
ever
s
Mar
ket
SC
E
SE
NTN
L_2_
CTG
5 29
105
SE
NTI
NE
L_G
5 13
.8
91.8
3 1
LA B
asin
E
aste
rn, V
alle
y-D
ever
s
Mar
ket
SC
E
SE
NTN
L_2_
CTG
6 29
106
SE
NTI
NE
L_G
6 13
.8
92.1
6 1
LA B
asin
E
aste
rn, V
alle
y-D
ever
s
Mar
ket
SC
E
SE
NTN
L_2_
CTG
7 29
107
SE
NTI
NE
L_G
7 13
.8
91.8
4 1
LA B
asin
E
aste
rn, V
alle
y-D
ever
s
Mar
ket
SC
E
SE
NTN
L_2_
CTG
8 29
108
SE
NTI
NE
L_G
8 13
.8
91.5
6 1
LA B
asin
E
aste
rn, V
alle
y-D
ever
s
Mar
ket

App
endi
x A
- L
ist o
f phy
sica
l res
ourc
es b
y PT
O, l
ocal
are
a an
d m
arke
t ID
117
SC
E
TIFF
NY_
1_D
ILLO
N
2902
1 W
INTE
C6
115
4.96
1
LA B
asin
E
aste
rn, V
alle
y-D
ever
s A
ug N
QC
W
ind
SC
E
TRN
SWD
_1_Q
F 25
637
TRA
NW
IND
11
5 7.
42
QF
LA B
asin
E
aste
rn, V
alle
y-D
ever
s A
ug N
QC
W
ind
SC
E
VA
LLE
Y_5_
PE
RR
IS
2416
0 V
ALL
EYS
C
115
7.94
LA B
asin
E
aste
rn, V
alle
y,
Val
ley-
Dev
ers
Not
mod
eled
A
ug N
QC
Q
F/S
elfg
en
SC
E
VA
LLE
Y_5_
RE
DM
TN
2416
0 V
ALL
EYS
C
115
3.70
LA B
asin
E
aste
rn, V
alle
y,
Val
ley-
Dev
ers
Not
mod
eled
A
ug N
QC
Q
F/S
elfg
en
SC
E
VA
LLE
Y_5_
RTS
044
2416
0 V
ALL
EYS
C
115
3.37
LA B
asin
E
aste
rn, V
alle
y,
Val
ley-
Dev
ers
Not
mod
eled
A
ug N
QC
M
arke
t
SC
E
VA
LLE
Y_5_
SO
LAR
1 24
160
VA
LLE
YSC
11
5 0.
00
LA
Bas
in
Eas
tern
, Val
ley,
V
alle
y-D
ever
s N
ot m
odel
ed
Ene
rgy
Onl
y M
arke
t
SC
E
VA
LLE
Y_5_
SO
LAR
2 25
082
WD
T786
34
.5
16.6
5 E
Q
LA B
asin
E
aste
rn, V
alle
y,
Val
ley-
Dev
ers
Aug
NQ
C
Mar
ket
SC
E
VA
LLE
Y_7_
BA
DLN
D
2416
0 V
ALL
EYS
C
115
0.44
LA B
asin
E
aste
rn, V
alle
y,
Val
ley-
Dev
ers
Not
mod
eled
A
ug N
QC
M
arke
t
SC
E
VA
LLE
Y_7_
UN
ITA
1 24
160
VA
LLE
YSC
11
5 2.
56
LA
Bas
in
Eas
tern
, Val
ley,
V
alle
y-D
ever
s N
ot m
odel
ed
Aug
NQ
C
Mar
ket
SC
E
VE
NW
D_1
_WIN
D1
2564
5 V
EN
WIN
D
115
1.66
Q
1 LA
Bas
in
Eas
tern
, Val
ley-
Dev
ers
Aug
NQ
C
QF/
Sel
fgen
SC
E
VE
NW
D_1
_WIN
D2
2564
5 V
EN
WIN
D
115
2.83
Q
2 LA
Bas
in
Eas
tern
, Val
ley-
Dev
ers
Aug
NQ
C
QF/
Sel
fgen
SC
E
VE
NW
D_1
_WIN
D3
2564
5 V
EN
WIN
D
115
3.36
E
U
LA B
asin
E
aste
rn, V
alle
y-D
ever
s A
ug N
QC
Q
F/S
elfg
en
SC
E
VE
RN
ON
_6_G
ON
ZL1
2434
2 FE
DG
EN
13
.8
5.75
1
LA B
asin
W
este
rn
M
UN
I
SC
E
VE
RN
ON
_6_G
ON
ZL2
2434
2 FE
DG
EN
13
.8
5.75
1
LA B
asin
W
este
rn
M
UN
I
SC
E
VE
RN
ON
_6_M
ALB
RG
24
239
MA
LBR
G1G
13
.8
42.3
7 C
1 LA
Bas
in
Wes
tern
MU
NI
SC
E
VE
RN
ON
_6_M
ALB
RG
24
240
MA
LBR
G2G
13
.8
42.3
7 C
2 LA
Bas
in
Wes
tern
MU
NI
SC
E
VE
RN
ON
_6_M
ALB
RG
24
241
MA
LBR
G3G
13
.8
49.2
6 S
3 LA
Bas
in
Wes
tern
MU
NI
SC
E
VIL
LPK
_2_V
ALL
YV
2421
6 V
ILLA
PK
66
4.10
LA B
asin
W
este
rn
Not
mod
eled
A
ug N
QC
Q
F/S
elfg
en
SC
E
VIL
LPK
_6_M
WD
YOR
24
216
VIL
LA P
K 66
4.
20
LA
Bas
in
Wes
tern
N
ot m
odel
ed
Aug
NQ
C
MU
NI
SC
E
VIS
TA_2
_RIA
LTO
24
901
VS
TA
230
0.25
LA B
asin
E
aste
rn, E
aste
rn
Met
ro
Ene
rgy
Onl
y M
arke
t
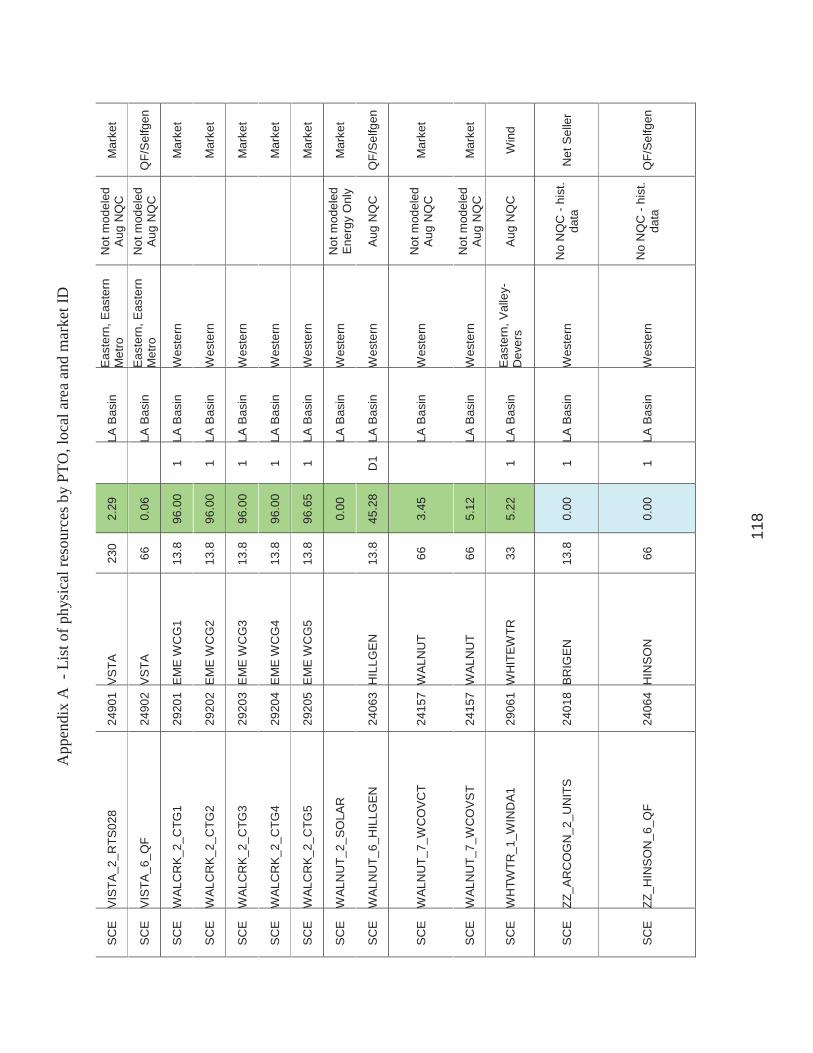
App
endi
x A
- L
ist o
f phy
sica
l res
ourc
es b
y PT
O, l
ocal
are
a an
d m
arke
t ID
118
SC
E
VIS
TA_2
_RTS
028
2490
1 V
STA
23
0 2.
29
LA
Bas
in
Eas
tern
, Eas
tern
M
etro
N
ot m
odel
ed
Aug
NQ
C
Mar
ket
SC
E
VIS
TA_6
_QF
2490
2 V
STA
66
0.
06
LA
Bas
in
Eas
tern
, Eas
tern
M
etro
N
ot m
odel
ed
Aug
NQ
C
QF/
Sel
fgen
SC
E
WAL
CR
K_2
_CTG
1 29
201
EM
E W
CG
1 13
.8
96.0
0 1
LA B
asin
W
este
rn
M
arke
t
SC
E
WAL
CR
K_2
_CTG
2 29
202
EM
E W
CG
2 13
.8
96.0
0 1
LA B
asin
W
este
rn
M
arke
t
SC
E
WAL
CR
K_2
_CTG
3 29
203
EM
E W
CG
3 13
.8
96.0
0 1
LA B
asin
W
este
rn
M
arke
t
SC
E
WAL
CR
K_2
_CTG
4 29
204
EM
E W
CG
4 13
.8
96.0
0 1
LA B
asin
W
este
rn
M
arke
t
SC
E
WAL
CR
K_2
_CTG
5 29
205
EM
E W
CG
5 13
.8
96.6
5 1
LA B
asin
W
este
rn
M
arke
t
SC
E
WAL
NU
T_2_
SO
LAR
0.00
LA B
asin
W
este
rn
Not
mod
eled
E
nerg
y O
nly
Mar
ket
SC
E
WAL
NU
T_6_
HIL
LGE
N
2406
3 H
ILLG
EN
13.8
45
.28
D1
LA B
asin
W
este
rn
Aug
NQ
C
QF/
Sel
fgen
SC
E
WAL
NU
T_7_
WC
OV
CT
2415
7 W
ALN
UT
66
3.45
LA B
asin
W
este
rn
Not
mod
eled
A
ug N
QC
M
arke
t
SC
E
WAL
NU
T_7_
WC
OV
ST
2415
7 W
ALN
UT
66
5.12
LA B
asin
W
este
rn
Not
mod
eled
A
ug N
QC
M
arke
t
SC
E
WH
TWTR
_1_W
IND
A1
2906
1 W
HIT
EWTR
33
5.
22
1 LA
Bas
in
Eas
tern
, Val
ley-
Dev
ers
Aug
NQ
C
Win
d
SC
E
ZZ_A
RC
OG
N_2
_UN
ITS
24
018
BR
IGE
N
13
.8
0.00
1
LA B
asin
W
este
rn
No
NQ
C -
hist
. da
ta
Net
Sel
ler
SC
E
ZZ_H
INS
ON
_6_Q
F 24
064
HIN
SO
N
66
0.
00
1 LA
Bas
in
Wes
tern
N
o N
QC
- hi
st.
data
Q
F/S
elfg
en

App
endi
x A
- L
ist o
f phy
sica
l res
ourc
es b
y PT
O, l
ocal
are
a an
d m
arke
t ID
119
SC
E
ZZ_L
AFR
ES
_6_Q
F 24
332
PA
LOG
EN
13
.8
0.00
D
1 LA
Bas
in
Wes
tern
, El N
ido
No
NQ
C -
hist
. da
ta
QF/
Sel
fgen
SC
E
ZZ_M
OB
GEN
_6_U
NIT
1
2409
4 M
OB
GE
N
13
.8
0.00
1
LA B
asin
W
este
rn, E
l Nid
o N
o N
QC
- hi
st.
data
Q
F/S
elfg
en
SC
E
ZZ_N
A
2432
7 TH
UM
SG
EN
13
.8
0.00
1
LA B
asin
W
este
rn
No
NQ
C -
hist
. da
ta
QF/
Sel
fgen
SC
E
ZZ_N
A
2432
9 M
OB
GE
N2
13.8
0.
00
1 LA
Bas
in
Wes
tern
, El N
ido
No
NQ
C -
hist
. da
ta
QF/
Sel
fgen
SC
E
ZZ_N
A
2433
0 O
UTF
ALL
1 13
.8
0.00
1
LA B
asin
W
este
rn, E
l Nid
o N
o N
QC
- hi
st.
data
Q
F/S
elfg
en
SC
E
ZZ_N
A
2433
1 O
UTF
ALL
2 13
.8
0.00
1
LA B
asin
W
este
rn, E
l Nid
o N
o N
QC
- hi
st.
data
Q
F/S
elfg
en
SC
E
ZZ_N
A
2926
0 A
LTA
MS
A4
11
5 0.
00
1 LA
Bas
in
Eas
tern
, Val
ley-
Dev
ers
No
NQ
C -
hist
. da
ta
Win
d
SC
E
ZZ_S
AN
TGO
_6_C
OYO
TE
2434
1 C
OYG
EN
13
.8
0.00
1
LA B
asin
W
este
rn
No
NQ
C -
hist
. da
ta
QF/
Sel
fgen
SC
E
ZZZZ
ZZ_E
LSE
GN
_7_U
NIT
4
2404
8 E
LSE
G4
G
18
0.00
4
LA B
asin
W
este
rn, E
l Nid
o R
etire
d M
arke
t
SD
G&
E B
OR
DE
R_6
_UN
ITA
1 22
149
CA
LPK
_BD
13
.8
48.0
0 1
SD
-IV
San
Die
go, B
orde
r
Mar
ket
SDG
&E B
RE
GG
O_6
_DE
GR
SL
5.
16
S
D-IV
S
an D
iego
N
ot m
odel
ed
Aug
NQ
C
Mar
ket
SD
G&
E B
RE
GG
O_6
_SO
LAR
22
082
BR
GE
N1
0.21
22
.44
1 S
D-IV
S
an D
iego
A
ug N
QC
M
arke
t

App
endi
x A
- L
ist o
f phy
sica
l res
ourc
es b
y PT
O, l
ocal
are
a an
d m
arke
t ID
120
SD
G&
E C
BR
LLO
_6_P
LSTP
1 22
092
CA
BR
ILLO
69
2.
53
1 S
D-IV
S
an D
iego
A
ug N
QC
M
arke
t
SD
G&
E C
CR
ITA
_7_R
PP
CH
F 22
124
CH
CA
RIT
A
138
2.17
1
SD
-IV
San
Die
go
Aug
NQ
C
Mar
ket
SD
G&
E C
HIL
LS_1
_SYC
EN
G
2212
0 C
ARLT
NH
S
138
0.67
1
SD
-IV
San
Die
go
Aug
NQ
C
QF/
Sel
fgen
SD
G&
E C
HIL
LS_7
_UN
ITA
1 22
120
CAR
LTN
HS
13
8 1.
52
2 S
D-IV
S
an D
iego
A
ug N
QC
Q
F/S
elfg
en
SD
G&
E C
NTN
LA_2
_SO
LAR
1 23
463
DW
GE
N3&
4 0.
33
113.
75
1 S
D-IV
N
one
Aug
NQ
C
Mar
ket
SD
G&
E C
NTN
LA_2
_SO
LAR
2 23
463
DW
GE
N3&
4 0.
33
0.00
2
SD
-IV
Non
e E
nerg
y O
nly
Mar
ket
SD
G&
E C
PS
TNO
_7_P
RM
AD
S
2211
2 C
AP
STR
NO
13
8 5.
38
1 S
D-IV
S
an D
iego
A
ug N
QC
M
arke
t
SD
G&
E C
PV
ER
D_2
_SO
LAR
23
309
IV G
EN3
G1
0.31
57
.15
G1
SD
-IV
Non
e A
ug N
QC
M
arke
t
SD
G&
E C
PV
ER
D_2
_SO
LAR
23
301
IV G
EN3
G2
0.31
45
.74
G2
SD
-IV
Non
e A
ug N
QC
M
arke
t
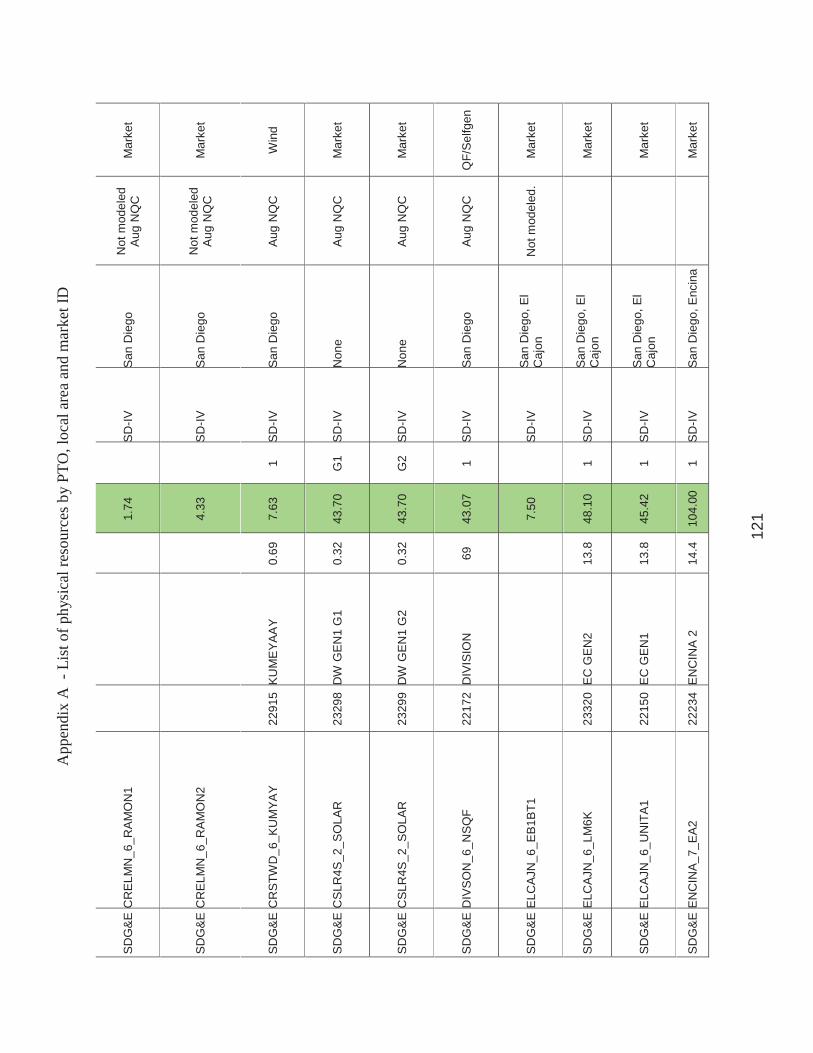
App
endi
x A
- L
ist o
f phy
sica
l res
ourc
es b
y PT
O, l
ocal
are
a an
d m
arke
t ID
121
SD
G&
E C
RE
LMN
_6_R
AM
ON
1
1.74
SD
-IV
San
Die
go
Not
mod
eled
A
ug N
QC
M
arke
t
SD
G&
E C
RE
LMN
_6_R
AM
ON
2
4.33
SD
-IV
San
Die
go
Not
mod
eled
A
ug N
QC
M
arke
t
SD
G&
E C
RS
TWD
_6_K
UM
YAY
22
915
KU
ME
YAA
Y
0.69
7.
63
1 S
D-IV
S
an D
iego
A
ug N
QC
W
ind
SD
G&
E C
SLR
4S_2
_SO
LAR
23
298
DW
GE
N1
G1
0.32
43
.70
G1
SD
-IV
Non
e A
ug N
QC
M
arke
t
SD
G&
E C
SLR
4S_2
_SO
LAR
23
299
DW
GE
N1
G2
0.32
43
.70
G2
SD
-IV
Non
e A
ug N
QC
M
arke
t
SD
G&
E D
IVS
ON
_6_N
SQ
F 22
172
DIV
ISIO
N
69
43.0
7 1
SD
-IV
San
Die
go
Aug
NQ
C
QF/
Sel
fgen
SD
G&
E E
LCA
JN_6
_EB
1BT1
7.50
SD
-IV
San
Die
go, E
l C
ajon
N
ot m
odel
ed.
Mar
ket
SD
G&
E E
LCA
JN_6
_LM
6K
2332
0 E
C G
EN
2 13
.8
48.1
0 1
SD
-IV
San
Die
go, E
l C
ajon
Mar
ket
SD
G&
E E
LCA
JN_6
_UN
ITA
1 22
150
EC
GE
N1
13.8
45
.42
1 S
D-IV
S
an D
iego
, El
Caj
on
M
arke
t
SD
G&
E E
NC
INA
_7_E
A2
2223
4 E
NC
INA
2
14.4
10
4.00
1
SD
-IV
San
Die
go, E
ncin
a
Mar
ket

App
endi
x A
- L
ist o
f phy
sica
l res
ourc
es b
y PT
O, l
ocal
are
a an
d m
arke
t ID
122
SD
G&
E E
NC
INA
_7_E
A3
2223
6 E
NC
INA
3
14.4
11
0.00
1
SD
-IV
San
Die
go, E
ncin
a
Mar
ket
SD
G&
E E
NC
INA
_7_E
A4
2224
0 E
NC
INA
4
22
300.
00
1 S
D-IV
S
an D
iego
, Enc
ina
M
arke
t
SD
G&
E E
NC
INA
_7_E
A5
2224
4 E
NC
INA
5
24
330.
00
1 S
D-IV
S
an D
iego
, Enc
ina
M
arke
t
SD
G&
E E
NC
INA
_7_G
T1
2224
8 E
NC
INA
GT
12.5
14
.50
1 S
D-IV
S
an D
iego
, Enc
ina
M
arke
t
SD
G&
E E
NE
RS
J_2_
WIN
D
23
.33
S
D-IV
N
one
Not
mod
eled
A
ug N
QC
W
ind
SD
G&
E E
SC
ND
O_6
_EB
1BT1
10.0
0 1
SD
-IV
San
Die
go, E
sco
Not
mod
eled
. M
arke
t
SD
G&
E E
SC
ND
O_6
_EB
2BT2
10.0
0 1
SD
-IV
San
Die
go, E
sco
Not
mod
eled
. M
arke
t
SD
G&
E E
SC
ND
O_6
_EB
3BT3
10.0
0 1
SD
-IV
San
Die
go, E
sco
Not
mod
eled
. M
arke
t
SD
G&
E E
SC
ND
O_6
_PL1
X2
2225
7 E
SG
EN
13
.8
48.7
1 1
SD
-IV
San
Die
go, E
sco
M
arke
t
SD
G&
E E
SC
ND
O_6
_UN
ITB
1 22
153
CA
LPK
_ES
13
.8
48.0
0 1
SD
-IV
San
Die
go, E
sco
M
arke
t

App
endi
x A
- L
ist o
f phy
sica
l res
ourc
es b
y PT
O, l
ocal
are
a an
d m
arke
t ID
123
SD
G&
E E
SC
O_6
_GLM
QF
2233
2 G
OAL
LIN
E
69
36.4
1 1
SD
-IV
San
Die
go, E
sco,
A
ug N
QC
N
et S
elle
r
SD
G&
E IV
SLR
P_2
_SO
LAR
1 23
440
DW
GE
N2
G1
0.36
57
.32
1 S
D-IV
N
one
Aug
NQ
C
Mar
ket
SD
G&
E IV
SLR
P_2
_SO
LAR
1 23
441
DW
GE
N2
G2
0.36
57
.32
1 S
D-IV
N
one
Aug
NQ
C
Mar
ket
SD
G&
E IV
SLR
P_2
_SO
LAR
1 23
442
DW
GE
N2
G3
0.36
57
.32
1 S
D-IV
N
one
Aug
NQ
C
Mar
ket
SD
G&
E IV
WE
ST_
2_S
OLA
R1
2315
5 D
U G
EN1
G1
0.2
65.2
0 G
1 S
D-IV
N
one
Aug
NQ
C
Mar
ket
SD
G&
E IV
WE
ST_
2_S
OLA
R1
2315
6 D
U G
EN1
G2
0.2
55.3
2 G
2 S
D-IV
N
one
Aug
NQ
C
Mar
ket
SD
G&
E L
AK
HD
G_6
_UN
IT 1
22
625
LKH
OD
G1
13.8
20
.00
1 S
D-IV
S
an D
iego
Mar
ket
SD
G&
E L
AK
HD
G_6
_UN
IT 2
22
626
LKH
OD
G2
13.8
20
.00
2 S
D-IV
S
an D
iego
Mar
ket
SD
G&
E L
AR
KS
P_6_
UN
IT 1
22
074
LRK
SP
BD
1 13
.8
46.0
0 1
SD
-IV
San
Die
go, B
orde
r
Mar
ket
SD
G&
E L
AR
KS
P_6_
UN
IT 2
22
075
LRK
SP
BD
2 13
.8
46.0
0 1
SD
-IV
San
Die
go, B
orde
r
Mar
ket
SD
G&
E L
AR
OA
1_2_
UN
ITA
1 20
187
LRP
-U1
16
0.00
1
SD
-IV
Non
e
Con
nect
to
CE
NA
CE
/CFE
gr
id fo
r the
su
mm
er –
not
av
aila
ble
for
Mar
ket

App
endi
x A
- L
ist o
f phy
sica
l res
ourc
es b
y PT
O, l
ocal
are
a an
d m
arke
t ID
124
ISO
BA
A R
A
purp
ose
SD
G&
E L
AR
OA
2_2_
UN
ITA
1 22
996
INTB
ST
18
145.
19
1 S
D-IV
N
one
M
arke
t
SD
G&
E L
AR
OA
2_2_
UN
ITA
1 22
997
INTB
CT
16
176.
81
1 S
D-IV
N
one
M
arke
t
SD
G&
E L
ILIA
C_6
_SO
LAR
2.41
SD
-IV
San
Die
go
Not
mod
eled
. M
arke
t
SD
G&
E M
RG
T_6_
ME
F2
2248
7 M
EF_
MR
2 13
.8
47.9
0 1
SD
-IV
San
Die
go,
Mira
mar
Mar
ket
SD
G&
E M
RG
T_6_
MM
AR
EF
2248
6 M
EF_
MR
1 13
.8
48.0
0 1
SD
-IV
San
Die
go,
Mira
mar
Mar
ket
SD
G&
E M
SH
GTS
_6_M
MA
RLF
22
448
ME
SA
HG
TS
69
3.70
1
SD
-IV
San
Die
go,
Mis
sion
A
ug N
QC
M
arke
t
SD
G&
E M
SS
ION
_2_Q
F 22
496
MIS
SIO
N
69
0.65
1
SD
-IV
San
Die
go
Aug
NQ
C
Mar
ket
SD
G&
E N
IMTG
_6_N
IQF
2257
6 N
OIS
LMTR
69
34
.98
1 S
D-IV
S
an D
iego
A
ug N
QC
Q
F/S
elfg
en
SD
G&
E O
CTI
LO_5
_WIN
D
2331
4 O
CO
GEN
G1
0.69
8.
17
G1
SD
-IV
Non
e A
ug N
QC
W
ind
SD
G&
E O
CTI
LO_5
_WIN
D
2331
8 O
CO
GEN
G2
0.69
8.
17
G2
SD
-IV
Non
e A
ug N
QC
W
ind

App
endi
x A
- L
ist o
f phy
sica
l res
ourc
es b
y PT
O, l
ocal
are
a an
d m
arke
t ID
125
SD
G&
E O
GR
OV
E_6
_PL1
X2
2262
8 P
A G
EN
1 13
.8
48.0
0 1
SD
-IV
San
Die
go, P
ala
M
arke
t
SD
G&
E O
GR
OV
E_6
_PL1
X2
2262
9 P
A G
EN
2 13
.8
48.0
0 1
SD
-IV
San
Die
go, P
ala
M
arke
t
SD
G&
E O
TAY_
6_LN
DFL
5 22
604
OTA
Y
69
0.
00
S
D-IV
S
an D
iego
, Bor
der
Not
mod
eled
E
nerg
y O
nly
Mar
ket
SD
G&
E O
TAY_
6_LN
DFL
6 22
604
OTA
Y
69
0.
00
S
D-IV
S
an D
iego
, Bor
der
Not
mod
eled
E
nerg
y O
nly
Mar
ket
SD
G&
E O
TAY_
6_P
L1X2
22
617
OYG
EN
13.8
35
.50
1 S
D-IV
S
an D
iego
, Bor
der
M
arke
t
SD
G&
E O
TAY_
6_U
NIT
B1
2260
4 O
TAY
69
2.38
1
SD
-IV
San
Die
go, B
orde
r A
ug N
QC
M
arke
t
SD
G&
E O
TAY_
7_U
NIT
C1
2260
4 O
TAY
69
1.78
3
SD
-IV
San
Die
go, B
orde
r A
ug N
QC
Q
F/S
elfg
en
SD
G&
E O
TME
SA
_2_P
L1X3
22
605
OTA
YM
GT1
18
16
5.16
1
SD
-IV
San
Die
go
M
arke
t
SD
G&
E O
TME
SA
_2_P
L1X3
22
606
OTA
YM
GT2
18
16
6.17
1
SD
-IV
San
Die
go
M
arke
t

App
endi
x A
- L
ist o
f phy
sica
l res
ourc
es b
y PT
O, l
ocal
are
a an
d m
arke
t ID
126
SD
G&
E O
TME
SA
_2_P
L1X3
22
607
OTA
YM
ST1
16
27
2.27
1
SD
-IV
San
Die
go
M
arke
t
SD
G&
E P
ALO
MR
_2_P
L1X3
22
262
PE
N_C
T1
18
170.
18
1 S
D-IV
S
an D
iego
Mar
ket
SD
G&
E P
ALO
MR
_2_P
L1X3
22
263
PE
N_C
T2
18
170.
18
1 S
D-IV
S
an D
iego
Mar
ket
SD
G&
E P
ALO
MR
_2_P
L1X3
22
265
PE
N_S
T
18
225.
24
1 S
D-IV
S
an D
iego
Mar
ket
SD
G&
E P
IOP
IC_2
_CTG
1 23
162
PIO
PIC
O C
T1
13.8
10
6.00
1
SD
-IV
San
Die
go
No
NQ
C -
Pm
ax
Mar
ket
SD
G&
E P
IOP
IC_2
_CTG
2 23
163
PIO
PIC
O C
T2
13.8
10
6.00
1
SD
-IV
San
Die
go
No
NQ
C -
Pm
ax
Mar
ket
SD
G&
E P
IOP
IC_2
_CTG
3 23
164
PIO
PIC
O C
T3
13.8
10
6.00
1
SD
-IV
San
Die
go
No
NQ
C -
Pm
ax
Mar
ket
SD
G&
E P
TLO
MA
_6_N
TCC
GN
22
660
PO
INTL
MA
69
2.
07
2 S
D-IV
S
an D
iego
A
ug N
QC
Q
F/S
elfg
en
SD
G&
E P
TLO
MA
_6_N
TCQ
F 22
660
PO
INTL
MA
69
19
.74
1 S
D-IV
S
an D
iego
A
ug N
QC
Q
F/S
elfg
en
SD
G&
E S
AM
PS
N_6
_KE
LCO
1 22
704
SA
MP
SO
N
12.5
6.
39
1 S
D-IV
S
an D
iego
A
ug N
QC
N
et S
elle
r S
DG
&E
SM
RC
OS
_6_L
ND
FIL
2272
4 SA
NM
RC
OS
69
1.
28
1 S
D-IV
S
an D
iego
A
ug N
QC
M
arke
t
SD
G&
E T
ER
ME
X_2_
PL1
X3
2298
2 TD
M C
TG2
18
156.
44
1 S
D-IV
N
one
M
arke
t
SD
G&
E T
ER
ME
X_2_
PL1
X3
2298
3 TD
M C
TG3
18
156.
44
1 S
D-IV
N
one
M
arke
t
SD
G&
E T
ER
ME
X_2_
PL1
X3
2298
1 TD
M S
TG
21
280.
13
1 S
D-IV
N
one
M
arke
t
SD
G&
E V
LCN
TR_6
_VC
SLR
1.87
SD
-IV
San
Die
go, P
ala
Not
mod
eled
A
ug N
QC
M
arke
t
SD
G&
E V
LCN
TR_6
_VC
SLR
1
2.17
SD
-IV
San
Die
go, P
ala
Not
mod
eled
A
ug N
QC
M
arke
t
SD
G&
E V
LCN
TR_6
_VC
SLR
2
4.78
SD
-IV
San
Die
go, P
ala
Not
mod
eled
A
ug N
QC
M
arke
t
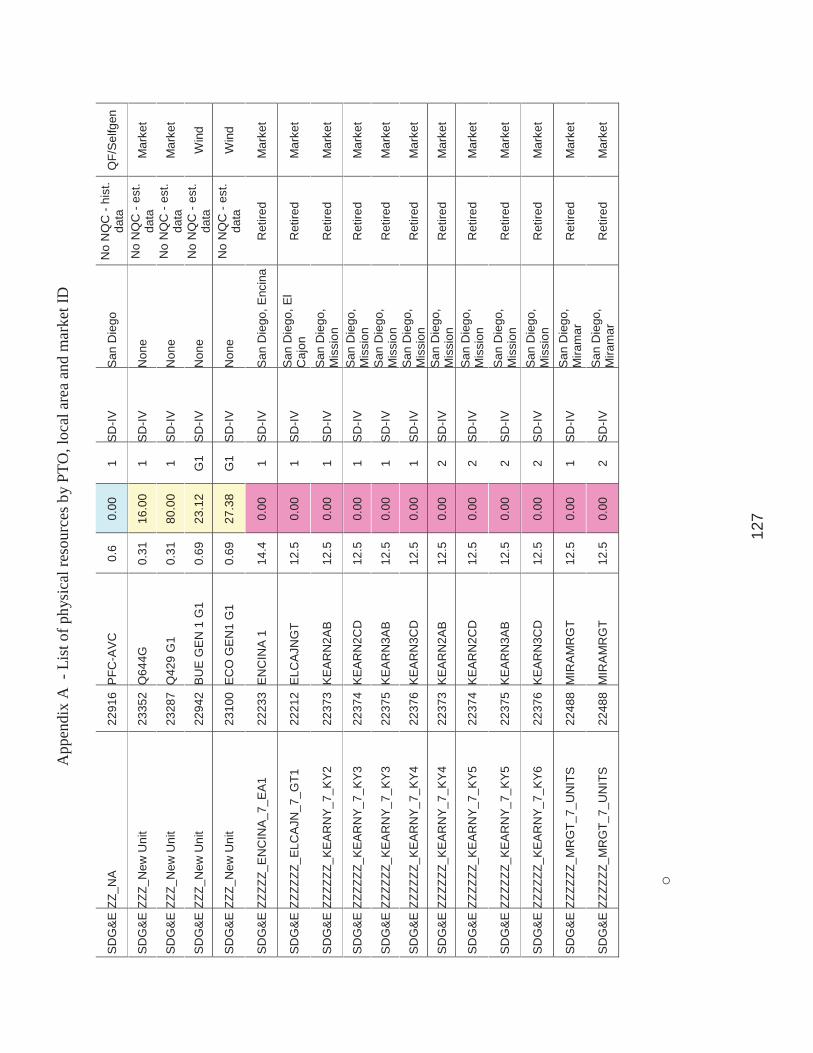
App
endi
x A
- L
ist o
f phy
sica
l res
ourc
es b
y PT
O, l
ocal
are
a an
d m
arke
t ID
127
SD
G&
E Z
Z_N
A
2291
6 P
FC-A
VC
0.
6 0.
00
1 S
D-IV
S
an D
iego
N
o N
QC
- hi
st.
data
Q
F/S
elfg
en
SDG
&E Z
ZZ_N
ew U
nit
2335
2 Q
644G
0.
31
16.0
0 1
SD
-IV
Non
e N
o N
QC
- es
t. da
ta
Mar
ket
SD
G&
E Z
ZZ_N
ew U
nit
2328
7 Q
429
G1
0.31
80
.00
1 S
D-IV
N
one
No
NQ
C -
est.
data
M
arke
t
SD
G&
E Z
ZZ_N
ew U
nit
2294
2 B
UE
GE
N 1
G1
0.69
23
.12
G1
SD
-IV
Non
e N
o N
QC
- es
t. da
ta
Win
d
SD
G&
E Z
ZZ_N
ew U
nit
2310
0 E
CO
GE
N1
G1
0.69
27
.38
G1
SD
-IV
Non
e N
o N
QC
- es
t. da
ta
Win
d
SD
G&
E Z
ZZZZ
_EN
CIN
A_7
_EA
1 22
233
EN
CIN
A 1
14
.4
0.00
1
SD
-IV
San
Die
go, E
ncin
a R
etire
d M
arke
t
SD
G&
E Z
ZZZZ
Z_EL
CA
JN_7
_GT1
22
212
ELC
AJN
GT
12.5
0.
00
1 S
D-IV
S
an D
iego
, El
Caj
on
Ret
ired
Mar
ket
SD
G&
E Z
ZZZZ
Z_K
EA
RN
Y_7_
KY2
22
373
KE
AR
N2A
B
12.5
0.
00
1 S
D-IV
S
an D
iego
, M
issi
on
Ret
ired
Mar
ket
SD
G&
E Z
ZZZZ
Z_K
EA
RN
Y_7_
KY3
22
374
KE
AR
N2C
D
12.5
0.
00
1 S
D-IV
S
an D
iego
, M
issi
on
Ret
ired
Mar
ket
SD
G&
E Z
ZZZZ
Z_K
EA
RN
Y_7_
KY3
22
375
KE
AR
N3A
B
12.5
0.
00
1 S
D-IV
S
an D
iego
, M
issi
on
Ret
ired
Mar
ket
SD
G&
E Z
ZZZZ
Z_K
EA
RN
Y_7_
KY4
22
376
KE
AR
N3C
D
12.5
0.
00
1 S
D-IV
S
an D
iego
, M
issi
on
Ret
ired
Mar
ket
SD
G&
E Z
ZZZZ
Z_K
EA
RN
Y_7_
KY4
22
373
KE
AR
N2A
B
12.5
0.
00
2 S
D-IV
S
an D
iego
, M
issi
on
Ret
ired
Mar
ket
SD
G&
E Z
ZZZZ
Z_K
EA
RN
Y_7_
KY5
22
374
KE
AR
N2C
D
12.5
0.
00
2 S
D-IV
S
an D
iego
, M
issi
on
Ret
ired
Mar
ket
SD
G&
E Z
ZZZZ
Z_K
EA
RN
Y_7_
KY5
22
375
KE
AR
N3A
B
12.5
0.
00
2 S
D-IV
S
an D
iego
, M
issi
on
Ret
ired
Mar
ket
SD
G&
E Z
ZZZZ
Z_K
EA
RN
Y_7_
KY6
22
376
KE
AR
N3C
D
12.5
0.
00
2 S
D-IV
S
an D
iego
, M
issi
on
Ret
ired
Mar
ket
SDG
&E Z
ZZZZ
Z_M
RG
T_7_
UN
ITS
22
488
MIR
AM
RG
T 12
.5
0.00
1
SD
-IV
San
Die
go,
Mira
mar
R
etire
d M
arke
t
SD
G&
E Z
ZZZZ
Z_M
RG
T_7_
UN
ITS
22
488
MIR
AM
RG
T 12
.5
0.00
2
SD
-IV
San
Die
go,
Mira
mar
R
etire
d M
arke
t
o

Appendix B - Effectiveness factors for procurement guidance
128
VI. Appendix B – Effectiveness factors for procurement guidance
Table - Eagle Rock. Effectiveness factors to the Eagle Rock-Cortina 115 kV line:
Gen Bus Gen Name Gen ID Eff Fctr (%) 31406 GEYSR5-6 1 36 31406 GEYSR5-6 2 36 31408 GEYSER78 1 36 31408 GEYSER78 2 36 31412 GEYSER11 1 37 31435 GEO.ENGY 1 35 31435 GEO.ENGY 2 35 31433 POTTRVLY 1 34 31433 POTTRVLY 3 34 31433 POTTRVLY 4 34 38020 CITY UKH 1 32 38020 CITY UKH 2 32
Table - Fulton Effectiveness factors to the Lakeville-Petaluma-Cotati 60 kV line:
Gen Bus Gen Name Gen ID Eff Fctr (%) 31466 SONMA LF 1 52 31422 GEYSER17 1 12 31404 WEST FOR 1 12 31404 WEST FOR 2 12 31414 GEYSER12 1 12 31418 GEYSER14 1 12 31420 GEYSER16 1 12 31402 BEAR CAN 1 12 31402 BEAR CAN 2 12 38110 NCPA2GY1 1 12 38112 NCPA2GY2 1 12 32700 MONTICLO 1 10 32700 MONTICLO 2 10 32700 MONTICLO 3 10 31435 GEO.ENGY 1 6 31435 GEO.ENGY 2 6 31408 GEYSER78 1 6 31408 GEYSER78 2 6 31412 GEYSER11 1 6 31406 GEYSR5-6 1 6 31406 GEYSR5-6 2 6

Appendix B - Effectiveness factors for procurement guidance
129
Table - Lakeville Effectiveness factors to the Vaca Dixon-Lakeville 230 kV line:
Gen Bus Gen Name Gen ID Eff Fctr (%) 31400 SANTA FE 2 38 31430 SMUDGEO1 1 38 31400 SANTA FE 1 38 31416 GEYSER13 1 38 31424 GEYSER18 1 38 31426 GEYSER20 1 38 38106 NCPA1GY1 1 38 38108 NCPA1GY2 1 38 31421 BOTTLERK 1 36 31404 WEST FOR 2 36 31402 BEAR CAN 1 36 31402 BEAR CAN 2 36 31404 WEST FOR 1 36 31414 GEYSER12 1 36 31418 GEYSER14 1 36 31420 GEYSER16 1 36 31422 GEYSER17 1 36 38110 NCPA2GY1 1 36 38112 NCPA2GY2 1 36 31446 SONMA LF 1 36 32700 MONTICLO 1 31 32700 MONTICLO 2 31 32700 MONTICLO 3 31 31406 GEYSR5-6 1 18 31406 GEYSR5-6 2 18 31405 RPSP1014 1 18 31408 GEYSER78 1 18 31408 GEYSER78 2 18 31412 GEYSER11 1 18 31435 GEO.ENGY 1 18 31435 GEO.ENGY 2 18 31433 POTTRVLY 1 15 31433 POTTRVLY 2 15 31433 POTTRVLY 3 15 38020 CITY UKH 1 15 38020 CITY UKH 2 15
Table – Rio Oso Effectiveness factors to the Rio Oso-Atlantic 230 kV line:

Appendix B - Effectiveness factors for procurement guidance
130
Gen Bus Gen Name Gen ID Eff Fctr. (%)
32498 SPILINCF 1 49 32500 ULTR RCK 1 49 32456 MIDLFORK 1 33 32456 MIDLFORK 2 33 32458 RALSTON 1 33 32513 ELDRADO1 1 32 32514 ELDRADO2 1 32 32510 CHILIBAR 1 32 32486 HELLHOLE 1 31 32508 FRNCH MD 1 30 32460 NEWCSTLE 1 26 32478 HALSEY F 1 24 32512 WISE 1 24 38114 Stig CC 1 14 38123 Q267CT 1 14 38124 Q267ST 1 14 32462 CHI.PARK 1 8 32464 DTCHFLT1 1 4
Table – South of Table Mountain
Effectiveness factors to the Caribou-Palermo 115 kV line:
Gen Bus Gen Name Gen ID Eff Fctr. (%) 31814 FORBSTWN 1 7 31794 WOODLEAF 1 7 31832 SLY.CR. 1 7 31862 DEADWOOD 1 7 31890 PO POWER 1 6 31890 PO POWER 2 6 31888 OROVLLE 1 6 31834 KELLYRDG 1 6 32450 COLGATE1 1 4 32466 NARROWS1 1 4 32468 NARROWS2 1 4 32452 COLGATE2 1 4 32470 CMP.FARW 1 4 32451 FREC 1 4 32490 GRNLEAF1 1 4 32490 GRNLEAF1 2 4 32496 YCEC 1 4 32494 YUBA CTY 1 4 32492 GRNLEAF2 1 4 32498 SPILINCF 1 2 31788 ROCK CK2 1 2 31812 CRESTA 1 2 31812 CRESTA 2 2

Appendix B - Effectiveness factors for procurement guidance
131
31820 BCKS CRK 1 2 31820 BCKS CRK 2 2 31786 ROCK CK1 1 2 31790 POE 1 1 2 31792 POE 2 1 2 31784 BELDEN 1 2 32500 ULTR RCK 1 2 32156 WOODLAND 1 2 32510 CHILIBAR 1 2 32513 ELDRADO1 1 2 32514 ELDRADO2 1 2 32478 HALSEY F 1 2 32460 NEWCSTLE 1 1 32458 RALSTON 1 1 32512 WISE 1 1 32456 MIDLFORK 1 1 32456 MIDLFORK 2 1 32486 HELLHOLE 1 1 32508 FRNCH MD 1 1 32162 RIV.DLTA 1 1 32502 DTCHFLT2 1 1 32462 CHI.PARK 1 1 32464 DTCHFLT1 1 1 32454 DRUM 5 1 1 32476 ROLLINSF 1 1 32484 OXBOW F 1 1 32474 DEER CRK 1 1 32504 DRUM 1-2 1 1 32504 DRUM 1-2 2 1 32506 DRUM 3-4 1 1 32506 DRUM 3-4 2 1 32166 UC DAVIS 1 1 32472 SPAULDG 1 1 32472 SPAULDG 2 1 32472 SPAULDG 3 1 32480 BOWMAN 1 1 32488 HAYPRES+ 1 1 32488 HAYPRES+ 2 1 38124 LODI ST1 1 1 38123 LODI CT1 1 1 38114 STIG CC 1 1
Table – San Jose
Effectiveness factors to the Metcalf-Evergreen #1 115 kV line.

Appendix B - Effectiveness factors for procurement guidance
132
Gen Bus Gen Name Gen ID Eff Fctr (%) 35863 CATALYST 1 20 36856 CCCA100 1 6 36854 Cogen 1 6 36854 Cogen 2 6 36863 DVRaGT1 1 6 36864 DVRbGT2 1 6 36865 DVRaST3 1 6 35860 OLS-AGNE 1 5 36858 Gia100 1 5 36859 Gia200 2 5 35854 LECEFGT1 1 5 35855 LECEFGT2 2 5 35856 LECEFGT3 3 5 35857 LECEFGT4 4 5 Table – Herndon
Effectiveness factors to the Herndon-Barton 115 kV line.
Gen Bus Gen Name Gen ID Eff Factor % 34624 BALCH 1 1 18.198 34616 KINGSRIV 1 16.901 34671 KRCDPCT1 1 16.258 34672 KRCDPCT2 1 16.258 34648 DINUBA E 1 15.628 34603 JGBSWLT ST 12.418 34677 Q558 1 12.418 34690 CORCORAN_3 FW 12.418 34692 CORCORAN_4 FW 12.418 34696 CORCORANPV_S 1 12.418 34699 Q529 1 12.418 34610 HAAS 1 11.344 34610 HAAS 2 11.344 34612 BLCH 2-2 1 11.344 34614 BLCH 2-3 1 11.344 34308 KERCKHOF 1 8.609 34343 KERCK1-2 2 8.609 34344 KERCK1-1 1 8.609 34345 KERCK1-3 3 8.609 34431 GWF_HEP1 1 7.258 34433 GWF_HEP2 1 7.258 34617 Q581 1 4.142 34649 Q965 1 4.142 34680 KANSAS 1 4.142

Appendix B - Effectiveness factors for procurement guidance
133
Table – Western LA Basin
Effectiveness factors to the Serrano – Villa Park #1 or #2 230 kV lines:
Gen Bus Gen Name Gen ID MW Eff Fctr (%) 29309 BARPKGEN 1 24 25208 DowlingCTG 1 23 25211 CanyonGT 1 1 23 25212 CanyonGT 2 2 23 25213 CanyonGT 3 3 23 25214 CanyonGT 4 4 23 24066 HUNT1 G 1 20 24067 HUNT2 G 2 20 24325 ORCOGEN 1 20 24005 ALAMT5 G 5 17 24161 ALAMT6 G 6 17 24001 ALAMT1 G 1 17 24002 ALAMT2 G 2 17 24003 ALAMT3 G 3 17 24004 ALAMT4 G 4 17 24162 ALAMT7 G R7 17 24133 SANTIAGO 1 13 24341 COYGEN 1 13 24018 BRIGEN 1 13 24011 ARCO 1G 1 11 24012 ARCO 2G 2 11 24013 ARCO 3G 3 11 24014 ARCO 4G 4 11 24020 CARBGEN1 1 11 24064 HINSON 1 11 24080 LBEACH8G R8 11 24081 LBEACH9G R9 11 24139 SERRFGEN D1 11 24163 ARCO 5G 5 11 24164 ARCO 6G 6 11 24170 LBEACH12 2 11 24170 LBEACH12 1 11 24171 LBEACH34 3 11 24171 LBEACH34 4 11 24327 THUMSGEN 1 11 24328 CARBGEN2 1 11 24062 HARBOR G38 1 11
38 Harbor generating units are currently on mothballed status.
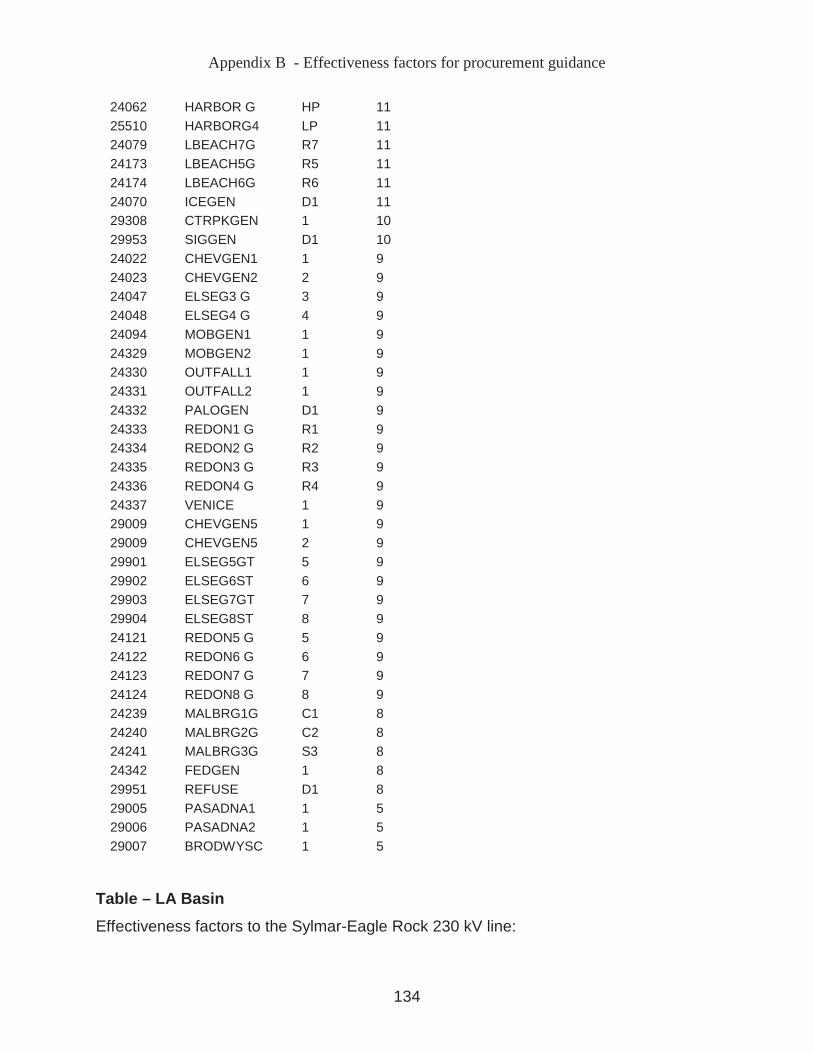
Appendix B - Effectiveness factors for procurement guidance
134
24062 HARBOR G HP 11 25510 HARBORG4 LP 11 24079 LBEACH7G R7 11 24173 LBEACH5G R5 11 24174 LBEACH6G R6 11 24070 ICEGEN D1 11 29308 CTRPKGEN 1 10 29953 SIGGEN D1 10 24022 CHEVGEN1 1 9 24023 CHEVGEN2 2 9 24047 ELSEG3 G 3 9 24048 ELSEG4 G 4 9 24094 MOBGEN1 1 9 24329 MOBGEN2 1 9 24330 OUTFALL1 1 9 24331 OUTFALL2 1 9 24332 PALOGEN D1 9 24333 REDON1 G R1 9 24334 REDON2 G R2 9 24335 REDON3 G R3 9 24336 REDON4 G R4 9 24337 VENICE 1 9 29009 CHEVGEN5 1 9 29009 CHEVGEN5 2 9 29901 ELSEG5GT 5 9 29902 ELSEG6ST 6 9 29903 ELSEG7GT 7 9 29904 ELSEG8ST 8 9 24121 REDON5 G 5 9 24122 REDON6 G 6 9 24123 REDON7 G 7 9 24124 REDON8 G 8 9 24239 MALBRG1G C1 8 24240 MALBRG2G C2 8 24241 MALBRG3G S3 8 24342 FEDGEN 1 8 29951 REFUSE D1 8 29005 PASADNA1 1 5 29006 PASADNA2 1 5 29007 BRODWYSC 1 5
Table – LA Basin
Effectiveness factors to the Sylmar-Eagle Rock 230 kV line:

Appendix B - Effectiveness factors for procurement guidance
135
GENERATOR MW Eff Fctr (%) PASADNA1 13.8 #1 -25.58 PASADNA2 13.8 #1 -25.57 BRODWYSC 13.8 #1 -25.25 MALBRG3G 13.8 #S3 -15.52 ELSEG8ST 13.8 #8 -13.47 ELSEG7GT 16.5 #7 -13.46 ELSEG3 G 18.0 #3 -13.43 ELSEG4 G 18.0 #4 -13.42 CHEVGEN1 13.8 #1 -13.37 CHEVGEN2 13.8 #2 -13.37 VENICE 13.8 #1 -13.37 CHEVGEN5 13.8 #1 -13.36 CHEVGEN5 13.8 #2 -13.36 MOBGEN1 13.8 #1 -13.34 MOBGEN2 13.8 #1 -13.34 PALOGEN 13.8 #D1 -13.34 REDON5 G 18.0 #5 -13.27 REDON6 G 18.0 #6 -13.26 ARCO 1G 13.8 #1 -12.54 ARCO 2G 13.8 #2 -12.54 HARBOR G 13.8 #1 -12.54 HARBORG4 4.2 #LP -12.54 HARBOR G 13.8 #HP -12.54 LBEACH12 13.8 #2 -12.51 THUMSGEN 13.8 #1 -12.49 CARBGEN1 13.8 #1 -12.48 SERRFGEN 13.8 #D1 -12.48 CARBGEN2 13.8 #1 -12.48 LBEACH34 13.8 #3 -12.47 ICEGEN 13.8 #D1 -12.23 CTRPKGEN 13.8 #1 -11.36 SIGGEN 13.8 #D1 -11.35 ALAMT3 G 18.0 #3 -10.66 ALAMT4 G 18.0 #4 -10.66 EME WCG1 13.8 #1 -9.96 OLINDA 66.0 #1 -9.51 BREAPWR2 13.8 #C1 -9.5 BARPKGEN 13.8 #1 -8.7 HUNT1 G 13.8 #1 -8.3 HUNT2 G 13.8 #2 -8.3 SANTIAGO 66.0 #1 -7.73 CanyonGT 1 13.8 #1 -7.34
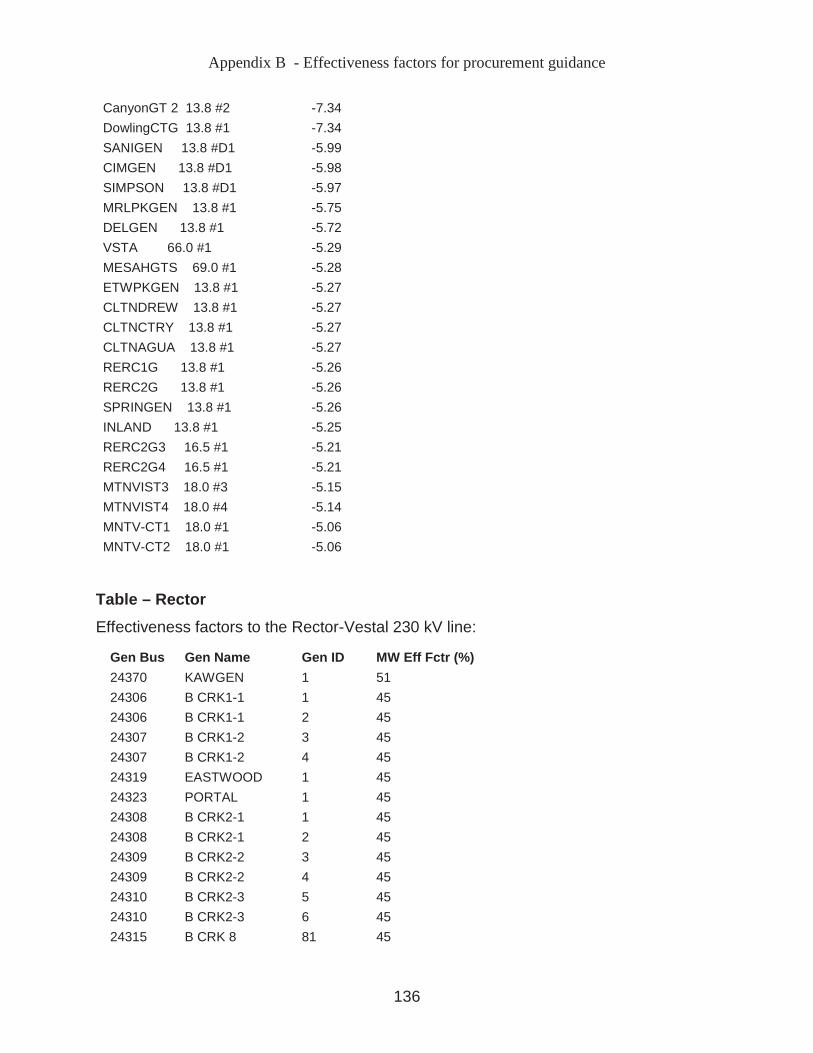
Appendix B - Effectiveness factors for procurement guidance
136
CanyonGT 2 13.8 #2 -7.34 DowlingCTG 13.8 #1 -7.34 SANIGEN 13.8 #D1 -5.99 CIMGEN 13.8 #D1 -5.98 SIMPSON 13.8 #D1 -5.97 MRLPKGEN 13.8 #1 -5.75 DELGEN 13.8 #1 -5.72 VSTA 66.0 #1 -5.29 MESAHGTS 69.0 #1 -5.28 ETWPKGEN 13.8 #1 -5.27 CLTNDREW 13.8 #1 -5.27 CLTNCTRY 13.8 #1 -5.27 CLTNAGUA 13.8 #1 -5.27 RERC1G 13.8 #1 -5.26 RERC2G 13.8 #1 -5.26 SPRINGEN 13.8 #1 -5.26 INLAND 13.8 #1 -5.25 RERC2G3 16.5 #1 -5.21 RERC2G4 16.5 #1 -5.21 MTNVIST3 18.0 #3 -5.15 MTNVIST4 18.0 #4 -5.14 MNTV-CT1 18.0 #1 -5.06 MNTV-CT2 18.0 #1 -5.06
Table – Rector Effectiveness factors to the Rector-Vestal 230 kV line:
Gen Bus Gen Name Gen ID MW Eff Fctr (%) 24370 KAWGEN 1 51 24306 B CRK1-1 1 45 24306 B CRK1-1 2 45 24307 B CRK1-2 3 45 24307 B CRK1-2 4 45 24319 EASTWOOD 1 45 24323 PORTAL 1 45 24308 B CRK2-1 1 45 24308 B CRK2-1 2 45 24309 B CRK2-2 3 45 24309 B CRK2-2 4 45 24310 B CRK2-3 5 45 24310 B CRK2-3 6 45 24315 B CRK 8 81 45

Appendix B - Effectiveness factors for procurement guidance
137
24315 B CRK 8 82 45 24311 B CRK3-1 1 45 24311 B CRK3-1 2 45 24312 B CRK3-2 3 45 24312 B CRK3-2 4 45 24313 B CRK3-3 5 45 24317 MAMOTH1G 1 45 24318 MAMOTH2G 2 45 24314 B CRK 4 41 43 24314 B CRK 4 42 43
Table – San Diego Effectiveness factors to the Imperial Valley – El Centro 230 kV line (i.e., the “S” line): GENERATOR MW Eff Factor (%)
INTBCT 16.0 #1 25.42
INTBST 18.0 #1 25.42
DW GEN2 G1 0.4 #1 25.18
DW GEN1 G1 0.3 #G1 25.15
DU GEN1 G2 0.2 #G2 25.14
DW GEN1 G2 0.3 #G2 25.14
DU GEN1 G1 0.2 #G1 25.08
DW GEN3&4 0.3 #1 25.08
OCO GEN G1 0.7 #G1 22.71
OCO GEN G2 0.7 #G2 22.71
ECO GEN1 G 0.7 #G1 21.85
Q644G 0.3 #1 21.11
OTAYMGT1 18.0 #1 17.82
OTAYMGT2 18.0 #1 17.82
OTAYMST1 16.0 #1 17.82
PIO PICO 1 13.8 #1 17.52
PIO PICO 1 13.8 #1 17.52
PIO PICO 1 13.8 #1 17.52
KUMEYAAY 0.7 #1 17.05
EC GEN2 13.8 #1 16.91
EC GEN1 13.8 #1 16.89
OY GEN 13.8 #1 16.82
OTAY 69.0 #1 16.81
OTAY 69.0 #3 16.81

Appendix B - Effectiveness factors for procurement guidance
138
DIVISION 69.0 #1 16.78
NOISLMTR 69.0 #1 16.75
SAMPSON 12.5 #1 16.69
CABRILLO 69.0 #1 16.62
LRKSPBD1 13.8 #1 16.56
LRKSPBD2 13.8 #1 16.56
POINTLMA 69.0 #2 16.56
CALPK_BD 13.8 #1 16.55
MESAHGTS 69.0 #1 16.48
CARLTNHS 138.0 #1 16.46
CARLTNHS 138.0 #2 16.46
MISSION 69.0 #1 16.39
EASTGATE 69.0 #1 16.25
MEF MR1 13.8 #1 16.23
CHCARITA 138.0 #1 16.21
MEF MR2 13.8 #1 16.08
LkHodG1 13.8 #1 15.60
LkHodG2 13.8 #1 15.60
GOALLINE 69.0 #1 15.23
PEN_CT1 18.0 #1 14.98
CALPK_ES 13.8 #1 14.97
ENCINA 2 14.4 #1 14.96
ES GEN 13.8 #1 14.96
PEN_CT2 18.0 #1 14.93
PEN_ST 18.0 #1 14.92
SANMRCOS 69.0 #1 14.84
PA GEN1 13.8 #1 14.40
PA GEN2 13.8 #1 14.40
BR GEN1 0.2 #1 13.67
CAPSTRNO 138.0 #1 11.88
Resources connected to Imperial Valley substation or nearby SDG&E-owned
substations in the area are most effective in mitigating the S-Line overload concern.
Recommended