2011 SAPMTCTE REPORTEarly (4-8 weeks post-delivery) Population-level
Effectiveness of WHO PMTCT Option A, South Africa, 2011
Medical Research Council, South AfricaSchool of Public Health, University of the Western Cape,
National Department of Health, South AfricaCenters for Disease Control and Prevention/PEPFAR
National Institute for Communicable Diseases/National Health Laboratory ServiceWits Paediatrics HIV Diagnostics
UNICEF

2011 SAPMTCTE report
Early (4-8 weeks post-delivery)
Population-level Effectiveness of WHO PMTCT Option A, South Africa, 2011

ii
Principal Investigators
Ameena Goga
Thu-Ha Dinh
Debra Jackson
SAPMTCTE Study Group
Yogan Pillay
Gayle Sherman
Adrian Puren
Peter Barron
Precious Robinson
Carl Lombard
Selamawit Woldesenbet
Vundli Ramokolo
Tanya Doherty
Sanjana Bhardwaj
Mary Mogoshoa
Nathan Shaffer
Mickey Chopra
Report Prepared by:
Ameena Goga
Debra Jackson
Babalwa Dumalisile
Contributors and Reviewers: Carl Lombard Adrian Puren
Gayle Sherman Selamawit Woldesenbet
Peter Barron Tanya Doherty
Mary Mogoshoa Vundli Ramokolo

iii
Copyright
Copyright 2013. All material in this report may be reproduced and copied for
non-commercial purposes: citation as to source, however, is required.
This report is disseminated by the South African Medical Research Council, National Department of
Health South Africa and PEPFAR/US Centers for Disease Control & Prevention.
Suggested citation
Goga AE, Dinh TH, Jackson DJ for the SAPMTCTE study group. Early (4-8 weeks post-delivery)
Population-level Effectiveness of WHO PMTCT Option A, South Africa, 2011. South African Medical
Research Council, National Department of Health of South Africa and PEPFAR/US Centers for Disease
Control and Prevention. 2013.
ISBN: 978-1-920618-20-9

iv
CONTENTS
PRIMARY CONTACTS/PRINCIPAL INVESTIGATORS…………………………………………………………………………….vi
ACKNOWLEDGEMENTS…………………………………………………………………………………………………………………….vii
ABBREVIATIONS AND ACRONYMS…………………………………………………………………………………………………..viii
EXECUTIVE SUMMARY………………………………………………………………………………………………………………………ix
Introduction ....................................................................................................................................... ix
Aims and Objectives .......................................................................................................................... ix
Methods.............................................................................................................................................. x
Results ................................................................................................................................................ x
Conclusions and Recommendations .................................................................................................. xi
DEFINITIONS…………………………………………………………………………………………………………………………………… xii
1. INTRODUCTION 1
2. METHODOLOGY 2
2.1 Survey Design and Justification .................................................................................................... 2
2.2 Study Population and Inclusion/Exclusion Criteria ....................................................................... 3
2.3 Sampling ....................................................................................................................................... 3
2.4 Data Collection Tools .................................................................................................................... 4
2.5 Ethical Considerations .................................................................................................................. 4
2.6 Data Collection Methods .............................................................................................................. 5
2.7 Laboratory Methods ..................................................................................................................... 8
2.8 Quality Control of Field Work ....................................................................................................... 9
2.9 Data Management ........................................................................................................................ 9
2.10 Data Analysis ............................................................................................................................. 10
3. RESULTS 11
3.1 Sample Realisation and Survey Profile ....................................................................................... 11
3.2 Sample Description and Characteristics ..................................................................................... 12
3.3 Infant HIV Infection Prevalence .................................................................................................. 19
3.4 National and Provincial Infant HIV Exposure and MTCT Rates................................................... 19
3.5 National PMTCT Programme Cascade ........................................................................................ 20
3.6 Demographic Characteristics, MTCT and the PMTCT Cascade by Province ............................... 24
3.7 Infant Feeding ............................................................................................................................. 58
4. DISCUSSION 61
4.1 Infant HIV Exposure .................................................................................................................... 61
4.2 Mother-to-Child Transmission of HIV ......................................................................................... 61
4.3 PMTCT Cascade .......................................................................................................................... 63
4.4 Early Infant Diagnosis ................................................................................................................. 64
4.5 Infant Feeding ............................................................................................................................. 64
5. STRENGTHS AND LIMITATIONS OF SAPMTCTE 65
Strengths ........................................................................................................................................... 65
Limitations…………………………………………………………………………………………………………………………………..65

v
6. CONCLUSION AND RECOMMENDATIONS 66
REFERENCES…………………………………………………………………………………………………………………………………….67
SAMPLE SIZE CALCULATION BY PROVINCE……………………………………………………………………………………….70
SAMPLING……………………………………………………………………………………………………………………………………….71
TABLES
Table 1 Data collection start and end dates in each province ............................................................... 5
Table 2 2010 SAPMTCTE desired and actual sample size by province ................................................ 11
Table 3 Selected socio-demographic observations of 2011 SAPMTCTE .............................................. 13
Table 4 Weighted Infant HIV infection prevalence nationally and by province .................................. 19
Table 5 Weighted infant HIV exposure and 4-8 week (early) MTCT of HIV by province for 2010 and
2011 ...................................................................................................................................................... 20
Table 6 HIV testing & results among pregnant women (weighted analysis) for 2010 and 2011 ........ 21
Table 7 Access to the PMTCT programme in reported HIV-positive mothers (weighted analysis), 2010
and 2011 ............................................................................................................................................... 22
Table 8 Baseline characteristics of Eastern Cape SAPMTCTE survey participants ............................... 24
Table 9 Baseline characteristics of Free State SAPMTCTE survey participants ................................... 27
Table 10 Baseline characteristics of Gauteng SAPMTCTE survey participants .................................... 31
Table 11 Baseline characteristics of KwaZulu-Natal SAPMTCTE survey participants .......................... 35
Table 12 Baseline characteristics of Limpopo SAPMTCTE survey participants .................................... 39
Table 13 Baseline characteristics of Mpumalanga SAPMTCTE survey participants ............................ 42
Table 14 Baseline characteristics of Northern Cape SAPMTCTE survey participants .......................... 46
Table 15 Baseline characteristics of North West SAPMTCTE survey participants ................................ 50
Table 16 Baseline characteristics of Western Cape SAPMTCTE survey participants ........................... 54
Table 17 Infant feeding practices amongst HIV exposed infants over the past 8 days by province .... 59
FIGURES
Figure 1 Using ELISA at biomedical marker to identify HIV-exposed infants......................................... 2
Figure 2 Design phase and data collection flow diagram for the cell-phone data collection system ... 7
Figure 3 Example of SAPMTCTE Mobile Researcher web-based interface ............................................. 7
Figure 4 2010 SAPMTCTE study profile ................................................................................................ 12
Figure 5 PMTCT service uptake (PMTCT cascade) in South Africa ....................................................... 23
Figure 6 PMTCT service uptake (PMTCT cascade) in the Eastern Cape ............................................... 26
Figure 7 PMTCT service uptake (PMTCT cascade) in the Free State .................................................... 30
Figure 8 PMTCT Service Uptake (PMTCT cascade) in Gauteng ............................................................ 34
Figure 9 PMTCT service uptake (PMTCT cascade) in KwaZulu-Natal ................................................... 38
Figure 10 PMTCT service uptake (PMTCT cascade) in Limpopo .......................................................... 41

vi
Figure 11 PMTCT service uptake (PMTCT cascade) in Mpumalanga ................................................... 45
Figure 12 PMTCT service uptake (PMTCT cascade) in the Northern Cape .......................................... 49
Figure 13 PMTCT service uptake (PMTCT cascade) in the North West Province ................................. 53
Figure 14 PMTCT service uptake (PMTCT cascade) in the Western Cape Province ........................... 57
Figure 15 Maternal antenatal HIV prevalence by province in South Africa......................................... 61
Figure 16 NHLS Early Infant Diagnosis PCR <2 months old 2008-2010 (from Sherman, 2010) ........... 62
Text Box 1: Eastern Cape infant HIV exposure and MTCT………………………………………………………………...26
Text Box 2: Free State infant HIV exposure and MTCT……………………………………………………………………..29
Text Box 3: Gauteng infant HIV exposure and MTCT………………………………………………. ………………………33
Text Box 4: Kwa-Zulul Natal infant HIV exposure and MTCT……………………………………………………………37
Text Box 5: Limpopo infant HIV exposure and MTCT……………………………………………………………………….41
Text Box 6: Mpumalanga infant HIV exposure and MTCT…………………………………………………………………44
Text Box 7: Northern Cape infant HIV exposure and MTCT………………………………………………………………48
Text Box 8: North West infant HIV exposure and MTCT……………………………………………………………………52
Text Box 9: Western Cape infant HIV exposure and MTCT……………………………………………………………….56
vii
PRIMARY CONTACTS/PRINCIPAL INVESTIGATORS
Ameena Goga, MD
Paediatric Epidemiologist
Medical Research Council, SA
Address: 1 Soutpansberg
Road, Pretoria, 0001,
Phone: +2782 302 3168
e-mail:
Thu-Ha Dinh, MD, MS
Medical Epidemiologist
Centers for Disease Control and
Prevention
Address: 1600 Clifton Rd
Atlanta, 30333
Phone: +1 404 639 8618
+2712 424 9000
e-mail: [email protected];
Debra Jackson, RN MPH DSc
Professor (Extraordinary)
School of Public Health
Univ. of the Western Cape
Address: PBX17 Robert
Sobukwe Road, Bellville 7535
Phone: +2783 327 7331
e-mail:
ACKNOWLEDGEMENTS
CDC and PEPFAR for technical and financial support.
UNICEF for financial support.
National Department of Health and Global Fund.
NICD/NHLS for conducting the validation ELISA testing on DBS samples; for providing
consumables for the survey and for performing all the DBS ELISA and PCR testing. In
particular we thank Ms Beverly Singh. Ushimta Patel and Ewalde Cutler.
Ms Tsakani Mhlongo for training data collectors on infant blood drawing procedures.
Provincial Departments of Health.
District and facility managers who provided support for the SAPMTCT Evaluation.
Mothers and their infants who participated in the survey.
MRC survey supervisors and data collectors.
WHO for protocol support.

viii
ABBREVIATIONS AND ACRONYMS
AIDS Acquired Immunodeficiency Syndrome
ANC Antenatal Care
ART Antiretroviral therapy
ARV Antiretroviral (drug)
CDC Centers for Disease Control and Prevention
DBS Dried Blood Spot
DHIS District Health Information System
DHS Demographic and Health Survey
DNA PCR DNA-based Polymerase Chain Reaction Test
EBF Exclusive Breast-Feeding
EID Early Infant Diagnosis
ELISA Enzyme-linked Immunosorbent Assay
HIV Human Immunodeficiency Virus
HSRC Human Sciences Research Council
HSRU Health Systems Research Unit of the Medical Research Council
IMCI Integrated Management of Childhood Illnesses
MCH Maternal and Child Health
MDG Millennium Development Goals
MPH Masters in Public Health
MRC Medical Research Council
MTCT Mother-to-child transmission (of HIV)
NDOH National Department of Health
NHLS National Health Laboratory Service
NICD National Institute for Communicable Diseases
NRF National Research Foundation
NSP National Strategic Plan, South Africa
PEPFAR President’s Emergency Plan For AIDS Relief
PITC Provider-Initiated Testing and Counseling
PSU Primary Sampling Unit
PMTCT Prevention mother-to-child transmission of HIV
RtHC Road to Health Chart
SA South African
SAPMTCTE South African Prevention of Mother-to-Child Transmission Evaluation
Sd-NVP Single-dose Nevirapine
SoPH School of Public Health, University of the Western Cape
UNICEF United Nations Children’s Fund
UWC University of the Western Cape
WHO World Health Organisation

ix
EXECUTIVE SUMMARY
Introduction
The first national evaluation of the South African PMTCT programme was conducted between June
and December 2010, during a period of transition between 2008 and 2010 guidelines to prevent HIV
transmission from mother to child (PMTCT). The 2008 South African (SA) PMTCT guidelines offered
maternal AZT prophylaxis from 28 weeks gestation and through labour and single dose nevirapine
(sdNVP) or ART if CD4≤250 cells/µl or Stage IV disease. All infants received single dose nevirapine
and 7 (or 28) days AZT.1 The 2010 SA PMTCT guidelines offered maternal AZT prophylaxis from 14
weeks with FDC/TDF in labour and sdNVP or ART if CD4≤350 cells/µl or Stage III/IV disease.2 All
infants received six weeks nevirapine or for one week after breastfeeding stops.
The detailed report is available from http://www.mrc.ac.za/healthsystems/reports.htm . In summary
a total of 10 820 eligible infants were enrolled; 10 735 interviews were conducted and 10 178 (94%)
DBS were drawn and analysed.3 The national weighted infant HIV-exposure prevalence was 32.0%
(95% CI 30.7-33.3%). The national weighted MTCT rate measured at 4-8 weeks of infant age was
3.5% (95% CI 2.9-4.1%). Provincial MTCT ranged between 1.4% and 5.9%. Among mothers who
reported being HIV negative, 4.1% delivered HIV-exposed infants. Of all participating mothers 98.8%
(95% CI 98.5-99.0%) received an HIV test during pregnancy and of these 98.6% (95% CI 98.4-98.9)
received their HIV test results. Of the reported HIV-positive mothers 78.3% had a CD4 cell count
done during pregnancy and 91.8% received either maternal highly active antiretroviral therapy (ART)
or mother/baby antiretroviral (ARV) prophylaxis. Amongst known HIV exposed infants 89% had
received infant feeding counselling and only 35.1% intended to access early infant diagnosis services
at the six weeks immunisation visit. Among all HIV exposed infants 20% were exclusively
breastfeeding, 62% formula feeding and 18% mixed feeding in the 8 days prior to the interview.
The 2011 survey was the second national PMTCT evaluation to determine population-level PMTCT
effectiveness, and the first national evaluation of WHO PMTCT Option A.
Aims and Objectives
We aimed to conduct a national facility-based survey to monitor the effectiveness of the South
African PMTCT programme. Our primary objective was to measure rates of early MTCT of HIV at six
weeks postpartum. Our secondary objective was to estimate coverage of key PMTCT interventions
and services (e.g., HIV testing, CD4 cell count testing, infant antiretroviral (ARV) prophylaxis, infant
feeding counselling).

x
Methods
The methods for the 2011 six weeks component was the same as in 2010.3 The sampling frame and
selected facilities were identical between 2010 and 2011, except for the 10 clinic replacements due
to shifting of services or clinic closure for maintenance.
A cross-sectional facility-based survey was conducted at public primary health care/community
health centres (PHC/CHC) offering immunisation services in all nine provinces. This methodology was
chosen as uptake of six-week immunisation in South Africa, was >99%, according to the 2007 District
Health Information System. The survey aimed to capture known and unknown HIV-exposed infants,
as well as PMTCT participants and non-participants. A biomedical marker (HIV enzyme-linked
Immunosorbent Assay (ELISA) tests to identify HIV antibodies) was used to identify HIV-exposed
infants from infant dried blood spot (DBS) specimens. All DBS specimens reactive on ELISA testing
were sent for DNA-based polymerase chain reaction tests (DNA PCR) to determine infant HIV
infection status.
Infants aged 4-8 weeks attending PHC/CHC facilities for their six week immunisation were included.
Hospitals and mobile clinics, very sick infants or infants aged <4 weeks or >8 weeks were excluded.
The immunisation data from the 2007 District Health Information System (DHIS) were used to
quantify the number of children that could be expected within facilities over a period of time and
then stratify by size. Sample size was calculated so that valid national and provincial level estimates
of MTCT could be ascertained. This resulted in between 34-79 facilities per province, 580 in total.
Facilities were randomly selected within strata with probability proportional to size (3 strata).
Caregiver/infant pairs were consecutively or randomly selected from facilities (depending on facility
size). Interviews were conducted and infant DBS drawn after receiving consent from caregivers for
study participation. Mothers and infants were referred into HIV care, as appropriate. Data were
collected using low cost cell phones and interview data were uploaded real time into a web-based
database console. Analysis was weighted for sample realisation and at provincial level proportional
to the live birth distribution of South Africa.
Results
In 2011 a total of 11 317 infants were screened from 580 facilities. Of these 601 did not meet
eligibility criteria, 143 refused to participate and 158 had incomplete consent. 10 475 infants were
deemed eligible and enrolled into the survey. 330 caregivers refused infant DBS and 39 had
insufficient DBS that could not be analysed. Thus 10 106 DBS were analysed.
The national weighted infant HIV-exposure prevalence was 32.0% (95% CI 30.7-33.3%).
The national weighted MTCT rate measured at 4-8 weeks of infant age was 2.7% (2.1-3.2).
The MTCT rate across provinces ranged from 1.98% to 6.06%..
Among mothers who reported being HIV negative, 3.9% had HIV-exposed infants.
Of all women participating 98.3 (95%Cl 98.0-98.6) received an HIV test during pregnancy and
of these 99.4 (95% Cl 97.7-99.2) got their HIV test results.

xi
Amongst self-reported HIV-positive mothers:
o 77.4% had a CD4 cell count done during pregnancy
o 93.9% received either maternal highly active antiretroviral therapy (ART) or
mother/baby antiretroviral (ARV) prophylaxis. 38.5% intended to access early infant
diagnosis services at the six week immunisation visit and
o 93.3% reported receiving infant feeding counselling.
Amongst self-reported HIV-positive women, 35.5 (33.1-38.0%) were exclusively
breastfeeding, 47.1% (44.8%-49.3%) avoided breastmilk and 17.4% (15.6-19.1%) were
mixed feeding in the 8 days prior to the interview.
Amongst self-reported HIV negative women 43.6% (41.6-45.7) were exclusively
breastfeeding, 10.1% (9.3%-11.0%) avoided breastmilk and 46.2% (44.2-48.3%) were mixed
feeding in the 8 days prior to the interview.
Conclusions and Recommendations
1. The national PMTCT survey found a 2.7% national MTCT rate in pregnancy and intrapartum
with a greater than 3-fold differential range of rates across the nine provinces (1.98% to
6.06%.).
2. Maternal HIV acquisition since the last HIV test was potentially high at 3.9% and therefore
repeat HIV testing at 32 weeks pregnancy, promotion of condom usage and couple testing is
critical. Further data should collected to assess the contribution of false negative rapid test
results to maternal potential HIV acquisition. In addition, more work is required to improve
the quality of rapid HIV testing in the field.
3. Uptake of PMTCT services is high, with more than 98% of women getting HIV tested during
pregnancy and 93.9% of HIV-positive mothers receiving ARV treatment or prophylaxis.
However CD4 (77.4%) testing and early infant diagnosis (EID) (38.5%) uptake are lower and
represent on-going missed opportunities in the PMTCT programme.
4. Early infant HIV testing uptake is high if offered to all infants (98.28%) at six-week
immunisation visits, indicating that EID strategies that routinely offer infant HIV testing only
to known HIV-exposed infants should be reviewed.
5. Given the measured MTCT rate and continued reduction in MTCT compared to 2010 (3.5%)
virtual elimination of paediatric HIV infection is possible with continued intensified effort.
However, postnatal transmission after 6 weeks also needs to be examined to assess
achievement of <5% MTCT at 18 months of infant age.
6. Exclusive breastfeeding was higher than previously reported, but was still low amongst self-
reported HIV positive and negative women despite the adoption of the Tshwane Declaration
of Support for Breastfeeding in August 2011.

xii
DEFINITIONS Caregiver The person who feeds and looks after the child most of the week. This
includes parents, legal guardians, family members, nannies or friends
who routinely feed, bath, change nappies, or in particular reference to
this study, bring the child for routine health services.
The Consortium Health Systems Research Unit (HSRU) of the Medical Research Council
(MRC) and School of Public Health of the University of the Western Cape
(SoPH, UWC).
Early (4-8 weeks) HIV
transmission rate among
HIV-exposed infants
Number of DNA PCR positive and ELISA positive infants divided by the
number of ELISA positive infants at 4-8 weeks.
Health care personnel Health care providers and health care workers.
Health care provider
Any person providing health services in terms of any law, including in
terms of the:
Allied Health Professions Act, 1982 (Act No.63 of 1982),
Health Professions Act, 1974 (Act No. 56 of 1974),
Nursing Act, 2005 (Act No. 33 of 2005),
Pharmacy Act, 1974 (Act No. 53 of 1974), and
Dental Technicians Act, 1978 (Act No. 19 of 1979).
Health care worker Any person who is involved in the provision of health services to a user,
but is not a health care provider. This includes lay counselors and
community caregivers.
HIV-exposed infant An infant born to a known HIV-positive mother and/or having a positive
HIV antibody test result using DBS ELISA. Infant HIV exposure prevalence
serves as an indirect marker of maternal HIV prevalence.
HIV-infected infant An HIV-exposed infant having a positive HIV DNA PCR result.
HIV-uninfected infant An HIV-exposed infant having a negative HIV DNA PCR result. (Note: In
many cases, there is on-going risk of postnatal transmission through
breastfeeding, so an early DNA PCR result indicates infection status at
the time of the test, but not the final infection status).
HIV-positive mother Defined for this survey as mothers whose infants have a positive DBS
ELISA.
HIV status unknown Refers to people (including children) who have not taken an HIV test or
who do not know the result of their test.
Infant A child from birth to 12 months of age.
Infant HIV infection
prevalence
Proportion of confirmed HIV-positive (infected) infants among all infants
tested during the study period, measured as number of positive DNA PCR
xiii
infant DBS divided by the total number of ELISA samples tested. In this
study infant HIV infection prevalence at 6 weeks will be measured in
infants age 4 to 8 weeks, who are attending routine immunisation clinic.
It will be measured as a point prevalence with the numerator defined as
those infants with a positive HIV DNA PCR test and the denominator of all
infants tested using HIV ELISA on dried blood spots in the study.
Maternal HIV prevalence Number of positive (infant) DBS ELISA divided by total number of ELISA
samples tested.
Maternal HIV
Incidence/Maternal
potential HIV acquisition
during pregnancy
The number of positive infant DBS ELISA among mothers reporting an
HIV-negative status during the interview divided by total number of
mothers reporting an HIV-negative status during the interview. This
indicator is likely a combination of the following scenarios: (i) mothers
who do not wish to admit positive status and report being HIV negative;
(ii) mothers who were tested during the window period; (iii) poor
quality control or performance of rapid tests in the field causing false
negative results at antenatal care (ANC) on HIV-infected
women. Reported field sensitivities are as low as 87% to 95% depending
on the rapid test used; and (iv) true acquisition of HIV after the last HIV
test.
Mother-to-child
transmission (MTCT)
Transmission of HIV from an HIV-positive woman to her infant during
pregnancy, delivery or breastfeeding. The term is used because the
immediate source of the infection is the mother, and does not imply
blame on the mother.
MTCT rate Defined for this survey as a numerator of HIV-positive infants (PCR
positive) and denominator of HIV-exposed infants (infant ELISA antibody
positive).
Routine offer of
counselling and testing
HIV testing that is routinely offered to all ANC clients. Health care
personnel provide group information first, followed by individually
offering HIV tests. The patient/client has the option to decline testing at
any stage of this process. The patient/client receives post-refusal
counselling or post-test counselling as appropriate.
Transmission in PMTCT
programme
Number of positive DNA PCR and positive ELISA divided by the number
of ELISA positive mothers who recall taking ARV prophylaxis or ART
during pregnancy/delivery.
Transmission in those not
participating in PMTCT
Programme (missed
opportunities)
Number of positive DNA PCR and positive ELISA divided by number of
mothers who do not recall taking ARV prophylaxis or ART during
pregnancy/delivery.

1
1. INTRODUCTION
The South African National Strategic Plan on HIV and AIDS and STIs (NSP), 2011-2016 aims to reduce
HIV transmission from mother to child to less than 2% at six weeks after birth and to less than 5% at
18 months post-delivery by 2016.4 The NSP acknowledges that strengthening the management,
leadership and coordination of the PMTCT programme and ensuring its integration with maternal
and child health services is critical.
In 2001 South Africa started implementing a programme to prevent HIV transmission from mother-
to-child at 18-pilot sites. The first interventions included single-dose nevirapine (Sd NVP) during
labour for the mother and to the baby within 72 hours of delivery; modified obstetric practices;
infant feeding counselling and the provision of free commercial infant formula to HIV-positive
mothers who avoided breastfeeding (NDOH, 2001).5 PMTCT interventions were scaled up in 2002
and in 2008 the national antiretroviral regimens for pregnant women were improved to dual therapy
(AZT from 28 weeks with Sd-NVP at the outset of labour for pregnant women and Sd-NVP with AZT
for baby).1
In 2010, PMTCT interventions were further modified as shown in Table 1 (NDOH/SANAC, 2010).2 The
2010 modifications included routine HIV testing and counselling for pregnant women, dual therapy
to prevent MTCT of HIV, ART for pregnant women with CD4 cell count ≤350 cells/µl, postnatal infant
prophylaxis for breastfeeding HIV-positive women and intensified efforts to integrate PMTCT
services into routine maternal and child health (MCH) services. These efforts are to meet the NSP
targets of reducing the MTCT rate of HIV to less than 5% by 2011 and to meet the 4th and 6th
Millennium Development Goals (MDGs) (i.e., ‘reduce by two thirds, between 1990 and 2015, the
under-five mortality rate’ and ’have halted by 2015 and begun to reverse the spread of HIV/AIDS’)
(UN, 2011).
The 2011 SAPMTCTE is the first evaluation of PMTCT Option A and was started 16 months after the
adoption of the 2010 PMTCT guidelines (PMTCT Option A) and during the month when South Africa
changed its infant feeding policy to exclusive breastfeeding for six months and continued
breastfeeding thereafter regardless of HIV status following the Breastfeeding Summit.6 However the
provision of free commercial infant formula milk was phased out between August 2011 and April
2012; thus during the 2011 survey free commercial infant formula milk was still provided as part of
the PMTCT programme.
The 2011 SAPMTCTE aimed to monitor the 2010-2011 trend in early effectiveness of the South
African National PMTCT programme. The primary objective of the 2011 SAPMTCTE was to measure
rates of early MTCT of HIV at 4-8 weeks postpartum. The secondary objective was to periodically
estimate uptakeof key PMTCT interventions and services (e.g., HIV testing, CD4 cell count testing,
infant ARV prophylaxis, infant feeding counselling).

2
2. METHODOLOGY
2.1 Survey Design and Justification
A cross-sectional facility-based survey, using a biomedical marker to determine MTCT rate, was
conducted. The survey was conducted among caregiver-infant pairs who presented at their local
primary health care facility for their infant’s six-week immunisation (1st DTP dose) visit. South Africa
reports >95% coverage of six week immunisation (1ST DTP dose) (WHO, 2011), making these clinics
an ideal catchment point for young infants -- of known or unknown HIV exposure status. This
provided a convenient sample to determine overall PMTCT effectiveness with relatively limited
selection bias.
This methodology has been proven effective in a South African context. Based on the approach
recommended by Rollins et al. 7, 8 we used a biomedical marker to identify infants exposed to HIV.
Chantry et al.9 found that sero-reversion for ELISA in HIV-exposed infants was not seen prior to 17
weeks of age suggesting that most, if not all, infants aged 4-8 weeks will still have maternal
antibodies in their bloodstream. In addition, rapid tests performed on whole blood are less sensitive
than HIV ELISA tests so that those performed on similar sample as this study, i.e. small volume of
whole blood, would rarely demonstrate sero-reversion before 2 months of age.10 Therefore, DBS HIV
ELISA would be expected to detect the vast majority of HIV-exposed infants. This means that
screening infants for the presence of HIV antibody would be a direct measure of infant HIV exposure
and an indirect measure of maternal HIV infection prevalence.
Figure 1 Using ELISA as a biomedical marker to identify HIV-exposed infants using HIV antibodies
Mom's HIV antibody
Infant's HIV antibody

3
This evaluation thus aimed to provide:
1) A valid estimate of MTCT and HIV infection prevalence in children aged 4-8 weeks, and
2) A reasonable estimate of coverage of key PMTCT programme indicators through 6 weeks
postpartum.
2.2 Study Population and Inclusion/Exclusion Criteria
The study population comprised infants aged 4-8 weeks and their caregivers visiting public health
facilities for the infant’s 1st DTP dose during the study period.
Inclusion Criteria
Study participants included 4-8 week old infants attending clinic for 1st DTP immunisation.
Caregivers had to consent to participation (consent for maternal or caregiver interview and/or infant
DBS).
Exclusion Criteria
Severely ill infants needing emergency medical care or urgent referral to the next level of care (e.g.,
infants who are vomiting everything or have convulsions; are lethargic or unconscious; or have
severe pneumonia or severe dehydration) were excluded from the study.
2.3 Sampling
Sampling Frame
The public health facilities were stratified as: < 130, 130-300 and >300 immunisations per year, and
data were extracted from the 2007 South African DHIS (Personal Communication C Hedberg, 2009).
A strategic decision was made to exclude the small facilities (<130 immunisations per year) from the
formal sampling frame. The 2008 national antenatal maternal HIV prevalence estimate of 29%
(NDOH, 2009) was used as the cut-off point for classifying facilities as above or below national
average for antenatal HIV prevalence.11 This stratification was only applied to facilities in the large
stratum (>300 immunisations per year). A total of 23 strata across province, facility size and
maternal HIV prevalence were utilised in the survey sampling frame and were sorted by province,
size and maternal HIV prevalence.
Sample Size
ANC maternal HIV prevalence11 and estimated MTCT rates from a KwaZulu-Natal survey using similar
methodology (Personal communication N. Rollins, unpublished data, 2009) were used to determine
the sample size for each province. Specifying relative precisions of 30% to 50% for the expected
MTCT rate across provinces plus a design effect of 2 indicated that a total sample size of 12 200
infant DBS specimens were needed. The sample size across provinces ranged from 1 800 (Gauteng)
to 700 (Northern Cape).

4
Sampling
Stratified two-stage sampling was used. In the first stage, facilities (Primary sampling units - PSUs)
were randomly sampled proportional to size (PPS) within each stratum. The method operated under
the without-replacement-type selection12 (Lehtonen & Pakhinen, 1994). At the second stage a fixed
number of infants per a facility was sampled. The fixed number was the median number of infants
expected within the sampling window (three weeks) across the population of facilities within the
stratum as determined from the detailed information of the sampling frame above. The fixed
number of infants sampled in each facility within a stratum ensured a self-weighting sample. A
sampling window of 3 weeks was used to realize the required sample. (Appendix#1)
2.4 Data Collection Tools
Data were gathered using a questionnaire adapted from several validated tools (Rollins et.al., 2007
& 2009; HSRC, undated; Nyblade & MacQuarrie, 2006; Tlebere et.al., 2007; Jackson et al. 2007). The
questionnaire included information on maternal age, parity, socio-economic status, antenatal care,
HIV testing, maternal HIV status, PMTCT care during pregnancy and delivery, infant feeding
counselling, birth information, infant feeding practices, infant weight; immunisations, postnatal visits
and illness since birth. Fathers/legal guardians/non-maternal caregivers were administered a shorter
form of the questionnaire that excluded ANC and PMTCT information.
The study tool was piloted in the Western Cape and KwaZulu-Natal provinces to test it in English and
at least one other official/local languages. Approximately 5-10 participants were administered the
study tool in each language as part of the pilot. The primary objective was to test the flow of
questions and basic understanding by the participants. The cell phone technology used for data
collection, including skips and field data entry, was also examined and tested. Adjustments to the
tool and/or cell phone data entry platform were made after the pilot as necessary.
2.5 Ethical Considerations
Written, signed, informed consent for all procedures in the study was obtained from each eligible
caregiver for the interview and DBS sampling (separately). Informed consent was in the preferred
language of the participants. The information sheet was written in plain lay words that could be
easily understood by participants. A confidential Study ID was given to each participant and inserted
in consent forms, lab forms and questionnaire for the purpose of data linking and auditing, and to
provide the infants’ blood test results to mothers or legal guardians. Care was taken to ensure that
HIV-infected mothers who refused the study understood that their infant could be tested without
participating in the study.
Ethical approval was obtained from the Medical Research Council and from each of the nine
provincial research ethics committees. Ethical approval was also granted from the United States
Centers for Disease Control and Prevention Atlanta.

5
2.6 Data Collection Methods
Data collection commenced at different times in each province (Table 1). All data collection was
completed by 16 March 2012.
Table 1 Data collection start and end dates in each province
PROVINCE
2011 Survey Mop-up - 2011
Data collection
start date
Data
collection end
date
Mop-up
start date (2012)
Mop-up
end date (2012)
Eastern Cape 22 Aug 15 Dec - -
Free State 15 Aug 15 Dec - -
Gauteng 15 Aug 15 Dec 30 Jan 24 Feb
KwaZulu Natal 15 Aug 15 Dec 13 Feb 16 March
Limpopo 15 Aug 15 Dec - -
Mpumalanga 15 Aug 15 Dec 30 Jan 10 March
Northern Cape 15 Aug 15 Dec - -
Northwest 15 Aug 15 Dec - -
Western Cape 15 Aug 15 Dec - -
TOTAL 15 Aug 15 Dec 30 Jan 16 March

6
Enrolment
Data collectors recruited mothers/caregivers from the PHC/CHC waiting room during immunisation
days. Data collectors introduced themselves and the study verbally and in written form using a
standardised information sheet. If the mother agreed to be interviewed, the interview was
conducted in a private location. Mother/Infant pairs attending the sampled facilities to receive the
infants’ DPT first dose vaccination were approached to enroll in the study. A screening questionnaire
was administered to determine eligibility and full informed consent forms were completed.
Cell Phone Technology for Data Collection
Electronic questionnaires were loaded on low-cost mobile phones using the Mobile Researcher
software management solution. The Mobile Researcher system consists of three components: the
handset, the web interface (data transport system) and web-based research console (Figure 2). The
handset is the device on which the questionnaires are entered. Minimum handset functionality is
ensured since phone is WAP (Wireless Application Protocol) enabled. The data is transferred via the
GPRS (General Packet Radio Services) network using the WAP platform on the mobile phone. The
web-based management console is a secure data capture centre that has controlled access.
Questionnaires were uploaded as they were completed to the central web management console and
then removed from the phone, while fieldworkers were in an area of mobile reception. In areas
where there was no mobile network reception, the questionnaire was stored on the phone until
reaching an area with adequate mobile network coverage when data would be automatically
uploaded. The questionnaire responses were available on the web-based console every minute,
allowing for real-time monitoring of data collection progress and analysis (Figure 3).

7
Figure 2 Design phase and data collection flow diagram for the cell-phone data collection system
Figure 3 Example of SAPMTCTE Mobile Researcher web-based interface

8
2.7 Laboratory Methods
The National Institute for Communicable Diseases, a division of the South African National Health
Laboratory Service (NHLS), conducted the testing. Questionnaires and DBS specimens were linked
using unique study identification numbers and lab order numbers. DBS specimens collected from
enrolled and consented infants were tested for HIV by means of a laboratory HIV ELISA test
(Genscreen HIV antibody assay). In cases where this was reactive (i.e., identified an infant born to an
HIV-positive mother), a qualitative HIV PCR (Cobas AmpliPrep/Cobas TaqMan HIV-1 Qual test version
1.0, Roche Diagnostics, Branchburg, NJ) was performed to determine whether the infant was
currently HIV-positive. In the case of a known HIV-positive mother, the study DBS specimens and
testing replaced the expected routine EID testing. All results were sent to clinic of origin and
returned to mother at either 10 or 14 week immunisation visit.
All aspects of the project were carried out according to strict standard operating procedures (SOPs),
and testing was conducted under conditions of good laboratory practice. Specimens received in the
laboratory were reviewed against the tracking lists/request form for correctness and adequacy of
specimens. Each specimen received unique bar-coded identifiers for tracking and data extraction.
Rejected specimens were accompanied by a rejection form with specified reasons and referred to
field staff for correction. A tracking list of rejected specimens was held by the lab in electronic
format. Specimens were tested and results entered into a LIMS (DISA) system; all results had three
levels of review.
The algorithm for testing was decided based on the outcome of initial dual ELISA testing. All reactive
specimens and every 10th non-reactive specimen were tested using a second ELISA, Vironostika
(bioMérieux, France). A total of 690 specimens were included in the analysis. The agreement
between the two tests was 99.4% and the sensitivity and specificity of the Genscreen assay was
99.7% and 99.2% respectively. Based on these results it was decided that a single ELISA test,
Genscreen, be used. All reactive ELISA tests were referred for DNA testing. In the case of a
laboratory ELISA equivocal result, HIV PCR testing was performed as a routine.
The procedure for qualitative PCR testing was by automated Ampliprep/Taqman v1.0 technology
(Roche). Evaluation of HIV PCR performance on DBS has demonstrated a sensitivity and specificity of
99.7% and 100% respectively.13 The data extraction of ALL ELISA reactive results was by location
code and the referral of spreadsheet to the PCR testing lab. ALL HIV PCR results were extracted and
individual reports generated by name of infant for return to the facility where the infant was tested.
The reports forms were standardised and had all the required information based on the original
request form. All assays used for surveillance were validated and/or verified prior to use, accredited
and the performance monitored by proficiency testing. In the case of discordant results between the
mother’s self-reported result and the laboratory result an algorithm using the two ELISAs, Western
blot and PCR was performed on the DBS to exclude lab error or false positive laboratory results.

9
The data was extracted to exclude personal patient identifiers and emailed to the researchers. The
extracted data was in Excel format. Databases were validated and confirmed at two levels before
release. The Excel spreadsheet was then merged with the questionnaire database fortnightly.
Laboratory data were sent electronically from the laboratory. Tracking logs (study IDs) were used to
link questionnaire data and blood test results. The tracking log was managed by the logistics
manager.
Prior to the six-week survey, a study was conducted to validate the use of screening and
confirmatory third generation ELISAs on DBS. This work was headed by Professors Gayle Sherman
and Adrian Puren, and the samples and funding used for this validation study are part of a separate
protocol.
2.8 Quality Control of Field Work
Every attempt was made to minimise errors which may result in variation in the collected data
contributing to bias in the results. Quality control (QC) was defined as the operational procedures
undertaken within the survey, as prescribed by the survey SOPs, to verify that the survey activities
(e.g., interviews, obtaining informed consent forms, pre-test counselling, DBS collection, recording
data, reporting data) were conducted in accordance with the defined quality standards. The SOPs
focused on QC activities done by the field worker, field worker supervisor, quality control officer and
the central team. QC activities aimed to improve the quality and validity of the collected data by:
Identifying factors that may affect the accuracy and reliability of the data and addressing the
identified factors;
Preventing and correcting errors in the collection of data; and
Ensuring that field activities align with the study SOPs.
2.9 Data Management
Data captured on the phones were protected with a write-only security model. Fieldworkers could
modify and review data while the interview was in progress. Captured data was encoded and stored
on the device in the Record Management system which ensured that only the Mobile Researcher
application could access the data.
The data was transferred securely to the web console, which uses 128-bit strength encryption. Data
storage and back up protocols are compliant to enterprise standards and database servers run RAID
to ensure redundancy in case of disk failure.
The uploaded data was reviewed daily to ensure that all fieldworkers were submitting responses in
accordance to scheduled work plans. The work plans were developed to achieve the required
number of DBS per facility and key questions were identified in the database to estimate and track
the collection of blood sample progress.

10
Questionnaire data was maintained by Mobile Researcher and exported to Excel for data analysis.
Anonymised laboratory data (Study ID only) were exported to Excel for merging with questionnaire
data. Consent verification from hard copy consent forms were entered into Excel and double
checked. Interim data analysis was completed during the course of the study. Data from
questionnaire, laboratory results and consent verification were all merged and cross-checked. Data
without consent verification was not included for analysis. Duplicates and other inconsistencies
across data sets were checked and cleaned according to data standards. Out-of-range and data
consistency checks were completed as a component of initial data analysis.
2.10 Data Analysis
Sample Realisation
A total 572 of the 585 sampled clinics were included in final sample. Reasons for non-inclusion
included clinic closure (temporary or permanent) or no longer administering immunisations. The
overall realisation was 81% with three provinces having low realisation (Northern Cape, Eastern
Cape and Limpopo).
Sample Weights
Sample weights were calculated for the survey to adjust for differential sampling design across
provinces and the sample realisation (as outlined above). The data from provinces were weighted by
using the proportional distribution of number of life births observed in 2008 for South Africa over
provinces. The realisation weights were done at the district or provincial level depending on the
sampled size and realisation within strata. For Northern Cape and Eastern Cape the realisation
weighting was done at the provincial level. The realisation weights pertain to the per protocol
sample size.
A survey analysis was done which took into account the stratification, the different sampling stages
and the finite number of PSUs involved. A weighted analysis was done to obtain national estimates
as well as provincial estimates. The infant HIV infection prevalence was estimated at the national
population level and in the HIV exposed sub-population. These estimates all have 95% confidence
intervals. Design effects are also reported. The survey specification and analysis was done in SAS
version 9.2. Descriptive statistics of the demographic profile of the participants was done by
province and country-wide, accounting for the survey design and realisation.

11
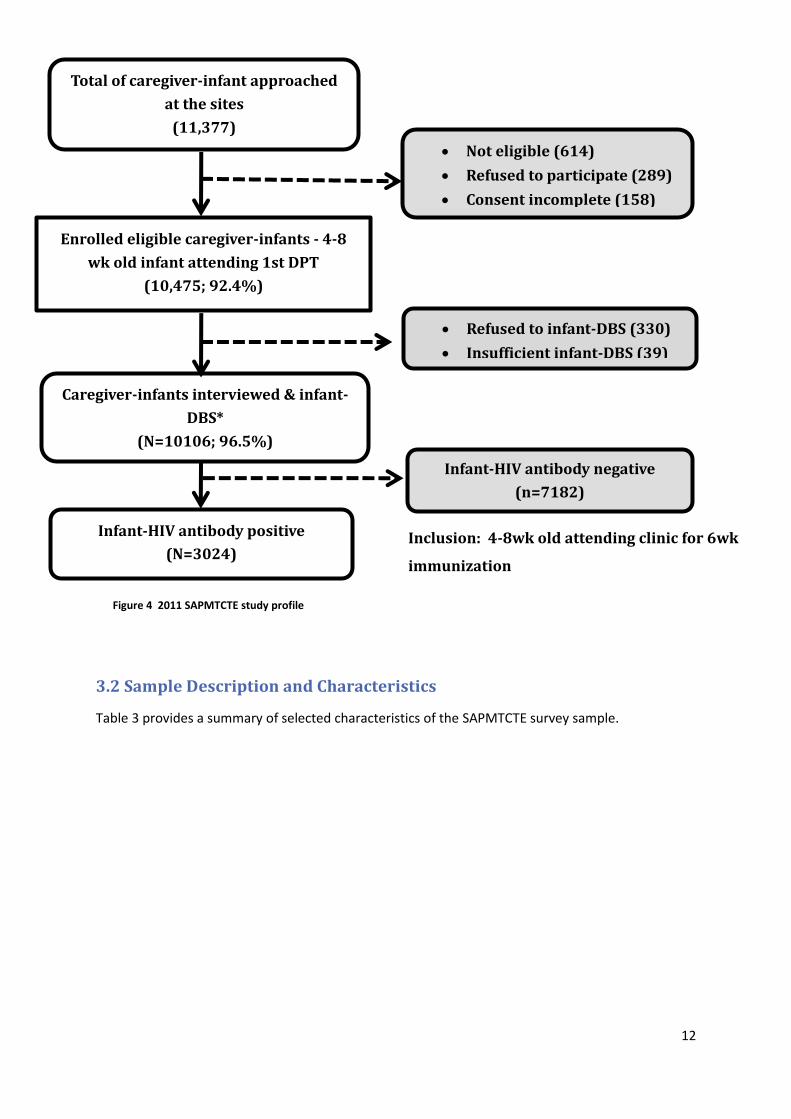
3. RESULTS
3.1 Sample Realisation and Survey Profile
Table 2 indicates the desired and actual sample size for questionnaire plus DBS sample and realised
sample size per province and nationally. All but three provinces realised at least 80% of sample.
Table 2 2010 SAPMTCTE desired and actual sample size by province
Province Desired
Sample Size (SS) Actual SS 2010
# (% Desired SS) Actual SS 2011 #(% Desired SS)
Eastern Cape 1400 776 (55%) 1194 (85%)
Free State 1300 1143 (88%) 1056 (81%)
Gauteng 1800 1735 (96%) 1607 (89%)
KwaZulu-Natal 1400 1224 (87%) 1052 (75%)
Limpopo 1400 1022 (73%) 1070 (76%)
Mpumalanga 1600 1286 (80%) 1210 (76%)
Northern Cape 700 444 (63%) 506 (72%)
North West 1200 1171 (98%) 1037 (86%)
Western Cape 1400 1381 (99%) 1374 (98%)
South Africa 12 200 10 182 (83%) 10106 (83%)
Weighting during analysis adjusted estimates in all provinces with lower than expected sample
realisation.
Figure 4 details the final study profile for the survey. Of the 11377 approached at the selected sites
614 (5.40%) did not meet the inclusion criteria, 289 (2.54%) refused participation and 158 (1.39%)
had incomplete consent forms. Thus 10475 (92.07%) were enrolled into the SAPMTCT Evaluation. Of
these 330 (3.15%) refused infant DBS and 39 (0.37%) had insufficient DBS. Thus 10106 (88.83% of
infants screened) had valid interviews and DBS and were included in this analysis
.
12
3.2 Sample Description and Characteristics
Table 3 provides a summary of selected characteristics of the SAPMTCTE survey sample.
Figure 4 2011 SAPMTCTE study profile
Enrolled eligible caregiver-infants - 4-8
wk old infant attending 1st DPT
(10,475; 92.4%)
Caregiver-infants interviewed & infant-
DBS*
(N=10106; 96.5%)
Refused to infant-DBS (330)
Insufficient infant-DBS (39)
Infant-HIV antibody positive
(N=3024)
Not eligible (614)
Refused to participate (289)
Consent incomplete (158)
Total of caregiver-infant approached
at the sites
(11,377)
Infant-HIV antibody negative
(n=7182)
Inclusion: 4-8wk old attending clinic for 6wk
immunization

13
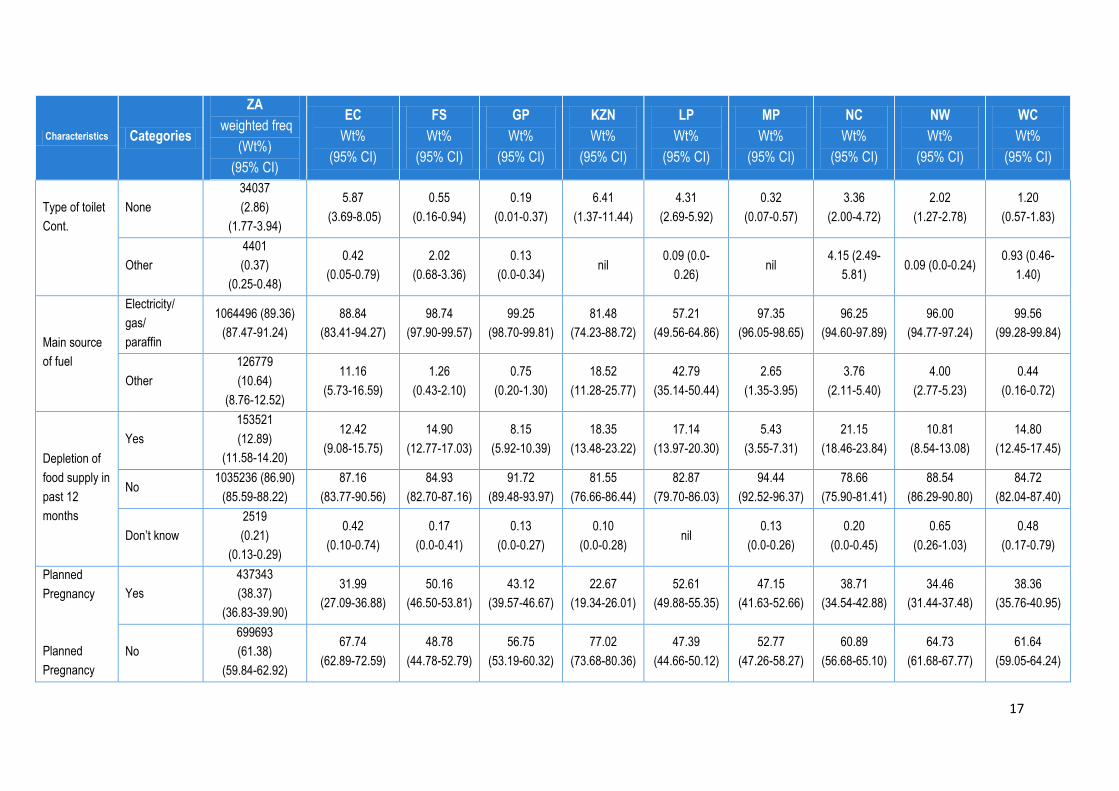
Table 3 Selected socio-demographic observations of 2011 SAPMTCTE Key: ZA: South Africa EC: Eastern Cape FS: Free State GP: Gauteng KZN: KwaZulu-Natal LP: Limpopo MP: Mpumalanga NC: Northern Cape NW: North West WC: Western Cape
Characteristics Categories
ZA
weighted freq
(Wt%)
(95% CI)
EC
Wt%
(95% CI)
FS
Wt%
(95% CI)
GP
Wt%
(95% CI)
KZN
Wt%
(95% CI)
LP
Wt%
(95% CI)
MP
Wt%
(95% CI)
NC
Wt%
(95% CI)
NW
Wt%
(95% CI)
WC
Wt%
(95% CI)
Relationship
of interview to
child
Mother 1156201 (97.02)
(96.67-97.36)
94.05
(92.53-95.58)
96.50
(95.66-97.35)
98.44
(97.97-98.92)
96.52
(95.38-97.66)
96.54
(95.54-97.54)
97.65
(96.97-98.34)
98.62
(97.91-99.32)
97.35 (
96.64-98.07)
97.29
(96.58-98.01)
Father
1671
(0.14)
(0.07-0.21)
0.08
(0.0-0.23)
0.08
(0.0-19)
0.19
(0.0-0.37)
0.07
(0.0-0.18)
0.09
(0.0-0.26)
0.29
(0.02-0.57) Nil
0.17
(0.0-0.36)
0.21
(0.01-0.40)
Grandmother/
grandfather
19494
(1.64)
(0.37-0.66)
3.85
(2.67-5.03)
2.09
(1.41-2.77)
0.93
(0.52-1.34)
1.66
(0.86-2.45)
1.96
(1.14-2.78)
0.96
(0.52-1.39)
0.59
(0.18-1.01)
1.76
(1.16-2.36)
1.01
(0.53-1.49)
Guardian/lega
l guardian
6171
(0.52)
(0.57-0.66)
1.34
(0.72-1.96)
1.16
(0.69-1.63)
0.25
(0.0-0.51)
0.39
(0.082)
0.56
(0.18-0.94)
0.53
(0.16-0.90)
0.79
(0.32-1.26)
0.28
(0.05-0.52)
0.29
(0.06-0.51)
Other
caregiver
8209
(0.67)
(0.51-0.87)
0.67
(0.29-1.06)
0.17
(0.0-0.35)
0.19
(0.0-0.37)
1.37
(0.63-2.10)
0.84
(0.34-1.35)
0.57
(0.24-0.91) Nil
0.44
(0.14-0.74)
1.21
(0.67-1.75)
Age of
mother
<15
14800
(1.24)
(1.04-1.45)
3.27
(2.41-4.12)
1.23
(0.70-1.77)
0.44
(0.14-0.73)
1.23
(0.58-1.87)
1.02
(0.48-1.58)
1.78
(1.15-2.40)
0.59
(0.17-1.01)
0.66
(0.30-1.01)
1.54
(0.96-2.12)
15-19
185919
(15.6)
(14.82-16.38)
21.61
(19.55-23.67)
13.90
(12.08-15.72)
10.89
(9.42-12.36)
19.51
(16.96-22.06)
13.83
(11.81-15.86)
19.92
(17.83-22.00)
15.8
(13.82-17.80)
14.35
(12.34-16.36)
13.47
(11.86-15.08)
20-24
359179
(30.14)
(29.16-31.12)
30.90
(28.50-33.30)
31.65
(29.60-33.70)
29.25
(27.28-31.22)
31.3
(28.12-34.50)
31.78
(29.08-34.47)
30.37
(27.70-33.04)
29.05
(26.45-31.65)
31.35
(29.21-33.49)
25.51
(23.50-27.52)

14
Characteristics Categories
ZA
weighted freq
(Wt%)
(95% CI)
EC
Wt%
(95% CI)
FS
Wt%
(95% CI)
GP
Wt%
(95% CI)
KZN
Wt%
(95% CI)
LP
Wt%
(95% CI)
MP
Wt%
(95% CI)
NC
Wt%
(95% CI)
NW
Wt%
(95% CI)
WC
Wt%
(95% CI)
Age of
mother cont.
25-29 304662 (25.56)
24.67-26.46)
21.61
19.89-23.32)
25.66
(23.55-27.76)
27.38
(25.53-29.23)
24.79
(21.92-27.65)
25.05
(22.52-27.57)
23.17
(21.12-25.19)
25.89
(23.49-28.28)
25.99
(23.56-28.42)
29.10
(27.01-31.12)
30-34
181495
(15.23)
(14.63-15.93)
12.48
(11.07-13.89)
17.14
(15.22-19.07)
17.30
(15.76-18.84)
13.31
(11.22-15.41)
15.51
(13.45-17.57)
13.91
(12.28-15.53)
17.59
(15.43-19.74)
13.01
(11.46-14.56)
17.77
(16.08-19.46)
35-39
112037
(9.40)
(8.80-10.00)
7.70
(6.38-9.03)
8.07
(6.75-9.40)
11.45
(10.04-12.86)
7.32
(5.73-8.90)
9.91
(7.87-11.94)
8.07
(6.79-9.35)
9.29
(8.01-10.57)
11.09
(9.48-12.69)
10.14
(8.94-11.35)
40-44
31252
(2.62)
(2.31-2.93)
1.76
(0.21-2.25)
2.13
(1.50-2.75)
3.11
(2.42-3.81)
2.24
(1.32-3.17)
2.90
(1.95-3.84)
2.79
(2.03-3.56)
1.78
(1.17-2.39)
3.56
(2.73-4.38)
2.37
(1.69-3.05)
45-49
2404
(0.20)
(0.11-0.29)
0.67
(0.34-0.10)
0.21
(0.00-0.42)
0.19
(0.01-0.37)
0.29
(0.00-0.59) nil nil nil nil
0.09
(0.00-0.24)
Education of
mother
None
17416
(1.46)
(1.23-1.69)
1.68
(1.09-2.26)
0.63
(0.21-1.05)
1.25
(0.81-1.68)
1.27
(0.57-1.97)
1.03
(0.55-1.51)
2.49
(1.58-3.39)
1.98
(1.21-2.75)
3.46
(2.45-4.47)
0.69
(0.24-1.15)
Grade 1-7
158083
(13.27)
(12.36-14.17)
19.93
(16.99-22.88)
11.75
(9.98-13.52)
8.09
(6.61-9.57)
13.77
(10.84-16.69)
11.59
(9.45-13.73)
18.64
(15.67-21.62)
14.03
(11.70-16.36)
21.05
(18.50-23.59)
11.00
(8.89-13.12)
Grade 8-12
943980
(79.21)
(78.02-80.40)
72.78
(69.82-75.73)
85.05
(82.92-87.17)
81.58
(78.69-84.47)
80.93
(77.49-84.37)
79.07
(76.85-81.28)
76.53
(73.46-79.60)
82.02
(79.70-84.33)
70.86
(67.82-73.90)
81.55
(78.98-84.12)

15
Characteristics Categories
ZA
weighted freq
(Wt%)
(95% CI)
EC
Wt%
(95% CI)
FS
Wt%
(95% CI)
GP
Wt%
(95% CI)
KZN
Wt%
(95% CI)
LP
Wt%
(95% CI)
MP
Wt%
(95% CI)
NC
Wt%
(95% CI)
NW
Wt%
(95% CI)
WC
Wt%
(95% CI)
Education of
mother cont.
Completed
tertiary
/technical/
university
69924
(5.87)
(5.15-6.58)
5.19
(3.90-6.49)
2.30
(1.62-2.98)
2.94
(6.80-11.12)
4.04
(2.63-5.45)
8.13
(6.47-9.79)
2.11
(1.43-2.80)
1.38
(0.61-2.16)
4.48
(3.19-5.78)
6.32
(4.42-8.23)
Unknown
2344
(0.20)
(0.12-0.28)
0.42
(0.12-0.72)
0.28
(0.0-0.55)
0.13
(0.0-0.34) nil
0.19
(0.0-0.42)
0.23
(0.01-0.46)
0.59
(0.20-0.99)
0.15
(0.0-0.32)
0.45
(0.16-0.74)
Marital status
of mother
Single 8851176 (74.28)
(72.68-75.87)
73.37
(71.06-75.67)
65.01
(61.86-68.17)
69.07
(64.77-73.38)
89.58
(85.74-93.41)
62.71
(58.72-66.70)
82.04
(79.53-84.54)
80.44
(77.48-83.39)
81.06
(78.36-83.75)
62.30
(57.82-66.77)
Married
234114
(19.65)
(18.49-20.79)
25.63
(23.21-28.05)
27.10
(24.20-30.00)
18.79
(15.93-21.66)
7.33
(5.61-9.04)
32.06
(28.24-35.87)
15.45
(12.82-18.08)
17.98
(14.83-21.14)
16.57
(14.13-19.01)
29.23
(25.61-32.85)
Co-habitting
66914
(5.62)
(4.27-6.96)
0.67
(0.26-1.08)
6.98
(5.02-8.94)
11.51
(7.53-15.49)
3.10
(0.0-6.82)
4.95
(2.83-7.08)
2.24
(1.36-3.13)
0.99
(0.12-1.86)
1.75
(1.06-2.44)
7.27
(4.95-9.60)
widowed
2079
(0.17)
(0.11-0.24)
nil 0.63
(0.12-1.15)
0.25
(0.04-0.45) nil nil
0.17
(0.0-0.37)
0.59
(0.18-1.00)
0.45
(0.12-0.79)
0.23
(0.02-0.42)
Divorced /
separated
3269
(0.27)
(0.18-0.37)
0.34
(0.07-0.60)
0.28
(0.0-0.55)
0.31
(0.02-0.60) nil
0.28
(0.01-0.55)
0.10
(0.0-0.28) nil
0.17
(0.0-0.37)
0.98
(0.60-1.37)
Unknown 195.13
(0.02) nil nil
0.06
(0.0-0.17) nil nil nil nil nil nil

16
Characteristics Categories
ZA
weighted freq
(Wt%)
(95% CI)
EC
Wt%
(95% CI)
FS
Wt%
(95% CI)
GP
Wt%
(95% CI)
KZN
Wt%
(95% CI)
LP
Wt%
(95% CI)
MP
Wt%
(95% CI)
NC
Wt%
(95% CI)
NW
Wt%
(95% CI)
WC
Wt%
(95% CI)
Main building
material of
house
Brick/Cement
block
902267
(75.74)
(73.77—77.71)
59.06
(52.77-65.35)
79.71
(77.12-82.30)
80.52
(76.62-84.43)
68.29
(61.94-74.64)
87.45
(84.79-90.12)
89.90
(87.25-92.54)
79.25
(75.27-83.23)
74.51
(71.25-77.76)
70.26
(64.11-76.42)
Informal
material /
corrugated
iron / wood
190680
(16.01)
(14.52-17.49)
9.90
(6.64-13.16)
18.96
(16.44-21.47)
19.48
(15.57-23.38)
12.38
(9.03-15.74)
7.96
(5.80-10.12)
7.95
(5.54-10.36)
20.75
(16.77-24.73)
23.46
(20.18-26.74)
29.74
(23.59-35.90)
Traditional
material/mud
97799
(8.21)
(6.43-9.98)
31.04
(23.55-38.53
1.33
(0.54-2.13) No data
19.13
(12.03-26.24)
4.59
(2.48-6.69)
2.09
(0.88-3.30) nil
2.03
(0.89-3.16) nil
Other
529.76
(0.05)
(0-0.09)
nil nil nil 0.20
(0.0-43) nil
0.06
(0.0-1.6) nil nil nil
Main source
of drinking
water
Piped in
house or yard
872976
(73.28)
(70.84-75.72)
46.56
(38.78-54.35)
96.52
(95.63-97.41)
92.91
(90.53-95.28)
55.34
(46.34-64.33)
42.88
(37.87-47.90)
85.37
(80.49-90.25)
90.32
(87.60-93.04)
74.83
(68.94-80.73)
98.01
(96.90-99.12)
Not piped in
house or yard
318299
(26.72)
(24.28-29.16)
53.44
(45.66-61.22)
3.48
(2.59-4.37)
7.09
(4.72-9.47)
44.66
(35.67-53.66)
57.12
(52.10-62.14)
14.63
(9.75-19.51)
9.68
(6.97-12.40)
25.17
(19.27-31.06)
1.99
(0.88-3.10)
Type of toilet
Flush toilet
598233
(50.22)
(47.85-52.58)
24.58
(18.28-30.88)
72.00
(66.94-77.05)
87.06
(83.50-90.62)
22.56
(16.11-29.01)
13.76
(9.17-18.36)
20.80
(14.92-26.69)
80.63
(76.72-84.54)
43.58
(35.75-51.40)
92.61
(90.01-95.22)
Pit latrine
554604
(46.56)
(44.24-48.87)
69.13
(62.88-75.38)
25.43
(20.48-30.39)
12.63
(9.10-16.16)
71.04
(64.12-77.95)
81.84
(77.22-86.45)
78.88
(73.00-84.75)
11.86
(9.22-14.50)
54.31
(46.59-62.04)
5.26
(2.83-7.69)
17
Characteristics Categories
ZA
weighted freq
(Wt%)
(95% CI)
EC
Wt%
(95% CI)
FS
Wt%
(95% CI)
GP
Wt%
(95% CI)
KZN
Wt%
(95% CI)
LP
Wt%
(95% CI)
MP
Wt%
(95% CI)
NC
Wt%
(95% CI)
NW
Wt%
(95% CI)
WC
Wt%
(95% CI)
Type of toilet
Cont.
None
34037
(2.86)
(1.77-3.94)
5.87
(3.69-8.05)
0.55
(0.16-0.94)
0.19
(0.01-0.37)
6.41
(1.37-11.44)
4.31
(2.69-5.92)
0.32
(0.07-0.57)
3.36
(2.00-4.72)
2.02
(1.27-2.78)
1.20
(0.57-1.83)
Other
4401
(0.37)
(0.25-0.48)
0.42
(0.05-0.79)
2.02
(0.68-3.36)
0.13
(0.0-0.34) nil
0.09 (0.0-
0.26) nil
4.15 (2.49-
5.81) 0.09 (0.0-0.24)
0.93 (0.46-
1.40)
Main source
of fuel
Electricity/
gas/
paraffin
1064496 (89.36)
(87.47-91.24)
88.84
(83.41-94.27)
98.74
(97.90-99.57)
99.25
(98.70-99.81)
81.48
(74.23-88.72)
57.21
(49.56-64.86)
97.35
(96.05-98.65)
96.25
(94.60-97.89)
96.00
(94.77-97.24)
99.56
(99.28-99.84)
Other
126779
(10.64)
(8.76-12.52)
11.16
(5.73-16.59)
1.26
(0.43-2.10)
0.75
(0.20-1.30)
18.52
(11.28-25.77)
42.79
(35.14-50.44)
2.65
(1.35-3.95)
3.76
(2.11-5.40)
4.00
(2.77-5.23)
0.44
(0.16-0.72)
Depletion of
food supply in
past 12
months
Yes
153521
(12.89)
(11.58-14.20)
12.42
(9.08-15.75)
14.90
(12.77-17.03)
8.15
(5.92-10.39)
18.35
(13.48-23.22)
17.14
(13.97-20.30)
5.43
(3.55-7.31)
21.15
(18.46-23.84)
10.81
(8.54-13.08)
14.80
(12.45-17.45)
No 1035236 (86.90)
(85.59-88.22)
87.16
(83.77-90.56)
84.93
(82.70-87.16)
91.72
(89.48-93.97)
81.55
(76.66-86.44)
82.87
(79.70-86.03)
94.44
(92.52-96.37)
78.66
(75.90-81.41)
88.54
(86.29-90.80)
84.72
(82.04-87.40)
Don’t know
2519
(0.21)
(0.13-0.29)
0.42
(0.10-0.74)
0.17
(0.0-0.41)
0.13
(0.0-0.27)
0.10
(0.0-0.28) nil
0.13
(0.0-0.26)
0.20
(0.0-0.45)
0.65
(0.26-1.03)
0.48
(0.17-0.79)
Planned
Pregnancy
Planned
Pregnancy
Yes
437343
(38.37)
(36.83-39.90)
31.99
(27.09-36.88)
50.16
(46.50-53.81)
43.12
(39.57-46.67)
22.67
(19.34-26.01)
52.61
(49.88-55.35)
47.15
(41.63-52.66)
38.71
(34.54-42.88)
34.46
(31.44-37.48)
38.36
(35.76-40.95)
No
699693
(61.38)
(59.84-62.92)
67.74
(62.89-72.59)
48.78
(44.78-52.79)
56.75
(53.19-60.32)
77.02
(73.68-80.36)
47.39
(44.66-50.12)
52.77
(47.26-58.27)
60.89
(56.68-65.10)
64.73
(61.68-67.77)
61.64
(59.05-64.24)

18
Characteristics Categories
ZA
weighted freq
(Wt%)
(95% CI)
EC
Wt%
(95% CI)
FS
Wt%
(95% CI)
GP
Wt%
(95% CI)
KZN
Wt%
(95% CI)
LP
Wt%
(95% CI)
MP
Wt%
(95% CI)
NC
Wt%
(95% CI)
NW
Wt%
(95% CI)
WC
Wt%
(95% CI)
cont.
DKN
2849
(0.25)
(0.15-0.35)
0.28
(0.01-0.54)
1.06
(0.20-1.92)
0.13
(0.0-0.28)
0.31
(0.0-0.62) nil
0.09
(0.0-0.22)
0.40
(0.06-0.75)
0.82
(0.27-1.37) nil
Infant gender Male 596132
(50.02)
(49.04-51.00)
51.84
(49.24-54.45)
50.36
(47.61-53.11)
50.97
(48.89-53.04)
49.66
(46.54-52.78)
48.04
(45.63-50.44)
50.38
(48.54-52.22)
54.15
(51.53-56.77)
46.81
(44.46-49.15)
49.35
(47.33-51.37)
Female 595615
(49.98)
(49.00- 50.95)
48.16
(45.56-50-76)
49.64
(46.89-52.39)
49.04
(46.96-51.11)
50.35
(47.23-53.47)
51.96
(49.56-54.37)
49.62
(47.78-51.46)
45.85
(43.23-48.47)
53.19
(50.85-55.54)
50.65
(48.63-52.67)
Infant age in
weeks
4 12158 (1.02)
(0.80-1.24)
3.09
(2.10-4.10)
0.54
(0.17-0.91)
0.25
(0.04-0.46)
1.05
(0.31-1.79)
0.65
(0.18-1.13)
3.03
(2.18-3.88)
0.59
(0.20-0.98)
0.56
(0.21-0.92)
0.07
(0.00-0.18)
5 74632 (6.26, 5.40-
7.12)
10.97
(7.91-14.03)
8.72
(6.06-11.39)
3.24
(2.01-4.46)
6.60
(3.68-9.52)
6.54
(4.03-9.05)
9.31
(7.28-11.34)
9.09
(6.73-11.45)
8.07
(6.178-9.96)
2.18
(1.19-3.16)
6 955558
(80.18, 78.93-
81.43)
64.57
(60.62-68.53)
82.60
(79.40-85.79)
86.43
(83.76-89.11)
79.09
(75.61-82.56)
86.63
(83.58-89.69)
71.51
(67.91-75.10)
74.11
(70.54-77.68)
79.53
(77.26-81.81)
83.79
(81.40-86.19)
7 120393
(10.10, 9.25-
10.95)
16.50
(13.76-19.23)
7.57
(5.94-9.20)
8.46
(6.37-10.56)
10.90
(8.74-13.06)
4.67
(3.01-6.34)
12.14
(10.12-14.15)
13.24
(11.50-14.98)
9.44
(7.74-11.15)
11.27
(9.22-13.33)
8 29006
(2.43)
(2.11- 2.75)
4.86
(3.49-6.22)
0.56
(0.28-0.85)
1.62
(1.05-2.19)
2.36
(1.50-3.23)
1.50
(0.76-2.23)
4.02
(2.80-5.23)
2.96
(1.92-3.29)
2.38
(1.47-3.29)
2.68
(1.85-3.51)

19
Of note is that nationally 97.02% of infants were brought to the clinic by their mothers; 91.93%
mothers were aged 20-34 years; 85.08% mothers had completed grades 8-12 or more of school;
74.28% of mothers were single, 61.38% of mothers reported that their pregnancy was
unplanned,12.89% reported running out of food at some time during the past 12 months and 91.7%
of infants were aged 4-8 weeks
3.3 Infant HIV Infection Prevalence
Table 4 Weighted Infant HIV infection prevalence nationally and by province
Province % Infant HIV
Infection Prevalence
2010
% Infant HIV
Infection Prevalence
2011
Eastern Cape 2.0 (1.1-2.9) 1.3 (0.7-1.8)
Free State 2.4 (1.6-3.2) 1.2 (0.7-1.7)
Gauteng 1.1 (0.6-1.5) 0.8 (0.3-1.2)
KwaZulu-Natal 1.9 (1.2-2.7) 0.9 (0.4-1.5)
Limpopo 0.9 (0.4-1.5) 0.8 (0.3-1.2)
Mpumalanga 3.0 (2.1-3.8) 1.2 (0.8-1.7)
Northern Cape 0.3 (0.1-0.6) 1.0 (0.4-1.6)
Northwest 1.9 (1.2-2.5) 0.8 (0.4-1.2)
Western Cape 0.9 (0.4-1.5) 0.4 (0.1-0.6)
National 1.5 (1.3-1.7) 0.9 (0.7-1.1)
The national weighted infant HIV infection prevalence among infants aged 4-8 weeks attending child
health clinics for their six week immunisation was 0.9% (95%CI: 0.7-1.1%). (Table 4) Infant HIV
infection prevalence is the rate of HIV-positivity among all infants tested regardless of exposure
which provides an indication of total burden of HIV disease in infants at 4-8 weeks of age.
3.4 National and Provincial Infant HIV Exposure and MTCT Rates
The national rate of infant HIV exposure was 32.2% (95%CI: 30.7-33.6%), with wide provincial
variation. (Table 5) (Note: Infant HIV exposure prevalence is presumed to be roughly equivalent to
maternal HIV prevalence.)
Among these HIV-exposed infants, the national rate of MTCT of HIV by 8 weeks is 2.7% (95%CI: 2.1-
3.2%), with an almost 3-fold difference between provinces; the lowest rate of 1.98% (95%CI: 0.65-
3.31) was found in the Western Cape and the highest rate of 6.1% (95%CI: 2.5-9.6) in the Northern
Cape.
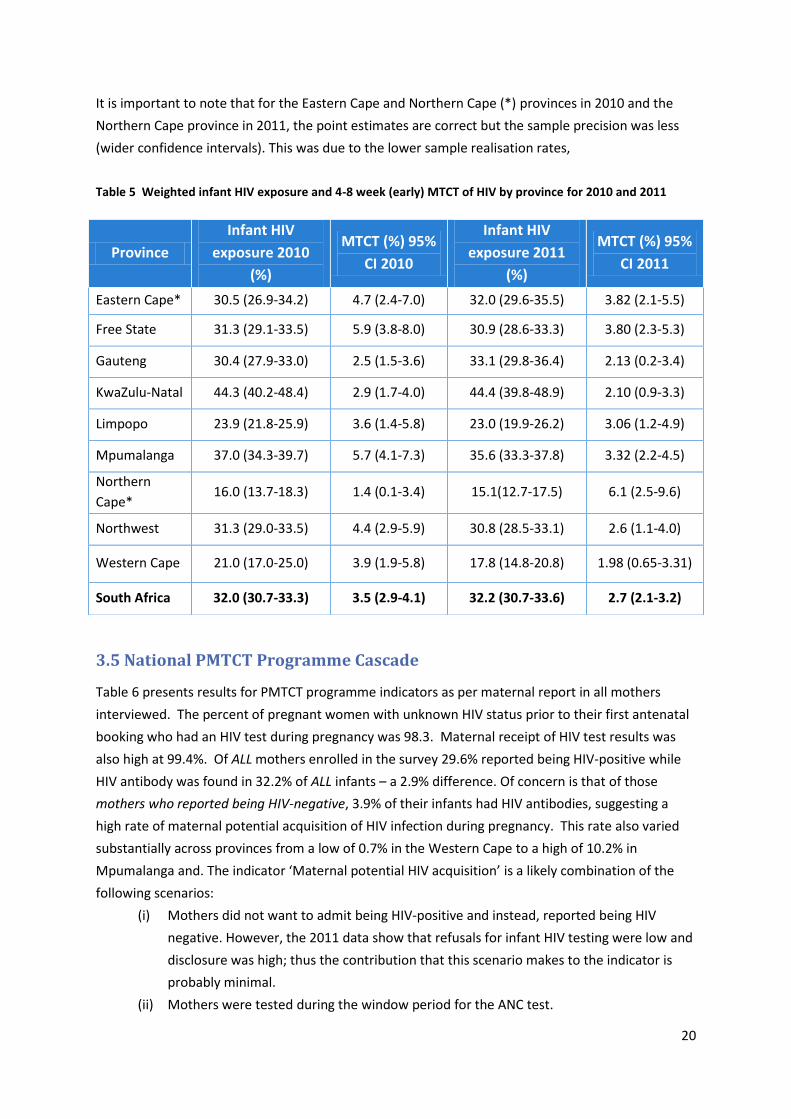
20
It is important to note that for the Eastern Cape and Northern Cape (*) provinces in 2010 and the
Northern Cape province in 2011, the point estimates are correct but the sample precision was less
(wider confidence intervals). This was due to the lower sample realisation rates,
Table 5 Weighted infant HIV exposure and 4-8 week (early) MTCT of HIV by province for 2010 and 2011
3.5 National PMTCT Programme Cascade
Table 6 presents results for PMTCT programme indicators as per maternal report in all mothers
interviewed. The percent of pregnant women with unknown HIV status prior to their first antenatal
booking who had an HIV test during pregnancy was 98.3. Maternal receipt of HIV test results was
also high at 99.4%. Of ALL mothers enrolled in the survey 29.6% reported being HIV-positive while
HIV antibody was found in 32.2% of ALL infants – a 2.9% difference. Of concern is that of those
mothers who reported being HIV-negative, 3.9% of their infants had HIV antibodies, suggesting a
high rate of maternal potential acquisition of HIV infection during pregnancy. This rate also varied
substantially across provinces from a low of 0.7% in the Western Cape to a high of 10.2% in
Mpumalanga and. The indicator ‘Maternal potential HIV acquisition’ is a likely combination of the
following scenarios:
(i) Mothers did not want to admit being HIV-positive and instead, reported being HIV
negative. However, the 2011 data show that refusals for infant HIV testing were low and
disclosure was high; thus the contribution that this scenario makes to the indicator is
probably minimal.
(ii) Mothers were tested during the window period for the ANC test.
Province
Infant HIV
exposure 2010
(%)
MTCT (%) 95%
CI 2010
Infant HIV
exposure 2011
(%)
MTCT (%) 95%
CI 2011
Eastern Cape* 30.5 (26.9-34.2) 4.7 (2.4-7.0) 32.0 (29.6-35.5) 3.82 (2.1-5.5)
Free State 31.3 (29.1-33.5) 5.9 (3.8-8.0) 30.9 (28.6-33.3) 3.80 (2.3-5.3)
Gauteng 30.4 (27.9-33.0) 2.5 (1.5-3.6) 33.1 (29.8-36.4) 2.13 (0.2-3.4)
KwaZulu-Natal 44.3 (40.2-48.4) 2.9 (1.7-4.0) 44.4 (39.8-48.9) 2.10 (0.9-3.3)
Limpopo 23.9 (21.8-25.9) 3.6 (1.4-5.8) 23.0 (19.9-26.2) 3.06 (1.2-4.9)
Mpumalanga 37.0 (34.3-39.7) 5.7 (4.1-7.3) 35.6 (33.3-37.8) 3.32 (2.2-4.5)
Northern
Cape* 16.0 (13.7-18.3) 1.4 (0.1-3.4) 15.1(12.7-17.5) 6.1 (2.5-9.6)
Northwest 31.3 (29.0-33.5) 4.4 (2.9-5.9) 30.8 (28.5-33.1) 2.6 (1.1-4.0)
Western Cape 21.0 (17.0-25.0) 3.9 (1.9-5.8) 17.8 (14.8-20.8) 1.98 (0.65-3.31)
South Africa 32.0 (30.7-33.3) 3.5 (2.9-4.1) 32.2 (30.7-33.6) 2.7 (2.1-3.2)

21
(iii) Poor QC/performance of rapid tests in the field causes false negative results at ANC on
HIV-infected women. Reported field sensitivities are as low as 87% to 95% depending on
the rapid test used. In correlation to this was mothers who reported being HIV-positive
but for which infant test HIV antibody negative which was 2.5% (95% CI 1.8-3.2%) and
also suggests potential problems with performance of rapid tests during ANC.
(iv) True acquisition of HIV after the last HIV test – primarily during pregnancy.
Table 6 HIV testing & results among pregnant women (weighted analysis) for 2010 and 2011
Province % ANC HIV Test % Tested who received
result
% Mothers report being
HIV-positive
%Infants of reported
HIV-negative
mothers who had
HIV antibody
2010 2011 2010 2011 2010 2011 2010 2011
Eastern
Cape
97.5
(96.5-98.6)
98.3
(97.6-98.9)
98.1
(97.1-99.1)
98.4
(97.7-99.2)
27.1
(23.5-30.7)
29.9
(26.8-32.9)
7.8
(5.8-9.7)
5.2
(3.7-6.7)
Free
State
98.8
(98.3-99.2)
97.6
(96.8-98.5)
98.9
(98.5-99.4)
99.0
(98.5-99.6)
27.9
(25.7-30.1)
28.5
(25.8-31.1)
5.4
(4.3-6.4)
4.2
(3.0-5.3)
Gauteng 99.1
(98.7-99.2)
98.5
(98.0-99.1)
99.3
(98.9-99.6)
99.7
(99.5-99.9)
28.3
(25.8-30.8)
30.4
(27. 1-33.7)
3.0
(2.2-3.9)
3.4
(2.4-4.4)
KwaZulu-
Natal
98.9
(98.3-99.2)
97.9
(96.8-99.1)
99.5
(99.1-99.9)
99.9
(99.7-100.0)
42.2
(38.1-46.2)
41.4
(36.3-46.4)
3.2
(2.1-4.4)
5.0
(3.7-6.4)
Limpopo 98.6
(97.8-99.5)
98.4
(97.7-99.0)
97.0
(95.9-98.1)
99.4
(98.9-99.8)
19.4
(17.3-21.6)
20.2
(17.3-23.1)
5.1
(3.6-6.7)
1.6
(0.9-2.3)
MP 98.6
(97.8-99.3)
98.4
(97.6-99.1)
97.1
(96.3-98.0)
99.0
(98.6-99.5)
32.6
(29.7-35.5)
29.1
(26.7-31.4)
7.8
(5.8-9.7)
10.2
(8.2-12.2)
Northern
Cape
99.3
(98.9-99.8)
99.0
(98.4-99.5)
96.7
(95.7-97.6)
99.8
(99.5-100.0)
14.4
12.2-16.7)
14.3
(12.3-16.2)
2.2
(1.2-3.3)
1.9
(1.2-2.7)
North
West
99.2
(98.8-99.6)
99.1
(98.7-99.6)
98.5
(97.8-99.1)
99.1
(98.5-99.6)
28.7
(26.7-30.6)
29.2
(26.7-31.7)
5.4
(3.9-6.8)
3.7
(2.5-4.9)
Western
Cape
98.6
(97.9-99.3)
97.7
(97.1-98.4)
98.8
(98.3-99.3)
99.4
(99.0-99.8)
19.9
(16.1-23.8)
17.2
(14.1-20.3)
1.1
(0.3-1.9)
0.7
(0.3-1.2)
South
Africa
98.8
(98.5-99.0)
98.3
(98.0-98.6)
98.6
(98.4-98.9)
99.4
(99.3-99.6)
29.4
(28.1-30.7)
29.6
(28.0-31.2)
4.1
(3.7-4.6)
3.9
(3.5-4.4)
Table 7 shows PMTCT programme indicators for women who reported being HIV-positive: 77.4% of
mothers reported getting a CD4 test result; taking ART was reported by 41.9% of mothers , while
52.0% reported receiving both maternal and neonatal antiretroviral (ARV) prophylaxis. This suggests
that 93.9% of HIV-positive mothers received either ART or ARV prophylaxis (Figure 5). These figures
show an increase in ART access compared with 2010 data, probably due to the CD4 cell cut-off for
ART access (≤350 cells/µl) in 2010. Maternal knowledge of CD4 cell count results remained the same
in 2010 and 2011, possibly illustrating the lack of communication between health care personnel and
HIV positive women or poor maternal memory of CD4 cell count result.

22
Table 7 Access to the PMTCT programme in reported HIV-positive mothers (weighted analysis), 2010 and 2011
Province % Received CD4 Test % Received ARV/ART
% Mother & Infant
Received ARV
Prophylaxis
% Intended to obtain
EID @ 6 weeks
2010 2011 2010 2011 2010 2011 2010 2011
EC 67.6
(60.2-75.1)
70.1
(64.1-76.0)
23.0
(16.9-29.0)
38.9
(33.3-44.4)
63.5
(55.3-71.7)
53.5
(48.1-58.9)
21.6
(14.9-28.4)
28.0
(17.6-38.4)
FS 85.8
(82.7-89.0)
63.2
(56.9-69.4)
37.7
(33.2-42.2)
44.2
(38.8-49.7)
56.4
(51.6-61.1)
51.8
(46.5-57.2)
43.7
(33.3-54.1)
24.6
(17.8-31.4)
GP 74.6
(69.8-79.4)
77.1
(72.1-82.0)
40.1
(34.9-45.3)
46.1
(41.1-51.1)
52.8
(47.1-58.4)
48.1
(42.8-53.4)
42.5
(32.6-52.4)
25.4
(19.2-31.5)
KZN 85.5
(82.1-88.8)
87.2
(81.3-93.1)
29.4
(25.5-33.3)
39.0
(34.2-43.8)
65.2
(61.1-69.3)
56.6
(51.8-61.3)
41.1
(30.5-51.6)
63.6
(53.7-73.5)
LP 68.3
(61.0-75.5)
68.1
(62.2-74.0)
33.3
(27.3-39.4)
37.7
(31.9-43.5)
54.3
(47.3-61.3)
48.2
(42.5-53.9)
28.4
(20.4-36.5)
31.1
(23.2-38.9)
MP 69.5
(65.5-73.5)
66.6
(62.6-70.7)
27.5
(23.3-31.7)
31.9
(25.9-37.8)
56.1
(51.8-60.3)
60.5
(54.3-66.7)
29.8
(23.1-36.5)
41.2
(32.1-50.3)
NC 88.7
(83.0-94.3)
76.8
(69.4-84.3)
28.6
(19.6-37.6)
52.2
(46.6-57.7)
58.7
(51.1-66.3)
46.4
(41.3-51.5)
1.6
(0.1-4.0)
11.6
(5.2-18.0)
NW 81.7
(78.3-85.1)
74.2
(69.9-78.5)
33.7
(29.1-38.4)
49.3
(44.6-53.9)
57.4
(52.4-62.5)
44.0
(39.6-48.5)
3.6
(1.6-5.7)
13.0
(7.3-18.7)
WC 89.6
(86.8-92.5)
86.4
(81.7-91.2)
34.2
(27.9-40.6)
49.8
(45.4-54.3)
60.0
(52.7-67.3)
47.6
(43.8-51.4)
37.9
(28.8-47.0)
46.3
(36.1-56.5
ZA 78.3
(76.4-80.4)
77.4
(74.9-80.0)
33.1
(30.8-35.3)
41.9
(39.7-44.2)
58.7
(56.3-61.1)
52.0
(49.7-54.2)
35.1
(30.6-39.6)
38.5
(34.3-42.7)
Only 38.46% of reported HIV-positive mothers indicated that they planned to obtain early infant
diagnosis (EID) for their infant during their six week immunisation visit (ranging from 11.59% in
Northern Cape to 63.56% in KwaZulu Natal ).

23
Figure 5 PMTCT service uptake (PMTCT cascade) in South Africa
Note: The first three indicators apply to all mothers, while the last three apply only to those who
reported being HIV-positive. Red indicates the percentage receiving ART while blue indicates the
percentage receiving ARV prophylaxis.
98.28 99.28
29.59
77.43
51.95 38.46
41.93
0
20
40
60
80
100
120
% ANC HIV Test % Tested whoreceived results
% Mothers whoreport beingHIV-positive
% Received CD4Test
% Mother &infant received
ARV Prophylaxis/ Mother on
HAART*
% Intended toobtain infant
PCR test
% ALL MOTHERS % MOTHERS REPORTED HIV-POSITIVE

24
3.6 Demographic Characteristics, MTCT and the PMTCT Cascade by
Province
3.6.1 Eastern Cape
Eastern Cape achieved a sample realisation of 55%. This was due to a high number of medium size
clinics requiring extended resources. Furthermore in the Eastern Cape many infants presenting for
six week immunisation were older than 8 weeks of age. This was especially the case in large urban
clinics. These infants were not eligible for enrolment into the survey.
General Description of Provincial Sample
Table 8 presents characteristics of respondents in the Eastern Cape province. Similar to the national
trend, the majority of the respondents are single (73.37%) mothers (94.05%), with education level of
grade 8-12 (72.78%). In comparison with other provinces, Eastern Cape has a significant percentage
(12.42) of respondents that reported experiencing depletion of food in the household in the last 12
months. Economic status indicators also show that pit latrines (69.13%) and not piped water
(53.44%) are utilised by the majority of the respondents.
Table 8 Baseline characteristics of Eastern Cape SAPMTCTE survey participants
2010
Characteristics Categories % 95% CI
Relationship to child Mother 97.3 93.9-96.8
Caregiver 4.7 3.2-6.1
Mean age of mother (range) 25.1 (14-52)
Infant gender Male 52.1 48.7-55.5
Female 47.9 44.5-51.3
Education of mother
None 2.5 1.6-3.4
Grade 1-7 21.8 18.4-25.1
Grade 8-12 70.8 67.4-74.3
Above Grade 12 4.4 3.0-5.9
Marital status of mother Single 75.8 73.1-78.6
Married/cohabitating 23.8 21.1-26.6
Main building material of house
Brick/Cement block 63.1 55.5-70.7
Informal material 11.8 8.1-15.5
Traditional material/mud 25.1 18.6-31.5
Main source of drinking water Piped in house or yard 42.3 34.8-49.8
Not piped in house or yard 57.7 50.2-65.2
Type of toilet
Flush toilet 26.4 19.6-33.3
Pit latrine 62.9 56.6-69.1
None 9.6 5.9-13.4
Other 1.0 0.4-1.7
Main source of fuel Electricity/gas/paraffin 97.8 96.9-98.8
Other 2.2 1.2-3.1
Depletion of food supply in past 12
months
Yes 24.5 18.9-30.1
No 75.0 69.4-80.6

25
2011
Characteristics Categories % 95% CI
Relationship to child
Mother 94.0 92.53-95.58
Father 0.1 0.0-2.3
Grandmother/grandfather 3.8 2.7-5.0
Guardian/legal guardian 1.3 0.7-2.0
Caregiver 0.7 0.3-1.1
Mean age of mother (range)
Infant gender Male 51.8 49.2-54.4
Female 48.2 45.6-50.8
Education of mother
None 1.7 1.1-2.3
Grade 1-7 19.9 17.0-22.9
Grade 8-12 72.8 69.8-75.7
Completed tertiary/technical /university 5.2 3.9-6.5
Don’t know 0.4 0.1-0.7
Marital status of mother
Single 73.4 71.1-75.7
Married 25.6 23.2-28.1
Co-habitting 0.7 0.3-1.1
Widowed Nil
Divorced/separated 0.3 0.1-0.6
Don’t know Nil
Main building material of house
Brick/Cement block 59.1 52.8-65.3
Informal material/corrugated iron/wood 9.9 6.6-13.2
Traditional material/mud 31.0 23.6-38.5
other Nil
Main source of drinking water Piped in house or yard 46.6 38.8-54.3
Not piped in house or yard 53.4 45.7-61.2
Type of toilet
Flush toilet 24.6 18.3-30.9
Pit latrine including ventilated pit latrine 69.1 62.9-75.4
None 5.9 3.7-8.1
Other 0.4 0.1-0.8
Main source of fuel Electricity/gas/paraffin 88.8 83.4-94.3
Other 11.2 5.7-16.6
Depletion of food supply in past
12 months
Yes 12.4 9.1-15.8
No 87.2 83.8-90.6
Don’t know 0.4 0.1-0.7
Was this pregnancy planned
Yes 32.0 27.1-36.9
No 67.7 62.9-72.6
Don’t know 0.3 0.0-0.5

26
Infant HIV Exposure and MTCT Rate in Eastern Cape Province
Text box 1 shows that infants’ HIV exposure was 32.0.%, with a 1.3% early infant HIV infection
prevalence and a 3.8% (95%CI: 2.1-5.5) MTCT rate at 4-8 weeks. The larger confidence interval
attached to this estimate is due to the smaller sample size attained in Eastern Cape. The percent of
reported HIV-negative mothers whose infants had HIV antibodies (presumed maternal HIV
acquisition after the initial HIV test) was 5.2% (95% CI 3.7-6.7%), was significantly lower than in
2010, but still the second highest in South Africa (after Mpumalanga).
Text Box 1: Eastern Cape infant HIV exposure and MTCT
2010
Infant HIV Exposure % (95%CI)
Infant HIV infection prevalence at
4-8 weeks
MTCT @ 4-8 weeks:%(95%CI)
%Infants of reported HIV-negative mothers who had
HIV antibody
30.5 (26.9-34.2) 2.0 (1.1-2.9) 4.7 (2.4-7.0) 7.8 (5.8-9.7)
2011
Infant HIV Exposure %
(95%CI)
Infant HIV infection
prevalence at 4-8
weeks
MTCT @ 4-8
weeks:%(95%CI)
%Infants of reported
HIV-negative mothers
who had HIV antibody
32.0 (29.6-35.5) 1.3 (0.7-1.8) 3.8 (2.1-5.5) 5.2 (3.7-6.7)
PMTCT Service Uptake (PMTCT Cascade) in the Eastern Cape Province
Figure 6 indicates that Eastern Cape has a fairly high antenatal HIV testing rate (97.5%) but ARV
prophylaxis/ART coverage of 86.5%. Coverage of CD4 count and intended EID is low in Eastern Cape.
Figure 6 PMTCT service uptake (PMTCT cascade) in the Eastern Cape
98.25 98.41
29.85
70.06 53.5
28.03
38.85
0
20
40
60
80
100
120
% ANC HIV Test % Tested whoreceived results
% Mothers whoreport beingHIV-positive
% Received CD4Test
% Mother &infant received
ARV Prophylaxis/ Mother on
HAART*
% Intended toobtain infant
PCR test
% ALL MOTHERS % MOTHERS REPORTED HIV-POSITIVE
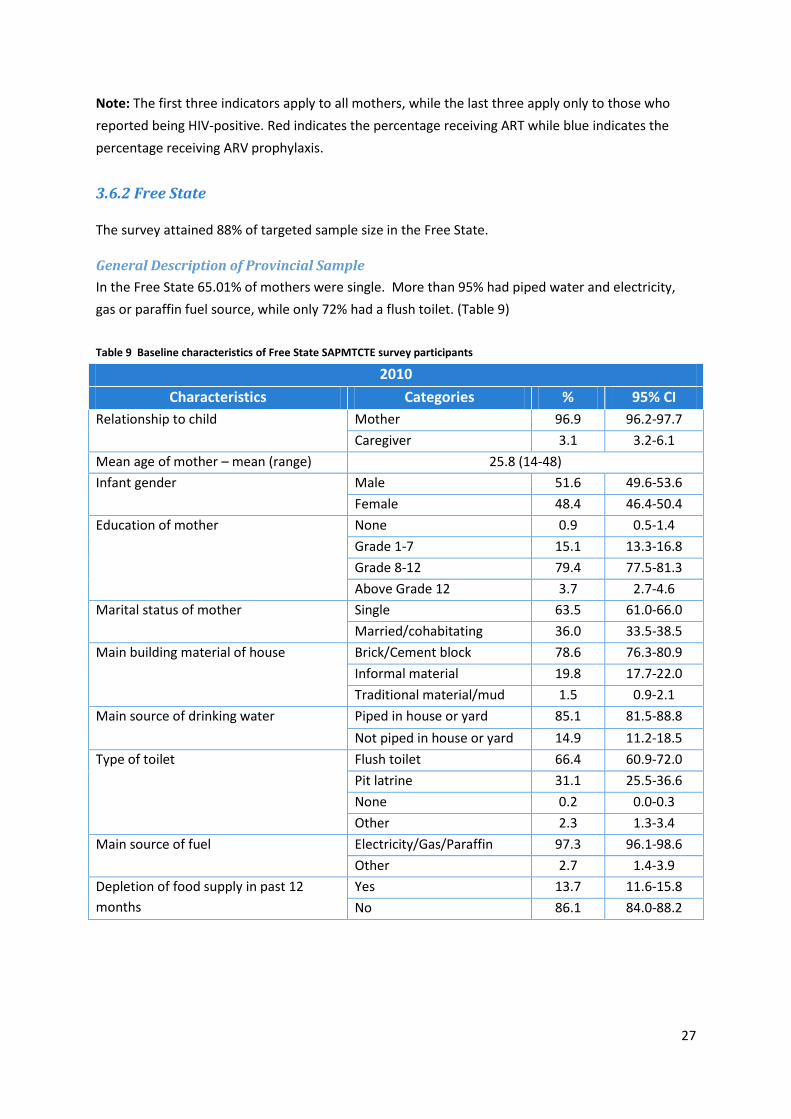
27
Note: The first three indicators apply to all mothers, while the last three apply only to those who
reported being HIV-positive. Red indicates the percentage receiving ART while blue indicates the
percentage receiving ARV prophylaxis.
3.6.2 Free State The survey attained 88% of targeted sample size in the Free State.
General Description of Provincial Sample
In the Free State 65.01% of mothers were single. More than 95% had piped water and electricity,
gas or paraffin fuel source, while only 72% had a flush toilet. (Table 9)
Table 9 Baseline characteristics of Free State SAPMTCTE survey participants
2010
Characteristics Categories % 95% CI
Relationship to child Mother 96.9 96.2-97.7
Caregiver 3.1 3.2-6.1
Mean age of mother – mean (range) 25.8 (14-48)
Infant gender Male 51.6 49.6-53.6
Female 48.4 46.4-50.4
Education of mother None 0.9 0.5-1.4
Grade 1-7 15.1 13.3-16.8
Grade 8-12 79.4 77.5-81.3
Above Grade 12 3.7 2.7-4.6
Marital status of mother Single 63.5 61.0-66.0
Married/cohabitating 36.0 33.5-38.5
Main building material of house Brick/Cement block 78.6 76.3-80.9
Informal material 19.8 17.7-22.0
Traditional material/mud 1.5 0.9-2.1
Main source of drinking water
Piped in house or yard 85.1 81.5-88.8
Not piped in house or yard 14.9 11.2-18.5
Type of toilet
Flush toilet 66.4 60.9-72.0
Pit latrine 31.1 25.5-36.6
None 0.2 0.0-0.3
Other 2.3 1.3-3.4
Main source of fuel Electricity/Gas/Paraffin 97.3 96.1-98.6
Other 2.7 1.4-3.9
Depletion of food supply in past 12
months
Yes 13.7 11.6-15.8
No 86.1 84.0-88.2

28
2011
Characteristics Categories % 95% CI
Relationship to child
Mother 96.5 95.7-97.3
Father 0.1 0.0-0.2
Grandmother/grandfather 2.1 1.4-2.8
Guardian/legal guardian 1.2 0.7-1.6
Caregiver 0.12 0.0-0.35
Mean age of mother (range)
Infant gender Male 50.4 47.6-53.1
Female 49.6 46.9-52.4
Education of mother
None 0.6 0.2-1.0
Grade 1-7 11.8 10.0-13.5
Grade 8-12 85.1 82.9-87.2
Completed tertiary/technical /university 2.3 1.6-3.0
Don’t know 0.3 0.0-0.6
Marital status of mother
Single 65.0 61.9-68.2
Married 27.1 24.2-30.0
Co-habitting 7.0 5.0-8.9
Widowed 0.6 0.1-1.2
Divorced/separated 0.3 0.0-0.6
Don’t know Nil
Main building material of house
Brick/Cement block 79.7 77.1-82.3
Informal material/corrugated iron/wood 19.0 16.4-21.5
Traditional material/mud 1.3 0.5-2.1
other Nil
Main source of drinking water Piped in house or yard 96.5 95.6-97.4
Not piped in house or yard 3.5 2.6-4.4
Type of toilet
Flush toilet 72.0 66.9-77.0
Pit latrine including ventilated pit latrine 25.4 20.5-30.4
None 0.6 0.2-0.9
Other 2.0 0.7-3.4
Main source of fuel Electricity/gas/paraffin 98.7 97.9-99.6
Other 1.3 0.4-2.1
Depletion of food supply in past
12 months
Yes 14.9 12.8-17.0
No 84.9 82.1-87.2
Don’t know 0.2 0.0-0.4
Was this pregnancy planned
Yes 50.1 46.5-53.8
No 48.8 44.8-52.8
Don’t know 1.1 0.2-1.9

29
Infant HIV Exposure and MTCT Rate in Free State Province
Text Box 2 shows that infants HIV exposure was 30.9% with a 1.2% early infant HIV infection
prevalence and a 3.8% (95%CI: 2.3-5.3%) MTCT rate at 4-8 weeks is the highest in South Africa. The
percentage of infants with reported HIV-negative mothers who were actually HIV-exposed
(presumed maternal HIV acquisition) was 4.2% (95%CI: 3.0-5.3%) was significantly lower than in
2010.
Text Box 2: Free State Infant HIV Exposure and MTCT
2010
Infant HIV Exposure %
(95%CI)
Infant HIV infection
prevalence at 4-8
weeks
MTCT @ 4-8
weeks:%(95%CI)
%Infants of reported
HIV-negative mothers
who had HIV antibody
31.3 (29.1-33.5) 2.4 (1.6-3.2) 5.9 (3.8-8.0) 5.4 (4.3-6.4)
2011
Infant HIV Exposure %
(95%CI)
Infant HIV infection
prevalence at 4-8
weeks
MTCT @ 4-8
weeks:%(95%CI)
%Infants of reported
HIV-negative mothers
who had HIV antibody
30.9 (28.6-33.3) 1.2 (0.7-1.7) 3.8 (2.3-5.3) 4.2 (3.0-5.3)
PMTCT Service Uptake (PMTCT cascade) in the Free State Province
Figure 7 shows uptake of HIV testing (97.64%) and coverage of ARV prophylaxis/ART is fairly high in
Free State (96.05%). CD4 testing was at 63.15%. The high presumed maternal potential HIV
acquisition may explain the high MTCT rate although, more detailed investigations are needed to
examine ‘effective coverage’ of the PMTCT cascade (i.e., despite high CD4 cell and ART/prophylaxis
uptake adherence to ARVs was low) and support for mothers post-HIV diagnosis and during
pregnancy. Adherence and care and support data were not gathered in 2010.

30
Figure 7 PMTCT service uptake (PMTCT cascade) in the Free State
Note: The first three indicators apply to all mothers, while the last three apply only to those who
reported being HIV-positive. Red indicates the percentage receiving ART while blue indicates the
percentage receiving ARV prophylaxis.
97.64 99.02
28.48
63.15 51.81
24.6
44.37
0
20
40
60
80
100
120
% ANC HIV Test % Tested whoreceived results
% Mothers whoreport beingHIV-positive
% Received CD4Test
% Mother &infant received
ARV Prophylaxis/ Mother on
HAART*
% Intended toobtain infant
PCR test
% ALL MOTHERS % MOTHERS REPORTED HIV-POSITIVE
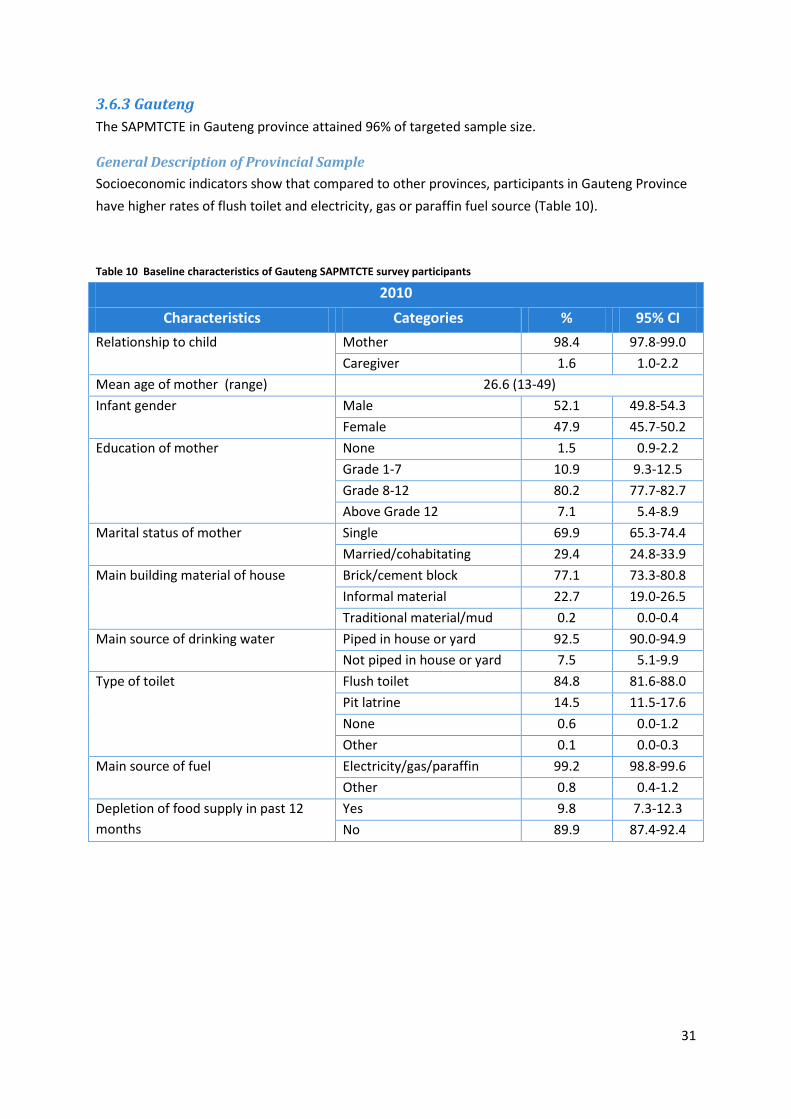
31
3.6.3 Gauteng
The SAPMTCTE in Gauteng province attained 96% of targeted sample size.
General Description of Provincial Sample
Socioeconomic indicators show that compared to other provinces, participants in Gauteng Province
have higher rates of flush toilet and electricity, gas or paraffin fuel source (Table 10).
Table 10 Baseline characteristics of Gauteng SAPMTCTE survey participants
2010
Characteristics Categories % 95% CI
Relationship to child Mother 98.4 97.8-99.0
Caregiver 1.6 1.0-2.2
Mean age of mother (range) 26.6 (13-49)
Infant gender Male 52.1 49.8-54.3
Female 47.9 45.7-50.2
Education of mother None 1.5 0.9-2.2
Grade 1-7 10.9 9.3-12.5
Grade 8-12 80.2 77.7-82.7
Above Grade 12 7.1 5.4-8.9
Marital status of mother Single 69.9 65.3-74.4
Married/cohabitating 29.4 24.8-33.9
Main building material of house Brick/cement block 77.1 73.3-80.8
Informal material 22.7 19.0-26.5
Traditional material/mud 0.2 0.0-0.4
Main source of drinking water
Piped in house or yard 92.5 90.0-94.9
Not piped in house or yard 7.5 5.1-9.9
Type of toilet
Flush toilet 84.8 81.6-88.0
Pit latrine 14.5 11.5-17.6
None 0.6 0.0-1.2
Other 0.1 0.0-0.3
Main source of fuel Electricity/gas/paraffin 99.2 98.8-99.6
Other 0.8 0.4-1.2
Depletion of food supply in past 12
months
Yes 9.8 7.3-12.3
No 89.9 87.4-92.4

32
2011
Characteristics Categories % 95% CI
Relationship to child
Mother 98.4 98.0-99.9
Father 0.2 0.0-0.4
Grandmother/grandfather 0.9 0.5-1.3
Guardian/legal guardian 0.2 0.0-0.5
Caregiver 0.2 0.0-0.4
Mean age of mother (range)
Infant gender Male 51.0 48.9-53.0
Female 49.0 47.0-51.1
Education of mother
None 1.2 0.8-1.7
Grade 1-7 8.1 6.6-9.6
Grade 8-12 81.6 78.7-84.5
Completed tertiary/technical /university 9.0 6.8-11.1
Don’t know 0.1 0.0-0.3
Marital status of mother
Single 69.1 64.8-73.4
Married 18.8 15.9-21.7
Co-habitting 11.5 7.5-15.5
Widowed 0.2 0.0-0.4
Divorced/separated 0.3 0.0-0.6
Don’t know 0.1 0.0-0.2
Main building material of house
Brick/Cement block 80.5 76.6-84.4
Informal material/corrugated iron/wood 19.5 15.6-23.4
Traditional material/mud Nil
other Nil
Main source of drinking water Piped in house or yard 92.9 90.5-95.3
Not piped in house or yard 7.1 4.7-9.5
Type of toilet
Flush toilet 87.1 83.5-90.6
Pit latrine including ventilated pit latrine 12.6 9.1-16.2
None 0.2 0.0-0.4
Other 0.1 0.0-0.3
Main source of fuel Electricity/gas/paraffin 99.3 98.7-99.8
Other 0.8 0.2-1.3
Depletion of food supply in past
12 months
Yes 8.2 5.9-10.4
No 91.7 89.5-94.0
Don’t know 0.13 0.0-0.3
Was this pregnancy planned
Yes 43.1 39.6-46.7
No 56.8 53.2-60.3
Don’t know 0.1 0.0-0.3

33
Infant HIV Exposure and MTCT Rate in Gauteng
Text Box 3 shows that infants’ HIV exposure was 33.1%, with a 0.8% early infant HIV infection
prevalence and a 2.1% (95%CI: 0.2-3.4%) MTCT rate at 4-8 weeks. Maternal potential HIV acquisition
was 3.4% (95% CI 2.4-4.4%)).
Text Box 3: Gauteng Infant HIV Exposure and MTCT
2010
Infant HIV Exposure % (95%CI)
Infant HIV infection prevalence at 4-8
weeks
MTCT @ 4-8 weeks:%(95%CI)
%Infants of reported HIV-negative mothers who had HIV antibody
30.4 (27.9-33.0) 1.1 (0.6-1.5) 2.5 (1.5-3.6) 3.0 (2.2-3.9)
2011
Infant HIV Exposure %
(95%CI)
Infant HIV infection
prevalence at 4-8
weeks
MTCT @ 4-8
weeks:%(95%CI)
%Infants of reported
HIV-negative mothers
who had HIV antibody
33.1 (29.8-36.4) 0.8 (0.3-1.2) 2.1 (0.2-3.4) 3.4 (2.4-4.4)
PMTCT service uptake (PMTCT cascade) in Gauteng
Gauteng has achieved close to 100% (98.54% tested and 99.73% received test) HIV testing rate.
Coverage of ARV prophylaxis or ART is 94.21% with 46.10% of women on ART, the highest of any
province. However, CD4 count is only 77.06% and intended EID coverage while higher than other
provinces is still below half (25.39%). (Figure 8)

34
Figure 8 PMTCT Service Uptake (PMTCT cascade) in Gauteng
Note: The first three indicators apply to all mothers, while the last three apply only to those who
reported being HIV-positive. Red indicates the percentage receiving ART while blue indicates the
percentage receiving ARV prophylaxis.
98.54 99.73
30.4
77.06
48.11
25.39
46.1
0
20
40
60
80
100
120
% ANC HIV Test % Tested whoreceived results
% Mothers whoreport beingHIV-positive
% Received CD4Test
% Mother &infant received
ARV Prophylaxis/ Mother on
HAART*
% Intended toobtain infant
PCR test
% ALL MOTHERS % MOTHERS REPORTED HIV-POSITIVE

35
3.6.4 KwaZulu-Natal
The SAPMTCTE in KwaZulu-Natal attained 87% of targeted sample size.
General Description of Provincial Sample
KwaZulu-Natal had a very high rate of single mothers at 89.58%, while brick/cement block house was
55.34% and piped water were just above 65%, and 18.35% of participants described depletion of
food supply in the past 12 months. (Table 11)
Table 11 Baseline characteristics of KwaZulu-Natal SAPMTCTE survey participants
2010
Characteristics Categories % 95% CI
Relationship to child Mother 95.5 95.4-97.5
Caregiver 3.5 2.5-4.6
Mean age of mother (range) 24.9 (14-47)
Infant gender Male 47.9 45.2-50.7
Female 52.1 49.3-54.8
Education of mother None 1.5 0.7-2.3
Grade 1-7 14.5 11.6-17.3
Grade 8-12 79.5 76.3-82.6
Above Grade 12 4.0 2.8-5.2
Marital status of mother Single 90.7 89.0-92.4
Married/cohabitating 8.9 7.2-10.6
Main building material of house Brick/Cement block 61.9 55.5-68.3
Informal material 13.3 9.0-17.6
Traditional material/mud 24.8 18.3-31.4
Main source of drinking water
Piped in house or yard 60.6 52.8-68.4
Not piped in house or yard 39.4 31.6-47.2
Type of toilet
Flush toilet 24.4 17.8-30.9
Pit latrine 71.9 65.2-78.5
None 3.8 1.0-6.5
Other 0.0 --
Main source of fuel Electricity/Gas/Paraffin 83.4 78.8-88.0
Other 16.6 12.0-21.2
Depletion of food supply in past 12
months
Yes 21.6 16.2-27.0
No 77.7 72.3-83.1

36
2011
Characteristics Categories % 95% CI
Relationship to child
Mother 96.5 95.4-97.7
Father 0.1 0.0-0.2
Grandmother/grandfather 1.7 0.9-2.4
Guardian/legal guardian 0.4 0.0-0.8
Caregiver 1.4 0.6-2.1
Mean age of mother (range)
Infant gender Male 49.7 46.5-52.8
Female 50.4 47.2-53.5
Education of mother
None 1.3 0.6-2.0
Grade 1-7 13.8 10.8-16.7
Grade 8-12 80.9 77.5-84.4
Completed tertiary/technical /university 4.0 2.6-5.4
Don’t know - -
Marital status of mother
Single 89.6 85.7-93.4
Married 7.3 5.6-9.0
Co-habitting 3.1 0.0-6.8
Widowed - -
Divorced/separated - -
Don’t know - -
Main building material of house
Brick/Cement block 68.3 61.9-74.6
Informal material/corrugated iron/wood 12.4 9.0-15.7
Traditional material/mud 19.1 12.0-26.2
other 0.2 0.0-0.4
Main source of drinking water Piped in house or yard 55.3 46.3-64.3
Not piped in house or yard 44.7 35.7-53.67
Type of toilet
Flush toilet 22.6 16.1-29.0
Pit latrine including ventilated pit latrine 71.0 64.1-78.0
None 6.4 1.4-11.4
Other - -
Main source of fuel Electricity/gas/paraffin 81.5 74.2-88.7
Other 18.5 11.3-25.8
Depletion of food supply in past
12 months
Yes 18.3 13.5-23.2
No 81.6 76.7-86.4
Don’t know 0.1 0.0-0.3
Was this pregnancy planned
Yes 22.7 19.3-26.0
No 77.0 73.7-80.4
Don’t know 0.31 0.0-0.62

37
Infant HIV Exposure and MTCT Rate in KwaZulu-Natal
Text Box 4 shows that infants HIV exposure was 44.4%, with a 0.9% early infant HIV infection
prevalence and a 2.1% (95%CI: 0.9-3.3%) MTCT rate at 4-8 weeks. Among infants whose mothers
reported being HIV negative 5.0% (95%CI: 3.7-6.4%) were HIV exposed (maternal potential HIV
acquisition after the initial test), which was significantly higher than in 2010.
Text Box 4: KwaZulu-Natal HIV Infant Exposure and MTCT
2010
Infant HIV Exposure %
(95%CI)
Infant HIV infection prevalence at 4-8
weeks
MTCT @ 4-8 weeks:%(95%CI)
%Infants of reported HIV-negative mothers who had HIV
antibody
44.3 (40.2-48.4) 1.9 (1.2-2.7) 2.9 (1.7-4.0) 3.2 (2.1-4.4)
2011
Infant HIV
Exposure %
(95%CI)
Infant HIV infection
prevalence at 4-8
weeks
MTCT @ 4-8
weeks:%(95%CI)
%Infants of reported HIV-
negative mothers who had HIV
antibody
44.4 (39.8-48.9) 0.9 (0.4-1.5) 2.1 (0.9-3.3) 5.0 (3.7-6.4)
PMTCT service uptake (PMTCT cascade) in the KwaZulu-Natal
In KwaZulu-Natal, close to 100% of pregnant mothers receive testing and test results. More than
85% of HIV-positive mothers received their CD4 cell count test result. ARV/ART coverage was also
high (95.55%). The high uptake of CD4 cell count results, together with the high percentage of
pregnant women and infants receiving ARV prophylaxis or ART may explain the lower MTCT rate in
KwaZulu-Natal. (Figure 9) Similar to other provinces, coverage of intended EID is low at 63.56%, but
compared to other provinces, KwaZulu-Natal is the second highest in its EID coverage.

38
Figure 9 PMTCT service uptake (PMTCT cascade) in KwaZulu-Natal
Note: The first three indicators apply to all mothers, while the last three apply only to those who
reported being HIV-positive. Red indicates the percentage receiving ART while blue indicates the
percentage receiving ARV prophylaxis.
97.92 99.9
41.35
87.17
56.55 63.56
39
0
20
40
60
80
100
120
% ANC HIV Test % Tested whoreceived results
% Mothers whoreport beingHIV-positive
% Received CD4Test
% Mother &infant received
ARV Prophylaxis/ Mother on
HAART*
% Intended toobtain infant
PCR test
% ALL MOTHERS % MOTHERS REPORTED HIV-POSITIVE

39
3.6.5 Limpopo
The SAPMTCT Evaluation in Limpopo province attained 73% of targeted sample size.
General Description of Provincial Sample
Limpopo showed a slightly higher rate of grandmother/grandfather (other than mothers) bringing
infants to services (1.96%) and slightly lower percentage of single mothers (69.7%) compared to
South African national rates. (Table 12)
Table 12 Baseline characteristics of Limpopo SAPMTCTE survey participants
2010
Characteristics Categories % 95% CI
Relationship to child Mother 93.8 92.4-95.2
Caregiver 6.2 4.8-7.6
Mean age of mother (range) 26.0 (14-47)
Infant gender Male 50.3 47.4-53.2
Female 49.7 46.8-52.6
Education of mother None 1.6 1.0-2.3
Grade 1-7 15.3 12.6-18.0
Grade8-12 75.0 71.9-78.1
Above Grade12 7.5 6.0-9.0
Marital status of mother Single 69.7 66.0-73.4
Married/cohabitating 30.0 26.4-33.7
Main building material of house Brick/Cement block 89.2 87.2-91.2
Informal material 8.3 6.3-10.2
Traditional material/mud 2.5 1.6-3.5
Main source of drinking water
Piped in house or yard 47.4 41.5-53.4
Not piped in house or yard 52.6 46.6-58.5
Type of toilet
Flush toilet 17.4 12.4-22.4
Pit latrine 76.1 71.4-80.8
None 6.0 4.2-7.9
Other 0.4 0.1-0.8
Main source of fuel Electricity/Gas/Paraffin 71.4 65.6-77.2
Other 28.6 22.8-34.4
Depletion of food supply in past 12
months
Yes 15.1 12.0-18.1
No 84.8 81.7-87.8
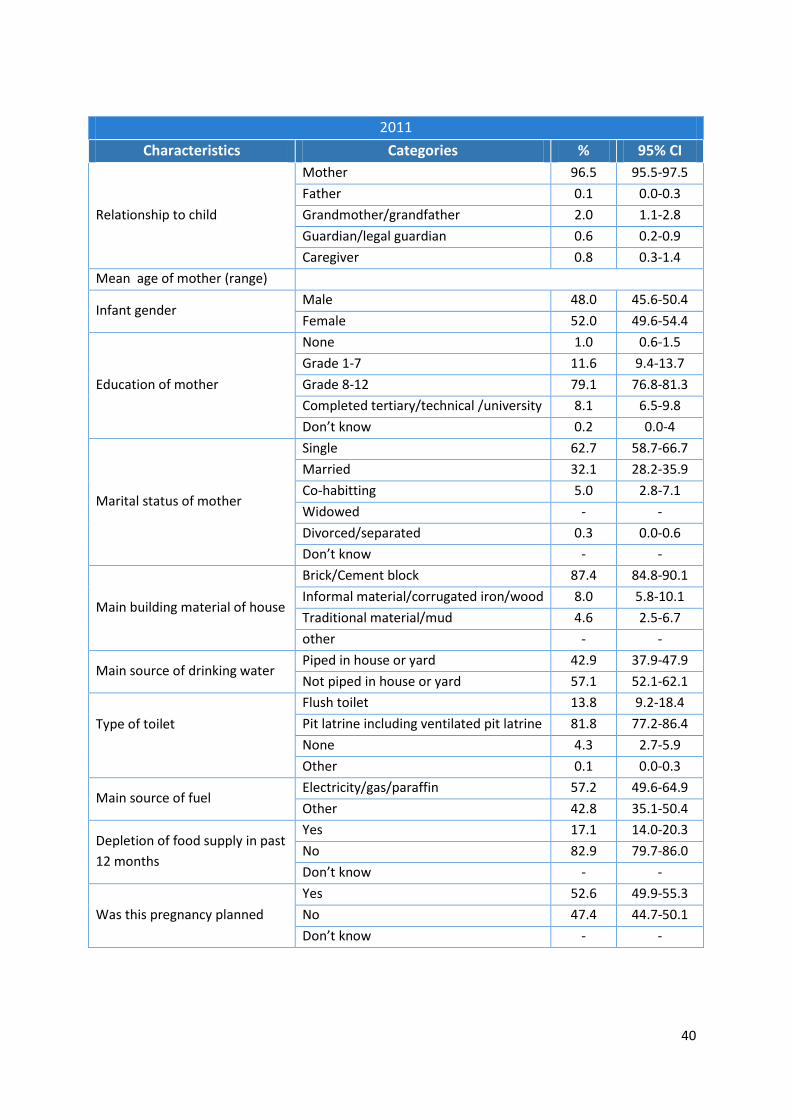
40
2011
Characteristics Categories % 95% CI
Relationship to child
Mother 96.5 95.5-97.5
Father 0.1 0.0-0.3
Grandmother/grandfather 2.0 1.1-2.8
Guardian/legal guardian 0.6 0.2-0.9
Caregiver 0.8 0.3-1.4
Mean age of mother (range)
Infant gender Male 48.0 45.6-50.4
Female 52.0 49.6-54.4
Education of mother
None 1.0 0.6-1.5
Grade 1-7 11.6 9.4-13.7
Grade 8-12 79.1 76.8-81.3
Completed tertiary/technical /university 8.1 6.5-9.8
Don’t know 0.2 0.0-4
Marital status of mother
Single 62.7 58.7-66.7
Married 32.1 28.2-35.9
Co-habitting 5.0 2.8-7.1
Widowed - -
Divorced/separated 0.3 0.0-0.6
Don’t know - -
Main building material of house
Brick/Cement block 87.4 84.8-90.1
Informal material/corrugated iron/wood 8.0 5.8-10.1
Traditional material/mud 4.6 2.5-6.7
other - -
Main source of drinking water Piped in house or yard 42.9 37.9-47.9
Not piped in house or yard 57.1 52.1-62.1
Type of toilet
Flush toilet 13.8 9.2-18.4
Pit latrine including ventilated pit latrine 81.8 77.2-86.4
None 4.3 2.7-5.9
Other 0.1 0.0-0.3
Main source of fuel Electricity/gas/paraffin 57.2 49.6-64.9
Other 42.8 35.1-50.4
Depletion of food supply in past
12 months
Yes 17.1 14.0-20.3
No 82.9 79.7-86.0
Don’t know - -
Was this pregnancy planned
Yes 52.6 49.9-55.3
No 47.4 44.7-50.1
Don’t know - -

41
Infant HIV Exposure and MTCT Rate in Limpopo
Text Box 5 shows that infants’ HIV exposure was 23.0%, with a 0.8% early infant HIV infection
prevalence and a 3.1% (95%CI: 1.2-4.9%) MTCT rate at 4-8 weeks. Among infants whose mothers
reported being HIV-negative 1.6% (95%CI: 0.9-2.3) were HIV-exposed, which is a significant
improvement over 2010.
Text Box 5: Limpopo HIV Infant Exposure and MTCT
2010
Infant HIV Exposure % (95%CI)
Infant HIV infection prevalence at 4-8
weeks
MTCT @ 4-8 weeks:%(95%CI)
%Infants of reported HIV-negative mothers who had HIV antibody
23.9 (21.8-25.9) 0.9 (0.4-1.5) 3.6 (1.4-5.8) 5.1 (3.6-6.7)
2011
Infant HIV Exposure %
(95%CI)
Infant HIV infection
prevalence at 4-8
weeks
MTCT @ 4-8
weeks:%(95%CI)
%Infants of reported
HIV-negative mothers
who had HIV antibody
23.0 (19.9-26.2) 0.8 (0.3-1.2) 3.1 (1.2-4.9) 1.6 (0.9-2.3)
MTCT service uptake (PMTCT cascade) in the Limpopo
The PMTCT cascade shows that less than 70% of mothers received their CD4 cell count test result
and 85.84% of HIV positive mothers received ARV prophylaxis or ART. (Figure 10)
Figure 10 PMTCT service uptake (PMTCT cascade) in Limpopo
Note: The first three indicators apply to all mothers, while the last three apply only to those who
reported being HIV-positive. Red indicates the percentage receiving ART while blue indicates the
percentage receiving ARV prophylaxis.
98.35 99.37
20.15
68.06
48.14 31.05
37.7
0
20
40
60
80
100
120
% ANC HIV Test % Tested whoreceived results
% Mothers whoreport beingHIV-positive
% Received CD4Test
% Mother &infant received
ARV Prophylaxis/ Mother on
HAART*
% Intended toobtain infant
PCR test
% ALL MOTHERS % MOTHERS REPORTED HIV-POSITIVE

42
3.6.6 Mpumalanga
The SAPMTCTE attained 80% of targeted sample size in the province of Mpumalanga.
General Description of Provincial Sample
In Mpumalanga more than 80% of study participants have brick/cement block houses, piped water
in house or yard, and electricity, paraffin or gas cooking fuel, but only 20.80% have a flush toilet.
Only 5.43% described depletion of food supply in the past 12 months. (Table 13)
Table 13 Baseline characteristics of Mpumalanga SAPMTCTE survey participants
2010
Characteristics Categories % 95% CI
Relationship to child Mother 95.0 94.3-95.8
Caregiver 5.0 4.2-5.7
Mean age of mother (Range) 25.3 (13-46)
Infant gender Male 50.3 48.1-52.5
Female 49.7 47.5-51.9
Education of mother None 3.0 2.3-3.7
Grade 1-7 17.9 15.7-20.2
Grade 8-12 75.2 72.9-77.5
Above Grade 12 2.1 1.3-2.9
Marital status of mother Single 74.8 72.6-77.1
Married/cohabitating 23.9 21.7-26.2
Main building material of house Brick/Cement block 85.7 82.5-88.9
Informal material 8.4 5.9-10.8
Traditional material/mud 5.9 3.8-8.0
Main source of drinking water
Piped in house or yard 83.9 79.9-87.9
Not piped in house or yard 16.1 12.1-20.1
Type of toilet
Flush toilet 30.3 23.9-36.7
Pit latrine 66.5 60.1-72.8
None 2.9 1.8-4.0
Other 0.3 0.1-0.6
Main source of fuel Electricity/Gas/Paraffin 88.3 65.6-77.2
Other 11.7 22.8-34.4
Depletion of food supply in past 12
months
Yes 8.9 6.6-11.2
No 89.1 86.6-91.6

43
2011
Characteristics Categories % 95% CI
Relationship to child
Mother 97.6 97.0-98.3
Father 0.3 0.0-0.6
Grandmother/grandfather 1.0 0.5-1.4
Guardian/legal guardian 0.5 0.2-0.9
Caregiver 0.6 0.2-0.9
Mean age of mother (range)
Infant gender Male 50.4 48.5-52.2
Female 49.6 47.8-51.5
Education of mother
None 2.5 1.6-3.4
Grade 1-7 18.6 15.7-21.6
Grade 8-12 76.5 73.5-79.6
Completed tertiary/technical /university 2.1 1.4-2.8
Don’t know 0.2 0.0-0.5
Marital status of mother
Single 82.0 79.5-84.5
Married 15.4 12.8-18.1
Co-habitting 2.2 1.4-3.1
Widowed 0.2 0.0-0.4
Divorced/separated 0.1 0.0-0.3
Don’t know - -
Main building material of house
Brick/Cement block 89.9 87.2-92.5
Informal material/corrugated iron/wood 8.0 5.5-10.4
Traditional material/mud 2.1 0.9-3.3
other 0.1 0.0-0.2
Main source of drinking water Piped in house or yard 85.4 80.5-90.2
Not piped in house or yard 14.6 9.8-19.5
Type of toilet
Flush toilet 20.8 14.9-26.7
Pit latrine including ventilated pit latrine 78.9 73.0-84.8
None 0.3 0.1-0.6
Other - -
Main source of fuel Electricity/gas/paraffin 97.3 96.0-98.6
Other 2.7 1.3-4.0
Depletion of food supply in past
12 months
Yes 5.4 3.6-7.3
No 94.4 92.5-96.4
Don’t know 0.1 0.0-0.3
Was this pregnancy planned
Yes 47.1 41.6-52.7
No 52.8 47.3-58.3
Don’t know 0.1 0.0-0.2
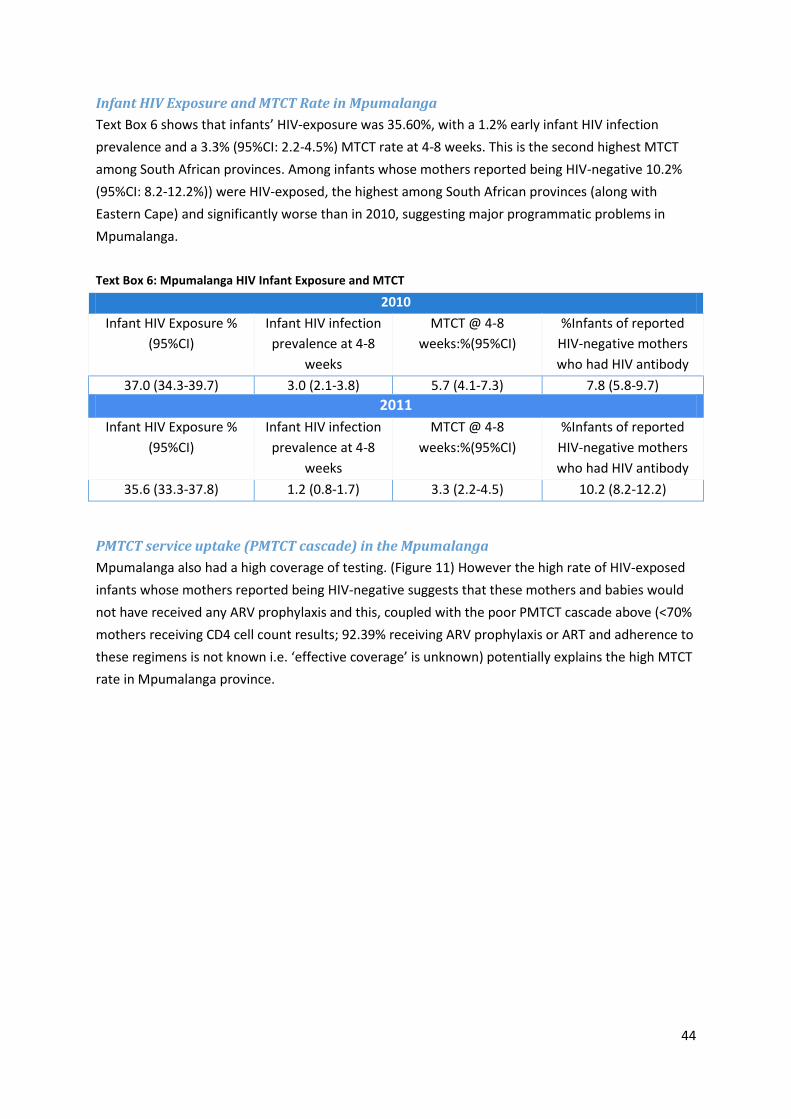
44
Infant HIV Exposure and MTCT Rate in Mpumalanga
Text Box 6 shows that infants’ HIV-exposure was 35.60%, with a 1.2% early infant HIV infection
prevalence and a 3.3% (95%CI: 2.2-4.5%) MTCT rate at 4-8 weeks. This is the second highest MTCT
among South African provinces. Among infants whose mothers reported being HIV-negative 10.2%
(95%CI: 8.2-12.2%)) were HIV-exposed, the highest among South African provinces (along with
Eastern Cape) and significantly worse than in 2010, suggesting major programmatic problems in
Mpumalanga.
Text Box 6: Mpumalanga HIV Infant Exposure and MTCT
2010
Infant HIV Exposure %
(95%CI)
Infant HIV infection
prevalence at 4-8
weeks
MTCT @ 4-8
weeks:%(95%CI)
%Infants of reported
HIV-negative mothers
who had HIV antibody
37.0 (34.3-39.7) 3.0 (2.1-3.8) 5.7 (4.1-7.3) 7.8 (5.8-9.7)
2011
Infant HIV Exposure %
(95%CI)
Infant HIV infection
prevalence at 4-8
weeks
MTCT @ 4-8
weeks:%(95%CI)
%Infants of reported
HIV-negative mothers
who had HIV antibody
35.6 (33.3-37.8) 1.2 (0.8-1.7) 3.3 (2.2-4.5) 10.2 (8.2-12.2)
PMTCT service uptake (PMTCT cascade) in the Mpumalanga
Mpumalanga also had a high coverage of testing. (Figure 11) However the high rate of HIV-exposed
infants whose mothers reported being HIV-negative suggests that these mothers and babies would
not have received any ARV prophylaxis and this, coupled with the poor PMTCT cascade above (<70%
mothers receiving CD4 cell count results; 92.39% receiving ARV prophylaxis or ART and adherence to
these regimens is not known i.e. ‘effective coverage’ is unknown) potentially explains the high MTCT
rate in Mpumalanga province.

45
Figure 11 PMTCT service uptake (PMTCT cascade) in Mpumalanga
Note: The first three indicators apply to all mothers, while the last three apply only to those who
reported being HIV-positive. Red indicates the percentage receiving ART while blue indicates the
percentage receiving ARV prophylaxis.
98.37 99.04
29.07
66.63 60.54
41.2
31.85
0
20
40
60
80
100
120
% ANC HIV Test % Tested whoreceived results
% Mothers whoreport beingHIV-positive
% Received CD4Test
% Mother &infant received
ARV Prophylaxis/ Mother on
HAART*
% Intended toobtain infant
PCR test
% ALL MOTHERS % MOTHERS REPORTED HIV-POSITIVE
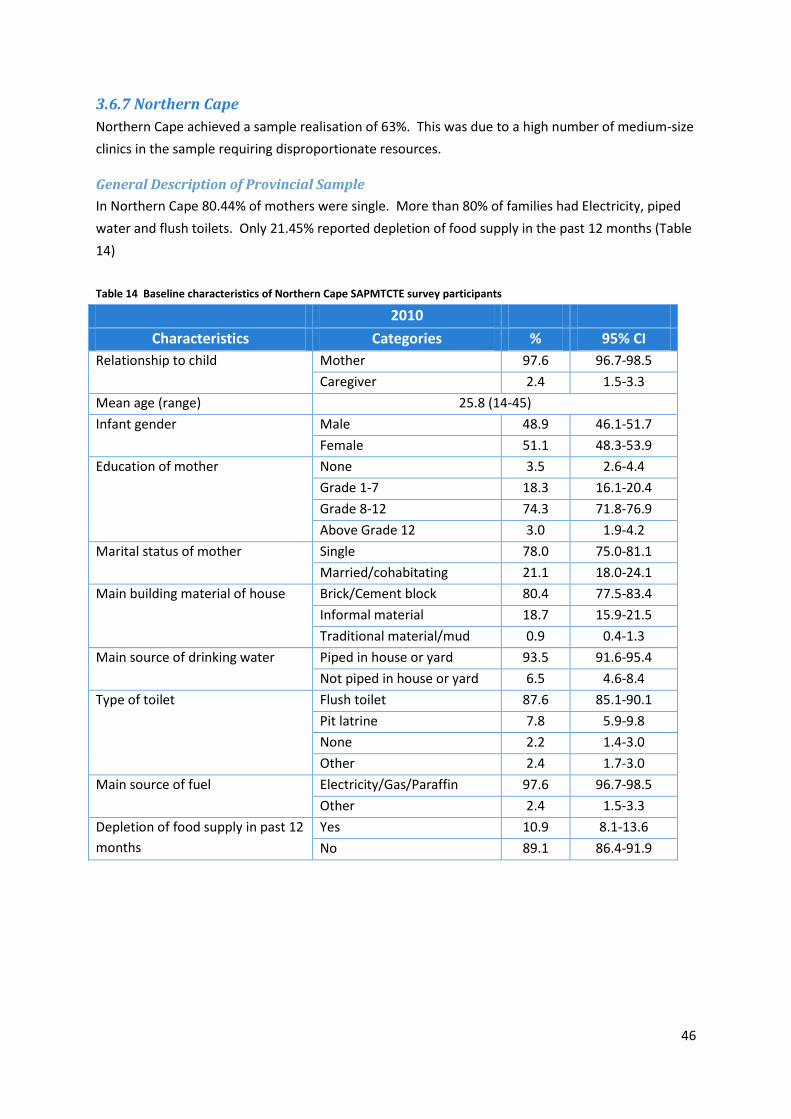
46
3.6.7 Northern Cape
Northern Cape achieved a sample realisation of 63%. This was due to a high number of medium-size
clinics in the sample requiring disproportionate resources.
General Description of Provincial Sample
In Northern Cape 80.44% of mothers were single. More than 80% of families had Electricity, piped
water and flush toilets. Only 21.45% reported depletion of food supply in the past 12 months (Table
14)
Table 14 Baseline characteristics of Northern Cape SAPMTCTE survey participants
2010
Characteristics Categories % 95% CI
Relationship to child Mother 97.6 96.7-98.5
Caregiver 2.4 1.5-3.3
Mean age (range) 25.8 (14-45)
Infant gender Male 48.9 46.1-51.7
Female 51.1 48.3-53.9
Education of mother None 3.5 2.6-4.4
Grade 1-7 18.3 16.1-20.4
Grade 8-12 74.3 71.8-76.9
Above Grade 12 3.0 1.9-4.2
Marital status of mother Single 78.0 75.0-81.1
Married/cohabitating 21.1 18.0-24.1
Main building material of house Brick/Cement block 80.4 77.5-83.4
Informal material 18.7 15.9-21.5
Traditional material/mud 0.9 0.4-1.3
Main source of drinking water
Piped in house or yard 93.5 91.6-95.4
Not piped in house or yard 6.5 4.6-8.4
Type of toilet
Flush toilet 87.6 85.1-90.1
Pit latrine 7.8 5.9-9.8
None 2.2 1.4-3.0
Other 2.4 1.7-3.0
Main source of fuel Electricity/Gas/Paraffin 97.6 96.7-98.5
Other 2.4 1.5-3.3
Depletion of food supply in past 12
months
Yes 10.9 8.1-13.6
No 89.1 86.4-91.9

47
2011
Characteristics Categories % 95% CI
Relationship to child
Mother 98.6 97.9-99.3
Father - -
Grandmother/grandfather 0.6 0.2-1.0
Guardian/legal guardian 0.8 0.3-1.3
Caregiver - -
Mean age of mother (range)
Infant gender Male 54.2 51.5-56.8
Female 45.8 43.2-48.5
Education of mother
None 2.0 1.2-2.8
Grade 1-7 14.0 11.7-16.4
Grade 8-12 82.0 79.7-84.3
Completed tertiary/technical /university 1.4 0.6-2.2
Don’t know 0.6 0.2-1.0
Marital status of mother
Single 80.4 77.5-83.4
Married 18.0 14.8-21.1
Co-habitting 1.0 0.1-1.9
Widowed 0.6 0.2-1.0
Divorced/separated - -
Don’t know - -
Main building material of house
Brick/Cement block 79.2 75.3-83.2
Informal material/corrugated iron/wood 20.8 16.8-24.7
Traditional material/mud - -
other - -
Main source of drinking water Piped in house or yard 90.3 87.6-93.0
Not piped in house or yard 9.7 7.0-12.4
Type of toilet
Flush toilet 80.6 76.7-84.5
Pit latrine including ventilated pit latrine 11.9 9.2-14.5
None 3.4 2.0-4.7
Other 4.2 2.5-5.8
Main source of fuel Electricity/gas/paraffin 96.2 94.60-97.89
Other 3.8 2.11-5.40
Depletion of food supply in past
12 months
Yes 21.4 18.5-23.8
No 78.7 75.9-81.4
Don’t know 0.2 0.0-0.4
Was this pregnancy planned
Yes 38.7 34.5-42.9
No 60.9 56.7-65.1
Don’t know 0.4 0.1-0.8

48
Infant HIV Exposure and MTCT Rate in the Northern Cape
Text Box 7 shows that infants’ HIV-exposure was 15.1%, with a 1.0% early infant HIV infection
prevalence and a 6.1% (95%CI: 2.5-9.6%) MTCT rate at 4-8 weeks. The larger confidence interval
attached to this estimate is due to the smaller sample size attained in Northern Cape.
Text Box 7: Infant HIV Exposure and MTCT Rate Northern Cape
2010
Infant HIV Exposure %
(95%CI)
Infant HIV infection
prevalence at 4-8
weeks
MTCT @ 4-8
weeks:%(95%CI)
%Infants of reported
HIV-negative mothers
who had HIV antibody
16.0 (13.7-18.3) 0.3 (0.1-0.6) 1.4 (0.1-3.4) 2.2 (1.2-3.3)
2011
Infant HIV Exposure %
(95%CI)
Infant HIV infection
prevalence at 4-8
weeks
MTCT @ 4-8
weeks:%(95%CI)
%Infants of reported
HIV-negative mothers
who had HIV antibody
15.1 (12.7-17.5) 1.0 (0.4-1.6) 6.1 (2.5-9.6) 1.9 (1.2-2.7)
PMTCT service uptake (PMTCT cascade) in the Northern Cape
Northern Cape has the lowest intended early infant diagnosis coverage of all provinces. Very few
(11.59%) HI- positive mothers indicated an intention to receive infant testing service at the 6-week
immunisation visit. However, thet CD4-cell count uptake is reported in the Northern Cape, at
76.81%. Other PMTCT cascade indicators of the province have above 90% coverage, similar to other
provinces. The rate of maternal potential HIV acquisition was 0.48% (upper limit 0.91%). The low
MTCT rate is likely due to the high coverage of the PMTCT cascade in Northern Cape and the lower
HIV acquisition rate compared with other provinces.

49
Figure 12 PMTCT service uptake (PMTCT cascade) in the Northern Cape
Note: The first three indicators apply to all mothers, while the last three apply only to those who
reported being HIV-positive. Red indicates the percentage receiving ART while blue indicates the
percentage receiving ARV prophylaxis.
98.98 99.79
14.29
76.81
46.38 11.59
52.17
0
20
40
60
80
100
120
% ANC HIV Test % Tested whoreceived results
% Mothers whoreport beingHIV-positive
% Received CD4Test
% Mother &infant received
ARV Prophylaxis/ Mother on
HAART*
% Intended toobtain infant
PCR test
% ALL MOTHERS % MOTHERS REPORTED HIV-
POSITIVE
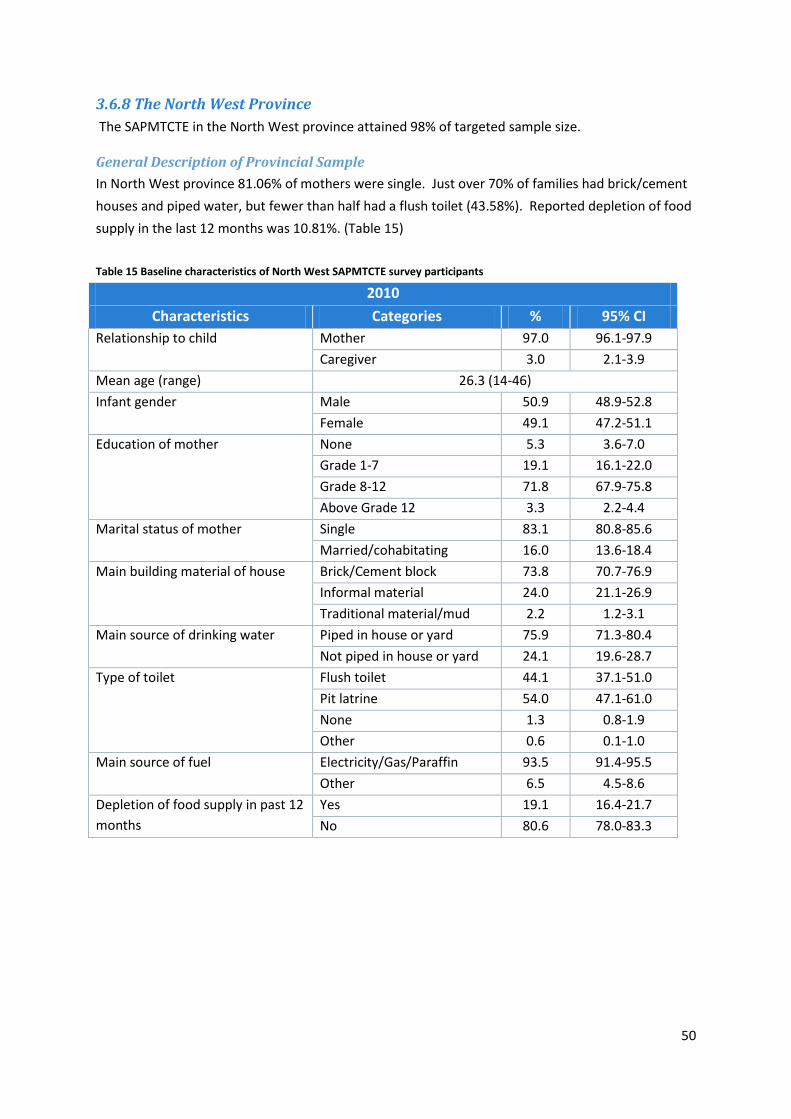
50
3.6.8 The North West Province
The SAPMTCTE in the North West province attained 98% of targeted sample size.
General Description of Provincial Sample
In North West province 81.06% of mothers were single. Just over 70% of families had brick/cement
houses and piped water, but fewer than half had a flush toilet (43.58%). Reported depletion of food
supply in the last 12 months was 10.81%. (Table 15)
Table 15 Baseline characteristics of North West SAPMTCTE survey participants
2010
Characteristics Categories % 95% CI
Relationship to child Mother 97.0 96.1-97.9
Caregiver 3.0 2.1-3.9
Mean age (range) 26.3 (14-46)
Infant gender Male 50.9 48.9-52.8
Female 49.1 47.2-51.1
Education of mother None 5.3 3.6-7.0
Grade 1-7 19.1 16.1-22.0
Grade 8-12 71.8 67.9-75.8
Above Grade 12 3.3 2.2-4.4
Marital status of mother Single 83.1 80.8-85.6
Married/cohabitating 16.0 13.6-18.4
Main building material of house Brick/Cement block 73.8 70.7-76.9
Informal material 24.0 21.1-26.9
Traditional material/mud 2.2 1.2-3.1
Main source of drinking water
Piped in house or yard 75.9 71.3-80.4
Not piped in house or yard 24.1 19.6-28.7
Type of toilet
Flush toilet 44.1 37.1-51.0
Pit latrine 54.0 47.1-61.0
None 1.3 0.8-1.9
Other 0.6 0.1-1.0
Main source of fuel Electricity/Gas/Paraffin 93.5 91.4-95.5
Other 6.5 4.5-8.6
Depletion of food supply in past 12
months
Yes 19.1 16.4-21.7
No 80.6 78.0-83.3

51
2011
Characteristics Categories % 95% CI
Relationship to child
Mother 97.4 96.6-98.1
Father 0.2 0.0-0.4
Grandmother/grandfather 1.8 1.2-2.4
Guardian/legal guardian 0.3 0.1-0.5
Caregiver 0.4 0.1-0.7
Mean age of mother (range)
Infant gender Male 46.8 44.5-49.2
Female 53.2 50.8-55.5
Education of mother
None 3.5 2.4-4.5
Grade 1-7 21.0 18.5-23.6
Grade 8-12 70.9 67.8-73.9
Completed tertiary/technical /university 4.5 3.2-5.8
Don’t know 0.2 0.0-0.3
Marital status of mother
Single 81.1 78.4-83.8
Married 16.6 14.1-19.0
Co-habitting 1.8 1.1-2.4
Widowed 0.4 0.1-0.8
Divorced/separated 0.2 0.0-0.4
Don’t know - -
Main building material of house
Brick/Cement block 74.5 71.2-77.8
Informal material/corrugated iron/wood 23.5 20.2-26.7
Traditional material/mud 2.0 1.0-3.2
other - -
Main source of drinking water Piped in house or yard 74.8 68.9-80.7
Not piped in house or yard 25.2 19.3-31.1
Type of toilet
Flush toilet 43.6 35.8-51.4
Pit latrine including ventilated pit latrine 54.3 46.6-62.0
None 2.0 1.3-2.8
Other 0.1 0.0-0.2
Main source of fuel Electricity/gas/paraffin 96.0 94.8-97.2
Other 4.0 2.8-5.2
Depletion of food supply in past
12 months
Yes 10.8 8.5-13.1
No 88.5 86.29-90.80
Don’t know 0.7 0.26-1.03
Was this pregnancy planned
Yes 34.5 31.44-37.48
No 64.7 61.68-67.77
Don’t know 0.8 0.27-1.37

52
Infant HIV Exposure and MTCT Rate in North West Province
Text Box 8 shows that infants’ HIV-exposure was 30.8%, with a 0.8% early infant HIV infection
prevalence and a 2.6 (95% CI 1.1-4.0%) MTCT rate at 4-8 weeks. The percentage of infants with
reported HIV-negative mothers who were actually HIV-exposed (presumed maternal HIV acquisition)
was 3.7% (95%CI: 2.5-4.9%) was significantly lower than in 2010.
Text Box 8: Infant HIV Exposure and MTCT Rate in North West Province
2010
Infant HIV Exposure %
(95%CI)
Infant HIV infection
prevalence at 4-8
weeks
MTCT @ 4-8
weeks:%(95%CI)
% Infants of reported
HIV-negative mothers
who had HIV antibody
31.3 (29.0-33.5) 1.9 (1.2-2.5) 4.4 (2.9-5.9) 5.4 (3.9-6.8)
2011
Infant HIV Exposure %
(95%CI)
Infant HIV infection
prevalence at 4-8
weeks
MTCT @ 4-8
weeks:%(95%CI)
%Infants of reported
HIV-negative mothers
who had HIV antibody
30.8 (28.5-33.1) 0.8 (0.4-1.2) 2.6 (1.1-4.0) 3.7 (2.5-4.9)
PMTCT Service Uptake (PMTCT cascade) in the North West Province
North West study participants had close to 100% HIV testing rate, but lower coverage of CD4 count
(74.16%) and EID services. The province ranked as the second lowest in intended EID coverage.
Only 12.99% of HIV-positive mothers in the sample intended to receive EID at the time of
immunisation visit. The higher rate of infants with reported HIV-negative mothers who were HIV-
exposed and who would not have received any PMTCT interventions, coupled with a only a 93.29%
coverage of ARV prophylaxis / ART may explain the somewhat higher MTCT rate measured in the
North West province.

53
Figure 13 PMTCT service uptake (PMTCT cascade) in the North West Province
Note: The first three indicators apply to all mothers, while the last three apply only to those who
reported being HIV-positive. Red indicates the percentage receiving ART while blue indicates the
percentage receiving ARV prophylaxis.
99.14 99.09
29.19
74.16
44.03 12.99
49.26
0
20
40
60
80
100
120
% ANC HIV Test % Tested whoreceived results
% Mothers whoreport beingHIV-positive
% Received CD4Test
% Mother &infant received
ARV Prophylaxis/ Mother on
HAART*
% Intended toobtain infant
PCR test
% ALL MOTHERS % MOTHERS REPORTED HIV-POSITIVE

54
3.6.9 Western Cape
The SAPMTCTE in the Western Cape attained 99% of targeted sample size.
General Description of Provincial Sample
The majority of Western Cape participants reported use of piped water (in house) (98.01%), flush
toilet (92.61%) and electricity, gas or paraffin (99.56%) for their fuel needs. However, a substantial
percentage (29.74%) of the participants reported living in a house built from informal materials. A
large percentage (14.80%) of respondents also reported that they experienced food shortage at least
once in the last 12 months. (Table 16)
Table 16 Baseline characteristics of Western Cape SAPMTCTE survey participants
Characteristics Categories % 95% CI
Relationship to child Mother 97.1 96.3-97.9
Caregiver 2.9 2.1-3.7
Mean age (range) 26.4 (14-47)
Infant gender Male 49.7 47.4-52.0
Female 50.3 48.0-52.6
Education of mother None 0.8 0.3-1.3
Grade 1-7 15.1 12.2-17.9
Grade 8-12 76.2 73.0-79.4
Above Grade 12 7.3 5.1-9.5
Marital status of mother Single 54.3 50.5-58.1
Married/cohabitating 44.0 40.2-47.8
Main building material of house Brick/Cement block 68.5 63.3-73.7
Informal material 31.1 26.0-36.3
Traditional material/mud 0.4 0.1-0.6
Main source of drinking water
Piped in house or yard 93.9 91.9-95.8
Not piped in house or yard 6.1 4.2-8.0
Type of toilet
Flush toilet 90.7 88.4-93.0
Pit latrine 5.6 3.5-7.7
None 1.3 0.6-2.0
Other 2.4 1.5-3.3
Main source of fuel Electricity/Gas/Paraffin 99.3 99.0-99.7
Other 0.7 0.3-1.0
Depletion of food supply in past 12
months
Yes 26.1 22.9-29.2
No 73.0 69.9-76.0
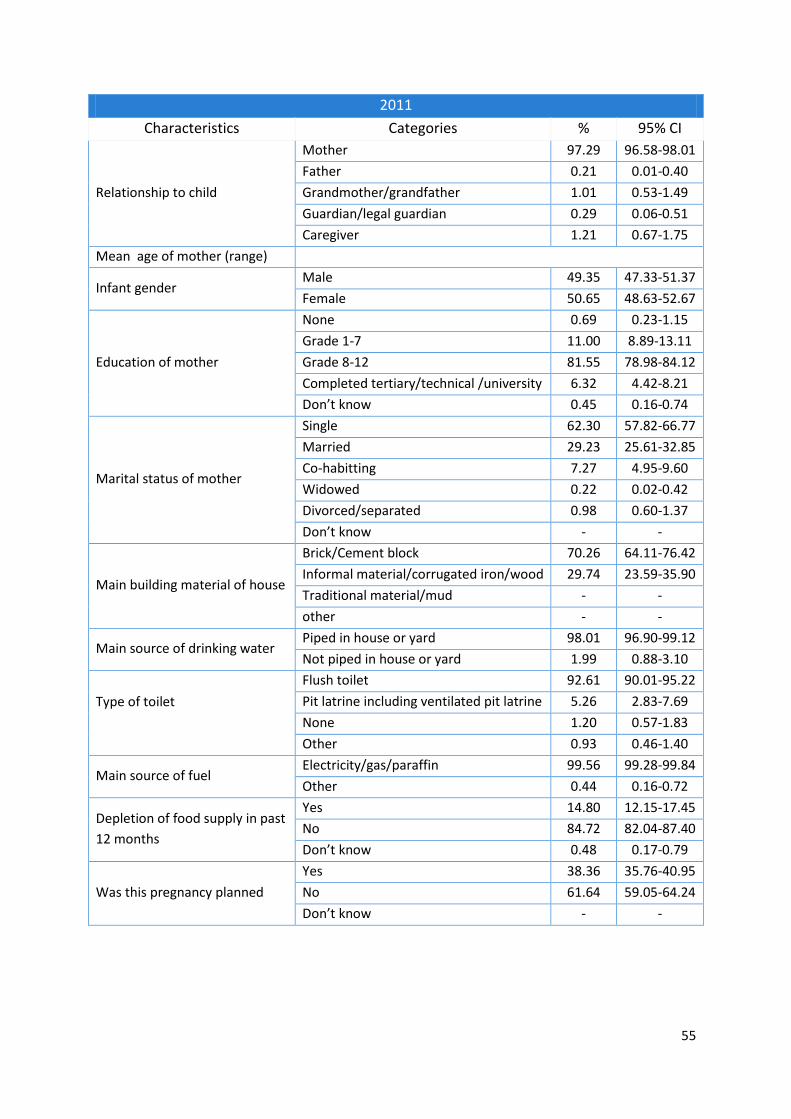
55
2011
Characteristics Categories % 95% CI
Relationship to child
Mother 97.29 96.58-98.01
Father 0.21 0.01-0.40
Grandmother/grandfather 1.01 0.53-1.49
Guardian/legal guardian 0.29 0.06-0.51
Caregiver 1.21 0.67-1.75
Mean age of mother (range)
Infant gender Male 49.35 47.33-51.37
Female 50.65 48.63-52.67
Education of mother
None 0.69 0.23-1.15
Grade 1-7 11.00 8.89-13.11
Grade 8-12 81.55 78.98-84.12
Completed tertiary/technical /university 6.32 4.42-8.21
Don’t know 0.45 0.16-0.74
Marital status of mother
Single 62.30 57.82-66.77
Married 29.23 25.61-32.85
Co-habitting 7.27 4.95-9.60
Widowed 0.22 0.02-0.42
Divorced/separated 0.98 0.60-1.37
Don’t know - -
Main building material of house
Brick/Cement block 70.26 64.11-76.42
Informal material/corrugated iron/wood 29.74 23.59-35.90
Traditional material/mud - -
other - -
Main source of drinking water Piped in house or yard 98.01 96.90-99.12
Not piped in house or yard 1.99 0.88-3.10
Type of toilet
Flush toilet 92.61 90.01-95.22
Pit latrine including ventilated pit latrine 5.26 2.83-7.69
None 1.20 0.57-1.83
Other 0.93 0.46-1.40
Main source of fuel Electricity/gas/paraffin 99.56 99.28-99.84
Other 0.44 0.16-0.72
Depletion of food supply in past
12 months
Yes 14.80 12.15-17.45
No 84.72 82.04-87.40
Don’t know 0.48 0.17-0.79
Was this pregnancy planned
Yes 38.36 35.76-40.95
No 61.64 59.05-64.24
Don’t know - -

56
Infant HIV Exposure and MTCT Rate in Western Cape
Text Box 9 shows that infants’ HIV-exposure was 17.8%, with a 0.4% early infant HIV infection
prevalence and a 1.98% (95% CI 0.65-3.31%) MTCT rate at 4-8 weeks, which was significantly lower
than in 2010. The percentage of infants with reported HIV-negative mothers who were actually HIV-
exposed (presumed maternal HIV acquisition) was 0.7% (95%CI: 0.3-1.2%) was the lowest in South
Africa. These data potentially suggest the Western Cape has the best quality and most effective
PMTCT programme.
Text Box 9: Infant HIV Exposure and MTCT Rate in Western Cape
2010
Infant HIV Exposure %
(95%CI)
Infant HIV infection
prevalence at 4-8
weeks
MTCT @ 4-8
weeks:%(95%CI)
%Infants of reported
HIV-negative mothers
who had HIV antibody
21.0 (30.7-33.3) 0.9 (0.4-1.5) 3.9 (1.9-5.8) 1.1 (0.3-1.9)
2011
Infant HIV Exposure %
(95%CI)
Infant HIV infection
prevalence at 4-8
weeks
MTCT @ 4-8
weeks:%(95%CI)
%Infants of reported
HIV-negative mothers
who had HIV antibody
17.8 (14.8-20.8) 0.4 (0.1-0.6) 1.98 (0.65-3.31) 0.7 (0.3-1.2)
PMTCT service uptake (PMTCT cascade) in the Western Cape
The Western Cape had close to 100% (97.73%) antenatal HIV testing rate. Almost all (99.41%)
mothers who had antenatal HIV testing received their result. About 97.41% of the HIV-positive
mothers were on either ART or ARV prophylaxis (including infant prophylaxis if mother is not on
ART). Similar to other provinces, the majority of the mothers did not plan to receive EID services
during the six-week immunisation visit.

57
Figure 14 PMTCT service uptake (PMTCT cascade) in the Western Cape Province
Note: The first three indicators apply to all mothers, while the last three apply only to those who
reported being HIV-positive. Red indicates the percentage receiving ART while blue indicates the
percentage receiving ARV prophylaxis.
97.73 99.41
17.21
86.42
47.58 46.31
47.58
0
20
40
60
80
100
120
% ANC HIV Test % Tested whoreceived results
% Mothers whoreport beingHIV-positive
% Received CD4Test
% Mother &infant received
ARV Prophylaxis/ Mother on
HAART*
% Intended toobtain infant
PCR test
% ALL MOTHERS % MOTHERS REPORTED HIV-POSITIVE

58
3.7 Infant Feeding
HIV-positive mothers who recalled receiving infant feeding counselling during antenatal care was
89.2% with a range from 77.9% in Limpopo to 92.4% in Gauteng and KwaZulu-Natal.
Among all infants (regardless of HIV exposure status) 44.8% (95% CI 43.2-46.3%) were mixed
breastfeeding; 28.0% (95% CI 25.6-29.4%) were exclusively breastfed in the 8 days prior to the 4-8
week interview and 27.2% (95% CI 26.1-28.3%) received no breast milk.
We categorised HIV-exposed infants who received breast milk plus any other milk or food (not
including prescribed medicines) over the past eight days as being at-risk as they were practicing
mixed breastfeeding. This ranged from a low of 9.6% in Gauteng to a high of 33.0% in Limpopo, with
a national average of 14.0% (Table 17). It is interesting to note that the province with the lowest
rate of infant feeding counselling (82% in Limpopo province) had high rates of at risk infant feeding
in HIV-exposed infants (33%).

59
Table 17 Infant feeding practices amongst HIV exposed infants over the past 8 days by province
Province
Mother reportedly
received infant feeding counseling during
ANC % (95% CI)
At Risk/ Mixed Feeding
% (95% CI)
Exclusive Breastfeeding
2010 2011 2010 2011 2010 2011
Eastern Cape 82.4 (76.1-88.8) 94.2 (91.3-97.3) 20.3 (16.6-23.9) 9.9 (6.7-13.0) 14.8 (11.3-18.2) 23.2 (17.8-28.6)
Free State 91.6 (88.7-94.6) 95.5 (93.7-97.4) 22.9 (19.1-26.8) 19.2 (14.9-23.5) 18.0 (14.5-21.5) 35.1 (30.1-40.1)
Gauteng 92.4 (89.7-95.1) 91.8 (87.9-95.6) 14.8 (11.4-18.1) 9.6 (6.2-13.0) 19.6 (15.9-23.2) 37.6 (32.2-43.0)
KwaZulu-Natal 92.4 (90.0-94.8) 97.2 (95.2-99.2) 14.0 (10.5-17.5) 10.4 (6.9-13.9) 26.1 (21.2-31.1) 42.5 (37.1-47.9)
Limpopo 77.9 (72.0-83.7) 82.2 (76.2-88.2) 32.8 (27.0-38.7) 33.0 (25.9-40.1 20.3 (15.5-25.1) 28.3 (21.5-35.0)
Mpumalanga 91.5 (88.4-94.6) 93.5 (91.5-95.4) 29.7 (26.0-33.4) 20.6 (15.5-25.6) 13.9 (11.01-16.8) 34.5 (28.6-40.5)
Northern Cape 81.0 (73.3-88.6) 94.2 (90.3-98.2) 23.9 (16.1-31.8) 21.7 (13.8-29.7) 43.7 (37.0-50.3) 43.5 (35.9-51.1)
North West 81.5 (76.1-86.8) 90.6 (87.3-94.0) 21.3 (17.5-25.1) 23.2 (16.7-29.7) 25.7 (21.3-30.0) 38.9 (33.0-44.8)
Western Cape 85.3 (80.5-90.1) 95.0 (92.6-97.3) 7.0 (4.3-9.6) 11.4 (7.3-15.4) 7.9 (5.3-10.4) 18.8 (13.9)
South Africa 89.2 (87.8-90.6) 93.3 (92.0-94.7) 18.1 (16.5-19.7) 14.0 (12.3-15.7) 20.4 (18.5-22.3) 35.5 (33.1-38.0)

60
There are several encouraging findings with regards to infant feeding:
Among mothers of HIV-exposed infants:
o 35.5% (33.12-38.0%) reported exclusive breastfeeding over the past 8 days, which is
a significant increase from the 20.4% (95% CI 18.5-22.3%) reported in 2010.
o The prevalence of exclusive breastfeeding measured in the 2011 survey was lowest
in the Western Cape Province and highest in Kwa Zulu Natal and Northern Cape
Provinces. However in at least all provinces except for Limpopo and Northern Cape a
significant increase in exclusive breastfeeding was measured between 2010 and
2011
o 47.1% (44.9-49.3%) reported avoiding breastmilk, which is a reduction from the
61.5% (59.2-63.8) measured in 2010.
o There was a significant increase in reported infant feeding counseling between 2010
and 2011 and the significant reduction in mixed feeding (at risk feeding) between
2010 and 2011.
Amongst mothers of HIV unexposed infants:
o 43.6% (41.6%-45.7%) reported exclusive breastfeeding over the past 8 days in 2011
compared with 31.3% (29.-33.0%) in 2012, illustrating a significant increase in
exclusive breastfeeding in 2011 compared with 2010.
o The Eastern Cape and Limpopo provinces recorded the lowest prevalence of
exclusive breastfeeding. This is especially worrying as these are both rural provinces.
The prevalence of exclusive breastfeeding was highest in the Kwa Zulu Natal and
Mpumalanga provinces.
o The prevalence of exclusive breastfeeding showed a significant increase between
the 2010 and 2011 surveys in all provinces except Limpopo, Northern Cape and
North West provinces.
o Data also show a reduction in mixed feeding amongst HIV unexposed infants: In
2010 57.4% (55.5-59.2%) reported mixed feeding whereas in 2011 this dropped to
46.2% (44.2-48.3%).
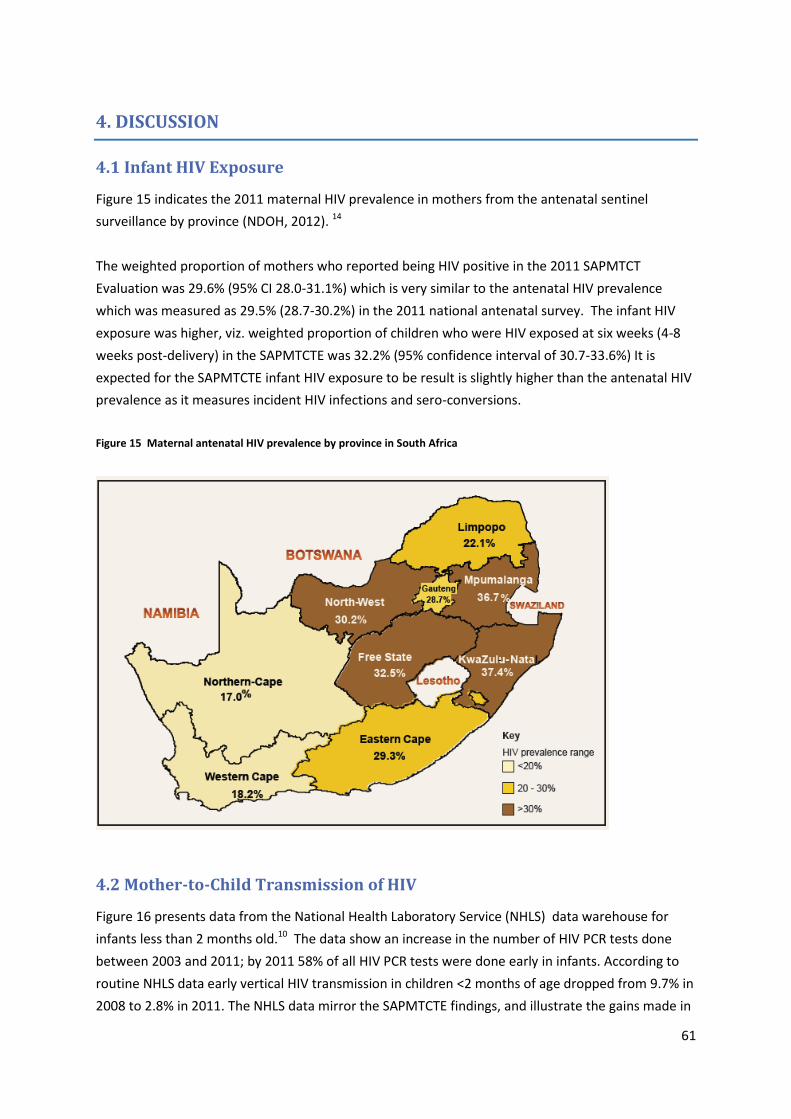
61
4. DISCUSSION
4.1 Infant HIV Exposure
Figure 15 indicates the 2011 maternal HIV prevalence in mothers from the antenatal sentinel
surveillance by province (NDOH, 2012). 14
The weighted proportion of mothers who reported being HIV positive in the 2011 SAPMTCT
Evaluation was 29.6% (95% CI 28.0-31.1%) which is very similar to the antenatal HIV prevalence
which was measured as 29.5% (28.7-30.2%) in the 2011 national antenatal survey. The infant HIV
exposure was higher, viz. weighted proportion of children who were HIV exposed at six weeks (4-8
weeks post-delivery) in the SAPMTCTE was 32.2% (95% confidence interval of 30.7-33.6%) It is
expected for the SAPMTCTE infant HIV exposure to be result is slightly higher than the antenatal HIV
prevalence as it measures incident HIV infections and sero-conversions.
Figure 15 Maternal antenatal HIV prevalence by province in South Africa
4.2 Mother-to-Child Transmission of HIV
Figure 16 presents data from the National Health Laboratory Service (NHLS) data warehouse for
infants less than 2 months old.10 The data show an increase in the number of HIV PCR tests done
between 2003 and 2011; by 2011 58% of all HIV PCR tests were done early in infants. According to
routine NHLS data early vertical HIV transmission in children <2 months of age dropped from 9.7% in
2008 to 2.8% in 2011. The NHLS data mirror the SAPMTCTE findings, and illustrate the gains made in
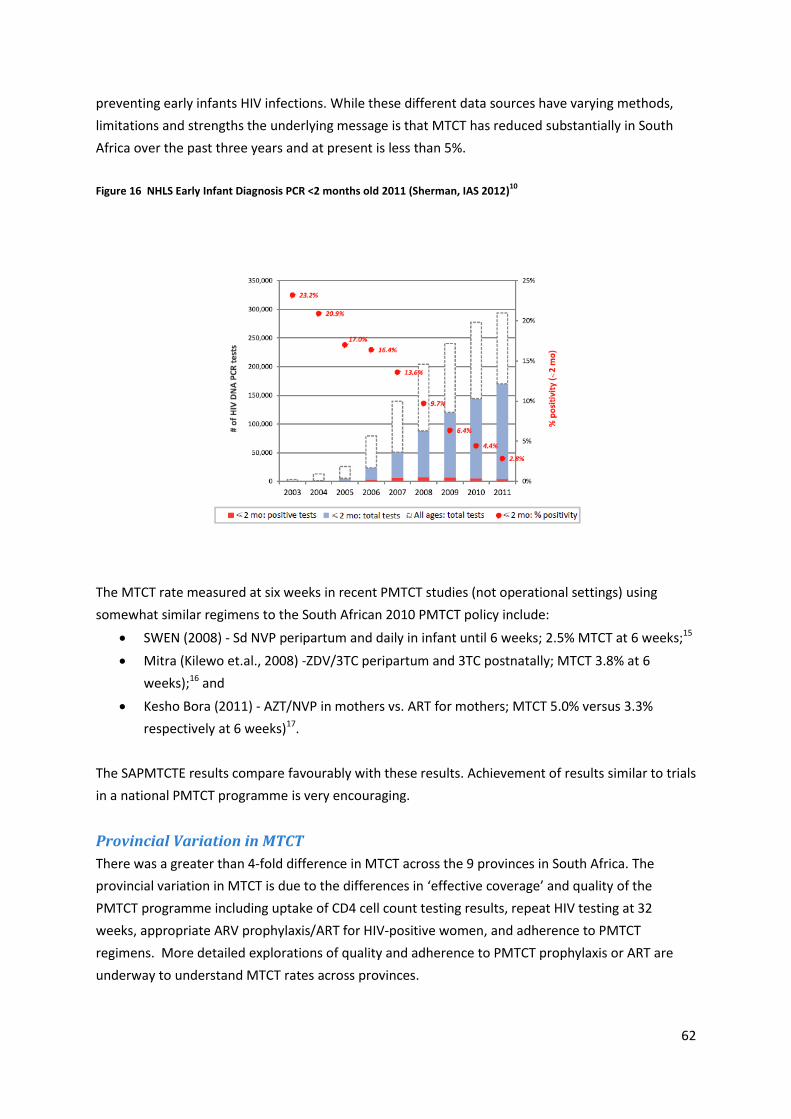
62
preventing early infants HIV infections. While these different data sources have varying methods,
limitations and strengths the underlying message is that MTCT has reduced substantially in South
Africa over the past three years and at present is less than 5%.
Figure 16 NHLS Early Infant Diagnosis PCR <2 months old 2011 (Sherman, IAS 2012)10
The MTCT rate measured at six weeks in recent PMTCT studies (not operational settings) using
somewhat similar regimens to the South African 2010 PMTCT policy include:
SWEN (2008) - Sd NVP peripartum and daily in infant until 6 weeks; 2.5% MTCT at 6 weeks;15
Mitra (Kilewo et.al., 2008) -ZDV/3TC peripartum and 3TC postnatally; MTCT 3.8% at 6
weeks);16 and
Kesho Bora (2011) - AZT/NVP in mothers vs. ART for mothers; MTCT 5.0% versus 3.3%
respectively at 6 weeks)17.
The SAPMTCTE results compare favourably with these results. Achievement of results similar to trials
in a national PMTCT programme is very encouraging.
Provincial Variation in MTCT
There was a greater than 4-fold difference in MTCT across the 9 provinces in South Africa. The
provincial variation in MTCT is due to the differences in ‘effective coverage’ and quality of the
PMTCT programme including uptake of CD4 cell count testing results, repeat HIV testing at 32
weeks, appropriate ARV prophylaxis/ART for HIV-positive women, and adherence to PMTCT
regimens. More detailed explorations of quality and adherence to PMTCT prophylaxis or ART are
underway to understand MTCT rates across provinces.

63
4.3 PMTCT Cascade
Missed opportunities along the PMTCT cascade of services (Stringer et.al., 2003) can reduce both the
coverage and quality of the PMTCT programme. HIV Testing in ANC clinics is the entry point into the
PMTCT programme. High coverage of this and each subsequent step reduces missed opportunities
for care. In 2011, ANC HIV testing by mothers was almost universal 98.3% but services further along
the cascade were not as high, with only 77.4% of HIV-positive mothers getting a CD4 count. These
were similar to 2010 data. The percentage of of mothers and infants received ARV prophylaxis or
treatment according to protocol increased slightly to 93.9% (from 91.3% in 2010). This data does
show improvement over a previous report from KwaZulu-Natal where prior to a quality
improvement intervention only 85% of women were tested in ANC, 40% received a CD4 test and
only 15% were given appropriate ARV prophylaxis (Doherty et.al., 2009). After the intervention, the
data from the Doherty study was comparable to the SAPMTCTE with 98% ANC HIV testing, 97% CD4
testing and 68% appropriate ARV prophylaxis. There has been an effort in South Africa in the last
few years to improve the PMTCT programme through interventions like the one described by
Doherty et.al. (2009) as well as others (e.g. Best Practices in Prevention of Mother-to-Child
Transmission (PMTCT) of HIV South Africa; NDOH/MRC/UWC/UNICEF/USAID, 2009). These efforts
are clearly impacting PMTCT, as shown by programme indicators and infant outcomes (early MTCT)
as described in this report.
Of ALL mothers enrolled in the survey, 29.4% reported being HIV-positive while HIV antibody was
found in 32% of ALL infants. Of concern is that of those mothers who reported being HIV-negative,
3.9% of their infants had HIV antibodies, suggesting a high rate of maternal potential acquisition of
HIV infection during pregnancy. This rate also varied substantially across provinces from a low of
0.7% in the Western Cape to a high of 10.2% in Mpumalanga. The indicator ‘Maternal potential HIV
acquisition’ is a combination of the following scenarios:
i. Mothers do not wish to admit being HIV-positive and reported being HIV negative. The data
show that refusals for infant HIV testing were low and disclosure was high; thus the
contribution that this scenario makes to the indicator is probably minimal.
ii. Mothers were tested during the window period for the ANC test.
iii. Poor QC/performance of rapid tests in the field caused false negative results at ANC on HIV-
infected women. Reported field sensitivities are as low as 87% to 95% depending on the
rapid test. In correlation to this was mothers who reported being HIV-positive but for which
infant test HIV antibody negative which was 2.5% (95% CI 1.8-3.2%) and also suggests
potential problems with performance of rapid tests during ANC.
iv. True acquisition of HIV after the last HIV test – which for most mothers was during
pregnancy.
Regardless of the cause this group of women and infants represent a substantial missed opportunity
for care as the mothers and infants did not receive ARV prophylaxis or appropriate counselling and
represents a metric for PMTCT programme quality. The high rate of maternal potential HIV

64
acquisition is also worrying as it is higher than previously reported (3%) in a study conducted in
KwaZulu-Natal (Moodley et al., 2009).
4.4 Early Infant Diagnosis
Intention to obtain a PCR test at the six week immunization visit remain the same nationally
between 2010 and 2011 [35.1% (30.6-39.6%) versus 38.5% (34.3-42.6%)] respectively illustrating
persistent gaps in the integration between routine child health services and HIV-related care. The
Free State province is particularly concerning as 2011 data show that intention for infant HIV testing
at six weeks immunisation visits significantly reduced between 2010 and 2011 [43.7% (33.3-54.1%)
versus 24.6% (17.8-31.4%)] respectively. Marginally significant improvements in integration are seen
from 2010 to 2011 in the Western Cape [37.9% (28.8-47.0%) versus 46.3% (36.1-56.5%)] and
Mpumalanga provinces [29.8% (23.1—36.5%) versus 41.2% (32.1-50.3%)] respectively and significant
increases in integration are seen in KZN province[41.1% (30.5-51.5%) in 2010 versus 63.6% (53.6-
73.5%) in 2011].
4.5 Infant Feeding
Infant feeding per caregiver recall for the past 8 days suggests a substantial increase in infant
feeding counseling, increase in exclusive breastfeeding and reduction in mixed breastfeeding
amongst HIV exposed and unexposed infants. The Tshwane Declaration of Support for Breastfeeding
was adopted in August 2011 just as the survey started.6 It received wide publicity and its effects are
likely to have been measured over the duration of the survey.

65
5. STRENGTHS AND LIMITATIONS OF SAPMTCTE
Strengths
This evaluation provides estimates of early vertical HIV transmission using a national and provincial
population-based representative sample of infants 4-8 weeks of age. The survey was conducted 16
months after South Africa adopted PMTCT Option A, and thus provides population level data on
effectiveness of WHO PMTCT Option A. It also provides data on uptake of the PMTCT programme
and infant feeding.
Limitations
The survey has the following limitations:
The data is facility-based using infants presenting for immunisation. Infants who do not come for
immunisation or have already died by 6 weeks of age are not included in the sample suggesting a
possible under-estimation of infant HIV infection prevalence.
Maternal Incidence (sero-conversion during pregnancy) was based on self-reports of previous HIV-
negative status and presence of HIV antibodies in infant ELISA test. Mothers may not accurately
report their previous HIV status for a variety of reasons, such as fear of stigma and disclosure.
Confidentiality was assured and discussed as part of the informed consent process and a private
place was secured for the conduct of interviews in an attempt to reduce this potential limitation.
Coverage of PMTCT programme indicators was via maternal recall and was not verified with
maternal antenatal or intrapartum records, however the recall period was relatively short (generally
less than 3-6 months).
Two-stage cluster random sampling was used. The primary sampling unit was primary health care
clinics reporting at least 130 immunisations per year from the 2007 DHIS data. Therefore this
sample excluded smaller primary health care facilities due to logistic reasons and secondary and
tertiary facilities, mobile clinics and other facilities in order to focus on PMTCT in the primary health
care services. Therefore this survey is not representative of these excluded facilities.
Finally, this survey does not measure postnatal HIV transmission.
66
6. CONCLUSION AND RECOMMENDATIONS
Conclusions:
1. South Africa reduced early vertical HIV transmission from 3.5% in 2010 to 2.7% (95% CI 2.1-
3.2%) in 2011. This followed the adoption of WHO PMTCT Option A.
2. Reported infant feeding counseling and infant feeding practices improved between 2010
and 2011.
3. Uptake of CD4 cell count testing and results is still poor (78% of HIV positive women)
Recommendations:
1. Bottle necks to further reductions in MTCT need to be explored
2. The effectiveness of PMTCT Option B needs to be measured: will it result in further
reductions in vertical HIV transmission as the need for CD4 cell count testing to initiate
antiretroviral treatment is removed
3. The long-term effectiveness of PMTCT needs to be urgently measured
4. Integration between routine child health services and early infant diagnosis needs to be
intensified
5. More work is needed to provide appropriate infant feeding counseling for continued
improvements in infant feeding practices

67
REFERENCES
1. National Department of Health. Policy and Guidelines for the Implementation of the PMTCT programme. 2008. Available from http://www.info.gov.za/view/DownloadFileAction?id=77877. Accessed 1 October 2009.
2. National Department of Health and SANAC. Clinical Guidelines: PMTCT (Prevention of Mother-to-Child Transmission). 2010. Available from http://www.fidssa.co.za/images/PMTCT_Guidelines.pdf. Accessed 6 January 2014.
3. Goga A, Dinh T, Jackson D, for the SAPMTCTE Study Group. Evaluation of the Effectiveness of the National Prevention of Mother-to-Child Transmission (PMTCT) Programme Measured at Six Weeks Postpartum in South Africa, 2010. Published 2012. Available from http://www.mrc.ac.za/healthsystems/reports.htm. Accessed 6 January 2014
4. National Department of Health SA. The National Strategic Plan on HIV, STIs and TB, 2012-2016. Available from www.info.gov.za/view/DownloadFileAction?id=155622 . Accessed 18 october 2013.
5. National Department of Health SA. National Department of Health. Protocol for providing a comprehensive package of care for the prevention of mother to child transmission of HIV (PMTCT) in South Africa. 2001. Available from http://www.law-lib.utoronto.ca/Diana/TAC_case_study/Protocol.html. Accessed 18 october 2013.
6. National Department of Health Breastfeeding Summit. The Tshwane Declaration of Support for breastfeeding in South Africa. South African Journal of Clinical Nutrition 2011; 24(4): 214-6.
7. Rollins N, Little K, Mzoloa S, Horwood C, Newell M-L. Surveillance of mother-to-child transmission prevention programmes at immunization clinics: the case for universal screening. AIDS 2007; 21: 1341-7.
8. Rollins N, Mzolo S, Moodley T, Esterhuizen T, van Rooyen H. Universal HV testing of infants at immunisation clinics: an acceptable and feasible approach for early infant diagnosis in high HIV prevalence settings. AIDS 2009; 23(1851-1857).
9. Chantry C, Cooper E, Pelton S, Zorilla C, Hillyer G, Diaz C. Seroreversion in human immunodeficiency virus-exposed but uninfected infants. Pediatr Infect Dis J 1995; 14(5): 382-7.
10. Sherman G, Lilian R, Coovadia A. The performance of five rapid HIV tests using whole blood in infants and children – selecting a test to achieve the clinical objective. Paed Infect Dis J 2012; 31(3): 267-72.
11. National Department of Health. 2008 National Antenatal Sentinel HIV and Syphilis Prevalence Survey, South Africa. Published 2009. Available from http://www.info.gov.za/view/DownloadFileAction?id=109007. Accessed 18 October 2013.
12. Lehtonen R, Pahkinen E. Practical Methods for Design and Analysis of Complex Surveys 2nd ed. West Sussex, UK: John Wiley & Sons; 2004. 13. Stevens W, Erasmus L, Moloi M, Taleng T, Sarang S. Performance of a novel human
immunodeficiency virus (HIV) type 1 total nucleic acid-based real-time PCR assay using whole blood and dried blood spots for diagnosis of HIV in infants. J Clin Microbiol 2008; 46: 3941–5.
14. National Department of Health. The 2011 National Antenatal Sentinel HIV & Syphilis Prevalence Survey in South Africa. Pretoria, Published 2012. Available from http://health-e.org.za/documents/f0980fb5107a7ce543a8bd5730e52333.pdf. Accessed 18 October 2013.
15. Six week extended dose nevirapine (SWEN) Study team et al. Extended dose nevirapine at 6 weeks of age for infants to prevent HIV transmission via breatsfeeding in Ethiopia, India and Uganda: an analysis of 3 randomised controlled trials. The Lancet 2008; 372: 300-13.

68
16. Kilewo C, Karlsson K, Massawe A, et al. Prevention of Mother-to-Child Transmission of HIV-1 through breastfeeding by treating infants prophylactically with lamivudine in Dar es Salaam. JAIDS 2008; 48(3): 315-23.
17. Kesho Bora Study Group, de Vincenzi I. Triple antiretroviral compared with zidovudine and single-dose nevirapine prophylaxis during pregnancy and breastfeeding for prevention of mother-to-child transmission of HIV-1 (Kesho Bora study): a randomised controlled trial. Lancet Infect Dis; 2011; Mar;11(3): 171-80.

69
APPENDIX I: SAMPLE SIZE AND SAMPLING
(See next page)

70
SAMPLE SIZE CALCULATION BY PROVINCE
Antenatal HIV
Prevalence 2007
% antenatal HIV test
(%)
% admin
of PMTCT
to babies
Estimated Coverage
(prevalence X %tested X %admin to
baby)
Est. not Covered
Transmission Rate in
exposed assuming SD
NVP MTCT=15% &
untreated MTCT=29% (Rollins)*
Overall Population Prevalence per 100 kids
Same precision
across province
Same relative
precision across
province (%)
sample size for
30% relative
precision
Sample size for design effect** of 2 & relative
precision 30%
Overall population prevalence
per 100 kids (%)
Varying precisio
n by province
Varying relative precisio
n by province
(%)
Sample size
using varying precision level without design effect
Sample size
using varying precision level with
design effect**
of 2
SA 29 67 47 31.5% 68.5% 24.6% 7.1% 2.1 30 575 1150
WC* 15 97 75 72.8% 27.3% 13.0% 1.9% 0.6 30 1989 3978 1.9 1.0 51 716 1400
NC 14 81 70 56.7% 43.3% 21.1% 2.9% 0.9 30 1336 2672 2.9 1.8 60 350 700
EC 24 73 35 25.6% 74.5% 25.4% 6.1% 1.8 30 680 1360 6.1 1.8 30 700 1400
FS 29 70 52 36.4% 63.6% 23.9% 6.9% 2.1 30 560 1120 6.9 2.0 29 617 1300
KZN 37 66 52 34.3% 65.7% 21.4% 7.9% 2.4 30 485 970 7.9 2.0 25 699 1400
MP 34 56 36 20.2% 79.8% 26.2% 8.9% 2.7 30 428 856 8.9 2.0 22 779 1600
LP 20 74 54 40.0% 60.0% 23.4% 4.7% 1.4 30 878 1756 4.7 1.5 32 703 1400
NW 29.9 86 50 43.0% 57.0% 23.0% 6.9% 2.1 30 560 1119 6.9 2.0 29 601 1200
GP 31 65 27 17.6% 82.5% 26.5% 8.2% 2.5 30 463 926 8.2 2.0 24 723 1800
Total 7379 14758 12200
ANC Prevalence & Coverage Data from DHIS
*WC & KZN assume full coverage dual therapy - Rollins KZN Study is 7%
** Design Effect = 1+(100-1)*(ICC=.01)=2

71
SAMPLING
Table 3 - number of facilities needed to be sampled from each province to collect data within 3wks (4 weeks for Northern Cape) duration from each facility.
Note DTP1 = 1st DTP
WESTERN CAPE
Strata Total Annual
DTPDTP# Percentage
Sample Size Proportional
Median Yearly Clinic DTP1
Number
Media 3-week Clinic DTP1
Number
Number of Facilities to be
Visited Small clinics (< 130 DTPDTP1#)
4537 20
Medium size clinics (130-300 annual DTPDTP1#)
15953 17.85 250 192 11 23
Large size (annual DTPDTP1 #>300) but low prev clinics
62884 70.38 985 535 31 32
Large size (annual DTPDTP1 #>300) but high prev clinics
10517 11.77 165 857 49 3
Overall Total 89354 100 1400 58 (or 78 if small facilities are
included)

72
EASTERN CAPE
Strata
Total Annual
DTPDTP for the
province
Percentage Adjusted
Percentage Sample size proportional
Sample size adjusted
proportional
Median yearly clinic
DTP1 number
Median 3 week clinic
DTP1 number
number of facilities
need to be visited
Number of facilities
that should be visited based on adjusted
distribution
Small clinics (<130 DTPDTP1#)
25862 20 20
Medium size clinics (130-300 annual DTP1#)
41620 36.38 30 509 420 186.5 11 47 39
large size (Annual DTP1 #>300) but low prev clinics
41646 36.40 43 510 602 459 26 19 23
large size (Annual DTP1 #>300) but high prev clinics
31141 27 27 381 378 402 23 16 16
Overall Total 114407 100 100 1400 1400 83 78 (or 98 if small
facilities are included)
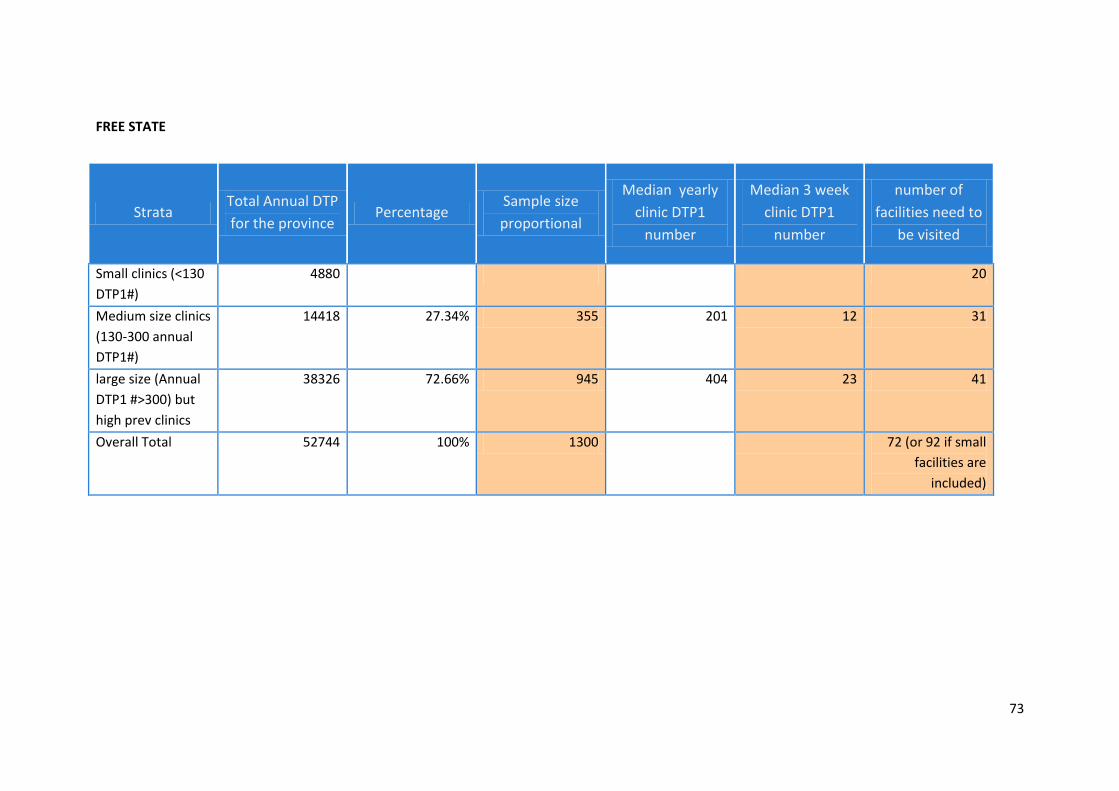
73
FREE STATE
Strata Total Annual DTP
for the province Percentage
Sample size
proportional
Median yearly
clinic DTP1
number
Median 3 week
clinic DTP1
number
number of
facilities need to
be visited
Small clinics (<130
DTP1#)
4880 20
Medium size clinics
(130-300 annual
DTP1#)
14418 27.34% 355 201 12 31
large size (Annual
DTP1 #>300) but
high prev clinics
38326 72.66% 945 404 23 41
Overall Total 52744 100% 1300 72 (or 92 if small
facilities are
included)

74
GAUTENG
Strata
Total Annual
DTP for the
province
Percentage Sample size
proportional
Median yearly
clinic DTP1
number
Median 3
week clinic
DTP1 number
number of
facilities need
to be visited
Small clinics (<130 DTP1#) 1926 20
Medium size clinics (130-300 annual
DTP1#) 15359 8.95% 161 237.5 14 12
Large size (Annual DTP1 #>300) but
low prev clinics 33023 19.25% 347 549 32 11
Large size (Annual DTP1 #>300) but
high prev clinics 123199 71.80% 1292 629 36 36
Overall Total 171581 100% 1800
59 (or 79 if small
facilities are
included)

75
KWAZULU-NATAL
Strata
Total Annual
DTP for the
province
Percentage Sample size
proportional
Median yearly
clinic DTP1 number
Median 3 week
clinic DTP1
number
number of facilities
need to be visited
Small clinics (<130 DTP1#) 7365 20
Medium size clinics (130-300
annual DTP1#) 40070 20.84% 292 209 12 24
large size (Annual DTP1
#>300) but low prev clinics 6505 3.38% 47 536.5 31 2
large size (Annual DTP1
#>300) but high prev clinics 145661 75.77% 1061 483 28 38
Over all Total 192236 100% 1400
64 (or 84 if small
facilities are included)
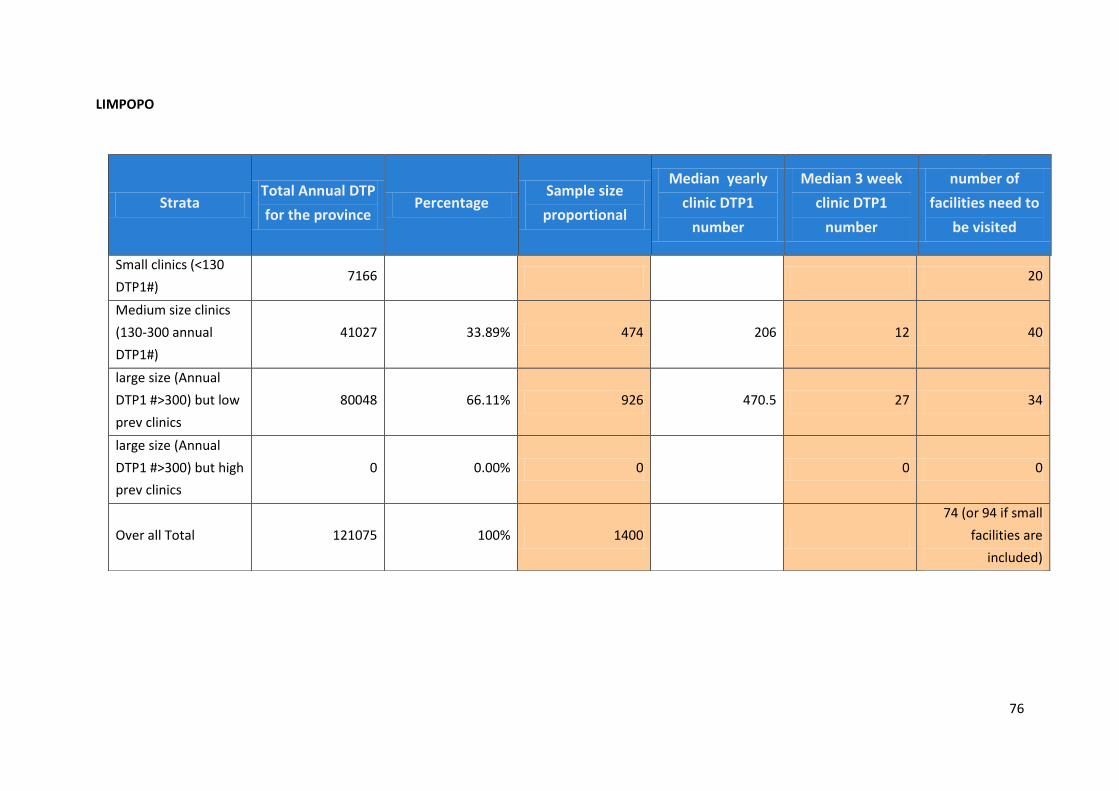
76
LIMPOPO
Strata Total Annual DTP
for the province Percentage
Sample size
proportional
Median yearly
clinic DTP1
number
Median 3 week
clinic DTP1
number
number of
facilities need to
be visited
Small clinics (<130
DTP1#) 7166 20
Medium size clinics
(130-300 annual
DTP1#)
41027 33.89% 474 206 12 40
large size (Annual
DTP1 #>300) but low
prev clinics
80048 66.11% 926 470.5 27 34
large size (Annual
DTP1 #>300) but high
prev clinics
0 0.00% 0 0 0
Over all Total 121075 100% 1400
74 (or 94 if small
facilities are
included)
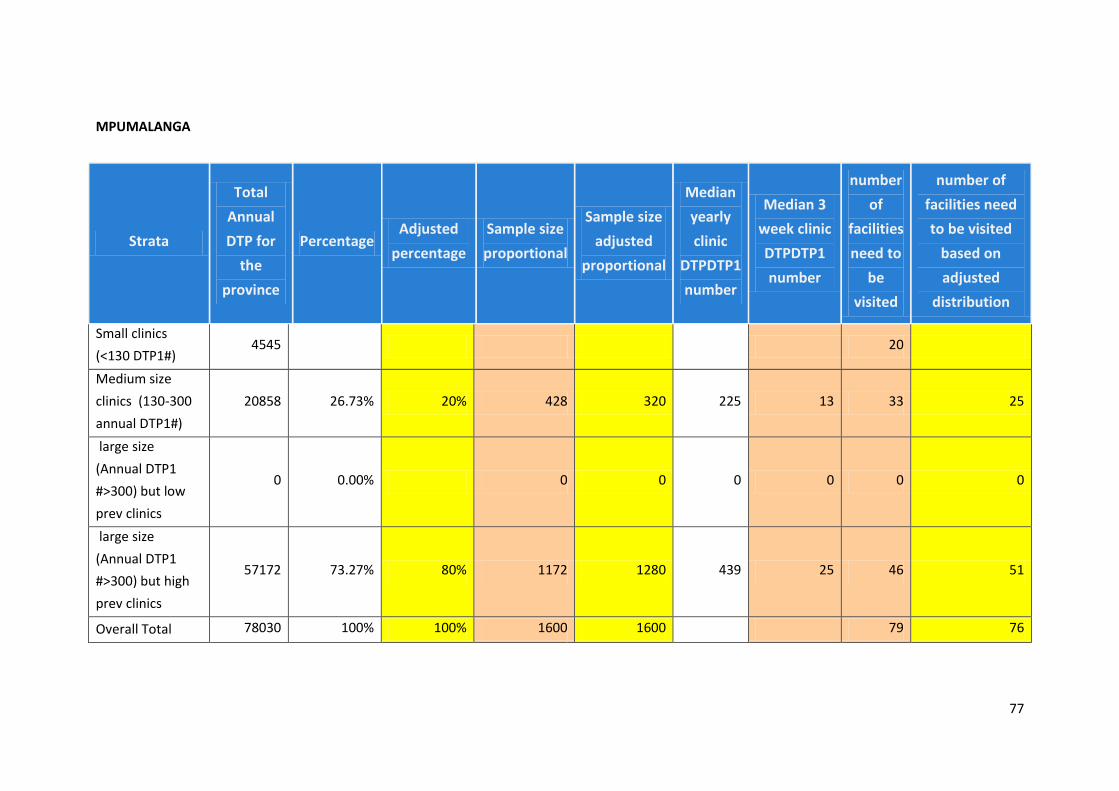
77
MPUMALANGA
Strata
Total
Annual
DTP for
the
province
Percentage Adjusted
percentage
Sample size
proportional
Sample size
adjusted
proportional
Median
yearly
clinic
DTPDTP1
number
Median 3
week clinic
DTPDTP1
number
number
of
facilities
need to
be
visited
number of
facilities need
to be visited
based on
adjusted
distribution
Small clinics
(<130 DTP1#) 4545 20
Medium size
clinics (130-300
annual DTP1#)
20858 26.73% 20% 428 320 225 13 33 25
large size
(Annual DTP1
#>300) but low
prev clinics
0 0.00% 0 0 0 0 0 0
large size
(Annual DTP1
#>300) but high
prev clinics
57172 73.27% 80% 1172 1280 439 25 46 51
Overall Total 78030 100% 100% 1600 1600 79 76
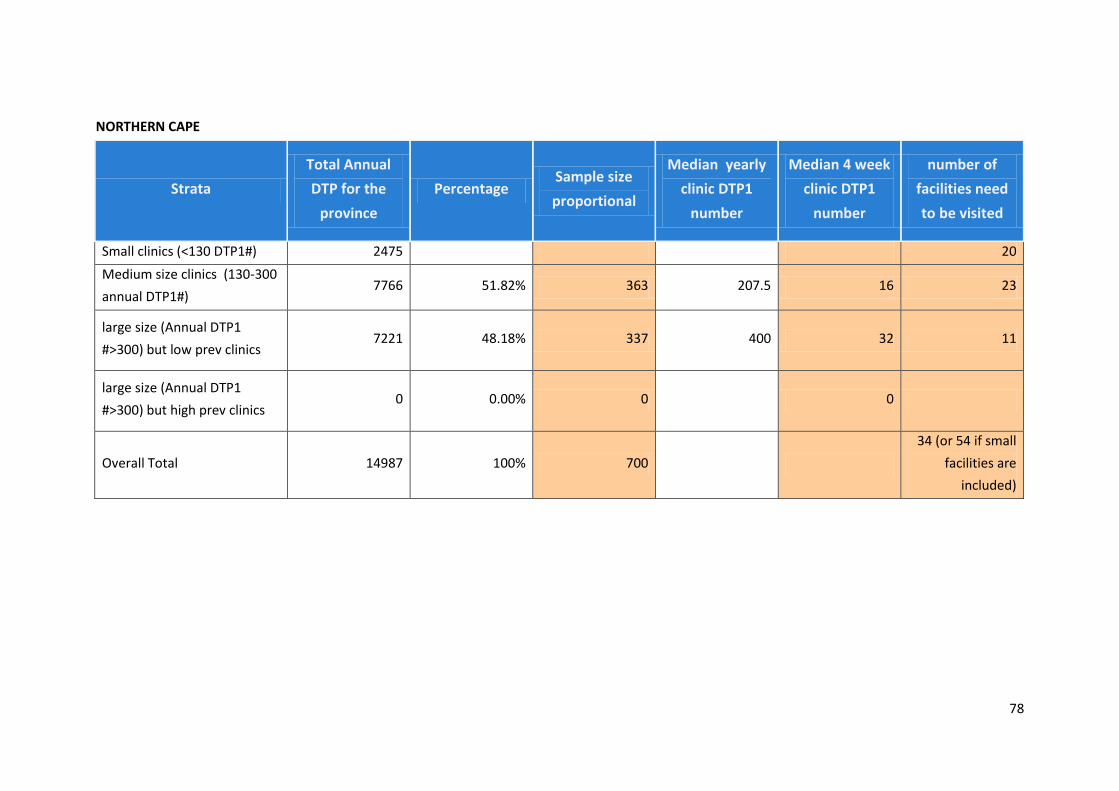
78
NORTHERN CAPE
Strata
Total Annual
DTP for the
province
Percentage Sample size
proportional
Median yearly
clinic DTP1
number
Median 4 week
clinic DTP1
number
number of
facilities need
to be visited
Small clinics (<130 DTP1#) 2475 20
Medium size clinics (130-300
annual DTP1#) 7766 51.82% 363 207.5 16 23
large size (Annual DTP1
#>300) but low prev clinics 7221 48.18% 337 400 32 11
large size (Annual DTP1
#>300) but high prev clinics 0 0.00% 0 0
Overall Total 14987 100% 700
34 (or 54 if small
facilities are
included)

79
NORTH WEST
Strata
Total Annual
DTP for the
province
Percentage Sample size
proportional
Median yearly
clinic DTP1
number
Median 3 week
clinic DTP1
number
number of
facilities need
to be visited
Small clinics (<130 DTP1#) 8758 20
Medium size clinics (130-
300 annual DTP1#) 22925 34.26% 411 204.5 12 35
large size (Annual DTP1
#>300) but low prev clinics 24100 36.02% 432 413 24 18
large size (Annual DTP1
#>300) but high prev clinics 19887 29.72% 357 432.5 25 14
Over all Total 66912 100% 1200
67 (or 87 if small
facilities are
included)
2010 SAPMTCTE (6 weeks) – Final Report June 2011
80
Each province was divided into three strata:
Stratum 1 includes clinics and CHCs that have annual Dtp1st dose 130-300 based on the
2007 DHIS data.
Stratum 2 includes clinics & CHCs with 300 and above Dtp1st dose & HIV prevalence below
the national (<29%) rate based on the 2007 DHIS and 2008 antenatal survey data
respectively.
Stratum 3 includes clinics & CHCs with 300 & above Dtp1st dose (based on the 2007 DHIS
data) & HIV prevalence above the national rate based on the 2007 DHIS data & 2008
antenatal survey data respectively.
In the small facilities stratum, 20 facilities were selected for situational analysis. Out of these 20
facilities only 10 were selected based on the feedback from the situational analysis.
Provinces that do not have the third stratum
Western Cape, Limpopo and Northern Cape do not have a third stratum: there is no district with
>29% HIV prevalence and high delivery rate (>300 immunisation) in these provinces. However, for
Western Cape, we had a sub-district level data from the ANC survey, which indicated that
Khayelitsha sub-district has more than 29% HIV prevalence. So, the third stratum was created from
large clinics in Khayelitsha. We were not able to do the same for Limpopo and Northern Cape, as we
did not have sub-district level HIV prevalence data (from the ANC survey) for the two provinces.
Reduced sample size for Northern Cape to 700
There were 96 facilities that could be sampled in the Northern Cape; but logistically 96 clinics was
not an achievable target within the allocated time. Consequently the researchers reduced the
number of facilities that needed to be visited to 53.
Adjusting weighting for Mpumalanga and Eastern Cape
The number of facilities needed to be sampled for Mpumalanga and Eastern Cape was 79 and 83
respectively. In addition, most of the facilities were from medium sized clinics. As this might be
difficult to achieve with available logistics capacity, we slightly shifted the weighting to the large
clinics (see column D), hence the number of facilities needed to be sampled from medium facilities
decreased from 47 to 39 for the Eastern Cape and from33 to 25 for Mpumalanga (see column J).
This was logistically feasible.
In Free state, we had only two strata - we grouped the last two strata as one stratum.
The second strata (large and low HIV prevalence clinics) in Free state had only 0.74% weighting
which translates to sampling only 1 facility from the second stratum. Since sampling cannot be
done for one facility, the second stratum is combined with the third stratum thus we have only two
strata for Free state.
2010 SAPMTCTE (6 weeks) – Final Report June 2011
81
APPENDIX 2
wc Wellington CDC
wc Dr Ivan Toms
wc Bongolethu Clinic Public 256 15 1 11
* note: have removed Kwanokuthula clinic
mp Boekenhouthoek Clinic Public 174 10 1 13 Wesselton Clinic removed
mp Gemsbokspruit Clinic Public 136 8 1 13
Kriel Clinic removed replace
with????
gp Joy Clinic 290 17 14
this is replacement for gp
Bapsfontein Clinic
ec Oliver Tambo District Municipality ec Nyandeni Local Service Area ec Nolita Clinic Public 153 9 1 11
ec Chris Hani District Municipality ec Ngcobo Local Service Area ec Lahlangubo Clinic (Ngcobo) Public 279 16 1 11
kz Umkhanyakude District Municipality kz KwaMbuzi Clinic Public 254 15 1 12
kz Umkhanyakude District Municipality kz Ophondweni Clinic Public 167 10 1 12
Recommended


![[XLS] · Web viewkumar 01132672078 pitampura delhi india dakshconveyor.com pagoda corp ... uniking@mweb.co.za 270514422156 Jimmy 270866636688 40](https://img.dokumen.tips/doc/110x75/5ab9148c7f8b9ad13d8d46f6/xls-viewkumar-01132672078-pitampura-delhi-india-dakshconveyorcom-pagoda-corp.jpg)