ORIGINAL PAPER
Use of Quercus ilex subsp. ballota phenological and pollen-production data for interpreting Quercus pollen curves
V. Jato Æ F. J. Rodrıguez-Rajo Æ M. J. Aira
Received: 9 October 2006 / Accepted: 9 November 2006 / Published online: 3 May 2007
� Springer Science+Business Media B.V. 2007
Abstract Although aerobiological data are often
used in phenological research as an indicator of
flowering, airborne pollen concentrations are influ-
enced by a number of factors that could affect pollen
curves. This paper reports on a study of various
aspects of reproductive biology in Q. ilex subsp.
ballota, together with environmental factors influ-
encing pollen release and transport, with a view of
achieving reliable interpretation of Quercus pollen
curves in Ourense (NW Spain). Aerobiological data
were recorded from 2002 to 2004 at two sites in the
province of Ourense. From 1st February to the end of
the flowering period, phenological observations were
carried out on 19 trees from the Q. ilex subsp. ballota
population found in the Ourense area. Pollen pro-
duction was calculated for the same trees. The
chilling and heating requirements for triggering
development were also calculated. The mean flower-
ing period lasted 11-15 days. Reduced pollen output
per catkin and, especially, a reduced number of
catkins per tree in 2003 and 2004, prompted a marked
decline in overall pollen production. Major differ-
ences observed in Q. ilex subsp. ballota pollen curves
were attributed to the considerable influence both of
weather conditions during pollination and pollen
production. In years with high pollen production and
weather conditions favouring pollen release, Q. ilex
subsp. ballota contributed almost 10% to the total
Quercus pollen curve. Around 20% of the pollen
trapped was captured before or after flowering
periods.
Keywords Quercus � Phenology � Pollen
production � Airborne pollen
1 Introduction
Knowledge of pollen production can be very useful in
determining the maximum amount of pollen that a
population can spread. This can be used to help to
establish an airborne forecasting system (Hidalgo,
Galan, & Domınguez, 1999) and to assess the relative
importance of every taxa included in a given pollen
type. Quercus (L.) pollen production is very high,
although it varies by species; findings for the number
of pollen grains per flower range from 1.9 · 104 to
1.3 · 106 (Moore & Webb, 1983; Tormo, Munoz,
Silva, & Gallardo, 1996). Quercus is considered a
moderate cause of pollinosis in many areas of
Europe, especially those with high pollen counts. In
V. Jato (&) � F. J. Rodrıguez-Rajo
Department of Plant Biology and Soil Sciences,
Universidad de Vigo, Edificio Politecnico, Campus
As Lagoas 32004 Ourense, Espana
e-mail: [email protected]
M. J. Aira
Department of Botany, University of Santiago de
Compostela, Campus Sur, 15782 Santiago de
Compostela Coruna, Spain
e-mail: [email protected]
123
Aerobiologia (2007) 23:91–105
DOI 10.1007/s10453-006-9046-7

Northwest Spain, between 4% and 12% skin sensi-
tisation to Quercus pollen has been reported among
pollen-allergy sufferers (Belmonte, Roure, & March,
1998; Ferreiro, Nunez, Rico, Soto, & Lopez, 1998).
Symptoms are often recorded over prolonged
periods, due both to the overlapping of flowering in
the various species present in the environment and
cross-reactivity with the pollen of Alnus, Betula,
Castanea, Olea and Poaceae (Ickovic & Thibaudon,
1991). The highest Quercus pollen counts in Galicia
(Northwest Spain) are recorded in the areas display-
ing the greatest diversity of Quercus species, i.e., at
the confluence of the Eurosiberian and Mediterranean
areas, where daily mean pollen counts exceed
200 pollen grains/m3 and annual values are over
2,000 pollen grains (Aira, Jato, & Iglesias, 2005). The
study of Quercus pollen data is not only useful
because of their allergenic potential but also essential
for evaluating the ecological conservation of Spain’s
woodland. Possible changes in the distribution of oak
due to hotter spring temperatures over recent years
(Emberlin et al., 1997; Corden & Millington, 1999)
are of major economic importance to the timber and
livestock industries.
In aerobiological studies, the Quercus pollen curve
usually represents total Quercus pollen: pollen
released by all the species to be found in the area.
The contribution of each species is governed not only
by its local abundance but also by its pollen
production, the distance from the pollen source to
the pollen trap and the possibility of pollen transport
over long and medium distances.
Pollen curve patterns do not always match those of
the flowering phenophase, and a lack of correlation
may be observed between flowering dates and
pollen concentrations (Latorre, 1997). Moreover, a
given pollen type may include different species.
Knowledge of the flowering sequence, abundance and
pollen production of each species is therefore essen-
tial in order to assess its contribution to the overall
pollen curve in space and time. Moreover, aerobio-
logical research must take into account not only
phenological data but also other environmental
variables, including topographical and weather-
related factors, the ability of the pollen grain to be
transported over long distances, pollen production
and distance from the source to the sampler.
Temperature is the factor exerting the clearest
influence on the onset of flowering, especially in tree
species that flower at the start of spring. Q. ilex subsp.
ballota (Desf.) Samp., is cited as the most relevant
example of adaptation to different climatic and
environmental conditions (Garcia-Mozo et al.,
2002b). Identification of the chilling and heating
required to overcome the period of dormancy enables
the determination of the onset of pollination (Faust,
1989; Frenguelli & Bricchi, 1998; Galan, Carinanos,
Garcıa-Mozo, Alcazar, & Domınguez, 2001; Rich-
ardson, Seeley, & Walker, 1984). Since the presence
of pollen in the air is the result of flowering,
aerobiological data may be used to calculate these
chilling and heating requirements (Frenguelli
& Bricchi, 1998; Garcia-Mozo, Galan, Gomez-
Casero, & Domınguez-Vilches, 2000, Garcia-Mozo
et al., 2002b; Rodrıguez-Rajo, Mendez, & Jato, 2000;
Galan et al., 2001; Jato, Rodrıguez-Rajo, Dacosta, &
Aira, 2004). Over the last few years, prompted by the
growing importance of global warming, a certain
amount of phenological research has been carried out
using aerobiological data to determine the timing of
flowering (Chuine, Cour, & Rousseau, 1998;
Emberlin et al., 1997; Emberlin et al., 2002; Galan
et al., 2005; Garcia-Mozo, Galan, & Domınguez-
Vilches, 2002a). Using long aerobiological data
series, it is possible to chart delays or advances in
the onset of pollination in the major wind-pollinated
species. However, in order to achieve a full under-
standing of the pollen curve and thus ensure the
correct application of pollen data, it is essential to
take into account the phenology and reproductive
biology of the plants, particularly those in the vicinity
of the spore trap.
A previous survey of Quercus phenology was
carried out in 2001 at Ourense (Northwest Spain) in
order to analyze the phenological behaviour of the
various local Quercus species (Jato, Rodrıguez-Rajo,
Mendez, & Aira, 2002) and to test the match between
flowering and airborne pollen counts. Quercus robur
L. and Q. pyrenaica Willd. were the largest contrib-
utors to the Quercus pollen curve. The heat require-
ment to trigger flowering in Q. ilex subsp. ballota was
similar to that obtained for both Q. robur and Q.
faginea Lam. The study found that transported pollen
could have a marked effect on Quercus pollen curves.
The present study was designed to determine pollen
production and reproductive biology of Q. ilex susbp.
ballota,, and to evaluate the contribution of this
species to the overall Quercus pollen curve.
92 Aerobiologia (2007) 23:91–105
123
2 Material and methods
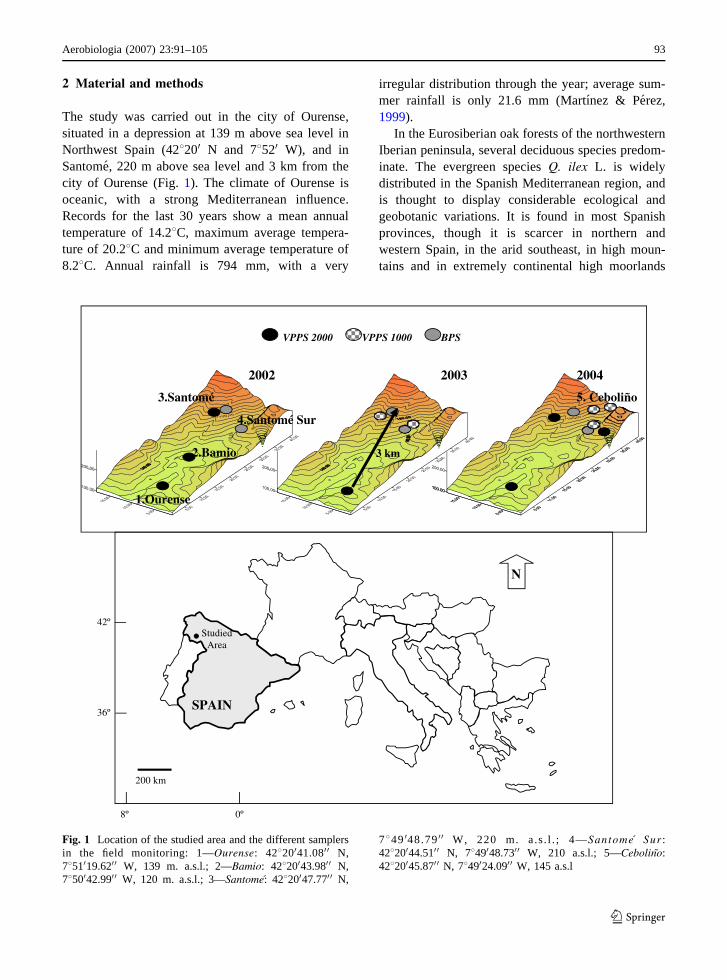
The study was carried out in the city of Ourense,
situated in a depression at 139 m above sea level in
Northwest Spain (428200 N and 78520 W), and in
Santome, 220 m above sea level and 3 km from the
city of Ourense (Fig. 1). The climate of Ourense is
oceanic, with a strong Mediterranean influence.
Records for the last 30 years show a mean annual
temperature of 14.28C, maximum average tempera-
ture of 20.28C and minimum average temperature of
8.28C. Annual rainfall is 794 mm, with a very
irregular distribution through the year; average sum-
mer rainfall is only 21.6 mm (Martınez & Perez,
1999).
In the Eurosiberian oak forests of the northwestern
Iberian peninsula, several deciduous species predom-
inate. The evergreen species Q. ilex L. is widely
distributed in the Spanish Mediterranean region, and
is thought to display considerable ecological and
geobotanic variations. It is found in most Spanish
provinces, though it is scarcer in northern and
western Spain, in the arid southeast, in high moun-
tains and in extremely continental high moorlands
5. Ceboliño
4.Santomé Sur
2.Bamio 3 km
3.Santomé
1.Ourense
20042002 2003
VPPS 2000 BPSVPPS 1000
N
200 km
StudiedArea
SPAIN36º
42º
8º 0º
Fig. 1 Location of the studied area and the different samplers
in the field monitoring: 1—Ourense: 42820041.080 0 N,
7851019.620 0 W, 139 m. a.s.l.; 2—Bamio: 42820043.980 0 N,
7850042.990 0 W, 120 m. a.s.l.; 3—Santome: 42820047.770 0 N,
7849 048.79 0 0 W, 220 m. a.s . l . ; 4—Santome Sur :
42820044.510 0 N, 7849048.730 0 W, 210 a.s.l.; 5—Cebolino:
42820045.870 0 N, 7849024.090 0 W, 145 a.s.l
Aerobiologia (2007) 23:91–105 93
123

(Costa, Morla, & Sainz, 1998). It includes two
subspecies: Q. ilex subsp. ilex L. and Q. ilex subsp.
ballota (Desf.) Samp. (=Q. ilex subsp. rotundifolia)
(holm oaks). Part of the Ourense province belongs to
the Eurosiberian region, while lower-altitude areas
and especially the Mino, Sil and Tamega river valleys
are considered part of the Mediterranean region.
Confluence of species representative of both regions
is therefore normal in the area. Oak forests predom-
inate in the area surrounding the city, particularly
Quercus pyrenaica and Quercus robur. Q. suber L. is
found in the lowest areas around the city, while there
is only one Q. ilex subsp. ballota population, in the
Santome area. There are also a few ornamental
American oaks: Q. rubra L. and Q. palustris
Muenchn.
The Q. ilex subsp. ballota population studied here
is underdeveloped, due to certain ecological pecu-
liarities prompted by steep slopes and frequent forest
fires. Small stands of this species are intermingled
with other shrub species.
2.1 Aerobiological survey
Pollen monitoring was conducted in the city of
Ourense and in Santome. In Ourense, pollen data
was recorded in 2002, 2003 and 2004 using a seven-
day LANZONI VPPS 2000 continuous volumetric
pollen trap, located on the roof of the sciences faculty
(approximately 20 m above ground level). The meth-
odology recommended by the Spanish Aerobiological
Network (REA)—was used (Domınguez, Galan,
Villamandos, & Infante, 1992). The onset of the
airborne pollen season was defined according to three
different criteria: the date on which 2.5% (Andersen,
1991) or 5% (Nilsson & Person, 1981) of annual total
pollen was recorded, and the date from which the first
pollen grains were recorded on a continual basis with
no more than two pollen-free days (Jato et al., 2002).
Finally, the day on which the maximum daily mean
pollen concentrations were recorded (peak day) was
taken as the mean date of anthesis for the population
around the sampling station, as suggested by Chuine,
Cour, and Rousseau (1999).
Monitoring of airborne Quercus pollen concentra-
tions usually includes all Quercus species, since
morphological similarities hinder any ready distinc-
tion between them. However, observed differences in
the size and, more particularly, the ornamentation of
the exine, together with known differences in flow-
ering dates between local Quercus species, enabled
Q. ilex subsp. ballota pollen to be distinguished from
that of other Quercus species. For the purposes of this
study, therefore, the Quercus pollen type includes
pollen from all local Quercus species, mainly Q.
robur, Q. pyrenaica, Q. ilex subsp. ballota, Q. suber
and also Q. faginea and Q. rubra, (both from a very
small number of trees), while the Q. ilex subsp.
ballota pollen type includes only pollen from this
species.
In the area of Santome (3 km from the city of
Ourense), home to the only Q. ilex subsp. ballota
population in the Ourense area, an aerobiological
survey was carried out over three years using a seven-
day LANZONI VPPS 2000 continuous volumetric
pollen trap (running from 12:00 h to 20:00 h every
day), together with a LANZONI VPPS 1000 and
Burkard portable samplers. The location of the pollen
trap and the sampling dates were modified every year,
as a function of the results obtained in the previous
year and the flowering period of Q. ilex subsp. ballota
(Fig. 1). Spearman’s correlation test was applied in
order to prove the association level between pollen
concentrations and meteorological parameters regis-
tered in this area.
Pollen dispersion maps were fulfilled by using the
Surfer mapping program. The maps were constructed
by interpolating the pollen data onto a grid, using the
powerful Kriging gridding method that produces
grids with up to 100 million nodes.
2.2 Phenological survey
To characterize the floral phenophase, trees were
sampled at least once a week from 1 February to the
end of flowering, from 2002 to 2004. Nineteen
randomly chosen Quercus ilex subsp. ballota trees
were sampled. For each tree, the dates of bud
development (the bud has increased of size up to 2–
4 mm and the catkin is still not distinguished), catkin
development (the catkin begins to develop although it
measures less than 1 cm and its pedicelum is
distinguished), catkin lengthening (the catkins mea-
sure 2 cm and the flowers are distinguished although
they are still closed), start of flowering (as the first
day a male catkin distributed its pollen, Wielgolaski,
1999), and end of flowering (drying-up of all catkins)
were noted. The same trees were observed every year.
94 Aerobiologia (2007) 23:91–105
123
The average length of the flowering phenophase
was limited by the calculated onset and ending of the
average flowering date. Moreover the earlier and later
dates for the onset and end of flowering mark the total
length of the flowering phenophase.
2.3 Pollen production
The methods developed by Cruden (1977) and
Hidalgo et al. (1999) were used to calculate pollen
production by anther, by flower, by catkin and by
tree. The 19 trees randomly chosen for phenological
observation were used for this purpose.
Pollen production per anther, catkin and tree,
number of flowers per catkin and number of catkin
per tree were calculated. Since the study area was
confined, it was possible to count the total number of
Q. ilex subsp. ballota trees, and thus to quantify total
pollen released from this source. A direct count was
made of all accessible trees; inaccessible trees were
photographed after flowering, and the different col-
ours of the new branches allowed them to be counted.
Since trees were underdeveloped due to the specific
ecological characteristics of the area, pollen produc-
tion per square meter was not calculated; it was
considered that production might be different in trees
of the same species growing in optimal areas.
2.4 Chilling and heat requirements
The model developed by Aron (1983) was used to
determine the chill accumulation expressed as chill-
ing hours:
CH ¼ 801 þ 0:2523B þ 7:574 � 10�4 B2
� 6:51 � 10�10 B4 � 11:44tmin
� 3:32tmax:
where B = 24D [(7.2 � tmin)/(tmax � tmin)], D is the
number of days in the period, and tmax and tmin are the
mean maximum and minimum temperatures, respec-
tively, for the period.
The period selected ranged from the day on which
the mean temperature fell below the threshold tem-
perature, to the day (in late December or early January)
on which the minimum temperature was recorded and
a change in the temperature trend was detected. Only
those days on which weather conditions allowed no
physiological activity were taken into account (Jato
et al., 2002); this occurs when the daily maximum
temperature is equal to or less than the threshold
temperature (Montero & Gonzalez, 1983). The thresh-
old temperature was set at 78C, since previous studies
have shown this to be the most effective temperature
for chilling (Jato et al., 2002).
Two methods for determining the heat requirement
were tested taking into account the period from the
day after the chill period to the start of the airborne
pollen season (using aerobiological data) or the start
of each phenophase (using phenological data).
(1) The heat requirement (HR) was calculated
as a function of the sum of the daily
maximum temperatures (Galan et al., 2001):
HR =P
tmax
(2) The heat requirement was also calculated by
taking into account the days after chilling
when weather conditions enabled plant phys-
iological activity, either totally (tmin > th) or
partially (tmax > th > tmin) (referred to by Jato
et al. (2002) as the vegetative activity or
VA). HR was considered as a function of the
sum of the difference between the daily
maximum temperatures and the threshold
temperatures: HR =P
(tmax � th).
When tmax was less than or equal to the threshold
temperature (tmax < th), the values were set to 0.
Different threshold temperatures from 68C to 88Cwere tested, in 0.58C increments, for heat
requirement.
2.5 Meteorological data
Weather data for Ourense over the study period were
provided by the National Meteorological Institute;
weather data during sampling in Santome were recorded
using two Weatherlink portable weather stations.
3 Results
3.1 Phenological results
Using the mean dates of onset and ending, the
flowering period lasted between 11 and 15 days,
depending on the year. The longest flowering period
was in 2002 and the shortest in 2004 (Table 1 and
Fig. 2).
Aerobiologia (2007) 23:91–105 95
123

The minimum and maximum dates for the onset
and end of flowering mark the total duration of the
period when the oaks were releasing pollen from the
anthers into the atmosphere. For all studied trees as a
whole, the pollen-release period in Ourense lasted
from late March/early April to late April/early May,
depending on the year (Fig. 2).
The standard deviation coefficient was less than
5% in each year, thus showing very homogeneous
behaviour with regard to the flowering dates observed.
3.2 Chilling and heat requirements
Taking 78C as the threshold temperature, the chilling
requirement was accumulated in Ourense from 2nd
November and 17th to 25th December, respectively,
in 2001–2002 and 2003–2004 and from 5th Decem-
ber to 15th January in 2002–2003. Accumulated
chilling ranged from 639 to 715 CH.
Heat requirements were calculated for every
phenophase; values were lower in 2003 for all
phenophases. Average totals of 1,855, 1,409 and
1,932, calculated asP
tmax, were accumulated from
the end of chilling to the mean flowering start date in
2002, 2003 and 2004, respectively (Fig. 3). Totals of
between 907 (in 2004) and 1,110 (in 2002), also
calculated asP
tmax, were accumulated from the start
of bud development to flowering onset.
Heat requirements were also calculated taking into
account the onset of the Quercus ilex subsp. ballota
airborne pollen season, delimited using different
criteria and also taking into account the date on
which maximum pollen counts were detected, i.e., the
peak pollen date (Table 2). Regardless of the method
used, values were lower in 2003. The results obtained
using the method developed by Galan et al. (2001),
which is calculated as a function of the sum of daily
maximum temperatures applied to the peak date,
most closely matched those obtained using pheno-
logical data for flowering onset (Table 2).
3.3 Pollen production
Pollen production per anther was similar in 2002 and
2003, but declined by roughly 25% in 2004 (average
4,646 pollen grains in 2004 versus 6,064 pollen grains
in 2003. Pollen production per catkin was similar in
Table 1 Average start date and mean length of observed
phenophases
Quercus ilex subsp. ballota
Santome
2002 2003 2004
Bud development 14 Feb 18 Feb 5 Mar
Length (days) 36 days 26 days 17 days
Catkin development 22 Mar 16 Mar 22 Mar
Length (days) 5 days 3 days 8 days
Catkin development 27 Mar 19 Mar 30 Mar
Length (days) 20 days 20 days 17 days
Flowering onset 16 Apr 8 Apr 16 Apr
End of Flowering 1 May 20 Apr 27 Apr
Flowering’s length 15 days 12 days 11 days
01-Feb
06-Feb
11-Feb
16-Feb
21-Feb
26-Feb
03-Mar
08-Mar
13-Mar
18-Mar
23-Mar
28-Mar
02-Apr
07-Apr
12-Apr
17-Apr
22-Apr
27-Apr
02-May
Santomé 2002
Santomé 2003
Santomé 2004a
a
a
b
b
b
c
c
c
d
d
d
(I)
01-Feb
06-Feb
11-Feb
16-Feb
21-Feb
26-Feb
03-Mar
08-Mar
13-Mar
18-Mar
23-Mar
28-Mar
02-Apr
07-Apr
12-Apr
17-Apr
22-Apr
27-Apr
02-May
Santomé 2002
Santomé 2004
Santomé 2003
d
d
d
(II)
Fig. 2 (I) Average length
of phenophases for the three
study years. (a = bud
development; b = catkin
development; c = catkin
lengthening; d = flowering).
(II) Total length of Quercusilex subsp. ballota flowering
period (phenological data)
96 Aerobiologia (2007) 23:91–105
123
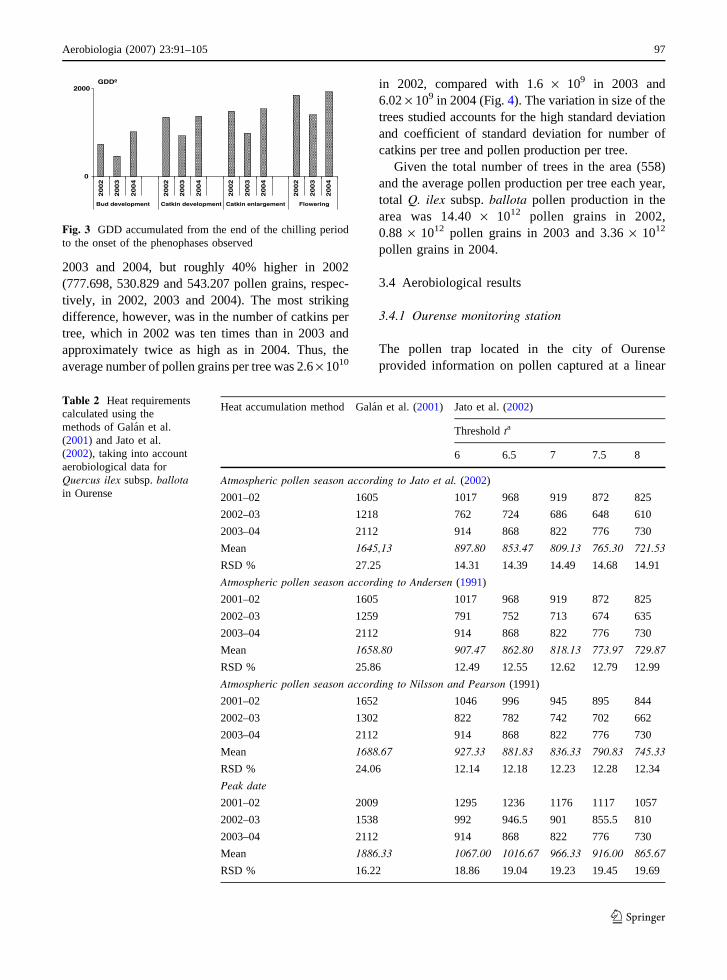
2003 and 2004, but roughly 40% higher in 2002
(777.698, 530.829 and 543.207 pollen grains, respec-
tively, in 2002, 2003 and 2004). The most striking
difference, however, was in the number of catkins per
tree, which in 2002 was ten times than in 2003 and
approximately twice as high as in 2004. Thus, the
average number of pollen grains per tree was 2.6 · 1010
in 2002, compared with 1.6 · 109 in 2003 and
6.02 · 109 in 2004 (Fig. 4). The variation in size of the
trees studied accounts for the high standard deviation
and coefficient of standard deviation for number of
catkins per tree and pollen production per tree.
Given the total number of trees in the area (558)
and the average pollen production per tree each year,
total Q. ilex subsp. ballota pollen production in the
area was 14.40 · 1012 pollen grains in 2002,
0.88 · 1012 pollen grains in 2003 and 3.36 · 1012
pollen grains in 2004.
3.4 Aerobiological results
3.4.1 Ourense monitoring station
The pollen trap located in the city of Ourense
provided information on pollen captured at a linear
0
2000
20
02
20
03
20
04
20
02
20
03
20
04
20
02
20
03
20
04
20
02
20
03
20
04
Bud development Catkin development Catkin enlargement Flowering
GDDº
Fig. 3 GDD accumulated from the end of the chilling period
to the onset of the phenophases observed
Table 2 Heat requirements
calculated using the
methods of Galan et al.
(2001) and Jato et al.
(2002), taking into account
aerobiological data for
Quercus ilex subsp. ballotain Ourense
Heat accumulation method Galan et al. (2001) Jato et al. (2002)
Threshold ta
6 6.5 7 7.5 8
Atmospheric pollen season according to Jato et al. (2002)
2001–02 1605 1017 968 919 872 825
2002–03 1218 762 724 686 648 610
2003–04 2112 914 868 822 776 730
Mean 1645,13 897.80 853.47 809.13 765.30 721.53
RSD % 27.25 14.31 14.39 14.49 14.68 14.91
Atmospheric pollen season according to Andersen (1991)
2001–02 1605 1017 968 919 872 825
2002–03 1259 791 752 713 674 635
2003–04 2112 914 868 822 776 730
Mean 1658.80 907.47 862.80 818.13 773.97 729.87
RSD % 25.86 12.49 12.55 12.62 12.79 12.99
Atmospheric pollen season according to Nilsson and Pearson (1991)
2001–02 1652 1046 996 945 895 844
2002–03 1302 822 782 742 702 662
2003–04 2112 914 868 822 776 730
Mean 1688.67 927.33 881.83 836.33 790.83 745.33
RSD % 24.06 12.14 12.18 12.23 12.28 12.34
Peak date
2001–02 2009 1295 1236 1176 1117 1057
2002–03 1538 992 946.5 901 855.5 810
2003–04 2112 914 868 822 776 730
Mean 1886.33 1067.00 1016.67 966.33 916.00 865.67
RSD % 16.22 18.86 19.04 19.23 19.45 19.69
Aerobiologia (2007) 23:91–105 97
123

distance of 3 km from the source area of Q. ilex
subsp. ballota pollen. Total annual Quercus and Q.
ilex subsp. ballota pollen counts were highest in
2002 (5,027 and 460 pollen grains, respectively).
In 2003 and 2004, very similar values were recorded
for total annual Quercus pollen (2,713 and 2,724),
while 85 and 50 Q. ilex subsp. ballota pollen
grains were identified. Pollen from Q. ilex subsp.
ballota accounted for 9.15%, 3.13% and 1.83% of
total Quercus pollen in 2002, 2003 and 2004,
respectively.
Airborne Quercus pollen was detected in Ourense
from mid-March to mid-June, while Q. ilex subsp.
ballota pollen was detected from mid-March to mid-
May; in both cases, pollen concentrations were
highest in April (Fig. 5).
Quercus pollen accounted for 16.6%, 16% and
14.5% of total annual pollen in the three study years,
POLLEN/ANTHER
Year
Pol
len
grai
ns
-2000
0
2000
4000
6000
8000
10000
12000
2002 2003 2004
Min-Max
25%-75%
Median value
POLLEN/ANTHER
Year
Pol
len
grai
ns
-2000
0
2000
4000
6000
10000
12000
2002 2003 2004
Min-Max
25%-75%
Median value
FLOWERS/CATKIN
Year
Flo
wer
s
0
20
40
60
80
100
120
2002 2003 2004
Min-Max
25%-75%
Median value
POLLEN/CATKIN
Year
Pol
len
-2e5
0
2e5
4e5
6e5
8e5
1e6
1,2e6
1,4e6
1,6e6
2002 2003 2004
Min-Max
25%-75%
Median value
CATKINS/TREE
Year
Cat
kins
-10000
30000
70000
1,1e5
1,5e5
1,9e5
2,3e5
2002 2003 2004
Min-Max
25%-75%
Median value
Pollen/Tree
0,E+00
1,E+10
2,E+10
3,E+10
Average 2002 Average 2003 Average 2004
Pol
len
Fig. 4 Q. ilex subsp. ballota pollen production per anther, catkin and tree and number of catkins per tree in 2002–2004
98 Aerobiologia (2007) 23:91–105
123
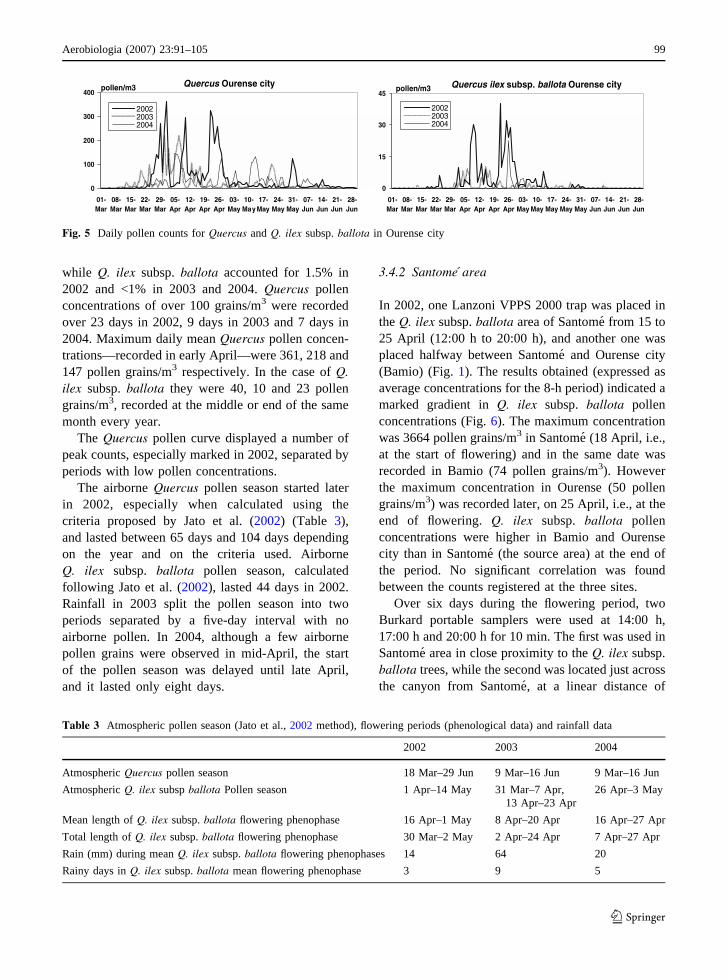
while Q. ilex subsp. ballota accounted for 1.5% in
2002 and <1% in 2003 and 2004. Quercus pollen
concentrations of over 100 grains/m3 were recorded
over 23 days in 2002, 9 days in 2003 and 7 days in
2004. Maximum daily mean Quercus pollen concen-
trations—recorded in early April—were 361, 218 and
147 pollen grains/m3 respectively. In the case of Q.
ilex subsp. ballota they were 40, 10 and 23 pollen
grains/m3, recorded at the middle or end of the same
month every year.
The Quercus pollen curve displayed a number of
peak counts, especially marked in 2002, separated by
periods with low pollen concentrations.
The airborne Quercus pollen season started later
in 2002, especially when calculated using the
criteria proposed by Jato et al. (2002) (Table 3),
and lasted between 65 days and 104 days depending
on the year and on the criteria used. Airborne
Q. ilex subsp. ballota pollen season, calculated
following Jato et al. (2002), lasted 44 days in 2002.
Rainfall in 2003 split the pollen season into two
periods separated by a five-day interval with no
airborne pollen. In 2004, although a few airborne
pollen grains were observed in mid-April, the start
of the pollen season was delayed until late April,
and it lasted only eight days.
3.4.2 Santome area
In 2002, one Lanzoni VPPS 2000 trap was placed in
the Q. ilex subsp. ballota area of Santome from 15 to
25 April (12:00 h to 20:00 h), and another one was
placed halfway between Santome and Ourense city
(Bamio) (Fig. 1). The results obtained (expressed as
average concentrations for the 8-h period) indicated a
marked gradient in Q. ilex subsp. ballota pollen
concentrations (Fig. 6). The maximum concentration
was 3664 pollen grains/m3 in Santome (18 April, i.e.,
at the start of flowering) and in the same date was
recorded in Bamio (74 pollen grains/m3). However
the maximum concentration in Ourense (50 pollen
grains/m3) was recorded later, on 25 April, i.e., at the
end of flowering. Q. ilex subsp. ballota pollen
concentrations were higher in Bamio and Ourense
city than in Santome (the source area) at the end of
the period. No significant correlation was found
between the counts registered at the three sites.
Over six days during the flowering period, two
Burkard portable samplers were used at 14:00 h,
17:00 h and 20:00 h for 10 min. The first was used in
Santome area in close proximity to the Q. ilex subsp.
ballota trees, while the second was located just across
the canyon from Santome, at a linear distance of
0
100
200
300
400
01-Mar
08-Mar
15-Mar
22-Mar
29-Mar
05-Apr
12-Apr
19-Apr
26-Apr
03-May
10-May
17-May
24-May
31-May
07-Jun
14-Jun
21-Jun
28-Jun
200220032004
pollen/m3 Quercus Ourense city
0
15
30
45
01-Mar
08-Mar
15-Mar
22-Mar
29-Mar
05-Apr
12-Apr
19-Apr
26-Apr
03-May
10-May
17-May
24-May
31-May
07-Jun
14-Jun
21-Jun
28-Jun
200220032004
pollen/m3 Quercus ilex subsp. ballota Ourense city
Fig. 5 Daily pollen counts for Quercus and Q. ilex subsp. ballota in Ourense city
Table 3 Atmospheric pollen season (Jato et al., 2002 method), flowering periods (phenological data) and rainfall data
2002 2003 2004
Atmospheric Quercus pollen season 18 Mar–29 Jun 9 Mar–16 Jun 9 Mar–16 Jun
Atmospheric Q. ilex subsp ballota Pollen season 1 Apr–14 May 31 Mar–7 Apr,
13 Apr–23 Apr
26 Apr–3 May
Mean length of Q. ilex subsp. ballota flowering phenophase 16 Apr–1 May 8 Apr–20 Apr 16 Apr–27 Apr
Total length of Q. ilex subsp. ballota flowering phenophase 30 Mar–2 May 2 Apr–24 Apr 7 Apr–27 Apr
Rain (mm) during mean Q. ilex subsp. ballota flowering phenophases 14 64 20
Rainy days in Q. ilex subsp. ballota mean flowering phenophase 3 9 5
Aerobiologia (2007) 23:91–105 99
123

200 m (South Santome). A marked gradient was
observed in pollen counts, and only in four samplings
were the pollen concentrations higher in South
Santome than in Santome (Fig. 7). No significant
correlations were found between pollen concentra-
tions and weather-related parameters recorded at the
sampling site.
Similar surveys were performed in 2003 and 2004,
although the number of samplers and their location
were modified in order to widen the study area in
other directions and over greater distances (Fig. 1).
In both years, rainy days were frequent, and the
washing-out effect—together with lower pollen
release—prompted a marked decline in airborne
pollen production compared with 2002; this hindered
interpretation of the data. However, it is noteworthy
that the maximum mean counts between 14:00 and
20:00 h in Ourense city in 2003 (9 pollen grains/m3)
and Santome (279 pollen grains/m3) were recorded
on the same date at the beginning of the flowering
period. However in Cebolino (located upstream at a
linear distance of 200 m from Santome and at a lower
altitude) the mean count was detected eight days later
(41 pollen grains/m3 recorded on 23 April), when
most Q. ilex subsp. ballota trees had finished
flowering. Weather data recorded in Santome showed
three rainy days just after the maximum pollen
concentration was recorded; after that, there was a
mild wind that constantly changed direction, although
was predominantly south or southwesterly (in con-
trast, over the preceding days the wind had been
constantly northerly or northeasterly). This may have
favoured turbulence and a decreased limit boundary
layer, helping pollen grains to rise from the surfaces
where they had previously been deposited by the rain.
In 2004, pollen concentrations recorded in Santome,
by means a sampler located at a distance of 50 m
from the Q. ilex subsp. ballota stand, were compared
3664
74
50
0
1000
2000
3000
4000
15-Apr 20-Apr 25-Apr
0
25
50
75
100
Santomé
Bamio
Ourense
pollen/m3 pollen/m3Fig. 6 Pollen counts
concentrations of Q. ilexsubsp. ballota in Santome,
Bamio and Ourense city
(mean concentrations from
12:00 h to 20:00 h)
0
100
200
300
400
500
Ho
ur
14
Ho
ur
17
Ho
ur
20
Ho
ur
14
Ho
ur
17
Ho
ur
20
Ho
ur
14
Ho
ur
17
Ho
ur
20
Ho
ur
14
Ho
ur
17
Ho
ur
20
H H Ho
ur
20
19 Apr 20 Apr 22 Apr 24 Apr 25 Apr16 Apr
Santomé
Santomé South
8,3863,1675.435pollen/m3 870
Ho
ur
14
Ho
ur
17
Santomé
Santomé South
8,3863,1675.435pollen/m3 870
H Ho
ur
20
Ho
ur
14
Ho
ur
17
Fig. 7 Q. ilex subsp. ballota pollen concentrations in Santome and South Santome (BPS pollen trap)
100 Aerobiologia (2007) 23:91–105
123

with those recorded in South Santome and Ourense
city. The gradient between Santome and South
Santome was lower than for the other study years.
In 2004, the maximum pollen concentration in
Ourense city was detected at the end of the flowering
period; higher counts were also recorded in Cebolino
at the end of the flowering period in 2004.
Using the results obtained at the various sampling
sites, several maps were made showing the pollen
concentration gradient (Fig. 8). Every year, the
maximum pollen concentrations were recorded either
at the start or at the full flowering phenophase in the
sampler nearest to the pollen source. However, in the
samplers located further upstream, maximum counts
were delayed until the end of flowering.
4 Discussion
Knowledge of the flowering phenology and potential
pollen-release patterns of the various Quercus species
may be of value in assessing the contribution of each
species to total airborne Quercus pollen, as well as in
predicting pollen counts over the year. One aim of the
present study was to measure Quercus ilex subsp.
ballota pollen production, in order to evaluate the
dispersion and transport potential of this pollen and
its contribution to the Quercus pollen curve. Since
there is only one small Quercus ilex subsp. ballota
population near Ourense (where the pollen trap has
been in use since 1993), it was possible to count the
total number of trees and thus quantify total pollen
02004006008001000120014001600180020002200240026002800300032003400360038004000
02004006008001000120014001600180020002200240026002800300032003400360038004000
02004006008001000120014001600180020002200240026002800300032003400360038004000
02004006008001000120014001600180020002200240026002800300032003400360038004000
FULL FLOWERINGSTART FLOWERING
pollen/m3
FULL FLOWERING FINAL FLOWERING
Fig. 8 Pollen count gradient maps in the Santome area
Aerobiologia (2007) 23:91–105 101
123
production. Identification of Q. ilex subsp. ballota
pollen in the Ourense monitoring station enabled a
determination of the percentage of pollen coming
from the source area.
Of the six Quercus species to be found in Ourense,
Q. robur is the first to flower (Jato et al., 2002). Q.
ilex subsp. ballota starts to flower a few days later.
Q. robur and Q. pyrenaica are the most widespread
species in the area and might be expected to be the
major sources of airborne Quercus pollen (Jato et al.,
2002). This study showed that, despite the small
number of trees involved, the contribution of Q. ilex
subsp. ballota to the total Quercus pollen count may
be significant. Airborne Q. ilex subsp. ballota pollen
appears around 20-30 days after atmospheric Quercus
pollen season onset. Its contribution to the Quercus
pollen curve may be as high as 10% in years with
high pollen production and weather conditions that
favor the release and dispersal of pollen into the air.
A marked decline in Quercus ilex subsp. ballota
pollen per catkin was recorded in 2003. The small
size of local Quercus ilex subsp. ballota trees led to
extremely low pollen production per tree. Although
pollen production per anther appears to be genetically
fixed (Subba-Reddi, 1986), total pollen production
per plant is also influenced by other factors (Stanley
& Linskens, 1974) and varies between years (Rogers,
1993). Calculated pollen production per anther was
higher than that reported by Gomez-Casero et al.
(2004) for the same species and similar to that cited
by Tormo et al. (1996) for Q. rotundifolia. Despite
the small size of the trees, pollen production per tree
recorded in 2002 was also higher than that reported
by Gomez-Casero, Hidalgo, Garcia-Mozo, Domın-
guez, and Galan (2004). However, considerable year-
on-year differences were observed in pollen produc-
tion per tree, and particularly in number of catkins
per tree; these may be due to weather-related factors
and to a system of resource allocation similar to that
reported for other species (Moe, 1998; Ranta, Oksa-
nen, Hokkanen, Bondestam, & Heino, 2005). The
study population grows close to its altitudinal limit,
under low-resource conditions that might affect
pollen production. Moreover the pathogenic fungi
observed on catkins in 2004 undoubtedly influenced
total pollen production that year. Fluctuations in
pollen production may account for the biannual or
triannual cycles widely reported for Quercus pollen
(Corden & Millington, 1999; Garcia-Mozo et al.,
1999). Here, there was a sharp fall in catkins per tree
in 2003 and 2004, which might help to account for
the marked decline in Q. ilex subsp. ballota airborne
pollen counts for both years; however, this is unlikely
to be the sole factor influencing airborne pollen
concentrations. Anther dehiscence and pollen dis-
persal was favored by the warm and dry weather
during flowering in 2002, increasing the amount of
pollen in the air. If these conditions are not met,
anthesis can be delayed or reduced, as happened in
2003 and 2004.
Airborne pollen does not exactly reflect the
flowering period (Latorre, 1999). During the mean
phenological flowering period, less than 60% of the
atmospheric annual total pollen was captured (44% in
2002, 37% in 2003 and 65% in 2004; between 68%
and 77% taking into account the total length of
flowering of Q. ilex subsp. ballota). This means that
over 20% of airborne Quercus ilex subsp. ballota
pollen was captured outside of the flowering periods,
much of it afterwards. This fact could be a conse-
quence of the earlier flowering of someunstudied
individual trees (19 trees were studied from 558 in
the population). Weather conditions during flowering
strongly influence pollen release and dispersal. Con-
ditions varied considerably in the three study years,
especially with regard to rainfall. The weather was
sunny and dry (only 14 mm recorded in three days) in
the full flowering period (16 April to 1 May) in 2002;
however, in 2003 (8–20 April) and 2004 (16–27
April) flowering periods were characterized by
abundant rainy days (64 mm were recorded in
nine days in 2003 and 20 mm in five days in 2004).
Such unfavourable meteorological conditions,
especially the abundant rainfall in 2003 and
2004, disturbed pollination and prompted rapid air
cleansing and a consequent decline in pollen counts.
However, when weather conditions are favorable,
airborne pollen remains in the air after flowering, and
the atmospheric pollen season may be longer than the
flowering period. Here, the atmospheric Q. ilex subsp.
ballota pollen season lasted for only eight days in
2004 and 44 days in 2002; however, the total length
of the flowering phenophase was 33 days in 2002 and
20 days in 2004.
Quercus pollen morphology appears not to facil-
itate transport (Mandrioli, Negrini, Cesari, &
Morgan, 1984); however some authors report a
considerable, though varying, capacity for transport
102 Aerobiologia (2007) 23:91–105
123
(Ducousso, Michaud, & Lumaret, 1993; Recio, Trigo,
Toro, & Cabezudo, 1999; Trigo, Recio, Toro, &
Cabezudo, 1997). Weather conditions may play a
major role in facilitating transport; here, while only to
a limited degree, resuspension would appear to be a
possibility, and might account for the increase in
Q. ilex subsp. ballota pollen concentrations once
flowering finished. Maximum pollen concentrations
were recorded at the start of full flowering. However,
a recovery of pollen concentrations was noted every
year at the end of flowering, and even after the
flowering period, especially in the pollen traps
located furthest from the source. Turbulence gener-
ated by atmospheric changes probably favoured a
reduction of the boundary layer, lifting pollen grains
previously deposited on the ground into the air and
depositing them close to the source in conditions of
low wind speeds.
Local topography may also play an important role
in the transport and deposition of pollen grains
(Hjelmroos, 1991). Khanduri et al. (2002) have
suggested that the long-distance transport of Pinus
roxburghii pollen is easier downhill than uphill.
Similarly, transport upstream appears to have been
more favored in the present study, prompting an
increase in Q. ilex subsp. ballota pollen counts at the
end of flowering periods.
Pollen transport is a complex phenomenon involv-
ing various physical factors, such as pollen grain size,
density, and morphology, as well as source-related
factors (location, structural aspects, pollen produc-
tion) (Mandrioli, Negrini, & Zanotti, 1982; Mandr-
ioli, Magnani, & De Nuntiis, 1999) and weather
conditions (wind speed and direction, temperature
and relative humidity). The presence of turbulence
prompted by heating of the air modifies the vertical
structure of the atmosphere helping to raise pollen
and/or prompting its deposition (Giostra, Mandrioli,
Tampieri, & Trombetti, 1991). Here, a marked
gradient in pollen concentrations was recorded over
the short distance from the source to the pollen trap
located in Ourense city. The percentage of Q. ilex
subsp. ballota pollen captured in this sampler in
relation to total pollen production was 0.32 · 10�7%
in 2002, 0.97 · 10�8% in 2003 and 0.15 · 10�8% in
2004. A correlation was noted between years with
low pollen production and low pollen counts. How-
ever, the stable weather during flowering in 2002,
with warm, sunny days, helped to keep pollen
airborne and thus the percentage of pollen captured
was higher. These findings serve to underline the
influence of weather-related factors—particularly
rainfall, which was more abundant and continued
during full flowering and the end of flowering in 2002
and 2003—on airborne pollen concentrations.
5 Conclusions
Airborne pollen counts do not always match flower-
ing periods, and considerable amounts of pollen may
be captured before or after flowering periods. When
pollen curves include pollen from different species,
studies should be carried out to determine the
flowering sequence and the contribution of each
species to overall pollen counts. For an adequate
interpretation of pollen counts, weather conditions,
topographic and phenological factors, together with
possible transport of pollen, should be taken into
account. Phenological studies should be made of
major wind-pollinated tree species in order to
improve the interpretation of airborne pollen data.
References
Aira, M. J., Jato, V., & Iglesias, I. (2005). Calidad del aire.
Polen y esporas en la Comunidad Gallega. Xunta de
Galicia. Santiago de Compostela.
Andersen, B. A. (1991). A model to predict the beginning of
the pollen season. Grana, 30, 269–275.
Aron, R. (1983). Availability of chilling temperatures in
California. Agricultural Meteorology, 28, 351–363.
Belmonte, J., Roure, J. M., & March, X. (1998). Aerobiology
of Vigo, North-Western Spain: Atmospheric pollen
spectrum and annual dynamics of the most important taxa,
and their clinical importance for allergy. Aerobiologia, 14,
155–163.
Chuine, I., Cour, P., & Rousseau, D. D. (1998). Fitting models
predicting dates of flowering of temperate-zone trees
using simulated annealing. Plan Cell and Environment,21, 455–466.
Chuine, I., Cour, P., & Rousseau, D. D. (1999). Selecting
models to predict the timing of flowering temperate trees:
implications for tree phenology modelling. Plant Cell andEnvironment, 22, 1–13.
Corden, J., & Millington, W. (1999). A study of Quercuspollen in Derby area. Aerobiologia, 15, 29–37.
Costa, M., Morla, C., & Sainz, H. (Eds.). (1998). Los bosques
ibericos. Ed. Planeta, Barcelona.
Cruden, R. W. (1977). Pollen-ovule ratios: A conservative
indicator of breeding systems in flowering plants. Evolu-tion, 31, 32–46.
Aerobiologia (2007) 23:91–105 103
123

Domınguez, E., Galan, C., Villamandos, F., & Infante, F.
(1992). Handling and evaluation of the data from the
aerobiological sampling. Monografıas Rea, 1, 1–18.
Ducousso, A., Michaud, H., & Lumaret, R. (1993). Repro-
duction and gene flow in the genus Quercus L. Ann ScicFor, 50(suppl), 91–106.
Emberlin, J., Detandt, M., Gehrig, R., Jaeger, S., Nolard, N., &
Rantio-Lehtimaki, A. (2002). Responses in the start of
Betula (birch) pollen seasons to recent changes in spring
temperature across Europe. International Journal of Bio-meteorology, 46, 159–170.
Emberlin, J., Mullins, J., Corden, J., Millington, W., Brooke,
M., Savage, M., & Jones, S. (1997). The trend to earlier
Birch pollen seasons in the U.K.: A biotic response to
changes in weather conditions? Grana, 36(1), 29–33.
Faust, M. (1989). Physiology of temperate zone fruits trees.
Chichester, New York: John Wiley & Sons.
Ferreiro, M., Nunez, M., Rico, A., Soto, T., & Lopez, R.
(1998). Polenes alergenicos y polinosis en el area de A
Coruna Rev. Esp de Alergol. e Inmunol. Clın, 13,
98–101.
Frenguelli, G., & Bricchi, E. (1998). The use of pheno-climatic
model for forecasting the pollination of some arboreal
taxa. Aerobiologia, 14, 39–44.
Galan, C., Carinanos, P., Garcıa-Mozo, H., Alcazar, P., &
Domınguez, E. (2001). Model for forecasting Oleaeuropaea L. airborne pollen in South-West Andalucıa,
Spain. International Journal of Biometeorology,45, 59–63.
Galan, C., Garcıa-Mozo, H., Vazquez, L., Ruiz, L., Dıaz de la
Guardia C., & Trigo, M. M. (2005). Heat requirement for
the onset of the Olea europaea L. pollen season in several
sites in Andalusia and the effect of the expected future
climate change. International Journal of Biometeorology,49, 184–188.
Garcia-Mozo, H., Galan, C., Carinanos, P., Alcazar, P.,
Mendez, J., Vendrell, M., Alba, F., Saenz, C., Fernandez,
D., Cabezudo, B., & Domınguez, E. (1999). Variations in
the Quercus sp. pollen season at selected sites in Spain.
Polen, 10, 59–69.
Garcia-Mozo, H., Galan, C., Gomez-Casero, M. T., &
Domınguez-Vilches, E. (2000). A comparative study of
different temperature accumulation methods for predict-
ing the start of the Quercus pollen season in Cordoba
(South West Spain). Grana, 39, 194–199.
Garcia-Mozo, H., Galan, C., & Domınguez-Vilches, E.
(2002a). The impact of future climate change in the start
of Quercus flowering in the Iberian Peninsula. Quaternary
climatic changes and environmental crises in the Medi-
terranean Region, July, 2002. Universidad de Alcala de
Henares. Madrid, 1–7.
Garcia-Mozo, H., Galan, C., Aira, M. J., Belmonte, J., Dıaz de
la Guardia, C., Fernandez, D., Gutierrez, A. M.,
Rodrıguez, F. J., Trigo, M. M., & Domınguez-Vilches, E
(2002b). Modelling start of oak pollen season in different
climatic zones in Spain. Agricultural and Forest Meteo-rology, 110, 247–257.
Giostra, U., Mandrioli, P., Tampieri, F., & Trombetti, F.
(1991). Model for pollen immission and transport in the
evolving convective boundary layer. Grana, 30, 210–214.
Gomez-Casero, M. T., Hidalgo, P., Garcia-Mozo, H.,
Domınguez, E., & Galan, C. (2004). Pollen biology in
four Mediterranean Quercus species. Grana, 43, 22–30.
Hidalgo, P. J., Galan, C., & Domınguez, E. (1999). Pollen
production of the genus Cupressus. Grana, 38, 1–5.
Hjelmroos, M. (1991). Evidence of long-distance transport of
Betula pollen. Grana, 30, 215–228.
Ickovic, M., & Thibaudon, M. (1991). Allergenic significance
of Fagaceae pollen. In: G. D’Amato, F. Spieksma, &
S. Bonini (Eds.), Allergenic pollen and pollinosis inEurope. Oxford.
Jato, V., Rodrıguez-Rajo, F. J., Mendez, J., & Aira, M. J.
(2002). Phenological behaviour of Quercus in Ourense
(NW Spain) and its relationship with the atmospheric
pollen season. International Journal of Biometeorology,46, 176–184.
Jato, V., Rodrıguez-Rajo, F. J., Dacosta, N., & Aira, M. J.
(2004). Heat and chill requirements of Fraxinus flowering
in Galicia (NW Spain). Grana, 43, 217–223.
Khanduri, V. P., & Sharma, C. M. (2002). Pollen production,
microsporangium dehiscence and pollen flow in Himalaya
cedar (Cedrus deodora Roxb ex D. Don). Annals of Bot-any, 89(5), 587–593.
Latorre, F. (1997). Comparison between phenological and
aerobiological patterns of some arboreal species of Mar
del Plata (Argentina). Aerobiologia, 13, 49–59.
Latorre, F. (1999). Differences between airborne pollen and
flowering phenology of urban trees with reference to
production, dispersal and interannual climate variability.
Aerobiologia, 15, 131–141.
Mandrioli, P., Magnani, P., & De Nuntiis, P. (1999). Mesoscale
transport of Castanea pollen and its survey in Italy. Paper
presented in the Int. Symposium on Castanea. Lugano,
Switzerland, pp. 25–26.
Mandrioli, P., Negrini, M. G., Cesari, G., & Morgan, G. (1984).
Evidence for long transport of biological and anthropo-
genic aerosol particles in the atmosphere. Grana, 23,
43–53.
Mandrioli, P., Negrini, M. G., & Zanotti, A. L. (1982). Air-
borne pollen from the Yugoslavian coast to the Po Valley
(Italy). Grana, 21, 121–128.
Martınez, A., & Perez, A. (1999). Atlas climatico de Galicia.
Santiago de Compostela, Espana: Xunta de Galicia.
Moe, D. (1998). Pollen production of Alnus incana at this south
Norwegian altitudinal ecotone. Grana, 37, 35–39.
Montero, J. L., & Gonzalez, J. L. (1983). Diagramas bio-climaticos. Madrid: Instituto Nacional para la conserva-
cion de la Naturaleza.
Moore, P. P., & Webb, J. A. (1983). An illustrated guide toPollen Analysis 2. Great Britain: Blackwell Sci Publ.
Nilsson, S., & Persson, S. (1981). Tree pollen spectra in the
Stockholm region (Sweden), 1973–1980. Grana, 20,
179–182.
Ranta, H., Oksanen, A., Hokkanen, T., Bondestam, K., &
Heino, S. (2005). Masting by Betula-species; applying the
resource budget model to north European data set. Inter-national Journal of Biometeorology, 49, 146–151.
Recio, M., Trigo, M. M., Toro, F. J., & Cabezudo, B. (1999).
Estimate and mapping of the activity of airborne pollen
sources. Aerobiologia, 8, 69–74.
104 Aerobiologia (2007) 23:91–105
123

Richardson, E. A., Seeley, S. D., & Walker, D. R. A. (1984).
Model for estimating the completion of rest for ‘‘Redha-
ven’’ and ‘‘Elverta’’ peach trees. HortoScience, 9(3),
331–332.
Rodrıguez-Rajo, F. J., Mendez, J., & Jato, V. (2000). Influencia
de la temperatura en la floracion de Quercus en el sur de
Galicia (Ourense y Vigo, 1994–98). Acta Bot Malacitana,25, 153–163.
Rogers, C. A. (1993). Application of aeropalynological prin-
ciples in Palaeoecology. Review of Paleobotany andPalynology, 79, 133–140.
Stanley, R. G., & Linskens, H. F. (1974). Pollen biology,biochemistry, management. New York: Springer-Verlag,
Berlin, Heidelberg.
Subba-Reddi, C., & Reddi, N. S. (1986). Pollen production in
some anemophilous angiosperms. Grana, 25, 55–61.
Tormo, R., Munoz, A., Silva, I., & Gallardo, F. (1996).
Pollen production in anemophilous trees. Grana, 35,
38–46.
Trigo, M. M., Recio, M, Toro, F. J., & Cabezudo, B (1997).
Intradiurnal fluctuations in airborne pollen in Malaga (S
Spain): A quantitative method. Grana, 36, 39–43.
Wielgolaski, F. E. (1999). Starting dates and basic tempera-
tures in phenological observations of plants. InternationalJournal of Biometeorology, 42, 158–168.
Aerobiologia (2007) 23:91–105 105
123
Recommended


![Front Matter: Volume 10453€¦ · 10453 03 Optical microtopographic inspection of asphalt pavement surfaces [10453-3] 10453 04 Spectrophotometric characterization of hemozoin as](https://img.dokumen.tips/doc/110x75/5fb3ae20c0c8ae0a490ad30c/front-matter-volume-10453-10453-03-optical-microtopographic-inspection-of-asphalt.jpg)