Embed Size (px)
Citation preview

d r a f t Recommendations
Interface Studio LLC
City-Wide Rochester Housing Market Study Analysis
April. 07
ZVA Appendix of Tables referenced in the Market Potential section of the

Table 1
Potential Market For New And Existing Housing UnitsDistribution Of The Potential Market Based On Housing Preferences And Income Levels
Of Draw Area Households With The Potential To Move Within/To The City In 2007City of Rochester, Monroe County, New York
City of Rochester; Balance of Monroe County; Regional Draw Area; All Other U.S. CountiesDraw Areas
Total Target Market HouseholdsWith Potential To Rent/Purchase Within TheCity of Rochester, Monroe County, New York 17,250
Potential Housing Market. . . . . . . . . Multi-Family . . . . . . . . . . . . . . . . . . . Single-Family . . . . . . . . . .
. . . . . . For-Rent . . . . . . . . . . . . . . . . . . . . . . . . . For-Sale . . . . . . . . . . . . . . . . . . .Below Below
Market-Rate* Market-Rate* AllRanges AllRanges Market-Rate* Market-Rate*Apts. Apts. Apts. Attached Detached Detached Total
Total Households: 3,670 4,620 2,380 1,650 1,410 3,520 17,250{Percent}: 21.3% 26.8% 13.8% 9.6% 8.2% 20.3% 100.0%
* Market rate is defined as affordable to households with incomes above 80 percent ofthe Rochester AMFI (Area Median Family Income), which is $64,100 for a family of four as of March 8, 2006.
NOTE: Reference Appendix One, Tables 1 through 11.
SOURCE: Claritas, Inc.;Zimmerman/Volk Associates, Inc.

Table 2
Potential Market For New And Existing Housing Units By Household TypeDistribution Of The Potential Market Based On Housing Preferences And Income Levels
Of Draw Area Households With The Potential To Move Within/To The City In 2007City of Rochester, Monroe County, New York
. . . . . . . Multi-Family . . . . . . . . . . . . . . . . . Single-Family . . . . . . . . . .. . . . . For-Rent . . . . . . . . . . . . . . . . . . . . . . For-Sale . . . . . . . . . . . . . . . . .
Below BelowMarket-Rate* Market-Rate* AllRanges AllRanges Market-Rate* Market-Rate*
Total Apts. Apts. Apts. Attached Detached Detached
Number of Households: 17,250 3,670 4,620 2,380 1,650 1,410 3,520
Empty Nesters& Retirees 29% 16% 18% 50% 30% 40% 40%
Traditional &Non-Traditional Families 41% 53% 37% 21% 41% 43% 45%
YoungerSingles & Couples 30% 31% 45% 29% 29% 17% 15%
100% 100% 100% 100% 100% 100% 100%
* Market rate is defined as affordable to households with incomes above 80 percent ofthe Rochester AMFI (Area Median Family Income), which is $64,100 for a family of four as of March 8, 2006.
NOTE: Reference Appendix One, Tables 1 through 11.
SOURCE: Claritas, Inc.;Zimmerman/Volk Associates, Inc.

Table 3 Page 1 of 5
Summary Of Selected Rental Properties City of Rochester, Monroe County, New York
January, 2007
Number Reported Reported Rent per AdditionalProperty of Units Base Rent Unit Size Sq. Ft. InformationAddress
. . . . . Inside the Loop . . . . . .
. . . . . East End . . . . . .
Chestnut Square (1905;1995) 86 99% occupancy. 328 East Main Street Studio $485 to 300 $0.97 to Elevator,
$560 575 $1.621BR/1BA $585 to 600 $0.98 to
$665 $1.112BR/1BA $660 to 850 $0.78 to
$715 $0.84
East End Lofts 17 82% occupancy. 15 Mathews Street 1BR/1BA $800 to 950 $0.84 to
$1,900 1,140 $1.67
200 East Avenue (1999) 77 97% occupancy. 200 East Avenue 1BR/1BA $985 to 722 $1.26 to Elevators.(Formerly Chevy Place Apts.) $1,135 900 $1.36 80% Market Rate,
2BR/2BA $1,225 to 1,068 $1.11 to 20% Tax Credit.$1,340 1,205 $1.15 Garage $65 mth.
2BR/1 1/2BA -TH $1,165 to 1,078 to $1.04 to Parking $35 mth.$1,185 1,140 $1.08
Temple Building Lofts (1925: 2006) 40 95% occupancy. 14 Franklin Street Studio $900 850 $1.06 Controlled access,
1BR/1BA $1,200 1,000 $1.20 elevators,1BR/2BA $1,350 to 1,300 to $0.98 to high-speed
$1,475 1,500 $1.04 internet access.2BR/2BA $1,550 to 1,325 to $1.06 to
$1,650 1,550 $1.17
2BR/2BA -Penthouses $1,800 to 1,700 to $0.95 to$2,000 2,100 $1.06
1BR/1 1/2BA -Work/Live $1,595 1,750 $0.911BR/2BA -Work/Live $1,875 2,150 $0.87
NOTE: Individual units in small buildings, carriage houses, townhouses, and detached houses range inrent from $300 to $1,250 per month.
SOURCE: Zimmerman/Volk Associates, Inc.

Table 3 Page 2 of 5
Summary Of Selected Rental Properties City of Rochester, Monroe County, New York
January, 2007
Number Reported Reported Rent per AdditionalProperty of Units Base Rent Unit Size Sq. Ft. InformationAddress
. . . . . Grove Place . . . . . .
Halo Lofts at 60 Grove 12 100% occupancy. 60 Grove Street $1,530 1,100 $1.39 Eastman students
NOTE: Other properties, including Chestnut Plaza, East Avenue Commons, and the Alexandrian, as well asindividual units in townhouses, etc. range in rent from $335 to $945 per month.
. . . . . St. Paul Quarter . . . . . .
Andrews Building 18 $525 to 89% occupancy. 216 Andrews Street $950 Elevators,
high-speed internet.
Michaels Stern Lofts (6/03) 45 96% occupancy. 1 Pleasant Street Studio $550 515 $1.07 Security system,
1BR/1BA $725 to 745 to $0.97 to elevators.$975 970 $1.01
2BR/1BA $1,050 to 1,030 to $1.02 to$1,200 1,270 $0.94
Riverview Lofts (2006) 36 90% occupancy. 176 Water Street 1BR/1BA 25 $625 450 to $1.04 to Elevators,
600 $1.39 Wi-Fi access.2BR/1BA 5 $1,125 800 $1.41
Duplex Lofts 6 $1,175 940 $1.25
Water Street Commons 65 98% occupancy. 185 N. Water Street 1BR/1BA $650 to 750 $0.87 to
$700 $0.931BR/1BA w/den $745 963 $0.77
2BR/1BA $800 to 1,196 to $0.67 to$1,000 1,300 $0.77
SOURCE: Zimmerman/Volk Associates, Inc.

Table 3 Page 3 of 5
Summary Of Selected Rental Properties City of Rochester, Monroe County, New York
January, 2007
Number Reported Reported Rent per AdditionalProperty of Units Base Rent Unit Size Sq. Ft. InformationAddress
. . . . . St. Paul Quarter {continued} . . . . . .
Smith-Gormley Building (1987) 18 83% occupancy. 180-82 St. Paul Street $725 to 1,106 $0.49 to Heat included.
$1,050 2,150 $0.66
NOTE: Other properties, including The Gauss, Cox Building, and the Crossroads, range in rents from$325 to $1,550 per month. The 60-unit Kirstein Building, at 234 Andrews Street, is in development.
. . . . . Cascade . . . . . .
Buckingham Commons (2006) 36 In Lease-up.85 Allen Street 1BR/1BA $825 to 730 to $1.13 to
$1,250 1,010 $1.24
Knowlton Building (2000) 14 100% occupancy. 69 Cascade Drive $1,500 to 1,500 to $1.00 WiFi.
$3,200 3,200 $1.00 Indoor parking.
NOTE: The loft at the Daily Record rents for $1,200 per month; other individual apartments range in rentfrom $400 to $450 per month.
. . . . . Outside the Loop . . . . . .
Medical Arts Building (1929; 2006) 31 100% occupancy. 277 Alexander Street 1BR/1.5BA $800 to 600 $1.33 to
2BR/2BA $2,200 1,200 $1.83
. . . . . Corn Hill . . . . . .
Corn Hill Apartments and Townhouses (1980s) 80 96% occupancy. 715 Clarissa Street 1BR/1BA $635 to 500 $1.27 to
$675 $1.352BR/1 1/2BA -TH $850 1,150 $0.74
3BR/2BA -TH $1,050 1,500 $0.70
SOURCE: Zimmerman/Volk Associates, Inc.

Table 3 Page 4 of 5
Summary Of Selected Rental Properties City of Rochester, Monroe County, New York
January, 2007
Number Reported Reported Rent per AdditionalProperty of Units Base Rent Unit Size Sq. Ft. InformationAddress
. . . . . Corn Hill {continued} . . . . . .
Corn Hill Landing 127301 Exchange Boulevard 1BR/1BA $650 to Retail,
2BR/1.5BA $2,550 restaurants.2BR/2BA3BR/3BA
. . . . . East Side . . . . . .
The Renaissance (1974; 2001) 186 90% occupancy. 2500 East Avenue Studio $995 500 $1.99 Gated, pool, spa,
1BR/1 1/2BA $795 to 980 to $0.81 to fitness center, $1,300 1,100 $1.18 cable TV.
2BR/2BA $1,175 to 1,437 to $0.82 to$1,950 1,580 $1.23
3BR/2BA $1,795 to 1,743 $1.03 to$2,450 $1.41
1600 East Avenue Apartments (1958; 1998) 164 80% occupancy. 1600 East Avenue Studio $800 to 396 $2.02 to Fitness center,
$895 $2.26 media center,1BR/1BA $995 to 634 $1.57 to billiard room, cable.
$1,345 $2.122BR/1BA $1,095 to 877 $1.25 to
$1,570 $1.792BR/2BA $1,220 to 935 $1.30 to
$1,670 $1.793BR/2BA $1,820 1,493 $1.22
$2,320 $1.55
SOURCE: Zimmerman/Volk Associates, Inc.

Table 3 Page 5 of 5
Summary Of Selected Rental Properties City of Rochester, Monroe County, New York
January, 2007
Number Reported Reported Rent per AdditionalProperty of Units Base Rent Unit Size Sq. Ft. InformationAddress
. . . . . Other . . . . . .
Imperial South 132 92% occupancy. 1577 Elmwood Avenue Studio $615 390 $1.58
1BR/1BA $710 to 680 $1.04 to$735 $1.08
2BR/1BA $780 820 $0.952BR/1 1/2BA $795 to 910 $0.81 to
$820 1,010 $0.87
1600 Elmwood 210 95% occupancy. 1600 Elmwood Avenue Studio $730 to 514 $1.42 to Pool, fitness center,
$780 $1.52 community center,1BR/1BA $850 to 711 $1.20 to business center.
$865 $1.222BR/1BA $930 to 966 $0.96 to
$1,010 $1.053BR/2BA $1,229 to 1,124 $1.09 to
$1,279 $1.14
SOURCE: Zimmerman/Volk Associates, Inc.

Table 4
Summary Of Selected For-Sale Multi-FamilyAnd Single-Family Attached Units
Monroe County, New YorkDecember, 2006
Total SalesUnit Unit Price Unit Size Price Per Total (Monthly
Development (Date Opened) Type Range Range Sq. Ft. Units Average)
. . . . Rochester . . . .
Rowhouses at 100 Union TH $349,900 † 2,280 $153 6 0Morris, Architect $379,000 † 2,400 $158
Sagamore On East (2003) CO $484,900 † 2,150 $226 23 22 (0.6)Christa Companies $519,900 † 2,150 $242
$598,000 † 2,400 $249
. . . . Henrietta . . . .
Eagle Pine Way TH $139,900 † 1,230 $114$159,359 † 1,218 $131$172,000 † 1,809 $95
Rivers Run (2006) TH $209,900 † 1,600 $131$222,900 † 1,955 $114$234,900 † 1,880 $125
. . . . Greece . . . .
Windwood Way area TH $169,900 † 1,445 $118$179,900 † 1,406 $128
. . . . Irondequoit . . . .
Audubon Trail TH $189,900 † 1,386 $137$212,400 † 1,402 $151
† Individual units.
SOURCE: Zimmerman/Volk Associates, Inc.�

Table 5
Summary of Current Multi-Family ListingsCity of Rochester, Monroe County, New York
January, 2007
List Unit Price PerAddress Year Built Price Size Square Foot Configuration
. . . . . Condominiums . . . . .
270 Latta Road 1984 $74,900 1,505 $50 2BR/2BA947 East Avenue 1903 $79,000 943 $84 1BR/2BA
1400 East Avenue 1968 $87,900 894 $98 1BR/1BA1000 East Avenue 1959 $94,900 975 $97 2BR/2BA1000 East Avenue 1959 $109,000 900 $121 2BR/1BA203 Gregory Park 1903 $109,900 1,580 $70 2BR/1BA30 Cornhill Place 1986 $134,900 1,322 $102 2BR/2BA
1412 East Avenue 1916 $209,900 1,550 $135 2BR/2BA
. . . . . Townhouses . . . . .
26Wangman Street 1995 $64,900 1,326 $49 3BR/2BA682 Broadway 1985 $73,000 1,090 $67 2BR/2BA
200 Corn Hill Place 1987 $79,900 682 $117 1BR/2BA354 Frederick Douglas 1983 $79,900 692 $115 1BR/2BA
124 Adams Street 1984 $109,900 1,512 $73 2BR/2.5BA374 Frederick Douglas 1983 $124,900 1,250 $100 2BR/2BA
359 South Plymouth 1985 $129,900 1,287 $101 2BR/2BA6 Grove Street 1996 $269,900 1,600 $169 3BR/3BA
145 Gibbs Street 2003 $399,900 3,080 $130 3BR/3BA
SOURCE: Multiple Listing Service;Zimmerman/Volk Associates, Inc.

Table 6 Page 1 of 3
Summary of Current Single-Family ListingsNew Construction
Greece, Irondequoit, Chili, and Brighton, Monroe County, New YorkJanuary, 2007
List Unit Price PerAddress Year Built Price Size Square Foot Configuration
. . . . . Greece . . . . .
Wendy Lane 2006 $99,900 792 $126 1BR/1BA2007 $124,900 1,281 $98 3BR/2BA2007 $124,900 832 $150 2BR/1BA2006 $129,900 1,011 $128 2BR/1BA
Haviland Park 2007 $115,900 1,208 $96 3BR/2BA2007 $121,900 1,333 $91 4BR/2BA
Black Duck Trail 2006 $164,900 1,443 $114 3BR/2BA
Quarterdeck 2006 $166,900 1,443 $116 2BR/2BA2006 $167,900 1,477 $114 3BR/2BA2006 $189,900 1,735 $109 3BR/2BA2006 $192,900 2,003 $96 3BR/3BA2006 $192,900 1,840 $105 3BR/3BA2006 $209,900 2,157 $97 4BR/3BA2006 $209,900 2,181 $96 4BR/3BA2006 $239,900 2,206 $109 3BR/3BA2006 $249,900 2,440 $102 3BR/3BA
Emery Run 2006 $169,900 1,270 $134 3BR/2BA2006 $198,900 1,720 $116 3BR/2BA
Pollet Place 2006 $179,900 1,340 $134 2BR/2BA
Avery Park Lane 2007 $180,000 1,498 $120 3BR/2BA2006 $185,000 1,498 $123 3BR/4BA2007 $195,000 1,498 $130 3BR/4BA
Whispering Pines 2007 $184,900 1,519 $122 3BR/2BA2007 $224,900 2,100 $107 4BR/2BA2007 $229,900 2,111 $109 4BR/3BA
SOURCE: Multiple Listing Service;Zimmerman/Volk Associates, Inc.

Table 6 Page 2 of 3
Summary of Current Single-Family ListingsNew Construction
Greece, Irondequoit, Chili, and Brighton, Monroe County, New YorkJanuary, 2007
List Unit Price PerAddress Year Built Price Size Square Foot Configuration
. . . . . Greece {continued} . . . . .
Talnuck Drive 2006 $198,900 2,164 $92 4BR/3BA2006 $225,900 2,478 $91 4BR/3BA2007 $254,900 2,466 $103 4BR/3BA2007 $269,900 2,613 $103 4BR/3BA
Mill Road 2007 $199,900 1,860 $107 3BR/3BA
Old Country Road 2007 $199,900 1,540 $130 3BR/2BA2007 $219,900 1,668 $132 3BR/2BA2007 $268,335 2,508 $107 3BR/3BA2007 $269,900 2,910 $93 4BR/3BA
East Moreno Drive 2007 $264,900 1,925 $138 3BR/2BA2007 $274,900 1,925 $143 3BR/3BA
Raspberry Patch Drive 2006 $270,000 2,500 $108 4BR/2BA2006 $329,900 3,050 $108 4BR/4BA2006 $329,900 2,526 $131 4BR/4BA
Melwood 2006 $279,900 2,910 $96 4BR/3BACarrington Drive 2006 $279,900 2,120 $132 3BR/3BABronze Leaf Trail 2006 $279,900 2,295 $122 3BR/3BA
Emery Run 2006 $282,000 2,787 $101 4BR/3BA
Cherry Creek Lane 2006 $295,000 2,372 $124 4BR/3BA2006 $310,000 1,995 $155 3BR/3BA2007 $321,000 2,676 $120 4BR/3BA2006 $349,900 2,890 $121 4BR/3BA
North Church Road 2006 $299,900 2,980 $101 4BR/3BA
Canal Woods 2007 $425,450 2,833 $150 4BR/3BA2006 $585,400 3,473 $169 4BR/4BA
Whisper Creek Court 2006 $599,977 3,168 $189 3BR/3BA
SOURCE: Multiple Listing Service;Zimmerman/Volk Associates, Inc.

Table 6 Page 3 of 3
Summary of Current Single-Family ListingsNew Construction
Greece, Irondequoit, Chili, and Brighton, Monroe County, New YorkJanuary, 2007
List Unit Price PerAddress Year Built Price Size Square Foot Configuration
. . . . . Irondequoit . . . . .
Knapp Avenue 2007 $114,900 900 $128 2BR/2BA2006 $129,900 1,220 $106 3BR/2BA2007 $134,900 1,272 $106 3BR/2BA2007 $139,900 1,333 $105 4BR/2BA
Frontenac Heights 2007 $144,900 1,209 $120 3BR/2BA
. . . . . Chili . . . . .
Chili Avenue 2007 $139,900 1,200 $117 3BR/2BAMarshall Road 2006 $184,900 1,540 $120 3BR/3BA
Kings Way 2007 $189,900 1,660 $114 3BR/2BAAttridge Road 2006 $189,900 1,950 $97 3BR/3BAVintage Lane 2006 $189,900 1,730 $110 3BR/3BA
Knights Trail West 2006 $195,000 1,940 $101 4BR/3BA2006 $224,900 2,100 $107 3BR/3BA
Grove Wood 2006 $219,900 1,721 $128 3BR/2BAChestnut Ridge 2006 $250,000 2,200 $114 4BR/3BA
Black Cedar Drive 2007 $259,900 2,234 $116 4BR/3BAEast Bellaqua 2006 $349,900 3,034 $115 3BR/3BA
. . . . . Brighton . . . . .
Babcock Drive 2007 $630,000 3,400 $185 4BR/3BA2007 $675,000 3,700 $182 4BR/3BA
Warren Avenue 2006 $775,563 3,912 $198 4BR/4BASouthern Parkway 2007 $875,000 4,126 $212 4BR/4BA
Council Rock Avenue 2006 $947,700 4,263 $222 4BR/4BA
SOURCE: Multiple Listing Service;Zimmerman/Volk Associates, Inc.
Table 7
Potential Market For Downtown/High Falls Housing UnitsDistribution Of The Potential Market Based On Housing Preferences And Income Levels
Of Draw Area Households With The Potential To Move Within/To The City In 2007City of Rochester, Monroe County, New York
City of Rochester; Balance of Monroe County; Regional Draw Area; All Other U.S. CountiesDraw Areas
Total Target Market HouseholdsWith Potential To Rent/Purchase Within TheCity of Rochester, Monroe County, New York 17,250
Total Target Market HouseholdsWith Potential To Rent/Purchase Within
The Downtown/High Falls Study Area 3,090
Annual Downtown/High Falls Housing Market. . . . . . . . . Multi-Family . . . . . . . . . . . Single-Family . .
. . . . . . For-Rent . . . . . . . . . . . . For-Sale . . . . . . Below
Market-Rate* Market-Rate* AllRanges AllRangesApts. Apts. Apts. Attached Total
Total Households: 610 1,130 890 460 3,090{Percent}: 19.7% 36.6% 28.8% 14.9% 100.0%
* Market rate is defined as affordable to households with incomes above 80 percent ofthe Rochester AMFI (Area Median Family Income), which is $64,100 for a family of four as of March 8, 2006.
NOTE: Reference Appendix One, Tables 1 through 15.
SOURCE: Claritas, Inc.;Zimmerman/Volk Associates, Inc.

Table 8
Annual Potential Market For Downtown/High Falls Housing Units By Household TypeDistribution Of The Potential Market Based On Housing Preferences And Income Levels
Of Draw Area Households With The Potential To Move Within/To The City In 2007City of Rochester, Monroe County, New York
. . . . . . . . . . . . . Multi-Family . . . . . . . . . . . . . . . Single-Family . .. . . . . For-Rent . . . . . . . . . . For-Sale . . . . .
BelowMarket-Rate* Market-Rate* AllRanges AllRanges
Total Apts. Apts. Apts. Attached
Number of Households: 3,090 610 1,130 890 460
Empty Nesters& Retirees 37% 26% 22% 61% 43%
Traditional &Non-Traditional Families 17% 34% 17% 6% 14%
YoungerSingles & Couples 46% 40% 61% 33% 43%
100% 100% 100% 100% 100%
* Market rate is defined as affordable to households with incomes above 80 percent ofthe Rochester AMFI (Area Median Family Income), which is $64,100 for a family of four as of March 8, 2006.
NOTE: Reference Appendix One, Tables 1 through 15.
SOURCE: Claritas, Inc.;Zimmerman/Volk Associates, Inc.

Table 9
Target Groups For New Mixed-Income Multi-Family For RentThe Downtown/High Falls Study Area
City of Rochester, Monroe County, New York
. . . . . . . . . . . . . . . Number of Households . . . . . . . . . . . . . . .
Empty Nesters Below Above At 10 Percent & Retirees 80% AMI* 80% AMI* Total Capture
Urban Establishment 0 20 20 2Small-Town Establishment 0 20 20 2
Suburban Establishment 0 40 40 4Affluent Empty Nesters 0 40 40 4Cosmopolitan Couples 0 30 30 3
New Empty Nesters 0 10 10 1Blue-Collar Retirees 0 10 10 1Downtown Retirees 110 60 170 17
Multi-Ethnic Seniors 40 20 60 6Second City Seniors 10 0 10 1
Subtotal: 160 250 410 41
Traditional &Non-Traditional Families
The Entrepreneurs 0 10 10 1Full-Nest Urbanites 0 20 20 2
Multi-Cultural Families 40 40 80 8In-Town Families 160 110 270 27
Single Parent Families 10 10 20 2
Subtotal: 210 190 400 40
YoungerSingles & Couples
e-Types 0 50 50 5Fast-Track Professionals 0 40 40 4
The VIPs 0 10 10 1Upscale Suburban Couples 0 70 70 7
New Bohemians 40 100 140 14Urban Achievers 160 380 540 54
Twentysomethings 10 10 20 2Small-City Singles 10 20 30 3
Blue-Collar Singles 10 10 20 20Soul City Singles 10 0 10 1
Subtotal: 240 690 930 93
Total Households: 610 1,130 1,740 174
SOURCE: Claritas, Inc.;Zimmerman/Volk Associates, Inc.

Table 10
Target Groups For New Mixed-Income Multi-Family For SaleThe Downtown/High Falls Study Area
City of Rochester, Monroe County, New York
Empty Nesters Number of At 10 Percent & Retirees Households Capture
Old Money 20 2UrbanEstablishment 20 2
Small-Town Establishment 20 2Suburban Establishment 40 4Affluent Empty Nesters 50 5
Cosmopolitan Elite 10 1Cosmopolitan Couples 20 2
New Empty Nesters 10 1Downtown Retirees 70 7Hometown Retirees 10 1
Multi-Ethnic Seniors 270 27Subtotal: 540 54
Traditional &Non-Traditional Families
Multi-Cultural Families 10 1In-Town Families 40 4
Single-Parent Families 10 1
Subtotal: 60 6
YoungerSingles & Couples
e-Types 30 3Fast-Track Professionals 20 2
New Bohemians 50 5Upscale Suburban Couples 30 30
Urban Achievers 120 12Twentysomethings 10 1Small-City Singles 10 1
Soul City Singles 20 2
Subtotal: 290 29
Total Households: 890 89
SOURCE: Claritas, Inc.;Zimmerman/Volk Associates, Inc.

Table 11
Target Groups For New Mixed-Income Single-Family Attached For SaleThe Downtown/High Falls Study Area
City of Rochester, Monroe County, New York
Empty Nesters Number of At 10 Percent & Retirees Households Capture
Old Money 10 1UrbanEstablishment 20 2
Small-Town Establishment 20 2Suburban Establishment 40 4Affluent Empty Nesters 30 3Cosmopolitan Couples 20 2
New Empty Nesters 10 1Downtown Retirees 20 2
Multi-Ethnic Seniors 30 3Subtotal: 200 20
Traditional &Non-Traditional Families
The Entrepreneurs 10 1Full-Nest Urbanites 10 1
Multi-Cultural Families 30 3In-Town Families 10 1
Subtotal: 60 6
YoungerSingles & Couples
e-Types 20 2Fast-Track Professionals 10 1
The VIPs 10 1New Bohemians 30 3
Upscale Suburban Couples 40 40Urban Achievers 70 7
Twentysomethings 10 1Small-City Singles 10 1
Subtotal: 200 20
Total Households: 460 46
SOURCE: Claritas, Inc.;Zimmerman/Volk Associates, Inc.

Table 12
Potential Market For Maplewood Housing UnitsDistribution Of The Potential Market Based On Housing Preferences And Income Levels
Of Draw Area Households With The Potential To Move Within/To The City In 2007City of Rochester, Monroe County, New York
City of Rochester; Balance of Monroe County; Regional Draw Area; All Other U.S. CountiesDraw Areas
Total Target Market HouseholdsWith Potential To Rent/Purchase Within TheCity of Rochester, Monroe County, New York 17,250
Total Target Market HouseholdsWith Potential To Rent/Purchase Within
The Maplewood Study Area 1,550
Annual Maplewood Housing Market. . . . . . . . . Multi-Family . . . . . . . . . . . . . . . . . . . Single-Family . . . . . . . . . .
. . . . . . For-Rent . . . . . . . . . . . . . . . . . . . . . . . . . For-Sale . . . . . . . . . . . . . . . . . . .Below Below
Market-Rate* Market-Rate* AllRanges AllRanges Market-Rate* Market-Rate*Apts. Apts. Apts. Attached Detached Detached Total
Total Households: 350 320 200 50 210 420 1,550{Percent}: 22.6% 20.6% 12.9% 3.3% 13.5% 27.1% 100.0%
* Market rate is defined as affordable to households with incomes above 80 percent ofthe Rochester AMFI (Area Median Family Income), which is $64,100 for a family of four as of March 8, 2006.
NOTE: Reference Appendix One, Tables 1 through 11, and 16 through 19.
SOURCE: Claritas, Inc.;Zimmerman/Volk Associates, Inc.

Table 13
Annual Potential Market For Maplewood Housing Units By Household TypeDistribution Of The Potential Market Based On Housing Preferences And Income Levels
Of Draw Area Households With The Potential To Move Within/To The City In 2007City of Rochester, Monroe County, New York
. . . . . . . Multi-Family . . . . . . . . . . . . . . . . . Single-Family . . . . . . . . . .. . . . . For-Rent . . . . . . . . . . . . . . . . . . . . . . For-Sale . . . . . . . . . . . . . . . . .
Below BelowMarket-Rate* Market-Rate* AllRanges AllRanges Market-Rate* Market-Rate*
Total Apts. Apts. Apts. Attached Detached Detached
Number of Households: 1,550 350 320 200 50 210 420
Empty Nesters& Retirees 34% 23% 16% 40% 20% 62% 40%
Traditional &Non-Traditional Families 34% 34% 34% 30% 60% 24% 39%
YoungerSingles & Couples 32% 43% 50% 30% 20% 14% 21%
100% 100% 100% 100% 100% 100% 100%
* Market rate is defined as affordable to households with incomes above 80 percent ofthe Rochester AMFI (Area Median Family Income), which is $64,100 for a family of four as of March 8, 2006.
NOTE: Reference Appendix One, Tables 1 through 11, and 16 through 19.
SOURCE: Claritas, Inc.;Zimmerman/Volk Associates, Inc.

Table 14
Target Groups For New Mixed-Income Multi-Family For RentThe Maplewood Study Area
City of Rochester, Monroe County, New York
. . . . . . . . . . . . . . . Number of Households . . . . . . . . . . . . . . .
Empty Nesters Below Above At 15 Percent & Retirees 80% AMI* 80% AMI* Total Capture
Suburban Establishment 0 10 10 2Affluent Empty Nesters 0 10 10 2
Multi-Ethnic Empty Nesters 30 20 50 6Mainstream Retirees 10 0 10 2
Middle-American Retirees 10 0 10 2Suburban Seniors 10 0 10 2
Downtown Retirees 10 10 20 3Multi-Ethnic Seniors 10 0 10 2
Subtotal: 80 50 130 21
Traditional &Non-Traditional Families
Full-Nest Urbanites 0 20 20 3Full-Nest Suburbanites 0 10 10 2Multi-Cultural Families 40 40 80 12
Blue-Collar Button-Downs 10 0 10 2Struggling Suburbanites 10 10 20 3
In-Town Families 30 20 50 6Urban Public Housing 30 10 40 6
Subtotal: 120 110 230 34
YoungerSingles & Couples
e-Types 0 10 10 2Upscale Suburban Couples 10 10 20 3
New Bohemians 10 20 30 5Urban Achievers 70 50 120 18
Twentysomethings 0 10 10 2Suburban Achievers 20 30 50 6
No-Nest Suburbanites 10 0 10 2Small-City Singles 0 10 10 2Suburban Strivers 30 20 50 6
Subtotal: 150 160 310 46
Total Households: 350 320 670 101
SOURCE: Claritas, Inc.;Zimmerman/Volk Associates, Inc.

Table 15
Target Groups For New Mixed-Income Multi-Family For SaleThe Maplewood Study Area
City of Rochester, Monroe County, New York
Empty Nesters Number of At 15 Percent & Retirees Households Capture
Multi-Ethnic Empty Nesters 20 2Mainstream Retirees 10 2
Suburban Seniors 10 2Downtown Retirees 10 2
Multi-Ethnic Seniors 30 2Subtotal: 80 10
Traditional &Non-Traditional Families
Full-Nest Urbanites 10 2Multi-Cultural Families 20 2
Struggling Suburbanites 10 2In-Town Families 10 2
Urban Public Housing 10 2
Subtotal: 60 10
YoungerSingles & Couples
New Bohemians 10 2Upscale Suburban Couples 10 2
Urban Achievers 10 2Suburban Achievers 10 2
Suburban Strivers 20 2
Subtotal: 60 10
Total Households: 200 30
SOURCE: Claritas, Inc.;Zimmerman/Volk Associates, Inc.

Table 16
Target Groups For New Mixed-Income Single-Family Attached For SaleThe Maplewood Study Area
City of Rochester, Monroe County, New York
Empty Nesters Number of At 10 Percent & Retirees Households Capture
Multi-Ethnic Empty Nesters 10 1Subtotal: 10 1
Traditional &Non-Traditional Families
Full-Nest Urbanites 10 1Multi-Cultural Families 20 2
Subtotal: 30 3
YoungerSingles & Couples
0Urban Achievers 10 1
Subtotal: 10 1
Total Households: 50 5
SOURCE: Claritas, Inc.;Zimmerman/Volk Associates, Inc.

Table 17 Page 1 of 2
Target Groups For New Mixed-Income Single-Family Detached For SaleThe Maplewood Study Area
City of Rochester, Monroe County, New York
. . . . . Number of Households . . . . .
Empty Nesters Below Above 10 Percent & Retirees 80% AMI* 80% AMI* Total Capture
Urban Establishment 0 20 20 2Suburban Establishment 10 30 40 4Affluent Empty Nesters 10 20 30 3Cosmopolitan Couples 0 10 10 1
New Empty Nesters 0 20 20 2Multi-Ethnic Empty Nesters 30 30 60 6
Mainstream Retirees 10 10 20 2RV Retirees 10 0 10 1
Middle-Class Move-Downs 10 0 10 1Middle-American Retirees 20 20 40 4
Suburban Retirees 10 0 10 1Downtown Retirees 10 10 20 20
Multi-Ethnic Seniors 10 0 10 1Subtotal: 130 170 300 30
Traditional &Non-Traditional Families
The Entrepreneurs 0 10 10 1Nouveau Money 0 10 10 1
Full-Nest Urbanites 0 30 30 3Unibox Transferees 0 10 10 1
Late-Nest Suburbanites 0 30 30 3Full-Nest Suburbanites 0 40 40 4Multi-Cultural Families 30 20 50 5
Blue-Collar Button-Downs 10 10 20 2Struggling Suburbanites 10 0 10 1
Subtotal: 50 160 210 21
SOURCE: Claritas, Inc.;Zimmerman/Volk Associates, Inc.

Table 17 Page 2 of 2
Target Groups For New Mixed-Income Single-Family Detached For SaleThe Maplewood Study Area
City of Rochester, Monroe County, New York
. . . . . Number of Households . . . . .
Younger Below Above 10 PercentSingles & Couples 80% AMI* 80% AMI* Total Capture
e-Types 0 10 10 1Fast-Track Professionals 0 10 10 1
The VIPs 0 10 10 10 0Upscale Suburban Couples 0 30 30 3
Cross-Training Couples 10 0 10 1Urban Achievers 10 0 10 1
Suburban Achievers 0 10 10 1No-Nest Suburbanites 10 20 30 3
Subtotal: 30 90 120 12
Total Households: 210 420 630 63
SOURCE: Claritas, Inc.;Zimmerman/Volk Associates, Inc.

Table 18
Potential Market For North And South Marketview Heights Housing UnitsDistribution Of The Potential Market Based On Housing Preferences And Income Levels
Of Draw Area Households With The Potential To Move Within/To The City In 2007City of Rochester, Monroe County, New York
City of Rochester; Balance of Monroe County; Regional Draw Area; All Other U.S. CountiesDraw Areas
Total Target Market HouseholdsWith Potential To Rent/Purchase Within The
Of Draw Area Households With The Potential To Move Within/To The City In 2007 17,250
Total Target Market HouseholdsWith Potential To Rent/Purchase Within The North
And South Marketview Heights Neighborhood 1,300
Annual North And South Marketview Heights Housing Market. . . . . . . . . Multi-Family . . . . . . . . . . . . . . . . . . . Single-Family . . . . . . . . . .
. . . . . . For-Rent . . . . . . . . . . . . . . . . . . . . . . . . . For-Sale . . . . . . . . . . . . . . . . . . .Below Below
Market-Rate* Market-Rate* AllRanges AllRanges Market-Rate* Market-Rate*Apts. Apts. Apts. Attached Detached Detached Total
Total Households: 350 300 290 70 130 160 1,300{Percent}: 26.9% 23.1% 22.3% 5.4% 10.0% 12.3% 100.0%
* Market rate is defined as affordable to households with incomes above 80 percent ofthe Rochester AMFI (Area Median Family Income), which is $64,100 for a family of four as of March 8, 2006.
NOTE: Reference Appendix One, Tables 1 through 11, 20 through 23.
SOURCE: Claritas, Inc.;Zimmerman/Volk Associates, Inc.

Table 19
Annual Potential Market For North And Marketview Heights Units By Household TypeDistribution Of The Potential Market Based On Housing Preferences And Income Levels
Of Draw Area Households With The Potential To Move Within/To The City In 2007City of Rochester, Monroe County, New York
. . . . . . . Multi-Family . . . . . . . . . . . . . . . . . Single-Family . . . . . . . . . .. . . . . For-Rent . . . . . . . . . . . . . . . . . . . . . . For-Sale . . . . . . . . . . . . . . . . .
Below BelowMarket-Rate* Market-Rate* AllRanges AllRanges Market-Rate* Market-Rate*
Total Apts. Apts. Apts. Attached Detached Detached
Number of Households: 1,300 350 300 290 70 130 160
Empty Nesters& Retirees 38% 29% 17% 58% 43% 62% 44%
Traditional &Non-Traditional Families 38% 42% 46% 28% 43% 23% 44%
YoungerSingles & Couples 24% 29% 37% 14% 14% 15% 12%
100% 100% 100% 100% 100% 100% 100%
* Market rate is defined as affordable to households with incomes above 80 percent ofthe Rochester AMFI (Area Median Family Income), which is $64,100 for a family of four as of March 8, 2006.
NOTE: Reference Appendix One, Tables 1 through 11, 20 through 23.
SOURCE: Claritas, Inc.;Zimmerman/Volk Associates, Inc.

Table 20
Target Groups For New Mixed-Income Multi-Family For RentThe North And South Marketview Heights Study Area
City of Rochester, Monroe County, New York
. . . . . . . . . . . . . . . Number of Households . . . . . . . . . . . . . . .
Empty Nesters Below Above At 10 Percent & Retirees 80% AMI* 80% AMI* Total Capture
Multi-Ethnic Empty Nesters 30 10 40 4Downtown Retirees 40 30 70 7
Multi-Ethnic Seniors 20 10 30 3Second City Seniors 10 0 10 1
Subtotal: 100 50 150 15
Traditional &Non-Traditional Families
Full-Nest Urbanites 0 20 20 2Multi-Cultural Families 40 40 80 8
In-Town Families 50 40 90 9Single-Parent Families 10 10 20 2Urban Public Housing 50 30 80 8
Subtotal: 150 140 290 29
YoungerSingles & Couples
e-Types 0 10 10 1New Bohemians 10 20 30 3Urban Achievers 70 50 120 12
Twentysomethings 0 10 10 1Small-City Singles 0 10 10 1
Blue-Collar Singles 10 10 20 2Soul City Singles 10 0 10 1
Subtotal: 100 110 210 21
Total Households: 350 300 650 65
SOURCE: Claritas, Inc.;Zimmerman/Volk Associates, Inc.

Table 21
Target Groups For New Mixed-Income Multi-Family For SaleThe North And South Marketview Heights Study Area
City of Rochester, Monroe County, New York
Empty Nesters Number of At 10 Percent & Retirees Households Capture
Multi-Ethnic Empty Nesters 20 2Downtown Retirees 30 3
Multi-Ethnic Seniors 120 12Subtotal: 170 17
Traditional &Non-Traditional Families
Full-Nest Urbanites 10 1Multi-Cultural Families 20 2
In-Town Families 20 2Single-Parent Families 10 1Urban Public Housing 20 2
Subtotal: 80 8
YoungerSingles & Couples
New Bohemians 10 1Urban Achievers 10 1Soul City Singles 20 2
Subtotal: 40 4
Total Households: 290 29
SOURCE: Claritas, Inc.;Zimmerman/Volk Associates, Inc.

Table 22
Target Groups For New Mixed-Income Single-Family Attached For SaleThe North And South Marketview Heights Study Area
City of Rochester, Monroe County, New York
Empty Nesters Number of At 10 Percent & Retirees Households Capture
Multi-Ethnic Empty Nesters 10 1Downtown Retirees 10 1
Multi-Ethnic Seniors 10 1Subtotal: 30 3
Traditional &Non-Traditional Families
Full-Nest Urbanites 10 1Multi-Cultural Families 20 2
Subtotal: 30 3
YoungerSingles & Couples
Urban Achievers 10 1
Subtotal: 10 1
Total Households: 70 7
SOURCE: Claritas, Inc.;Zimmerman/Volk Associates, Inc.

Table 23
Target Groups For New Mixed-Income Single-Family Detached For SaleThe North And South Marketview Heights Study Area
City of Rochester, Monroe County, New York
. . . . . Number of Households . . . . .
Empty Nesters Below Above At 10 Percent & Retirees 80% AMI* 80% AMI* Total Capture
Urban Establishment 0 10 10 1Cosmopolitan Couples 0 10 10 1
Multi-Ethnic Empty Nesters 20 10 30 3Middle-Class Move-Downs 0 10 10 10
Blue-Collar Retirees 10 0 10 1Downtown Retirees 30 20 50 5Hometown Retirees 10 0 10 10
Multi-Ethnic Seniors 10 10 20 2Subtotal: 80 70 150 15
Traditional &Non-Traditional Families
Full-Nest Urbanites 0 30 30 3Unibox Transferees 0 10 10 1
Multi-Cultural Families 30 20 50 5Single-Parent Families 0 10 10 1
Subtotal: 30 70 100 10
YoungerSingles & Couples
e-Types 0 10 10 1The VIPs 0 10 10 1
Urban Achievers 10 0 10 1Blue-Collar Singles 10 0 10 1
Subtotal: 20 20 40 4
Total Households: 130 160 290 29
SOURCE: Claritas, Inc.;Zimmerman/Volk Associates, Inc.

Table 24
Potential Market For South Wedge Housing UnitsDistribution Of The Potential Market Based On Housing Preferences And Income Levels
Of Draw Area Households With The Potential To Move Within/To The City In 2007City of Rochester, Monroe County, New York
City of Rochester; Balance of Monroe County; Regional Draw Area; All Other U.S. CountiesDraw Areas
Total Target Market HouseholdsWith Potential To Rent/Purchase Within The
Of Draw Area Households With The Potential To Move Within/To The City In 2007 17,250
Total Target Market HouseholdsWith Potential To Rent/Purchase Within
The South Wedge Neighborhood 1,190
Annual South Wedge Housing Market. . . . . . . . . Multi-Family . . . . . . . . . . . . . . . . . . . Single-Family . . . . . . . . . .
. . . . . . For-Rent . . . . . . . . . . . . . . . . . . . . . . . . . For-Sale . . . . . . . . . . . . . . . . . . .Below Below
Market-Rate* Market-Rate* AllRanges AllRanges Market-Rate* Market-Rate*Apts. Apts. Apts. Attached Detached Detached Total
Total Households: 230 390 280 80 70 140 1,190{Percent}: 19.3% 32.8% 23.5% 6.7% 5.9% 11.8% 100.0%
* Market rate is defined as affordable to households with incomes above 80 percent ofthe Rochester AMFI (Area Median Family Income), which is $64,100 for a family of four as of March 8, 2006.
NOTE: Reference Appendix One, Tables 1 through 11, 24 through 27.
SOURCE: Claritas, Inc.;Zimmerman/Volk Associates, Inc.

Table 25
Annual Potential Market For South Wedge Units By Household TypeDistribution Of The Potential Market Based On Housing Preferences And Income Levels
Of Draw Area Households With The Potential To Move Within/To The City In 2007City of Rochester, Monroe County, New York
. . . . . . . Multi-Family . . . . . . . . . . . . . . . . . Single-Family . . . . . . . . . .. . . . . For-Rent . . . . . . . . . . . . . . . . . . . . . . For-Sale . . . . . . . . . . . . . . . . .
Below BelowMarket-Rate* Market-Rate* AllRanges AllRanges Market-Rate* Market-Rate*
Total Apts. Apts. Apts. Attached Detached Detached
Number of Households: 1,190 230 390 280 80 70 140
Empty Nesters& Retirees 37% 30% 15% 61% 25% 71% 50%
Traditional &Non-Traditional Families 36% 48% 38% 18% 38% 29% 50%
YoungerSingles & Couples 27% 22% 47% 21% 37% 0% 0%
100% 100% 100% 100% 100% 100% 100%
* Market rate is defined as affordable to households with incomes above 80 percent ofthe Rochester AMFI (Area Median Family Income), which is $64,100 for a family of four as of March 8, 2006.
NOTE: Reference Appendix One, Tables 1 through 11, 24 through 27.
SOURCE: Claritas, Inc.;Zimmerman/Volk Associates, Inc.
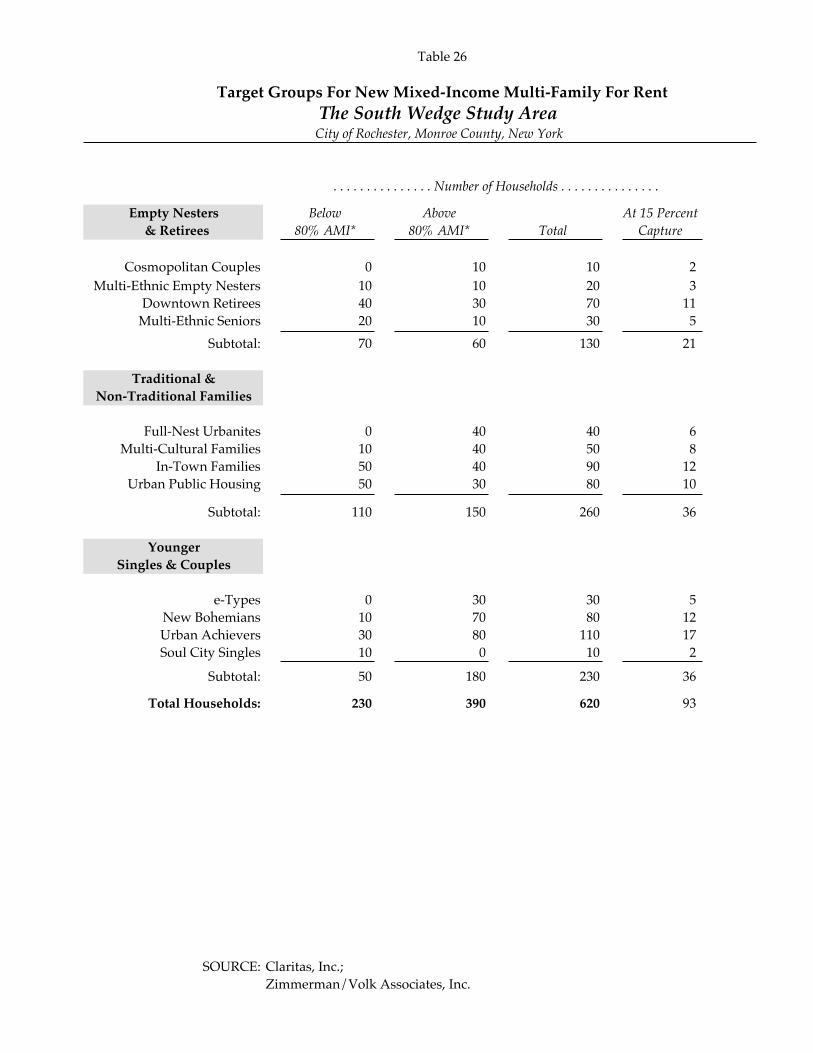
Table 26
Target Groups For New Mixed-Income Multi-Family For RentThe South Wedge Study Area
City of Rochester, Monroe County, New York
. . . . . . . . . . . . . . . Number of Households . . . . . . . . . . . . . . .
Empty Nesters Below Above At 15 Percent & Retirees 80% AMI* 80% AMI* Total Capture
Cosmopolitan Couples 0 10 10 2Multi-Ethnic Empty Nesters 10 10 20 3
Downtown Retirees 40 30 70 11Multi-Ethnic Seniors 20 10 30 5
Subtotal: 70 60 130 21
Traditional &Non-Traditional Families
Full-Nest Urbanites 0 40 40 6Multi-Cultural Families 10 40 50 8
In-Town Families 50 40 90 12Urban Public Housing 50 30 80 10
Subtotal: 110 150 260 36
YoungerSingles & Couples
e-Types 0 30 30 5New Bohemians 10 70 80 12Urban Achievers 30 80 110 17Soul City Singles 10 0 10 2
Subtotal: 50 180 230 36
Total Households: 230 390 620 93
SOURCE: Claritas, Inc.;Zimmerman/Volk Associates, Inc.

Table 27
Target Groups For New Mixed-Income Multi-Family For SaleThe South Wedge Study Area
City of Rochester, Monroe County, New York
Empty Nesters Number of At 15 Percent & Retirees Households Capture
Cosmopolitan Couples 10 2Multi-Ethnic Empty Nesters 10 2
Downtown Retirees 30 5Multi-Ethnic Seniors 120 15
Subtotal: 170 24
Traditional &Non-Traditional Families
Multi-Cultural Families 10 2In-Town Families 20 3
Urban Public Housing 20 3
Subtotal: 50 8
YoungerSingles & Couples
e-Types 10 2New Bohemians 20 3Urban Achievers 10 2Soul City Singles 20 3
Subtotal: 60 10
Total Households: 280 42
SOURCE: Claritas, Inc.;Zimmerman/Volk Associates, Inc.

Table 28
Target Groups For New Mixed-Income Single-Family Attached For SaleThe South Wedge Study Area
City of Rochester, Monroe County, New York
Empty Nesters Number of At 10 Percent & Retirees Households Capture
Downtown Retirees 10 1Multi-Ethnic Seniors 10 1
Subtotal: 20 2
Traditional &Non-Traditional Families
Full-Nest Urbanites 20 2Multi-Cultural Families 10 1
Subtotal: 30 3
YoungerSingles & Couples
e-Types 10 1New Bohemians 10 1Urban Achievers 10 1
Subtotal: 30 3
Total Households: 80 8
SOURCE: Claritas, Inc.;Zimmerman/Volk Associates, Inc.

Table 29
Target Groups For New Mixed-Income Single-Family Detached For SaleThe South Wedge Study Area
City of Rochester, Monroe County, New York
. . . . . Number of Households . . . . .
Empty Nesters Below Above At 10 Percent & Retirees 80% AMI* 80% AMI* Total Capture
Urban Establishment 0 20 20 2Cosmopolitan Couples 0 10 10 1
Multi-Ethnic Empty Nesters 10 10 20 2Downtown Retirees 30 20 50 50
Multi-Ethnic Seniors 10 10 20 2Subtotal: 50 70 120 12
Traditional &Non-Traditional Families
Full-Nest Urbanites 0 50 50 5Multi-Cultural Families 20 20 40 4
Subtotal: 20 70 90 9
Total Households: 70 140 210 21
SOURCE: Claritas, Inc.;Zimmerman/Volk Associates, Inc.
Table 30
Potential Market For Plymouth Exchange Housing UnitsDistribution Of The Potential Market Based On Housing Preferences And Income Levels
Of Draw Area Households With The Potential To Move Within/To The City In 2006City of Rochester, Monroe County, New York
City of Rochester; Balance of Monroe County; Regional Draw Area; All Other U.S. CountiesDraw Areas
Total Target Market HouseholdsWith Potential To Rent/Purchase Within TheCity of Rochester, Monroe County, New York 17,250
Total Target Market HouseholdsWith Potential To Rent/Purchase Within The
Plymouth Exchange Neighborhood Study Area 860
Annual Plymouth Exchange Housing Market. . . . . . . . . Multi-Family . . . . . . . . . . . . . . . . . . . Single-Family . . . . . . . . . .
. . . . . . For-Rent . . . . . . . . . . . . . . . . . . . . . . . . . For-Sale . . . . . . . . . . . . . . . . . . .Below Below
Market-Rate* Market-Rate* AllRanges AllRanges Market-Rate* Market-Rate*Apts. Apts. Apts. Attached Detached Detached Total
Total Households: 170 250 160 60 100 120 860{Percent}: 19.8% 29.1% 18.6% 7.0% 11.5% 14.0% 100.0%
* Market rate is defined as affordable to households with incomes above 80 percent ofthe Rochester AMFI (Area Median Family Income), which is $64,100 for a family of four as of March 8, 2006.
NOTE: Reference Appendix One, Tables 1 through 11, 28 through 31.
SOURCE: Claritas, Inc.;Zimmerman/Volk Associates, Inc.

Table 31
Annual Potential Market For Plymouth Exchange Housing Units By Household TypeDistribution Of The Potential Market Based On Housing Preferences And Income Levels
Of Draw Area Households With The Potential To Move Within/To The City In 2006City of Rochester, Monroe County, New York
. . . . . . . Multi-Family . . . . . . . . . . . . . . . . . Single-Family . . . . . . . . . .. . . . . For-Rent . . . . . . . . . . . . . . . . . . . . . . For-Sale . . . . . . . . . . . . . . . . .
Below BelowMarket-Rate* Market-Rate* AllRanges AllRanges Market-Rate* Market-Rate*
Total Apts. Apts. Apts. Attached Detached Detached
Number of Households: 860 170 250 160 60 100 120
Empty Nesters& Retirees 33% 18% 16% 38% 33% 60% 58%
Traditional &Non-Traditional Families 29% 41% 32% 24% 34% 10% 25%
YoungerSingles & Couples 38% 41% 52% 38% 33% 30% 17%
100% 100% 100% 100% 100% 100% 100%
* Market rate is defined as affordable to households with incomes above 80 percent ofthe Rochester AMFI (Area Median Family Income), which is $64,100 for a family of four as of March 8, 2006.
NOTE: Reference Appendix One, Tables 1 through 11, 28 through 31.
SOURCE: Claritas, Inc.;Zimmerman/Volk Associates, Inc.
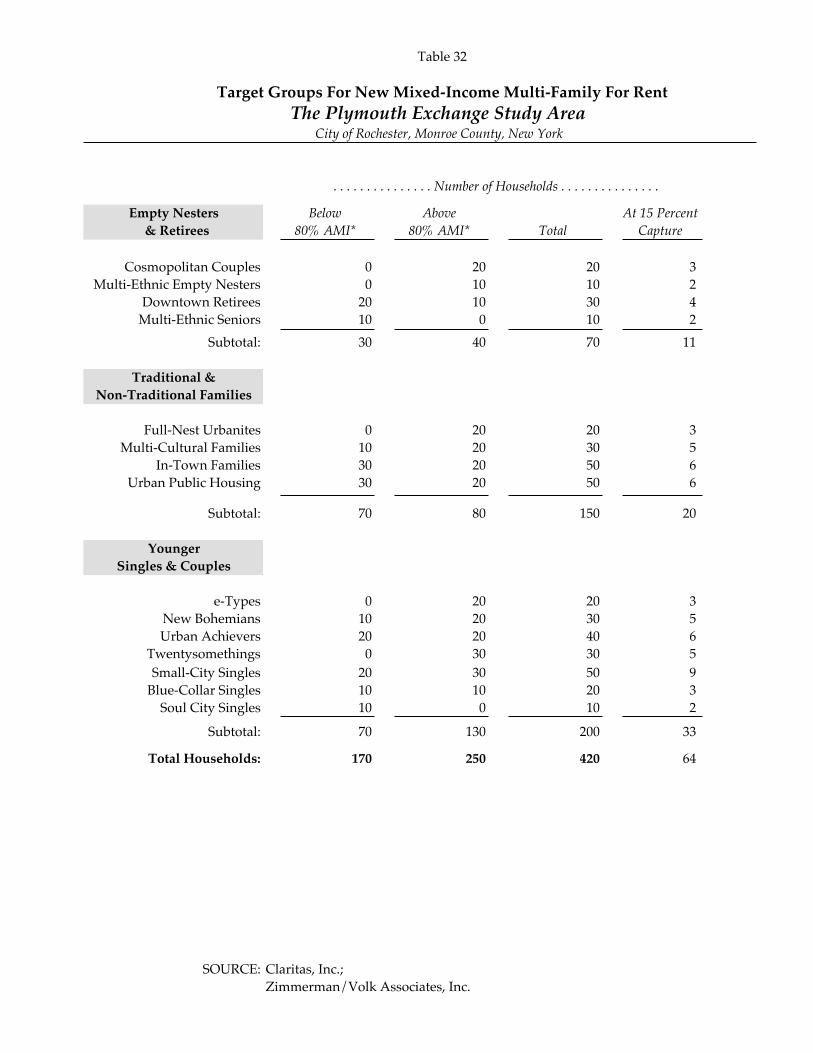
Table 32
Target Groups For New Mixed-Income Multi-Family For RentThe Plymouth Exchange Study Area
City of Rochester, Monroe County, New York
. . . . . . . . . . . . . . . Number of Households . . . . . . . . . . . . . . .
Empty Nesters Below Above At 15 Percent & Retirees 80% AMI* 80% AMI* Total Capture
Cosmopolitan Couples 0 20 20 3Multi-Ethnic Empty Nesters 0 10 10 2
Downtown Retirees 20 10 30 4Multi-Ethnic Seniors 10 0 10 2
Subtotal: 30 40 70 11
Traditional &Non-Traditional Families
Full-Nest Urbanites 0 20 20 3Multi-Cultural Families 10 20 30 5
In-Town Families 30 20 50 6Urban Public Housing 30 20 50 6
Subtotal: 70 80 150 20
YoungerSingles & Couples
e-Types 0 20 20 3New Bohemians 10 20 30 5Urban Achievers 20 20 40 6
Twentysomethings 0 30 30 5Small-City Singles 20 30 50 9
Blue-Collar Singles 10 10 20 3Soul City Singles 10 0 10 2
Subtotal: 70 130 200 33
Total Households: 170 250 420 64
SOURCE: Claritas, Inc.;Zimmerman/Volk Associates, Inc.

Table 33
Target Groups For New Mixed-Income Multi-Family For SaleThe Plymouth Exchange Study Area
City of Rochester, Monroe County, New York
Empty Nesters Number of At 15 Percent & Retirees Households Capture
Cosmopolitan Couples 10 2Multi-Ethnic Empty Nesters 10 2
Downtown Retirees 20 2Multi-Ethnic Seniors 20 2
Subtotal: 60 8
Traditional &Non-Traditional Families
Full-Nest Urbanites 10 2Multi-Cultural Families 10 2
In-Town Families 10 1Urban Public Housing 10 1
Subtotal: 40 6
YoungerSingles & Couples
e-Types 10 2New Bohemians 10 2
Twentysomethings 10 2Small-City Singles 10 2
Soul City Singles 20 2
Subtotal: 60 10
Total Households: 160 24
SOURCE: Claritas, Inc.;Zimmerman/Volk Associates, Inc.

Table 34
Target Groups For New Mixed-Income Single-Family Attached For SaleThe Plymouth Exchange Study Area
City of Rochester, Monroe County, New York
Empty Nesters Number of At 10 Percent & Retirees Households Capture
Cosmopolitan Couples 10 1Multi-Ethnic Seniors 10 1
Subtotal: 20 2
Traditional &Non-Traditional Families
Full-Nest Urbanites 10 1Multi-Cultural Families 10 1
Subtotal: 20 2
YoungerSingles & Couples
Twentysomethings 10 1Small-City Singles 10 1
Subtotal: 20 2
Total Households: 60 6
SOURCE: Claritas, Inc.;Zimmerman/Volk Associates, Inc.

Table 35
Target Groups For New Mixed-Income Single-Family Detached For SaleThe Plymouth Exchange Study Area
City of Rochester, Monroe County, New York
. . . . . Number of Households . . . . .
Empty Nesters Below Above At 10 Percent & Retirees 80% AMI* 80% AMI* Total Capture
Cosmopolitan Elite 0 30 20 2Cosmopolitan Couples 0 30 30 3
Multi-Ethnic Empty Nesters 10 0 10 1Downtown Retirees 20 10 30 30
Multi-Ethnic Seniors 30 0 30 3Subtotal: 60 70 120 12
Traditional &Non-Traditional Families
Full-Nest Urbanites 0 30 30 3Multi-Cultural Families 10 0 10 1
Subtotal: 10 30 40 4
YoungerSingles & Couples
e-Types 0 10 10 10 0Urban Achievers 10 0 10 1
Twentysomethings 0 10 10 1Small-City Singles 10 0 10 1
Blue-Collar Singles 10 0 10 1
Subtotal: 30 20 50 5
Total Households: 100 120 210 21
SOURCE: Claritas, Inc.;Zimmerman/Volk Associates, Inc.