Embed Size (px)
Citation preview
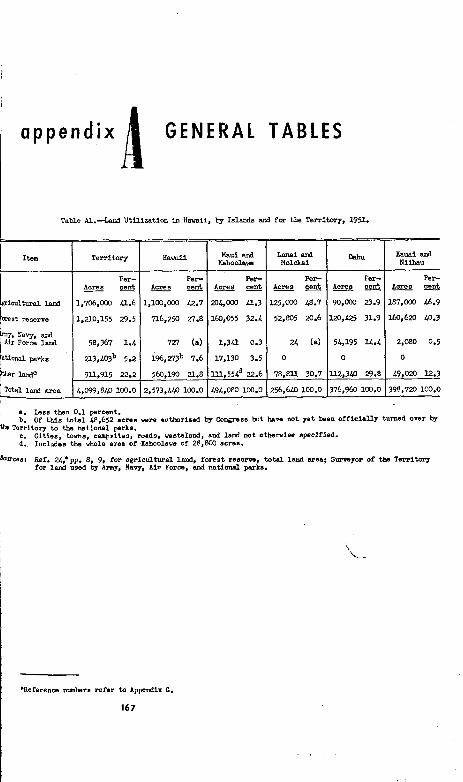
a p p e n d i x A G E N E R A L T A B L E S
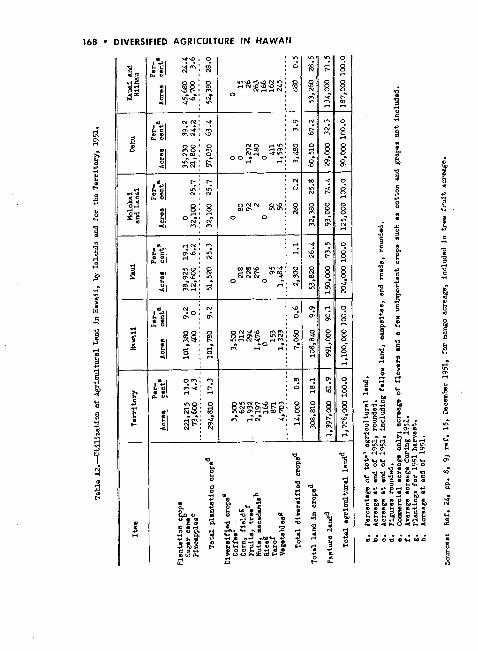
Table Al.-Land Utilization in Hawaii, by Islands ard for the Territory, 1951.
Itam Territory
Per- - &
Lmltural land 1,706,000 42.6
est reserve 1,210,155 29.5
F, Navy, d Ir Force land 58,367 1.4
t o n a l parks 223.~03~ 5.2
er krdC 911.915 22.2
Dtal lard area 4,099,840 10 .0
Kauai and NlUsu
Per- A- @
L87.m 45.9
160,620 40.3
2,080 0.5
0
49.020 12.3
398,720 100.0
a. Less than 0.1 percent. b. Of th i s to t a l 48,652 acres were authorized b? Congress but have not yet been o f f i c i a l ly turned over by
Territory to the national parka. c. Cities, towns, campsites, mads, wasteland, and land not othervise specified. d . Inelu5es the whole area of Kahcolew of 2 P , W acres.
Ucea: Ref. ~ 2 p p . 8, 9, for egricultural land, f o n s t r e s e w , total land area; S u r w p ~ of the Territory for land used by AnnJ, Bavy, A l r Form, ard national parks.
.Reference numbers refer to Appendix C.
167
Tab
le A
2.4
tili
za
tio
n
of
Ag
ricu
ltu
ral
Lan
d in
Haw
aii,
by I
slan
ds and
for
the
Ter
rito
ry,
1951
.
Itsm
T
err
ito
ry
Haw
aii
Mau
l M
olok
ai
and
Lan
ai
Pla
nta
tio
n c
ps
S
vp
r ca
m
~in
ea
pp
les
~
73,6
00
4.3
To
tal
pla
nta
tio
n c
rop
sd
Mrs
rsif
03
cro
pse
C
ofh
ai
Cor
n fl
eld
g
~ru
ils
, tre
ef
Nut
s m
acad
amia
h ~
ice
k
~a
ro
~
ve
pta
ble
s~
To
tal
lan
d i
n c
rops
d
Pas
ture
lan
dd
To
tal
sgri
cu
ltu
al
lan
dd
I 1
,706
,000
16
0.0
(1,1
00
,00
0 1
00.0
I 2
04,0
00 1
00.0
11
25,0
00 1
00.0
per
cen
tam
of
to
ta'
ag
ric
ult
ura
l la
nd
. A
crea
ge i
t en
d of
1
95
i, r
ound
ed.
Acr
eage
a
t en
d of
19
51,
incl
ud
ing
fal
low
lan
d,
cam
psi
tes,
an
d m
ads,
ro
unde
d.
Fig
ure
s so
unde
d.
Co
mrc
isl
scre
age only8
acre
age
of
flo
wer
s an
d a
few
uni
mpo
rtan
t cr
op
s eu
ch a
s co
tto
n a
nd
pa
pe
a n
ot
incl
ud
ed.
Ave
rage
acr
eag
e d
uri
ng
195
1.
Pla
nti
ng
e fo
r 19
51 h
arv
est.
A
crea
ge
at
end
of
1951
.
~e
f.
24,
pp.
8,
91 r
ef.
15
, b
cem
bsr
175
1,
for
man
go a
crea
ge,
in
clu
dad
in
tre
e fruit a
crea
ge.
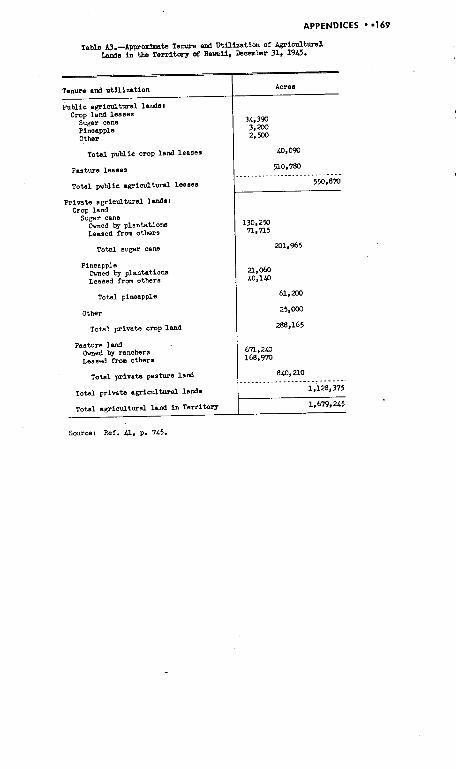
public agricultural l a d s : Crop land leases
Sugar cane Pineapple Other
APPENDICES 169
Table 0.-bpSmrimate Temne and Utillaation of AgricultUral Lands In tbe Territory of Hawaii, Dacmter 31. I945.
Total public crop land leases
Te- and ut i l izat ion
Pasture leases
Acres
Total public agricultural leases
I
Private agricultural lmda: Crop land
Sugar cane h e d by plantations Leased from others
TOW sugar cane
Pineapple h e d by plantations Leased from others
Total pineapple
Other
Total private crop land
Pasture land h e d by ranchers Leased from others
Total private agricultural lands
Total agricultural land in Ter r i toR
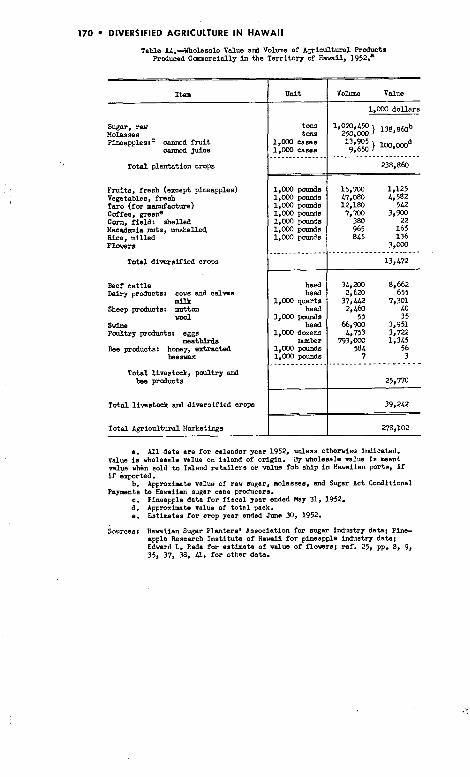
170 DIVERSIFIED AGRICULTURE I N HAWAII
Table A4.--Idholesale Value and Volume of Agricultuoal Roducts Roduwd C-ercially in the T e r r i t o q of Hawaii, 1952.'
Sugar, raw Molasses ~ i m a ~ ~ l e s : ~ canned f ru i t
m m d juice
Total plantation crops
Frui ts , f resh (except pineapples) Vegetables, fresh Taro (for mumfacture) Coffee, greene Con, field: shelled Macadamia rmts, unshelled Rice, milled Flcvers
Total dirrersified crops
Beef ca t t l e Dairy products: cows and calvss
nFUr Sheep products: mttcm
voal Svine Pail t ry products: eggs
meatbirds b e products: honey, extracted
tBeSVBX
Total l i v e s t a k , parl t ry and b e products
T o t a l livestock and diversified crop8
T o t a l ~ g r i c u l t w a l EIarketings
tons tone
1,000 cases 1,000 cases
heal
volume Value
1,000 dol lars
LO%L50 138,860b zlo.000 }
--..-.-.-.....-...----
a. A l l data are for calendar year 1952, unless othervlse indicated. Value i s vholeaale value on island of o r i g n . By vholssale value i s meant v a l y when sold to Ialand re t a i l e r s or value fob ship in Aavaiian ports, i f i f sxparted.
b. Appmxbte velue of rsw sugar, molasses, and Sugar Act Conditional Paylants to Hawaiian sugar cane producers.
c. Pineapple data for f i sca l year ended May 31, 1952. d. Approximate value of to t a l pack. e. Estimates for crop year ended June 30, 1952.
Sourcsai Aavaiian Sugar Planters' Association for sugar industry data; Pine- apple Research Inst i tute of Hawaii for pineapple industry data3 Edward I. Rada for e a t h a t s of value of flovtrs; ref. 25, pp. 8, 9, 35, 37, 38, W. for other data.
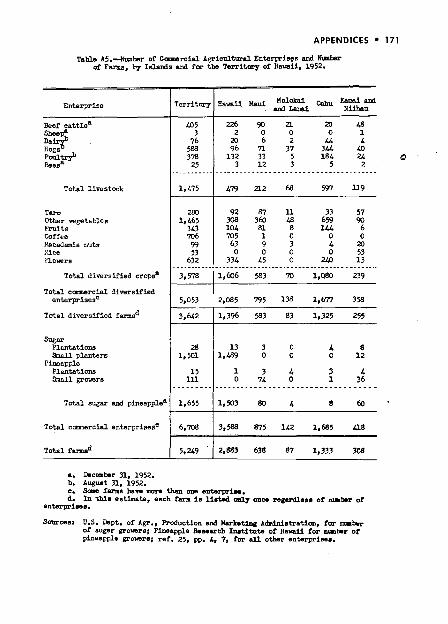
APPENDICES 171
Table A5.--Rmber of Cammrcial Agricultural Enterprises and Nuubr of Farms, by Ialruris and fo r the Tex'r1tm-y of B a d , 1952.
Enterprise
Total l ivest&
Taro Other ve&e.bles Frulta Coffee Macadamia nuts .xce R o ~ r s
Total diversified cropsa
Total camnercial d iwrsVied enterprisesC
Total diversified farmsd
%= Plantations Small planters
Pineapple P l a n t a t i m Small g r m r s
Total sugar and pineapplea
Total c m e r c i a l enterprisesc
Total farmsd
b. ~ - t 31, i952. c. Sae farms han m o m than olr, enterprism. d. I n this ea tha te , each fam i s l i s t 4 0117 on- regardless of m d n r of
e n t n r p r i ~ s .
172 DIVERSIFIED AGRICULTURE I N HAWAII
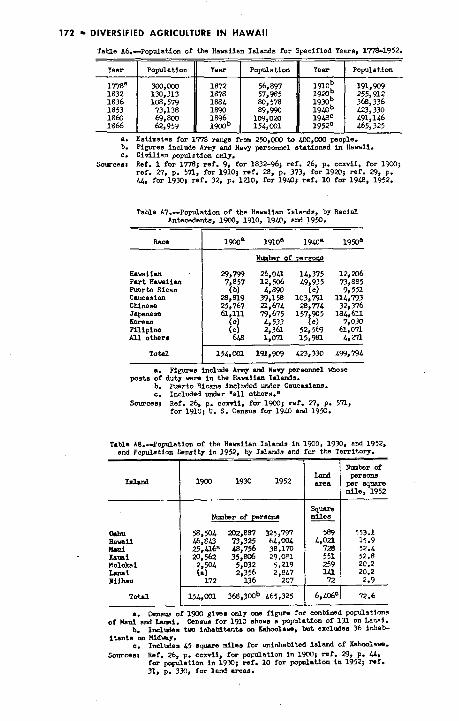
Tahle A6.-Population of the Hawaiian Islands for Specified Years, 177&1952.
56.897 57,985
108,579 80.578 368,336 73,138 89,990 1 9 d 423,330
186l 69,800 1896 109rOP 19LBc 491,146 1866 62,959 1900~ 154,001 1952C 465,325
a. Estimate8 for 176 range h 250,000 to WM.000 people. b. Pigurea lnclude Army and Nav personnel stationed in Hamil. c. Civilian population only.
Solpcess Ref. 1 for 1718; ref. 9. for 1832-96; refa 26. P. c c d b for 1900; ref. 27, p. 571, for 1910; ref. 28, p. 373, for 1 9 E ; ref. 29, p. 44, for 1 9 x 8 ref. 32, p. 1210. for 19W; ref. 10 for 1948, 1952.
Tahle A7.-Population of the Hawaiian Islands, by Racial Antecedents, 1900, 1910, 1940, em3 1950.
I
Aavaiian Part Havaiian Pmrta Rican Caucasian Chine w Japanese Korean Filipino A l l others
a. Figures include Amy and Navy personnel whose posts of duty vera in the Havaiian lalards.
b. Puerto %cans included under Caucasians. c. Included under "all o F r s . "
Sources: Ref. 26, p. ccI.rli, for 1900; ref. 27, p. 572. for 1910; U. S. Census for 19LD and 1950.
Taus A8.4opulation of the Hawaiian lalsnds in and Population Damlty i n 1952, by Islands and - KIO, 1930, and 1952.
r the Territory.
Number of
mile. 1952
a. Census of 1900 g i w s only aa f i w s for canbimd ppulat ians of Haul and Lanai. Cen- for 1910 shows a population of 131 on Lanai.
b. Ineludss tvo inhablhnts on Illhoolaw, but sxcludss 36 W e b itaats on M i d w .
c. I n c l d e s 45 s- miles for rminhabitsd island of Kabmlmm.
Sourcear Ref. 26, p. ccxvli, for ppu la t i an i n 1900; ref. 29. p. US for population in 19m; raf. 10 for populstion i n 1952; ref. 3, p. 330, f a r land areas.
a p p e n d i x VEGETABLE TABLES
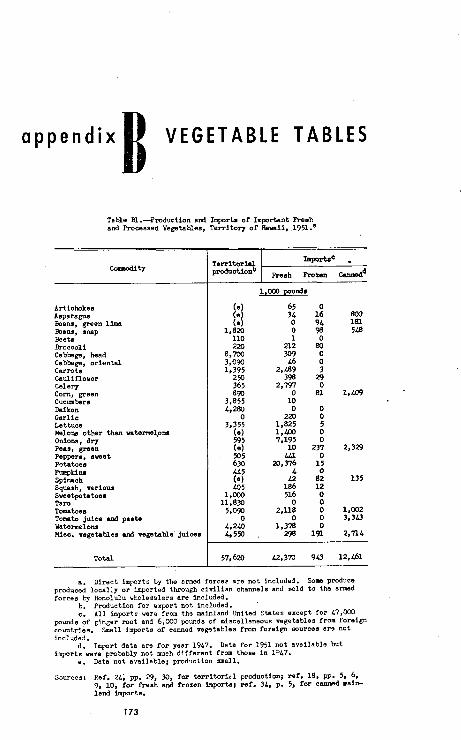
Table S1.-Production a d Imports of Imprtant h e s h and Processed Vegetables, T e r r i t o r y of Aavaii, 1951.'
T e r r i t o r i a l
A r t i c b k e a A s p a r e v Bans, green limn Beaw, snap Beets Broccoli Cabbage, head Cabbage, o r i e n t d c a r r o t s Cauliflower Celery Corn, green C u m b e r s Daikon Gar l ic Let tuce Weloris o t h e r than b a t e n n s l , ~ ~ Onions, dry Peas, p e n Pappers, sweet Potatoes Rnapki rn S p b c h Squash, r a r i o u s Sveetpotatoes T a m
a. Direct i m p r t s by the armed forcee .re not included. Some prcduce produced l o c e l l y o r imported through c i v l l i a n channels and w l d t o t h e armed forces by Honolulu v t o l s s a l e r s are included.
b. Prcduetion f o r export not included. . c. A l l imports were from t h s mainland United States except f o r 47,000
pounds of ginger m o t and 6,WO pounds of miscellaneous vegetables from fore ign countr ies . Small imports of cenned vegetables fmm fore ign sources a r s not incPaded.
d. Import da ta are f o r year 1947. Data f o r 1951 not avai labla but lopor ts usre pmbsbly not much d i f f e r e n t from thoae i n 1?47.
e. Data not avai lable ; production small.
Sourcesr Ref. ZL; pp. 29, 30, f o r t e r r i t o r i r l prcduction; ref . 18, pp. 5 , 6, 9, 10, for Fresh a d frozen lmports; n f . 3L, p. 5, f o r canned m a i h land imports.
174 DIVERSIFIED AGRICULTURE I N HAWAII
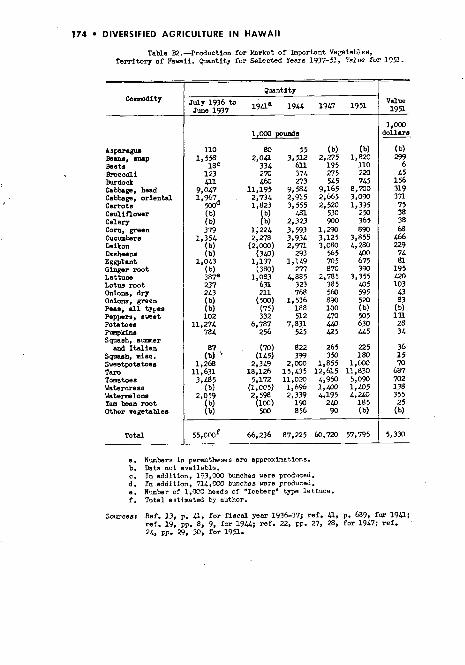
Table E2.-Production f o r lfarket o f Important Veeetables, Territol). o f Hsuaii. Qmnt i ty f a r Selec ted Years 1437-51, Valve for 1 9 s .
Asparagun Bems, snap m a t s h c c o l i Burdock Cabhge. head Cabbags, o r i e n t a l Carrots Cauliflower Celery Corn, green Cucmters Daikon Dasheena Eggplant Ginger m o t Lettuce Lotus m o t Onions, W Onions, green Peas, dl types P e p p r s , aveet Potatoes FwnpkiM Squash, s m e r azd I t a l i a n
Smash. mlsc. ~ n e t p k a t o a a Tam Tomatoea Watercress U a t e m l o ~ Yam b a n mot Other vegetables
Total
a . Nunters i n parentheses are approximations. b. Data not avs i l sb le . c . I n addi t ion , 103,'X)O bunches were produced. d . I n addi t ion , 714.C00 hmches vsre produced. e. Number of 1,WO heads of "Iceberp" type l e t t u c e . f . Tate l estimated by author.
- Vdue 1951
1,000
(b) 299
6 45
1 5 6 319 371 75 38 38 68 L66 2-29 7L 81
195 LZO 103
43 83
(b) 131 28 3L
36 15 70
687 702 1 3 355 25
( b)
Sourcasi Ref. 13, p. 0, for f i s c a l gear 1936-37; ref. L l , p. M9, fm 19W; ref . 19, pp. 8, 9, for 1 9 U ; r e f . 22, PP. 27, 28, f o r 1947; ref. 24, pp. 29, 30, f o r 1951.
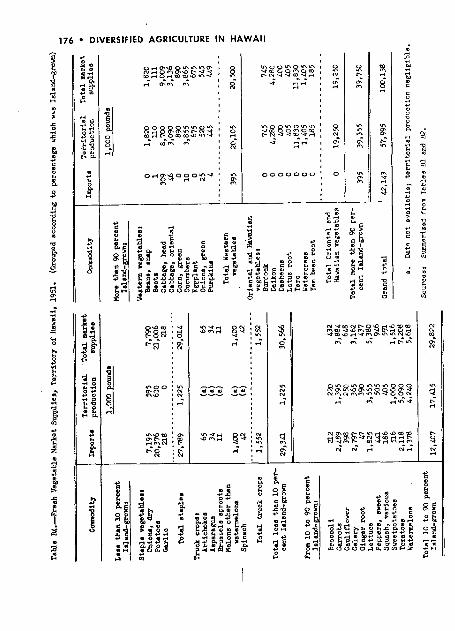
APPENDICES ' 175
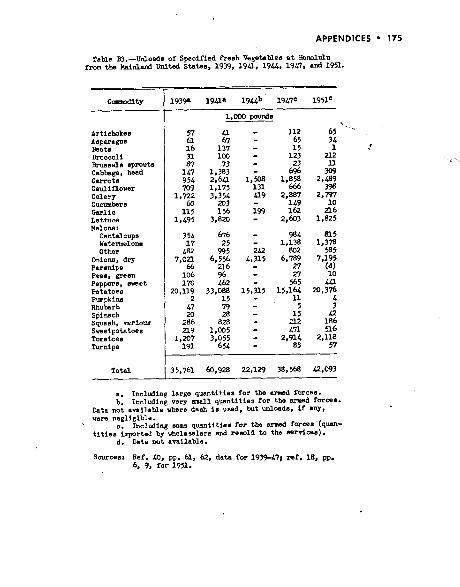
Table 83 -Unloads of Specifled Fresh Vegetables a t Bonolulu horn the t.&ard United S tabs . 1939. 19U, 194%. 1947, and 1951.
Artichokes Aspwgus b e t a Bmccoll Brussels spmuts Cabbage, head carrots Cauliflower Celery Cucmbrs Garlic Lettuce Helom:
Csntaloupa UabrUiWlOM Other
Onions, dry Parsnips Peas, green Peppers, sveet Potatoes Fumpkins Rhubarb Spinsch Squash, n r f o u s Sveetpotatws Tomatoes Turnips
a. Including large quantities for the anad forces. b. Including very a l l quantities fo r the armed forces.
Data not available where dash i s used, h t unloada, iT any, were negligible.
c. Ine ld ing swa qusnt i t ier fo r the armed foreas (quan- t i t i e s imported by vholesf&rs and rewld to the services).
d. Data not available.
Sources: Ref. 10, pp. 61, 62, data for 1939-L7; ref . 18, pp. 6, 9. for 1951.
Tah
ls &
.-Fre
sh
Veg
etab
le M
arke
t S
up
pli
es,
Te
rrit
ory
of
Haw
aii,
19
51.
(Cro
up
d a
cco
rdin
g t
o p
erce
nta
ge
vh
ich
vaa
Is
land
-gro
un)
d -
Lea
s th
an 1
0 p
erc
en
t Ia
lwd
-gm
vn
:
Sta
ple
ve
gst
ab
lsa
l O
nion
s, dry
P
ota
toe
s G
arl
ic
To
tal
sta
ple
s
Tru
olr
cro
ps:
A
rtic
tok
es
As
pa
raw
B
russ
els
spro
uts
M
elon
s o
the
r th
an
n
tarm
elo
rm
Sp
inac
h
To
tal
tru
ck
cro
ps
To
td l
es
s t
han
10
per
- c
en
t Is
lsn
d-g
rov
n
From
10
to
90
pwrc
ent
~sl
ard
-gra
m
Bro
cw
li
C-ta
Cau
lifl
ow
er
Cel
ery
G
ing
er r
oo
t L
ett
uc
e
Pep
per
s,
svw
et
Squash, v
ario
ua
Sv
ee
tpta
toe
s T
omat
oes
Wat
erm
elon
s
TO
W
10 t
o 9
3 p
erce
nt
Isla
nd
-gro
m
Te
rrit
ori
al
To
tal
mar
kat
In
po
rts
prc
du
ctio
n
au
pp
lim
-
1,0
00
pou
nds
Com
mod
ity
Mor
e th
an
90
prc
en
t Is
lan
d-p
vn
r
Wes
tern
ra
gst
ab
les:
B
sans
, sn
ap
be
ts
C
abba
gs,
head
C
abba
ge,
ori
en
tal
Cor
n,
gre
en
Cuc
umbs
rs
Eg
gp
lan
t O
nion
s,
pe
en
R
wp
kin
n
To
tal
Ues
tarn
v
eget
able
s
Ori
en
tal
and
&n
ila
n
veg
etab
les*
B
urdo
ck
Dei
kon
Das
heen
a L
otu
s ro
ot
Tar
o
Wat
ercr
ess
Yam
bean
ro
ot
To
tal
Ori
en
tel
and
Hsn
iia
n v
eget
able
s
To
tel
mor
e th
an 9
0 p
er-
ce
nt
Isla
nd-g
row
n
Gra
nd
tota
l
0.
Impo
rts
Te
rrit
ori
al
To
tal
wk
et
p
rod
uct
ion
su
pp
lie
s =
1,0
00
pounds
<, w
2 3 ...
8.
Dnt
s no
? st
mil
eb
le;
terr
ito
ria
l p
rod
llct
ion
ne
eli
?ib
le.
So
urc
es,
Su
mer
ized
fr
om
Tab
les
81
and
B
2.
APPENDICES 177
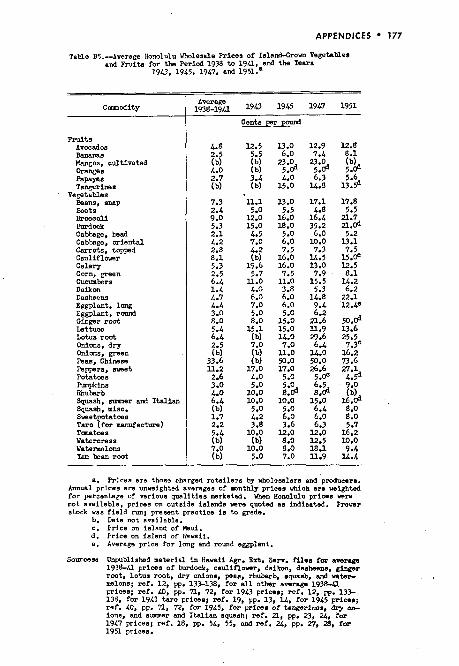
Table B5.--Average Honolulu Vholesale Prices of Islard-Cmvn Vegetables and Fmi t s for the Period 1938 to 19L1, and the Tears
19L3, 19L5. 1947, and 1951.'
Fruits Avocados Bananas Mangos, cultivated oranges papans Tangerines
Veeetables bans , snap b e t s B r a c o l l Burdock Cabbage, head Cabbage, or iental Carrots, topped C a u l i f l m r Celery Corn, green Cumbers Daikon Dasheens Eggplant, long Eggplant, rwnd Ginger root Lettuce Lotus r w t Onions, dry Onions, green Peas, Cbinsse Peppers, sweet Potatma PlrmpkFns Rhubarb Squash, m e r ard I t a l l an Squash, mlsc. Sveetwtatoes Taro ifor manufacture) Tamtoes Watercress Watermelons Yan bean root
Cents per porud
a. Prices are thoas charged re t a i l e r s by wholssalers and prcducers. Annual prices are unvelghted averages of m n t h l j prices which are wlghted fo r percentage of various qual i t ies marketed. Yhen Honolulu prices vere not availabls, prices on outside ialanda w r e quoted as indicated. Pravar stock was f i e ld run; present practice i s to grade.
b. Dats not av6ilabla. c. Price on island of Haul. d. Price an island of Heveii. e . Average price for long and round eggplant.
Soureesl Unpublished material in Hamil A g r . Ed. Ssrv. f i h a for amraga 1938-L1 prices of burdock, cauliflowr, daikon, dasheens, ginger root, lotus root, dry ontons, p a s , rhubarb. #quash, a d ntar- melons; ref. 12, pp.137-138, for all o t b r avursg. 193- prices; ref. 40, pp. n, 72, for 1943 prices; ref. 12, pp. 133- 138, for 1943 taro pricea; ref. 19. pp. 13, 1L. for 1945 prices; ref. LO, pp. 71, 72. for 1945, for price6 of tangerines, dFg m ions, and s m a r and I t a l i an aquaah; ref. Zl, pp. 23, 2.4, for 1947 prices; ref. 18. pp. 54. 55, and ref. 2L. pp. 27. 28. fm 1951 prices.
178 ' DIVERSIFIED AGRICULTURE I N HAWAII
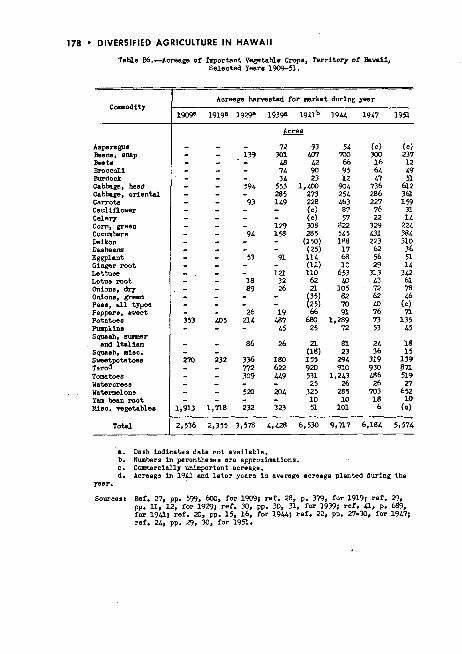
Table &.--~crea@ of Important Vegstahlo Crops, Territory of Hawaii, Selected Years 1909-3.
Asparagus Bsans, snap Peeto Broccoli Burdoc& Cabtaw. head Cabtab; or iental Carrots caul inover Celery Corn, green Cnnrmbers Daikon Dasheens Eggplant Ginger root Letturn Lotus m o t Onions, drJ. Onions, green Pens, el1 types Peppers, sweet Potatoes Pumpkins Squash, mmer and Italian
Squash, misc. Swetpctatoee ~ a m d ..- - Tomatoes Ustarcress Uatarnelons Tam bean root Mac. rrgetahle.
Acres@ harvested for .larkst during year
a. Dash indicates data not avsilsbls. b. Numbers i n parentheses are approrimations. c. Commercially un i rp r t an t acreage. d. Acreage in 19W and l a t e r years is aversge acreage planted during the
p a r .
ref. 24, pp. 29, 3, for 193.
APPENDICES 179
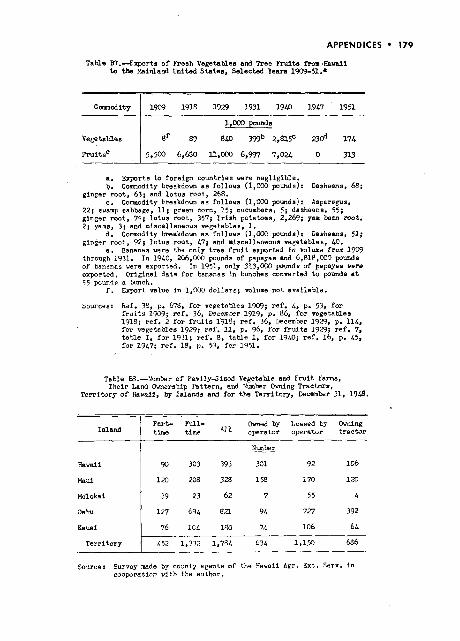
Table B7.-Eaprtr of Fresh Vegetables and Tree h y i t s l h m ~ R a u a i 1 to tb k i n l a n d United S t a t e s , Selec ted Years lW+!iI.a
a. Exports ta foreign countr ies were negl ig ib le . b. Comodity breakdown a s follows (1,CCU pounds): Dasheens, 68;
ginger m o t , 63. and l o t u s mot, 268. c . c o ~ m n o ~ i t y hreakdovn a s f o l l o v s (1,030 pounds)r Asparagus,
225 swamp cabbage, 11; green corn, 15; cucumbers, 5; daaheens, 55; ginger m o t , 75; l o t u s m o t , 357; I r i a h potatoes, 2,260; yam bean mot, 2; yeas, 3; and miscellsnsous vegetables, 1.
d . C o m d i t y breakdown as follows (1,WC pounds): Dssheans, 51; ginger root , 92; l o t u s m o t , 47; and niseellaneous vegetables, LO.
e . Eananas vera the only t r e e f r u i t exported i n volvms from 1909 through 1931. In 1940, 206,OM pounds of papayas and 6,81P,M)O pounds of bananes were exported. I n 1951, only 313,OCO pounds of pEpSYR8 mere exported. Original da ta f o r bananas in bunches converted t o pocnda a t 55 pounds a btmch.
f . E q r t value i n 1,000 d o l l a r s ; volume not avai lable .
Sourcesr Raf. 38, p. 675, f o r vegetables 1909; ref . 4, p. 53, for f r u i t s 1909; ref . 36, Decemker 1919, p. 86, f o r wgetablea 1918; ref . 2 f o r f r u l t s 1918; ref . 36, December 1929, p. 114. f o r vegetables 1929; ref. 11, p. 96, f o r fruits 1929; ref . 7, t a b l e I , f a r 1931; ref . 8, t a b l e I, f o r 1940; ref . 16, p. 45. f o r 19L7; ref . 18, p. 53, for 1951.
C m d i t y
Vegetables
Table @&.-Number of Fani lySized Vegetable and F r u i t Farms, Their Land Ovnsrship Pattarn, and Nmber Ovning Tractors ,
T e r r i t o r y of H a w a i l , by Islends and f o r t h e Terr i tory , Decsmkr 31, 19LB.
1909 1918 1929 1931 1940 19L7 1951
1,030 P ~ S
Sf 89 860 399b ~ , 8 1 5 ~ 230d 1 7 4
Hawaii / W 303 393 301 92 106
Inland
Oahu ( 127 69L 8 Z 9L 727 392
Part- Nl- Ovned by Leased by Ovning time time *' operator operator t r e c t o r
Ksuai 76 ICL 180 7L 106 64
T e r r i t o r y L52 1,?72 1,78L 63.4 1,150 686
Sources Survey made by cmnty agents of the Hsveii Agr. Ext. Serv. i n cooperation with the author.
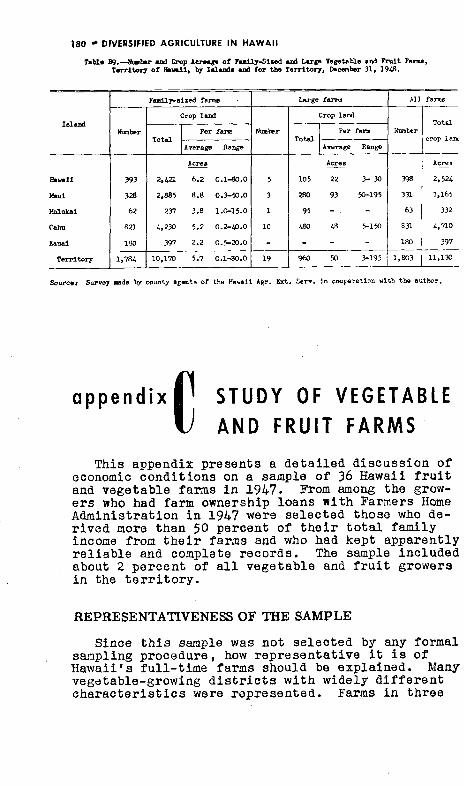
180 DIVERSIFIED AGRICULTURE IN HAW411
Crop lad
Awrags Range
2,421 6.2 0.1-80.0
Kaud 180 397 2.2 0.f-20.0 - Territory 1,ZL 10,170 5.7 0.1-80.0 19
Large farms 1 AII farms
Cmp land
Scurcer Survey made by county agents of the Pawail I F . Ext. Serv. i n cooperstion with the a u t h r .
a p p e n d i x S T U D Y O F VEGETABLE A N D F R U I T F A R M S
This appendix p resen t s a d e t a i l e d d i scuss ion of economic cond i t ions on a sample of 36 Hawaii f r u i t and vagetable f a n s i n 1947. From among the grow- e r s who had farm ownership loans wi th Farmers Home Adminis t ra t ion i n 1947 were s e l e c t e d those who de- r i v e d more than 50 percent of t h e i r t o t a l family income from t h e i r farms and who had kept apparen t ly r e l i a b l e and complete records . The sample included about 2 p e r c e n t of a l l vege tab le and f r u i t growers i n the t e r r i t o r y .
REPRESENTATIVENESS OF THE SAMPLE
Since t h i s sample was n o t s e l e c t e d by any formal sanp l ing procedure , how r e p r e s e n t a t i v e it i s of Hawaii 's fu l l - t ime farms should be explained. Many vegatable-growing d i s t r i c t s w i t h widely d i f f e r e n t c h a r a c t e r i s t i c s were represen ted . Farms i n t h r e e
APPENDICES ' 181
upland d i s t r i c t s were included: nine a t Volcano- Glenwood and one a t Kamuela on iiawaii, and f o u r a t Olinda on Maui. The o t h e r farms were l o c a t e d a t lower e l a v a t i o n s : f o u r a t Mountain View, th ree a t Kona, and one each a t Naalehu, Pahoa, and n o r t h e r n Hamakua on Hawaii; two a t Omaopio and one a t Haiku on Maui; s i x a t Kaneohe and Kahaluu on Oahu; and t h r e e i n Wailua Homesteads on Kauai. The p r i n c i p a l vege table-groxing a r e a s n o t adequa te ly represen ted i n t h s saap le were those on the leeward s i d e s of the I s l a n d s .
Because of the p a u c i t y of a v a i l a b l e r e c o r d s , some of t h e d i s t r i c t s and i s l a n d s were n o t weighted- i n the sample i n accordance wi th the d i s t r i b u t i o n of a l l vegetable and f r u i t farms i n tha t e r r i t o r y . For example, while t h e p ropor t ion of Itlaui and Kauai farms i n the sample was approximately the same as i n the t o t a l t e r r i t o r i a l farm popula t ion, the per- centage of Hawaii farms was too l a r g e , and t h a t of Oahu farms t o o small.
An e f f o r t was made t o eva lua te the representa- t i v e n e s s of the sample w i t h regard t o farm q u a l i t y . FHA superv i so r s graded s o i l f e r t i l i t y and depth , topography, c l i m a t e , and market d i s t a n c e of a l l sampled e n t e r p r i s e s . The farms i n the d i f f e r e n t d i s t r i c t s va r i ed g r e a t l y , a s i s shown i n Table 01.
I n the upland d i s t r i c t s : The Volcano-Glenwood -
growers had the d isadvantage of shal low s o i l and' poor c l imate . The Ol inda growers had good l and r e s o u r c e s , but a s h o r t growing season f o r high- value crops. The Kaauela growsrs had deap, f e r t i l e s o i l , l e v e l l a n d , and good c l imate .
-4t lower e l e v a t i o n s : The Kountain View growers had l a n d of l e s s than avarage q u a l i t y , and a wet c l imate . The Kona growers had shallow s o i l , but the c l ima te made vegetable r a i s i n g p o s s i b l e dur ing p e r i o d s of h igh p r i c e s . The grower a t Pahoa had shal low s o i l , t h e one a t Bamakua had a wet w i n t e r , and t h e one i n Naalzhu was renote from the n e a r e s t shipping p o i n t ; o therwise the farm resources of these t h r e e growers were about avsrage. The growers a t Omaopio had a b e t t e r than average s o i l and c l ima te but they were s h o r t of i r r i g a t i o n water . The Eaiku grower had f a i r l a n d , but a wet c l imate . Oahu and Kauai growers had b e t t e r than average land and c l i - mate f o r vege tab le product ion. I n a d d i t i o n , Oahu growers were favored by t h e i r proximity t o the Hono- l u l u market .
On t h e whole, t h e s o i l depth on the m a j o r i t y of sample farms was below average and t h e topography
182 DIVERSIFIED AGRICULTURE I N HAWAII
j u s t about avzrage f o r Hawai i ' s vegatable and P r u i t farms. S o i l f e r t i l i t y and c l imate were r a t e d above average f o r most farms. The d i s tance of the sample farms t o the p r i n c i p a l market, Honolulu, was g r e a t e r than average f o r a l l I s l a n d vegetable and f r u i t farms because the sample was overweighted wi th farms l o c a t e d on the ou t s ide i s l a n d s .
Th i r ty - four of the 36 s m p l e farmers operated t h e i r own proper ty exc lus ive ly , and two l e a s e d a p o r t i o n of t h e i r l and from o t h e r s . This sample, t h e r e f o r e , was on ly r e p r e s e n t a t i v e of owner-operated farms f o r a l l ma t te r s i n which type of ownership was a f a c t o r .
The acreage of the m a j o r i t y of saaple farms was s i g n i f i c a n t l y l a r g e r than t h a t of most vegetable farms i n t h e t e r r i t o r y . The average t o t a l a r e a of the 36 farms was 36 a c r e s . The crop acreage, a more s i g n i f i c a n t f i g u r e , was 10 a c r e s (Table C3). E'our- t een sample growers had 10 o r more a c r e s of cropland, t h i r t e e n had between 5 and 10 a c r e s , and n ine had l e s s than 5 a c r e s . I n comparison, the average crop a r e a of family-operated vegetable and f r u i t farms i n the t e r r i t o r y was on ly 5.7 a c r e s i n 1948 (Table B9).
I n comparing the average crop acreage on the sample farms w i t h t h a t of a l l vegetable and f r u i t farms i n t h e I s l a n d s , i t must be remembered t h a t one-fourth of a l l growers were par t - t ime farmers , whereas the sample growers were fu l l - t ime farmers. There was a l s o a s l i g h t d i f fe rence i n the d e f i n i t i o n of ncroplandw i n t h e sample and i n t h e t e r r i t o r i a l survey, which somewhat favored the former. I n t h e saap le , cropland included a l l l a n d t h a t could be used f o r crop product ion vrithout major c l e a r i n g and drainage operat ions . I n t h e survey the term. was given t o a l l land t h a t had been used f o r crop grow- i n g dur ing 1947 o r 1948. Rowever, even i f t h i s d i f f e r e n c e i n d e f i n i t i o n i s taken i n t o account, the sample gro:vers had considerably more cropland t h a n t h e average farmer i n t h e survey.
An attempt was made t o compare t h e character- i s t i c s and q u a l i t i e s of t h e sample growers w i t h those of the average vegetable and f r u i t producers i n t h e t e r r i t o r y . Because of t h e shortage of a g r i - c u l t u r a l c r e d i t i n Hawaii, t h e FHA had been able t o s e l e c t the bes t among many a p p l i c a n t s f o r loans . 421 sample growers were born and r a i s e d i n the l s l a n d s o r i n t h e mainland United S t a t e s , while many non-FHA farmers were f o r e i g n born and edu- cated. The sample growers were a l s o s u b s t a n t i a l l y younger than the m a j o r i t y of a l l I s l and vegetable
APPENDICES 183
producers; t h e i r average age was 37 ye.ars. Xo d a t a wera a v a i l a b l e f o r t h e avarage age of a l l t e r r i t o r i a l vegetable and f r u i t farmers i n 1947, but i n 1950 i t averaged 47 years , according t o the United S t a t e s Census. (See r e f . 33, p. 14.) Thus,, on the b a s i s of upbringing and a g e , the sample growers can be expected t o ' b e more progress ive i n t h e i r production methods than the major i ty of IS- land farmers.
The sample growers had, wi th one o r t s o ex- cep t ions , adequate a g r i c u l t u r a l experience. 'ltventy-seven o f t h e 35 men f o r which informat ion was a v a i l a b l e , o r 77 percen t , had bean on t h e i r p resen t farms when t h e United S t a t e s en te red J o r l d ;'Jar 11. Four had begun o ~ e r a t i n g t h e i r farms i n 1942, two i n 1943, and one each i n 1945 and 1946. I n comparison, a l l f r u i t apd vegetable gr.owers i n the t e r r i t o r y had occupied t h e i r present farms on the average f o r 11 years i n '1950. (See r e f . 33, p . 14.)
The f a c t t h a t t h e s a ~ p l e farmers kept b e t t e r r e c o r d s than almost a l l o t h e r Hawaiian growers i n d i c a t e d , on the b a s i s of mainland exper ience, t h a t they were better-than-average farmers. On the o t h e r hand, some of the b e s t FHA borrowers had repaid t h e i r d e b t s out of t h e i r h igh war-time p r o f i t s and, t h e r e f o r e , were n o t inc luded i n the sample.
independently of each o ther , FHA superv i sors and t h e county agen t s of t h e A g r i c u l t u r a l 3xten- s i o n Service graded e v e r y sanple grower f o r h i s farming a b i l i t y . ' l 'heir eva lua t ions agreed i n n e a r l y a l l cases . 'The major i ty of sample farmers were r a t e d a s better-than-average f r u i t and vege- t e b l e producers [Table C 1 ) .
Yhe l a c k of r e p r e s e n t a t i v e n e s s of t h e sample may be summarized a s follows: (1) the sample was not weighted according to. t e r r i t o r i a l farm d i s t r i - but ion; (2) the farms were o f l a r g e r than average s i z e ; ( 3 ) the a b i l i t y of most growers was above average; and (4) the sample represented omner-oper- a t o r s only.
INVENTORY OF THE SAMPLE FARMS
The book value of t o t a l a s s e t s p e r sample farm family averaged $10,300, ranging from $6,200 f o r the farms i n Kona t o $14,100 f o r those i n Olinda (Table C2). S u b s t i t u t i n g the 1947 market va lues
184 DIVERSIFIED AGRICULTURE IN HAWAII
of r e a l e s t a t e would br ing the average value of a s s e t s p e r sanple family up t o $13,100. The book value of l and averaged 23,160 p e r farm, o r $88 p e r a c r e , and ranged from $1,550 i n Kountain View t o $5,600 i n Olinda, o r $30 t o $186 p e r acre . Non- cropland remained l a r g e l y unused on t h e sanple farms. The t o t a l l a n d investment p e r farm divided by the crop acreage was t h e r e f o r e a f a i r approxima- t i o n of land c o s t s pe r crop a c r e .
The investment p e r crop ac re depended upon t h e value p e r a c r e of a l l land on t h e farm, and, more important, on t h e p ropor t ion o f cropland per farm. For example, on t h e Kauai farms 70 percent of the t o t a l a r e a was c rop lmd. The investment i n a l l farm land was $118 per a c r e , o r $30 above t h e sample average. Nevertheless, t h e investment p e r crop acre was $168, t h e lowest f o r a l l d i s t r i c t s . I n c o n t r a s t , cropland of t h e Mountain View sample e n t e r p r i s e s amounted t o on ly 5 percent o f t o t a l farm land. Des- p i t e the low investment of $30 p e r farm a c r e , the investment per crop a c r e t h e r e was $620, the highest f o r a l l sample d i s t r i c t s . The average investment p e r crop acre on a l l sanple farms was $312.
The book value of l and on the sample farms was t h e purchase p r i c e . A l l but two farms had been bought before World !"far I1 o r dur ing t h e f i r s t war y e a r s when p r i c e s were low. Therefore , the super- v i s o r s of the FHA were requested t o es t imate the 1947 market value of the l a n d f o r each sample farm. According t o t h e i r conse&ative opinion, t h e average market va lue of l and was $4,590 p e r sanple farm, o r 54 percent more t h a n t h e book value (Table C3). Di f fe rences between book and market value ranged from 31 percent a t Omaopio t o 84 percent a t Mountain View. Using the same method of computing farm in - vestment Der crop a c r e a s be fore , Mountain View farms had the h ighes t market value wi th $1,140 p e r a c r e , Oahu farms second h ighes t wi th $721, and Kauai farms lowest wi th $252 p e r acre.
A t t h e r a t e of 5 p e r c e n t , . t h e annual i n t e r e s t charges p e r crop ac re i n s e v e r a l sample d i s t r i c t s were h igher than r e n t s paid f o r l e a s e d cropland. For example, the average i n t e r e s t charge per crop a c r e a t Mountain View was $57, while r e n t s f o r vege- t a b l e and f r u i t l a n d i n t h a t a r e a were h a l f t h a t amount o r l e s s .
The value of farm Improvements o t h e r than the dwel l ing, such a s farm bu i ld ings , fences , and irri- g a t i o n systems were low, avera i n g $44.0 p e r sample farm. The va lues ranged from $80 on t h e farms i n
APPENDICES 185
Kona t o $890 on those i n Omaopio (Table C3). A mainland farmer would be as tonished a t the
m a l l number of animals kep t by the sample growers. Only seven of the 36 farmers owned horses o r mules. Twenty-f ive r a i s e d chickens . O f t hese , s i x t e e n had l e s s than 20 b i r d s of a l l ages, e i g h t had between 21 and 80, and one had a f l o c k of 1,000. Seven farmers kept ducks, and f i v e had c a t t l e . Of t h e s i x who r a i s e d hogs, th ree had only. one each. The aver- age value of l i v e s t o c k p e r sample farm was $254 (Table C4). Though smal l , t h e number of animals owned by t h e sample growers was probably l a r g e r than t h s t owned by most vegetable and f r u i t producers i n t h e t e r r i t o r y , because the FHA superv i sors had s t r e s s e d t o t h e i r c l i e n t s t h e need f o r more l i v e - s tock e n t e r p r i s e s .
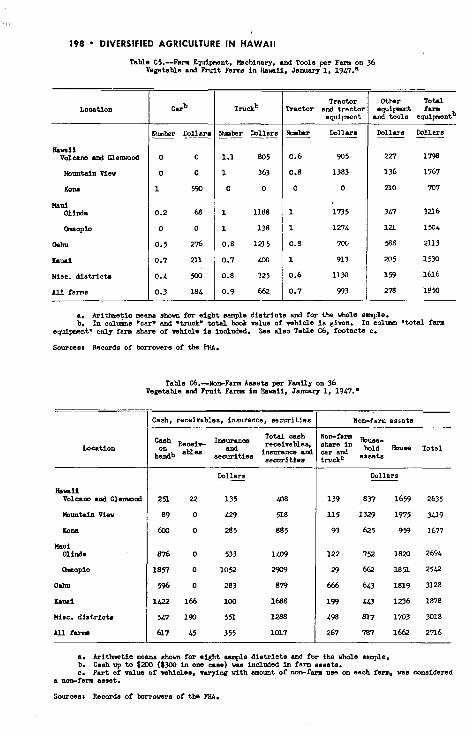
For t h e i r s i z e the sample farms were w e l l equip- ped w i t h c a r s , t r u c k s , and farming equipment. A l l excep t one grower had e i t h e r a c a r o r a t ruck , but he , too , bought a t r u c k i n 1948. There were 11 c a r s and 31 t r u c k s on the 36 farms. Five f a m i l i e s owned both a c a r and a t ruck , and one grower owned th ree t r u c k s of va r ious s i z e s . Average investment f o r c a r s and t r u c k s was $850 p e r sample farm (Table C 5 ) .
Twenty-five growers, o r 70 percen t of the sample, owned t r a c t o r s and t r a c t o r equipment. I n a d d i t i o n , one producer owned a t r a c t o r coopera t ive ly w i t h another. The Kona growers had no t r a c t o r s , because t h e i r l and was t o o rocky and shallow. The o t h e r farms wi thout a t r a c t o r had t o o l i t t l e cropland under c u l t i v a t i o n t o warrant the investment. Most t r a c t o r s were the wheel type of 1 5 t o 20 horsepower. The deprec ia ted book value of t r a c t o r s and imple- ments on farms owning a t r a c t o r averaged $1,430 and ranged from $340 t o $3,180.
Tools and miscel laneous equipment o t h e r than c a r s , t r u c k s , t r a c t o r s , and implements averaged $280 p e r sample farm (Table C 5 ) . Major i tems used by a l l sample growers were sprayers ( b o t h power-driven and hand-operated), hand d u s t e r s , and weed burners. Many farmers had horse-drawn implements, engines , pumps, and por tab le i r r i g a t i o n equipment. Garden and hand t o o l s and shop equipment were valued any- where f r o n twenty-f i v e t o severa l hundred d o l l a r s p e r farm.
Af te r World War I1 when war su rp lus machinery could be bought cheaply i n Hawaii, many growers, p a r t i c u l a r l y v e t e r a n s , took advantage of t h e oppor- t u n i t y t o buy jeeps , c a r s , t r u c k s , t r a i l e r s , and o ther equipment.
186 DIVERSIFIED AGRICULTURE I N HAWAII
The average deprecia ted investment i n f a r n equip- ment p e r sample grower was $1,850. It ranged from $700 p e r farm t n Kona t o $3,200 i n Olinda (Table C2). The value of s u p p l i e s , growing c rops , and farm cash on hand was es t imated a t about $1,000 p e r sample pro- ducer (Table C2).
Asse t s o the r than r e a l e s t a t e used f o r t h e farm bus iness averaged $3,100 per sanp le grower, ranging from $1,780 on the nonmechanized smal l farms of Kona t o $4,220 on t h e l a r g e r mechanized farms o f Olinda. These f i g u r e s i n d i c a t e d the major c a p i t a l requiremen' of a vegetable producer who leased h i s land. I n ad- d i t i o n 7 a t e n a n t needed funds f o r prepaying h i s leas t and f o r taking ca re of h i s family u n t i l h i s crops we] harvested.
The book value of a l l a s s e t s used i n the farm bus: n e s s p e r sample farm ranged from $3,800 on the Kona farms t o $10,200 on t h e Olinda farms, averaging $6,700. Based on the 1947 market value of farm r e a l e s t a t e , t h i s f i g u r e inc reased t o $8,200 (Table C 2 ) .
Non-farm bus iness a s s e t s of t h e family included the dwelling, household a s s e t s , cash on hand o t h e r than an opera t ing minimum needed f o r the farm, and var ious types of savings. The average book value p e r house was $1,660 (Table C6). Many houses were const ructed before Dorld YJar 11, when bu i ld ing c o s t s were low. Their average 1947 market value was e s t i - na ted a t $3,000 by FfU superv i sors , o r 80 percen t above t h e i r book vzlue. The houses ranged from an o ld shack worth ba re ly $600 t o a l a r g e ; w e l l - b u i l t hone appraised conserva t ive ly a t $6,300.
Household a s s e t s were valued a t ,;800 on the average p e r sample farm. S e c u r i t i e s , bank savings , l i f e insurance, r e c e i v a b l e s , and cash on hand aver- aged $1,000 p e r grower. Four f a m i l i e s had l e s s than 9100, 12 from $100 t o $500, 1 3 from $501 t o $1,500, and seven from $1,501 t o $4,600 o f such savings. The average book value of a l l non-farm a s s e t s p e r grower was 03,600 (Table C2) . I f t h e 1947 market value of the house were s u b s t i t u t e d f o r i t s book va lue , the t o t a l f i g u r e f o r non-farm a s s e t s would cone up t o $4,900.
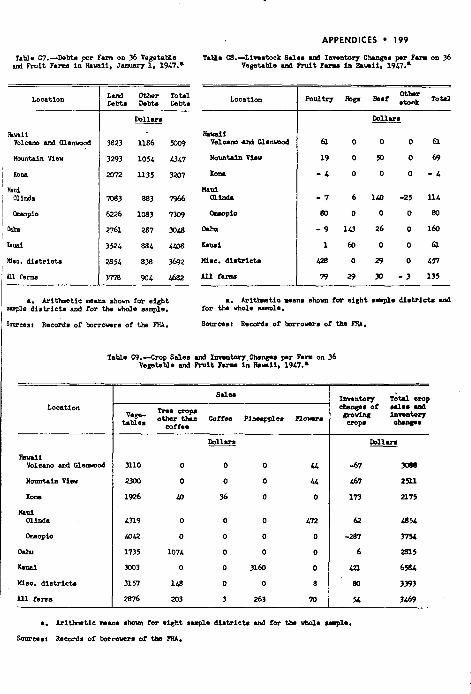
Average d e b t s per sample farmer were $4,700, which was 46 percent of t h e book value and 36 per - cent of t h e market value of t o t a l a s s e t s (Table C7).
FARM RETURNS ON THE SAMPLE FARMS
Gross farm r e t u r n s were def ined a s the sum of farm s a l e s and inventory changes, f a r n product ion
APPENDICES 187
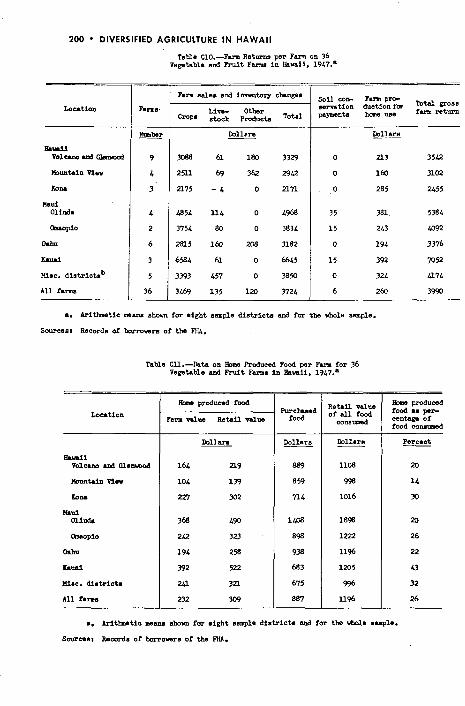
f o r hone use , and s o i l conserva t ion payments by the f e d e r a l government. The mean g r o s s farm r e t u r n p e r sample grower was $3,990 (Table ClC). Twelve
roducers had g r o s s farm r e t u r n s between $1,500 and $2,499, 22 between $2,500 and $9,700, and two between $9,701 and $10,699. There was a c o r r e l a t i o n between crop acreage and g r o s s farm r e t u r n s , The producers i n t h e two d i s t r i c t s w i t h the l a r g e s t crop acreage p e r farm had t h e h ighes t g r o s s farm r e t u r n s ; t h e growers i n t h e f o u r d i s t r i c t s w i t h t h e smal les t crop acreage, the lowe st.
Crop s a l e s and inven tory changes c o n s t i t u t e d by f a r t h e l a r g e s t p o r t i o n of g r o s s farm r e t u r n s . They averaged $3,470 p e r sample grower, o r 87 percent of g r o s s farm r e t u r n s . Tho share of crop s a l e 9 i n g r o s s farm r e t u r n s ranged from 81 percent f o r Mountain View t o 93 percent f o r Kauai.
The sample farmers were s p e c i a l i z e d a s t o t h e type 1 of crops r a i s e d . Of t h e t o t a l crop market ings , 84 percen t were vege tab le , 6 percent t r e e crop, 8 per- I
c e n t p ineapple , and 2 percent f lower s a l e s (Table C 9 ) . Only e i g h t ou t of the 36 growers so ld more than $800 worth of crops o t h e r t h a n vegetables . O f t hese , f i v e , s o l d t r e e f r u i t s , two pineapples , and one f lowers . One of these e i g h t farmers s p e c i a l i z e d i n f r u i t s only. I n t h e case of t h e remaining seven producers, aa rke t - i n g s of crops o t h e r t h a n vegetables amounted t o any- where from one- thi rd t o two-thirds of a l l crop s a l e s . The growers producing both f r u i t s and vege tab les usua l ly r a i s e d only one type of f r u i t . Farmers pro- ducing vege tab les e x c l u s i v e l y f r e q u e n t l y concentrated on few kinds.
A glance a t t h e s a l e s of l i v e s t o c k and miscellane- ous products makes t h e l a c k of e n t e r p r i s e d i v e r s i f i - c a t i o n on the sample farms even more apparent. To ta l s a l e s and inventory changes of l i v e s t o c k avaraged $135 p e r sample grower, o r 3 percent of g r o s s farm r e t u r n s (Tables CB and (310).
S a l e s of o the r than crop and l i v e s t o c k products averaged $120 p e r sample grower, o r 3 percent of g r o s s farm r e t u r n s . Seven farmers made s a l e s of t h i s type, raoging from $80 t o $1,200. S i x of them, i n t h e Volcano-Glenwood and l lountain View d i s t r i c t s of Hawaii, marketed f e r n stumps and firewood, by- p roduc t s of t h e i r l a n d c lea r ing opera t ions . They a l s o s o l d f e r n s p r o u t s , which a r e used i n the prepa- r a t i o n of o r i e n t a l d ishes . One Oahu farmer and h i s family so ld guavas and mountain app les which graw wild i n t h e a rea .
188 DIVERSIFIED AGRICULTURE I N HAWAII
s o i l conservat ion payments mounted t o only $6 per sample farm. Six growers had become e l i g i b l e f o r such payments, f o u r on 13aui and two on Kauai. The amount p e r grower who received payments aver- aged $36, ranging from 420 t o $68.
Farm prodpct ion f o r hone use was m a l l and con- s i s t e d mainly of food. I ts value ranged from 50 t o $720, averaging $260 p e r sample grower, o r %. 5 percent of t o t a l g r o s s farm r e t u r n s (Table C10). Firewood product ion accounted f o r about $60 on the farms on t h e Ssland of Hawaii, and was most ly neg l i - g i b l e on the o t h e r i s l a n d s . Some growers r a i s e d p r a c t i c a l l y nothing f o r home use.
Food produced f o r hone use on the farm averaged 26 percen t of the t o t a l value of food consumed per farm family and ranged from 5 t o 65 percent (Table C 1 1 ) . To a r r i v e a t t h e r e t a i l value of home-pro- duced food, t h e farm value was increased by one- t h i r d . On t h i s b a s i s , the mean r e t a i l value of home-grown food was $310 per f a r m . Food bought amounted t o $890. The r e t a i l value of a l l food consumed by the average sample family of 5.4 peo- p l e was $1,200.
FARM COSTS OF THE SAMPLE FARMS
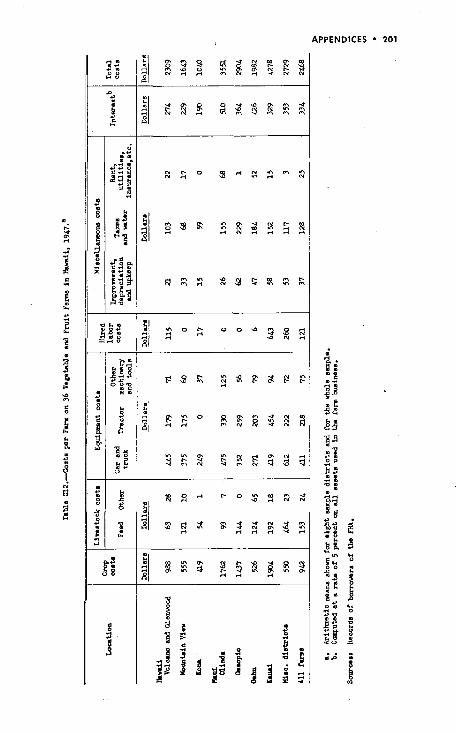
T o t a l farm c o s t s were broken down i n t o t h e fol lowing major groups: (1) crops, ( 2 ) l i v e s t o c k , ( 3 ) e uipment, ( 4 ) h i r e d l abor , ( 5 ) miscellaneous, and ( 8 ) i n t e r e s t . Crop c o s t s included cash ex- penses f o r f e r t i l i z e r and l ime, i n s e c t i c i d e s , fungi- c i d e s , he rb ic ides , packaging m a t e r i a l s , and t rans - p o r t a t i o n and marketing. They amounted t o 38 percent of a l l farm c o s t s p e r sample farm. Eecause of l a rge1 t r a n s p o r t a t i o n and marketing c o s t s , t h i s propor t ion was h igher f o r growers on t h e o u t s i d e i s l a n d s than f o r thosa l o c a t e d on Oahu. It amounted t o 50 percent on hlaui, compared t o 27 percen t on Oahu (Table C12). Crop c o s t s v a r i e d d i r e c t l y wi th t h e l e v e l o f output pe r farm. Feed and o t h e r l i v e s t o c k c o s t s amounted t o $177, o r 7 percent of a l l farm c o s t s .
Equipment c o s t s included expenses f o r c a r , t ruck , t r a c t o r , o t h e r machinery, and t o o l s . I n t e r e s t on equipment was n o t included h e r e ' b u t wi th i n t e r e s t on a l l farm a s s e t s . Cars and t rucks were deprecia ted a t the r a t e of 10 percen t per year . However, only p a r t of t h i s deprec ia t ion was considered a s a c o s t of the farm business . A varying por t ion was charged t o o f f - farm business o r fami ly l i v i n g , depending upon the
APPENDICES 189
percentage of c a r o r t r u c k use f o r these purposes. Trac to rs were deprec ia ted a t the r a t e of 10 percen t p e r annum. The r a t e of de r e c i a t i o n of o t h e r machin-
depending upon the I tern. 1 e r y and t o o l s va r ied from t o 25 percen t pe r year
Average annual c a r and t ruck c o s t s were .$dl per sample grower. l o r f o u r f s r n e r s , c a r and t ruck c o s t s ranged from $20 t o $199, f o r 22 from $200 t o $420, and f o r 1 0 from $421 t o a s high a s $1,361. Avers e t r a c t o r c o s t s pe r grower owning a t r a c t o r were $311. Three farmers had t r a c t o r c o s t s of from $100 t o $199, e igh teen from $200 t o .$365, and th ree from $366 t o $526. Costs of o t h e r machinery and t o o l replacement were 575 per o p e r a t o r , ranging from $15 on a nomechanized farm t o $214 on a highly mech- an ized e n t e r p r i s e .
T o t a l equipment c o s t s were $704 p e r grower, o r 29 percen t of t o t a l farm c o s t s (Table.Cl2). A Kona farmer who d id not own a t r a c t o r had t h e lowest equipment cos ts--6228. The vegetable grower a t Xaalehu had equipment c o s t s mount ing t o $1,900. He was l o c a t e d f a r away from h i s neares t shipping po in t , H i l o , and h i s t ruck ing c o s t s were high.
Only e i g h t of the sample growers used any h i red l s b o r , Three paid wages of ~ 1 5 5 o r l e s s , two paid between $400 and $700 and th ree who used fu l l - t ime h i red h e l p paid from $900 t o $1,300. Average h i r e d l a b o r c o s t s were $121 p e r sample rower, o r 5 per- cent of a l l farm c a s t s (Table C12k.
The major i tems included under miscel laneous c o s t s were deprec ia t ion and upkeep of improvements, t axes , wa te r , u t i l i t i e s , f i r e insurance, and r e n t . A s t h e s e growers had few farm bu i ld ings and o t h s r improvements, t h e i r deprec ia t ion c o s t and upkeep averaged only $37.
I n 1947 I s l a n d farmers paid t h r e e kinds of d i r e c t t a x e s o t h e r than n e t income taxes , namely, personal p roper ty , r e a l p roper ty , and g r o s s income t a x e s ; The personal p roper ty t a x , which averaged $22 p e r sample grower, was abol ished a t t h e end of 1947. Real p roper ty t a x e s averaged $42 per sample producer and ranged from $6 f o r a grower i n Llountain View t o $130 f o r one on Oahu.
The g r o s s income t a x on s a l e s by farmers t o whole- s a l e r s , 0.25 percent i n t h e first h a l f of 1947, was r a i s e d t o 1.5 percent beginning J u l y 1. The average g r o s s income t a x paid p e r grower was $37 and ranged from $13 t o $100, depending upon volume and season of s a l e s . The t a x r a t e of 1.5 pe rcen t i s s t i l l i n e f f e c t . The amount of g r o s s income t a x e s which
190 DIVERSIFIED AGRICULTURE I N HAWAII
farmers would now have t o pay on a s a l e s va lue equal t o t h a t i n 1947 would be about 70 percen t higher.
Expenditures f o r i r r i g a t i o n water v a r i e d g r e a t l y . I n the more humid d i s t r i c t s i r r i g a t i o n was e i t h e r no t necessary o r was requ i red on ly dur ing shor t per iods . I n these a r e a s water was u s u a l l y cheap, and c o s t s f o r i r r i g a t i o n water ranged from zero t o about $20 p e r year. I n s e c t i o n s w i t h pronounced dry s p e l l s and where water was expensive, such a s Rula, Maui , expenses f o r i r r i g a t i o n water ranged from $100 t o 3200 p e r farm. Average t a x and wate r expenses p e r grower were $128, o r 5 pe rcen t of a l l farm c o s t s .
Other i t ems , such a s r e n t i n t h e case of two producers, t h e f a r n share of u t i l i t i e s and f i r e in- surance, and con t r ibu t ions t o farmer o rgan iza t ions , amounted t o $25 per farm. T o t a l miscel laneous c o s t s were $190, o r 8 percen t of a l l farm c o s t s .
I n t e r e s t , coaputed a t t h e r a t e of 5 p e r c e n t on a l l a s s e t s used i n t h e farm business , was $334 p e r grower, o r 1 3 percent of a l l farm c o s t s (Table C12). It ranged from $130 f o r a producer i n Mountain View t o $640 f o r one i n Olinda.
T o t a l c o s t s pe r grower, including i n t e r e s t but excluding a charge f o r family l a b o r , averaged $2,470 (Table C13). They var ied g r e a t l y from farm t o farm and d i s t r i c t t o d i s t r i c t , depending p r h a r i l y on s i z e of ou tpu t and degree of mechanization. Eona farms were small i n s i z e , had a modest o u t p u t , and were opera ted mainly w i t h hand too l s . The i r average c o s t s were $1,000. Kauai farms, of l a r g e r s i z e , w i t h a g r e a t e r ou tpu t , and t rac to r -opera ted , had average c o s t s of $4,300 p e r farm.
FARM INCOME ON THE SAMPLE FARMS
Farm income v a l u e s were c a l c u l a t e d by sub t rac t - i n g farin c o s t s from g r o s s farm r e t u r n s . Depending on how i n t e r e s t was t r e a t e d , s e v e r a l income measures were obta ined. I n c a l c u l a t i n g "net farm income ," i n t e r e s t was not considered a c o s t , but r a t h e r an income. Farm c o s t s i n t h i s case included a l l cash expenses a s we l l a s d e p r e c i a t i o n of b u i l a i n g s and equipment. Net farm income per sample family aver- aged $1,860 and ranged Prom $1,500 i n Volcano-Glen- wood t o $3,100 on Kauai.
I n the case of " l abor and management income," i n t e r e s t was considered a c o s t . A t an i n t e r e s t r a t e of 5 percent on a l l farm a s s e t s , t h e average
APPENDICES . 191
l a b o r and management income per sample f m i l y was $1,520 and ranged from $1,190 f o r f a r n e r s i n Omaopio t o $2,780 f o r the Kauai growers (Table C13).
If i n t e r e s t a t the same r a t e were charged only on t h e a c t u a l d e b t s of t h e growers i n 1947, t h e average l a b o r and management income p e r family would be $1,690, o r about ha l f way between the two income measures j u s t d iscussed. Actual ly , t h e producers i n t h e sample were a l l f inanced by FHA and pa id only 3 percen t on t h e i r loans.* The a c t u a l l a b o r and management income f o r t h e s e f a m i l i e s averaged, there- f o r e , $1,760 p e r farm and ranged from $1,390 i n Omaopio t o $3,010 on Kauai.
The y e a r l y n e t income earned per man working f u l l time on these farms i s a s i g n i f i c a n t income measure comparable t o wage r e t u r n s i n the major a g r i c u l t u r a l i n d u s t r i e s . This n e t income p e r work year was c a l c u l a t e d by d iv id ing the a c t u a l l a b o r and management income per farm by t o t 2 1 nan gears worked. It averaged $1,112, ranging from $850 i n the Volcano-Glenwood d i s t r i c t t o ,;l,6OO on Eauai (Table C U ) .
I n February 1947 t h e mean hour ly wage f o r about 6,000 sugar p l a n t a t i o n l a b o r e r s was 94 c e n t s . The modal t h i r d of these sugar workers rece ived 84 c e n t s pe r hour. (See r e f . 14, p , 56.) If it i s assumed t h a t these employees viorked a t l e a s t 2,400 hours dur ing the year a t these wages, the mean a n n u a l ' ea rn ings per ~ o r k e r would have been 52,250 and the moda 1 income $2,000.
A v e r a ~ e cash ea rn ings f o r 1,056 pineapple plan- t a t i o n workers, not inc lud ing managerial , super- v i so ry , and p r o f e s s i o n a l employees, amounted t o 41,929 i n 1946. A l l of t h e s e workers were on the p a y r o l l throughout t h e year . However, because of the seasona l charac te r of t h e i n d u s t r y , n o t a l l of them worked r e g u l s r l y dur ing the year . P e r q u i s i t e s valued a t 1 5 c e n t s p e r hour f o r men and 10 c e n t s pe r hour f o r women were no t included i n the ea rn ing f i g u r e f o r the mcnths January through S e p i w b e r . (See r e f . 14, 'pp. 87, 89, and! 90.)
Earnings of fu l l - t jme wage workers i n the sugar and pineapple i n d u s t r i e s t h u s were about twice z s
* A l l these farms had received t h e i r farm owner- sh ip loans before 1946 when the i n t e r e s t r a t e charged by the FHA was 3 percent . Farmers t h a t received farm ownership loans from the FHA a f t e r 1948 pay a n i n t e r e s t r a t e of 4 percent .
192 DIVERSIFIED AGRICULTURE I N HAWAII
high a s the l a b o r and management income of t h e f r u i t and vege tab le sample farmers.
The e f f e c t of the fo l lowing f o u r f a c t o r s on the n e t farm income p e r worker on the sample farms was s tud ied : (1) g r o s s farm r e t u r n s p e r worker, ( 2 ) r a t i o of non-labor c o s t s t o g r o s s farm r e t u r n s , ( 3 ) farmer a b i l i t y , and ( 4 ) farm q u a l i t y . The g r o s s farm r e t u r n p e r Kauai grower was about 50 pe rcen t above the sample average of $2,525. The Kauai producers were r a t e d above average i n a b i l i t y and t h e i r farms a t l e a s t average i n q u a l i t y . T h e i r c o s t s aaounted t o 57 pe rcen t of g r o s s farm r e t u r n s , 1 percen t above the average f o r the e n t i r e sample. They had t h e h ighes t n e t income p e r worker f o r a l l sample sub- groups (Table C14).
The Kona growers had a g r o s s farm r e t u r n of $2,450 p e r worker, which was below the sample aver- age. Eowever , they were considered good farmers and t h e c l imate of t h e i r d i s t r i c t enabled them t o market t h e i r c rops dur ing the season of h igh p r i c e s . They d i d no t use t r a c t o r s and, p a r t l y because of t h i s , t h e i r c o s t s amounted t o on ly 37 p e r c e n t o f t h e i r g r o s s farm r e t u r n s , which was l e s s t h a n f o r any o t h e r sample subgroup. Thay had t h e second h i g h e s t income p e r worker among the sample d i s - t r i c t s .
The s i x Oahu growers were r a t e d a s above? average i n a b i l i t y , and t h e i r farms were consifiered t o be f a i r l y good. T h e i r l o c a t i o n on Oahu, c lose t o the Honolulu market , was one reason why t h e i r c o s t per- centage of g r o s s farm r e t u r n s was low, 48 pe rcen t . The i r g r o s s r e t u r n pe r farm worker was s l i g h t l y above average. They ranked t h i r d h ighes t i n n e t annual incoma p e r worker among the subgroups.
Olinda growers had a g r o s s farm r e t u r n of $3,000 p e r worker, o r about 25 percent above the sample average. They were r a t e d a s b e t t e r than average farmers and opera ted t h e l a r g e s t c rop acreages i n a l l sample d i s t r i c t s . However, the c l imate l i m i t e d t h e i r product ion mainly t o low-value crops , such a s cabbage. The i r c o s t percentage of 60 pe rcen t of g r o s s farm r e t u r n s was high. They had t h e f o u r t h h i g h e s t n e t income p e r worker.
The r e c o r d s of the two Omaopio producers show the l i m i t i n g e f f e c t on n e t farm income of j u s t one component of farm q u a l i t y , namely, a v a i l a b i l i t y of i r r i g a t i o n water. These growers p l a n t e d a l a r g e c rop i n t h e sp r ing but no r a i n f e l l f o r s e v e r a l months dur ing the summer. Avai lable i r r i g a t i o n wa te r was i n s u f f i c i e n t , and p a r t of t h e c rop d r i ed
APPENDICES 193
up. The g ross farm r e t u r n p e r worker of $2,900, though above average, was f a r below expecta t ions . Another consequence of the drought was the i n c r e a s e i n the c o s t percentage t o 66 percen t of g r o s s farm r e t u r n s , t h e highest f o r a l l d i s t r i c t s . The growers were o f average a b i l i t y and the n a t u r a l resources , o t h e r than a v a i l i b i l i t y of i r r i g a t i o n water , were of h igh qua l i ty . Never theless , t h e Omaopio oper- a t o r s were i n s ix t -h p lace i n annual income p e r worker among t h e e i g h t major sample d i s t r i c t s .
The Volcano-Glenwood d i s t r i c t ranked lowest i n farm qua l i ty . I ts s o i l was shallovr and i ts f e r - t i l i t y had been. dep le ted on some of t h e farms. The crop acreage p e r farm was smal l , and the c l imate l i m i t e d the range of crops. The growers i n t h i s d i s t r i c t were judged a s being below average i n a b i l i t y . They had t h e m a l l e s t g r o s s farm r e t u r n s p e r worker and the second h i g h e s t cos t percentage of g ross f a m re tu rns . The i r d i s t r i c t had t h e low- e s t f a r n income per worker of a l l sample a reas .
OFF-FARM INCOME ON THE SAMPLE FARMS
Off-farm income was s u b s t a n t i a l f o r some of the sample f a a i l i e s . For t e n of t h e n i t ranged from $800 t o $3,600, c o n s t i t u t i n g anywhere from 1 7 t o .49 percen t of t h e i r t o t a l incone." E igh t more f a m i l i e s had from $100 t o $700 off-farm incone, which i n a l l but one casa axounted t o l e s s t h a n 1 5 percent of t h e i r t o t a l income. Of the remaining 1 8 f a m i l i e s , the o f f - f a r 3 incone was l e s s than $100. Of f - fa ra income per sample farm averaged $597, o r 26 percen t of the average t o t a l family income of $2,238 (Table Cl5) .
Sometimes the o u t s i d e work of the grower had some r e l a t i o n t o h i s farm. For example, one vege- t a b l e grower t rucked the produce of o t h e r s t o msrket wi th h i s own. Another, who received low p r i c e s on the wholesale market, began s e l l i n g h i s t ruck c rops t o neighbors a t r e t a i l . Even tua l ly he bought ad- d i t i o n a l vege tab les f r m o t h e r producers and expand- ed h i s opera t ions . A few growers used t h e i r t r a c t o r s , bu l ldozers , and o t h e r equipment on neighboring farms.
* Famil ies who received less than 50 percent of t h e l r t o t a l family income from the farm were n o t included i n t h e sample.
194 DIVERSIFIED AGRICULTURE I N HAWAII
I n some cases the off-farm work had no r e l a t i o n t o t h e farm but cons i s ted i n running s t o r e s o r working f o r a wage i n town o r on p lan ta t ions .
Occasionally; grown-up ch i ld ren , p a r e n t s , o r r e l a - t i v e s l i v i n g on t h e f a r 3 had o u t s i d e jobs, but a l s o contr ibuted d i r e c t l y o r i n d i r e c t l y t o the farm l a b o r force . The women worked i n t h e housa a f t e r r e tu rn- ing from t h e i r o u t s i d e jobs, f r e e i n g t h e grower's wi fe o r mother f o r work i n the f i e l d s . S imi la r ly , the men who worked o f f the farm helped i n doing t h e chores and f a r m l a b o r on week-ends.
SAVINGS ON THE SAMPLE FARMS
?let savings were c a l c u l a t e d t o i n d i c a t e the f i - nanc ia l s t a b i l i t y o f the sanple f m i l i e s a t t h e i r 1947 s tandards of l i v i n g . The term n a t savings a s used here means the d i f f e r e n c e between l i v i n g c o s t s of ths fami ly and cash income a f t e r n e t incone tax- e s . To determine n e t savings , farm product ion f o r home use and f e d e r a l and t e r r i b o r i a l n e t income t a x e s were deducted from f m i l y income.
Only f o u r growers paid any f e d e r a l , and s i x any t e r r i t o r i a l n e t incone taxes . The average f e d e r a l n e t income t a x paid per sample family was $26, and the average t e r r i t o r i a l n e t income t a x was $5. A s mentioned e a r l i e r , production f o r hone use averaged '$260 per f a r a . By s u b t r a c t i n g t h e s e t axes 3nd pro- duct ion f o r hone use from t h e average f a n i l y income
2 ! 2,288, an average f a n i l y cash income a f t e r t a x e s 1,997 was obtained.
Living c o s t s a s used here include a l l f ami ly cash expenses, the cos t o f using the c a r f o r family pur- poses , a s we l l a s i n t e r e s t , d e p r e c i a t i o n , and upkeep on the dwel l ing, home f u r n i t u r e , and equipment. Since the book value of the houses was too low t o be taken a s a b a s i s f o r c a l c u l a t i n g i n t e r e s t and d e p r e c i a t i o n , the 1947 s a l e s value of each house was es t imated , and the average of book va lue and sacs va lue used i n c a l c u l a t i n g i n t e r e s t and de- p r e c i a t i o n .
On the average the sample f a m i l i e s spent $34 more than t h e y earned (Table (315). Eleven house- holds overspent t h e i r cash income by $400 t o $1,500 and e i g h t by $100 t o $399. S leven f a m i l i e s saved between $100 and $300 and s i x from $400 t o $1,500.
In t h i s c a l c u l a t i o n of n e t savings , an i n t e r e s t charge of 5 percent on farm and home d e b t s was in- cluded as a cos t r a t h e r than the 3 percen t i n t e r e s t
APPENDICES ' 195
t h a t these FHA c l i e n t s a c t u a l l y paid . Th is was done t o make t h e sample r e s u l t s more r e p r e s e n t a t i v e of t e r r i t o r i a l vegetable and f r u i t farmers i n gener- a l . I n t e r e s t r a t e s on l o a n s t o I s l a n d growers a r e r a r e l y l e s s t h a n 5 percent. It could be argued t h a t t h e sampla producers might have reduced t h e i r l i v i n g s tandards somewhat i f they had pa id an in - t e r e s t r a t e of 5 r a t h e r than 3 percent . Net f m i l y cash income a f t e r t axes and family l i v i n g c o s t s were, t h e r e f o r e , r e c a l c u l a t e d on the b a s i s of a 3 pe rcen t i n t e r e s t r a t e on farm and home debts.
This r e c a l c u l a t i o n r a i s e d family cash income a f t e r n e t incone t a x e s from 1,997 t o $2,061 and decreased l i v i n g c o s t s from $ 2,031 t o $2,003. A s a r e s u l t , average sav ings p e r sample farm rose t o $58. Nineteen f m i l i e s i n t h e sample s t i l l earned l e s s than they spen t , though the d i s t r i b u t i o n was somewhat more favorable . Nine f a m i l i e s spent from $400 t o $1,300 and 1 0 from $100 t o $399 more t h a n t h e i r income dur ing t h e S i x f a d l i e s saved up t o $399, and 11 from $;::*to $1,500.
To encourage a grower t o continue opera t ing h i s farm, s u f f i c i e n t savings should remain above his family l i v i n g c o s t s t o enable him t o make a reason- ab le annual payment on h i s d e b t s and t o improve h i s farm and home. Besides, t h e grower needs t o bu i ld up funds f o r h i s o ld age re t i r ement and f o r s p e c i a l cont ingencies . Savings of $58 p e r year . a r e not s u f f i c i e n t t o provide f o r these needs.
196 DIVERSIFIED AGRICULTURE I N HAWAII
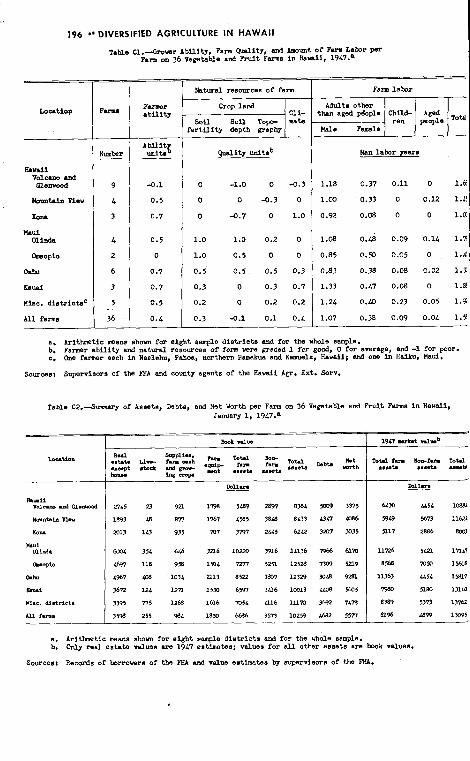
Table U.-Gmwr Ability, Far. W i t y , and Amount of Farm labor per Farm on 36 Vegetable and Pruit Tarns i n Hawaii, 19L7.a
& t u r d resources of fern
Crop lard
Fert i l i ty depth graphy
Adults other
H d e Female
Man labor p a r s
a. Arithmetic means show for. e ight ample d i s t r i c t s and for the u b l e ample. b. Fsrner ab i l i ty d natural resources of farm vera graded 1 for g d , 0 for average, and -1 for p r . c. One f m r each in Nealehu, Paboa, northern Hemakua and Kemuela. Havaiii and one i n H a i k u . Naui.
Souroest Supervlaors of the TI" and county agents of the Havaii Agr. Ext. Serr.
Table CZ.-Smmmr~ of Assets. Debts, a d Net Worth per Farm on 36 Vegetable and h i t Farms In Hawaii, January 1, 1947.'
r o w fur n0n-f". rot. ..Ut. U..t. ".a
a. Arithmetic mans shovn for eight sample d i s t r i c t s and for the whole sample. b. Only rsal estate d u e s an, 1917 estimatss; values for all other assets are bmk values.
Sources: Records of borrowrs of the TfiA and d u e estimates by supervlsora of the TfiA.
APPENDICES 197
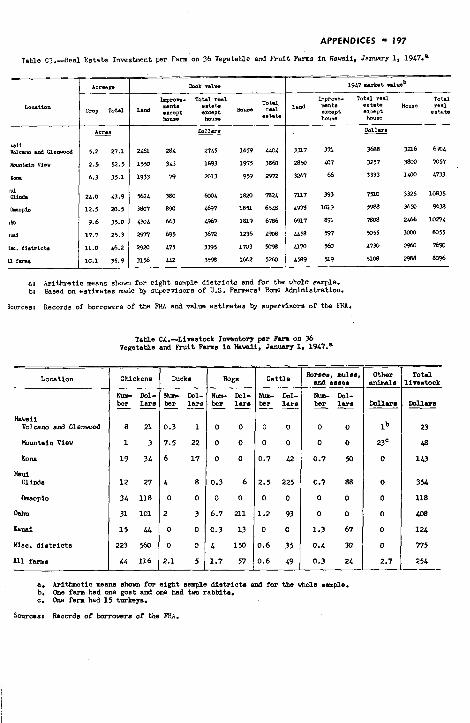
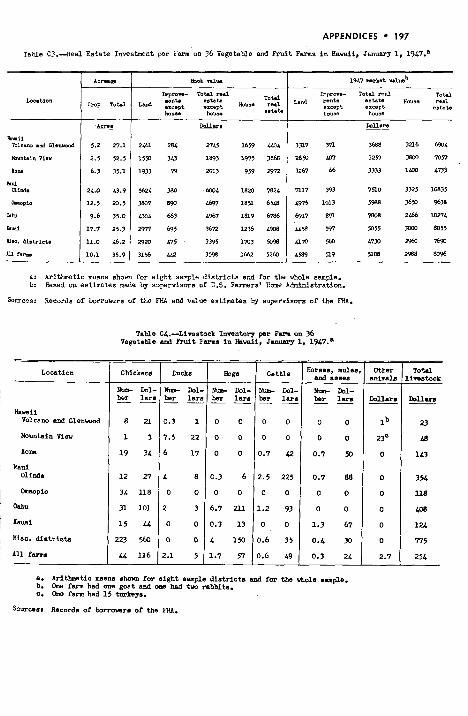
Table C3.-Real Est.t-3 Investment per Farm on 36 Vegetable and Fruit Farms i n Hawif, January 1, 19L7.a
Lend Total real
..tab
. . apt house
D0ll.m - 3688
3257
3333
7510
5988
7808
5055
4730
5106
Totat real
srtats
-
6904
70%
L733
10835
9638
10274
8055
7690
8096
ar A r i t h t i c means shown for eight sample d i s t r i c t s and for the whole sample. b: Based on estimates made by supervisors of U S . Farmers' Aome Ahinistrat ion.
Sources: Records of borrowers of the FlU and value estimates by aupervisora of the FHA.
Table C4.-Liwstock I m n t o q per F m on 36 Vsgetahls and Ruit F m s In i h w i i , J a n u a r ~ 1, 1947.'
=
Lucks
=
Cattle
- Other
lb
23=
0
0
0
0
0
0
2.7 -
Chickens
KUE- bl- bar 1ma
8 21
1 3
1 9 34
12 27
34 118
31 101
1 5 44
223 560
44 116
Dol- l a r i -
Nuar mi- bar = -
0 0
0 0
0 0
0.3 6
0 0
6.7 211
0.3 1 3
4 150
1.7 57
Nmc- Dol- tar lar :
0 0
0 0
0.7 42
2.5 225
0 0
1.2 93
0 0
0.6 35
0.6 49
Hawaii Vol cam and G l e a d
Wountain View
Kona
W a u i Olinda
omaoplo
oahu
Kauai
Mac. d ia t r i c t a
A11 farms
a. Ari thmtic means shorn for alght sample d la t r l c t a and for the mole asmple. b. One farm had one goat a d om had t w rabbit.. c. One farm had 15 turkeys.
Sourmsr Records o f borromrs of the IHA.
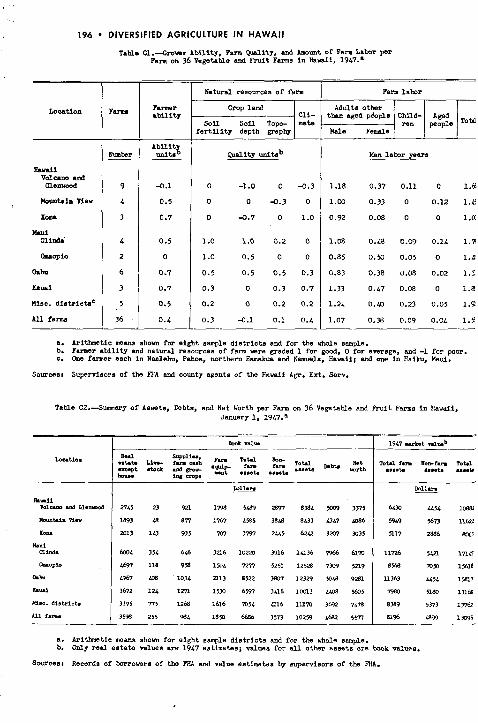
196 DIVERSIFIED AGRICULTURE I N HAWAII
T-ble Q.-Cronr Ability, Fana Wit,, and b u n t of P- L a b r per F a n on 36 Vegetable and h i t F m s i n Hawaii, 19L7.'
-
Natural resources of f a n Farm l s t o r
Adults o t b r Crop land
h r t i l l t y depth graphy
puality unit& Abil i t
=r & 9 -0.1
Man l a t o r years
R a d i Volcano and Glsnvood
I bwltrln viev
KOM
k U i OliXlA
(Lnopio
Oahu
kuai
Mac. d ia t r i c t se
A l l farms
a. Aritlrmetic means ahown for eight sample d i s t r i c t s and for the whole sample. b. F m r ab i l i ty and ns twa l resources of farm vere graded 1 for good 0 for averwe, and -1 fa r poor. s. One f m r each in Naalshn, Pahoa, northern Hamakua end Kemuela. at ail; and one i n Haiku, Maui.
Sowcesr Supervisors of the P A and county weu t s of the H a d l Agr. Ext . Sem.
Table C 2 . S m a r y of Aasets. Bbts , and Net Worth per Farm on 36 Ve-table and h i t Farms i n Hawaii. January 1; 1947.'
a. Arithmetic mans shovn for eight sample d i s t r l c t a and for the whole sample. b. Only real estata raluea are 19L7 estimatss; values for all other assats are b k values.
Sources8 Records of borrovera of the FKA and value estimates by supervisors of the RU.
APPENDICES 197
Table C3.-Real Estate Invsstment per Farm an 36 Vegetable and F'ruit Farms i n Havaii, January 1, 1947.'
Cmp T O W
a: Arithmetic meens sham for eight sample d i s t r i c t s and for the whole sample. b: Based on estimates made by supervisors of U.S. Farmers' E m Arhinistratlon.
Sources: Records of borrovers of the FHA and value estimates by suprv i so r s of tha FHA.
Table C4.-Lirestock Imsntory p r FM on 36 Vegetable ard hyit Farms i n hvaii , JanuYly 1. 1947.'
Lamtion Chickens
Hawaii Vol cam and Glenmod
Hountain View
KOM
Waui Olinda
omaopio
oahu
Kaui
Hisc. districts
Bm- Dcl. ber + -
8 21
1 3
19 34
12 27
34 118
31 101
1 5 44
223 560
A l l farms 44 116
a. Arl thmtic means shown for aigbt sample d i s t r i c t s d for the uhda mmpls. b. Oae farm had one goat and on, had tw rabbita. c. Cue farm had 1 5 tupkeys.
Sources: Records of borrmmrs of the FHA.
- - Other
anisale - mllu.
l b
23'
0
0
0
0
0
0
2.7
198 ' DIVERSIFIED AGRICULTURE I N HAWAII
Table C5.-Farp Equipment. Hachiner)r, and Tools per Farm on 36 Vegetable and Fruit Farms i n Rauaii. Jamurp 1. 1947.'
location
E n d l Volcano md Clenwod
Hountain Viev
&am
Haul Olindm
Oahu
I(aua1
Hise. d i s t r i c t s
A l l farms
bteT Dollars - I Iiollars Ib l l a r s Dollars I Tractor
h c t c r and t ractor eaulcmnt
a. l i r i t h e t i c means shorn for eight sample d i s t r i c t s and for the whole sample. b. In columns "carg .%d mtruek* total book d u e of vehicle i s given. In c o l m .total farm
equipmentn only far. s h e of vehicle is included. See also Table C6, footnote c.
Sources: Rocords of borrowers of the lR4.
Othar Total equ ips r t fan4
and b o l a e q u i m n t h
Table C6.-~on-Farm A ~ e t s psr Fmfiy on 36 Vegetable and h i t Fwm i n R a d i , January 1. 1947.'
Bsvlii Volcano am3 Glsm~cd
m m t a i n View
kana
Haul mimia
(hnaopio
O l h u
Kauai
Mac. d i s t r i c t .
A l l farm.
Cash, receivables, insurance, securi t ies
Total cash R e c e i r lnsuranm receirablas,
Gb ables aestier ~MTVIULCI) ur a e c u i t i e a
Non-farm assets
a. k i t h m t i c means s h m for eight sample d i s t r i c t s and for the &ole sample. h. (ash up to $200 ($300 i n om caw) was included in fano assets. c. Part of d w of rehicles, rsrying with amolmt of nopfarm use on each ram, vas conaidered
a non-fm aswt.
Sourcsaa Records of borrovsrs of the RU.
APPENDICES 199
h h l a C7.-Debts per Tun on 36 Vegntehle Tabla C8.--tinstock S d e s rrd I m n t o w Cluage. p r Fum on 36 and huit T a m in Ihbaii, January 1, 1947.e Vegntahle and R d t F r u i n lhmi i . 1947..
R d 1 Volcam and Clemrwd
Uountdin Vlw
I Ems
hui ainda
I maapio
1 0th" I buai
MIC. dl r t r i c t s
Ul farms
Land Other T o m mbt. Rbt. h b t . Location
A l l f ~ .
8 0 o o o e O
- 9 10 26 o 1to
t o o 0 6 1
m 0 2 9 0 4 9
a. Ari tbwtic means shorn f m eight a. Ari thwtic mane s b r n f m eight .am@. diwtricts d W e distr ictd md lor the whale ssmple. for tho h o l e s m l e .
~ e e a r Records of borrowrn of ths RIA. Somcas: bcords of bxrowra of the Ryl.
Table C9.--Cmp Salsa rrd Imen* C i n s v p s per F u m on 36 Vegutahle a d Ruit F u u i n 111mli. 1947..
Location
H a d i Vololun, .nd usmaad
Kountdn V i e w
KOM
Wlui Olllrda
omaopio
oatnr
Kaul
Wisc. d i s t r i c t s
A l l faras
1 - n w TAM uvp chang.. of nl.. .ad
mffee crop. -.
a. h i t h m t i c nsane shorn f m eight a@* district. and for ths tbse -1..
Source.: Rscorda of borrowrs of tbs I11\.
200 ' DIVERSIFIED AGRICULTURE I N HAWAII
Table C10.-Farm Returns per F a n on 96 Vegetable a d Mt Fsnne i n kvaii, 1947.'
location
B . d voleup a53 chv2d
bun ta in Visv
XOM
Wlui Olinda
h w p i o
Oaho
KauAl
Wsc. d i s t r i c t sb
A l l f u a s
Farm.- L l ~ b 0 t h . I stock Products
a. A r i ~ t i c means shorn for eight smple d i s t r i c t s end for the whole smple.
Sources: Records of borrowrs of the FXi.
Table C11.-Data on Aom Roduced food per Farm for 36 Vegetable and Frui t Farms i n Ilamii, 1947.a
Location
Roas produced food
Pam d u e Retail d u e
Doll u s
161 219
104 139
zn 3 2
368 490
242 323
194 258
392 522
2W 321
232 309
Furchased focd
Dollars
889
859
n 4
1108
898
9%
683
675
887
a. A r i ~ t l e means shown f m eight mampla d i s t r i c t s md for the vbolo sample.
Sourmsr Records of borrowrs of the FH4.
Tab
le C
12.-
-Coa
ts
pr
Fu
m o
n 36
Veg
atab
le a
nd R
yit
Fam
a in
Bav
aii,
19
47.'
-
Lir
asto
ck c
ost
a E
qu
ipm
nt
ws
ts
Hir
ed
H
isca
llan
sou
s m
ats
Lo
utl
on
C
mP
m
mt.
oth
er
lab'
~m
pror
amen
t,
Ren
t,
lntw
ea
tb :zz
Fe
ed
Oth
m
'YN2
T
ract
or
mac
hine
ry
dep
reci
atio
n dF
br
uti
liti
es,
an
d t
oo
ls
ud u
pkee
p In
~u
nn
oe
,etc
.
lhlm
il
Vo
lcu
n a
nd G
lenw
cd
uovn
taln
viw
Kam
'
Do
llar
s
a.
Ari
thm
etic
man
e sh
own
for
eig
ht
sam
ple
dis
tric
ts a
nd f
or
the
vhole
sam
ple.
b.
Cq
uts
d a
t a
rats
of
5 p
rce
nt on dl
aess
ta u
aed
in t
he
fm
bu
sin
ess.
Sou
rces
: R
awrd
s o
f b
crro
wre
of the FHA.
202 DIVERSIFIED AGRICULTURE I N HAWAII
Ihval i Voluoo ud Glen-
I(ouat.in VIW
bar
Wui Oil*
~ o p i o
Oahu
Kaul
Mac. d i s t r i c t s
A l l f u a u
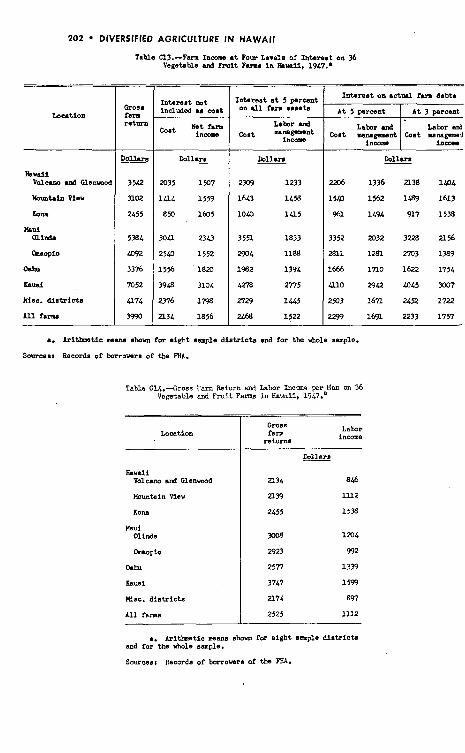
Table Q3.-Farm Income a t Pour Levels of In tams t on 36 Vegetable md R'ult Fuau I n h v a i i , 1947..
- -
Gross farm m t m
- Dollars
3542
no2
2455
5384
4cQ2
3376
7052
4374
3990
I*rnst at I*rsst on actrul f n debts
Intarnet m t lnclvded -6 cost On A t 5 ~ r c e n t 1 A t 3 ~ r c e r l t
Labor ud Net f n Labor a d Labor and in- Cost m"went Cost m a n a w n t C o m t MMBWBII
Income inecms ioccad
a. A r i ~ t l c means shovn for eight sample districts and for the d o l e sample.
S m c e s t Records of tarrovars of the FHA.
Table ell+.--Gross Vegetable
Pam Return am3 am3 Frui t F m s
hbor Incm per 1 . h i n Hawaii, 191+7.'
Location
Bawaii Volcano and Glenvwd
Hountain View
KOM
mui Olinda
~ a o p l o
OatN
buai
Kisc. d i a t r l c t s
A l l rams
Gross fm Labor
returns Income
Dollers
846
1112
1538
1204
992
1339
1599
897
111 2
a. A r i h t i c maas show for eight ample d i s t r i c t s and for the vhole ample.
Sources: Records of bcolowrs of the FHA.
APPENDICES 203
Table U5.-Family Incmu, Living Costa, and Saving6 p r Farm, on 36 Vegetable 4 M t FMS i n HaYILIi, 1947.5
Intenat on actual farm ud ha. debt. at 5 pr-ot
a. Arithmetic means shorn for eight ample d i s t r i c t s and for the whole sample. b. Includas a l l cnsh l iving expanses, cost of using car or truck for nowtusiness ptn-poses, depreciation
and upkep of duelling and household assets, and interest on portion of total indebtedmas charged to nowfarm 118Bets.
Sources: Records of b r r o w r s of the FHA.
appendix VEGETABLE L A B O R NEEDS, I) COSTS, A N D R E T U R N S
The amount of l a b o r used t o produce most vege- t a b l e s i n t h e t e r r i t o r y i s much higher than i n the mainland United S t a t e s . I n 1943 and 1944 l a b o r requirements per a c r e f o r four important vege tab les were g r e a t e r i n Rawaii than on t h e mainland by t h e following percentages: 119 percen t f o r head cabbage, 136 percent f o r snap beans, 200 percent f o r green corn, and 325 percent f o r l e t t u c e (Table D l ) .
The d i f f e r e n c e between I s l a n d and mainland l a b o r requirements was l e s s pronounced p e r pound of vege- t a b l e s produced. It amounted t o 81 percen t f o r beans, 110 percent f o r head cabbage, 125 percent f o r green corn, and 186 percent f o r l e t t u c e . How- e v e r , p e r acre y i e l d s under the i n t e n s i v e c u l t i v a - t i o n methods of' t h e t e r r i t o r y a r e genera l ly h igher than those on the mainland. (See r e f . 6 , p. 2.)
204 DIVERSIFIED AGRICULTURE I N HAWAII
This exp la ins the b e t t e r showing of Hawaiian growers on a p e r pound b a s i s than on a p e r a c r e b a s i s .
A s tudy of c o s t s and r e t u r n s of growing win te r tomatoes was made on 1 0 p l a n t i n g s i n the seasons 1946-47 t o 1948-49. The average l a b o r employed on a l l sample f i e l d s was 497 man hours p e r ac re .
I n c o n t r a s t t o t h i s h igh l a b o r inpu t , t h e amount of t r a c t o r use was low. The average number of hours of t r a c t o r work was 17.5 p e r acre . One farmer d id not use a t r a c t o r a t a l l , while another operated h i s a t t h e r a t e of 27 hours p e r ac re . T r a c t o r s were p r i m a r i l y employed f o r plowing the s o i l before p l a n t i n g . A l l growers but one used a t r a c t o r f o r t h a t operat ion. Only four fa rmers did any machine c u l t i v a t i n g .
A l l tomato p l a n t i n g s were m a l l i n s i ze . Five of the 1 0 p l a n t i n g s were on 0.25 a c r e s , th ree on 0.75 a c r e s , one on 1 a c r e , and one on 1.75 a c r e s .
Grower r e t u r n s and c o s t s were on a n f .o .b. road- s i d e b a s i s , picked but n o t packad. Gross farm re- t u r n s pe r average a c r e y ie ld ing 12,400 pounds of marketable tomatoes were $1,828. T o t a l c o s t s in - c luding a charge of $397 f o r fami ly l a b o r a t t h e r a t e of $.80 p e r hour, were $681. The d i f f e r e n c e between g r o s s farm r e t u r n s and c o s t s , the farm management income, was $1,147 p e r ac re . The farm management income p l u s the charge made f o r l a b o r averaged $ 1 544 p e r ac re . (See r e f . 3, pp. 6, 10, 15, and 22.3
Labor a a s by f a r the l a r g e s t c o s t item--58 per- c e n t of a l l c o s t s (Table D2). I n s e c t i c i d e s and fung ic ides c o n s t i t u t e d the second most important expense, o r 18 percen t of t o t a l c o s t s . F e r t i l i z e r s mounted t o 10 p e r c e n t , and a l l o t h e r c o s t s in- c lud ing equipment use , water , r e n t , and i n t e r e s t , t o 1 4 percent of t h a t o t a l .
These Hawaiian w i n t e r tomato r e c o r d s were con- pared wi th 1 0 unpublished win te r tomato records f o r the 1949-50 season c o l l e c t e d i n San Diego county, Ca l i fo rn ia . I f I s l a n d tomato growars should decide t o export t o t h e mainland dur ing the win te r , they would havs t o compete d i r e c t l y wi th these C a l i f o r n i a farmers.
The tomato p l a n t i n g s of t h e San Diago farmers were much l a r g e r than those of t h e Hawaiian growers. They ranged from 2 t o 20 a c r e s p e r farm, averaging about 9 ac res . Average y i e l d p e r a c r e was 52,200 pounds, o r more than f o u r t i n e s a s h igh a s t h a t of I s l a n d farms.
T o t a l c o s t p e r pound of tomatoes averaged 7.23
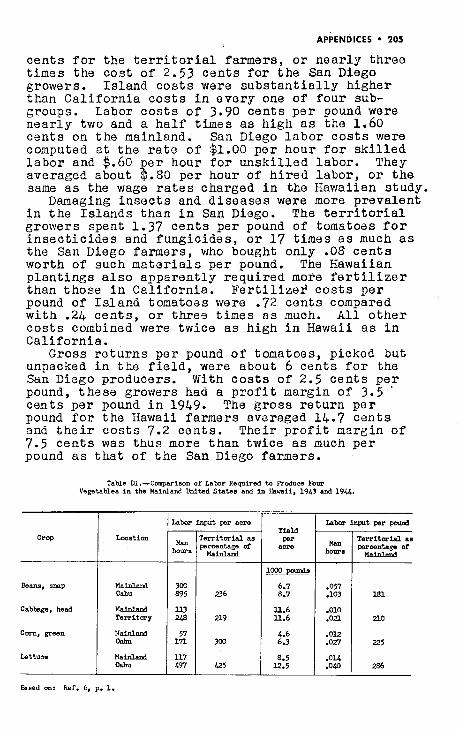
APPENDICES 205
c e n t s f o r the t e r r i t o r i a l farmers, o r n e a r l y th ree t imes the cos t of 2.53 c e n t s f o r t h e San Diego growers. I s l and c o s t s were s u b s t a n t i a l l y higher than C a l i f o r n i a c o s t s i n every one of f o u r sub- groups. Labor c o s t s of 3.90 c e n t s p e r pound were n e a r l y two and a h a l f t imes a s h igh a s the 1.60 c e n t s on t h e mainland. San Diego l a b o r c o s t s were conputed a t t h e r a t e of $1.00 p e r hour f o r s k i l l e d l a b o r and G.60 e r hour f o r u n s k i l l e d l abor . They averaged about 5.80 p e r hour of h i r e d l abor , o r t h e same a s the wage r a t e s charged i n the Hawaiian study.
Damaging i n s e c t s and d i s e a s e s were more prevalent i n t h e I s l a n d s than i n San Diego. The t e r r i t o r i a l growers spent 1.37 c e n t s per pound of tomatoes f o r i n s e c t i c i d e s and fung ic ides , o r 1 7 t imes a s much a s the San Diego farmers , who bought only .08 c e n t s worth of such m a t e r i a l s pe r pound. The Hawaiian p l a n t i n g s a l s o apparen t ly requ i red more f e r t i l i z e r than those i n Ca l i fo rn ia . F e r t i l i z e f c o s t s p e r pound of I s l a n d tomatoas were .72 c e n t s compared w i t h .24 c e n t s , o r th ree t imes a s much. A l l o t h e r c o s t s combined were twice a s h igh i n Hawaii a s i n Ca l i fo rn ia .
Gross r e t u r n s p e r pound of tomatoes, picked but unpacked i n t h e f i e l d , were about 6 cen t s f o r the San Diego producers. With c o s t s of 2.5 c e n t s p e r pound, t h e s e growers had a p r o f i t margin of 3.5 '
cen t s pe r pound i n 1949. The g r o s s r e t u r n p e r pound f o r t h e Hawaii farmers averaged 14.7 c e n t s and t h e i r c o s t s 7.2 c e n t s . Their p r o f i t msrgin of 7.5 c e n t s was thus more than twice a s much p e r pound a s t h a t of t h e San Diego farmers.
Table El.-Comparison o f Labr Required to Roduce Four Vegetables i n the Hainland United States and in Hawaii, 1943 and 1 9 4 .
Crop
Beana, snap
Cabbage, head
Corn, green
Lettuce
I input per acre
Mainland 57
Based on: Ref. 6 , p. 1.
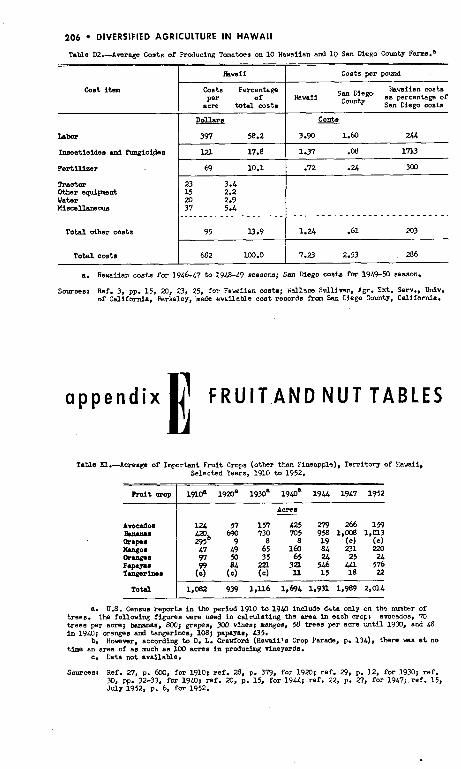
206 DIVERSIFIED AGRICULTURE I N HAWAII
Table D2.-Arerage Costs of Roducing Tcmatoes on 10 Havaiian and 10 San Mego County F s r m ~ . ~
cost item Coats Percentaa Havaiian coats ~ a v a i i S ~ 2 i ; g o a. percentage of
acre total costs San Ciego costs
Total other coats 95 U .9 1.24 .61 203
I Total costs 682 lW.O 7.23 2.53 286
a. Raveiian costs for 19L647 to 19&L9 seasons; San mego coats for 1949-9 season.
Sourcesl Ref. 3, pp. 15, 20, 23, 25, for Fsveiian costs; iiallsca Sullivan, A g r . 9xt. Serv., Univ. of California, brkeley, made aMilhhle cost records frm San Ciego County, Cdjfornis.
a p p e n d i x 1 F R U I T A N D N U T T A B L E S
Table El.-Acreage of Lmpcrtant Ruit Crops (other than Pineapple), Territory of Hawaii, Selected Years, 1910 to 1952.
Mt crop l9loa 1 9 a a 1930' 1940' 1 9 U 1947 1952
e. Amcddos 124 57 157 425 279 266 159 huulu ~ 2 0 690 730 705 958 1.008 1.013 *ape ~ 9 5 ~ 9 8 8 19 ( 4 (0) -0. L7 L9 65 It0 84 231 220 w-6- 97 50 35 65 24 25 24 P W 99 84 221 321 546 16 576 Tangerima (c) (0) (c) U 1 5 18 22
Total 1,OBZ 939 1 , U 6 1.694 l r 9 Y 1,989 2.014
a. US. Census r e p r t s in the period 1910 to1940 include data only on the numter of trees. The follovlng figures vere used i n calculating the area i n each crops avocados, 70 t r ees per acre; tamma, 800; grapes, 300 vines! mangos, 58 t rees p r acre un t i l 1930, Md LB i n 19LO- oranges and tangerines. 108; papayas, 435.
b: Hobever, according to D. I. Cravford (Ravali's Crop Parade, p. 13L). there was a t no time an area of as much am 100 acres i n producing vineyards.
c. Data not available.
S-cssr Ref. 27, p. 600, for 1910; ref. 28, p. 379, for 19h); ref. 29, p. 12, for 19M; ref . 30, pp. 32-33, for 1940; ref . XI, p. 15, for 19% ref. 22, p. 27, for 1947; ref. 15, July 1952, p. 6, for 1952.
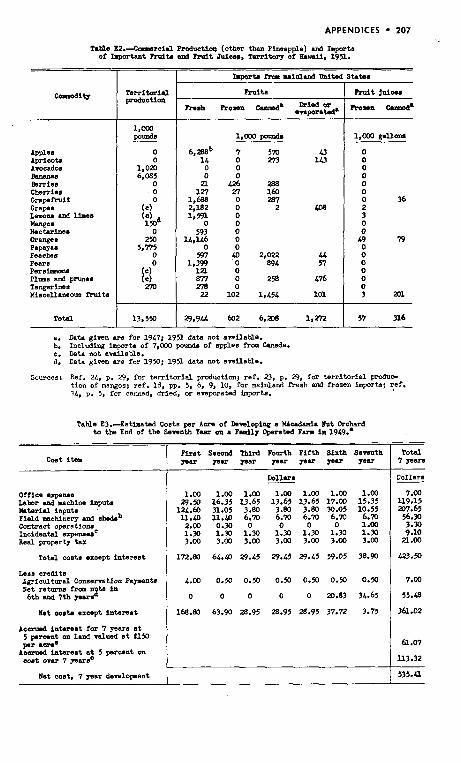
APPENDICES 207
Table E 2 . a r c i . l Production (other than Pineapple) and Import0 of Impartant Prrrit. d ?rult Jtrtcar. T e r r i b r ~ of 8.4. 195l.
a. Data g iwn sre for 19471 1 9 2 data not availebla. b. Including imports of 7,000 pn'uis of apples f i r m Canada. c. Dsta not available. d. Data g i w n are for 1950; 1951 data not available.
Sources: P.ef. 2.4, p. 29, for t e r r i t a r i a l productionj ref. 23, p. 29, for t e r r i to r i a l produ* tion of mangos; ref. 18, pp. 5, 6, 9, 10, for mainland fresh d frozen imports; ref. 7.4, p. 5, for canned, dried, or ewporatad imports.
Table E3.-Esthatad Coats psr Acre of Developing a M u d d a I b t O r c v to the End of the Sersnth Tsar on a Paall? gemtad Farm in 1949.
Office erpsnsa Labor mrd vlchine inputs Materid inputs N ~ M laacbinery and a ~ s b Cantmct operations ~nc iden t r l erpsnsesC Real property tux
TOW costs except i n t e n s t
Less credi ts Agrint l tmal Consemtion Payments Net ntm f rca nab In 6th mrd 7th pus
Ilwt coat. wxcwpt in ta res t
Net oost. 7 par dewlapen t
- Total
7 7--
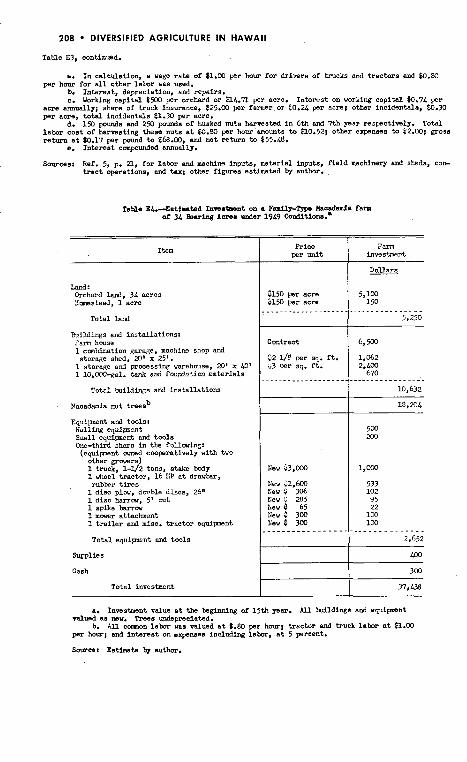
208 DIVERSIFIED AGRICULTURE IN HAWAII
Table E3, continued.
a. I n calculation, a wage r a t e of $1.00 per hour for d r l w r s of trucks and t ractors and $0.80 per hour for all other labor was used.
b. Interest depreeletlon, end repairs. c. iiorking !capital SYX) per orchard or d1L.n per acre. I n t e n s t on working capital 80.7L per
acre m u a l l y ; share of truck insurance, $25.00 per farmer or (0.24 per acre; other incidentals, W.30 per acre, t o t a l incidentals 11.M per acre.
d. 1 % punds and 2% pounds of husked nuts herrestad i n 6th and 7th year respectively. Total labar cost of harvesting these nuts a t k7.S per hour mounts to $10.52; other expensas to $2.00; grcss return a t 60.17 per pound t o $68.00, and net return to $55.48.
e. Interest compounded annually.
Sources: Ref. 5, p. 21, for l a t a r and machine inputs, material inputs, f i e ld mechlnery and sheds, c o b t r a c t operations, and h x ; other figures estimated by author.
Land: Orchard Land. 34 acres H-stead, 1 acre
Total land
Buildings and installations: Farn house 1 canhination garage, machine shop and storage shed, 2Q' x 25'.
1 storage and processing warehouse, 23' x LO' 1 10,000-gal. tank and f d n t i o n materials
Tottil Lwildlngs and instal la t ions
Macadamia nut treesb
Equipant and tools: Hulling equipnent Small equipnent and tools Gne-third share in the follouingr
( q u i p e n t owned cooperatively with two other grarers) 1 truck 1-l/2 tons, stake body 1 wheel'tractor, 16 HP a t drawbar. r u b k r t i r e s
1 disc p l w , dmhle discs, 26" 1 disc harrw, 5' cut 1 spike W r w I mover attachment 1 t r a i l e r and nisc. t ractor equipent
Total equipnent and tools
Cash
Total investncnt
R i c e per uni t
Contract
02 l/* per sq. f t . ~3 per sq. f t .
New r1.600 New $ 306 Nev : 285 New $ 65 Nev $ 300 1;ew S 300 - - - - - - - - - - - - - - -
a. Inwstrment value a t the beginning of 15th year. All Lulldings and equipnsnt ralued as mw. Trsas deprec ia t ed .
h. A 1 1 c-on labor was valued a t 6.80 per houri trector and truck labor a t $1.00 per hour; and in te res t on elpeMES including labor, a t 5 percent.
Sourwr E a t h t a by author.
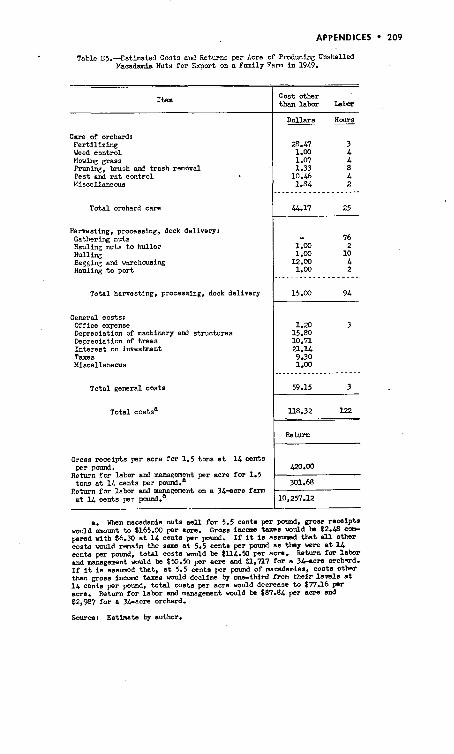
APPENDICES 209
Table E5.4stimnted Costs and Returns per Acre of Pmducine Unshelled Macadamia Nuts fo r Export on a Family Farm i n 1949.
Item
Care of orchard: Fert i l iz ing Weed control Nowing grass Runing, brush t rash ranoval Pest and m t control Miscellaneous
Total orchard care
Harvesting, processing, dock delivery: Gathering nuts Hauling nuts t o huller Hulling Bagging and warehousing Hauling t o port
Total harvesting, proeesaing, dock delivery
General costs: Office erpense Deprecistion of machinery an3 structures Depreciation of t r ees Interest on invesbent Tams Miscellaneous
Total general costs
Total costsa
Gross receipts per acre for 1.5 tons a t 1 4 cents per p h .
Return fo r labor mx? management per acre for 1.5 tons a t 14 cents per p d . "
Return for labor and management on a 34-acre farm a t 14 cents per pod . "
:oat other than labor labor
Dollars Houra - -
Return
a. When mscadsmia nuts s e l l for 5.5 cents p r pcund, gross r ewip ta would mount to b165.W pr acre. Gross incam t sxsa wuld b $2.48 a n - pared with 56.30 a t 1L cents per pour& I f it i s assumed tha t all other costs wuld remain the same a t 5.5 cents p r pound as they =re a t 1 4 eenta per pound, t o t a l costs vould b (llL.50 per acre. Return for labor and management would be $59.50 p r acre and $ l , n 7 for a 34-a- orchard. I f it i a assrnned that, a t 5.5 cents per p o d of macadamias, costs other than gross income taxes wuld decline by one-thLrd from t he i r l e m l s a t 1 4 cents p r pound, tatal costs per acre would decrease to Sn.16 per acre. Return for labor and management would te 987.8L p r acre and $2,987 for a 344cre orchard.
sourwr Estinate by author.
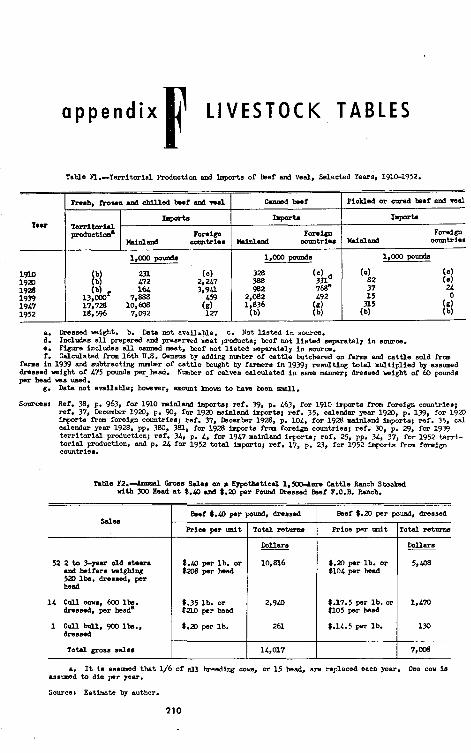
a p p e n d i x L I V E S T O C K T A B L E S
'able F1.-Territorial Reduction and Imports of k f and Veal, Selected Years, 1910-1952.
m s h , -own llld chilled b..? ad wal Mlmd Lwf Pickled or emsd Lwf and veal - I.port. - T d t m i r l ~ c t i ~ Foreign Foreign Foreign
cormM*. Wrinl.nd countries )lainland cormtries
a. Dressed wight . b. Data not available. C. Not l i s t ed i n source. d. Includes all prepared end ~~~~~~~d m a t products; beef not l i s t e d separately i n source. e. figure includes all canned meat, beef not l i s t e d separately i n source. r. Calculated from 16th U.S. C e n m by a d d i r ~ umber of ca t t l e butchered on farms and ca t t l e sold frm
f m s in 1939 and subtsacthg m b e r of ca t t l e bought by farmers i n 1939; resul t ine t o m multiplied by assumed dressed weight of L75 pounds p e r bead. Nmber of ca lms calculated i n same manner# dressed w i g h t of 60 pounds per head vas u&.
g. Data not available; hoveper, mount b o w to have been a.
Sources: Ref. 38, p. 963, for 1910 d n l m d impo~tsi ref. 39, p. 463, for 1910 lmpr ta fro. fmeign countries; ref. 37, December 1920, p. 90, for 1920 mainland imprta; ref. 35, calendar p a r 1920, p. 139. for 1920 l m p r t s fim foreign countrtee; ref. 37, Deoembr 1928, p. 101, for 1928 aainland imports; ref. 35. cal calendar year 1928, pp. 380. 381, for 1928 inports flwa foreign countries; ref. M, p. 29, for 1939 t e r r i to r i a l productioni ref. 34, p. L. for 19L7 mainland Imports; ref. 25. pp. 3L, 37, for 1952 t e r r i - t o r i a l production, and p. 24 for 1952 total inpmts; ref. 17, p. 23, for 1952 Imports from foreign countries.
Tahle F2.-Anraal Cmss W e e on a Eypo+htical 1.500-lon Catt le Ranch Stocked vith MO Head a t a.40 d 1.P per P d Dressed Beef F.O.B. Ranch.
Besf 1.40 per p o d . dressed Beef 6.20 per pound, dressed Sales
Prio. per d t Total ret- R i c e p r d t Total retmnn
52 2 t o 3 - p ~ ~ old atsera laa b.1f.r. usighin(l 5X) lbs . dreaeed, per head
1 4 Crrll cows 6W lb. dressed, &r heada
1 cull bull, 900 lbu., dressed
Total gross sales
6.w per lb. or $208 par heed
1.35 lb. or $210 per head
t.20 per lb.
$.a per lb. or $lOL per bead
6.17.5 per lb. or $105 per head
t.lL.5 psz lb.
a, It I s assmad tha t 1/6 of all breeding cam, or 15 head, sla replaesd eacn year. One cow i s assmed to die per p a r .
Source: Ea tha te by author.
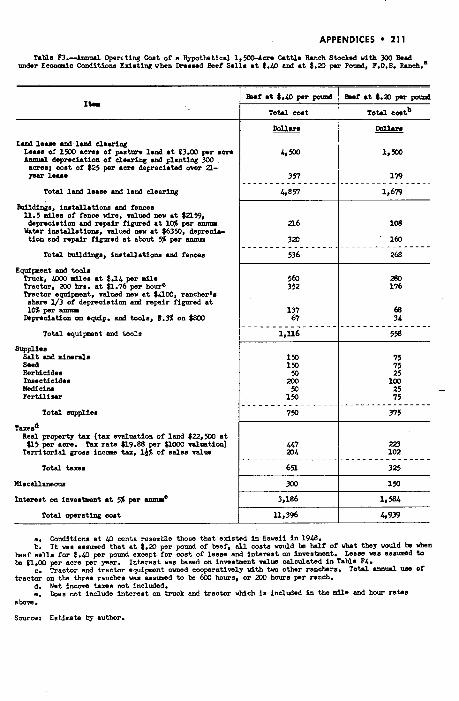
APPENDICES 21 1
Tahle ?3.-Annual Opereting Cost of s Hypothetical 1,500-Acre Cattle Ranch Stoohd d t h 300 Eed under EconcPic Conditions Edat ing vhen h a s & %sf Se l l s st 6.40 and a t $.a pr P o d , P.O.B. h c h . '
L h d 1eMa hd lhd ale- b m e of lm acres of pnstme I d a t $3.00 per a m lmnul d e p n d a t i o n of elearlng and pinning 300
acrae; m e t of $25 p r acre depreciated o w r 2l- pu l e u .
Total 1 4 lease and land clearing
EUU~~&, i lutal la t iona m x ~ fence. U.5 miles of fence wire, valued new a t
depnciat ion hd npdr flgumd a t 10% per annrn Water instal la t ions, rrlued new a t $6350, deprecla- t ion 4 nplr figured a t about 5% p r anm
Total buildings, installat10110 hd fences
E q d p e n t hd t w l r huck, LOOO a i l e s a t b.14 p r mlle Tractor. 200 hrs. a t Q.76 p r hourc Tractor equipment, valwd mw a t $000, rancher's
sham 113 of depreolrtion and repair figured a t 10% pr a-
h p c f a t i o n on equip. d tool., 8.3% on #a03
Total s q u i p n t and tools
Total mppllee
T-S~ Real propart7 tax (tax maleation of land 622.W a t $l5 per acre. Tax r a t e a9.88 par QWO n lea t lon)
Terr i tor ial cross inccas tar. 1s of sslse valm
Total operating coat
a. Conditions a t LO cents reaemhle those that exlsted In Hawaii i n 19.48. b. It was assumd that a t 1.20 per pound of teef, a l l costs wuld t a half of vhat they wuld b vfisn
teef s e l l s for t.40 par pound except for cost of lease Md interest on inws tmnt . b a n e vas asslnaed t o t a (1.00 par acre p r par. Interest was based on invnstuent value d c u l a t e d InTahle F4.
E. lkaotor and t ractor e q u i p n t ovmd coopsrativsly d t h t w other ranchers. Total annual um of t ractor on the three ranches was assumed t o t a 623 hours, or 200 hours par rmch.
d. Net income taxaa not included. e. Doss not include Interest on truck and t ractor vhich i s included i n the mile and hour r a w s
abow.
Source: Estimate hy author.
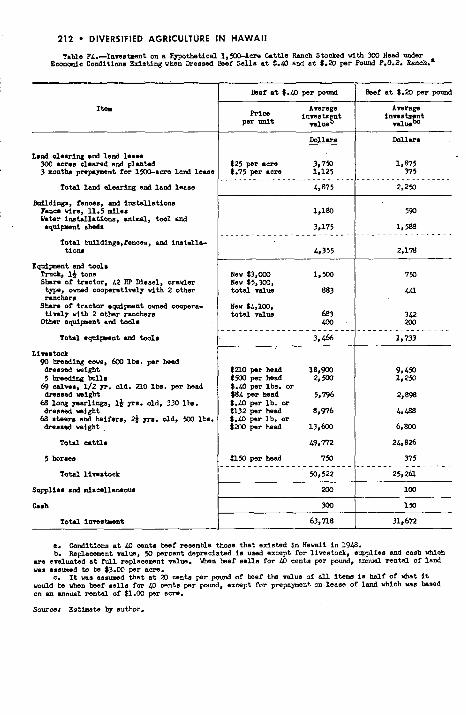
212 DIVERSIFIED AGRICULTURE I N HAWAII
Table F4 -1nvwstratnt on a Hypothetical 1 , W A c r e Cattle Ranch Stocked vith 300 Read under Economic ~ o i d i t i o n s Eds t ing vhen Dressed b e f Sel la a t 5.40 and e t 5.20 per Po& F.O.B. ~anch.'
L u d alearing ud land 1e.m 100 .ens cleared and planted 3 montb p m p a p n t fo r 1%-am l a d lease
Total land clearing aad land laaae
h i ld inga , fences, a d instal la t ions Pence v im, 11.5 miles Water instal la t ions, animal, tool md e q u i p n t shed.
Tota l bdldings,fenwa, wad ina ta l l sc t i o m
E q n i p n t and tool8 Truck, 1* tons Sbma of tractor. 42 W Mesel, crawler tm, owned c o o p n t i w l y v l th 2 other rancher. S b of t ractor e q u i p n t o d c w p r a -
tivwly vitb 2 other ranchers Other equipant and tools
Total eqn ipsn t and tools
Linatock 4, h e d i n g cow, 633 lb. per head dressed migh t 5 h e d i n g boll.
69 d n s , 1/2 w. old. a0 lbs. p r head dmsead winh t
68 long p X w s . i+ p. OM. 330 ibs. dresaed w i g h t
68 steers aad heifers, 2& y ~ s . old. XY) lbs. dressed wigh t ,
Supplies and mlacellansoua
Total ima.taeat
b e f a t 6.N per PO-
Avwrage Rice inps tm n t
per uni t nlwg
625 per acra 3.750 6.75 pr acre 1,125
-..----..------.------..-- 4.875
New t3,WO 1,500 Nev $5,303, t o t a l value 883
Nev $4,100. to t a l value 683
400 . - - - - - . . . - - - - - - - - - - - - -
3. LM
$PO per head 18,900 dm pi head 2, K X ) $ 4 per lha. o r S34 w r b a d 5.796 -. -
lb. or a 3 2 wr head 8,976 $.LO per lb . or $ZX p r head 13,600
U50 per head 750 .-.---..-----.---------
50,522
Bsef a t t.20 per pound
a. Conditions a t 40 cents bwf resemble those tha t e d s t a d i n Havail i n 1948. b. Replaeewnt d u e , 50 p r c e n t depreciated i s uaed except for livestock, supplies and cash m c h
ars evaluated a t rull replacement value. Yhen teef s e l l s for LO cents per pound, annual rental of land was asslaad t o b $3.00 per a m .
c. It was aasrmad tha t a t 23 centa per pamd of beef the value of ell items l a half of &at it vould b vhen bsf ael le for LO cents per paund, except for on lease of land which was baed on an annual rental of $1.00 per acn .
Source: E a t h a t s by author.
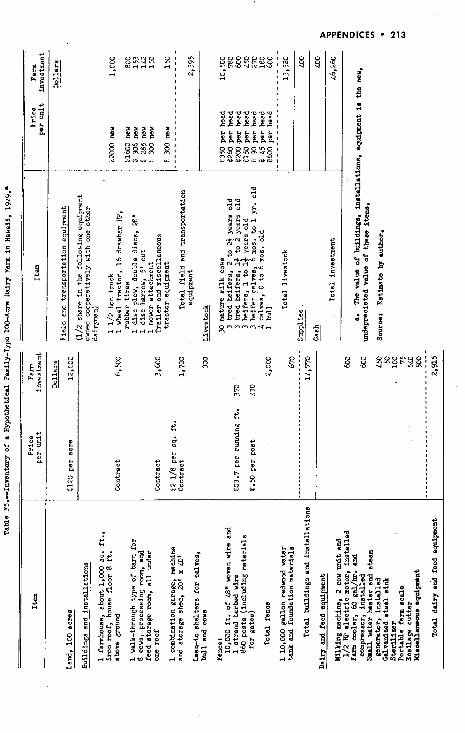
APPENDICES ' 213
a p p e n d i x SOURCES FOR TABLES I N A P P E N D I C E S
1. Adams, Romanzo C. interracial Marriage in Hau'aii. New York: The Mac- millan Co., 1937. 353 pp.
2. Bananar in Hawaii. Univ. of Hawaii, Agr. Studies 5. Honolulu: 1927. [4] pp. 3. Cady, H. B. Cost Factors in the Production of Hawaiian Winter Tomatoes. Univ.
of Hawaii, Agr. Ext. Cir. 273. Honolulu: 1950. 31 pp.. mimeo. 4. Crawford, David L. Hawaii's Crop Parade. Honolulu: Advertiser Publishing
company, 1937. 305 pp. 5. Elliott, Ralph C. Economic Possibilities of Macadamia Nuts as a Hawaiian Crop.
Univ. of Hawaii, Agr. Ext. Cir. 248. Honolulu: ,1948. 33 pp., mimeo. 6. - and Herbert Hiroshige. Man Hours Required to Produce Certain Vege-
tables. Univ. of Hawaii, Agr. Ext. Cir. 179. Honolulu: 1945. 7 pp., mimeo. 7. Hanson, Kenneth I., and Kenichi Murata. Summary of Shipments of Fruits and
Vegetables from Hawaii to the Mainland, 1931-1938. Univ. of Hawaii, Agr. Ext. Cir. 3. Honolulu: 1939. 17 pp., mimeo.
8. - - Summary of Shipments of Fruits and Vegetables from Hawaii to the Mainland, 1940. Univ. of Hawaii, Agr. Exr. Cir. 110. Honolulu: 1941. 12 pp., mimeo.
9. Hawaii (Kingdom). Board of Education. Census of the Hawaiian Islands, 1832- 1896. Honolulu.
10. Hawaii (Terr.). Board of Health. Civilian population estimates for April 1, 1940, July 1, 1948, and July 1, 1952. Honolulu.
11. - Territorial Planning Board. A n Historic Inpentory of the Physical, Social and Economic, and Indu~rrial Resources of the Territory of Hawaii. First Progress Report. Honolulu: 1939. 322 pp.
12. Ishida, Jack T. Production and Marketing of Fresh Vegetables in Hawaii. M.S. thesis, Univ. of Hawaii. Honolulu: 1947. 141 pp., typed.
13. Magistad, Oscar C., and T. 0. Frazier. Production and Marketing of Truck Crops in the Territory of Hawaii. Univ. of Hawaii, Agr. Exp. Sta. Bull. 78. Honolulu: 1938. 46 pp.
14. Shoemaker, James H. The Economy of Haulaii in 1947. . . U. S. Bureau of Labor Statistics. Bull. 926. Washington: 1948. 214 pp.
15. University of Hawaii. Agr. Ext. Serv. The Agricultural Outlook. (See December 1951 and July 1952.)
16. - - 1947 Honolulu Unloads, Shipments, and Wholsale Prices of Sperifed Agricultural Products. Agr. Ext. Cir. 237. Honolulu: 1948. 48 pp., mimeo.
17. - - 1912 Honolulu Unloads of Fruits, Iregetables and Livestock Prod- ucts. Agr. Econ. Report 14. Honolulu: 1953. 25 pp.. mimeo.
18. - - 1911 Market statistic^. Agr. Econ. Report 10. Honolulu: 1952. 57 pp., mimeo.
APPENDICES 215
19. - - 1945 Statistics of Divers$ed Agritulure in Hawaii. Agr. Ext. Cir. 199. Honolulu: 1946. 28 pp., mimeo.
20. - - 1946 Statistics of Diversified Agriculture in Hawaii. Agr. Ext. Cir. 217. Honolulu: 1947. 35 pp., mimeo.
21. ------ - 1947 Statistics of Diversifid Agriculture in Hawaii. Agr. Ext. Cir. 241. Honolulu: 1948. 38 pp., mimeo.
22. - - 1948 Statistics of Diversified Agriculture in Hawaii. Agr. Ext. Cir. 263. Honolulu: 1949. 43 pp., mimeo.
23. - - 19S0 Statistics of Diversified Agriculture in Hawaii. Agr. Econ. Report 7. Honolulu: 1951. 45 pp., mimeo.
24. - - 1951 Statistics of Diversified Agriculture in Hawaii. Agr. Econ. Report 11. Honolulu: 1952. 46 pp., mimeo.
25. - - 1952 Statistics of Diversified Agriculture and Market Receipts in Hawaii. Agr. Econ. Report 16. In preparation.
26. U. S. Bureau of the Census. 12th Census of the United States: 1900. Washington: 1902. (See Vol. 11; ccxxiii and 754 pp.)
27. - 13th Census of the Unitedstates: 1910. Washington: 1913. (See "Abstract of the Census . . . with Supplement for Hawaii"; 625 pp.)
28. - 14th Censu of the United States:. 1920. Washington: 1922. (See "Agri- culture," Vol. VI, part 3; 423 pp.)
29. - 15th Census of the United States: 1930. Washington: 1932. (See "Out- lying Territories and Possessions"; 338 pp.)
30. - 16th Census of the United States: 1940. Washington: 1942. (See "Agri- culture, Hawaii"; 42 pp.)
31. - 16th Census of the United Statec 1940. Washington: 1942 (See "Areas of the United States"; 465 pp.)
32. - 16th Census of the United States: 1940. Washington: 1942. (See "Popu- lation," Vol. I; 123ipp.)
-
33. - U. S. Census of Aariculture: 1950. Washington: 1952. (See Vol. I. part . - - . - 34, chapter 4, "Hawaii"; 45 pp.)
34. - United States Trade in Merchandise and Gold and Silver with the United States Territories and Possessions: 1947. Report FT 800. Washington: 1948.
35. U. S. Bureau of Foreign and Domestic commerce. Foreign commerce and Navi- gation of the United States. Washington. (See 1920, 1928, 1939.)
36. - Monthly Summary of Foreign and Domestic Commerce. Washington. (See December 1919, 1929.)
37. - Monthly Summary of Foreign Commerce of the United States. Washington. (See December 1920, 1928, 1939.)
38. U. S. Bureau of Statistics. Monthly Summary of Commerce and Finance of the United States: December, 1910. Washington: 1911.
39. - The Foreign Commerce and Navigation of the United States for the Year Ending Jane 30, 1910. Washington: 1911.
40. U. S. Civil Aeronautics Board. Exhibits of Trans-Air Hawaii Limited. CAB Docket 2859. 1948. 167 pp., mimeo.
41. U. S. Congress. House. Committee on the Territories. Statehoodfor Hawaii. Hearings, 79th Congress., 2d. sess., H. Res. 236. Washington: 1946. 909 pp.
Access roads, 136 acreage: agricultural crops 13-14, t. A2;
coffee, 60, 113-114, 116, t. A2; field corn, 60, 127-128, t. A2; fruit, 60, 92-94, t. A2, El ; macadamia nuts, 61, 103-104, t. A2; pasture, 13-14,16-17, 134-135, 137, t. A2, A3; rice, 60, 126-127, t. A2; tomatoes, 204, t. B6; vegetables, 60, t. A2, B6, B9; vege- table and fruit farms, 75-77, 181- 182, 186, 192, t. B9, C3. See also farm size, production area and location
advertising. See promotion age, vegetable and fruit farmers, 182-
183 Agricultural Conservation Program. See
U.S.. Production and Marketing Ad- ministration
Agricultural Extension Service: 24-25; coffee, 114; ranching, 135; rice, 127; vegetable and fruit sample farms, 183
anthuriums, 61, 121-123, 125. See also floral products
armed forces: affected by federal policy, 5: effect onHawaiian economy, 2,164: employment, 3-4; garbage, i43-145; land area, 13, t. A l ; payroll, 3; vege- table purchases, 67
artificial insemination, 142 asparagus, 70-71, t. 31-34, 3 6 assets, vegetable and fruit sample farms,
183-186, t. C2-C6. See alsoinvestment avocados: 92-96, 99-102; acreage, 92-
93, t. E l ; commercial production, 92-94, .99-100, t. E2; exports, 99, 161; prices, 99-100, t. B5
Balance of payments, 1-3, 160-161 balanced ranches, 135-136 bananas: 92, 94-96; acreage, 92, 94, t.
E l ; exports, 41, 47, 96, 161, t. B7; history, 38, 40-41, 47, t. B7, E l ; prices, 96, t. B5; production, 92, 94, t. E2; marketing, 131-132, 139
banks, 30, 33-34, 51 barter. See trade beef and beef cattle: 131-139, t. AS,
F1-F5; grazing land, 13-18; history, 40-41, 49-50, 131-132, t. F1; im- ports, 131-132, 139, 160, t. F1; labor, 27; large and small ranches, 134-137; leases and land, 18-20, 132-139; in macadamia orchards, 109; marketing, 131-132, 139; marketings and con- sumption, 131, 160, t. F1; numbers, 40, 49, 61, 131; outlook, 139; planta- tion and factor connection, 58-59; prices, 132,134,138-139; roduction, 131, t. F1; product~on pro!lems, 137- 139; racial origin of ranchers and ranch workers, 22-23, 135; ranch in- vestment, cost, income, 133-134, t. F2-F4; vegetable and fruit farms, 83, 185, t. C4
beekee ing: 155-157; exports of honey and geeswax, 50, 155-156, 161, 166; history, 50, 155; in macadamia or- chard, 110; production, producers, 62, 155-157, t. A4, A5
beeswax. See beekeeping breeding: beef cattle, 136-137; dairy
cattle, 142; poultry, 152-153; swine, 146-147
buildings and installations: cattle ranch, t. F3, F4; dairy farm, 142, t. F5; macadamia farm, t. E4; vegetable sample farms, 184, t. C3
business cycles: 1, 69, 165. See also depression
butter, 49, 139, 140 by-products: cattle, 40, 131; pineapple,
57, 59; sugar, 3, 59, 138, 141, 146, 151; vegetables, 83. See also processed products
California Gold Rush, 40-41 Canec, 3 capital requirements. Set investment
218 DIVERSIFIED AGRICULTURE OF HAWAII
car, 115, 185, t. C5 cash income. See income castor beans, 128 cattle. See beef cattle, dairying Caucasians: beef cattle ranchers, 135;
egg consumption, 147-148; number, 21, t. A7
chickens. See poultry . child labor: coffee, 27, 114; law, 35;
vegetable and fruit sample farms, 78, t. C l
Chinese, 21, 23, 46-48, t. A7 citrus, 39-40, 93-95, t. B5, El, E2 climate: 12-16; beef cattle, 133, 138-
139; coffee, 15, 113; field corn, 128; floral products, 120-123; poultry, 147, 150, 152; vegetable and fruit sample farms, 181, 192, t. C1
coconuts, 110 coffee: 44-45, 112-116; acreage, farm
number, 60, 113-114, 116, t. A2, AS; child labor, 27, 114; dealer credit, 30-31; demand, 112; exports, 44-45, 113, 161; farm costs, 114-115; farm size, 44-45, 113-114; growing dis- trict, 15, 113; history, 44-45, 60, 112-114; interplanting with maca- damia nuts, 109; labor, 27, 114-116; !and, 113-116; markets and market- ing, 113, 115; outlook, 115-116; price, 45, 112-114, 116; racial an- cestry of growers, 22, 113; rainfall, 14, 113; returns, 114; tariff, 45, 112
commerce, history, 39-41 competing areas: avocados, 99-100;
beef and veal, 131; castor beans, 128; coconuts, 110; floral products, 124- 125; macadamia nuts, 105-106; mis- cellaneous crops, 47-48; papayas, 98; rice, 126-127; vegetables, 74-75. See also competing products
competing products: dairy products, 140; floral products, 119, 125; fruit, 92, 95-96, 98-100; macadamia nuts, 106-107, pork, 143-145; poultry products, 147-148, 152-153, 155; vegetables, 67-69, 71-72. See also competmg areas
consumer education. See promotion consumer preference, poultry and eggs,
155. See also food habits consum tion: affected by depression,
165; [eef and veal, 131; dairy prod- ucts, 140; floral products, 117-118; fruits, 95-96, 160; pork, 144;. poultry and eggs, 147-148,155; requirements for increase, 161. See also marketings
containers. See packing and packaging cooperation and cooperatives: 26, 162-
163; beef cattle, 136137; coffee,
115-116; dairies, 142; flowers, 118; poultry, 152-155; swine, 145-146; vegetables and fruit, 86-87, 97. See also industry cooperation and organi- zation
corn, field. See field corn corn, green, 69, 71, 73, t. B1-B7 costs: 161-162; avocados, 100; bee-
keeping, 156-157; cattle ranch, 133- 134, 137-138, t. F3; coffee, 114; floral products, 122-124; macadamia nuts, 107-110, t. E3, E5; papayas, 97-98; pork, 144-147; poultry, 149- 152; rice, 127; tomatoes, 204-205, t. D2; vegetable and fruit sample farms, 77-79, 188-190, t. C12, C13
cotton, 48 credit, agricultural: 30-34, 164, 182;
beef cattle, 136; dairies, 141-142; governmental, 31-34; poultry, 151, 154; private, 30-31, 33; vegetables, 80
credit unions, federal, 31 cropland: 13-18, t. A2, A3; definition,
75, 182; vegetable and f ru~ t farms, 77,82,.183-184, t. B9. See also acreage, farm slze
crop rotation, 84-85, 162 crops, commercially unsuccessful, 48,
61
Dairying: 139-143; cow replacements, 141-142, 160, 162, 166; development and present status, 139-141; farm inventory, 142, t. F5; hired labor, 27; history, 49, 61-62, 139, 140; location, 17, 141-142; milk product~on, 61-62, 139, t. A4; dairy products, 139-140; racial ancestry of farmers and workers, 22; reducing costs, 141-143; by sugar plantations, 58
dealer credit, 30-31 dealer education. See promotion debts, vegetable and fruit sample farms,
186, 190, t. C2, C7, Cl3 demand: coffee, 112; macadamia nuts,
106,161; pork, 143; poultry and eggs, 148. See also outlook
depression: 160, 165; beef cattle, 139; coffee, 114, 116; floral products, 126; honey, 155-156. See also business cycles-
diet. See food habits diseases: 13, 34; bees, 155; flowers, 123;
pineapple, 57; poultry, 34, 150; swine, 147; vegetables, 79, 85, 205
diversification of farm: 162; fruit, 101; swine, 146; vegetables, 83-84. See also specialization
donkeys, 40, GI, t. C4
ducks, 40, 62 dwelling. See houses
Earnings. See income, labor, wages eating habits. See food habits economy of Hawaii: problems, 1-6,
160; vulnerability, 1, 5-6, 165-166 education, agricultural, 24-25, 164 eggs. See poultry employment: 1,3-4; effect of expended
diversified agriculture, 164; resources of farm, 162; seasonal, 27. See also labor
equipment: coffee farms, 115; dairy farm, 142, t. F5; history, 38, 41, 43, 57-58, 78-79; tomato farms, 204, t. D2; vegetable and fruit sample farms, 184-185, 188, t. C2, C5, C12. See also mechanization
escalator clause, 19, 139, 163 ethylene dibromide gas, 96, 99 expansion, diversified agriculture, 160-
161, 163-166 expenses. See costs ex orts: 1-3, 161; avocados, 99, 161;
gananas, 41,47, 96, 161, t. B7; chicks and hatching eggs, 152-153; coco- nuts, 110; coffee, 44-45, 113, 161, 166; depression, 165; early history, 40-41, 43-50; floral products, 61, 117-126, 161, 165-166; fruits and fruit products, 41, 47, 96101, 161, 165-166, t. B7; honey and beeswax, 50, 155-156, 161, 166; lima beans, 161; macadamia nuts, 105-106, 161, 165-166; papayas, 96-99, 161, t. B7; rice, 46, 126; sugar, 40-41, 43; taro products, 72, 161; taxes, 36; trans- portation interruption, 165-166; veg- etables, 40-41, 47, 70-72, 161, 164, 165-166, 204, t. B7; war, 166
Family income. See income family living cost. See living cost family-sized farms: 162; coffee, 113-
114; dairies, 142; macadamia nuts, 104, 107-109, t. E3-E5; oultry, 148- 149; swine, 144; vegeta%le and fruit, 77-78, t. B8, B9, all appendix C. See also farm size
farm costs. See costs Farm Advisory Board, 20, 164 Farm Bureau, 25 farm income. See income farm layout, 89, 146, 152, 162 Farm Loan Board, 33 farm occupancy, fruit and vegetable
farmers, 182-183 farm production for home use: 83-84,
162, 165; vegetable and fruit, coffee
INDEX 219
farms, 77, 114-115, 188, t. C8, C11 farm records, 33, 85, 183 farm returns. See returns farm size: 162; beef cattle, 49, 134-137;
beekeeping, 156; coffee, 113-114; dairy, 140-142; floral products, 117, 120-121; fruits, 94; honey, 156; Ru- leana, 39, 41-42; macadamia nuts, 104, 107, 109; pineapple, 56; poultry, 148-150; rice, 46, 127; sugar, 43, 54; swine, 144, 146; vegetables, 82; vege- table and fruit farms, 75-77, 182, t. B8, B9, C3. See also family-sized farms, acreage
farmer ability, vegetable and fruit sam- ple farmers, 183, t. C1
farmer organizations, 25-26 farms, number of: 63, t. AS; beef cattle,
134-135, t. A5; beekeeping, 156, t. AS; coffee, 113, t. A5; dairies, 140- 141, t. A5; floral products, 117, t. AS; fruit, 63, 75-77, t. AS, B8, B9; macadamia nuts, 104, t. A5; poultry and eggs, 148-149, t. AS; rice, 126, t. A5; swine, 143-144, t. A?; vege- table, 63, 75-77, t. AS, B8, B9
federal policies: 1, 160, 164-165; armed forces, 3, 5, 164; sugar, 5, 55, 165
feed: 160, 162, 166; bulk transportation, 142, 151; dairy cattle, 141-142; emer- gency reserves, 151-152, 166; field corn, 128, 138-139; molasses, 59, 138, 146; pineapple pulp, 59, 138; poultry, 150-152, 154; swine, 145- 146
feeder cattle, 139 fern products, 120, 187 fertilization and fertilizer: 162; coffee,
115: fruit. 101: macadamia nuts. 109: - , rice, 12&12j; vegetables, 83-84; 204-205, t. D2
field corn: 127-128, t. A4; acreage, 60, 127-128, t. A2: as beef cattle feed, 138-139; hi st^;^, 48-49, 127-1283 rotation crop for pasture, 139
Filipinos: on coffee farms, 22, 113; number, 21-22, t. A7
fish, 2 floral products: 116126; anthuriums,
61, 121-123, 125; climate, 116, 118, 120-123; expansion and present sta- tus, 116117; exports, 61, 118-126, 165-166; interplanting in macadamia orchards, 109; markets and market- ing, 117-125; orchids, 61, 118, 125; problems and outlook, 123-126; pro- duction and marketing for local con- sumption, 117-1 18; production areas, 15-16, 117-118, 120-121, 124-125; transportation, 121-126, 165-166;
220 DIVERSIFIED AGRICULTURE OF HAWAII
tropical foliage, 61, 118, 121-123, 125, 165-166; value, 63, 116-119, 122, t. A4
flowers. See floral products foliage, tropical, 61, 118-119, 121, 125,
165-166 f o ~ d ~ c o n ~ u m ~ t i o n on farms, 77, 114-
115, 162, 188, t. C11 food crops, prediscovery Hawaii, 38 food habits: 162; beef and veal, 131;
milk and cream, 49, 140; pork, 144; poultry and eggs, 148; vegetables, 70
food, home produced. See production for home use
food prices. See prices food processing. See processed products
and processing forest reserve, 13-17, t. A1 4-H clubs, 25 freight rates. See transportation fruit flies: 24, 34; floral products, 121;
fruits, 96, 99, 101-102; vegetables, 68, 71
fruits: 92-102, t. A2, A4, A5, B5, B7-B9, El , E2; acreage, 60, 92-94, t. A2, El; exports, 41, 47, 96101, 161, 165-166, t. B7; grades and grading, 34-35, 87-88, 97; history, 38-41, 47, 60, 92-93, 96, t. B5, B7, El ; Island consumptlon, 95-96, 160; production problems and research, 101-102; production areas, 13-16, 94; products, 95, 98, 101, 160-161; swine feed, 101, 146. See also vege- table and fruit sample farms
functional specialization, 162-163 fungicides, tomatoes, 204-205, t. D2 Future Farmers of America, 25
Garbage, 143-146 geese, 62 goats, 40, 62 government, 34-37, 164 grades and grading: 34-35; beef, 131-
132; eggs, 155; floral products, 122- 124; honey, 156; papayas, 97; swine, 147; vegetables, 71, 87-88. See aho quality
grapes, 39, 93, 95, t. El , E2 green manure, 84, 162 gross income (general excise) tax. Sce
taxes gross returns, gross receipts, gross sales.
See returns growing district. See production area guava, 94, 101
Hawaii (island): area, land utilization, description, 11, 14-15, t. Al, A2, AS;
beef cattle, sheep, 40, 49, 58, 132, 134, 136; field corn, 49, 128; floral products, 117-118, 120, 121; fruit, 56, 94; history, 39-40, 44, 49, 51, 56; macadamia nuts, 103-105; num- ber of farms, t. AS; population, 22, t. A8; poultry, 153-154; soil and water, 35, 89; transportation, 28-30, 51; vegetables, 68, 74, 76, 82; vege- table and fruit farms, 181-192, t. B8, B9, C1-C15. See also Kona
Hawaii Agricultural Experiment Sta- tion, 24, 149
Hawaii Employment Relations Act, 35 Hawaiian Homes Commission, 17-18,
11. 136 <-, -- - Hawaiian Islands: physical characteris-
tics, 11-13; utilization of agricultural land, 13-14
Hawaiians: egg consumption, 148; farmers, 22-23; milk consumption, 49, 140; number, 20-21, t. A7; pork preference, 144; ranchers, 23, 135- 136
hides, 40, 49, 131 history: 38-51; beef cattle, beef and
veal, 40-41, 49-50, 61, 131-132, t. F1; beekeeping, 50, 62, 155-156; coffee, 40-41, 44-45, 60, 112-114; dairying, 49, 61-62, 139-140; discov- ery to middle of 19th Century, 39- 41; field corn, 48-49, 60, 127-128; floral products, 61, 116117; fru~t, 38-41, 47, 92-93, 9697, 99-100, t. B5, B7, El; Great Mahele and after- math, 42; horses and mules, 40-41, 50, 61; macadamia nuts, 60-61, 103- 104; pineapple, 39-41, 55-56; popu- lation, 20-22, t. A6-A8;.poultry, 38, 40-41, 50, 62, 147; predrscovery Ha- waii, 38-39; rice, 45-47, 60, 126127; sheep, 40, 49-50, 61; sugar, 38, 40- 41, 43-44, 53-55; swine, 38, 40-41, 50, 61, 143-144; vegetables, 3841, 47-48, 60, 70-74, 79-80, t. B5-B7
hogs. See swine home demonstration clubs, 25 home produced food. See production for
home use homesteader, homesteading, 17-18,136 honey. See beekeeping Honolulu: beef and dairy, 49, 132, 143;
floral products, 116118,120; history, 21, 39, 48-49; miscellaneous, 12, 16, 22, 181; poultry, 148,152-154; prices, 6,75, 132,145, t. B5; swine, 143-145; transportation, 28-30, 50-51; vege- tables, 68, 72-75, 77, 86-87, t. B3, B5. See also Oahu
horses, 40-41, 50, 61, 185, t. C4
INDEX 221
houses on farms, 89, 186, t. C3, C6 household assets, 186, t. C6
Implements. See equipment imports: 1-2, 160-161; beef and veal,
131-132, 139, 160, t. F1; chicks and hatching eggs, 152-153, 166; dairy cow replacements, 141, 162, 166; dairy products, 62, 139-140, 160; feed, 1, 141, 151-152, 161, 166; fruit, fresh and processed, 60, 95, 160, t. E2; potatoes, Irish, 67-68, 70, 160, t. B1, B3, B4; poultry products, 62, 147-148, 152-153, 155, 160; pro- cessed food, 62, 67,95, 131, 139-140, 144, 160-161, t. B1, E2, F1; rice, 45, 126-127, 160;. swine and pork, 143-144, 160; taxes, 30; transporta- tion interruption, 6, 126, 151-152, 165-166; vegetables, 60, 67-70, 72, 74, 87, 160-161, t. B1, B3, B4
improvement of animal stock, 142, 146-147, 152, 162
income: coffee, 114; macadamia nuts, 108, t. E5; off-farm, vegetable and fruit sample farms, 193-194, t. C15; of pineapple workers, 78, 191; of sugar workers, 78, 191; tomatoes, 205; vegetable and fruit sample farms, 78-79, 190-194, t. C13-C15. See also returns
income tax. See tax Industrial Research Advisory Council,
24 industry cooperation and organization:
26, 163; floral products, 123, 125; papayas, 98-99; pineapple, 57; poul- try and eggs, 153-155; sugar, .44. See also cooperation and cooperaelves
insects: 13; flowers, 121; fruit, 93, 102; pineapple, 57; poultry, 149; vege- tables, 79, 85, 205. See also fruit flies
insecticides, poultry, 150; tomatoes, 204-205, t. D2
inspection service, plant and animal, 34-35, 154
interest on Invested capital: cattle ranch, 134, t. F3; macadamia nut orchard, 107, t. E3, E5; vegetable and fruit sample farms, 190, 194, t. C12, C13, c15-
interplanting crops, macadamia or- chards, 108-109
inventory. See investment investment: beef cattle, 133-134, t. F4;
dairy, 142, t. F5; floral products, 120-121, 123; macadamia nuts, 107, t. E4; poultry farms, 150; vegetable and fruit sample farms, 183-196, t. C2-c7
irrigation: 163; cattle, 137-138; history, 38, 43-44; irrigation projects, 20, 88-89; irrigated land and pastures, 13-14, 137-138; value of irrigation systems, 13; vegetables and fruit, 88-89, 189, 192. See also water
Jams and jellies, 101, 161 Japanese: 22, t. A7; coffee farmers, 22,
113; producers of floral products, 22, 118; rice, 22, 126
Kauai: area, land 'utilization, descrip- tion, 11-12, 17, t. AI, A2, A8; cattle, 135-136; corn, 128; flowers, 117; fruit and nuts, 56, 94, 103-104; history, 43-44, 46,48; number farms, t. AS; population, 22, t. A8; poultry, 154; rice, 46, 126-127; transportation, 28; vegetables, 74, 77, 82, 84-85; vegetable and fruit farms, 181, 184, 187, 190-191, t. B8, B9, C1-C15; wages. 27
~ona : c b ~ e e , 44, 113, 115-116; credit, 30-31; description, 15, 113; fruit, 94; labor and wages, 27; ranches, 136; transportation, 29; vegetable and fruit sample farms, 181, 183-186, 189-192, t. C1-C15
Koreans, 20, 118, t. A7 kuleana, 39, 41-42
Labor: 26-27, 161-162; cattle and pas- tures, 27, 135, 138; coffee, 27, 114- 116; dairies, 27, 141-142; family la- bor, 26-27, 45, 75-76, 78, 109, 194, t. C1; floral products, 120; labor and management conflicts, 1, 5-6, 160, 165; labor saving practices, 53, 162; laws, 35; macadamia orchard, 107- 109, t. E3, E5; poultry, 27, 148-150; rice, 46-47, 127; seasonal, 27; sugar and pineapple, 21, 53, 191-192; swine, 27, 146; unions, 5-6; vege- tables, 27, 75-76, 78-80, 82, 85, 203- 205, t. D l , D2; vegetable and fruit sample farms, 188, 193, t. C1, C12. See also employment, wages, income
labor income. See income Lanai, 10, 15, 49, t. Al, A2, A8 land: agricultural, 13-18, t. A1-A3;
area, Hawaiian Islands, 11, 13, t. A l ; beef cattle and pasture, 13-19, 132- 138, t. A2, A3, F3, F4; dajrles, 17, 141-142; Great Mahele, 42; lrrlgated, 14,16-17,88-89,137-138,163; price,
1
i 222 DIVERSIFIED AGRICULTURE OF HAWAII
18, 116, 120, 132, 134; scarcity, 18; swine, 146; value, 18, 116, 120, 132- 134, 183-184, t. C3. See also cropland acreage, farm size, lease, production area and location
land ownership. See land tenure land tenure, 17-20, 162-163, t. A3;
coffee, 113, 116; concentratlon of ownership, 18; fruit, 101; history, 17-18, 39, 42-44, 46-47; private or fee simple, 17-18, 163, t. A3; public, 17-18, t. A3; relation to credit, 32- 33; vegetable and fruit farms, 77, 89, 182, t.-B8
land utilization: 13-17, 163-164, t. Al ; agricultural land, 13-17, t. A2, A3; vegetable farms, 83
large farms. See farm size laws, 34-35, 164 leases and leasing: 18-20, 163, t. A3;
coffee, 19, 116; credit, 33; escalator clause, 19, 139, 163; fruit, 19, 101; pasture land, 18-20, 132-133, 136, 139, t. A3; pineapple, 19, t. A3; share cropping, 31; sugar, 19, t. A3; swine, 143, 145; vegetables, 19, 89, 184
lima beans, 71, 161 litchi, 93-94 livestock: 131-147; history, 38, 40, 49-
50, 131, 139, 143; vegetable and fruit farms, 185, 187-188, t. C4, C8-C10, C12. See also beef cattle, dairying, swine, sheep, horses
living costs, 193-195, t. C15 location, Hawaiian Islands, 11. See also
production area and location, com- peting areas
Macadamia nuts: 102-110, t. E3-E5; acreage, 61, 103-104, t. A2; connec- tion with sugar industry, 58; costs, returns, investment, 107-110, t. E3- E5; demand and price, 103, 106-108; description of nut, tree, yield, prod- uct, 102-106, 109; exports, 105-106, 161, 165-166; history, 60-61, 103- 105; number and race of operators, 22, 104, t. AS; production areas, 14-17, 103-106, t. A2
machinery, agricultural. See mechaniza- tlon
management, 1, 5, 160, 165. See also production methods
mangos, 58, 93-95, 101, t. B5, El, E2 manufacturing industries, 3 markets and marketing: 161, 163-164;
avocados, 99-100, 161; bananas, 96, 161; beef, 131-132, 139; coffee, 113,
115; floral products, 117-125; fruit, 95-100, 161; history, 39-41, 43-50; honey and beeswax, 155-156; maca- damia nuts, 103, 106, 108, 161; or- derly marketing, 86-87, 123; poultry products, 152-155, 160; swine, 144, 147, 160; vegetables, 77, 85-88, 163
marketing act, 34-35 marketing costs. See costs marketing practices, 163 marketings: general agricultural, 62, 63,
t. A4; beef and veal, 131, t. El; vegetables, 67, t. B1, B2, B4. See also production, exports
Maui: area, land utilization, descrip- tion, 11, 15-16, t. Al, A2, A8; beef, milk, cattle, 134, 136, 143; field corn, 49, 128; floral products, 117-118; fruit and nuts, 56, 94, 103-105; his- tory, 41, 44, 48-49, 51; number of farms. t. A5; population, 22, t. AS; poultry, 154; soil conservation dis- trict, 35; transportation, 28, 30, 51; vegetables, 41, 68, 74, 77, 82, 88; vegetable and fruit farms, 181, 183- 185, 187-193, t. B8, B9, C1-C15
meat inspection, 35 mechanization: 161-163, 165; adapta-
tion of farming, 80; cattle ranchers, 135, 137, t. F3, F4; coffee, 115; dai- ries, 141; depression, 165; equipment overhead, 81-82; fruit, 101; maca- damia nuts, 109, t. E3, E4; pinea ple, 58; rice, 127; sugar, 53; vegeraides, 79-82, 89; vegetable and fruit sample farms, 77, 185-186, t. C5. See also equipment, tractor, truck
military expenditures. See armed forces milk. See dairying missionaries, 41 mochi rice. 126 molasses: kattle, 59, 138, 141; swine,
59, 146 Molokal: area, land utilization, descrip-
tion, 11, 16, t. Al, A2, A8; credit, 31; crops, 74, 94, 117, 128, t. B8, B9; land and water, 35, 89; livestock, 49, 135; population, 22, t. A8; transpor- tation. 29
money, 39-40, 51 mulching, 84, 162 mules, 40, 50, 61, 185, t. C4
National parks, 13, t. A1 natural resources, vegetable and fruit
sample farms, 181-182, 192, t. C1. See also climate, land, water
nematodes, 93, 123 net income. See income
INDEX 223
net returns. See returns net worth, vegetable and fruit sample
farms, t. C2 Niihau, 11, 17, 22, 49, 135, t. Al, A2,
A8
Oahu: area and land, 11, 1618 , 35, t. Al , A2, A8; beef and cattle, 40, 135; dairying, 141-143; floral products, 117-118; fruit, 56, 94, 101; history, 40,44,46, 51; macadamia nuts, 103- 105; number of farms, t. AS; popu- lation, 22, t. A8; poultry, 149, 153; share cropping, 31; swine, 143-147; transportation, 30, 51; vegetables, 74-75, 81-82, 84-85, 87-88, t. D l ; vegetable and fruit farms, 181, 184, 187-189, 192, t. B8, B9, C1-C15; wages, 27. See also Honolulu
off-farm income. See income, off-farm onions, dry, 67-68, 73, 160, t. B1-B6 operating costs. See costs operating unit. See farm size oranges, 40-41,47, 93-95, t. B5, El , E2 orchids, 61, 118, 125. See also floral
products orderly marketing. See markets and mar-
keting -
organization. See industry cooperation and organization
Orientals: egg consumption, 148; milk consumption, 140; pork preference, 144; ranchers, 135. See also Japanese, Chinese, Koreans, Filipinos
outlook: 160-166; beef cattle, 139; beekeeping, 157; coffee, 115-116; field corn, 128; floral products, 125; fruit and fruit products, 96-97, 101; macadamia nuts, 102, 105-106, 108; pineapple, 58; poultry and eggs, 155; rice, 127; sugar, 55
outlying islands: dairies, 141-143; poul- try products, 153; swine, 144, 146; vegetable and fruit sample farms, 182, 188. See also individual islands
output. See production, marketings outside islands. See outlying islands overproduction. See surplus ownership of land and farms. See land
tenure
Packing and packaging: 35; floral prod- ucts, 123; honey, 156-157; papayas, 97; poultry, 154-155; vegetables, 87
papayas: 92, 94-99, t. E2; acreage, 92, t. E l ; exports, 96-99, 161, t. B7; interplanting with macadamia nuts, 109; leases, 101; location, 17, 94; prices, 97, t. B5; research, 102. See also fruit
parasites, 147, 150 part-time farms. See farm size, family-
sized farms passion fruit, 101-102 pastures and pasturing: 166; acreage,
13-14, 16-17, 134-135, 137, t. A2, A3; beef cattle, 132-139, 160, 162; dairy cattle, 141-143; field corn ro- tation, 128; location, 14-18; swine, 145-146
per capita consumption See consump- tion, per capita
pests. See diseases, insects pigeons, 62 pigs. See swine pineapple: 55-58, t. A2-A5; acreage,
56, t. A2, A3; business cycles, 5; bran and pulp, 59, 138, 141; connec- tion with diversified agriculture, 58- 60, 138, 141; employment, 4; ex- ports, 2,55-57; Caucasians, Filipinos, Japanese, 22; labor income, 78, 191; outlook, 58; production areas, 1617 , 55-56
planning, agricultural, 20, 85, 164 plantation crops. See sugar, pineapple pocket market, 86 poha, 101 poi. See taro population, effect of balance of pay-
ments, 2 population and race, 20-23, t. AGA8 pork, 38, 41, 143-144, 147, 160, t. A4.
See also swlne Portuguese, 22, 135 potatoes, Irish, 3 H 1 , 60, 67-70, 73,
160, t. B1-B7 poultry: 147-155, t. A4, A5; breeding
and flock replacement, 151-153, 166; history, 38, 50, 62, 147; imports, 62, 147-148,152-153,155,160; Japanese, 22; present status, 62, 147-149; pro- cessing and marketing, 153-155; production areas, 15-16, 149; re- ducing farm costs, 149-152; vege- table and fruit farms, 185, t. C4
perquisites, 27, 191 price control: beef, 132; coffee, 112;
honey 156; vegetables, 72-73 price cutting, floral products, 119, 124 price stability, 124, 163 prices: 6, 163, 166; beef, 132-134, 138-
139, 162; coffee, 45, 112-114, 116; floral products, 119-126; frutt and fruit products, 95-100, t. B5; honey, 156; land, 17, 116, 120, 132, 134; lease, 19, 132; macadamia nuts, 103, 106-108; milk, 140; pork, 143, 145; poultry and eggs, 148, 152-155; taxes, 36-37; vegetables, 72-73, 75,
224 DIVERSIFIED AGRICULTURE OF HAWAII
192, t. B5; water, 88 processed products and processing:
160-161; coconuts, 110; floral prod- ucts, 121; fruit, 95-38, 100-101; im- ports, 62, 67, 95, 131, 139-140, 144, 160-161, t. B1, E2, F1; jams and jellies, 101; macadamia nuts, 103, 110; poultry products, 153-155. See also by-products
production: 160-163; beef and veal 131, 160, t. A4, F1; coffee, 112-113, t. A4; dairy replacements, 141-142, 160, 162; field corn, 128, t. A4; floral products, 120-122, t. A4; fruit, 94, 160, t. A4, E2; green feed, 141, 160; honey and beeswax, 50,62, 155-156, t. A4; milk, 61-62; 139, 141, 160, 166, t. A4; poultry and eggs, 62, 147, 150-151, 153-154, 160, 166, t. A4; swine and pork, 143-144. 160, t. A4; vegetables, 60, 72-75, 160, t. A4, B1, B2, B4, B6. See also market- ings, yield
production area and location: beef cat- tle, 15-17, 136; beekeeping, 157; coffee, 15, 113; dairies, 16, 141; field corn, 128; floral products, 15-16, 117-118, 120-121; fruit, 14-17, 94, 180-181, t. C1; macadamia nuts, 14- 17, 105-106; poultry, 15-16, 149; swine, 15-16, 143-145; vegetables, 14-17, 74, 180-181, t. C1. See also acreage, land
production costs. See costs production for home use: 162; coffee,
114-115; vegetable and fruit sample farms, 77,83-84, 162, 188, 194, t. C11
production methods: 161-163; beef cat- tle, 136-139, 162; beekeeping, 156; dairying, 141-143; floral products, 121-122; fruit, 101-102; history, 38- 39.41, 45,47; macadamia nuts, 109- 110; poultry, 149-152; rice, 47, 127; swine, 145-147; vegetables, 80-85
production unit. See farm size productivity, 162, 164 profit. See returns promotlon: 163; floral products, 120,
123-125: fruit, 96, 99; macadamia nuts, IOG, 108; pineapple, 57; vege- tables and taro aroducts. 72, 88 ------ . .
prosperity, 1, 69, i39 public instruct~on, department of, 25
Quality: 35, 163; beef cattle, 136-138; floral products, 120-121, 123-124; fruit, 95-98; honey, 156; pasture, 137-138; poultry and eggs, 148, 152, 154; vegetables, 41, 87; vegetables and fruit sample farms, 181-182,
191-192, t. C1. See also grades and grading
quarantine, 34, 71, 96, 99
Rabbits, 62 race or national origin, 21-23, t. A7.
See also Caucasians, Chinese, Filipinos, Hawaiians, Japanese, Koreans, Ori- entals, Portuguese
railroads, 30 rainfall. See climate ranch. See farm real estate value: 133, t. F4; coffee, 115;
dairy, 142, t. FS; vegetable and frult sample farms, 183-184, t. C2, C3. See also land, cattle ranch
rearmament program, 1, 3 records, farm, 33, 85, 183 refrigeration: eggs, 154-155; ships,
28-29 regulations, governmental, 34-35 rents and rental. See leases and leasing research, agricultural, 24, 59, 102, 104,
115, 125, 149-151, 164 resources: agricultural, development
during depression, 165; mineral, 1. See also land, irrigation, water
retailing: floral products, 118, 120, 124; fruit, 95-97; poultry products, 153- 155; swine, 147; vegetables, 87-88
returns: cattle ranch, 133-134, t. F2; coffee, 114; floral products, 122-123; macadamia nuts, 108, t. E3, E5; poultry, 149-151; vegetables, 203- 205; vegetable and fruit sample farms, 186-187, 191-193, t. C9, C10, C14. See also income
rice: 45-47, 126-127; acreage, 60, 126- 127, t. A2; farm number, 46-47, 126, t. A5; growing districts, 17
risk, 83, 162 roads, 29-30, 51, 136
Sales. See marketings, returns sanitation, 35, 145, 147 savngs: coffee, 114; vegetable and fruit
sample farms, 194-195, t. C15 seasonal differences, eggs, 154 seasonal labor, 27 seasonal production, gluts. See surplus self-sufficiency: prediscovery Hawaii,
38; war time, 166 share cropping, 31 sheep and sheep products, 40, 49-50,
61, t. A4, A5 shipping. See transportation silk, 48 size of farm. See farm size small farmers. See farm size soil conservation districts, 35, 85
INDEX 225
soil conservation payments. See U.S. Production and Marketing Admin- lstratlon -- - ~-. ~
soil tests, 84, 162 soils: Hawaiian Islands, 13; vegetable
and fruit sample farms, 181-182, 193, t. C1
specialization: cattle ranches, 135; cof- fee farms, 115-116; functional, 162; vegetables, 83-84; vegetable and fruit sample farms, 187, t. C8-C10. See dso diversification of farm
standard of living, effect of balance of payments, 2. See also living costs
stock improvement. See improvement of animal stock
storage and storing, 152-154 storms, 12, 102 sugar: 43-44, 53-55, t. A2-AS; area,
13-17, 44, 53-54, t. A2, A3; by- products, 3, 59, 138, 141, 146, 151; connection wlth d~versified agricul- ture, 58-60, 138, 141; employment, 3-4, 53; exports, 40-41, 43; factors, 43; federal policies, 5, 55, 165; Ha- waiian Sugar Planters' Association, 24, 44; history, 38, 40-41, 43-44, 53-55; Caucasians, Filipinos, Japan- ese, 22; labor income, 78, 191; mar- keting quota, 2, 55; plantations, 43- 44, 53-54, t. 5; poultry feed, 59, 151; small sugar growers, 54, t. 5
summary, 160-166 surplus: 163; floral products, 124; pa-
payas, 99; poultry products, 153-154 survey of diversified agriculture, 1900
to present, 60-62 swine: 143-147, t. AS; development
and present status, 143-145; industry problems, 145-147; connection with sugar plantations, 58; history, 38, 40-41, 58, 61, 143-144; numbers, 61, 143; location, 15-16, 143-145; racial ancestry of farmers, 22; ve- getable and fruit, 83, 101, 146, 185, t. C4. See also pork
Tallow, 40,49, 131 tangerines, 93-95, t. B5, El, E2 tariff and import duties: coffee, 45, 112;
rice, 46; sugar, 43 taro: acreage, 60, t. A2, B6; exports of
products, 72, 161; food values of products, 72; history, 38, 42, 48, t. B2, B5, B6; prices, t. B5; production or sales, 68-69, 84-85, t. B1, B2, B4
taxes: 35-37; cattle ranch, t. F3; maca- damia nuts, t. E3, E5; vegetable and fruit sample farms, 189, 194, t. C12, c15
techniques, agricultural. See production methods, mechanization
tenant. See lease tenure. See land tenure tomatoes, 68-69, 71, 73, 203-205, t.
B1-B6, D2 topography, 11-12, 13-16, 113, 162,
181, t. C1 tourist industry, 3, 5 tractor: coffee, 115; macadamia nuts,
t. E3, E4; ranches and dairies, 135, t. F3-F5; rice, 127; vegetable and fruit farms, 75, 77, 79-82, 85, 101, 185, 192, 204, t. B8, C5, D2. See also mechanization
trade, 39-40, 51 trade education, 99 trade organization. See industry coopet-
ation and organization transportation: 27-30, 50-51, 165-166;
floral products, 28, 119, 121-124; freight rates, 28-29, 119, 123, 154; fruit, 29, 96-97, 100; hlstory, 50-51; honey, 156; interisland sea and air, 29, 51; milk, 143; papayas, 97; poul- try, 28, 152-153; radroads, 30; roads, 29-30, 51; transpacific sea and air, 27-29, 50-51; vegetables, 29, 72, 81-82. See also transportation inter- ruption
transportation interruption: 1, 6, 160, 165-166; dairy industry, 141, 166; field corn. 128: floral products, 125- 126, 1 6 5 ; ~ ~ o u l t r ~ , 151-152, 166. See also transportation
Treaty of Reciprocity: effect on coffee, 45; effect on sugar, 43-44; effect on wages, 51
truck, 81-82, 115, 127, 185, t. C5, E4, F3-F5
Unemployment, 3-4, 160, 165 unloads, mainland. See imports U.S. Farm Credit Administration, 31,
34, 164 U.S. Farmers Home Administration,
31-33, 114, 180-186, 191, t. C1-CIS U.S. Production and Marketing Ad-
ministration: 34; macadamia orchard, t. E3; ranching, 133; vegetable and fruit sample farms, 187, t. C10
University of Hawaii, 24-25 utilization: bee products, 156-157; cas-
tor beans, 128; coconuts, 110; coffee, 113; floral products, 117, 120, 125; fruits and fruit products, 96, 98-99, 101; macadamia nuts, 102-103; milk, 139; pineapple, 55-57, 59; poultry products. 148, 155; sugar, 59; vege-
226 DIVERSIFIED AGRICULTURE OF HAWAII
tables and vegetable products, 72, 83. See also processed products
Value: 2-3, 62-63, t. A4; cattle, 62, 133-134, t. A4, F2-F4; coffee, 63, 115, t. A4; dairying, 62, 142, t. A4, F5; floral products, 63, 116-119, 122, t. A4; land, 18, 116, 132; macadamia nuts, 107-108, t. A4, E4, E5; pine- apple, 2, 5, 57, t. A4; poultry prod- ucts, 62, t. A4; rice, 46, 63, t. A4; sheep products, 50, t. A4; sugar and molasses, 2, t. A4; swine products, 62, t. A4; vegetable and vegetable products, 63, 72, 75, t. B2, A4; vege- table and fruit farms, 77, t. C2-C15. See also prices
vanda, orchids, 119-121, 123-125. See also floral products
veal. See beef vegetables: 67-89, t. A2, A4, A5, B1-
B9, appendices C, D; acreage, 60, t. A2, B6, B9; age of farmers, 182; business cycles and long time trends, 69-70; connection with sugar and pineapple, 58-60; exports, 40-41, 47, 70-72, 161, 164-166, 204, t. B7; farm methods and organization, 79-85, 161-163; grades and grading, 34-35, 71,87-88; imports, 60,67-70,72-74, 87, 160-161, t. B1, B3, B4; land and water, 77, 88-89; macadamia or- chards, 109; marketing, 77, 85-88, 163; marketings, 67, t. B1, B2, B4; prices and production, 67-69, 72-74, 75, 160-161, t. B1-B5; production districts, 14-17, 74; racial ancestry of
farmers, 22-23; survey of vegetable and fruit farms, 75-77; swine sideline, 146. See also vegetable and fruit sam- ple farms
vegetable and fruit sample farms: 77- 78, appendix C; age of farmers, 182; costs. 77. 188-190. t. C12. C13: debts. 186, i90, t. ~ 3 1 67, ~ 1 3 ; inventory; 77, 183-186, t. C2-C6; representa- tiveness of sample, 180-183; returns, income, savings, 186, 190-195, t. C13-C15
volume of production and sales. See production, marketings
Wages, 27-28, 47, 51, 53, 191, t. E3, E4. See also income, labor
wage and hour law, 35 war: future, 125-126, 166; Korea, 1,
3-4, 144. See also World War I1 waste products, 3, 83 water: cattle, 136, 138; cost, 88, 189;
water rights, 20. See also irrigation whaling, 40, 43 wheat, 48 wholesale market. See market wool. See sheep World War 11: 1-3; beef prices, 132;
coffee, 112-114: fruit, 92, 96, 98: honey, 156; swine, 143-145; vege: tables, 72-74, 76, 79-81, 183
Yield: honey, 156; macadamia nuts, 104-105; rice, 47, 127; vegetables, 84-85, 203-204, t. D l . See aho pro- duction
Young Farmers Association, 25
PRODUCTION NOTE
The text and references of this book have been set in 10 pt. and 8 pt. Monotype Garamond, respectively, and the subheads and running heads in 12 pt. and 8 pt. Linotype Spartan bold, respectively, by the Advertiser Publishing Company, Ltd. Title page, part titles, and chapter openings have been set in 18 pt. Spartan medium condensed and 60 pt. and 72 pt. Onyx by the Honolulu Star-Bulletin, Ltd. Ap- pendices have been typewritten.
Illustrations, tables, and end leaves have been prepared by Walter Kiyabu with Spartan bold condensed, Spartan medium, and Onyx set by the Honolulu Star- Bulletin, Ltd. Appendices were prepared for publication by Robert W. Sparks.
The book has been printed on Everett Pulp and Paper Company's substance 60 Nautilus eggshell laid, the body and index by letterpress and the appendices by offset. End leaves were printed by offset on substance 70 Ticonderoga Text gray laid. Printing and binding were done by the Advertiser Publishing Company, Ltd. Covers were manufactured by Russell-Rutter Company, Inc., of Athol Manufac- turing Company's standard finish Dublin 025X Terek Cloth.
The book was designed by and produced under the supervision of William S. Ellis, Jr., and Aldyth V. Morris.


LAST DATE STAMPEC UNLESS RECALLED
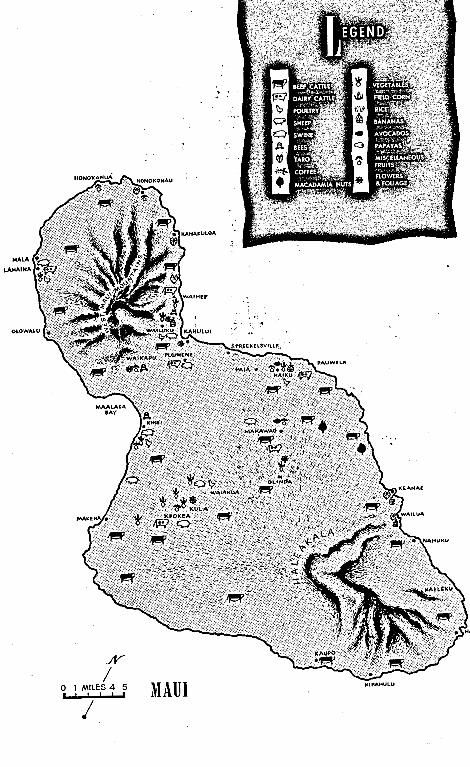
0 1 MILES 4 5 CIPAMULU , MAUI f