Embed Size (px)
Citation preview

Youth Substance Use TrendsCasa Grande Alliance Coalition
Prepared by:
Shana MaloneArizona Criminal Justice Commission
Statistical Analysis Center
November 18, 2014
Data in this presentation were aggregated to the following areas:
Casa Grande Alliance (8th , 10th, & 12th Grade)
n=1,169
Pinal County(8th, 10th, & 12th Grade)
n=4,283
CONSUMPTION
Identifying the severity of the problem and who is most affected

The Arizona Youth Drug Severity Index
A pulse for how severe the problem of youth substance use is in an area
Reflects the # of kids using, the frequency of use and the harm per substance Frequency: 1 = (1-2x, experimental); 2= (3-9x, weekend); 3= (10-19x,
weekend + some weekday); 4=(20+, habitual)
The higher the score, the more severe the problem Anything over 20 is noteworthy; over 30 a problem; and over 40 a very big
concern.

0
5
10
15
20
25
30
35
40
45
50
33.6729.73
21.1918.38
The Severity of Youth Substance UseThe Drug Severity Index (DSI)
Casa Grande Alliance
2008 2010 2012 2014
Drug
Sev
erity
Inde
x Sc
ore
Ver
y Lo
w
L
owM
oder
ate
Hig
h
Ext
rem
e
45.4% Cumulative Change

% Use µ Frequency µ Harm0
5
10
15
20
25
30
35
40
35.43
2.24
7.92
34.12
2.02
7.19
26.45
1.46
5.19
22.93
1.26
4.48
DSI Component: Casa Grande Alliance
2008 2010 2012 2014

Alc
ohol
Hea
vy A
lcoh
ol
Cig
arett
es
Che
win
g To
bacc
o
Mar
ijuan
a
Hal
luci
noge
ns
Coc
aine
Inh
alan
ts
Met
h
Her
oin
Ecs
tasy
Ste
roid
s
Rx
Pain
Rel
ieve
rs
Rx
Seda
tives
Rx
Stim
ulan
ts
Tot
al R
x D
rugs
OTC
Synt
hetic
Dru
gs
(Bat
h Sa
lts,
Spi
ce)
Alc
ohol
& R
x D
rugs
0
10
20
30
40
50
60
70
80
90
100
30 Day Youth Substance Use by Gender in Casa Grande (2014)
Males Females
Perc
ent (
%) U
se

Alc
ohol
Hea
vy A
lcoh
ol
Cig
arett
es
Che
win
g To
bacc
o
Mar
ijuan
a
Hal
luci
noge
ns
Coc
aine
Inh
alan
ts
Met
h
Her
oin
Ecs
tasy
Ste
roid
s
Rx
Pain
Rel
ieve
rs
Rx
Seda
tives
Rx
Stim
ulan
ts
Tot
al R
x D
rugs
OTC
Synt
hetic
Dru
gs
(Bat
h Sa
lts,
Spi
ce)
Alc
ohol
& R
x D
rugs
0
10
20
30
40
50
60
70
80
90
100
30 Day Youth Substance Use by Grade in Casa Grande (2014)
8th Grade 10th Grade 12th Grade
Perc
ent (
%) U
se

Alc
ohol
Hea
vy A
lcoh
ol
Cig
arett
es
Che
win
g To
bacc
o
Mar
ijuan
a
Hal
luci
noge
ns
Coc
aine
Inh
alan
ts
Met
h
Her
oin
Ecs
tasy
Ste
roid
s
Rx
Pain
Rel
ieve
rs
Rx
Seda
tives
Rx
Stim
ulan
ts
Tot
al R
x D
rugs
OTC
Synt
hetic
Dru
gs
(Bat
h Sa
lts,
Spi
ce)
Alc
ohol
& R
x D
rugs
0
10
20
30
40
50
60
70
80
90
10030 Day Youth Substance Use by Ethnicity Casa Grande (2014)
Hispanic Non-Hispanic
Perc
ent
(%) U
se

Alc
ohol
Sip
Alc
ohol
Re
gula
r U
se
Ciga
rett
es
Mar
ijuan
a
Alc
ohol
Sip
Alc
ohol
Reg
ular
Use
Ciga
rett
es
Mar
ijuan
a
Alc
ohol
Sip
Alc
ohol
Re
gula
r U
se
Ciga
rett
es
Mar
ijuan
a
10.5
11.0
11.5
12.0
12.5
13.0
13.5
14.0
14.5
15.0
Age of 1st Use by Substance Type
2008 2010 2012 2014
Ave
rage
Age
in Y
ears
Casa Grande Pinal County State

CONSEQUENCES
Identifying the Costs of Substance Use and Markers of Return on
Investment for Prevention

Pass
enge
r DD
Drov
e Dr
unk
Drun
k/Hi
gh
at S
choo
l
Sold
Dru
gs
Pass
enge
r DD
Drov
e Dr
unk
Drun
k/Hi
gh
at S
choo
l
Sold
Dru
gs
Pass
enge
r DD
Drov
e Dr
unk
Drun
k/Hi
gh
at S
choo
l
Sold
Dru
gs
0
10
20
30
40
50
60
70
80
90
100
Youth Substance Related Consequences
2008 2010 2012 2014
Perc
ent (
%) Y
outh
Rep
orti
ng B
ehav
ior
Casa Grande Pinal County State

CONTEXTUAL FACTORS
Identifying What Can Be Changed

At
a pa
rty
Gav
e so
meo
ne $
to
buy
it
Som
eone
und
er 2
1
Adu
lt fa
mily
m
embe
r
Unr
elat
ed a
dult
Pare
nt/G
uard
ian
Oth
er
Took
from
hom
e
Liqu
or L
icen
se
Faci
lity
Stol
e it
0
10
20
30
40
50
60
70
80
90
100Where Casa Grande Youth Obtained Alcohol
2010 2012 2014
Perc
ent (
%) Y
outh
Rep
orti
ng E
ach
Sour
ce
Frie
nds
Hom
e
Parti
es
Oth
er
Fam
ily/R
elati
ve
Doc
tor/
Phar
mac
y
Scho
ol
Out
side
U.S
.
Inte
rnet
Frie
nds
Oth
er
Parti
es
Fam
ily/R
elati
ve
Scho
ol
Som
eone
wit
h a
med
mj c
ard
Hom
e
0
10
20
30
40
50
60
70
80
90
100
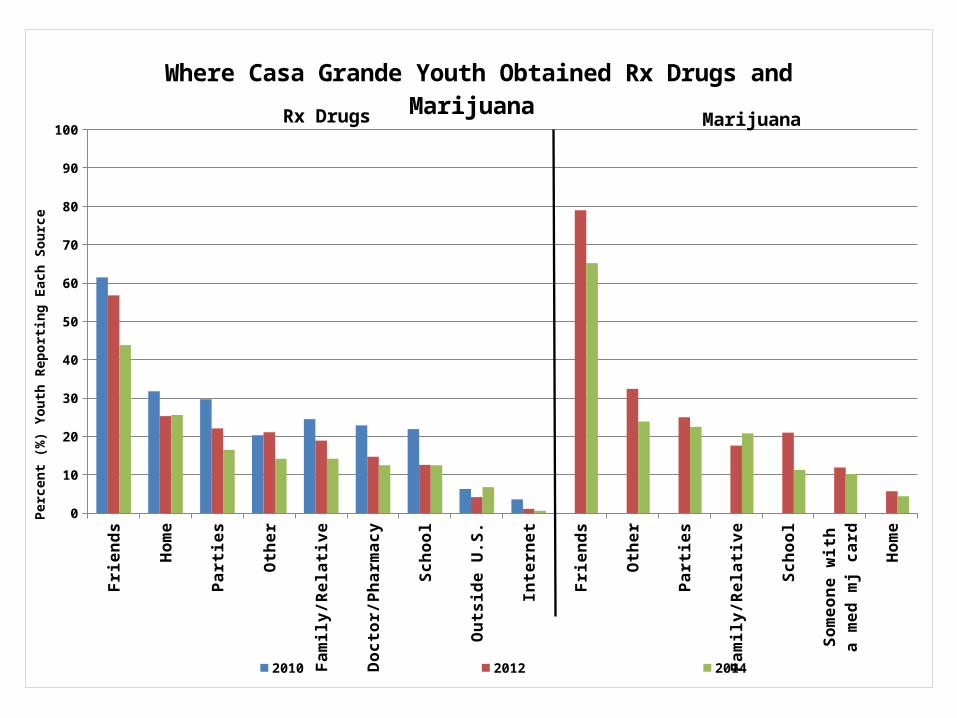
Where Casa Grande Youth Obtained Rx Drugs and Marijuana
2010 2012 2014
Perc
ent (
%) Y
outh
Rep
ortin
g Ea
ch S
ourc
e
Rx Drugs Marijuana

0
10
20
30
40
50
60
70
80
90
100
9.3 10.214.5
7.917.3
26.6 29.522.0 24.2
33.0
52.647.4
57.7
26.6
40.5
59.6 63.2
46.3 49.9
66.4
Risk Factors of Note in Casa Grande (2014) Users had 2-6x the rate of risk as non-users
Non Users Users
Perc
ent (
%) Y
outh
at R
isk
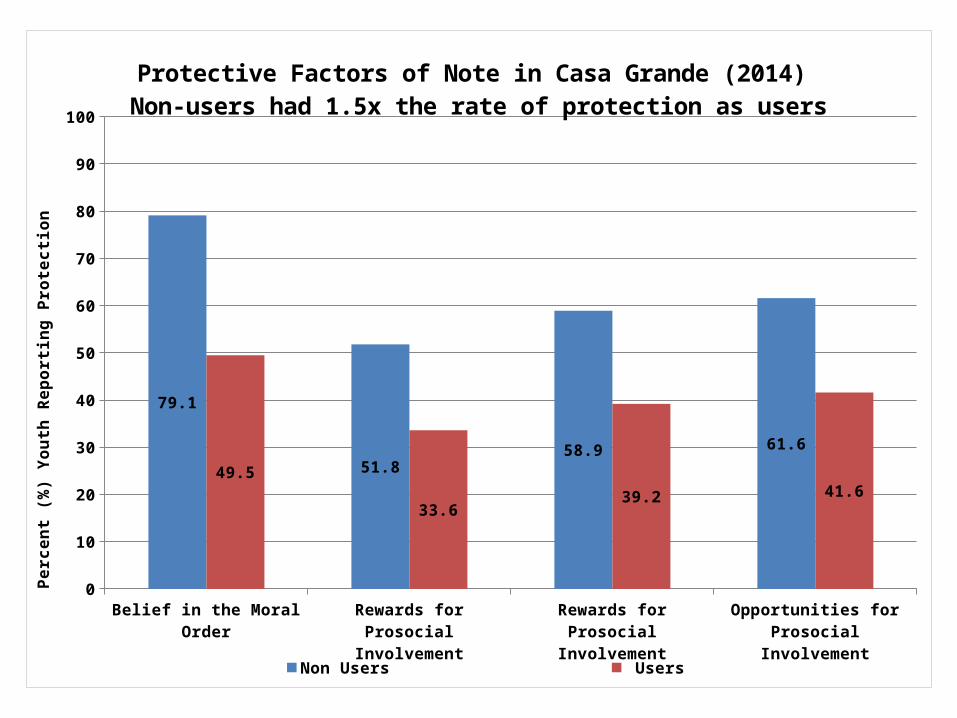
Belief in the Moral Order Rewards for Prosocial Involvement
Rewards for Prosocial Involvement
Opportunities for Prosocial Involvement
0
10
20
30
40
50
60
70
80
90
100
79.1
51.858.9 61.6
49.5
33.639.2 41.6
Protective Factors of Note in Casa Grande (2014) Non-users had 1.5x the rate of protection as users
Non Users Users
Perc
ent
(%) Y
outh
Rep
ortin
g Pr
otec
tion

Alcohol (daily) Tobacco Trying Marijuana Regular Marijuana Rx Drugs0
10
20
30
40
50
60
70
80
90
100
57.9
78.9
27.833.3
68.4
45.6
72.7
9.6 10.8
68.2
Percentage of Casa Grande Youth Who Perceived Substance Use as Risky (2014)
Non Users Users
Perc
ent (
%) W
ho P
erce
ive
Risk

No Discussion Alcohol Tobacco Rx Drugs Illicit Drugs0
10
20
30
40
50
60
70
80
90
100
56.3
25.9 25.620.4
30.2
59.4
19.415.6 12.4
22.5
Percentage of Casa Grande Youth Who Discussed ATODs with Their Parents (2014)
Non Users Users
Perc
ent (
%) o
f You
th

Pare
nts
Frie
nds
Sibl
ings
Gra
ndpa
rent
s
Oth
er R
elati
ves
Teac
hers
Coac
hes
Oth
er A
dult
s
Coun
selo
rs
No
One
Men
tors
Tuto
rs
0
10
20
30
40
50
60
70
80
90
100
63.3
59.7
38.2
24 23.8
17.6
14.6
10.3
7.7
5.8
5.2
1.2
45.1
58.8
33.5
17.7
19.8
10.4
9.1
10.7
4.8 10
.6
3.3
0.9
Sources of Social Support Systems Used by Casa Grande Youth (2014)
Non Users Users
Perc
ent (
%) Y
outh
Who
Rep
ort U
sing
Sou
rce

Hav
e fu
n
Get
hig
h
Dea
l wit
h st
ress
Keep
from
feel
ing
sad
Oth
er
Som
ethi
ng n
ew
Stop
bor
edom
To fo
cus
Fit
in
Feel
nor
mal
Beca
use
I ne
eded
it
Lose
wei
ght
Be m
ore
grow
n up
Get
bac
k at
pa
rent
s
Be li
ke a
fa
mou
s pe
rson
0
10
20
30
40
50
60
70
80
90
100Reasons Youth Gave for Using Substances in the Past 30 Days (2014)
Casa Grande Pinal County State
Perc
ent (
%) Y
outh
Rep
orti
ng R
easo
ns

Not
inte
rest
ed
Pare
nt
disa
ppro
val
Can
hurt
me
Coul
d be
arr
este
d
Oth
er a
dult
disa
ppro
val
Mig
ht g
et
expe
lled
Lose
pri
vile
ges
Mor
ally
wro
ng
Get
a b
ad
repu
tatio
n
Frie
nds
disa
ppro
ve
Aga
inst
bel
iefs
Don
't li
ke
Coul
dn't
find
any
0
10
20
30
40
50
60
70
80
90
100
Reasons Youth Gave for Not Using Substances in the Past 30 Days (2014)
Casa Grande Pinal County State
Perc
ent
(%) Y
outh
Rep
ortin
g Re
ason
s

For More Information
• Shana [email protected]
• SAC website: http://www.azcjc.gov/ACJC.Web/sac/Default.aspx
• Community Data Project website: http://www.bach-harrison.com/arizonadataproject/