Embed Size (px)
Citation preview

Claremont CollegesScholarship @ Claremont
CMC Senior Theses CMC Student Scholarship
2018
You Can Run But You Can’t Hide: The Advance ofShareholder ActivismKendall Greenberg
This Open Access Senior Thesis is brought to you by Scholarship@Claremont. It has been accepted for inclusion in this collection by an authorizedadministrator. For more information, please contact [email protected].
Recommended CitationGreenberg, Kendall, "You Can Run But You Can’t Hide: The Advance of Shareholder Activism" (2018). CMC Senior Theses. 1970.http://scholarship.claremont.edu/cmc_theses/1970
64
Claremont McKenna College
You Can Run But You Can’t Hide:
The Advance of Shareholder Activism
submitted to
Professor Murat Binay
by
Kendall Greenberg
for
Senior Thesis
2017-2018

1
Abstract*
Shareholder activism has exploded in popularity since the turn of the century, due in large part to impressive relative returns generated by its major participants. The result has thus been a surge in assets invested in the category, to in excess of $170 billion today up from less than $3 billion in 2000 (Inglis 2015; Romito 2015). This influx of capital, in absolute dollars and pace of growth, has caused many to wonder whether activists truly create shareholder value and, if so, if the value generated is sustainable. Numerous studies of activist interventions prior to 2009 reveal significant stock price gains around the time of activist arrival and positive longer term buy-and-hold abnormal returns as well. The question remains, however, whether those trends have continued as volume of transactions and number of activists have increased post the recent global financial crisis. In this report, we perform an empirical analysis focused on a hand-collected dataset of 1,088 activist interventions from 1995-present. This dataset includes all 13D filings, as well as Under the Threshold activist campaigns. First, we analyze stock price returns for this group over short- and long-term periods and find that activists continue to unlock shareholder value in recent deals comparable to that of earlier ones. We then perform a proprietary regression to identify which factors drive the most successful returns. Such insights should prove informative for investors employing an activist strategy and companies looking to manage areas of vulnerability.
* I sincerely thank my advisor, Professor Murat Binay, for his inspiration and guidance, as this year-long endeavor would not have been possible without him. I would also like to thank Professor Angela Vossmeyer for her assistance with my regression techniques. I appreciate and want to recognize 13D Monitor for granting me access to its comprehensive collection of activist events so that I could identify and analyze the companies that met my activist criteria. Lastly, hats off to my family and friends for their unwavering support and encouragement throughout the entire thesis process. Mom and Dad—you are both rockstars!

2
ABSTRACT 1INTRODUCTION 3I:DEFINITION&HISTORYOFSHAREHOLDERACTIVISM 6
ACTIVISTINVESTINGDEFINED 6THEHISTORYOFACTIVISTINVESTING:THECORPORATERAIDERBECOMESAVALUE-CREATOR 8
TheEarlyDays 8Activism1.0:FeartheCorporateRaider 9Activism2.0:WelcometheWhiteKnight? 10Activism3.0:ModernActivism 11
II:ACTIVISTINVESTINGASANASSETCLASS 13THE“A”STANDSFORALPHA 13INCREASINGACCEPTANCECREATESITSOWNASSETCLASS 14THEENVIRONMENTREMAINSFAVORABLE 15
III:THEPLAYERS,OBJECTIVESANDTACTICS 18ASTORYOFTWOCAMPS 18ACTIVISTTYPES 20CAMPAIGNOBJECTIVES 22INVESTMENTSTRATEGIESANDTACTICS 25
IV:EXISTINGLITERATUREREVIEW 30STOCKPERFORMANCE 31SHORTTERMSTOCKPRICEEFFECTS 32LONGTERMSTOCKPRICEEFFECTS 34
V:DATACOLLECTIONANDRESEARCHMETHODOLOGY 38VI:RESULTSANDDISCUSSION 40
MEANABNORMALSTOCKRETURNS 40PROPRIETARYREGRESSION 41
Resultsfor13DShort-TermRegression 42ResultsforUTTShort-TermRegression 44Resultsfor13DLong-TermRegression 45ResultsforUTTLong-TermRegression 45
LIMITATIONS 46VII:FUTURERESEARCH 47VIII:CONCLUSION 48BIBLIOGRAPHY 50FIGURES 56TABLES 58

3
Introduction
It seems inescapable. Another week, another couple of front page headlines in
The Wall Street Journal involving shareholder activism. To wit, in the second half of
2017 alone, there have been 55 such articles gracing the A section cover’s prime column,
with July’s announcement of a proxy fight by Nelson Peltz’s Trian Fund Management
against megacap company Procter & Gamble being the granddaddy of them all. At a
$222 billion market valuation that day, P&G became the largest company ever to be
subject to such a campaign.
No company is immune. As noted in The Economist in 2015, “Neither age, status
nor systemic importance offers any protection…Activists have removed the management
of the oldest firm on the New York Stock Exchange, Sotheby’s…won a board seat on
Bank of New York Mellon, a too-big-to-fail bank…and attacked the world’s most
valuable company, Apple.” Why? Because activism works, leading to changes in
corporate behavior along economic, corporate governance and social lines. In fact,
activist hedge funds have been labeled “capitalism’s unlikely heroes” by The Economist
(“Capitalism's Unlikely Heroes”), and law firm Schulte Roth & Zabel notes that
“activism has facilitated some of the biggest transformations in capital markets - from
sector consolidation to changing capital allocation trends—and accelerated the search for
margin growth” (“Activist Investing: An Annual Review of Trends in Shareholder
Activism” 2016). The result has been a growing acceptance by the institutional
investment community, and even public companies themselves, of the value that activists
can add. But not everyone is a fan.

4
Intentional activists are those who believe that they can create shareholder value
better than management teams and boards of directors can on their own. Proponents of
the strategy argue that activists help align the interests of shareholders and management
teams, promote positive business modifications, improve operations and stock
performance at subject companies and enhance efficiency in the economy and market
overall. Critics contend that activists are meddlers with limited knowledge of underlying
operations, suffer from “short termism” at the expense of long term investment focus and
are out to enrich only themselves and their own investors. No matter who is right,
activists’ success rate in achieving campaign objectives illustrates the impact they are
having in corporate America and the overall positive alpha they have generated continues
to capture investors’ attention and dollars.
As capital in the asset class has reached record levels during the last decade,
shareholder activists have diversified themselves in terms of strategies and tactics
employed, as well as size, industry and condition of companies they pursue. For
example, the noticeable trend toward large cap targets a few years ago as activists put
their dry powder to work culminated in more recent predictions for a falloff of activity in
the sector due to the finite number of companies with market valuations exceeding $10
billion (“2016 U.S. Shareholder Activism Review and Analysis”). But these concerns
proved premature as, despite a falloff in 2015-2016, 2017 witnessed a record number of
large cap companies become the subject of activist attention (Rossman 2017).
Logic would dictate that efficient markets should recognize the potential influence
of activists in terms of stock price returns if they indeed add value to the capital market.
But the world is not always logical and these preeminent investors as a class are too smart

5
to miss the obvious if it is true. The impact that activists have had, and can have, in terms
of stock price appreciation and operational performance improvements is thus worthy of
investigation. While numerous studies have evaluated the outcomes of past shareholder
activism using 13D filings, often with conflicting conclusions, few have done the
research to include more contemporary deals which encompass a recent trend toward
those that fall below the 13D filing threshold. Notably, the average market cap of these
under the threshold (UTT) transactions is much larger than those of 13D filings1, so they
are a solid proxy for large cap activist target influence. After analyzing the most
substantial existing studies on activist-induced stock performance results and
reconstructing them to incorporate data from 1,088 events up to present, this paper
identifies the variables that have proven most influential in driving both short- and long-
term shareholder outcomes. We find positive cumulative abnormal returns and buy-and-
hold abnormal returns over the (t-10, t+10) and (t, t+1 year) event windows, respectively.
We also find a strong, negative relationship between abnormal returns and industries with
high lobbying costs. Lastly, intense campaign strategies, that imply management
takeovers, are positively related to abnormal returns.
The structure of this paper proceeds as follows. Section I defines activist investing
and summarizes its history and evolving dynamics. Section II outlines the attraction of
this asset class and articulates why such growth should continue. Section III highlights
the different varieties of activist investors, as categorized by a range of deal objectives
and investment tactics. Section IV synthesizes published literature that assesses the
influence of activist investing on stock performance, both short-term and long-term.
1 Sixty three percent of the UTT transactions we analyzed boast market capitalizations greater than $10b, as compared with 11% of our 13D transactions.

6
Section V details the data collection and research methodology employed in this
proprietary study. Section VI presents the conclusions of our empirical testing and
analyzes the outcomes. Sections VII and VIII suggest potential areas for future study and
consideration and impart concluding remarks, respectively.
I: Definition & History of Shareholder Activism
Activist Investing Defined
Activists are people who seek to create positive change, be it political,
environmental, social or economic. Activist investors are, accordingly, shareholders who
purposefully engage with management teams and boards of directors to unlock
shareholder value by agitating for corporate change. Harvard Business Review’s John
Pound terms them entrepreneurial activists in that they accumulate “a large stake in a
publicly held corporation with the intention to bring about change and thereby realize a
profit on the investment” (Klein and Zur 2009). These event-driven investors pressure
their public company targets to most often:
• hone corporate strategy;
• implement operational improvements;
• better allocate capital;
• pursue (or challenge) M&A alternatives; and/or
• modify corporate governance practices.

7
The most vulnerable companies have thus been historically underperformers, in
terms of either stock price or operating metrics, relative to their peer groups, those with
high cash levels or underachieving business units, or those possessing weak management
teams or corporate governance practices (Park 2016). Whereas conventional investors
generally invest in a stock to show their support and enthusiasm for a management team
and opportunity, activists conversely make an investment with the intent of proposing
changes to the status quo. A small entry fee provides the chance for high potential
impact and reward.
All public company shareholders, including those solely dedicated to activist
investing, must follow certain regulatory procedures in terms of disclosing their
accumulations. A mere $2000 stockholding held for a year usually enables one to file a
shareholder resolution yet, once a stake exceeds the 5% threshold, a 13D statement must
be filed with the SEC within ten days.2 This 13D requires the investor to explicitly
identify itself, its source of funds and the purpose of the transaction, among other items.
Generally speaking, activists do not like to disclose this information, as they do not want
to tip off others as to their actions, drive up stock prices before they have acquired their
full positions or potentially alienate management or other stakeholders earlier than
planned. Therefore, the most savvy have begun employing derivatives or informally
partnering with investors in order to raise their influence levels without triggering the
need for public filings.
2 To be eligible to submit a proposal, rule 14a-8(b) requires the shareholder to have continuously held at least $2,000 in market value, or 1%, of the company's securities entitled to be voted on the proposal at the meeting for at least one year by the date of submitting the proposal (www.sec.gov).

8
The History of Activist Investing: The Corporate Raider Becomes a Value-
Creator
The Early Days
The roots of shareholder activism trace back to 1926 when Benjamin Graham
pressured the management team at Northern Pipeline Company to distribute its excess
cash to shareholders. His research had led him to discover that this could be done with
no impact to operations but significant returns for investors and, after two years of
persuasion, he accomplished his goal (Gaffney 2017). As such, while Graham is best
known as the “Father of Value Investing,” his insightful ability to convince an
overcapitalized public company to return assets to shareholders actually makes him a
“Father of Activist Investing” as well.
While a handful of other greedy managements gained notoriety throughout the
next few decades, people, for the most part, believed that public corporations served a
broader social good and that investors would benefit from their existence alongside
employees, customers and communities at large in a free enterprise system. Legislation
enacted in response to the Great Depression, such as the Securities Exchange Act of
1934, provided further assurance that the federal government would monitor secondary
markets and act to protect public shareholders. In response, public stock ownership
broadened as more individuals wanted to participate in America’s post war economic
growth. Mutual fund and pension fund assets grew, reflecting investor desires for
liquidity, diversification, professional management and privacy of holdings and
accentuating the divide between management teams and shareholders. Castellanos
(2015) explains that this gap, known as the Fundamental Agency Problem, occurs when

9
managements (agents) act in their own interest at the expense of the interests of their
principals (shareholders). Academics and the investment public recognized this and
began to speak up. Economist Milton Friedman, for one, renewed the focus on
shareholder primacy in 1970 when he published “The Social Responsibility of Business is
to Increase Its Profits” in The New York Times Magazine, suggesting that the “one and
only one social responsibility of business–[is] to increase its profits [for shareholders] so
long as it stays within the rules of the game” (Friedman 1970).
Activism 1.0: Fear the Corporate Raider
Friedman’s philosophical doctrine, along with contemporaneous academic and
regulatory developments and the bravado of a few wealthy individuals, set the stage for
activist investing to come into its own during the 1970s and 1980s. Infamous corporate
raiders such as Carl Icahn, T. Boone Pickens, Ronald Perelman and Nelson Peltz used
their own money to buy controlling positions in public companies and launch proxy
contests for board control, usually with the goal of replacing management or breaking up
the company to increase the value of their individual holdings. Hostile tender offers
became a popular tool to buyout shareholders without having to lobby for their support
and could be quite lucrative. Icahn’s 1985 hostile takeover and subsequent asset sales at
Trans World Airlines earned him a personal profit of $469 million, while leaving TWA
with $540 million in debt (Grant 2014).
In response to these unwanted solicitations, many companies adopted anti-
takeover provisions intended to protect against exploitation by the corporate raiders.
Such defensive board tactics, including poison pills and golden parachutes, often had the
desired effect of pressuring potential buyers to increase their bids. But the strong stock

10
markets that followed, along with legislation that invalidated many restrictive
antitakeover provisions and strengthened minority shareholder rights, ultimately led to a
dramatic decline of these large scale corporate raids.
Activism 2.0: Welcome the White Knight?
Despite the sudden demise of their strategy, the investment success of these astute
businessmen’s acquisitions and turnarounds did not go unnoticed. The result was the
1990s arrival of a new type of activist, one who raised money from outside investors and
pursued minority board representation in order to influence corporate strategy on issues
beyond M&A activity, namely operational efficiency and/or financial restructuring.
These activists embraced existing management teams, often allowing them to co-invest in
taking the company private in what became known as leveraged, or management, buyouts
(LBOs and MBOs). Outside of the public limelight, the so-called “white knights” (such
as KKR & Co. and Forstmann Little & Co.) were more successful at convincing
executives to make the changes they felt were necessary for their investments to later re-
emerge as more profitable and promising public entities. Attractive and plentiful junk
bond financing was a strong enabler. Buyout returns were quite impressive until higher
acquisition prices and rising rates took their toll on deal economics and the number of
attractive investment candidates relatedly dwindled.
All the while, institutional ownership of public shares was accelerating, especially
in the passive index strategy. Index investors are unable to do the “Wall Street Walk”
and sell when they lose faith in a company’s prospects; rather, they must maintain
ownership in all companies required to replicate their chosen index. Accordingly, they
can either sit quiet and wait, or can elect to prod their portfolio companies into better

11
performance by adopting activist-like techniques. The activist community was about to
morph again.
Activism 3.0: Modern Activism
Today, activism has become a mainstream investment strategy, evidenced by the
number and breadth of players as well as the magnitude of invested assets. No longer is
the term "activist" associated with the corporate raiders of the 1970s and 1980s, or the
MBO and LBO firms of the 1990s. Instead activism is now perceived as a "value-based
strategy that optimizes untapped shareholder wealth" (Romito 2015). This new
generation includes Third Point Partners, ValueAct Capital Partners, Starboard Value,
Pershing Square Capital and a re-focused Elliott Management, some of whom were
founded by protégés of the old guard. There are also occasional activists, who do not
pursue activism as a stated strategy but often publicly criticize their portfolio companies
to affect change, and spontaneous activists, namely more conventional investors who
simply choose to engage with management teams rather than selling their stakes. Even
some corporations themselves are entering the activist investor fray. These newcomers
are driving new activist fund formation and the number of new activist campaigns to
record levels.
Activists are also pursuing friendly private overtures with increasing frequency,
evidencing that their desire to affect change is often greater than their desire to be
disruptive. Accordingly, unlikely associates have now joined forces, as traditional
investors have bought into the very funds they once shunned and partnered in co-invest
deals with their former nemeses (Gallagher, Drippe 2015; Romito 2015; “Activist
Investing: An Annual Review of Trends in Shareholder Activism” 2016). For example,

12
top tier asset manager Neuberger Berman purchased a 20% stake in JANA Partners in
2014 and one of the largest index investors, State Street Global Advisors, has publicly
stated that it engages with activists (Toonkel 2015). Traditional investors are even
surfacing potential targets in what have become fondly known as RFAs (requests for
activism) (Goldhaber 2015; Gelles, De La Merced 2014). To wit, Bill Ackman, of
Pershing Square Capital, notes that “Periodically, we are approached by large institutions
who are disappointed with the performance of companies they are invested in to see if we
would be interested in playing an active role in effectuating change” (Gelles, De La
Merced 2014).
Jack Inglis, AIMA CEO, points out that “hedge funds generally make more
proficient activists” and that traditional institutional investors, when they do pursue an
activist agenda, rarely achieve substantial benefits for shareholders (“Unlocking Value:
The Positive Role of Activist Hedge Funds” 2015). Despite the economies of scale
available to larger institutions, these hedge fund activists enjoy several regulatory,
structural and organizational advantages. Accredited investor requirements characteristic
of the alternative investment structure relieve them of the need to protect the retail
investor with diversification and conservatism, enabling them to make concentrated,
meaningful and higher risk bets. Moreover, the infamous profit-based compensation
structure of hedge fund managers highly incents them to dedicate their resources to
proactively engage management teams to enhance profitability. With significant personal
wealth often tied up in their portfolio, hedge fund activists have additional motivation to
impart change that drives absolute shareholder returns. Hedge funds are also less bound
by investment horizons, political sensitivities or client agendas as compared to traditional

13
fiduciaries such as pension funds, index funds and mutual funds. Their independent,
unaffiliated status allows them greater flexibility to pursue controversial and assertive
campaigns without fear of related party backlash. Prevost and Rao (2000) find that
public pension fund activism is actually associated with share price declines at the target
companies (Denes et al 2016). As such, it is not surprising that Schulte Roth & Zabel’s
Fall 2016 Shareholder Activism Survey revealed that activist respondents believe hedge
funds will be the group that initiates the most activist investing over the coming year, and
that the volume of activism will at least remain constant if not increase (“Activist
Investing: An Annual Review of Trends in Shareholder Activism” 2016). From this point
forward, unless otherwise noted, the term “activists” in this report will refer to the hedge
fund activists driving the current modern activism movement.
II: Activist Investing as an Asset Class
The increase in activist investing has been dramatic and evidenced by trends in
assets under management, new fund formation and the number of activist campaigns, not
to mention media attention devoted to the topic. Growth in each of these measures
reflects the outperformance of activist funds themselves as well as the overall acceptance
of the investment strategy by more traditional capital markets participants.
The “A” Stands for Alpha
The most obvious appeal of activist investing reflects its potential to generate
strong alpha, i.e., excess returns relative to a given benchmark. Especially in today’s
markets, with active fund managers so broadly and routinely underperforming passive
ones, investors are seeking any chance for strong relative performance. Sullivan &
14
Cromwell, in its 2016 U.S. Shareholder Activist Review and Analysis, notes that “Not all
activist campaigns have been successful and not all funds are successful, but activist
funds as a group have been successful at generating significant alpha”. As represented by
the Novus Activist Portfolio, activist hedge funds as a group have returned 10.7%
annualized, outperforming both the S&P500 (7.6% CAGR) and the MSCI World Index
(6.1% CAGR) from 2004 through 2016 (Gelles, De La Merced 2014). Top activists also
perform better than many hedge funds overall, averaging 9.8% compound annual returns
from 01/2009-12/2017 versus returns of 7.5% for overall event-driven funds, as measured
by HFR data (White 2017).
A higher level of risk is a necessary evil that accompanies the reward potential of
any event-driven investment. Activists make meaningful, concentrated bets that often
have unpredictable and singular catalyst realizations. The volatility associated with the
strategy is captured in higher standard deviations and lower Sharpe Ratios, which do
lower the strategy’s risk-adjusted returns somewhat. Yet top activists continue to have
remarkable scorecards, as highlighted in Table 1.
Increasing Acceptance Creates its Own Asset Class
Assets under management (AUM) at activist funds topped $170 billion as of June
2017, up from $47 billion following the financial crisis in 2009 and less than $3 billion at
the turn of the century.3 The rise is commensurate with activists’ track record in
concurrently improving performance at their target companies and generating substantial
returns for their own investors, as well as with the increase in alternative investment
funds overall (Inglis 2015). Further, this capital influx has fueled a vicious cycle of
3 Data according to www.hedgefundresearch.com

15
higher investment dollars enabling more and larger activist campaigns, leading to greater
activist clout at target companies, thus generating more likely campaign success and
superior returns and ultimately circling back to increased capital inflows for established
and new activist funds. Figures 1 and 2 quantify the strong and sustainable pace of new
fund formation and the surging number of both activist campaigns and target companies.
There is indeed plenty of room to grow, as shareholder activism accounts for less
than 4% of $3 trillion in assets managed by wider alternative investment universe (Inglis
2015). Concurrently, activists are enjoying increasing receptivity in the market for their
strategies, accomplishments and tactics, among other investors and companies alike. FTI
Consulting’s 2015 survey of institutional investors found that most investors favorably
view activists as a catalyst for change that aligns management incentives and sharpens
their strategic focus. Schulte Roth & Zabel’s 2016 survey of activists themselves also
noted that “92% of respondents believe institutional investors are more accepting of
activists than in previous years” (“Activist Investing: An Annual Review of Trends in
Shareholder Activism” 2016). Notably, a full 15% of S&P500 companies “have faced an
activist campaign [since 2009] and 50% of S&P500 firms have had an activist on their
share register over that period” (“An Investor Calls” 2015).
The Environment Remains Favorable
Like the markets they play in, the rise in activist assets under management has
had its ebbs and flows. More specifically, the boom of the early 2000's turned into a bust
with the onset of the financial crisis in late 2007. The following two years saw investors
withdraw almost all of the activist-designated capital they had invested in the prior four,
as activist hedge funds underperformed nearly every other hedge fund strategy (Brav et al

16
2008). The economic downturn made it difficult for activists to finance successful
campaigns and fewer dollars made it tougher to convince managements, who were
focused on survival, to make any changes at all. By 2009 however, activism’s attraction
resumed, and even accelerated, its upward march. Activity prospered in the low interest
rate, cash-rich balance sheet, high M&A, politically-friendly and new high-hitting equity
market environment. “In addition, the second wave of hedge fund activism has benefited
from greater familiarity and experience among investors in activist funds, other large
shareholders of targeted companies, management and directors of those companies,
influential observers and the activists themselves. With added experience, capital and
rivals, activist funds have also become more ambitious, targeting larger, often well-
performing companies” (“Unlocking Value: The Positive Role of Activist Hedge Funds”
2015).
A comparison of FTI’s annual surveys from 2012-2016 highlights that a growing
majority of activist investors forecast activism levels will stay constant or increase.
Several underlying fundamental factors portend continued strength in the strategy’s
appeal. First, macroeconomic factors such as relatively low interest rates and high levels
of M&A will continue to present opportunities for activists to pursue investments with
attractive relative yields. Second, activist agendas continue to gain legitimacy from the
support of third party professional services providers. The 2003 SEC change that
required institutional investors to disclose their voting on governance matters gave rise to
a reliance on proxy advisory firms and such firms tend to side with activists rather than
corporate leadership in proxy battles (“Activist Investing: An Annual Review of Trends
in Shareholder Activism” 2017; Semuels 2016). In addition, law firms, investment

17
banks, consultants and even large corporations have set up practices dedicated to what
they call “corporate preparedness” and “shareholder defense” (LaFon 2015). Third, the
interests between management and shareholders need better alignment. Many executive
compensation arrangements are still considered either egregious or uncorrelated with
corporate performance, and the recent frequency of corporate scandals has exposed the
need for more fiduciary accountability on behalf of corporate boards and investment
managers. Fourth, the cost of activism has dropped, as new regulations and increased
institutional investor support, coupled with high institutional share ownership, have
allowed activists to leverage their resources with smaller investments (Coffee and Palia
2015). Efficiencies from social media and the new information dissemination techniques
have also economically extended the activist reach with minimal cost. Last, but not least,
the very prevalence of activists has lowered the negative stigma associated with their
actions, enhancing their status as attractive shareholders for successful public
corporations. In addition, their willingness to work behind the scenes and approach
situations in a friendly, rather than hostile, manner makes them more amenable partners
as well.
Recently, activists underperformed the S&P500 by almost 8% from June 2015
through year end 2016. As such, activist fund flows did decline in 1H 2016 for the first
time since 2009, following the weak overall performance. Sullivan & Cromwell, LLP
astutely notes in its 2016 U.S. Shareholder Activism Review and Analysis, that this
fluctuation in AUM suggests that “any headwinds encountered by these funds in
identifying and capitalizing on activism opportunities can raise significant fundraising
and fund-retention challenges.” In 2017, activist returns generally lagged those of major

18
indices again as value fell out of favor, as shown in Figure 3 (“Activist Investing: An
Annual Review of Trends in Shareholder Activism” 2018). It is too soon to gauge the
fundraising impact of such performance, but activists continued to deploy record amounts
of capital nonetheless. As Activist Insight highlighted in its 2018 review, “if activism can
broaden in times of rising markets, a scenario in which funds become more reluctant to
engage seems hard to imagine” (“Activist Investing: An Annual Review of Trends in
Shareholder Activism” 2018).
III: The Players, Objectives and Tactics
A Story of Two Camps
Those in the corporate corner assert that activists are myopic predators, looking
for an immediate payout with no regard for the interests of others. This short-termism
theme is associated with an allegation of wealth transfer from creditors and employees to
shareholders, as opposed to genuine long-term value creation. It also accuses activists of
reducing necessary investments in R&D, increasing corporate leverage, depleting cash
and artificially driving M&A activity. In reference to the recent surge, Warren Buffett
says he has "zero interest" in joining the fray because, although activism makes sense in
certain cases… when corporations are mismanaged to the detriment of shareholders," he
believes that the majority of their targets don't fit that description (LaFon 2015).
At its extreme, this camp blames activist hedge funds for America's
macroeconomic problems of “economic stagnation and inequality since the financial
crisis" and even relates the rise of shareholder-oriented governance to the fall of GDP in
certain European countries since the early 1970s (Goldhaber 2015; Lipton 2013). Some

19
of the largest institutional investors agree: Blackrock's chief executive, Larry Fink, has
said that the strategies pursued by activists "destroy jobs" (Alden 2014). Attorney Martin
Lipton, inventor of the famed poison pill defense to corporate takeovers, declares "the
only difference between corporate raiding and modern activism is that the Icahns of the
world figure out how to get their way with only 2% of the share register" (Goldhaber
2015). Columbia Law professor John Coffee and team agree with the possibility that
"increasing rate of hedge fund activism is beginning to compel corporate boards…to
forgo long-term investments…in favor of a short term policy of maximizing shareholder
payout in the form of dividends and stock buybacks," which they consider a "serious
externality... that may justify greater transparency and reducing tax subsidy for such
activities" (Coffee and Palia 2015).
Activists, on the other hand, genuinely feel they are injecting a "breadth of fresh
air in the complacent world of the American corporation" by engineering beneficial
change that helps companies optimize shareholder value (“An Investor Calls”). These
self-proclaimed defenders of corporate value and stewards of capital reason that the
challenges they bring to bear induce corporate leaders to behave with greater
accountability and transparency, benefiting the investing public. Harvard Law professor
Lucien Bebchuck and Duke Professor of Finance Alon Brav are among the most oft-cited
champions of this view. Bebchuk’s 2015 study, "The Long-Term Effects of Hedge Fund
Activism," examines a large sample of activist interventions over a five year period and
finds no evidence that short term improvements in operating performance or stock returns
come at the expense of longer term gains. Brav’s 2008 proprietary analysis of data from

20
2001-2006 adds that the strategic, operational and financial remedies promoted by
activists succeed 2/3 of the time.
Famed activist Nelson Peltz asserts that new age market dynamics are pushing
investors to activism because high frequency trading and immediate information
dissemination have eliminated the mispricings once discoverable through proprietary
research, forcing investors to create their own opportunities for superior returns. “The
markets have gotten too efficient. Instead of trying to figure out what’s going to happen,
we’re buying stock, and our goal is to get the company to do something that’s in the best
interest of shareholders,” he proclaimed in a recent interview. Bill Ackman adds that “It
is hard for activism to be harmful…If the ideas are good, they will happen. If they are
bad, they won’t get support” (“An Investor Calls” 2015). Furthermore, activist investors
possess a stated mission to act as a catalyst for change and the mandate to do the
impartial, hard-hitting forensic analysis that overstretched benchmark-focused passive
institutional investors do not. In response to criticism that they are detrimental to long-
term business investment, activists counter that they fill unmet needs to increase
corporate efficiency and concurrently prevent managers from unproductive overspending
and potentially abusing their unchecked power in other ways as well. In their 2015 paper,
Coffee and Palia note that Bebchuk praises their “investment-limiting interventions” that
“move targets toward …optimal investment levels” because managements are often
biased towards empire building (Coffee and Palia 2015).
Activist Types
Today's activist investors can be objectively classified in terms of their tenure,
size and campaign frequency. Data provider Factset’s Shark Repellant service has coined

21
its own nomenclature based on tiers including the Sharkwatch 50 and Known Activists.4
These two subsets are launching new campaigns at a lesser rate in recent years than a
third identified group: First-Time Activists. This growing new player presence
underscores the broadening popularity of the activist strategy, which also includes non-
dedicated activists such as multi-strategy hedge funds, pension funds, religious groups
and even large corporations. Our report will classify activists as either Top Activists,
those who are established, active and well-funded, or Other Activists.
Activists can be further differentiated based on their usual deal objectives and
investment strategies, or tactics. The breadth of these measures mirrors the variety of
investor types who believe that they can create shareholder value better than management
teams and corporate boards. The prevalence of any singular campaign complexion
fluctuates over time, based on current market dynamics and the stylistic preferences and
analytical rationale of the most prolific investors of the moment. Daniel Loeb of Third
Point is known for his frequent poison pen letters which publicly criticize managements
in very open forums and stand in stark contrast to JANA Partners’ more constructive and
collaborative approach. Elliott Associates is willing to fully acquire its portfolio
companies outright, while Starboard Value and ValueAct Capital often streamline and
simplify their targets. Ebbs and flows can also mimic the successful “strategy du jour.”
To wit, governance and diversity are currently hot issues while return of capital and
balance sheet structure are not as popular at the moment.
4 The SharkWatch 50 represents 50 activists who Shark Repellant deems most prominent based on activity level and ability to affect change. Known Activists encompass other established activists, many run by offspring from larger firms, who have initiated five or more high impact campaigns.

22
Campaign Objectives
Activist deal objectives generally fall into three categories: social; business and
governance. Of note, these motivations are not mutually exclusive, as a campaign for
governance change may raise the likelihood of a successful strategic initiative or result in
enlightened corporate citizenship. They are often, but not always, publicized at the outset
in regulatory filings such as the “Item 4: Purpose of Transaction” section of the 13D
filing, but may morph and evolve as dialogue progresses. Sometimes the demands are
clearly being made to boards of directors, other times they take the form of appeals to
shareholders (including, but not limited to, proxy battles).
• Social activism includes environmental and human rights motivations and
frequently involves organizations that may not even own stock in the target (think
PETA). Michael Levin, of The Activist Investor, goes so far as to suggest that
these “special interest” activists not be taken too seriously given their intent is
more to express a particular view than to create a profitable investment (Levin
2010). Perhaps this explains why relatively few corporate social responsibility
(CSR) campaigns actually pass. Nonetheless they are still highly influential and
stimulate change at major companies. In fact, one recent study in particular
concludes that firms that are consistently targeted by social activists eventually
adopt more socially conscious practices (McDonnell et al 2015).
• Business activism encompasses a variety of demands related to strategy/M&A,
operational issues and capital structure. These matters strike at the heart of a
business and the decision making ability of management. As such, these

23
engagements are usually contentious and can have a significant impact on a firm’s
daily activities.
o Strategic/M&A: These demands are aimed at management or the Board
and can involve acquisition of the target, the target as acquirer, spinning
off non-core or underperforming operations or even opposing a strategic
transaction or seeking a higher premium in a sale. This demand category
also includes the hiring an investment bank to explore strategic
alternatives. A few examples follow.
§ In 2014, Icahn Enterprises acquired a large stake in eBay in order
to press the parent to spinoff its growth vehicle, PayPal.
§ The 13D-stated purpose of JANA’s campaign in 2017 against
Whole Foods Market was to “hire an investment bank to explore
strategic alternatives.”
§ The Icahn/Southeastern Asset Management alliance in 2013
opposing DELL Inc.’s going private transaction was, while
unsuccessful at blocking the MBO, able to drive up the
consideration paid to shareholders in the deal
(www.13dmonitor.com).
o Operational: This strategy encompasses efforts to reduce corporate cost
structure or replace CEO or other management team members, or to alter
business execution in other operational focus areas. For example, Trian’s
2015 campaign against GE was focused not only on spinoff potential, but

24
also on reducing cost structure and optimizing capital allocation
(www.13dmonitor.com).
o Capital Structure: Financial engineering is commonly perceived to be a
major goal of activism due to its historic dominance, but, in modern
activism, balance sheet restructuring accounted for a minority of activist
campaigns of late. Today’s companies, it seems, have largely caught on to
the fact that high cash levels and large amounts of other underperforming
assets make them prime activist candidates. For instance, Icahn
Enterprises followed on Greenlight Capital’s effort in 2013 to pressure
Apple Inc. to distribute more of its significant cash stockpile to investors
via a larger than already-announced share buyback and the company
eventually complied (www.13dmonitor.com).
• Governance activism agitates for change in a company’s internal controls and
policies, such as board configuration, composition and representation, executive
compensation and other areas of disclosure and shareholder rights. This
campaign objective typically accompany additional activist demands, and thus
represents the most common form of activist proposal. Researchers, however, find
mixed results at best in terms of the standalone impact on business performance
of governance campaigns and note that “Governance changes are frequently
sought by activist funds as a step towards achieving operational or strategic
changes” (Levin 2010, “Unlocking Value: The Positive Role of Activist Hedge
Funds” 2015).

25
In light of the above discussion and given the information presented by 13D Monitor,
our regression evaluates the three principal business activism objectives (strategic/M&A,
operations, and capital structure) alongside that of governance.
The man behind The Activist Investor, Michael Levin, offers a novel incremental
premise to justify activist activity: Risk Activism. This concept acknowledges that
investors are risk takers by nature, while most executives have a lower risk tolerance due
to their high economic and reputational dependence on their singular company, and the
overriding responsibility they have for their employees’ livelihoods. This divergent risk
profile between investors and executives raises the likelihood that overly conservative,
and often inferior, business judgments will be made by the latter, at least in the eyes of
the former. “Risk activists seek to align executive risk behavior with investor risk
appetite,” so that enterprising shareholders are not unduly burdened by corporate
management’s “wasteful risk aversion” ("Managing Shareholder Activism in a New Era."
2015).
Investment Strategies and Tactics
While the core pressure points of campaign objectives have changed very little over
the years, activists’ investment approaches have evolved fairly dramatically. Table 2
indicates the range of activist tactics over a recent 17 year period. The once common
hostile takeover has largely given way to a broad array of somewhat friendlier strategies,
covering the spectrum from discreet meeting requests to aggressive publicity campaigns,
and from inexpensive and frequent 500 word shareholder proposals to private proxy
solicitations among major shareholders. That said, headline-grabbing public proxy
battles, which can easily cost activists more than $7 million each, still comprise nearly

26
10% of the activity among well-funded hedge fund activists (Gantchev 2011; “Unlocking
Value: The Positive Role of Activist Hedge Funds” 2015). One explanation is that
“shareholder proposals usually are not associated with significant changes in firm values
or with earnings improvements, whereas hedge fund activism usually is” (Denes,
Karpoff, McWilliams 2016). The range of possibilities in the activist’s playbook can be
evaluated along the following lines, many of which are utilized in our regression.
• Private vs. Public. The private approach includes letters, meetings and other
behind-the-scenes negotiations with management teams and boards. It is most
prevalent, though underreported by its very nature, and tends to be favorably
received by smart executives willing to sift through the unsolicited advice. When
private activism is unsuccessful, due to an unapproachable or closed-minded
reception, activists will typically go public with their demands. They may choose
to publish their investment rationale in open letters, disclose their intentions via
13D filings or issue press releases to disseminate their case. The idea is to not
only convince management to make a change but also to gain the support of other
shareholders for their critique.
• Friendly vs. Hostile. Irrespective of the level of exposure, the tone of a campaign
can fall along a continuum from collaborative to antagonistic. Brav et al find that
non-hostile campaigns have a 30% greater success rate than hostile ones (Brav
2008). Historically, European style activism in particular has tended to have a
“constructivist” nature, but lately European and U.S. activist tactics have been
converging. The former’s closed door settlements have become more

27
commonplace in America simultaneous with U.S. media-driven, public proxy
battles becoming the trend in the U.K. (Skroupa 2017)
• Board Seat Emphasis. Board nominations, when successful, offer activists
themselves, or their chosen nominees, literally a seat at the table on all pressing
corporate issues and for an extended period of time. The Wall Street Journal’s
2015 study concludes that attaining a board seat is “the best chance an activist has
at driving outperformance at big companies” (Benoit, Monga 2015). The tactic is
aggressive: Brav notes that only 14% of activist funds seeking board
representation do so without a proxy contest (Kerr 2008). Running vote no
campaigns against incumbent directors, whereby activists urge others to withhold
votes for a particular candidate, can often be more cost effective and less time
consuming ("Managing Shareholder Activism in a New Era." 2015). Majority
slate changes are even gaining some traction. In 2013, Starboard initiated a
successful campaign to replace the full slate of Darden Restaurant Inc’s board of
directors (Castellanos 2015). Starboard recently launched a campaign against
Newell aiming to oust the entire board and the company’s CEO (Terlep 2018).
• Investment Time Horizon. Activists are stereotypically accused of having trader-
like mentalities, but holding periods have recently doubled, from an average of
1.5 years to 3 years ("The Shareholder Activists' View”). This is consistent with
the popularity of friendly campaigns, which tend to involve lengthier and closer
working relationships between activists and managements. When deal objectives
are more operational in nature, as opposed to M&A focused, durations also tend
to be longer.

28
• Stake Size. Savvy derivative usage, institutional partnering and the wolfpack
mentality allow activists to exert influence with a 2-3% stake as opposed to the 5-
10% stake that used to be necessary to gain management attention (Gallagher,
Drippe 2015). The side benefit of not having to breach the 5% 13D disclosure
threshold has moreover facilitated more diplomatic contact with management. A
study conducted by Denes et al, however, concludes that undemocratic activism
that adopts the characteristics of corporate takeovers, especially significant
stockholdings, is associated with greater improvement in share values and firm
operations at target companies. It also asserts that activism that lacks the
formation of large ownership blocks is only associated with minor changes in
target firm share value and operations (Denes, Karpoff, McWilliams 2016).
The past decade's rise in activist investing has predictably caused a widening of
the target net in terms of industry, geography and market cap. On the industry front, those
once shunned as too regulated or binary and thus difficult for investors to influence, such
as oil & gas, financial, even some biotechnology, have recently joined the radar (“The
Activist Report: 10 Questions with Mattew Drapkin” 2016). Geographically, the
perceived crowding of the US market has led to a global search for investment
opportunities.
From a market cap perspective, smaller caps have historically borne the brunt of
activism. They are easier to gain a foothold in, their managements are more easily
influenced, their shareholder bases are generally less sophisticated and there are a greater
number of small cap companies on today's exchanges (“The Activist Report: 10

29
Questions with Mattew Drapkin” 2016). That said, with fewer concerns showing
persistently low ROEs and trading below liquidation value, and significant amounts of
activist capital awaiting investment, activists are now looking at larger valuation targets
once thought to be beyond reach for all but the largest investors due to the sheer cost
involved in acquiring a stake. Recent trends have mitigated this concern. Institutional
support, wolfpack strategies, follow on investing and the media loudspeaker have made it
more efficient for activists to pursue larger targets; almost 60% of campaigns now
address companies with market caps in excess of $25 billion (Zenner et al
2015). According to FactSet, from 2009 through 2016 the average market cap of activist
target companies nearly quadrupled to $4.7 billion from $1.2 billion. The number of
mega and large cap campaigns increased five-fold, to 30 from six, accounting for 8% of
total campaign volume for the year up from 3%, over that same time (Birstingl 2016;
“Activist Investing: An Annual Review of Trends in Shareholder Activism” 2017).5 In
2017, activist targets with market caps in excess of $10 billion made up 21 % of the
year’s deals (“Activist Investing: An Annual Review of Trends in Shareholder Activism”
2018). Table 3 presents another interesting illustration of market cap growth. This
proprietary analysis of data from 13D Monitor reveals that, for any of today’s top
activists, the average equity valuation of exited UTT positions was between five and 32
times greater than the average exited 13D filing target’s market cap. Given that the
earliest UTT filings joined the database in 2013, this represents additional evidence of
recent interest in larger equity value targets.
5 We define mega cap targets as those having a market capitalization greater than $50 billion and large cap targets as those with market caps between $10 and $50 billion, consistent with the majority of research published on the topic.

30
It is important to note that just as activists have matured in their investment styles
and tactics, so too have companies in their creativity and drive to repel them. A large
number of professional services firms, including investment banks, law firms and
consultants, have developed practices dedicated to advising target companies on how to
interact with, or better yet not enter the crosshairs of, activists, and many companies
themselves are formalizing their own response teams and approaches to potential
unwanted shareholders (Bryan 2016).
IV: Existing Literature Review
Numerous academic studies conducted over the past few decades assess the
efficacy of shareholder activism and activist investors’ ability to create shareholder value
at their target companies. This impact is primarily measured in two ways: stock price
performance and corporate operational performance. Researchers compare the results
generated at the target companies over a given time period to either broader market
averages, industry peer group benchmarks or other matched control samples in order to
calculate abnormal, or excess, returns attributable to the activist intervention. Generally
speaking, the conclusions reveal positive excess stock price gains post activist event, but
mixed evidence in terms of operational improvements. The most significant findings of
these earlier investigations, and their unique points of differentiation, are highlighted in
this section.
Notably, of the datasets previously utilized, all but Krishnan (2015) date back to
before 2009 and thus do not encompass the recent surge in activism since the global
financial crisis of 2008. Accordingly, an important contribution of our paper to existing

31
knowledge is that it extends the shareholder value creation time frame into current years.
In addition, our empirical study concentrates solely on stock performance impact due to
time constraints. Future research could be conducted to explore activist-driven
operational improvements by analyzing changes post intervention in measures such as
return on assets, Tobin’s Q, sales growth and R&D spending.
Stock Performance
Stock price reactions are instantaneous and easily monitored measures of activist
impact; they are an immediate check and balance in the court of public opinion. They are
also anticipatory, as investors buy and sell to factor in expected outcomes, and can be
unjustifiably fickle, and subject to herd-mentality, at times. The largest debates
pertaining to share price performance do not center on whether shareholder activism
boosts overall stock prices, but rather focus on its timing, sustainability and underlying
cause.
As would be expected given the frequent allegations of activist “short-termism,”
many studies investigate the stock performance impact at activist investments by delving
into stock price fluctuations surrounding the 13D event window. More specifically, these
researchers break down stock returns into two main segments around this filing date, t:
the “before” (t-x) and the “after” (t+x). The most popular “before” period appears to be
t-ten days, or (t-10), which is justifiable given disclosure regulations and investor habits.
If an activist has ten days after crossing the 5% threshold in which to file a 13D form,
then he is likely still accumulating within that 10-day period and the subject stock may
reflect that buy interest by rising in price. To wit, Bebchuk et al (2013) observe that
activists typically file their 13Ds between eight and ten days after exceeding 5%
32
ownership and disproportionately concentrate their buying on the day they cross the
threshold and the next day. So (t-10) not only includes that entire time frame, but is also
not too long so as to permit share price movement from an excessive noise factor due to
unrelated compounding events (i.e., earnings releases, CEO departure, etc.) and
simultaneously not too short to prevent information leakage and wolfpack-related buying
patterns to be included in the stock price move. The “during” period consistently refers to
the day of filing, known as the event, or simply as t. The “after” window is very broad,
and a function of whether the study is examining short term returns (t+10 and t+20 are
common) or longer-term returns (which range from one-five years post activist event).
Short Term Stock Price Effects
The earliest analyses in this regard explore the influence of activism spearheaded
by traditional institutional investors, primarily mutual funds and pension funds, from the
late 1980s and early 1990s. In these instances, Gillan and Starks (2000) and Del Guercia
and Hawkins (1999) find insignificant abnormal stock returns in brief periods around the
proxy mailing date and initial announcement date, respectively. Recent studies, however,
are much more relevant in that they focus on modern day hedge fund activism and
current campaign datasets. They show that Activism 3.0, as we label it, produces an
opposite result and that abnormal excess short-term stock returns are generated when
activists join the shareholder register. Denes et al (2016) relatedly acknowledge that
“Research based on shareholder activism from the 1980s and 1990s generally finds few
consequential effects, while activism in more recent years is more frequently associated
with increased share values and operating performance.”

33
There are a few outliers whose research contradicts the consensus regarding
positive evidence and implications of short term price returns around the 13D filing.
Brigida (2012), for one, studied 123 campaigns from 2004-2007 and concluded that
nearly all of the positive price effect resulting from a 13D filing occurs in the (t-10, t-6)
window, suggesting the only one to benefit is the activist himself. The preponderance of
researchers, however, confirm that initiation of an activist campaign boosts short term
stock prices, benefiting shareholders overall, as outlined below.
Brav, Jiang, Partnoy and Thomas (2008) examined a hand-collected dataset of
882 campaigns from 2001-2006 and document a +7% abnormal return surrounding (t-20,
t+20). Notably, more than half of that return occurs in the 10 days prior to the filing, and
is accompanied by high share turnover. They attribute this large “before” performance to
10 day filing period logistics that allow the filing firm to buy prior to announcement, as
well as to wolf pack investing and information leakage. Clifford (2008) studied activist
hedge fund activity from 1998-2005 and similarly observes positive excess returns of
3.39% in the 5 day window around the filing (t-2, t+2). Further, he documents a higher
return for targets whose hedge fund owners state active investment intentions in the 13D
filing, versus those of targets whose same hedge fund owners list a passive investment
purpose, consistent with the theory that the market values an activist’s ability to add
value to the target. In other words, the market does not jump equally on the bandwagon
for any investor who takes a greater than 5% stake. Klein and Zur (2009) also find a
pattern of significant positive market reaction around t in their research of 151 13D
filings by hedge fund activists between 2003 and 2005. Specifically, they calculate a
+10.7% mean abnormal return for campaigns in which activists achieve their stated goals

34
over the (t-30, t+5) window and a +2.6% for those targets whose campaigns are
unsuccessful. While their dataset is much smaller than that in prior studies, their research
is comprehensive regarding short-term stock returns relative to size, market- and
industry-adjusted benchmarks, 13D “purpose statement” and filing outcome (obtains
stated goals, receives board seat, ultimate merger). Boyson and Mooradian (2009) study
campaigns from 1994-2005 and find cumulative abnormal returns (CAR) of +4.8%
around the event window (t-25, t+25) for all targets, yet a +10.5% for the 20% subsample
that fits the “intense activism” target category, reflecting deal objective, campaign tactics
and other like. Greenwood and Schor (2009) analyze 980 targets from 1993 to 2006 and
find short term returns are significantly higher for targets that are ultimately acquired,
namely +5.72% vs. +2.36% (t-10, t+5). Most comprehensively, Bebchuk, Brav and Jiang
(2015) document a short term spike of 6% in the 40 days surrounding the filing, i.e., (t-
20, t+20) for their a dataset of 2,000 targets from vintage years 1994-2007. Most recently,
Krishnan, Partnoy and Thomas (2015) examine 1,003 targets from 2008-2014 and
confirm high and persistent returns of +7% during (t-10, t+10). Krishnan et al (2015)
also develop a hedge fund reputation index and use it to quantify that, during this
window, the targets of the top activists outperform (+10.63% vs. 6.72%) the averages.
Their survey is especially notable as it shows that high abnormal returns persist even as
the number of activists and number of interventions increase.
Long Term Stock Price Effects
Brav (2008) remarks that the fact that activists do not sell immediately post the
short term pops, instead holding on for an average one-three year investment horizon,
indicates that they believe there are future stock gains to be captured once their campaign

35
objectives are implemented. Studies with longer event windows suggest this is indeed
the case, especially when such objectives are achieved.
Investigations into longer term buy and hold results determine that, on average,
activist interventions do produce long term share outperformance for their corporate
targets. Brav et al (2008) document that the early positive returns noted above do not
reverse in subsequent years and thus are not just the result of a trading friction around t.
Specifically, for deals with vintage years 2001-2006, they quantify buy-and-hold-
average-returns (BHAR) from t-30 through the exit date (or December 31, 2006 if there
is no exit date) of 33.0% annualized in terms of raw deal holding-period which remain
significantly positive when adjusted for market and size at +20.6% and +14.3%,
respectively. The authors do acknowledge that such returns may be affected, but are not
driven by, a few extreme outliers. The aforementioned 2015 study by Bebchuk, Brav
and Jiang finds that markets correctly anticipate an activist’s eventual effect and reiterates
that short term gains by activist targets do not come at the expense of long term
performance but rather predict long term results. They quantify positive monthly alphas
using multiple standard models for the three-and five-year periods post intervention, and
positive value-weighted BHARs of 2.58% for (t+1 month, t+36 months) and 5.81% for
(t+1 month, t+60 months). Interestingly, they compute a positive BHAR of 25.78% for
the three years post activist exit as well, refuting a perception that activists “pump and
dump” their investments. Gantchev (2011) updates Brav’s BHAR analysis from t-30
through the exit date (or December 31, 2007 if there is no exit date) and finds a
comparable annualized mean raw return of 31.48%. He then subtracts a proprietary
calculation of activist costs and finds that size-adjusted abnormal returns drop to 7.6%,

36
leading him to conclude that only the top quartile of activists earn returns that justify the
large cost of their engagement.
Klein and Zur (2009) quantify abnormal returns of +11.4% in the one year
following an intervention, and affirm that the greatest gains are usually accompanied by
high campaign success and at least one board seat win. This is consistent with a 2015
study by The Wall Street Journal of 71 activist campaigns which found that the best
chance for activist success came with attaining a board seat. Of the 38 targets that
outperformed their industry peer group, activists held board seats at 24. In that spirit,
Clifford (2008) finds that the favorable announcement returns for activist blockholders
persist over longer event windows, both absolutely and relative to those of passive
blockholders (average excess returns of 22.32% one year post event vs. versus 7.80%,
respectively). Further, Clifford highlights that in cases where the blockholder changes its
stated intention from passive to active in any subsequent filing, the target earns an
additional +1.98% return.
Several studies suggest that shareholder activism primarily creates value by
producing takeover opportunities for target companies, even when the acquisition attempt
fails. Greenwood and Schorr’s focus on the relationship between activists and
acquisitions finds that an average +10.26% positive return is generated in the (t-1 month,
t+18 months) window for the typical intervention. Importantly, this is comprised of a
+25.85% long term positive return when the target is acquired within 18 months of the
13D filing, with most of that coming in the last 15 months, versus +2.85% when the
target remains independent. They also expose that firms targeted by activists are more
likely to be acquired than those in a control sample. Similarly, a study by Boyson et al

37
(2015) follows targets through the (t-1 month, t+24 months) time frame and finds CARs
of 9.75% on average, with those that are subsequently acquired averaging +36.7% CARs
versus negligible returns for those who do not receive takeover offers at all and +18.0%
for those who receive bids but remain independent. This latter observation leads to the
assertion that the mere presence of a takeover bid drives a target to improve its
operational, financial and investment policies. Thus activism not only increases the
likelihood of receiving a takeover bid, but it also contributes to an overall improvement
in a target’s value as a stand-alone entity. Citibank’s Khorana (2013) agrees that
takeovers drive the highest returns in his calculation of target outperformance relative to
the market -- by 15% one year post event, and 34% two years post. Like Brav, he too
points out the great disparity in performance among targets, underscoring that large
average returns are driven by a small number of extremely successful campaigns that
generate outsized gains, as opposed to high returns across the majority of companies.
One non-academic report by Ken Squire (2014), founder of 13D Monitor and the
13D Activist Fund, is worth mentioning here due to its added insight. In an unpublished
but publicly summarized 2011 study conducted in support of his fund launch, Squire
reviews more than 100 13D filings from 2006-2011 for targets pursued by premium
activists only and with market caps exceeding $1billion. He finds a 2.7% price jump
from (t-1, t) that grows by an additional 16% in the 15 months following the event (t,
t+15 months). While arguably self-serving due to his fund’s specific orientation toward
large cap securities, this documented performance on large cap activist targets appears to
be legitimate given his fund’s performance and the significant interest in large cap
activism of late.

38
V: Data Collection and Research Methodology
The list of activist targets that comprise our dataset began with all companies that
were subject to 13D or under the threshold (UTT) activist campaigns according to
independent data service, 13D Monitor. The resulting 1,088 companies encompass
transactions from 1995-2017, and can be further segmented into 1,015 events represented
by 13D filings from 1995-2017 and 73 represented in UTT activities from 2013-
2017. UTT transactions first surfaced in the database in 2013, and have since grown at a
rapid rate relative to all activist events. In this manner, we gathered company name,
ticker symbol, activist, filing type and filing date.
We then used WRDS to obtain a PERMNO number for each of the 1,088
companies. PERMNOs are essential because they are unique company identification
numbers and, as such, enable us to retrieve stock prices on any given date for any
company, even if the company is no longer in existence or has ceased trading. FactSet
was used to collect market capitalizations for each company as of the date of the activist
intervention. Deal summaries from 13D Monitor offered insights into type and level of
activism, target company industry, type of activist, stake size at 13D, exit type, and
outcome of campaign. We further refined our dataset by implementing a self-imposed
“full independent variable data availability mandate” so as to not sway our subsequent
regression analysis. Specifically, if input on any of our chosen variables was
unobtainable from any of these three sources, the underlying company was eliminated
from our working dataset, paring our target list by approximately 20%.
The abnormal returns used in the calculation for cumulative abnormal returns and
buy-and-hold abnormal returns were obtained from the Center for Research in Security

39
Prices (CRSP). These periods encompass both short and long-term horizons and are
consistent with prior studies (Krishnan et al (2015) and Klein and Zur (2009)) for
comparative purposes and to assure the validity of our data. Of note, because a UTT
intervention does not trigger the 13D filing requirement, UTT events have approximate
event dates, as opposed to actual ones, leaving some room for data inconsistency.
For our short-term time horizon assessment, our data availability mandate,
combined with a chosen start date of (t-10), allowed us to consider 842 companies in our
13D short-term analyses and 49 in our UTT short-term analyses. In terms of long-term,
our chosen BHAR time frame end date of (t+1 year) required, by definition, at least one
year of time lapse from event date, t, to end pricing date. This further filtered our final
target list to 827 events for our 13D BHAR analyses, but allowed us to maintain 49
targets in our UTT BHAR analyses. Lastly, in terms of our regression, we determined
that outliers had a large effect on our results. As such, and similar to several prior
studies, we winsorized our dependent variable at the 5% level in order to make our data
less sensitive to such anomalies.
The primary purpose of our proprietary simple linear regression in Equation (1) is
to identify what key campaign factors, if any, have a statistically significant impact on
campaign success, as measured by stock performance (short- and long-term) for activist
targets. The independent variables that we selected ("#$) thus reflect the range of factors
that might influence an activist’s campaign results, as outlined in Section III. Relevant
campaign information for this analysis was compiled from both 13D Monitor and
Thomson Reuters, and fact-checked for accuracy with FactSet when questionable dates or
numbers arose. The independent variables can be broadly grouped into the three principal

40
categories, namely stock characteristics, activist agenda and outcome (see Table 4 for
details).
&$ = "( + "*#$* + "+#$+ + ⋯+ "-#$- + .$for 0 = 1,2, …5. (1)
While some of these variables are quantifiable and objective in nature, others are
more subjective and open to interpretation. For example, our categorization for campaign
strategy is based on our own analysis of publicly available information and revolved
around an assessment of the visibility level, active vs. passive approach and hostile or
friendly nature surrounding each campaign. Further, our research reveals that even
dedicated activist analysts sometimes disagree on whether campaigns are successful or
not. Finally, other variables such as board seats won as a percentage of those pursued
and net insider trading around t, while interesting to include if enough reliable and
consistent data could be obtained, are not considered due to our data availability mandate.
The tradeoff of trying to ensure the accuracy of this data results in The Wall Street
Journal’s 2015 survey including only 71 companies in its analysis.
VI: Results and Discussion
Mean Abnormal Stock Returns
Table 5 illustrates the mean abnormal stock returns for both the 13D and UTT
datasets using all four risk models: Market (M); Market-Adjusted (MA); Fama French 3
Factor (FF3); and Fama French + Momentum (FFM). The discussion below focuses
mainly on the FF3 and FFM models, as they incorporate additional sources of risk.
Consistent with earlier findings from Krishnan et al (2015), our results reveal an
average +7% cumulative abnormal return (CAR) surrounding (t-10, t+10) for all 13D

41
filings (FF3 and FFM). The short-term return effect is smaller, but still positive and
significant, for UTT targets, generating +4.4% (FF3) and +4.7% (FFM) CAR’s,
respectively. These more muted returns are to be expected for this latter group because
UTT targets are larger and more widely known, making abnormal stock price movement
harder to stimulate.
When the event window is extended to a full year, (t, t+1 year), we find an average
buy-and-hold abnormal return (BHAR) for 13D filings of +4.1% (FF3) and +4.6%
(FFM). While lower than the stock performance results found in prior one year-post-
activism studies by Klein and Zur (2009), Clifford (2008) and Khorana (2013), the gains
remain significant and positive. UTT BHARs measure only 0.9% for the FF3 model, but
increase to 3.6% with inclusion of the momentum factor.
For both 13D and UTT BHAR’s, we see an increase in abnormal returns from FF3
to FFM, implying that activist investors actually chase previous underperformers. In
doing so, they cause losers to mean-revert much more quickly than they would otherwise.
These results fuel our conviction that activist investors do add shareholder value to
their target companies in a sustainable fashion despite growth in both the amount of
investment dollars and number of funds pursuing the strategy. Significantly positive
gains in stock price performance at rates at or slightly below those of prior researchers
give us comfort with the construct of our study and confidence that the implications we
draw for the newer phenomenon UTT activist intervention are well-founded.
Proprietary Regression
We then undertake a proprietary regression exercise to identify which variables
are most influential in driving the aforementioned abnormal returns, the results of which

42
are presented below in Tables 7-10. Our analyses focus on variable significance at the
90% confidence level and, in summarizing the results, we focus primarily on variables
which are statistically significant in both the FF3F and FFM models.
Results for 13D Short-Term Regression
Table 7 shows which variables contribute most to activist success in adding
shareholder value in (t-10, t+10) for all 13D filings. Most noteworthy is that the log of
market cap is a statistically significant contributor to CAR with a negative relation, with
coefficients of -1.5% for FF3 and -1.4% for FFM. In other words, the higher the
capitalization of a public company, the less value an activist unlocks for shareholders in
the short-term. This is logical because it is harder to affect a stock price, even for
experienced activist investors, when the company is larger and more widely known.
Also, with a larger company comes a bigger and more dispersed shareholder population,
which makes it more difficult for activist investors to get requisite parties on board with
their ideas and initiatives. Not to mention, it is more costly, in absolute dollar terms, to
accumulate a 5% stake in companies with greater market values, and such concerns are
often ahead of the game in terms of updating processes and implementing strategies that
otherwise represent low hanging fruit for activists to improve.
Secondarily, the nature of one’s industry is an important factor, and Health Care,
Industrials, Information Technology and Real Estate all stand out as statistically
significant and negatively correlated to CAR. According to the Center for Responsive
Politics (CRP), which ranks sectors based on cumulative dollars spent on lobbying for the
years 1998-2017 (see Table 6), the Real Estate sector spends the third most on lobbying,
with Telecommunications placing fourth. As shown in table 6, Health Care takes the

43
second spot on the rankings. It is important for activist investors to consider this, as
industries with high lobbying efforts will tend to have greater resistance to activist
efforts. Activists also tend to avoid companies in regulated industries such as Financial
Services or Health Care, as the higher risk associated with these external factors makes it
harder for activists to exert control. At the same time, in volatile and typically
commodity-driven industries, such as Industrials and Materials, sometimes activists will
see strategic opportunities that executives cannot see. Dan Romito, senior analyst at
Nasdaq Advisory Services, writes that, “activists do share a common universal behavioral
trait with the rest of us—they prefer the path of least resistance. There isn’t as much
blood in the water when it becomes clear management is prepared and has already
preemptively addressed activist scenarios” (Romito 2015).
Next, campaign objectives that are strategic or have no Item 4 stated at the time of
the 13D are statistically significant and positively related to CARs. While partially
inconsistent with the albeit dated conclusion of Clifford (2008), we conclude that the
recent popularity and success of activist investors has encouraged today’s market
participants to have more confidence in the activist agenda and not require a stated Item 4
to realize that activists can add value.
Finally, the size of an investor’s stake at the time of the 13D filing is statistically
significant and positively related to CAR. A 1% increase in stake size leads to an average
increase in CAR of 36% (FF3 and FFM). The higher the stake, the more potential upside
the investor envisions; the market clearly agrees and supports the activist by responding
with related buy interest.

44
Results for UTT Short-Term Regression
Table 8 summarizes the results for our UTT short-term regression model and
indicates that Real Estate and Telecommunications are again both statistically significant
and negatively related to CARs. According to the CRP rankings, these industries are
ranked 3 and 4, respectively, in terms of regulatory influence, making it more difficult for
activists to induce change.
Another significant negative correlation in this regression is Type of Activist. A
known activist investor significantly decreases CAR by 7.8% (FF3) or 6.4% (FFM). This
seems counterintuitive because one would assume that a prolific activist would be most
impactful, even when he merely expresses initial interest. But producing minimal, if any,
movement in a target’s stock price is a key reason behind an activist not breaching the
13D threshold. In this way, the activist can accumulate a fuller stake at a lower price.
Moreover, perhaps, the market wonders what the activist motivation is for not
committing to a full campaign at the outset. Maybe there is anticipation that the target
will fight back and the activist will stand down, or maybe the activist is waiting to see if
others will join in wolfpack-style.
Lastly, our Type of Campaign Strategy variable relates to Boyson and
Mooradian’s (2009) “intensity index.” To wit, our conclusion that campaign strategies
classified as highly publicized, active, and implying a management change have a direct
and positive correlation with CARs mirrors their finding that target companies that are
subject to “intense activism” produce higher CARs than those that are not. Intense
activism produces an approximate 5% increase in CAR for both the FF3 and FFM
models.

45
Results for 13D Long-Term Regression
Our long-term 13D regression results, shown in Table 9, reveal that our Before or
After Crisis variable is positive and statistically significant to BHAR. Campaigns
initiated after 2008 lead to a 7% (FF3) or 9% (FFM) increase in BHAR. This can be
partially attributed to the 2010 Dodd Frank Wall Street Reform and Consumer Protection
Act, enacted in response to the 2008 Financial Crisis, which improved proxy access and
advanced shareholder rights on other governance issues such as nominating directors and
“say on pay.”
Energy, Financials, and Industrials are all statistically significant and negatively
related to BHARs. Energy spends the fifth most on lobbying, and financials, the third
most.
Lastly, campaign strategies that are highly publicized, active, and imply a
management change are positively related to BHARs (a similar relationship to that found
in our UTT short-term regression). Again, intense activism makes a real difference.
Results for UTT Long-Term Regression
As shown in our long-term UTT model (Table 10), we find that the Materials industry is
significantly and positively related to BHARs. Activists have enjoyed BHARs of 104%
(FFM) to 118% (FF3) by targeting companies within this sector. Granted, the UTT
sample has only 2 Materials firms, so the result could skewed due to firm-specific or
sample size factors. However, the results are also consistent with the findings of The
Valence Group, which notes that, “It is straightforward to see the attraction of chemicals
for activists: Portfolio structures, multiple capital allocation options, high profitability

46
and numerous strategic choices, all combine to create fertile ground to question senior
management decisions” (“Shareholder Activism in Chemicals” 2015).
Limitations
We encountered a few challenges in conducting our study, most of which related
to assembling our proprietary data set. We could not find a single source that contained
all of the information we desired, so we needed to create our own using multiple unique
sources. On numerous occasions, the data was inconsistent or incomplete. When data
conflicted, we would cross reference wherever possible and often against more than one
source. When data was unavailable, we made defensible judgment calls and conducted
further research, including direct examination of the filings themselves. Still, significant
gaps in the data we were able to compile curtailed the number of companies we could
employ in our research. As a result, while comprehensive and current, our dataset is still
relatively small and lacks substantive history. It is not immune to outliers, although
efforts were taken to reduce their effect through winsorization.
Broadly speaking, additional limitations arose due to the private nature of much
of the data surrounding activist interventions, and the subjective interpretations by
various parties as to whether success was achieved. Future studies could benefit from
having additional time and resources to gather data that is not easily available or
verifiable for historical activist transactions, but likely meaningfully contributes to
activist-induced returns. This information could include board seats won, management
changes provoked and net insider buying and selling statistics around the filing period.
Analysis of UTT transactions, specifically, will also improve as more of these deals take
place in the coming years, with relevant data collected and refined as time progresses.

47
VII: Future Research
There is significant opportunity for further research of the ever-changing asset
class known as activist investing. In particular, as increasingly larger cap companies are
targeted by activists, it will be fascinating to compare the complexion and results of
activist efforts at these concerns to those of historically prevalent smaller cap targets.
One could also study changes in the operating metrics at all target companies in
response to activist interventions to determine whether activists generate improvements
in this objectively measured data. Although prior research has covered this area, it has not
been updated to current times. Contemporary analysis of the behavior of corporate
managements and boards as a factor in attracting activist attention would also prove
enlightening.
In an always evolving regulatory and political environment, one should also look
at the impact of new and proposed regulations on the popularity and success of activist
investing in general. Specifically, there has been meaningful conversation lately about
whether the 13D 10-day filing window is still relevant in the current era of computerized
trading. Today, the 5% threshold can be reached almost instantly, and much larger
positions can be accumulated before the 10-day window is met. This period between
crossing 5% and the 10-day deadline, “gives activist investors, whose number on priority
is discretion when building a position, a powerful tool” ("Managing Shareholder
Activism in a New Era" 2015). The passage of Dodd Frank gives the SEC authority to
modify the timeframe in which 13D filings must occur. A shortened window could
address short-termism concerns, and may give corporate management teams a greater
opportunity to defend themselves against predator activists. It would be constructive to

48
investigate past 13D filings, the time frame in which they were filed (within the 10-day
period), and what affect, if any, shorter filing durations have had on activist-induced
abnormal stock returns.
VIII: Conclusion
This study comprises 1,088 companies activist interventions from 1995-2017. Our
1,088 companies can be further segmented into 1,015 events represented by 13D filings
from 1995-2017 and 73 represented in under the threshold (UTT) activities from 2013-
2017. First, we analyze stock price returns for these two groups over short- and long-
term periods and find that activists continue to unlock shareholder value in recent deals
comparable to that of earlier ones. Consistent with prior research, our short-term event
window (t-10, t+10) reveals an average cumulative abnormal return of +7% and +4.5%
for our 13D and UTT datasets, respectively, using a Fama French 3 factor (FF3) and
Fama French + momentum (FFM) model. In our long-term event window (t, t+1 year),
we find an average buy-and-hold abnormal return of +4.5% for our 13D data set (both
FF3 and FFM), and +0.91% and +3.64% for our UTT datasets, using a FF3 and FFM,
respectively.
We then perform a proprietary regression to identify which factors drive the most
successful returns for activist targets. The independent variables that we selected reflect
the range of factors that might influence an activist’s campaign results. The variables can
be broadly grouped into the three principal categories: stock characteristics; activist
agenda and outcome. We find a strong, negative relationship between abnormal returns in
all time frames and industries with high lobbying costs (Real Estate, Health Care,

49
Industrials, and Financials). Our 13D long-term regression also shows a positive,
significant relationship between BHAR and our Before or After Crisis variable,
indicating that campaigns post-2008 Financial Crisis lead to higher BHAR, consistent
with prior research. Lastly, intense campaign strategies that imply management takeovers
are positively related to abnormal returns. This is as we would expect, and reinforces our
thesis that activists truly do continue to unlock shareholder value. The most successful of
them, it seems, really do put the “activ-” in activist!

50
Bibliography
"2015 Shareholder Activist Landscape: An Institutional Investor Perspective." FTI
Consulting, Strategic Communications, 2015.
“2016 U.S. Shareholder Activism Review and Analysis.” Sullivan & Cromwell LLP, 28
November 2016.
“Activist Investing: An Annual Review of Trends in Shareholder Activism.” Activist
Insight Limited, 2015.
“Activist Investing: An Annual Review of Trends in Shareholder Activism.” Activist
Insight Limited, 2016.
“Activist Investing: An Annual Review of Trends in Shareholder Activism.” Activist
Insight Limited, 2017.
“Activist Investing: An Annual Review of Trends in Shareholder Activism.” Activist
Insight Limited, 2018.
Ajay Khorana et al, Citi, “Rising Tide of Global Shareholder Activism,” 14 October
2013.
Alden, William. “Laurence Fink Says Activist Investing Can 'Destroy Jobs'.” The New
York Times, The New York Times, 11 Dec. 2014.
"An Investor Calls." The Economist, The Economist Group Limited, 5 Feb. 2015
Anderson, Theo. “Storming the Corporate Castle: Does Shareholder Activism Work?”
www.inthesetimes.com, 23, March 2015.
Bebchuk, Lucian, Alon Brav, and Wei Jiang. "The Long-Term Effects of Hedge Fund
Activism." Columbia Law Review 115, no. 5 (June 2015): 1085-156.

51
Benoit, David and Vipal Monga. “Are Activist Investors Helping or Undermining
American Companies?” www.wsj.com, 5 October 2015.
Birstingl, Andrew. “Activists Knocking on the Doors of Big Firms.” Market Insight.
Factset Research Systems Inc., 20 April 2016.
Birstingl, Andrew. “Does Shareholder Activism Drive Outperformance?” FactSet Insight.
31 Aug 2016.
Boyson, Nicole M. and Mooradian, Robert M., "Intense Hedge Fund Activists." 12
October 2009
Boyson, Nicole, et al. “Activism Mergers.” Journal of Economic Literature, Nov. 2015,
faculty.haas.berkeley.edu/mopp/Research/activism_mergers.pdf.
Brav, A. et al. "Hedge Fund Activism: Updated Tables and Figures," 2 September 2013.
Brav, Alon, Wei Jiang, Frank Partnoy, and Randall Thomas. "Hedge Fund Activism,
Corporate Governance, and Firm Performance." The Journal of Finance63, no. 4
(2008): 1729-775.
Brigida, Matthew, and Jeff Madura. “Information Leakages Prior to 13D Filings.”
Journal of Financial and Economic Practice, vol. 12, no. 2, 2012, pp. 23–38.,
www.bradley.edu/dotAsset/dd6c62c8-fb5e-4684-8151-6053b6c45600.pdf.
Bryan, Bob. “A Beginner’s Guide to Being a Rabble-Rousing Corporate-Raiding, CEO’s
Worst Nightmare Hedge Fund Manager.” Business Insider,
www.businessinsider.com, 28 June 2016.
“Capitalism's Unlikely Heroes.” The Economist, The Economist Group Limited, 7 Feb.
2015.

52
Castellanos, Javier et al. “New Age of Shareholder Activism: Description, Analysis and
Prescriptive Recommendations for Executives and Directors.” April 2015.
Clifford, Christopher P. "Value Creation or Destruction? Hedge Funds as Shareholder
Activists." Journal of Corporate Finance 14, no. 4 (2008): 323-36.
Coffee, John C. and Darius Palia. “The Wolf at the Door: The Impact of Hedge Fund
Activism on Corporate Governance.” 4 September 2015.
Del Guercio, Diane, Hawkins, Jennifer, 1999. The motivation and impact of pension fund
activism. J. Financ. Econ. 52, 293–340.
Denes, Matthew and Karpoff, Jonathan M. and McWilliams, Victoria, Thirty Years of
Shareholder Activism: A Survey of Empirical Research (June 8, 2016).
Friedman, M. 1970. The social responsibility of business is to increase its profits. New
York Times Magazine, September 13: 32-33, 122-124
Gaffney, Mark. "Benjamin Graham: I Had 'Treasure in My Hands.'" MarkWGaffney, 28
May 2017.
Gallagher, Francis and Peter Drippe. “Shareholder Activism Continues to Attract Assets
and Boost Activity.” Advisor Perspectives, Inc., 8 July 2015
Gantchev, Nickolay M., "The Costs of Shareholder Activism: Evidence from a
Sequential Decision Model" (2011). Publicly accessible Penn Dissertations. Paper
442.
Gelles, David, De La Merced, Michael. "New Alliances in Battle for Corporate Control."
The New York Times, The New York Times, 18 March 2014.
Gillan, Stuart L., Starks, Laura T., 2000. Corporate governance proposals and shareholder
activism: the role of institutional investors. J. Financ. Econ. 57, 275–305.

53
Goldhaber, Michael D. “Marty Lipton’s War on Hedge Fund Activists.” The American
Lawyer, 30 March 2015.
Grant, Elaine X. "When Carl Icahn Ran a Company: The Story of TWA." Marc
Andreessen, 18 March 2014.
Greenwood, Robin, and Michael Schor. "Investor Activism and Takeovers. “Journal of
Financial Economics 92, no. 3 (2009): 362-75.
Inglis, Jack. “Unlocking Value: The Positive Role of Activist Hedge Funds.” AIMA, 1
February 2015.
Kerr, Simon. “Cevian Capital.” Cevian Capital | The Hedge Fund Journal, 6 Oct 2008.
Klein, April, and Emanuel Zur. "Entrepreneurial Shareholder Activism: Hedge Funds and
Other Private Investors." The Journal of Finance 64, no. 1 (2009): 187-229.
Krishnan, C. N. V. and Partnoy, Frank and Thomas, Randall S., The Second Wave of
Hedge Fund Activism: The Importance of Reputation, Clout, and Expertise. (July
25, 2016). Vanderbilt Law and Economics Research Paper No. 15-9; Journal of
Corporate Finance, Vol. 40, No. 296-314, 2016.
LaFon, Holly. “Warren Buffet Says Most Activist Investors Offer ‘Promise of
Performance’.” GuruFocus, 15 October 2015.
Levin, Michael. "A Concise Guide to Activist Investing." The Activist Investor, May
2010.
Lipton, Martin. “Empiricism and Experience; Activism & Short-Termism; the Real
World of Business.” Harvard Law School Forum, 28 October 2013.
"Managing shareholder activism in a new era." Norton Rose Fulbright. October 2015

54
McDonnell, Mary-Hunter, Brayden G. King and Sarah A. Soule. “A Dynamic Process
Model of Private Politics: Activist Targeting & Corporate Receptivity to Social
Challenges.” American Sociological Review, January 2015.
Park, Damien J. “Activist Investors and Target Identification.” Harvard Law School
Forum, 23 June 2016.
Romito, Dan. “Four Types of Activist Investors and How to Spot Them.” Harvard
Business Review, 7 October 2015.
Rossman, Jim et al. "Lazard's Shareholder Advisory Group: 2017 Activism Year in
Review." Lazard, 2017.
Semuels, Alana. “Can America’s Companies Survive America’s Most Aggressive
Investors?” The Atlantic, 18 November 2016
“Shareholder Activism in Chemicals” The Valence Group. January 2015
“Shareholder Activism: Who, What, When & How?” www.pwc.com, March 2015.
Skroupa, Christopher. “Activist Activity -- The Shifting Tides Of Shareholder
Engagement In The U.S. And U.K.” Forbes, Forbes Magazine, 16 Feb. 2017.
Squire, Ken. “13D Activist Fund Beats S&P 500 in Each of Its First Two Years.”
13DMonitor, 6 Jan. 2014
Terlep, Sharon. “Newell Adds New Directors Ahead of Proxy Fight With Starboard.”
The Wall Street Journal, Dow Jones & Company, 22 Feb. 2018.
“The Activist Report: 10 Questions with Matthew Drapkin.” www.13DMonitor.com,
February 2016.
"The Shareholder Activists' View." FTI Consulting, Strategic Communications, 2015.

55
Toonkel, Jessica. "State Street Global Advisors targets underperforming companies."
Reuters, 25 September, 2015.
“Unlocking Value: The Positive Role of Activist Hedge Funds.” AIMA, 1 February
2015.
White, Colleen. “Analyzing Activist Investor Performance in 2016.” Novus, 24 Feb.
2017.
Zenner, Marc et al. “The Activist Revolution: Understanding & Navigating a New
World of Heightened Investor Scrutiny.” J.P. Morgan, January 2015.

56
Figures
Figure 1: Public Company Targets by Year (2013-2017)
Number of companies publicly subjected to activist demands per year. While 2013-2016 saw a yearly increase, 2017 had a slight setback in the number of public company subjected to activist demands.
Source: “Activist Investing: An Annual Review of Trends in Shareholder Activism” 2018
Figure 2: Publicly Active Activists (2010-2014)
This figure displays the number of activists running a public campaign in a given year. The figure shows a 5-year
consecutive increase in the number of activists.
Source: “Activist Investing: An Annual Review of Trends in Shareholder Activism” 2015
805
843
744
616
570
0 200 400 600 800 1000
2017
2016
2015
2014
2013
203
160
150
89
76
0 50 100 150 200 250
2014
2013
2012
2011
2010

57
Figure 3: Compounded Activist Insight Index versus S&P 500 and MSCI World Indexes Since 2009
This figure displays the compounded Activist Insight Index net return (black line) versus the S&P 500 Index total return (blue line) and the MSCI World Index total return (gray line). While activist value has historically outperformed major
indexes, 2017 saw poor performance and lower returns for activist funds.
Source: “Activist Investing: An Annual Review of Trends in Shareholder Activism” 2018.

58
Tables
Table 1: Average Performance of Exited 13D Filings for Top Activists vs. S&P
This table presents the number of exited 13D’s, average company return, and average S&P return per each top activist.
Activist Exited 13D Filings
# Situations Average Company Return Average S&P Return
Elliott Associates 27 27% 9% JANA Partners 24 21% 9% Pershing Square 18 204% 15% Starboard Value 56 38% 12% Third Point LLC 21 2% -2%
Trian Fund Management 7 50% 32% ValueAct Capital 42 39% 11%
Source: 13D Monitor
Table 2: Frequency of U.S. Activist Hedge Funds’ Tactics (1994-2011)
This table presents a range of tactics that activist investors use in the campaigns, along with the frequency with which they are used. The results suggest that activists favor non-hostile tactics.
Source: Brav et al (2013)

59
Table 3: Market Cap Growth for Top Activists for Exited 13D and UTT Filings
This table presents the number of exited 13D’s and exited UTT’s, along with their average market caps per each top
activist. The far right column shows the market cap difference between 13D and UTT companies.
Activist
Exited 13D Filings Exited UTT Filings
# Situations Average Market
Cap (in $m) # Situations
Average Market Cap
(in $m)
Market Cap Compare:
UTT vs. 13D Pershing Square 18 19,144 1 $200,419 10.5x
Third Point LLC 21 2,300 6 $65,493 28.5x
Trian Fund Management 7 7,508 1 $154,826 20.6x
JANA Partners 24 9,410 7 $44,016 4.7x
Elliott Associates 27 2,478 5 $20,945 8.5x
Starboard Value 56 1,285 4 $8,811 6.9x
ValueAct Capital 42 4,430 2 $46,731 10.5x
Source: 13D Monitor

60
Table 4: Independent Variables in Regressions
This table presents and describes the independent variables used in the regression of this paper. Timing of campaign variable is used in the 13D regressions only. Campaign length, outcome type, and exit type are used in the long-term
regressions only. Dummy variables in regression are consumer discretionary for industry and win for activist for outcome type.
Stock Characteristics
Timing of Campaign *only for 13D regressions
As a result of the 2008 Financial Crisis, which saw the collapse of many corporate giants, shareholders became increasingly weary of corporate leadership, and thus more dedicated to shareholder activism. Further, the Crisis led to the 2010 Dodd Frank Wall Street Reform and Consumer Protection Act, which addresses proxy access and shareholder’s rights to nominate directors. The additional support for activism is likely related to an increase in the market’s confidence in activist interventions. Additionally, the low interest rate environment following the Crisis is likely to affect activist funds.
Log of Market Cap
It is harder to affect a stock price when the company is larger and more widely known. With larger company comes a larger and more dispersed shareholder population, which makes it more difficult for activist investors to get requisite parties on board with their ideas and initiatives. Not to mention, it is more costly, in absolute dollar terms, to accumulate a 5% stake in companies with greater market values, and such concerns are often ahead of the game in terms of updating processes and implementing strategies that are otherwise low hanging fruit ways for activists to increase shareholder value.
Industry of Target Company
Determines shareholder types: certain industries are older and pay more dividends, thus attractring institutions which seek dividend paying stocks (bank trusts and pension funds). Also relates to amount of lobbying dollars spent by industry
Consumer Discretionary *dummy variable in regression*
Consumer Staples Energy Financials Health Care Industrials Information Technology
Materials Real Estate Telecommunications

61
Utilities Total % of Institutional Holdings
As of previous quarter before 13D filed
Activist Agenda Type of Activist Known activists are those that are experienced
Solo-Filing or Co-Filing
If filing as a group, you need less skin in the game, as the group’s total holdings need to exceed 5%. Group filings are advantageous for activism in larger companies, as it is more expensive to accumulate shares
Campaign Objective Item 4 stated in 13D filing
Corporate Governance
Strategic/Advisory Capital Allocation/Balance Sheet
Operational No Item 4 stated at time of 13D
Campaign Strategy Proxy for intensity of campaign
Highly publicized, active, does not imply management change
file lawsuit; nominate directors (as standalone); solicit proxies or comments; submit shareholder proposal; any of above plus settle with company
Highly publicized, active, does imply management change
acquisition of company; meeting with/letter to shareholders or third party; offer to acquire company; standstill or voting agreement
More private, passive, friendly
letter to management; meetings with management; reimburse expenses; request company documents; any of above plus settle with company
Stake Size at 13D (%)
The higher the stake size, the more skin the activist has in the game.
Campaign Length (# days)
Campaign Outcome Outcome Type Win for activist *dummy variable in regression* Partial win for activist
Loss for activist

62
Withdrawal by activist
Exit Type Investor exits activism file 13F, 13G, 13G/A, 13D/A or dissolution of group Resolution reached bankruptcy/liquidation or sale of company
Table 5: Mean Abnormal Stock Returns
Mean (median) cumulative abnormal returns (CAR) in the event window (t-10, t+10) and buy-and-hold abnormal
returns (BHAR) in the (t, t+252) event window are shown below. All results are shown in percentage form. The results incorporate both the 13D filings and the UTT filings. Results are shown for 4 risk models: market, market adjusted, Fama French 3 Factor, and Fama French + Momentum model. All abnormal returns are significantly different than
zero.
Market Market Adjusted FF 3 FF Momentum
13D CAR 7.40 (5.78)
6.45 (5.82)
7.41 (6.35)
7.38 (6.52)
13D BHAR 3.52 (6.37)
2.48 (1.20)
4.06 (6.64)
4.61 (8.66)
UTT CAR 4.60 (6.03)
4.40 (4.49)
4.39 (5.35)
4.70 (5.75)
UTT BHAR -7.33 (-6.72)
-0.79 (-0.62)
0.91 (1.25)
3.64 (3.13)

63
Table 6: Cumulative Dollars Spent on Lobbying, Ranked by Sector (1998-2017)
This table presents the cumulative dollars spent on lobbying per sector (1998-2017). Sectors are displayed in order from top spender to lowest spender.
Sector Total
Misc. Business $7,991,601,047
Health $7,922,951,018
Finance/Insur/RealEst $7,904,393,840
Communic/Electronics (includes Telecom and IT) $6,326,189,241
Energy/Nat Resources $5,676,059,922
Other $3,983,878,730
Transportation (includes Industrials) $3,933,355,176
Ideology/Single-Issue $2,504,011,807
Agribusiness $2,305,664,158
Defense $2,230,260,643
Construction $867,295,398
Labor $767,032,190
Lawyers & Lobbyists $477,557,131
Source: www.OpenSecrets.org
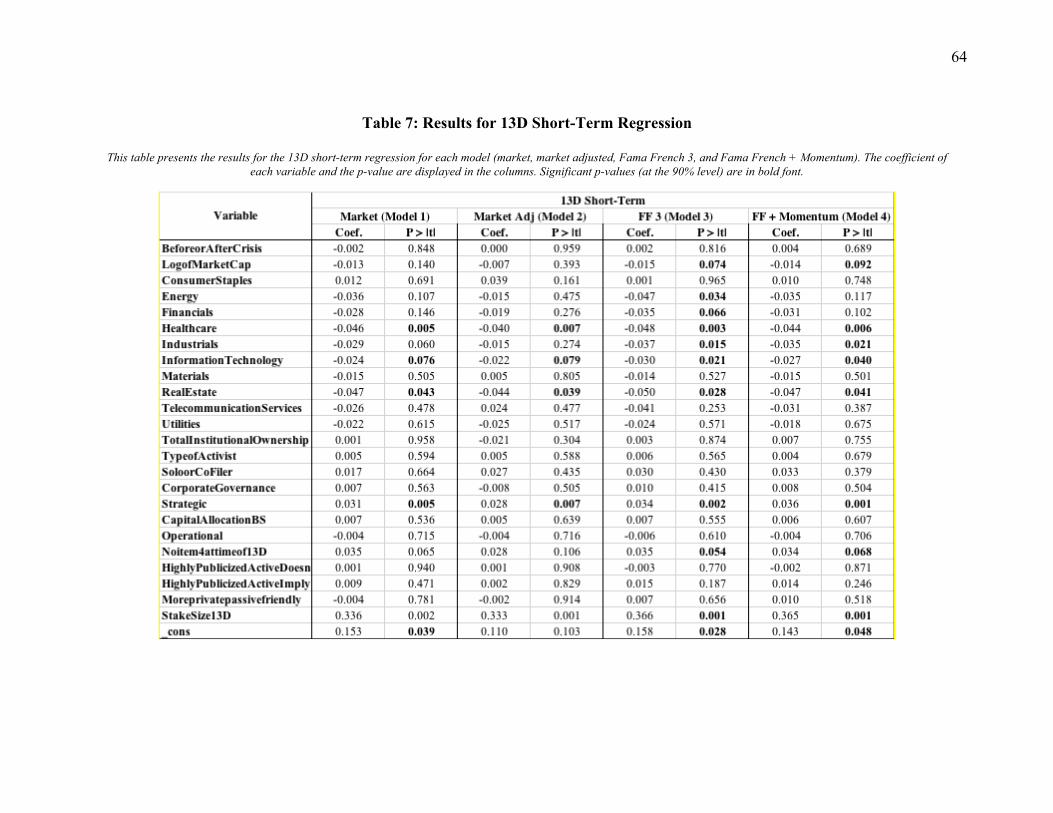
64
Table 7: Results for 13D Short-Term Regression
This table presents the results for the 13D short-term regression for each model (market, market adjusted, Fama French 3, and Fama French + Momentum). The coefficient of
each variable and the p-value are displayed in the columns. Significant p-values (at the 90% level) are in bold font.

65
Table 8: Results for UTT Short-Term Regression
This table presents the results for the UTT short-term regression for each model (market, market adjusted, Fama French 3, and Fama French + Momentum). The coefficient of
each variable and the p-value are displayed in the columns. Significant p-values (at the 90% level) are in bold font.

66
Table 9: Results for 13D Long-Term Regression
This table presents the results for the 13D long-term regression for each model (market, market adjusted, Fama French 3, and Fama French + Momentum). The coefficient of each variable and the p-value are displayed in the columns. Significant p-values (at the 90% level) are in bold font.

67
Table 10: Results for UTT Long-Term Regression
This table presents the results for the UTT long-term regression for each model (market, market adjusted, Fama French 3, and Fama French + Momentum). The coefficient of each variable and the p-value are displayed in the columns. Significant p-values (at the 90% level) are in bold font.

67