Embed Size (px)
Citation preview
TRANSPORTATION RESEARCH RECORD 1091
National Research Council, Washington, D.C., 1957, pp. 38-41. 3. f/RB Special Report 87: Highway Capacity Manual. HRB,
National Research Council, Washington, D.C., 1965, pp. 160-186. 4. Weaving Area Operations Study. NCHRP Project 3-15, Final
Report. Department of Transportation Planning and Engineering, Polytechnic Institute of Brooklyn, Brooklyn, New York, 1971, unpublished.
5. Transportation Research Circular 212: Interim Materials on Highway Capacity. TRB, National Research Council, Washington, D.C., Jan. 1980, pp. 189-208.
6. J. E. Leisch. A New Technique for Design and Analysis of Weaving Sections on Freeways. /TE Journal, Vol. 49, No. 3, March 1979.
7. J. E. Leisch and J. P. Leisch. Procedure for Analysis and Design of Weaving Sections. Report FHWA-RD-82/54, FHWA, U.S. Department of Transportation, 1982.
8. W. Reilly, H. Kell, and P. Johnson. Weaving Analysis Procedures for the New Highway Capacity Manual. JHK and Associates, Aug. 1984.
109
9. Special Report 209: Highway Capacity Manual. TRB, National Research Council, Washington, D.C., 1985, Chapter 4, pp. 4-1 to 4-19.
10. J. Fazio. Development and Testing of A Weaving Operational Analysis and Design Procedure. M.S. thesis. University of Illinois at Chicago, Chicago, 1985.
11. J. Fazio et al. Users Guide 10 the Microcomputer Program Version of Four Weaving Operational Analysis and Design Procedures. 2nd ed. University of filinois at Chicago, Chicago, Aug. 1985.
12. A. G. Bullen and P. Athol. Development and Testing of JNTRAS, A Microscopic Freeway Simulatiori Model . University of Pittsburgh, Piusburgh, Feb. 1976, Vol. 2.
Publication of this paper sponsored by Committee on Highway Capacity and Quality of Service.
A Comparison of the 1985 Highway Capacity Manual and the Signal Operations Analysis Package 84
DANE !SMART
The ·primary objective of this paper is to determine if the signalized intersection procedure as described in Chapter 9 of the 1985 Highway Capacity Manual (HCM) w1U give results consistent with the microcomputer version of the SlgnaUzed Operations Analysis Package 84 (SOAP 84). Each procedure was used to analyze the lntersectJon In Chapter 9, Calculation 3, of the 1985 RCM. Average stopped delay was calculated for the intersection by each method and was used as the basis for comparing the 1985 HCM and SOAP 84. For through movements and protected- restricted left t·urns, tbe two procedures produced slm.Uar results for calculating stop delay, X ratios, and effectlve green ratios. However, for the results to be consistent, the saturation ftow as calculated by the HCM method must be used In SOAP 84 as the capacity (saturation ftow) for through movements and the protected-restricted left turns. For protected- permissive and unprotected lell turns, the two methods produce significantly dlfferent results.
Federal Highway Administration, U.S. Department of Transportation, HHP-21, 400 Seventh Street, S.W., Washington, D.C. 20590.
Described is an effort to compare the microcomputer version of SOAP 84 with the methodology in Chapter 9, Signalized Intersections, of the 1985 Highway Capacity Manual (HCM).
The Signal Operations Analysis Package (SOAP 84) is a computerized method for developing control plans and evaluating the operations of individual signalized intersections. As the basis for the comparison between SOAP 84 and the 1985 HCM, delay will be calculated by each method. SOAP 84 determines average delay, which includes delay incurred during deceleration and acceleration as well as stop delay. The 1985 HCM calculates average stop delay as the basis for determining level of service. To make a comparison between the two methods, average delay will be converted to average stop delay by using the following formula (1):
Average delay/1.3 = average stop delay (1)
As the first step in the analysis, Calculation 3: Operational Analysis of a Multiphase Actuated Signal from Chapter 9 of
110 TRANSPOKfJITION RESEARCH RECORD 1091
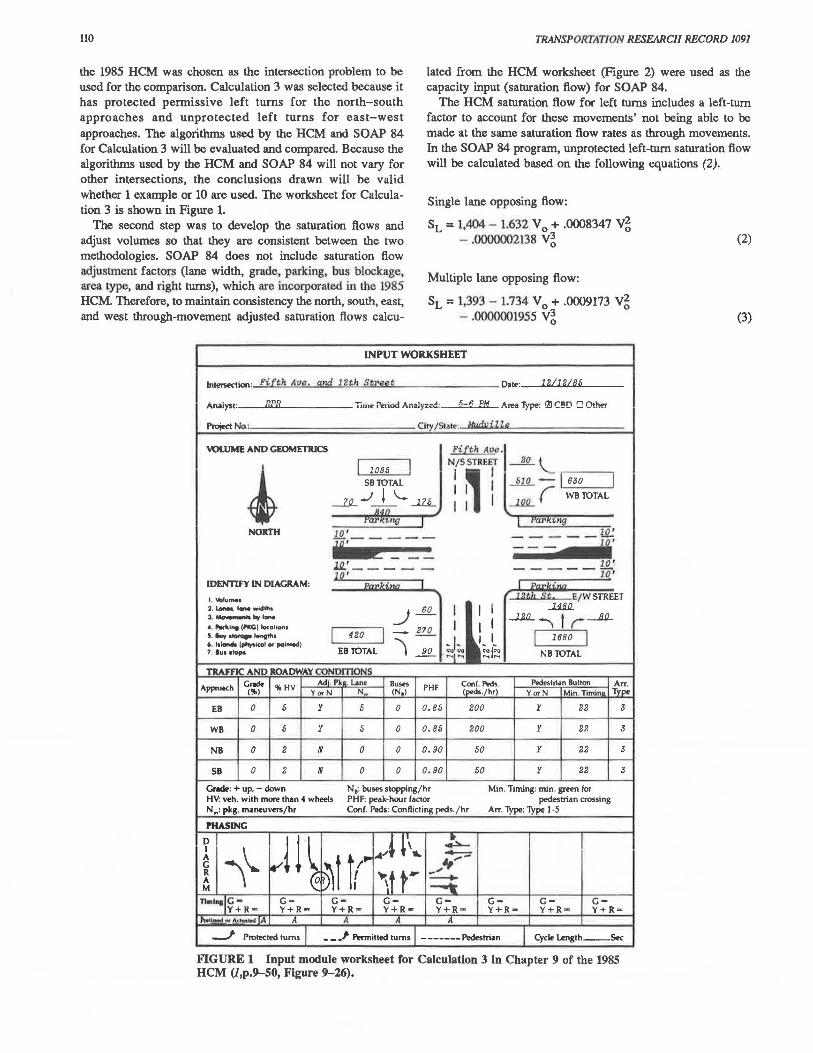
the 1985 HCM was chosen as the intersection problem to be used for the comparison. Calculation 3 was selected because it has protected permissive left turns for the north-south approaches and unprotected left turns for east-west approaches. The algorithms used by the HCM and SOAP 84 for Calculation 3 will be evaluated and compared. Because the algorithms used by the HCM and SOAP 84 will not vary for other intersections, the conclusions drawn will be valid whether 1 example or 10 are used. The worksheet for Calculation 3 is shown in Figure 1.
lated from the HCM worksheet (Figure 2) were used as the capacity input (saturation flow) for SOAP 84.
The HCM saturation flow for left turns includes a left-tum factor to account for these movements' not being able to be made at the same saturation flow rates as through movements. In the SOAP 84 program, unprotected left-tum saturation flow will be calculated based on the following equations (2).
Single lane opposing flow:
The second step was to develop the saturation flows and adjust volumes so that they are consistent between the two methodologies. SOAP 84 does not include saturation flow adjus!ment factors (lane width, grade, parking, bus blockage, area type, and right turns), which are incorporated in the 1985 HCM. Therefore, to maintain consistency the north, south, east, and west through-movement adjusted saturation flows calcu-
SL = 1,404 - I.632 V 0 + .0008347 V~ - .0000002138 v~
lnten;ection: Fi[th Ava.
J\Miyst: lJ.f,,lf
Project No.:
Multiple lane opposing flow:
SL = 1,393 - 1.734 V 0 + .0009173 V~ - .0000001955 v~
INPUT WORKSHEET
and ~2~h Sf.!'2!!~ Date: lU.lU.6.~
Tir..e Pcriud Analyz~ : 5-11 PM Area T}1''" ~ C!!D 0 0th'!!
City / S\Mt : l:JJJd.rJ.i..1.'Le.
VOLUME AND GEOMETRICS Pi[th Alie.
"('~"f .--.1Q..
~ I I 1085
SlO -1 630 I SBlOTAL I I I _li_ ..) _L '- -1.ZL I I I --1.M._ ' we lOTAL
OM>
rar1<1. llG I I .1"41'1<1.Plg
NORTH 10' - - - --~ if _____ ii'
J.Q.' ___ - - 10'-10 ' - - -- - 10·
IDENTIFY IN DIAGRAM: u--u··-- I I u ,..,.u.: ........
'·"°'"'"'" 1~~ .. -"~ E/WSTREET
2. Lofteil, lone wkhha _) ....§.!!_ I I I __uag_
3.-irvi .... l I -121L' t r~ 4 '9rklnt (l'KG) loc:otion1 I s. 1ay • ..._i.ngt11, I 420 I - 270
I I I 1680 I 6. l1lando (~lcal a< palni.d) ) ~I- ~~I~ 7. lu1 11opt. EBlOTAL 2f!_ :::;,:::; NB TOTAL
TRAFFIC AND ROADWAY CONOmONS
Appro«h Grode %HY Adl. Ph. Une Buses PHF Con! Peds Pedestrian Button Arr.
(%) YorN N,. (N,) (t>eds./hr) YorN Min Timin~ Tvi>e
EB 0 5 y 5 0 0.85 200 'i 22 3
we 0 5 y 5 0 0.85 200 y 22 3
NB 0 2 N 0 0 0.90 50 y 22 3
SB 0 2 N 0 0 0.90 50 y 22 3
Grade: + up, - down N 1: buses stopping/hr Min. Timing: min. green for H¥. wh . with more than 4 wheels PHF: peak-hour factor pedestrian oossing Nm: pkg. maneuvers/hr Conf. Ped.: Conflicting peds. /hr Arr. Type: fype I ·5
PHASING
D
.,! 1 ~ .. .-ii'.. ~ I
\\.. --A
~t tr~ ., ...
G R .. \t t .. _..,. A -M -;
TI•lq1G - G= G- G- G- G"" G= c-Y+R - Y+R- Y+R= Y+R- Y+R- Y+R- Y+R - Y+R=
,,...,_ "' "''-"" IA A A A A
_J Protected turns I • _.I' ~itted turns - ------Pedestrian I Cycle Length--Sec
FIGURE 1 Input module worksheet for Calculation 3 In Chapter 9 of the 1985 HCM (J,p.9-50, Figure 9-26).
(2)
(3)

!SMART 111
SATURATION FLOW ADJUSTMENT WORKSHEET Li\NE GROUPS ADn . STMENT FACTORS
© (I) (I) @ ® ® (!) ® ® ® @ 9 0 A ppr. Line Ideal No.ol Line HHvy Grode Pkg au. ATU Right ~It A'M. Sot.
Group S.t. Lin .. Width ~h Block.tgt ~ Tum Tum ow Movements Flow I. fuu I I ( .. I., f., Rate
(pcphgpl) N Ta Die IHMe Tobi• T1blo T1blt Table Table llbl• • 9-S 9-6 9-7 g.e 9-9 9-10 9-11 9-12 (vph,oi)
' 1800 1 . 9J .975 1. 00 1. o~ 1.00 .90 1.00 .31 455 -- __ .,,,,.
EB -~
1800 2 . 9J . 975 1.00 • 9J5 1.00 .90 . 94 1. 00 2582
------
' 1800 1 • 9J .975 1.00 1. 00 1. 00 . 90 1.00 .48 705
we }=-1800 2 . 9J .975 1.00 . 9J5 1.00 . 90 .99 1.00 2719
\ ~, +\ 1800 1 1.00 .99 1.00 1.00 1. 00 .90 1.00 . 95 1524 I
NB t r~ 1800 2 1.00 .99 1.00 1.00 1.00 .90 _99 1.00 Jl76
\:\ 1800 1 1. 00 .99 1. 00
'-. 1. 00 1.00 .90 1.00 • 95 1524
SB ,i i 1800 2 1.00 .99 1. 00 1.00 1. 00 • 90 .99 1. 00 3176
FIGURE 2 Saturation Oow rate module worksheet for Calculation 3 in Chapter 9 of the 1985 HCM (J,p.9-52, Figure 9-28).
where SL is the saturation flow for unprotected left turns
[vehicles per hour (vph)], and V 0 is the opposing through volume (vph).
For the protected portion of left-tum phases, SOAP 84 will use the HCM saturation flow rate without the left-tum factor (Table 1). SOAP 84 left-tum saturation flow for the unprotected portion of the tum will be based on Equation 3. Because the eastbound and westbound left turns have no proLected phase, the saturation How rates from Table 1 for eastbound left turns and westbound left turns will not be used in the calculations for total left-tum capacity of SOAP 84.
In the 1985 HCM, the volume is also adjusted based on peakhour and lane-use factors. SOAP 84 does not make volume adjustments based on these factors. Rather, SOAP 84 relies on evaluating intersections at 15-min intervals if the user desires. With 15-min analysis periods, the peak-hour factor would be accounted for. In this example, a 1-hr time period is analyzed.
TABLE 1 SATURATION FLOW RATE WITHOUT LEFT-TURN FACTOR
Direction
Eastbound left Westbound left Northbound left Southbound left
Saturation Flow Rate
1,469 1,469 1,603 1,603
Note: In SOAP 84, capacii.y input is specified in terms of saturation Oow (vehicles per hour of green).
To remain consistent, the HCM-adjusted How shown in Figure 3 (adjusted for peak-hour and lane-use adjustments) will be used as the SOAP volume because the SOAP analysis will be for 1 hr rather than 15-min intervals.

112 TRANSPORTATION RESEARCH RECORD 1091
VOLUME ADJUSTMENT WORKSHEET
© (!) (!) @ (!) @ (!) @ ® ~ ~ ~ppr. Mvt. Mvt. Peak Aow Lane Flow rate Number Lane Adj. Prop.
Volume Hour Rite Group in Lane of Lanes Utilization Aow of (vph) Factor it4
Group N Factor v LT or RT PHF v, u J;'t'~ PLTorP11
(vph) Table.9-4 , LT 60 0.85 71 ---- 71 1 1. 00 71 1. 0 LT
---.. EB TH 270 0. 85 J18 ~ 424 2 1.05 445 0.25
• RT
RT 90 0.85 106
LT 100 0. 85 118 ,,,,.---
118 1 1. 00 118 1. 0 LT
' WB TH 510 0.85 ' ~ 600 ,._____ 624 2 1. 05 655 o. 04
RT
RT 20 0.85 24
'\ .. , l.T 120 0. 90 JJJ +' lJJ 1 1.00 lJJ 1. 0 LT
\ I I
NB ... 1480 0.90 1U44 + tp
1733 2 1 . o~ 1R"I/ 0.05 I I RT
RT 80 0.90 89
LT 175 0.90 194 ~~ 194 1 1.00 194 1. 0 LT \..
SB TH 840 0.90 9JJ . .A! 1011 2 1. 05 1062 0.08 RT
RT 70 0.90 78
FIGURE 3 Volume adjustment module worksheet for Calculation 3 in Chapter 9 of the 1985 HCM (J,p.9-51, Figure 9-27).
The remaining input (minimum green, headway time, phasing, and permissive lefL turns) needed to run SOAP 8!l does not require any adjusunenls to remain consistent wilh lhe HCM procedlU'e. Timing for the intersection is identified in SOAP 84 approximately as shown in Calculation 3 of the HCM. For this problem, the phasing and cycle length evaluated by SOAP 84 are given in Table 2.
TABLE 2 PHASING AND CYCLE LENGTH EVALUATED BY SOAP 84
Phase
1 2 3 4
Green Time (sec)
7.5 6.5
73.2 31.6
Note: cycle length = 118.8 sec and lost time = 1.5 sec.
By using the HCM methodology and SOAP 84, the intersection was evaluated. The results are shown in Figures 4 and 5. By using Equation l, the delay calculated by SOAP will be converted to average stop delay. A comparison of the results given in Table 3.
The delay for through movements compares well. However, the permissive left turns are significantly different. For example, for northbound left turns, according to the HCM, delay is ca!cul too ;ir 71.36 sec, whereas with SOAP 84 a delay of 35.5 sec is calculated.
The first step in determining why there is such a significant difference is to look at each method's equation for determining delay. The delay equation of the HCM is as follows.
Uniform arrivals:
d1 = 0.38 C(l - g/C)2/[1 - (g/C)(x)]

TABLE NO. 31
LEVElrOF-SERVICE WORKSHEET
uneGroup First Term Delay Second Term Delay lbtal Delay .. LOS
<D @ @ @ © ® <!I ® ® ~ @ I!) 11)
APP'• UM v/c Creon Cycle Delay un• O.l•y Progression une une Approach A ppr Group Ratio R11tio Length d, Group d, faclor Group Group O.l1y LOS Mo\'e- x g/C c (sK/veh) Capacity (sec/veh) PF Delay LOS (sec/v•h) Table men ts (sec) c Table 9-13 (sec/veh) Table 9-1
(\'ph) (~)X$ 9-1
' -"" .612 .254 118.8 29.74 116 6.27 1. 00 36 01 D
EB - .678 .254 118.8 30.34 \
648 1.97 0.85 27.46 D 28.6 D
--- .659 .254 118.8 30.61 181 5.83 1. 00 35.99 D + we I~ .948 - .254 118.8 33.08 682 16.33 0.85 42.00 E 41 . 1 E
... "'\•\ .936 .653 118.8 13.94 78 57.54 1.00 71.36 F
NB tr .950 .603 118.8 16.65 1915 8.14 0.85 21.07 c 24.5 c
\:~~ .944 .690 118.8 12. 17 142 42.43 1. 00 54 .60 E
SB lJl . 518 .645 118.8 8.54 2049 0.19 0.85 7.42 B 14.7 c
Intersection Delay 25. 1 sec/veh lntersettion LOS D (Table 9-1)
FIGURE 4 Level-of-service module worksheet for Calculation 3 in Chapter 9 of the 1985 HCM (J,p.9-56, Figure 9-31).
CALCULATED EFFECTIVE GREEN/ CYCLE RATIO FOR EACH MOVEMENT (INCLUDING LEFT TURN RELEASE ADJUSTMENT)
******************************************************************************************************* *LAMDA * TIME * l - NBT * 2 - NBL * 3 - SBT * 4 - SBL * 5 - EBT * 6 - EBL * 7 - WBT * 8 - WBL * ******************************************************************************************************* * 1 * 150 0 * . 604 * .182 • .658 * .1 52 • .253 * .047 * . 253 * .085 • *******************************************************************************************************
TABLE NO. 33 CALCULATED DEGREE OF SATURATION ( VOLUME/CAPACITY ) ( IF X = 999.999, NO GREEN TIME)
******************************************************************************************************* * X * TIME * 1 - NBT * 2 - NBL * 3 - SBT * 4 - SBL * 5 - EBT * 6 - EBL * 7 - WBT * 8 - WBL • ******************************************************************************************************* * 1 * 1500 • .949 * .466 * . 508 * .820 * .680 * 1.037 • .951 • .955 • *******************************************************************************************************
TABLE NO. 38 AVERAGE UNIT DELAY (SECON DS/VEHICLE)
************** ***************************************************************************************** *AVDEL * TIME * 1 - NBT * 2 - NBL * 3 - SBT * 4 - SBL * 5 - EBT * 6 - EBL * 7 - WBT * 8 - WBL * ******************************************************************************************************* • 1 * 1500 * 29.9 3 5 * 46.152. 10.867 • 65.156 * 42.916 * 186.784 • 63.887 * 125.898. **************•**************************************************************************************** ***NOTE ... CYCLE LENGTH COMPUTED FROM TIMING CARD.
FIGURE 5 Calculation 3 SOAP 84 results.

114
TABLE 3 COMPARISON OF AVERAGE STOP DELAY PER VEHICLE CALCULATED BY USING HCM METHODOLOGY AND SOAP 84
Direction HCMa SOAP 84
Northbound through 24.79 23.02 Northbound left 71.36 35.50 Southbound through 8.73 8.36 Southbound left 54.60 50.12 Eastbound through 32.31 33.01 Eastbound left 36.01 143.68 Westbound through 49.41 49.14 Westbound left 35.99 96.84
"It should be noted that the HCM through movement does not include a .85 progression factor because in SOAP 84 a progression factor of 1.0 is assumed.
Random arrivals
d2 = 173x2 ((x - 1) + [(x - 1)2 + (16x/c)]lf2}
where
d ~ average stop delay per vehicle for the subject lane group (sec/veh)
C = cycle length (sec), g/C = green ratio for the subject lane group-the ratio of
effective green time to cycle iength, x = volume-to-capacity (v/c) ratio for the subject lane
group, and c = capacity of the subject lane group.
The delay equation of SOAP 84 is D = D1 + D2 + D3
where
D = average delay per vehicle (sec/veh), D 1 = delay per vehicle for uniform vehicle
arrivals, and D2 + D3 = delay per vehicle for random vehicle arrivals.
Uniform arrivals:
D1 = C(l - 'A.)2/2(1 - 'A.x)
where
D1 = delay per vehicle (sec), C = cycle length (sec), 'A. = proportion of green time given to the movement
(effective green time/cycle length), and x = v/c ratio.
Random arrivals:
TRANSPORTATION RESEARCH RECORD 1091
where
Bn = 2(1 - x) + xz; z = (2x/v) x (60/D = (2/c) x (60/D; v = approach volume (vph); T = period length (min), usually 6G min; c = capacity; and
Bd = 4z- z2.
The two factors that both equations use are the degree of saturation (x) and the effective green/cycle length. By running both delay equations with the same degrees of saturation and effective green ratios, a comparison was made to determine if the delay equations will produce different results. Figure 6 shows the delay estimates from the models.
0 H E-<
. 3
~ • 5
w > . 8 H E-< u w ti. ti. w
1.0
. 3 . 5 . 8 1. 0
Legend:
HCM
FIGURE 6 SOAP 84 versus HCM delay (x = vie, for c = 100 sec and v = 100 vehicles).
As can be observed from the data in Figure 6, when the effective green and the v/c ratio are the same in the HCM and SOAP 84 models, the resultant delays are similar except when the v/c ratio approaches 1.0. Because the delay equations give similar results, SOAP 84 and HCM must compute the v/c and effective green ratios differently. Only by having different inputs wouid the two methods produce differenl delay esLimates for-the same problem, as indicated by the data in Table 3.
The next step is to look at how each method calculates the v/c and effective green ratio for left turns in Calculation 3 in Chapter 9 of the HCM. Addressed first are v/c ratios for protected-permissive left turns in the north and south directions. In the HCM methodology, the v/c ratios for the protected portion of a protected-permissive left-tum phase are based on

/SMART
an arbitrary split of demand between the protected and permissive ponion of the tum phase.
In CalcuJation 3, the HCM methodology does not assign any vehicles turning on the permissive portion of the left-tum phase. Only two vehicles per cycle are assumed to tum on the change interval (yellow) of the phase. As indicated in the HCM, a minimum of two vehicles per cycle would be turning, probably as sneakers, during the yellow phase. This assumption of the HCM is conservative because there is excess left-tum capacity in Calculation 3 for the permissive portion of the northbound left-tum and southbound left-tum phases. Because only a minimum amoum of demand is assigned to the permissive portion of the left-tum phase, a high amount of left-tum volume remains on the protected left-tum portion of the phase. Thus, the v/c ratio for the protected left tum remains high and the HCM methodology uses the v/c ratio for the protected portion of a protected-permissive left tum in the delay equations.
The approximation of using the v/c ratio computed for the protected portion of the phase to represent the northbound left turns resulcs in an excessive delay computation. The capacity for northbound left turns using the HCM equations can be approximated as follows (HCM Equation 9-22):
CLT = (1,400 - Vo) (g/C) PTL
where
CLT = capacity of the left-tum permissive phase, (vph),
Vo = opposing through plus right-tum movement (vph), and
(g/C) PTL = effective unsaturated green ratio for the permissive left-tum phase (sec/sec).
For NBL turns,
Vo = 1,011 (g/C) PTL = .45
CLT = (1,400 - 1,011) x (.45) = 175
Protected phase Permissive phase
Total
Capacity (vph)
76 175 251
With a capacity of more than 250 vph and an adjusted demand of 133, the northbound left-tum phase will not be near saturation, as assumed in Calculation 3 in Chapter 9 of the HCM.
For the southbound direction, the HCM assumption that the protected and permissive portion of the left turns are operating at a high v/c ratio actually reflects the existing operating conditions. The permissive portion of the southbound left turns has a small amount of capacity and the delay estimates for the southbound left turns from the two methodologies are much closer (Table 3).
In the east-west direction, there is no protected left-tum phase. Left turns are made in gaps of the opposing through
115
movemencs. In the HCM and SOAP 84 methodologies, the volume demand for left turns is the same for permissive-only left turns. However, the two methods do vary in their calculation of capacity for permissive left turns. The HCM methodology for estimating capacity will produce a higher value than will SOAP 84. Although the methodologies produce capacity estimates that may differ by only 40 or 50 vph for the penn.issive turns, they produce capacity estimates for the permissive turns with significant differences in the v/c ratios. The HCM technique with a high capacity estimates a lower v/c ratio than does SOAP 84. In Calculation 3 of the HCM, SOAP 84 estimates the v/c ratio of eastbound left turns as greater than 1.0. As a result, delay for eastbound left turns is extremely high, as estimated by SOAP 84.
Applying the HCM and SOAP 84 methodologies to Calculation 3 produces the v/c ratios given in Table 4.
As can be observed from the data in Table 4, the SOAP 84 lower estimate of capacity for unp~otccted left turns produces significantly different v/c ratios for eastbound and westbound left turns. For the northbound and southbound left turns, the HCM procedure of assigning a minimum of two sneakers to the permissive portion of a phase results in a higher v/c ratio than estimated by SOAP 84. Through-movement v/c ratios are almost exactly the same.
TABLE 4 V/C RATIOS ACHIEVED BY APPLYING THE HCM AND SOAP 84 MEmODOLOGIES TO CALCULATION 3 IN CHAPTER 9 IN THE HCM
Direction HCM SOAP 84
Northbound through 0.950 0.949 Northbound left 0.936 0.466 Southbound through 0.518 0.508 Southbound left 0.944 0.820 Eastbound through 0.678 0.680 Eastbound left 0.612 1.037 Westbound through 0.948 0.951 Westbound left 0.659 0.955
The next step in the analysis is to look at effective green ratios. For left turns with permissive movements, HCM determines the effective green ratio by adding the protected (if any) and permissive phases, subtracting lost time, and dividing the result by the cycle length. SOAP 84 differs significantly in its calculation of effective green ratios for protected-permissive (northbound left and southbound left) and unprotected left turns (eastbound left and southbound left). The SOAP 84 equation is as follows:
Left-tum effective green ratio = [(Gp+ 2.5 x Sn) + (Gu x CJ/SrJ/cycle length (4)
where
GP = effective green time for protected portion of left tum,

116
Sn = number of sneakers per cycle, Gu = unsaturated green time for permissive portion of
left tum, Ct = Tanner's capacity for unprotected left tum, and Sr = adjusted saturation flow for protected left tum.
When the left-tum headway time is equal to 2.5, SOAP Equation 4 for left-tum effective green ratios becomes equivalent to the left-tum capacity (protected, permissive, and sneakers) divided by the saturation flow [3,600/left-tum headway (default 2.5 sec)]. The HCM includes the entire permissive green time in its estimate of effective green time for left turns. From Equation 4 only a portion of the permissive green is included in the SOAP calculation of effective green ratios. As a result, the effective green ratio for unprotected left turns will vary significantly between the two procedures.
For Calculation 3 in Chapter 9 of the HCM, the effective green ratios are given in Table 5. For through movements and protected left turns without permissive left turns, the HCM and SOAP 84 calculate effective green ratios in a similar manner:
[(Green time and clearance time) - lost rime]icycie iength
Therefore, as can be observed from the data given in Table 5, all effective green ratios for through movements are the same for both methods.
TABLE S EFFECTIVE GREEN RATIOS
Direction HCM SOAP 84
Northbound through .603 .602 Northbound left .653 .182 Southbound through .645 .658 Southbound left .690 .152 Eastbound through .254 .253 Eastbound left .254 .047 Westbound through .254 .253 Westbound left .254 .083
CONCLUSIONS
Four major conclusions can be made in a comparison of the 1985 HCM and SOAP 84.
TRANSPORTATION RESEARCH RECORD 1091
1. SOAP 84 does not make any adjustments to the capacity (saturation flow) for factors included in the HCM. Under the current version of SOAP 84, the user must estimate externally from the program the capacity (saturation flow) for each movement. Requiring the user to make an estimation of saturation flow is one of the major weaknesses in SOAP 84. This problem could be avoided if the saturation flow adjustment factors were incorporated in SOAP 84.
2. SOAP 84 and the 1985 HCM can produce similar results when estimating delay, v/c ratios, and effective green ratios for through movements and protected-restricted left turns. If 1985 HCM saturation flow adjustments are used as input, SOAP 84 could be used as a surrogate for the signalized intersection chapter of the 1985 HCM when evaluating through movements and protected-restricted left turns. However, for unprotected left turns and protected-permissive left-tum phasing, the approach taken by the two procedures differs significantly and would not give comparable results unless the procedure's algorithms are modified.
3. The 1985 HCM underassigns the number of vehicles that use the permissive phase of a protected-permissive left tum. In Calculation 3 in Chapter 9 of the HCM, no left-turning vehicles are assigned to the permissive portion of the left-tum phase. Consequently, the protected portion of the left turn is overassigned. This condition creates unrealistically high v/c ratios and delay computations.
A more realistic estimate of delay for protected-permissive left turns would result if the combined v/c ratio for the protected and permissive portion of the left tum were used in the delay computatio!l..s rather than only the protected portion of the phase.
4. For unprotected left turns, the HCM procedure calculates capacity at a significantly higher value than does SOAP 84.
REFERENCES
1. Special Report 209: Highway Capacity ManlUJl. TRB, National Research Council, Washington, D.C., 1985.
2. SOAP 84 User's Manual, Implementation Package. FHWA-lp-85-7. FHWA, U.S. Department of Transportation, Jan. 1985.
Publication of this paper sponsored try Committee on Highway Capacity and Quality of Service.


![New York Tribune (New York, NY) 1904-09-11 [p 8]chroniclingamerica.loc.gov/lccn/sn83030214/1904-09-11/… · · 2009-02-27The members of the New-York National baseball ... and J](https://img.dokumen.tips/doc/110x75/5aafa5ca7f8b9a5d0a8db416/new-york-tribune-new-york-ny-1904-09-11-p-8-2009-02-27the-members-of-the.jpg)


![New York Daily Tribune.(New York, NY) 1861-03-27 [p 4]. fileNew York Daily Tribune.(New York, NY) 1861-03-27 [p 4]](https://img.dokumen.tips/doc/110x75/5ca55cbe88c993af5d8b605f/new-york-daily-tribunenew-york-ny-1861-03-27-p-4-york-daily-tribunenew.jpg)
![New York Tribune (New York, NY) 1908-09-23 [p 9]REMOVALStoEUROPE MAPLE*CO LONDON Speclattttsln Rtmovala PARIS LOCK UP VANS constantly passing backwards and forwards between j>j* America](https://img.dokumen.tips/doc/110x75/5f10dbbf7e708231d44b27d5/new-york-tribune-new-york-ny-1908-09-23-p-9-removalstoeurope-mapleco-london.jpg)


![New York Daily Tribune.(New York, NY) 1858-07-28 [p 3].€¦ · Eor raataei p.-i.-uia-a *d-dr*ta\A1" 0. CBKAMKR,^ei...! I'i.. 'i. i j^XCI R610N8toELIZAHETIU'ORT,N.J.. J fba.'.r ob](https://img.dokumen.tips/doc/110x75/5ed35ae3080258622969b8c7/new-york-daily-tribunenew-york-ny-1858-07-28-p-3-eor-raataei-p-i-uia-a.jpg)