Embed Size (px)
Citation preview

1
1. Introduction
1.1 The Definition of Environmental Stress Cracking
Service life is always one of the important factors people will consider when
picking the right material. People used to use a lot of metals, and nowadays
plastics are developed so much that they have replaced metals to a large extend.
So the failure problems of plastics get more concerns than ever. Among all the
failures happened on plastics, 15%-‐20% are caused by environmental stress
cracking [1]. It is very interesting to both chemists and physicists as it involves,
stress enhanced absorption, permeation, thermodynamics of mixtures, local
yielding, cavitations, fibrillation and fracture. [2]
Environmental Stress Cracking (ESC) in plastics is the failure of plastics due to the
action of both stress and surface-‐active substances (known as stress cracking
agents). Stress can be external or internal stress and these surface-‐active agents can
be alcohols, soaps, dyes, agents containing moisture. [1,2,5] The source of the stress is
often unavoidably processed in during moulding. So even there’s no applied
external stress, ESC is still possible. The source of fluid contact is sometimes
primary, but the existing of adhesives, paints, lubricants and cleaning agents are
the most often reasons[1,3,4].
ESC is not a chemical reaction between the polymer and the active environment
even though it results from the interaction of the polymer with certain
chemicals. The stress-‐cracking agents accelerate the process of macroscopic
brittle-‐crack formation but not in a way of chemical degradation of polymer [5].
1.2 The Cause of ESC
When polymer subjects to a high tensile force in the temperature above glass
transition temperature (Tg), the material will reach a yielding point before
ductile fracture happens. The time to fracture decreases with the increasing of

2
tensile force. How about the tensile force is low enough that no locally yielded
sites generate? What will be the change in the material?
Fig 1.1 Time dependent creep ruptures strength of an amorphous plastic
showing ductile to brittle transition
From the figure above, we can see, when the material exposes to a low force for a
sufficiently long time, the material will have brittle fracture in the last. Many
factors can accelerate this procedure, for example higher temperature, dynamic
fatigue and contact with specific fluids (ESC)[6].
The fracture mechanism under high stress and low stress is different:
When material is subject to high stress, a high density of locally yielded sites will
be generated and grow, when the yielded sites are big enough to merge with
each other, the sites become a big one and eventual macroscopic yield failure
happens. However, when material is subject to low stress, only a few sites will be
micro-‐yielded and grow slowly. The chance to meet the neighbors and coalesce is
very little. But these yielded zones cavitate and fibrillate to become crazes, which
eventually reach a critical length for fast crack. The absorption of fluid plasticizes
polymer and reduces yield strength [2].

3
Another explanation about these two fracture mechanisms is “tie molecules”. In
amorphous polymers, crack formation due to ESC begins with craze formation.
Highly drawn fibrils hold together these craze regions and bridge the micro-‐
cracks and prevent their propagation and coalescence; For semi-‐crystalline
polymers, tie molecules connect the crystalline laminas through the amorphous
phase [5]. The tie molecules play an important role in the mechanical properties
of the polymer, since it is the bridge for transmission of load. Stress cracking
agents lower the cohesive forces that maintain the tie molecules between the
crystalline laminas. Thus cracking is initiated at stress values lower than the
critical stress level of the material [5].
The fracture mechanism for a polymer with lamellae crystalline structure, e.g.
Polyethylene, is shown in figure 1.2 – 1.4.
Fig 1.2 Initial steps in the deformation of polyethylene [7]
Fig 1.3 Steps in the ductile deformation of polyethylene [7]

4
There are three different kinds of intercrystalline materials in a semi crystalline
polymer: cilia are chains suspended from the end of a crystalline chain while
loose loops are chains begin and end in the same lamellae; the third kind is tie
molecules, which are chains begin and end in adjacent lamellae.
When a large tensile load is applied as shown in the arrow direction in Fig1.2 (b),
some tie molecules cannot be pulled out any more (Fig1.2(c)) and lamellas break
up into small units as shown in Fig1.3(b). For a small tensile load, the large-‐scale
fiber pullout is not attained, the loading situation will stay like Fig1.2(b) for a
long time, but after a critical time, most of tie molecules disentangle from the
matrix and load cannot be supported by the remaining few tie molecules, thus
happens the brittle fracture in Fig1.4.
Fig 1.4 Final step in the brittle failure of polyethylene [7]
Any stress cracking agent will help the tie molecules to be pulled out from the
lamellae [5].
1.3 The Prediction of ESC
Now there’s still no exactly effective way to calculate or predict the influence of a
given fluid on a certain polymer.[2] Some kinds of severe ESC fluid can be
absorbed by polymer very quickly, and the fast decreasing of hardness and
strength would cause a fast fracture. Not all the liquids have this significant
impact even though almost every kinds of fluid are more affinitive than air.

5
As there are tens of thousands of fluids in the world, as well as thousands of
plastics, how can we know if this plastic is safe to use in contact with a particular
fluid? But as no system way is found to calculate the impact, what we can do is
prediction or testing.
There’re some generalizations made by scientists who work on this area for a
long time. Normally amorphous thermoplastics or thermoplastics in their
amorphous state are more prone to ESC than the semi-‐crystalline state or
thermoset. As the structure of the crystalline is more packed, not like the loose
structure in the amorphous phase. So fluid cannot go into crystalline as easy as
amorphous phase. For the thermoset, as it’s cross-‐linked between molecular
chains, the diffusion of fluid also meets barrier. Another rule is about hydrogen
bonding. More details about hydrogen bonding will be discussed later in this
chapter. D.Wright[2] found that fluids with modest hydrogen bonding are most
likely to be severe or moderate stress cracking agents. But also in
Bistra’spaper[5], she indicated that fluids with a low hydrogen bonding are prone
to be severe or moderate ESC agents. In Isaksen’s early works[8], he carried out
experiments on many fluids tried to correlate fluids parameters to ESC, but
found no close relation between hydrogen bonding and ESC. It’s possible this
rule only works in some kinds of polymers but maybe not for all the plastics.
Fluids with a high molar volume have fewer possibilities to be severe stress
cracking agents [2]. Because high molar volume leads to high viscosity and it’s not
easy to move freely with a high viscosity. Similar rule is plastics with high melt
flow index suffer from reduced ESC resistance[2], as it’s not easy for the
movement of fluid molecules in polymer chains with large molecular weight.
Amorphous plastics are most susceptible to ESC at temperatures that approach
their Tg[2]. This due to the increased free volume in polymers as Tg is
approached, which facilitates fluid permeation into the polymer.
Early research indicated total solubility parameter of the fluid was the most
critical factor. This parameter is from the total cohesion energy of the substance.
If the polymer and fluid have similar total solubility parameter, then the polymer
tends to absorb more fluid than the one doesn’t have a similar total solubility

6
parameter. This theory only works well with the solubility parameter less than
10, it’s not able to predict the performance between polymer and fluid which
have a total solubility parameter more than 10[2].
With more research on solubility parameter, scientists found the total cohesion
energy of a liquid, E, can be divided into at least three separate parts either by
experiment or by calculation[9]. In the three-‐parameter Hanson approach, these
parts quantitatively describe the non-‐polar (atomic), dispersion interactions, ED,
permanent dipole-‐permanent dipole (molecular) interactions, EP, and the
hydrogen-‐bonding (molecular) interactions, EH.
E = ED + EP + EH (1)
Dividing this equation by the molar volume, V, gives the respective Hansen
cohesion energy (solubility) parameters.
E/V = ED/V + EP/V + EH/V (2)
δ2= δD2 +δP2 +δH2 (3)
The total cohesion energy divided by the molar volume is the total cohesion
energy density. The square room of this is the Hildebrand total solubility
parameter, δ. The SI units for these are MPa1/2.
Now there’re more models used to predict this ESC phenomenon. Isaksen[8] used
polar parameter to predict ESC for HDPE and he established a reasonable
correlation between equilibrium absorption and time to fail together with polar
solubility parameter. In his study, polyethylene, which has the lowest polarity of
all polymers, is the most rapidly attacked by fluids of (similar) low polarity.
Hansen and Just [10] reported the results that confirm ESC phenomena in plastics
depend on the size and shape of the test liquid’s molecules as well as their
Hansen Solubility Parameter (HSP) relative to those of the polymer.
Peter J. Walsh and A.J. Lesser [11] probed a hypothesis for predicting a critical
stress associated with of ESC. An experimental technical involving contact angle
measurements of a sessile drop as function of stress is used. But they still need
further experiments to look at the effect of contact angle on ESC.

7
1.4 Assessment by Testing
There are a variety of test methods available for assessing the ESCR of
thermoplastics. Mainly they are constant strain or constant stress testing. But
constant strain test is always less severe than the equivalent test involving the
application of a constant load because the stress in the sample induced by
constant stain will decay with time due to stress relaxation.
1.4.1 Constant Strain Tests
Constant strain tests are most commonly used because they are cheap to carry
out. The problem for this kind of tests is stress relaxation mentioned in the
paragraph above.
1.4.4.1 Bell Telephone Test (BTT) for Flexible Materials
In the test, a strip of the material is bent. The maximum surface strain is given
by:
ε= t/ (w-t) (4)
Where w is the width of the holder and t is the material thickness. This method is
quite crude and cheap and only really used for quality control testing of
polyethylene.[2]
1.4.2 Constant Stress Tests

8
1.4.2.1 Single Cantilever for Rigid Materials
It’s a simple method without dedicated investment. A strip of the material is
clamped to the edge of a sturdy bench. The fluid is applied to the upper surface.
As a control it is recommended that the same configuration be run concurrently
in the absence of the fluid. [2]
1.4.2.2 Tensile Creep Test
A high temperature tensile creep rupture testing device which is applicable to
both rigid and flexible materials was developed by Rapra. [2] It’s quite similar to
the common test at constant load. It involves application of a tensile stress and
the recording of the time to rupture. Even though the name is high temperature
creep testing device, it’s also possible to work in normal temperature. This is the
device on which the creep tests in this paper carry out.
1.5 Aim of the Project
The aim of this project is to investigate the properties of a POE hose, especially
the environmental stress cracking resistance property. And if there’s any
relatively simple way to predict if the hose can be used to contain the given fluid.

9
2. Experimental
2.1 Materials
In this chapter, different tests are explained. All the materials used in the
following tests were taken from the POE hose (SPX DN13) (figure 2.1), which is a
commercial product of LK Pex. The raw material used for the hose was POE. It is
a kind of thermo elastomer made by in-‐situ polymerization of ethylene and
octene in metallocene catalyst. The soft chain structure of octene and crystallized
ethylene chain make POE not only stiff but also easy to process. The saturated
structure makes it excellent ageing-‐resistant material. Now it’s widely used in
cable industry, automotive industry as well as household appliance industry.
Fig 2.1 Photo of a specimen cut from the hose
2.2 Apparatus
2.2.1 Tensile Test
The aim of the tensile test is to get the stress and strain for the hose to break in 4
kinds of liquids. They were xylene, acetic acid, Igepal CO-‐630 and water.
Tensile test was carried out in the Rheology Lab, Department of Materials and
Manufacturing Technology, Chalmers University of Technology. The model of the
tensile test machine was ZWICK. LK Pex modified the grip of the tensile test
device in order to fit the shape of hose. Figure 2.2 is a photo of tensile test device
(left) and a close look of the new grip (right). For the new grip, it’s clear to see
how it works in figure 2.3. There are two pieces of sample holders holding the

10
ring. When the grips go upwards, the upper piece of sample holder will also go
upwards and thus the elongation of the ring.
Fig 2.2 Photo of tensile test machine and a close look of new grip
Fig 2.3 Sketch of the grips before test (left), in the test (right)
Here is the process for the experiment: a section of hose (ring) with a length of
12 mm (Fig 2.1) was cut from a long hose and fixed in the machine as shown in
photo. The crosshead can travel with a speed preset on the software. Then the
crosshead would drive the movement of grips. So the hose got elongation. Once
the crosshead began to move, one kind of liquid was applied on the outer surface
of the ring using a burette. There was a hole designed in the bottom base of the
device to accept the liquid from the hose for the sake of protecting the device. To

11
assure that there’s always liquid on the ring, the liquid should be applied on the
surface very often until the break happened.
The 2000N load cell was used in the experiment and speed set for crosshead was
20mm/min for the first minute and 2mm/min later on.
Tensile tests were carried out with the dry ring and also on the rings with four
different agents. They were xylene, acetic acid, Igepal CO-‐630 and water. Three
to four times of repetitions were done for every different liquid.
2.2.2 Creep Test
The rig for the creep test was designed by LK Pex. It’s a developed version of
tensile creep rupture rig from Rapra[2]. The software used here was Creep
Software EC 04 from the company Elastocon AB. A photo of the tensile creep test
rig is shown in figure 2.4.
Fig2.4 Photo of creep test machine which is developed from Rapra tensile creep
rupture rig
When compare this rig with the one from Rapra, there are several advantages for
the new rig designed by the company. First a digital device was installed to
measure and record the elongation of specimen. Secondly, the special curve

12
design of the link between the lever and movable head for holding the sample
allows more accurate recording of the sample elongation. Also the design of the
solvent tank makes it easier to carry out creep tests with several different
challenging liquids, as it’s easier to change the liquid and safer for the operator.
The validation of the new rig was done by comparing the elongation figure in the
digital device with the figure got from a vernier caliper. The result showed that
most of the time the figures shown in device were exactly the same as what got
from vernier caliper. Even there was difference some times, the difference was
small enough to neglect.
By doing the test, first to do was balance the lever with the left side and right
side. The left side had the weight of the empty weight pan, weight of pointer
from digital gauge and also the self-‐weight of left side lever. The right side had
the weight of one of sample holder, the upper part of crosshead, the weight of
right side lever and the counter balance. The lever can be equilibrious by moving
the counter balance. After the lever was balanced, the similar specimen was cut
as the one in the tensile test, and then dimensions were measured. The
specimen was fixed on the sample holder. The sample holder was then placed in
the socket of the crosshead. Pour the liquid in the tank and add the weights to
the weight pan as soon as finishing pouring the liquid. The time interval for the
two procedures should be short because if it delayed, it’s possible some of the
liquids can be plasticizer for polymer, the property of polymer would change as
well as the creep feature.
In the creep tests, the same liquids as in the tensile test were used. They were
xylene, acetic acid, Igepal CO-‐630 and water.
Several pre-‐tests were done before the formal tests to decide how much weight
should be put on the weight pan. The weight should not be too large, otherwise
the elongation may exceed the measuring range of the rig and also a large force
may not lead to environmental stress cracking due to the generation of a high
density of local yielded sites. Meanwhile a too small weight is also not preferred
as it may take a longer time for the plastic to have feature changes.

13
After several pre-‐tests, a weight of 2.5 kg to 3.5 kg was chosen. And for the sake
of time limit of the project, most of the creep tests were stopped in 5 days or
when there was an obvious change in the strain rate.
Then came the analysis of data in the last. However, as the POE hose specimen
can elongate as much as 10 times of the original length before breaking, it’s out
of the rig’s record ability. Also an elongation of 10 times is not interested for the
project as in the real service condition a hose will never elongate so much. So in
the test, only a 100% elongation was recorded. And then the strain rate during
elongation was analyzed.
Fig 2.5 A strain logt sketch from uniaxial creep rupture in glass
fiber/polyester.[12]
From figure 2.5 we can see, a polymer has three different stages of elongation
during the creep test. The first stage is the elastic elongation (not shown in the
figure). The secondary creep is a relatively flat stage. After that comes the
tertiary creep, which is also the initiation of fracture.[12] In the test, an earlier
appearance of the third stage is judged as a quicker fracture initiation.

14
2.2.3 Swollen Test
The hose we used in the experiment was cross-‐linked by 0.5% peroxide. The
degree of cross-‐linking is a very important aspect in the characterization of
polyethylene based polymers.
The way to carry out swollen test was a classic way first used by P.J. Phllips and
W.S. Lambert using boiling xylene [13,14]. Figure 2.6 is the photo of swollen test
device.
Xylene was supplied by Fisher Scientific, analytical reagent grade.
Fig 2.6 Photo of the device for swollen test
Fig 2.7 Photo of thin films from POE hose for swollen test
Thin films[15] (figure 2.7) from the POE hose of known weight were immersed in
boiling xylene (138 0C – 140 0C) in a stainless-‐steel basket for 72 hours to allow

15
the extracting of uncross-‐linked polymer. Afterwards the basket with the
remaining part of the film was transferred into a xylene-‐containing flask and
held at 1100C oil-‐bath for 24 hours. This was for the swelling of the cross-‐linked
matrix. The sample was transferred to a clean dry tared weighing bottle for
weighing without delay. Here it should be very careful as the sample should not
be squeezed and the transfer of specimen should be made quickly. The surfaces
should not be subjected to excess blowing. After recording the weight in swollen
state, the sample with opened weighing bottle was transferred to a vaccum oven
(Heraeus Vacutherm, Thermo Scientific) at 1100C for 24 hours. Two groups of
POE hose made in different times were used in the experiments with 3
repetitions in each group. Estimates of percentage of extractables were obtained
using the weight loss of POE. The molecular weight between crosslinks was
estimated using the Flory-‐Rehner equation as follows[14,16,17]:
V2 = (W2/ρ2)/[W2/ρ2+(W1-‐W0)/ρ1] (5)
v = -‐[ln(1-‐ V2)+ V2 + χV22]/ V1(V21/3 -‐ V2/2) (6)
Mc =ρ2/v (7)
Where v is the effective network chain density,V2 is the volume percentage of
polymer in a swollen sample, V1 is the molar volume of solvent, χ is the Flory-‐
Huggins polymer/solvent interaction parameter, W0 is the weight of polymer
before swelling, W1 is the weight of polymer after swelling, W2 is the weight of
polymer after vacuum drying, ρ1 is the density of solvent, and ρ2 is the density of
polymer. In the calculation of MW, the values of V1 and χ are 136 mL/mol and
0.37, respectively.[14]
.
16
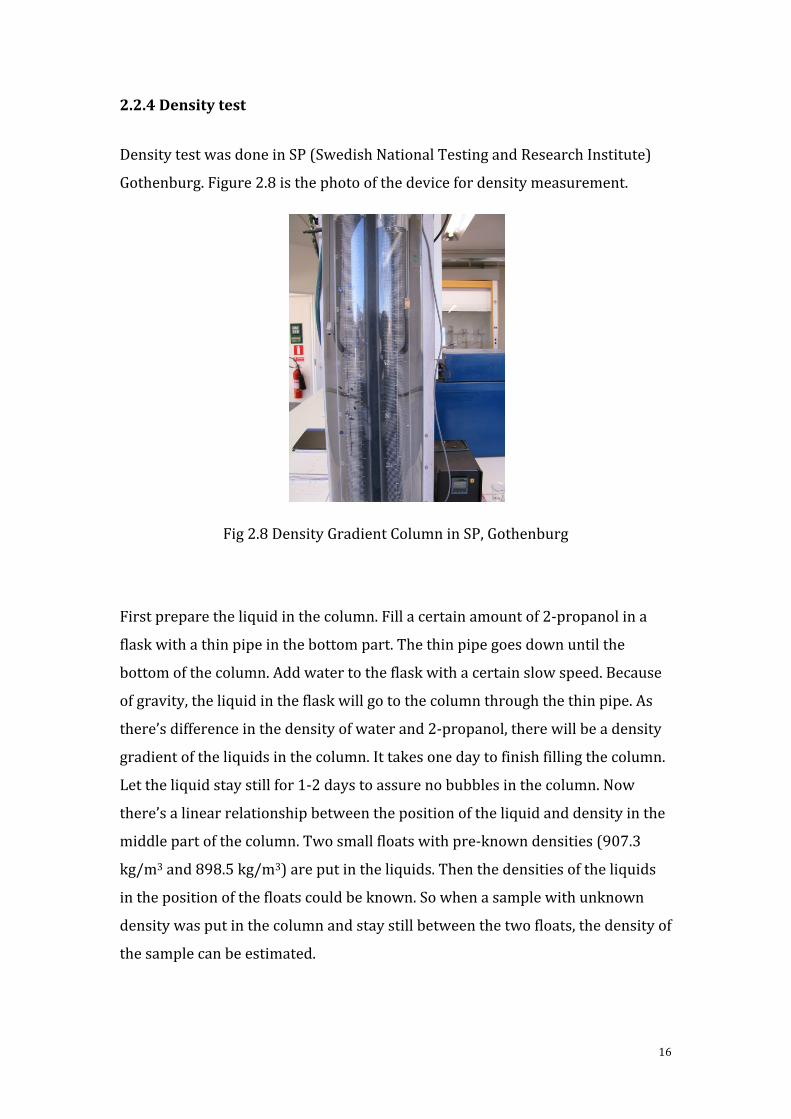
2.2.4 Density test
Density test was done in SP (Swedish National Testing and Research Institute)
Gothenburg. Figure 2.8 is the photo of the device for density measurement.
Fig 2.8 Density Gradient Column in SP, Gothenburg
First prepare the liquid in the column. Fill a certain amount of 2-‐propanol in a
flask with a thin pipe in the bottom part. The thin pipe goes down until the
bottom of the column. Add water to the flask with a certain slow speed. Because
of gravity, the liquid in the flask will go to the column through the thin pipe. As
there’s difference in the density of water and 2-‐propanol, there will be a density
gradient of the liquids in the column. It takes one day to finish filling the column.
Let the liquid stay still for 1-‐2 days to assure no bubbles in the column. Now
there’s a linear relationship between the position of the liquid and density in the
middle part of the column. Two small floats with pre-‐known densities (907.3
kg/m3 and 898.5 kg/m3) are put in the liquids. Then the densities of the liquids
in the position of the floats could be known. So when a sample with unknown
density was put in the column and stay still between the two floats, the density of
the sample can be estimated.

17
3. Results and Discussion
3.1 Calculation of the Total Solubility Parameter of POE
The cohesive energy density or solubility parameter of polymers cannot be
calculated via the heat of vaporization, because the energy for separating the
molecular chains is always larger than breaking down the polymer into small
molecules. An indirect method is to find the best solvents for the polymer. The
solubility parameters of the polymer would then equal that of the solvents.
Alternatively the molar attraction constants (G) for sub-‐molecular groups may
be used to provide a calculated value[18]. Values for groups in POE are given
below:
-‐CH2-‐ = 133; -‐CH-‐ = 28; -‐CH3 = 214;
For POE used in the experiment, the percentage of ethylene and octene are
treated as commercial secret by the supplier. The structure of this polymer is:
δ= d•G/M (8)
Where M is the molecular weight of a repeat unit (28x+112y) and d is the density
(0.909 g/cm3, density test will be presented later in this article).
For POE used in this test,
G = (133+133)•x+ (133 +28+133•5+214)•y = 266x+1040y
G/M = ()/(28x+112y) = 9.5 –y/(x+4y) = 9.5 –1/(x/y+4)
G/Mmin = 9.5-‐0.25 = 9.25 (when x/y→0)

18
G/Mmax = 9.5-‐0 = 9.5 (when x/y →∞)
δmin = d•(G/M)min = 0.909•9.25 = 8.408 (cal/cm3)1/2 = 17.24 MPa1/2
δmax = d•(G/M)max = 0.909•9.5 = 8.636 (cal/cm3)1/2 = 17.70 MPa1/2
So the total solubility parameter for POE is between 17.24 and 17.70 MPa1/2.
As polarity comes from the misalignment of positive electric charge center and
negative electric charge center, normally molecules with symmetrical structure
have a low polarity.
The structure of the main chain of POE is very regular and symmetrical. The side
group –(CH2)5CH3 has a very low polarity, plus normally polymer has a long
chain, side group would stay on the two sides of main chain, which causes an
even lower polarity.
So, POE has a very low polar solubility parameter.
3.2 Tensile test
Before showing the result of tensile test, here is some explanation of calculation
of stress and strain.
Fig. 3.1 Cross-‐section view of initial ring on the sample holder

19
Fig 3.2 Cross-‐section view of ring and sample holder during a test
The length of the dash line in the schematic is the length of ring used in
calculation. As the ring has an initial thickness of around 2.2 mm, during the test,
ring was becoming thinner and thinner, the actual thickness at a certain time
cannot be known.
After some measurements of thickness during the test and also for the sake of an
easy calculation, following assumption is made:
When the crosshead travels between 0-‐10 mm, the length of the ring which
contacts the ring holder is the initial ring length which is 46.472 mm.
When it goes between 10-‐20 mm, the length is 46, when it goes between 20 -‐ 30
mm, the length is 45; and the like. At last before the break, as the ring is so thin
that the thickness can be neglected. The length of ring which contacts the holder
is 40.3.
σ = F/A0 (9)
A0 = 2•t•w (10)
w is the width of the ring;
ε = (l-l0)/l0 (11)
l0 is the initial length of the ring; l is the length of ring at a certain time;
True stress σt = σ•(1+e); (12)
True strain εt = ln(1+e) (13)

20
Table 3.1 shows the result of the different test groups in tensile test. The result
shows in Table 3.1 is the mean value of 4-‐5 repetitions in the corresponding
group. As mean values, they can better represent the property of material but
stress-‐strain plot of material from beginning of the test to the end cannot be
gained from the mean value. So Table 3.2 shows the result of typical run in each
group, which has the closest value as the mean value. The further analysis is
based on these typical tests.
Table 3.1 Result of tensile test
Sample Stress(MPa) Strain True
stress(MPa)
True strain
Dry specimen 23.21 5.37 147.87 1.85
Specimen with
water
23.40 5.26 146.43 1.83
Specimen with
xylene
18.79 4.95 111.73 1.78
Specimen with
acetic acid
20.92 5.08 127.12 1.80
Specimen with
Igepal CO-‐630
23.15 5.30 145.80 1.84

21
Table 3.2 Result of typical run in each test group
Sample Stress(MPa) Strain True
stress(MPa)
True strain
Dry specimen 22.99 5.44 148.12 1.86
Specimen with
water
24.17 5.35 153.40 1.84
Specimen with
xylene
18.14 4.86 106.27 1.77
Specimen with
acetic acid
20.47 5.04 123.61 1.80
Specimen with
Igepal CO-‐630
22.90 5.32 144.67 1.84
Fig 3.3 Stress-‐strain chart of samples in different agents

22
Fig 3.4 True stress-‐true strain chart of samples in different agents
From these figures, we can see:
1. No big difference is shown between the dry samples and samples in water or
Igepal.
2. Acetic acid and xylene have quite big influence on the ring. The stress to
break decreases 25% for sample in xylene compared with dry sample. While
for acetic acid, it is 14%. The decreasing is large enough to convince people
the impact of xylene and acetic acid on POE hose.
Igepal CO-‐630 is the most commonly used stress cracking agent for evaluating
polyethylene or ethylene copolymer because it has a solubility parameter of
20MPa which is not far from PE’s 16.4MPa or POE’s 17MPa. But here there was
little influence of Igepal CO-‐630 on tensile test. One of the reason is Igepal CO-‐
630 has a relatively high molar volume (600cm3/mol), the degree of absorption
is low under zero stress, but increases with increasing stress.[2] But experiments
also show that there is little difference between Igepal and air in the rupture test

23
which is less than 15 hours. This means Igepal is a slow runner. Tensile test was
less than 20min for each specimen. This explains why Igepal has little influence
here.
3.3 Creep test
Fig 3.5 Strain-‐logt plot of POE in acetic acid with a range of loading
There are some small fluctuation in the beginning of the curves, it’s because
weight pan was held by hand when loading these weights on the pan. Small
movement of the weight pan caused by hand was recorded.
From figure 3.5 we can see an earlier third stage comes with a relative large
loading, which means an earlier fracture will happen. What can also be observed
is that the curve for stress of 0.975 MPa (with a loading of 3.5kg) is different
from those with smaller loadings. It doesn’t have a flat stage. Possible because
this loading is large enough that the equilibrium stage of the external force and
force from tie molecules quickly passed.

24
Fig 3.6 Strain-‐logt plot of POE in different fluids with a constant stress of 0.557
MPa (with a loading of 2.5kg)
Fig 3.7 Strain-‐logt plot of Igepal in concentration of 100% and 40% with a
constant stress of 0.557 MPa (with a loading of 2.5kg)
From the above two figures, we can see:

25
Almost no influence was brought by water compared with sample in air. They
have same modulus as well as the shape and trend of the curves.
Igepal CO-‐630 has a smaller modulus compared with dry sample, but in the
limited time recorded in the experiment, still there’s no big difference of the
shape of the curve.
Acetic acid shows a third stage after about 15 hours.
Obviously xylene is the most severe ESC agent among all the fluids shown here. It
has a third stage in less than 8 hours. And from the observation of sample after
creep test, xylene was the fluid POE absorbed most.
Table 3.3 HSP of four fluids in the test.[9]
Fluids δD δP δH δT
Xylene
Acetic acid
Igepal CO-‐630
Water
17.8
14.5
/
15.5
0-‐1
8
Appr. 10
16
3.1
13.5
/
42.4
18
21.3
20
47.9
POE has a total solubility parameter between 17.24 and 17.70, and a polar
solubility parameter closes to 0 and hydrogen bonding closes to 0. As early
work[8]was done by other scientists that they correlated polar solubility
parameter to ESC and got a good simulation on HDPE. From the data here, xylene
has the closest polar solubility parameter and it is the most severe ESC agent, but
xylene also has the closest total solubility parameter. As lack of more data to
support, it cannot say we have the same conclusion here.
But we can see from this group of data, that total solubility parameter has a same
sequence as the severity of ESC in the range of fluids which have similar molar
volume. Xylene has the closest total solubility parameter, follows acetic acid as
well as Igepal CO-‐630, and last comes water which has a largest difference in
total solubility parameter.
From figure 3.7 we can see molar volume is very important factor.

26
However, because of the measuring range of the rig which is less than 25mm,
while the elongation of POE to break is around 220mm, it’s not possible to
record ring’s time to rupture. For this reason, a figure like figure 1.1 cannot be
obtained from the creep tests here. Also if a ductile to brittle transition existing
for POE cannot be judged. It’s difficult to compare the result with other
literatures, e.g. the influence of crystallinity or cross linking degree on ESC, as
most of the papers evaluate ESC by rupture time of material.
The result from creep test is similar with the result got from tensile test. Then it’s
possible to have the assumption that tensile test can predict ESC of chemical
agents with a small molar volume. The time for tensile test is much less than that
of creep test. But for these small molecules, they can immerse in polymer with
less hindrance. Even the time is short, they can still impact the property like
chain entanglement of polymer.
3.4 Swollen test
Table 3.4 Percentage of extractables, molecular weight between crosslinks and
average chain length between crosslinks of POE hose
Specimen nr. Extractables
(%)
Mw between
crosslinks
Average CH2 units
1
2
3
4
5
6
38.3
39.1
37.4
39.2
38.7
38.4
651.9
656.2
649.5
648.5
652.3
649.2
47
47
46
46
47
46
So the molecular weight between crosslinks is around 650 g/mol, and average
CH2 units between crosslinks are 46-‐47.

27
Compared with the work done by Liao[19], they did swollen test on another grade
of POE and with the same procedure, but the result was very different from the
result we get here. The average molecular weight between crosslinks is 4108
g/mol for 0.5 wt% crosslinking agent and the extractable rate is 20.8%. And the
POE they used was Engage 8003 from Dow Chemical and the density is 0.885
g/cm3 which has a lower density than the POE used here. It’s possible it’s not a
linear polymer and has more branch than the polymer we use. Branch could
increase the molecular weight between crosslinks a lot. Another reason could be
the different use of crosslinking agents.
3.5 Density Test
Fig 3.8 Result of gradient column test
Read from the figure we can see the density of the POE hose is 0.909 g/cm3.The
densities of amorphous phase and crystalline phase are 0.852 g/cm3 and 1.008
g/cm3, respectively.
As degree of crystallinity fc = (ρ-‐ ρa)/(ρc -‐ρa) (14)
fc = 36.5%
28
4. Conclusion
In all the four fluids tested on POE, xylene has the most severe ESC impact on
POE, followed by acetic acid and Igepal CO-‐630, while water almost has no
impact on POE. Compare with the ESC prediction models mentioned in the
beginning of the article, total solubility parameter fits best with the result. That
is, for the agents tested on POE, the more closer are the total solubility
parameter of the agent and that of the material (POE), the more severe effect on
ESC. Tensile test were in some agreement with the creep tests. Within in range of
agents tested on POE, tensile tests were helpful towards investigating the
severity of ESC but limited to fluids having a small molar volume.

29
Recommendations for Further Research
Creep test on more fluids can be carried out in the future. For example fluids
with a close total solubility parameter but different polar solubility parameter or
close polar solubility parameter but different total solubility parameter
compared with POE. Also POE with different grades can be tested to see how the
relation goes with density and molecular weight between cross links with ESCR.

30
References
1.M.C. Hough, D.C. Wright, Polymer Testing 1996, 15, 407-‐421
2. D. Wright, “Environmental Stress Cracking of Plastics”, RAPRA Technology Ltd.
Shawbury 1996
3. J. Lagaron, N.M. Dixon, B.J. Kip, Macromolecules 1998, 31, 5845-‐5852
4. J. Lagaron, J. Pastor, B. Kip, Polymer 1999, 40, 1629-‐1636
5. B. Andersen, Doctoral dissertation “Investigations on Environmental Stress
Cracking Resistance of LDPE/EVA Blends”, 2004
6. A. Lustiger, R.D. Cornelinssen, J. Mater.Sci. 1987, 22, 2470-‐2476
7. A. Lustiger, “Understanding Environmental Stress Cracking in Polyethylene” in
“Medical Plastics: Degradation, Resistance & Failure Analysis”, R.C. Portnoy,
SPE, Plastic Design Library 1998, p. 66-‐71
8. R.A. Isaksen, S. Newman, R.J. Clark, J.Appl. Polym. Sci. 1963, 7, 515
9. C.M. Hansen, “Hanson solubility parameters-‐ a user’s handbook”, CRC Press
LLC, 2000
10. C.M. Hansen, L. Just, Ind. Eng. Chem. Res. 2001, 40, 21-‐25
11. P.J. Walsh, A.J. Lesser, J. Mater Sci. 2007, 42, 5835-‐5844
12. Brostow, Corneliussen, “ Failure of Plastics”, Hanser Publishers 1986
13. P.J. Phillips, Polymer 1990, 31,2077-‐2082
14. P.J. Phillips, ANTEC 1994, 1476-‐1479
15. ASTM D 2765 – 01 Standard Test Methods for Determination of Gel Content
and Swell Ratio of Crosslinked Ethylene Plastics, 2006
16. D.J. Dijkstra, W. Hoogsteen, A. Pennings, Polymer 1989, 30, 866-‐873
17. G. Gielenz, B. Jungnickel, J. Colloid Polym. Sci. 1982, 26, 742-‐753

31
18. P.A. Small, J. Appl. Chem. 1953, 3, 71
19. H.T. Liao, C.S. Wu, Polymer-‐Plastics Technology and Engineering 2003, 42, 1,
1-‐16


![ﻢﻴﺴﻠﻛ ﺕﺎﻨﺑﺮﻛ ﺕﺍﺭﺫﻮﻧﺎﻧ …pishrochem.com/uploads/Articles/5.pdf · crazes which can absorb energy [8]. ... plastics,toughnessisoftenmeasuredusingCharpyandIzodimpact](https://img.dokumen.tips/doc/110x75/5b796e2f7f8b9a7f378da1ed/-crazes-which-can.jpg)