Embed Size (px)
Citation preview

YATRA CAPITAL LIMITED
UNAUDITED INTERIM FINANCIAL STATEMENTS
FOR THE SIX MONTHS ENDED 30 SEPTEMBER 2016
INVESTMENT MANAGER

1
Contents
Performance Summary......................................................................................................................2
Chairman’s Statement.......................................................................................................................3
Board of Directors.............................................................................................................................5
Directors’ Report...............................................................................................................................7
Corporate Governance Report.........................................................................................................12
Statement of Financial Position......................................................................................................16
Statement of Profit or Loss and Other Comprehensive Income......................................................17
Statement of Changes in Equity.....................................................................................................18
Statement of Cash Flows................................................................................................................19
Notes to the Financial Statements.................................................................................................20
Corporate Information...................................................................................................................44
Contact information......................................................................................................................45

2
Performance Summary
Yatra Capital Limited (“Yatra” or “the Company”) through its investment in K2 Property Limited
(K2) has exited from 9 out of a total of 14 investments in its portfolio up to 30 September 2016.
This includes 6 complete exits from a mixed-use project in Bhavnagar, a listed investment in
Phoenix Mills Limited, Gangetic Developers Private Limited in Agra, Palladium Constructions in
Bangalore, Vamona Developers Private Limited in Pune and City Centre Mall in Nashik and 3
phased exits of our full interest in Riverbank Holdings in Kolkata; Treasure Town in Bijalpur, Indore
and Forum IT Parks in Kolkata. We have also partially exited from one of our ongoing assets Saket
Engineers in Hyderabad. As of 30 September 2016, Yatra through its investment in K2 remains
invested in 4 investments, of which one is an enterprise level investment which has several
projects in the entity which are currently being developed.
The Company redeemed 1,410,437 ordinary shares for EUR 10 mn during the period.
Net Asset Value (“NAV”)* per share increased by 6.17% from EUR 7.09 as at 31 March 2016 to EUR
7.53 as at 30 September 2016.
The net profit for the period ended 30 September 2016 derived from the investment activities of
the Company was EUR 1.52 mn. This is as compared to a net loss of EUR 8.07 mn for the period
ended 30 September 2015. Basic and diluted profit per share for the period ended 30 September
2016 was EUR 0.31 as compared to basic and diluted loss per share of EUR 1.03 for the period
ended 30 September 2015.
*NAV per share is based on Yatra’s net assets derived from the Statement of Financial Position as at 30 September
2016 divided by the number of shares then outstanding and in issue.

3
Chairman’s Statement
Dear Shareholders,
I am pleased to report to you on the performance of the Company for the six-month period ended 30
September 2016.
The Company has reported a profit for the period of around EUR 1.82 million, deriving predominantly
from above-forecast cash receipts and adjustments to the values of underlying portfolio assets, with
a minor positive effect from currency movements. Further details of individual assets appear
elsewhere in these interim financial statements. Investors will note that the Company’s net asset value
continues to reduce by virtue of its ongoing programme of capital returns to shareholders.
Operationally, the Board members of the Investment Sub-Committee carried out their regular visit to
India in October and met with our key partners in Pune and Hyderabad, taking the opportunity to
emphasise the Company’s objective of robust management to deliver maximum returns to
shareholders. This is seen by the Investment Manager as being helpful in their ongoing negotiations.
Costs continue to be reduced where it is viable and appropriate to do so, without prejudicing the
Company’s governance and regulatory systems and controls; and to that effect, the Company’s
remuneration committee has recommended to the board of directors a further reduction in directors’
fees of 10% with effect from 1st October 2016, and such recommendation has been accepted.
Given that all of the Company’s remaining portfolio assets are being moved towards realisation,
macroeconomic factors continue to have a declining degree of influence on Company performance,
but is notable that the INR:EUR rate has moved from 74.75 at the balance sheet date to 72.75 at the
time of writing, continuing the trend seen since early September.
As part of the board’s ongoing financial planning processes, an exercise has been conducted to seek
to assess the likely expected and final outcome in net asset value (“nav”) per share terms once all of
the Company’s remaining assets have been disposed of, liabilities settled, the Company’s subsidiaries
liquidated and the necessary steps taken to place the Company in a position to liquidate once the final
return of capital to shareholders has been made. When taking into account contractual incentive fees
which would accrue to the investment manager if and when the remaining assets are sold, based on
the current assessed fair values of those assets, and being mindful of the governance, regulatory,
administration and audit costs required to keep the group in good standing, together with the cost of
the liquidation process itself, the board can now indicate that the additional sum to be returned to
shareholders at the conclusion of the liquidation process is anticipated to be in the range of EUR 6.20-
EUR 6.40 per share. The achievement of this estimate remains subject to material uncertainty, and
assumes static currency rates. Further assessments of the likely outcome will be made and reported
to you on a periodic basis.
The board and the investment manager have been reflecting upon the progress that the Company has
made since the asset disposal programme was initiated through board recommendation and the
shareholder vote in 2013. It is the board’s view that the investment manager has performed creditably
in achieving exits from portfolio assets that in several cases were far from straightforward, and that
the proceeds received and thus the capital already returned to shareholders has been in the aggregate
at the upper end of the range of possible outcomes. Additionally, the investment manager believes

4
that the timing for possible new real estate investments in India is very attractive as is their deal flow
in relevant areas of the sector.
As a result, the board is consulting with major shareholders as to a possible change in the investment
strategy of the Company. Such amendment, if approved by shareholders in general meeting, would
result in the cash flow realisations from existing investments in the process of being divested
(including cash on hand) being re-invested in Indian residential real estate assets with the aim of
providing an attractive and stable annual income yield, alongside capital gains, to investors over the
long term. In the event that it is appropriate to do so, the Company will make further announcements
on this and related matters. I wish to reiterate that while this consultation process is undertaken, the
Company will actively continue its realisation programme without delay and will, in any event, seek to
realise all its remaining portfolio assets on an expedited basis if shareholders ultimately decide to
change the Company’s investment strategy, as outlined.
As always, I would like to thank my board colleagues, our Investment Manager, IL&FS Investment
Advisors LLC, our advisors, and you, our shareholders, for your continuing support.
Best wishes
Richard Boléat
Chairman
29 November 2016
5
Board of Directors
Richard Boléat
Richard Boleat qualified as a Chartered Accountant with Coopers & Lybrand in the UK in 1988. He
subsequently worked in the Middle East, Africa and the UK for a number of commercial and financial
services groups before returning to Jersey in 1990. He was formerly a Principal of Channel House
Financial Services Group Limited prior to its acquisition by Capita Group plc ("Capita") in September
2005. Richard led Capita's financial services client practice in Jersey until September 2007, when he
left the company to establish an independent corporate governance practice. He currently acts as
Chairman of CVC Credit Partners European Opportunities Limited and Funding Circle SME Income Fund
Limited, both of which are listed on the London Stock Exchange, and is an independent director of a
number of other substantial collective investment and investment management entities.
Christopher Wright
Christopher Wright is Chairman and a co-founder of EM Alternatives LLC in Washington DC, emerging
markets focused private equity asset management firm and a director of Merifin Capital Group, a
private European investment firm. Until mid-2003 he served as Head of Global Private Equity for
Dresdner Kleinwort Capital and was formerly a Group Board Member of Dresdner Kleinwort. He acted
as Chairman of various investment funds prior to and following the latter's integration with Allianz
Private Equity.
He is a co-founding director of Roper Technologies Inc (NYSE, S & P 500).
Mr Wright has chaired the investment committees of and/or serves on several advisory boards of third
party managed LBO and venture capital funds in North America and Europe and has advised several
other financial institutions, including Hansa Capital, CdB Webtech, Standard Bank of South Africa,
Surya Capital, GP Investimentos, and IDeA Alternative Investments on their investments in private
equity and other alternative assets around the world.
Mr Wright was educated at Oxford University (M.A.) and holds a Certified Diploma in Accounting and
Finance (from the ACCA). He is Foundation Fellow, Corpus Christi College, Oxford.
David Hunter
David Hunter is Managing Director of Hunter Advisers, a property fund consultancy which offers advice
on the launch and operation of property funds in the UK and overseas. Coupled with this role, he has
a number of non-executive positions in UK and international property companies, focused on
delivering value for shareholders. Until 2005, David was a leading Pan-European property fund
manager with over 20 years’ experience and an exceptional track record of building and running fund
management businesses.
David was President of the British Property Federation in 2003-04 and led the industry delegation
which successfully negotiated with the UK Government for the introduction of REITs.

6
Malcolm King After qualifying at a general practice firm in 1968 Malcolm was one of the first in his profession to gain
an MBA by taking a full time two-year course at the Ivey Business School of the University of Western
Ontario, Canada. Joining King & Co in 1970, he headed the investment part of the business for 23
years. In 1993 Malcolm restructured the asset management side of the business, which grew the
properties under management from GBP 850 mn to the current level of more than GBP 8 billion when
he retired.
He was Senior Partner from 1987 to 2005 and International Chairman from 1992 - 2006. In 1992 he
conceived and engineered the merger of King & Co with J P Sturge to form King Sturge. During his time
as Senior Partner, the company's turnover increased from just over GBP 11 mn to approximately GBP
100 mn and a staff of nearly 1,600. He was the senior Non-Executive of Redrow Plc and was a director
of RICS Business Services. He is non-Executive Chairman of a Jersey based private property company;
non-Executive of two other private property companies and Managing Director of a family property
company. He was a pro bono member of the property advisory committees of both Imperial College
London and Sue Ryder.
George Baird
George was born in Dundee, Scotland in 1950 and qualified with AYMM in 1974 before moving to
Jersey in 1980 to work for the States of Jersey in the finance area. In 1991 he was appointed Treasurer
of the States of Jersey, one of the most senior positions in the Civil Service reporting to the Finance
and Economics Committee whose main responsibility was defining and implementing government
financial and budget strategy. In 1999 he moved to Mourant as Group Finance and Operations Director
until his retirement in 2002. Since then he has built up a portfolio of non- executive directorships in
the Channel Islands to include several property companies where he plays a prominent role on the
Investment and Audit Committees.
Ramesh Bawa
Mr Bawa has rich experience of around three decades in the Banking and Financial Services Sector. He
has built up a strong and effectual relationship and has a large network of business association with
Banks/ Financial Institutions / Insurance Companies both domestically and internationally. Mr Bawa
had worked with organizations like Syndicate Bank and National Housing Bank. In 1995, he joined
IL&FS Group and at IL&FS he went on to hold various senior positions. Then, in October 2006, he
became the Managing Director and the Chief Executive Officer of IL&FS Financial Services Ltd and
recently in May 2015 he has also been entrusted with the responsibility of Managing Director of IL&FS
Investment Managers Limited, a Private Equity arm of IL&FS Group. He is also on the Board of several
IL&FS Group companies which are related to the financial services and infrastructure sector. He holds
a Post-Graduation Degree in Personnel Management & Industrial Relationship and also a Masters
Degree in Political Science. Mr Bawa has been appointed on the Board of the Company effective 1 July
2016 which has been confirmed by the Jersey Financial Services Commission on 25 November 2016.
7
Directors’ Report
The Directors present their interim report and the unaudited financial statements of Yatra Capital
Limited (“the Company”) for the period ended 30 September 2016.
The Company The Company was established in Jersey on 26 May 2006. The Company’s ordinary shares were
admitted to listing on the Euronext Market on 6 December 2006. The Company was established to
invest in Foreign Direct Investment (FDI) compliant Indian real estate development opportunities. The
Company has invested in a broad base of assets covering commercial, retail, residential, special
economic zones and hospitality, targeting returns from development, long term capital appreciation
and income. The Company continues to exit the remaining portfolio to return the money to
shareholders.
Business Review A review of the Company’s activities during the period is set out in the Chairman’s Statement on page
3. The Company redeemed 1,410,437 ordinary shares for EUR 10 mn on 30 September 2016. The
number of ordinary shares in issue as at 30 September 2016 were 3,465,217.
Results and Dividend The Company’s results for the period ended 30 September 2016 are shown in the Statement of Profit
or Loss and Other Comprehensive Income (page 17) and related notes (pages 20 to 43). The Directors
do not propose to declare a dividend for the period under review (30 September 2015 - Nil).
Directors All the directors of the Company are independent and non-executive with the exception of Ramesh
Bawa, who is a director of IL&FS Investment Managers Limited, the holding company of IL&FS
Investment Advisors LLC, the Investment Manager to the K2 Property Limited. The membership of the
Board of Directors (“Board”) is set out below.
Director Date of Appointment
David Hunter 5 June 2006 Malcolm King 5 June 2006 Richard Boléat (Chairman) 27 January 2010 Christopher Wright 27 January 2010 George Baird (Chairman of the Audit and Risk Committee) 8 March 2012 Ramesh Bawa 1 July 2016
All the directors served in office throughout the period except Mr Ramesh Bawa. Shahzaad Dalal, who
was a director of the Company, resigned on 1st July 2016.

8
Directors’ Interests The following directors had interests in the shares of the Company as at 30 September 2016.
Director Number of Ordinary Shares
Christopher Wright 2,338 David Hunter 4,734 Malcolm King 5,325
All the directors are also directors of K2 Property Limited, a subsidiary of the Company.
Directors’ Remuneration During the period, the directors received the following emoluments from the Company:
Directors of the Company Remuneration (in EUR)
David Hunter 20,250 Malcolm King 19,125 Richard Boléat 27,000 Christopher Wright 20,250 George Baird 21,375
There are no service contracts in existence between the Company and its directors. However, each
director was appointed by a Letter of Appointment, which sets out the main terms of the appointment.
All the directors offer themselves for re-election each year at the Annual General Meeting of the
Company.
Management
IL & FS Investment Advisors LLC (“IIAL” or “the Investment Manager”) provides investment
management services to K2 Property Limited and project management, property advisory, property
management and monitoring services to those subsidiaries of K2 Property Limited which acquire
properties, in each case in accordance with the investment objective, investment policy and
restrictions of the Company, K2 Property Limited and its subsidiaries. IIAL is a wholly owned subsidiary
of IL&FS Investment Managers Limited (“IIML”), which is in turn a subsidiary of Infrastructure Leasing
& Financial Services Limited (“IL&FS”) a company incorporated in India. IIML is listed on the National
Stock Exchange of India Limited and BSE Limited. IIAL also provides coordination of public relations,
investor relations and other general operating services to the Company.
Statement of Directors’ Responsibilities
The directors are responsible for preparing the financial statements in accordance with applicable law
and regulations.
Company law requires the directors to prepare financial statements for each financial year. Under
that law they have elected to prepare the financial statements in accordance with International
Financial Reporting Standards and applicable law.
Under company law, the directors must not approve the financial statements unless they are satisfied
that they give a true and fair view of the state of affairs of the company and of the profit or loss of the
company for that period. In preparing these financial statements, the directors are required to:
select suitable accounting policies and then apply them consistently;
make judgements and estimates that are reasonable and prudent;

9
state whether applicable accounting standards have been followed, subject to any material departures disclosed and explained in the financial statements; and
prepare the financial statements on the going concern basis unless it is inappropriate to presume that the company will continue in business.
The directors are responsible for keeping adequate accounting records that are sufficient to show and
explain the company’s transactions and disclose with reasonable accuracy at any time the financial
position of the company and enable them to ensure that the financial statements comply with
Companies (Jersey) Law 1991. They have general responsibility for taking such steps as are reasonably
open to them to safeguard the assets of the company and to prevent and detect fraud and other
irregularities.
The directors are responsible for the maintenance and integrity of the corporate and financial
information included on the company’s website. Legislation in Jersey governing the preparation and
dissemination of financial statements may differ from legislation in other jurisdictions.
Responsibility statement
With regard to Regulation 20041109/EC of the European Union (the "EU Transparency Directive"), the
directors confirm to the best of their knowledge that:
the financial statements for the period ended 30 September 2016 give a true and fair view of the
assets, liabilities, financial position and profit or loss of the Company as required by law and in
accordance with International Financial Reporting Standards; and
the Directors' report and Chairman’s statement give a fair view of the development of the
Company's business, financial position and the important events that have occurred during the
period and their impact on these financial statements.
The principal risks and uncertainties faced by the Company are disclosed below and in note 3 of these
financial statements.
Corporate Governance
A statement of Corporate Governance can be found on pages 12 to 15.
Key Risks There are a number of risks attributed towards the execution of the Company’s strategy. The directors
wish to highlight the following key risks:
• Real estate investments are long-term, illiquid investments and therefore the Company may
not be able to realize the current NAV. The Company seeks to mitigate these risks by
enhancing the marketability of, and exploring additional methods of disposing of, its interests.
• The Indian companies in which the Company invests through its investment in K2 obtain
construction loans from banks and financial institutions. These are secured by way of a
mortgage on the land and the property to be developed. In case of default in repayment, the
lending banks have a first charge on the land and property so provided as well as the other
assets of the land owning company.
10
• Changes to regulations governing foreign investments including repatriation of funds may
adversely affect the Company's performance. The Company, through the Investment
Manager, monitors this risk and, where applicable, procures advice from specialist lawyers
and tax advisors in respect of the structuring of its investments.
• The Company through its investment in K2 invests in Indian companies (“Portfolio
Companies”) and these investments are denominated in Indian Rupees. The Company’s issued
shares are denominated in EUR, and the Company and its investment in K2 are therefore
exposed to currency risk whereby a movement in the Indian Rupee / EUR exchange rate will
affect the value of the investments and result in unrealised and realised gains or losses
thereon.
• The Company, through its investment in K2, is exposed to counterparty risk, principally as a
result of the joint venture and leveraged nature of its investment portfolio. There is
dependence upon the continued activity, performance and solvency of its joint venture real
estate development partners. Additionally, the success of the development activities is
contingent upon the continued willingness of domestic Indian financial institutions to provide
development and construction finance on acceptable terms.
Where the Company, through K2, has contracted to dispose of interests in Portfolio
Companies or their underlying assets, there is a credit risk in respect of the willingness and
ability of the counterparties to honor the relevant agreements. The Board reviews this risk
and applies appropriate discount rates to the contracted values of these agreements.
• Portfolio Companies are heavily dependent on obtaining consent from statutory bodies at key
stages of the development process, the subsequent sign off / acceptance of completed
schemes and subsequent release of funds. All these stages can involve protracted timescales.
• The Company, through its investment in K2, holds minority stakes in the Portfolio Companies
and hence cannot control the governance function or day-to-day operations of these Portfolio
Companies.
• Portfolio Companies are exposed to the risk of frivolous legal intervention by third parties
causing delays in execution of projects due to the relatively slow movement of the judicial
processes in India.
The Board continues to monitor and, where possible, take steps to mitigate these key risks and other
uncertainties to which the Company and its investment in K2 are exposed.
Annual General Meeting The last Annual General Meeting of the Company was convened on 14 September 2016.

11
Independent Auditors KPMG Channel Islands Limited was reappointed as auditor at the Annual General Meeting held on 14
September 2016.
By Order of the Board
Richard Boléat George Baird Chairman Director and Audit & Risk Committee
Chairman
29 November 2016

12
Corporate Governance Report It is the Company’s policy to comply with best corporate governance practices. The Company
recognizes that effective governance is a fiduciary responsibility fundamental to its long-term success.
The Board endeavors to foster a management culture based on effective checks and balances, proper
procedures for managing risks attached to opportunities, and accountability towards stakeholders
with regard to the policies pursued. The Company has been a member of the Association of
Investment Companies, UK since January 2012. The Company has considered the principles and
recommendations of the AIC Code of Corporate Governance (AIC Code) by reference to the AIC
Corporate Governance Guide for Investment Companies (AIC Guide). The AIC Code, as explained by
the AIC Guide, addresses all the principles set out in the UK Corporate Governance Code, as well as
setting out additional principles and recommendations on issues that are of specific relevance to the
Company. The Company complies with all the principles of the AIC Code of Corporate Governance
except for the policy on tenure of directors and preparation of a viability statement. The Board
concludes that the requirement of the AIC Code on tenure of directors is not relevant for the Company
due to the fact that the Company is in the process of a disposal program which the Board presently
anticipates that it would result in its winding up in the foreseeable future. Consequently, the Company
does not believe that it would be appropriate or meaningful to produce a viability statement.
Role of the Board
The Board has determined that its role is to consider and determine the following key matters, which
it considers are of strategic and operational importance to the Company:
• the overall objectives for the Company and the Company’s strategy for fulfilling those
objectives within an appropriate risk framework;
• any shifts in strategy that may be appropriate in light of market conditions;
• the capital structure of the Company and its subsidiaries including consideration of any
appropriate use of gearing both for the Company and its subsidiaries and in any joint ventures
or similar arrangements in which they may invest from time to time;
• the engagement of the Investment Manager, Administrators and other appropriately skilled
service providers and the monitoring of their effectiveness through regular reports and
meetings;
• the key elements of the Company’s performance including Net Asset Value and distributions;
• compliance with company law and regulatory obligations, including the approval of the
financial statements and the recommendation as to dividends (if any).
The directors bring independent views to the board and a diversity of experience including chartered
surveying, civil service, banking, law, administration, treasury, financial accounting, corporate finance
and fund management to add to the Board’s effectiveness, particularly in the area of property,
performance of emerging markets, corporate strategy, governance and risk management. The
directors take decisions objectively and in the best interests of the Company being collectively and
individually responsible for its success. They are accountable to shareholders and take into
consideration the need to foster the Company’s business relationships with other stakeholders in
discharging their obligations.
13
The Board has conducted a self-assessment exercise for the year ended 31 March 2016 and will
continue to do so annually. The Board members have reaffirmed their independence wherever
appropriate other than as disclosed elsewhere in these financial statements.
The directors believe that this interim report and financial statements, taken as a whole, present a
fair, balanced and understandable assessment of the Company’s position and prospects.
Board Decisions The Board ensures during its meetings that strategic matters are considered as well as matters of
particular concern to shareholders. The operational obligations of the Board have been delegated
through appropriate arrangements to the Investment Manager and the Administrator, as all members
of the Board are non-executive. The independent directors of the board meet separately at least once
a year to review the performance of the Board as a whole.
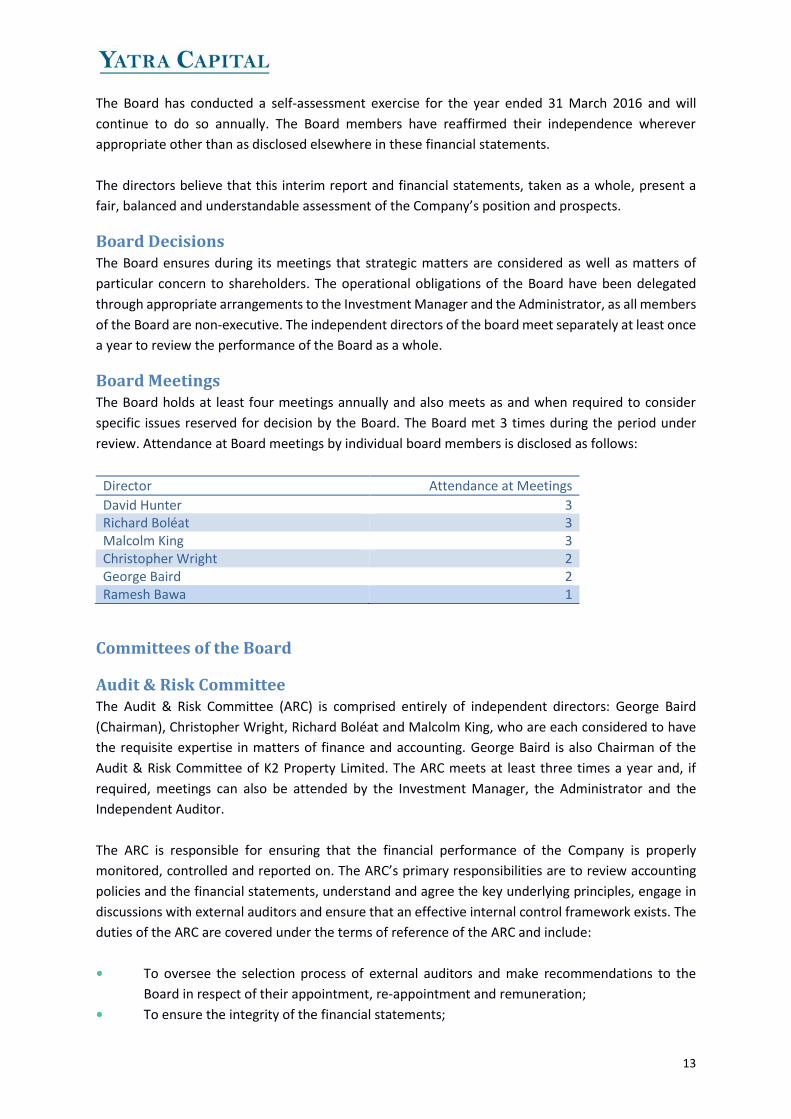
Board Meetings The Board holds at least four meetings annually and also meets as and when required to consider
specific issues reserved for decision by the Board. The Board met 3 times during the period under
review. Attendance at Board meetings by individual board members is disclosed as follows:
Director Attendance at Meetings
David Hunter 3 Richard Boléat 3 Malcolm King 3 Christopher Wright 2 George Baird 2 Ramesh Bawa 1
Committees of the Board
Audit & Risk Committee The Audit & Risk Committee (ARC) is comprised entirely of independent directors: George Baird
(Chairman), Christopher Wright, Richard Boléat and Malcolm King, who are each considered to have
the requisite expertise in matters of finance and accounting. George Baird is also Chairman of the
Audit & Risk Committee of K2 Property Limited. The ARC meets at least three times a year and, if
required, meetings can also be attended by the Investment Manager, the Administrator and the
Independent Auditor.
The ARC is responsible for ensuring that the financial performance of the Company is properly
monitored, controlled and reported on. The ARC’s primary responsibilities are to review accounting
policies and the financial statements, understand and agree the key underlying principles, engage in
discussions with external auditors and ensure that an effective internal control framework exists. The
duties of the ARC are covered under the terms of reference of the ARC and include:
• To oversee the selection process of external auditors and make recommendations to the
Board in respect of their appointment, re-appointment and remuneration;
• To ensure the integrity of the financial statements;

14
Audit & Risk Committee (Continued)
• To monitor and review the independence of the auditors, their objectivity and effectiveness,
taking into consideration relevant professional and regulatory requirements;
• To keep under review the effectiveness of internal financial controls;
• To ensure that a member of the ARC attends the Annual General Meeting of the Members;
• To oversee the effectiveness of the processes and controls used by the Company to monitor
and manage risk within the parameters adopted by the Board; and
• To review the Company's major risk exposures and the steps taken to monitor and control
such exposures.
The directors believe that due to the structure and size of the Company, no internal audit function is
appropriate or required.
During the period under review, the ARC met 3 times. The table below shows the attendance of the
ARC members at the meetings for the period under review:
Director Attendance at Meetings
Richard Boléat 2 Malcolm King 2 Christopher Wright 3
George Baird 3
Remuneration and Nominations Committee The Remuneration and Nominations Committee (RNC) comprises Richard Boléat, Ramesh Bawa and
David Hunter (Chairman) of which the majority is independent of the Investment Manager. Shahzaad
Dalal ceased to be a member of the RNC from his date of resignation. RNC is responsible for the terms
of appointment and remuneration of the Company’s directors and the incentive policies of the
Company, K2 Property Limited and its subsidiaries as a whole. The RNC met once during the period
under review. The table below shows the attendance of the RNC members at the meetings for the
period under review:
Director Attendance at Meetings
Richard Boléat 1 David Hunter 1 Ramesh Bawa Nil
Shareholder Relations Shareholder communications are a priority of the Board and the Company maintains a regular
dialogue with its shareholders. The Company promptly posts all relevant information and news to the
Authority for Financial Markets, Euronext and on its website. The Chairman and representatives of the
Investment Manager make themselves available to meet with key shareholders, analysts, current and
future investors and the media. The Board is also fully informed on any market commentary on the
Company made by the Investment Manager and other professional advisors, including its brokers. The

15
Board monitors its investor relations process consistently to ensure the effectiveness of the
Company’s communications. The notice of the Annual General Meeting is posted to the shareholders
at least 42 clear days in advance of the meeting. Shareholders or their proxies are encouraged to
attend and participate in the Annual General Meeting. The Chairman and representatives of the
Investment Manager are available at the Annual General Meeting to address any questions that the
shareholders wish to raise.
Financial statements In compliance with the Dutch Financial Supervision Act (FSA) relating to the Company’s Euronext
Amsterdam Listing, the audited annual and the unaudited semi-annual financial statements of the
Company are also uploaded on its website www.yatracapital.com

16
Statement of Financial Position
As at 30 September 2016
As at As at
Notes 30-Sep-16 31-Mar-16
EUR EUR
ASSETS
Non - Current assets
Financial assets at fair value through profit or loss
6 -
17,844,854
- 17,844,854
Current assets
Financial assets at fair value through profit or loss
6 26,059,843 16,341,184
Prepayments and other receivables
7 27,581 50,119
Cash and cash equivalents 8 113,582 463,470
26,201,006 16,854,773
Total assets 26,201,006 34,699,627
EQUITY AND LIABILITIES
Capital and reserves
Stated capital 9 125,457,092 135,457,092
Accumulated losses (99,372,336) (100,888,932)
Total equity 26,084,756 34,568,160
Current liabilities
Accruals and other payables 10 116,250 131,467
116,250 131,467
Total equity and liabilities 26,201,006 34,699,627
Number of ordinary shares in issue 3,465,217 4,875,654
Net asset value per share 16 7.53 7.09
The financial statements were approved by the Board of Directors and authorised for issue on 29 November 2016. They were signed on its behalf by Richard Boléat and George Baird.
Richard Boléat
George Baird
Chairman Director and Audit & Risk Committee Chairman
The notes on pages 20 to 43 form an integral part of these financial statements.

17
Statement of Profit or Loss and Other Comprehensive Income
For the period ended 30 September 2016
Notes
Period ended 30 Sept
2016
Period ended 30 Sept
2015
EUR EUR
INCOME Net loss on foreign exchange (775) (1,462) Realised (loss)/ gain on financial assets at fair value through profit or loss 6
(34)
53
Gain on disposal of subsidiaries - 26,960 Unrealised gain/(loss) on financial assets at fair value through profit or loss
3.6, 6 1,873,839
-
1,873,030 25,551
EXPENSES Custodian, secretarial and administration fees 21,909 22,613 Legal and professional costs 129,254 121,182 Directors’ fees 12 108,000 120,000 Directors’ insurance 17,903 16,761 Audit expenses 30,870 47,612 Listing agents fees Travelling expenses
11,498 27,707
12,840 29,098
Unrealized loss on financial assets at fair value through profit or loss
3.6, 6 - 7,711,107
Other administrative expenses 9,293 10,848
356,434 8,092,061
Total Comprehensive Profit/(Loss) for the period before tax
1,516,596 (8,066,510)
Taxation 5 - -
Total Comprehensive Profit/(Loss) attributable to: Equity holders of the Company 1,516,596 (8,066,510)
1,516,596 (8,066,510)
Basic and diluted profit/(loss) per share
15
0.31 (1.03)
The notes on pages 20 to 43 form an integral part of these financial statements.
18
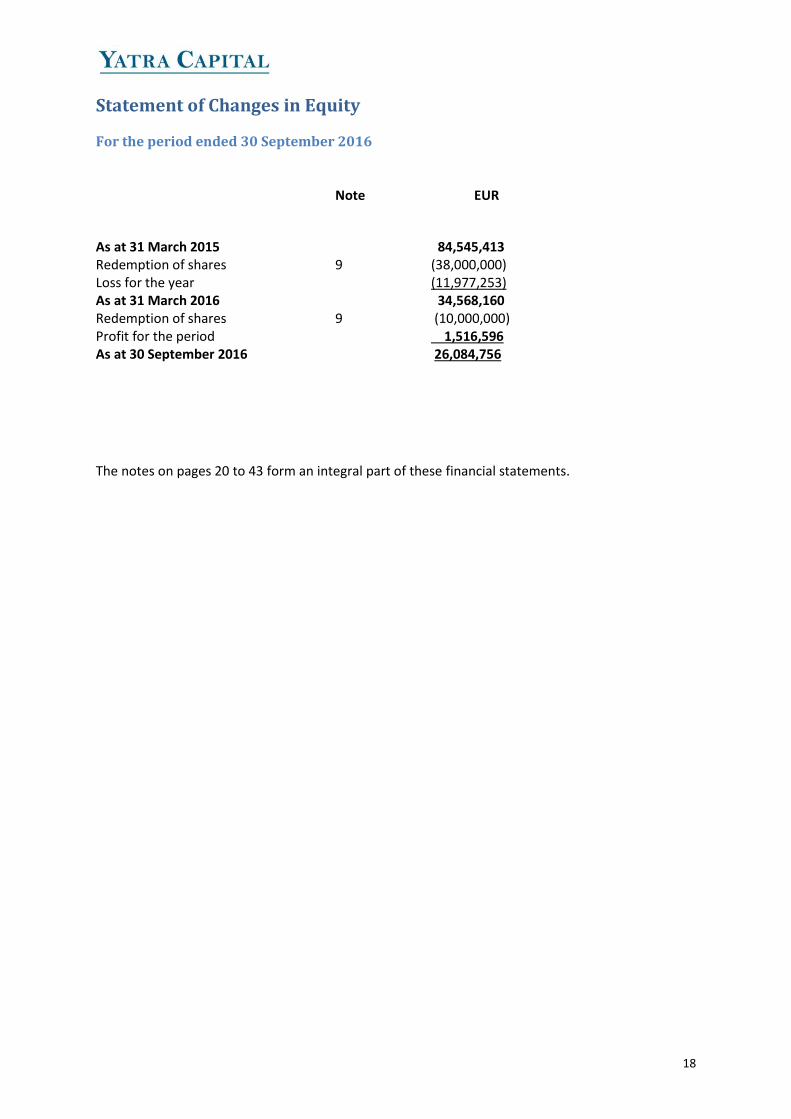
Statement of Changes in Equity
For the period ended 30 September 2016
Note EUR
As at 31 March 2015 84,545,413 Redemption of shares 9 (38,000,000) Loss for the year (11,977,253) As at 31 March 2016 34,568,160 Redemption of shares 9 (10,000,000) Profit for the period 1,516,596 As at 30 September 2016 26,084,756
The notes on pages 20 to 43 form an integral part of these financial statements.

19
Statement of Cash Flows
For the period ended 30 September 2016
Period ended
30 Sept 2016
Period ended 30 Sept
2015 Notes EUR EUR
Cash flows from operating activities Total comprehensive profit/(loss) for the period before taxation
1,516,596 (8,066,510)
Adjustments for: Realised loss / (gain) on financial assets at fair value through profit or loss and gain on disposal of subsidiaries 6
34
(27,015)
Unrealised loss / (gain) on fair valuation of financial assets at fair value through profit or loss
6 (1,873,839)
7,711,108
Cash used in operations (357,209) (382,417)
Decrease in prepayments and other receivables 22,539 25,552 Decrease in accruals and other payables (15,217) (3,809)
Net cash used in operating activities (349,888) (360,674)
Cash flows from investing activities Proceeds from redemption of shares in K2 6 10,000,000 38,000,000 Proceeds from disposal of investment 6 - 26,962
Net cash generated from investing activities 10,000,000 38,026,962
Cash flows from financing activities Payment on redemption of ordinary shares 9 (10,000,000) (38,000,000)
Net cash used in financing activities (10,000,000) (38,000,000)
Net decrease in cash and cash equivalents (349,888) (333,712) Cash and cash equivalents at beginning of the period 463,470 1,063,084
Cash and cash equivalents at end of the period 8 113,582 729,372
The notes on pages 20 to 43 form an integral part of these financial statements.

20
Notes to the Financial Statements
1. General information
Yatra Capital Limited (the "Company") is a limited liability company incorporated and domiciled in
Jersey with registered office address at First Floor Le Masurier House, La Rue Le Masurier, St Helier,
Jersey, JE2 4YE. The Company is governed by the Collective Investment Funds (Jersey) Law 1988, as
amended, and the subordinate legislation made there under and regulated by the Jersey Financial
Services Commission. The purpose of the Company is to enable pooling of funds by investors for
investment in K2 Property Limited ("K2") and its subsidiaries.
K2 was incorporated on 19 May 2006 and is domiciled as a limited liability company under the laws of
the Republic of Mauritius. K2 holds a category 1 Global Business Licence issued by the Financial
Services Commission in Mauritius. K2 and its subsidiaries make investments in companies established
to carry out real estate development and ownership across India (“Portfolio Companies”).
IL&FS Investment Advisors LLC, an investment management company incorporated and domiciled in
the Republic of Mauritius (“the Investment Manager”) advises the Company and K2 with respect to its
investment activities. The administration of the Company is undertaken by Citco Jersey Limited with
effect from 8 September 2014.
The Company's ordinary shares are listed and traded on the Euronext Market, under ISIN
JE00B1FBT077.
2. Summary of significant accounting policies
The principal accounting policies adopted in the preparation of these financial statements have been
consistently applied to all the periods presented unless otherwise stated and are set out below.
2.1 Basis of preparation
The financial statements have been prepared in accordance with International Financial Reporting
Standards (“IFRS”) and the Interpretations adopted by the International Accounting Standards Board
(“IASB”). The financial statements have been prepared under the historical cost basis, as modified by
the fair valuation of investments.
The preparation of financial statements in accordance with IFRS requires the use of certain critical
accounting estimates. It also requires the Board of Directors to exercise its judgment in the process of
applying the Company’s accounting policies. The areas involving a higher degree of judgment or
complexity, or areas where assumptions and estimates are significant to these financial statements
are disclosed in Note 4.
As at 30 September 2016, the Company did not hold a controlling interest in any of the Portfolio
Companies in which it has invested through its investment in K2. The estimates and assumptions
applied in determining the fair value of these investments are set out in note 3.6.

21
Notes to the Financial Statements (Continued)
Summary of significant accounting policies (Continued)
The Company early adopted the Amendments to IFRS 10, IFRS 12 and IAS 27 (the “Amendments”) with
a date of initial application of 1 April 2013. The Board of Directors concluded that the Company met
the definition of an Investment Entity. As a result, the Company measures its investments in its
subsidiary at fair value through profit or loss.
A qualifying investment entity is required to account for investments in controlled entities as well as investments in associates and joint ventures at fair value through profit or loss; the only exception would be subsidiaries that are considered an extension of the investment entity’s investing activities. The consolidation exemption is mandatory for qualifying investment entities. An investment entity typically has the following characteristics:
It should have more than one investment. The Company has invested in K2. K2, through its direct and indirect subsidiaries, has invested in multiple Portfolio Companies;
It should have more than one investor. The Company has multiple investors;
It should have Investors that are not related parties. With the exception of the Company’s directors, none of the Company’s investors are, to its knowledge, related parties; and
It should have ownership interests in the form of equity or similar interests. The Company’s ownership interests are in the form of equity.
Standards and amendments to existing standards effective 1 April 2016. There are no standards, interpretations and amendments to existing standards that are effective for the first time for the financial year beginning 1 April 2016 that have a material impact on the Company. There are no new standards and amendments to standards and interpretations adopted during the period. Going concern
As agreed with the shareholders of the Company in June 2013, the Class A and Class B shares held by
the Company in K2 were redeemable at the option of K2 on 30 September 2016. K2 did not elect to
exercise this option. The Board in its meeting of 1 July 2016 agreed to seek a formal shareholders
approval on the extension of the terms of the Investment Management Agreement with IIAL beyond
30 September 2016 after conducting a detailed assessment of the balance of the portfolio and the exit
strategy for the same. The annual general meeting of the Company was held on 14 September 2016
wherein the resolution for extension of the Investment Management Agreement until a long stop date
of 31 December 2018 was unanimously passed. Based on the foregoing the Company continues to be
a going concern.
2.2 New standards and interpretations not yet adopted
New standards and interpretations not yet adopted
A number of new standards and amendments to standards are effective for annual periods beginning
after 1 April 2016 and earlier application is permitted; however, the Company has not early applied

22
Notes to the Financial Statements (Continued)
Summary of significant accounting policies (Continued)
the following new or amended standards in preparing these financial statements. The two new
amendments potentially relevant to the Company are discussed below.
A. IFRS 9 Financial Instruments
On 24 July 2014, the IASB issued the final IFRS 9 Financial Instruments Standard, which replaces
earlier versions of IFRS 9 and completes the IASB’s project to replace IAS 39 Financial
Instruments: Recognition and Measurement.
This standard includes changes in the measurement bases of the Company’s financial assets to
amortised cost, fair value through other comprehensive income or fair value through profit or
loss. Based on the assessment of the Board, these amendments will not have any material
impact on the financial statements as the Company measures its investment in K2 at fair value
through profit or loss and other financial instruments at cost after evaluation of impairments if
any.
The standard is effective for annual periods beginning on or after 1 January 2018 with
retrospective application, early adoption is permitted. The Company is assessing potential
impact on its financial statements resulting from application of IFRS 9.
B. IFRS 15 Revenue from Contracts with Customers
This standard replaces IAS 11 Construction Contracts, IAS 18 Revenue, IFRIC 13 Customer Loyalty
Programmes, IFRIC 15 Agreements for the Construction of Real Estate, IFRIC 18 Transfer of Assets
from Customers and SIC-31 Revenue – Barter of Transactions Involving Advertising Services.
The standard contains a single model that applies to contracts with customers and two
approaches to recognising revenue: at a point in time or over time. The model features a
contract-based five-step analysis of transactions to determine whether, how much and when
revenue is recognised.
This new standard will not have any impact on the Company.
The standard is effective for annual periods beginning on or after 1 January 2018, with early
adoption permitted.

23
Notes to the Financial Statements (Continued)
Summary of significant accounting policies (Continued)
The following new or amended standards are not applicable to the Company and are not expected to
have a significant impact on the Company’s financial statements:
Standard/Interpretation Effective date
Periods beginning
on or after
Amendments to IAS 12 Recognition of Deferred Tax Assets for
Unrealised Losses – Amendments to IAS 12
1 January 2017
Amendments to IAS 7 Disclosure Initiatives – Changes in liabilities
arising from financial activities
1 January 2017
2.3 Foreign currency translation
(a) Functional and presentation currency
For the purposes of the financial statements, the results and financial position of the Company is
expressed in Euro, which is the functional currency of the Company. Euro is the functional currency
because it is the currency of the primary economic environment in which the Company operates. Euro
is the currency in which the majority of the costs of the Company are incurred, capital is realised and
dividends are paid.
(b) Transactions and balances
Foreign currency transactions are translated into the functional currency using the exchange rates
prevailing at the date of transactions or valuation where items are re-measured. Foreign exchange
gains and losses resulting from the settlement of such transactions and from the translation at period-
end exchange rates of monetary assets and liabilities denominated in foreign currencies are
recognised in the Statement of Profit or Loss and Other Comprehensive Income. The EUR exchange
rate used at the date of Statement of Financial Position for the translation of monetary assets and
liabilities denominated in INR was 74.75 (31 March 2016 - 75.09), representing a 0.45% appreciation
in the INR against the EUR over the period. Translation differences on non-monetary financial assets
and liabilities re-measured at each reporting date, such as equity instruments classified as financial
assets at fair value through profit or loss, are recognised in the Statement of Profit or Loss and Other
Comprehensive Income within the net gain or loss on financial assets at fair value through profit or
loss.
2.4 Financial assets at fair value through profit or loss
(a) Classification
The financial assets of the Company are classified as “financial assets at fair value through profit or
loss” and “loans and receivables”.
K2 is wholly owned by the Company. K2 through its investments in underlying companies invests in
joint ventures and associates.

24
Notes to the Financial Statements (Continued)
Summary of significant accounting policies (Continued)
The Company adopted the Investment Entities exemption (Amendments to IFRS 10, IFRS 12 and IAS
27), issued in October 2012, such that all subsidiaries that represent investments shall not be
consolidated. The amendments define an investment entity and require a parent that is an investment
entity to measure its investments in particular subsidiaries at fair value through profit or loss in
accordance with IAS 39 instead of consolidating those subsidiaries in its consolidated financial
statements. Accordingly, the principles of consolidation under IFRS 10 are not applicable to the
Company for the period ended 30 September 2016.
Financial assets designated at fair value through profit or loss at inception are financial instruments
that are not classified as held for trading but are managed and their performance evaluated on a fair
value basis in accordance with the Company’s documented investment strategy. The Company’s policy
is for the Investment Manager and the Board to evaluate the information about these financial assets
on a fair value basis together with other related financial information.
The Board, as advised by the Investment Manager, has taken an appropriate classification of
investments at the time of purchase and re-evaluates the classification on a regular basis.
Loans and receivables of the Company include cash and cash equivalents and other receivables.
(b) Recognition/de-recognition
Purchases and sales of investments are recognised on the “trade date” – the date on which the
Company contracts to purchase or sell the investment. Financial assets are derecognised when the
rights to receive cash flows from the investments have expired or the Company has transferred
substantially all risks and rewards of ownership. Net gain from financial assets at fair value through
profit and loss includes all realised and unrealised fair value changes and foreign exchange differences,
but excludes dividend income. Realised gains/losses are calculated as the difference between the
disposal value of its investment in K2 and the cost of the investment.
(c) Measurement
Financial assets at fair value through profit or loss are initially recognised at fair value. Transaction
costs are expensed in the Statement of Profit or Loss and Other Comprehensive Income. Subsequent
to initial recognition, all financial assets at fair value through profit or loss are measured at fair value.
Gains and losses arising from changes in the fair value of the financial assets at fair value through
profit or loss are recognized in profit or loss of the Statement of Profit or Loss and Other
Comprehensive Income in the period in which they arise.
(d) Fair value estimation
‘Fair Value’ is a price that would be received to sell an asset or paid to transfer a liability in an orderly
transaction between market participants at the measurement date in the principal or, in its absence,
the most advantageous market to which the Company has access at that date. The fair value of a
liability reflects its non-performance risk.

25
Notes to the Financial Statements (Continued)
Summary of significant accounting policies (Continued)
The fair value of financial instruments traded on an active market is based on the closing quoted
market prices at the reporting date. The fair value of financial instruments that are not traded in an
active market are determined by using valuation techniques.
The Company has adopted the investment entity exemption under IFRS 10 and records the adjusted
net asset value of its direct subsidiary as the fair value of its investment in its direct subsidiary.
In determining the fair value of financial instruments in K2, and in turn the Portfolio Companies, a
variety of methods and assumptions are used that are based on project status and market conditions
existing at each reporting date. Valuation techniques used include the use of comparable recent arm’s
length transactions, reference to other instruments that are substantially the same, discounted cash
flow analysis and other valuation techniques commonly used by market participants as prescribed by
the Royal Institution of Chartered Surveyors (“RICS”). The methodologies, processes and significant
unobservable inputs used in the valuation derived by the Investment Manager are detailed in notes
3.6 and 4.1 below. For valuing the Portfolio Companies where K2 has contracted exits, the net present
value of the contracted exit amounts, discounted using a rate based on the credit risk associated with
counterparties and tested for impairment, is considered as the fair value of the investment in that
Portfolio Company.
2.5 Loans and receivables
Loans and receivables of the Company include cash and cash equivalents and other receivables.
A provision for impairment of amounts due from counterparties is established when there is objective
evidence that the Company will not be able to collect all amounts due from the relevant counterparty.
2.6 Cash and cash equivalents
Cash comprises cash at bank. Cash equivalents are short-term, highly liquid investments, that are
readily convertible to known amounts of cash and which are subject to an insignificant risk of change
in value.
2.7 Accruals and other payables
Accruals and other payables are recognised initially at fair value and subsequently stated at amortised
cost using the effective interest method.
2.8 Stated capital
Ordinary shares are classified as equity. Ordinary shares which were bought back and recorded as
treasury shares have been cancelled. Ordinary shares bought back by the Company via its tender
mechanism and compulsory redemption have also been cancelled.
2.9 Realised / Unrealised gain / (loss) on financial assets at fair value through profit or
loss
The realised gain / (loss) from financial assets at fair value through profit or loss (FVTPL) represents
the difference between the carrying amount of a financial asset at the beginning of the reporting
period, or the transaction price if it was purchased in the current reporting period, and its sale or

26
Notes to the Financial Statements (Continued)
Summary of significant accounting policies (Continued)
settlement price. Net realised gain / (loss) from financial assets at FVTPL is calculated using the average
cost method.
The unrealised gain / (loss) represents the difference between the carrying amount of a financial
instrument at the beginning of the period, or the transaction price if it was purchased in the current
reporting period, and its carrying amount at the end of the period.
2.10 Transaction cost
Transaction costs are costs incurred to acquire financial assets at fair value through profit or loss. They
include fees and commissions paid to agents, advisers, brokers and dealers. Transaction costs, when
incurred, are immediately recognised in the Statement of Profit or Loss and Other Comprehensive
Income as an expense.
2.11 Expenses
All expenses are recognized in the Statement of Profit or Loss and Other Comprehensive Income on
an accrual basis.
2.12 Current and deferred income tax
The current income tax charge is calculated on the basis of currently enacted or substantively enacted
tax laws at the reporting date in the countries in which the Company’s activity generates taxable
income. The Board periodically evaluates positions taken in tax returns with respect to situations
in which applicable tax regulations are subject to interpretation and establishes provisions where
appropriate on the basis of amounts expected to be paid to the tax authorities.
2.13 Financial instruments
Financial instruments carried in the Statement of Financial Position include financial assets at fair value
through profit or loss and other receivables, cash at bank, accruals and other payables. The particular
recognition methods adopted are disclosed in the individual policy statements associated with each
item. Disclosures regarding financial instruments to which the Company is a party are provided in Note
3.
2.14 Treasury shares
When shares recognized as equity are repurchased, the amount of the consideration paid, which
includes directly attributable costs, net of any tax effects, is recognized as a deduction from equity.
Repurchased shares are classified as treasury shares and are presented as a deduction from equity.
Treasury shares are not held for sale or subsequent reissue and are cancelled.
2.15 Related parties
Related parties are both natural and legal persons where the person has the ability, directly or
indirectly, to control the other party or exercise significant influence over the other party in making
financial and operating decisions.

27
Notes to the Financial Statements (Continued)
Summary of significant accounting policies (Continued)
2.16 Segment reporting
A business segment is a group of assets and operations engaged in providing products or services that
are subject to risks and returns that are different to those of other business segments. A geographical
segment is a group of assets and operations engaged in providing products or services within a
particular economic environment that are subject to risks and return that are different from those of
segments operating in other economic environments. The Company, through K2 and its subsidiaries,
is engaged in real estate development companies in India, being a single reportable geographical
segment having an economic environment that is subject to risks and returns which are different from
geographical segments operating in other economic environments.
2.17 Offsetting
Financial assets and financial liabilities are offset and the net amount presented in the statement of
financial position when, and only when, the Company has a legal right to offset the amounts and
intends either to settle them on a net basis or to realise the asset and settle the liability
simultaneously.
3 Financial risk management
3.1 Strategy in using financial instruments
The Board has overall responsibility for the determination of the Company’s risk management
objectives and policies. The Company’s overall risk management policy focuses on management of
risk at the Portfolio Company level and above and particularly seeks to minimize potential adverse
effects on the Company’s financial performance, flexibility and liquidity.
The Company’s activities expose it to a variety of financial risks, the principal risks being credit risk,
liquidity risk, and market risk (including foreign currency risk). The Company’s financial instruments
comprise of financial assets at fair value through profit or loss, cash and cash equivalents and other
items such as prepayments and other receivables, accruals and other payables which arise from its
operations.
This note presents information about the Company’s exposure to each of the above risks, the Board’s
objectives, policies and processes for measuring and managing risk and management of capital.
Further quantitative disclosures are included throughout these financial statements. The Company
held no derivative instruments as at 30 September 2016 (31 March 2016- Nil). A summary of the main
risks is set out below:
3.2 Market risk
The Company is exposed to market risk, which is the risk that the fair value of future cash flows of a
financial instrument will fluctuate because of changes in market values. Market risks also arise from
open positions in interest rate, currency and equity products, all of which are exposed to general and
specific market movements and changes in the level of volatility of market rates or prices such as
interest rates, foreign exchange rates and equity prices.

28
Notes to the Financial Statements (Continued)
Financial risk management (Continued)
(a) Cash flow and interest rate risk
Interest rate risk arises from the effect of fluctuations in the prevailing levels of market interest rates
on the fair value of financial instruments and future cash flow. The Company’s cash flow is monitored
at regular intervals by the Board. As at 30 September 2016, the Company did not have significant
interest bearing financial instruments; therefore the Company is not exposed to significant cash flow
interest rate risk.
(b) Foreign currency risk
Foreign currency risk arises when future transactions or recognised monetary assets and monetary
liabilities are denominated in a currency other than the Company’s functional currency. The
Company’s significant monetary assets and liabilities are held in EUR, hence the Company is not
directly exposed to foreign currency risk.
The Company, through K2 and its investments in underlying companies, invests in India and holds both
monetary and non-monetary assets and liabilities denominated in currencies other than the EUR, the
functional currency. It is therefore, indirectly exposed to foreign currency risk. IFRS 7 considers the
foreign exchange exposure relating to financial assets and liabilities, such as the Company’s
investments, to be a component of market price risk and not foreign currency risk. However, the
Company monitors the exposure on all foreign currency denominated financial assets and liabilities.
The Company has in place a policy that requires it to keep under review its foreign currency risk against
the functional currency. Forward contracts may be used on a transaction by transaction basis with a
view to hedging foreign currency exposure. The Company will continue to monitor foreign currency
risk and the need for hedging transactions. During the period under review, no foreign currency
hedging transactions took place, and the Company continues to have fully unhedged indirect INR
exposures comprising substantially all of the Company’s financial assets at fair value through profit or
loss. The table below summarises the Company’s financial assets and liabilities, monetary and non-
monetary, which are denominated in a currency other than the EUR:
30 September 2016 31 March 2016
Company INR GBP INR GBP
Liabilities
Monetary liabilities 3,308 5,689 5,659 28,704
The table below summarises the sensitivity of the Company’s monetary and non-monetary assets and
liabilities to changes in foreign currency movements at 30 September 2016. The analysis is based on
the assumptions that the relevant foreign exchange rate appreciated/depreciated against the EUR by
the percentage disclosed in the table below, with all other variables held constant. This represents the
directors’ best estimates of a reasonable possible shift in the foreign exchange rates, having regard to
the historical volatility of those rates. There are no monetary and non-monetary assets determined
other than in EUR.

29
Notes to the Financial Statements (Continued)
Financial risk management (Continued)
Reasonably possible shift in rate
30 September 2016
Reasonably possible shift in rate
31 March 2016
Company % EUR % EUR
Currency
GBP
- Monetary liabilities
+15%/(15 %) 6,543/4,836 +15 %/(15 %) 33,009/24,398
INR
- Monetary liabilities
+ 15 %/(15 %) 3,804/2,812 +15 %/(15 %) 6,508/4,810
(c) Price risk
The Company is exposed to price risk as the investments of the Company as stated in the Statement
of Financial Position are classified as financial assets at fair value through profit or loss. Where non-
monetary financial instruments, such as the Company’s investments in the Portfolio Companies held
through K2 and its underlying companies, are denominated in currencies other than the Euro, the
price initially expressed in foreign currency and then converted into Euro will also fluctuate because
of changes in foreign exchange rates. Paragraph (b) ‘Foreign currency risk’ above sets out how this
component of price risk is managed and measured.
3.3 Credit risk
Credit risk arises when a failure by counterparty to discharge their obligations could reduce the
amount of future cash inflows from financial assets on hand at the reporting date. The Company’s
policy is to maintain cash balances and short term deposits with a reputable banking institution and
to monitor the placement of cash and deposit balances on an ongoing basis. As at 30 September 2016,
all cash balances were placed with Barclays Bank Plc which had a long term credit rating of “A-
(Negative)” from Standard and Poor’s.
The Company’s credit risk also arises in respect of other receivables as disclosed in note 7 below. The
Board has considered the recoverability of these balances as at 30 September 2016 and does not
consider the risk of failing to recover these amounts to be significant. Additionally, before the
Company enters into transactions with another party, it makes an assessment of the credit worthiness
of that party.
The Company’s credit risk also arises in respect of receivables pertaining to contracted exit cash flows.
The Board reviews this risk of contracted receivables on a regular basis and has put in place a regular
impairment mechanism for assessing this risk as mentioned in note 3.6 of the financial statements.

30
Notes to the Financial Statements (Continued)
Financial risk management (Continued)
3.4 Counterparty risk
Counterparty risk is defined as the current and prospective risk to earnings or capital arising from a
counterparty’s failure to meet the terms of any obligation to the Company or otherwise to perform as
agreed. Counterparty risk arises when funds are extended, committed, invested, or otherwise
exposed through actual or implied contractual agreements. Indirect counterparty risk to the Company
arises primarily from three types of commercial arrangements:
1. The continuing willingness by banks and other financial institutions to provide finance on
agreed terms to Portfolio Companies, to enable those companies to execute their planned
real estate development within budgeted tolerances.
2. The ability and willingness of the joint venture partners at Portfolio Company level to carry
out the relevant real estate development project in accordance with agreed budgets,
timescales and quality standards.
3. The ability and willingness of the joint venture partners of the Portfolio Companies to honour
the contracted exit values at the specified timelines.
A failure by a constituent member of either of these commercial counterparty groups to perform as
agreed could lead to a material negative performance of an individual Portfolio Company investment
which could have a material impact on the Company’s Statement of Financial Position. The Investment
Manager seeks to ensure that counterparty risk is mitigated by way of continuous monitoring of
Portfolio Companies, the joint venture partners, banks and financial institutions with whom they
contract. Identified risks are escalated and actions taken as necessary.
3.5 Liquidity risk
Liquidity risk is the risk that the Company may not be able to generate sufficient cash resources to
settle its obligations in full as they fall due or can do so only on terms that are materially
disadvantageous. As a policy, the Company minimises these risks by maintaining sufficient cash to
meet all anticipated future payment obligations. As at 30 September 2016, the total financial liabilities
of the Company amounted to EUR 116,250 (31 March 2016: EUR 131,467), which are all due within
one year.
At 30 September 2016, the Company had sufficient liquid financial assets to meet its current financial
obligations. The table below analyses the Company’s non-derivative financial liabilities into relevant
maturity groupings at the financial position date.
Details
Due - less than 12 months Due - more than 12 months
30 September 2016 EUR
31 March 2016 EUR
30 September 2016 EUR
31 March 2016 EUR
Accruals and other payables 116,250 131,467 - -
Total payable 116,250 131,467 - -

31
Notes to the Financial Statements (Continued)
Financial risk management (Continued)
On the basis of the above, the Board considers that the company has no significant liquidity risk.
3.6 Fair values
The carrying amount of other receivables, cash and cash equivalents and accruals and other payables
approximate their fair values. The financial assets at fair value through profit or loss represent the fair
value of the Company’s investment in K2.
The fair values of financial assets at fair value through profit or loss that are not traded in an active
market are determined by using valuation techniques. The techniques used by the Company are
explained in Note 4.1 below.
For the purpose of these financial statements the Company determines the fair value of its investment
in K2 based on the net asset value (NAV) of K2 in its latest available unaudited financial statements.
The directors review these details and consider, among other things, the following factors: (a) the net
asset valuation; (b) the value date of the net asset value provided; and (c) the basis of accounting.
When deemed necessary, adjustments to the NAV for relevant factors, such as liquidity and/or credit
risks, are made to obtain the best estimate of fair value. As at the reporting date, the Board and the
Investment Manager believe that the NAV of K2 as per its 30 September 2016 unaudited financial
statements is representative of the fair value of its investment in K2.
The table below sets out information about significant unobservable inputs used as at 30 September
2016 in measuring financial instruments categorised as Level 3 in the fair value hierarchy.
Description Amount (EUR) Valuation technique
Unobservable inputs Range
As at 30 September 2016 Unquoted investment 26,059,843 NAV NAV of K2
NA
As at 31 March 2016 Unquoted investment 34,186,038
NAV NAV of K2
NA
The net asset value of the Company is sensitive to the fair value of K2.
IFRS 13 requires the Company to classify fair value measurements using a fair value hierarchy that reflects the significance of inputs used in making the measurements. The fair value hierarchy has the following levels:
Level 1 inputs are quoted prices (unadjusted) in active markets for identical assets and
liabilities that the entity can access at the measurement date.

32
Notes to the Financial Statements (Continued) Financial risk management (Continued)
Level 2 inputs are inputs other than quoted prices included in level 1 that are observable for
the asset or liability, either directly (that is, as prices) or indirectly (that is, derived from prices).
Level 3 inputs are inputs for the asset and liability that are not based on observable market
data (that is, unobservable inputs).
The level in the fair value hierarchy within which the fair value measurement is categorised is
determined on the basis of the lowest level input that is significant to the fair value measurement in
its entirety. If a fair value measurement uses observable inputs that require significant adjustments
based on unobservable inputs, that measurement is a level 3 measurement.
Assessing the significance of a particular input to the fair value measurement in its entirety requires
judgement, considering factors specific to the asset or liability.
The determination of what constitutes ‘observable’ requires significant judgement by the Company.
The Company considers observable data to be that market data that is readily available, regularly
distributed or updated, reliable and verifiable, not proprietary, and provided by independent sources
that are actively involved in the related market. The following table analyses within the fair value
hierarchy of the Company’s financial assets measured at fair value:
Assets
Level 1
Level 2
Level 3
Total
Balance
30 September 2016
EUR EUR EUR EUR
Financial assets designated at fair value through profit or loss (Non-Current)
-
-
-
-
Financial assets designated at fair value through profit or loss (Current)
- - 26,059,843 26,059,843
Total - - 26,059,843 26,059,843
31 March 2016
Financial assets designated at fair value through profit or loss (Non-Current)
-
-
17,844,854 17,844,854
Financial assets designated at fair value through profit or loss (Current) - -
16,341,184 16,341,184
Total - - 34,186,038 34,186,038
There has been no transfer between levels during the period ended 30 September 2016 (31 March
2016 – Nil). The changes in the financial assets at fair value through profit or loss classified at level 3
are as follows:

33
Notes to the Financial Statements (Continued) Financial risk management (Continued)
30 September 2016
31 March 2016
EUR EUR
Balance as at 1 April 34,186,038 83,504,691
Redemption of shares (10,000,000) (38,000,000)
Disposal of subsidiaries - (26,960)
Realised loss/(gain) on financial assets at fair value through profit or loss
(34)
27,013
Unrealised gain/(loss) on financial assets at fair value through profit or loss
1,873,839 (11,318,706)
Balance as at period / year ended 26,059,843 34,186,038
Transfers between levels of the fair value hierarchy, if any, are deemed to have occurred at the end
of the reporting period.
The Company, through K2 and its investments in underlying companies, has invested in unquoted
shares in the Portfolio Companies. In the absence of observable prices, as described in Note 4.1,
valuation techniques are used to compute the fair value of the investments held by K2 and its
underlying companies. The fair value of un-exited portfolio companies as at 30 September 2016 is
based on the internal desktop valuation carried out by the Investment Manager which are derived
from the valuations prepared by the independent international property valuer - CB Richard Ellis South
Asia Private Limited (“the Valuer”) as at 31 March 2016 based on the guidelines issued by the Royal
Institution of Chartered Surveyors (RICS), UK. The valuation makes use of the Discounted Cash Flow
(“DCF”) method, to value the different projects, based on the stage of each project. This method seeks
to make use of recent real estate transactions similar in nature to each individual project, where
available and relevant, and of a number of assumptions and judgments obtained from the Investment
Manager. Hence, the investments which comprise substantially all of the net assets of K2 are classified
under level 3.
The investment in the remaining Portfolio Companies where exits have been contracted have been
valued using the net present value of the estimated cash flows based on the definitive legal
documentation entered into for exit from these investments, and adjusted for any other relevant
factors.
As at 30 September 2016, the investments made by the Company through K2 and its underlying
companies are predominantly in residential developments and in the form of receivables from fully or
phased exits.
a. Residential development
The valuation of residential developments are carried out using Earnings Before Interest, Taxes and
Depreciation and Amortisation (EBITDA) level cash flows as reduced by the tax impact over the
project life under the DCF method, discounted using a weighted average cost of capital (WACC),
which the Investment Manager deems appropriate for the project being valued. The three
significant inputs used in the DCF method are sales price, construction cost and WACC.

34
Notes to the Financial Statements (Continued) Financial risk management (Continued)
The table below presents the sensitivity of the fair value of K2 incorporated in the Company’s Statement of Financial Position to changes in the significant unobservable inputs for residential developments:
Significant unobservable inputs
30 September 2016
Movements
31 March 2016 Movements
EUR mn EUR mn Increase in sale price 5% 0.98 1.00 Decrease in sale price 5% (1.01) (1.02) Increase in construction cost 5% (0.75) (0.84) Decrease in construction cost 5% 0.67 0.77 Increase in WACC 5% (0.30) (2.02) Decrease in WACC 5%
0.32 2.47
The significant unobservable inputs used in the valuation in the case of sale price, WACC and construction cost vary from project to project depending upon on the product mix of each project, location etc. b. Contracted exits
The significant input is the estimation of cash flows arising from contracted exits. The fair value would increase (decrease) if estimated cash flows were higher (lower).
The table below presents the sensitivity of the fair value of K2 incorporated in the Company’s Statement of Financial Position to changes in the significant unobservable input for contracted exits.
Significant unobservable inputs 30 September 2016 Movements
EUR mn
31 March 2016 Movements
EUR mn Increase in estimated cash flows 10%
0.83
0.72
Decrease in estimated cash flows 10% (0.83) (0.72)
3.7 Capital risk management
The Company’s objectives when managing capital are to safeguard its ability and the ability of its
subsidiaries to continue as going concerns in order to provide returns and value for shareholders. The
Company and its subsidiaries have no borrowings and accordingly the gearing ratios are nil. The
Portfolio Companies in which the Company’s indirect subsidiaries have invested have borrowings
related to their real estate development activities without any recourse to the Company.

35
Notes to the Financial Statements (Continued) Financial risk management (Continued)
3.8 Financial instrument by category
The following is the table of the Company’s current assets:
30 September 2016 Non-current and current assets
Loans and receivables
EUR
Financial Assets at fair value through
profit or loss EUR
Total
EUR
Financial assets at fair value through profit or loss (Non-Current)
- - -
Financial assets at fair value through profit or loss (Current)
- 26,059,843 26,059,843
Cash and cash equivalents 113,582 - 113,582
Other receivables 13,861 - 13,861
Total 127,443 26,059,843 26,187,286
31 March 2016 Non-current and current assets
Financial assets at fair value through profit or loss (Non-Current)
- 17,844,854
17,844,854
Financial assets at fair value through profit or loss (Current)
- 16,341,184
16,341,184
Cash and cash equivalents 463,470 - 463,470
Other receivables 13,861 - 13,861
Total 477,331 34,186,038 34,663,369
The following table analyses within the fair value hierarchy of the Company’s current assets:
Assets
Level 1
Level 2
Level 3
Total
Balance
30 September 2016
EUR EUR EUR EUR
Cash and cash equivalents 113,582 - - 113,582
Other receivables - - 13,861 13,861
Total 113,582 - 13,861 127,433
31 March 2016
Cash and cash equivalents 463,470
-
463,470
Other receivables - - 13,861 13,861
Total 463,470 - 13,861 477,331

36
Notes to the Financial Statements (Continued) Financial risk management (Continued)
The following is the table of the Company’s current liabilities:
30 September 2016 Current liabilities
Accruals and other payables
EUR Total EUR
Accruals and payables 116,250 116,250
Total 116,250 116,250
31 March 2016
Accruals and payables 131,467 131,467
Total 131,467 131,467
The following table analyses within the fair value hierarchy of the Company’s current liabilities:
Assets
Level 1
Level 2
Level 3
Total
Balance
30 September 2016
EUR EUR EUR EUR
Accruals and payables -
-
116,250
116,250
Total - - 116,250 116,250
31 March 2016
Accruals and payables -
-
131,467
131,467
Total - - 131,467 131,467
4 Critical accounting estimates and judgements
4.1 Critical accounting estimates and assumptions
As part of its ongoing business, the Company, through the Board, makes estimates and assumptions
concerning the future. The resulting accounting estimates will, by definition, seldom equal the related
actual results. The estimates and assumptions that have a significant risk of causing a material
adjustment to the carrying value of assets and liabilities within the next financial year are outlined
below.
Fair value of financial assets at fair value through profit or loss
The Company, through K2 and its investment in underlying companies, holds financial instruments
that are not quoted in active markets in the form of unquoted shares of the Portfolio Companies. In
the absence of an active market, the fair value of such unquoted investments has been determined
based on the fair value of the underlying net assets of the Portfolio Companies for which there are no
contracted exits. The major components of the net assets of remaining invested Portfolio Companies
is the land owned by it and any development and/or any capital work in progress, and its related
borrowings. Their net assets also include other current assets and liabilities. The fair value of the
investments held by K2 and its underlying companies in the Portfolio Companies has been determined
based on the net assets of these Portfolio Companies, as adjusted for:
37
Notes to the Financial Statements (Continued)
Critical accounting estimates and judgements (Continued)
(1) differences between IFRS and Indian GAAP; and (2) fair valuation of all of the underlying assets and liabilities.
For investments in Portfolio Companies held by K2 and its underlying companies, where a definitive
full or phased exit has been agreed, the fair value has been determined as the net present value of
the contracted exit cash flows.
The Board have considered the above in determining whether the net asset value of K2 per its 30
September 2016 unaudited financial statements is the most appropriate basis for estimating the
Company’s investment in K2, and they have concluded that it is.
4.2 Critical judgements
Functional currency
The Board considers the EUR as the currency that most faithfully represents the economic effects of
the Company’s underlying events, transactions and conditions. EUR is the currency in which the
Company measures its financial performance and reports its results. This determination also considers
the competitive environment in which the Company operates compared to other European
investment products.
Investment entity exemption
As explained in note 2.1, the Board of Directors has concluded that the Company met the definition
of an Investment Entity. As a result, the Company measures its investments in its subsidiary at fair
value through profit or loss.
Going concern
As agreed with the shareholders of the Company in June 2013, the Class A and Class B shares held by
the Company in K2 were redeemable at the option of K2 on 30 September 2016. K2 did not elect to
exercise this option. The Board in its meeting of 1 July 2016 agreed to seek a formal shareholders
approval on the extension of the terms of the Investment Management Agreement with IIAL beyond
30 September 2016 after conducting a detailed assessment of the balance of the portfolio and the exit
strategy for the same. The annual general meeting of the Company was held on 14 September 2016
wherein the resolution for extension of the Investment Management Agreement until a long stop date
of 31 December 2018 was unanimously passed. Based on the foregoing the Company continues to be
a going concern.
5 Taxation
5.1 Current tax – Jersey
The Company is domiciled in Jersey, Channel Islands. Any profits arising in the Company are subject
to tax at the rate of 0% (2016: 0%).

38
Notes to the Financial Statements (Continued)
6 Financial assets at fair value through profit or loss
The financial assets at fair value through profit or loss are as follows:
Company EUR
As at 31 March 2015 83,504,691
Redemption of shares (38,000,000)
Disposal of subsidiaries (26,960)
Realised gain on financial assets at fair value through profit or loss
27,013
Unrealised loss on financial assets at fair value through profit or loss
(11,318,706)
As at 31 March 2016 34,186,038
Redemption of shares (10,000,000)
Realised gain on financial assets at fair value through profit or loss
(34)
Unrealised loss on financial assets at fair value through profit or loss
1,873,839
As at 30 September 2016 26,059,843
The current and non-current financial assets at fair value through profit or loss are as follows:
EUR EUR Company 30 September 2016 31 March 2016 Classified as current during the period / year
26,059,843 16,341,184
Classified as non-current during the period / year
- 17,844,854
Total 26,059,843 34,186,038
Financial assets classified under current assets are those that are expected to be realised within a
period of less than 12 months.
Financial assets classified under non-current assets are those that are not expected to be realised
within a period of less than 12 months. The Company has investments in both direct and indirect
companies.
Indirect companies are those entities in respect of which the Company has the power to govern the
financial and operating polices by virtue of an investment in a direct company.

39
Notes to the Financial Statements (Continued)
Financial assets at fair value through profit or loss (Continued)
A list of the significant direct investments, including the name, principal activity, country of
incorporation and the proportion of ownership interest is given below:
Direct investment
Name of subsidiary Principal Activity Country of incorporation
Class of share
Percentage held by
the Company
K2 Property Limited Investment holding Mauritius Ordinary Class A and B
100%
K2 issued 1,250,000 Class A shares on 16 January 2007, and 1,687,865 Class B shares on 7 January
2008 to the Company and 75,000 Class C shares and 25,000 Class D shares to IFS Trustees (as Trustee
of Saffron Investment Trust) hereinafter referred to as Advisor Shareholders. All the shares have a par
value of USD 0.01 each.
K2 has a finite life of 15 years ending in 2020, which can be extended by the Board of Directors of K2
by two successive terms each of one year. Class A and Class B shares are redeemable at the option of
K2. The present intention of the Directors is that the Class A and Class B shares will be fully redeemed
on or before 31 December 2018.
During the period ended 30 September 2016, K2 redeemed 33,085 Class A shares for a consideration
of EUR 2,554,798 and 108,700 Class B shares for a consideration of EUR 7,445,202. As at 30 September
2016, the Company held 731,545 Class A shares and 1,030,977 Class B shares of K2. The nominal share
capital of Class C and Class D shares is USD 1,000.

40
Notes to the Financial Statements (Continued)
Financial assets at fair value through profit or loss (Continued)
Indirect holding companies
Name of subsidiaries
Principal Activity Country of incorporation
Class of share
Percentage held indirectly by
The Company
K2 Private Equity Limited Investment Holding Mauritius Ordinary 100%
K2 Hospitality Limited Investment Holding Mauritius Ordinary 100%
K2 Residential Limited Investment Holding Mauritius Ordinary 100%
K2 Commercial Limited Investment Holding Mauritius Ordinary 100%
K2 Retail Limited* Investment Holding Mauritius Ordinary 100%
K2C Residential Limited Investment Holding Mauritius Ordinary 100%
K2A Private Equity Limited Investment Holding Mauritius Ordinary 100%
K2A Hospitality Limited Investment Holding Mauritius Ordinary 100%
K2F Residential Limited* Investment Holding Mauritius Ordinary 100%
K2C Hospitality Limited Investment Holding Mauritius Ordinary 100%
K2A Residential Limited Investment Holding Mauritius Ordinary 100%
K2E Residential Limited Investment Holding Mauritius Ordinary 100%
K2B Commercial Limited Investment Holding Mauritius Ordinary 100%
K2C Retail Limited* Investment Holding Mauritius Ordinary 100%
K2G Residential Limited* Investment Holding Mauritius Ordinary 100%
Mildren Holding Limited Investment Holding Cyprus Ordinary 100%
*These companies are under liquidation process.
7 Prepayments and other receivables
30 September 2016 EUR
31 March 2016 EUR
Prepayments 13,720 36,258
Other receivables 13,861 13,861
Total 27,581 50,119
The Board has reviewed the above receivables at 30 September 2016 to determine whether any
impairment provision is required. The Board has concluded that there was no indication of impairment
at 30 September 2016 (2016: Nil).
8 Cash and cash equivalents
For the purposes of the cash flow statement, cash and cash equivalents comprise the following
balances:
30 September 2016 EUR
31 March 2016 EUR
Cash and cash equivalents 113,582 463,470

41
Notes to the Financial Statements (Continued)
9 Stated capital and share premium
Authorised and issued stated capital
Number of Ordinary
shares of no par value
Stated Capital
EUR
Total EUR
As at 31 March 2015 11,123,141 173,457,092 173,457,092
Shares redeemed during the year (4 May 2015 and 1 September 2015) (6,247,487) (38,000,000) (38,000,000)
As at 31 March 2016 4,875,654 135,457,092 135,457,092
Shares redeemed during the period (30 September 2016) (1,410,437) (10,000,000) (10,000,000)
As at 30 September 2016 3,465,217 125,457,092 125,457,092
All issued ordinary shares of the Company are fully paid and have been admitted to the official list of
Euronext. The Company's capital is represented by these ordinary shares, each of which carries one
vote and has full entitlement to dividends when declared. The Company has no restrictions or specific
capital requirements on the issue and re-purchase of ordinary shares. The relevant movements in
capital are shown in the statement of changes in equity. In accordance with the objectives outlined in
Note 1 and the risk management policies in Note 3, the Company endeavours to invest the proceeds
from the issue of ordinary shares in appropriate investments while maintaining sufficient liquidity to
meet its working capital and investment needs on an ongoing basis, such liquidity being augmented
by short-term borrowings or disposal of investments where necessary. The share premium represents
amount collected from investors towards issue of no par value shares comprising both the initial public
offer and the follow on public offer. It may be utilised when the Company buys back its own shares or
redeem the previously issued shares.
10 Accruals and other payables
30 September 2016 EUR
31 March 2016 EUR
Amount due to related parties 17,310 49,927
Other payables 68,070 30,040
Accruals 30,870 51,500
Total 116,250 131,467
11 Distribution payable
No dividend was paid during the period ended 30 September 2016 (31 September 2015 - Nil).

42
Notes to the Financial Statements (Continued)
12 Related party transactions
The Company entered into transactions with related parties in respect of director’s remuneration and
expenses, and receivable from the Investment Manager as set out below:
Directors’ interests
Directors’ interests in the shares of the Company is as disclosed in the Directors’ report on Page 7.
Directors’ remuneration and expenses
The total remuneration paid to Directors who are related parties (being all the directors of the
Company) for the period was EUR 108,000 (30 September 2015 – EUR 120,000).
The amount payable to the Directors towards reimbursement of travelling expenses as at 30
September 2016 was EUR 2,310 (31 March 2016 – EUR 4,325).
Amount receivable from and payable to Investment Manager
At the period end, EUR 15,000 was payable directly by the Company to the Investment Manager (31
March 2016 – EUR 30,000).
Amount payable to K2 is Nil as at 30 September 2016 (31 March 2016 – EUR 15,602).
The total incentive fee which would become due to the Investment Manager from 1 October 2016 up to 30 September 2017 based on the anticipated proceeds on ultimate disposal of the investments in the underlying subsidiaries would be approximately EUR 2.60 million. This would translate into approximately EUR 0.75 per share based on the number of shares presently in issue.
13 Ultimate controlling party
In the opinion of directors, there is no party who meets the definition of Ultimate Controlling Party.
14 Capital and other commitments
The Company has no capital commitments as at 30 September 2016 (31 March 2016 – Nil).
15 Profit/ (Loss) per share
Basic profit / (loss) per share is calculated by dividing the net profit / (loss) attributable to the
Company’s equity holders by the weighted average number of ordinary shares in issue during the
period.
30 September 2016 EUR
30 September 2015 EUR
Profit/(Loss) attributable to equity holders of the Company 1,516,596 (8,066,510)
Weighted average number of ordinary shares in issue 4,860,155 7,852,275
Basic and diluted profit/(loss) per share 0.31 (1.03)
The Company has not issued any other shares or instruments that are considered to have dilutive
potential.

43
Notes to the Financial Statements (Continued)
16 Net asset value per share
30 September 2016 EUR
31 March 2016 EUR
Net assets 26,084,756 34,568,160
Number of ordinary shares in issue 3,465,217 4,875,654
Net assets value per share 7.53 7.09
17 Segment information
The chief operating decision maker ("CODM") in relation to the Company is deemed to be the Board
of the Company itself. The factor used to identify the Company's reportable segments is geographical
area. Based on the above and a review of information prepared on an IFRS basis which provided to
the Board, it has been concluded that the Company is currently organised into one reportable
segment; India.
There is only one type of real estate projects within the above segment which is predominantly
residential (2016 – one type; predominantly residential). CODM considers on a quarterly basis the
results of the position of residential property as a whole as part of their ongoing performance review.
The CODM receives quarterly updates on its investment in K2 from the Investment Manager of K2. In
addition, quarterly portfolio reports and period end valuation reports are reviewed and reported on
by the Investment Manager to the Board of Directors.
Operating segments
The Company has only one reportable operating segment and the performance of this segment
accounts for the performance of the Company as a whole. Other than cash and cash equivalents and
related interest and charges, the results of the Company are deemed to be generated in India.
18 Subsequent Events
On 3rd October, 2016 an indirect subsidiary of the Company, K2E Residential Limited, received EUR 1.48 million in respect of share sale proceeds for shares held in Riverbank Developers Limited. Further on 6th October 2016, it also received EUR 2.11 million in respect of share sale proceeds for shares held in Riverbank Developers Limited.
On 4th October 2016, an indirect subsidiary of the Company, K2A Residential Limited, received EUR 1.04 million as dividend income from Kolte Patil Real Estate Private Limited.

44
Corporate Information
Registered Office: Investment Manager to K2 Independent Auditor: and service provider to Yatra Le Masurier House IL& FS Investment Advisors LLC KPMG Channel Islands Limited La Rue Le Masurier St Helier
IFS Court, Twenty Eight Cybercity, Ebene
37 Esplanade St Helier, JE4 8WQ
JE2 4YE Mauritius Jersey Jersey Administrator:
Citco Jersey Limited Le Masurier House La Rue Le Masurier St Helier, Jersey
Legal Advisors: Carey Olsen 47 Esplanade St. Helier Jersey JE1 0BD
Corporate Brokers & Advisors (From 1 April 2016)
Corporate Brokers & Advisors (Until 31 March 2016)
NPlus1 Singer Advisory LLP One Bartholomew Lane London EC2N 2AX
Edmond De Rothschild Orion House 5 Upper St. Martin’s Lane London WC2H 9EA
Listing & Paying Agent ISIN ABN AMRO Bank N.V. Gustav Mahlerlaan 10, P O Box 283 (HQ7050) 1000 EA Amsterdam The Netherlands
JE00B1FBT077

45
Contact Information Yatra Capital Limited, Jersey
Charles Millard Beer +44 1534 756 706 [email protected] NPlus1 Singer Advisory LLP (Corporate advisors) James Maxwell +44 207 496 3056 [email protected] ABN AMRO Bank N V, (Listing Agent)
Diederik Berend +31 20 628 0707 [email protected] IL & FS Investment Advisors LLC, Mauritius
Vijay Ganesh +230 467 3000 [email protected]
For more information on Yatra, please log on to www.yatracapital.com.
For more information on IL & FS Investment Advisors LLC, please log on to:
www.ilfsinvestmentmanagers.com
INVESTMENT MANAGER