Embed Size (px)
Citation preview

Yale UniversityMartin Wexler Steven Hao Stephen OshmanMartin Wexler, Steven Hao, Stephen Oshman,
Michael Simpson, Ayung Tseng April 2, 2009

Ticker: PVH
Target Price: $22Target Price: $22
Market Price: $21
Investment Thesis: Source: Yahoo FinanceInvestment Thesis: 1. Resilient company margins during recession
2 Strong growth from international licensing2. Strong growth from international licensing
3. Healthy liquidity and strong balance sheet
2
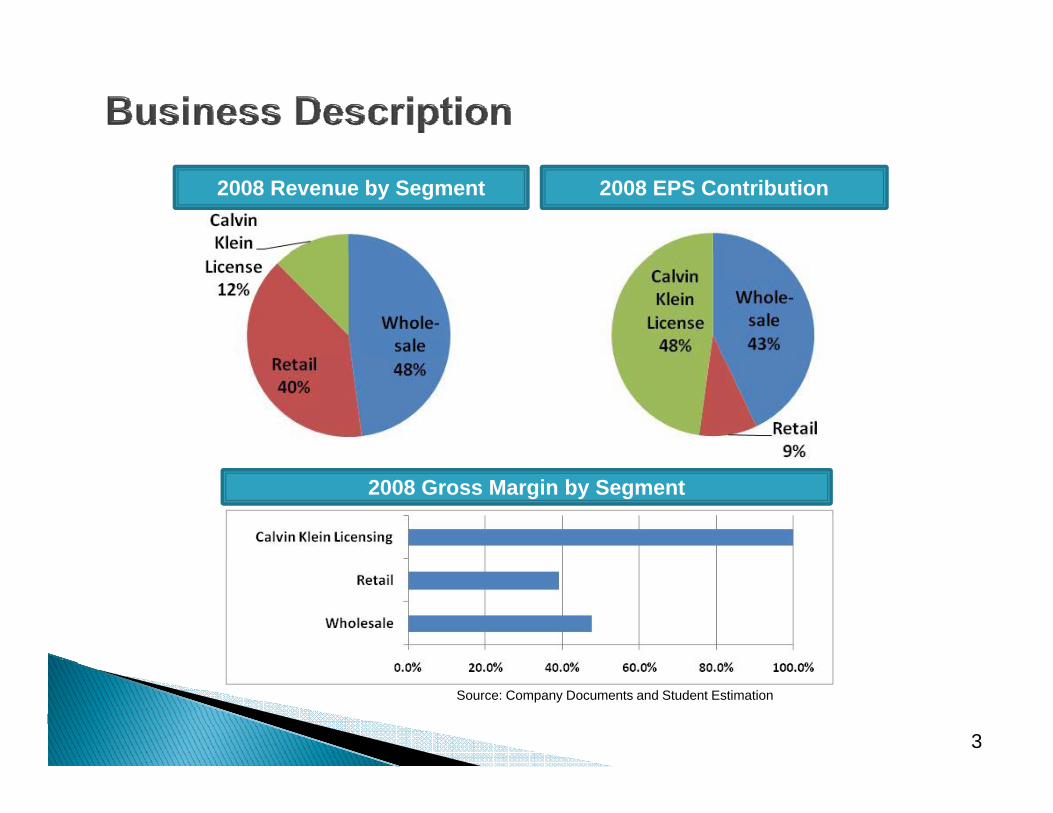
2008 Revenue by Segment 2008 EPS Contribution
2008 Gross Margin by Segment
Source: Company Documents and Student Estimation
3

Source: Company Documents and Student Estimation
4
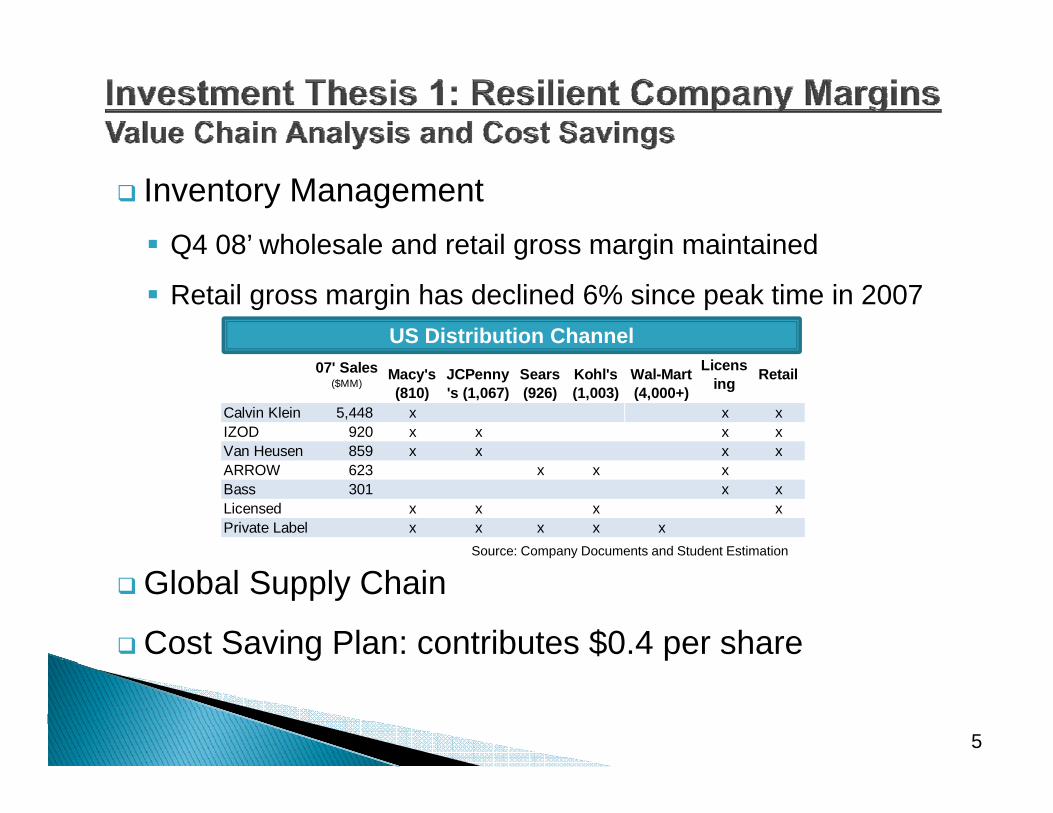
Inventory ManagementQ4 08’ wholesale and retail gross margin maintainedQ4 08 wholesale and retail gross margin maintained
Retail gross margin has declined 6% since peak time in 2007US Distribution Channel
07' Sales ($MM)
Macy's (810)
JCPenny's (1,067)
Sears (926)
Kohl's (1,003)
Wal-Mart (4,000+)
Licensing Retail
Calvin Klein 5,448 x x xIZOD 920 x x x xVan Heusen 859 x x x xARROW 623 x x xBass 301 x xLicensed x x x xPrivate Label x x x x x
Source: Company Documents and Student Estimation
Global Supply Chain
Cost Saving Plan: contributes $0.4 per share
5

Change in Gross Margin of Key Players in last Recession
S C D t
Scenario Analysis on Length of Recession and Margins
Source: Company Documents
Case Target Price Margin Change Length of Recession Weight DCF Target
Bull $25.71 -3% Ends in 2009 Christmas 25%
Base $23.41 -5% Ends in 2010 Christmas 50% $23.86
6
Bear $22.92 -7% Ends in 2011 Christmas 25%
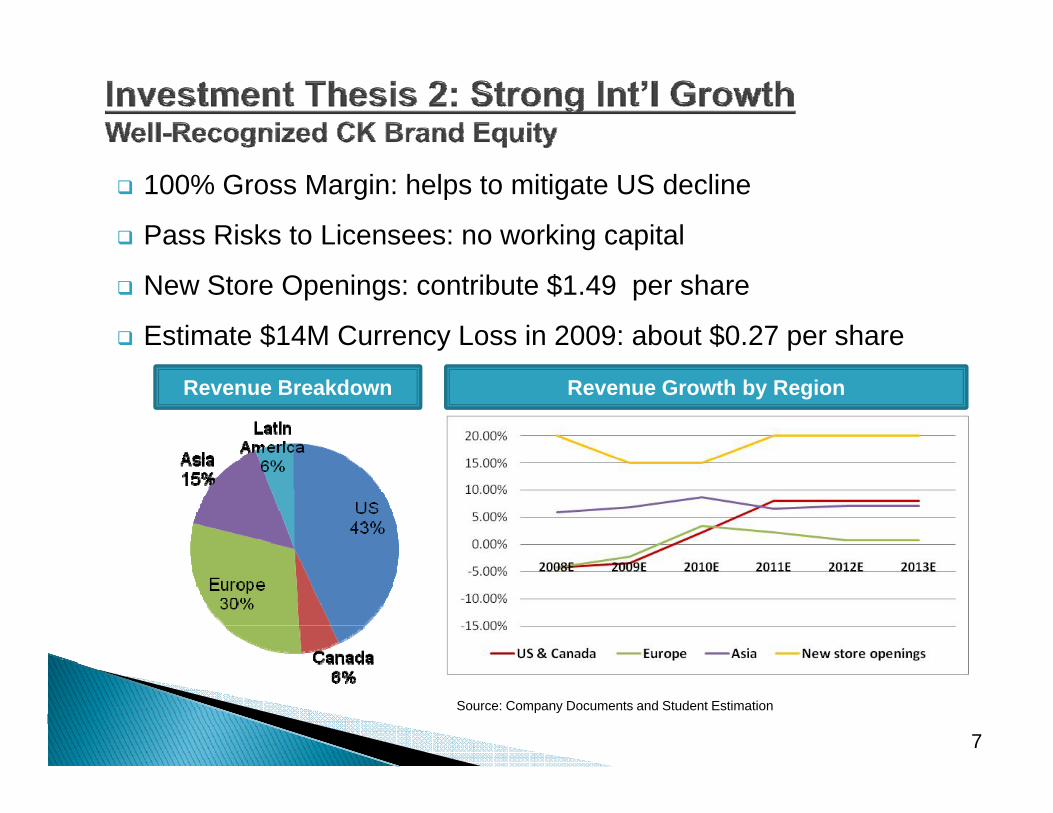
100% Gross Margin: helps to mitigate US decline
Pass Risks to Licensees: no working capital
New Store Openings: contribute $1.49 per share
Estimate $14M Currency Loss in 2009: about $0.27 per share
Revenue Breakdown Revenue Growth by Region
7
Source: Company Documents and Student Estimation

Strong Cash Flow to Weather RecessionInventory days at industry average 95 daysInventory days at industry average 95 days
Predicted to rise to 105 days in 2009
Estimated FCF $100M in 2009$
Estimated $300M cash balance at end of 2008
Clean Balance SheetClean Balance SheetFixed amount of debt $399M, $150M to expire in 2011
Cut back in capex in the short termCut back in capex in the short term
Actively looking for attractive acquisitions to gain market share
8
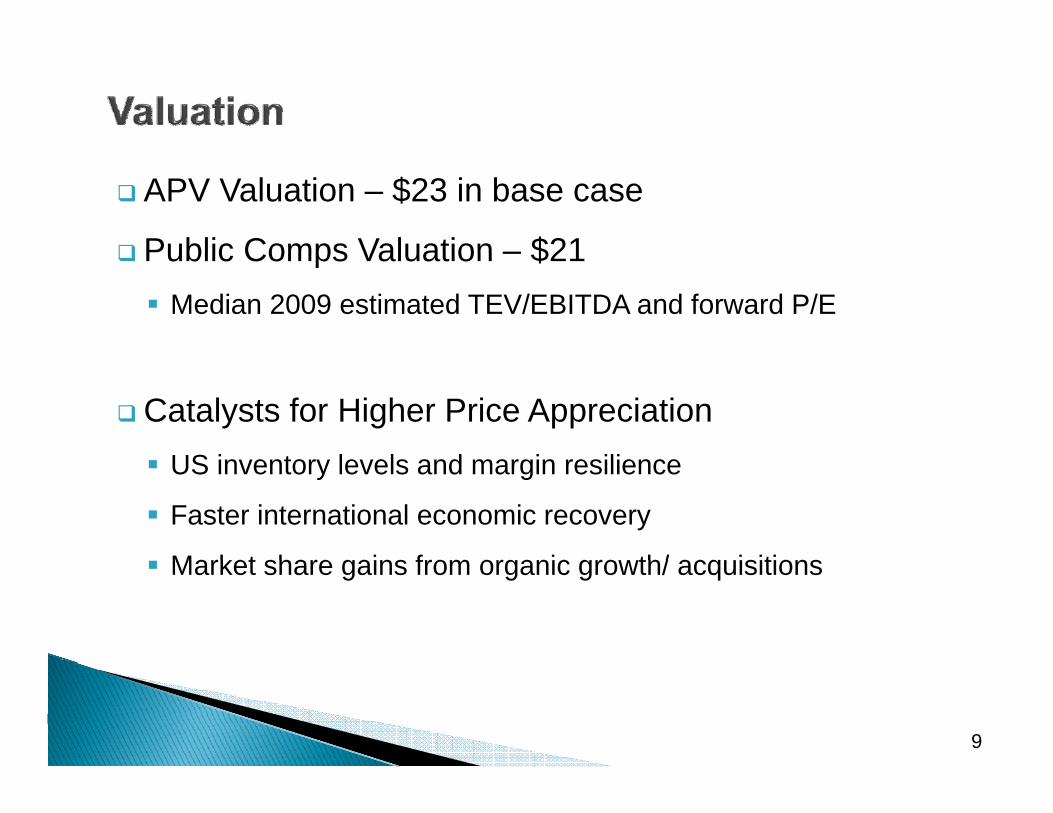
APV Valuation – $23 in base case
Public Comps Valuation – $21Public Comps Valuation – $21Median 2009 estimated TEV/EBITDA and forward P/E
Catalysts for Higher Price AppreciationUS i t l l d i iliUS inventory levels and margin resilience
Faster international economic recovery
Market share gains from organic growth/ acquisitionsMarket share gains from organic growth/ acquisitions
9

1.32.5
20
25
1.50.4 1.5
0.315
20
2210
14.5
5
0Initial PT Wholesaler Wholesaler Liscensee Longer Slower Currency Worst Case
10
Discount Bankruptcy &Consolidation
Bankruptcy Recession Global Growth
Risk P.T.

Target price: $22
Investment Thesis: 1 Resilient company margins during recession1.Resilient company margins during recession
2.Strong growth from international licensing
3 Healthy liquidity and strong balance sheet3.Healthy liquidity and strong balance sheet
11


Wholesale revenue growth Retail revenue growth Licensing revenue growthNominal GDP growth Industry comp store growth USCoefficient Industry non‐comp store growth CanadaIndustry chain store growth PVH comp store growth adj. EuropeRetail channel adjustment PVH non‐comp store growth adj. AsiaCompetition adjustment Seasonality adjustment New licensee/store opening adj.Seasonality adjustment PVH Retail revenue growth Seasonality adjustmentPVH Wholesale revenue growth PVH Licensing revenue growth
Appendix 1

Based on PVH fiscal year 2008 FY 2011 FY 2012 FY 2013
4Q 1Q 2Q 3Q 4Q 1Q 2Q 3Q 4Q08Dec 09Mar 09Jun 09Sep 09Dec 10Mar 10Jun 10Sep 10Dec
Revenue Growth Projection for for Phillips‐Van Heusen
FY 2009 FY 2010
08Dec ‐09Feb
09Mar ‐09May
09Jun ‐09Aug
09Sep ‐09Nov
09Dec ‐10Feb
10Mar ‐10May
10Jun ‐10Aug
10Sep ‐10Nov
10Dec ‐11Feb
Wholesale revenue growth
Nominal GDP growth 2.10% 0.64% 0.64% 1.64% 2.96% 4.12% 4.12% 4.12% 4.68% 5.09% 5.71% 5.25%
Coefficient 84.73% 84.73% 84.73% 84.73% 90.47% 93.34% 93.34% 93.34% 117.66% 117.66% 117.66% 127.57%
Industry chain store growth 1 78% 0 54% 0 54% 1 39% 2 68% 3 85% 3 85% 3 85% 5 51% 5 99% 6 72% 6 60%Industry chain store growth 1.78% 0.54% 0.54% 1.39% 2.68% 3.85% 3.85% 3.85% 5.51% 5.99% 6.72% 6.60%
Retail channel adjustment ‐4.00% ‐4.00% ‐4.00% ‐4.00% ‐4.00% ‐3.00% ‐2.00% ‐1.00% 1.00% 2.75% 2.00% 2.00%
Competition adjustment ‐0.75% ‐0.75% ‐0.75% ‐0.75% ‐0.75% ‐0.75% ‐0.75% ‐0.75% ‐0.75% ‐0.75% ‐0.75% ‐0.75%
Seasonality adjustment ‐2.79% 2.65% ‐4.48% 4.62% ‐2.79% 2.65% ‐4.48% 4.62% ‐2.79% 0.00% 0.00% 0.00%
PVH Wholesale revenue growth ‐5.76% ‐1.56% ‐8.69% 1.26% ‐4.86% 2.75% ‐3.39% 6.71% 2.97% 7.99% 7.97% 7.85%
Retail revenue growth
Industry comp store growth ‐9.00% ‐9.00% ‐9.00% ‐7.20% ‐5.75% ‐5.75% ‐5.75% ‐5.75% ‐1.40% 0.14% 3.63% 3.63%
Industry non‐comp store growth 2.64% 4.40% 4.40% 4.40% 3.82% 3.82% 3.82% 3.82% 4.36% 4.95% 6.48% 6.32%
PVH comp store growth adj. ‐2.10% ‐1.00% ‐1.00% ‐1.00% ‐1.00% ‐1.00% ‐1.00% ‐1.00% ‐1.00% ‐1.00% ‐1.00% ‐1.00%
PVH non‐comp store growth adj. ‐3.00% ‐3.00% ‐3.00% ‐3.00% ‐3.00% ‐1.00% ‐1.00% ‐1.00% ‐1.00% ‐1.00% ‐2.00% ‐2.00%
Seasonality adjustment 2.48% ‐3.64% 0.35% 0.81% 2.48% ‐3.64% 0.35% 0.81% 2.48% 0.00% 0.00% 0.00%
PVH Retail revenue growth ‐8.98% ‐12.23% ‐8.25% ‐5.99% ‐3.45% ‐7.57% ‐3.58% ‐3.12% 3.44% 3.09% 7.10% 6.51%
Licensing revenue growth Weights
US 42.00% ‐4.21% ‐4.21% ‐4.21% ‐3.36% ‐2.07% 0.10% 1.10% 2.10% 5.76% 7.99% 7.97% 7.85%
Canada 5.00% ‐4.21% ‐4.21% ‐4.21% ‐3.36% ‐2.07% 0.10% 1.10% 2.10% 5.76% 7.99% 7.97% 7.85%
Europe 35.00% ‐4.21% ‐4.21% ‐4.21% ‐4.21% 3.68% 3.68% 3.68% 3.68% 2.62% 2.17% 0.45% ‐0.62%
Asia 18.00% 6.00% 6.00% 6.00% 6.00% 9.50% 9.50% 9.50% 9.50% 6.41% 6.60% 7.05% 6.60%
Asia new licensee/store opening adj. 18.00% 20.00% 15.00% 15.00% 15.00% 15.00% 15.00% 15.00% 15.00% 15.00% 20.00% 20.00% 20.00%
Seasonality adjustment 2.11% ‐2.37% ‐3.65% 3.91% 2.11% ‐2.37% ‐3.65% 3.91% 2.11% 0.00% 0.00% 0.00%
PVH Licensing revenue growth 3.34% ‐2.04% ‐3.32% 4.64% 6.84% 3.37% 2.56% 10.59% 9.59% 9.30% 8.77% 8.26%
Appendix 2

Dollars in millions, except per share
2003 2004 2005 2006 2007 2008 2009E 2010E 2011E 2012E 2013EHistorical Fiscal Year Projected Fiscal Year
Projected Income Statement for Phillips‐Van Heusen
2003 2004 2005 2006 2007 2008 2009E 2010E 2011E 2012E 2013ERevenuesWholesale 721.0 741.1 912.5 953.5 1,178.8 1,140.8 1,111.2 1,145.3 1,236.7 1,335.3 1,440.2 Retail 698.1 739.8 816.6 928.5 981.1 1,025.2 950.8 928.8 957.6 1,025.6 1,092.3 Calvin Klein Licensing 149.8 160.5 179.7 208.6 265.3 309.5 314.7 336.1 367.4 399.7 432.7 Total Revenues 1,568.9 1,641.4 1,908.8 2,090.6 2,425.2 2,475.4 2,376.7 2,410.2 2,561.7 2,760.6 2,965.2 Rev Growth 4.6% 16.3% 9.5% 16.0% 2.1% ‐4.0% 1.4% 6.3% 7.8% 7.4%
Change to total revenue growth rateChange to total revenue growth rateCOGS 924.5 890.4 1,017.8 1,060.8 1,234.2 1,271.5 1,287.0 1,245.9 1,219.4 1,311.6 1,406.4 SG&A 576.4 621.3 683.2 772.2 880.8 926.8 956.2 969.7 935.7 1,008.4 1,083.1 EBIT 68.0 129.7 207.8 257.6 310.2 277.1 133.5 194.7 406.6 440.6 475.7 EBIT/Rev 4.3% 7.9% 10.9% 12.3% 12.8% 11.2% 5.6% 8.1% 15.9% 16.0% 16.0%
EBITWholesale 65.4 80.7 135.5 122.2 159.6 153.4 60.4 70.3 167.5 181.2 195.7Wholesale 65.4 80.7 135.5 122.2 159.6 153.4 60.4 70.3 167.5 181.2 195.7 Retail 3.5 19.1 38.5 82.9 81.7 10.3 (82.2) (41.5) 57.8 62.2 66.5 Calvin Klein Licensing 15.0 63.2 74.8 125.1 128.9 154.3 155.3 165.9 181.3 197.2 213.5 Corporate (15.9) (33.3) (41.0) (72.6) (58.3) (51.6) (51.6) (51.6) (51.6) (51.6) (51.6) Total EBIT 68.0 129.7 207.8 257.6 311.9 266.5 82.0 143.1 355.0 389.0 424.1
Tax expense 24.3 42.3 77.6 96.7 111.5 101.5 31.2 54.5 135.3 148.2 161.6 After‐tax EBIT 43.7 87.4 130.2 160.9 200.4 165.0 50.7 88.6 219.8 240.8 262.5 growth 100.1% 49.0% 23.6% 24.5% ‐17.7% ‐69.2% 74.6% 148.1% 9.6% 9.0%
After‐tax unusual items (5.5) 0.1 (0.6) 4.7 1.0 (18.2) ‐ ‐ ‐ ‐ ‐ ‐ After‐tax interest expense 5.3 19.1 41.7 58.2 69.3 27.4 ‐ ‐ ‐ ‐ ‐ ‐ Pref. dividends and other adj. 20.0 21.1 29.2 14.2 ‐ ‐ ‐ ‐ ‐ ‐ ‐ NI to common stock 12.9 47.3 58.6 93.3 132.1 119.4 50.7 88.6 219.8 240.8 262.5
Weighted Avg. Diluted Shares Out. 30.3 51.6 51.7 53.5 57.1 51.5 51.5 51.5 51.5 51.5 51.5 Diluted EPS 0.4 0.9 1.1 1.7 3.1 2.3 1.0 1.8 4.3 4.7 5.1 Growth 115.7% 23.8% 53.7% 78.5% ‐25.9% ‐57.0% 80.4% 138.8% 9.6% 9.0%
Dividend per share 0.15 0.15 0.15 0.15 0.15 0.15 0.15 0.15 0.15 0.15 0.15 Dividend 4.5 7.7 7.8 8.0 8.6 7.7 7.7 7.7 7.7 7.7 7.7
EPS contributionWholesale 1.4 1.1 1.6 1.4 1.7 1.8 0.7 0.8 2.0 2.2 2.4 Retail 0.1 0.2 0.5 1.0 0.9 0.1 (1.0) (0.5) 0.7 0.7 0.8 Calvin Klein Licensing 0.3 0.8 0.9 1.5 1.4 1.9 1.9 2.0 2.2 2.4 2.6 Corporate (1.4) (1.5) (2.3) (3.1) (1.8) (2.0) (0.6) (0.6) (0.6) (0.6) (0.6) Total Diluted EPS 0.4 0.9 1.1 1.7 3.1 2.3 1.0 1.8 4.3 4.7 5.1 Appendix 3

Dollars in millions, except per shareProjected Income Statement for Phillips‐Van Heusen
2003 2004 2005 2006 2007 2008 2009E 2010E 2011E 2012E 2013ERatios and AssumptionsRevenue growth
Projected Fiscal YearHistorical Fiscal Year
Wholesale 2.8% 23.1% 4.5% 23.6% ‐3.2% ‐2.6% 3.1% 8.0% 8.0% 7.9%Retail 6.0% 10.4% 13.7% 5.7% 4.5% ‐7.3% ‐2.3% 3.1% 7.1% 6.5%Calvin Klein Licensing 7.1% 12.0% 16.1% 27.2% 16.7% 1.7% 6.8% 9.3% 8.8% 8.3%
COGS % of rev 58.9% 54.2% 53.3% 50.7% 50.9% 51.3% 54.2% 51.4% 47.6% 47.5% 47.4%SG&A % of rev 36.7% 37.9% 35.8% 36.9% 36.3% 37.7% 40.2% 40.2% 36.5% 36.5% 36.5%
Gross MarginWholesale 40.2% 46.3% 48.3% 49.4% 48.0% 49.1% 44.1% 44.7% 47.7% 47.7% 47.7%Retail 31.6% 38.0% 38.2% 45.5% 42.8% 36.6% 30.0% 34.1% 40.2% 40.2% 40.2%Calvin Klein Licensing 100.0% 100.0% 100.0% 100.0% 100.0% 100.0% 100.0% 100.0% 100.0% 100.0% 100.0%
Net Capex % of next year RevWholesale 0.8% 1.1% 1.0% 0.8% 2.0% 1.0% 1.0% 2.0% 2.0% 2.0%Retail 3.1% 4.0% 2.6% 3.2% 6.3% 3.5% 3.5% 4.0% 4.0% 4.0%Calvin Klein Licensing 0.7% 0.6% 0.6% 0.6% 1.4% 1.0% 1.1% 1.2% 1.3% 1.4%
Corporate Depreciation % of total rev 0.1% 0.1% 0.1% 0.1% 0.4% 0.2% 3.0% 0.4% 0.4% 0.4%
Tax rate 35.8% 32.6% 37.4% 37.5% 37.8% 38.1% 38.1% 38.1% 38.1% 38.1%
Appendix 4

Projected Balance Sheet for Phillips‐Van HeusenDollars in millions
2003 2004 2005 2006 2007 2008 2009 2010 2011 2012Cash And Equivalents 133.0 124.1 267.4 366.1 269.9 328.2 555.4 726.2 881.5 1097.4
Historical Fiscal Year Projected Fiscal Year
Cash And Equivalents 133.0 124.1 267.4 366.1 269.9 328.2 555.4 726.2 881.5 1097.4Account receivables 96.7 93.4 102.8 99.4 186.0 200.6 169.5 170.5 180.4 194.0Inventory 218.4 242.9 257.7 284.9 322.2 282.7 370.2 325.3 318.3 342.4Prepaid Exp. 23.1 19.0 18.1 39.6 48.3 53.0 33.5 34.5 36.3 39.8 Deferred Tax Assets, Curr. 17.2 13.7 23.4 2.0 ‐ ‐ ‐ ‐ ‐ ‐ Other Current Assets 0.5 0.3 0.3 8.0 9.8 ‐ ‐ ‐ ‐ ‐ Total Current Assets 488.9 493.4 669.7 800.0 836.2 864.4 1,128.6 1,256.4 1,416.4 1,673.6
Gross Property, Plant & Equipment 321.2 364.3 389.9 424.8 516.6 568.9 616.5 694.2 778.2 868.6 Accumulated Depreciation (182.7) (209.7) (231.4) (252.8) (284.5) (373.7) (476.1) (581.4) (689.3) (799.0) Net Property, Plant & Equipment 138.5 154.6 158.5 172.0 232.1 195.2 140.5 112.8 88.9 69.7
48.9%Goodwill 160.4 174.5 200.0 271.1 322.0 372.9 420.4 468.6 519.9 575.1 Other Intangibles 628.8 699.3 699.4 742.4 740.1 737.8 761.6 809.8 861.0 916.2 gOther Long‐Term Assets 22.7 27.8 25.9 27.9 42.1 42.1 42.1 42.1 42.1 42.1 Total Assets 1,439.3 1,549.6 1,753.5 2,013.4 2,172.5 2,212.5 2,493.2 2,689.8 2,928.4 3,276.7
Accounts Payable 49.8 54.5 61.6 81.9 112.8 349.2 117.6 113.9 97.2 104.6 Accrued Exp. 114.4 133.4 145.3 188.4 210.0 452.6 434.5 440.7 468.4 504.7 Unearned Revenue, Current 18.7 20.6 23.8 27.7 34.4 ‐ ‐ ‐ ‐ ‐ Def Tax Liability Curr 2 9 0 0 0 0 0 0 0 0 0 0Def. Tax Liability, Curr. ‐ ‐ ‐ ‐ 2.9 0.0 0.0 0.0 0.0 0.0 Total Current Liabilities 182.9 208.5 230.7 298.0 360.1 801.8 552.1 554.5 565.6 609.3
Long‐Term Debt 399.1 399.5 399.5 399.5 399.6 399.6 399.6 399.6 399.6 399.6 Pension & Other Post‐Retire. Benefits 15.8 ‐ ‐ ‐ ‐ ‐ ‐ ‐ ‐ ‐ Def. Tax Liability, Non‐Curr. 178.3 187.2 232.5 256.3 219.6 216.7 205.3 211.1 222.2 243.7 Other Non‐Current Liabilities 102.4 125.6 118.2 117.3 236.9 233.8 221.5 227.7 239.7 262.9 Total Liabilities 878.5 920.8 980.9 1,071.1 1,216.2 1,651.9 1,378.6 1,392.9 1,427.1 1,515.5
Pref. Stock, Convertible 264.7 264.7 161.9 ‐ ‐ ‐ ‐ ‐ ‐ ‐ Common Stock 30.6 32.5 43.2 55.9 56.5 56.5 56.5 56.5 56.5 56.5 Additional Paid In Capital 155.4 185.7 346.1 530.0 559.0 559.0 559.0 559.0 559.0 559.0 Retained Earnings 145.6 178.5 255.4 388.6 558.5 737.2 922.2 1,131.2 1,372.4 1,653.9 Treasury Stock (0 5) (0 6) ‐ (0 1) (200 3) (200 3) (200 3) (200 3) (200 3) (200 3)Treasury Stock (0.5) (0.6) ‐ (0.1) (200.3) (200.3) (200.3) (200.3) (200.3) (200.3) Comprehensive Inc. and Other (35.1) (32.0) (34.0) (32.2) (17.4) (41.7) (41.7) (41.7) (41.7) (41.7) Total Equity 560.7 628.8 772.6 942.2 956.3 1,110.7 1,295.7 1,504.7 1,745.9 2,027.4
Total Liabilities And Equity 1,439.2 1,549.6 1,753.5 2,013.3 2,172.5 2,762.6 2,674.2 2,897.6 3,173.0 3,542.9
Appendix 5

Projected Balance Sheet for Phillips‐Van HeusenProjected Balance Sheet for Phillips Van HeusenDollars in millions
2003 2004 2005 2006 2007 2008 2009 2010 2011 2012Ratios and Assumptions
Historical Fiscal Year Projected Fiscal Year
Days in a year 365AR outstanding days 24.9 23.0 21.7 19.3 31.4 31.3 30.0 30.0 30.0 30.0Inventory outstanding days 86.2 99.6 92.4 98.0 95.3 81.1 105.0 95.3 95.3 95.3AP outstanding days 19.7 22.3 22.1 28.2 33.4 100.3 33.4 33.4 29.1 29.1Avg cash conversion cycle 91.4 100.3 92.0 89.1 93.4 12.2 101.6 91.9 96.2 96.2Prepaid Exp. % of rev 1.6% 1.3% 1.0% 2.1% 2.2% 2.1% 2.1% 2.1% 2.1% 2.1%p pDeferred Tax Assets, Curr. % of rev 1.1% 0.8% 1.2% 0.1% 0.0% 0.0% 0.0% 0.0% 0.0% 0.0%Other Current Assets % of rev 0.0% 0.0% 0.0% 0.4% 0.5% 0.0% 0.0% 0.0% 0.0% 0.0%Accrued Exp. % of rev 8.1% 9.0% 8.4% 10.0% 9.7% 18.3% 18.3% 18.3% 18.3% 18.3%Unearned Revenue, Current % of rev 1.3% 1.4% 1.4% 1.5% 1.6% 0.0% 0.0% 0.0% 0.0% 0.0%Def. Tax Liability, Curr. % of rev 0.0% 0.0% 0.0% 0.0% 0.1% 0.0% 0.0% 0.0% 0.0% 0.0%Def Tax Liability Non‐Curr % of rev 12 6% 12 6% 13 4% 13 6% 10 2% 10 2% 10 2% 10 2% 10 2% 10 2%Def. Tax Liability, Non‐Curr. % of rev 12.6% 12.6% 13.4% 13.6% 10.2% 10.2% 10.2% 10.2% 10.2% 10.2%Other Non‐Current Liabilities of rev 7.2% 8.5% 6.8% 6.2% 11.0% 11.0% 11.0% 11.0% 11.0% 11.0%Increase in goodwill 14.10 25.50 71.10 50.90 50.90 47.53 48.20 51.23 55.21 Increase in GW % of rev 0.9% 1.3% 3.4% 2.1% 2.1% 2.0% 2.0% 2.0% 2.0%Increase in tradenames 70.50 0.10 43.00 (2.30) (2.30) 23.8 48.2 51.2 55.2 Increase in tradenames % of rev 4.3% 0.0% 2.1% ‐0.1% ‐0.1% 1.0% 2.0% 2.0% 2.0%
i i % f & 16 % 1 9% 16 6% 16 1% 16 6% 1 0% 1 0% 13 0% 12 0% 11 0%Depreciation % of gross PP&E 16.4% 15.9% 16.6% 16.1% 16.6% 15.0% 14.0% 13.0% 12.0% 11.0%
Appendix 6

Discounted Cash Flow Valuation for Phillips‐Van HeusenDollars in millions, except per share
2003 2004 2005 2006 2007 2008 2009 2010 2011 2012After‐tax EBIT 43.7 87.4 130.2 160.9 200.4 165.0 50.7 88.6 219.8 240.8 Stock‐based compensation expense 6.9 9.6 10.6 11.6 12.8 14.1 15.5 Depreciation and Amortization 52.7 58.1 64.7 68.4 85.7 85.3 86.3 90.3 93.4 95.5
Historical Fiscal Year Projected Fiscal Year
pChange in working capital (16.5) (17.1) (3.5) (93.0) 261.3 (288.0) 40.2 (19.6) (30.4) Change in other assets and liabilities 45.0 44.2 62.1 105.6 204.4 (22.3) 17.2 49.0 77.6 Cash flow from operations 96.4 174.0 222.0 294.8 308.3 726.6 (161.6) 249.0 356.6 399.0 Capital expenditures (32.0) (46.1) (37.5) (46.2) (102.6) (52.3) (47.7) (77.7) (84.0) (90.4) Addition to intangibles (84.6) (25.6) (114.1) (48.6) (48.6) (71.3) (96.4) (102.5) (110.4) Free cash flow to the firm 43.3 158.9 134.5 157.1 625.7 (280.6) 74.9 170.2 198.1 Growth% 267.3% ‐15.3% 16.8% 298.3% ‐144.8% ‐126.7% 127.3% 16.4%PV of FCF 541 3 (242 7) 56 0 110 2 111 0PV of FCF 541.3 (242.7) 56.0 110.2 111.0 Terminal value 1,982.1 PV of terminal value 1,110.4 Firm value with all equity 1,144.9 Debt tax shield 9.4 PV of debt tax shield 60.3 Estimated firm value 1,205.2 Shares outstanding 51.5
Estimated share price 23.4Current price 17.8 Underpriced % 32%
AssumptionsRisk free rate 3.5% 30‐year T‐Bond yieldBeta 1 7 capitalIQ 5 year betaBeta 1.7 capitalIQ 5 year beta Market risk premium 7.0% historical avg and forward‐looking estimate Cost of equity 15.6% unlevered cost of equity for both equity and tax shieldTerminal growth rate 5.1% US 1981‐2007 average growth rate Tax rate 38.1%Cost of debt, pretax 6.2%Debt amount ($ millions) 399.6
Appendix 7

Dollars in millions
Description Maturity Seniority SecuredConverti
bleInterest exp.
remaining yearVanguard BBB Yield
Debentures, 7.75% due 2023 2023 Senior Yes No 7.7$ 14.0 8.5%Senior Unsecured Notes, 7.25% due 2011 2011 Senior No No 10.9$ 2.0 4.6%
$
weighted avg
interest rate
Senior Unsecured Notes, 8.125% due 2013 2013 Senior No No 12.2$ 4.0 6.2%
399.6 30.8$ 7.7% 6.2%
Appendix 8

Appendix 9
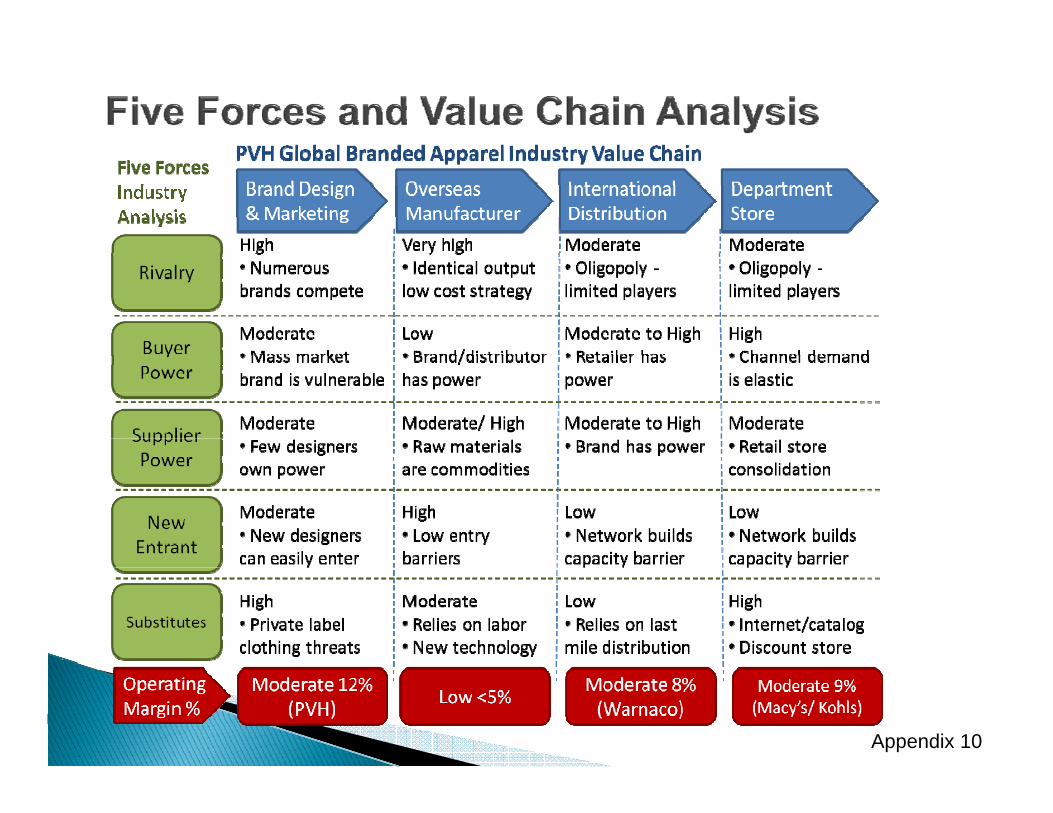
Appendix 10

Guess?Jones Apparel GroupJ pp pKenneth Cole Perry EllisRalph LaurenVF Corp. Warnaco Group
Appendix 11

Appendix 12