Embed Size (px)
Citation preview

Wyodak Power Plant
Chapter 6, Section 2 Construction Permit Application
Submitted to the Wyoming Air Quality Division And Prepared by
1407 West North Temple Salt Lake City, Utah 84116
March 2008

1
1.0 Introduction PacifiCorp Energy proposes to add new air pollution control devices that will significantly lower emissions of particulate matter (PM10), sulfur dioxide (SO2) and nitrogen oxides (NOX) at the Wyodak Power Plant located near Gillette, in Campbell County, Wyoming. The installation of this pollution control equipment requires an analysis of the air quality impacts of the projects and submittal of this construction permit application to the Wyoming Air Quality Division. Through this application, PacifiCorp Energy is seeking to:
• Obtain a Chapter 6, Section 2 construction permit for proposed Wyodak Plant projects including the installation of new pollution control devices.
• Establish plantwide applicability limits for nitrogen oxides (NOX) and sulfur dioxide
(SO2). The plantwide applicability limits (PALs) will allow the facility to conduct ongoing plant maintenance while ensuring the facility remains in compliance with New Source Review requirements. The requested PALs include:
o Establishing a NOX PAL of 5,078.0 tons/year at issuance of the construction
permit o Establishing a NOX PAL of 4,775.5 tons/year following completion of the
Wyodak boiler low-NOX projects o Establishing an SO2 PAL of 7,893.5 tons/year at issuance of the construction
permit. o Establishing an SO2 PAL of 3,333.8 tons/year following completion of the
Wyodak fabric filter baghouse installation.
• Obtain lower particulate matter emission rate limits for the Wyodak boiler. The requested PM10 limit includes:
o Establishment of a PM10 limit of 71 lb/hour following installation of the fabric filter baghouse
• Obtain a lower NOX emission rate limit for the Wyodak boiler. The requested NOX limit
includes: o Establishment of a boiler NOX limit of 0.23 lb/MMBtu on a 12-month rolling
average following installation of the low-NOX system
• Obtain a lower SO2 emission rate limit for the Wyodak boiler. The requested SO2 limit includes:
o Establishment of a boiler SO2 limit of 0.16 lb/MMBtu on a 12-month rolling average following installation of the fabric filter baghouse
o Establishment of a boiler SO2 limit of 2,115 lb/hour (0.45 lb/MMBtu x 4,700 MM/hour) on a fixed 3-hour average basis following installation of the fabric filter baghouse

2
• Because the installation of the low-NOX control system may increase emissions of carbon monoxide, and because the emissions evaluation indicates that the future potential CO emissions increase is above the PSD significance threshold of 100 tons/year, PacifiCorp requests that a CO limit be established for the Wyodak boiler. The requested limit is based on carbon monoxide emission rates utilizing good combustion control methods on the boiler following the low-NOX control system installation. The requested carbon monoxide limit includes:
o Establishment of a CO limit of 0.25 lb/MMBtu, 1,175 lb/hour, on a 30-day rolling
average following completion of the low-NOX control system The planned Wyodak pollution control equipment projects are identified in the following table: Table 1.0: Wyodak Pollution Control Equipment Projects
Wyodak Boiler Installation of a fabric filter baghouse to replace an electrostatic precipitator Installation of a low-NOX control system
1.1 Existing Operations PacifiCorp Energy is 80 percent owner as well as the operator of the Wyodak Power Plant which consists of one 335 net MW (nominal) electric generating unit. The Wyodak plant went into commercial operation in September 1978. The Wyodak Power Plant is an existing major stationary source of air emissions under both the New Source Review and Title V programs. The Wyodak boiler has a maximum heat input rate of 4,700 MMBtu/hour.
1.2 Emissions Analysis The emission control projects proposed in this construction permit application include the installation of fabric filter baghouse to replace the existing electrostatic precipitator and the installation of a low-NOX control system. The installation of the fabric filter baghouse will allow increased sulfur dioxide (SO2) removal rates from the existing flue gas desulfurization system. These projects will result in improved particulate matter removal rates, reduced SO2 emission rates and reduced NOX emission rates for the Wyodak facility. To establish a clear baseline for determining when PSD requirements may be triggered in the future, PacifiCorp is proposing to establish plantwide applicability limits for SO2 and NOX that would limit plantwide emissions of these pollutants at the facility to the “past actual baseline emissions” as defined by the Environmental Protection Agency’s (EPA) “past actual to future actual emissions test.” The plantwide applicability limits would be in addition to the new, lower unit-specific limits to be established as a result of adding the proposed air pollution control devices. Establishing plantwide limits for SO2 and NOX
3
will ensure that any proposed project will not cause an associated emissions increase of these specific pollutants. 1.3 Prevention of Significant Deterioration Review The Wyodak Plant is located in an area classified as attainment for all criteria pollutants and is a listed PSD Source Category; therefore, the requirements of the federal PSD program, as administered by the Wyoming Department of Environmental Quality and the Wyoming Division of Air Quality will apply to the projects specified in this Chapter 6, Section 2 construction permit application. As a result of the PSD review described in more detail below, PacifiCorp has concluded that there will not be a “significant net emissions increase” as defined in 40 CFR Part 52 and WAQSR Chapter 6 Section 4 for SO2, NOX, PM10, lead, hydrogen fluoride, sulfuric acid, or VOCs; therefore, a BACT review for these pollutants will not be required. PacifiCorp has included a BACT review for carbon monoxide. 1.4 Compliance with National Ambient Air Quality Standards for Class
I and Class II Areas and NSPS After completing the planned projects the Wyodak Power Plant will meet all National Ambient Air Quality Standards (NAAQS) and the Class I and Class II PSD increments in the vicinity of the facility. A dispersion modeling analysis will be performed for CO which has the potential of a significant net emissions increase. At the request of the Wyoming Department of Environmental Quality a NAAQS impact analysis for all criteria pollutants will be performed including SO2, NOX, HF, CO, PM10 and lead at post-pollution control equipment project emission rates. The facility will meet the applicable New Source Performance Standards (NSPS) defined in the federal regulations at 40 CFR 60 Subpart D and Wyoming Air Quality Standard and Regulations Chapter 5, Section 2.
2.0 Project Description
PacifiCorp plans to install pollution control equipment and implement other plant projects between January 2009 and December 2011 as reflected in the project timeline shown in Table 2.1. These projects are listed in Appendix A. The projects identified are based on current plans and may be refined as overhaul schedules and equipment status change. Additional information will be provided to the Wyoming Division of Air Quality as PacifiCorp further refines the project schedule and scope.
The planned Wyodak Plant projects are summarized as follows:

4
Wyodak Projects
• Installation of a fabric filter baghouse to replace the existing electrostatic precipitator
• Installation of a boiler low-NOX control system
• Steam turbine overhaul
• Plant projects listed in Appendix A
Table 2.1 contained on the following page identifies the planned Wyodak Power Plant project schedule from 2008 through 2014. Table 2.1 includes major plant maintenance projects as well as pollution control equipment installations.

5
Table 2.1: Wyodak Project Schedule
steam turbine overhaulinstall boiler low-NOX systeminstall fabric filter baghouse
Major 2009 ProjectsInstall Bottom Ash PondInstall Reverse Osmosis Skid
Major 2011 ActivitiesOverhaul HP/IP/LP Steam TurbineRewind GeneratorInstall Fabric Filter BaghouseInstall Low-NOX System
2011 Wyodak Outage: March 5 - April 16
January 1, 2008 January 1, 2009 January 1, 2010 January 1, 2011 January 1, 2012 January 1, 2013 January 1, 2014 January 1, 2015
April 1 April 1 April 1 April 1 April 1 April 1 April 1
July 1 July 1 July 1 July 1 July 1 July 1 July 1
October 1 October 1 October 1 October 1 October 1 October 1October 1

6
3.0 List of Potential Air Emission Points and Air Contaminants Emissions Summary The Wyodak Power Plant currently operates under Title V operating permit 3-1-101-1. The operating permit has incorporated all applicable requirements contained in the following permits: MD-1177, MD-1079, waiver AP-3436, and the Chapter 6, Section 2 waivers issued January 19, 1996 and October 5, 1997. The facility’s Title V permit identifies the facility’s emission points and potential air contaminants.
4.0 Evaluation of Historic and Future Emission Rates
4.1 Project Description
This section presents the method for conducting various PSD evaluations, including:
• A determination of baseline actual emissions for SO2, NOX, PM10, CO, ozone (as non-methane VOCs), fluoride (as hydrogen fluoride), lead, and sulfuric acid.
• A determination of projected actual emissions of SO2, NOX, PM10, CO, VOCs,
fluorides, lead, and sulfuric acid. • A comparison between the CO, PM, VOCs, fluorides, lead, and sulfuric acid past
actual baselines and future potential emissions to determine if PSD significance levels are triggered.
This section also sets forth the proposed plantwide applicability limits for SO2 and NOX. The evaluation of historic (baseline) and future potential pollutant emission rates are contained in Appendix B of this permit application.
4.2 Baseline Actual Emissions
The pollutants of interest for this review are SO2, NOX, PM10, CO, VOCs, fluorides, lead, and sulfuric acid.
4.2.1 Calculation of Baseline Actual Emissions
40 CFR 52.21(b)(48)(i) describes baseline actual emissions for the Wyodak Power Plant as follows: Baseline actual emissions means the rate of emissions, in tons per year, of a regulated NSR pollutant, as determined in accordance with paragraphs (b)(48)(i) through (iv) of this section.
7
(i) For any existing electric utility steam generating unit, baseline actual emissions means the average rate, in tons per year, at which the unit actually emitted the pollutant during any consecutive 24-month period selected by the owner or operator within the 5-year period immediately preceding when the owner or operator begins actual construction of the project. The Administrator shall allow the use of a different time period upon a determination that it is more representative of normal source operation.
(a) The average rate shall include fugitive emissions to the extent quantifiable, and emissions associated with startups, shutdowns, and malfunctions. (b) The average rate shall be adjusted downward to exclude any non-compliant emissions that occurred while the source was operating above any emission limitation that was legally enforceable during the consecutive 24-month period. (c) For a regulated NSR pollutant, when a project involves multiple emissions units, only one consecutive 24-month period must be used to determine the baseline actual emissions for the emissions units being changed. A different consecutive 24-month period can be used for each regulated NSR pollutant. (d) The average rate shall not be based on any consecutive 24-month period for which there is inadequate information for determining annual emissions, in tons per year, and for adjusting this amount if required by paragraph (b)(48)(i)(b) of this section.
To identify and calculate baseline actual emissions, PacifiCorp has used data from the EPA Clean Markets Division’s emissions data base. In order to comply with the EPA’s acid rain program, PacifiCorp utilizes continuous emissions monitors (CEMs) to report hourly SO2 and NOX emissions for the boiler at the Wyodak facility. CEMs are also used to obtain and report the hourly heat input rate into the Wyodak boiler. The hourly emissions and heat input data is submitted to the EPA on a quarterly basis and is readily available on the EPA’s website located at http://cfpub.epa.gov/gdm/. For purposes of this review the 5-year evaluation period is from January 2003 through December 2007. The baseline actual emissions are summarized in Table 4.2.

8
SO2 Emissions Appendix B, Table WYO-1 identifies the monthly SO2 emissions for the relevant time period. This data was obtained from the Environmental Protection Agency’s (EPA) Acid Rain Emissions database for stack emissions and from the Wyodak Plant’s annual emissions inventory for non-stack emissions. The monthly data and emissions inventory data was used to calculate the maximum past actual annual plant SO2 emission rate of 7,853.5 tons/year. The maximum past actual Wyodak stack SO2 emission rate of 7,853.5 tons/year does not include any SO2 emissions in excess of the applicable 3-hour limit of 0.5 lb/MMBtu during the 24-month evaluation period from May 2004 through April 2006. NOX Emissions Appendix B, Table WYO-3 identifies the monthly NOX emissions for the relevant time period. This data was obtained from the Environmental Protection Agency’s (EPA) Acid Rain Emissions database for stack emissions and from the Wyodak Plant’s annual emissions inventory for non-stack emissions. The monthly data and emissions inventory data was used to calculate the maximum past actual annual plant NOX emission rate of 5,038.0 tons/year. There were no NOX
emissions in excess of the applicable 3-hour limit of 0.70 lb/MMBtu during the 24-month evaluation period from May 2004 through April 2006. Particulate Matter Emissions Appendix B, Table WYO-7 identifies the monthly PM10 emissions for the relevant time period. The facility PM10 emission rates are based on annual stack test data, in units of lb/MMBtu multiplied by the monthly boiler heat input values identified in the EPA’s Acid Rain Emissions database to calculate the stack emission rate. The Wyodak Plant’s annual emissions inventory database was used to identify the maximum non-stack emission rate. As indicated in Table WYO-7, the Wyodak Plant had a maximum past actual 5-year PM10 emission rate of 374.0 tons/year. Carbon Monoxide Carbon monoxide emissions for the boiler have been determined by multiplying the past annual coal consumption (Appendix B, Table WYO-6) by the AP-42 emission factor for carbon monoxide emissions from coal fired boilers. The maximum non-stack carbon monoxide emission rates were obtained from the Wyodak Plant’s annual emissions inventory database. The maximum past actual total Wyodak CO emission rate was 510.3 tons/year. The results of the past actual CO emissions evaluation is contained in Appendix B, Table WYO-15.

9
Volatile Organic Compounds Volatile organic compound emissions for the boiler have been determined by multiplying the past annual coal consumption (Appendix B, Table WYO-6) by the AP-42 emission factor for volatile organic compounds emissions from coal fired boilers. The maximum non-stack VOC emission rates were obtained from the Wyodak Plant’s annual emissions inventory database. The maximum past actual total Wyodak VOC emission rate was 61.2 tons/year. The results of the past actual VOC emissions evaluation is contained in Appendix B, Table WYO-17. Lead Emissions Lead emissions have been determined from the average past annual lead concentration of the coal burned, the average past annual coal ash concentration, the annual particulate matter emission rate, the annual boiler heat input rate (Appendix B, Table WYO-5) and the Method specified in AP-42 for determining lead emissions from coal fired boilers. The maximum past actual Wyodak emission rate was 0.05 tons/year. The result of the past actual lead emissions evaluation is contained in Appendix B, Table WYO-13. Fluoride Emissions Fluoride emissions, as hydrogen fluoride, have been determined from the 5-year average annual fluorine concentrations contained in coal burned at the Wyodak Plant and from the past actual annual coal burn rate as indicated in Table WYO-6. The Electric Power Research Institute (EPRI) LARK-TRIPP method for the determination of hydrogen fluoride (HF) emissions was used to calculate the maximum past actual annual HF emission rate of 13.0 tons/year as indicted in Table WYO-9. Sulfuric Acid Emissions Sulfuric acid emissions are calculated using past actual annual coal sulfur concentrations, past actual annual heat input rates (WYO-5) and Electric Power Research Institute’s Estimating Total Sulfuric Acid Emissions from Stationary Power Plants, Technical Update, April 2007 method for calculating H2SO4 emissions. The maximum past actual Wyodak sulfuric acid emission rate was 0.3 tons/year. The result of the past actual sulfuric acid emissions evaluation is contained in Appendix B, Table WYO-11.
Table 4.2 indicates the annual past actual baseline emission rates for the Wyodak Plant pollutants identified above. Table 4.2: Summary of Wyodak Baseline (Past Actual) Emissions
Wyodak SO2 tons/year
NOX tons/year
PM10 tons/year
HF tons/year
H2SO4 tons/year
Lead tons/year
CO tons/year
VOC tons/year
Boiler Stack Emissions 7,853.5 5,038.0 374.0 13.0 0.3 0.05 510.3 61.2
10
4.3 Projected Actual Emissions for Prevention of Significant Deterioration Pollutants
The next step in the emission rate evaluation is to projected actual emission rates for each pollutant. This is accomplished by determining the projected actual emissions based on coal quality, unit utilization, addition of pollution controls and expected emission rates. Projected actual emissions are defined as follows:
40 CFR 52.21(b)(41)(i) Projected actual emissions means the maximum annual rate, in tons per year, at which an existing emissions unit is projected to emit a regulated NSR pollutant in any one of the 5 years (12-month period) following the date the unit resumes regular operation after the project, or in any one of the 10 years following that date, if the project involves increasing the emissions unit’s design capacity or its potential to emit that regulated NSR pollutant and full utilization of the unit would result in a significant emissions increase or a significant net emissions increase at the major stationary source.
(ii) In determining the projected actual emissions under paragraph (b)(41)(i) of this section (before beginning actual construction), the owner or operator of the major stationary source:
(a) Shall consider all relevant information, including but not limited to, historical operational data, the company’s own representations, the company’s expected business activity and the company’s highest projections of business activity, the company’s filings with the State or Federal regulatory authorities, and compliance plans under the approved State Implementation Plan; and (b) Shall include fugitive emissions to the extent quantifiable and emissions associated with startups, shutdowns, and malfunctions; and (c) Shall exclude, in calculating any increase in emissions that results from the particular project, that portion of the unit’s emissions following the project that an existing unit could have accommodated during the consecutive 24-month period used to establish the baseline actual emissions under paragraph (b)(48) of this section and that are also unrelated to the particular project, including any increased utilization due to product demand growth; or (d) In lieu of using the method set out in paragraphs (a)(41)(ii)(a) through (c) of this section, may elect to use the emissions unit’s potential to emit, in tons per year, as defined under paragraph (b)(4) of this section.
PacifiCorp has proposed to accept plantwide applicability limits (PALs) for SO2 and NOX which are based on the Wyodak Plant’s past actual baseline emission rates and on future potential emission rates based on new, lower SO2 and NOX emission limitations. With

11
these caps in place there is no potential that future emissions will be greater than past actual emissions, and no additional evaluation of future emissions is required.
4.3.1 Calculation Projected Annual Emissions
Under the provisions of 40 CFR 52.21(b)(41)(ii)(d) PacifiCorp has elected to determine the future emission rates of SO2, NOX, PM10, fluoride (as HF), sulfuric acid, lead, CO and VOCs based on the facility’s potential to emit these pollutants. The future annual emission rates are based on applicable pollutant emission limitations – at existing or requested future emission limits – as well as on a maximum annual boiler operating time of 8,760 hours/year and a boiler heat input rate of 4,700 MMBtu/hour. The facility’s average 5-year unit-specific coal heating values, in units of Btu/lb are used to calculate the maximum annual coal burn rates based on the maximum 4,700 MMBtu boiler heat input rate indicated above. Finally, where applicable, EPA AP-42 emission factors are used to calculate future potential pollutant emission rates. Boiler Heat Input The boiler heat input rate is used to calculate future potential emission rates at applicable pollutant emission limitations or, where appropriate, using EPA AP-42 emission factors. Other valid emission calculation methods, such as LARK-TRIPP was used to calculate HF and H2SO4 emission rates. A review of the EPA’s Clean Air Markets Acid Rain database was used to identify the Wyodak Plant’s maximum boiler heat input rates for the 5-year evaluation period used for this construction permit application. An evaluation of the Acid Rain database indicates a maximum boiler heat input rate of 4,700 MMBtu/hour. Coal Burn The Boiler coal burn rates are used to calculate some future potential emission rates – such as hydrogen fluoride and carbon monoxide – using appropriate AP-42 emission factors. The maximum future potential coal burn rate was calculated based on the 5-year average coal heating content values and in the maximum boiler heat input rate of 4,700 MMBtu/hour identified above. A 5-year review of the Wyodak Plant’s most recent (2002-2006) coal heating content data indicates that the boiler had an average coal heating value of 8,029.2 Btu/lb. The maximum future annual coal burn rate can then be calculated using the average coal heating content value of 8,029.2 Btu/lb; the maximum boiler heat input rate of 4,700 MMBtu/hour; and a maximum annual boiler operating time of 8,760 hours/year. Using these data and appropriate conversion factors provides a maximum future annual boiler coal burn rate of 2,563,892 tons/year as indicated in Table WYO-10.

12
Sulfur Dioxide (SO2) Emissions In this construction permit application PacifiCorp is requesting that a PAL be established for SO2 at issuance of the construction permit equivalent to the maximum past actual baseline emission rate of 7,853.5 tons/year plus the PSD significance threshold of 40 tons/year. Thus, an SO2 PAL of 7,893.5 tons/year is requested at issuance of the construction permit. Furthermore, PacifiCorp requests that a new SO2 PAL equivalent to 3,333.8 tons/year be established following construction of the fabric filter baghouse and implementation of the requested 12-month rolling average SO2 emission limit of 0.16 lb/MMBtu. The future potential SO2 emission rate of 0.16 lb/MMBtu; the maximum boiler heat input rate of 4,700 MMBtu/hour; the maximum past actual non-stack emission rate of 0.0 tons/year; and the PSD significance level of 40 tons/year were used to establish the requested SO2 PAL value of 3,333.8 tons/year as indicated in Table WYO-2. Nitrogen Oxides (NOX) Emissions In this construction permit application PacifiCorp is requesting that a PAL be established for NOX at issuance of the construction permit equivalent to the maximum past actual baseline emission rate of 5,038.0 tons/year plus the PSD significance threshold of 40 tons/year. Thus, a NOX PAL of 5,078.0 tons/year is requested at issuance of the construction permit. Furthermore, PacifiCorp requests that a new NOX PAL equivalent to 4,775.5 tons/year be established following installation of the low-NOX burner system and implementation of the requested 12-month rolling average NOX emission limit of 0.23 lb/MMBtu. The future potential NOX emission rate of 0.23 lb/MMBtu; the maximum boiler heat input rate of 4,700 MMBtu/hour; the maximum past actual non-stack emission rate of 0.8 tons/year; and the PSD significance level of 40 tons/year were used to establish the requested NOX PAL value of 4,775.5 tons/year as indicated in Table WYO-4. Particulate Matter Emissions The post-pollution control fabric filter baghouse project PM10 emission limit of 0.015 lb/MMBtu and boiler heat input value 4,700 MMBtu/hour was used to calculate the future potential exhaust stack particulate matter emission rate of 308.8 tons/year as indicated in Table WYO-8. Following installation of the requested fabric filter baghouse Wyodak will have a boiler PM10 limit of 71 lb/hour (based on an emission rate of 0.015 lb/MMBtu at a boiler heat input rate of 4,700 MMBtu/hour). Issuance of the requested PM10 emission limit, on a lb/hour basis, will ensure that future potential PM10 emissions are equal-to-or-less-than the maximum past actual emission rate of 327.5 tons/year identified in the 5-year emissions evaluation performed for this construction permit application as indicated in Table WYO-7.

13
Following installation of the fabric filter baghouse, the Wyodak boiler will have a future potential PM10 emission rate of 308.8 tons/year based on a boiler heat input of 4,700 MMBtu/hour and an emission limit of 0.015 lb/MMBtu. The boiler stack PM10 emission rate of 308.8 tons/year and the maximum non-stack PM10 emission rate of 46.5 tons/year provide a future total particulate matter emission rate of 355.3 tons/year as indicated in Table WYO-8. Carbon Monoxide Emissions PacifiCorp is requesting that a Wyodak carbon monoxide (CO) emission limit of 0.25 lb/MMBtu be established following installation of a low-NOX control system on the facility boiler. A maximum future potential CO emission rate of 5,146.6 tons/year was calculated based on the requested emission limit of 0.25 lb/MMBtu, boiler heat input rate of 4,700 MMBtu/hour and maximum non-stack emission rate of 0.1 tons/year as identified in Table WYO-16. Volatile Organic Compound Emissions The maximum future potential volatile organic compound (VOC) emission rate was calculated based on the applicable AP-42 emission factor; on the maximum future potential coal burn rate; and on non-stack VOC emission rates. The applicable VOC emission factor for coal-fired boilers is equivalent to 0.06 lb/ton of coal burned; the maximum future potential Wyodak coal burn rate is equivalent to 2,563,892 tons/year; and the maximum non-stack VOC emission rate is 0.0 tons/year. Multiplying the 0.06 lb/ton VOC emission factor by the maximum coal burn rate and adding the non-stack emission rate establishes a maximum future potential Wyodak Plant stack VOC emission rate of 76.9 tons/year as indicated in Table WYO-18. Lead Emissions The maximum future potential lead emission rate was calculated based on the applicable AP-42 emission factor for coal-fired boilers and on 5-year average Wyodak data including coal lead concentrations, coal ash concentrations, the post-pollution control project PM10 emission rate, and on the future potential boiler heat input rate. Utilizing the appropriate AP-42 emission factor from EPA Table 1.1-16 and an average coal lead concentration of 3.60 ppm; average coal ash content of 7.01%; PM10 emission rate of 0.015 lb/MMBtu; and future potential heat input rate of 41,172,000 MMBtu/year establishes a maximum future potential Wyodak lead emission rate of 0.06 tons/year as indicated in Table WYO-14.

14
Fluoride Emissions The maximum future potential fluoride emission rate, as hydrogen fluoride, has been determined from the Wyodak Plant’s 5-year average annual coal fluoride concentration, from the elimination of SO2 scrubber bypass following installation of the fabric filter baghouse, and from the maximum future potential annual coal burn rate. The EPRI LARK-TRIPP method was used to calculate the maximum future potential HF emission rate of 10.7 tons/year as indicated in Table WYO-10. Sulfuric Acid Emissions EPRI’s Estimating Total Sulfuric Acid Emissions from Stationary Power Plants, Technical Update, April 2007 method was used to calculate the Wyodak Plant’s maximum future potential H2SO4 emission rate. The future potential sulfuric acid emission rate was calculated based on the 5-year average annual coal sulfur concentration; the future potential boiler heat input value as indicated in Table WYO-10; and the installation of a fabric filter baghouse. Using the EPRI calculation method and future potential heat input value and average 5-year coal sulfur concentration provides a maximum future potential Wyodak Plant H2SO4 emission rate of 0.0 tons/year as indicated in Table WYO-12.
Table 4.3 indicates the annual future potential emission rates for the Wyodak Plant pollutants identified above. Table 4.3: Summary of Wyodak Future Potential Emissions
Wyodak SO2 tons/year
NOX tons/year
PM10 tons/year
HF tons/year
H2SO4 tons/year
Lead tons/year
CO tons/year
VOC tons/year
Boiler Stack Emissions 3,293.8 4,735.5 355.3 10.7 0.0 0.06 5,146.6 76.9

15
4.3.2 Prevention of Significant Deterioration Significance
Determination
In order to determine if a Prevention of Significant Deterioration (PSD) significance level has been reached the past actual baseline emissions for each pollutant is subtracted from the projected annual emissions. If a significance level has been exceeded for a pollutant then a Prevention of Significant Deterioration review must be performed for that pollutant. PacifiCorp is requesting that the “past actual to future potential actual” emissions test specified in the December 2002 revisions to the New Source Review rules [40 CFR 52.21(aa) and WAQSR Chapter 6, Section 4] be used to establish Plantwide Applicability Limitations (PALs) for SO2 and NOX at the Wyodak Plant. These plantwide annual emission limits will be imposed to assure, through federal enforceability, that the future Potential to Emit for the facility, as a whole, will be no greater than historical emissions. Therefore, there will be no net emissions increase of sulfur dioxide or nitrogen oxides as defined as “significant” [40 CFR 52.21(b)(23)] with respect to PSD review of these pollutants under the provisions of a PSD “major modification” [40 CFR 52.21(b)(2)(i)]. PSD review will apply to the other regulated pollutants for which there is a net increase defined as significant [40 CFR 52.21(b)(23)]. As noted in Section 1.0, at issuance of the construction permit PacifiCorp requests that NOX and SO2 PALs be established at values equivalent to the maximum past actual emission rates plus 40 ton/year PSD significance thresholds. Thus, at issuance of the construction permit a NOX PAL of 5,078.0 tons/year and an SO2 PAL of 7,893.5 tons/year year is requested for the Wyodak Plant. Furthermore, following completion of the fabric filter baghouse installation and low-NOX burner project PacifiCorp requests that new NOX and SO2 PALs be implemented at values established from the 12-month rolling average SO2 emission limit of 0.16 lb/MMBtu, NOX limit of 0.23 lb/MMBtu, maximum boiler heat input rate of 4,700 MMBtu/hour; maximum past actual non-stack emission rates; and PSD significance thresholds of 40 tons/year. Thus, following completion of the fabric filter baghouse installation and low-NOX burner project, PacifiCorp requests that a NOX PAL of 4,775.5 tons/year and an SO2 PAL of 3,333.8 tons/year be established at the Wyodak Plant. In order to determine if a Prevention of Significant Deterioration significance level has been reached the past actual baseline emissions for each pollutant is subtracted from the projected annual emissions. If a significance level has been exceeded for a pollutant then a Prevention of Significant Deterioration review must be performed for that pollutant.

16
4.3.3 Contemporaneous Period and Pre-Project Actual Emissions 4.3.3.1 Definition of a “Major Modification” An existing major source is subject to Prevention of Significant Deterioration review only if it undertakes a “major modification” [40 CFR 52.21(b)(2)(i)] and WAQSR Chapter 6, Section 2]. “Major modification” is defined as “any physical change in or change in the method of operation of a major stationary source that would result in a significant net emissions increase of any pollutant subject to regulation under Clean Air Act” [40 CFR 52.21(b)(23) and WAQSR Chapter 6, Section 2]. A major modification does not include: routine maintenance, repair and replacement [40 CFR 52.21(b)(2)(iii)(a) and WAQSR Chapter 6, Section 2] or an increase in the hours of operation or in the production rate [40 CFR 52.21(b)(2)(iii)(f) and WAQSR Chapter 6, Section 2].
To determine if a Prevention of Significant Deterioration significance level has been reached the baseline actual emissions are subtracted from the projected actual emissions. The results of this evaluation for each pollutant are shown in Table 4.3.

17
Table 4.4: Evaluation of Significance Level by Pollutant
Pollutant
Past Actual (Baseline) Emissions tons/year
Projected Actual (Future Annual)
Emissions tons/year
Projected Actual minus
Past Actual Emissions (Emission Increase)
tons/year
PSD Review Significance Level
tons/year
Is Emission Increase greater than
PSD Significance Level
SO2 7,853.5 3,293.8 -4,559.7 40 No
NOX 5,038.0 4,735.5 -302.4 40 No
PM10 374.0 355.3 -18.8 15 No
Hydrogen Fluoride (HF) 13.0 10.7 -2.3 3 No
Sulfuric Acid (H2SO4)
0.3 0.0 -0.2 7 No
Lead 0.05 0.06 0.01 0.6 No
Carbon Monoxide (CO) 510.3 5,146.6 4,636.3 100 Yes
VOC 61.2 76.9 15.7 40 No

18
4.3.3.2 Determination of Major Modification Although the proposed projects may constitute a physical change at the plant, they will not result in significant net emissions increases of SO2, NOX, particulate matter, hydrogen fluoride, sulfuric acid, lead or VOCs and therefore are not major modifications for these pollutants. The results of the emissions evaluation indicate that future potential emissions of CO may increase above the PSD significance level.
4.4 Requested Emission Rate Limits
This section identifies the requested emission rate limits for the Wyodak Plant following completion of the proposed pollution control equipment projects.
Particulate matter = 10 microns (filterable): • 71 lb/hour, annual average (4,700 MMBtu/hr x 0.015 lb/ MMBtu)
This limit will go into effect within 90 days following completion of the installation of the fabric filter baghouse. The fabric filter baghouse installation is planned to occur in 2011. Sulfur dioxide:
• 0.16 lb/MMBtu, 12-month rolling average • 2,115 lb/hour, fixed 3-hour basis
These limits will go into effect within 90 days after the fabric filter baghouse has been completed and deemed commercial. The expected commercial date is 2011. After successful testing the equipment will be deemed commercial. Nitrogen oxides:
• 0.23 lb/MMBtu, annual average This limit will go into effect within 90 days after the low-NOX burners have been installed, tested and deemed commercial. The expected installation date is 2011. After successful testing the equipment will be deemed commercial. Carbon monoxide:
• 0.25 lb/MMBtu, 1,175 lb/hour, 30-day rolling average This limit will go into effect within 90 days after the low-NOX burners have been installed, tested and deemed commercial. The expected installation date is 2011. After successful testing the equipment will be deemed commercial.
19
Plantwide Applicability Limitations As indicated in Section 1.0 of this application, PacifiCorp Energy is requesting that SO2 and NOX Plantwide Applicability Limitations (PALs) be established at the Wyodak Plant following issuance of the requested construction permit. The following federally enforceable annual plantwide emission limits are requested for SO2 and NOX. These limits are based on the highest 24 consecutive month average NOX and SO2 emission rate in the previous 60 month period, future potential NOX and SO2 emission rates; and NOX and SO2 PSD significance threshold values of 40 tons/year.
• At issuance of the construction permit it is requested that a NOX Plantwide Applicability Limitation of 5,078.0 tons/year be established at the facility. At issuance of the requested PAL the 5,078.0 ton/year NOX limitation will be validated monthly on a 12-month rolling average basis.
• Following completion and certification of the boiler low-NOX project it is
requested that a NOX PAL be established at a rate of 4,775.5 tons/year.
• At issuance of the construction permit it is requested that an SO2 Plantwide Applicability Limitation of 7,893.5 tons/year be established at the facility. At issuance of the requested PAL the 7,893.5 ton/year SO2 limitation will be validated monthly on a 12-month rolling average basis.
• Following completion and certification of the fabric filter baghouse it is
requested that an SO2 PAL be established at a rate of 3,333.8 tons/year.
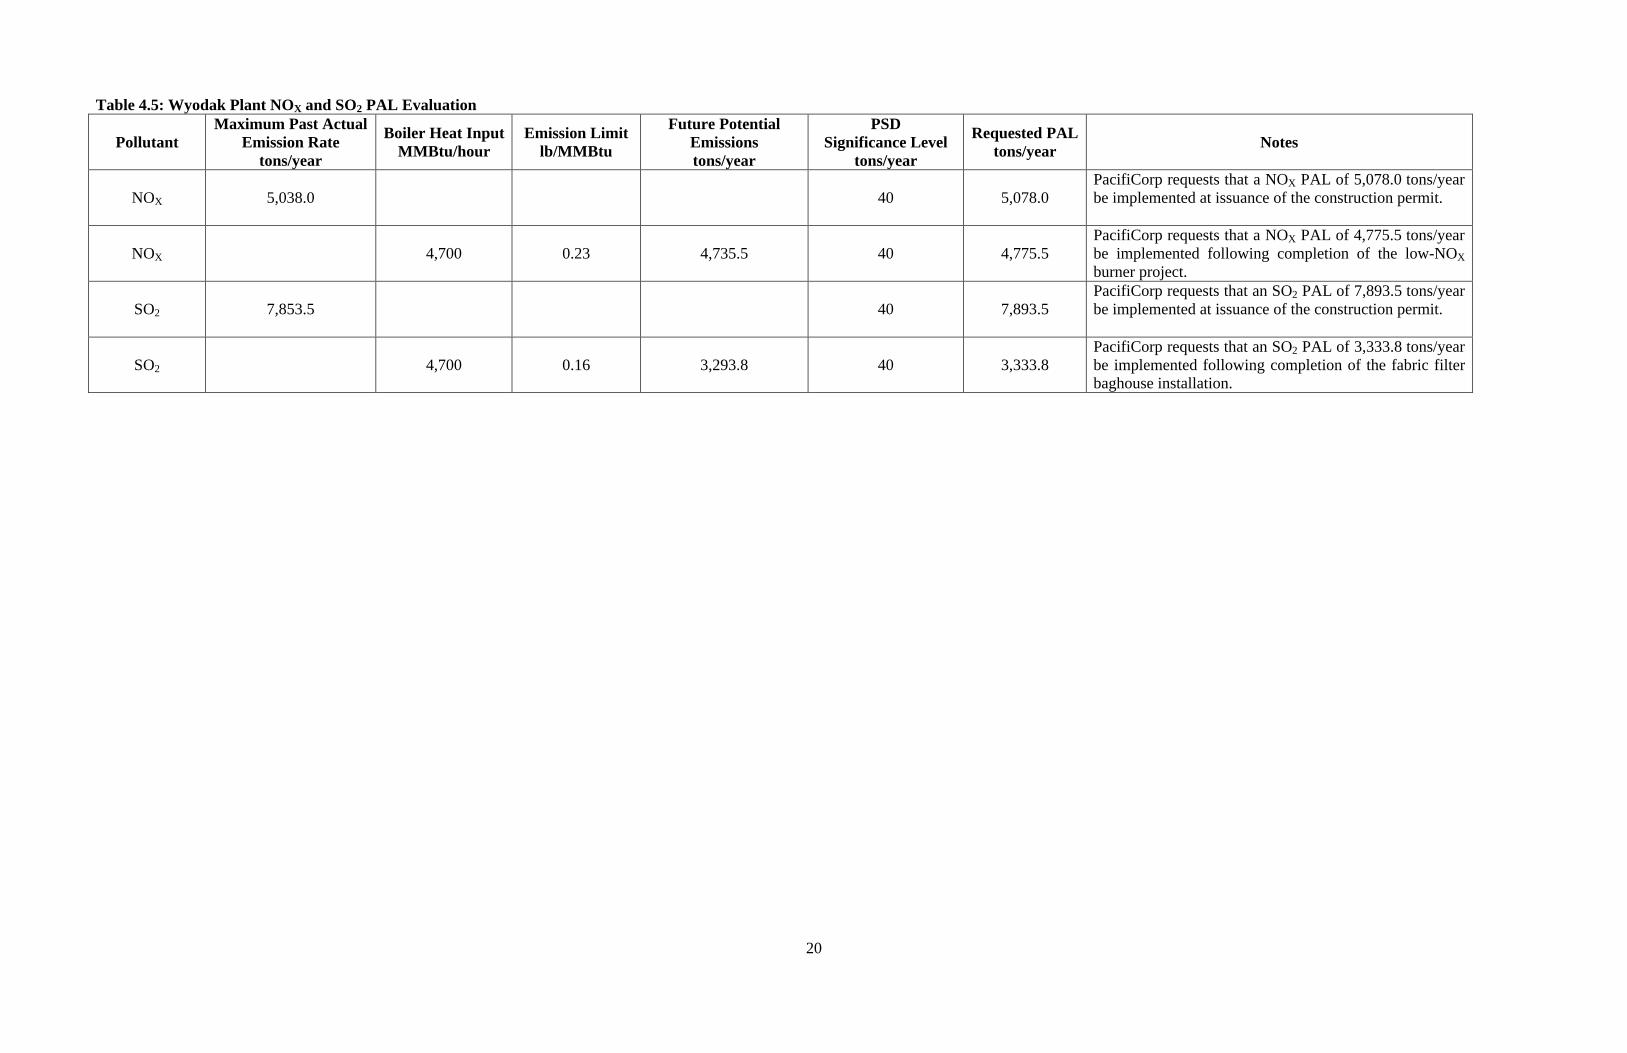
The following page containing Table 4.5 summarizes the emissions data and PSD significance values used to establish the requested NOX and SO2 PAL values for the Wyodak Power Plant. Table 4.6 contained on page 21 provides a summary of the past actual and future potential stack emission rates for NOX, SO2, PM10, HF, H2SO4, lead, CO and VOC and includes a chronology of the requested emission limits to be implemented at the Wyodak Plant.
20
Table 4.5: Wyodak Plant NOX and SO2 PAL Evaluation
Pollutant Maximum Past Actual
Emission Rate tons/year
Boiler Heat Input MMBtu/hour
Emission Limit lb/MMBtu
Future Potential Emissions tons/year
PSD Significance Level
tons/year
Requested PAL tons/year Notes
NOX 5,038.0 40 5,078.0 PacifiCorp requests that a NOX PAL of 5,078.0 tons/year be implemented at issuance of the construction permit.
NOX 4,700 0.23 4,735.5 40 4,775.5 PacifiCorp requests that a NOX PAL of 4,775.5 tons/year be implemented following completion of the low-NOX burner project.
SO2 7,853.5 40 7,893.5 PacifiCorp requests that an SO2 PAL of 7,893.5 tons/year be implemented at issuance of the construction permit.
SO2 4,700 0.16 3,293.8 40 3,333.8 PacifiCorp requests that an SO2 PAL of 3,333.8 tons/year be implemented following completion of the fabric filter baghouse installation.

21
Table 4.6: Wyodak Emissions Summary – Past Actual vs. Future Potential and Emission Limit Chronology
Pollutant/Parameter Table Reference PSD Significance Level Is PSD Triggered
SO2Tables WYO-1, WYO-1a
and WYO-27,853.5 tons/year 3,293.8 tons/year -4,559.7 tons/year 40 tons/year No
NOX Tables WYO-3 and WYO-4 5,038.0 tons/year 4,735.5 tons/year -302.4 tons/year 40 tons/year No
Heat Input Tables WYO-5 and WYO-10 33,919,881 MMBtu/year 41,172,000 MMBtu/year
Coal Burn Tables WYO-6 and WYO-10 2,040,782 tons/year 2,563,892 tons/year
Particulate Matter(Stack and Non-Stack)
Tables WYO-7 and WYO-8 374.0 tons/year 355.3 tons/year -18.8 tons/year25 tons/year
(15 tons/year for PM10)No
Hydrogen Fluoride Tables WYO-9 and WYO-10 13.0 tons/year 10.7 tons/year -2.3 tons/year 3 tons/year (fluoride) No
Sulfuric Acid Tables WYO-11 and WYO-12 0.3 tons/year 0.0 tons/year -0.2 tons/year 7 tons/year No
Lead Tables WYO-13 and WYO-14 0.05 tons/year 0.06 tons/year 0.01 tons/year 0.6 tons/year No
Carbon Monoxide Tables WYO-15 and WYO-16 510.3 tons/year 5,146.6 tons/year 4,636.3 tons/year 100 tons/year Yes
VOC Tables WYO-17 and WYO-18 61.2 tons/year 76.9 tons/year 15.7 tons/year 40 tons/year No
Note: Carbon monoxide is the only pollutant that has a post-project emission increase above its PSD significance level.
Permit Assumption Timeline:
2008: Upon Issuance of Construction Permit(a) A 5,078.0 ton/year NOX Plantwide Applicability Limit (PAL) becomes effective at issuance of construction permit.
(b) A 7,893.5 ton/year SO2 Plantwide Applicability Limit (PAL) becomes effective at issuance of construction permit.
2011: Upon Certification of Pollution Control Equipment(a) Wyodak will be subject to a 12-month rolling average NOX limitation of 0.23 lb/MMBtu
(b) Wyodak will be subject to a 12-month rolling average SO2 limitation of 0.16 lb/MMBtu
(c) Wyodak will be subject to a 3-hour fixed block average SO2 limitation of 2,115 lb/hour(d) Wyodak will be subject to a CO limitation of 0.25 lb/MMBtu, 1,175 lb/hour on a 30-day rolling average(e) The Wyodak Plant will be subject to a NOX PAL of 4,775.5 tons/year
(f) The Wyodak Plant will be subject to an SO2 PAL of 3,333.8 tons/year
(g) The Wyodak Plant will be subject to a PM10 limitation of 71 lb/hour (0.015 lb/MMBtu) within 90 days following the completion of the fabric filter baghouse installation
Maximum Past Actual Rate
Maximum Future Potential RateEmission Rate
Increase/Decrease

22
5.0 Description of Pollution Control Equipment 5.1 Sulfur Dioxide 5.1.1 Fabric Filter Baghouse PacifiCorp will replace the existing electrostatic precipitator in 2011 with a fabric filter baghouse. The installation of the fabric filter baghouse will eliminate flue gas desulfurization system (FGD) bypass and result in increased sulfur dioxide removal rates. Additionally, the fabric filter baghouse will tolerate lower flue gas approach temperatures as compared to the electrostatic precipitator, allowing increased SO2 removal rates in the Wyodak dry FGD scrubber. In this application PacifiCorp requests that a 0.16 lb/MMBtu emission limit, on a 12-month rolling average basis, be implemented following construction of the fabric filter baghouse. Furthermore, a 3-hour fixed block average limit of 2,115 lb/hour is requested for the Wyodak Plant following completion of the fabric filter baghouse installation. 5.2 Nitrogen Oxides 5.2.1 Low-NOX Burners PacifiCorp will install a new generation low-NOX boiler burner system on the Wyodak boiler in 2011 which will be used to control nitrogen oxides (NOX) emissions. In this application PacifiCorp requests that a 0.23 lb/MMBtu emission limit, on a 12-month rolling average basis, be implemented at Wyodak following construction of the low-NOX system. 5.3 Particulate Matter 5.3.1 Fabric Filter Baghouse PacifiCorp requests that a 71 lb/hour PM10 limit be established at the Wyodak Plant following completion of construction of the fabric filter baghouse.

23
6.0 Best Available Control Technology Determination The Clean Air Act’s PSD program provides that a Best Available Control Technology analysis must be conducted if a proposed project will result in a significant increase of a PSD pollutant.
Applicability
PacifiCorp has determined that the projects proposed for the Wyodak Power Plant may result in a significant increase (as determined by the thresholds established in the regulations) of carbon monoxide (CO). Therefore, PacifiCorp has conducted a Best Available Control Technology analysis for CO in this construction permit application.
The EPA has developed a process for conducting Best Available Control Technology analyses. This method is referred to as the “top-down” method. The steps to conducting a “top-down” analysis are listed in Environmental Protection Agency’s New Source Review Workshop Manual” Draft, October 1990. The steps are:
§ Step 1 – Identify All Control Technologies
§ Step 2 – Eliminate Technically Infeasible Options
§ Step 3 – Rank Remaining Control Technologies by Control Effectiveness
§ Step 4 – Evaluate Most Effective Controls and Document Results
§ Step 5 – Select Best Available Control Technology
Carbon Monoxide Best Available Control Technology Analysis Combustion controls designed to reduce NOX emissions may increase carbon monoxide by creating oxygen deficient combustions zones in the boiler. These controls are balanced to provide the maximum NOX reduction while minimizing carbon monoxide emission increases.
Step 1 - Identify All Control Technologies Only two control technologies have been identified for control of carbon monoxide. § Catalytic oxidation § Combustion controls
The catalytic oxidation is a post-combustion control device that would be applied to the combustion system exhaust, while combustion controls are part of the combustion system design of the boiler.

24
Step 2 - Eliminate Technically Infeasible Options Catalytic oxidation has been used to obtain the most stringent control of carbon monoxide emissions from combustion turbines firing natural gas. This alternative, however, has never been applied to a coal-fired boiler and has not been demonstrated to be a practical technology in this application.
For sulfur-containing fuels such as coal, an oxidation catalyst will convert SO2 to SO3, resulting in unacceptable levels of corrosion to the flue gas system as SO3 is converted to H2SO4. Generally, oxidation catalysts are designed for a maximum particulate loading of 50 milligrams per cubic meter. The Wyodak Plant has particulate matter loadings upstream of its particulate matter control devices in excess of 5,000 milligrams per cubic meter. In addition, trace elements present in coal, particularly chlorine, are poisonous to oxidation catalysts. Catalysts have not been developed that have or can be applied to coal-fired boilers due to the high levels of particulate matter and trace elements present in the flue gas.
Although the catalyst could be installed downstream of the particulate matter pollution control device (dry scrubber and fabric filter baghouse), the flue gas temperature at that point will be less than 300º F, which is well below the minimum temperature required (600ºF) for the operation of the oxidation catalyst. Utilization of a catalyst would require the flue gas to be reheated, resulting in significant negative energy and economic impacts. For these reasons, as well as the low levels of CO in coal-fired units, no pulverized-coal-fired boilers have been equipped with oxidation catalysts. Use of an oxidation catalyst system is thus considered technically infeasible and this system cannot be considered to represent Best Available Control Technology for control of carbon monoxide.
Step 3 - Rank Remaining Control Technologies by Control Effectiveness Based on the Step 2 analysis, combustion control is the only remaining technology for this application.
Step 4 - Evaluate Most Effective Controls and Document Results There are no environmental or energy costs associated with combustion controls.
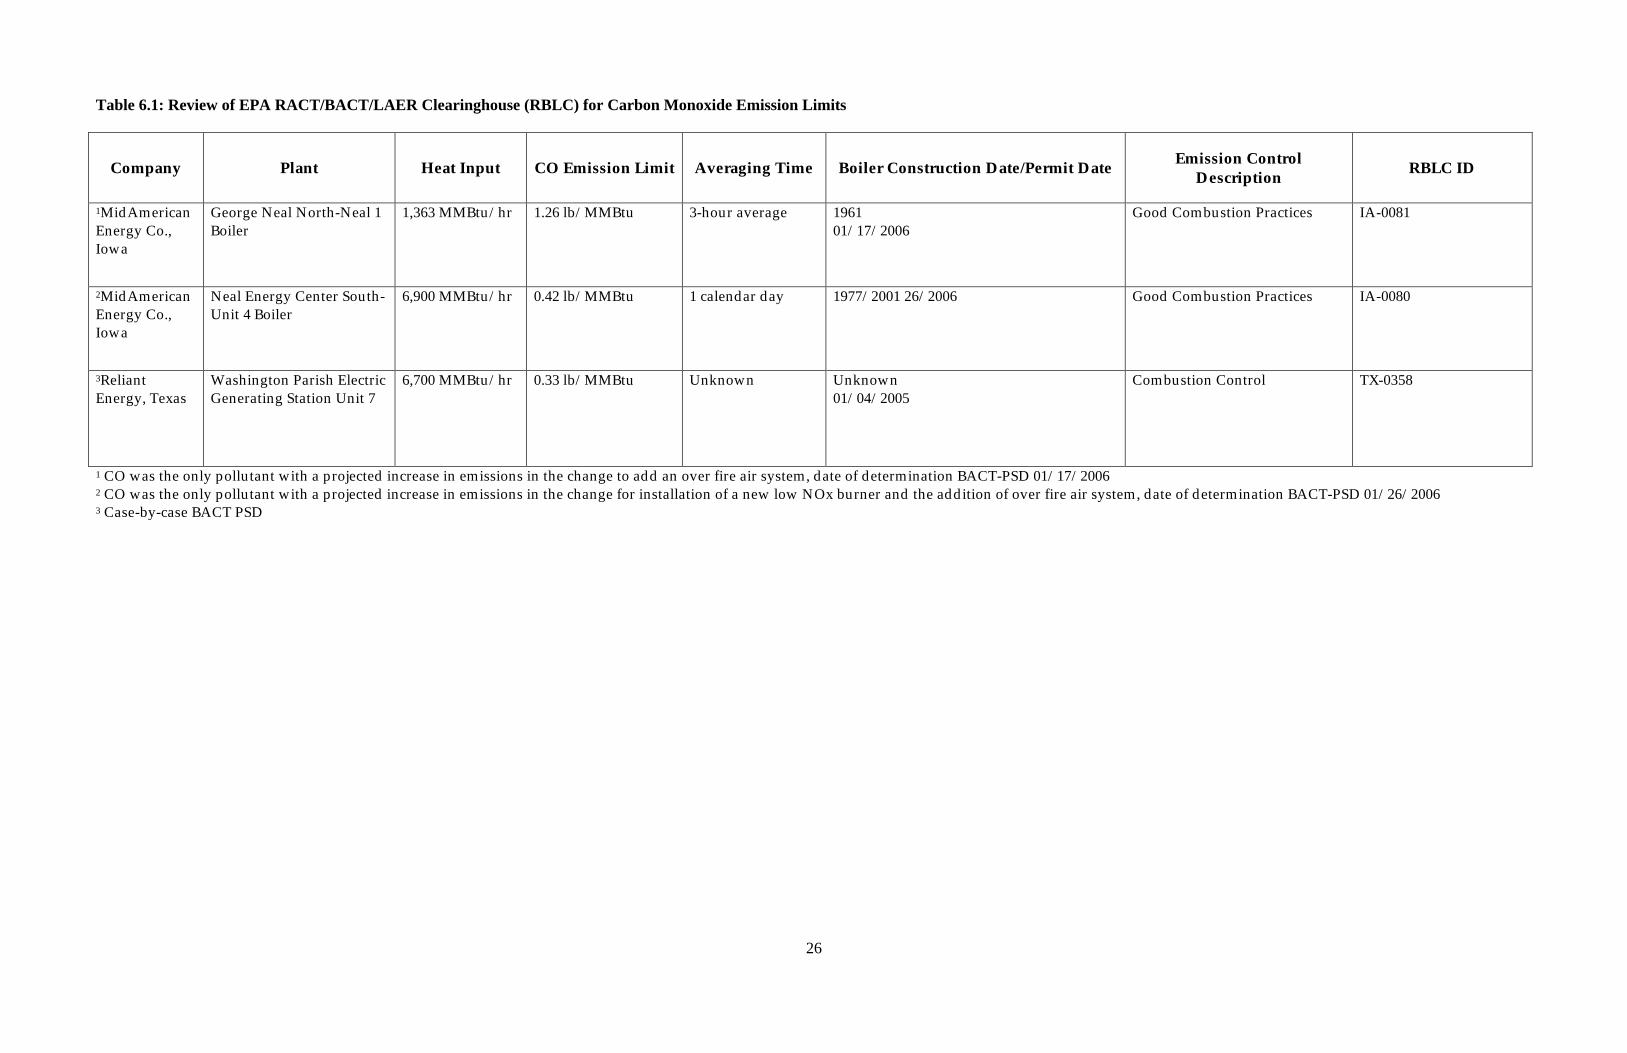
Step 5 - Select Best Available Control Technology The EPA New Source Review, RACT, BACT, LAER Clearinghouse database for comparable sources related to CO is shown in Table 6.1. The final step in the top-down Best Available Control Technology analysis process is to select Best Available Control Technology. Based on the above analysis, good combustion control for CO is chosen as Best Available Control Technology for these projects. Because there is a balance between reducing NOX emissions with advanced combustion controls and increasing CO emissions, i.e., the lower the NOX emissions the greater the potential for an increase in CO emissions, a 30-day rolling average emission limit of 0.25 lb/MMBtu for CO is recommended for the Wyodak Plant.

25
References
U.S. Environmental Protection Agency, 2007, RACT/BACT/LAER Clearinghouse Database http://cfpub1.epa.gov/rblc/htm/bl02.cfm. Wyoming Department of Environmental Quality, Air Quality Division Standards and Regulations, Chapter 6 Permitting Requirements
26
Table 6.1: Review of EPA RACT/BACT/LAER Clearinghouse (RBLC) for Carbon Monoxide Emission Limits
Company Plant Heat Input CO Emission Limit Averaging Time Boiler Construction Date/Permit Date Emission Control Description RBLC ID
1MidAmerican Energy Co., Iowa
George Neal North-Neal 1 Boiler
1,363 MMBtu/hr 1.26 lb/MMBtu 3-hour average 1961 01/17/2006
Good Combustion Practices IA-0081
2MidAmerican Energy Co., Iowa
Neal Energy Center South-Unit 4 Boiler
6,900 MMBtu/hr 0.42 lb/MMBtu 1 calendar day 1977/2001 26/2006 Good Combustion Practices IA-0080
3Reliant Energy, Texas
Washington Parish Electric Generating Station Unit 7
6,700 MMBtu/hr 0.33 lb/MMBtu Unknown Unknown 01/04/2005
Combustion Control TX-0358
1 CO was the only pollutant with a projected increase in emissions in the change to add an over fire air system, date of determination BACT-PSD 01/17/2006 2 CO was the only pollutant with a projected increase in emissions in the change for installation of a new low NOx burner and the addition of over fire air system, date of determination BACT-PSD 01/26/2006 3 Case-by-case BACT PSD

27
7.0 Regulatory Review The Clean Air Act’s PSD program provides that a Best Available Control Technology analysis must be conducted if a proposed project will result in a significant increase This section provides a regulatory review of the applicability of state and federal air quality permitting requirements for the addition of the emission controls and other plant projects.
State of Wyoming Air Permitting Requirements
The State of Wyoming has been granted authority to implement and enforce the federal Clean Air Act (CAA) [pursuant to the State Implementation Plan review and approval process] and federal air permitting requirements which are embodied within the state rules. The Plant is a major stationary source of air emissions, as defined within Wyoming Air Quality Standards and Regulations (WAQSR), 40 CFR 70 (Title V Operating Permits) and 40 CFR Part 52.21 (PSD Program Requirements). The Wyoming Department of Environmental Quality, Air Quality Division, has previously issued permits and permit revisions as appropriate for existing Plant facilities. The general requirements for permits and permit revisions are codified under Chapter 6 of Wyoming Air Quality Standards and Regulations.
Construction Permit Requirements (WAQSR Chapter 6) The replacement, addition or upgrade of existing emissions controls, including the low-NOX burners will result in an increase of some air pollutant emissions, necessitating the issuance of a construction permit pursuant to WAQSR Chapter 6, Section 2; Permit Requirements for construction, modification and operation. PacifiCorp is required by WAQSR Chapter 6, Section 2 to obtain a construction permit from the State of Wyoming, Department of Environmental Quality, prior to any work at the facility. Appendices contained in this construction permit application include appropriate construction permit forms as required by WAQSR Chapter 6, Section 2.
Operating Permit Requirements (WAQSR Chapter 6) The federal operating permit program (Title V) is implemented by regulations codified at 40 CFR Part 70 and 71. The State of Wyoming has been granted authority to implement and enforce the federal Title V program through state regulations outlined under WAQSR Chapter 6, Section 3. PacifiCorp currently has a Department of Environmental Quality issued Title V Operating Permit (Permit No. 3-1-101-1) for the Wyodak Power Plant. The replacement, addition of, or upgrade to existing air emissions controls and other plant projects constitute a significant modification to the Plant and will therefore require a modification of the existing Title V permit.

28
Prevention of Significant Deterioration (WAQSR Chapter 6, Section 2) Within the federal NSR regulations, a subset of rules, which apply to major sources and major modifications within attainment areas, is referred to as the PSD program. Since the planned projects are at a current PSD source, located in an area classified as attainment for all criteria pollutants, the PSD program will apply to the permitting of these projects. Wyoming Department of Environmental Quality has been delegated full authority from EPA for administering the federal PSD rules; consequently, these requirements are codified within the state’s permitting rules at WAQSR Chapter 6, Section 4.
The PSD program defines a major stationary source as:
1. Any source type belonging to one of the 28 listed source categories that has a potential-to-emit (PTE) of 100 tons per year or more of any criteria pollutant regulated under the CAA, or
2. Any other (non-categorical) source type with a PTE of 250 tpy of any pollutant regulated under the CAA.
The Wyodak Power Plant facility belongs to one of the 28 listed source categories (fossil fuel-fired steam electric plants of more than 250 million Btu/hour heat input) and is considered an existing major stationary source because the PTE for CO and sulfuric acid mist all exceed the limits listed in this section.
Modifications to an existing major source are considered major and subject to PSD review if the resulting net emissions increase is equal to or greater than the corresponding significant emissions increase threshold for each respective pollutant. A net emissions increase includes both of the following:
• The potential increase in emissions due to the modifications itself; and
• Contemporaneous net emissions increases and decreases of regulated air pollutants, under the PSD program
An emissions increase is considered significant if emissions meet or exceed any of the following rates:
• CO, 100 tpy
• NOX, 40 tpy
• SO2, 40 tpy
• PM10, 15 tpy
• Particulate matter, 25 tpy
• Ozone, 40 tpy of VOCs
• Lead, 0.6 tpy
• Fluorides, 3 tpy

29
• Hydrogen sulfide, 10 tpy
The basic PSD permitting requirements and conditions for issuing a construction permit that must be met for a major modification include:
• The degree of pollution control for emissions, to include fugitive emissions and fugitive dust, is at least BACT, except as otherwise provided in Chapter 6, Section 2 [WAQSR Chapter 6, Section 2(c)(v)]
• Performing ambient air quality impacts analysis – air dispersion modeling [WAQSR Chapter 6, Section 4(b)(i)(A)(I)]
• Analysis of impact to soils, vegetation, and visibility
• Analysis of Class I area impacts
New and Modified Sources in Non-attainment Areas and Maintenance Areas The plant is not located in a non-attainment or maintenance area. Therefore, a non-attainment New Source Review analysis is not required.
Emissions Impact Analysis (WAQSR Chapter 6, Section 2) Because the addition of the low-NOX burners may result in an increase in some emissions, PacifiCorp will conduct a comprehensive air quality modeling analysis for all criteria pollutants including SO2, NOX, PM10, lead, hydrogen fluoride, CO and H2SO4.
Monitoring and Reporting After a construction permit is received, PacifiCorp will be required to conduct monitoring, submit emission reports, ensure that equipment meets certain specifications, and conduct other activities as the Wyoming Department of Environmental Quality requests. Some of these requirements are enumerated below:
• Meet the reporting requirements specified in WAQSR Chapter 7 in the event of an unavoidable breakdown.
• Submit and retain air emission inventory and perform testing and monitoring as required in WAQSR Chapter 7.

30
Appendix A: Wyodak Projects Year Project 2009 Construct new bottom ash collection pond 2009 Install reverse osmosis skid 2009 Install variable frequency drives 2009 Air cooled condenser vibration mitigation project 2009 Switchgear remote racking project 2009 Pulverizer combustion improvements 2010 Coal pipe replacement 2011 Boiler feed pump motor replacement 2011 Boiler safety valve rebuilds 2011 Major steam turbine overhaul 2011 Install low-NOX control system 2011 Install fabric filter baghouse (replace electrostatic precipitator) 2011 Rewind generator 2011 Replace boiler slope tubes 2011 Replace boiler water wall and arch tubes 2011 Replace bottom ash hopper refractory 2011 Replace boiler superheater tubes 2011 Rebuild main steam valves 2011 Replace bottom ash hopper refractory 2011 Diesel storage tank coating 2011 Upgrade and replace motor control centers 2011 Rebuild redler conveyors 2011 Coal pipe replacement 2011 Rebuild emergency diesel generator 2011 Rebuild primary air fan

31
Appendix B: Emissions Calculations This appendix contains maximum past actual and future potential annual emission rates for SO2, NOX, PM10, HF, H2SO4, lead, CO and VOCs. Appendix B also contains maximum past actual and future potential boiler heat input rates and coal burn rates for the Wyodak boiler for use in applicable pollutant emission rate calculations.

32
Wyodak Emissions SummaryPast Actual vs. Future Potential Emissions Evaluation
Pollutant/Parameter Table Reference PSD Significance Level Is PSD Triggered
SO2Tables WYO-1, WYO-1a
and WYO-27,853.5 tons/year 3,293.8 tons/year -4,559.7 tons/year 40 tons/year No
NOX Tables WYO-3 and WYO-4 5,038.0 tons/year 4,735.5 tons/year -302.4 tons/year 40 tons/year No
Heat Input Tables WYO-5 and WYO-10 33,919,881 MMBtu/year 41,172,000 MMBtu/year
Coal Burn Tables WYO-6 and WYO-10 2,040,782 tons/year 2,563,892 tons/year
Particulate Matter(Stack and Non-Stack)
Tables WYO-7 and WYO-8 374.0 tons/year 355.3 tons/year -18.8 tons/year25 tons/year
(15 tons/year for PM10)No
Hydrogen Fluoride Tables WYO-9 and WYO-10 13.0 tons/year 10.7 tons/year -2.3 tons/year 3 tons/year (fluoride) No
Sulfuric Acid Tables WYO-11 and WYO-12 0.3 tons/year 0.0 tons/year -0.2 tons/year 7 tons/year No
Lead Tables WYO-13 and WYO-14 0.05 tons/year 0.06 tons/year 0.01 tons/year 0.6 tons/year No
Carbon Monoxide Tables WYO-15 and WYO-16 510.3 tons/year 5,146.6 tons/year 4,636.3 tons/year 100 tons/year Yes
VOC Tables WYO-17 and WYO-18 61.2 tons/year 76.9 tons/year 15.7 tons/year 40 tons/year No
Note: Carbon monoxide is the only pollutant that has a post-project emission increase above its PSD significance level.
Permit Assumption Timeline:
2008: Upon Issuance of Construction Permit(a) A 5,078.0 ton/year NOX Plantwide Applicability Limit (PAL) becomes effective at issuance of construction permit.(b) A 7,893.5 ton/year SO2 Plantwide Applicability Limit (PAL) becomes effective at issuance of construction permit.
2011: Upon Certification of Pollution Control Equipment(a) Wyodak will be subject to a 12-month rolling average NOX limitation of 0.23 lb/MMBtu(b) Wyodak will be subject to a 12-month rolling average SO2 limitation of 0.16 lb/MMBtu(c) Wyodak will be subject to a 3-hour fixed block average SO2 limitation of 2,115 lb/hour(d) Wyodak will be subject to a CO limitation of 0.25 lb/MMBtu, 1,175 lb/hour on a 30-day rolling average(e) The Wyodak Plant will be subject to a NOX PAL of 4,775.5 tons/year
(f) The Wyodak Plant will be subject to an SO2 PAL of 3,333.8 tons/year(g) The Wyodak Plant will be subject to a PM10 limitation of 71 lb/hour (0.015 lb/MMBtu) within 90 days following the completion of the fabric filter baghouse installation
Maximum Past Actual Rate
Maximum Future Potential RateEmission Rate
Increase/Decrease

33
Table WYO - 0Wyodak Past Actual Non-Stack Emissions Evaluation
PM (TSP) Emissions(tons/year)
Source ID 2 3 4 5 6 7 8 9 10 11 FUG01 Insig (a) Insig (b) Insig (c) Insig (d) Insig (e) Insig (f) Insig (g) Insig (h) Insig (i) Insig (j) Insig (k) Insig (l)
Total AnnualNon-Stack
PM Emissions(tons/year)
Maximum Past ActualNon-Stack PM Emissions
(tons/year)Year Year 47.32002 0.0 2.3 11.0 21.2 3.9 2.3 0.0 0.7 0.5 2.9 0.0 0.0 0.0 0.0 0.0 0.0 0.0 0.0 0.0 0.0 0.0 NA 44.7 20022003 0.0 2.3 11.0 23.4 3.9 2.3 0.0 0.7 0.5 3.3 0.0 0.0 0.0 0.0 0.0 0.0 0.0 0.0 0.0 0.0 0.0 NA 47.3 20032004 0.0 2.3 11.0 8.8 3.9 2.3 0.7 5.7 2.7 0.0 0.0 0.0 0.0 0.0 0.0 0.0 0.0 0.0 0.0 0.0 NA 37.3 20042005 0.0 2.3 11.0 2.6 1.5 0.7 5.4 3.3 0.0 0.0 0.0 0.0 0.0 0.0 0.0 0.0 0.0 0.0 0.0 NA 26.7 20052006 0.0 2.3 11.0 0.6 4.8 2.8 0.0 0.0 0.0 0.0 0.0 0.0 0.0 0.0 0.0 0.0 0.0 NA 21.5 2006
PM10 Emissions(tons/year)
Source ID 2 3 4 5 6 7 8 9 10 11 FUG01 Insig (a) Insig (b) Insig (c) Insig (d) Insig (e) Insig (f) Insig (g) Insig (h) Insig (i) Insig (j) Insig (k) Insig (l)
Total AnnualNon-Stack
PM10 Emissions(tons/year)
Maximum Past ActualNon-Stack PM10
Emissions(tons/year)
Year Year 46.52002 0.0 2.3 11.0 21.2 3.9 2.3 0.0 0.2 0.1 2.9 0.0 0.0 0.0 0.0 0.0 0.0 0.0 0.0 0.0 0.0 0.0 NA 43.8 20022003 0.0 2.3 11.0 23.4 3.9 2.3 0.0 0.2 0.1 3.3 0.0 0.0 0.0 0.0 0.0 0.0 0.0 0.0 0.0 0.0 0.0 NA 46.5 20032004 0.0 2.3 11.0 8.8 3.9 2.3 0.2 1.1 2.7 0.0 0.0 0.0 0.0 0.0 0.0 0.0 0.0 0.0 0.0 0.0 NA 32.3 20042005 0.0 2.3 11.0 2.6 1.5 0.2 1.0 3.3 0.0 0.0 0.0 0.0 0.0 0.0 0.0 0.0 0.0 0.0 0.0 NA 21.9 20052006 0.0 2.3 11.0 0.2 0.9 2.8 0.0 0.0 0.0 0.0 0.0 0.0 0.0 0.0 0.0 0.0 0.0 NA 17.2 2006
SO2 Emissions(tons/year)
Source ID 2 3 4 5 6 7 8 9 10 11 FUG01 Insig (a) Insig (b) Insig (c) Insig (d) Insig (e) Insig (f) Insig (g) Insig (h) Insig (i) Insig (j) Insig (k) Insig (l)
Total AnnualNon-Stack
SO2 Emissions(tons/year)
Maximum Past ActualNon-Stack SO2 Emissions
(tons/year)Year Year 0.02002 0.0 0.0 0.0 0.0 0.0 0.0 0.0 0.0 0.0 0.0 0.0 NA 0.0 20022003 0.0 0.0 0.0 0.0 0.0 0.0 0.0 0.0 0.0 0.0 0.0 NA 0.0 20032004 0.0 0.0 0.0 0.0 0.0 0.0 0.0 0.0 0.0 0.0 0.0 NA 0.0 20042005 0.0 0.0 0.0 0.0 0.0 0.0 0.0 0.0 0.0 0.0 0.0 NA 0.0 20052006 0.0 0.0 0.0 0.0 0.0 0.0 0.0 0.0 0.0 0.0 0.0 NA 0.0 2006
NOX Emissions(tons/year)
Source ID 2 3 4 5 6 7 8 9 10 11 FUG01 Insig (a) Insig (b) Insig (c) Insig (d) Insig (e) Insig (f) Insig (g) Insig (h) Insig (i) Insig (j) Insig (k) Insig (l)
Total AnnualNon-Stack
NOX Emissions(tons/year)
Maximum Past ActualNon-Stack NOX
Emissions(tons/year)
Year Year 0.82002 0.2 0.0 0.0 0.4 0.1 0.0 0.0 0.0 0.0 0.0 0.0 NA 0.8 20022003 0.2 0.0 0.0 0.2 0.0 0.0 0.0 0.0 0.0 0.0 0.0 NA 0.5 20032004 0.2 0.0 0.0 0.2 0.1 0.0 0.0 0.0 0.0 0.0 0.0 NA 0.5 20042005 0.2 0.0 0.0 0.1 0.1 0.1 0.0 0.0 0.0 0.0 0.0 NA 0.6 20052006 0.2 0.0 0.0 0.2 0.1 0.1 0.0 0.0 0.0 0.0 0.0 NA 0.6 2006
VOC Emissions(tons/year)
Source ID 2 3 4 5 6 7 8 9 10 11 FUG01 Insig (a) Insig (b) Insig (c) Insig (d) Insig (e) Insig (f) Insig (g) Insig (h) Insig (i) Insig (j) Insig (k) Insig (l)
Total AnnualNon-Stack
VOC Emissions(tons/year)
Maximum Past ActualNon-Stack VOC
Emissions(tons/year)
Year Year 0.02002 0.0 0.0 0.0 0.0 0.0 0.0 0.0 0.0 0.0 0.0 0.0 NA 0.0 20022003 0.0 0.0 0.0 0.0 0.0 0.0 0.0 0.0 0.0 0.0 0.0 NA 0.0 20032004 0.0 0.0 0.0 0.0 0.0 0.0 0.0 0.0 0.0 0.0 0.0 NA 0.0 20042005 0.0 0.0 0.0 0.0 0.0 0.0 0.0 0.0 0.0 0.0 0.0 NA 0.0 20052006 0.0 0.0 0.0 0.0 0.0 0.0 0.0 0.0 0.0 0.0 0.0 NA 0.0 2006

34
Table WYO - 0 (continued)Wyodak Past Actual Non-Stack Emissions Evaluation
CO Emissions(tons/year)
Source ID 2 3 4 5 6 7 8 9 10 11 FUG01 Insig (a) Insig (b) Insig (c) Insig (d) Insig (e) Insig (f) Insig (g) Insig (h) Insig (i) Insig (j) Insig (k) Insig (l)
Total AnnualNon-Stack
CO Emissions(tons/year)
Maximum Past ActualNon-Stack CO Emissions
(tons/year)Year Year 0.12002 0.1 0.0 0.0 0.0 0.0 0.0 0.0 0.0 0.0 0.0 0.0 NA 0.1 20022003 0.1 0.0 0.0 0.0 0.0 0.0 0.0 0.0 0.0 0.0 0.0 NA 0.1 20032004 0.1 0.0 0.0 0.0 0.0 0.0 0.0 0.0 0.0 0.0 0.0 NA 0.1 20042005 0.1 0.0 0.0 0.0 0.0 0.0 0.0 0.0 0.0 0.0 0.0 NA 0.1 20052006 0.1 0.0 0.0 0.0 0.0 0.0 0.0 0.0 0.0 0.0 0.0 NA 0.1 2006
Source ID Description
2 T-1 Transfer House (emergency coal backup handling system)3 T-2 Transfer House4 Silo Methane Purge Exhauster5 Dust Extractor Unit6 Station Coal Transfer House (removed from service)7 Station Coal Silo Exhauster (removed from service)8 Recycle Ash Bin (SDA System) (removed from service)9 Fly Ash Silo (fugitve emissions from truck loading)
10 Fly Ash Haul Road11 Peerless Pit Secondary Crusher
FUG01 Passive Enclosure Dust Control System (PECS)Insignificant (a) Emergency Diesel Generator EngineInsignificant (b) Emergency Diesel Fire Pump EngineInsignificant (c) Standby Diesel Fire Pump EngineInsignificant (d) Propane-Fired Space Heater (coal handling)Insignificant (e) Propane-Fired Space Heater (main coal silo)Insignificant (f) Propane-Fired Space Heater (main coal silo)Insignificant (g) Propane-Fired Space Heater (boiler building)Insignificant (h) Propane-Fired Space Heater (boiler building)Insignificant (i) Propane-Fired Space Heater (turbine building)Insignificant (j) Propane-Fired Space Heater (water treatment building)Insignificant (k) Propane-Fired Space Heater (new maintenance shop)Insignificant (l) Propane-Fired Space Heater (old maintenance shop) Note: has been relocated to main coal silo (Insignificant Source (f))
Note: Non-stack emission rates were obtained from 2002 through 2006 annual emission inventories.

35
Table WYO - 1Wyodak Past Actual SO2 Stack Emissions Evaluation
Past Actual Monthly SO2 Emissions from CEMs/Clean Air Markets (tons/month)
UNIT NAME Jan-03 Feb-03 Mar-03 Apr-03 May-03 Jun-03 Jul-03 Aug-03 Sep-03 Oct-03 Nov-03 Dec-03 Jan-04 Feb-04 Mar-04 Apr-04 May-04 Jun-04 Jul-04 Aug-04Wyodak 731.8 589.7 598.9 697.6 652.9 592.8 668.3 705.5 646.4 701.8 580.5 644.2 608.5 645.9 698.1 398.2 645.4 662.4 690.3 608.4
Excess Emissions 10.5 12.0 4.9 1.2 4.4Net Emissions 731.8 589.7 598.9 697.6 652.9 592.8 668.3 705.5 646.4 701.8 580.5 644.2 608.5 645.9 698.1 387.7 633.4 657.4 689.1 604.0
Past Actual Annual SO2 Emission Rate Based on Rolling 24-Month Period (tons/year)UNIT NAME Jan-03 Feb-03 Mar-03 Apr-03 May-03 Jun-03 Jul-03 Aug-03 Sep-03 Oct-03 Nov-03 Dec-03 Jan-04 Feb-04 Mar-04 Apr-04 May-04 Jun-04 Jul-04 Aug-04
Wyodak This is based on a 24-month rolling average so there are no valid averages until December 2004
Table WYO - 1 (continued)Wyodak Past Actual SO2 Stack Emissions Evaluation
Past Actual Monthly SO2 Emissions from CEMs/Clean Air Markets (tons/month)
Sep-04 Oct-04 Nov-04 Dec-04 Jan-05 Feb-05 Mar-05 Apr-05 May-05 Jun-05 Jul-05 Aug-05 Sep-05 Oct-05 Nov-05 Dec-05 Jan-06 Feb-06 Mar-06 Apr-06 May-06675.8 750.7 735.0 743.0 669.1 524.9 533.8 679.6 641.7 665.2 662.9 679.2 653.0 659.3 670.5 692.7 653.5 644.9 677.1 584.3 243.62.9 0.0 0.0 1.0 12.4 3.8 4.8 4.8 1.9 2.9 2.1 3.1 3.6 1.4 0.3 0.0 5.9 0.6 10.7 11.1 2.7
672.8 750.7 735.0 742.0 656.7 521.1 529.0 674.9 639.8 662.3 660.7 676.2 649.3 657.9 670.2 692.7 647.6 644.3 666.5 573.2 240.9
Past Actual Annual SO2 Emission Rate Based on Rolling 24-Month Period (tons/year)Sep-04 Oct-04 Nov-04 Dec-04 Jan-05 Feb-05 Mar-05 Apr-05 May-05 Jun-05 Jul-05 Aug-05 Sep-05 Oct-05 Nov-05 Dec-05 Jan-06 Feb-06 Mar-06 Apr-06 May-06
7,818 7,780 7,746 7,711 7,699 7,693 7,728 7,724 7,709 7,711 7,689 7,734 7,758 7,777 7,777 7,761 7,853 7,657

36
Table WYO - 1 (continued)Wyodak Past Actual SO2 Stack Emissions Evaluation
Past Actual Monthly SO2 Emissions from CEMs/Clean Air Markets (tons/month)
Jun-06 Jul-06 Aug-06 Sep-06 Oct-06 Nov-06 Dec-06 Jan-07 Feb-07 Mar-07 Apr-07 May-07 Jun-07 Jul-07 Aug-07 Sep-07 Oct-07 Nov-07 Dec-0731.5 603.4 545.4 611.5 614.5 649.6 654.6 556.9 498.5 660.1 625.1 720.1 678.9 678.9 706.1 664.7 705.0 610.1 737.115.116.4 603.4 545.4 611.5 614.5 649.6 654.6 556.9 498.5 660.1 625.1 720.1 678.9 678.9 706.1 664.7 705.0 610.1 737.1
Past Actual Annual SO2 Emission Rate Based on Rolling 24-Month Period (tons/year)Jun-06 Jul-06 Aug-06 Sep-06 Oct-06 Nov-06 Dec-06 Jan-07 Feb-07 Mar-07 Apr-07 May-07 Jun-07 Jul-07 Aug-07 Sep-07 Oct-07 Nov-07 Dec-077,337 7,294 7,265 7,234 7,166 7,123 7,079 7,029 7,018 7,084 7,059 7,099 7,107 7,116 7,131 7,139 7,163 7,133 7,155
Maximum Past Actual Annual SO2 Stack Emissions (tons/year) 7,853.5
7,853.5
Note:
Total Maximum Past Actual SO2 Emission RateStack and Non-Stack Emissions
(tons/year)
0.00.00.00.0
0.00.00.00.0
0.00.00.00.0
Propane-Fired Space Heater (turbine building)Propane-Fired Space Heater (water treatment building)Propane-Fired Space Heater (new maintenance shop)Propane-Fired Space Heater (old maintenance shop)
Propane-Fired Space Heater (main coal silo)Propane-Fired Space Heater (main coal silo)Propane-Fired Space Heater (boiler building)Propane-Fired Space Heater (boiler building)
The maximum past actual Wyodak stack SO2 emission rate of 7,853.5 tons/year does not include SO2 emissions in excess of the 3-hour average limit of 0.5 lb/MMBtu.
Table WYO-1a indicates the monthly SO2 emissions in excess of the 0.5 lb/MMBtu 3-hour limit that were subtracted from the monthly CEM-measured SO2 stack emissions during the 24-month evaluation period from May 2004 through April 2006.
Emissions SourceMaximum Past Actual
Non-Stack Emission Rate(tons/year)
Total Maximum Non-Stack SO2 Emission Rate(tons/year)
0.0
Emergency Diesel Generator EngineEmergency Diesel Fire Pump EngineStandby Diesel Fire Pump EnginePropane-Fired Space Heater (coal handling)

37
Table WYO - 1aWyodak Past Actual Sulfur Dioxide Emissions in Excess of Allowable Limit
SO2 Emissions in Excess of 0.5 lb/MMBtu Limit during 24-Month Evaluation Period from May 2004 through April 2006:
Date and TimeExcess Emission
Rate(lb/MMBtu)
Duration of Excess Emissions
(hours)
Heat Input(MMBtu/hour)
Excess Emissions Above
0.5 lb/MMBtu Limit(lbs)
Month
Monthly SO2 Emissionsin Excess of
3-hour SO2 limit of 0.5 lb/MMBtu(tons)
4/2/04 21:00 0.77 3.0 2,762.5 2,204.5 Apr-04 10.54/13/04 21:00 1.14 3.0 2,816.0 5,372.9 May-04 12.04/14/04 0:00 0.66 3.0 3,571.7 1,682.3 Jun-04 4.94/14/04 3:00 0.63 3.0 3,633.5 1,460.7 Jul-04 1.24/14/04 6:00 0.55 3.0 3,019.4 471.0 Aug-04 4.44/17/04 0:00 1.21 3.0 1,220.5 2,607.0 Sep-04 2.94/17/04 12:00 0.78 3.0 1,164.9 968.0 Oct-04 0.04/17/04 15:00 0.63 3.0 1,125.2 452.3 Nov-04 0.04/18/04 0:00 0.69 3.0 2,315.1 1,291.8 Dec-04 1.04/18/04 18:00 0.91 3.0 3,609.5 4,428.9 Jan-05 12.45/10/04 9:00 0.95 3.0 2,467.7 3,294.4 Feb-05 3.85/10/04 12:00 0.81 3.0 3,872.9 3,601.8 Mar-05 4.85/11/04 0:00 0.67 3.0 3,857.4 1,932.6 Apr-05 4.85/11/04 21:00 0.64 3.0 1,924.7 819.9 May-05 1.95/18/04 15:00 0.55 3.0 4,215.1 644.9 Jun-05 2.95/19/04 0:00 1.29 3.0 1,918.1 4,545.8 Jul-05 2.15/19/04 3:00 1.30 3.0 1,099.4 2,625.4 Aug-05 3.15/19/04 6:00 1.27 3.0 1,075.0 2,470.4 Sep-05 3.65/19/04 9:00 0.55 3.0 1,112.2 173.5 Oct-05 1.45/19/04 12:00 0.86 3.0 3,550.3 3,834.3 Nov-05 0.36/17/04 15:00 0.55 3.0 2,670.6 416.6 Dec-05 0.06/26/04 3:00 1.24 3.0 1,910.2 4,229.1 Jan-06 5.96/26/04 18:00 0.79 3.0 1,464.6 1,252.2 Feb-06 0.66/26/04 21:00 0.88 3.0 3,468.5 3,974.9 Mar-06 10.77/2/04 0:00 1.89 3.0 0.0 0.0 Apr-06 11.17/2/04 15:00 0.78 3.0 2,866.1 2,424.7 May-06 2.78/28/04 0:00 0.69 3.0 1,340.5 760.1 Jun-06 15.18/28/04 3:00 1.09 3.0 2,225.5 3,932.58/28/04 6:00 0.90 3.0 3,457.9 4,149.59/16/04 21:00 0.67 3.0 4,009.6 2,032.9

38
Table WYO - 1a (continued)Wyodak Past Actual Sulfur Dioxide Emissions in Excess of Allowable Limit
Date and TimeExcess Emission
Rate(lb/MMBtu)
Duration of Excess Emissions
(hours)
Heat Input(MMBtu/hour)
Excess Emissions Above
0.5 lb/MMBtu Limit(lbs)
9/21/04 0:00 1.43 3.0 0.0 0.09/22/04 0:00 1.05 3.0 2,339.7 3,825.412/4/04 6:00 0.94 3.0 1,551.7 2,052.91/1/05 21:00 0.62 3.0 3,018.9 1,123.01/2/05 21:00 1.20 3.0 1,977.2 4,128.41/14/05 0:00 0.56 3.0 3,954.3 747.41/15/05 6:00 0.62 3.0 0.0 0.01/15/05 9:00 0.90 3.0 0.0 0.01/30/05 3:00 0.66 3.0 1,098.9 520.91/31/05 15:00 1.02 3.0 2,933.0 4,557.91/31/05 18:00 1.00 3.0 4,307.7 6,487.41/31/05 21:00 1.14 3.0 3,734.6 7,192.82/1/05 0:00 0.58 3.0 3,763.5 869.42/19/05 0:00 1.01 3.0 1741.9 2,686.02/19/05 3:00 0.62 3.0 3082.6 1,109.72/20/05 6:00 0.67 3.0 1256 644.32/20/05 9:00 0.84 3.0 1346.4 1,373.32/20/05 12:00 0.58 3.0 3807.6 913.83/1/05 0:00 0.55 3.0 2841.4 431.93/1/05 3:00 0.78 3.0 1488.6 1,263.83/8/05 21:00 1.11 3.0 1504.6 2,735.43/9/05 0:00 0.88 3.0 3269.3 3,727.03/9/05 3:00 0.66 3.0 3215.4 1,495.2
4/25/05 12:00 0.56 3.0 4038.8 666.44/28/05 6:00 0.62 3.0 2575.97 958.34/29/05 9:00 1.26 3.0 3458.6 7,885.65/5/05 18:00 0.58 3.0 3880.9 931.45/28/05 3:00 0.82 3.0 3109.3 2,938.36/12/05 18:00 1.02 3.0 2867.5 4,435.46/24/05 0:00 0.64 3.0 3508.2 1,452.47/26/05 3:00 0.92 3.0 3349.2 4,260.28/18/05 18:00 0.73 3.0 1205.2 831.6

39
Table WYO - 1a (continued)Wyodak Past Actual Sulfur Dioxide Emissions in Excess of Allowable Limit
Date and TimeExcess Emission
Rate(lb/MMBtu)
Duration of Excess Emissions
(hours)
Heat Input(MMBtu/hour)
Excess Emissions Above
0.5 lb/MMBtu Limit(lbs)
8/18/05 21:00 0.88 3.0 2264.7 2,602.18/19/05 0:00 0.60 3.0 3663.7 1,099.18/19/05 12:00 0.64 3.0 3923.9 1,612.79/3/05 0:00 1.03 3.0 1546.5 2,449.79/3/05 21:00 0.88 3.0 3215.8 3,656.49/6/05 15:00 0.60 3.0 3999.7 1,139.910/3/05 0:00 0.62 3.0 1584.9 565.810/3/05 3:00 0.71 3.0 3619.5 2,226.011/4/05 3:00 0.56 3.0 3588.97 635.21/8/06 12:00 0.83 3.0 1740.4 1,702.11/8/06 15:00 0.65 3.0 3260.9 1,506.51/10/06 3:00 0.92 3.0 2233.6 2,794.21/11/06 0:00 1.15 3.0 1266.1 2,461.31/11/06 3:00 1.07 3.0 2892.5 4,954.92/16/06 12:00 0.60 3.0 4019.9 1,230.13/3/06 6:00 0.61 3.0 3199.6 1,046.33/11/06 0:00 1.21 3.0 1591.5 3,370.83/11/06 18:00 0.85 3.0 1298.9 1,348.33/11/06 21:00 0.70 3.0 3260.4 1,975.83/16/06 12:00 0.59 3.0 4059.4 1,120.43/18/06 0:00 2.04 3.0 2026.1 9,342.33/18/06 15:00 0.65 3.0 1226.3 559.23/18/06 18:00 0.80 3.0 2867.4 2,537.64/3/06 18:00 0.89 3.0 1854.6 2,169.94/4/06 12:00 0.71 3.0 3445.6 2,150.14/14/06 21:00 0.67 3.0 3660 1,910.54/17/06 9:00 0.72 3.0 2243.4 1,494.14/19/06 12:00 0.84 3.0 3685.7 3,715.24/20/06 18:00 1.02 3.0 3301.1 5,110.14/28/06 9:00 0.58 3.0 2811.6 683.24/29/06 15:00 0.95 3.0 3109.3 4,178.94/30/06 18:00 0.57 3.0 3992.8 850.5

40
Table WYO - 1a (continued)Wyodak Past Actual Sulfur Dioxide Emissions in Excess of Allowable Limit
Date and TimeExcess Emission
Rate(lb/MMBtu)
Duration of Excess Emissions
(hours)
Heat Input(MMBtu/hour)
Excess Emissions Above
0.5 lb/MMBtu Limit(lbs)
5/7/06 6:00 0.58 3.0 1720.2 387.05/7/06 9:00 0.80 3.0 3979.7 3,617.5
5/12/06 21:00 0.71 3.0 2168.5 1,353.16/27/06 12:00 0.81 3.0 977.9 897.76/28/06 6:00 0.63 3.0 1475.5 575.46/28/06 9:00 1.30 3.0 1679.9 4,046.96/28/06 12:00 1.32 3.0 1662.7 4,075.36/28/06 15:00 1.12 3.0 1826.73 3,375.86/28/06 18:00 0.93 3.0 1906.2 2,459.06/30/06 0:00 1.08 3.0 1513.7 2,633.86/30/06 3:00 1.13 3.0 1913.4 3,587.66/30/06 15:00 0.60 3.0 1082.9 337.96/30/06 18:00 1.13 3.0 1381.9 2,595.26/30/06 21:00 1.25 3.0 2468.4 5,553.9
Note: Excess emissions above the 3-hour SO2 standard of 0.5 lb/MMBtu were subtracted from the monthly SO2 emission rates during the 24-month evalution period that was used to identify the maximum Wyodak past actual SO2 emission rate of 7,853.5 tons/year. (Reference: Table WYO-1)
The maximum SO2 annual emission rate of 7,853.5 tons/year was established during the 24-month evaluation period from May 2004 through April 2006. (Reference Table WYO-1)
The maximum past actual annual stack SO2 emission rate of 7,853.5 tons/year, maximum non-stack SO2 emission rate of 0.0 tons/year and PSD significance level of 40 tons/year is used to establish the requested initial PAL value of 7,893.5 tons/year.

41
Table WYO - 2Wyodak Future Potential Sulfur Dioxide Emission Evaluation
Step 1: Calculate future potential SO2 emissions based on emission limit
Maximum Boiler Heat Input
(MMBtu/hour)
Post-Project Sulfur Dioxide Emission Limit
(lb/MMBtu)
Maximum Annual Boiler Operational
Time(hours/year)
Post-ProjectAnnual Sulfur
DioxideStack Emission Rate
(tons/year)Wyodak 4,700 0.16 8,760 3,293.8
Non-Stack SO2 Emission Rate: 0.0 tons/year
Total Future Potential SO2 Emission Rate: 3,293.8 tons/year
PSD SO2 Significance Threshold: 40 tons/year
Post-Scrubber Upgrade SO2 PAL: 3,333.8 tons/year

42
Table WYO - 3Wyodak Past Actual NOX Emissions Evaluation
Past Actual Monthly NOX Emissions from CEMs/Clean Air Markets (tons/month)
UNIT NAME Jan-03 Feb-03 Mar-03 Apr-03 May-03 Jun-03 Jul-03 Aug-03 Sep-03 Oct-03 Nov-03 Dec-03 Jan-04 Feb-04 Mar-04 Apr-04 May-04 Jun-04 Jul-04 Aug-04Wyodak 413.9 357.8 346.9 395.9 393.8 361.6 427.0 418.2 408.0 400.5 354.3 385.1 367.7 370.7 393.2 254.1 437.4 467.2 467.6 415.4
Past Actual Annual NOX Emission Rate Based on Rolling 24-Month Period (tons/year)UNIT NAME Jan-03 Feb-03 Mar-03 Apr-03 May-03 Jun-03 Jul-03 Aug-03 Sep-03 Oct-03 Nov-03 Dec-03 Jan-04 Feb-04 Mar-04 Apr-04 May-04 Jun-04 Jul-04 Aug-04
Wyodak This is based on a 24-month rolling average so there are no valid averages until December 2004
Table WYO - 3 (continued)Wyodak Past Actual NOX Emissions Evaluation
Past Actual Monthly NOX Emissions from CEMs/Clean Air Markets (tons/month)
Sep-04 Oct-04 Nov-04 Dec-04 Jan-05 Feb-05 Mar-05 Apr-05 May-05 Jun-05 Jul-05 Aug-05 Sep-05 Oct-05 Nov-05 Dec-05 Jan-06 Feb-06 Mar-06 Apr-06 May-06415.1 451.5 456.4 456.0 402.0 332.0 323.6 422.8 398.6 397.5 442.0 436.5 439.5 450.3 443.9 457.5 428.7 396.4 394.7 341.9 141.7
Past Actual Annual NOX Emission Rate Based on Rolling 24-Month Period (tons/year)Sep-04 Oct-04 Nov-04 Dec-04 Jan-05 Feb-05 Mar-05 Apr-05 May-05 Jun-05 Jul-05 Aug-05 Sep-05 Oct-05 Nov-05 Dec-05 Jan-06 Feb-06 Mar-06 Apr-06 May-06
4,808 4,802 4,788.7 4,777.1 4,790.5 4,792.9 4,810.8 4,818.4 4,827.5 4,843.3 4,868.2 4,913.0 4,949.2 4,979.7 4,992.6 4,993.3 5,037.2 4,889.4

43
Table WYO - 3 (continued)Wyodak Past Actual NOX Emissions Evaluation
Past Actual Monthly NOX Emissions from CEMs/Clean Air Markets (tons/month)
Jun-06 Jul-06 Aug-06 Sep-06 Oct-06 Nov-06 Dec-06 Jan-07 Feb-07 Mar-07 Apr-07 May-07 Jun-07 Jul-07 Aug-07 Sep-07 Oct-07 Nov-07 Dec-0712.1 333.2 296.2 333.6 387.2 395.1 393.8 305.0 279.5 379.2 372.5 432.7 421.3 427.5 396.2 401.5 397.3 340.0 442.0
Past Actual Annual NOX Emission Rate Based on Rolling 24-Month Period (tons/year)Jun-06 Jul-06 Aug-06 Sep-06 Oct-06 Nov-06 Dec-06 Jan-07 Feb-07 Mar-07 Apr-07 May-07 Jun-07 Jul-07 Aug-07 Sep-07 Oct-07 Nov-07 Dec-074,661.9 4,594.7 4,535.1 4,494.3 4,462.2 4,431.5 4,400.4 4,351.9 4,325.6 4,353.4 4,328.3 4,345.3 4,357.3 4,350.0 4,329.8 4,310.7 4,284.3 4,232.3 4,224.6
Maximum Past Actual Annual Stack NOX Emissions (tons/year) 5,037.2
Maximum Past Actual Non-Stack NOX Emissions
5,038.0
* Note that Wyodak had no NOX emissions in excess of the applicable 3-hour limit of 0.70 lb/MMBtu during the 24-month evaluation period from May 2004 through April 2006.
Total Maximum Past Actual NOX Emission RateStack and Non-Stack Emissions
(tons/year)
Propane-Fired Space Heater (new maintenance shop)Propane-Fired Space Heater (old maintenance shop) NA
Total Maximum Non-Stack NOX Emission Rate(tons/year)
0.8
Propane-Fired Space Heater (boiler building) 0.0Propane-Fired Space Heater (turbine building) 0.0Propane-Fired Space Heater (water treatment building) 0.0
0.0
Propane-Fired Space Heater (main coal silo) 0.0Propane-Fired Space Heater (boiler building) 0.0
Propane-Fired Space Heater (coal handling) 0.4Propane-Fired Space Heater (main coal silo) 0.1
Emergency Diesel Fire Pump Engine 0.0Standby Diesel Fire Pump Engine 0.0
Emissions SourceMaximum Past Actual
Non-Stack Emission Rate(tons/year)
Emergency Diesel Generator Engine 0.2
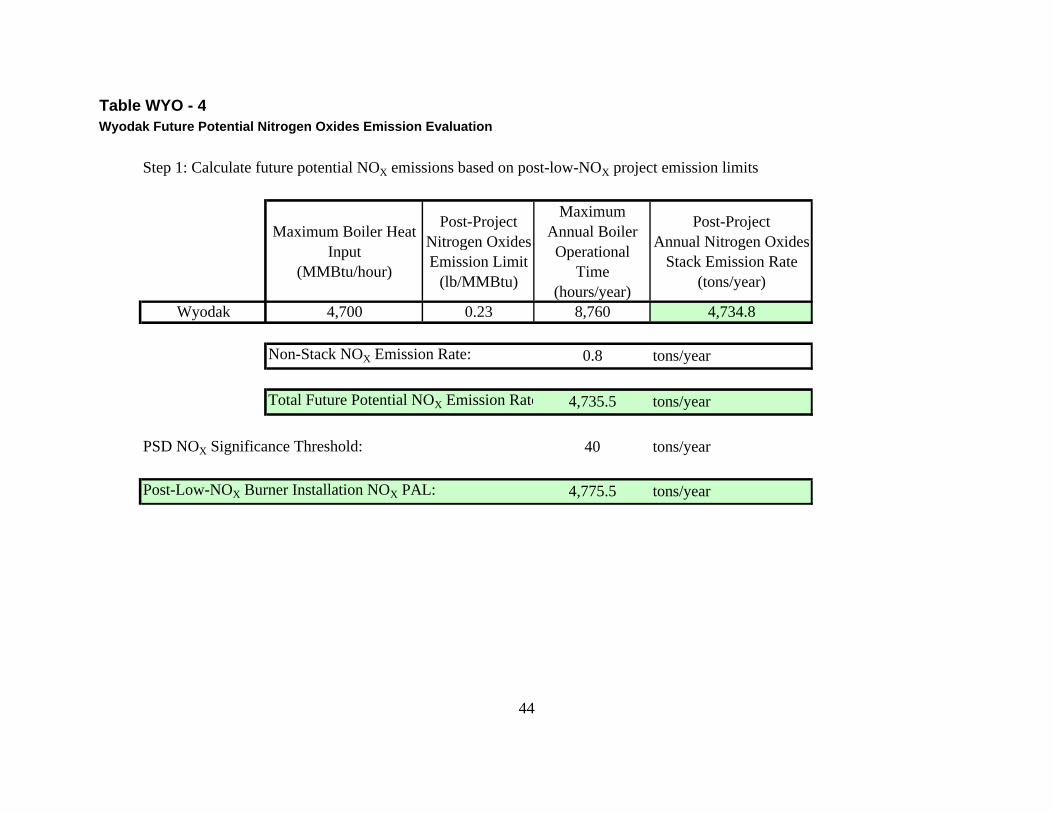
44
Table WYO - 4Wyodak Future Potential Nitrogen Oxides Emission Evaluation
Step 1: Calculate future potential NOX emissions based on post-low-NOX project emission limits
Maximum Boiler Heat Input
(MMBtu/hour)
Post-Project Nitrogen Oxides Emission Limit
(lb/MMBtu)
Maximum Annual Boiler Operational
Time(hours/year)
Post-ProjectAnnual Nitrogen Oxides
Stack Emission Rate(tons/year)
Wyodak 4,700 0.23 8,760 4,734.8
Non-Stack NOX Emission Rate: 0.8 tons/year
Total Future Potential NOX Emission Rate: 4,735.5 tons/year
PSD NOX Significance Threshold: 40 tons/year
Post-Low-NOX Burner Installation NOX PAL: 4,775.5 tons/year

45
Table WYO - 5Wyodak Past Actual Heat Input Evaluation
Past Actual Monthly Heat Input from CEMs/Clean Air Markets (MMBtu/month)UNIT NAME Jan-03 Feb-03 Mar-03 Apr-03 May-03 Jun-03 Jul-03 Aug-03 Sep-03 Oct-03 Nov-03 Dec-03 Jan-04 Feb-04 Mar-04 Apr-04 May-04 Jun-04 Jul-04 Aug-04
Wyodak 3,150,461 2,636,347 2,747,598 2,995,293 2,804,539 2,550,483 2,970,100 2,957,345 2,802,480 2,933,706 2,574,419 2,838,981 2,736,756 2,845,632 3,108,684 1,691,746 2,722,187 2,823,583 2,989,266 2,676,730
Past Actual Annual Heat Input Rate Based on Rolling 24-Month Period (MMBtu/year)UNIT NAME Jan-03 Feb-03 Mar-03 Apr-03 May-03 Jun-03 Jul-03 Aug-03 Sep-03 Oct-03 Nov-03 Dec-03 Jan-04 Feb-04 Mar-04 Apr-04 May-04 Jun-04 Jul-04 Aug-04
Wyodak This is based on a 24-month rolling average so there are no valid averages until December 2004
Table WYO - 5 (continued)Wyodak Past Actual Heat Input Evaluation
Past Actual Monthly Heat Input from CEMs/Clean Air Markets (MMBtu/month)Sep-04 Oct-04 Nov-04 Dec-04 Jan-05 Feb-05 Mar-05 Apr-05 May-05 Jun-05 Jul-05 Aug-05 Sep-05 Oct-05 Nov-05 Dec-05 Jan-06 Feb-06 Mar-06 Apr-06 May-06
2,834,223 3,180,642 3,111,045 3,157,515 2,758,441 2,206,840 2,273,363 2,828,357 2,760,228 2,818,040 2,817,180 2,837,389 2,770,839 2,856,638 2,918,473 3,006,285 2,766,719 2,696,745 2,801,037 2,444,546 1,034,435
Past Actual Annual Heat Input Rate Based on Rolling 24-Month Period (MMBtu/year)Sep-04 Oct-04 Nov-04 Dec-04 Jan-05 Feb-05 Mar-05 Apr-05 May-05 Jun-05 Jul-05 Aug-05 Sep-05 Oct-05 Nov-05 Dec-05 Jan-06 Feb-06 Mar-06 Apr-06 May-06
33,919,881 33,723,871 33,509,117 33,272,000 33,188,532 33,166,376 33,300,155 33,223,695 33,163,717 33,147,896 33,109,362 33,281,389 33,365,041 33,380,023 33,305,579 33,151,756 33,528,156 32,684,280
Table WYO - 5 (continued)Wyodak Past Actual Heat Input Evaluation
Past Actual Monthly Heat Input from CEMs/Clean Air Markets (MMBtu/month)Jun-06 Jul-06 Aug-06 Sep-06 Oct-06 Nov-06 Dec-06 Jan-07 Feb-07 Mar-07 Apr-07 May-07 Jun-07 Jul-07 Aug-07 Sep-07 Oct-07 Nov-07 Dec-07167,563 2,633,301 2,563,455 2,723,811 2,638,858 2,762,614 2,767,740 2,406,814 2,101,831 2,855,299 2,647,405 3,038,535 2,908,793 2,948,656 3,000,205 2,829,394 2,951,129 2,561,569 3,054,970
Past Actual Annual Heat Input Rate Based on Rolling 24-Month Period (MMBtu/year)Jun-06 Jul-06 Aug-06 Sep-06 Oct-06 Nov-06 Dec-06 Jan-07 Feb-07 Mar-07 Apr-07 May-07 Jun-07 Jul-07 Aug-07 Sep-07 Oct-07 Nov-07 Dec-07
31,356,270 31,178,287 31,121,650 31,066,444 30,795,552 30,621,336 30,426,449 30,250,635 30,198,131 30,489,099 30,398,623 30,537,776 30,583,153 30,648,891 30,730,299 30,759,576 30,806,821 30,628,369 30,652,712
Maximum Past Actual Annual Heat Input (MMBtu/year) 33,919,881

46
Table WYO - 6Wyodak Past Actual Coal Burn Evaluation
Past Actual Monthly Coal Burn (tons/month)UNIT NAME Jan-03 Feb-03 Mar-03 Apr-03 May-03 Jun-03 Jul-03 Aug-03 Sep-03 Oct-03 Nov-03 Dec-03 Jan-04 Feb-04 Mar-04 Apr-04 May-04 Jun-04 Jul-04 Aug-04
Wyodak 187,474 161,747 167,461 179,840 170,469 154,296 185,020 182,795 171,278 177,461 153,811 173,992 163,119 169,154 184,560 100,555 162,363 170,555 183,222 164,499
Past Actual Annual Coal Burn Rate Based on Rolling 24-Month Period (tons/year)UNIT NAME Jan-03 Feb-03 Mar-03 Apr-03 May-03 Jun-03 Jul-03 Aug-03 Sep-03 Oct-03 Nov-03 Dec-03 Jan-04 Feb-04 Mar-04 Apr-04 May-04 Jun-04 Jul-04 Aug-04
Wyodak This is based on a 24-month rolling average so there are no valid averages until December 2004
Table WYO - 6 (continued)Wyodak Past Actual Coal Burn Evaluation
Past Actual Monthly Coal Burn (tons/month)Sep-04 Oct-04 Nov-04 Dec-04 Jan-05 Feb-05 Mar-05 Apr-05 May-05 Jun-05 Jul-05 Aug-05 Sep-05 Oct-05 Nov-05 Dec-05 Jan-06 Feb-06 Mar-06 Apr-06 May-06169,698 184,870 180,910 182,415 158,770 130,433 131,190 169,604 165,100 170,706 171,276 167,117 165,035 162,456 171,967 174,297 163,970 159,860 165,022 145,424 62,545
Past Actual Annual Coal Burn Rate Based on Rolling 24-Month Period (tons/year)Sep-04 Oct-04 Nov-04 Dec-04 Jan-05 Feb-05 Mar-05 Apr-05 May-05 Jun-05 Jul-05 Aug-05 Sep-05 Oct-05 Nov-05 Dec-05 Jan-06 Feb-06 Mar-06 Apr-06 May-06
2,040,782 2,026,430 2,010,773 1,992,638 1,987,520 1,984,835 1,993,040 1,986,168 1,978,329 1,975,208 1,967,705 1,976,783 1,976,936 1,977,361 1,972,714 1,962,945 1,985,380 1,935,471
Table WYO - 6 (continued)Wyodak Past Actual Coal Burn Evaluation
Past Actual Monthly Coal Burn (tons/month)Jun-06 Jul-06 Aug-06 Sep-06 Oct-06 Nov-06 Dec-06 Jan-07 Feb-07 Mar-07 Apr-07 May-07 Jun-07 Jul-07 Aug-07 Sep-07 Oct-07 Nov-07 Dec-07
4,416 158,054 153,601 171,177 161,198 175,319 176,676 176,950 162,309 167,324 161,321 187,012 171,745 174,817 180,175 169,593 180,349 151,557 185,660
Past Actual Annual Coal Burn Rate Based on Rolling 24-Month Period (tons/year)Jun-06 Jul-06 Aug-06 Sep-06 Oct-06 Nov-06 Dec-06 Jan-07 Feb-07 Mar-07 Apr-07 May-07 Jun-07 Jul-07 Aug-07 Sep-07 Oct-07 Nov-07 Dec-07
1,852,401 1,839,817 1,834,368 1,835,108 1,823,272 1,820,476 1,817,607 1,826,697 1,842,635 1,860,702 1,856,560 1,867,516 1,868,036 1,869,806 1,876,335 1,878,614 1,887,561 1,877,356 1,883,037
Maximum Past Actual Annual Coal Burn Rate (tons/year) 2,040,782

47
Table WYO - 7Wyodak Past Actual Particulate Matter Emission Evaluation
Past Actual Monthly Heat Input from CEMs/Clean Air Markets (MMBtu/month)UNIT NAME Jan-03 Feb-03 Mar-03 Apr-03 May-03 Jun-03 Jul-03 Aug-03 Sep-03 Oct-03 Nov-03 Dec-03 Jan-04 Feb-04 Mar-04 Apr-04 May-04 Jun-04 Jul-04
Wyodak 3,150,461 2,636,347 2,747,598 2,995,293 2,804,539 2,550,483 2,970,100 2,957,345 2,802,480 2,933,706 2,574,419 2,838,981 2,736,756 2,845,632 3,108,684 1,691,746 2,722,187 2,823,583 2,989,266
Past Actual Monthly Particulate Matter Emission Rate from Annual Stack Testing (lb/MMBtu)UNIT NAME Jan-03 Feb-03 Mar-03 Apr-03 May-03 Jun-03 Jul-03 Aug-03 Sep-03 Oct-03 Nov-03 Dec-03 Jan-04 Feb-04 Mar-04 Apr-04 May-04 Jun-04 Jul-04
Wyodak 0.006 0.006 0.006 0.006 0.006 0.025 0.025 0.025 0.025 0.025 0.025 0.025 0.025 0.025 0.025 0.025 0.007 0.007 0.007
Monthly Particulate Matter Emission Rate (obtained by multiplying monthly heat input times particulate matter emission rate) tons/monthUNIT NAME Jan-03 Feb-03 Mar-03 Apr-03 May-03 Jun-03 Jul-03 Aug-03 Sep-03 Oct-03 Nov-03 Dec-03 Jan-04 Feb-04 Mar-04 Apr-04 May-04 Jun-04 Jul-04
Wyodak 9.6 8.0 8.4 9.1 8.6 31.9 37.1 37.0 35.0 36.7 32.2 35.5 34.2 35.6 38.9 21.1 9.5 9.9 10.5
Past Actual Annual Particulate Matter Emission Rate Based on Rolling 24-Month Period (tons/year)UNIT NAME Jan-03 Feb-03 Mar-03 Apr-03 May-03 Jun-03 Jul-03 Aug-03 Sep-03 Oct-03 Nov-03 Dec-03 Jan-04 Feb-04 Mar-04 Apr-04 May-04 Jun-04 Jul-04
Wyodak This is based on a 24-month rolling average so there are no valid averages until December 2004
Table WYO - 7 (continued)Wyodak Past Actual Particulate Matter Emission Evaluation
Past Actual Monthly Heat Input from CEMs/Clean Air Markets (MMBtu/month)Aug-04 Sep-04 Oct-04 Nov-04 Dec-04 Jan-05 Feb-05 Mar-05 Apr-05 May-05 Jun-05 Jul-05 Aug-05 Sep-05 Oct-05 Nov-05 Dec-05 Jan-06 Feb-06 Mar-06 Apr-06
2,676,730 2,834,223 3,180,642 3,111,045 3,157,515 2,758,441 2,206,840 2,273,363 2,828,357 2,760,228 2,818,040 2,817,180 2,837,389 2,770,839 2,856,638 2,918,473 3,006,285 2,766,719 2,696,745 2,801,037 2,444,546
Past Actual Monthly Particulate Matter Emission Rate from Annual Stack Testing (lb/MMBtu)Aug-04 Sep-04 Oct-04 Nov-04 Dec-04 Jan-05 Feb-05 Mar-05 Apr-05 May-05 Jun-05 Jul-05 Aug-05 Sep-05 Oct-05 Nov-05 Dec-05 Jan-06 Feb-06 Mar-06 Apr-060.007 0.007 0.007 0.007 0.007 0.007 0.007 0.007 0.007 0.014 0.014 0.014 0.014 0.014 0.014 0.014 0.014 0.014 0.014 0.014 0.014
Monthly Particulate Matter Emission Rate (obtained by multiplying monthly heat input times particulate matter emission rate) tons/monthAug-04 Sep-04 Oct-04 Nov-04 Dec-04 Jan-05 Feb-05 Mar-05 Apr-05 May-05 Jun-05 Jul-05 Aug-05 Sep-05 Oct-05 Nov-05 Dec-05 Jan-06 Feb-06 Mar-06 Apr-06
9.4 9.9 11.1 10.9 11.1 9.7 7.7 8.0 9.9 19.3 19.7 19.7 19.9 19.4 20.0 20.4 21.0 19.4 18.9 19.6 17.1
Past Actual Annual Particulate Matter Emission Rate Based on Rolling 24-Month Period (tons/year)Aug-04 Sep-04 Oct-04 Nov-04 Dec-04 Jan-05 Feb-05 Mar-05 Apr-05 May-05 Jun-05 Jul-05 Aug-05 Sep-05 Oct-05 Nov-05 Dec-05 Jan-06 Feb-06 Mar-06 Apr-06
250.5 250.6 250.4 250.2 250.6 256.0 249.9 241.2 232.6 224.8 216.5 210.6 203.4 196.0 187.6 178.0 176.0

48
Table WYO - 7 (continued)Wyodak Past Actual Particulate Matter Emission Evaluation
Past Actual Monthly Heat Input from CEMs/Clean Air Markets (MMBtu/month)May-06 Jun-06 Jul-06 Aug-06 Sep-06 Oct-06 Nov-06 Dec-06 Jan-07 Feb-07 Mar-07 Apr-07 May-07 Jun-07 Jul-07 Aug-07 Sep-07 Oct-07 Nov-07 Dec-07
1,034,435 167,563 2,633,301 2,563,455 2,723,811 2,638,858 2,762,614 2,767,740 2,406,814 2,101,831 2,855,299 2,647,405 3,038,535 2,908,793 2,948,656 3,000,205 2,829,394 2,951,129 2,561,569 3,054,970
Past Actual Monthly Particulate Matter Emission Rate from Annual Stack Testing (lb/MMBtu)May-06 Jun-06 Jul-06 Aug-06 Sep-06 Oct-06 Nov-06 Dec-06 Jan-07 Feb-07 Mar-07 Apr-07 May-07 Jun-07 Jul-07 Aug-07 Sep-07 Oct-07 Nov-07 Dec-070.029 0.029 0.029 0.029 0.029 0.029 0.029 0.029 0.029 0.029 0.029 0.029 0.029 0.007 0.007 0.007 0.007 0.007 0.007 0.007
Monthly Particulate Matter Emission Rate (obtained by multiplying monthly heat input times particulate matter emission rate) tons/monthMay-06 Jun-06 Jul-06 Aug-06 Sep-06 Oct-06 Nov-06 Dec-06 Jan-07 Feb-07 Mar-07 Apr-07 May-07 Jun-07 Jul-07 Aug-07 Sep-07 Oct-07 Nov-07 Dec-07
15.0 2.4 38.2 37.2 39.5 38.3 40.1 40.1 34.9 30.5 41.4 38.4 44.1 10.2 10.3 10.5 9.9 10.3 9.0 10.7
Past Actual Annual Particulate Matter Emission Rate Based on Rolling 24-Month Period (tons/year)May-06 Jun-06 Jul-06 Aug-06 Sep-06 Oct-06 Nov-06 Dec-06 Jan-07 Feb-07 Mar-07 Apr-07 May-07 Jun-07 Jul-07 Aug-07 Sep-07 Oct-07 Nov-07 Dec-07
178.7 175.0 188.8 202.7 217.5 231.1 245.7 260.2 272.8 284.2 300.9 315.2 327.5 322.8 318.1 313.4 308.6 303.8 298.1 292.9
Maximum Past Actual Annual Stack Particulate Matter Emissions (tons/year) 327.5
Maximum Past Actual Non-Stack PM10 Emissions
374.0 (Past actual stack emission rate of 327.5 tons/year plus non-stack emission rate of 46.5 tons/year)
Total Maximum Non-Stack PM10 Emission Rate(tons/year)
46.5
Total Maximum Past Actual PM10 Emission RateStack and Non-Stack Emissions
(tons/year)
Station Coal Transfer House (removed from service)Station Coal Silo Exhauster (removed from service)Recycle Ash Bin (SDA System) (removed from service)
3.92.30.00.2
Propane-Fired Space Heater (new maintenance shop)Propane-Fired Space Heater (old maintenance shop)
0.02.311.023.4
0.13.3
Propane-Fired Space Heater (water treatment building)
0.00.00.00.00.00.00.00.00.0
Propane-Fired Space Heater (boiler building)Propane-Fired Space Heater (turbine building)
0.00.0
Propane-Fired Space Heater (main coal silo)Propane-Fired Space Heater (boiler building)
Propane-Fired Space Heater (coal handling)Propane-Fired Space Heater (main coal silo)
Emergency Diesel Fire Pump EngineStandby Diesel Fire Pump Engine
Passive Enclosure Dust Control System (PECS)Emergency Diesel Generator Engine
Fly Ash Haul RoadPeerless Pit Secondary Crusher
Dust Extractor Unit
Fly Ash Silo (fugitve emissions from truck loading)
T-2 Transfer HouseSilo Methane Purge Exhauster
Emissions Source Maximum Past ActualT-1 Transfer House (emergency coal backup handling system)

49
Table WYO - 8Wyodak Future Potential Particulate Matter Emission Evaluation
Maximum Boiler Heat Input (I)
(MMBtu/hour)
Post-Project Particulate Matter Emission Limit*
(lb/MMBtu)
Post-Project Particulate Matter Emission Limit*
(lb/hour)
Maximum Annual Boiler Operational
Time(hours/year)
Future Potential AnnualParticulate Matter
Emission Rate(tons/year)
Stack 4,700 0.02 71 8,760 308.8Non-Stack NA NA NA NA 46.5
Wyodak Total (post-project PM10 rate): 355.3
* Particulate Matter Emission Limit Following Installation of Fabric Filter Baghouse

50
Table WYO - 9Wyodak Past Actual Hydrogen Fluoride Emission Evaluation
MHF = Fcomb x 2000 lb/ton x CHF x 1/106 x Facid
Where: MfgHF = Manufacture of Hydrogen Fluoride, lb/yearFcomb = Coal combustion, tons/year Note: Maximum annual coal burn rate from December 2004;Fcomb = 2,040,782 tons/year Table WYO-6CHF = 50.47 Average fluoride concentration in coal, ppmFBypass = 0.07 7.2% Wyodak scrubber bypassFacid = MHF/MF Acid conversion factor: ratio of molecular weights, compound/parent chemicalMF = 18.9984 Molecular weight of fluorineMHF = 20.0063 Molecular weight of hydrogen fluorideFacid = 1.053054AR = Annual release of hydrogen fluoride, lb/yearEFFGD = 6% HF emission factor for FGD systemsEFNo FGD = 50% HF emission factor without FGDAR = Mfg * (EF/100)ARFGD Removal = (1.0 - FBypass) x EFGD x MHF
ARBypass = FBypass x EFNoFGD x MHF
ARTotal = ARFGD Removal + ARBypass
Calculation Method:
EPRI LARK-TRIPP Calculation and Methods for Threshold Determination and Release EstimatesHF Emission Factor with FGD System: 6%Subbituminous Coal Emission Factor: 50%(Table 5-1 Emission Factors for HCL and HF)

51
Table WYO - 9 (continued)Wyodak Past Actual Hydrogen Fluoride Emission Evaluation
2002 2003 2004 2005 2006
Average 2002-2006 Fluoride Concentration
ppm
Wyodak 72.25 64.50 66.00 78.50 48.62 65.97
MfgHF = (Coal, tons/year)*(2000 lb/ton)*(CHF ppm)*(1/106) Facid
MfgHF = 283,563.3 lbs/year (quantity of HF manufactured through coal combustion)
ARFGD Removal = (1.0 - FBypass) x EFFGD x Mfg HF
ARFGD Removal = (1.0 - 0.072) x (0.06) x (283,563.3) lbs/yearARFGD Removal = 15,788.8 lbs/year (stack air release considering FGD removal, lbs.)ARBypass = (0.072) x (0.50) x (283,563.3) lbs/yearARBypass = 10,208.3 lbs/year (stack air release considering FGD bypass, lbs.)ARTotal = ARFGD Removal + ARBypass (total stack air release, lbs.)ARTotal = (15,788.8 + 10,208.3) lbs/yearARTotal = 25,997.1 lbs/year
25,997.1 lb/year13.0 tons/year
Historical Coal Fluoride Concentrations (Parts Per Million)
Maximum Past Actual Wyodak HF Emissions =

52
Table WYO - 10Wyodak Future Potential Coal Burn and Hydrogen Fluoride Emission Evaluation
2002 2003 2004 2005 2006Wyodak 8,110 8,057 8,019 7,980 7,980 8,029
Maximum Potential Annual Coal Burn Rate
Maximum Boiler Heat
Input(MMBtu/hour)
Wyodak 4,700
* Maximum potential annual heat input and coal burn rates used in future potential H2SO4, lead and HF emission calculations
Annual Average Coal Heating Value(Btu/lb)
Average CoalHeating Value
(Btu/lb)
Maximum AnnualHeat Input at
8760 hours/year*(MMBtu/year)
Average 2002-2005Coal Heating Value
(Btu/lb)
Maximum PotentialAnnual Coal Burn*
(tons/year)
41,172,000 8029 2,563,892

53
Table WYO - 10 (continued)Wyodak Future Potential Coal Burn and Hydrogen Fluoride Emission Evaluation
MHF = Fcomb x 2000 lb/ton x CHF x 1/106 x Facid
Where: MfgHF = Manufacture of Hydrogen Fluoride, lb/yearFcomb = Coal combustion, tons/yearFcomb = 2,563,892 tons/year (Wyodak future potential coal burn rate)CHF = 50.47 Average Wyodak fluoride concentration in coal, ppm (FGD scrubber, no bypass)FBypass = 0.00 0% Wyodak scrubber bypassFacid = MHF/MF Acid conversion factor: ratio of molecular weights, compound/parent chemicalMF = 18.9984 Molecular weight of fluorineMHF = 20.0063 Molecular weight of hydrogen fluorideFacid = 1.05305393AR = Annual release of hydrogen fluoride, lb/yearEFFGD = 6% HF emission factor for FGD systemsEFNo FGD = 50% HF emission factor without FGDAR = Mfg * (EF/100)
ARFGD Removal = (1.0 - FBypass) x EFGD x MHF
ARBypass = FBypass x EFNoFGD x MHF
ARTotal = ARFGD Removal + ARBypass
Calculation Method:
EPRI LARK-TRIPP Calculation and Methods for Threshold Determination and Release EstimatesHF Emission Factor with FGD System: 6%Subbituminous Coal Emission Factor: 50%(Table 5-1 Emission Factors for HCL and HF)

54
Table WYO - 10 (continued)Wyodak Future Potential Coal Burn and Hydrogen Fluoride Emission Evaluation
2002 2003 2004 2005 2006Average 2002-2006
Fluoride Concentration ppm
Wyodak 72.25 64.50 66.00 78.50 48.62 65.97
MfgHF = (Coal, tons/year)*(2000 lb/ton)*(CHF ppm)*(1/106) Facid
MfgHF = 356,248.6 lbs/year (quantity of HF manufactured through coal combustion)
ARFGD Removal = (1.0 - FBypass) x EFFGD x Mfg HF
ARFGD Removal = (1.0 - 0.0) x (0.06) x (356,248.6) lbs/yearARFGD Removal = 21,374.9 lbs/year (stack air release considering FGD removal, lbs.)ARBypass = (0.00) x (0.50) x (356,248.6) lbs/yearARBypass = 0.0 lbs/year (stack air release considering FGD bypass, lbs.)ARTotal = ARFGD Removal + ARBypass (total stack air release, lbs.)ARTotal = (21,374.9 + 0.0) lbs/year
ARTotal = 21,374.9 lbs/year
21,374.9 lb/year10.7 tons/year
Historical Coal Fluoride Concentrations (Parts Per Million)
Maximum Future Potential Wyodak HF Emissions =

55
Table WYO - 11Wyodak Past Actual Sulfuric Acid Emission Evaluation
Sulfuric Acid Mist Manufactured from Combustion (EPRI LARK-TRIPP method used to calculate sulfuric acid emission rate)
EMComb = K*F1*E2
Where: EMComb = total H2SO4 manufactured from combustion, lbs/yearK = molecular weight and units conversion constant = (98.07)/(64.04) * 2000
98.07 = Molecular weight of H2SO4
64.04 = Molecular weight of SO2
K = 3,063F1 = Fuel Impact FactorF1 = 0.0018 (Subbituminous/PRB coal)E2 = SO2 mass rate, tons/year
E2 = K1 * K2 * C1 * S1
Where: K1 = molecular weight and units conversion constant = (64.04)/(100*32.06) 64.04 = Molecular weight of SO2
32.06 = Molecular weight of S100 = conversion of % S to fraction
K1 = 0.02K2 = Sulfur conversion to SO2; implicit from EPA AP-42K2 = 0.875 (Subbituminous coal)C1 = Coal burn, tons/yearC1 = 2,040,782 tons/year (max from WYO-6; December 2004)S1 = Coal sulfur weighted, %

56
Table WYO - 11 (continued)Wyodak Past Actual Sulfuric Acid Emission Evaluation
2002 2003 2004 2005 2006Wyodak 0.61 0.58 0.64 0.63 0.65 0.62
S1 = 0.62
E2 = K1 * K2 * C1 * S1E2 = (0.02) x (0.875) x (2,040,782) x (0.62) SO2 emissions tons/yearE2 = 22,214 tons/year
EMComb = K*F1*E2EMComb = (3,063) x (0.0018) x (22,214) lbs/yearEMComb = 122,474 lbs/year
Annual Average Coal Sulfur Concentration(percent)
Average CoalSulfur
Concentration(percent)

57
Table WYO - 11 (continued)Wyodak Past Actual Sulfuric Acid Emission Evaluation
EMFGC = Ke * B * fe * Is Total H2SO4 manufactured from flue gas conditioning system, lbs/year
Where: EMFGC = Total H2SO4 manufactured from flue gas conditioning system, lbs/yearKe = 3,799 conversion factorB = Coal burn in TBtu/year
B = 33.9 TBtu/year (From WYO-5; December 2004)fe = Operating factor of flue gas conditioning system (generally = 0.8)fe = 0 (Wyodak does not use flue gas conditioning)Is = SO3 injection rate in ppmv at 6% O2, wet;
Is = 0 ppmv (flue gas conditioning is not used at Wyodak)
EMFGC = (3,799) x (33.9) x (0.8) x (0) lbs/yearEMFGC = 0 lbs/year (Sulfuric Acid Manufactured from Flue Gas Conditioning)
ERComb = EMComb * F2 (all that apply)ERComb = Sulfuric acid released from combustionF2 = Technology Impact Factors
F2 = 0.56 (Air Heater Removal of Sulfuric Acid - PRB Coal; Applicable to Wyodak Boiler)F2 = 0.73 (Cold-side ESP - Subbituminous (PRB) Coal; Applicable to Wyodak Boiler)F2 = 0.01 (Dry FGD - PRB Coal; Applicable to Wyodak)
ERComb = (122,474) x (0.56) x (0.73) x (0.01) lbs/year

58
Table WYO - 11 (continued)Wyodak Past Actual Sulfuric Acid Emission Evaluation
ERComb = 501 lbs/year (Sulfuric Acid Released from Combustion)
ERFGC = [EMFGC - (Ke * B * fe * INH3)] * F3FGC * F2 Total H2SO4 released from flue gas conditioning
Where: ERFGC = Sulfuric Acid Released from Flue Gas ConditioningEMFGC = Sulfuric acid manufactured from flue gas conditioning
EMFGC = 0 lbs/yearKe = 3,799 conversion factorB = Coal burn in TBtu/year
B = 33.9 TBtu/year (From WYO-5; December 2004)fe = 0 (Wyodak does not use flue gas conditioning)INH3 = NH3 injection for dual flue gas conditioning, ppmv at 6% O2, wet;
INH3 = 0 ppmv WyodakF3FGC = Technology Impact Factors for FGC
F3FGC = 0.02 (Subbituminous coal with FGC injection downstream of APH)

59
Table WYO - 11 (continued)Wyodak Past Actual Sulfuric Acid Emission Evaluation
F2 = Technology Impact FactorsF2 = 0.56 (Air Heater Removal of Sulfuric Acid - PRB Coal; Applicable to Wyodak)F2 = 0.73 (Cold-side ESP - Subbituminous (PRB) Coal; Applicable to Wyodak)F2 = 0.01 (Dry FGD - PRB Coal; Applicable to Wyodak)
ERFGC = [ 0 - (3,799 x 33.9 x 0.8 x 0)] x 0.02 x 0.01 (Use F2 factor for equipment after the ESP)
ERFGC = 0 lbs/year (Wyodak Sulfuric Acid Released from Flue Gas Conditioning)
ERTotal = ERComb + ERFGC Total sulfuric acid released from combustion and from flue gas conditioningERTotal = (501 + 0) lbs/year
ERTotal = 501 lbs/year
501 lbs/year0.3 tons/year
Total Past Actual Sulfuric Acid Emission Rate =

60
Table WYO - 12Wyodak Future Potential Sulfuric Acid Emission Evaluation
Sulfuric Acid Mist Manufactured from Combustion (EPRI LARK-TRIPP method used to calculate sulfuric acid emission rate)
EMComb = K*F1*E2
Where: EMComb = total H2SO4 manufactured from combustion, lbs/yearK = molecular weight and units conversion constant = (98.07)/(64.04) * 2000
98.07 = Molecular weight of H2SO4
64.04 = Molecular weight of SO2
K = 3,063F1 = Fuel Impact FactorF1 = 0.0018 (Subbituminous/PRB coal)E2 = SO2 mass rate, tons/year
E2 = K1 * K2 * C1 * S1
Where: K1 = molecular weight and units conversion constant = (64.04)/(100*32.06) 64.04 = Molecular weight of SO2
32.06 = Molecular weight of S100 = conversion of % S to fraction
K1 = 0.02K2 = Sulfur conversion to SO2; implicit from EPA AP-42K2 = 0.875 (Subbituminous coal)C1 = Coal burn, tons/yearC1 = 2,563,892 tons/year (future potential maximum from WYO-10)S1 = Coal sulfur weighted, %

61
Table WYO - 12 (continued)Wyodak Future Potential Sulfuric Acid Emission Evaluation
2002 2003 2004 2005 2006Wyodak 0.61 0.58 0.64 0.63 0.65 0.62
S1 = 0.62
E2 = K1 * K2 * C1 * S1E2 = (0.02) x (0.875) x (2,563,892) x (0.62) SO2 emissions tons/yearE2 = 27,908 tons/year
EMComb = K*F1*E2EMComb = (3,063) x (0.0018) x (29,908) lbs/yearEMComb = 153,868 lbs/year
Annual Average Coal Sulfur Concentration(percent)
Average CoalSulfur
Concentration(percent)

62
Table WYO - 12 (continued)Wyodak Future Potential Sulfuric Acid Emission Evaluation
EMFGC = Ke * B * fe * Is Total H2SO4 manufactured from flue gas conditioning system, lbs/year
Where: EMFGC = Total H2SO4 manufactured from flue gas conditioning system, lbs/yearKe = 3,799 conversion factorB = Coal burn in TBtu/year
B = 41.2 TBtu/year (From WYO-10)fe = Operating factor of flue gas conditioning system (generally = 0.8)fe = 0 (Wyodak does not use flue gas conditioning)Is = SO3 injection rate in ppmv at 6% O2, wet;
Is = 0 ppmv (flue gas conditioning is not used at Wyodak)
EMFGC = (3,799) x (41.2) x (0.8) x (0) lbs/yearEMFGC = 0 lbs/year (Sulfuric Acid Manufactured from Flue Gas Conditioning)
ERComb = EMComb * F2 (all that apply)ERComb = Sulfuric acid released from combustionF2 = Technology Impact Factors
F2 = 0.56 (Air Heater Removal of Sulfuric Acid - PRB Coal; Applicable to Wyodak Boiler)F2 = 0.10 (Baghouse - Subbituminous Coal; Applicable to Wyodak Boiler following Baghouse Installation)F2 = 0.01 (Dry FGD - PRB Coal; Applicable to Wyodak)
ERComb = (153,868) x (0.56) x (0.10) x (0.01) lbs/year

63
Table WYO - 12 (continued)Wyodak Future Potential Sulfuric Acid Emission Evaluation
ERComb = 86 lbs/year (Sulfuric Acid Released from Combustion)
ERFGC = [EMFGC - (Ke * B * fe * INH3)] * F3FGC * F2 Total H2SO4 released from flue gas conditioning
Where: ERFGC = Sulfuric Acid Released from Flue Gas ConditioningEMFGC = Sulfuric acid manufactured from flue gas conditioning
EMFGC = 0 lbs/yearKe = 3,799 conversion factorB = Coal burn in TBtu/year
B = 41.2 TBtu/year (From WYO-10)fe = 0 (Wyodak does not use flue gas conditioning)INH3 = NH3 injection for dual flue gas conditioning, ppmv at 6% O2, wet;
INH3 = 0 ppmv WyodakF3FGC = Technology Impact Factors for FGC
F3FGC = 0.02 (Subbituminous coal with FGC injection downstream of APH)

64
Table WYO - 12 (continued)Wyodak Future Potential Sulfuric Acid Emission Evaluation
F2 = Technology Impact FactorsF2 = 0.56 (Air Heater Removal of Sulfuric Acid - PRB Coal; Applicable to Wyodak)F2 = 0.10 (Baghouse - Subbituminous Coal; Applicable to Wyodak following Baghouse Installation)F2 = 0.01 (Dry FGD - PRB Coal; Applicable to Wyodak)
ERFGC = [ 0 - (3,799 x 41.2 x 0.8 x 0)] x 0.02 x 0.01 (Use F2 factor for equipment after the baghouse)
ERFGC = 0 lbs/year (Wyodak Sulfuric Acid Released from Flue Gas Conditioning)
ERTotal = ERComb + ERFGC Total sulfuric acid released from combustion and from flue gas conditioningERTotal = (86 + 0) lbs/year
ERTotal = 86 lbs/year
86 lbs/year0.0 tons/year
Total Future Potential Sulfuric Acid Emission Rate =

65
Table WYO - 13Wyodak Past Actual Lead Emission Evaluation
Lead emissions calculated using AP-42 Table 1.1-16 9/98
Lead emissions (lb/1012 Btu) = 3.4 * (C/A * PM)0.80
C = milligrams/kilogram (lead cncentration in coal)A= percent ash in coal
PM = average particulate matter emission rate lb/MMBtu
2002 2003 2004 2005 2006
Wyodak 5.25 3.00 3.67 3.00 3.09 3.60
2002 2003 2004 2005 2006
Wyodak 6.70% 6.73% 7.20% 7.14% 7.27% 7.01%
Annual Average Coal Lead Concentration (C)(ppm) Average Coal
Lead Concentration (C)(ppm)
Annual Average Coal Ash Concentration (A)(percent) Average Coal
Ash Concentration (A)(percent)

66
Table WYO - 13 (continued)Wyodak Past Actual Lead Emission Evaluation
2003 2004 2005 2006 2007
Wyodak 0.017 0.013 0.012 0.024 0.016 0.016
Reference
Wyodak WYO-5; December 2004
Annual Lead Emission Rate(lb/1012Btu)
Wyodak 2.96
Annual LeadEmission Rate
(lb/year)
Annual Lead Emission Rate(tons/year)
Wyodak 100.6 0.05
0.05 tons/year
Annual AverageParticulate Matter Emission Rate (PM)
(lb/MMBtu)
Average PMEmission Rate
(PM)(lb/MMBtu)
Maximum Past Annual Heat Input(MMBtu/year)
33,919,881
3.60 0.0701 0.016
Average LeadConcentration (C)
(ppm)
Average Coal AshConcentration (A)(weight fraction)
Average Particulate MatterEmission Rate (PM)
(lb/MMBtu)
Maximum Past Actual Lead Emission Rate:
33.92.96
Annual Lead Emission Rate(lb/1012 Btu)
Annual Heat Input(1012 Btu/year)

67
Table WYO - 14Wyodak Future Potential Lead Emission Evaluation
Lead emissions calculated using AP-42 Table 1.1-16 9/98
Lead emissions (lb/1012 Btu) = 3.4 * (C/A * PM)0.80
C = milligrams/kilogram (lead cncentration in coal)A= percent ash in coal
PM = average particulate matter emission rate lb/MMBtu
2002 2003 2004 2005 2006
Wyodak 5.25 3.00 3.67 3.00 3.09 3.60
2002 2003 2004 2005 2006
Wyodak 6.70% 6.73% 7.20% 7.14% 7.27% 7.01%
Annual Average Coal Lead Concentration (C)(ppm) Average Coal
Lead Concentration (C)(ppm)
Annual Average Coal Ash Concentration (A)(percent) Average Coal
Ash Concentration (A)(percent)
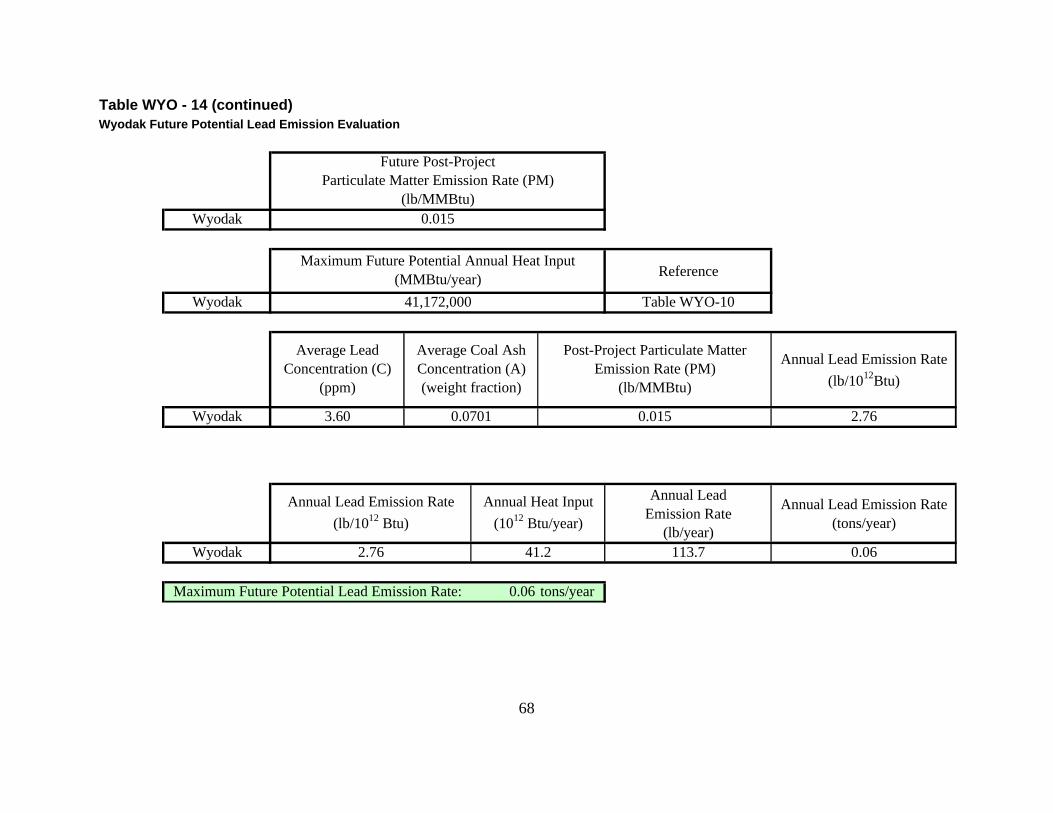
68
Table WYO - 14 (continued)Wyodak Future Potential Lead Emission Evaluation
Wyodak
Reference
Wyodak Table WYO-10
Annual Lead Emission Rate(lb/1012Btu)
Wyodak 2.76
Annual LeadEmission Rate
(lb/year)
Annual Lead Emission Rate(tons/year)
Wyodak 113.7 0.06
0.06 tons/year
0.0701 0.015
Future Post-ProjectParticulate Matter Emission Rate (PM)
(lb/MMBtu)
Maximum Future Potential Annual Heat Input(MMBtu/year)
41,172,000
Maximum Future Potential Lead Emission Rate:
0.015
Annual Lead Emission Rate(lb/1012 Btu)
Annual Heat Input(1012 Btu/year)
2.76 41.2
Average LeadConcentration (C)
(ppm)
Average Coal AshConcentration (A)(weight fraction)
Post-Project Particulate MatterEmission Rate (PM)
(lb/MMBtu)
3.60

69
Table WYO - 15Wyodak Past Actual Carbon Monoxide Emission Evaluation
Carbon monoxide emissions calculated using AP-42 Table 1.1-3 9/98
Carbon monoxide AP-42 emission factor = 0.5 lb/ton (0.5 lb of CO emitted per ton of coal burned)
Maximum Past ActualAnnual Coal Burn Rate
(tons/year)Reference
Carbon MonoxideEmission Factor
lb/ton
Annual COEmission Rate
lb/year
Annual COEmission Rate
tons/yearWyodak 2,040,782 WYO-6; December 2004 0.5 1,020,391 510.2
510.2 tons/year
Maximum Past Actual Non-Stack CO Emissions
Propane-Fired Space Heater (main coal silo)
0.00.00.00.00.0
Emergency Diesel Fire Pump EngineStandby Diesel Fire Pump EnginePropane-Fired Space Heater (coal handling)Propane-Fired Space Heater (main coal silo)
Total Maximum Non-Stack CO Emission Rate(tons/year)
0.1
Total Maximum Past Actual CO Emission RateStack and Non-Stack Emissions
(tons/year)510.3
Propane-Fired Space Heater (new maintenance shop) 0.0Propane-Fired Space Heater (old maintenance shop) NA
Propane-Fired Space Heater (turbine building) 0.0Propane-Fired Space Heater (water treatment building) 0.0
Propane-Fired Space Heater (boiler building) 0.0Propane-Fired Space Heater (boiler building) 0.0
Maximum Past Actual Stack Carbon Monoxide Emission Rate:
Emissions SourceMaximum Past Actual
Non-Stack CO Emission Rate(tons/year)
Emergency Diesel Generator Engine 0.1

70
Table WYO - 16Wyodak Future Potential Carbon Monoxide Emission Evaluation
Step 1: Calculate future potential emissions based on post-low-NOX project emission limits
Maximum BoilerHeat Input Rate(MMBtu/hour)
Post-ProjectCarbon Monoxide
Emission Limit(lb/MMBtu)
Maximum AnnualBoiler Operational Time
(hours/year)
Post-ProjectAnnual Carbon Monoxide
Stack Emission Rate(tons/year)
Wyodak 4,700 0.25 8,760 5,146.5
Future Potential Non-Stack Annual CO Emission Rate: 0.1 tons/year
5,146.6 tons/yearTotal Future Potential Annual Carbon Monoxide Emission Rate:

71
Table WYO - 17Wyodak Past Actual VOC Emission Evaluation
Volatile Organic Compound emissions calculated using AP-42 Table 1.1-19 9/98
VOC AP-42 emission factor = 0.06 lb/ton (0.06 lb of VOC emitted per ton of coal burned)
Maximum Past ActualAnnual Coal Burn Rate
(tons/year)Reference
VOCEmission Factor
lb/ton
Annual VOCEmission Rate
lb/year
Annual VOCEmission Rate
tons/yearWyodak 2,040,782 WYO-6; December 2004 0.06 122,447 61.2
61.2 tons/year
Maximum Past Actual Non-Stack VOC Emissions
Total Maximum Past Actual VOC Emission RateStack and Non-Stack Emissions
(tons/year)61.2
Propane-Fired Space Heater (old maintenance shop) NA
Total Maximum Non-Stack VOC Emission Rate(tons/year)
0.0
Propane-Fired Space Heater (water treatment building) 0.0Propane-Fired Space Heater (new maintenance shop) 0.0
Propane-Fired Space Heater (boiler building) 0.0Propane-Fired Space Heater (turbine building) 0.0
Propane-Fired Space Heater (main coal silo) 0.0Propane-Fired Space Heater (boiler building) 0.0
Propane-Fired Space Heater (coal handling) 0.0Propane-Fired Space Heater (main coal silo) 0.0
Emergency Diesel Fire Pump Engine 0.0Standby Diesel Fire Pump Engine 0.0
Maximum Past Actual Stack VOC Emission Rate:
Emissions SourceMaximum Past Actual
Non-Stack VOC Emission Rate(tons/year)
Emergency Diesel Generator Engine 0.0

72
Table WYO - 18Wyodak Future Potential VOC Emission Evaluation
Volatile Organic Compound emissions calculated using AP-42 Table 1.1-19 9/98
VOC AP-42 emission factor = 0.06 lb/ton (0.06 lb of VOC emitted per ton of coal burned)
Maximum Future PotentialAnnual Coal Burn Rate
(tons/year)Reference
VOCEmission Factor
lb/ton
Annual VOCEmission Rate
lb/year
Annual VOCStack Emission Rate
tons/yearWyodak 2,563,892 Table WYO-10 0.06 153,834 76.9
Future Potential Non-Stack Annual VOC Emission Rate: 0.0 tons/year
76.9 tons/yearTotal Future Potential VOC Emission Rate:

73
Appendix C: Permit Application Form This appendix includes a completed Wyoming Department of Environmental Quality Air Quality Division permit application form.

74
DEPARTMENT OF ENVIRONMENTAL QUALITY AIR QUALITY DIVISION
PERMIT APPLICATION FORM
Date of Application: March 11, 2008
1. Name of Firm or Institution: PacifiCorp Energy - Wyodak Power Plant 2. Mailing Address
48 Wyodak Road - Garner Lake Route Gillette Wyoming Number Street City State
Campbell 82716 (307) 687-4230 County Zip Telephone
3. Plant Location
5 Miles East of Gillette Gillette Wyoming Number Street City State
Campbell 82718 (307) 687-4230 County Zip Telephone
4. Name of owner or company official to contact regarding air pollution matters
Bill Lawson Director- Engineering and Environmental (801) 220-4581 Name Title Telephone
1407 West North Temple Salt Lake City Utah 84116 Number Street City State Zip
5. General nature of business
The Wyodak facility is a coal-fired plant used to generate electricity
6. Permit application is made for: New Construction X Modification
Relocation Operation

75
7. Type of equipment to be constructed, modified, or relocated. (List each major piece of equipment separately.)
PacifiCorp plans to replace the existing Wyodak electrostatic precipitator with a fabric filter baghouse, install a new-generation low-NOX control system and rebuild the facility’s steam turbine. The replacement of the electrostatic precipitator with a fabric filter baghouse will significantly reduce the particulate matter emission rate from the boiler and allow increased sulfur dioxide removal rates from the flue gas desulfurization system. The low-NOX burner project will result in lower NOX emission rates from the Wyodak boiler.
8. If application is being made for operation of an existing source in a new location,
list previous location and new location: Previous Location:
Not Applicable
New Location:
9. If application is being made for a crushing unit, is there: (mark all appropriate boxes)
Not applicable. Identified projects are being constructed to:
• Reduce the boiler particulate matter emission rate (Replace the existing electrostatic precipitator with a fabric filter baghouse)
• Rebuild the Wyodak steam turbine • Reduce the boiler SO2 emission rate with increased scrubber removal efficiencies resulting from
the fabric filter baghouse project (approach temperature benefits) • Reduce boiler NOX emission rate
No material crushing equipment is associated with the listed projects.

76
10. Materials used in unit or process (include solid fuels): Not applicable. The listed projects are being installed to reduce the particulate matter emission rate from the Wyodak boiler; to increase the FGD system SO2 removal efficiency; and to reduce the boiler NOX emission rate. The listed projects will not alter the coal throughput or heat input capacities of the Wyodak boiler.
Type of Material
Process Weight Average (lb/hr)
Process Weight Maximum (lb/hr)
Quantity/Year
Coal
2,563,892 tons (maximum)
11. Air contaminants emitted:
The replacement of the Wyodak ESP with a fabric filter baghouse will not change the characteristics of the pollutants being discharged from the stack; however, the project will result in a reduction of the particulate matter emission rate from the source. The baghouse installation will also allow a lower flue gas approach temperature from the FGD scrubber to the baghouse as compared to the allowable approach temperature from the FGD scrubber to the existing electrostatic precipitator. The capability of a reduced baghouse approach temperature allows an increased SO2 removal rate from the existing flue gas desulfurization system. The steam turbine overhaul will have no effect on the characteristics of the pollutants being discharged from the Wyodak exhaust stack. The low-NOX burner project will reduce NOX pollutants being emitted from the exhaust stack and may result in an increase in CO emissions. The Wyodak Plant currently has a particulate matter emission limit of 0.10 lb/MMBtu heat input. Following the installation of the fabric filter baghouse the emission rate from the boiler will be equivalent to an annual limit of 0.015 lb/MMBtu (71 lb/hour). PacifiCorp requests that a plantwide applicability limitation (PAL) for NOX equivalent to 5,078.0 tons/year be established on a 12-month rolling average basis at issuance of the requested construction permit. Following completion of the low-NOX burner project, PacifiCorp requests that a 12-month rolling average NOX emission limitation of 0.23 lb/MMBtu be applied to the Wyodak boiler. Furthermore, PacifiCorp requests that a 12-month rolling average NOX PAL equivalent to 4,775.5 tons/year be established at Wyodak following completion of the low-NOX control project. Because the installation of the low-NOX control project may increase emissions of carbon monoxide, a 30-day rolling average CO limit of 0.25 lb/MMBtu (1,175 lb/hour) is requested for the Wyodak facility following completion of the boiler low-NOX project. PacifiCorp requests that a plantwide applicability limitation (PAL) for SO2 equivalent to 7,893.5 tons/year be established on a 12-month rolling average basis at issuance of the requested construction permit. Following completion of the fabric filter baghouse project, PacifiCorp requests that a 12-month rolling average SO2 emission limitation of 0.16 lb/MMBtu be applied to the Wyodak boiler as well as a fixed block 3-hour average SO2 limit of 2,115 lb/hour. Furthermore, PacifiCorp requests that a 12-month rolling average SO2 PAL equivalent to 3,333.8 tons/year be established at Wyodak following completion of the fabric filter baghouse project.

77
Calculations of the Emission Estimates Summary of Past Actual Annual Emissions
Wyodak SO2 tons/yr
NOX tons/yr
PM10 tons/yr
VOC tons/yr
CO tons/yr
H2SO4 tons/yr
Lead tons/yr
Fluorides tons/yr
Stack Emissions 7,853.5 5,038.0 374.0 61.2 510.3 0.3 0.05 13.0
Summary of Projected Annual Emissions
Wyodak SO2 tons/yr
NOX tons/yr
PM10 tons/yr
VOC tons/yr
CO tons/yr
H2SO4 tons/yr
Lead tons/yr
Fluorides tons/yr
Stack Emissions 3,293.8 4,735.5 355.3 76.9 5,146.6 0.0 0.06 10.7
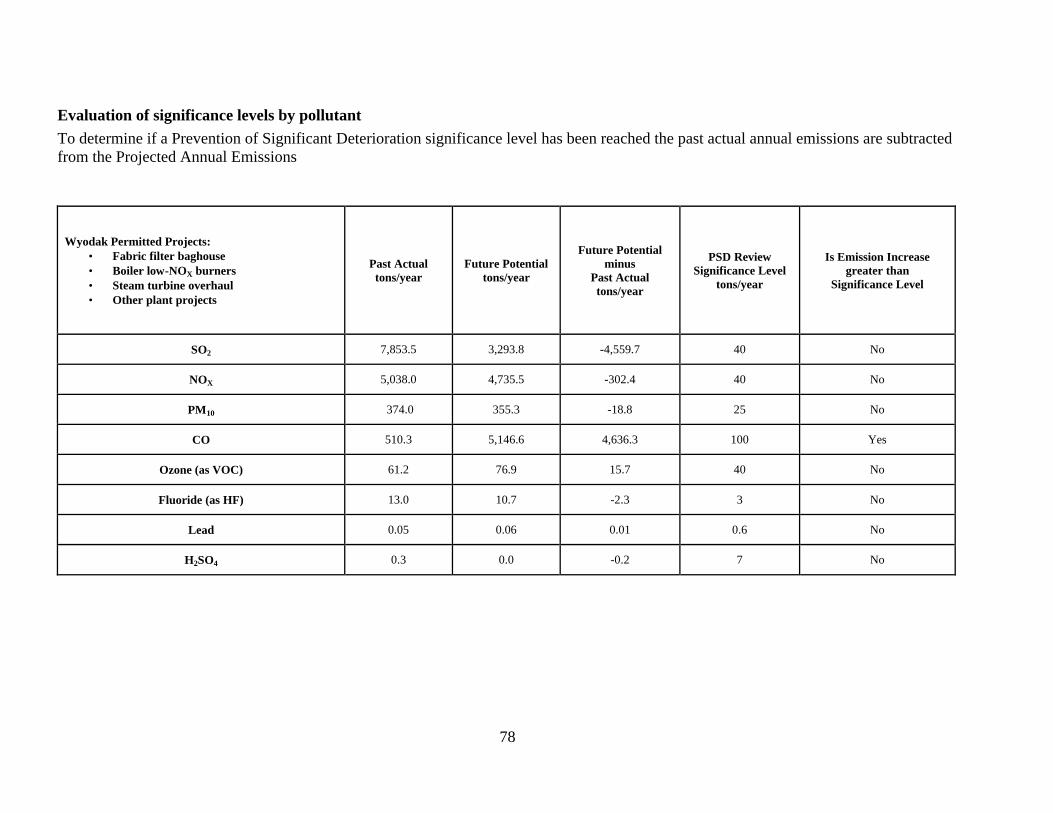
78
Evaluation of significance levels by pollutant To determine if a Prevention of Significant Deterioration significance level has been reached the past actual annual emissions are subtracted from the Projected Annual Emissions
Wyodak Permitted Projects:
• Fabric filter baghouse • Boiler low-NOX burners • Steam turbine overhaul • Other plant projects
Past Actual tons/year
Future Potential tons/year
Future Potential minus
Past Actual tons/year
PSD Review Significance Level
tons/year
Is Emission Increase greater than
Significance Level
SO2 7,853.5 3,293.8 -4,559.7 40 No
NOX 5,038.0 4,735.5 -302.4 40 No
PM10 374.0 355.3 -18.8 25 No
CO 510.3 5,146.6 4,636.3 100 Yes
Ozone (as VOC) 61.2 76.9 15.7 40 No
Fluoride (as HF) 13.0 10.7 -2.3 3 No
Lead 0.05 0.06 0.01 0.6 No
H2SO4 0.3 0.0 -0.2 7 No

79
12. Air contaminant control equipment:
Emission Point Type Pollutant Removed Efficiency
Boiler Stack
• Fabric Filter Baghouse • Low-NOX Burners • FGD System
PM10 NOX SO2
This equipment is expected to reduce particulate matter emissions from 0.10 lb/MMBtu heat input (pre-project emission rate) to 0.015 lb/MMBtu heat input on an annual average basis; and reduce NOX emissions to 0.23 lb/MMBtu and reduce SO2 emissions to 0.16 lb/MMBtu on a 12-month rolling average basis

80
13. Type of combustion unit: (check if applicable): A. Coal
1. Pulverized X : General ; Dry Bottom X; Wet Bottom ; With Flyash Reinjection ; Without Flyash Reinjection ; Other Wall-Fired 2. Spreader Stoker : With Flyash Reinjection ; Without Flyash Reinjection ; Cyclone ; Hand-Fired ; Other
B. Fuel Oil Horizontally Fired Tangentially Fired
Type of combustion unit:(check if applicable):
C. Natural Gas
D. If other, please specify
Hourly fuel consumption (estimate for new equipment) Not Applicable Size of combustion unit 4,700 MMBtu/hour (Wyodak boiler)
14. Operating Schedule: 24 hours/day; 7 days/week; 52 weeks/year.
Peak production season (if any):

81
15. Fuel analysis: Not applicable. The planned projects include the installation of pollution
control equipment including low-NOX burners to reduce NOX emissions and a fabric filter baghouse to control particulate matter emissions and allow increased SO2 removal in the flue gas desulfurization system. The requested projects will not change the amount of fuel burned or the capacity of the generating unit.
COAL
FUEL OIL
NATURAL GAS
% Sulfur
% Ash
BTU Value

82
16. Not applicable. Not applicable. The planned projects include the installation of pollution control equipment including low-NOX burners to reduce NOX emissions and a fabric filter baghouse to control particulate matter emissions and allow increased SO2 removal in the flue gas desulfurization system. The requested projects will not change the amount of fuel burned or the capacity of the generating unit..
Products Quantity/Year
17. Emissions to the atmosphere (each point of emission should be listed separately and
numbered so that it can be located on the flow sheet):
Emission
Point
Stack Height
(ft)
Stack Diameter
(ft)
Gas
Discharge SCFM
Exit Temp
(OF)
Gas Velocity
(ft/s)
Wyodak Stack
400
20 (exit I.D.)
1,900,000
190
100
18. Does the input material or product from this process or unit contain finely divided
materials which could become airborne?
X Yes No
Is this material stored in piles or in some other way as to make possible the creation of dust problems?
X Yes No
Not applicable. The planned projects include the installation of pollution control equipment including low-NOX burners to reduce NOX emissions and a fabric filter baghouse to control particulate matter emissions and allow increased SO2 removal in the flue gas desulfurization system. The requested projects will not change the amount of fuel burned or the capacity of the generating unit.

83
18. Continued: List storage pile (if any):
Type of Material Particle Size (Diameter or Screen Size)
Pile Size (Average Tons
on Pile)
Pile Wetted (Yes or No)
Pile Covered (Yes or No)
19. Using a flow diagram:
(1) Illustrate input of raw materials.
(2) Label production processes, process fuel combustion, process equipment, and air pollution control equipment.
(3) Illustrate locations of air contaminant release so that emission points under items 11, 12 and 17 can be identified. For refineries show normal pressure relief and venting systems. Attach extra pages as needed.
20. A site map should be included indicating the layout of facility at the site. All buildings,
pieces of equipment, roads, pits, rivers and other such items should be shown on the layout.
21. A location drawing should be included indicating location of the facility with respect to
prominent highways, cities, towns, or other facilities (include UTM coordinates).


![WELCOME [fikhaglobalteknik.com] · • Pulse Jet Baghouse • Reverse Air Baghouse Dust Collectors • Shaker baghouse dust collector • Automation System • PLC (programable Logic](https://img.dokumen.tips/doc/110x75/600d3569c9481d2aff589460/welcome-a-pulse-jet-baghouse-a-reverse-air-baghouse-dust-collectors-a.jpg)