Embed Size (px)
Citation preview

CWS/WP/200/28
WTO and Shrinking Policy Space for Food security:
Issues and Challenges for China
Working Paper
September, 2016
Sachin Kumar Sharma
Assistant Professor,
Room No. 708,
Centre for WTO Studies,
Indian Institute of Foreign Trade
Delhi
Email: [email protected]

2
Shrinking Policy Space for Food security and WTO: Issues and Challenges for China
Sachin Kumar Sharma
Abstract
With 133.8 million people suffering from hunger in China, achieving food self-
sufficiency and food security are primary goals of agricultural policy in China. To achieve
these goals as well to support millions of low income or resource poor farmers, China is
implementing Minimum Purchase Price (MPP) policy for grains through its state agencies.
Besides price support, the Chinese government also gives other budgetary support to wheat in
the form of subsidies for improved crop strains and seeds. However, the procurement of food
grains at MPP is limited by WTO rules. In this context, this study critically examines the
development space available to China to implement policy related to price support backed
procurement of grains for food security under the WTO regime. In this regard, product
specific support to wheat through price and other budgetary support in China is calculated at
nominal prices as well as by considering inflation at different levels of procurement for the
period 1999-2016. As per the commitments on agricultural products under the WTO rules,
the maximum applicable limit for China to provide product specific AMS is 8.5 percent of
value of production of a specific crop for a relevant year. The findings of this study show that
China does not have much flexibility to implement price support for wheat in near future if
the calculations are done without considering inflation. China is breaching applicable
permissible limit at the procurement level of 25 and 30.5 percent of total production of wheat.
It may be one the reasons why China has not increased the minimum purchase price of wheat
since 2014. It would be difficult for China to implement price support as well as other
product specific budgetary support policy for wheat in the immediate future due to shrinking
policy space as a result of binding commitments related to agriculture sector.
Keyword: China, WTO, Amber Box, Minimum Purchase Price, Agreement on Agriculture,
Price support
JEL classification: F13, F14, F51, Q17, Q18
Assistant Professor, Centre for WTO Studies, Indian Institute of Foreign Trade, New Delhi. Email: [email protected]. Mobile number: 9818885835 The author is grateful to Prof. Abhijit Das and Jayant Raghu Ram (Centre for WTO Studies) for comments on this paper.

3
Shrinking Policy Space for Food security and WTO: Issues and Challenges for China
Sachin Kumar Sharma
Section 1: Introduction
The FAO (2015) has estimated that globally 795 million people do not have access to
sufficient food to live a healthy life, of which, 780 million people are living in developing
countries. China is home to 133.8 million people who are facing hunger and suffering daily
hardships to access sufficient food for healthy life. The challenge of ensuring food security
for millions of people who are suffering from hunger remains a daunting policy task for
China. In this situation, policies related to the agriculture sector have to play a crucial rule in
eliminating huger and achieving the United Nations Sustainable Development Goal related to
hunger by 2030. However, binding commitments under the Agreement on Agriculture (AoA)
pose severe threats for many developing countries to provide sufficient food for millions of
poor people.
Procurement, stockholding and distribution of food grains are important aspects of
food security policies in many developing countries. According to Footnote 5 of the AoA,
government stockholding programmes for food security purposes in developing countries,
whose operation is transparent and conducted in accordance with officially published criteria
or guidelines shall be considered to be in conformity with the provisions of Green Box,
including programmes under which stock of foodstuffs for food security purposes are
acquired and released at administered prices, provided that the difference between the
acquisition price and the external price is accounted for in the AMS (WTO 2002). In other
words, the expenditure related to distribution and stockholding of foodgrains is permissible
without any limit under the Green Box. However, procurement of foodgrains at administered
price is limited by the rules of the WTO and is covered under the Amber Box which accounts
for trade distorting support. Limited and shrinking policy space in Amber Box is creating
problems in implementing the food security policies by developing countries. Finding a
permanent solution to the issues related to public stockholding for food security purposes has
now become a litmus test for successful conclusion of the Doha Development Round.
About the importance of price support and procurement of food grains for food
security purposes in developing countries, the South Centre (2015) has highlighted that (1)
given the price fluctuations in agricultural prices, building national reserves has been widely
acknowledged to be a critical part of developing countries‟ food security strategy; (2)
procuring foodgrains from surplus regions of the country and distributing to food deficit
regions has been and remains an important food security instrument for developing countries;

4
and (3) price and procurement policies are important instruments whereby resource-poor
farmers‟ income can be stabilised and even guaranteed. Like many other developing
countries (India, Indonesia, Kenya, Zambia and Pakistan etc.), price support to the agriculture
sector is an important instrument of China‟s agriculture policy to achieve self-sufficiency in
food grain production and ensuring food security.
The agriculture policy under different five year plans including the 13th
five year plan
(2016-2020) aims at modernizing the agricultural sector, land reforms, protecting the quality
of farmland to increase productivity, and ensuring grain self-sufficiency (at least 95%) and
food safety. This is to be attained through increasing support to the agriculture sector and
providing more benefits and subsidies to farmers (WTO 2016). To achieve self-sufficiency in
foodgrain production as well as to ensure food security for the millions of poor people, China
is implementing MPP for wheat. Price support policy in China has evolved since 1985. China
started state procurement system and protective price policy in the 1990s. However, from
2004 onwards, the Chinese government implemented MPP policy to maintain stability of
grain market prices, protecting the farmers and controlling the food supply.
Procurement of food grains at administered price for public stockholding has become
a contentious issue in the Doha Development Round especially during the last two ministerial
conferences (Bali, 2013 and Nairobi, 2015). In this context it would be useful to critically
examine the policy space of China to implement price support policy for grains under the
WTO regime. For this purpose, product specific support to wheat through price support in
China is calculated according to the provisions of AoA.
This paper is divided into six main sections. Section 2 contains an overview of the
agriculture policy of China. Section 3 discusses the methodology for calculating product
specific support and relevant provisions of AoA that impinge upon the policy space of
China‟s food security goals. Section 4 highlights the trends in domestic support to wheat
based on notifications submitted by China to the WTO. Section 5 analyses the results under
two broad scenarios i.e. with and without considering inflation for calculating product
specific support. The final section concludes the findings of the study.

5
Section 2: Overview of China’s Agricultural policy for Wheat
In China, the National Development and Reform Commission (NDRC) announces the MPP
for grains every year in consultation with the Ministry of Agriculture and other government
institutions (WTO 2016). The state-owned China Grain Reserve Corporation (Sinograin),
which was established in 2000, is responsible for implementing buffer stock policy. It
purchases grains when the market price falls below the established support level. It also
holds weekly auctions of grains to maintain sufficient market supplies. Besides managing
grain and oilseed reserve stocks, Sinograin is also responsible for the procurement of grains
and oilseeds, stock maintenance, inter-provincial shipments and international trade of grain.
The government stocks consist mainly of rice, wheat, and maize (OECD 2015a). The
amounts of crops purchased by Sinograin at minimum or intervention prices change from one
year to the next, depending on the relative levels of market prices and those offered by the
government (OECD 2015b).
The MPP scheme for grains is linked to the volume of China's grain reserve system which is
under the overall responsibility of the State Grain Administration (SGA). Detailed minimum
grain inventory levels for each province are specified with the main grain producing
provinces in north-eastern China required to maintain at least three months of sales inventory
and other provinces to keep at least six months of sales inventory (OECD 2013). A report of
OECD (2015b) pointed out that the actual level of public stockholding for food security is
unknown, but the International Grains Council estimates that China‟s reserves of wheat,
coarse grains and rice are at about 40% of total domestic use, which is much more than of
any other major grain producing or consuming country. China‟s buffer stock policy is cited as
one of the reasons why China experienced stable domestic food prices during the 2007-08
food price crises. Rice and wheat prices displayed much less volatility in Chinese markets
compared to the international market during the last decade, and certainly during the 2007-08
price hikes.
Price support policy for the agriculture sector in China has evolved and reformed over a long
period of time. During 1985-1990, the Chinese government adopted the “State Contract
Purchase Price” policy to implement contract purchase system of agricultural products
produced by farmers. In 1990, the Chinese government replaced "contract purchase system"
with "state procurement system". Before 1995, the state procurement pricing system covered
many agricultural products, including wheat, rice, corn, cotTon, soybeans, rape seeds and

6
sugar crops etc. In the 1996-1998 base periods, the products covered by the system only
include wheat, rice, corn and cotTon (WTO 2001).
In 1993, the Chinese government adopted the protective price policy to safeguard farmers'
income. Protective price determined by farmers‟ production cost plus a certain amount of
profit. In 1997–1998, the products covered by the protective price policy were wheat, rice
and corn (Cheng 2008). The Chinese government repealed the protective price policy system
in 2004 and started to employ grain MPP policy to maintain stability of grain market prices,
protect the farmers and control the food supply. In response to a question raised at Committee
on Agriculture (CoA) in (month and year), China reported that the protective pricing system
policy differed from minimum procurement/purchase price policy in the aspects of
implementation time, area and products. The protective pricing system covered rice, wheat
and corn while the minimum procurement price policy covers only rice and wheat; the
protective price system was implemented across the board in China while the minimum
procurement price system was implemented only in major rice- and wheat-producing areas;
no specific implementation time was set for the protective price system while MPP is only set
for the peak season or crop procurement (CoA Meeting Number 59, Question ID 59036) .
The minimum price for wheat increased during 2012-2014, due to an increase in production
costs, but remained unchanged in 2015 and 2016. The MPPs for wheat remained at 2360
Yuan/Ton during 2014 to 2016 (table 1). The Chinese government also carried out ad-hoc
interventions to procure several other agricultural commodities at pre-determined prices to
protect the farmers and the consumer from price volatilities. Such interventions have covered
maize, cane sugar, soybeans, rapeseed, cotTon and pork, but in 2014-15 they were
discontinued for cotTon, soybeans and rapeseeds and replaced by compensations covering the
difference between pre-determined target prices and actual market prices (OECD 2016).
Table 1: Minimum Purchase Price for Wheat in China (Yuan/Ton)
Year White Red and mixed Average
2007 1,440 1,380 1,410
2008 1,540 1,440 1,490
2009 1,740 1,660 1,700
2010 1,800 1,720 1,760
2011 1,900 1,960 1,930
2012 2,040 2,040 2,040
2013 2,240 2,240 2,240
2014 2,360 2,360 2,360
7
2015 2,360 2,360 2,360
2016 2,360 2,360 2,360
Source: OECD (2016), “China”, in Agricultural Policy Monitoring and Evaluation 2016, OECD Publishing,
Paris.DOI: http://dx.doi.org/10.1787/agr_pol-2016-10-en
Besides market price support, the Chinese government supports the farmers through
budgetary transfers. Most of them are provided through four basic programmes: (1) direct
payments for grain producers; (2) payments to compensate farmers for an increase in prices
of agricultural inputs, in particular fertilisers and fuels; (3) subsidies for improved seeds; and
(4) subsidies for purchase of agricultural machinery. China is in the process of restructuring
its overall agricultural subsidy policy. The aim of this reform is to protect the land and attain
food security (WTO 2016).
Direct payments for grain producers and almost all subsidies for chemicals and seeds are paid
at a flat rate per unit of land. For instance, direct payments to support grain production and to
increase grain producers‟ incomes were around USD 24-36/ha. It is noteworthy that the
payment is provided to the person who holds the contract rights to the land, not to the person
who cultivates the land. The centrally funded comprehensive subsidy on agricultural inputs is
implemented as a payment per unit of land, not necessarily sown to grains. Support for
improved quality seeds is provided via the Improved Seed Variety Subsidy programme. The
actual implementation mechanism of this subsidy depends on the commodity. Thus, for the
improved hybrid seeds of rice, maize and rapeseed, the government pays cash directly to
farmers (through their account in the bank) on the basis of the cultivated area, and for the
improved seeds of wheat, soybean and cotTon, it is for the provinces to decide if the subsidy
takes the form either of a direct payment or of reduced seed prices (OECD 2011). In 2015,
the government applied a pilot programme to combine “Three subsidies” (direct payments for
grain producers, comprehensive subsidy on agricultural inputs and improved seed variety
subsidy), all paid on per unit of land basis, into a single payment in five. The new
programme, called “agricultural support and protection subsidy” consists of two components.
Four-fifths of the value of “three subsidies” was paid per unit of land directly to owners of
land use rights. This part is intended to protect arable land fertility and to preserve grain
production capacity. One-fifth of budgetary allocations was set aside for “new-style” farms
who rent land from neighbours, “family farms”, cooperative farms, and farms run by
agribusiness companies (OECD 2016).
Figure 1: Trend in production and consumption of wheat in China (1000 Ton)

8
Source: Index Mundi. http://www.indexmundi.com/ accessed on 10th
July, 2016
Figure 2: Trend in export and import of wheat (1000 Ton)
Source: Index Mundi. http://www.indexmundi.com/ accessed on 10th
July, 2016
Due to various support programmes like minimum purchase price, direct payment, subsidies
for inputs and seed, production of wheat has increased sharply from 102 million Ton in 1995
to 130 million Ton in 2016. China has achieved self-sufficiency to a great extent in wheat due
to increase in production vis-à-vis consumption of wheat (figure 1). Though, China is a net
importer of wheat, its dependency on imported wheat has declined from 1995 to 2016 (figure
2). Domestic production is more than consumption of wheat in recent times, but China is
importing wheat to support food reserves for food security purposes.
-
20,000
40,000
60,000
80,000
1,00,000
1,20,000
1,40,000
19
95
19
96
19
97
19
98
19
99
20
00
20
01
20
02
20
03
20
04
20
05
20
06
20
07
20
08
20
09
20
10
20
11
20
12
20
13
20
14
20
15
20
16
Production Consumption
-8000
-6000
-4000
-2000
0
2000
4000
6000
8000
19
96
19
97
19
98
19
99
20
00
20
01
20
02
20
03
20
04
20
05
20
06
20
07
20
08
20
09
20
10
20
11
20
12
20
13
20
14
20
15
20
16
Trade balance Export Import

9
Section 3: Methodology
The methodology to calculate product specific support to wheat producers is given under the
following sections:
3.1 General Provisions under Agreement on Agriculture (AOA) related to Domestic
Support
The AoA provides the methodology to estimate domestic support to agriculture
sector. The key aim of reducing domestic support is to correct trade distortions with a view to
promote efficient allocation and use of world resources. Domestic support is the annual level
of support extended to the agricultural sector. Domestic support to agriculture sector under
AoA is divided into three boxes i.e. Amber, Green and Blue box.
All domestic support measures, except exempt measures, provided in favour of
agricultural producers are to be measured as the „Aggregate Measurement of Support‟
(AMS), commonly known as Amber Box. Article 6 along with Annexes 3&4 of AoA
provides the methodology to calculate the Amber box support. The support provided to
farmers under this box includes (1) product specific support like price and budgetary support
and; (2) non-product specific support like fertiliser, irrigation subsidies. It is to be noted that
if product specific and non-product specific support is below the de minimis limit then a
member is not required to include that support under the Amber box. De minimis limit is the
minimal amounts of trade distorting domestic support that are allowed under AoA. For
developing countries de minimis limit for product specific support is 10% of that member‟s
total value of a basic agricultural product during the relevant year. In case of non-product
specific support, this limit is 10% of that member‟s total agricultural production during the
relevant year (WTO 2002).
To be classified under the Green Box, domestic support measures should meet the
fundamental requirement that they have minimal impact on trade and production and shall
not have the effect of providing price support to producers. A member country can spend
without any financial limitation on measures that fit the description of Green box. Direct
payments under production-limiting programmes are exempted if these are based on fixed
area and yield or livestock payments made on a fixed number of heads (Blue box). Besides
this, all the direct or indirect government support provided to encourage agricultural and rural
development, investment subsidies and agricultural input subsidies provided to low income or
resource poor farmers in developing countries are exempted from the reduction commitments
(Article 6.2).

10
3.2: Methodology to Calculate Product Specific Support
Product specific support is calculated using the gap between a fixed External
Reference Price (ERP) and the applied administered price multiplied by the quantity of
production eligible to receive the applied administered price. Budgetary payments made to
maintain this gap, such as buying-in or storage costs, shall not be included in the AMS. The
AMS shall be calculated as close as practicable to the point of first sale of the basic
agricultural product concerned. Measures directed at agricultural processors shall be
included to the extent that such measures benefit the producers of the basic agricultural
products (Annex 3.7). About the determination of fixed ERP, Annex 3.9 of AoA states that it
shall be based on the years 1986 to 1988 and shall generally be the average FOB (Free On
Board) unit value for the basic agricultural product concerned in a net exporting country and
the average CIF ( Cost, Insurance and Freight) unit value for the basic agricultural product
concerned in a net importing country in the base period. The fixed reference price may be
adjusted for quality differences as necessary. Therefore, to calculate product specific support
administered price is compared to ERP based on 1986-88 prices. This is an illogical
methodology as product specific support increases over a period of time if inflation is not
considered while calculating product specific support.
3.3: Specific Provisions for China
As China became a member of WTO in 2001, the de minimis limit applicable for China was
negotiated at the time of accession; it is different from that of other developing countries. In
case of product specific limit, the de minimis limit for China is 8.5 per cent of value of a
specific product, whereas for non-product specific support it is 8.5 per cent of the total value
of agricultural production in China. Instead of 1986-88, the ERP for China is determined on
the basis of a three year average during 1996-1998. Therefore, to calculate product specific
support, the administered price is compared to ERP based on 1996-1998 prices (WTO 2001).
According to China‟s scheduled commitments on agriculture, China can provide support
through measures of the types described in Article 6.2 of the AoA. But the amount of such
support will be included in China's calculation of its AMS (WTO 2015a).
3.4: Product Specific Support to wheat under different Scenarios
China has notified domestic support to its agriculture sector till 2010. In this study, product
specific support to wheat is estimated in nominal terms as well as by considering inflation for
the years 2000-2016. Due to unavailability of procurement data for the period 2011-2016, the

11
product specific support is calculated by assuming different levels of procurement i.e. 20, 25,
and 30.50 percent of total production of wheat in China.
Section 4: Overview of domestic support in China
4.1 Trends in domestic support to agriculture sector based on notifications
China has notified domestic support to agriculture for the period 1999 to 2010. Supporting
tables related to commitments on agricultural products in Part IV of the schedules show that
China has notified domestic support in Yuan (WTO 2001). This document contains
information about domestic support to agriculture sector in China for the base period i.e.
1996-998.
Schedules related to domestic support show that product and non-product specific support to
the agriculture sector in China was below the de minimis limit during the base period i.e.
1996-1998 (WTO 2001). Product specific and non-product specific support during 1999 to
2010 was also below the de minimis limit. China has not given any support under Article 6.2
and the Blue Box during 1999-2010. Green box support which is permissible under AoA
without any limit, accounts the major share in total domestic support to agriculture sector in
China (table 1). General services and direct payments have more than 85 percent share in
total Green Box support for the year 2010. The share of public stockholding for food security
purposes has declined but in absolute terms it increased during 1999 to 2010 (table 2). China
has spent 77 billion Yuan on public stockholding in 2010.
Table 1: Trends in domestic support to agriculture sector in China
Year Current AMS
(Y millions) Green Box Total support
Value of
Production
(VoP)
Total support
as a percent
VoP
Product
Specific
Non- Product
specific (Y millions) (Y millions) Y millions %
AGST 935 29,402 137,595 167,932 2,048,860 8.2
1999 2,854 700 184,335 187,889 2,199,010 8.5
2000 3,503 745 207,899 212,147 2,220,320 9.6
2001 1,790 748 242,332 244,870 2,336,460 10.5
2002 1,275 234 252,117 253,626 2,513,970 10.1
2003 1,314 1,282 257,962 260,558 2,646,390 9.8
2004 4,194 1,974 308,493 314,661 3,254,030 9.7
2005 2,454 2,200 309,566 314,220 3,543,479 8.9
2006 1,364 14,951 356,524 372,839 3,684,030 10.1

12
2007 11,481 30,754 457,856 500,091 4,443,544 11.3
2008 16,764 78,863 593,014 688,641 5,279,877 13.0
2009 19,471 89,123 477,460 586,054 5,473,460 10.7
2010 25,351 97,664 534,632 657,647 6,289,740 10.5
Source: China‟s WTO notifications on domestic support
Note: Product specific and non product specific support was below the de minimis limit during 1999-2010
Table 2: Composition of Green Box Support in China
Year Green
Box
General services Public
stockholding for
food security
purposes
Domestic food
aid
Direct payments
Y millions Y
millions
Percent Y
millions
Percent Y
millions
Percent Y
millions
Percent
AGST 137,595 78,559 57.09 38,378 27.89 1,884 1.37 18,774 13.64
1999 184,335 1,09,110 59.19 47,596 25.82 2,640 1.43 24,989 13.56
2000 207,899 1,21,230 58.31 53,799 25.88 2,360 1.14 30,510 14.68
2001 242,332 1,45,046 59.85 59,685 24.63 683 0.28 36,918 15.23
2002 252,116 1,51,417 60.06 53,148 21.08 401 0.16 47,150 18.70
2003 257,962 1,54,274 59.81 54,526 21.14 178 0.07 48,984 18.99
2004 308,494 1,65,603 53.68 42,061 13.63 132 0.04 1,00,698 32.64
2005 309,566 1,72,729 55.80 44,087 14.24 99 0.03 92,651 29.93
2006 356,525 2,00,784 56.32 50,378 14.13 93 0.03 1,05,269 29.53
2007 457,857 2,80,164 61.19 54,201 11.84 49 0.01 1,23,443 26.96
2008 593,015 3,55,126 59.88 57,932 9.77 64 0.01 1,79,893 30.34
2009 477,460 2,32,279 48.65 69,538 14.56 59 0.01 1,75,584 36.77
2010 534,632 2,50,076 46.78 77,045 14.41 14 0.00 2,07,497 38.81
Source: China‟s WTO notifications on domestic support
4.2 Trends in product specific support to Wheat in China
China was a net importer of wheat during 1996-1998 and therefore, ERP was determined
on the basis of average import price i.e. CIF price during the base period (Table 3). ERP of
wheat for the purpose of calculating product specific support is 1698 Yuan/Ton.
Table 3: Determination of external reference price of wheat in China- HS code
10011000
Calendar Year
Import Volume Import Value CIF Price CIF Price 1/
(Tons) (US $) (US $/Ton) (RMB Yuan/Ton)
1996 45,12,381 1,02,30,59,000 226.7 1,885.0
1997 15,08,909 29,66,53,000 196.6 1,629.6
1998 12,75,384 24,33,73,000 190.8 1,579.8

13
Average of 1996-98
204.7 1,698.1
Source: WTO (2001)
Product specific support to wheat in China was negative during the base period because
the administered price was lower than the fixed ERP (table 4). Eligible production for state
procurement price refers to the amount purchased by state-owned enterprises from farmers at
state procurement price for the food security purpose, whereas the eligible production for
Protective Price refers to the amount purchased by state-owned enterprises from farmers at
protective price in order to protect farmer‟s income.
Table 4: Product specific aggregate measurement of support: market price support
Calendar
year Measure type (s)
Applied administered
price
(RMB Yuan/Ton)
External
reference price
(RMB
Yuan/Ton)
Eligible
production
(1000 Tons)
Total market
price support
(million RMB
Yuan)
1996 State Procurement Pricing 1480.0 1885.0 15000 -6075
1997 State Procurement Pricing 1480.0 1629.6 15000 -2244
Protective Price System 1340.0 1629.6 31002 -8979
1998 State Procurement Pricing 1420.0 1579.8 15000 -2397
Protective Price System 1260.0 1579.8 12956 -4144
Source: China‟s schedule, WTO
Table 5: Notified product specific market price support to wheat producer in China
Year
Applied
administered
price
External
reference
price
Eligible
Production
Value of
Production
(VoP)
Total market
price support
Share (Market
price
support/VoP)
Yuan/Ton Yuan/Ton
Thousand
Ton million Yuan million Yuan Percent
1999 1,254 1,698 37,800 NA -16,783 -
2000 1,136 1,698 35,050 NA -19,698 -
2001 1,124 1,698 38,600 NA -22,156 -
2002 1,240 1,698 34,850 105,280 -15,961 -15.16
2003 1,100 1,698 20,460 105,600 -12,235 -11.59
2004 - 1,698 0 141,610 - -
2005 - 1,698 0 161,860 - -
2006 1,410 1,698 40,688 161,360 -11,718 -7.26
2007 1,410 1,698 28,925 182,750 -8,330 -4.56
2008 1,490 1,698 41,740 199,300 -8,682 -4.36
2009 1,700 1,698 39,855 222,460 80 2.00
2010 1,760 1,698 23,113 235,330 14 2.46
Source: China‟s WTO notifications on domestic support
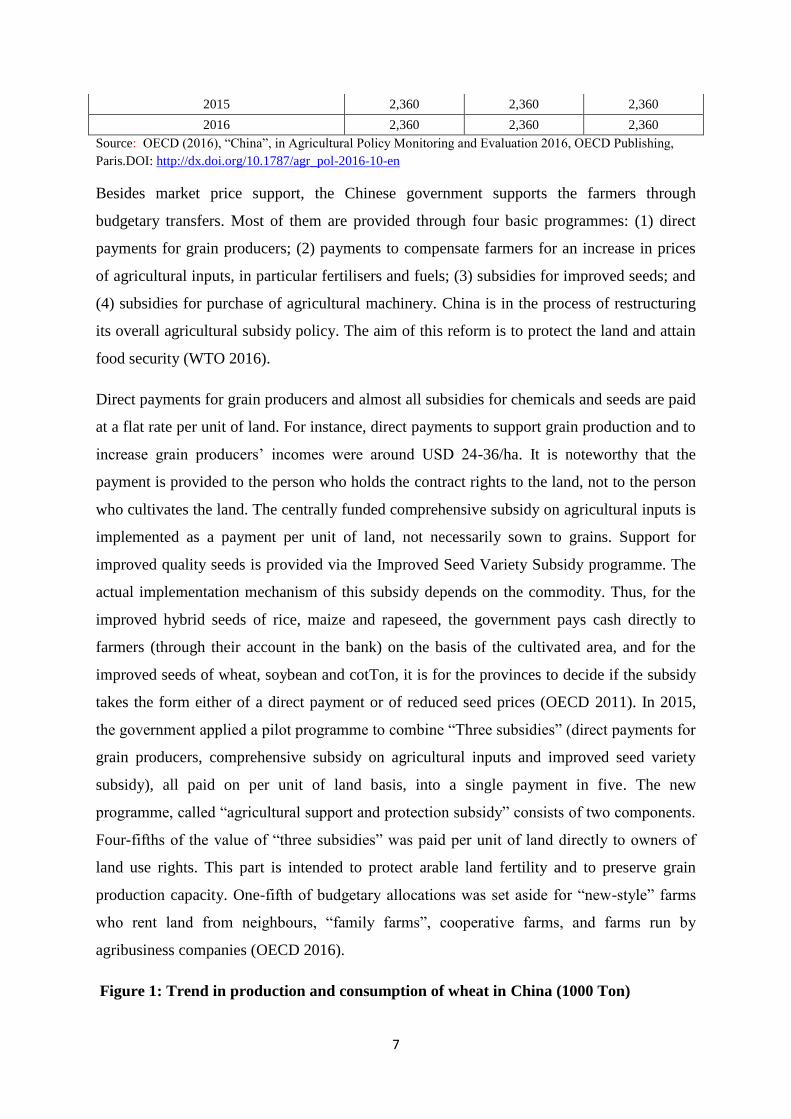
Table 6: Notified product specific Support to wheat (market price support and other
product specific budgetary support)
14
Year
Product Specific
Market Price Support
Other Product
Specific
Budgetary
Outlays
Total Product Specific support
Value of
Production
(VoP)
Other
product
specific
budgetary
outlays
Total
Product
specific
support
million Yuan million Yuan million Yuan million Yuan % of VoP % of VoP
1999 -16,783 0 -16,783 NA - -
2000 -19,698 0 -19,698 NA - -
2001 -22,156 0 -22,156 NA - -
2002 -15,961 4 -15,957 1,05,280 0.00 -15.16
2003 -12,235 110 -12,125 1,05,600 0.10 -11.48
2004 - 201 201 1,41,610 0.14 0.14
2005 - 1,058 1,058 1,61,860 0.65 0.65
2006 -11,718 1,081 -10,637 1,61,360 0.67 -6.59
2007 -8,330 1,101 -7,229 1,82,750 0.60 -3.96
2008 -8,682 2,159 -6,523 1,99,300 1.08 -3.27
2009 80 4,371 4,451 2,22,460 1.96 2.00
2010 1433 4,359 5,792 2,35,330 1.85 2.46
Source: China‟s WTO notifications on domestic support
China is providing product specific support to wheat through price support (minimum
purchase price scheme) as well as in the form of other product specific budgetary outlay
which includes subsidies for improved crop strains and seeds. Product specific market price
support to wheat was negative during 1999-2008 as the administered price of wheat was
lower than the fixed ERP. Product specific price support was positive but below the de
minimis limit for the years 2009 and 2010 (table 5). Other product specific budgetary outlays
for wheat have increased steeply from 0.10 percent of value of production in 2003 to 1.85
percent in 2010. Product specific AMS for wheat was 2.46 percent of value of production of
wheat in 2010. Table 6 shows that product specific support which includes price and
budgetary support to wheat was below the de minimis limit during 1999-2010.
Section 5: Result
This section deals with calculation of product specific support to wheat at different levels of
procurement of wheat by government agencies. This section is divided into two broad sub-
sections i.e. product specific support with, and without considering inflation in the Chinese
economy.
5.1: Product Specific Support to wheat without considering inflation
Product specific support to wheat is calculated as per the methodology given in AoA for
calculating Amber Box support. On an average, the share of procurement of wheat by

15
government agencies in total production was 33 percent during 1999-2010 (table 7). Due to
non- availability of data on procurement, product specific support is calculated by assuming
procurement level at 20, 25 and 30.5 percent for the period 2011-2016.
Table 7: Trend in production and procurement of wheat in China
Year Production Procurement
Share of procurement in
production
1000 Ton 1000 Ton Percent
1999 113,880 37,800 33
2000 99,640 35,050 35
2001 93,873 38,600 41
2002 90,290 34,850 39
2003 86,490 20,460 24
2004 91,952 No procurement 0
2005 97,445 No procurement 0
2006 108,466 40,688 38
2007 109,298 28,925 26
2008 112,464 41,740 37
2009 115,120 39,855 35
2010 115,180 23,113 20
Average (1999-2010) 102,842 34,108 33
Source: Index Mundi and China‟s domestic support notifications to WTO.
Table 8 shows that applied administered price for wheat was higher than the ERP and the gap
between these two variables has widened during 2011-2016. The Chinese government has not
increased the administered price of wheat during 2014-2016 and it remained at 2360
yuan/Ton during the same period. The value of production is calculated by multiplying
administered price with total production of wheat for the period 2011-2016.
Based on the assumption that eligible production equals 20 percent of production, the result
shows that product specific market price support has increased from 2.40 percent to 5.61
percent during 2011-2016. It remained at 5.61 percent of value of production for the period
2014-16 because of stable administered price over the same period. As applicable de minimis
limit for China is 8.5 percent of value of production, the results show that product specific
price support to wheat at 20 percent procurement level is under the permissible limit. Results
are same even in case of procurement level at 25 percent of total production of wheat as
product specific price support remained below the de minimis level. Product specific market
price support to wheat is higher than the de minimis limit if the procurement level is 30.5
percent of total production of wheat (table 9). Product specific market price support to wheat

16
was 8.56 percent during 2014-16 and it crosses the de minimis limit applicable for China. It is
clear that China does not have much policy space to implement price support policy for
wheat under the WTO regime.
Table 8: Product specific market price support to wheat by assuming eligible
production 20% of total wheat production
Year
Applied
administer
ed price
External
reference
price
Eligible
production
Total
production
Value of
production
(VoP)
Total market
support
Share (price
support/VoP
)
Yuan/Ton Yuan/To
n
Thousand
Ton
Thousand
Ton
Million
Yuan
Million
Yuan Percent
2011 1930 1698 23480 117400 226582 5447 2.40
2012 2040 1698 24205 121023 246887 8278 3.35
2013 2240 1698 24386 121930 273123 13217 4.84
2014 2360 1698 25242 126208 297851 16710 5.61
2015 2360 1698 26038 130190 307248 17237 5.61
2016 2360 1698 26000 130000 306800 17212 5.61
Source:
1. OECD (2016), “China”, in Agricultural Policy Monitoring and Evaluation 2016, OECD Publishing,
Paris.DOI: http://dx.doi.org/10.1787/agr_pol-2016-10-en
2. China‟s WTO notifications on domestic support
3. Index Mundi. http://www.indexmundi.com/ accessed on 10th
July, 2016
Table 9: Product specific market price support to wheat under different level of eligible
production
Year
Market support (Million
Yuan)
Percent of VoP
Market support (Million
Yuan)
Percent of VoP
Market support (Million
Yuan)
Percent of VoP
Eligible
Production → 20% 25% 30.50%
2011 5,447 2.40 6,809 3.01 8,307 3.67
2012 8,278 3.35 10,347 4.19 12,624 5.11
2013 13,217 4.84 16,522 6.05 20,156 7.38
2014 16,710 5.61 20,887 7.01 25,483 8.56
2015 17,237 5.61 21,546 7.01 26,287 8.56
2016 17,212 5.61 21,515 7.01 26,248 8.56
Source:
1. OECD (2016), “China”, in Agricultural Policy Monitoring and Evaluation 2016, OECD Publishing,
Paris.DOI: http://dx.doi.org/10.1787/agr_pol-2016-10-en
2. China‟s WTO notifications on domestic support
3. Index Mundi. http://www.indexmundi.com/ accessed on 10th
July, 2016

17
However, policy space would further shrink if other budgetary support to wheat is included in
these calculations. By assuming that the other budgetary support is 1.85 percent of value of
production during 2011-2016 (same level as in 2010), total product specific support to wheat
is calculated by adding product specific price support and other budgetary support to wheat
during 2011-2016. Table 10 shows that product specific support to wheat where eligible
production equals 20 percent of production was 7.46 percent in 2016, which is very close to
the maximum permissible limit applicable (8.5 percent) for China. The Chinese government
policy to keep price support to wheat at 2360 Yuan/Ton has helped in keeping product
specific support below the de minimis level at 20 percent level of procurement. At
procurement levels equal to 25 and 30.5 percent, product specific support crosses the de
minimis level during 2014-2016. To keep the product specific support for wheat below the de
minimis limit, China has to refrain from increasing purchase price or procurement quantity
and other budgetary support in future. Therefore, it is difficult for China to continue with
market support policy for wheat due to shrinking policy space under the Amber Box.
Table 10: Product specific support (price and budgetary support) to wheat
Year Other Product specific
budgetary support
(assuming at same
level as in 2010)
Product specific market price
support at different level of
procurement
Total Product specific support at
different level of procurement
Eligible
Production
→
20% 25% 30.50% 20% 25% 30.50%
2011 1.85 2.40 3.01 3.67 4.25 4.86 5.52
2012 1.85 3.35 4.19 5.11 5.20 6.04 6.96
2013 1.85 4.84 6.05 7.38 6.69 7.90 9.23
2014 1.85 5.61 7.01 8.56 7.46 8.86 10.41
2015 1.85 5.61 7.01 8.56 7.46 8.86 10.41
2016 1.85 5.61 7.01 8.56 7.46 8.86 10.41
Source:
1. OECD (2016), “China”, in Agricultural Policy Monitoring and Evaluation 2016, OECD Publishing,
Paris.DOI: http://dx.doi.org/10.1787/agr_pol-2016-10-en
2. China‟s WTO notifications on domestic support
3. Index Mundi. http://www.indexmundi.com/ accessed on 10th
July, 2016
5.2 Product specific support without considering inflation
Comparison of the administered price with the ERP (1996-98) by ignoring inflation is
questionable on the basis of economic logic. Due to inflation, the value of money or
purchasing power of money declines as they have an inverse relationship. Though, Article

18
18.4 of AoA mentions inflation, it is not a Member‟s unilateral right to consider inflation
while calculating product specific support. Article 18.4 of AoA states that:
“In the review process Members shall give due consideration to the influence of
excessive rates of inflation on the ability of any Member to abide by its domestic
support commitments”.
This flexibility depends on the discretion of other members of WTO during the review
process. For example, in case of breaching de minimis limit, China has to submit domestic
support notification without considering the inflation. Then members in the review process or
in Committee on Agriculture may give flexibility to China to consider inflation while
calculating domestic support. The other related issue is the definition of "excessive inflation".
China can argue for full inflation allowance to be given while calculating domestic support,
but other Members may not allow for full inflation allowance and can argue that excessive
inflation does not mean full inflation allowance. It is to be noted that a country may need to
seek endorsement from Committee on Agriculture (CoA) in various years which would lead
to unpredictability. There is still a lot of ambiguity about the definition of "excessive
inflation" which is curtailing policy space for developing countries. Despite the ambiguity
about the definition of excessive inflation, product specific price support to wheat in China is
calculated by considering full inflation allowance. The data on consumer price index (CPI)
for China is extracted from World Bank database. The value of CPI was 144 in 2016 and the
inflation rate was around 2.39 percent per annum during the base period (1996-98) to 2016
(figure 3).
Figure 3: Trend in consumer price index of China during 1996 to 2016 (base year 1996-
98)
0
20
40
60
80
100
120
140
160
19
96
-98
19
99
20
00
20
01
20
02
20
03
20
04
20
05
20
06
20
07
20
08
20
09
20
10
20
11
20
12
20
13
20
14
20
15
20
16
Consumer Price Index

19
Source: World Development Indicators, World Bank http://data.worldbank.org/data-catalog/world-
development-indicators access on 10th July, 2016
Figure 4: Comparison of external reference price and applied administered price
(Yaun/Ton)
Source:
1. OECD (2016), “China”, in Agricultural Policy Monitoring and Evaluation 2016, OECD Publishing,
Paris.DOI: http://dx.doi.org/10.1787/agr_pol-2016-10-en
2. China‟s WTO notifications on domestic support
3. World Development Indicators, World Bank http://data.worldbank.org/data-catalog/world-
development-indicators access on 10th July, 2016
Given the rates of inflation, it is obvious that administered price at current prices is
higher than the fixed ERP as shown in figure 4; this is eroding the policy space to implement
price support policy. Without considering inflation, breaching the product specific de
minimis limit is inevitable. However, the result will be different if inflation is taken into
account while calculating product specific price support. Deflated administered price is
consistently below ERP during 1999 to 2016 except in the year 2014. It results in a negative
price support for wheat in China in almost all the years except in 2014. Product specific price
support was -11.28 percent in 1999 and it increased to -.72 percent in 2016 (table 11).
Table 11: Product specific market price support to wheat in China by considering
inflation
Year
Applied
administ
ered
price
(RMB
Yuan/To
n)
External
reference
price
(RMB
Yuan/To
n)
Eligible
production
(thousand Ton)
Total
production
(1000 MT)
Value of
production
(VoP)
Total
market
support Share
(price
support/V
oP) ( Yuan
millions)
(million
RMB
Yuan)
1999 1,267 1,698 37,800 1,13,880 1,44,338 -16,275 -11.28
2000 1,145 1,698 35,050 99,640 1,14,114 -19,373 -16.98
0
500
1000
1500
2000
2500
19
99
20
00
20
01
20
02
20
03
20
04
20
05
20
06
20
07
20
08
20
09
20
10
20
11
20
12
20
13
20
14
20
15
20
16
External Reference Price Nominal Applied Administered Price
Deflated Applied Adminsterd Price (1996-98)

20
2001 1,125 1,698 38,600 93,873 1,05,610 -22,116 -20.94
2002 1,251 1,698 34,850 90,290 1,12,928 -15,588 -13.80
2003 1,097 1,698 20,460 86,490 94,865 -12,300 -12.97
2004
1,698 - 91,952 - 0
2005
1,698 - 97,445 - 0
2006 1,310 1,698 40,688 1,08,466 1,42,090 -15,787 -11.11
2007 1,251 1,698 28,925 1,09,298 1,36,687 -12,941 -9.47
2008 1,248 1,698 41,740 1,12,464 1,40,393 -18,769 -13.37
2009 1,434 1,698 39,855 1,15,120 1,65,123 -10,507 -6.36
2010 1,437 1,698 23,113 1,15,180 1,65,553 -6,025 -3.64
Eligible production equal to 20 percent of total production of wheat during 2011-2016
2011 1,495 1,698 23,480 1,17,400 1,75,544 -4,760 -2.71
2012 1,540 1,698 24,205 1,21,023 1,86,333 -3,833 -2.06
2013 1,647 1,698 24,386 1,21,930 2,00,851 -1,237 -0.62
2014 1,702 1,698 25,242 1,26,208 2,14,834 107 0.05
2015 1,678 1,698 26,038 1,30,190 2,18,461 -520 -0.24
2016 1,639 1,698 26,000 1,30,000 2,13,051 -1,538 -0.72
Source:
1. OECD (2016), “China”, in Agricultural Policy Monitoring and Evaluation 2016, OECD Publishing,
Paris.DOI: http://dx.doi.org/10.1787/agr_pol-2016-10-en
2. China‟s WTO notifications on domestic support
3. Index Mundi. http://www.indexmundi.com/ accessed on 10th
July, 2016 4. World Development Indicators, World Bank http://data.worldbank.org/data-catalog/world-
development-indicators access on 10th July, 2016
Table 12: Product specific market price support to wheat under different level of
eligible production (by considering inflation)
Year
Market support (Million
Yuan)
Percent of VoP
Market support (Million
Yuan)
Percent of VoP
Market support (Million
Yuan)
Percent of VoP
Eligible
Production → 20% 25% 30.50%
2011 -4760 -2.71 -5950 -3.39 -7140 -4.07
2012 -3833 -2.06 -4791 -2.57 -5749 -3.09
2013 -1237 -0.62 -1547 -0.77 -1856 -0.92
2014 107 0.05 133 0.06 160 0.07
2015 -520 -0.24 -650 -0.30 -780 -0.36
2016 -1538 -0.72 -1922 -0.90 -2307 -1.08 Source:
1. OECD (2016), “China”, in Agricultural Policy Monitoring and Evaluation 2016, OECD Publishing,
Paris.DOI: http://dx.doi.org/10.1787/agr_pol-2016-10-en
2. China‟s WTO notifications on domestic support
3. Index Mundi. http://www.indexmundi.com/ accessed on 10th
July, 2016 4. World Development Indicators, World Bank http://data.worldbank.org/data-catalog/world-
development-indicators access on 10th July, 2016

21
At procurement levels of 25 and 30.5 percent, product specific price support remained
below the de minimis level (table 12). Product specific support which includes both price as
well as budgetary support also remained well below the applicable permissible limit for
China. Therefore, China has no problem in implementing price and budgetary support policy
for wheat in near future if due consideration is given to inflation while calculating product
specific support (table 13). However, the gap between deflated administered price and the
ERP is narrowing down on the one hand, and the upward trend in product specific budgetary
support on the other may create problems for China to keep product specific support to wheat
within the permissible limit.
Table 13: Product specific support (price and other budgetary support) to wheat under
different level of eligible production (by considering inflation)
Year Other Product specific
budgetary support
(assuming at same
level as in 2010)
Product specific price support at
different level of procurement
Total Product specific support at
different level of procurement
Eligible
Production
→ 20% 25% 30.50% 20% 25% 30.50%
2011 1.85 -2.71 -3.39 -4.07 -0.86 -1.54 -2.22
2012 1.85 -2.06 -2.57 -3.09 -0.21 -0.72 -1.24
2013 1.85 -0.62 -0.77 -0.92 1.23 1.08 0.93
2014 1.85 0.05 0.06 0.07 1.90 1.91 1.92
2015 1.85 -0.24 -0.30 -0.36 1.61 1.55 1.49
2016 1.85 -0.72 -0.90 -1.08 1.13 0.95 0.77
Source:
1. OECD (2016), “China”, in Agricultural Policy Monitoring and Evaluation 2016, OECD Publishing,
Paris.DOI: http://dx.doi.org/10.1787/agr_pol-2016-10-en
2. China‟s WTO notifications on domestic support
3. Index Mundi. http://www.indexmundi.com/ accessed on 10th
July, 2016 4. World Development Indicators, World Bank http://data.worldbank.org/data-catalog/world-
development-indicators access on 10th July, 2016
Section 6: Conclusion and way forward
The absolute number of undernourished people in China has declined steeply from around
300 million in 1991 to 145 million in 2014–16 due to proactive agricultural policies and
programmes. Procurement of foodgrains though price support measures as well as product
specific budgetary support would acquire greater importance in targeting hunger and
supporting millions of low income or resource poor farmers. Results of this study show that
China does not have much needed flexibility or policy space to implement price support
policy for wheat in near future. It would be difficult for China to provide product specific

22
support to wheat without breaching the applicable AMS limit for product specific support to
agriculture sector and it would severely constrain the efforts of the government to address
undernourishment prevalent amongst 133 million of its population.
Results also show that calculation of product specific support by considering inflation helps
in keeping support to grains within permissible limit. But there is ambiguity about the
definition of "excessive inflation" under Article 18.4 of AoA and using full inflation
allowance to calculate product specific support. Given these constraints, China has not
increased minimum purchase price for wheat since 2014 despite increase in cost of
cultivation of wheat. It is difficult for China to increase minimum purchase price,
procurement of grains and other product specific support to wheat due to China‟s binding
commitments related to agriculture sector.
Given the fact that a very large number of people are suffering from hunger and
undernourishment, the erosion of policy space to implement price support based food security
policy will hamper the welfare of millions of low income or resource poor farmers as well as
millions of undernourished people living in China. In many developing countries, markets
which are not well developed need price support backed public stockholding programmes to
support their farmers. Even many developed countries like the USA and the EU are using
price support to build their own agriculture sector and support their farmers. Due to the
eroding policy space, developing countries have sought to amend the provisions of the AoA
so that they will not face problems in implementing food security policy without breaching
their commitments under the WTO rules. Various proposals on food security by different
negotiating groups such as the African Group and the G 33 Group were discussed during the
Doha Round negotiations which sought to give flexibility to the developing countries
members to implement the food security policy without violating the provisions of AoA. Due
to the differences among the WTO members, a permanent solution on the food security issue
remained elusive during the 10th
Ministerial Conference held at Nairobi during 15-18
December, 2015. At the Nairobi ministerial conference, it was decided that members shall
engage to negotiate and make all the concentrated efforts to agree and adopt a permanent
solution (WTO 2015b). At present, WTO member countries are engaged in finding a
permanent solution so that developing countries members have the flexibility to implement
food security policy as per their prevailing socio-economic situation without breaching their
commitments under AoA. Whatever the permanent solution to the issue of public
23
stockholding, the WTO members should ensure that no one dies of hunger and extreme
poverty due to unfair and unjust provisions of WTO. China along with other developing
countries should come together and demand a permanent solution which allows member
countries to implement their food security policies without being constrained by WTO rules.
References
Cheng F (2008) China Shadow WTO Agricultural Domestic Support Notifications,
International Food Policy Research Institute, Discussion paper 00793
FAO (2015) Regional overview of food insecurity: Asia and the Pacific.
http://www.fao.org/3/a-i4624e.pdf, accessed on 1st July, 2015
Gale, Fred (2013), Growth and Evolution in China‟s Agricultural Support Policies, ERR-153.
U.S. Department of Agriculture, Economic Research Service, August 2013.
OECD (2011), “China”, in Agricultural Policy Monitoring and Evaluation 2011, OECD
Publishing, Paris. DOI: http://dx.doi.org/10.1787/agr_pol-2011-en
OECD (2013), “China”, in Agricultural Policy Monitoring and Evaluation 2013, OECD
Publishing, Paris. DOI: http://dx.doi.org/10.1787/agr_pol-2013-en
OECD (2015a), Issues in Agricultural Trade Policy: Proceedings of the 2014 OECD Global
Forum on Agriculture, OECD Publishing, Paris.
http://dx.doi.org/10.1787/9789264233911-en
OECD (2015b), “China”, in Agricultural Policy Monitoring and Evaluation 2015, OECD
Publishing, Paris. DOI: http://dx.doi.org/10.1787/agr_pol-2015-10-en
OECD (2016), “China”, in Agricultural Policy Monitoring and Evaluation 2016, OECD
Publishing, Paris.DOI: http://dx.doi.org/10.1787/agr_pol-2016-10-en
South Centre (2015) WTO‟s MC10: Agriculture Negotiations-Public Stockholding,
Analytical Note SC/TDP/AN/MC10/3. http://www.southcentre.int/analytical-note-
december-2015-3/ , Accessed on 5th march, 2016
WTO (2001) Working Party on the Accession of China: Communication from China on
domestic support. Document number WT/ACC/CHN/38/Rev.3
WTO (2002) The legal texts: the results of the Uruguay Round of Multilateral Trade
Negotiations. Published by the WTO Secretariat
WTO (2015a) Domestic Support notification submitted to Committee on Agriculture: China.
Document number G/AG/N/CHN/28.
WTO (2015b) Public stockholding for food security purposes, Ministerial Conference Tenth
Session. Document no. WT/MIN(15)/44 & WT/L/979
WTO (2016) Trade policy review China. WT/TPR/S/342.
https://www.wto.org/english/thewto_e/countries_e/china_e.htm Accessed on 9th
August, 2016