Embed Size (px)
Citation preview

Write off-loading:Practical power management for
enterprise storageD. Narayanan, A. Donnelly, A. Rowstron
Microsoft Research, Cambridge, UK

Energy in data centers
• Substantial portion of TCO– Power bill, peak power ratings– Cooling– Carbon footprint
• Storage is significant– Seagate Cheetah 15K.4: 12 W (idle)– Intel Xeon dual-core: 24 W (idle)
2

Challenge
• Most of disk’s energy just to keep spinning– 17 W peak, 12 W idle, 2.6 W standby
• Flash still too expensive– Cannot replace disks by flash
• So: need to spin down disks when idle
3
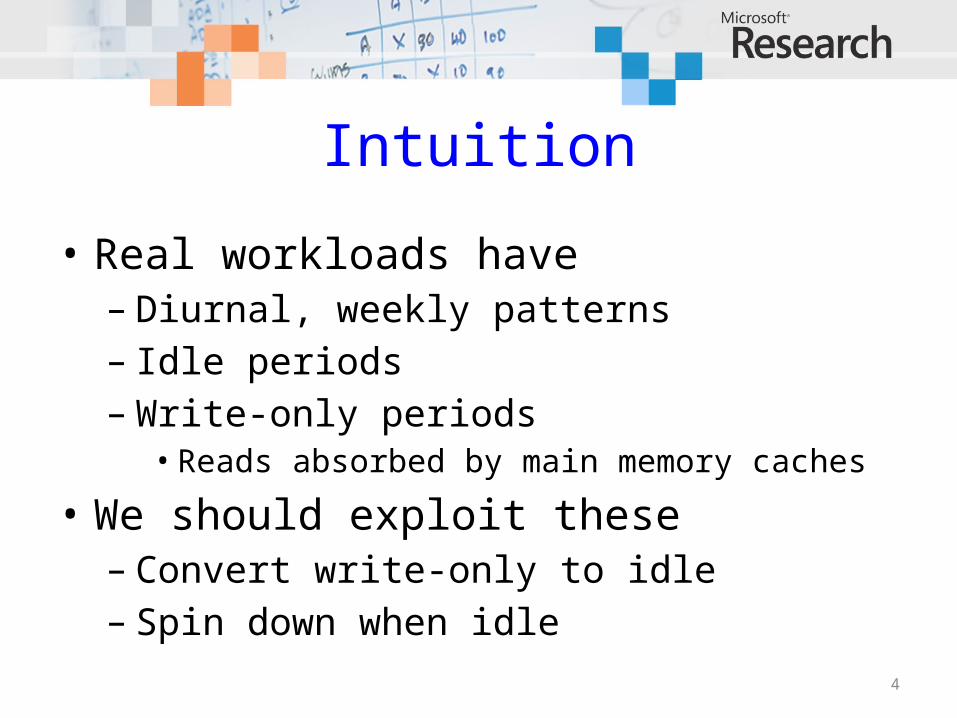
Intuition
• Real workloads have– Diurnal, weekly patterns– Idle periods– Write-only periods
• Reads absorbed by main memory caches
• We should exploit these– Convert write-only to idle– Spin down when idle
4

Small/medium enterprise DC
• 10s to100s of disks– Not MSN search
• Heterogeneous servers– File system, DBMS,
etc
• RAID volumes• High-end disks
5
FS1
FS2
DBMS
Vol 0
Vol 1
Vol 0
Vol 1
Vol 2
Vol 0
Vol 1

Design principles
• Incremental deployment– Don’t rearchitect the storage
• Keep existing servers, volumes, etc.
– Work with current, disk-based storage• Flash more expensive/GB for at least 5-10
years• If system has some flash, then use it
• Assume fast network– 1 Gbps+
6

Write off-loading
• Spin down idle volumes• Offload writes when spun down
– To idle / lightly loaded volumes– Reclaim data lazily on spin up– Maintain consistency, failure resilience
• Spin up on read miss– Large penalty, but should be rare
7

Roadmap
• Motivation
• Traces
• Write off-loading
• Evaluation
8

How much idle time is there?
• Is there enough to justify spinning down?– Previous work claims not
• Based on TPC benchmarks, cello traces
– What about real enterprise workloads?• Traced servers in our DC for one week
9

MSRC data center traces
• Traced 13 core servers for 1 week• File servers, DBMS, web server, web cache,
…• 36 volumes, 179 disks• Per-volume, per-request tracing• Block-level, below buffer cache
• Typical of small/medium enterprise DC– Serves one building, ~100 users– Captures daily/weekly usage patterns 10

Idle and write-only periods
11
0 10 20 30 40 50 60 70 80 90 1000
5
10
15
20
25
30
Read-onlyRead/write
% of time volume active
Num
ber o
f vol
umes
14% 80%
21%
47%
Mean active time per disk

Roadmap
• Motivation
• Traces
• Write off-loading
• Preliminary results
12

Write off-loading: managers
• One manager per volume– Intercepts all block-level requests– Spins volume up/down
• Off-loads writes when spun down– Probes logger view to find least-loaded
logger• Spins up on read miss
– Reclaims off-loaded data lazily
13

Write off-loading: loggers
• Reliable, write-optimized, short-term store– Circular log structure
• Uses a small amount of storage– Unused space at end of volume, flash
device
• Stores data off-loaded by managers– Includes version, manager ID, LBN range– Until reclaimed by manager
• Not meant for long-term storage 14

Reclaim
Off-load life cycle
15
v1
v2
ReadWrite
Spin upSpin down
ProbeWriteInvalidate

Consistency and durability
• Read/write consistency– manager keeps in-memory map of off-
loads– always knows where latest version is
• Durability – Writes only acked after data hits the disk
• Same guarantees as existing volumes– Transparent to applications 16

Recovery: transient failures
• Loggers can recover locally– Scan the log
• Managers recover from logger view– Logger view is persisted locally– Recovery: fetch metadata from all
loggers– On clean shutdown, persist metadata
locally• Manager recovers without network
communication17

Recovery: disk failures
• Data on original volume: same as before– Typically RAID-1 / RAID-5– Can recover from one failure
• What about off-loaded data?– Ensure logger redundancy >= manager– k-way logging for additional redundancy
18

Roadmap
• Motivation
• Traces
• Write off-loading
• Experimental results
19

Testbed
• 4 rack-mounted servers– 1 Gbps network– Seagate Cheetah 15k RPM disks
• Single process per testbed server– Trace replay app + managers + loggers– In-process communication on each
server– UDP+TCP between servers
20

Workload
• Open loop trace replay• Traced volumes larger than testbed
– Divided traced servers into 3 “racks”• Combined in post-processing
• 1 week too long for real-time replay– Chose best and worst days for off-load
• Days with the most and least write-only time
21

Configurations
• Baseline• Vanilla spin down (no off-load)• Machine-level off-load
– Off-load to any logger within same machine
• Rack-level off-load– Off-load to any logger in the rack
22

Storage configuration
• 1 manager + 1 logger per volume– For off-load configurations
• Logger uses 4 GB partition at end of volume
• Spin up/down emulated in s/w– Our RAID h/w does not support spin-
down– Parameters from Seagate docs
• 12 W spun up, 2.6 W spun down• Spin up delay is 10—15s, energy penalty is
20 J– Compared to keeping the spindle spinning always
23

Energy savings
24
Worst day Best day0
102030405060708090
100VanillaMachine-level off-loadRack-level off-load
Ener
gy (%
of b
asel
ine)

Energy by volume (worst day)
25
10 20 30 40 50 60 70 80 90 1000
5
10
15
20
25
30 Rack-level off-loadMachine-level off-loadVanilla
Energy consumed (% of baseline)
Num
ber o
f vol
umes

Response time: 95th percentile
26
Best day Read
Worst day Read
Best day Write
Worst day
Write
0
100
200
300
400
500
600
700BaselineVanillaMachine-level off-loadRack-level off-load
Res
po
nse
tim
e (s
eco
nd
s)

Response time: mean
27
Best day Read
Worst day Read
Best day Write
Worst day
Write
0
50
100
150
200
250BaselineVanillaMachine-level off-loadRack-level off-load
Res
po
nse
tim
e (s
eco
nd
s)

Conclusion
• Need to save energy in DC storage• Enterprise workloads have idle
periods– Analysis of 1-week, 36-volume trace
• Spinning disks down is worthwhile– Large but rare delay on spin up
• Write off-loading: write-only idle– Increases energy savings of spin-down
28

Questions?

Related Work
• PDC↓ Periodic reconfiguration/data movement↓ Big change to current architectures
• Hibernator↑ Save energy without spinning down↓ Requires multi-speed disks
• MAID– Need massive scale

Just buy fewer disks?
• Fewer spindles less energy, but– Need spindles for peak performance
• A mostly-idle workload can still have high peaks
– Need disks for capacity• High-performance disks have lower
capacities• Managers add disks incrementally to grow
capacity
– Performance isolation• Cannot simply consolidate all workloads
31

Circular on-disk log
32
H
HEAD TAIL
7 8 9 4 ........8 7........ 1 2 7-9 X X X 1 2X X
ReclaimWrite
Spin up

Circular on-disk log
Nuller
Head
Tail
Reclaim
Header block
Null blocks
Active log
Stale versions
Invalidate
33

Client state
34

35
Server state
35

Mean I/O rate
36
0 1 2 0 1 2 3 4 0 1 0 1 0 1 2 0 1 0 1 2 0 1 2 0 1 0 0 1 2 3 0 1 0 1 2 3
usr proj prn hm rsrch prxy
src1 src2 stg ts web mds
wdev0
20406080
100120140160180200
ReadWrite
Requ
ests
/ s
econ
d

Peak I/O rate
37
0 1 2 0 1 2 3 4 0 1 0 1 0 1 2 0 1 0 1 2 0 1 2 0 1 0 0 1 2 3 0 1 0 1 2 3
usr proj prn hm rsrch prxy
src1 src2 stg ts web mds
wdev0
500100015002000250030003500400045005000
ReadWrite
Requ
ests
/ s
econ
d

Drive characteristics
Typical ST3146854 drive +12V LVD current profile
38

Drive characteristics
39