Embed Size (px)
Citation preview
Migrating Server Storage to SSDs: Analysis of Tradeoffs
Dushyanth NarayananEno Thereska
Austin DonnellySameh Elnikety
Antony Rowstron
Microsoft Research Cambridge, UK

Solid-state drive (SSD)
2
NAND Flash memory
Flash Translation Layer (FTL)
Block storage interface
Persistent
Random-access
Low power
Cost, Parallelism, FTL complexity
USB drive Laptop SSD “Enterprise” SSD
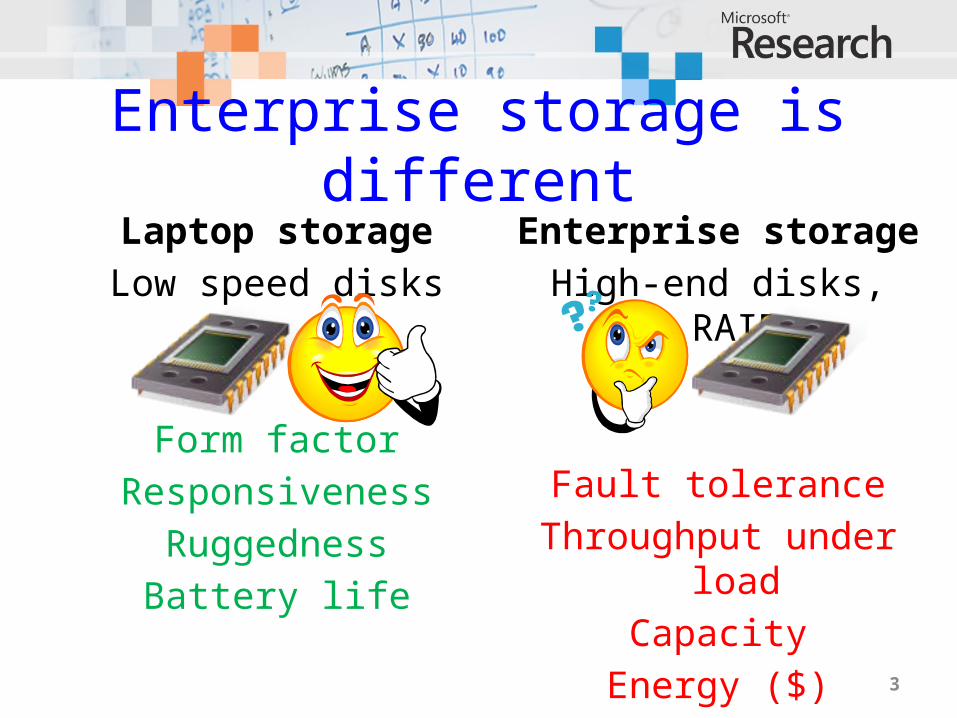
Enterprise storageHigh-end disks, RAID
Fault toleranceThroughput under
loadCapacity
Energy ($)
Laptop storageLow speed disks
Form factorResponsiveness
RuggednessBattery life
Enterprise storage is different
3

Flash$$$$$
Replacing disks with SSDs
4
Disks$$
Matchperformance
Flash$
Matchcapacity
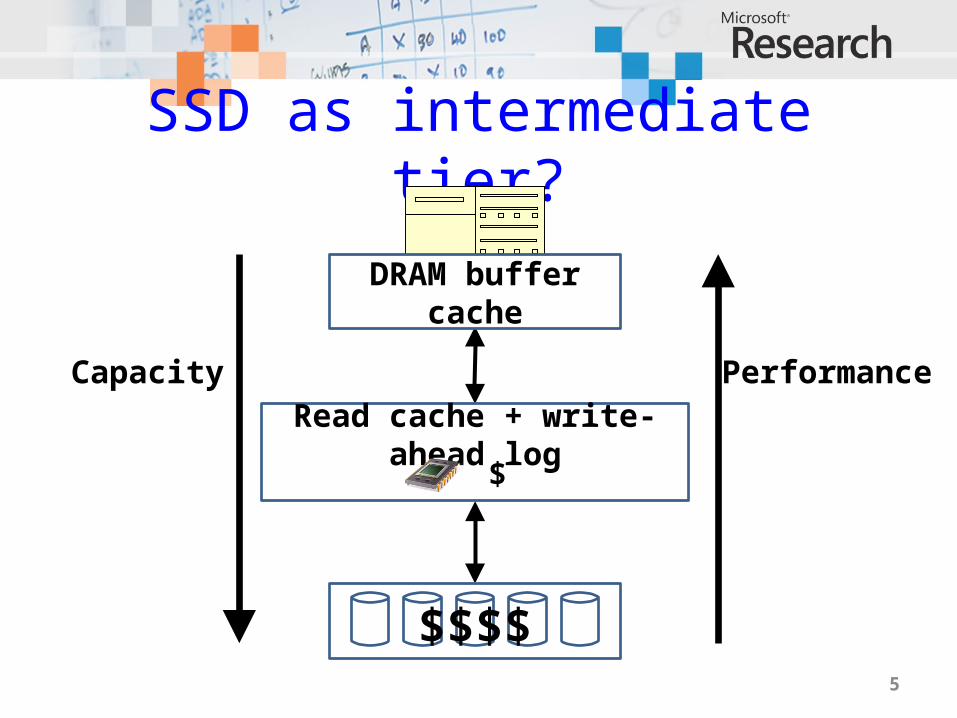
SSD as intermediate tier?
5
DRAM buffer cache
Read cache + write-ahead log
Capacity Performance
$$$$
$

Other options?
• Hybrid drives?– Flash inside the disk can pin hot blocks– Volume-level tier more sensible for
enterprise
• Modify file system?• We want to plug in SSDs
transparently– Replace disks by SSDs– Add SSD tier for caching and/or write
logging6

Challenge
• Given a workload–Which device type, how many, 1 or 2
tiers?
• We benchmarked enterprise SSDs, disks
• We traced many real enterprise workloads
• And built an automated provisioning tool– Takes workload, device models– And computes best configuration for
workload
7
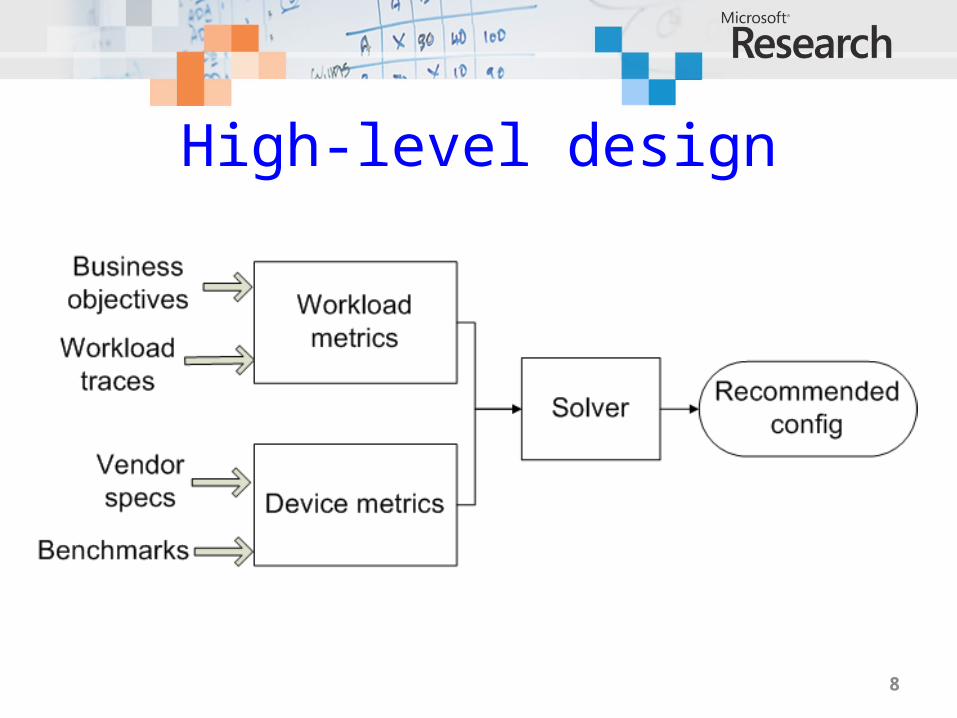
High-level design
8

Devices (2008)
9
Device Price Size Sequential throughput
Random-access
throughputSeagate Cheetah 10K $123 146 GB 85 MB/s 288 IOPSSeagate Cheetah 15K $172 146 GB 88 MB/s 384 IOPSMemoright MR25.2 $739 32 GB 121 MB/s 6450 IOPSIntel X25-E (2009) $415 32GB 250 MB/s 35000 IOPSSeagate Momentus 7200 $53 160 GB 64 MB/s 102 IOPS

Characterizing devices
• Sequential vs random, read vs write– Some SSDs have slow random writes– Newer SSDs remap internally to
sequential–We model both “vanilla” and
“remapped”
• Multiple capacity versions per device– Different cost/capacity/performance
tradeoffs10
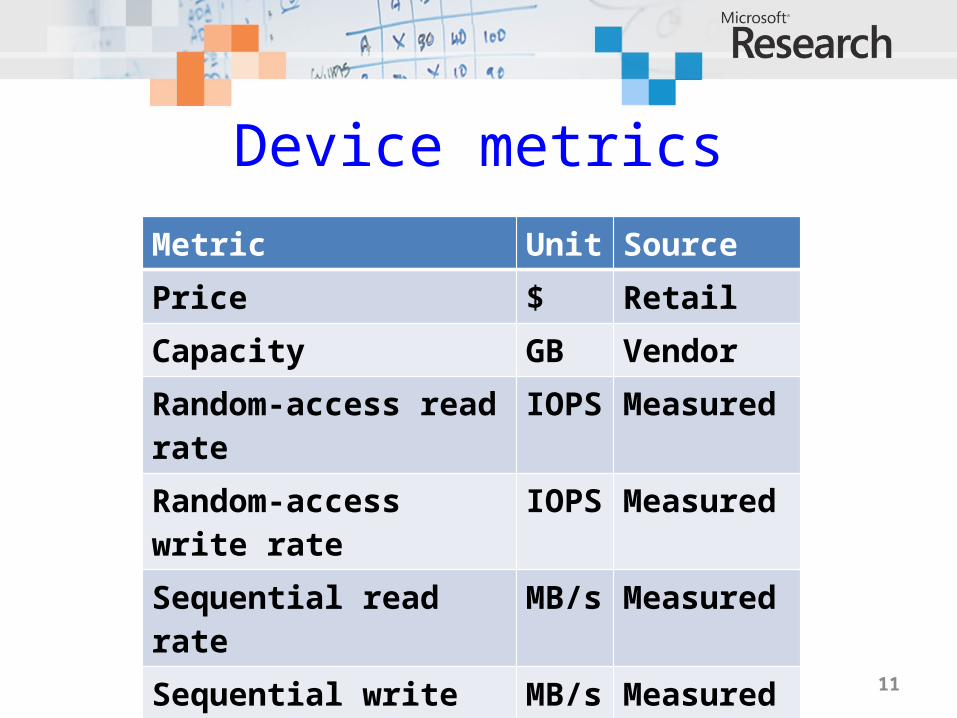
Device metricsMetric Unit SourcePrice $ RetailCapacity GB VendorRandom-access read rate IOPS MeasuredRandom-access write rate IOPS MeasuredSequential read rate MB/s MeasuredSequential write rate MB/s MeasuredPower W Vendor
11
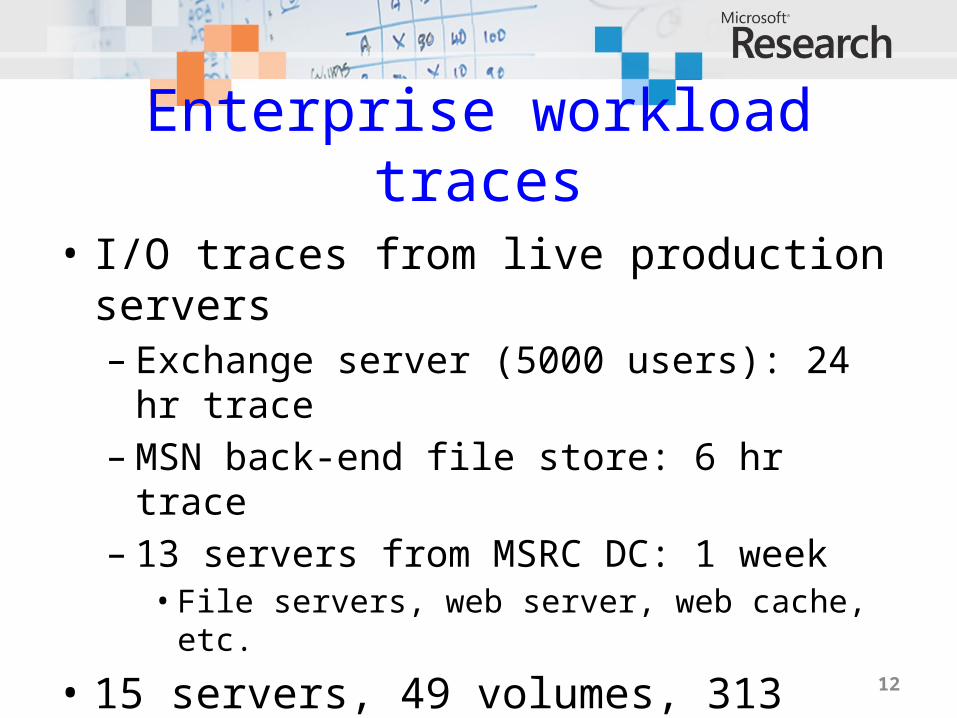
Enterprise workload traces
• I/O traces from live production servers– Exchange server (5000 users): 24 hr
trace–MSN back-end file store: 6 hr trace– 13 servers from MSRC DC: 1 week• File servers, web server, web cache, etc.
• 15 servers, 49 volumes, 313 disks, 14 TB– Volumes are RAID-1, RAID-10, or RAID-5
12

Enterprise workload traces
• Traces are at volume (block device) level
• Below buffer cache, above RAID controller
• Timestamp, LBN, size, read/write• Each volume’s trace is a workload–We consider each volume separately
13
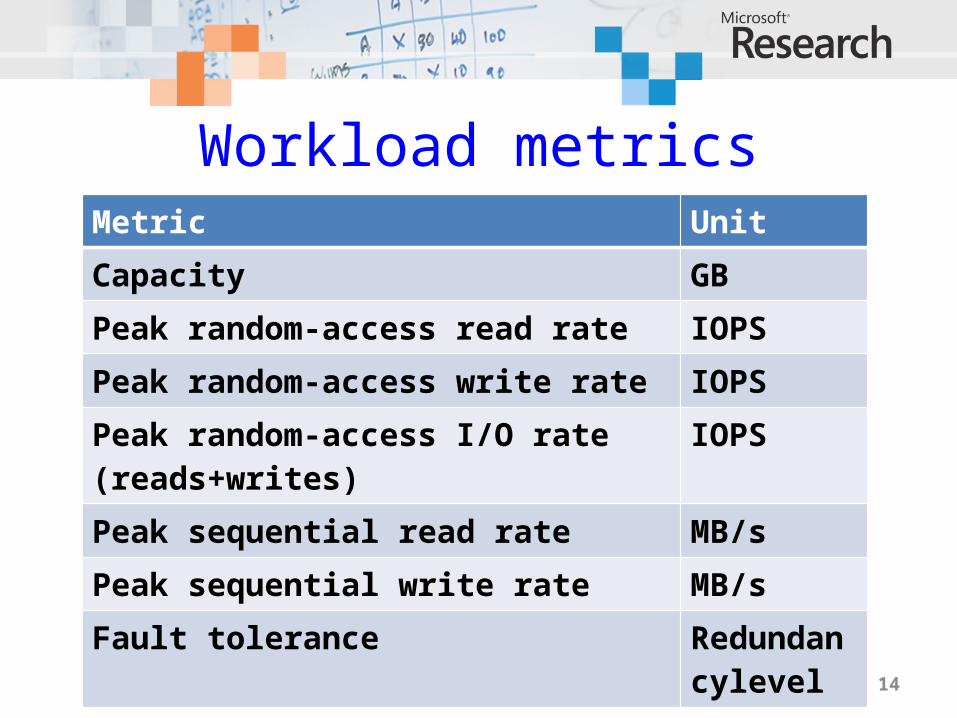
Workload metricsMetric UnitCapacity GBPeak random-access read rate IOPSPeak random-access write rate IOPSPeak random-access I/O rate (reads+writes) IOPSPeak sequential read rate MB/sPeak sequential write rate MB/sFault tolerance Redundancy
level
14
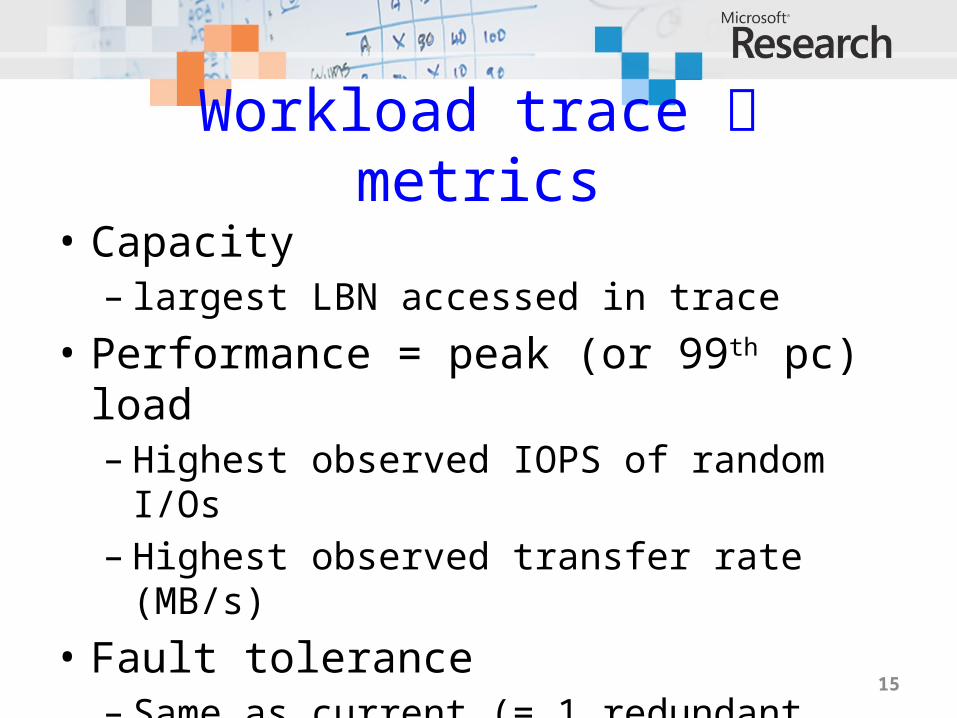
Workload trace metrics
• Capacity– largest LBN accessed in trace
• Performance = peak (or 99th pc) load– Highest observed IOPS of random I/Os– Highest observed transfer rate (MB/s)
• Fault tolerance– Same as current (= 1 redundant device)
15
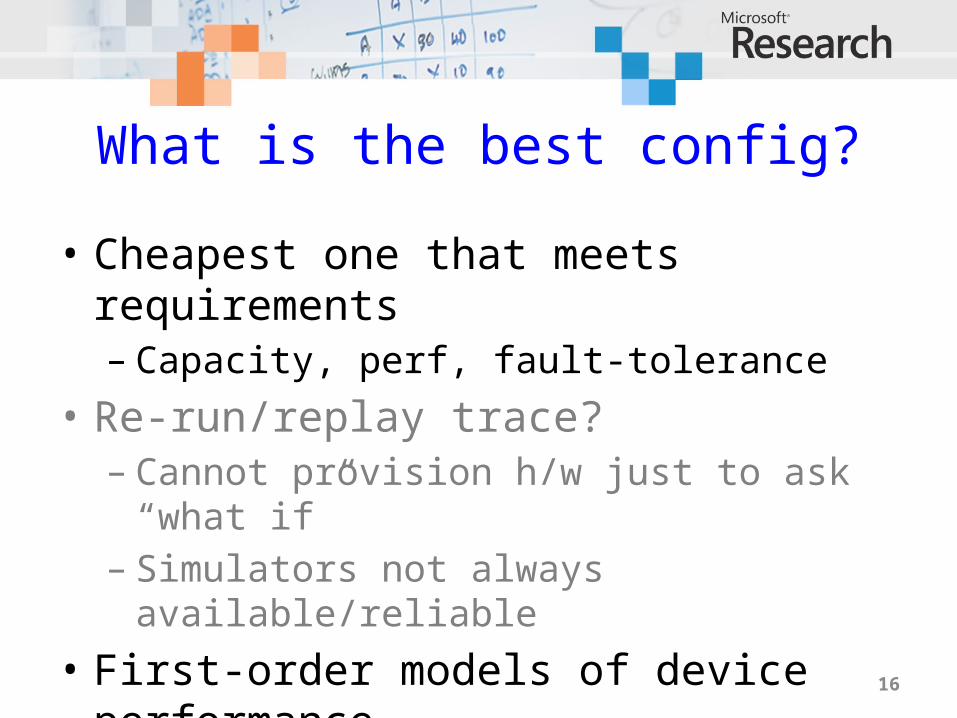
What is the best config?
• Cheapest one that meets requirements– Capacity, perf, fault-tolerance
• Re-run/replay trace?– Cannot provision h/w just to ask “what
if”– Simulators not always available/reliable
• First-order models of device performance– Input is device metrics, workload
metrics
16

Solver
• For each workload, device type– Compute #devices needed in RAID array• Throughput, capacity scaled linearly with
#devices
– To match every workload requirement• “Most costly” workload metric determines
#devices
– Add devices for fault tolerance– Compute total cost
17
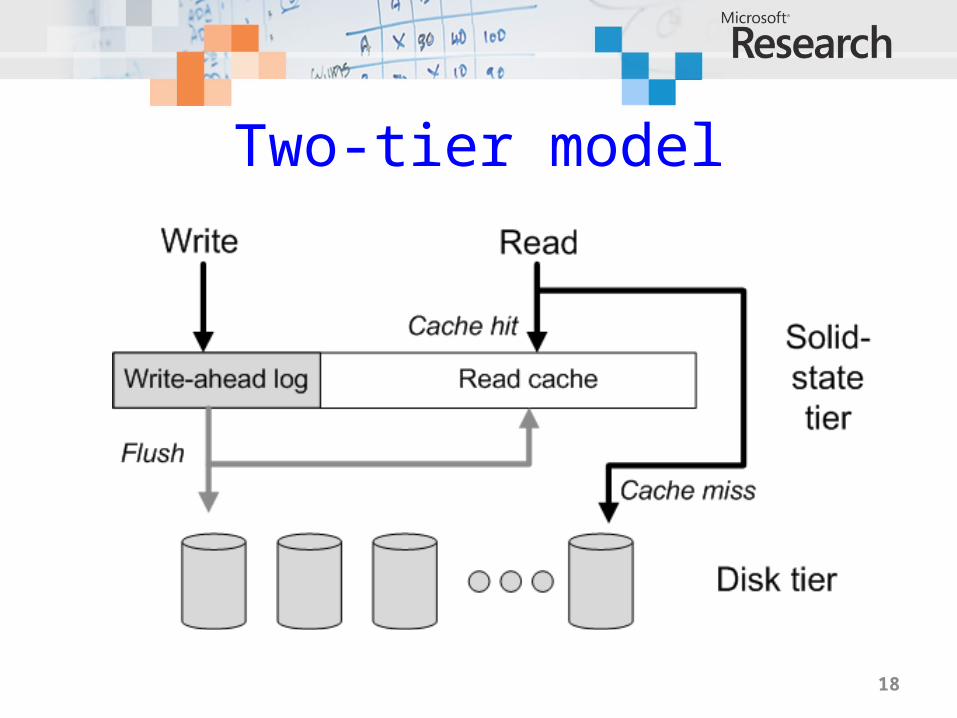
Two-tier model
18

Solving for two-tier
19

Solving for two-tier model
• Iterate over cache sizes, policies–Write-back, write-through for logging– LRU, LTR (long-term random) for
caching
• Inclusive cache model– Can also model exclusive (partitioning)–More complexity, negligible capacity
savings
20

Model assumptions
• First-order models– Ok for provisioning coarse-grained– Not for detailed performance modelling
• Open-loop traces– I/O rate not limited by traced storage
h/w– Traced volumes are well-provisioned
21
Roadmap
• Introduction
• Devices and workloads
• Finding the best configuration
• Analysis results
22
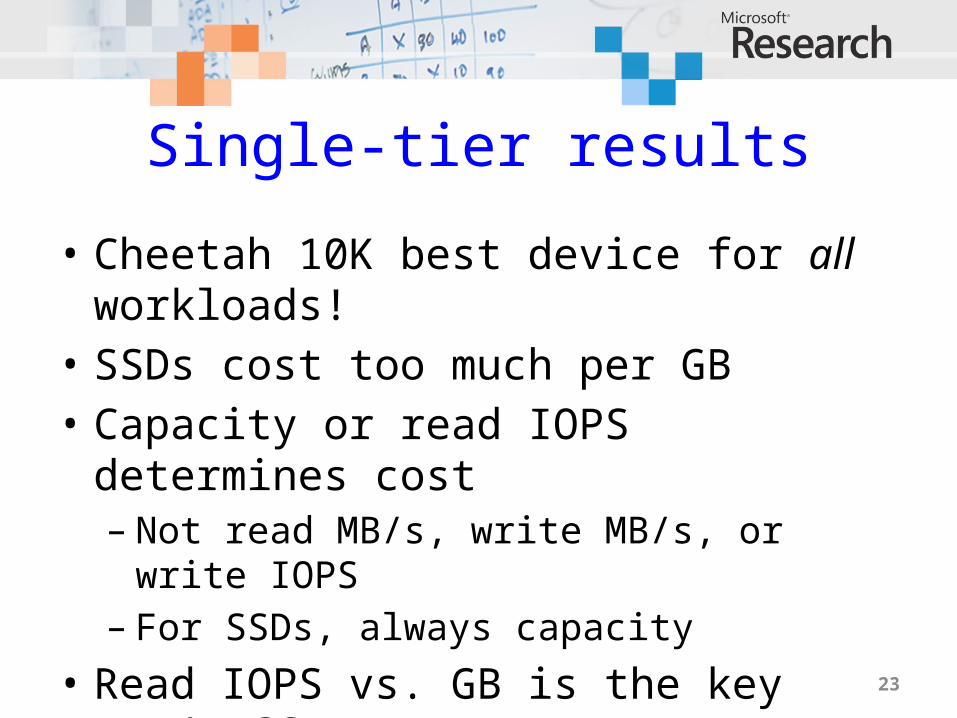
Single-tier results
• Cheetah 10K best device for all workloads!
• SSDs cost too much per GB• Capacity or read IOPS determines
cost– Not read MB/s, write MB/s, or write IOPS– For SSDs, always capacity
• Read IOPS vs. GB is the key tradeoff23

Workload IOPS vs GB
24
1 10 100 10001
10
100
1000
10000
GB
IOPS
SSD
Enterprise disk

When will SSDs win?
• When IOPS dominates cost• Break even $/GB for SSD when– Cost of GB (SSD) = Cost of IOPS (disk)
• Our tool also computes this point– New SSD compare its $/GB to break-
even– Then decide whether to buy it
25
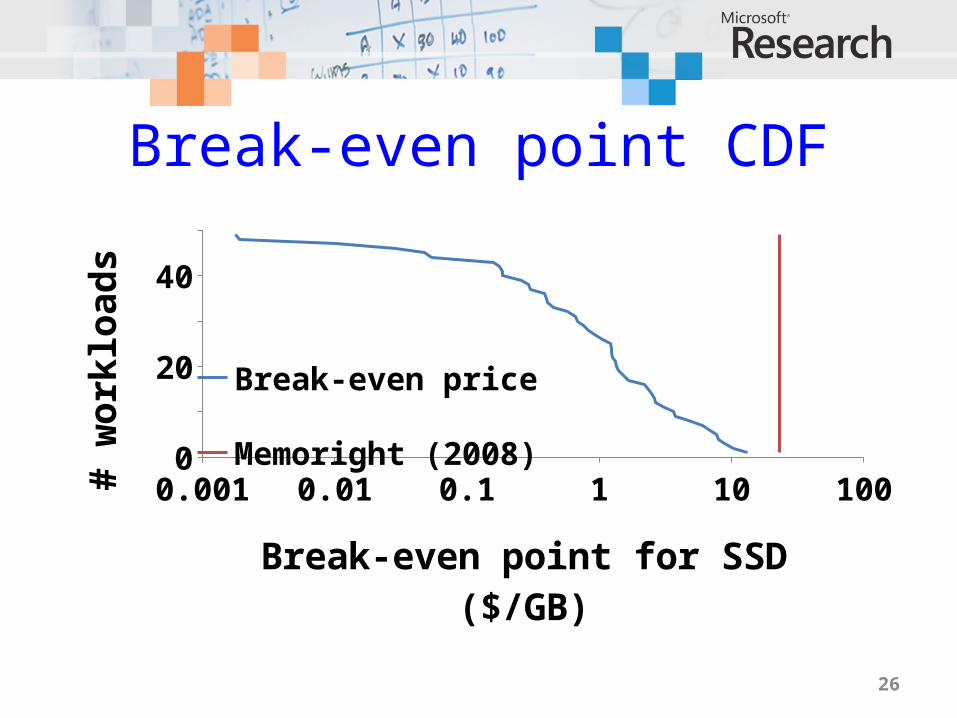
Break-even point CDF
26
0.001 0.01 0.1 1 10 1000
10
20
30
40
50
Break-even price
Memoright (2008)
Break-even point for SSD ($/GB)
# w
orkl
oads

Break-even point CDF
27
0.001 0.01 0.1 1 10 1000
10
20
30
40
50
Break-even price
Intel X25-E (2009)
Memoright (2008)
Break-even point for SSD ($/GB)
# w
orkl
oads

Break-even point CDF
28
0.001 0.01 0.1 1 10 1000
10
20
30
40
50
Break-even priceRaw flash (2009)Intel X25-E (2009)Memoright (2008)
Break-even point for SSD ($/GB)
# w
orkl
oads

Capacity limits SSD
• On performance, SSD already beats disk
• $/GB too high by 1-3 orders of magnitude– Except for small (system boot) volumes
• SSD price has gone down but– This is per-device price, not per-byte
price– Raw flash $/GB also needs to drop a lot 29
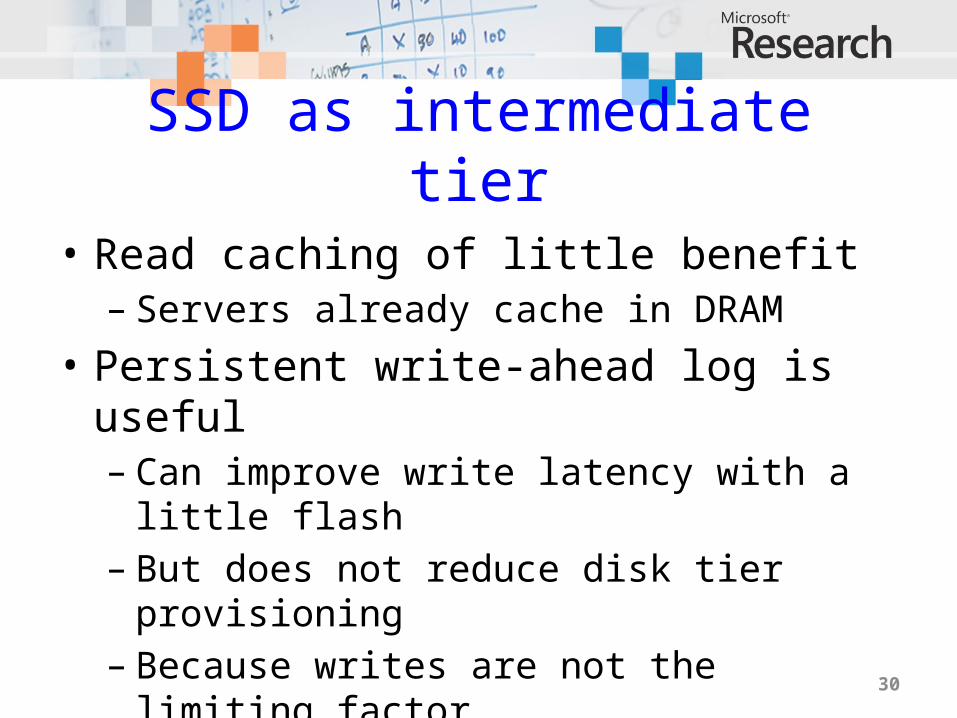
SSD as intermediate tier
• Read caching of little benefit– Servers already cache in DRAM
• Persistent write-ahead log is useful– Can improve write latency with a little
flash– But does not reduce disk tier
provisioning– Because writes are not the limiting
factor30

Power and wear
• SSDs use less power than Cheetahs– But $ savings << cost difference
• Flash wear is not an issue– SSDs have finite #write cycles– But will last well beyond 5 years• Workloads’ long-term write rate not that
high• You will upgrade before you wear device out
31

Conclusion
• Capacity limits flash SSD in enterprise– Not performance, not wear
• Workload IOPS/GB ratio is key metric• Might never get cheap enough
[Hetzler2008]
– All Si capacity today = 12% of HDD market
– There are more profitable uses of Si capacity
– Need higher density technologies (PCM?)
32
This space intentionally left blank
33

What are SSDs good for?
• Mobile, laptop, desktop• Maybe niche apps for enterprise SSD– Too big for DRAM, small enough for flash• And huge appetite for IOPS
– Single-request latency– Power– Fast persistence (write log)
34

Assumptions that favour flash
• IOPS = peak IOPS–Most of the time, load << peak• Faster storage will not help: already
underutilized
• Disk = enterprise disk– Low power disks have lower $/GB,
$/IOPS
• LTR caching uses knowledge of future– Looks through entire trace for randomly-
accessed blocks35

Supply-side analysis [Hetzler2008]
• Disks: 14,000 PB/year, fab cost $1B• MLC NAND flash: 390 PB/year, $3.4B• If all Si capacity moved to MLC flash
today–Will only match 12% of HDD production
• Revenue: $35B HDD, $280B Silicon– No economic incentive to use fabs for
flash36

Device characteristics
37
Device Memoright SSD Cheetah 10K Cheetah 15K Momentus 7200
Price $739 $339 $172 $150
Capacity 32 GB 300 GB 146 GB 200 GB
Power 1.0 W 10.1 W 12.5 W 0.8 W
Read (seq) 121 MB/s 85 MB/s 88 MB/s 64 MB/s
Write (seq) 126 MB/s 84 MB/s 85 MB/s 54 MB/s
Read (random) 6450 IOPS 277 IOPS 384 IOPS 102 IOPS
Write (random) 351 IOPS 256 IOPS 269 IOPS 118 IOPS

9 of 49 benefit from caching
38
exchange
/1
exchange
/2
exchange
/3
exchange
/5
exchange
/6
msn-befs/
1
msn-befs/
4
msn-befs/
5hm/1
prxy/1
1
10
100
1000LTR LRU SSD (2008)
Server/volume
Brea
k-ev
en p
oint
($
/GB)

Energy savings << SSD cost
39
1 10 100 10000
10
20
30
40
50
US energy price (2008) Break-even vs. CheetahBreak-even vs. Mo-mentus
Energy price ($/kWh)
# w
orkl
oads
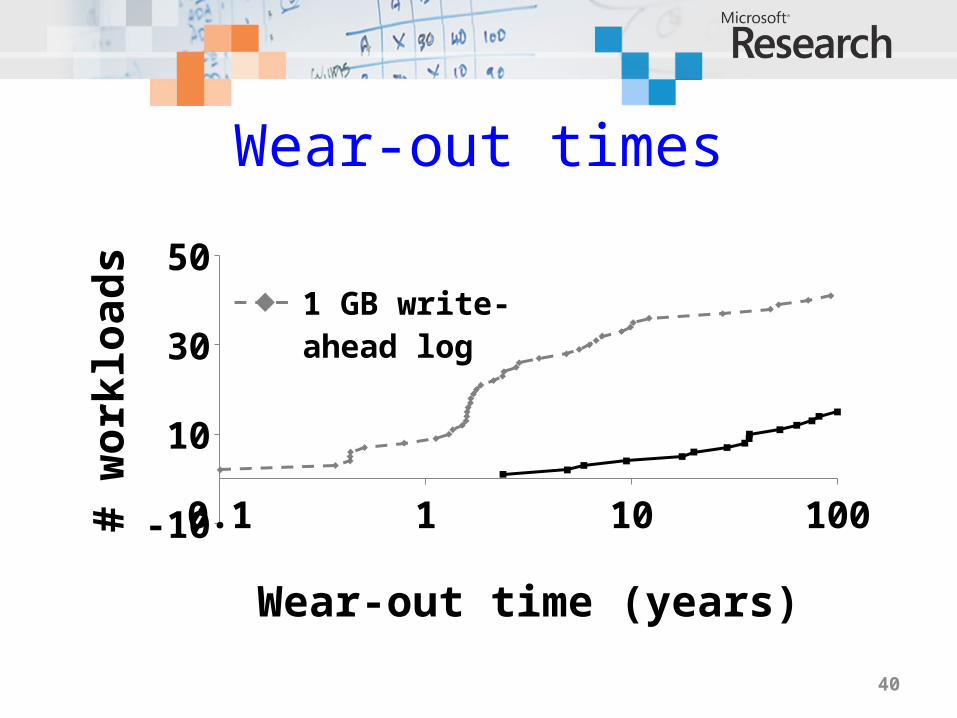
Wear-out times
40
0.1 1 10 1000
1020304050
1 GB write-ahead log
Entire volume
Wear-out time (years)
# w
orkl
oads