Embed Size (px)
Citation preview

REPORT ON WP2 Interac)ve User Query Interface
User Informa)on Needs, User Scenarios and Implementa)on Plan
Fish4Knowledge Project Mee5ng December 2011 -‐ Catania
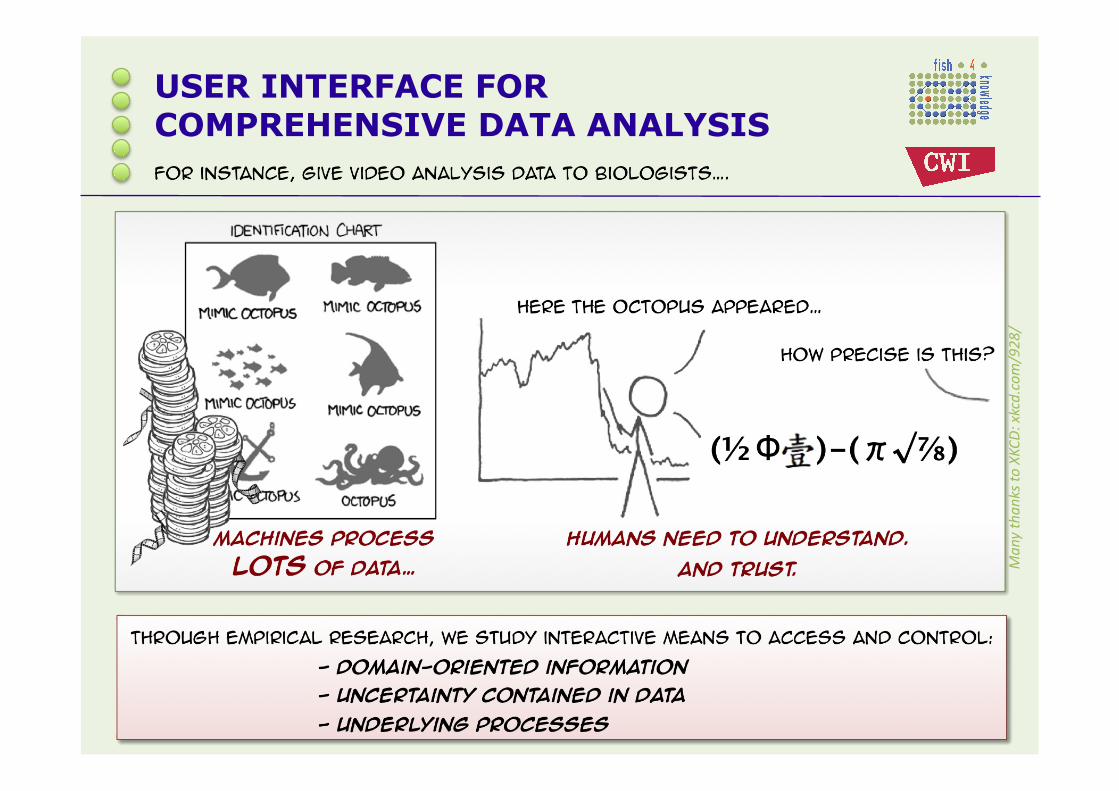
USER INTERFACE FOR COMPREHENSIVE DATA ANALYSIS
Many than
ks to
XKCD: xkcd.com/928/
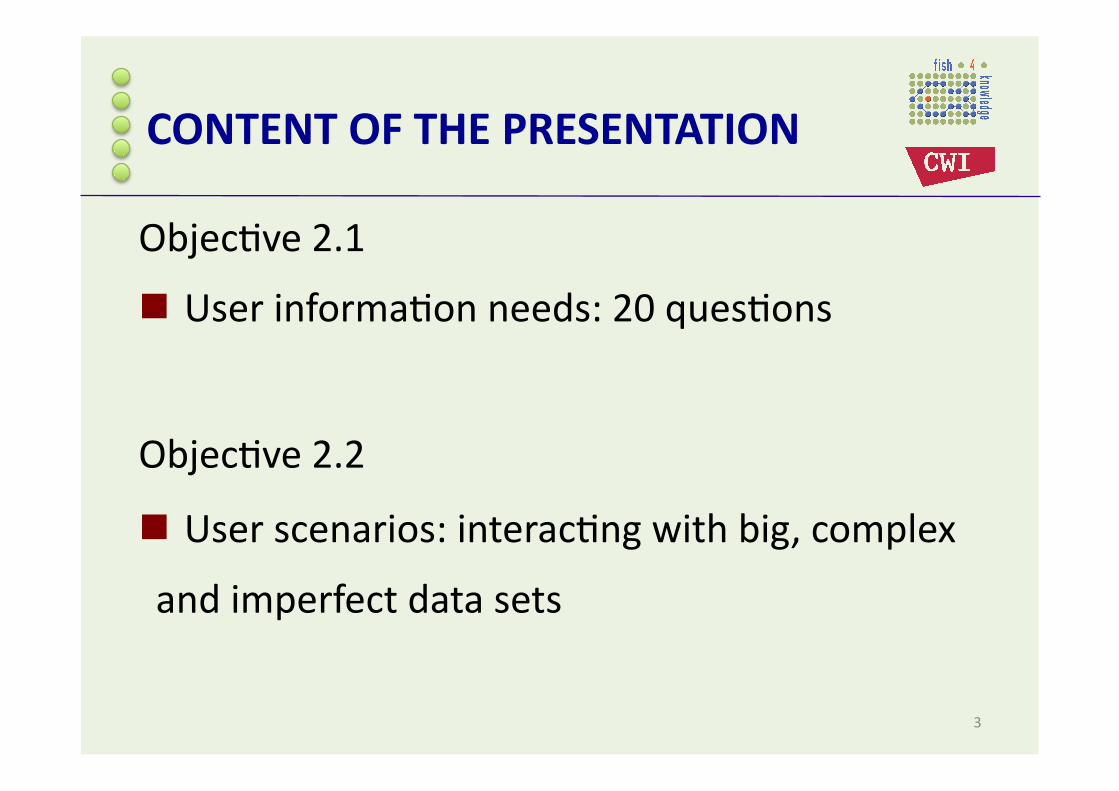
CONTENT OF THE PRESENTATION
Objec)ve 2.1
User informa)on needs: 20 ques)ons
Objec)ve 2.2
User scenarios: interac)ng with big, complex
and imperfect data sets
3
USER INFORMATION NEEDS
Results reported in Deliverable 2.1
4
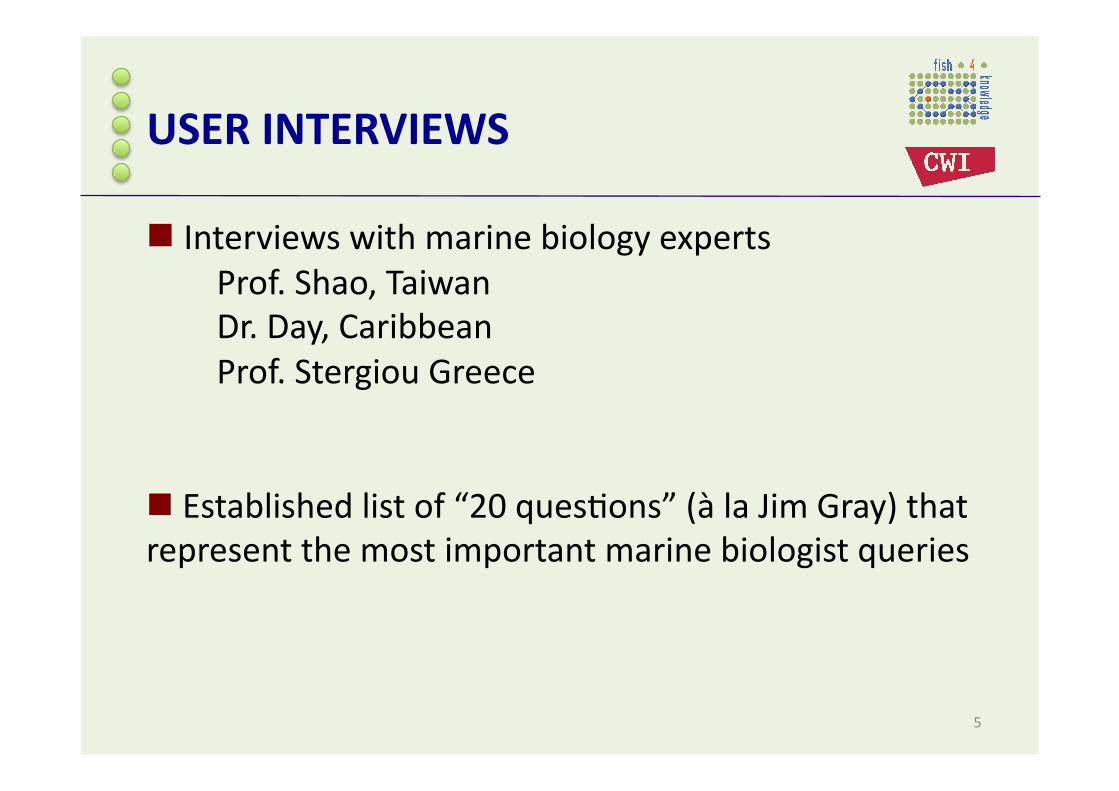
USER INTERVIEWS
Interviews with marine biology experts Prof. Shao, Taiwan Dr. Day, Caribbean Prof. Stergiou Greece
Established list of “20 ques)ons” (à la Jim Gray) that represent the most important marine biologist queries
5
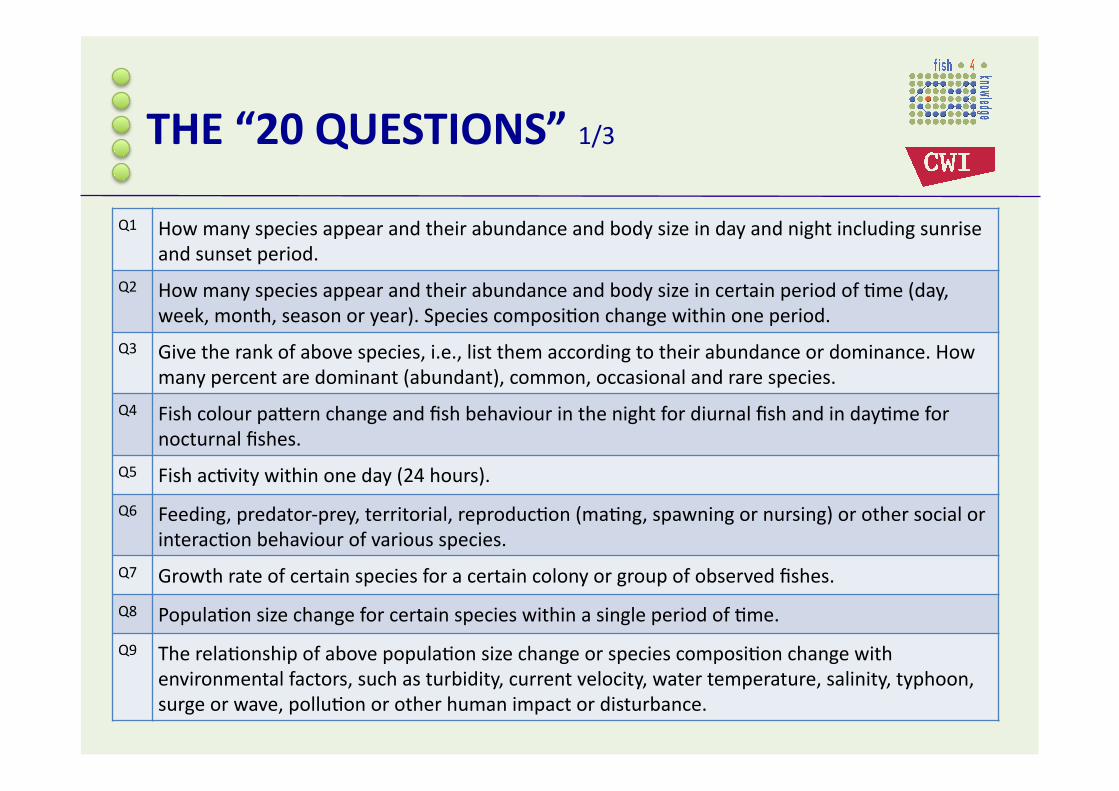
THE “20 QUESTIONS” 1/3
Q1 How many species appear and their abundance and body size in day and night including sunrise and sunset period.
Q2 How many species appear and their abundance and body size in certain period of )me (day, week, month, season or year). Species composi)on change within one period.
Q3 Give the rank of above species, i.e., list them according to their abundance or dominance. How many percent are dominant (abundant), common, occasional and rare species.
Q4 Fish colour pa^ern change and fish behaviour in the night for diurnal fish and in day)me for nocturnal fishes.
Q5 Fish ac)vity within one day (24 hours). Q6 Feeding, predator-‐prey, territorial, reproduc)on (ma)ng, spawning or nursing) or other social or
interac)on behaviour of various species. Q7 Growth rate of certain species for a certain colony or group of observed fishes. Q8 Popula)on size change for certain species within a single period of )me. Q9 The rela)onship of above popula)on size change or species composi)on change with
environmental factors, such as turbidity, current velocity, water temperature, salinity, typhoon, surge or wave, pollu)on or other human impact or disturbance.
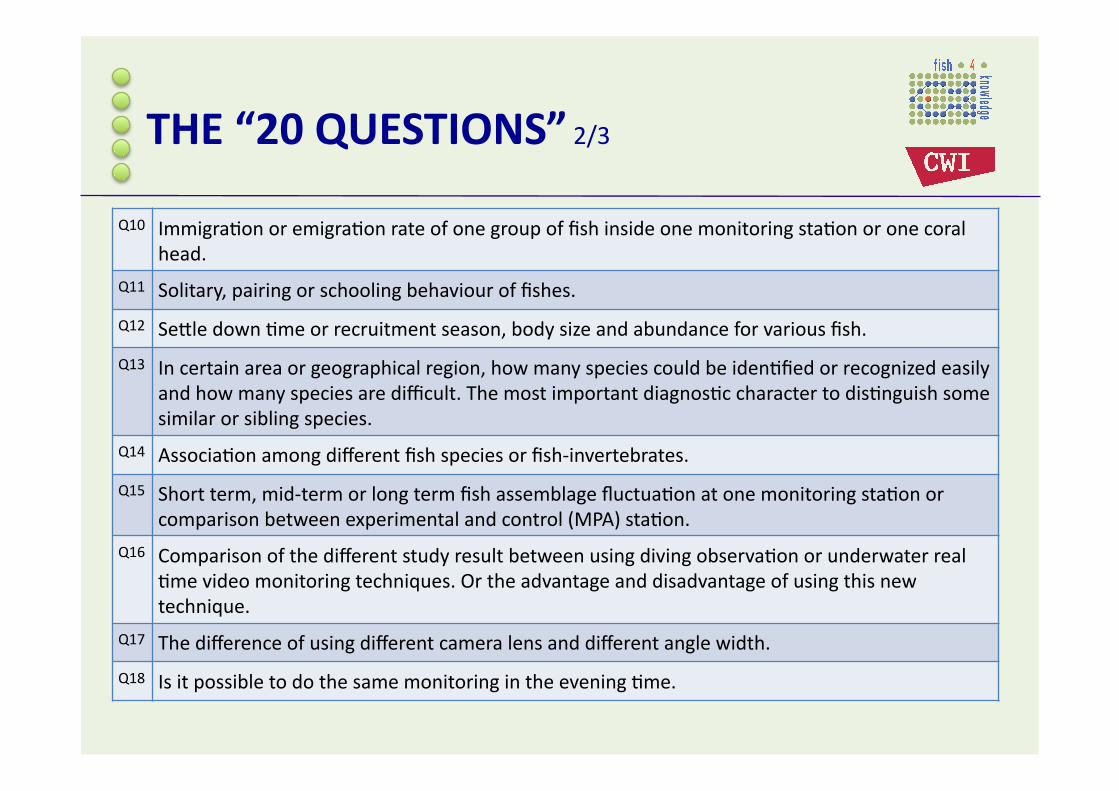
THE “20 QUESTIONS” 2/3
Q10 Immigra)on or emigra)on rate of one group of fish inside one monitoring sta)on or one coral head.
Q11 Solitary, pairing or schooling behaviour of fishes. Q12 Se^le down )me or recruitment season, body size and abundance for various fish. Q13 In certain area or geographical region, how many species could be iden)fied or recognized easily
and how many species are difficult. The most important diagnos)c character to dis)nguish some similar or sibling species.
Q14 Associa)on among different fish species or fish-‐invertebrates. Q15 Short term, mid-‐term or long term fish assemblage fluctua)on at one monitoring sta)on or
comparison between experimental and control (MPA) sta)on. Q16 Comparison of the different study result between using diving observa)on or underwater real
)me video monitoring techniques. Or the advantage and disadvantage of using this new technique.
Q17 The difference of using different camera lens and different angle width. Q18 Is it possible to do the same monitoring in the evening )me.
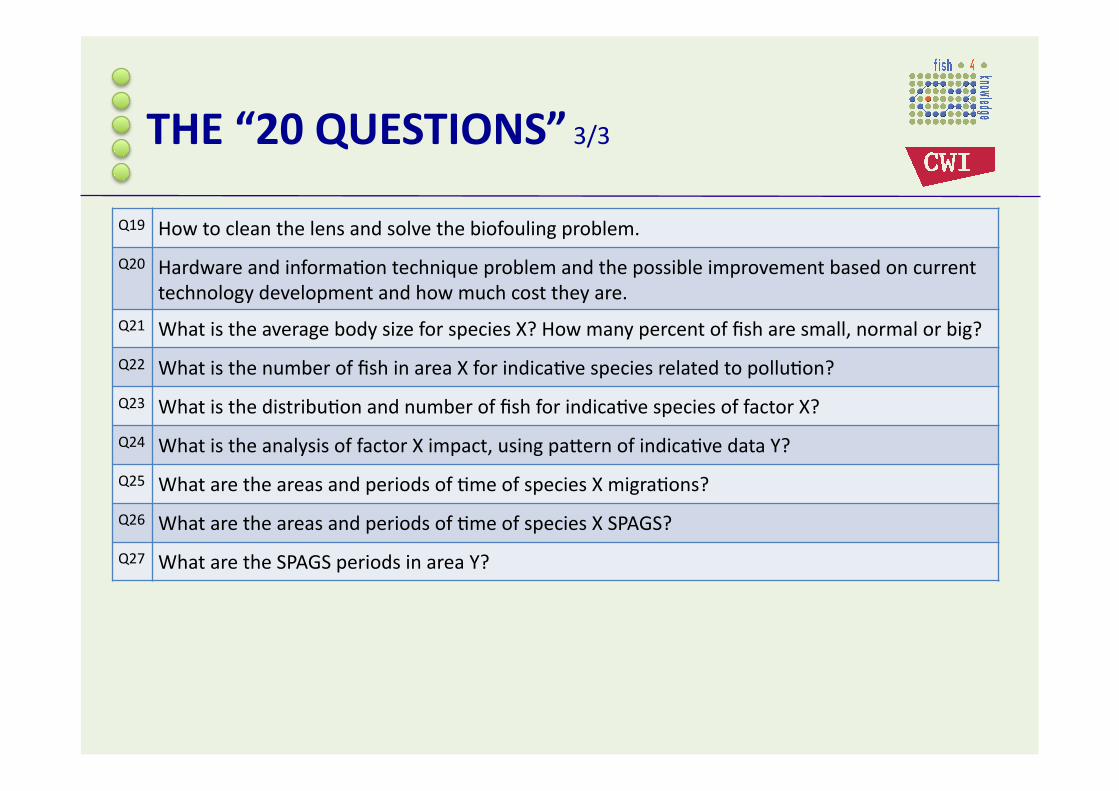
THE “20 QUESTIONS” 3/3
Q19 How to clean the lens and solve the biofouling problem. Q20 Hardware and informa)on technique problem and the possible improvement based on current
technology development and how much cost they are. Q21 What is the average body size for species X? How many percent of fish are small, normal or big? Q22 What is the number of fish in area X for indica)ve species related to pollu)on? Q23 What is the distribu)on and number of fish for indica)ve species of factor X? Q24 What is the analysis of factor X impact, using pa^ern of indica)ve data Y? Q25 What are the areas and periods of )me of species X migra)ons? Q26 What are the areas and periods of )me of species X SPAGS? Q27 What are the SPAGS periods in area Y?
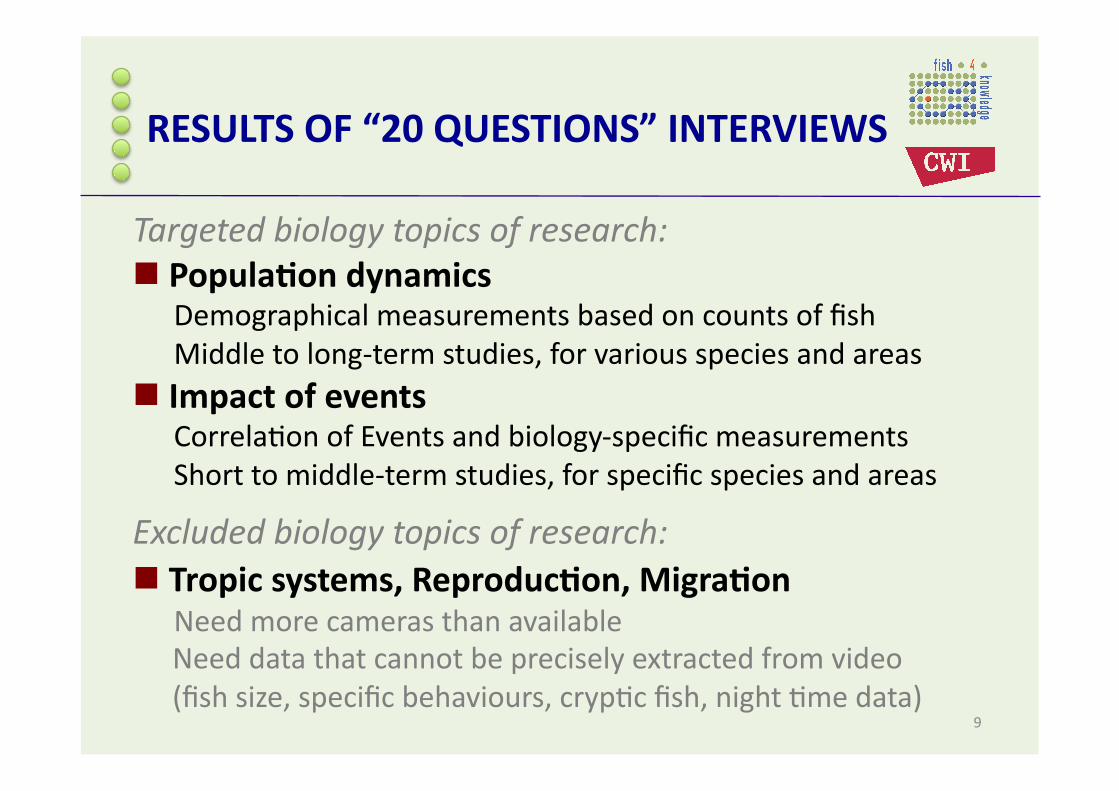
RESULTS OF “20 QUESTIONS” INTERVIEWS
Targeted biology topics of research: Popula<on dynamics
Demographical measurements based on counts of fish Middle to long-‐term studies, for various species and areas
Impact of events Correla)on of Events and biology-‐specific measurements Short to middle-‐term studies, for specific species and areas
Excluded biology topics of research: Tropic systems, Reproduc<on, Migra<on
Need more cameras than available Need data that cannot be precisely extracted from video (fish size, specific behaviours, cryp)c fish, night )me data)
9
USER SCENARIOS
Details in Deliverable 2.2
10

CHARLES -‐ THE STUDY OF FISH ABUNDANCE OVER TIME
Charles' ac5ons:
Explore the count of fish over 3 years
Spot irregulari)es in 2010
Control the visualisa)on
Exclude technical explana)ons
Study abundance per area versus average abundance
Find area that influenced the overall abundance
Customise and share visualisa)on
11
Explore the count of fish over 3 years
12
1. CHARLES -‐ THE STUDY OF FISH ABUNDANCE OVER TIME
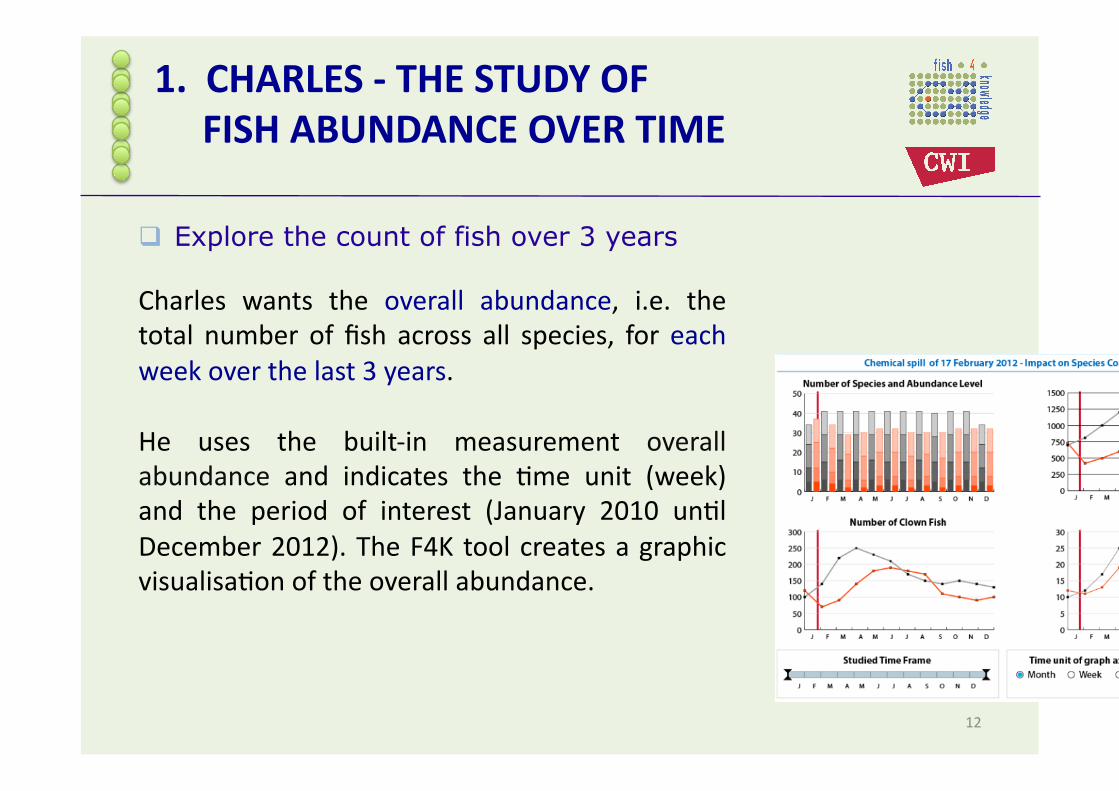
Charles wants the overall abundance, i.e. the total number of fish across all species, for each week over the last 3 years.
He uses the built-‐in measurement overall abundance and indicates the )me unit (week) and the period of interest (January 2010 un)l December 2012). The F4K tool creates a graphic visualisa)on of the overall abundance.
Spot irregularities in 2010
13
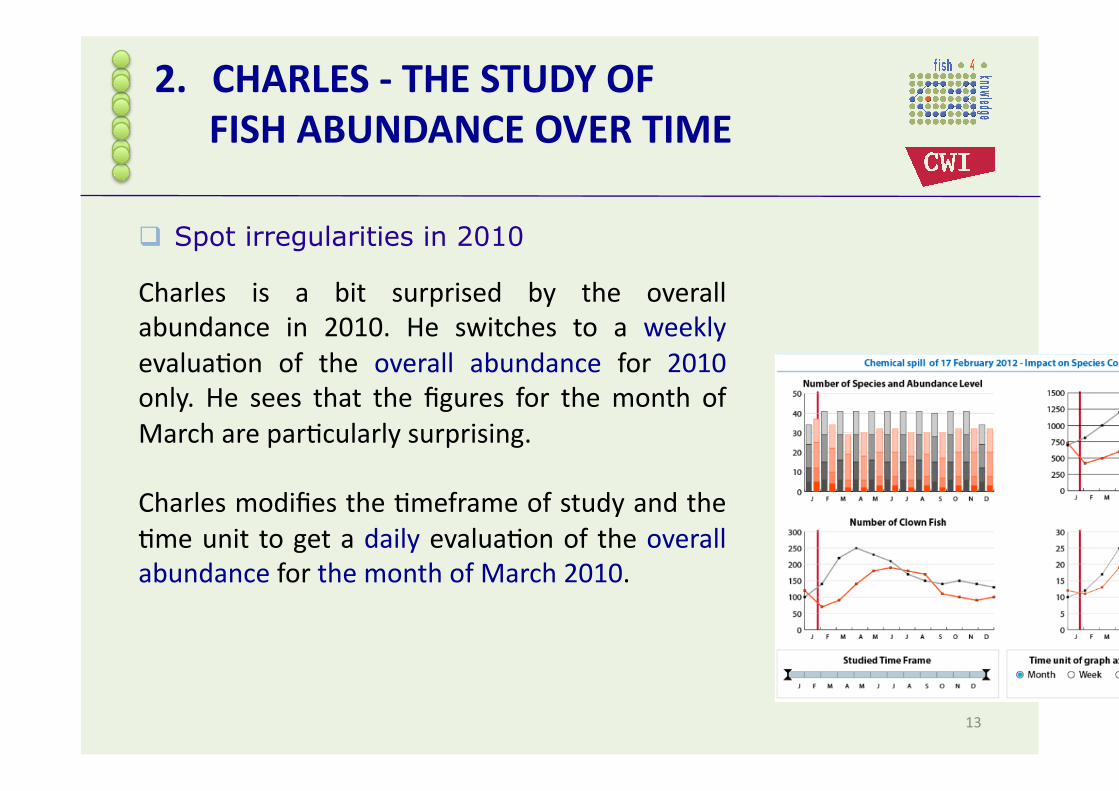
Charles is a bit surprised by the overall abundance in 2010. He switches to a weekly evalua)on of the overall abundance for 2010 only. He sees that the figures for the month of March are par)cularly surprising.
Charles modifies the )meframe of study and the )me unit to get a daily evalua)on of the overall abundance for the month of March 2010.
2. CHARLES -‐ THE STUDY OF FISH ABUNDANCE OVER TIME
Check the visualisation of overall abundance
14
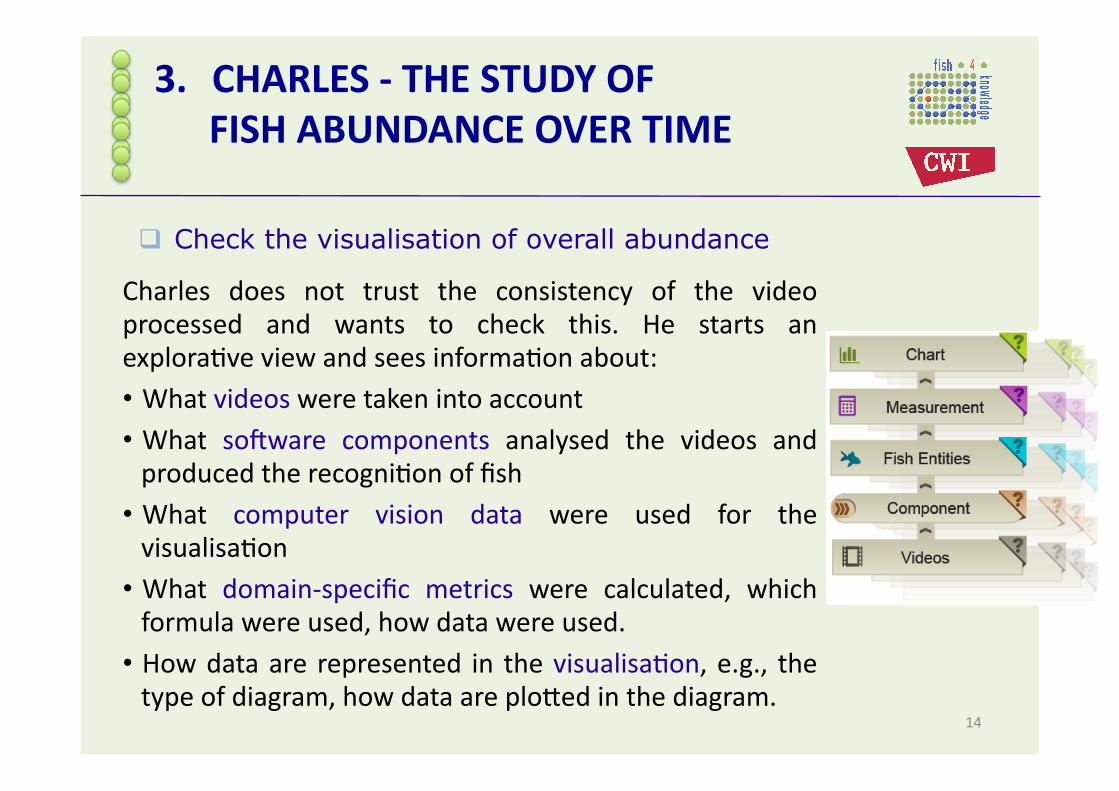
Charles does not trust the consistency of the video processed and wants to check this. He starts an explora)ve view and sees informa)on about: • What videos were taken into account • What somware components analysed the videos and produced the recogni)on of fish • What computer vision data were used for the visualisa)on • What domain-‐specific metrics were calculated, which formula were used, how data were used. • How data are represented in the visualisa)on, e.g., the type of diagram, how data are plo^ed in the diagram.
3. CHARLES -‐ THE STUDY OF FISH ABUNDANCE OVER TIME

Checking the videos
15
Charles wants to check if a homogeneous set of cameras and videos were available at the beginning of 2010. He asks for more details about the videos that were taken into account. He looks for inconsistencies in the number of cameras or videos available from each loca)on e.g., if cameras were in maintenance, if a significant number of videos are missing or bad quality.
Charles can select a custom set of cameras or videos to get a homogeneous set of videos, but the set is already consistent enough. Charles also wants to verify if the quality of videos is consistent. He inspects a few videos from 2010, and he even looks for video in 2011 to verify if the quality is similar, and if fishes are accurately iden)fied.
4. CHARLES -‐ THE STUDY OF FISH ABUNDANCE OVER TIME
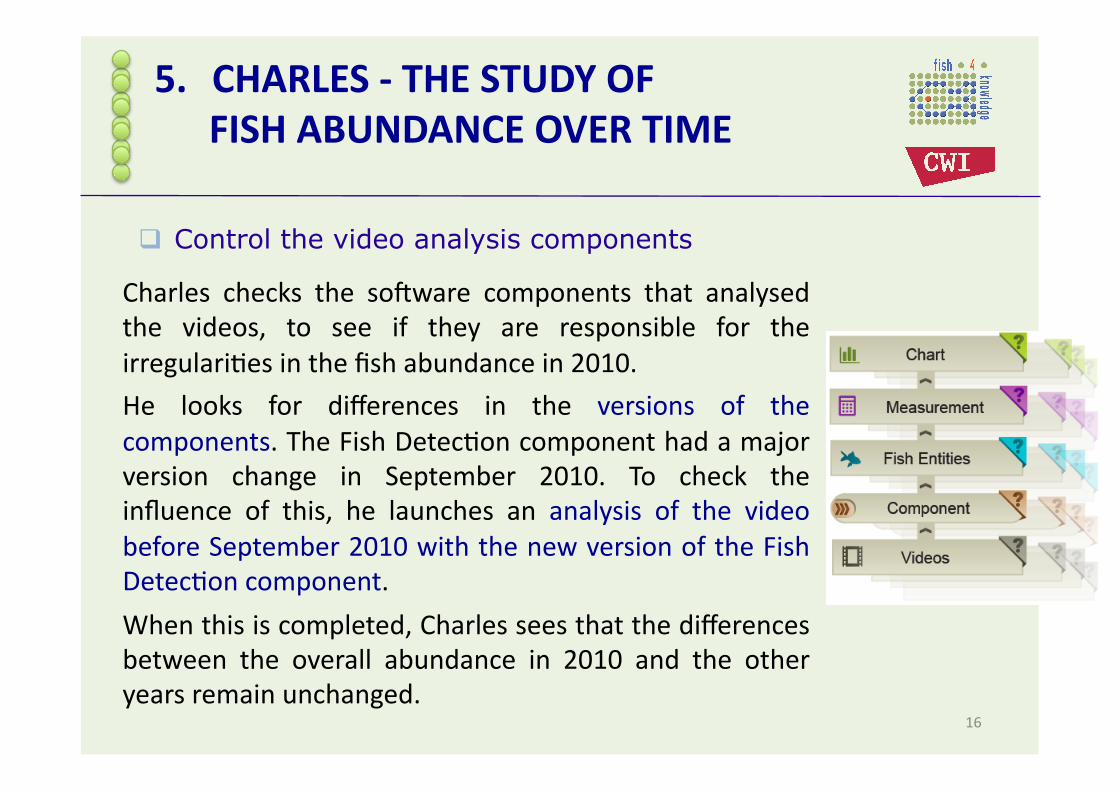
Control the video analysis components
16
Charles checks the somware components that analysed the videos, to see if they are responsible for the irregulari)es in the fish abundance in 2010.
He looks for differences in the versions of the components. The Fish Detec)on component had a major version change in September 2010. To check the influence of this, he launches an analysis of the video before September 2010 with the new version of the Fish Detec)on component.
When this is completed, Charles sees that the differences between the overall abundance in 2010 and the other years remain unchanged.
5. CHARLES -‐ THE STUDY OF FISH ABUNDANCE OVER TIME
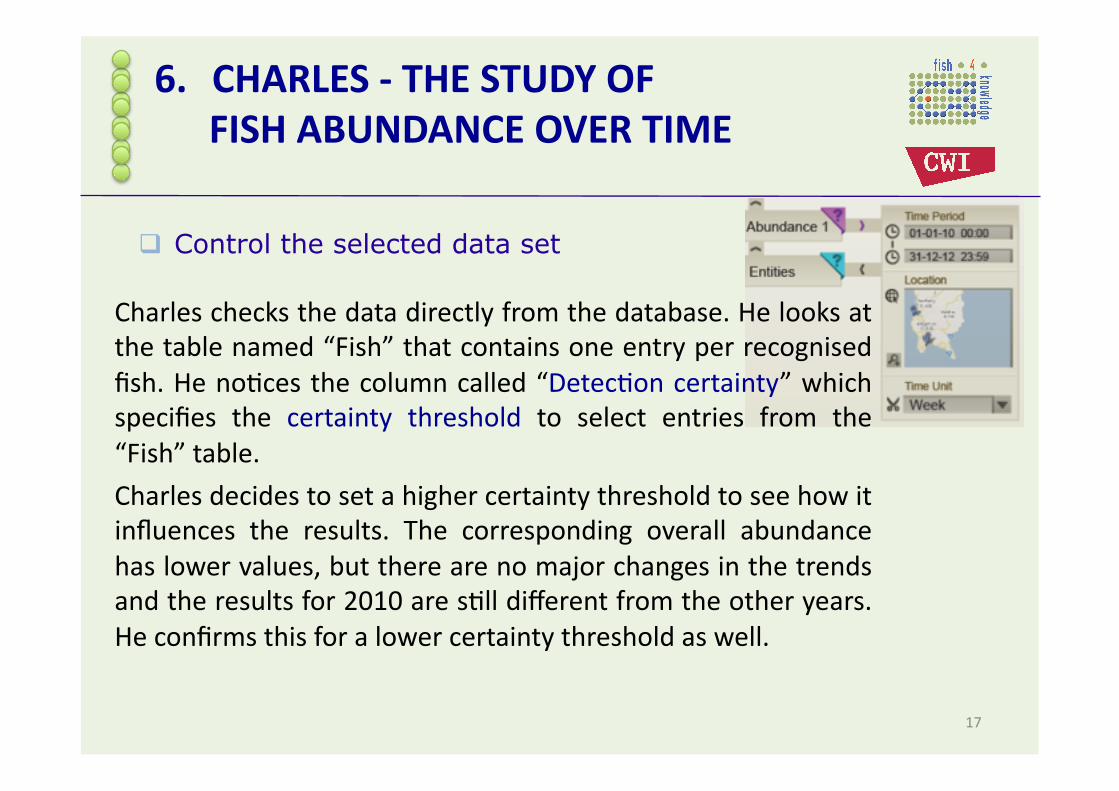
Control the selected data set
17
Charles checks the data directly from the database. He looks at the table named “Fish” that contains one entry per recognised fish. He no)ces the column called “Detec)on certainty” which specifies the certainty threshold to select entries from the “Fish” table.
Charles decides to set a higher certainty threshold to see how it influences the results. The corresponding overall abundance has lower values, but there are no major changes in the trends and the results for 2010 are s)ll different from the other years. He confirms this for a lower certainty threshold as well.
6. CHARLES -‐ THE STUDY OF FISH ABUNDANCE OVER TIME

Find area that influenced the results
18
Charles found no technical reason to explain the differences that appear for the year 2010, but now he knows exactly what is represented in the visualisa)on, and he trusts the findings of the system.
Charles starts thinking about biological reasons that influenced the popula)on dynamics in 2010. He wonders if the changes in 2010 occurred for the whole island of Taiwan, or if they were localised in a specific area. He calculates the overall abundance for various areas. He
7. CHARLES -‐ THE STUDY OF FISH ABUNDANCE OVER TIME
finds that major irregulari)es occurred in the eastern part of Taiwan and this influenced the na)onal overall abundance.
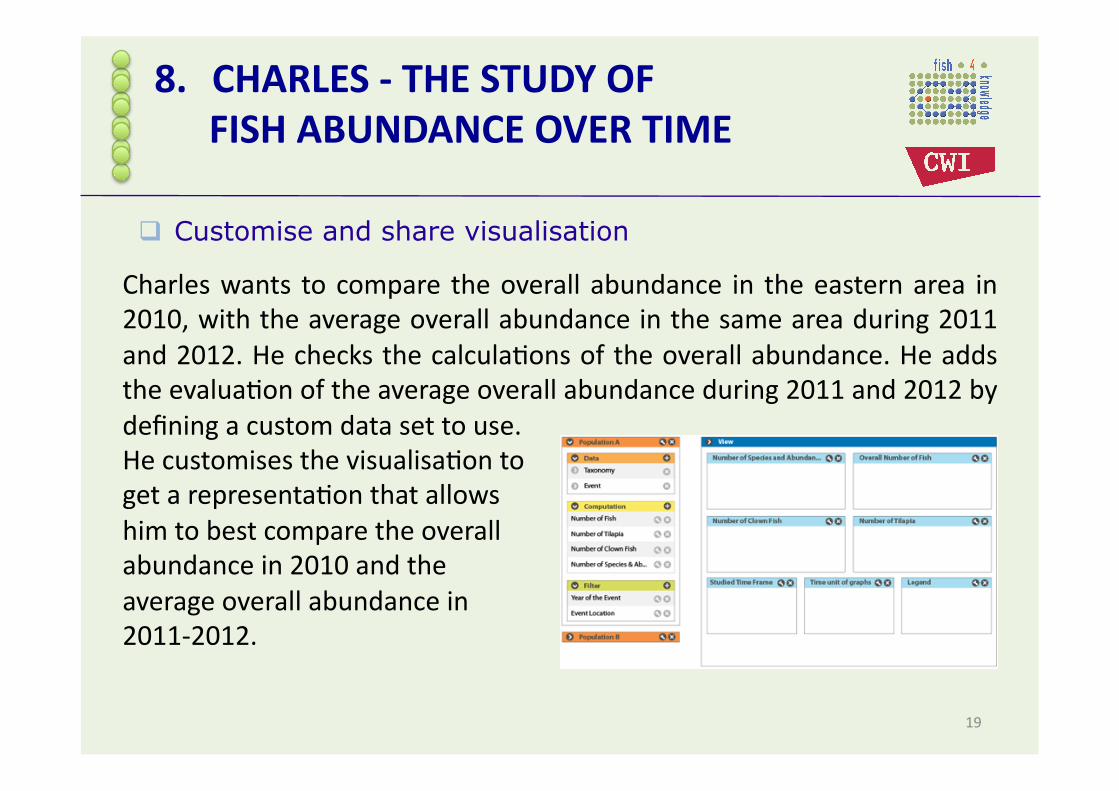
Customise and share visualisation
19
Charles wants to compare the overall abundance in the eastern area in 2010, with the average overall abundance in the same area during 2011 and 2012. He checks the calcula)ons of the overall abundance. He adds the evalua)on of the average overall abundance during 2011 and 2012 by defining a custom data set to use.
8. CHARLES -‐ THE STUDY OF FISH ABUNDANCE OVER TIME
He customises the visualisa)on to get a representa)on that allows him to best compare the overall abundance in 2010 and the average overall abundance in 2011-‐2012.
CHARLES -‐ THE STUDY OF FISH ABUNDANCE OVER TIME
Charles' ac5ons:
Explore the count of fish over 3 years
Spot irregulari)es in 2010
Control the visualisa)on
Exclude technical explana)ons
Study abundance per area versus average abundance
Find area that influenced the overall abundance
Customise and share visualisa)on
20
ERICA -‐ THE STUDY OF ENVIRONMENTAL CONDITIONS
Erica's ac5ons:
Explore Charles' visualisa)on Research and define environmental events to study
Define species to study w.r.t. events to study Explore and compare several visualisa)ons
Find correla)ons with 3 events in a row Create visualisa)on and measurements to illustrate findings
Share the visualisa)on with Charles
21
WRAP UP: MAIN DESIGN PROBLEM
Marine biologists need to trust their data
In F4K, data is generated by algorithms they do not understand
Data generated by algorithms are imperfect
The goal for the system UI design is to empower marine biologists to assess whether data supports scien<fically valid findings
YEAR 2
Objec<ve 2.2 -‐ Create ini)al component-‐based prototypes to establish their usefulness.
Create interface mockups and UI prototypes based on scenarios
Evaluate these with users Objec<ve 2.3 -‐ Create advanced prototypes that fulfill specific high-‐level user informa)on needs.
Coordinate with other WPs to create working end-‐to-‐end scenario
YEAR 3 Objec<ve 2.4 -‐ Integrate user interface components into end-‐to-‐end system. 23