Embed Size (px)
Citation preview

By Marcus Marktanner3 October, 2009
Food Market and Food Insecurity in Lebanon, Syria, Jordan, Iraq,
Iran, Yemen and Palestine
World Food ProgrammeRegional Market Survey
For the Middle East

EXECUTIVE SUMMARY
Prices of basic staples have witnessed a considerable upward trend since January 2006. Until today, they have more than doubled for rice, maize, soybean and palm oil, ground nuts, and barley. Rising demand and changing consumption patterns in emerging economies, higher energy, transportation and fertilizer costs, the substitution of food for industrial crops, climate change and water scarcity, speculation, and a weakening US dollar are important factors behind this development. Like most other developing countries, the price shock hit the seven ODC countries subject of this study off-guard. Unlike other countries though, the agricultural sector of the ODC countries is generally poorly positioned to make a meaningful contribution to the amelioration of the current crisis.
On average, food requirements exceed the countries’ agricultural output, which is a
situation that most likely will aggravate in the future. Fast population growth and diminishing productivity due to climate change will mostly account for this development. Nevertheless, the countries have also an agricultural productivity deficit relative to their general level of development that goes beyond geography and demography. These can be attributed to underdeveloped markets like poor transportation and financing infrastructure more than lack of access to physical input factors like use of irrigation systems and fertilizers.
A more in-depth analysis reveals that the general economic framework is affected by a
host of adverse geo-politic, geographic, and market-organizational factors. Refugee problems, armed conflicts, and droughts make food security and agricultural development highly erratic. Centralized marketing and procurement practices will become increasingly challenged in the wake of recent price developments. As governments become forced to liberalize production and distribution decisions, the pockets of food-insecurity within societies will widen and the calls for social safety nets become louder.
Widespread negative food price balances in the region have let most countries to develop
import trade relationships with partners from outside the Middle East. In case of a sudden deterioration of food security, food aid would also have to be organized from outside the region. The vulnerability profile of the countries make them logistically challenging, especially in the events of armed conflict and a refugee problem.
The countries of this study can be divided into relatively low and high food-insecure
economies. Comparatively advanced food markets with minor institutional deficits, such as lack of competition on the retail level, suboptimal transportation and capital market infrastructure, and governmental interference into the marketing process characterize the low food-insecurity countries of Lebanon, Syria, Jordan, and Iran. The high food-insecure countries of Iraq and Palestine even lack the most fundamental prerequisites for market interaction, which are secure property rights and freedom of movement, while widespread poverty and the use of Qat strangles Yemen’s development prospects.
A substantial refugee problem is a common theme among many ODC countries. Most
studies address the hardship of the refugees while the impact on the regular population seems to be under-researched. The high vulnerability to climate change resulting in periodic droughts and

possibly conflicts over scarce water resources is another common challenge to ODC countries that will require more research.
Immediate supply side adjustments to the food price crisis do often aggravate the current
situation. These involve overpricing by retailers, smuggling with expired products, lining pockets by governmental officials, and political charities exploiting the situation. Substitution and income effects increase demand for food items with inferior nutritional value and enforce the reduction of consumption of other essential goods and services.
On the public policy level, short and long term policies must be separated. In the short
term, both price policies and social safety net programs are used. Among price policies, tax bans, depletion of buffer stocks, export restrictions, and price controls are widely applied. Regarding social safety nets, school feeding, food stamps, and cash-transfers are the most popular response strategies. Food-for-work programs, which are socially particularly efficient, are not employed. The long run must not be lost out of sight, though. Agrarian reforms, family planning, economic liberalization, decentralization, efficiently sized public sectors, and redistributive social policy may still free substantial productivity gains. Whether they will be enough to keep up with population growth and the reduction of agricultural productivity due to climate change must be questioned, though. Ultimately, food security in the ODC countries will rest more on general economic modernization than a green revolution.
It is estimated that the food price crisis will increase the number of undernourished in the
ODC countries by roughly 3.7 million people. Currently, around 20 million of the total population of 157 million is underfed. The study also quantifies the increase of poverty, malnutrition, school drop-outs, food expenditure shares, and food inequality. Poor data quality, however, lends the empirical assessment a strong initial explorative nature.
In summary, the countries of this study will require constant monitoring of geopolitical,
climate change, food price, and public policy developments. The high food import dependency of the region calls for logistically challenging food aid mechanisms. Food-for-work programs should be promoted more. Moreover, since food prices are expected to remain at elevated levels, short-term policies will not be sustainable. The development of long term food security policies, as envisioned in WFP’ strategic plan for 2008-2011, should complement the traditional concentration on short-term policies and food distribution.

TABLE OF CONTENTS 1. Introduction............................................................................................................................. 1
1.1. Definition of Project......................................................................................................... 1 1.2. Particular Challenges........................................................................................................ 1 1.3. Specific Questions............................................................................................................ 2 1.4. Data and Methodology ..................................................................................................... 3
2. The Food Price Crisis – A Brief Overview of Main Arguments ............................................ 4 2.1. Rising Demand................................................................................................................. 4 2.2. Shift in Consumption Pattern ........................................................................................... 6 2.3. Higher Energy, Transportation, and Fertilizer Costs ....................................................... 7 2.4. Biofuel.............................................................................................................................. 8 2.5. Climate Change .............................................................................................................. 12 2.6. Water Scarcity ................................................................................................................ 13 2.7. Declining Food Reserves and Speculation..................................................................... 14 2.8. Dollar Depreciation ........................................................................................................ 16
3. The State of Agricultural Supply in ODC Countries ............................................................ 17 3.1. Preliminary Remarks...................................................................................................... 17 3.2. Where do ME-ODC Countries Stand? ........................................................................... 18
4. More in Depth Analysis of ODC Countries.......................................................................... 24 4.1. Overview ........................................................................................................................ 24 4.2. Lebanon.......................................................................................................................... 24
4.2.1. General Economic Conditions ................................................................................ 24 4.2.2. The State of Food Security ..................................................................................... 26 4.2.3. Market and Trade Overview ................................................................................... 27
4.3. Syria ............................................................................................................................... 30 4.3.1. General Economic Conditions ................................................................................ 30 4.3.2. The State of Food Security ..................................................................................... 30 4.3.3. Market and Trade Overview ................................................................................... 32
4.4. Jordan ............................................................................................................................. 34 4.4.1. General Economic Conditions ................................................................................ 34 4.4.2. The State of Food Security ..................................................................................... 34 4.4.3. Market and Trade Overview ................................................................................... 35
4.5. Iran ................................................................................................................................. 37 4.5.1. General Economic Conditions ................................................................................ 37

4.5.2. The State of Food Security ..................................................................................... 38 4.5.3. Market and Trade Overview ................................................................................... 39
4.6. Iraq ................................................................................................................................. 40 4.6.1. General Economic Conditions ................................................................................ 40 4.6.2. The State of Food Security ..................................................................................... 41 4.6.3. Market Overview .................................................................................................... 43
4.7. Yemen ............................................................................................................................ 44 4.7.1. General Economic Conditions ................................................................................ 44 4.7.2. Food Security .......................................................................................................... 46 4.7.3. Market Overview .................................................................................................... 47
4.8. Palestine ......................................................................................................................... 48 4.8.1. General Economic Conditions ................................................................................ 48 4.8.2. Food Security .......................................................................................................... 49 4.8.3. Market Overview .................................................................................................... 50
4.9. Summary ........................................................................................................................ 51 5. Food Crisis, Market Dynamics, and Policy Options............................................................. 54
5.1. Introduction .................................................................................................................... 54 5.2. How Efficient are Markets? ........................................................................................... 54 5.3. How do Suppliers React to Rising Food Prices?............................................................ 56
5.3.1. Supply Adjustment in Theory................................................................................. 56 5.3.2. Smuggling ............................................................................................................... 57 5.3.3. Hoarding ................................................................................................................. 58 5.3.4. Charity based Supply .............................................................................................. 59
5.4. How do Consumers react to Rising Food Prices? .......................................................... 59 5.4.1. Demand Adjustment in Theory............................................................................... 59 5.4.2. A Snapshot of the Food Price Rises in ODC Countries.......................................... 60 5.4.3. Substitution Effects................................................................................................. 61
5.5. Recommended Short and Long Term Policies to Fight Food Price Inflation................ 62 5.5.1. What Government Should Do in Theory ................................................................ 62 5.5.2. Agrarian Reforms.................................................................................................... 62 5.5.3. Family Planning ...................................................................................................... 64 5.5.4. Income Redistribution............................................................................................. 65 5.5.5. Building Transportation Infrastructure ................................................................... 67 5.5.6. Building Financial Infrastructure............................................................................ 67

5.5.7. Short Term Response Policies ................................................................................ 68 5.6. Response Policies in Practice......................................................................................... 69
5.6.1. Tax Reductions ....................................................................................................... 70 5.6.2. Use of Buffer Stocks............................................................................................... 70 5.6.3. Export Bans............................................................................................................. 70 5.6.4. Cash Transfers ........................................................................................................ 71 5.6.5. Food-for-Work Programs........................................................................................ 71 5.6.6. Food Stamps............................................................................................................ 72 5.6.7. School Feeding........................................................................................................ 72
6. Assessment of the Social Cost of the 2006-2008 Food Price Crisis..................................... 72 6.1. Methodology .................................................................................................................. 72 6.2. Discussion of Results ..................................................................................................... 73 6.3. Application of Results to ODC Countries...................................................................... 74 6.4. Final Word of Caution.................................................................................................... 78
7. Concluding Policy Recommendations.................................................................................. 78 7.1. Contingency Planning .................................................................................................... 78 7.2. Emergency Preparedness................................................................................................ 80 7.3. Crisis Response Policies................................................................................................. 81
8. References............................................................................................................................. 83 9. Appendix............................................................................................................................... 87

LIST OF FIGURES
Figure 1: Population Weighted Per Capita Income of China and India and IMF Food Price Index (2005 = 100).................................................................................................................... 5
Figure 2: Estimated World Import Growth of Selected Commodities over 2005-2007 Average .. 6 Figure 3: Ammonia (USD/ton) and Gas Prices (Mont Belvieu, TX Propane Spot Price FOB,
Cents per Gallon), January 2000=100 ............................................................................ 7 Figure 4: Pros and Cons of Biofuel................................................................................................. 8 Figure 5: OECD Biofuel Production and Feedstock Consumption Forecasts................................ 9 Figure 6: Simulations of Changes of World Prices of Feed Stock Crops and Sugar in 2020 ...... 10 Figure 7: Calorie Availability Changes in 2020 ........................................................................... 10 Figure 8: World Population and World Food Production Index (1961-2004).............................. 11 Figure 9: Agricultural Productivity by 2080 (with carbon fertilization, less pessimistic view)... 13 Figure 10: Water Scarcity ............................................................................................................. 14 Figure 11: Stock-to Use Ratios and Prices ................................................................................... 15 Figure 12: Food Price Incex and USD/EUR Exchange Rate (Jan 2005=100) ............................. 16 Figure 13: Internally Displaced in Iraq......................................................................................... 42 Figure 14: Land Inequality vs. Cereal Yield................................................................................. 63 Figure 15: Residual Agricultural Productivity and Population Growth Rate ............................... 65 Figure 16: Estimated Food Inflation Elasticities .......................................................................... 74

LIST OF TABLES Table 1: Relative Agricultural Productivity in ODC Countries.................................................... 20 Table 2: Elasticity of Cereal Yield to various Determinants ........................................................ 23 Table 3: Development Potentials of Credit Markets and Transportation Infrastructure .............. 23 Table 4: Lebanon’s Top-Ten Agri-Food Imports in 2006 ............................................................ 29 Table 5: Lebanon’s Major Import Partners of Basic Foods in 2004............................................. 29 Table 6: Syria’s Top-Five Agri-Food Imports (2003) .................................................................. 33 Table 7: Syria’s Major Import Partners of Basic Foods (2004)................................................... 33 Table 8: Jordan’s Major Import Partners of Basic Foods (2004) ................................................. 36 Table 9: Iran’s Major Import Partners of Basic Foods (2004)...................................................... 39 Table 10: Yemen’s Major Import Partners of Basic Foods (2004) .............................................. 48 Table 11: Agriculture and Food Security among ME-ODC Countries – Stylized Facts.............. 52 Table 12: Relative Food Share Expenditures as an Indicator for Market Efficiency ................... 55 Table 13: Marginal Increases of Total Revenues to 1% Increases of Price.................................. 59 Table 14: Snapshot of Food Price and General Inflation as Reported in Local Newspapers....... 61 Table 15: Undernourishment and Income Inequality ................................................................... 66 Table 16: Short Term Response Policies ...................................................................................... 69 Table 17: Food Price Elasticity of Undernourishment (Pooled OLS double log regression)....... 73 Table 18: Estimation of Socioeconomic Impacts of Food Price Crisis on ODC Countries ......... 76

LIST OF APPENDIX ITEMS
Appendix Item 1: Data Description .............................................................................................. 87 Appendix Item 2: Agricultural Productivity Regressions............................................................. 88 Appendix Item 3: Regression Results Food Expenditure Shares ................................................. 90 Appendix Item 4: Cereal Yield vs. Land Inequality ..................................................................... 90 Appendix Item 5: Cereal Yield vs. Fertility.................................................................................. 91 Appendix Item 6: Compilation of Socioeconomic Indicators of ODC Countries ........................ 92

1
1. Introduction
1.1. Definition of Project
This study analyzes the food markets of Jordan, Syria, Lebanon, Palestine, Iran, Iraq, and Yemen
(ME-ODC Countries). These countries cover the Middle Eastern part of the area covered by the
operational activities of the ODC, which also extends to North Africa and the Caucasus. Despite
some similarities, such as adverse climatic conditions for agricultural production, the countries
are generally very different and confronted with different problems. Each country therefore
requires a substantial amount of separate treatment. The objective of the study is to better
understand the dynamics of the food markets of these countries, particularly in light of the recent
food price inflation. The findings shall help the World Food Program (WFP) to identify
appropriate strategies for contingency planning, emergency preparedness, and the formulation of
response policies.
1.2. Particular Challenges
As many other economies, the countries of this study are adversely affected by the recent upward
trend in food prices. As opposed to other cases, though, the countries of interest in this study are
subject to particular challenges that aggravate the current crisis. In the case of Palestine it is the
effect of Israeli occupation. In the case of Iraq, it is the aftermath of the US-led invasion. Closely
related to the developments in Iraq are the situations in Syria and Jordan, where many Iraqis
found refuge. Lebanon still recovers from the July 2006 war between Hezbollah and Israel,
which had devastating effects on rural communities and the agricultural sector. Yemen is one of
the least developed countries of the world, is confronted with an influx of Somali refugees, and

2
suffers particularly from the widespread use of Qat as a recreational drug and stimulant. Lastly,
Iran is currently one of the biggest receivers of windfall profits from oil exports.
1.3. Specific Questions
Several questions naturally suggest themselves:
• What are the sources of the food price crisis? Although the answer to this question lies in
a multitude of factors, a constant monitoring of these determinants is especially important
for contingency planning purposes. Section two will discuss these aspects.
• What is the state of agricultural supply? In a study of food markets, it lends itself to start
with the supply side. The main objective is to identify ODC countries’ agricultural
productive capacity from a comparative perspective. By doing so it will be looked at a
variety of physical and institutional input factors that are important for agricultural
development. Questions of interest are: Is farming short of fertilizers or irrigation? How
big is the effect of regional water scarcity? Is there a lack of capital per farmer? Do
farmers have access to human capital, transportation infrastructures, and financial
capital? These questions will be examined in section three. They are designed to help in
the formulation of policies to help the WFP in its objective to “[E]nable development by
(a) helping people build assets that benefit them directly; (b) promoting the self-reliance
of poor people and communities.” (WFP online).
• What are the challenges of food market development beyond what can be derived from
readily available data? The comparative perspective of section three is of an introductory
nature, which will be complemented in section four by a more in-depth analysis of the
various markets. This is necessary given the wide range of different challenges that

3
prevail among ODC countries. The study of country-specific peculiarities is important for
the formulation of emergency preparedness and contingency planning strategies. Section
four thus discusses country by country with regards to general economic conditions, the
state of food security, and market and trade characteristics.
• How does the current food price crisis affect various economic actors? Demand and
supply side adjustments as discussed in textbooks of economics are often very different
from the real behavior of economic actors on the ground. This is particularly true for
countries that are as unique as the ones of this study. Knowledge about consumer and
producer behavior is therefore an integral part of the formulation of response strategies.
Following the same objective, another important question addressed in this context is:
What policy options are available and have been introduced by ODC Countries to address
food price inflation? Section five is subject to these questions, whereas its analysis relies
substantially on the content analysis of local newspaper reports.
• How did the food price crisis hit the various countries? The food price crisis goes far
beyond the measurement of undernourishment. It also affects malnourishment, poverty,
access to food, school enrollment, and food expenditures shares. Section six estimates the
response elasticity of various food related and socioeconomic indicators and attempts to
quantify the impact in the context of the current food price crisis.
1.4. Data and Methodology
The actuality of the problem underlying this study called for a substantial use of internet sources.
Main sources were reports, background papers, and commentaries that are published on the
websites of international organizations and nongovernmental organizations. Major sources of

4
information were the Food and Agriculture Organization (FAO), the World Bank, the
International Monetary Fund, the World Food Program (WFP), United Nations High
Commissioner for Refugees (UNHCR), Organization for Economic Development (OECD) and
ReliefWeb. It was also found that Canada’s Agriculture and Agri-food Ministry and the United
States Department of Agriculture had valuable information on the ME-ODC economies. Another
important source was newspaper articles, which were very helpful for qualitative assessments of
the situation on the ground.
A major objective of this study is to obtain a quantitative impression of the food price crisis,
which began to unfold itself in 2006. Although official data for the year 2005 and onwards is
scarce, many arguments made in this study call for some kind of empirical support and
estimation. The absence of accurate and up-to-date time-series data for the countries of this study
thus requires working with available panel data as a second-best solution. This constraint should
be kept in mind when reading this report and some of its results should be interpreted
accordingly as an initial explorative assessment.
2. The Food Price Crisis – A Brief Overview of Main Arguments
2.1. Rising Demand
Higher food prices are the result of an increase in demand from fast growing emerging
economies, dominated by China and India. Both economies have experienced a combined
population-weighted real per capita income growth rate of more than seven percent since the
year 2000. In 2000 dollars, the two countries’ population-weighted per capita income increased

5
by more than 400% from $200 in 1980 to over $1,056 in 2005 (own calculations). Today, both
countries furthermore contribute for at least 30% of world growth (Reisen, 2006). But to which
extent the rise of emerging economies accounts for rising food prices is difficult to say. If food
prices go up as a result of increasing wealth in India and China, then this must be a recent
phenomenon as Figure 1 shows.
Figure 1: Population Weighted Per Capita Income of China and India and IMF Food Price Index (2005 = 100)
0
20
40
60
80
100
120
140
1980 1985 1990 1995 2000 2005
Year
Food
Pric
e In
dex,
Com
bine
d Pe
r Cap
ita In
com
e of
Chi
na a
nd In
dia
Inde
x
FoodPrXIncome
Source: 2007 World Bank Development Indicator Database and International Monetary Fund Commodity Price Statistics, Author’s illustration.

6
2.2. Shift in Consumption Pattern
Increased wealth and urbanization in emerging economies is characterized by a reduction of
consumption of basic staples such as grain and rice and consumptive expansion of vegetables,
fruit, meat, and fish. Demand for meat, in turn, increases demand for grain as cattle feed.
According to Buntrock, G. (2007), farmers now use 200-250 million tons of grains more as cattle
feed than they did 20 years ago. In order to produce one kilogram of pork and beef, the required
amounts of grain are three and eight kilograms, respectively. According to the OECD-FAO
Agricultural Outlook 2008, world import growth of food will be dominated by developing
countries and be strongest among whole milk powder, vegetable oils, and meat. Figure 2
provides a graphical summary of the estimated growth of world imports of selected commodities.
Figure 2: Estimated World Import Growth of Selected Commodities over 2005-2007 Average
Source: FAO-OECD Agricultural Outlook, p. 23.

7
2.3. Higher Energy, Transportation, and Fertilizer Costs
Higher energy prices resulting from rising wealth in fast developing emerging economies,
geopolitical instability, and a shortage of refineries trigger a vicious cycle for farming
communities. As energy prices go up, prices for intermediary goods and input factors in
agriculture increase as well. An obvious side effect is higher transportation and market access
costs. Another important case in point is the price of fertilizers. Natural gas, as a substitute for
oil, is not only linked to the price of oil, but also to the price of nitrogen fertilizer, whose
production uses natural gas as an important input factor. It accounts for approximately 90% of all
production costs (Finch, 2007). According to author’s estimates, a 1% increase in natural gas
prices increases ammonia prices by approximately 0.8%. Figure 3 displays the close relationship
between natural gas and ammonia prices.
Figure 3: Ammonia (USD/ton) and Gas Prices (Mont Belvieu, TX Propane Spot Price FOB, Cents per Gallon), January 2000=100
70
80
90
100
110
120
130
140
1999 2000 2001 2002 2003 2004 2005 2006 2007 2008
AmmXGasX
Sources: Yara International ASA (http://www.yara.com/en/about/index.html) and Energy Information Agency (http://tonto.eia.doe.gov/dnav/pet/pet_pri_spt_s1_d.htm), Author’s illustration.

8
The vicious cycle consists of the following: As fertilizer prices increase, farmers need to
substitute it for alternative means. Lower yields are the result, which in turn increase the scarcity
problem, put further upward pressure on agricultural prices, and aggravate hunger and poverty.
In the developed world, fertilizer costs account for more than 10% of total farming expenses for
the cultivation of wheat, corn, and soybeans (Brown et. al., 2008). In developing countries,
fertilizer shares of total farming expenses are obviously much higher.
2.4. Biofuel
As energy prices increase, substitution effects towards biofuel take place. According to Braun
(2007, p. 7), biofuel production becomes economically efficient when oil prices rise beyond
USD 60. Its environmental efficiency is highly controversial, though. Groom et. al. (2007, p.
608) discuss the pros and cons of biofuel and conclude that “certain feedstock production
practices can in fact cause great harm to the land, soils, water, and climate.” Figure 4 summarizes
some of the authors’ findings regarding the pros and cons of biofuel.
Figure 4: Pros and Cons of Biofuel
Source: Stiffler, L. (2008, online), referencing to Groom et. al. (2007).

9
Biofuel has been an important contributor to the fact that the demand for cereal consumption has
been increasingly greater than its production. Braun (2007, p. 5), quoting FAO studies, reports
that while cereal demand for consumption for food and feed increased by 4% and 7%,
respectively since 2000, its industrial use has increased by more than 25%. Biofuel is mostly
produced from sugar cane, especially in Brazil, maize, generally in the US, and rapeseed, mostly
in Germany. As crude oil prices keep on rising, demand for various feed crops for industrial
purposes will increase, too. Prices for food crops and biofuel become thus similarly
interdependent and cointegrated as prices of fertilizer and natural gas.
The OECD (2008) estimates that biofuel-production will increase from currently 80 billion liters
to 120 billion liters in 2016. The share of feedstock used in this production differs from country
to country and is the range of 60% of Brazil’s sugar cane production to 5% of China’s maize
harvest. The two panels of Figure 5 summarize these OECD estimates.
Figure 5: OECD Biofuel Production and Feedstock Consumption Forecasts
Biofuel Production Forecast until 2016 Feedstock Consumption in 2016
Source: OECD (2008)
The International Food Policy Research Institute simulated the possible effects of the expansion
of biofuel production on food prices and food security. Two scenarios were simulated: a
10
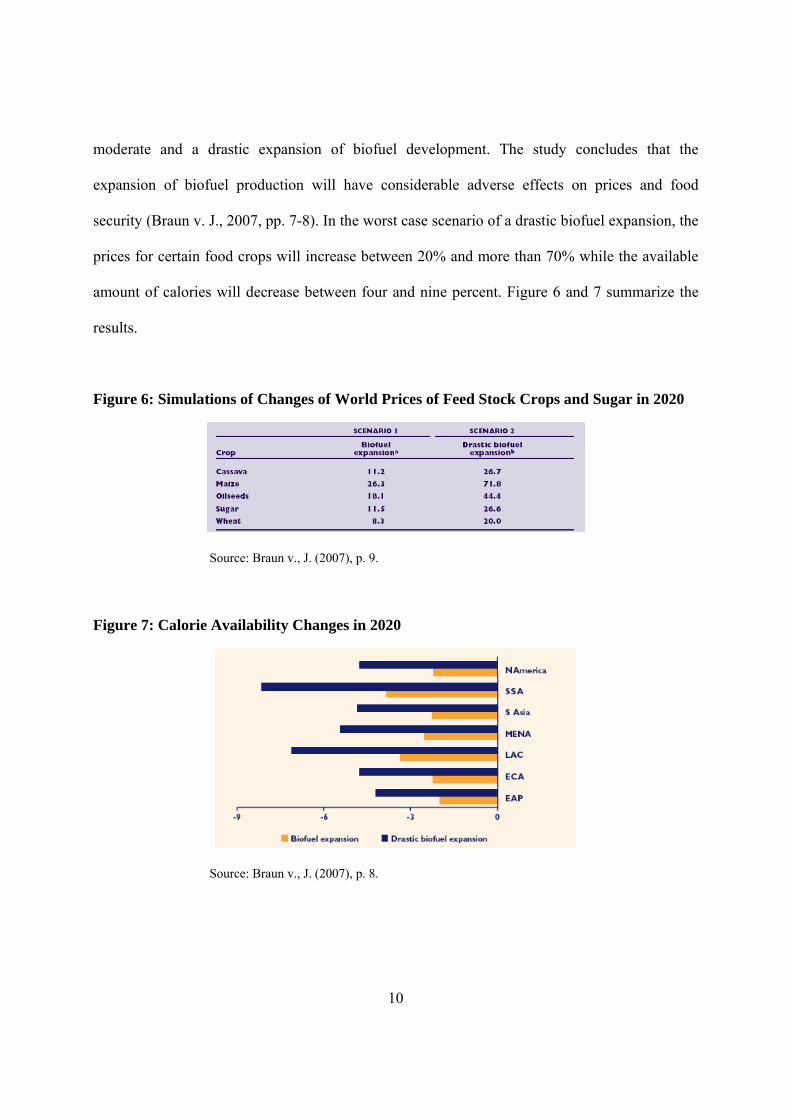
moderate and a drastic expansion of biofuel development. The study concludes that the
expansion of biofuel production will have considerable adverse effects on prices and food
security (Braun v. J., 2007, pp. 7-8). In the worst case scenario of a drastic biofuel expansion, the
prices for certain food crops will increase between 20% and more than 70% while the available
amount of calories will decrease between four and nine percent. Figure 6 and 7 summarize the
results.
Figure 6: Simulations of Changes of World Prices of Feed Stock Crops and Sugar in 2020
Source: Braun v., J. (2007), p. 9.
Figure 7: Calorie Availability Changes in 2020
Source: Braun v., J. (2007), p. 8.

11
There are also voices that argue that the adverse interaction between biofuel and food security is
overrated. The main counter-argument is that there is no global shortage in the sense that there
would not be enough food available to feed the world. In fact, as Figure 8 shows, food
production has always kept up with the world population. Since the 1990s, world food
production seems to be even growing at a slightly faster rate than world population.
Figure 8: World Population and World Food Production Index (1961-2004)
Population and Food Production Development in the World, 1961-2004
0
20
40
60
80
100
120
1960 1965 1970 1975 1980 1985 1990 1995 2000
Year
Popu
latio
n, F
ood
Prod
uctio
n In
dex
(200
0=10
0)
PopWORFPXWOR
Source: 2007 World Bank Development Indicator Database, Author’s illustration.
The argument in favor of biofuel continues that the real problem of food insecurity in developing
countries is access to food, which is hampered by inefficiencies in agricultural production,
deficient transportation infrastructure, lack of access to markets and credit, inequality of

12
economic opportunities, and poor quality of governance. In short: The problem is much more
underdevelopment in general, not biofuel. Accordingly, some political leaders, like in Brazil,
which is the world’s biggest ethanol producer, even argue that energy crops are a key to escape
underdevelopment and to empower farming communities.
Given the actuality of the biofuel discussion, studies regarding the price effects are mushrooming
and often manipulated along political interests. The Guardian, in his July 4, 2008 edition, for
example, quotes a “secret” World Bank report, conducted by World Bank economist Don
Mitchell that attributes 75% of the food price increase to biofuel while the US government’s
estimate is only 3%. Another difficult to predict impact of biofuel production is the loss of
biodiversity, as tropical deforestation is replaced by mono-cultures with presumably high biofuel
returns.
2.5. Climate Change
Simulations predict “agricultural winners and losers” from climate change. Although the impacts
of climate change vary from region to region, winners are more likely to occur in the northern
hemisphere. Exact predictions are nevertheless difficult to make. Particularly difficult is the
assessment of so-called carbon fertilization, which refers to the stimulating effect of carbon
dioxide on tree growth. If one takes this effect positively into account, simulations tend to
generate less dismal predictions. Cline (2007) has systematically separated these two effects in
his study. In the Arab world, where forests are scarce, this distinction is barely important,
though. According to Cline’s study, the Middle East is located in the region that is most

13
vulnerable to climate change. According to Cline’s findings, agricultural output will decrease by
15-30% by 2080. Figure 9 provides a graphical summary of Clines’ predictions.
Figure 9: Agricultural Productivity by 2080 (with carbon fertilization, less pessimistic view)
Source: Cline (2007), p. 75.
2.6. Water Scarcity
Water scarcity is another distinct characteristic of the region. Whereas the world average of
renewable water resources per capita in 2005 was 8,549 m3, all ODC countries ranged far below
this average. In the case of Yemen and Jordan, per capita water consumption already exceeds the
natural per capita water supply. With almost 90%, agriculture accounts for the lion share of
water consumption. As Figure 10 illustrates, water availability per capita will shrink dramatically
by 2050. The biggest challenges to future water management will be population growth,
industrial water pollution, agriculture’s water thirst, and possibly the containment of armed
conflicts over water scarcity.

14
Figure 10: Water Scarcity
Renewable Water Resources Per Capita (1975-2025, m3) Water Availability in ODC Countries (1950-2050)
0
5000
10000
15000
20000
25000
1950 1955 1960 1965 1970 1975 1980 1985 1990 1995 2000 2005 2010 2015 2020 2025 2030 2035 2040 2045 2050
Year
Ren
ewab
le W
ater
Per
Cap
ita (c
ubic
met
ers)
LebanonSyriaJordanIranIraqYemen
Water withdrawal per capita as a percentage of available renewable water resources 2005
Lebanon Syria Jordan Iran Iraq Yemen Palestine 33% 84% 129% 56% 63% 186% NA
Source: Gardner-Outlaw, T., Engleman, R. (1997), India’s Ministry of Water Resources (medium forecast)
http://www.cwc.nic.in/ISO_DATA_Bank/waterrelated2007/chapter1pdf/TABLE%201.29FINAL.pdf) and World Resources Institute (http://earthtrends.wri.org/pdf_library/data_tables/wat2_2005.pdf).
2.7. Declining Food Reserves and Speculation
The increase in demand for food crops in combination with reduced production inevitably leads
to declining food stocks. A major food scarcity indicator is the stock-to-use ratio, which
measures end-of-period stocks relative to total consumption during the same period. Stock-to-use
ratios are widely used predictors of future price developments. They also can be translated into
days of remaining consumption. Rathi (2008) has compiled evidence of the relationship between
stock-to-use ratios and prices for the world’s production of wheat, corn (maize), and rice. Figure
11 displays his findings.

15
Figure 11: Stock-to Use Ratios and Prices
Figure 11 a: World Wheat Stock-to Use Ratio vs. Price
Figure 11 b: World Corn Stock-to Use Ratio vs. Price
Figure 11 c: World Rice Stock-to Use Ratio vs. Price
Source: Rathi (2008)
The results show that both world wheat and corn production have experienced a continuous
decline in stock-to-use ratios since 2000. During the same time, prices for wheat and corn
increased by roughly 250 percent and 100 percent, respectively. Whereas the decrease in stock-
to-use ratios has been a trend for these two commodities since the year 2000, price responses
occurred mostly after 2005. The behavior of rice is different, with both stock-to-use ratios and
16
prices having shown an upward trend since 2000. The relationship between falling stock-to-use
ratios and rising prices is substantially driven by commodity price speculation.
2.8. Dollar Depreciation
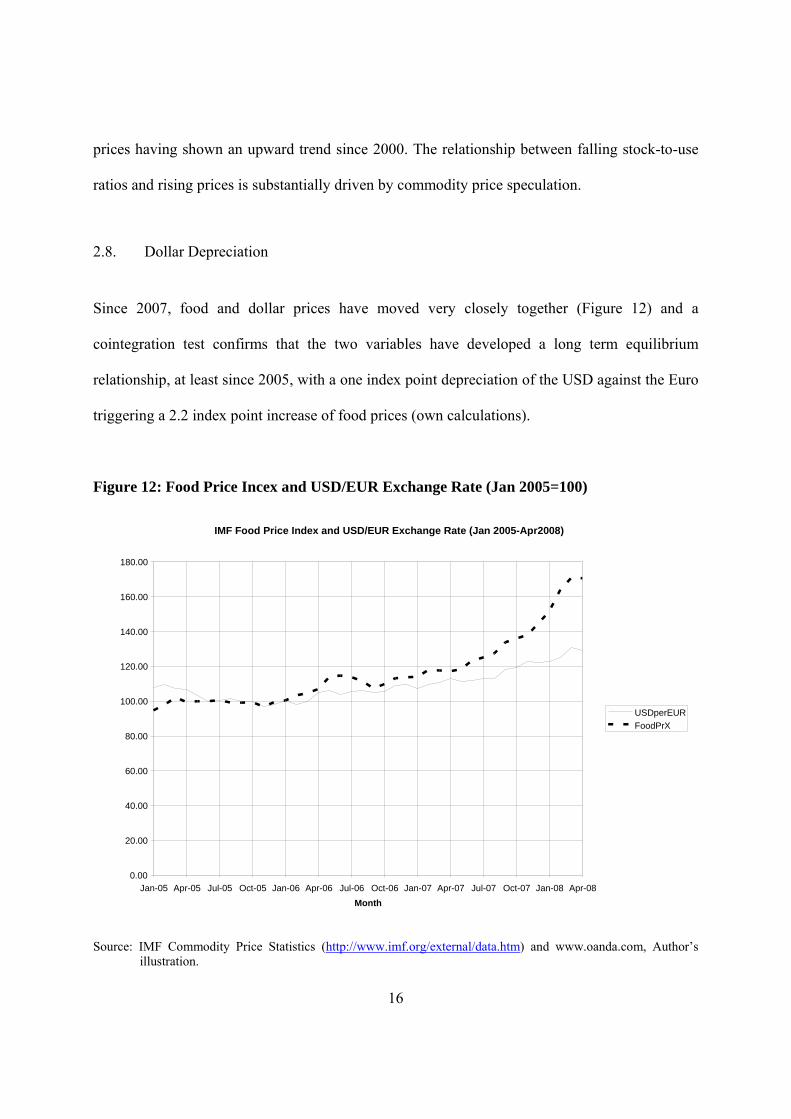
Since 2007, food and dollar prices have moved very closely together (Figure 12) and a
cointegration test confirms that the two variables have developed a long term equilibrium
relationship, at least since 2005, with a one index point depreciation of the USD against the Euro
triggering a 2.2 index point increase of food prices (own calculations).
Figure 12: Food Price Incex and USD/EUR Exchange Rate (Jan 2005=100)
Source: IMF Commodity Price Statistics (http://www.imf.org/external/data.htm) and www.oanda.com, Author’s illustration.
IMF Food Price Index and USD/EUR Exchange Rate (Jan 2005-Apr2008)
0.00
20.00
40.00
60.00
80.00
100.00
120.00
140.00
160.00
180.00
Jan-05 Apr-05 Jul-05 Oct-05 Jan-06 Apr-06 Jul-06 Oct-06 Jan-07 Apr-07 Jul-07 Oct-07 Jan-08 Apr-08 Month
USDperEURFoodPrX

17
Commodity prices are traded internationally in US dollar and its depreciation causes sellers to
raise prices in order to make up for the depreciation. To this adds that monetary policies between
the US and Europe are not coordinated. Inflation fears are of a much greater concern to the
European Central Bank than to the FED, which is traditionally equally concerned with price
stability and employment. As a result, Europe is more likely to maintain a positive interest rate
gap to the US, which may trigger a vicious cycle. As higher interest rates in Europe attract more
capital, the dollar will keep on depreciating and send commodity prices even higher. However,
exchange rates are highly volatile constructs and their formation depends on many more
macroeconomic fundamentals but interest rates.
3. The State of Agricultural Supply in ODC Countries
3.1. Preliminary Remarks
For the purpose of this study, a panel dataset was built. The countries listed go beyond the seven
of this study in order to be able to estimate representative empirical relationships from panel
evidence and to compensate for data scarcity that characterizes the Arab world. Each country has
ideally nine observations, which are consecutive five-year averages beginning with the 1961-
1965 and ending with the 2001-2005 observation. Data availability constraints, however,
produce many missing observations. This problem is more severe with earlier observations.
Appendix Item 1 about Here [Dataset Description]

18
3.2. Where do ME-ODC Countries Stand?
According to Saif (2008), agricultural markets in the Arab world perform suboptimally because
of limited access to capital and markets, outdated farming practices, lack of human capital,
adverse market interventions by public policy, geographic disadvantages, especially water
scarcity and arid climates, inefficient energy sectors, limited competitive pressure among
producers and retailers, as well as a general neglect of the agricultural sector due to fast
urbanization. Many of Saif’s claims can be tested empirically.
The standing of the ODC countries in terms of agricultural productivity relative to various
socioeconomic fundamentals can be estimated econometrically by making use of a residual
analysis. The following equations are estimated:
• Identification of Relative Agricultural Productivity:
Cereal Yieldi = b0+b1 Per Capita Incomei + b2 Water per Capitai + b3 Yeari + εi
• Relative Use of Fertilizers
Fertilizer Usei = b0+b1 Per Capita Incomei + b2 Water per Capitai + b3 Yeari + εi
• Relative Use to Irrigation Systems
Irrigation Usei = b0+b1 Per Capita Incomei + b2 Water per Capitai + b3 Yeari + εi

19
• Relative Endowment of Capital per Agricultural Worker
Capital/Workeri = b0+b1 Per Capita Incomei + b2 Yeari + εi
• Relative Access to Human Capital
Secondary School Enrollmenti = b0+b1 Per Capita Incomei + b2 Yeari + εi
• Relative access to Transportation Infrastructure
Transportationi = b0+b1 Per Capita Incomei + b2 Yeari + εi
• Relative access to Credit
Domestic Crediti = b0+b1 Per Capita Incomei + b2 Yeari + εi
Positive residuals indicate an excess exploitation of the policy parameter, negative residuals a
deficiency. Deficiencies are fields that should be addressed by public policy. Table 1 summarizes
the results, whereas the countries are classified according to the residual of the most recent
observation. The actual regression results are listed in Appendix Item 2.
Appendix Item 2 about Here [Agricultural Productivity Regressions]

20
All ODC countries reveal an agricultural productivity deficit after controlling for per capita
income, water per capita and the observation period. No data was available for Iraq and
Palestine, but the particular geopolitical constraints of these two countries make them obvious
productivity-deficit countries, too.
Table 1: Relative Agricultural Productivity in ODC Countries
LBN SYR JOR IRN IRQ YEM PAL Agricultural Productivity Deficit?
Yes Yes Yes Yes -- Yes --
Fertilizer Use Deficit?
No No No No -- Yes --
Irrigation Use Deficit?
No No No No No No --
Capital per Farmer Deficit? No No Yes No -- No --
Access to Human capital Deficit? -- Yes No No Yes Yes No
Transportation Infrastructure Deficit?
-- Yes Yes No -- -- --
Access to Credit Deficit? No Yes No No -- Yes --
Source: Author’s calculations.
Regarding the tangible input factors fertilizer, irrigation, and capital per farmer, Yemen shows a
deficit in fertilizer use and Jordan in capital per worker. No country lacks relative irrigation
capacities. However, discussions with WFP-personnel with field work experience at WFP’s
regional office in Cairo, Egypt, September 21, 2008, revealed that despite the presence of
physical capital on the ground, the know-how to operate the technology efficiently is often not
given.

21
Nevertheless, there is no strong statistical support for the conclusion that agricultural
development lacks behind general economic development. Relative human capital development
deficits are more common, which of course, complement practitioners’ reports that the
availability of agricultural capital is not necessarily a guarantor for their proper use. Educational
deficits can be identified for Syria, Iraq, and Yemen. Syria has moreover a deficit in access to
credit, together with Yemen, and transportation infrastructure, together with Jordan. From a
general perspective, it thus seems that non-tangible input factors such as access to schooling,
markets, and credit pose a greater problem to agricultural productivity than tangible factors. The
only country that does not appear to have an immediate development deficit in any of the policy
fields is Iran. This is also reflected by the fact that Iran’s predicted agricultural productivity is
closest to the trend line.
Noteworthy is the generally good endowment with capital per agricultural worker, fertilizer use,
and irrigation in combination with relative credit scarcity in the case of Yemen and Syria. The
amount of private credit available is also always an indicator for an economy’s decentralization
degree. The more private credit is available, the more decentralized is the economy. Thus, the
observation of a relatively high endowment with agricultural technological infrastructure
(physical capital, fertilizer use, and irrigation) coinciding with low credit availability hints at a
need for structural adjustment and privatization.
Why does transportation infrastructure matter? Suboptimal transportation infrastructure prevents
economies of scale in production and conserves inefficient smallholder farming. The problem of
an inefficient transportation infrastructure may have several sources: Lack of regional

22
development, strong center-periphery patterns, adverse business climates preventing the
development of a transportation service sector, and the combination of all.
The various deficits can also be assessed quantitatively. Two steps are necessary for this. First,
one needs to estimate the response elasiticity of agricultural productivity to the various
parameters. This can be done by estimating the following equations:
Cereal Yieldi = b0+b1 Per Capita Incomei + b2 Fertilizer Consumptioni + b3Yeari + εi
Cereal Yieldi = b0+b1 Per Capita Incomei + b2 Capital per Farmeri + b3Yeari + εi
Cereal Yieldi = b0+b1 Per Capita Incomei + b2 Secondary Enrollmenti + b3Yeari + εi
Cereal Yieldi = b0+b1 Per Capita Incomei + b2 Transportationi + b3Yeari + εi
Cereal Yieldi = b0+b1 Per Capita Incomei + b2 Domestic Crediti + b3Yeari + εi
These equations are estimated as double log regressions except equation three which focuses on
human capital. Secondary school enrollment enters the equation on the right hand side non-
transformed, thus making the regression coefficient a semi-elasticity. Omitting the coefficients
for the constants, per capita income and the observation period, the following response
elasticities of cereal yield are obtained

23
Table 2: Elasticity of Cereal Yield to various Determinants A 1% increase
of fertilizer consumption
A 1% increase of capital per
worker
A 1 percentage point increase of
secondary enrollment
A 1% increase of transportation
capacity
A 1% increase of domestic
credit
increases cereal yield by 0.198% 0.046% 0.009% 0.039% 0.069%
t-stat 21.622 1.076 4.787 4.043 3.247 p-value 0.00 0.23 0.00 0.00 0.00
N 1137 213 270 527 1104 Adj. R2 58.3 23.9 45.3 44.8 41.3
Source: Author’s calculations
Second, these elasticities are then applied to the actual deficits behind Table 1. The results,
summarized in Table 3, confirm the impression that improvements in access to capital markets
and transportation infrastructure are not only more common among the ODC countries than
deficits in direct agricultural technology, the simulation of the correction of these deficits relative
to the general level of development also pays a substantial productivity dividend. Better access to
capital and markets will stimulate agricultural productivity through greater managerial
independence and greater economic incentives.
Table 3: Development Potentials of Credit Markets and Transportation Infrastructure SYR
(1996-2000) JOR
(1996-2000) IRN
(1996-2000) YEM
(2001-2005) Cereal Yield Predicted (using income, water & time) 1818 1801 1953 1324 Cereal Yield Real 1382 1639 1949 864 Development Potential 32% +9% +0.2% 53% Development Potential Fertilizer Use +21.5% Development Potential Capital per Farmer +1.1% Development Potential Human Capital +0.04% 0.04% Development Potential Financial Market Development 11.1% 11.0% Development Potential Transportation Infrastructure 2.9% 25.2%
Source: Author’s estimates.

24
4. More in Depth Analysis of ODC Countries
4.1. Overview
The countries of this study show a host of different vulnerabilities. Lebanon, Jordan, Syria, and
Iran have low levels of chronic food insecurity and relatively functioning food markets. In the
absence of exogenous shocks such as a war, a refugee crisis, or a severe drought, these four
countries should have the means to address systemic food insecurity issues within their own
resources. Iraq, Palestine, and Yemen, on the other hand, suffer from high levels and chronic
food insecurity and relatively underdeveloped markets. In these countries, problems of food
insecurity are not limited within small pockets of the society. The size and scope of food
insecurity and the nature of exogenous problems in these countries suggest that domestic
resources will not suffice to solve problems domestically. In analyzing the ODC countries in
more detail, the following aspects will be prioritized: General economic conditions, the state of
food security, and market and trade overview.
4.2. Lebanon
4.2.1. General Economic Conditions
In 2005, Lebanon had a per capita income of $5,672 in year 2000 USD. This corresponds to the
73.2 percentile rank of all countries in the world for which data was available and makes
Lebanon the richest country of this study. Lebanon, however, suffers from low investment
activity, which affects the agricultural sector as well. Domestic investment averaged 19% of
GDP during the 2001-2005 period whereas the income-predicted value is 5% higher. Another

25
2% of gross capital formation comes from foreign aid. After the civil war, Lebanon experienced
fast economic growth, driven by construction. This growth boom, however, has not proved to be
sustainable and economic growth has slowed down to around 2%-3% since 2000. Between 1960
and today, Lebanon has experienced fast urbanization. Its rural population decreased from 52.5%
to 13.6%. The growth rate of the population is with 1% low.
Historically, Lebanon has never been driven by domestic investment rather than capital imports.
These capital imports were the result of Lebanon’s particular geopolitical position as the bridge
between the West and the Arab world. After the 1958 revolution in Iraq, the unification between
Syria and Egypt as the United Arab Republic, and socialist experimenting in Egypt and Syria in
the 1960s, huge amounts of money fled into the presumably safe haven of Lebanon. Yet, this
money has been more of a curse than a blessing. It led to huge wealth concentration among
business elites in Beirut and had little spillover effects into the periphery. Attracted by the
increased wealth accumulation, migration from the periphery to Beirut then set in without the
city being prepared to respond appropriately. Quickly, a poverty belt and illegal settlements grew
around the southern suburbs of Beirut.
Another reason for Lebanon’s suboptimal investment climate is of a geopolitical nature,
especially the Arab-Israeli conflict. After the 1967 Arab-Israeli war, Lebanon saw itself suddenly
confronted with a Palestinian refugee population that accounts for roughly 10% of the total
population. The Palestinian problem quickly topped the political agenda, divided the country
politically, and made Lebanon vulnerable to external interventions. This conflict culminated into
the 1975-1990 civil war. After the war, Lebanon never really recovered economically. Its once

26
unique geo-strategic position was taken over by Gulf economies, which attract now most of the
capital imports in the Arab world. The post civil war reconstruction boom lasted only shortly,
prioritized prestigious real estate projects over sustainable economic development, and
eventually drove the state into several debt crises that persist until today. In the wake of highly
unbalanced economic development, the political power-sharing formula is increasingly
challenged by various political factions and keeps the country in a political limbo.
4.2.2. The State of Food Security
The percentage of people undernourished in Lebanon averaged 3% in the 2001-2005 period,
corresponding to a 23.5 percentile rank of all countries with available data. Relative to its per
capita income, Lebanon’s percentage of undernourished is far below the income predicted value,
which is 9%.
The 2006 war between Hezbullah and Israel hit the agricultural sector the most and prevented a
regular harvest. The Israeli bombardments destroyed livestock, trees, fields, boats, nets,
machinery and marketing infrastructure. In the South, cluster bombs and unexploded ordnances
made 25% of the cultivated fields temporarily inaccessible. The FAO estimates the total damage
to the agricultural sector at $280 million. Its recovery is still not complete and a variety of
international organizations assist farming communities to rebuild their livelihoods, where
agriculture accounts for about 70% of household income (FAO Newsroom 2006).
The war put a temporary end to generally low levels of food insecurity. Beginning with the
outbreak of hostilities on July 12, 2006, roughly 25% of Lebanon’s population became instantly

27
food insecure. After the war ended on August 14, 2006, however, food markets showed
impressive resiliency. The World Food Program’s emergency program in Lebanon, after
distributing almost 13,000 tons of foods to more than 810,000 people, was already terminated on
October 31, 2006 (WFP News Press Release, 2006).
Another sudden food insecurity concern arose in 2007, when armed conflict between the militant
group of Fatah-al Islam and the Lebanese broke out in the refugee camp of Nahr al-Bared. Nahr-
al Bared hosts more than 32,000 registered refugees, organized in some 5,500 families.
According to a WFP (2008) study, only 1,200 families returned to the camp by May 2008. The
full restoration of the camp will take at least three years. Despite the physical destruction and
emotional hardship that the refugees had suffered, WFP finds that all internally displaced have
sufficient access to food. Securing enough food, however, comes at costly coping strategies.
There are reports of people skipping meals at least once a week, shifts in diet, reduction of
personal hygiene expenses, and sales of personal assets such as personal jewelry and
memorabilia. The 14 refugee camps in Lebanon with its more than 200,000 registered refugees
should receive constant food security monitoring.
4.2.3. Market and Trade Overview
The value added of agriculture to GDP accounts for roughly 6% of GDP in 2005 (Presidency of
the Council of Ministers, p. 13) and employs 8% of the labor force. Lebanon is highly food
import dependent, satisfying 70% of its food needs through imports (Agriculture and Agri-food
Canada, 2007). Domestic wheat production regularly covers less than 30% of domestic
28
consumption (FAO Stat). Its food trade deficit as a percentage of GDP stands at 5.6% of GDP
and is substantially favored by a highly overvalued exchange rate.
Lebanon’s problem is not so much inefficient cultivation of existing arable land, rather than the
underdevelopment of agricultural business opportunities. According to Canada’s Agriculture and
Agri-food ministry and its foreign market information system (online), Lebanon exploits only
55% of its productive areas. It also laments wasteful and inefficient agricultural practices and
lack of public and private funding. Thus, although Lebanon as a whole is not short of private
credit as shown in section three, its agricultural sector likely is. In 2002, for example, only 0.3%
of the public budget and only 2% of bank loans were allocated to agriculture. After the civil war,
Lebanon witnessed a classical crowding out of private by public investment. Another problem is
the disappearance of high value-added food transformation and processing industries, with the
exception being wineries.
In 2006, Lebanon imported food for $ 1.3 billion. Lebanon’s ten major import categories and
trading partners in 2006 are summarized in the below Table 4, which shows that the biggest
market share accrues to non-neighboring countries. Agriculture and Agri-food Canada estimates
that the neighboring countries of Syria, Turkey and Egypt control about 15% of the import
market.

29
Table 4: Lebanon’s Top-Ten Agri-Food Imports in 2006 Product Volume-US$M First Two Largest Suppliers 1. Live Bovine Animals 137 Brazil-Germany 2. Cheese 82 Morocco-Egypt 3. Meat 68 Brazil-Paraguay 4. Wheat (Durum) 59 Russia-Turkey 5. Food Preparations 48 Ireland-USA 6. Sugar 47 Greece-Italy 7. Milk (Powder) 42 Netherlands/Czech Republic 8. Maize (Corn) 40 USA-Bulgaria 9. Oil (Soybean) 32 Syria-Egypt 10. Coffee 27 Brazil Source: Agriculture and Agri-Food Canada.
According to the 2005-2006 FAO Statistical Yearbook, which covers the year 2004, Lebanon’s
major import partners were the USA, France and Germany. The major import products were
cattle, cigarettes and wheat. Lebanon’s major export partners are Syria, Saudi Arabia, and the
United Arab Emirates and major export products are maize, tobacco, and apples. Table 5
provides an overview of Lebanon’s imports of cereals, maize, dry milk, vegetable oil, rice, sugar
and wheat from FAO Stat.
Table 5: Lebanon’s Major Import Partners of Basic Foods in 2004 Cereals Maize Dry Milk Vegetable Oil Country T Country t Country t Country t First China 131 USA 273503 Czech Rep. 572 Spain 62 Second Canada 22 Argentina 36376 Ukraine 450 Malaysia 19 Third Netherlands 8 Brazil 4359 France 429 Germany, 8 Fourth Denmark 5 Moldova 3304 Moldova 352 France, UK 4 Fifth Bulgaria 1175 Slovakia 100 Italy, KSA, India 4
Rice Sugar Refined Wheat Country t Country t Country t First Egypt 20 France 54865 Russia 169502 Second UK 45066 USA 93879 Third Belgium 17300 Australia 87775 Fourth Italy 8366 Syria 40000 Fifth Netherlands 7724 Argentina 39113 Source: FAO Stat

30
4.3. Syria
4.3.1. General Economic Conditions
In 2005, Syria’s per capita income was $1,175 in year 2000 USD, which places it at the 41.0
percentile rank of all countries. Relative to its per capita income, it has a considerable investment
activity of around 21% of GDP. For the period between 2001 and 2005, it was five percentage
points higher than predicted. Yet, high investment activity led to only suboptimal growth over
the same period, which was only 1.4% as opposed to the investment-predicted growth rate of
2.1%. Such an observation is not unusual for countries with big public sectors. Forced by a
young population where 60% are 20 years or younger and high unemployment rates, whose
range, depending on the source, is estimated between 10% and 25%, Syria has recently
embarked on a careful economic reform and liberalization path, which has already translated into
an improvement of its growth record. A major challenge will be to maintain this reform
momentum. Roughly 50% of Syria’s population still lives in rural areas, only down from 61% in
the early sixties. Relative to its per capita income, its population growth rate is with 2.5% higher
than the income predicted value.
4.3.2. The State of Food Security
According to FAO estimates, Syria’s percentage of undernourished lies at 4% and is much below
the income-predicted value of 21%. A UNDP estimate for the 2003-2004 period beyond
undernourishment concludes that 11.4% of the population have insufficient access to basic food
and non-food needs (Al Zoughbi, 2006). Heavy investments in the agricultural sector in recent

31
years have constantly improved Syria’s food trade position, which likely could be balanced by
today had Syria not been struck by a severe drought this year. According to the United States
Department of Agriculture (2008), wheat production will fall by 38% in 2008/2009 compared to
2007 as rainfall was only 15-30 of the average. The region most hit by the drought is Syria’s
“breadbasket” in the northeastern provinces, where 75% of total wheat production is located.
Wheat is Syria’s major grain crop, accounting for 83% of total grain production. As a
consequence of the drought Syria needed to import 120,000 tons of wheat this year. This made
Syria again a net wheat importer for the first time in 15 years.
The biggest problem of food insecurity lies among Iraqi refugees. According to UNHCR
statistics (2007), Syria accommodates an estimated 1.5 million Iraqi refugees. An increasing
number of Iraqis entering Syria arrive poorly prepared, only relying on their cash possession and
social networks. Not all refugees register with the UNHCR. In an emergency response operation,
the WFP (2008) found that among those who do register with the UNHCR, approximately 15%
carry cash with them that is too little to finance their basic food and non-food needs for more
than three months. As basic food prices have recently increased by 25-30% and housing prices
roughly doubled, many Iraqi refugees will become food insecure even faster. Another problem is
that the refugee problem also increases the vulnerability of Syrians. The influx of refugees drives
up prices and reduces real incomes of everyone else. Moreover, many refugees compete illegally
on the labor market with Syrians, thus crowding out domestic labor and putting pressure on the
development of real wages.

32
4.3.3. Market and Trade Overview
Syria’s economy has a substantial agricultural sector, which contributed 23% percent to GDP in
2005 and employed roughly 30% of the labor force. The agricultural sector is currently
undergoing change. According to Agriculture and Agri-Food Canada (2005), a previous neglect
of agriculture has been replaced by a proactive agricultural development policy. A priority is the
extension of irrigated farm land, which is supposed to increase by 38% in 2015. Between 1990
and 2003, agricultural policy translated into a constant increase of the wheat production to
consumption ratio. While in 1990 this ratio was only 95%, Syria grew into a substantial wheat
surplus producer country, displaying a production to consumption ratio of more than 180% in
2003.
Although production occurs mostly decentralized, the marketing and distribution process of, for
example, wheat is still controlled by the state. From a market theoretical perspective, the
separation of the allocation from the distribution decision is clearly a source of inefficiency.
Interestingly, though, the 2008 drought may actually oblige government to allow for grater
decentralization of marketing decisions. Syria’s government has always been the monopoly
procurer and marketer of the domestic wheat harvest, which are two positions it could easily
finance when world prices of agricultural products were still low. In the wake of rising prices,
however, farmers are no longer anymore willing to sell to the government and government may
thus be forced to abandon its intermediary position between production and distribution. If it
does so, food insecurity is likely to spread.

33
Agriculture and Agri-food Canada (2005) identifies Syria’s major agri-food imports as corn,
refined sugar, soybean oilcake, rice, and food preparations. Its major import partners are the
USA, Brazil, Argentina, Thailand, and Spain.
Table 6: Syria’s Top-Five Agri-Food Imports (2003) Product Volume-US$M First Two Largest Suppliers 1. Corn 147 United States 2. Refine Sugar 112 Brazil 3. Soybean oilcake 83 Argentina 4. Rice, milled 58 Thailand 5. Food Preparations 55 Spain Source: Agriculture and Agri-Food Canada.
According to the FAO 2005-2006 Statistical Yearbook, Syria’s major exports are sheep, cotton,
and wheat. The fact that Syria in 2008 has turned to a net wheat importer, from a net exporter of
it in previous years, is on the one hand a positive testimony of Syria’s agricultural development
process over the last years. But on the other hand it is also evidence of the fact that agriculture in
the region is highly vulnerable to climate change. Syria must therefore ask itself what price it is
willing to pay for improving its agricultural self-sufficiency in terms of foregone development in
other areas of the economy. Table seven provides a glimpse of Syria’s major import partners of
other basic food commodities.
Table 7: Syria’s Major Import Partners of Basic Foods (2004) Maize Dry Milk Vegetable Oil Sugar Refined Wheat Country Country Country Country Country t Country t Country t First USA 724831 Belgium 61 Turkey 263 Brazil 218314 Russia 19293 Second Argentina 127433 France 21 France 50472 Ukraine 13929 Third Ukraine 2627 Belgium 9100 Bulgaria 10424 Fourth Spain 4000 Fifth Guatemala 3600 Source: FAO Stat

34
4.4. Jordan
4.4.1. General Economic Conditions
Jordan’s per capita income in 2005 was $2,086 in year 2000 USD, corresponding to a percentile
rank of 54.7. Domestically accumulated investment in the 2001-2005 period was less than 15%
of GDP and 4.5 percentage points below the income-predicted trend line. Another 7% of
investment activity comes from foreign aid, thus making Jordan highly vulnerable to the whims
of international donors. Jordan’s per capita income growth rate between 2001 and 2005 was with
3.7% impressively high and also translates into relatively low unemployment, which currently
stands at around 13%. A major source of Jordan’s recent growth has been demand side driven,
most notably by the 2001 Jordan–US Free Trade Agreement and substantial US foreign aid to
Jordan. Positively, the export share of manufacturing (% of GDP) has increased noticeably from
an average of roughly 14% in the 1996-2000 period to more than 21% in the 2001-2005 period.
Jordan has also experienced rapid urbanization since the 1960s with the rural population share
having decreased from 47% to 18%. The population growth rate is with 2.5% higher than
predicted by its income.
4.4.2. The State of Food Security
Jordan’s undernourishment percentage is 6.5% and also far below the income predicted value of
17.5%. Jordan is one of the world’s most water scarce countries. According to FAO statistics,
renewable water resources per capita in 2005 were only 157 m3 while the world average was

35
above 8,000 m3. Gardner-Outlaw and Engleman (1997, p. 16 f.) estimate that by 2050 water
availability per capita will go down to between 119 m3 and 90 m3.
Canada’s Agriculture and Agri-Food Ministry (2007) complains lack of market oversight with
potentially adverse effects on food security as farmers sell in local markets products whose
pesticide content exceeds regulatory limits. Another threat to food security is the supply of low-
quality water for irrigation that contaminates crops. Jordan’s 2002-2010 National Strategy for
Agricultural Development lists other areas of problems, which relate to animal health, animal
care, and animal living conditions and which to resolve would require better monitoring and law
enforcement mechanisms.
Iraqi refugees have become a major problem in Jordan, too. With a population of only 5.5
million, Jordan hosts between 500,000 and 750,000 refugees. The problems caused by the influx
of Iraqi refugees are in nature identical to those of Syria. Their quantitative dimensions,
however, may be more severe simply due to the high number of refugees relative to the total
population, which is much greater in Jordan’s case.
4.4.3. Market and Trade Overview
Jordan’s agricultural sector is small. In 2005, it contributed only 2.8% to GDP and employed
around 3.5% of the labor force. Soil quality is generally poor and requires considerable care in
terms of nutritional inputs, thus making agricultural production highly capital intensive. It is
estimated that in order to make Jordan’s agriculture self-sustainable, investments in improved
production technology and marketing infrastructure of around $65 million would be necessary.

36
From an economic perspective, this seems to be a highly questionable investment as Jordan does
not have a comparative cost advantage in agricultural production. Between 1990 and 2003,
Jordan’s wheat production to consumption ratio had been regularly below 20%, sometimes even
falling below 5%. The country’s food trade deficit as a percentage of GDP in 2005 stood at 6%
of GDP. Jordan’s government nevertheless seems to envision a drastic improvement of
agricultural self-sufficiency according to Canada’s Agriculture and Agri-Food Ministry (2007).
Following the consumption pattern change associated with economic modernization and
urbanization towards a diet richer in protein, Jordan gives particular attention to live stock
development in its 2002-2010 National Strategy for Agricultural Development. Currently, Jordan
complains self sufficiency of only 30% for red meat, 53% for milk and dairy products, and 7.7
percent for fish. Jordan’s major import partners of basic foods are listed in below Table 8.
Table 8: Jordan’s Major Import Partners of Basic Foods (2004)
Cereals Maize Dry Milk Vegetable Oil Country T Country t Country t Country T First USA 8 USA 319161 New Zealand 5171 UAE 180 Second Argentina 81738 Belgium 3440 Burkina Faso 37 Third India 17299 Netherlands 2153 Germany 35 Fourth Brazil 8685 Australia 1710 USA 8 Fifth Egypt 255 Poland 1302 Netherlands, KSA, UK 2
Sugar Refined Wheat Country t Country t First KSA 88423 KSA 88423 Second Thailand 56863 Thailand 56863 Third UAE 32723 UAE 32723 Fourth Brazil 25155 Brazil 25155 Fifth Belgium 5500 Belgium 5500 Source: FAO Stat

37
The FAO 2005-2006 Statistical Yearbook lists as Jordan’s major import products wheat, palm
oil, and barley. Its major import trade partners are the US, Indonesia, and Syria. Jordan’s major
exports are hydrogenated oils (margarine), tomatoes and cigarettes.
4.5. Iran
4.5.1. General Economic Conditions
Iran’s per capita income in 2005 was $1,943 in year 2000 USD, which puts the country at the 51
percentile rank. Iran has regularly high domestic savings rates in the range between 30% and
35%. For most of the 1980s Iran’s growth rate relative to its high investment activity was below
the trend line. Whereas suboptimal growth during the 1980s can be attributed to the war with
Iraq, below trend-line growth in 1990s had more internal reasons. For the 2001-2005
observation, though, growth accelerated beyond the predicted value. This is most likely the result
of the increase of the value added of natural resource exports to GDP, which increased by more
than three percent from the 1996-2000 to 2001-2005 observation (own calculations). Most of
Iran’s current growth is based on rent income rather than capital accumulation. Unemployment
rates are estimated between 11% and 15%. Iran’s high investment activity is also favored by a
relatively low population growth rate. Moreover, Iran has witnessed fast urbanization. Its rural
population shrank from 60% in the early sixties to 34% in the 2000s. Iran’s rural population
share is 17% lower than its income would predict. Population growth is at 1.4% low.

38
4.5.2. The State of Food Security
For the 2001-2005 observation, the percentage of undernourishment is 4%. This is thirteen
percentage points lower than its per capita income predicted value. This generally favorable
picture is also confirmed by an official study by Deghan of Iran’s Ministry of Jihad-e and
Agriculture, which nevertheless finds that due to insufficient distribution channels pockets of
malnourishment within the Iranian society still exist. The study also notes that crops account for
the lion share of energy and proteins, causing some deficiencies in the supply of certain
nutrients, such as calcium and iron.
Iran is a geographically vulnerable market. In the past it has been badly hit by droughts, which
some experts claim to follow a seven year cycle. A particularly severe drought occurred in
1999/2000, during which 2.8 million tones of wheat were destroyed, 800,000 animals killed, and
70% of rural water supplies affecting 37 million Iranians disrupted (BBC News, August 3,
2000). According to the United States Department of Agriculture Commodity Intelligence
Report (2008), this year has been another drought season. Despite favorable early season
conditions, above-normal temperatures and below-average rainfall struck between March and
April at a moment that is particularly important for the yield formation prospects. Wheat
production is now expected to be 20% less than in 2007. Most of Iran’s wheat production occurs
in the northwest and is mostly non-irrigated. In the absence of droughts, Iran is generally able to
meet its demand for wheat. In 2004, Iran’s wheat production to consumption ratio was 114%.

39
4.5.3. Market and Trade Overview
In 2005, agriculture accounted for 10.4% of GDP and employed 24.9 of the labor force. Over the
last years, Iran has made substantial progress in improving its agricultural productivity, having
turned from a wheat net importer to a net exporter. Wheat is grown on roughly half of Iran’s
irrigated land. Available figures indicate that Iran’s overall food trade balance has almost closed
down in recent years. Its food trade deficit for the 2001-2005 period was less than one percent of
GDP. Ninety percent of Iran’s population is fed by domestic production. According to Canada’s
Agriculture and Agri-food Ministry (2007), the biggest challenge on the supply side during this
period was storage capacity. The storage capacity shortage was estimated at three million tons
and named a major source of waste.
Table 9: Iran’s Major Import Partners of Basic Foods (2004)
Maize Dry Milk Vegetable Oil Country t Country t Country t First UAE 487027 Germany 3929 Italy 140 Second Brazil 470801 UAE 1262 Kuwait 76 Third Lebanon 290525 New Zealand 1134 UK 18 Fourth Germany 247501 Belgium 1090 UAE 13 Fifth Netherlands 117259 Bahrain 900 Switzerland 10
Rice Sugar refined Wheat Country t Country t Country t First Pakistan 66 UAE 66322 Russia 84878 Second South Africa 2280 Canada 69288 Third Turkey 337 Uzbekistan 61457 Fourth Belgium 16 UAE 5182 Fifth India 5 Austria 1491 Source: FAO Stat
According to the FAO 2005-2006 Statistical Yearbook, Iran’s major import products are soybean
(oil and cake) and maize. The United Arab Emirates, Brazil, and Switzerland were its major

40
import partners. Its major agri-food exports are pistachios, raisins, and spices. Above Table 9
summarizes Iran’s basic food imports.
4.6. Iraq
4.6.1. General Economic Conditions
Lack of reliable data makes the assessment of the general economic conditions of Iraq difficult.
There is even no accurate data on Iraq’s per capita income, much less on other basic
macroeconomic indicators. There is no doubt, though, that Iraq has witnessed a dramatic decline
of living standard since the 1980s as a result of the Iran-Iraq war (1980-1988), the first Gulf war
(1991), and the US led invasion in Iraq in 2003. Author’s calculations and estimates of available
and scattered data suggest that Iraq’s per capita income in 1980 in year 2000 prices was roughly
$8,000. By the end of the war in 1988, which cost Iraq about $450 billion and the lives of
800,000, it dropped to around $750. After the first Gulf war, the UN classified Iraq as a pre-
industrial state and estimated the contraction of economic activity at two thirds, thus leaving Iraq
with an approximate per capita income of $250 in 1991. According to the World Bank, it
recovered to around $600 in 2002, the year before the US led invasion. For the year of the
invasion, some studies conclude that Iraq’s economy contracted by one third, corresponding to a
per capita income of $400 in 2003. Since 2004, Iraq’s economy is officially growing again and
per capita income in 2005 is estimated at around $500 (in year 2000 USD). Official estimates in
purchasing power parity terms are much higher and reach $3,400, similar to Indonesia, which,
however, may convey an overly optimistic picture of the situation in Iraq.

41
There is no data on investment activity but the situation on the ground suggests that the
reconstruction of Iraq is mainly driven by foreign aid and oil revenues. Most of the official
redevelopment focus of Iraq is directed on its cash cow oil. But there are signs of life in the
shadow of oil, too. The Economist, in its June 12th edition, reported cautiously that “Iraq starts to
fix itself.” The article stresses favorably the success of greater troop deployments, increase of
oil-revenues, and rising governmental self-confidence in addressing sectarian violence. Private
business investment must essentially start from scratch but takes place increasingly. USAID
established in Iraq a business registry and reported more than 32,500 entries by December 2006.
Iraq, nevertheless, has still a long way to go. Reports on unemployment rates range between 25%
and 40% (Brookings Iraq Index).
4.6.2. The State of Food Security
In 2004, the WFP conducted the first major study on food security in Iraq, followed up by a
second one in 2005. A peculiarity of Iraq is its substantial reliance on the Public Distribution
System (PDS). The PDS was established as part of the oil-for-food program in 1995. It is
supposed to guarantee every citizen a certain amount of basic food commodities. The basket of
goods had a value of $15 in 2005. The WFP estimates that in Iraq roughly 4 million people, or
15.4% of the population, are food insecure. Should the PDS be discontinued, an additional 12.3
million Iraqis, or 47% of the total population, would become food insecure. Some studies find
that the average daily calorie supply has dropped to 2,000 kcal only. Newborn, children, and
elderly are again hit the hardest, especially in rural areas. Sixty-nine percent of the food-insecure
live in rural areas, where in turn one third of the Iraqi population lives. Thirty-three percent of
the children of food-insecure households show signs of malnutrition.

42
The PDS is problematic for various reasons. In practice, it has become a quite accurate census of
Iraq’s demographic profile. In the 2005 election, voters were registered based on PDS
information. Prior to the 2003 war, the PDS was Iraq’s most efficient institution. According to a
2007 study by Refugee International, a Washington based NGO, the PDS, however, has lost its
efficiency due to a number of reasons. Insecurity is the first with reports of, for example, PDS
trucks being hijacked by criminal gangs. Because of insufficient infrastructure and interruptions
to the free movement of goods, PDS deliveries often reach their destination, if at all, only with
substantial delays. If they arrive, their freight is often incomplete. A second problem is
administrative inefficiency. PDS rations are only distributed where people are registered. Yet,
with more than 2.4 million Iraqi’s internally displaced, many of them have no access to the PDS.
Figure 13: Internally Displaced in Iraq
Source: United Nations Office for the Coordination of Humanitarian Affairs

43
According to Refugee International (2007), the situation is particularly problematic in the
predominantly Kurdish provinces in the north, which have become a safe haven for many
refugees from various sects. Because PDS registration equals voter registration, Kurdish
authorities are reluctant to issue PDS cards to refugees. Refugees International estimates that
virtually none of the approximately 150,000 refugees in the Kurdish provinces has access to the
PDS. A third problem is corruption in the distribution process.
4.6.3. Market Overview
The US Department of State’s “The Future of Iraq Project - Water, Agriculture, and
Environment Group” (2005), describes Iraq as a country that has always been dominated by
agricultural activity. Although agriculture currently contributes only 6% to GDP, it employs over
25% of the labor force. Iraq’s major crops are wheat and barley, which is planted on more than
60% of arable land. The areas most favorable to agricultural production are located in the less
arid north east and the valleys of the Euphrates and Tigris rivers. Agricultural productivity has
been constantly declining over the 1990s. Cereal yield today is estimated at around 800-1,000
kg/ha. In neighboring Iran, cereal yield is with roughly 2,300 kg more than twice as high.
There are numerous reasons for the decline of agricultural productivity beyond those that are
obviously linked to Iraq’s security situation. First, the physical capital stock of Iraq’s agriculture
is mostly of outdated local or Eastern European production, for which spare parts are difficult to
get by. Iraq’s agricultural sector is moreover short of simple equipment such as drills and
sprayers, which prevents the efficient use of fertilizers and pesticides. In fact, insufficient
fertilizer use is among the most serious causes for low productivity, although Iraq is richly

44
endowed with natural resources to develop a fertilizer industry to meet its demand. At the current
stage, conservation tillage is thus barely possible. Second, there is a lack of human capital. Most
human capital in use was accumulated before the 1980s and agricultural scientists had little
contact to international scientific networks. Third, and closely related to the lack of capital, is a
high vulnerability to weeds, diseases, and insects.
4.7. Yemen
4.7.1. General Economic Conditions
Yemen’s 2005 per capita income was $530 in year 2000 USD, which places it at the 25th
percentile rank. Its investment share during the 2001-2005 period averaged 21% and is more
than twice the income-predicted value. Its growth performance relative to its investment activity
is dismal. Between 2001 and 2005, per capita incomes essentially remained unchanged. From a
growth theoretical perspective, Yemen’s extremely high population growth rate of more than
three percent is a substantial factor behind stagnating per capita incomes. Given the fact that
Yemen’s average fertility rate between 2001 and 2005 period was six, its investment rate is not
only considerable relative to per capita income, but also relative to population growth. Yemen is
furthermore a highly rural society with a rural population share of 72%.
Yemen is confronted with a host of challenges. Domestically it is has been regularly challenged
by political instability. Reunified in 1990, domestic problems relate to the conflict between the
pro Western government and the rising influence of al-Islah, an Islamist political party. The wide
use of the recreational drug Qat comes at a high social cost. This social cost is less in terms of

45
adverse socioeconomic consequences such as drug-related crime, reduced individual
productivity, or rising divorce numbers. Rather it is the high opportunity cost of foregone
production of other goods which are environmentally more sustainable and add more value to
agricultural production. The use of Qat is an indicator of a high (present) time preference rate,
which is far too high to stimulate individual investment and foregone consumption, which are
necessary for the accumulation of capital and the initiation of economic development.
Governmental oil revenues are the major source of investment activity.
Geopolitically, Yemen is not embedded in an environment that is favorable to economic
development and investment into a regional division of labor either. Across the Bab-el Mandeb
strait, a possibly vital hub for regional trade, the three countries Sudan, Somalia, and Ethiopia
rank first, third, and eighteenth of Foreign Policy’s 2007 Failed State Index. Historical border
disputes with Saudi Arabia have just been settled in 2000. Disputes with Saudi Arabia escalated
in 1991 when Saudi Arabia expelled 800,000 Yemenites and stopped its financial aid as a
retaliation measure against Yemen’s decision not to support the first Gulf war against Iraq. The
subsequent economic shock split the government about the political course of the country that
eventually led to eight weeks of civil war in 1994.
A byproduct of the conflicts at the horn of Africa, especially in Somalia and Ethiopia, is a
constant influx of refugees into Yemen. The flight into Yemen is dangerous and many refugees
who flee by boat do not survive the journey. Many refugees see Yemen only as a passage to the
Gulf States, but most remain stranded. Somalis are granted automatically refugee status while
Ethiopians need to register with the UNHCR. The exact number of refugees in Yemen is

46
unknown and subject to wild guesses ranging from 200,000-250,000 according to the UNHCR to
more than one million according to Yemen’s government. The WFP targets more than 33,000
Somali refugees in Yemen.
The various political, socioeconomic and geopolitical factors have made Yemen one of the
poorest countries in the world, putting poverty reduction on top of its development agenda. For
this, diversifying the economy will be necessary. Currently, more than one third of GDP stems
from exports of natural resources. Unfortunately, though, oil industries are often geographically
insulated and have very little forward and backward linkages to other sectors of the economy.
They are moreover poor job creators. Transforming oil revenues into sustainable development
and socio-economic modernization will have to assume priority. This is even more so when
taking into account the demographic pressures in Yemen, where almost half of the population
has not yet reached the age of 15.
4.7.2. Food Security
More than one third of Yemen’s population is undernourished. For the 2001-2005 period, the
number was 37.5%. Relative to per capita income, this is roughly ten percentage points above the
trend line. Food security is particularly challenged by low levels of water resources. Yemen’s
average available water per capita supply is 198 m3 while individual water withdrawal is already
368 m3. By 2025, available water supply will be only 105 m3. Agriculture uses 93% of water
resources, whereas the growth of Qat alone accounts for 40% of it. If Qat cultivation continues at
its current rate, the Sana’a water basin will be depleted by 2015 with dependent agricultural
activity, family incomes, and jobs being destroyed for good. Yemen’s food trade deficit with the

47
rest of the world for the period between 2001 and 2005 was 6.6% of GDP. Financing this deficit
consumes roughly 50% of Yemen’s oil revenues. In 2003, Yemen produced less than 5% of the
wheat it consumed.
A June 2008 WFP study, published in August 2008, conducted a comprehensive food security
analysis of Yemen. The malnutrition indicators and undernourishment are with a total prevalence
rate of 44%, 10%, and 37%, respectively fall into the high concern categories according to WHO
standards. The study moreover finds that 43% are food insecure. Eighteen percent are severely
food-insecure.
4.7.3. Market Overview
The share of agriculture to GDP in 2005 stood at 14% of GDP. Employment in agriculture is
estimated at 54% for 1999 (2007 WDI). Agricultural markets face enormous challenges in the
near future. One is desertification, which eats up continuously scarce arable land. According to
the Yemeni Ministry of Agriculture and Irrigation, 95% of Yemen’s arable land is threatened by
desertification. Another problem is again Qat. In addition to crowding out alternative crops and
draining the country’s water supply, it has become a major source for rising prices of other basic
food commodities. In Yemen, there is a strong political support for investing into domestic
agriculture and to seek protection from international markets, which may be a questionable
strategy.
According to FAO’s 2005-2006 Statistical Yearbook, Yemen’s major import categories are
wheat, chicken meat, and cow milk powder. Its major import partners are Brazil, UAE, and
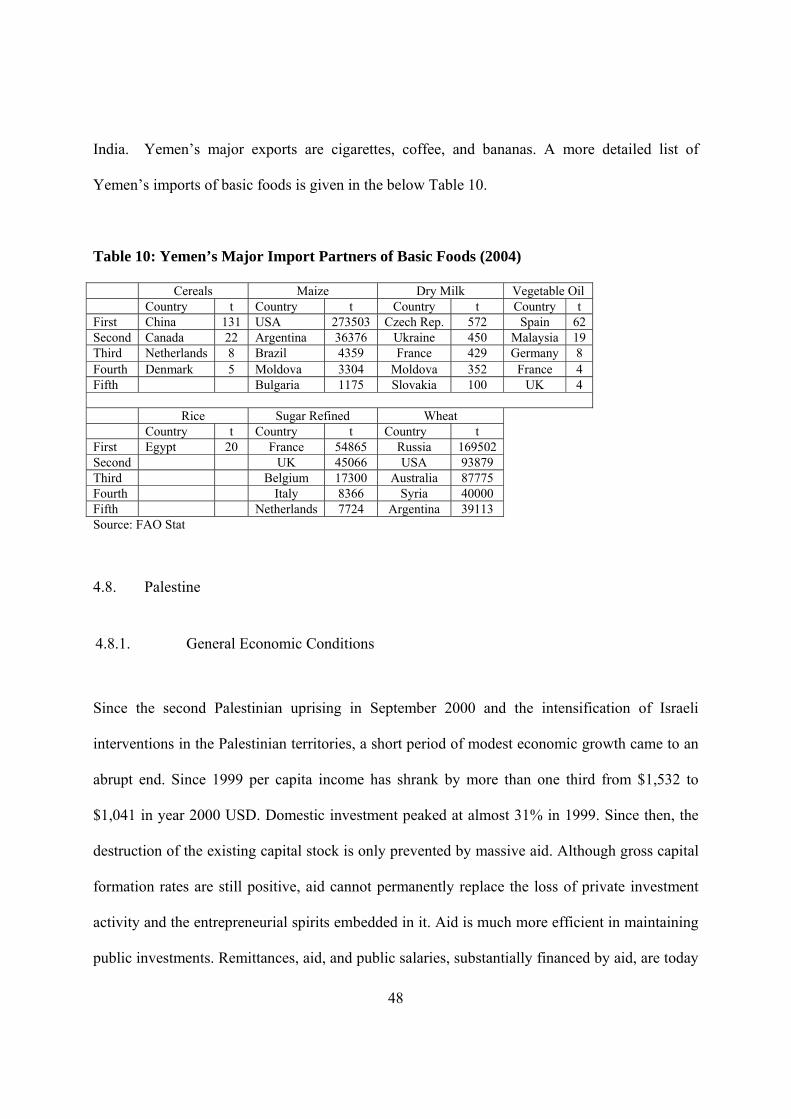
48
India. Yemen’s major exports are cigarettes, coffee, and bananas. A more detailed list of
Yemen’s imports of basic foods is given in the below Table 10.
Table 10: Yemen’s Major Import Partners of Basic Foods (2004) Cereals Maize Dry Milk Vegetable Oil Country t Country t Country t Country t First China 131 USA 273503 Czech Rep. 572 Spain 62 Second Canada 22 Argentina 36376 Ukraine 450 Malaysia 19 Third Netherlands 8 Brazil 4359 France 429 Germany 8 Fourth Denmark 5 Moldova 3304 Moldova 352 France 4 Fifth Bulgaria 1175 Slovakia 100 UK 4
Rice Sugar Refined Wheat Country t Country t Country t First Egypt 20 France 54865 Russia 169502 Second UK 45066 USA 93879 Third Belgium 17300 Australia 87775 Fourth Italy 8366 Syria 40000 Fifth Netherlands 7724 Argentina 39113 Source: FAO Stat
4.8. Palestine
4.8.1. General Economic Conditions
Since the second Palestinian uprising in September 2000 and the intensification of Israeli
interventions in the Palestinian territories, a short period of modest economic growth came to an
abrupt end. Since 1999 per capita income has shrank by more than one third from $1,532 to
$1,041 in year 2000 USD. Domestic investment peaked at almost 31% in 1999. Since then, the
destruction of the existing capital stock is only prevented by massive aid. Although gross capital
formation rates are still positive, aid cannot permanently replace the loss of private investment
activity and the entrepreneurial spirits embedded in it. Aid is much more efficient in maintaining
public investments. Remittances, aid, and public salaries, substantially financed by aid, are today

49
the major source of income and demand. Although demand is still surprisingly strong, the signs
of a crumbling economy intensify. Unemployment has increased from ten percent in 1999 to
29% in Gaza and 19% in the West Bank. The June 2007 take-over by Hamas and Israel’s
response with more closures and controls over the in- and outflow of goods has transformed
Gaza into an essentially autarkic economy, with the only booming activity being smuggling. It is
estimated by the World Bank that since 1999 95% of industrial activity has been choked off.
Demographically, the rural population share is with 28.4% low while population growth is with
3.3% high.
4.8.2. Food Security
The economic downslide has severe consequences on food security for both Gaza and the West
Bank, whereas the situation in Gaza is more desperate. Estimates for 2004 suggest an
undernourishment percentage of 16% for all occupied Palestinian territories. This corresponds to
a four percentage point increase since 1999. Recent developments have made the situation even
worse. According to a July 2008 WFP study, food insecurity in Palestine has captured on
average 38% of the population with strong differences between Gaza and the West bank, where
the numbers stand at 56% and 25%, respectively.
Gaza has to deal with unique food security problems, which are the result of closures and the
slow collapse of domestic infrastructure. Closures do not only prevent access to needed food
imports, they also affect medication and fuel supplies. Certain people depend on medication for
proper food utilization. Frequent power cuts and water scarcity add hygienic problems to proper
food utilization. Even worse, lack of fuel prevents the correct operation of sewage treatment that

50
is necessary to prevent hazardous waste from contaminating ecological resources. Between
January and May 2008, the lack of fuel has led Gaza to discharge 60 million liters of partially
and non-treated sewage into the Mediterranean. These toxics are likely to re-enter the food chain
with yet unknown consequences for public health.
4.8.3. Market Overview
Technically, speaking of an agricultural market overview in Palestine is a false labeling as both
Gaza and the West Bank lack the basic fundamentals for market interaction, most notably secure
property rights and the free movement of goods. The Gaza strip and the West Bank have very
different characteristics. One of the most obvious is population density. Population density in the
Gaza Strip, which is among the highest in the world, is estimated at around 4,118 per km2.
Agriculture’s value added to GDP in Palestine is estimated at around 8%. Due to the various
exogenous shocks, which the Palestinian economy is exposed to, the absolute output of the
agricultural sector shows a dramatic downward trend. Estimates suggest that 12%-18% of the
Palestinian labor force is employed in agriculture. As opposed to modern and free markets, the
structure of Palestine’s agriculture is closer to a medieval feudal system, where Palestinians are
in effect tenants. Regular Israeli incursions have led to the razing of fields and trees that lead to
the displacement of people and the desertification of land. Closures prevent the import of
essential agricultural equipment such as fertilizers and spare parts necessary to maintain
agriculture’s capital stock. Moreover, closures prevent agricultural products meant for exports
from leaving the economy and often cause them to perish on the spot. Some figures suggest that
the annual value added of agriculture could be $200-$300 million higher in the absence of Israeli
disruptions. The total damage to Palestine’s agricultural sector since 2000 is estimated at more

51
than $1.5 billion. Agriculture’s contribution to GDP is around 8% and it employs roughly 12%
of the labor force.
The West Bank is much less densely populated. It is estimated that on average 446 people share
on square kilometer. The West Bank faces similar problems like Gaza, although the nature of the
problem relates less to closures rather than the restriction of the internal free movement of goods
and people as a result of checkpoints. Illegal settlements are often associated with the redirection
of transportation routes and additional checkpoints, which strangulates any economic activity on
the ground and undermines directly the economy’s ability to develop economies of scale.
4.9. Summary
The above discussion has revealed that although the seven ODC countries show more differences
than similarities, there are nevertheless some common themes, too. Obviously, it is important to
distinguish between low systemic food-insecure countries and high or chronically food insecure
ones. Lebanon, Syria, Jordan, and Iran fall into the first category. Iraq, Yemen, and Palestine fall
into the second. The difference between low and high food insecure countries is relevant for
contingency planning. Countries with low food-insecurity can be expected to play a much greater
role in establishing food security for the most vulnerable than high food-insecurity countries. The
following Table 11 summarizes some key observations for the seven ME-ODC countries. Some
of the listed particular challenges are clearly specific to individual countries, for example the
problem of unexploded ordnances in South Lebanon, while others are of a more universal nature,
such as insufficient market monitoring and governmental interference.

52
Table 11: Agriculture and Food Security among ME-ODC Countries – Stylized Facts LBN SYR JOR IRN IRQ YEM PAL
GDP per capita 5672 1175 2086 1943 500 530 1041 Investment 19% 21% 15% 30% NA 21% NA
Unemployment 20% 20% 13% 15% 25%-40% 34% 29% (Gaza) 19% (West
Bank) Growth 2%-3% 1.40% 3.70% 4% NA 0% -5% Urbanization 86% 50% 82% 66% 68% 26% 72%
Gen
eral
Eco
nom
ic
Con
ditio
ns
Population Growth 1% 2.50% 2.50% 1.40% 3% 3% 3.30%
Agriculture/ GDP 6% 23% 2.80% 10% 6% 14% 8%
Agriculture Employment 8% 30% 3.50% 24.90% 25% 54% 12%-18%
Agr
icul
ture
Challenges
No policy priority, currency
overvaluation, credit access,
UXOs
Droughts, gov’t interference
Gov’t monitoring,
pesticide overuse, animal
health, water scarcity
Droughts, storage capacity
Capital stock, human capital
Droughts, Qat, water scarcity
Israeli closures, incursions,
razing of farm land
Under-nourishment 3% 4% 6.50% 4% 15% 38% 16%
Food Trade Deficit 5.60% 0.80% 5.90% 1% NA 6.60% NA
Wheat production consumption ratio
15%-30% 90%-180% 2%-11% 70%-120% NA 5%-10% 3%-14%
Food
Sec
urity
Challenges Civil strife, armed conflict Refugees Refugees Reaching
vulnerable Civil strife, PDS Qat, refugees
Interruption of movement of goods due to
closures Source: Author’s illustration.

53
A striking common theme is the problem of refugees, either in combination with the situation in
Iraq, the Horn of Africa, or the Arab-Israeli conflict. All countries are confronted with a
substantial sub-population, about which information is generally scarce. When looking at these
refugee sub-populations, the focus is generally on the refugees. It is important, though, not to
lose sight of the problem and hardship that refugees create for regular citizens, too. If refugees
are a source of rising prices, then in the shadow of the refugee problem also regular citizens will
suffer. This aspect seems to be under-researched.
A final common aspect is the political attitude towards agricultural development. All countries of
this study seem to envision some kind of food self-sufficiency in the long run. Geographic and
demographic constraints, however, suggest that this is a highly risky undertaking as it may
redirect scarce resources into a dead end. Rather than working on food self-sufficiency goals,
countries may have to accept permanent food trade deficits as a reality that they can barely
escape. ODC countries should ask themselves, which sectors of the economy they need to
cultivate in order to finance food imports. Ultimately, only successful economic development
will safeguard food insecurity.

54
5. Food Crisis, Market Dynamics, and Policy Options
5.1. Introduction
Lebanon, Jordan, Syria and Iran are low systemic food-insecure countries wile Iraq, Yemen, and
Palestine are high or chronic food-insecure countries. Although both types of countries are in
need of external support, the nature of support should be different. Support to low systemic food
insecurity countries can be limited to institutional reforms strengthening allocation and
distribution efficiencies of the market place. Institutional support to high-food-insecurity
countries is even more important, but also needs to be complemented by direct aid in order to
avoid major humanitarian crises. In order to identify appropriate strategies for contingency
planning, information is crucial about the nature of the various local markets, crisis response
strategies of the economic actors, and available policy options.
5.2. How Efficient are Markets?
The efficiency of food markets depends on many parameters. Supply may be affected by
disasters, natural resources, and climate. Similarly, demand is affected by socioeconomic factors
like income inequality, unemployment, and poverty. The interaction between demand and supply
depends heavily on governmental interventions, such as price controls and trade policies. Given
the host of factors that may influence the efficiency of food markets, there are no readily
available food market efficiency indicators. However, it may be approached indirectly, the basic
idea being that food market efficiency should drive down the food expenditure share, for which
estimates are available from the Economic Research Service of the United States Department of

55
Agriculture. Unfortunately, the USDA data are snapshots from 1996. They can be assumed
though, to be relatively constant over time.
In order to get an idea of food market efficiency, again use is made of a residual analysis. The
following equation is estimated.
Food Expenditure Sharei = β0 + β1 Incomei + β2 Cereal Yieldi
+ β3 Water per Capitai + β4 Food Trade Balancei + ei
This equation estimates the food expenditure share as a function of the general level of economic
development as well as control factors for the strength of agricultural sector. Positive residuals
can then be taken as indicators for distributional problems, such as the lack of competition on the
retail sector because of market entry barriers due to market power or poor infrastructure.
Similarly, negative residuals hint at greater food market efficiency. The predicted, real, and
residual values associated with the regression are summarized in the following Table 11. The
complete regression results are given in Appendix Item 3.
Appendix Item 3 about Here [Determinants of Food Expenditure Shares]
Table 12: Relative Food Share Expenditures as an Indicator for Market Efficiency
LBN SYR JOR IRN IRQ YEM PAL Food Budget Share 39.3 47.9 37.7 32.5 NA 61.1 58
Predicted 31.2 42.6 42.1 40.0 NA 56.3 NA Residual 8.1 5.3 -4.4 -7.5 NA 4.8 NA
Source: Author’s calculations.
56
The results show that, after controlling for supply side or allocation characteristics, Lebanon,
Syria, and Yemen have food shares that are higher than predicted, suggesting that distribution
inefficiencies make the availability of food more expensive, thus driving up the food price
shares. Jordan and Iran have food expenditure shares below predicted values, which may be
taken, at first sight, as a positive signal. The causes for positive and negative residuals, of course,
still need to be explored in more depth. For contingency planning, however, it is sufficient to
notice at the moment that households in countries with positive residuals will have much less
resources available to accommodate a food price shock.
5.3. How do Suppliers React to Rising Food Prices?
5.3.1. Supply Adjustment in Theory
A normal microeconomic reaction to rising prices is that producers make abnormal profits in the
short run that attract market entry in the long run. This market entry will then drive down again
prices. Many countries will respond to abnormal profits with the development of new arable land
and investment in agricultural capital. Technological progress leading to more productive crops
will also be stimulated. The nature of the current food price crisis is therefore also part of the
long run solution. However, until those long-run adjustment mechanisms set in, other, less
optimistic, adjustment mechanisms can also be observed. These mechanisms relate to the abusive
exploitation of the food price crisis. Two of them are of an economic nature, smuggling and
hoarding, and one is of a political one, welfare programs sponsored by special interest groups.

57
5.3.2. Smuggling
There are abundant reports of smuggling of agricultural products from low income to higher
income countries and from food subsidizing economies to more liberalized ones. Flour
smuggling, for example, is reported from Syria to Lebanon, Egypt to Gaza, and Yemen to Saudi
Arabia. In Lebanon, the Shebaa farm donkeys are literally famous for their orientation skills in
the mountainous area between Lebanon and Syria. Other articles write about tunnels being built
for smuggling purposes, especially between Gaza and Egypt and Syria and Lebanon. Of course,
one could argue by referring to free trade theory that smuggling is welfare enhancing as the
winners of free trade, i.e. the smugglers, win more than what the losers lose. However, the
problem with this rational is that the losers from smuggling, i.e. the consumers in the relatively
poorer countries, cannot be analyzed within the standard tool kit of microeconomic welfare
analysis. The rise in poverty and food insecurity goes far beyond the standard analysis of
consumer and producer surplus and stretches deep into the realm of market failure and social
costs. Smuggling puts individual people’s life and social stability at stake.
Another dimension of smuggling is trade with expired products. Yemen seems to be particularly
hit by this practice. Alone in 2008, Yemen destroyed at least 42 tons of expired food. Yemen
may just be the tip of the iceberg, though. One should therefore take realistically into account
that there is a great possibility for trade with expired products to remain undetected in many
other places with severe consequences for public health.

58
5.3.3. Hoarding
As prices go up, retailers have an incentive to limit the supply even more. Many local
newspapers report that retailers tend to buy larger amounts of agricultural products than what
they put on their shelves in order to increase their profits. This practice is favored by the fact that
many retailers in developing countries have a strong bargaining position vis-à-vis farmers, which
are often smallholders. In addition, consumers are poorly organized, too. The retail sector, on the
other hand, is equipped with much greater market power, which it can abuse at the expense of
consumers. As demand for food is universally inelastic, a 1% increase in price reduces demand
for food products by less than 1%, which is why retailers increase their revenues with every
percentage increase in price. The percentage increase in total revenue following a percentage
increase in price can be approximated by the following formula:
Percentage Increase in Revenue= (1+Percentage Price Increase) (1 - ε) - 1
where ε is the price elasticity of demand. Applying this formula to the countries of this study,
whose price elasticities are very similar, suggests that a 1% price increase increases retail
sectors’ total revenues by around 0.6% (Table 12). Unfortunately, data for Iraq and Yemen was
unavailable. There are concerns that retailers take advantage of their bargaining power
especially during the holy month of Ramadan.

59
Table 13: Marginal Increases of Total Revenues to 1% Increases of Price LBN SYR JOR IRN YEM Food Price Elasticity 0.392 0.392 0.388 0.385 0.332 Percentage increase in Total Revenues to 1% increase in Price 0.604 0.604 0.608 0.611 0.665 Source: Author’s calculations.
5.3.4. Charity based Supply
Humanitarian crises, such as triggered by the current food price inflation, are always heydays for
charities. Hamas, Hezbullah, and the Muslim Brotherhood have a long tradition and experience
in providing social safety nets that most Arab states fail to provide through their public
administration. But it is not only charities competing with the state. In Lebanon, for example,
Saudi-funded Sunni Muslim Charities compete with Hezbullah in protecting their followers from
rising food. Many charities seem to be even thankful for the food price crisis. Especially in
Jordan, where the Islamic Action Front assists 32,000 families with food baskets and financial
aid, the political capitalization is particularly strong. Many observers see the cocktail of food
price inflation, the absence of public social safety nets, and politically motivated charities filling
the void as a substantial threat to political stability of many Arab regimes (Daragahi, 2008).
5.4. How do Consumers react to Rising Food Prices?
5.4.1. Demand Adjustment in Theory
The theoretical analysis of households responding to rising food prices is regularly discussed in
text books of economics. The standard case is that higher prices lead to a negative substitution
and income effect, both of which lead to a reduction of consumption. Obviously, negative

60
substitution and income effects can be more easily accommodated by middle and upper income
classes than by lower income households. It is easier for middle-income households to substitute
dining-out for cooking at home but it is almost impossible for a housewife who needs to bake
bread for her family to substitute flour for anything else. In this latter case, a household will have
to focus all its purchasing power on the most essential commodities and cut down consumption
of everything else, including such items as personal hygiene and preventive medical checkups of
parents and children. In extreme cases, some households will cut consumption of everything else
and allocate all resources on the purchase of basic staples, so that they actually end up buying
more after prices went up. This case is known in the literature as the so-called Giffen case. It also
explains hoarding.
5.4.2. A Snapshot of the Food Price Rises in ODC Countries
Since the beginning of the food price crisis in 2006, local newspaper reports have frequently
given numerical examples of how prices have changed. Obtaining a clear and complete picture,
though, is still difficult as different articles quote different figures and refer to different time
spans, geographical areas, and commodities. Nevertheless, by drawing on local newspaper
articles, the following Table 13 provides a snapshot of recent price increases. The numbers show
without exception high double-digit inflation rates for food commodities in 2008. There is also
clear evidence for food price inflation slowly trickling down to general inflation.

61
Table 14: Snapshot of Food Price and General Inflation as Reported in Local Newspapers
Lebanon Syria Jordan Iran Iraq Yemen Palestine
Basic Commodities (Olive oil, eggs, meat etc.)
20%-30% (over one
year)
60%-100% (over one
year)
10%-30% (over one
year)
45% (over one
year)
13.6 (over one
year)
230% (over past two
years) 55% for WFP
purchases (over one year)
70% -100% since 2006;
21% since 2007; Gaza Strip 5%-
10% higher
Inflation 2008 10%-15% 10-15% 10%-15% 25% 15%
18% overall 23% for food (2008 only)
12.5%
Source: Author’s calculations.
5.4.3. Substitution Effects
There are various substitution effects as a result of rising prices on the demand side. Syrian
papers, for example, report substitution effects of white meat, olive oil and fruits for red meat,
wheat, potatoes and other basic staples. Of course, such substitution effects are not limited to
Syria but reflect universal adjustment strategies. Other newspaper articles suggest that many
vulnerable households become in essence vegetarian and lack crucial micronutrients, especially
protein. If such substitution effects are permanent, the health status of the household members is
put at risk. Particularly vulnerable are pregnant women, newborn, toddlers, and the elderly. Yet,
there are even less obvious substitution effects, such as the substitution of civil security
responsibilities for extra income. A case in point is Jordan, where reports have surfaced that
members of security forces sold weapons and ammunition in order to be able to feed their
families. Again, the food crisis has not only a humanitarian and public health dimension. It also
undermines political stability and security.

62
5.5. Recommended Short and Long Term Policies to Fight Food Price Inflation
5.5.1. What Government Should Do in Theory
Inflation causes social costs, but so does fighting inflation. A problem with inflation is that it
strikes fast but it cannot be fought quickly. Theoretical and historical evidence notwithstanding,
many governments believe that living with inflation, or managing it, would lead to lower social
costs than determined anti-inflationary policies. The textbook theory to contain inflation is
simple: Increase supply or decrease demand. Most of the policies to expand supply focus on
improving the allocation efficiency of markets. Policies to increase agricultural supply may
involve agrarian reforms, the development of financial markets, improvements of market access
infrastructure, and research and development. On the demand side, family planning, fiscal
austerity, and restrictive monetary policy are standard recipes, which, however, often neglect the
political constraints on the ground. Additionally, most of these policies are subject to
considerable time lags. The question thus is: What works in the moment of the crisis? As
opposed to medium-to long term policies, short-term policies are in nature built around the
redistribution of income. They entail safety net programs and taxation policies.
5.5.2. Agrarian Reforms
Land inequality is an important factor for productive efficiency. In order to illustrate this, Figure
14 provides some cross-sectional evidence for the inversely u-shaped relationship between land
inequality and cereal yield.

63
Figure 14: Land Inequality vs. Cereal Yield
5.5
6.5
7.5
8.5
9.5
30.0 45.0 60.0 75.0 90.0LandIneq
LnC
erY
ld
Source: Author’s illustration with data from Frankema, E. (2006), The Colonial Origins of Inequality: Exploring the Causes and Consequences of Land Distribution, Groningen Growth and Development Centre, Research memorandum, July 2006 http://ggdc.eldoc.ub.rug.nl/FILES/root/WorkPap/2006/GD-81/GD81.pd f and 2007 WDI, Author’s illustration.
Simply spoken, land titles should neither be defined too small so that they prevent economies of
scale nor too large so that they become a source of market power and social inequality. In case of
doubt, however, defining smaller land titles may be preferable to larger ones as it is easier for
smallholders to organize themselves in efficient cooperatives to realize economies of scale than
to force monopolists to become more efficient.
According to Figure 14, the optimum land inequality value would be 63.1. The dataset, on which
Figure 14 is based, contains data only for Syria, Jordan, Iran, and Iraq. These countries’ values
all exceed the optimal value of 63.1. The values for Syria, Jordan, Iran, and Iraq are 64.3, 64.3,
67.7, and 82.0, respectively. This suggests that land inequality was particularly a problem in
Iraq. In rebuilding Iraq, the issue of land inequality should therefore be a factor to be considered
as well. The regression results underlying Figure 14 are given in Appendix Item 4.

64
Appendix Item 4 about Here [Cereal Yield vs. Land Inequality]
In addition to land inequality, many developing countries suffer from unclear property rights on
factor land. Common practices are tenancies, which have adverse incentives for investment. A
prerequisite for agricultural efficiency is that the economic incentives associated with land
ownership are maximized. This calls for secure, tradable, mortgageable, and transparent land
titles.
5.5.3. Family Planning
Socioeconomic vulnerabilities are accelerated by fast population growth. High fertility rates
drain families’ income and prevent savings and capital accumulation. Family planning, despite
potential cultural concerns, should be a public policy issue in countries like Yemen, and to a
lesser extent Syria, Jordan, and Palestine. Only Lebanon and Iran have low population growth
rates. There may be even opportunities to combine food aid with awareness creation for the
advantages of family planning. In order to illustrate the power of family planning, the residuals
of the regression of agricultural productivity
Cereal Yieldi = b0+b1 Per Capita Incomei + b2 Water per Capitai + b3 Yeari +εi
were regressed against population growth. The scatter plot of Fig. 15 shows the results, which
lend strong support to the idea that low fertility rates free up resources that can be used to
increase factor land’s productivity.
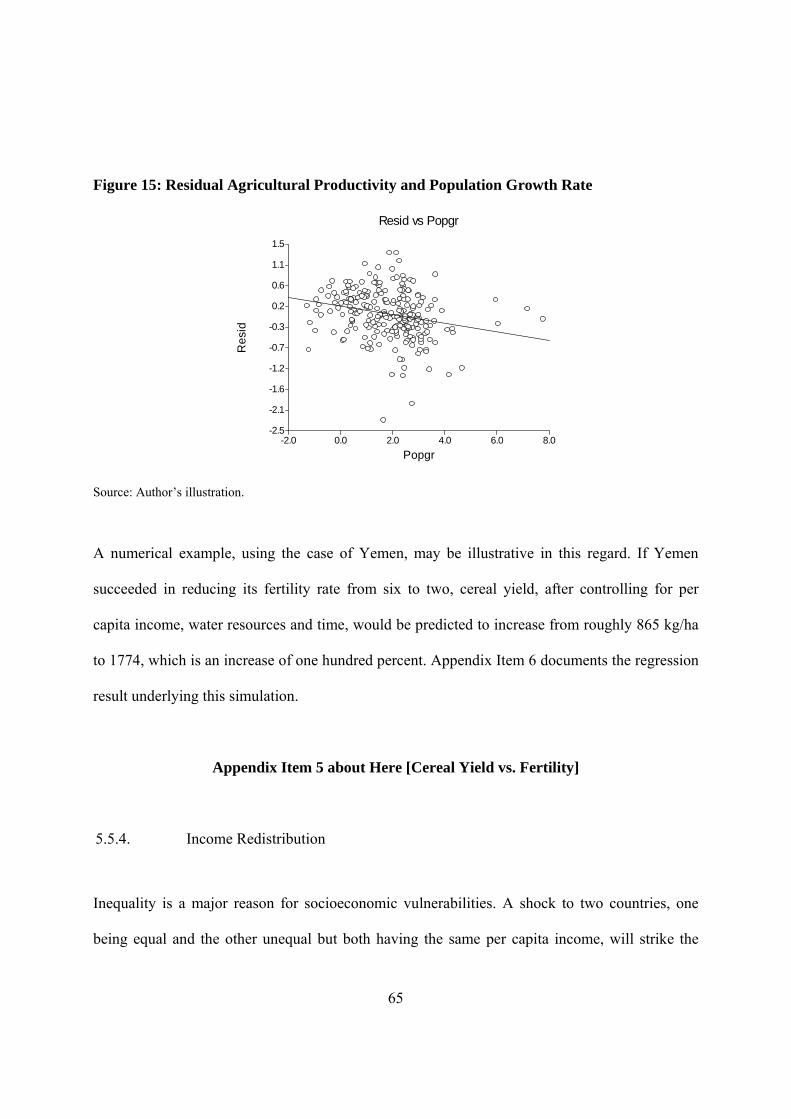
65
Figure 15: Residual Agricultural Productivity and Population Growth Rate
-2.5
-2.1
-1.6
-1.2
-0.7
-0.3
0.2
0.6
1.1
1.5
-2.0 0.0 2.0 4.0 6.0 8.0
Resid vs Popgr
Popgr
Res
id
Source: Author’s illustration.
A numerical example, using the case of Yemen, may be illustrative in this regard. If Yemen
succeeded in reducing its fertility rate from six to two, cereal yield, after controlling for per
capita income, water resources and time, would be predicted to increase from roughly 865 kg/ha
to 1774, which is an increase of one hundred percent. Appendix Item 6 documents the regression
result underlying this simulation.
Appendix Item 5 about Here [Cereal Yield vs. Fertility]
5.5.4. Income Redistribution
Inequality is a major reason for socioeconomic vulnerabilities. A shock to two countries, one
being equal and the other unequal but both having the same per capita income, will strike the

66
more unequal country much more. In order to illustrate this, the following double-log regression
was estimated
Undernourishmenti = b0 + b1 Per Capita Incomei + b2 Cereal Yldi + b3 Water per Capitai
+ b4 Income Inequalityi + b5 Yeari + εi
with the following results:
Table 15: Undernourishment and Income Inequality
DV=Undernourishment (Ln) Coefficient t-Stat P-Value Intercept 16.526 2.348 0.02 Per Capita Income (Ln) -0.432 -11.339 0.00 Cereal Yield (Ln) -0.200 -2.28 0.02 Water per Capita (Ln) 0.043 1.773 0.08 Inequality (Ln) 1.662 4.314 0.00 Year -0.008 -2.124 0.03
Source: Author’s calculations.
The results show that the statistical significance of inequality is very high. A look at the socio-
economic significance, however, is more instructive. Consider again the case of Yemen, which
has an Estimated Household Income Inequality indicator, which reads similar to a Gini-
coefficient, of 42.8. Its level of undernourishment is 37.5. Then, a policy that would, for
example, reduce inequality by 10% to 38.5, would reduce undernourishment by 16.6% to 31.3%.
Assuming a population of 22 million, an income redistributing policy of the just described kind
could provide food security to more than 1.3 million Yemenites.

67
Income redistributing policies, of course, can occur in many ways. It may range from direct
income transfers to people deprived of basic needs to public investments to promote social
upward mobility.
5.5.5. Building Transportation Infrastructure
The very nature of agricultural products, which is that they are perishable products, makes the
agricultural sector dependent on efficient market coordination. The state plays an important role
in this regard, mostly by providing the necessary transportation infrastructure. In section three,
deficits in transportation infrastructure have been identified already for Syria and Jordan.
5.5.6. Building Financial Infrastructure
Similar to transportation infrastructure, financial markets are an important complement to
agricultural market efficiency. In many developing countries, banks are often unwilling or unable
to lend to the agricultural sector. In the case of Lebanon, for example, post civil war
reconstruction has driven out private access to credit. Lebanese banks simply did not have an
incentive to provide loans to the agricultural sector. In other societies, such as Yemen, tribal
traditions are associated with unclear property rights that prevent credit markets from
developing. Another reason is simply state control over the banking sector, which did not
necessarily give priority to agricultural development.

68
5.5.7. Short Term Response Policies
Short term response policies can be social safety nets or market intervention policies. According
to the World Bank (2008), short term safety net programs entail cash transfers, food-for-work
programs, and food aid distributions. Price manipulation policies comprise the reduction or
abolishment of import tariffs and VAT, subsidies, buffer stock depletion, export bans, and price
ceilings.
The various policies can be assessed in light of different efficiency criteria:
• Does the policy reach the targeted group? Is the policy incentive compatible?
• Does the policy have cross-national spill-over effects?
• Is the policy easy to implement?
• Is the policy easy to manage?
Table 15, which is taken from the World Bank, summarizes these policies.

69
Table 16: Short Term Response Policies
Source: Worldbank (2008), Rising Food Prices: Policy options and World Bank Response, Background Note, http://siteresources.worldbank.org/NEWS/Resources/risingfoodprices_backgroundnote_apr08.pdf.
5.6. Response Policies in Practice
The acuteness of the food price crisis has led to a dominance of short term polices. These include
price controls, export restrictions, use of buffer stocks, and tax reductions. The countries make
also use of targeted social assistance programs, such as cash transfers, food stamps, and school
feeding programs.

70
5.6.1. Tax Reductions
Tax reductions of food grains are reported from all ODC countries, except for Yemen. From a
microeconomic perspective, reducing taxes on food grains is an efficient policy in the sense that
it does not interfere with allocation efficiency. It is also easy to implement and to manage.
Neither does it affect other countries. An important question, however, is how long a country can
finance such a policy without sacrificing other essential services of the state. To some extent, it is
a wasteful policy as it also subsidizes higher income households.
5.6.2. Use of Buffer Stocks
These policies are pursued only by Yemen, Syria, and Iraq. Using buffer stocks to stabilize
supply, when used economy wide, is similarly problematic like tax reductions. Food grain stocks
are better used for targeted social assistance, such as a school-feeding programs or assistance to
expecting women. There are also newspaper reports of corruption in association with the use of
buffer stocks. Subsidized flour rations earmarked for bakeries are sold on the black market by
either governmental officials or the bakeries and do not reach consumers.
5.6.3. Export Bans
Export bans are used by Yemen, Syria, and Iraq. Although these are politically comprehensible
measures, they are in essence “beggar-thy-neighbor” policies. The more countries reduce their
exports, the higher will be world prices, which will aggravate the situation of food-import
dependent countries. Food export bans are also harmful to farmers in the export-restricting

71
country as it deprives them of valuable profits that can be used for the modernization of the
agricultural capital stock. Export bans thus work like a tax on the farmers that are used to
subsidize the rest of the society, including the non-vulnerable.
5.6.4. Cash Transfers
All countries except Lebanon make use of governmental cash transfers. However, even in the
case of Lebanon, cash transfers occur by political parties and charities. In the case of Lebanon,
this is particularly problematic as it undermines the already weak of government even more.
Other than that, cash transfers score high in terms of targeting efficiency and incentive
compatibility, unless it would be financed through loose monetary policy. For cash transfers to
be efficient, government must be equipped with fiscal and administrative capacity, which is
generally not the case. The food price crisis is therefore at least an opportunity to introduce
slowly more efficient public administrations and progressive taxations.
5.6.5. Food-for-Work Programs
Food-for-work programs provide excellent opportunities to combine targeting efficiency with
social benefits. None of the ODC countries, however, makes use of such programs, which is
most likely due to inefficient public administrations and possibly ethical considerations. Of
course, large scale food-for-work programs may also have negative side effects, especially if
they lead to crowding out on the labor market. Ideally, food-for-work programs are a substitute
for wage increases. This is especially an option for the public sector. Similar to food-for-work
programs, food-for-family-planning-awareness-creation programs may also be taken into

72
consideration. At least in the medium to long run, lower fertility rates will be necessary to escape
food-insecurity traps.
5.6.6. Food Stamps
Food stamps rank high on targeting efficiency, but are often costly in public-administrative
terms. According to the World Bank, Syria, Palestine, and Iraq make use of food stamps.
5.6.7. School Feeding
Lebanon, Syria, Jordan, and Palestine make use of school feeding programs. School feeding
programs are also efficient in terms of targeting vulnerable and generating positive social
spillover effects. They pay a high public health dividend and prevent poverty-determined early
school drop-outs.
6. Assessment of the Social Cost of the 2006-2008 Food Price Crisis
6.1. Methodology
In order to get an idea of the socioeconomic impacts of the food price crisis, one can estimate the
food price inflation elasticity of various food security related indicators. To do this, the food
security indicators are regressed on per capita income and food price inflation, using simple
pooled OLS double log regressions. The 2005 World Bank Development Indicator Database
reports an annual food price index for the period between 1980 and 2005. This index was then

73
transformed into a food price inflation indicator, for which five-year average inflation rates were
calculated. The maximum range covers five consecutive periods from 1981-1985 to 2001-2005,
with the last observation only covering the period from 2001 to 2003.
In running the regressions, multicollinearity is a problem on the right hand side of the equations
with per capita income dominating the regression results. Two models are therefore always run,
one only with food price inflation (Model I) and one with both food price inflation and per capita
income (Model II). Table 16 summarizes the results (omitting the intercept).
Table 17: Food Price Elasticity of Undernourishment (Pooled OLS double log regression)
*** = significant at 1% level; **=significant at 5% level. Source: Author’s calculations.
6.2. Discussion of Results
The results show that the bilateral effect of food inflation is significant on undernourishment,
real per capita income, food expenditure shares, and food inequality. Model II, however, shows
Model I Model II
Elasticity of Food Inflation N Adj.
R2 Food
Inflation Per capita
income N Adj. R2
Undernourishment 0.13*** 466 3.7 -0.04 -0.56*** 451 63.6 Real income (2000 USD) -0.29*** 623 9.9 -0.04 1.00*** (lagged income) 610 99.9
Food Expenditure Shares 0.10*** 434 9.8 -0.00 -0.31*** 424 78.5
Food Inequality 0.01*** 510 2.7 -0.009** -0.08*** 495 59.8 One Dollar Poverty -0.05 247 0.0 -0.02 -0.84*** 246 48.2 Two Dollar Poverty -0.08 247 1.0 -0.04 -0.80*** 246 48.6 Malnutrition Weight to Age -0.07 255 1.0 -0.1*** -0.56*** 249 45.2 Malnutrition Height to Age 0.02 233 0.0 -0.01 -0.52*** 228 49.3 Primary School Enrolment -0.01 325 0.0 0.03*** 0.11*** 316 36.9 Secondary School Enrolment -0.09*** 244 3.5 -0.02 0.33*** 235 53.9

74
that these relationships are not necessarily statistically robust when per capita income is added on
the right hand side of the equation. This, however, is a statistical phenomenon that obviously
shall not prevent one from concluding that food price inflation exercises severe adverse effects
on a society’s food security. Moreover, since per capita income is affected by food price inflation
and per capita income is such a dominant explanatory variable for food security variables, there
are also strong indirect effects.
The indirect effect of food inflation is always very close to the bilateral effect. Take, for
example, the case of undernourishment. The bilateral effect of a one percent increase of food
price inflation increases undernourishment by 0.13 percent. The indirect effect through real
income is 0.16 percent (-0.29*-0.56). It is therefore possible to estimate all elasticities using this
indirect approach. The following Figure 16 summarizes this approach.
Figure 16: Estimated Food Inflation Elasticities
Source: Author’s illustration
6.3. Application of Results to ODC Countries
Between the 2001-2005 observation and 2008, the IMF food price indicator rose from 90.6 to
172.2 in April 2008, or an increase by 90%. Assuming a 100% increase as a reference model is
thus not farfetched. Table 17 summarizes the results of applying the elasticities to the various
ODC countries.

75
The results suggest that the population of undernourished people increased by an estimated 3.7
million people over the last five years that can be only attributed to the food price crisis. The
population of the ODC countries account for roughly 2.3 percent of the world population. The
UN estimates that the food price crisis increases undernourishment worldwide by more than 100
million. Assuming a world population of 6.7 billion, a linear extrapolation from the ODC
countries to the world would predict the victims of the “Silent Tsunami,’ as the food price crisis
has become known, too, at 157,000 million. Since this number likely overshoots the real number,
one can conclude in reverse causation that the ODC countries are hit over-proportionally by the
food price crisis.
Table 18 predicts also socioeconomic costs in other areas. Unfortunately, due to data constraints,
they cannot be easily aggregated. This deficit notwithstanding, available figures and estimates
indicate that the food price crisis drives people into poverty, increases malnourishment, and
reduces school enrollment, although more on the secondary level. Although the impact on food
inequality seems to be statistically negligible, this may be a data artifact. Similarly, the increase
of food expenditure shares likely underestimate real effects on the ground.

76
Table 18: Estimation of Socioeconomic Impacts of Food Price Crisis on ODC Countries
Lebanon Syria Jordan Iran Iraq Yemen Palestine Population
2008 in Million
3.69 20.59 5.94 71.35 28.3 23.06 4.14
Percentage Pop growth over 5 years
5.54 13.53 13.61 7.45 9.2 16.93 22.98
Percentage 2001-2005 3.00 4.00 6.50 4.00 15.0 (est.) 37.50 16.00 Percentage 2008 3.48 4.64 7.54 4.64 17.4 38.66 18.56 Population 2001-2005 105,000 725,440 339,690 2,656,200 4,000,000
(est.) 7,395,375 538,560 Population 2008 128,577 955,344 447,664 3,310,732 4,910,485 8,914,996 768,292
Under- nourishment
Absolute Increase 23,577 229,904 107,974 654,532 910,485 1,519,621 229,732 Percentage 2001-2005 2.00 2.00 15.70 Percentage 2008 2.48 2.48 19.47 Population 2001-2005 104,520 1,328,100 3,096,197 Population 2008 147,312 1,769,480 4,489,782
One Dollar Poverty
Absolute Increase 42,792 441,380 1,393,585 Percentage 2001-2005 6.95 7.31 45.24 Percentage 2008 8.55 8.99 55.65 Population 2001-2005 363,207 4,854,205 8,921,780 Population 2008 507,870 6,414,365 12,832,890
Two Dollar Poverty
Absolute Increase 144,663 1,560,160 4,511,110 Percentage 2001-2005 93.7 94.45 92.39 87.28 72.02 89.60 Percentage 2008 90.89 91.62 89.62 84.66 69.86 86.91 Population 2001-2005 440,324 2,221,464 673,375 4,920,363 1,970,359 501,127 Population 2008 449,750 2,446,404 742,085 5,128,225 2,234,269 597,784
Primary Enrolment
Absolute Decrease 9,426 224,940 68,710 207,862 263,910 96,656

77
Table 17: Estimation of Socioeconomic Impacts of Food Price Crisis on ODC Countries (Contd.)
Lebanon Syria Jordan Iran Iraq Yemen Palestine Percentage 2001-2005 50.08 81.83 77.53 32.74 85.87
Percentage 2008 45.07 73.65 69.78 29.47 77.28 Population 2001-2005 1,232,468 556,051 6,196,034 721,224 406,999
Population 2008 1,259,132 568,579 5,992,132 758,903 450,458
Secondary Enrolment
Absolute Decrease 26,664 12,528 -203,902 37,679 43,459 Percentage 2001-2005 11.00 8.50 15.40 53.10 9.90
Percentage 2008 12.65 9.77 17.71 61.06 11.38 Population 2001-2005 46,991 56,361 740,400 1,272,730 64,321
Population 2008 56,901 73,599 914,894 1,709,510 90,927
Malnutrition Height to Age
Absolute Increase 9,910 17,238 174,494 436,779 26,606 Percentage 2001-2005 3.90 4.40 10.90 45.60 4.90
Percentage 2008 4.52 5.10 12.64 46.76 5.68 Population 2001-2005 16,663 29,175 524,049 1,092,107 31,835
Population 2008 20,331 38,419 652,979 1,309,150 45,383
Malnutrition Weight to Age
Absolute Increase 3,668 9,244 128,930 217,043 13,548 Value 2001-2005 13.90 14.80 14.10 15.30 15.80 12.80 Food
Inequality Value 2008 14.18 15.09 14.38 15.61 16.12 13.06 Value 2001-2005 39.33 47.92 37.67 32.55 61.13 Food
Expenditures Share Value 2008 42.87 52.23 41.06 33.64 66.63
Source: Author’s calculation.
A summary of major socioeconomic, agricultural performance, and access to market and credit
indicators are compiled in Appendix Item 6.
Appendix Item 6 about Here [Compilation of Major Indicators for ODC Countries]
78
6.4. Final Word of Caution
Like every statistical analysis, the results of this study are substantially influenced by the quality
of the data. The quality of data regarding food security is unfortunately rather poor. For example,
the 2005 World Bank Development Indicator Database still listed national food indices, which
were discontinued shortly after and therefore shortly before they would have been needed the
most. How does data quality affect the results of this study? It is believed that they lead to rather
conservative estimates. Either way, future research is indispensable and this study should be thus
interpreted as an explorative one.
7. Concluding Policy Recommendations
The above analysis was conducted with the objective to obtain a better understanding of the food
markets of the seven ME-ODC countries. The results shall help in the formulation of strategies
for contingency planning, emergency preparedness, and crisis response policies.
7.1. Contingency Planning
Contingency planning revolves mostly around geopolitical vulnerabilities. Widespread problems
are refugees and internally displaced people. This is particularly true for Iraq, Syria, Jordan,
Yemen, and Lebanon. Iraq hosts four million internally displaced people and many of them are
not reached by the public distribution system, either because of insecurity, leakages, or
administrative inefficiencies. Syria and Jordan host together another estimated 2-2.5 million Iraqi
refugees. Yemen is mostly confronted with Somali and Ethiopian refugees. Their exact number

79
is not known and estimates range from 200 thousand to more than a million. Lastly, Lebanon has
more than 200,000 registered refugees. Another geopolitical hotspot is Palestine, where the
economic situation has deteriorated dramatically since 2006, especially in Gaza. Although Iran is
also regularly in the cross lines of geopolitics, most of it is still rhetoric and has not yet affected
the lives of the people on the ground.
Droughts are another common risk to sudden increases of food insecurity. In the case of the ME-
ODC countries, droughts are, paradoxically, the more problematic the greater is the share of
domestic production to consumption. In recent history, especially Syria, Iran, and Yemen have
proven vulnerable to droughts.
The third communality is the exposure to the recent food price crisis, which has been a particular
emphasis of this study. Preliminary estimates with available data suggest that the food price
crisis will account for at least 3.7 million additional undernourished people in the ME-ODC
region, although this estimate is likely too conservative in light of given data availability
constraints. Another problem is that all estimates are based on the assumption that everything
else is held constant. A major concern in the context of the food price crisis, however, is whether
most states’ food subsidy schemes will remain in place or need to be abandoned. If they become
abandoned, food insecurity will spread more rapidly.
For contingency planning purposes, the ME-ODC countries require thus constant monitoring on
various fronts: Geopolitics (IDPs, refugees, armed conflict), droughts, and prices (direct effects

80
and indirect effects on subsidy systems). The WFP Vulnerability Analysis and Mapping system
is an excellent initiative in this regard.
7.2. Emergency Preparedness
Emergency preparedness is foremost a logistic problem: Where to make the purchase and how to
get it delivered on the ground. As the analysis of the seven ME-ODC countries has shown, their
trade and vulnerability profile makes them uniquely challenging from a logistic perspective. In
the presence of a food crisis, food will have to be purchases most likely outside the Middle East.
Yet, emergency preparedness also refers to the following questions:
• What are the country-specific ME-ODC emergency preparedness strategies?
• What are the WFP’s emergency preparedness strategies?
• To which extend, are the strategies of ME-ODC and WFP compatible?
A basic principle of economic policy, which emergency planning and administration is part of, is
the principle of subsidiarity. It implies that every country should apply an emergency
preparedness strategy for itself while the role of a supranational organization should be to
complement domestic emergency relief efforts only after domestic efforts are exhausted. A
constant dialog with vulnerable countries is therefore necessary. This is also correctly
incorporated in the WFP Strategic Plan where it says: “WFP's partnerships with national
governments will be implemented in a manner consistent with the widely-recognized principles

81
of ownership, alignment, harmonization, management for results and mutual accountability.” (p.
10).
The presence of a global fire-brigade, such as the WFP, implies a moral hazard. Some countries
may neglect their precautionary responsibilities and hope to free ride on the international
community. Especially a country like Yemen, where buffer stocks cannot be accumulated
because a substantial amount of arable land is used for the cultivation of QAT, which is then
consumed as a recreational drug, puts the principle of subsidiarity ad absurdum. It is important to
create public policy awareness for that food security policy must begin on the national level. In
this regard, the WFP can serve as a platform for dialog and exchange where different countries
can learn from each other and develop best practices in food security policy. Policy-oriented
research at the WFP should support and accompany this dialog.
7.3. Crisis Response Policies
Short and long term policies must be distinguished. Short-term policies work on prices and
quantities. They involve slashing taxes, export bans, buffer stock interventions, price controls,
and subsidies. Other short term policies address social safety nets. Cash transfers, school feeding
programs, food stamps, and work for food programs fall under this category.
As most pundits predict food prices to remain high, many of the crisis response strategies cannot
be financed forever, as they were conceptualized as short-term policies. In fact, it can be
questioned whether many of the existing subsidy systems will prevail or if governments will
have to scrap them.

82
Among short-term-policies, food-for-work programs are barely utilized in the ME-ODC
countries. Food-for-work programs, however, would be an excellent opportunity for most ME-
ODC countries. This is because unemployment is generally high and crowding-out effects are
not to be expected. Another advantage of food-for-work programs is that they create economic
activity on the supply side while all other social-safety-nets try to conserve economic activity,
only trying to halt a decrease in demand.
To “reduce hunger and chronic undernourishment“ that concerns at least 19 million people in
the ME-ODC countries and to “strengthen capacities of countries to reduce hunger,” as
envisioned in WFP’s 2008-2011 Strategic Plan (p. 3), is barely possible without developing a
long term food security policy vision. Short-term crisis response strategies should not be
detached from long-term crisis prevention scenarios. This study has shown that there are many
opportunities for the integration of long-term food security concerns within such a framework.
Examples are family planning, infrastructure projects, and redistributive policies.

83
8. References
Almas, A. A. M. and M. Scholz (2006), Agriculture and Water resources Crisis in Yemen: Need for Sustainable Agriculture, Journal of Sustainable Agriculture, Vol. 28(3), 2006, pp. 55-75. Agriculture and Agrifood Canada (2005), Agri-food Sector Profile – Amman, Jordan, November 2007, http://www.ats.agr.gc.ca/africa/4045_e.htm Agriculture and Agrifood Canada (2005), Agri-food Sector Profile – Syria, August 2005, http://www.ats.agr.gc.ca/africa/4045_e.htm Agriculture and Agrifood Canada (2007), Agri-food Sector Profile – Beirut, Lebanon, October 2007, http://ats-sea.agr.gc.ca/info/africa-e.htm. Agriculture and Agrifood Canada (2007), Agri-food Sector Profile – Iran, Theran, December 2007, http://infoexport.gc.ca/ie-en/DisplayDocument.jsp?did=78216&_requestid=1685513 Al Zoughbi, S. (2006), The State of Food Security: Recent Trends in Syria, Ministry of Agriculture and Agrarian Reform, Working Paper No 17, April 2006, http://www.napcsyr.org/dwnld-files/working_papers/en/17_food_security_syria_en.pdf. BBC News (2000), Iran Facing Drought Catastrophe, http://news.bbc.co.uk/2/hi/middle_east/864801.stm Braun v., J. (2007), The World Food Situation, New Driving Forces and Required Actions, International Food Policy Research Institute, Washington, D.C., 2007. Buntrock, G., Cheap No More, The Economist, December 6, 2007. CIA World Fact Book, https://www.cia.gov/library/publications/the-world-factbook/ Chakrabortty, A., Secret Report: Biofuel Caused Food Crisis, The Guardian, July 4, 2008, http://www.guardian.co.uk/environment/2008/jul/03/biofuels.renewableenergy. Cline, W. R. (2007), Global Warming and Agriculture, Impact Estimates by Country, Peterson Institute for International Economics, Washington, D.C., 2007. Daragahi, B. (2008), Islamists Gain from Food Crisis, Los Angeles Times, May 18, http://articles.latimes.com/2008/may/18/world/fg-food18 Deghan, A. (undated), Agriculture and Food Security in Iran, http://www.agri-peri.ir/AKHBAR/86/aban/kargah/first%20day/Mr.Dehghan/Mr.DehghanAgriculture%20and%20food%20security.pdf

84
FAO (2006), The State of Food Insecurity in the World 2006, Eradicating World Hunger – Taking Stock Ten Years after the World Food Summit, http://www.fao.org/docrep/009/a0750e/a0750e00.htm FAO Newsroom (2006), Lebanon: Damage to Agriculture, Fisheries and Forestry Estimated at around $280 Million, November 27, 2006, Rome, http://www.fao.org/Newsroom/en/news/2006/1000445/index.html)\ FAO Newsroom (2006), The Near East and North Africa: Growing Demand, Limited resources, www.fao.org/newsroom/en/focus/2006/1000252/article_1000254en.html FAO Statistical Yearbook (2005/2006), Country Profiles, Vol. 2, http://www.fao.org/ES/ESS/yearbook/vol_1_2/site_en.asp?page=cp Finch, J. (2007), Corn, Fertilizer Could Drive Natural Gas Price Higher, www.bestsyndication.com/?q=043007_corn-crops-use-fertilizers-from-natural-gas-supplies-investing-in-commodities.htm (Accessed September 15, 2008). Gardner-Outlaw, T., Engleman, R. (1997), Sustaining water, Easing scarcity, A Second Update, Washington, DC, Population Action International, p. 2–19. Groom, M. J., E. A. Gray, and P. A. Townsend. Biofuels and Biodiversity: Principles for promoting better biofuels policies. 2008. Published Early On-Line on 8 February 2008 in Conservation Biology. International Monetary Fund – The World Bank (2007), West Bank and Gaza, Economic Developments in 2006 – A First Assessment, http://www.imf.org/external/np/wbg/2007/eng/032607ed.pdf Ministry of Agriculture Jordan, The National Strategy for Agricultural Development, The Future of the Agricultural Sector 2002-2010, http://www.moa.gov.jo/html/strat/strategic_eng/AS-V-BG.htm. The Humanitarian Monitor occupied Palestinian territory (2008), Number 27, Tables of Indicators, http://www.ochaopt.org/documents/ocha_opt_humanitarian_monitor_table_2008_07_english.pdf OECD (2008), Agriculture and Fisheries, Key Graphs: Biofuels and Agriculture, http://www.oecd.org/document/16/0,3343,en_2649_37401_40054096_1_1_1_1,00.html OECD-FAO Agricultural Outlook 2008-2017 http://www.agri-outlook.org/dataoecd/54/15/40715381.pdf Presidency of the Council of Ministers, Lebanon’s Economic Accounts 2005, Beirut, Lebanon, October 2007.

85
Rathi, A. M. (2008), Stock to Use Ratio and Prices, Commodity Watch, Vol. 1, Issue 22, 16 Jul, 2008-30 Jul, 2008, http://www.commoditywatch.in Refugees International (2007), Iraq: Fix the Public Distribution System to Meet Needs of the Displaced, http://www.refugeesinternational.org/content/article/detail/9971/ Refugees International (2008), Yemen: Durable Solutions Needed, http://www.refugeesinternational.org/content/article/detail/10562/ Reisen, H. (2006), China’s and India’s Implications for the World Economy, Basel University Lectures Series, Power Point Presentation, http://www.oecd.org/document/58/0,3343,en_2649_33731_2737210_1_1_1_1,00.html. Saif, I. (2008), The Food Price Crisis in the Arab Countries: Short Term Responses to a Lasting Challenge, Carnegie Endowment for International Peace, Middle East Program, Web Commentary, June 2008, http://www.carnegieendowment.org/files/saif_food_prices_final.pdf Stiffler, L. (2008), Bio-Debatable: Food vs. Fuel, Seattle Post Intelligencer, May 3, 2008 http://seattlepi.nwsource.com/local/361634_biodiesel03.html. The Economist, Iraq starts to fix itself, June 12, 2008. United Nations High Commissioner for Refugees (2008), 2007 Global Trends, http://www.pecad.fas.usda.gov/highlights/2008/05/Syria_may2008.htm. United Nations High Commissioner for Refugees (2008), Survey shows most Iraqis in Syria still Unwilling to Return Home, http://www.unhcr.org/cgi-bin/texis/vtx/iraq?page=news&id=481734784 United States Department of Agriculture – Foreign Agricultural Service, Commodity Intelligence Report, Syria: Wheat Production in 2008/2009 Declines Owing to Season Long Drought, May 9, 2008, http://www.pecad.fas.usda.gov/highlights/2008/05/Iran_may2008.htm United States Department of Agriculture – Foreign Agricultural Service, Commodity Intelligence Report, Syria: Wheat Production in 2008/2009 Declines Owing to Season Long Drought, May 9, 2008, http://www.pecad.fas.usda.gov/highlights/2008/05/Syria_may2008.htm United Nations Office for the Coordination of Humanitarian Affairs (2008), Iraq Humanitarian Profile Map (as of March 2008), http://ochaonline.un.org/romenaca/MapCentre/HumanitarianProfileMaps/tabid/4653/language/en-US/Default.aspx US Department of State (2005), The Future of Iraq Project - Water, Agriculture, and Environment Group, http://www.gwu.edu/~nsarchiv/NSAEBB/NSAEBB198/FOI%20Water,%20Af%20and%20Envt.pdf

86
WFP News Press Release (2006), WFP concludes operation in Lebanon, October 31, 2006, http://www.wfp.org/english/?ModuleID=137&Key=2278. WFP Rapid Food Needs Assessment – Refugees fleeing Iraq into Syria, January 29 to February 8, 2007, http://documents.wfp.org/stellent/groups/public/documents/ena/wfp122476.pdf World Bank (2008), West Bank and Gaza: Economic Development and Prospects – March 2008, http://web.worldbank.org/WBSITE/EXTERNAL/COUNTRIES/MENAEXT/WESTBANKGAZAEXTN/0,,contentMDK:21694302~menuPK:294370~pagePK:2865066~piPK:2865079~theSitePK:294365,00.html World Food Program (2004), Baseline Food Security Analysis in Iraq, http://www.wfp.org/country_brief/middle_east/iraq/assessments/0409_foodsecurity.pdf. World Food Program (2005), Food Security and Vulnerability Analysis in Iraq, http://www.reliefweb.int/rw/RWFiles2008.nsf/FilesByRWDocUnidFilename/EDIS-7BSRN8-full_report.pdf World Food Programme (2007), WFP Rapid Food Needs Assessment: Refugees Fleeing Iraq into Syria – Feb 2007, http://documents.wfp.org/stellent/groups/public/documents/ena/wfp122476.pdf World Food Programme oPt (2007), Rapid Food Security Needs Assessment in Gaza Strip, Effect of Import restrictions and Freeze on Exports on the Food Security in Gaza Strip, Survey Report, http://www.reliefweb.int/rw/RWFiles2007.nsf/FilesByRWDocUnidFilename/LSGZ-7AUE69-full_report.pd World Food Programme Vulnerability and Mapping (2008), Food Security and Market Monitoring Report occupied Palestinian territory, Report 19, http://www.reliefweb.int/rw/RWFiles2008.nsf/FilesByRWDocUnidFilename/MUMA-7GP7VV-full_reort.pdf World Food Programme (2008), WFP Strategic Plan (2008-2011), http://www.wfp.org/eb/docs/2008/wfp176663~2.pdf.

87
9. Appendix
Appendix Item 1: Data Description
Variable Name Description Source ycap GDP per capita (constant 2000 US$) PopMill Population in Millions RurPop Rural population (% of total population)
AgriEmp Employment in agriculture (% of total employment)
PopGr Population growth (annual %) Fert Fertility rate, total (births per woman) NetGCF Gross capital formation without aid (% of GDP) OneDolPov Poverty headcount ratio at $1 a day (PPP) TwoDolPov Poverty headcount ratio at $2 a day (PPP) SecEnr School enrollment, secondary (% net)
2007 WDI
EHII Estimated Household Income Inequality Indicator
University of Texas Estimated Household
Income Inequality Data Project
FoodGini Gini coefficient of dietary energy consumption FAO
MalNut5H Malnutrition prevalence, height for age (% of children under 5)
MalNut5W Malnutrition prevalence, weight for age (% of children under 5)
UnderNour Prevalence of undernourishment (% of population)
2007 WDI
FoodExpShr Expenditures on food (% of income) FoodPrElast Price Elasticity of Food Demand
US Department of Agriculture
LandIneq “Frankema Gini” Frankema (2006)
Soci
oeco
nom
ic F
unda
men
tals
FoodPrInfl Food Price Inflation 2005 World Bank
Development Indicator Database
Irrigated Irrigated land (% of cropland) CerealYld Cereal yield (kg per hectare)
FertCons Fertilizer consumption (100 grams per hectare of arable land)
2007 WDI
WaterCap Renewable Water Resources per Capita India’s Ministry of Water Resources
FoodTB Food Trade Balance (% of GDP) Own calculations using 2007 WDI
Agr
icul
tura
l Pe
rfor
man
ce
AgriCapWrk Capital Stock in Agriculture in 1000 (1995$ per worker,000) FAO (2006)
RoadTran Roads, goods transported (million ton-km)
RailTran Railways, goods transported (million ton-km)
Trans RoadTran + RailTran
Acc
ess t
o M
arke
t an
d C
apita
l
DomCred Domestic credit to private sector (% of GDP)
2007 WDI

88
Appendix Item 2: Agricultural Productivity Regressions
• Identification of Relative Agricultural Productivity:
Cereal Yieldi = b0+b1 Per Capita Incomei + b2 Water per Capitai + b3 Yeari +εi
DV = Cereal Yield (Ln) Coefficient Std. Error T-Stat P-Value Intercept -21.783 5.336 -4.082 0.00 Lnyconst (Ln) 0.273 0.021 13.097 0.00 WaterCap (Ln) 0.041 0.019 2.182 0.03 Year 0.014 0.003 5.071 0.00 N 250 Adjusted R2 43.8
• Relative Use of Fertilizers
Fertilizer Usei = b0+b1 Per Capita Incomei + b2 Water per Capitai + b3 Yeari +εi
DV=Fertilizer Consumption (Ln) Coefficient Std. Error T-Stat P-Value Intercept -26.525 14.882 -1.782 0.08 lnyconst 0.842 0.058 14.606 0.00 LnWaterCap -0.09 0.052 -1.737 0.08 Year 0.014 0.007 1.818 0.07 N 250 Adjusted R2 47.1
• Relative Use to Irrigation Systems
Irrigation Usei = b0+b1 Per Capita Incomei + b2 Water per Capitai + b3 Yeari +εi
DV=Irrigation Use (Ln) Coefficient Std. Error T-Stat P-Value Intercept -27.058 17.412 -1.554 0.12 lnyconst 0.233 0.069 3.384 0.00 LnWaterCap -0.192 0.065 -2.968 0.00 Year 0.014 0.009 1.664 0.10 N 240 Adjusted R2 8.9

89
• Relative Endowment of Capital per Agricultural Worker
Agricultural Capital per Workeri = b0+b1 Per Capita Incomei + b2 Yeari +εi
DV=AgriCapWrk (Ln) Coefficient Std. Error T-Stat P-Value Intercept 4.472 24.843 0.18 0.86 lnyconst 0.609 0.052 11.651 0.00 Year -0.004 0.012 -0.291 0.77 N 216 Adj. R2 38.5
• Relative Access to Human Capital
Secondary School Enrollmenti = b0+b1 Per Capita Incomei + b2 Yeari +εi
DV = Secondary Enrollment Coefficient Std. Error T-Stat P-Value Intercept -2566.78 559.899 -4.584 0.00 lnyconst 13.387 0.637 21.017 0.00 Year 1.26 0.28 4.509 0.00 N 296 Adj. R2 60.2
• Relative access to Transportation Infrastructure
Transportationi = b0+b1 Per Capita Incomei + b2 Yeari +εi
DV = Transportation Coefficient Std. Error T-Stat P-Value Intercept -18.981 21.21 -0.895 0.37 lnyconst 0.786 0.06 13.055 0.00 Year 0.011 0.011 1.013 0.31 N 23.8 Adj. R2 542
• Relative access to Credit
Domestic Crediti = b0+b1 Per Capita Incomei + b2 Yeari +εi
DV = Domestic Credit Coefficient Std. Error T-Stat P-Value ntercept -18.989 3.442 -5.517 0.00 lnyconst 0.406 0.014 29.057 0.00 Year 0.01 0.002 5.56 0.00 N 1187 Adj. R2 43.0
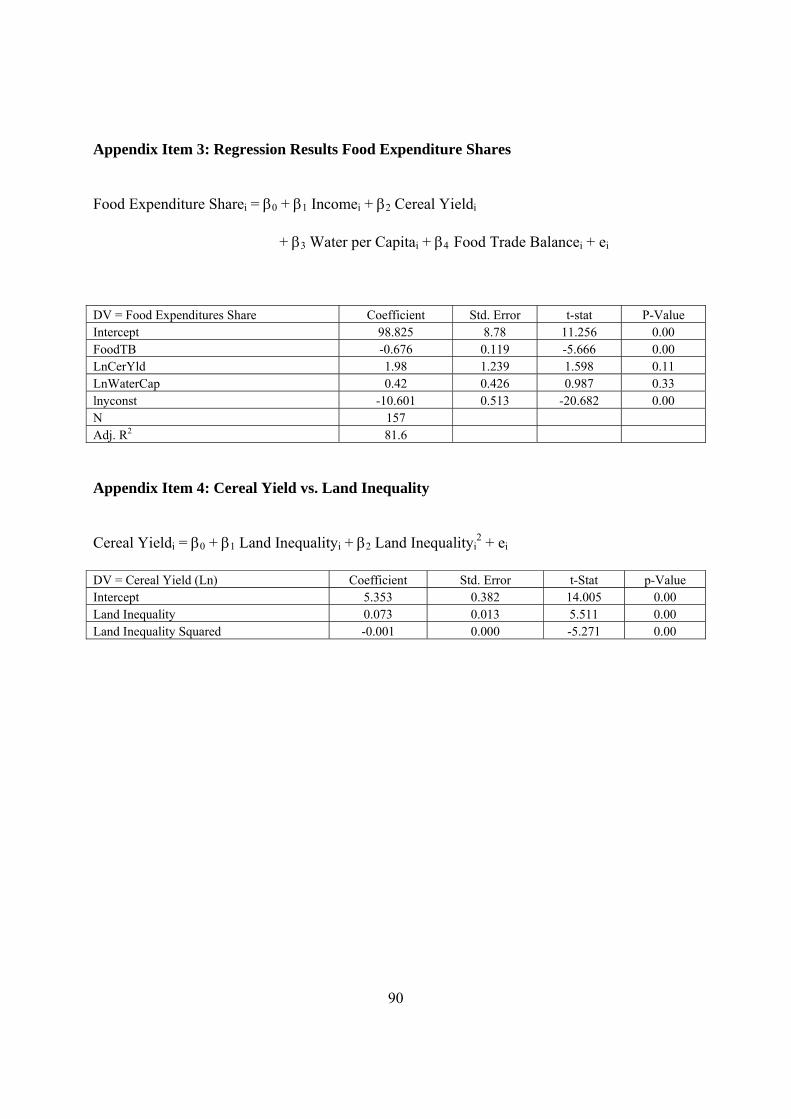
90
Appendix Item 3: Regression Results Food Expenditure Shares Food Expenditure Sharei = β0 + β1 Incomei + β2 Cereal Yieldi
+ β3 Water per Capitai + β4 Food Trade Balancei + ei
DV = Food Expenditures Share Coefficient Std. Error t-stat P-Value Intercept 98.825 8.78 11.256 0.00 FoodTB -0.676 0.119 -5.666 0.00 LnCerYld 1.98 1.239 1.598 0.11 LnWaterCap 0.42 0.426 0.987 0.33 lnyconst -10.601 0.513 -20.682 0.00 N 157 Adj. R2 81.6
Appendix Item 4: Cereal Yield vs. Land Inequality Cereal Yieldi = β0 + β1 Land Inequalityi + β2 Land Inequalityi
2 + ei
DV = Cereal Yield (Ln) Coefficient Std. Error t-Stat p-Value Intercept 5.353 0.382 14.005 0.00 Land Inequality 0.073 0.013 5.511 0.00 Land Inequality Squared -0.001 0.000 -5.271 0.00
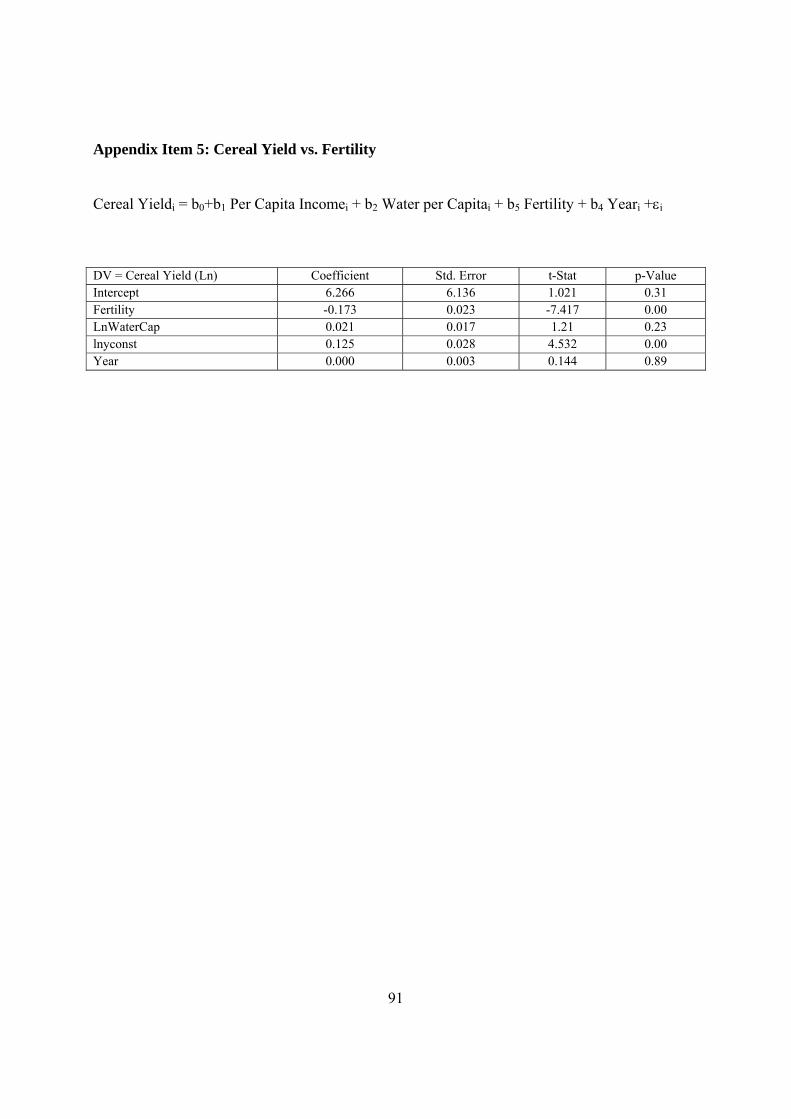
91
Appendix Item 5: Cereal Yield vs. Fertility
Cereal Yieldi = b0+b1 Per Capita Incomei + b2 Water per Capitai + b5 Fertility + b4 Yeari +εi
DV = Cereal Yield (Ln) Coefficient Std. Error t-Stat p-Value Intercept 6.266 6.136 1.021 0.31 Fertility -0.173 0.023 -7.417 0.00 LnWaterCap 0.021 0.017 1.21 0.23 lnyconst 0.125 0.028 4.532 0.00 Year 0.000 0.003 0.144 0.89

92
Appendix Item 6: Compilation of Socioeconomic Indicators of ODC Countries
Lebanon
Indicator 61-65 66-70 71-75 76-80 81-85 86-90 91-95 96-2k 01-05 Per Capita Income ($2000) .. .. .. .. .. 3245.8 4388.0 4926.2 5416.9 Population in Million 2.1 2.3 2.6 2.7 2.8 2.7 3.0 3.3 3.5 Rural Population Share 52.5 43.9 36.0 29.0 22.9 18.4 15.9 14.5 13.6 Employment in Agriculture .. .. .. .. .. .. .. .. .. Population Growth Rate 2.7 2.0 2.3 0.1 0.7 -0.4 2.9 1.3 1.0 Fertility Rate 5.7 5.2 4.8 4.2 3.7 3.2 2.9 2.6 2.3 Investment (free of aid) .. .. .. .. .. 8.9 27.2 25.9 18.9 One Dollar Poverty .. .. .. .. .. .. .. .. .. Two Dollar Poverty .. .. .. .. .. .. .. .. .. Secondary School Enrollment .. .. .. .. .. .. .. .. .. Estimated Household Income Inequality .. .. .. .. .. .. .. .. .. Food Gini .. .. .. .. .. .. .. 13.9 .. Malnutrition (Height to Age) .. .. .. .. .. .. .. 12.2 11.0 Malnutrition (Weight to Age) .. .. .. .. .. .. .. 3.0 3.9 Undernourishment .. .. 21.0 .. 9.0 .. 2.5 3.0 3.0 Food Expenditure Share 39.3 39.3 39.3 39.3 39.3 39.3 39.3 39.3 39.3 Food Price Elasticty .. .. .. .. .. .. .. -0.4 .. Land Inequality .. .. .. .. .. .. .. .. .. Food Price Inflation .. .. .. .. .. .. .. .. .. Irrigation 17.6 21.6 24.4 27.1 28.8 28.3 30.3 33.6 33.2 Cereal Yield 1035.7 924.0 1167.3 1154.4 1234.8 1800.8 2183.2 2030.1 2502.1 Fertilizer Consumption 929.9 1278.1 1931.8 1466.4 2040.1 1211.5 1908.2 3186.8 2882.3 Renewable Water per Capital .. .. 1735.0 .. .. .. .. 1463.0 .. Food Trade Balance (% GDP0 .. .. .. .. .. .. .. -7.4 -5.6 Agricultural Capital per Worker (thousands, $1995) .. .. .. .. .. .. 20.0 .. 33.0 Roads, goods transported (million ton - km) .. .. .. .. .. .. .. .. .. Railways, goods transported (million ton - km) .. .. .. .. .. .. .. .. .. Transport .. .. .. .. .. .. .. .. .. Domestic credit to private sector (% of GDP) .. .. .. .. .. 66.5 49.8 75.4 81.0

93
Appendix Item 6: Compilation of Socioeconomic Indicators of ODC Countries (Contd.)
Syria
Indicator 61-65 66-70 71-75 76-80 81-85 86-90 91-95 96-2k 01-05 Per Capita Income ($2000) 540.6 531.6 707.2 938.2 1006.3 882.9 1031.3 1122.6 1142.7 Population in Million 5.1 6.0 7.1 8.4 10.1 12.0 14.0 16.0 18.1 Rural Population Share 61.3 58.0 55.6 53.9 52.6 51.5 50.6 50.0 49.6 Employment in Agriculture .. .. .. .. .. .. .. .. 30.3 Population Growth Rate 3.1 3.3 3.3 3.5 3.8 3.4 2.8 2.6 2.5 Fertility Rate 7.6 7.6 7.5 7.4 6.9 5.7 4.4 3.8 3.4 Investment (free of aid) 12.5 13.5 14.4 20.5 19.8 14.4 21.5 19.4 20.6 One Dollar Poverty .. .. .. .. .. .. .. .. .. Two Dollar Poverty .. .. .. .. .. .. .. .. .. Secondary School Enrollment .. .. .. .. .. .. 42.7 36.1 50.1 Estimated Household Income Inequality 48.7 48.3 45.8 45.6 44.3 39.9 44.0 46.3 41.5 Food Gini 14.8 .. .. .. .. .. .. .. .. Malnutrition (Height to Age) .. .. .. .. .. .. 23.7 18.8 .. Malnutrition (Weight to Age) .. .. .. .. .. .. 12.5 6.9 .. Undernourishment .. .. 16.0 .. 3.0 .. 5.0 4.0 4.0 Food Expenditure Share 47.9 47.9 47.9 47.9 47.9 47.9 47.9 47.9 47.9 Food Price Elasticty .. .. .. .. .. .. .. -0.4 .. Land Inequality 64.3 64.3 64.3 64.3 64.3 64.3 64.3 64.3 64.3 Food Price Inflation .. .. .. .. 12.7 36.3 9.2 -0.1 2.6 Irrigation 8.9 8.4 9.6 9.5 10.5 11.9 17.7 21.6 24.0 Cereal Yield 816.2 703.1 801.4 944.2 924.4 947.8 1352.9 1381.8 1923.1 Fertilizer Consumption 24.3 49.1 97.7 205.4 358.5 551.5 678.6 764.4 674.3 Renewable Water per Capital .. .. 6014.0 .. .. .. .. 2774.0 .. Food Trade Balance (% GDP0 .. .. -5.2 -3.9 -4.0 -2.3 -2.5 -1.6 -0.8 Agricultural Capital per Worker (thousands, $1995) .. .. .. .. .. .. 14.0 .. 14.0 Roads, goods transported (million ton - km) .. .. .. .. .. .. .. .. .. Railways, goods transported (million ton - km) .. .. .. 577.0 874.2 1421.8 1183.0 1531.0 1961.0 Transport .. .. .. 577.0 874.2 1421.8 1183.0 1531.0 1961.0 Domestic credit to private sector (% of GDP) 19.8 11.6 5.7 5.3 7.4 7.3 10.1 9.2 9.3

94
Appendix Item 6: Compilation of Socioeconomic Indicators of ODC Countries (Contd.)
Jordan
Indicator 61-65 66-70 71-75 76-80 81-85 86-90 91-95 96-2k 01-05 Per Capita Income ($2000) .. .. 1118.3 1587.7 2005.5 1897.1 1637.8 1713.4 1917.8 Population in Million 1.0 1.4 1.7 2.0 2.5 3.0 3.9 4.6 5.2 Rural Population Share 47.1 44.7 43.0 41.0 36.3 30.2 24.1 20.4 18.5 Employment in Agriculture .. .. .. .. .. .. .. 4.9 3.9 Population Growth Rate 5.8 5.8 3.7 3.7 3.9 3.6 5.6 3.0 2.4 Fertility Rate 8.0 7.9 7.8 7.2 6.5 5.7 4.9 4.1 3.4 Investment (free of aid) .. .. .. 8.5 17.1 13.9 20.0 18.0 14.7 One Dollar Poverty .. .. .. .. .. 2.0 2.0 2.0 2.0 Two Dollar Poverty .. .. .. .. .. 2.0 10.6 7.4 7.0 Secondary School Enrollment .. .. .. .. .. .. .. 79.2 81.8 Estimated Household Income Inequality 48.5 48.3 47.8 49.0 47.8 48.9 46.3 46.6 46.8 Food Gini .. .. .. .. .. .. 14.1 .. .. Malnutrition (Height to Age) .. .. .. .. .. 15.8 .. 7.8 8.5 Malnutrition (Weight to Age) .. .. 17.4 .. .. 6.4 6.4 5.1 4.4 Undernourishment .. .. 19.0 .. 6.0 .. 4.0 7.0 6.5 Food Expenditure Share 37.7 37.7 37.7 37.7 37.7 37.7 37.7 37.7 37.7 Food Price Elasticty .. .. .. .. .. .. .. -0.4 .. Land Inequality 64.3 64.3 64.3 64.3 64.3 64.3 64.3 64.3 64.3 Food Price Inflation .. .. .. .. 3.9 9.4 4.8 3.2 0.8 Irrigation 10.6 10.8 10.9 11.0 13.7 18.5 24.4 27.4 27.3 Cereal Yield 664.2 547.6 645.2 461.7 587.8 936.3 1273.9 1639.8 1344.3 Fertilizer Consumption 113.8 117.5 137.3 340.3 511.8 645.7 795.9 1175.2 1440.7 Renewable Water per Capital .. .. 338.0 .. .. .. .. 132.0 .. Food Trade Balance (% GDP0 -5.4 -5.6 -8.6 -8.4 -7.7 -8.0 -8.6 -7.3 -5.9 Agricultural Capital per Worker (thousands, $1995) .. .. .. .. .. .. 8.0 .. 5.0 Roads, goods transported (million ton - km) .. .. .. .. .. .. .. .. .. Railways, goods transported (million ton - km) .. .. .. 355.0 662.4 686.6 741.1 622.0 689.3 Transport .. .. .. 355.0 662.4 686.6 741.1 622.0 689.3 Domestic credit to private sector (% of GDP) 14.8 23.2 26.2 43.9 59.5 71.6 70.0 76.6 76.3

95
Appendix Item 6: Compilation of Socioeconomic Indicators of ODC Countries (Contd.)
Iran
Indicator 61-65 66-70 71-75 76-80 81-85 86-90 91-95 96-2k 01-05 Per Capita Income ($2000) 980.8 1247.2 1828.5 1919.5 1471.8 1219.9 1425.4 1530.3 1800.4 Population in Million 23.4 26.9 31.2 36.6 43.7 51.8 57.1 61.8 66.4 Rural Population Share 64.3 60.4 56.1 51.9 48.1 44.9 41.4 37.4 34.2 Employment in Agriculture .. .. .. .. .. 26.4 23.8 23.0 24.9 Population Growth Rate 2.7 2.8 3.1 3.3 3.7 2.9 1.6 1.5 1.4 Fertility Rate 7.0 6.7 6.4 6.5 6.3 5.2 3.8 2.4 2.1 Investment (free of aid) 27.0 29.1 24.2 25.0 24.0 22.9 28.2 33.3 34.6 One Dollar Poverty .. .. .. .. .. 2.0 2.0 2.0 .. Two Dollar Poverty .. .. .. .. .. 12.1 7.8 7.3 .. Secondary School Enrollment .. .. .. .. .. .. .. .. 77.5 Estimated Household Income Inequality 47.9 48.8 46.8 46.1 37.6 36.5 41.2 43.2 43.2 Food Gini .. .. .. .. .. 15.3 .. .. .. Malnutrition (Height to Age) .. .. .. .. .. .. 18.9 15.4 .. Malnutrition (Weight to Age) .. .. .. .. .. .. 15.7 10.9 .. Undernourishment .. .. 30.0 .. 7.0 .. 4.0 3.0 4.0 Food Expenditure Share 32.5 32.5 32.5 32.5 32.5 32.5 32.5 32.5 32.5 Food Price Elasticty .. .. .. .. .. .. .. -0.4 .. Land Inequality 67.7 67.7 67.7 67.7 67.7 67.7 67.7 67.7 67.7 Food Price Inflation .. .. .. .. 15.8 17.4 33.0 19.0 13.5 Irrigation 31.3 32.4 34.3 35.9 39.8 42.3 38.3 41.2 42.7 Cereal Yield 864.6 881.5 925.1 1173.2 1147.0 1306.5 1693.8 1949.3 2288.0 Fertilizer Consumption 16.6 50.9 169.3 299.8 619.9 692.8 633.7 774.4 864.9 Renewable Water per Capital .. .. 4124.0 .. .. .. .. 2031.0 .. Food Trade Balance (% GDP0 -1.5 -0.5 -1.7 -2.3 .. .. .. -1.8 -1.0 Agricultural Capital per Worker (thousands, $1995) .. .. .. .. .. .. 9.0 .. 8.0 Roads, goods transported (million ton - km) .. .. .. .. .. .. .. .. .. Railways, goods transported (million ton - km) .. .. .. .. 6735.0 8198.4 9479.4 14220.3 18452.3 Transport .. .. .. .. 6735.0 8198.4 9479.4 14220.3 18452.3 Domestic credit to private sector (% of GDP) 20.8 24.9 25.6 36.8 33.6 34.0 28.7 26.0 36.0

96
Appendix Item 6: Compilation of Socioeconomic Indicators of ODC Countries (Contd.)
Iraq
Indicator 61-65 66-70 71-75 76-80 81-85 86-90 91-95 96-2k 01-05 Per Capita Income ($2000) .. .. .. .. .. .. .. 907.7 .. Population in Million 8.1 9.5 11.2 13.2 15.4 17.6 20.3 23.3 .. Rural Population Share 52.4 46.0 40.7 36.1 32.5 30.7 30.8 31.8 32.7 Employment in Agriculture .. .. .. .. .. .. .. .. .. Population Growth Rate 3.2 3.3 3.4 3.3 2.9 2.6 3.1 3.0 .. Fertility Rate 7.3 7.2 7.2 6.7 6.3 6.0 5.6 5.4 .. Investment (free of aid) .. .. .. .. .. .. .. .. .. One Dollar Poverty .. .. .. .. .. .. .. .. .. Two Dollar Poverty .. .. .. .. .. .. .. .. .. Secondary School Enrollment .. .. .. .. .. .. .. 30.4 36.7 Estimated Household Income Inequality 45.7 45.2 44.0 42.1 41.0 42.1 46.3 47.4 47.4 Food Gini .. .. 14.3 .. .. .. .. .. .. Malnutrition (Height to Age) .. .. .. .. .. .. 21.8 22.1 .. Malnutrition (Weight to Age) .. .. .. .. .. .. 11.9 19.4 .. Undernourishment .. .. .. .. .. .. .. .. .. Food Expenditure Share .. .. .. .. .. .. .. .. .. Food Price Elasticty .. .. .. .. .. .. .. .. .. Land Inequality 82.0 82.0 82.0 82.0 82.0 82.0 82.0 82.0 82.0 Food Price Inflation .. .. .. .. .. .. .. .. .. Irrigation 27.1 28.7 29.6 31.4 32.0 43.5 63.3 63.0 58.6 Cereal Yield .. .. .. .. .. .. .. .. .. Fertilizer Consumption 5.3 24.4 55.2 134.7 221.0 406.8 538.8 706.2 1111.4 Renewable Water per Capital .. .. 6844.0 .. .. .. .. 3263.0 .. Food Trade Balance (% GDP0 -2.2 .. 12.5 12.1 .. .. .. .. .. Agricultural Capital per Worker (thousands, $1995) .. .. .. .. .. .. .. .. .. Roads, goods transported (million ton - km) .. .. .. .. .. .. .. .. .. Railways, goods transported (million ton - km) .. .. .. .. .. .. .. .. 1682.0 Transport .. .. .. .. .. .. .. .. 1682.0 Domestic credit to private sector (% of GDP) 14.8 12.4 8.2 5.6 .. .. .. .. ..

97
Appendix Item 6: Compilation of Socioeconomic Indicators of ODC Countries (Contd.)
Iraq
Indicator 61-65 66-70 71-75 76-80 81-85 86-90 91-95 96-2k 01-05 Per Capita Income ($2000) .. .. .. .. .. .. .. 907.7 .. Population in Million 8.1 9.5 11.2 13.2 15.4 17.6 20.3 23.3 .. Rural Population Share 52.4 46.0 40.7 36.1 32.5 30.7 30.8 31.8 32.7 Employment in Agriculture .. .. .. .. .. .. .. .. .. Population Growth Rate 3.2 3.3 3.4 3.3 2.9 2.6 3.1 3.0 .. Fertility Rate 7.3 7.2 7.2 6.7 6.3 6.0 5.6 5.4 .. Investment (free of aid) .. .. .. .. .. .. .. .. .. One Dollar Poverty .. .. .. .. .. .. .. .. .. Two Dollar Poverty .. .. .. .. .. .. .. .. .. Secondary School Enrollment .. .. .. .. .. .. .. 30.4 36.7 Estimated Household Income Inequality 45.7 45.2 44.0 42.1 41.0 42.1 46.3 47.4 47.4 Food Gini .. .. 14.3 .. .. .. .. .. .. Malnutrition (Height to Age) .. .. .. .. .. .. 21.8 22.1 .. Malnutrition (Weight to Age) .. .. .. .. .. .. 11.9 19.4 .. Undernourishment .. .. .. .. .. .. .. .. .. Food Expenditure Share .. .. .. .. .. .. .. .. .. Food Price Elasticty .. .. .. .. .. .. .. .. .. Land Inequality 82.0 82.0 82.0 82.0 82.0 82.0 82.0 82.0 82.0 Food Price Inflation .. .. .. .. .. .. .. .. .. Irrigation 27.1 28.7 29.6 31.4 32.0 43.5 63.3 63.0 58.6 Cereal Yield .. .. .. .. .. .. .. .. .. Fertilizer Consumption 5.3 24.4 55.2 134.7 221.0 406.8 538.8 706.2 1111.4 Renewable Water per Capital .. .. 6844.0 .. .. .. .. 3263.0 .. Food Trade Balance (% GDP0 -2.2 .. 12.5 12.1 .. .. .. .. .. Agricultural Capital per Worker (thousands, $1995) .. .. .. .. .. .. .. .. .. Roads, goods transported (million ton - km) .. .. .. .. .. .. .. .. .. Railways, goods transported (million ton - km) .. .. .. .. .. .. .. .. 1682.0 Transport .. .. .. .. .. .. .. .. 1682.0 Domestic credit to private sector (% of GDP) 14.8 12.4 8.2 5.6 .. .. .. .. ..

98
Appendix Item 6: Compilation of Socioeconomic Indicators of ODC Countries (Contd.)
Yemen
Indicator 61-65 66-70 71-75 76-80 81-85 86-90 91-95 96-2k 01-05 Per Capita Income ($2000) .. .. .. .. .. 455.8 454.6 511.8 534.3 Population in Million 5.6 6.1 6.7 7.7 9.2 11.2 13.9 16.9 19.7 Rural Population Share 89.8 87.6 85.8 84.2 82.4 80.1 77.4 75.3 73.5 Employment in Agriculture .. .. .. .. .. .. .. 54.1 .. Population Growth Rate 2.1 1.7 1.9 3.2 3.9 3.9 4.6 3.3 3.1 Fertility Rate 8.4 8.4 8.5 8.6 8.6 8.1 7.4 6.7 6.0 Investment (free of aid) .. .. .. .. .. 6.3 15.4 19.9 20.2 One Dollar Poverty .. .. .. .. .. .. 3.4 15.7 .. Two Dollar Poverty .. .. .. .. .. .. 19.9 45.2 .. Secondary School Enrollment .. .. .. .. .. .. .. 32.7 .. Estimated Household Income Inequality 48.3 49.4 54.8 48.9 43.1 42.9 42.9 42.9 42.9 Food Gini .. .. .. .. .. .. 15.8 .. .. Malnutrition (Height to Age) .. .. .. 57.7 33.7 .. 44.1 48.2 53.1 Malnutrition (Weight to Age) .. .. .. 55.7 30.4 .. 34.5 42.1 45.6 Undernourishment .. .. 54.0 .. 39.0 .. 34.0 36.0 37.5 Food Expenditure Share 61.1 61.1 61.1 61.1 61.1 61.1 61.1 61.1 61.1 Food Price Elasticty .. .. .. .. .. .. .. -0.3 .. Land Inequality .. .. .. .. .. .. .. .. .. Food Price Inflation .. .. .. .. .. .. .. .. .. Irrigation 16.1 17.7 19.0 19.4 20.4 21.1 26.7 28.9 31.4 Cereal Yield 776.9 791.2 847.1 935.4 727.6 905.5 1023.2 1022.0 864.8 Fertilizer Consumption .. 1.1 14.5 63.1 114.2 117.7 90.8 95.5 93.3 Renewable Water per Capital .. .. 586.0 .. .. .. .. 226.0 .. Food Trade Balance (% GDP0 .. .. .. .. .. .. -9.7 -9.8 -6.6 Agricultural Capital per Worker (thousands, $1995) .. .. .. .. .. .. 3.0 .. 3.0 Roads, goods transported (million ton - km) .. .. .. .. .. .. .. .. .. Railways, goods transported (million ton - km) .. .. .. .. .. .. .. .. .. Transport .. .. .. .. .. .. .. .. .. Domestic credit to private sector (% of GDP) .. .. .. .. .. 6.1 5.1 4.5 6.9

99
Appendix Item 6: Compilation of Socioeconomic Indicators of ODC Countries (Contd.)
Palestine
Indicator 61-65 66-70 71-75 76-80 81-85 86-90 91-95 96-2k 01-05 Per Capita Income ($2000) .. .. .. .. .. .. 1274.4 1400.9 1031.0 Population in Million .. .. .. .. .. 2.0 2.2 2.7 3.4 Rural Population Share 53.1 47.9 42.5 38.7 35.9 33.2 30.6 28.9 28.4 Employment in Agriculture .. .. .. .. .. .. .. 13.2 14.5 Population Growth Rate .. .. .. .. .. .. 3.9 4.3 4.0 Fertility Rate .. .. .. .. .. .. 6.1 5.3 4.8 Investment (free of aid) .. .. .. .. .. .. 20.1 21.6 -9.4 One Dollar Poverty .. .. .. .. .. .. .. .. .. Two Dollar Poverty .. .. .. .. .. .. .. .. .. Secondary School Enrollment .. .. .. .. .. .. .. 76.8 85.9 Estimated Household Income Inequality .. .. .. .. .. .. .. .. .. Food Gini .. .. .. .. .. .. .. 12.8 .. Malnutrition (Height to Age) .. .. .. .. .. .. .. 7.3 9.9 Malnutrition (Weight to Age) .. .. .. .. .. .. .. 4.1 4.9 Undernourishment .. .. .. .. .. .. .. 12.0 16.0 Food Expenditure Share .. .. .. .. .. .. .. .. .. Food Price Elasticty .. .. .. .. .. .. .. .. .. Land Inequality .. .. .. .. .. .. .. .. .. Food Price Inflation .. .. .. .. .. .. .. .. .. Irrigation .. .. .. .. .. .. .. .. .. Cereal Yield .. .. .. .. .. .. .. .. .. Fertilizer Consumption .. .. .. .. .. .. .. .. .. Renewable Water per Capital .. .. .. .. .. .. .. .. .. Food Trade Balance (% GDP0 .. .. .. .. .. .. .. .. .. Agricultural Capital per Worker (thousands, $1995) .. .. .. .. .. .. .. .. .. Roads, goods transported (million ton - km) .. .. .. .. .. .. .. .. .. Railways, goods transported (million ton - km) .. .. .. .. .. .. .. .. .. Transport .. .. .. .. .. .. .. .. .. Domestic credit to private sector (% of GDP) .. .. .. .. .. .. .. .. ..