Embed Size (px)
Citation preview

2010
© 2011 U.S. Highbush Blueberry Council
World Blueberry Acreage & Production
February, 2011
By Cort Brazelton Brazelton Ag Consulting

2008 World Blueberry Acreage & Production Report Page 2 of 51
© 2011 U.S. Highbush Blueberry Council
Cort Brazelton
Brazelton Ag Consulting
TABLE OF CONTENTS
Introduction ....................................................................................................................................................... 3
Methods and Objectives ............................................................................................................................... 4
Themes for 2010 .............................................................................................................................................. 6
North America .................................................................................................................................................. 6
South America................................................................................................................................................. 17
Europe ................................................................................................................................................................ 25
Mediterranean & North Africa ................................................................................................................ 32
Southern Africa .............................................................................................................................................. 34
The Pacific ........................................................................................................................................................ 36
Asia ...................................................................................................................................................................... 38
Global Highbush Blueberries ................................................................................................................... 42
Global Wild/Lowbush Blueberries ........................................................................................................ 45
Global Crop: Highbush and All Wild Blueberries Combined .................................................... 46
Predictions: Review and Trends .............................................................................................................. 47
Conclusions ...................................................................................................................................................... 49

2008 World Blueberry Acreage & Production Report Page 3 of 51
© 2011 U.S. Highbush Blueberry Council
Cort Brazelton
Brazelton Ag Consulting
Introduction
After a corrective period spanning nearly two years in the blueberry business, coupled with a
worldwide economic recession, the blueberry industry came back to life with renewed purpose and
direction in 2010. Since the downturn began in 2008, the year for which the previous version of this
report is published, virtually all of the additional fruit produced has been shipped and sold in the fresh
market. With these significant diversions to fresh, a light wild crop and successful movement of
frozen inventory, processed prices rebounded as global demand for frozen and processed blueberries
continued to grow. Overall, the Southern Hemisphere with Chile in the dominant position, had a
good 09/10 season and the 10/11 season has gone reasonably well thus far without considerable
problems. Contained in this document is extensive data on acreage and production for 2010
(southern hemisphere data is for 2009/10 unless otherwise indicated). This year‟s report will review
the industry‟s events of the last two years in detail, reference more distant history, examine key drivers,
discuss trends and, to the best of the author‟s ability, attempt to predict what we might expect as
participants in this increasingly global blueberry industry in the future.
Around the world, established growing regions are under pressures to professionalize as the crop
moves from its niche position to that of a commodity in demand year-round. New regions are leaving
infancy, providing glimpses of their future potential. Many challenges lie ahead from possible buyer
black-lash against a return to high frozen prices, climate change, product quality issues, food safety
concerns, new regulations, higher demands on shelf-life and shipping characteristics, higher quality
expectations, more informed buyers, and pending production increases just to name a few. There are
many new opportunities as well. Whole new regions of the world are awaking to consume blueberries;
new varieties are making it possible not only to produce in new geographies but to improve grower
economics and consumer experience everywhere, while many new products utilizing blueberries
continue to be rolled out onto the shelves. Most contributors to this project expressed enthusiasm,
optimism, excitement and passion for an increasingly dynamic industry.
Disclaimer Regarding Data Contained in this Report: Quantifying exact commercial acreage and
production for every growing region is not a realistic undertaking for this project. Without a doubt
there are regions with commercial acreage and production that have been neglected in this report and
the acreage and production figures provided vary widely from very accurate to simplistic best guesses
from individuals and parties active in those regions. The data and analysis presented in this document
is therefore not intended to portray precise snapshots of what is in the ground and what was
produced, but rather to draw attention to trends, both macro and micro in scale in order to achieve a
better understanding of where the blueberry industry has been, where it is today and ultimately to
speculate as to where it is going.
Many public and private sources of information and intelligence were utilized to compile the
information delivered in this publication. Industry leaders from around the world anonymously
contributed significant time, energy and their valuable insights to help build the body of information
and intelligence presented here. In many cases, commonalities in the communications with
contributors lead to the clear development of the trends outlined in this report. I would like to extend

2008 World Blueberry Acreage & Production Report Page 4 of 51
© 2011 U.S. Highbush Blueberry Council
Cort Brazelton
Brazelton Ag Consulting
my gratitude to the people who took the time to make these significant contributions that provide
much of the content of this document. Special thanks to Nancy Bauer at Northwest Visuals who
played a key role in framing and designing the formats for both the presentation and report for this
project. Special thanks to Fall Creek Farm and Nursery and its customer base for their support and
contributions. Thank you to all the individuals who invest their time, year after year, and share their
information and insights for this and previous reports.
Methods and Objectives
Methods:
Data Collection, Intelligence, Sources: Thank you!
Industry Organizations: Increasingly, growers, service providers and handlers from production
regions around the world are forming organizations to share information, promote consumption,
track production and address issues pertinent to their realities. Blueberry committees and
organizations can now be found on every continent and in most major growing areas. Data and
intelligence from these groups, both published and provided upon request, has been vital to the
generation of this report. Thank you to these organizations for their help and support and their
service to the industry.
Surveys: Targeted surveys were sent to industry members around the world to collect acreage data,
production data and intelligence. Rather than broadcasting a form survey as in previous years, more
time was spent targeting each source and the areas of their expertise. Thank you to the many
contributors who took the time to fill out surveys and provide their input.
Interviews with Industry Leaders: There is no replacement for person to person interviews.
Thanks to technology, extended interviews are now possible not only over the phone but in video
conference and through voice over internet protocol at low cost. The information shared in these
conversations and interviews were invaluable to improving the amount of key intelligence available to
the industry via this report. Care has been given to not disclose sensitive information that is meant to
remain private. Thank you to all who took their time to be interviewed and particularly their
willingness to be open and share their knowledge, experience and insights.
USDA FAS: In addition to helping US agricultural companies abroad, the FAS can be an excellent
source of information on what is happening abroad in an industry. Thank you to the FAS
contributors to the project.
Interviews with Buyers and End Users: Without the input of the final purchasers who deliver the
product to the consumer and have a significant impact on decisions regarding products, promotion
and pricing, to name a few, this report would be incomplete. As a result, buyers for supermarkets,
consultants in marketing, food companies, and other purchasers were interviewed to ensure their
perspective and input was included. Special thank you to those who help get our product to
consumers and a willingness to take the time to share insights.
2008 World Blueberry Acreage & Production Report Page 5 of 51
© 2011 U.S. Highbush Blueberry Council
Cort Brazelton
Brazelton Ag Consulting
Consumers: Though not performed on an organized level in consumer research groups and
consumer attitude surveys, this author made a continuous concerted effort during frequent travels in
North America and abroad to discuss and interview regular consumers about their awareness,
opinions and interest in blueberries. Their responses corresponded surprisingly well with the
experience of those involved on the supply side of the business in the market.
Format
The format for this report will compartmentalize sections by geography and conclude with a global
overview. Each section will evaluate geographies within a standard format:
Review: A written review of the data for region‟s previous season
Production and Acreage: Tables on its production and acreage data in the 2009/10-2010 season –
All data will be in acres and million lbs.
Summary: A brief summary of the events of the season and/or overview of the region to date
Drivers: Bullets on the major drivers in the region‟s blueberry industry (demand, markets, technology,
economics, positioning, opportunities)
Trends: The general trends for the geography looking to the future
Note on North America and Chile Sections: The largest blueberry industries in the world are in the United States and
Chile. Special attention will be given to intelligence shared by industry contributors on the events of the last 24 months in
the “Summary” sections for each of these regions.
Drivers: Categories
Demand and Market(s)
What are the market and demand realities that fuel the activity in the region(s)? What are the
underlying drivers for the demand? Are there new markets? What are the established tendencies of
existing markets?
Technology
Is new technology changing the supply side dynamics of the business? Is there a need for a new
technology to improve economics, quality or affect the outcomes? How is technology being
integrated in to the supply chain from the farm to the final sale?
Economics
How are macroeconomic events impacting the industry in a region and its participants? What are the
economic realities dominant on the micro level within the industry? How are a country‟s economic
policies affecting its domestic industry? What are the standout financial and economic themes driving
the business? What realities most affect producer, vendor and handler costs?

2008 World Blueberry Acreage & Production Report Page 6 of 51
© 2011 U.S. Highbush Blueberry Council
Cort Brazelton
Brazelton Ag Consulting
Geography
Where is the industry located geographically and how does that impact its business potential? How
does a region‟s geography impact climate, timing, quality and market access?
Themes for 2010
Rapid Growth Creates Unique Challenges: After years of breakneck industry growth, this theme
stands out. The faster an industry grows, the more it tends to underperform for various reasons.
The Blueberry Industry is Going Global: Production and consumption are expanding around the
world. Much of the growth in production in new areas is being driven by demand growth in new
places.
New Consumers Now a Major Driver of Demand: Historically, much of the consumption
increase was attributed to existing blueberry consumers eating more fruit, now there is a clear
additional trend towards more people beginning to eat blueberries.
Drive towards Professionalism and Scale: The biggest winners during the downturn and in the
current upswing have been the larger and increasingly professional run operations.
Repositioning and Re-tooling in Established Regions: As the competition increases, the industry
grows and professionalizes and the market becomes more discerning, leading growers in established
regions are renovating their businesses with new varieties, new technology, better infrastructure and
ultimately pursuing greater efficiency, productivity and quality.
Fresh Dominates: Since the downturn in 2008, the vast majority of the production increase has been
diverted to the fresh market.
Renewed Growth Potential in Processed: Having picked-up in 2010, the processed market looks
poised for growth. Many new products using blueberries were developed in the last decade but have
been held back when securing supply proved difficult. With increased production coming on, food
companies are now finally willing to try rolling out the new products. In North America and around
the world, the markets for frozen, IQF, and products using blueberries is growing. The landscape of
today‟s processed market and industry show hope of the potential for supply growing while meeting
renewed demand.
North America
Review:
Between 2008 and 2010 North America‟s estimated acreage grew from 95,607 to 108,791 Acres, a
total of 13,184 additional acres and a 13.8% increase over 2 years (NA1 & NA2). Clearly acreage has
continued to grow rapidly in North America, though not quite at the rate of the preceding years where
planted acreage increased 10-20% annually. As of 2010, North America now has over 100,000 planted
acres and over 57% of the world‟s blueberry acreage (see Global section). The Western and Southern

2008 World Blueberry Acreage & Production Report Page 7 of 51
© 2011 U.S. Highbush Blueberry Council
Cort Brazelton
Brazelton Ag Consulting
States remain the fastest growing regions with 7,765 acres added to the West and 3,950 added in the
South. Mexico has been growing at a high rate though from a low acreage adding an estimated 857
acres since 2008 (NA1 & NA2). Standouts for production in 2010 included the State of Georgia
growing from 31 in 2008 to 56 million pounds in
2010, while North Carolina, Oregon, Washington
and British Colombia also saw significant
increases in production (NA4). Also noteworthy
is the North American production increase from
415.8 million lbs to 491.3 million lbs with the vast
majority of the total increase shipped fresh since
2008. Between 2008 and 2010 the industry saw
an increase in fresh diversion from 229.4 to 303.0
million lbs while in process, a mere increase from
186.4 to 188.3. Over the course of two years, the
industry witnessed an increase of 75.5 million lbs, virtually all of which was shipped fresh (NA4 &
NA5). Since the downturn in the processed market, fresh diversion and consumption has grown at
incredible rates. In the following sections are tables and charts outlining these data and a summary of
recent events and pertinent information and intelligence.
Production and Acreage: (Denominated in Millions of Pounds)
Please note, all production and acreage data in this report are provided in pounds and acres.
For metric references, there are approximately 2.47 acres in a Hectare and 2.204 pounds per
Kilogram.
North American Acreage Growth; 2010 Crop (NA1)
NORTH AMERICA Acreage 2010 Production
GROWTH 2005 2007 2008 2010 Fresh Process Total
British Columbia 13,000 17,500 18,300 21,020 56.00 34.00 90.00
Washington 2,815 3,982 5,678 8,820 12.00 30.00 42.00
Oregon 4,410 5,516 6,234 7,458 25.80 27.50 53.30
California 2,370 3,949 5,120 5,790 27.00 1.00 28.00
Western 22,595 30,947 35,332 43,088 120.8 92.5 213.3
Michigan 18,500 19,300 21,200 22,750 49.50 49.50 99.00
Indiana 850 850 900 950 2.70 1.30 4.00
Others 1,055 1,275 1,300 1,500 1.90 - 1.90
Midwest 20,405 21,425 23,400 25,200 54.1 50.8 104.9
North America Acreage Distribution
Western39%
Midwest23%
Northeast10%
Southern27%
Mexico & Central America
1%

2008 World Blueberry Acreage & Production Report Page 8 of 51
© 2011 U.S. Highbush Blueberry Council
Cort Brazelton
Brazelton Ag Consulting
NORTH AMERICA Acreage 2010 Production
GROWTH 2005 2007 2008 2010 Fresh Process Total
New Jersey 7,500 7,900 7,960 8,120 32.00 8.00 40.00
New York 1,000 1,050 1,100 1,200 2.20 0.10 2.30
E. Canada 1,230 1,150 1,200 1,260 3.80 0.10 3.90
Nova Scotia - 300 300 300 1.00 - 1.00
Northeast 9,730 10,400 10,560 10,880 39.0 8.2 47.2
Florida 1,800 3,200 3,450 3,950 15.00 0.80 15.80
Arkansas 350 530 550 550 0.50 - 0.50
Miss./Louisiana 2,140 2,500 3,300 3,850 3.00 4.50 7.50
Georgia 7,500 9,120 11,000 12,800 36.00 20.00 56.00
North Carolina 5,500 6,000 6,200 6,800 27.50 11.50 39.00
Texas 875 950 1,000 1,050 1.50 - 1.50
Others - - - 450 0.60 - 0.60
Southern 18,165 22,300 25,500 29,450 84.1 36.8 120.9
Northern Mexico 60 180 260 295 0.75 - 0.75
Southern Mexico 120 350 530 1,350 4.20 - 4.20
Guatemala - 15 25 27 0.05 - 0.05
Mexico & Cen. Am. 180 545 815 1,672 5.0 - 5.0
North America 71,075 85,617 95,607 110,290 303.0 188.3 491.3
By Region: North American Acreage Growth; 2010 Crop (NA2)
NORTH AMERICA Acreage 2010 Production
GROWTH TOTALS 2005 2007 2008 2010 Fresh Process Total
Western 22,595 30,947 35,332 43,088 120.8 92.5 213.3
Midwest 20,405 21,425 23,400 25,200 54.1 50.8 104.9
Northeast 9,730 10,400 10,560 10,880 39.0 8.2 47.2
Southern 18,165 22,300 25,500 29,450 84.1 36.8 120.9
Mexico & Cen. Am. 180 545 815 1,672 5.0 - 5.0
North America 71,075 85,617 95,607 110,290 303.0 188.3 491.3

2008 World Blueberry Acreage & Production Report Page 9 of 51
© 2011 U.S. Highbush Blueberry Council
Cort Brazelton
Brazelton Ag Consulting
North American Production Growth (NA3)
NORTH AMERICAN PRODUCTION GROWTH
1995 1997 1999 2001 2003 2005 2007 2008 2010
Western 56.4 55.4 74.9 86.6 81.2 95.1 162.6 163.6 213.3
Midwestern 70.8 75.5 72.8 71.5 63.0 75.1 93.6 114.1 104.9
Northeastern 33.0 33.8 35.8 45.9 55.2 70.2 54.8 60.7 47.2
Southern 35.4 30.0 43.6 41.9 46.2 61.6 45.9 75.2 120.9
Mexico & Central Am. 0.0 0.0 0.0 0.0 0.0 0.2 1.0 2.2 5.0
Total Production 195.6 194.7 227.1 245.9 245.6 302.2 357.9 415.8 491.3
North American Production & US Comparison: 2008 vs. 2010 (NA4)
NORTH AMERICA PRODUCTION
2008 Production 2010 Production
Fresh Process Total Fresh Process Total
British Columbia 40.00 35.00 75.00 56.00 34.00 90.00
Washington 6.50 23.50 30.00 12.00 30.00 42.00
Oregon 18.00 26.60 44.60 25.80 27.50 53.30
California 13.00 1.00 14.00 27.00 1.00 28.00
Western 77.5 86.1 163.6 120.8 92.5 213.3
Michigan 45.00 65.00 110.00 49.50 49.50 99.00
Indiana 2.30 1.50 3.80 2.70 1.30 4.00
Others 0.30 - 0.30 1.90 - 1.90
Midwest 47.6 66.5 114.1 54.1 50.8 104.9
New Jersey 46.00 8.00 54.00 32.00 8.00 40.00
New York 2.20 0.10 2.30 2.20 0.10 2.30
E. Canada 3.00 0.10 3.10 3.80 0.10 3.90
Nova Scotia 1.00 0.25 1.25 1.00 - 1.00
Northeast 52.2 8.5 60.7 39.0 8.2 47.2
Florida 9.00 - 9.00 15.00 0.80 15.80
Arkansas 1.50 - 1.50 0.50 - 0.50
Miss./Louisiana 1.90 1.80 3.70 3.00 4.50 7.50
Georgia 16.00 15.00 31.00 36.00 20.00 56.00
North Carolina 20.00 8.50 28.50 27.50 11.50 39.00
Texas 1.50 - 1.50 1.50 - 1.50
Others - - - 0.60 - 0.60
Southern 49.9 25.3 75.2 84.1 36.8 120.9

2008 World Blueberry Acreage & Production Report Page 10 of 51
© 2011 U.S. Highbush Blueberry Council
Cort Brazelton
Brazelton Ag Consulting
NORTH AMERICA PRODUCTION
2008 Production 2010 Production
Fresh Process Total Fresh Process Total
Northern Mexico 0.50 - 0.50 0.75 - 0.75
Southern Mexico 1.60 - 1.60 4.20 - 4.20
Guatemala 0.10 - 0.10 0.05 - 0.05
Mexico & Cen. Am. 2.2 - 2.2 5.0 - 5.0
North America 229.4 186.4 415.8 303.0 188.3 491.3
North American Production & Use Comparison by Region: 2008 vs. 2010 (NA5)
NORTH AMERICA 2008 Production 2010 Production
PRODUCTION Fresh Process Total Fresh Process Total
Western 77.5 86.1 163.6 120.8 92.5 213.3
Midwest 47.6 66.5 114.1 54.1 50.8 104.9
Northeast 52.2 8.5 60.7 39.0 8.2 47.2
Southern 49.9 25.3 75.2 84.1 36.8 120.9
Mexico & Cen. Am. 2.2 - 2.2 5.0 - 5.0
North America 229.4 186.4 415.8 303.0 188.3 491.3
Summary:
North America continues to be the dominant player in the global blueberry industry (see Global
sections). Due to its significance in both the global fresh and processed markets and the significant
shifts of the last year, detailed attention will be given to the events of the 2010 North American
season.
In 2010 North America saw a particularly dynamic year with surprises for some and disappointment
for others. Below is a recount of the North American season.
A Complicated Spring
The beginning of the North American spring season was more condensed than other years. The early
crop was delayed across the board in 2010. From Florida and Georgia all the way to the San Joaquin
Valley of California, the industry experienced the frustration of a late start. Further complicating
matters, production was amassed into a few weeks in the mid to late spring windows. With a strong
North Carolina crop more or less on time and late California and Georgia deals meeting up with an on
time New Jersey harvest, June saw a record crop beating every previous month with an estimated 8.5
million pint-flat equivalents (near 80 million lbs). 2010 marked the first year that the month of June
out produced the month of July, thus the catch phrase, “June is the new July” echoed throughout the

2008 World Blueberry Acreage & Production Report Page 11 of 51
© 2011 U.S. Highbush Blueberry Council
Cort Brazelton
Brazelton Ag Consulting
industry. Growers and Marketers struggled in the late spring and early summer months to make sense
of compressed volumes, a less than ideal supply curve and significant fresh diversion amidst uncertain
processed prices.
This was a difficult season for many growers in the Central Valley of California. With difficulties in
forecasting and a late, albeit somewhat short crop, California‟s growers and many sellers trudged
through some very tough weeks. 2010 was not a
bad season for all growers in the Golden state
however with good pricing for the early coastal
crop and excellent performance from the new
early season varieties, particularly Snowchaser and
Springhigh, across the state. With its challenges in
cost of production, water availability and distance
from the east coast market, many California
growers are evaluating their options to diversify,
lower costs, and broaden the shoulders of their
season as the seek to sustain and grow.
Growers in the southeastern states faced similar market conditions though they are not facing the
same structural challenges as California. As stated above, Georgia, Florida and North Carolina put a
great deal of fruit into the market in overlapping windows. Many growers claimed to be 3 and even 5
weeks late compared to the previous year. After weeks with only a trickle of fruit moving through the
fresh market, the wave of product from multiple states came together to fill the produce shelves in late
May. These heavy fresh volumes moved surprisingly well, especially considering the low quantities
that preceded it in a March and April with high prices and low consumption. Fresh consumption
went from miniscule to massive in a matter of 2 weeks and prices remained sufficient for most
growers to continue picking.
The standout region in the southeastern US in 2010 was Georgia, which has now exceeded the
production of any other state in the South with 56 million pounds. It is now the third largest
production region by tonnage after B.C. and Michigan. The growth has happened fast and much of it
has been in older varieties, particularly older Rabbiteye varieties, which are proving a challenge to
market and meet elevating consumer expectations. Some contributors expressed concern that a
substantial portion of what has been planted in the South in recent years, as in other growing regions,
may not remain competitive without further investment in different varieties and additional field
modifications. With the challenges that rapid growth brings aside, the State of Georgia in a few short
years has grown exponentially and come to command a strong position in the spring deal in North
America.
In the state of North Carolina there was much more planting activity going on over the last 2 years
than reflected in the acreage growth in the table above (NA1). This is primarily due to a trend starting
in a number of longer established regions – replanting and repositioning for the future. The actual
figure of new acres for North Carolina is likely over 1,000 new acres though there are only an
North America Acreage Increases
0
20,000
40,000
60,000
80,000
100,000
120,000
1995 1999 2001 2003 2005 2007 2008 2010

2008 World Blueberry Acreage & Production Report Page 12 of 51
© 2011 U.S. Highbush Blueberry Council
Cort Brazelton
Brazelton Ag Consulting
estimated 600 more acres than 2 years ago. A major driver for this replanting is shifting in to better
varieties to meet the cost structure and market needs of the future. Today the primary variety targeted
for change out is Croatan, historically the mid season Southern Highbush variety of the deal. With the
introduction of the plastic clamshell and a more discerning consumer and buyers, varieties whose
quality issues were once tolerable are now obsolete and not acceptable.
Although the 2010 spring had its challenges, there was a notable silver lining. Fresh volumes shipped
out of southeast increased considerably without significant changes in pricing relative to the previous
year. Average returns remained strong well above cost. The May-June volumes in particular were
substantial and were sold and consumed at acceptable prices. Much of the Southeastern Rabbiteye
crop was sold on the fresh market keeping the process market clean for the summer Northern
Highbush deal with New Jersey in the lead.
Recovery in the Process Market
The frozen market surged back to health in 2010 with demand and pricing likely to hold strong well
through 2011. This turnaround was not anticipated in the gloom of the preceding winter. After
record movement month after month from the winter through the spring, inventories were low by
summer and demand was high. Two years of prices significantly below recent history to buyers and
consumers, significant diversion to an attractive fresh option and new products in the processed
markets kept consumption growing through the industry downturn and the global recession.
Another key factor that played a major part in this upturn is the light lowbush crop in 2010, down well
over 40% from 2008 (see Wild/Lowbush section). Low wild blueberry volumes left the doors wide
open for Highbush to meet the renewed processed demand for blueberries in 2010. Although
inventories were lower than anticipated going into the summer months and the wild crop was light,
clear processed prices to packers and growers did not emerge until late July, by which time much of
the Northern Hemisphere had shipped fresh. This lack of clarity about processed prices limited
diversion to the freezer during peak season. Growers generally opted for the greater certainty of the
fresh option which has left inventories low and pushed frozen prices up significantly through the
winter of 2010/11.
Also worth noting is the entrance of China and the greater Pacific Rim as a major net importer and
consumer of frozen blueberries. China, South Korea and other Asian markets played pivotal roles in
North America Fresh Production by Region North America Process Production by Region
WesternMidwestern
Northeastern
Southern
Mexico & Central
America
0
50
100
150
200
250
300
1995 1997 1999 2001 2003 2005 2007 2008 2010
Western
MidwesternNortheastern
Southern
Mexico & Central America
0
50
100
150
200
1995 1997 1999 2001 2003 2005 2007 2008 2010

2008 World Blueberry Acreage & Production Report Page 13 of 51
© 2011 U.S. Highbush Blueberry Council
Cort Brazelton
Brazelton Ag Consulting
absorbing 2009/10 frozen inventory and present an exciting export markets for future. These new
growth markets are particularly exciting for growers with a process focus in the West.
The Summer Fresh Season
North Americans consumed more fresh blueberries than ever before in 2010. Commitments made
early to retail programs in large packs at attractive prices combined with excellent quality helped drive
consumption to new highs. Pricing held steady through July, even after Independence Day, and
continued to rise from the mid season peak.
The western states added over 75 million pounds over 2 years since 2008 with the overwhelming bulk
of the additional fruit being shipped fresh. In the Pacific Northwest, the origin of most of the west‟s
increase, the new varieties Draper and Liberty were particular standouts this year as new fields began
to enter mature production. Draper‟s large firm berries, concentrated ripening and efficient, low cost
of harvest drew attention from the Pacific Northwest to Michigan. The quality of Liberty‟s mid-late
season fruit stood out as well, particularly in Oregon where the plant seems to perform particularly
well. Processed volume in 2008 vs. 2010 was almost stagnant, playing a major role in the rise in prices
and the low inventories going in to the winter months.
A standout in the Pacific Northwest in 2010 is the growth of Washington State. In 2010 the state of
Washington‟s acreage, for the first time, exceeded that of Oregon‟s making it the second largest region
by acreage in the west after B.C. Central and eastern Washington began to exert influence as well in
2010 representing now over 1/3 Washington State‟s planted acreage. Distinct from the western
growing regions of Oregon, Washington and B.C., many „east side‟ growers are large vertically
integrated operators in tree fruit or large independent growers of scale. With noteworthy exceptions,
the focus of most growers in the Yakima and Colombia basin is fresh while that of the average „west
side‟ grower tends to be more on process with an option for fresh. Although the winters are hard in
the high desert region, the long growing season, cool nights and warm days help growers put out an
excellent product. The dry climate with lower disease pressure has led to a great deal of organic
production as well in the region. The other rapid growth activity in the Evergreen State is occurring in
the northwestern corner of the state across the border from B.C. Due to high land prices, the lack of
available quality blueberry soils, pressure from urban development and other challenges, there is
increasing movement of B.C. blueberry farmers into Whatcom and Skagit counties along the border.
This “B.C. crossover” is generating significant new acreage, changing the nature of the Washington
deal and contributing to the State‟s rapid growth.
New Jersey had a challenging season in 2010 due to disruptive rains in the Hammonton area during
the late season and challenges in labor availability to harvest the crop. Primarily for these reasons,
Jersey growers did not harvest their entire crop and the region actually has lower production than the
2008 figure. Interestingly, a portion of the labor shortage in New Jersey is being attributed to the
growth of Georgia‟s blueberry industry. With a large and growing crop producing into the month of
July with Rabbiteyes, New Jersey growers are concerned that pickers will stay on longer in Georgia
thus creating a labor shortage in New Jersey. Although New Jersey acreage is not growing
considerably, there is a great deal of replanting, field improvement and new variety adoption going on.
2008 World Blueberry Acreage & Production Report Page 14 of 51
© 2011 U.S. Highbush Blueberry Council
Cort Brazelton
Brazelton Ag Consulting
As land prices for good blueberry soils are high, as much as $25,000 per acre or more, and availability
limited, most growers are seeking to increase the productivity and quality of existing acres. As a result,
although New Jersey‟s acreage is not anticipated to increase significantly in the coming years, though
an increase in production is expected.
Michigan had a slightly smaller crop in 2010 although volumes stayed close to the 100 million lb mark.
More notable is the even split between fresh and frozen in 2010 (NA4). As in other regions, including
traditional process geographies, Michigan moved a large percentage of its crop fresh amidst ambiguity
around process prices. As in New Jersey, labor is a continuing concern though it was sufficiently
available for Michigan growers in 2010. Returns on the Michigan crop varied considerably for
Michigan growers and the marketing of the fresh crop is becoming more dispersed. The crop in
Michigan is becoming more predictable due installation of frost control in many fields. As in other
mature growing regions, production is becoming more consolidated on a percentage basis as large
farming operations increase in size. The leasing of small and medium sized farms to larger operations
is becoming more common and the adoption of professional growing practices, particularly among
the large scale growers, will likely lead to higher average yields in the coming years.
Pricing for late season fruit rose through September and October with volumes not arriving from
Argentina until late October. Fruit volumes continued to decline by mid August across North
America and the September and October months remain more underserved than even the spring
months. The Elliott variety continues to account for the vast majority of late season fruit from North
America and is saleable at higher prices as options remain few.
Alternatives to Elliott are beginning to attract considerable attention in some growing regions both in
new late season northern Highbush varieties like Liberty and Aurora and higher quality new late
season Rabbiteyes like Ocklockonee. Growers in the US and Canada producing late season fruit will
maintain a freight, proximity and production advantage over foreign competitors though Argentina is
not the only region with long term potential to compete in the late window.
What about Mexico?
Mexico is coupled with Central America in the tables due to its production dynamics and climate,
Mexico will clearly be a major player over time in the North American market. Mexico is already an
established supplier of fresh raspberries and both fresh and processed strawberries. In blackberries,
Mexico controls majority market share of the fresh market for 7-8 months of the year. After over a
decade of slow trials and scattered larger scale efforts, the Mexico blueberry industry is finally
beginning to materialize. Although the industry is still very young and undeveloped, the potential of
blueberries in the country is becoming clearer. Most of Mexico‟s blueberry crop today is produced in
the winter months from late December through March and is based on one public variety.
Establishing a competitive position will take time, but Mexican growers are innovative and
resourceful. As new varieties become available and ongoing horticultural trials yield results, the rate of
planting may increase. If Mexico does indeed grow as quickly as some anticipate there is potential for
a repeat of the historical trends of rapid growth bringing underperformance. The history of
blueberries is full of areas that overheat and plant too fast, making critical mistakes in variety selection,

2008 World Blueberry Acreage & Production Report Page 15 of 51
© 2011 U.S. Highbush Blueberry Council
Cort Brazelton
Brazelton Ag Consulting
field preparation, site selection, infrastructure design - these fields have chronically underperformed in
many areas. Some of these trends are definitely occurring again in Mexico. Mexico, as has been seen
in so many other crops, tends to be full of surprises. One of note is Mexican domestic demand for
blueberries.
North America: Looking Ahead
Considering the downturn in both the blueberry business cycle and the global economy, 2010 marked
a significant improvement on the previous 2 years. This was not an excellent season for everyone,
however, and challenges from food safety and labor needs to increasing volumes and aggregate cost of
production increases pose challenges. Also worth noting is the surprisingly low average per acre
productivity in many regions. As the industry matures, there are clear trends which indicate
competitive advantage for vertical integration, professionalization and operations of scale, especially in
the more competitive production windows and regions.
Beyond the blueberry business, questions remain about the long term impact of macroeconomic
disruptions in North America on the purchasing habits of consumers and access to capital of business.
If process prices rise significantly in 2011 and 2012, there is fear among process industry leaders of a
repeat in buyer backlash and reformulations just when end users begin to believe that they could
access the berries needed to develop their products and go to market strategies. Volumes during peak
months will likely continue to increase making crop estimates, planning and coordination all the more
important. Such discipline and planning will be critical to ensure the returns that growers need to be
sustainable and profitable while delivering the pricing and quality that keeps consumers coming back.
Throughout the blueberry supply chain world, this report‟s contributors have expressed concern that
many of the farming practices, post harvest systems and varieties common in North America‟s
blueberry industry today are not aligned with what the market wants for the future. What will happen
to this fruit and how those choices affect the market and consumption is a major question to be
answered in the coming years. Countering these concerns is a great deal of optimism that the future
will be bright for the North American Blueberry industry with good planning and a hands-on
approach to the challenges faced. After one of the most challenging periods in the modern history for
the home of the blueberry industry, North America‟s blueberry industry faces a new chapter offering
both complex challenges and exciting opportunities to achieve new levels of growth and success.
Drivers:
Market: Domestic consumption sustaining in existing consumptions regions, growing in new markets
like the Southwest
Export Markets: Heavy demand from Pacific Rim
High Return Marketing Windows: The early and late fresh deals continue to offer high returns
Health message: Remains strong at home and abroad and driving consumption

2008 World Blueberry Acreage & Production Report Page 16 of 51
© 2011 U.S. Highbush Blueberry Council
Cort Brazelton
Brazelton Ag Consulting
Finance: Access to capital for operations and capital investments was more limited between 2008 and
2010 forcing many companies to rely on their own cash, limiting growth and in some cases upkeep
Labor: Availability of labor is an increasing challenge in many regions, limited ability to harvest for
fresh and driving increased interest in mechanized harvest (though with limited success) for fresh
Process Market: Process market likely to return to health for growers in 2011 with demand and
pricing likely to hold strong.
Fresh Market: Movement has been significant and there remains room for more growth especially in
underserved market windows of the Spring and Early Fall.
Trends:
Consumption: People are eating more blueberries around the world
North American Market: North America is and will likely continue to be the largest global producer
meeting domestic and foreign consumption for the medium and long term
Room for continued growth: There appears to be considerable room both domestically and abroad
for growth in fresh and processed markets if pricing remains attractive
Fresh demand continues: Major movement into fresh likely to continue as consumption increases
New products create new demand: Increased product availability, particularly if pricing remains
reasonable, will continue to foster the introduction of new products using blueberries
Growing operations of scale: Consolidation, economies of scale, food safety, traceability,
predictability, and cost of doing business to marketers drive much of this need
Professionalization in farming practices, particularly in established growing regions
Low Yields: Many fields planted during the boom years are producing sub-par yields
Cost control: Dwindling margins pushing growers, large and small, to seek means to lower per
unit cost
Mechanized Fresh Harvest: Though not nearly as feasible as many hope with today‟s varieties and
technology, the development of systems to lower average harvest cost of the long term will be a
critical initiative within the industry.
Replanting: Some areas are replanting more rather than expanding acreage
Variety Chang-outs: Will be driven first and foremost by cost of growing and harvest and the market
demands of the future
Consolidation in Marketing over the Long Term: According to contributing industry experts, the
number of marketers may be reaching its peak and will perhaps decrease over the next 10 years.

2008 World Blueberry Acreage & Production Report Page 17 of 51
© 2011 U.S. Highbush Blueberry Council
Cort Brazelton
Brazelton Ag Consulting
Mexico will become a significant player in the next decade?
Late Spring Production is Growing Rapidly: “June is the new July”, perhaps “May will be the
new June”?
Filling the Troughs: Plantings targeting early Spring, late Summer and early Fall are likely to increase
in North America as growers seek higher fresh returns.
Maintaining Gains, Growing Opportunities: The industry has proven that it can move huge
volumes of berries at decent to good prices with good planning and marketing, even in a recession. If
record breaking volumes can sell in June than July, can the same be done in August? Most months of
the year still have very limited production compared to the high volume months. Expect growers to
seek to lower costs during peaks and broaden the shoulders into lower volume months.
Optimism: North American contributors are on average highly optimistic about long-term the future
South America
Review:
Between 2008 and 2010 South American
acreage increased by 4,297 acres from 39,703
acres to an estimated 44,000 acres (SA1). This
is a much lower rate of increase over 2 years
than the breakneck growth earlier in the
decade with over 6,000 acres planted between
2006/07 and 2008 and the estimated 15,000
acres planted between 2004/5 and 2007
(SA1). This is nonetheless remarkable
considering the challenging years experienced
in South America since the slowdown. Most notable is the fact that the overwhelming bulk of this
planting has occurred in Chile, most of it in the central and southern growing regions, in fact
Argentina‟s managed acreage actually decreased as some farms were abandoned and fell into disrepair.
South America‟s growth is indeed remarkable
having grown from an estimated 2,500 acres
in 1995 to 44,000 in 2010 (SA1). The focus
of the industry remains on fresh production
for the export market although there is a
growing process alternative. The data below
captures the 2009/10 season for South
America and previous years, summary and
diagrams follow.
South America Acreage Increases
South America Acreage Distribution
0
10,000
20,000
30,000
40,000
50,000
1995 1999 2001 2003 2005 2007 2008 2010
Chile73%
Argentina22%
Uruguay4%
Peru0%
Colombia0%

2008 World Blueberry Acreage & Production Report Page 18 of 51
© 2011 U.S. Highbush Blueberry Council
Cort Brazelton
Brazelton Ag Consulting
Production and Acreage:
South American Acreage Growth; 2009/10 Crop (SA1)
SOUTH AMERICA GROWTH TOTALS
Acreage 2010 Production
2005 2007 2008 2010 Fresh Process Total
Chile 11,120 22,700 26,908 32,250 109.51 14.00 123.51
Argentina 6,919 9,400 10,900 9,500 24.64 2.00 26.64
Uruguay - 1,450 1,620 1,850 2.68 0.33 3.01
Peru - 40 60 80 0.03 - 0.03
Brazil - 50 200 300 0.20 - 0.20
Colombia - 10 15 20 0.01 - 0.01
South America 18,039 33,650 39,703 44,000 137.1 16.3 153.4
South America Production &US Comparison: 2007/08 vs. 2009/10 (SA2)
SOUTH AMERICA PRODUCTION
2008 Production 2010 Production
Fresh Process Total Fresh Process Total
Chile 68.14 19.40 87.54 109.51 14.00 123.51
Argentina 22.20 3.00 25.20 24.64 2.00 26.64
Uruguay 1.60 0.60 2.20 2.68 0.33 3.01
Peru 0.03 0.01 0.04 0.03 - 0.03
Brazil 0.12 0.01 0.13 0.20 - 0.20
Colombia 0.01 0.01 0.02 0.01 - 0.01
South America 92.1 23.0 115.1 137.1 16.3 153.4
Summary:
Chile
2009/10: This biggest standout event for Chile in the last 2 years is the 60% increase in fresh
production between the 2007/08 season and the 2009/10 season, even with disruptions discussed
below. An increase of this scale was not to be for a number of reasons, one which drew international
attention for months. There remained arrival issues during the first half of the season which were
later worsened. The great defining event of the 2009/10 season in Chile was the Earthquake (8.8 on
the moment magnitude scale) and the tremors and aftershocks that followed. There was a 7.5
earthquake in March 2010 as well. The earthquakes cut off the season early and disrupted exports
considerably for at least 3 weeks. Many coolers did not have electricity and this loss of cold chain

2008 World Blueberry Acreage & Production Report Page 19 of 51
© 2011 U.S. Highbush Blueberry Council
Cort Brazelton
Brazelton Ag Consulting
cause additional quality issues. Delays in exports from the south of the country due the earthquake
caused significant peaks in product flow in the later part of the season. Labor became an even larger
issue than normal when many pickers were reticent to go to the fields to harvest after the natural
disaster. As a result of the earthquake, there were both quality issues and a much shorter crop than
anticipated. With the spring crop in North America late in 2010, late season Chilean fruit achieve
good prices and growers in the south did particularly well. Though quality and pricing in 2009/10 was
generally better than the previous year for Chile, unsettling events made the 2009/10 Chile deal very
confusing with programs disrupted, quality problems and unpredictable volumes. Since the
earthquake insurance companies have reportedly been supportive and recovery has been fairly upbeat.
2010/11: The 2010/11 Chilean season had a timely start and has thus far been smoother. With the
season 50% complete in mid January and moving faster than 2009/10, the Chilean season looked to
be a satisfactory year, particularly with good frozen prices, keeping weaker fruit out of the fresh
market, and currency interventions improving the exchange rate. Quality has generally been
acceptable and movement good. Accumulated volumes up to early January 2011 were close to on par
with forecasted volumes though some weeks saw significant variances between the forecast and the
actual exports. The exchange rate, amidst an ever appreciating peso, is becoming a major issue for
growers and exporters this year. Almost 40% of the Chilean crop was exported when the peso was
particularly high in advance of government efforts to devalue the peso with the $12 BN intervention
by the central bank to bring the peso closer to the 460-490 pesos/USD range. As Chile continues to
suffer from “Dutch disease” (the inflation of a nation‟s currency value due to high natural resource
values or high FDI which undermines the competitiveness of a country‟s exports), largely due to the
high value of commodities like copper. There are concerns about the impact of high exchange rates,
inflation, increasing real costs and the availability of labor.
Processed Diversion: The 2010/11 season will likely see much higher diversion to process as export
requirements are becoming more disciplined among many companies and fruit that has concerns
raised about its exportability is often being sent to IQF. There are still limits in processing and storage
capacity and only a limited number of companies actively engaged on a professional level in the
processed business.
Varieties: Varieties are becoming more important for grower success in Chile and much of what is
planted in the country is of older varieties not suited for mechanized packing and long boat trips in
Controlled Atmosphere. Much of this move to newer and improved varieties is also linked to the
labor issue as having high yield and easy to pick fruit is not only critical for quality and returns but
attracting sufficient picker to harvest. If a field does not offer an opportunity for a picker to make
competitive wages, it often is not picked on time which can lead to additional quality issues. Timing,
specifically producing earlier and later into the season continues and this effort is naturally closely tied
to varieties.
New Markets: Also noteworthy for Chile is the opportunity for growth in exports to Asia,
particularly China. China is increasingly coming up in conversations among Chile‟s blueberry leaders.
To quote an industry leader and use another example, “the Chilean industry sent 50% of their cherries

2008 World Blueberry Acreage & Production Report Page 20 of 51
© 2011 U.S. Highbush Blueberry Council
Cort Brazelton
Brazelton Ag Consulting
to China this year; 5 years ago this was only 10%”. Securing open access to China‟s market, beyond
Hong Kong, will be critical for the long term health of Chile‟s blueberry industry.
Potential Impact of Mexico: Although the role of Mexico is not yet completely clear and the
Mexican industry in its infancy, there is increasing awareness in Chile about the growth in Mexico.
This has not stopped growers from moving forward with their plans, but it has certainly peaked
interest. The example of raspberries and other crops, once major fresh exports of the country and
now largely displaced by Mexico, is naturally on the minds of many.
The Chilean Blueberry Committee: Another significant recent development has been the advent
of the Chilean Blueberry Committee. The committee has played a key role by helping to coordinate
information regarding export volumes and production and crop trends consequently making decisions
in package sizing, production and market predictions more transparent. Growers have access to this
information which is helping their decision making process and increasing trust as they work with
their marketers and make decision on pack sizes, fresh vs. process diversions and other key decisions.
Exporters have better information and intelligence to run their programs and execute effectively while
simultaneously being able to engage in more functional discourse and decision making with growers.
The Chilean Blueberry Committee has played a major role in helping all active parties in Chile be more
effective with better information and intelligence and has provided respectably accurate data on
volumes.
There are other important trends well underway in Chile. Over the last two years many of the larger
exporting companies have restructured their sourcing strategy to focus on consolidating production
among fewer suppliers in an effort to improve quality and traceability and lower their cost of doing
business. This led to the release of many small and some medium sized growers from these programs,
leaving them to seek new channels for the export of their product. As a result of this shake up in the
industry, the number of new exporters and, to a lesser degree, new importers have swelled.
The high costs to growers and marketers of rejections and quality issues have led to a significant shift
in the industry. Forward looking growers are improving their harvest and post harvest systems to
improve the treatment of their product and are investing in new varieties with better export quality
fruit. Meanwhile, leading marketers are increasingly focusing on growers of scale able to meet
certification and export quality requirements while lowering their risk and costs.
To summarize the input of contributors regarding farming dynamics, the key areas of concern that will
impact the profitability of the Chilean grower in the future are as follows:
Export Systems: Post harvest and shipping systems to ensure the best arrival possible
Labor: Varieties and management systems that attract pickers with the opportunity to make money
with high yields and good harvest efficiencies
Product Quality: Long shelf life with good firmness, size and flavor

2008 World Blueberry Acreage & Production Report Page 21 of 51
© 2011 U.S. Highbush Blueberry Council
Cort Brazelton
Brazelton Ag Consulting
Alternatives to Fresh: The development of a process alternative to maintain product quality in the
fresh market and to give growers opportunity to capture the residual value of their non export fruit
Chile, having undergone years of rapid growth and the challenges that come with it, is now going
through a corrective period that is painful for many in the industry. Those best suited to adapt to the
growing pressure to professionalize, lower cost and improve quality are the operations of scale, the
vertically integrated companies and other well capitalized entities eager to adapt and adopt new
technologies and opportunities.
Argentina and Uruguay
A description of the 2009 season provides an ample outline of the challenges these industries face,
particularly Argentina. Argentina‟s season began a little later than usual. Tucuman, traditionally the
early region in northeast of the country, battled frosts and lost much of its crop, particularly the early
fruit. Volumes were light throughout the first weeks due to freezes and a cool spring throughout the
country. November 2009 brought considerable rains which disrupted harvest and caused additional
product loss and making considerable volumes of fruit unreliable for export. In Concordia, Entre
Rios Region to the North of Buenos Aires province, the rains were followed by exceptionally high
temperatures bringing with it additional quality problems. Unfavorable weather events, the large
percentage of varieties unsuitable for reliable export and the logistical challenges due to lack of
infrastructure and phytosanitary restrictions made the 2009/10 season a difficult one. For these
reasons and other challenges, Argentina‟s production in the fields has increased over the years, but the
volume exported has not grown substantially. Also noteworthy is the distribution of Argentina‟s
volumes on the marketing side with the sales of its 20+ million pounds highly fractionalized passing
through more exporters and importers than there are during periods of significantly higher volumes
elsewhere. In 2009/10 there were more than 70 handlers in the Argentine deal. Amidst the
challenges facing growers and investors in Argentina, over 500 Hectares (over 1,200 acres) have been
abandoned or left idle and uncared for.
Final production figures for the 2010/11 season will not arrive in time for the completion of this
report, but early indications are that the exported crop volumes increased this last season, possibly by
more than 25% in Argentina and over 80% for Uruguay. Product quality was better than the previous
year due to better weather during harvest. To date, grower reactions to returns have not been positive
across the board however with many concerned that their combined cost of production, picking and
packing of one kilo of fruit continues to exceed their per-kilo returns in many weeks, especially when
incurring the cost of air freight.
On the processed side of the business, there is some growth in frozen and IQF diversion. The frozen
interest stems from existing frozen companies involved in other crops in Argentina and Chilean
companies active in or diversifying in to frozen berries. Although Argentina will have some growth in
processed blueberries in the coming years, Chile looks more likely to make a notable contribution.
With all the challenges in this growing region it is easy to miss the bright spots in Argentina and
Uruguay. Much of Uruguay, though not of the scale of Argentina, is doing quite well and sustaining

2008 World Blueberry Acreage & Production Report Page 22 of 51
© 2011 U.S. Highbush Blueberry Council
Cort Brazelton
Brazelton Ag Consulting
gradual growth. Uruguay is the oldest democracy in Latin America and a highly functional place to do
business. Uruguay‟s blueberry industry grew more slowly and thus fewer mistakes were made during
establishment. In Argentina, there are professional operations which are re-tooling to ensure that they
have the right horticultural management, the right varieties and the best post harvest and export
systems to sustain and be profitable in the long term. Argentina presents an excellent example of one
of the themes outlined in the introduction of this report: Rapid Growth Creates Unique Challenges -
the faster an industry grows, the more it tends to underperform. There remains plenty of hope and
opportunity in Argentina and Uruguay but there will continue to be a correctional period that will not
be pain-free for many.
Peru
Peru remains in the early stages of development in blueberries. Although Peruvian growers have
entered many industries rapidly and on a considerable scale like asparagus and citrus to name a few,
success has yet to be sufficiently demonstrated to validate significant investment in blueberries.
Though there are notable differences, the conditions indicate a need for similar horticultural systems
to those used in Mexico. There are many serious farming and exporting companies in Peru and
interest in blueberries continues to grow. Up to this point most activity has been driven by Chileans
and pioneering Peruvians. Failure to sign the UPOV convention (the international treaty on
Intellectual property in plant material and breeders‟ rights) and a long history of not respecting
Intellectual property in Agriculture has prevented Peru and its growers from gaining legal access to
newer low chill genetics. Another challenge for the foreseeable future is the need to fumigate any fruit
exported to the US due to a Medfly quarantine.
Brazil
Though not booming on the scale of other major developing economies in the crop, Brazil is
emerging both as a potential producer and a consumer of blueberries. With its mainly tropical climate
and breadth of agricultural investment options, cultivation of the crop is not being adopted as rapidly
as in neighboring countries. Growing blueberries in low latitudes, especially in tropical climates is very
difficult and the lack of defined cultural programs and proven success presents challenges to growth.
Most activity in blueberry production is occurring in the south of the country in Rio Grande do Sul,
Parana and Santa Catarina where there is some chill and a possibility that Southern Highbush and
Rabbiteyes can be grown in more traditional cycles, particularly in the higher elevation areas. Limited
legal access to competitive genetics in the country has also kept growth at a slow pace. Unlike its rate
of domestic production, Brazil‟s interest in consuming blueberries is growing.
Colombia
Activity in Columbia remains restricted to trialing though some of the trials have moved to a
commercial trial stage. As elsewhere, development of production in Colombia is, at least initially,
being driven be domestic demand. This demand is both in the tourism industry and in the larger cities
with educated cosmopolitan consumers. Colombia actually has domestic Vaccinium species that have
long been a popular local fruit. The introduction of Highbush blueberries offers an opportunity to
2008 World Blueberry Acreage & Production Report Page 23 of 51
© 2011 U.S. Highbush Blueberry Council
Cort Brazelton
Brazelton Ag Consulting
grow the local consumption of blueberries and over the long term a potential export. Due to the ultra
low latitude of Colombia, the difficulty in introducing competitive genetics as the country is not a
UPOV signatory, and time needed to develop effective horticultural systems, Colombia is likely many
years away from significant development.
South America: Looking Ahead
Change for Chile
Industry leaders with an eye on trends not only in Chile but the greater industry at large are predicting
a significant change in Chile‟s role as a counter-seasonal blueberry supplier in the coming decade. At
the core of this trend is the pending gradual rise of Mexico as a blueberry supplier in the same market
window as Chile‟s. With its market proximity and potential to product quality fruit within a day‟s
truck ride of the market, many predict Mexico will come to dominate many of the months previously
served by the Southern Hemisphere in North America. This gradual shift is not necessarily bad news
for Chile, in fact this change corresponds with another significant shift in global consumption. It is
highly likely that the growth of Mexico‟s supply of blueberries to North America will coincide with the
growth of consumption in the other major Northern Hemisphere markets – Asia and Europe with
Chile well positioned to supply.
Corrections in Argentina and Uruguay
Argentina and Uruguay are most likely to continue to experience a tumultuous corrective period.
They will also, like Chile, face growing competition. Unlike Chile, however, Argentina and Uruguay
will be harder pressed to compete as the quality and volume of late season fruit from the Pacific
Northwest and Michigan improves, the north of Chile increases its presence and new regions like Peru
and Mexico seek to enter Argentina‟s window as well. As in all mature growing regions, the winners
will be those with the highest quality and the lowest per unit cost aligned with the best delivery system.
Achieving this will be hard for many growers in these two countries. Competition will be fierce and it
will likely take many years yet to see the winners rise to the top.
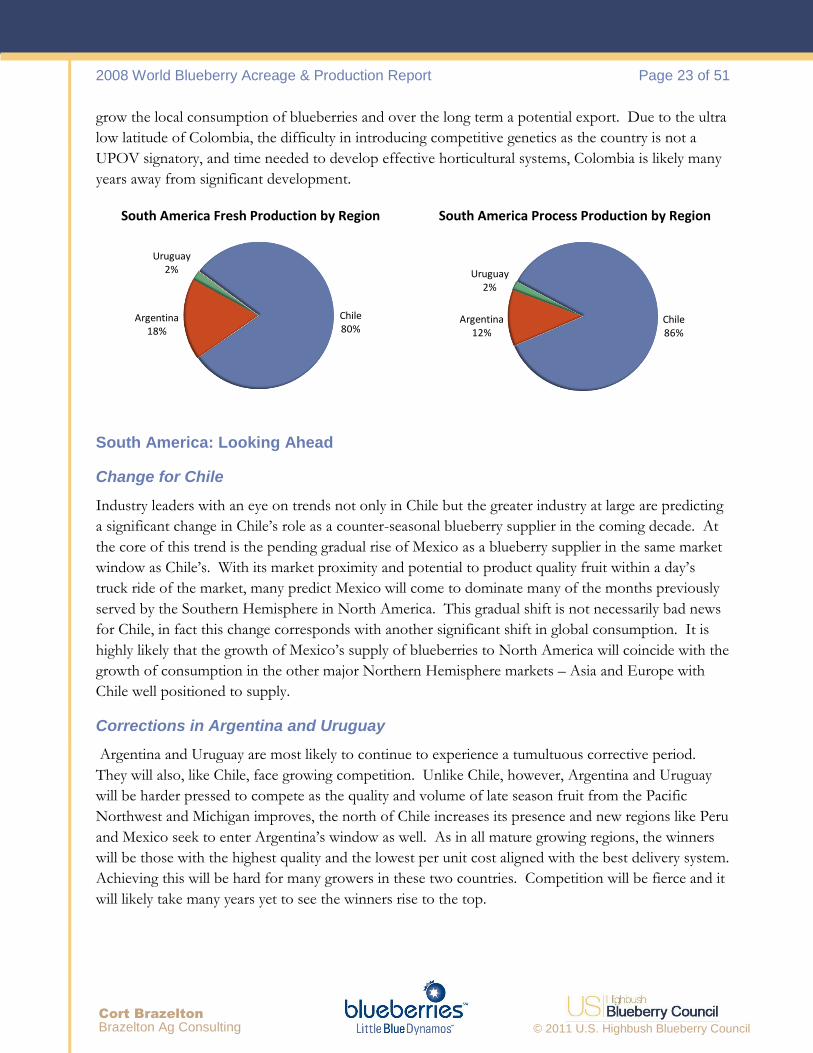
South America Fresh Production by Region South America Process Production by Region
Chile80%
Argentina18%
Uruguay2%
Chile86%
Argentina12%
Uruguay2%

2008 World Blueberry Acreage & Production Report Page 24 of 51
© 2011 U.S. Highbush Blueberry Council
Cort Brazelton
Brazelton Ag Consulting
The New Regions: Peru, Brazil and Colombia
The rates of planting maintained during the boom of the 1990‟s and early 2000‟s is unlikely to be
repeated by the new regions in South America. With its extensive infrastructure for exporting fresh
produce, large established farming companies, and a culture of rapid adoption of new crops Peru is
the most likely to establish a position in blueberry production and export of the 3 new players.
Numerous Peruvian growing companies are in active commercial trialing stage now. The
development of the Colombian industry is more likely to be gradual. Lastly, Brazil amidst its rapid
economic development appears to be on track to become a net consumer over time.
Drivers:
Market Maturation: Increasing volumes in most production windows is giving buyers the ability to
be more selective, creating winners and losers in the business
Geography: Northern Hemisphere consumption continues to grow, creating new market and
demand opportunity for counter seasonal fruit.
Macroeconomic Growth Brings New Challenges: Success in development is changing the
aggregate costs of key inputs and labor
Exchange Rate Economics: Currency policy, particularly the high Chilean peso, impacting terms of
trade and profitability back to the farm
New Markets: Growth in Asia is increasing demand for South American, especially Chilean fruit
Varieties: Many varieties are no longer suitable for today‟s post harvest, export systems and consumer
preferences.
Technology: Access to the best positions with maritime companies with good controlled atmosphere
management is becoming a competitive issue, benefiting large exporters
Logistics: Over the long term ocean freight in controlled atmosphere is the only low cost means of
exporting from South America.
Trends:
Growers seeking to lower cost and increase production as their per unit costs increase and returns
decline
Larger and Vertically Integrated Operations continue to maintain higher profits and are thus able
to continue reinvesting to professionalize operations
Labor Will be a Major Issue: Chilean, Argentina and Uruguayan growers will see higher labor costs
and availability challenges in the coming years and adaptation to this new reality will be critical for
success

2008 World Blueberry Acreage & Production Report Page 25 of 51
© 2011 U.S. Highbush Blueberry Council
Cort Brazelton
Brazelton Ag Consulting
Process: Processed diversion likely to increase in the 2010/11 season due to high prices and
widespread availability of fruit not suitable for export
Challenges for Argentina: Continued turbulence in Argentina due to poor cost/return ratio.
Argentina will likely undergo a protracted corrective period with big winners and losers.
Replanting will become commonplace in South America‟s established growing regions.
Variety Changes to 1) ensure good maritime arrivals and 2) secure much needed labor there will be a
change out to more productive varieties with better quality fruit to attract harvesters.
Post Harvest Systems and Varieties: Forward looking growers are improving their harvest and post
harvest systems to improve the treatment of their product and are investing in new varieties with
better export quality fruit.
The Chilean Peso: Macroeconomic trends indicate that the Chilean peso will remain high relative to
other currencies which will create challenges for the Chilean export industry. Cost of production and
export relative to returns will become more of a challenge, pushing the industry to increase yields,
lower costs, decrease shrink, increase efficiency, and maximize returns however possible.
Continued Growth in South America: Chile will likely continue to replant and increase acreage
while new regions will move from the trial to early commercial stage. Expanding global demand will
drive this growth.
Europe
Review:
European acreage growth has been much more metered in the last two years, growing from 18,038
acres in 2008 to an estimated 20,780 in 2010 (EUR1). With an increase of 2,742 acres, a majority
share of which was in the east, European acres have grown but not excessively (EUR2). The 2010
crop was up from 56.6 million lbs in 2008 at an estimated 81 million lbs (EUR3&4). As will be
explored in the Summary below, European consumption has yet to take off on the mainland to the
degree it has in the UK, the absence of which has kept planting growing at a moderate rate.
European Acreage Increases 1995-2010 European Acreage Distribution
0
4,000
8,000
12,000
16,000
20,000
1995 1999 2001 2003 2005 2007 2008 2010
South & Western
19%
Central & Northern
39%
Eastern42%

2008 World Blueberry Acreage & Production Report Page 26 of 51
© 2011 U.S. Highbush Blueberry Council
Cort Brazelton
Brazelton Ag Consulting
The following sections provide updated data and intelligence regarding the European blueberry
industry and market.
Production and Acreage:
European Acreage Growth; 2010 Crop (EUR1)
EUROPE GROWTH
Acreage 2010 Production
2005 2007 2008 2010 Fresh Process Total
France 741 810 840 890 3.75 0.22 3.97
Spain 494 1,870 2,100 2,600 17.63 - 17.63
Portugal 99 320 330 480 2.42 - 2.42
South & Western 1,334 3,000 3,270 3,970 23.8 0.2 24.0
Austria - 100 110 125 0.60 0.11 0.60
Denmark - 50 50 60 0.28 0.03 0.30
Netherlands - 580 600 640 2.76 0.28 3.03
Germany 3,954 4,400 5,063 5,300 18.73 1.21 19.95
Ireland - 25 35 35 0.13 - 0.13
Italy 445 540 600 680 3.64 0.22 3.86
Sweden - 80 80 90 0.22 0.01 0.23
Switzerland - 50 50 55 0.20 0.10 0.30
UK 49 550 550 670 2.40 0.10 2.50
Central & Northern 4,448 6,375 7,138 7,655 28.9 2.1 30.9
Baltics - 250 290 335 1.10 - 1.10
Poland 3,954 6,700 6,900 7,800 13.84 9.91 23.75
Ukraine - 160 180 190 0.44 0.22 0.66
Romania - 100 120 130 0.42 - 0.42
Others - 120 140 160 0.09 0.09 0.18
Eastern 3,954 7,330 7,630 8,615 15.9 10.2 26.1
Europe 9,736 16,705 18,038 20,240 68.6 12.5 81.0

2008 World Blueberry Acreage & Production Report Page 27 of 51
© 2011 U.S. Highbush Blueberry Council
Cort Brazelton
Brazelton Ag Consulting
By Region: European Acreage Growth; 2010 Crop (EUR2)
EUROPE Acreage 2010 Production
GROWTH TOTALS 2005 2007 2008 2010 Fresh Process Total
South & Western 1,334 3,000 3,270 3,970 23.8 0.2 24.0
Central & Northern 4,448 6,375 7,138 7,655 28.9 2.1 30.9
Eastern 3,954 7,330 7,630 8,615 15.9 10.2 26.1
Europe 9,736 16,705 18,038 20,240 68.6 12.5 81.0
European Production & Use Comparison: 2008 vs. 2010 (EUR3)
EUROPE 2008 Production 2010 Production
PRODUCTION Fresh Process Total Fresh Process Total
France 2.20 0.23 2.43 3.75 0.22 3.97
Spain 9.20 - 9.20 17.63 - 17.63
Portugal 1.00 - 1.00 2.42 - 2.42
South & Western 12.4 0.2 12.6 23.8 0.2 24.0
Austria 0.40 0.10 0.60 0.60 0.11 0.60
Denmark 0.10 0.10 0.30 0.28 0.03 0.30
Netherlands 3.30 0.30 3.60 2.76 0.28 3.03
Germany 16.53 0.33 16.86 18.73 1.21 19.95
Ireland 0.05 - 0.05 0.13 - 0.13
Italy 3.30 0.10 3.40 3.64 0.22 3.86
Sweden 0.10 0.10 0.20 0.22 0.01 0.23
Switzerland 0.20 0.10 0.30 0.20 0.10 0.30
UK 0.65 - 0.65 2.40 0.10 2.50
Central & Northern 24.6 1.1 26.0 28.9 2.1 30.9
Baltics - - - 1.10 - 1.10
Poland 17.40 0.60 18.00 13.84 9.91 23.75
Ukraine - - - 0.44 0.22 0.66
Romania - - - 0.42 - 0.42
Others - - - 0.09 0.09 0.18
Eastern 17.4 0.6 18.0 15.9 10.2 26.1
Europe 54.4 2.0 56.6 68.6 12.5 81.0

2008 World Blueberry Acreage & Production Report Page 28 of 51
© 2011 U.S. Highbush Blueberry Council
Cort Brazelton
Brazelton Ag Consulting
Production & Use Comparison by Region: 2008 vs. 2010 (EUR4)
EUROPE ANNUAL 2008 Production 2010 Production
PRODUCTION Fresh Process Total Fresh Process Total
South & Western 12.4 0.2 12.6 23.8 0.2 24.0
Central & Northern 24.6 1.1 26.0 28.9 2.1 30.9
Eastern 17.4 0.6 18.0 15.9 10.2 26.1
Europe 54.4 2.0 56.6 68.6 12.5 81.0
Summary:
The entrance of mainland Europe, along with Asia, as a major consumer of blueberries is an eagerly
anticipated development in the blueberry industry. To date the UK continues to account for the
majority of consumption, but consumption elsewhere in the continent is growing. Blueberry
consumption on the mainland is centered primarily in Central and Northern European countries like
Switzerland, Denmark, parts of Germany,
Holland and Scandinavia. Urban centers in
Spain, the major spring producer, are beginning
to show signs of increased interest in
blueberries and there is renewed interest in
French supermarkets. Common feedback to
suppliers in the large markets of France,
Germany and elsewhere is that quality,
specifically flavor and aroma, of blueberries
must improve (along with price) for
supermarkets to promote and consumers to try the product and/or consume more frequently. Also
important to note is the dominant position of fresh consumption in Europe. Processed diversion,
although starting from a low reference point in
2008 at 2 million lbs, grew six-fold to 12.5
million pounds in two years, a very notable
development. The introduction of new
products using blueberries continues in
Europe, though not at the pace of North
America. European consumption and use of
blueberries has increased considerably in the
last decade. Historically, health research was a
major driver of consumption in the UK. Now
new health research on blueberries is emerging in Central Europe in particular, which has gained
considerable press coverage and may affect consumption. When considered together, these factors
indicate that there remains considerable room for growth and market development in Europe.
2010 Europe Fresh Production
2010 Europe Processed Production
South & Western
35%
Central & Northern
42%
Eastern23%
South & Western
2%
Central & Northern
16%
Eastern82%

2008 World Blueberry Acreage & Production Report Page 29 of 51
© 2011 U.S. Highbush Blueberry Council
Cort Brazelton
Brazelton Ag Consulting
South & Western Europe
Spain
The dominant volume player in the South and Western growing regions of Europe is Spain, currently
the leading supplier of spring fruit. Expansion has slowed in Spain due to increased costs, lower
returns and an emphasis on expanding into lower cost regions such as Morocco. Lack of availability
of competitive varieties for most growers has also kept many from investing in further expansion in
blueberries. Lamentably, there is increasing illegal propagation of protected varieties due to lack of
access among Spanish growers. With the variety Star unprotected in Europe, much of what is planted
is in this variety, resulting in a strong peak in May/June with limited volumes before and after. The
greatest concern for growers is cost of production and long term trends in Huelva and southern
growing regions is to seek lower cost systems for growing and shipping. Many growers in Spain are
keenly interested in growing Southern Highbush varieties with machine harvest potential during the
mid to late window to compete in the lower return periods of late May through June. Northern Spain
is also beginning to develop a focus on higher chill material to be shipped domestically and to the UK
and the rest of Europe.
Portugal
Though quite active during the early years when adopting blueberries in the 1990‟s and early 2000‟s,
Portuguese growers slowed their rate of growth in the latter half of the last decade. Much of this slow
down was due to a generational shift among blueberry growers and a slow-down in plantings by
outsiders seeking to take advantage of the maritime climate, light soils and diverse microclimates.
Very recently there has been renewed interest in blueberries in Portugal both driven by an upturn in
domestic consumer interest in the product and opportunities to leverage advantages in growing both
high and low chill blueberries.
France
France is a primary July producer in Europe with a production window more similar to western
Oregon and Washington. Though France represents enormous market potential with a sizeable
network of consolidated retailers, feedback from the French industry indicates that consumption will
not grow significantly in the highly developed country of 65+ million consumers until the flavor and
aroma profile of blueberries improves to meet the demands of the French palate. To quote a
respected French grower, “the French market will not be developed on the back of Duke”. Big fruit
with strong crunch but a light flavor that Americans enjoy is not sufficient to keep the French
consumer coming back for blueberries. Rather than Duke and Draper, varieties like Camellia and
Liberty are more likely to be favorites. Beyond basic education and awareness of blueberries, the
French market will not be more apt to take on aggressive blueberry consumption until varieties, post
harvest systems and distribution systems are such that their preferences are served.

2008 World Blueberry Acreage & Production Report Page 30 of 51
© 2011 U.S. Highbush Blueberry Council
Cort Brazelton
Brazelton Ag Consulting
Central & Northern Europe
Central and Northern European industries have continued to plant and grow despite concerns about
costs, availability of labor, limitations on farming tools available and other challenges that farmers face
growing intensive crops in developed Europe. Much of the plantings that have gone in are driven by
local markets and local consumption and the vast majority of plantings are focused on fresh.
Mainland Opportunity and Growth: As mentioned above, the UK remains the dominant market
for blueberries in Europe – both fresh and frozen – and its growers are primarily fresh focused. As
Polish production, concentrated between late July through late August and early September, increases,
UK growers are seeking to pick earlier in June and early July (“The French Window”) and store their
late fruit to sell after Poland is out. The first strategy is proving more effective than the second as the
market does not accept poor flavor and quality willingly. While the peak volumes in North America
are in June and July, Europe‟s peak is in August during the Polish season. Late June and July
production comes in smaller volumes from the UK, Benelux, France and Germany. Dutch blueberry
growers continue to occupy a lower cost position during the summer months by entering the market
with machine harvested fruit in the fresh market. An important note on Holland – the Netherlands
did not plant 500+ acres between 2008 and 2010 but rather previous reported figures have been
understated. A small portion of Dutch acres, estimated at 80, are committed to process while the
majority is fresh focused with some diversion to process. Quality issues with machine harvested fresh
fruit from Holland have been accused of depressing prices in the July period and is being held as the
culprit for July prices not being higher considering the lower volumes during that period. Growers in
the north of Italy have developed strong positions supplying quality fruit both to the growing
domestic demand of Italy and exporting to Switzerland, Austria, Germany and elsewhere. Italy,
though not a market the scale of France and Germany, is increasingly showing interest in blueberries.
Italians are eager to try new things and the awareness and popularity of blueberries is growing
throughout the urban centers of the country. Germany remains by far the largest player in the region
with over 5,000 acres. The most populous country with the largest market in Europe, Germans are
continuing to increase their consumption of blueberries and particularly eager to buy local product.
With over 7,500 acres in Central and Northern Europe, over 40% it planted in the last five years,
production will continue to increase. As most all of these countries present major potential markets,
hope predominates that year round consumption will grow with the increase of local production.
Eastern Europe
Poland
The single dominate player in Eastern Europe is Poland. Poland is also the only European growing
region with growers who make notable contributions to frozen and processed markets. The saying,
“August is the July of Europe” is a result of Poland‟s position as the largest producer and its peak a
month later than the summer producers in North America. Indeed, June and July are comparatively
light volume months. Planting has slowed down significantly this last year in Poland as production
grew, capital became increasingly difficult to access and demand stalled amidst the economic
downturn. Polish growers have historically been separated between growers who are GLOBALGAP

2008 World Blueberry Acreage & Production Report Page 31 of 51
© 2011 U.S. Highbush Blueberry Council
Cort Brazelton
Brazelton Ag Consulting
certified and those who are not. To access most western European markets, growers must have
GLOBALGAP certification. As growers seek the higher returns of the Western European markets,
many are getting certified and fewer are picking for the processed buyers. The other great divide
among Polish growers is in size. Poland consists of a handful of very large growers and a huge
number of very small growers. Many of these farms are managed by growers of limited resources.
This factor combined with the age of the fields, many less than 5 years old, and the extreme low
winter temperatures combined with spring frosts provides some explanation for the very low average
productivity in Poland. Polish production can vary significantly year on year depending on winter
temperatures and spring frosts. The weather leading into the 2009 season was mild leading to a large
crop while the winter of 2009/10 had cold snaps with temperatures of -30°C / -22°F which combined
with poor pollination weather lead to a lighter crop for 2010. Looking forward, growth in Poland will
likely be led by larger operations and growers who remain competitive will likely become
GLOBALGAP certified thus increasing market access.
Baltics
Growth in the Balitic regions has been lead by a group of sizeable family farming operations focused
on supplying both the eastern markets in Russia and major East European cities and to the Western
European market. In the maritime regions of the Lithuania and Latvia winters can be milder than
inner Poland and some farms are achieving good yields in the heavy peat soils.
Further Eastern Europe
As fresh and process production of Northern Highbush becomes more expensive in Western and
Central Europe, countries further east are reportedly gaining some attention as potential suppliers to
the growing markets in the Europe, Eurasia and the Middle East over the long term.
Drivers:
Market: Fresh consumption continues to account for most of Europe‟s consumption
Local Markets: The loca-vore movement in Europe is a strong driver for plantings, especially in the
most developed Central and Northern European countries.
Technology: Interest in machine harvesting for fresh is growing throughout Europe as costs
increase and labor is increasingly difficult to secure.
Economics: High costs of production pushing planting growth further East and South in pursuit of
lower production costs.
Trends:
Investment in Promotion: Continued efforts will be needed to growth the mainland European
market.
Spain: Growth in Spain is likely to focus on ultra early production and low cost mid to late Southern
Highbush production.

2008 World Blueberry Acreage & Production Report Page 32 of 51
© 2011 U.S. Highbush Blueberry Council
Cort Brazelton
Brazelton Ag Consulting
Acreage Growth in Europe is most likely to continue to move east and south in pursuit of lower
production and harvest costs.
Mediterranean & North Africa
Review:
Although in its infancy and very small by world standard, the Mediterranean and North African
industries have begun to grow both driven by export opportunities and in some cases more localized
consumption. Acreage nearly doubled from 2008 to 2010 from 355 to an estimated 672 acres with
Morocco leading the pack with approximately 450 acres (MNA1). Production has also started to
increase as young plantings mature bringing the 2010 crop to an estimated 2 million lbs (MNA1 &
MNA2). Below find the data, Summary and intelligence on the region.
Production and Acreage:
Mediterranean & North Africa Acreage Growth; 2010 Crop (MNA1)
MED. & N. AFRICA Acreage 2010 Production
GROWTH TOTALS 2005 2007 2008 2010 Fresh Process Total
Morocco - 170 180 450 1.76 0.02 1.79
Egypt - 20 25 35 0.09 0.01 0.10
Turkey - - 120 150 0.13 0.01 0.14
Israel - 25 30 35 0.10 - 0.10
Others - - - 2 0.10 - 0.10
Med. & N. Africa - 215 355 672 2.2 0.0 2.2
Mediterranean & North Africa Production & Use Comparison: 2008 vs. 2010
(MNA2)
MED. & N. AFRICA 2008 Production 2010 Production
PRODUCTION Fresh Process Total Fresh Process Total
Morocco 0.30 - 0.30 1.76 0.02 1.79
Egypt - - - 0.09 0.01 0.10
Turkey 0.50 - 0.50 0.13 0.01 0.14
Israel 0.01 - 0.01 0.10 - 0.10
Others - - - 0.10 - 0.10
Med. & N. Africa 0.8 - 0.8 2.2 0.0 2.2

2008 World Blueberry Acreage & Production Report Page 33 of 51
© 2011 U.S. Highbush Blueberry Council
Cort Brazelton
Brazelton Ag Consulting
Summary:
Morocco
As establishment, production and harvest costs in Spain increase, the move to producing in Morocco
continues. Much of this growth is not only in blueberries but strawberries, vegetables, tree fruit and
other products and often led by Spanish companies. Serious domestic operators are also growing
rapidly in Morocco. Blueberry activity in Morocco today is restricted to a couple of large scale private
developments and smaller scale trials by companies with limited variety options. One of the current
limitations on growth in Morocco is the lack of legal access for legitimate companies to competitive
genetics. As this situation changes, growth in Morocco for this and the reasons outlined above, will
likely accelerate. In the medium to long term Morocco will most likely be the primary supplier of early
spring fruit to the UK and European markets.
Egypt
Egyptian fruit production is dominated by a small group of very large vertically integrated grow-
packer-exporters. These companies have become major suppliers of high value produce to the UK
and European markets. Interestingly, much of the growth these companies are positioning specifically
to serve is not just in the traditional markets of Europe, but in the Middle East and Russia. All
blueberry activity in Egypt up to this point is in commercial trial stage. With low land, water and labor
costs, ample resources and an adaptable climate, Egyptian growing companies have the potential to be
low cost, high quality suppliers of scale over the long term. Also worth noting is the long term
potential of the Egyptian market with a population of 80 million people (roughly the population of
Germany) and a growing middle class. The impact of Egypt‟s revolution on the nascent industry
remains unclear at the time this report is being written.
Turkey
Having already assumed a significant position in table grapes, stone fruit and cherries, interest in
blueberries is now developing among Turkish growers. Domestically in Turkey, a developed country
of over 70 million people, a nascent boom in blueberry demand is underway as Turkish consumers
become aware of blueberries, their health benefits, flavor and convenience. With high duties on
imported fruit, prices for blueberries in Turkey are high and though there is extensive interest in
growing from small farmers to large agricultural corporations, the planted area remains relatively
limited.
Drivers:
Middle Eastern Market: Consumers in countries like Turkey, Saudi Arabia, UAE and Dubai are
increasingly demanding blueberries for the same reasons that drive consumption elsewhere.
Geography: Eastern Mediterranean countries are well located to supply Russia, the Middle East and
Europe in addition to becoming blueberry consumers.

2008 World Blueberry Acreage & Production Report Page 34 of 51
© 2011 U.S. Highbush Blueberry Council
Cort Brazelton
Brazelton Ag Consulting
North Africa: Low cost of production and harvest in North Africa will continue to attract local and
foreign investment in production.
Trends:
Morocco is on track to develop a position as Europe‟s low cost producer of quality Spring fruit.
Turkey could become a significant consumer of blueberries and may develop a domestic industry.
Southern Africa
Review:
Production in Southern African has grown gradually with an estimated 214 acres added since 2008,
most of which were planted in Republic of South Africa (SoA1). Production has grown moderately to
2.3 million lbs (SoA2). See below for details on the Southern African industry.
Production and Acreage:
Southern Africa Acreage Growth; 2010 Crop (SoA1)
SOUTHERN AFRICA Acreage 2010 Production
GROWTH TOTALS 2005 2007 2008 2010 Fresh Process Total
South Africa 740 800 900 1,120 2.10 0.20 2.30
Angola - 10 10 2 0.00 - 0.00
Zimbabwe - - - 1 0.00 - 0.00
Others - - - 1 - - -
Southern Africa 740 810 910 1,124 2.1 0.2 2.3
Southern Africa Production & Use Comparison: 2008 vs. 2010 (SoA2)
SOUTHERN AFRICA 2008 Production 2010 Production
PRODUCTION Fresh Process Total Fresh Process Total
South Africa 1.10 0.44 1.54 2.10 0.20 2.30
Angola 0.01 - 0.01 0.00 - 0.00
Zimbabwe - - - 0.00 - 0.00
Others - - - - - -
Southern Africa 1.1 0.4 1.6 2.1 0.2 2.3

2008 World Blueberry Acreage & Production Report Page 35 of 51
© 2011 U.S. Highbush Blueberry Council
Cort Brazelton
Brazelton Ag Consulting
Summary:
Republic of South Africa
For all intensive purposes, South Africa (RSA) has the only real blueberry industry in southern Africa.
Activity in Neighboring Angola and Zimbabwe consists solely of trials. Growing and exporting of
blueberries in South Africa is highly consolidated and focused on providing counter seasonal fruit to
the UK market and Mainland Europe. As RSA must compete with Argentina and Chile for most of
its season, the focus of most growers has been on market proximity, quality, leveraging its diverse
climates and growing conditions and vertical integration. Another interesting trend in RSA is the
small but expanding domestic market for blueberries. In recent years RSA has become not only a
counter seasonal exporter of blueberries, but an importer during the Northern Hemisphere season to
ensure year round supply to the domestic market. RSA faces some challenges today as an exporter as
its currency appreciates with investors seeking solace from the financial instability of the developed
world markets and buys South African bonds and the Rand. Putting the currency situation affecting
all exporters aside, RSA continues to show promise to develop as a smaller but competitive supplier of
Southern Hemisphere fruit and, over the long term, as a potential market.
Drivers:
South Africa’s Model: Cost effective production of quality counter seasonal fruit for Europe
The Rand’s value is increasing relative to the currencies of other exporting countries
Market: South African consumers are discovering blueberries.
Trends:
New Developments: There is potential over the long term for development in other southern
African countries
Growth in RSA is unlikely to expand rapidly due to costs and competition from other southern
hemisphere growing regions.

2008 World Blueberry Acreage & Production Report Page 36 of 51
© 2011 U.S. Highbush Blueberry Council
Cort Brazelton
Brazelton Ag Consulting
Asia & The Pacific
The Pacific
Review:
Acreage growth in the Pacific region has been limited in the last two years with roughly 200 additional
acres added bringing the total acreage just shy of 3,000 (Pac1). Production has grown however, nearly
doubling to 10 million lbs since 2008 in the region. Below is the overview of the Pacific blueberry
industry which essentially consists of New Zealand and Australia.
Production and Acreage:
Pacifica Acreage Growth; 2010 Crop (Pac1)
PACIFIC Acreage 2010 Production
GROWTH TOTALS 2005 2007 2008 2010 Fresh Process Total
Australia 1,384 1,450 1,470 1,530 5.70 0.90 6.60
New Zealand 1,050 1,290 1,290 1,450 2.00 1.50 3.50
Philippines - 10 10 2 - - -
Pacific 2,434 2,750 2,770 2,982 7.7 2.4 10.1
Asia & Pacific Acreage Increases 2005-2010 2010 Asia & Pacific Acreage Distribution
2010 Asia & Pacific Fresh Production 2010 Asia & Pacific Processed Production
Asia
Pacific
0%
20%
40%
60%
80%
100%
2005 Acres 2007 Acres 2008 Acres 2010 Acres
Asia 79%
Pacific21%
Asia 53%
Pacific47%
Asia 61%
Pacific39%

2008 World Blueberry Acreage & Production Report Page 37 of 51
© 2011 U.S. Highbush Blueberry Council
Cort Brazelton
Brazelton Ag Consulting
Pacifica Production & Use Comparison: 2008 vs. 2010 (Pac2)
PACIFIC 2008 Production 2010 Production
PRODUCTION Fresh Process Total Fresh Process Total
Australia 4.40 0.88 5.28 5.70 0.90 6.60
New Zealand 2.00 1.50 3.50 2.00 1.50 3.50
Philippines 0.01 - 0.01 - - -
Pacific 6.4 2.4 8.8 7.7 2.4 10.1
Summary:
Australia
The Australian blueberry industry continues to receive some of the highest fresh blueberry prices in
the world due to its restrictions on fresh imports. The majority of production is along the central and
northeast seaboard of the country where most growers manage Southern Highbush in evergreen
systems allowing them to produce from late winter (August) into early summer
(November/December). Varieties grown consist of privately owned genetics and public Southern
Highbush varieties and some Rabbiteyes which allow the season to continue once the Southern
Highbush are finished. Though limited, there is also high chill production in the far south of the
country and in Tasmania. Australia has some of the highest per capita blueberry consumption in the
world following American and English trends of consumption. The health message is firmly
entrenched and the Australian consumer is an avid purchaser of blueberries for the same reasons of
flavor, convenience, fun and health as in other established blueberry markets. Although Australia still
does not allow imports of fresh blueberries, frozen imports are allowed and Australia presents an
interesting opportunities for processors.
New Zealand
New Zealand (NZ) is both an exporter and a consumer of blueberries. During the 1990‟s and early
2000‟s NZ blueberries competed with Chile to service demand in North America and Europe. More
recently as Chilean production has exploded and NZ growth more cautious, the NZ industry has
turned to focus on primarily serving the Australia and NZ markets at home while developing a
premium niche position in the high end markets in Asia and the Middle East. Planting in recent years
has been limited and relegated primarily to the far south in pursuit of the late season market though
spring frosts have been a problem in some of these plantings. In the increasingly commoditized
markets in Asia, NZ fruit is finding it difficult to compete with Chilean product on price when there is
not a premium for quality. As a result of the Chilean competition, the strategy of many NZ operators
is to differentiate with high quality fruit, air freighted to the premium markets. NZ growers tend to be
highly innovative with some of the highest producing farms in the world and exceptional quality.
Target high end Asian markets include Singapore, South Korea, Kuala Lampur and other „tiger‟
markets. A major initiative underway for NZ as in other counter seasonal suppliers is an intensive

2008 World Blueberry Acreage & Production Report Page 38 of 51
© 2011 U.S. Highbush Blueberry Council
Cort Brazelton
Brazelton Ag Consulting
effort to gain direct access to the mainland Chinese market. With new consumers at home and abroad
to serve, many in the NZ industry are optimistic about the future though there is plenty of work to be
done.
Drivers:
Australian Market: Australia has some of the highest demand and per capita blueberry consumption
in the world following American and English trends of consumption.
Geography: The Pacific blueberry producers are well located to serve both domestic and Asian
demand
Asian Growth is creating strong pull for Pacific blueberries
Major efforts to open mainland China to New Zealand and Australian fresh fruit
Trends:
High Australian demand could drive frozen import growth from the Americas.
Asian demand will drive growth in Pacific production for counter seasonal fruit.
If mainland China opens to New Zealand and Australian fresh fruit imports potential for growth
will increase.
Asia
Review:
Asia‟s acreage more than doubled between 2008 and 2010 growing from 5,100 acres to an estimated
11,135 acres (AsA1). The bulk of this growth has been in China as investment in the crop, often
supported by provincial governments, increases. Production in Asia remains low with many young
fields and poorly established farms yet to contribute much volume. Estimated 2010 production was
12.4 million lbs. As indicated in preceding section, the rise of Asia as a consumer of blueberries is
beginning to be felt in major producing regions around the world.

2008 World Blueberry Acreage & Production Report Page 39 of 51
© 2011 U.S. Highbush Blueberry Council
Cort Brazelton
Brazelton Ag Consulting
Production and Acreage:
Asia Acreage Growth; 2010 Crop (AsA1)
ASIA Acreage 2010 Production
GROWTH TOTALS 2005 2007 2008 2010 Fresh Process Total
China 642 3,275 2,900 8,645 3.00 3.60 6.60
India - - 60 80 0.20 - 0.20
Japan 1,112 1,300 2,090 2,230 4.90 0.20 5.10
South Korea - 40 50 180 0.50 - 0.50
Asia 1,754 4,615 5,100 11,135 8.6 3.8 12.4
Asia Production & Use Comparison: 2008 vs. 2010 (AsA2)
ASIA 2008 Production 2010 Production
PRODUCTION Fresh Process Total Fresh Process Total
China 1.76 2.30 4.06 3.00 3.60 6.60
India - - - 0.20 - 0.20
Japan 4.00 0.05 4.05 4.90 0.20 5.10
South Korea 0.10 - 0.10 0.50 - 0.50
Asia 5.9 2.4 8.2 8.6 3.8 12.4
Summary:
A common thread among all contributors to this report is the belief that the growth in Asian demand
and consumption of blueberries will be immense over this next decade. From countries as small as
Singapore, growing markets like South Korea and Taiwan, the established consumption of Japan and
the behemoth that is China, the Asian market for blueberries and blueberry products is poised for
development. With widespread cultural traditions devotedly focused on health and beauty, blueberries
are a natural fit as incomes increase, awareness of higher value products like blueberries grow and the
desire to be healthy, age gracefully and enjoy desirable foods continues to grow. There will be
domestic production throughout Asia developed to meet the growing demand, but this production is
not likely to increase at a rate sufficient to meet the rates of consumption.
China
Potential of China: In many global industries today, China is the 10,000 pound Panda in the room.
In the case of blueberries, China is far off from being the gorilla in production, but the Chinese
consumer is fast on their way to being the gorilla in consumption. Serving this market will likely be a
major driver of growth for the Southern Hemisphere and the greater pacific region.

2008 World Blueberry Acreage & Production Report Page 40 of 51
© 2011 U.S. Highbush Blueberry Council
Cort Brazelton
Brazelton Ag Consulting
In just a few years, perceptions of China as a potential mega-producer and low-cost exporter of
blueberries have shifted to expectations of China becoming one of the world‟s largest consumers and
possibly net importers of blueberries. Currently, demand is highest in the large coastal megacities
though interest is quickly spreading to major urban centers throughout the country. With domestic
supplies limited (see date tables) and technical phytosanitary barriers to importing fresh berries, major
Chinese cities offer some of the highest prices for blueberries in the world. China played a major role
in helping move North America‟s frozen inventories of 2010. The greater openness to frozen imports
of blueberries is a notable opportunity today and, moving forward, for producers in the Americas in
particular. Western retailers like Carrefour, Wal-Mart and Tesco have established strong positions in
China as have numerous domestic and Japanese operators and the demand for high value produce is
growing. Unlike big developing markets like India where distribution and logistics can be a challenge
and the position of retail supermarkets is less dominant, China has a quickly maturing retail industry
poised for expansion in the sales of blueberries in fresh, frozen, juices and CPG products. If or when
efforts to gain access to the mainland fresh market are successful, countries allowed to export fresh
blueberries to China will be positioned to participated in what appears to be years of exciting market
growth.
Though China is unlikely to be a net exporter of blueberries any time soon let along meet domestic
demand, this does not mean that significant development on the production side is not underway.
Plantings are in the ground and many more on the way, now throughout the country in numerous
cases with local or provincial government support. As perishable logistics and cold chain can be a
challenge in many parts of China, there is considerable opportunity to produce fresh fruit in the
proximity of major urban areas. In pursuit of these and other opportunities there are now blueberry
developments in 12 major provinces. Jilin and Shandong provinces lead the pack with the first
focused on „cultivated‟ lowbush and half-highs in rows and the former in Northern Highbush.
Southern Highbush and Rabbiteye production in lower chill regions is beginning to pick up pace as
well. Most all varieties being grown to date are public and there are many reports of mix ups in fields.
Some patented varieties have leaked in to China but planting has only just begun. Another important
point worth noting is the difficulty in obtaining reliable data on actual acres/hectares planted. Many
blueberry projects are seeking government support which often incentivizes exaggerated reporting of
progress. Also worth noting is the low productivity of many fields and the weather challenges growers
face. To date there have been serious challenges in producing both Spring fruit and mid-late through
late season fruit. In the primary production regions of Shandong, Dalian and Jilin heavy rains prevent
the production of quality fruit from late July onwards. Challenges aside, Chinese blueberry production
will continue to grow and domestic product in some windows will become increasingly available.
India
After year of working through red tape, the USHBC in cooperation with Thomas J. Payne Market
Development have succeeded in securing access for fresh North American blueberries in India.
Current shipments have yet to consist of large volumes. With its massive 1 Billion+ population, a
large and growing middle and upper class, and an increasing number of highly educated people, India
represents and exciting market opportunity. Current reported planting in India consist of research

2008 World Blueberry Acreage & Production Report Page 41 of 51
© 2011 U.S. Highbush Blueberry Council
Cort Brazelton
Brazelton Ag Consulting
trials and dispersed small commercial plantings, mostly in the north of the country. Due to the strong
ties between the Punjab and the BC grower community, a number of the trials and projects reportedly
have connections with the industry there. Logistics and cold chain can be a challenge in India due to
the lack of infrastructure. As a result, domestic production for fresh product is likely to develop
locally to serve nearby urban areas. Frozen sales are most likely to be successful in concentrated
cosmopolitan areas where freezer storage is more widely available. Contributors have commented
that the “easiest way in” to India is most likely with shelf stable packaged products with blueberries if
distribution and consumption is to increase significantly in the short to medium term.
Japan
Since growing from a small niche market in the 1990‟s to the substantial center of consumption it is
today, Japan has developed both domestic production and a large business for imports. Much of this
growth in awareness of blueberries and the growth in consumption in Japan, with its health conscious
aging population, were spurred by the development work of the USHBC and WBANA. As the
majority of Japan‟s growing regions are lower chill and humid, its domestic production consists
primarily of Southern Highbush. This puts most of Japan‟s domestic production, which receives
preference when available, in the spring time. As the summer time is generally the rainy season,
exports from the northern hemisphere have the greatest opportunity to ship fresh product to Japan in
the Summer through the early Fall.
In fresh sales Japan is now a competitive market for imported berries, primarily from North America
and Chile. The high end market for IQF frozen blueberries has continued to grow though not at the
pace experienced during the boom years, much of it in small manageable retail packs. Use of high end
frozen product also continues in yogurts and other packaged and baked goods.
Another interesting piece of information sheds light not only on the growth of Japan in the blueberry
business but the growth of the greater Asian market. With its long established international trading
houses, Japan is becoming an exporter to Asia or, more correctly, a “re-exporter”. Multiple sources
have expressed a belief that much of the frozen and fresh fruit being shipped to Japan is not being
consumed domestically but rather repacked and shipped to other Asian countries, especially China.
Although this is not the lowest cost delivery system by any means, there is clearly sufficient demand
and pricing to rationalize the efforts. Blueberry consumption has now moved far beyond Japan in
Asia and the Japanese are rushing to serve it.
South Korea
Though it does not represent the same level of behemoth market opportunity like its neighbor China,
South Korea‟s demand for volumes of blueberries is booming. Phytosanitary restrictions on fresh
imports remain unresolved, but frozen movement to South Korea is growing rapidly. Although there
is increased interest in domestic production, development has been limited up to this point. South
Korea exhibits traits of a substantial net importer for years to come.

2008 World Blueberry Acreage & Production Report Page 42 of 51
© 2011 U.S. Highbush Blueberry Council
Cort Brazelton
Brazelton Ag Consulting
Drivers:
Asian demand and consumption of blueberries is anticipated to be immense over this next decade.
Widespread cultural traditions devotedly focused on health and beauty make blueberries a natural fit as
incomes increase, awareness of higher value products like blueberries grow and the desire to be
healthy, age gracefully and enjoy desirable foods continues to grow.
Purchasing power of Asian consumers is on track for sustained growth.
Chinese Market: Domestic consumption and demand far exceed domestic supply and will likely
continue to do so for some years. China has a quickly maturing retail industry poised for expansion in
the sales of blueberries in fresh, frozen, juices and CGP products.
Trends:
Domestic production will grow in Asia to serve local demand in country, especially in fresh.
Imports: Asian production is not likely to increase at a rate sufficient to meet the increasing rates of
consumption creating big opportunities for exporters.
New Products in China could become a major driver for processed blueberry demand
South Korea is on track to become “the next Japan”.
India may present opportunities for shelf stable products using blueberries.
Global Highbush Blueberries
Global Highbush Acreage and Production
WORLD ANNUAL Acreage 2010 Production
GROWTH TOTALS 2005 2007 2008 2010 Fresh Process Total
North America 71,075 85,617 95,607 110,290 303.00 188.30 491.30
South America 18,039 33,650 39,703 44,000 137.07 16.33 153.40
Europe 9,736 16,705 18,038 20,780 68.64 12.50 81.02
Med. & N. Africa - 215 355 672 2.18 0.04 2.23
Southern Africa 740 810 910 1,124 2.10 0.20 2.30
Asia & Pacific 4,188 7,365 7,870 14,117 16.30 6.20 22.50
World Acreage 103,778 144,362 162,483 190,983 529.3 223.6 752.8

2008 World Blueberry Acreage & Production Report Page 43 of 51
© 2011 U.S. Highbush Blueberry Council
Cort Brazelton
Brazelton Ag Consulting
Global Highbush Crop and Usage: 2008 vs. 2010
Global Highbush Summary & Review:
Global Highbush acreage grew between 2008 and 2010 by an estimated 27,001 acres from 162,483 to
189,484 acres. This Change represents a near 17% increase over 2 years. Clearly blueberry planting
continued during the global economic
downturn, driven by increasing local and
global demand. Global production between
2008 and 2010 grew by 146.24 million lbs
from 606.63 to 752.87 million lbs, an increase
of 24% over 2 years. Incredibly, virtually all
of this production increase was sold fresh
around the world, a clear trend in recent
years. Another standout for 2010 is the ratio
of fresh to processed diversion. 524.3 million
lbs fresh vs. 223.57 in processed represents a
Fresh Process Total Fresh Process Total
North America 229.40 186.35 415.75 303.00 188.30 491.30
South America 92.10 23.03 115.13 137.07 16.33 153.40
Europe 54.43 1.96 56.39 68.64 12.50 81.14
Med. & N. Africa 0.81 0.00 0.81 2.18 0.04 2.23
Southern Africa 1.11 0.44 1.55 2.10 0.20 2.30
Asia & Pacific 12.27 4.73 17.00 16.30 6.20 22.50
World Acreage 390.12 216.51 606.63 529.30 223.57 752.87
2010 Million Lbs.2008 Million Lbs.
World Acreage Increases 1995-2010 World Acreage Distribution
2010 World Highbush Fresh vs. Processed Production
0
50
100
150
200
250
1995 1999 2001 2003 2005 2007 2008 2010
Thousands
North America South AmericaEurope Med. & N. AfricaSouthern Africa AsiaPacific
North America
58%
South America
23%
Europe 11%
Med. & N. Africa 0.4%
Southern Africa 0.6%
Asia & Pacific 7%
0
50
100
150
200
250
300
North America
South America
Europe Med. & N. Africa
Southern Africa
Asia & Pacific
Fresh Process

2008 World Blueberry Acreage & Production Report Page 44 of 51
© 2011 U.S. Highbush Blueberry Council
Cort Brazelton
Brazelton Ag Consulting
ratio of over 2 to 1 fresh to process diversion. In 2010 North America shipped twice the fresh
volume that it did in process.
This imbalance may offer additional clarity as to why processed prices have turned up so quickly. The
ability of the global fresh market to consume such rapid volume increases is encouraging. On the
process side of the business the question of stability and predictability for both suppliers and buyers
comes into questions. If such growth can be sustained in fresh, 139.18 million lbs in 2 years globally,
why could the same not be accomplished in the processed side of the business? Sustaining the
continuing growth in global consumption and demand for fresh while initiating and sustaining
renewed growth in process will be a key determining factor in the Highbush Industry‟s continued
success. This author anticipates this to be the greatest challenge of our global industry in the
coming years.
2010 World Fresh Production 2010 World Processed Production
World Acreage Increases 1995-2010 2010 World Production
North America
57%
South America
26%
Europe13%
Med. & N. Africa0.41%
Southern Africa0.40%
Asia & Pacific3%
North America
85%
South America 4%
Europe7%
Med. & N. Africa 0.04
Southern Africa0.05%
Asia & Pacific4%
0
50
100
150
200
250
1995 1999 2001 2003 2005 2007 2008 2010
Thousands
North America South AmericaEurope Med. & N. AfricaSouthern Africa AsiaPacific North
America66%
South America
21%
Europe11%
Med. & N. Africa0.30%
Southern Africa0.31%
Asia & Pacific3%
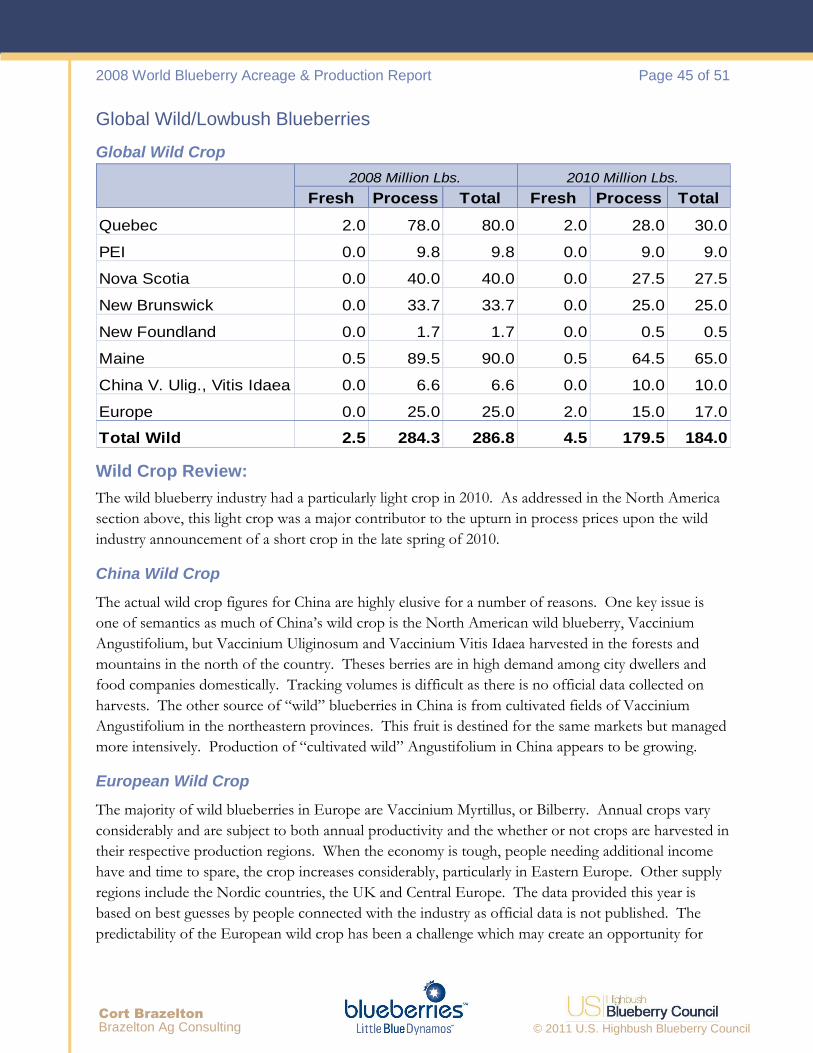
2008 World Blueberry Acreage & Production Report Page 45 of 51
© 2011 U.S. Highbush Blueberry Council
Cort Brazelton
Brazelton Ag Consulting
Global Wild/Lowbush Blueberries
Global Wild Crop
Fresh Process Total Fresh Process Total
Quebec 2.0 78.0 80.0 2.0 28.0 30.0
PEI 0.0 9.8 9.8 0.0 9.0 9.0
Nova Scotia 0.0 40.0 40.0 0.0 27.5 27.5
New Brunswick 0.0 33.7 33.7 0.0 25.0 25.0
New Foundland 0.0 1.7 1.7 0.0 0.5 0.5
Maine 0.5 89.5 90.0 0.5 64.5 65.0
China V. Ulig., Vitis Idaea 0.0 6.6 6.6 0.0 10.0 10.0
Europe 0.0 25.0 25.0 2.0 15.0 17.0
Total Wild 2.5 284.3 286.8 4.5 179.5 184.0
2008 Million Lbs. 2010 Million Lbs.
Wild Crop Review:
The wild blueberry industry had a particularly light crop in 2010. As addressed in the North America
section above, this light crop was a major contributor to the upturn in process prices upon the wild
industry announcement of a short crop in the late spring of 2010.
China Wild Crop
The actual wild crop figures for China are highly elusive for a number of reasons. One key issue is
one of semantics as much of China‟s wild crop is the North American wild blueberry, Vaccinium
Angustifolium, but Vaccinium Uliginosum and Vaccinium Vitis Idaea harvested in the forests and
mountains in the north of the country. Theses berries are in high demand among city dwellers and
food companies domestically. Tracking volumes is difficult as there is no official data collected on
harvests. The other source of “wild” blueberries in China is from cultivated fields of Vaccinium
Angustifolium in the northeastern provinces. This fruit is destined for the same markets but managed
more intensively. Production of “cultivated wild” Angustifolium in China appears to be growing.
European Wild Crop
The majority of wild blueberries in Europe are Vaccinium Myrtillus, or Bilberry. Annual crops vary
considerably and are subject to both annual productivity and the whether or not crops are harvested in
their respective production regions. When the economy is tough, people needing additional income
have and time to spare, the crop increases considerably, particularly in Eastern Europe. Other supply
regions include the Nordic countries, the UK and Central Europe. The data provided this year is
based on best guesses by people connected with the industry as official data is not published. The
predictability of the European wild crop has been a challenge which may create an opportunity for

2008 World Blueberry Acreage & Production Report Page 46 of 51
© 2011 U.S. Highbush Blueberry Council
Cort Brazelton
Brazelton Ag Consulting
future Highbush sales to European buyers who have traditionally sought European wild. This last
season‟s European wild crop was reported as average.
North American Wild Crop
Comparing the 2008 to 2010 wild crops in North America, the drop is most notable. The 2010
lowbush crop was almost 100 million lbs lower than the 2008 crop at 157 million lbs down from 255.2
in 2010. Quebec saw a major crop loss falling from 80 million lbs in 2008 to 30 million in 2010.
Maine and Nova Scotia also had significant drops. Looking to the future, this light year may set the
stage for a turn-around in the wild crop in 2011 as light production years in lowbush are often
followed by bumper crops. Multiple contributors have commented that the unpredictable nature of
the wild blueberry crop is driving increased interest in Highbush among many buyers.
Global Crop: Highbush and All Wild Blueberries Combined
2008 vs. 2010 Combined Highbush and Wild
Fresh Process Total Fresh Process Total
North America 231.9 439.1 671.0 305.5 342.8 648.3
South America 92.1 23.0 115.1 137.1 16.3 153.4
Europe 54.4 27.0 81.4 70.6 27.5 98.1
Med. & N. Africa 0.8 0.0 0.8 2.2 0.0 2.2
Southern Africa 1.1 0.4 1.6 2.1 0.2 2.3
Asia & Pacific 12.3 11.3 23.6 16.3 16.2 32.5
TOTAL 392.62 500.81 893.43 533.80 403.07 936.87
2008 Million Lbs. 2010 Million Lbs.
2010 World Highbush Processed Production 2010 World Highbush & Lowbush Processed Production
North America
85%
South America 4%
Europe7%
Med. & N. Africa 0.04
Southern Africa0.05%
Asia & Pacific4%
North America
47%
No.America Wild38%
South America
4%
Europe3.10%
Europe Wild3.72%
Asia & Pacific2%
Asia Wild2%
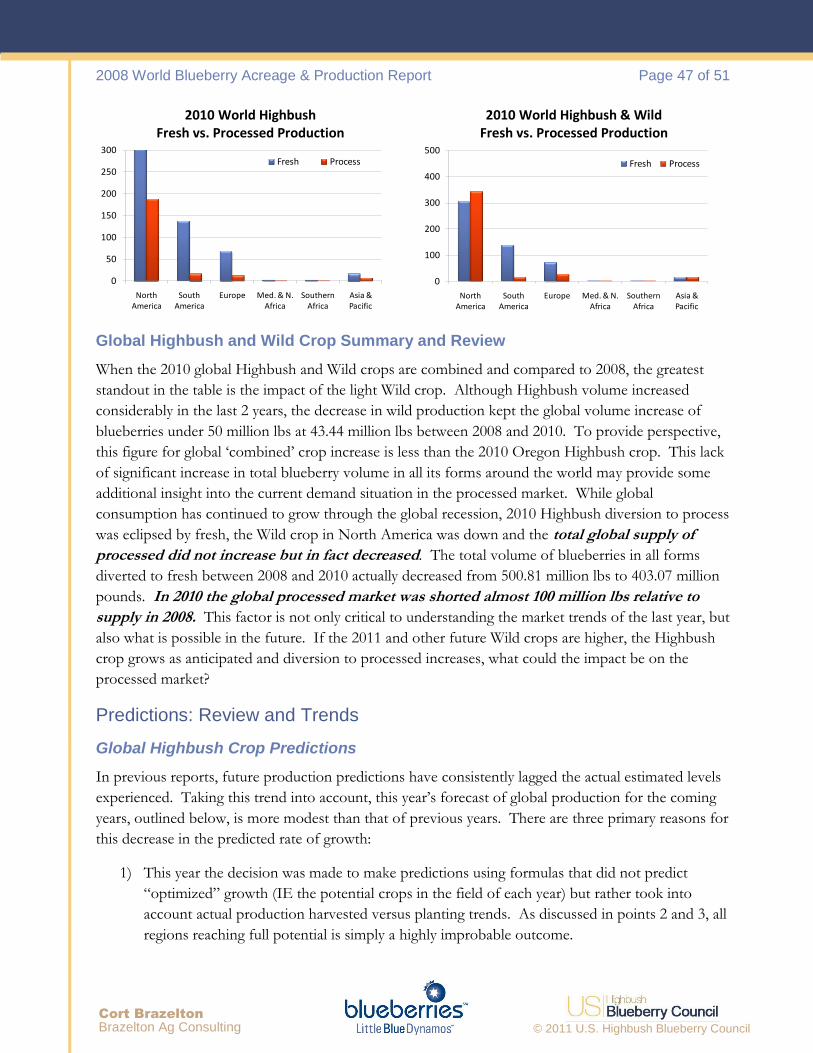
2008 World Blueberry Acreage & Production Report Page 47 of 51
© 2011 U.S. Highbush Blueberry Council
Cort Brazelton
Brazelton Ag Consulting
Global Highbush and Wild Crop Summary and Review
When the 2010 global Highbush and Wild crops are combined and compared to 2008, the greatest
standout in the table is the impact of the light Wild crop. Although Highbush volume increased
considerably in the last 2 years, the decrease in wild production kept the global volume increase of
blueberries under 50 million lbs at 43.44 million lbs between 2008 and 2010. To provide perspective,
this figure for global „combined‟ crop increase is less than the 2010 Oregon Highbush crop. This lack
of significant increase in total blueberry volume in all its forms around the world may provide some
additional insight into the current demand situation in the processed market. While global
consumption has continued to grow through the global recession, 2010 Highbush diversion to process
was eclipsed by fresh, the Wild crop in North America was down and the total global supply of
processed did not increase but in fact decreased. The total volume of blueberries in all forms
diverted to fresh between 2008 and 2010 actually decreased from 500.81 million lbs to 403.07 million
pounds. In 2010 the global processed market was shorted almost 100 million lbs relative to
supply in 2008. This factor is not only critical to understanding the market trends of the last year, but
also what is possible in the future. If the 2011 and other future Wild crops are higher, the Highbush
crop grows as anticipated and diversion to processed increases, what could the impact be on the
processed market?
Predictions: Review and Trends
Global Highbush Crop Predictions
In previous reports, future production predictions have consistently lagged the actual estimated levels
experienced. Taking this trend into account, this year‟s forecast of global production for the coming
years, outlined below, is more modest than that of previous years. There are three primary reasons for
this decrease in the predicted rate of growth:
1) This year the decision was made to make predictions using formulas that did not predict
“optimized” growth (IE the potential crops in the field of each year) but rather took into
account actual production harvested versus planting trends. As discussed in points 2 and 3, all
regions reaching full potential is simply a highly improbable outcome.
2010 World Highbush Fresh vs. Processed Production
2010 World Highbush & Wild Fresh vs. Processed Production
0
50
100
150
200
250
300
North America
South America
Europe Med. & N. Africa
Southern Africa
Asia & Pacific
Fresh Process
0
100
200
300
400
500
North America
South America
Europe Med. & N. Africa
Southern Africa
Asia & Pacific
Fresh Process

2008 World Blueberry Acreage & Production Report Page 48 of 51
© 2011 U.S. Highbush Blueberry Council
Cort Brazelton
Brazelton Ag Consulting
2) The odds of record crops in any more than a few geographies is simply too unlikely and events
often tend to be offsetting – global weather trends, old fields, labor challenges and disease
pressure to name a few, make simultaneous record crops around the world highly improbable.
The number of disease challenges in blueberries is in fact increasing, not decreasing and the
tools available to fight these challenges are not increasing at the same rate. In fresh regions, a
big crop in the fields is frequently not accompanied by available labor to ensure its full harvest.
The apparent increase in unpredictable global weather patterns contribute to the unlikelihood
of good crops in all regions. As explained by a contributing weather expert, independent of
any climate change trends, when weather is extreme and disruptive in one part of the globe it
is often more favorable in others. All regions reaching optimum potential in the same year has
not been the historical trend.
3) The third practical trend is linked to one of the key themes of this report, namely that the
rapid rate of growth in recent years comes with challenges – the industry has grown quickly
and as a result there will be tendencies to underperform. All areas that expanded at an
extremely rapid pace such as BC, Georgia, Chile and Argentina have underperformed relative
to anticipated production curves. This trend appears likely to continue in rapidly growing
regions such as Mexico and China. In regions where growth is extreme, this trend is most
prevalent, fields are installed in weaker sites, inferior varieties are planted, available expertise is
limited, poor quality nursery stock is often used and a dearth of clear harvesting, post harvest
and marketing plans all contribute to lower performance. The faster an area grows, the more
likely it is to underperform as a region. This plays a strong role in these revised predictions.
Global Highbush Crop Predictions by Region
World Production
Growth Predictions 2005 2007 2008 2009 2010 2011 2012 2013 2014 2015
2007 Predictions 393.30 493.93 572.00 692.00 806.00
2008 Predictions 393.30 493.93 606.83 805.50 1,002.00 1,191.00 1,343.00
2010 Predictions 393.30 493.30 606.83 656.80 752.75 852.60 938.00 1,058.50 1,229.00 1,368.00
North America 305.00 358.00 415.75 440.00 491.30 530.00 555.00 590.00 680.00 735.00
South America 35.00 64.00 115.13 130.00 153.40 190.00 220.00 260.00 295.00 330.00
Europe 42.10 54.00 56.59 65.00 81.02 95.00 110.00 135.00 160.00 180.00
Med. & N. Africa 0.45 0.81 1.00 2.23 5.00 9.00 14.00 18.00 25.00
Southern Africa 1.00 1.11 1.55 1.80 2.30 5.60 8.00 11.50 14.00 18.00
Asia & Pacific 10.20 15.74 17.00 19.00 22.50 27.00 36.00 48.00 62.00 80.00

2008 World Blueberry Acreage & Production Report Page 49 of 51
© 2011 U.S. Highbush Blueberry Council
Cort Brazelton
Brazelton Ag Consulting
The global production growth predictions for 2010 and onward reflect a growth curve quite similar to
that of the 2008 predictions. The difference is the time frame (see x axis in graphs above) over which
these production increases are anticipated to be realized. Predictions provided in 2008, which this
author felt were at the time reasonably conservative, exceeded actual growth. This prediction for 2010
reflects the key factors outlined above and a potentially more realistic outlook through 2015.
Conclusions
Reiterating Themes, Posing Questions
Having interacted with contributors from all over the world, this author sees global trends in the
blueberry business coupled with a number of critical questions that must be answered in the coming
years. From the grower to the packer/marketer to the buyer and even in some cases the consumer
and media. Examining the data and intelligence provided by contributors around the globe, the trends
and questions are surprisingly common and can be placed into two categories which frame the themes
outlined in the beginning of the report:
1) Growth in Global Production and Consumption
The Blueberry Industry is Going Global: Production and consumption are expanding around the
world. Much of the growth in production in new areas is being driven by demand growth in new
places. To quote an Egyptian grower discussing the Middle Eastern market, “people in the western
world aren‟t the only one‟s interested in eating healthy and enjoying good food”. Blueberries are being
grown in more places and more people are consuming them around the world.
New Consumers Now a Major Driver of Demand: Historically, much of the consumption
increases in blueberries have been attributed to existing blueberry consumers eating more fruit, now
there is a clear additional trend towards more people beginning to eat blueberries. More people in
existing markets and new markets around the world are discovering blueberries and seeking them out.
How can this new demand be supplied?
Fresh is a Major Driver: Fresh consumption has been growing steadily for years. During the
recession the vast majority of the production increase was diverted to the fresh market. Can this rate
of fresh consumption growth be sustained and how?
2008 World Production Growth Predictions 2010 World Production Growth Predictions
0
300
600
900
1,200
1,500
2005 2007 2008 2009 2010 2011 2012
Million Lbs.
Asia & Pacific
Southern Africa
Med. & N. Africa
Europe
South America
North America
0
300
600
900
1,200
1,500
2005 2007 2008 2009 2010 2011 2012 2013 2014 2015
Million Lbs.Asia & Pacific
Southern Africa
Med. & N. Africa
Europe
South America
North America

2008 World Blueberry Acreage & Production Report Page 50 of 51
© 2011 U.S. Highbush Blueberry Council
Cort Brazelton
Brazelton Ag Consulting
Opportunity and Challenges in Processed: Though challenges remain, the processed market has
potential to grow. With production increasing, it may finally be feasible for the introduction of new
products using blueberries in the food industry. Massive fluctuations in processed blueberry prices,
quality and product types have reportedly been confusing and a frustrating for buyers and end users.
Concerns about the predictability of the wild crop may drive greater interest in Highbush blueberries
among process buyers if greater predictability can be offered. In North America and around the
world, the market for processed blueberries in all forms is growing. The landscape of today‟s
processed market and the greater blueberry industry exhibits the potential for supply growing while
meeting renewed demand. Growth in processed blueberries has lagged behind fresh, how can this
trend be turned around? How can the successes in fresh production and consumption growth be
repeated in process?
2) Winners and Losers
Rapid Growth Creates Unique Challenges: The faster an industry grows, the more it tends to
underperform. This trend applies to a number of producing regions which are not as likely to achieve
full potential without repositioning. With so many plantings established during the years of rapid
growth, many are under-achieving. From Poland to Argentina, China to Florida, average productivity
per acre is significantly lower than that of a field achieving reasonable productivity. Will changes
occur in time for these boom regions to remain competitive?
Drive towards Professionalism, Quality and Scale: The biggest winners during the downturn and
in the current upswing have generally been the larger and professionally run operations. Buyers and
consumers are becoming more, not less selective and educated. This trend may eventually render
many of today‟s product types, brands, varieties, fields, infrastructure, post harvest systems, etc…
obsolete. Will the separation between such operations become increasingly apparent? How will it
manifest itself? How will smaller operations position and align to compete?
Repositioning and Re-tooling in Established Regions: The industry is growing and
professionalizing and the market becoming more discerning, leading growers in established regions are
renovating their businesses with new varieties, new technology, better infrastructure and ultimately
pursuing greater efficiency, productivity and quality. What are the most important steps to take to
remain competitive? What does a “winner” look like in the future?”
Special note regarding industry organizations: A great deal of the success in the blueberry industry‟s
success and growth over the last 20 years can be attributed the research and promotional activities of
the USHBC, The Chilean Blueberry Committee and WBANA and other industry organizations. Many
industries around the world have formed their own organizations to engage in similar activities. 2011
marks the year of formation of the International Blueberry Organization. Continued efforts in
research, dissemination of the health message, generic promotional activity and market development
will be critical in supporting the sustained growth in use and consumption of blueberries around the
world. In an increasingly interconnected world, enhanced global cooperation on such key issues
which transcend the commercial interest of individual entities presents exciting opportunities to build
a strong and sustainable future for all in the blueberry industry.

2008 World Blueberry Acreage & Production Report Page 51 of 51
© 2011 U.S. Highbush Blueberry Council
Cort Brazelton
Brazelton Ag Consulting
After years of consistent increases in production, consumption and pricing, much of the industry
experienced a severe downturn in 2008, 2009 and early 2010. The dramatic effect of this event
brought some of the lowest prices in real terms in many years. Two years of reasonable prices to
buyers and consumers, significant diversion to an attractive fresh option and new products in the
processed markets kept consumption growing through the industry downturn and the global
recession.
The world is slowly pulling out of recession and the optimism in the blueberry business is
palpable among contributors to this report. Blueberry production AND consumption is
increasingly global. Since the last report in 2008, this development is evidenced by the many
new consuming centers of blueberries. Blueberries are following the same trend as most
other food-stuffs and consumer items spurred by the growth of global communication and
redistribution of wealth around the world. The world economy is becoming global and
blueberry production and consumption is growing with it. Many questions about the future
of the blueberry industry remain unanswered. As an element of predictability and stability
returns to the business and the blueberry notably moves from its position as a niche product
to that of a ‘must have’ commodity, there are many new challenges and opportunities. Old
models, once highly effective, appear to be giving way to new systems and ways of engaging
in the business to ensure success. The rewards are great and the stakes higher. As in so
many other industries facing similar trends of globalization, increased competition and ever
faster rates of game change, the challenges ahead for the blueberry industry are stark and the
opportunities exciting and manifold. The systems and strategies developed to face these new
realities head on will be the determining factors of future success in this increasingly dynamic
industry.


![Blueberry Hill - Kiama Blowhole Buskers€¦ · Blueberry Hill [C] /// /// [F] /// /// [G7] stop [Tacet] I found my [F]thrill ..... on Blueberry [C]Hill ..... On Blueberry [G] Hill](https://img.dokumen.tips/doc/110x75/5f334258c6a82b4839519c93/blueberry-hill-kiama-blowhole-buskers-blueberry-hill-c-f-g7.jpg)