Embed Size (px)
Citation preview

Document of
The World Bank
FOR OFFICIAL USE ONLY
Report No.? 147
PROGRAM PERFORMANCE AUDIT REPORT
INDONESIA
FIRST AND SECOND TRADE POLICY ADJUSTMENT LOANS(LOANS 2780-IND AND 2937-IND)
JUNE 30, 1989
Operations Evaluation Department
This document has a restricted distribution and ma% be used bi recipients onl% in the performance oftheir official duties. Its contents mas not otherwise be disclosed without World Bank authorization.
Pub
lic D
iscl
osur
e A
utho
rized
Pub
lic D
iscl
osur
e A
utho
rized
Pub
lic D
iscl
osur
e A
utho
rized
Pub
lic D
iscl
osur
e A
utho
rized
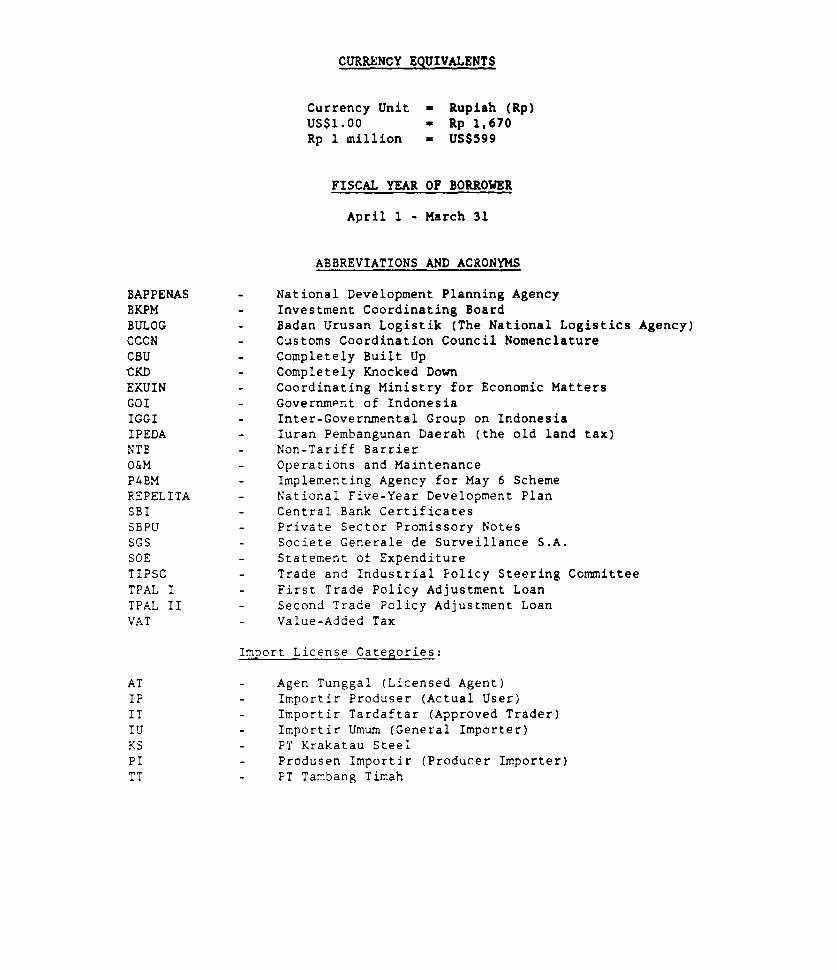
CURRENCY EqUIVALENTS
Currency Unit - Rupiah (Rp)US$1.00 = Rp 1,670Rp 1 million w US$599
FISCAL YEAR OF BORROWER
April 1 - March 31
ABBREVIATIONS AND ACRONYMS
BAPPENAS - National Development Planning AgencyBKPM - Investment Coordinating BoardBULOG - Badan Urusan Logistik (The National Logistics Agency)CCCN - Customs Coordination Council NomenclatureCBU - Completely Built Up
CKD - Completely Knocked Down
EKUIN - Coordinating Ministry for Economic MattersGOI - Government of IndonesiaIGGI - Inter-Governmental Group on IndonesiaIPEDA - luran Pembangunan Daerah (the old land tax)NTB - Non-Tariff Barrier
O&M - Operations and MaintenanceP4BM - Implementing Agency for May 6 SchemeREPELITA - National Five-Year Development PlanSBI - Central Bank CertificatesSBPU - Private Sector Promissory NotesSGS - Societe Generale de Surveillance S.A.SOE - Statement of Expenditure
TIPSC - Trade and Industrial Policy Steering CommitteeTPAL I - First Trade Policy Adjustment LoanTPAL II - Second Trade Policy Adjustment LoanVAT - Value-Added Tax
Import License Categories:
AT - Agen Tunggal (Licensed Agent)IP - Importir Produser (Actual User)IT - Importir Tardaftar (Approved Trader)IU - Importir Umum (General Importer)KS - PT Krakatau SteelP - Produsen Importir (Producer Importer)TT - PT Tambang Timah
FOR OICIAL USE ONLYTHE WORLD BANK
Washington. OC 20433US A
00eC no off-eoni-~IOpeoate -- lvaujan
August 25, 1989
MEMORANDUM TO THE EXECUTIVE DIRECTORS AND THE PRESIDENT
SUBJECT: Program Performance Audit Report on Indonesia First and SecondTrade Policy Adjustment Loans (Loans 2780-IND and 2937-IND)
Attached, for information, is a copy of a report entitled "ProgramPerformance Audit Report on Indonesia First and Second Trade Policy AdjustmentLoans (Loans 2780-IND and 2937-IND)" prepared by the Operations EvaluationDepartment.
Attachment
This document has a restricted distribution and may be used by recipients only in the performanceof their oficial duties Its contents may not otherwise be disclosed without World Bank authorization.
- AL I
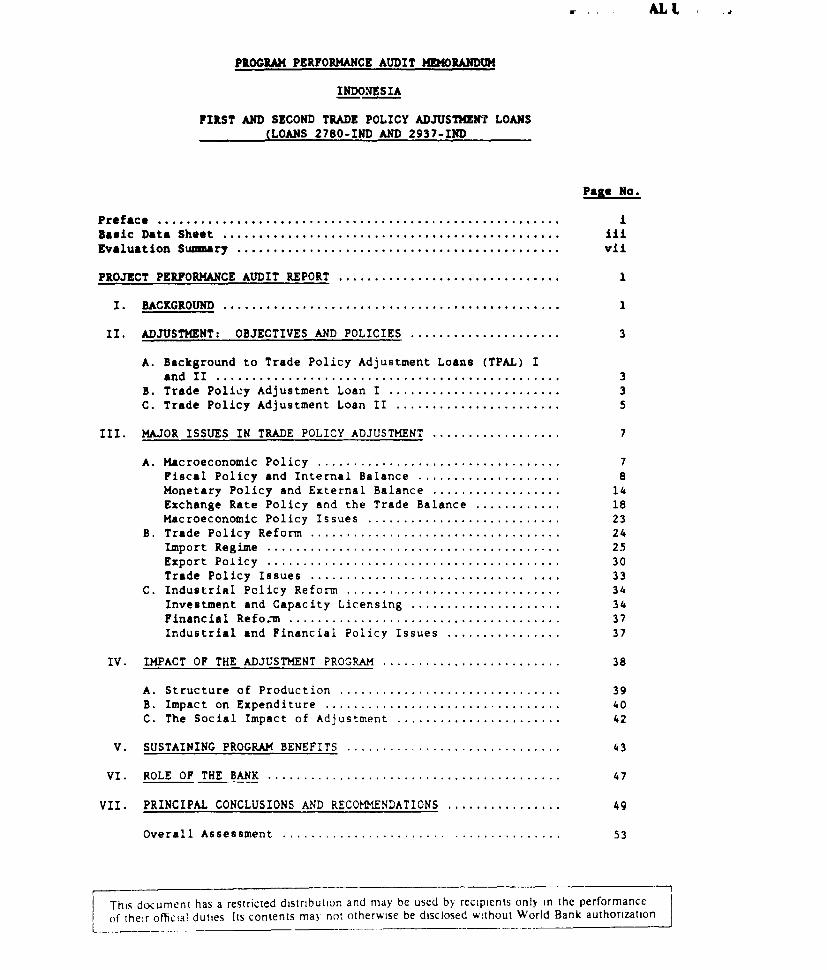
PROGRAM PERFORMANCE AUDIT MEMORANDUM
INDONESIA
FIRST AND SECOND TRADE POLICY ADJUSTMENT LOANS(LOANS 2780-IND AND 2937-IND
Page No.
Preface......................................................... .Basic Data Sheet ............................................... . iiiEvaluation Summary ................................................. vii
PROJECT PERFORMANCE AUDIT REPORT ..... 1..................... 1
I. BACKGROUND ...... 1................................... 1
II. ADJUSTMENT: OBJECTIVES AND POLICIES ................... 3
A. Background to Trade Policy Adjustment Loans (TPAL) Iand II ................................................ 3
B. Trade Policy Adjustment Loan I .............................. 3C. Trade Policy Adjustment Loan II ................... 5
III. MAJOR ISSUES IN TRADE POLICY ADJUSTMENT ................ 7
A. Macroeconomic Policy ......................................... 7Fiscal Policy and Internal Balance .......................... 8Monetary Policy and External Balance ...................... 14Exchange Rate Policy and the Trade Balance .............. 18Macroeconomic Policy Issues ............................... 23
B. Trade Policy Reform .......................................... 24Import Regime .............................................. 25Export Policy .............................................. 30Trade Policy Issues .................................. ..... 33
C. Industrial Policy Reform ....... ........................... 34Investment and Capacity Licensing ......................... 34Financial Refom.............................................. 37Industrial and Financial Policy Issues ...................... 37
IV. IMPACT OF THE ADJUSTMENT PROGRAM ..................... ... 38
A. Structure of Production ............................ 39B. Impact on Expenditure ................ .......... 40C. The Social Impact of Adjustment .................. ... . 42
V. SUSTAINING PROGRAM BENEFITS ......................... 43
VI. ROLE OF THE BANK ......................................... 47
VII. PRINCIPAL CONCLUSIONS AND RECOMMENDATIONS ............ 49
Overall Assessment ....................... ............ . 53
This document has a restricted distribution and may be used by recipients only in the performanceof their official duties Its contents may not otherwise be disclosed without World Bank authorization
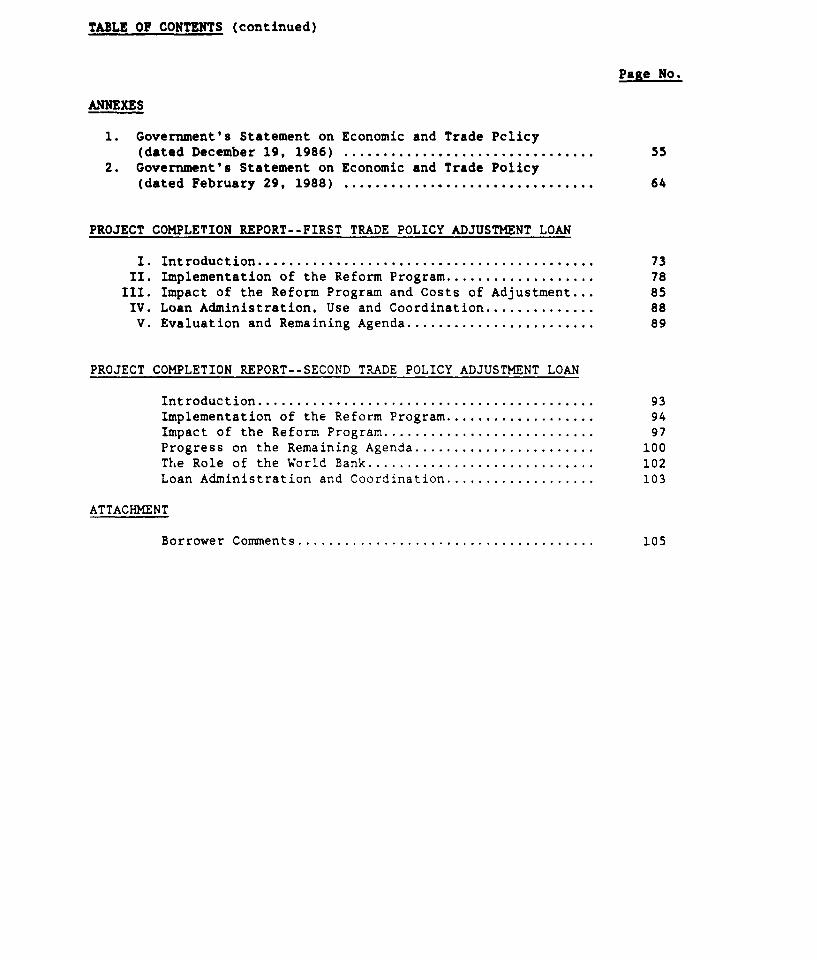
TABLE OF CONTENTS (continued)
Page No.
ANNEXES
1. Government's Statement on Economic and Trade Pclicy(dated December 19, 1986) ................................ 55
2. Government's Statement on Economic and Trade Policy(dated February 29, 1988) ................................ 64
PROJECT COMPLETION REPORT--FIRST TRADE POLICY ADJUSTMENT LOAN
I. Introduction........................................... 73II. Implementation of the Reform Program................... 78
III. Impact of the Reform Program and Costs of Adjustment... 85IV. Loan Administration, Use and Coordination.............. 88V. Evaluation and Remaining Agenda........................ 89
PROJECT COMPLETION REPORT--SECOND TRADE POLICY ADJUSTMENT LOAN
Introduction........................................... 93Implementation of the Reform Program................... 94Impact of the Reform Program........................... 97Progress on the Remaining Agenda....................... 100The Role of the World Bank............................. 102Loan Administration and Coordination................... 103
ATTACHMENT
Borrower Comments...................................... 105

LIST OF TABLES
1.1 Impact of External Shocks, 1983/84-1988/89 .... 23.1 Central Government Budget, 1982/83-1989/90.................... .3.2 Income and Sales/Value Added Tax Receipts as Percent of GDP.. 113.3 Debt Indicators for Selected Countries....................... 113.4 Domestic Inflation Indicators, 1984-88....................... 133.5 Net Foreign Assets and Imports.................................3.6 Domestic Interest Rates, 1981-1988........................... 163.7 Monetary Aggregates, 1984-1988............................... 173.8 Balance of Payments, 1981/82-1988/89......................... 203.9 Non-Oil Merchandise Exports, 1982/83-1988/89.................. 22
3.10 Major Items Within 'Other" Manufactured Exports............... 233.11 Impact of Reform Packages on Import Licensing Coverage
Since 1986............253.12 Changes in the Tariff Schedule for the Whole Economy
Since 1985....................................................263.13 Level and Dispersion of Tariffs in Broad Sectors,
1985 and 1989................................................. .273.14 Effective Rates of Protection................................ 283.15 Dispersion of Real ERPs...................................... 293.16 Sectors with Export Restrictions, 1989....................... 323.17 Implementation of May 6 Scheme............................... 323.18 Investment Approvals by BKPM................................. 353.19 Indonesia: Summary of Investment Restrictions................ 364.1 Indonesia's Economic Structure, 1981/82-1988/89............... 394.2 Overall and Sectoral GDP Performance, 1973-1988............... 404.3 Impact of Adjustment Policies on National Expenditu-s ......... 415.1 Saving-Investment Balances, 1981-1988........................ 455.2 Selected Indicators of International Economic
Activity, 1988-2000........................................ 466.1 Imports Financed by TPALS I AND 1I............................. 49
LIST CF GRAPHS
1.1 Oil Price Trend................................................. 13.1 Exchange Rate Movements......................................... 18
LIST CF BOXES
1. Adjustment Policies, 1983/84-1988/89........................... ix2. Indonesia: Key Economic indicators, 1981-88 ..................... x3. Indonesia: World Eank Assistance, 1981-88 ..................... xvii4. Effect of a Shift From Quotas to, Tariffs....................... 31

PROGRAM PERFORMANCE AUDIT REPORT
INDONESIA
FIRST AND SECOND TRADE POLICY ADJUSTMENT LOANS(LOANS 2780-IND AND 2937-IND)
PREFACE
This is a performance audit of the Bank's First and Second TradePolicy Adjustment Loans (TPALs) to Indonesia. TPAL I (Loan 2780-IND,US$300 million) was signed on February 6, 1987, and fully disbursed by June30, 1987. TPAL II (Loan 2937-IND, US$300 million) was signed on June 10,1988, and was fully disbursed by November 17, 1988.
The audit consists of a Program Performance Audit Memorandum(PPAM), prepared by the Operations Evaluation Department (OED), and ProgramCompletion Reports (PCRs), prepared by the Asia Regional Office. The PPAMis based on a review of the President's Reports (No. P-4429-IND, dated June30, 1986, and No. P-4794-IND, dated April 19, 1988), the loan agreements,the Summaries of Board Discussions, and the PCRs and related documents inthe Bank's files. Bank staff associated with the loans have beeninterviewed and discussions have been held with IMF staff. An OED missionvisited Indonesia in January 1989 to review the trade policy adjustmentoperations with Government officials and private sector representatives.The valuable assistance provided by the Borrower, the Bank's ResidentMission in Jakarta, and the staff at headquarters, is gratefullyacknowledged.
The PCR provides a good account and assessment of the projectexperience, and discusses the performance of the Bank and the projectexecuting agencies. The PPAR elaborates on particular aspects, such as theappropriate mix and coordination of macroeconomic policy instruments, thesequencing of the reforms, and the effectiveness of the overall program.
Following standard CED procedures, copies of the draft PPAR weresent to the Government and the Borrower. The Borrower's comments have beentaken into account in finalizing the report and have been reproduced as anattachment to the PPAR.

- iii -
PROGRAM PERFORMANCE AUDIT REPORT
INDONESIA
TRADE POLICY ADJUSTMENT LOAN
(LOAN 2780-IND)
BASIC DATA SHEET(US$ Million)
LOAN STATUS
As of 05/31/89Original Disbursed Cancelled Repaid Outstanding
300.00 300.00 0.00 0.00 300.00
CUMULATIVE DISBURSEMENTS
FY87
(i) Estimated 300.0(ii) Actual 300.0
(iii) (ii) and Z of (i) 100.0
OTHER LOAN DATA
Original Actual orDate Reestimated
First Mention in Files 11/10/86Appraisal Mission 11-12/86Negotiations 12/19/86Board Approval 02/03/87Loan Agreement - 02/06/87Effectiveness 04/07/87 03/18/87Closing - 06/30/87Actual Completion 06/30/87
STAFF INPUT
FY87 FY88 Total
Preappraisal 15.9 15.9Appraisal 4.8 4.8Negotiation 1.8 - 1.8Supervision 3.8 13.4 17.2
Total 26.3 13.4 39.7

- iv -
MISSION DATA
Month/ No. of No. of Staff Date ofItem Year Weeks Persons weeks /a Report
Preparation/Preappraisal 09-10/86 8.0 3 10.0
Appraisal 11-12/86 9.0 3 12.5 12/30/86Supervision 03-06/87 - 2 4.0Completion 06/00/88 - 2 2.0 06/30/88
/a Includes total staff weeks devoted to TPAL based on the TimeRecording System.
FOLLOW-ON LOAN
Second Trade Policy Adjustment Loan
(Loan 2937-IND)Signed June 10, 1938

- v -
PROGRAM PERFORMANCE AUDIT REPORT
INDONESIA
SECOND TRADE POLICY ADJUSTMENT LOAN(LOAN 2337-IND)
BASIC DATA SHEET(US$ Million)
LOAN STATUS
As of 05/31/89Original Disbursed Cancelled Reaid Outstanding
300.00 300.00 0.00 0.00 300.00
CUMULATIVE DISBURSEMENTS
FY89
(i) Estimated 300.0(ii) Actual 300.0
(iii) (ii) and I of (i) 100.0
OTHER LOAN DATA
Original Actual orDate Reestimated
First Mention in Files - 02/17/88Appraisal Mission - 01-02/88Negotiations - 04/01/88
Board Approval - 05/10/88
Loan Agreement - 06/10/88
Effectiveness 06/88 08/01/88Closing - 03/31/89
Actual Completion - 03/31/89 p
STAFF INPUT
FY87 FY88 Total
Negotiation 16.0 16.0
Total 16.0 16.0

- vi -
MISSION DATA
Month/ No. of No. of Staff Date ofItem Year Weeks Persons Weeks la Report
Preparation 12/87-01/88 6 3 8.0Appraisal 01-02/88 4 3 8.0 04/19/88Supervision 08-11/88 - 2 2.7Completion 03/00/89 2 2 2.0 03/10/89
/a Total inputs based on Time Recording System.
FOLLOW-ON LOAN
Private Sector Development Loan(Loan 3080-IND)
Signed July 21, 1989

- vii -
PROGRAM PERFORMANCE AUDIT REPORT
INDONESIA
FIRST AND SECOND TRADE POLICY ADJUSTMENT LOANS(LOANS 2780-IND AND 2937-IND)
EVALUATION SUMMARY
Background
1. The rapid growth of income, consumption, and investment thatcharacterized the 1970s in Indonesia corresponded with an escalation in oilprices. indonesia used its oil income to develop its industrial andagricultural base and to contribute to sociel development. Its fortuneswere, however, reversed in the early 1980s with the collapse of oil prices.Underlying structural problems surfaced and contributed to emergingeconomic difficulties. Indonesia responded by undertaking reforms designedto restore internal and external balance and the potential for long-termgrowth with financial stability.
2. Beginning with a major devaluation of its currency in 1983,Indonesia adjusted to the diminished export income in two ways: (a)reducing expenditure by appropriate monetary and fiscal strategies; and (b)liberalizing the complex trade and regulatory environment. Both measureswere designed to improve resource allocation and promote private sectordevelopment. These accions were supported by two Trade Policy AdjustmentLoans. These loans were ex post in the sense that they were granted inresponse to actions that were already taken by the Government, but on thetacit understanding that the reform program was anchored within a medium-term framework of adjustment and growth. The first loan (TPAL I) becameeffective on March 18, 1987, and the second loan (TPAL 11) on August 8,1988. Each loan was for a sum of US$300 million. The loans have beenfully disbursed.
The Adjustment Program
3. TPAL I supported the first phase of adjustment. A central elementin G0I's aijustment program was the restraint of expenditure tc counterrising inflation and restore internal balance. The brunt of the cutsoccurred in government investment expenditures where priorities focussed onthe completion of on-going projects, foreign aided projects, projects witha focus on employment and equity and operation and maintenance operations.Improved exterral balance was promoted by a further exchange ratedevaluation in September 1986 and the exchange rate was subsequentlyallowed to depreciate against a falling US dollar. These measures werereinforced by improvements in the trade regime to increase the
competitiveness of exports an- efficiency of imports, as well as to injectgreater competitiveness into the industrial sector. Recognizing a rola for
- viii -
foreign private investment in a strategy for economic diversification, manyof the rectrictions on foreign participation in local business enterpriseswere relaxed.
4. TPAL II supported the second stage of the Government's reformprogram. GOI reinforced and consolidated the policies and measures it hadundertaken in earlier years and built on the progress achieved in 1986. In1987 and 1988, the shift from import restrictions to a tariff-based traderegime was continueO and measures were taken to lower tariff ceilings aswell as tariff dispersion. The tegulatory environment for certaincategories of exports was further eased. Additional fields of investmentwere opened to foreign and domestic investors. Restrictions prohibitingforeign-owned companies from marketing Indonesian export goods wereabolished. Foreign companies were allowed to purchase domestic inputswithout limitation and rules regarding the hiring of expatriates wererelaxed.
5. Reforms at the level of the production sector were complemented bychanges in the financial sector. These included liberalization of mostinterest rate controls on State Bank deposits, establishment of ruralbanks, elimination of credit ceilings for all banks, and a reduction in thenumber of programs qualifying for new Bank Indonesia liquidity credits.Measures were instituted to improve the functioning of the Jakarta StockExchange and to improve access for smaller, less well established companiesseeking to mobilize resources through the capital market.
6. The policy reforms implemented in conjunction with TPAL I and IImust be seen as a continuation of a process which commenced soon after thedecline in oil prices in 1981. They gathered momentum with a majordevaluation of the rupiah in 1983. Box 1 simarizes the key adjustments.
Impact of Adjustment Policie'
Internal Balance
7. The macroeconomic policy package that was associated with TPAL Iand II consisted of a major fiscal effort, a conservative monetary strategyand an exchange rate policy directed towards restoring internal andexternal balance. It has yielded positive a ,ults (see Box 2). Inflationslowed down to 8.7Z in 1988. An important reason for the fall in inflationis the reduction in the central government's budget deficit, which resultedfrom a major improvement in tax effort as well as a reduction inexpenditures. Non-oil taxes rose from 5.9Z of GDP in 1982/83 to anestimated 8.5Z in 1988/89, while government expenditure over the sameperiod declined from 22.2Z of GDP to about 19.3Z.
Structural Shifts
8. Economic growth also picked up as a result of improved performanceof the non-oil sector, which grew faster tlan overall GDP. The improvedperformance of the non-oil sector was reflected in its share of totalexports, which rose very rapidly. Non-oil exports financed 28Z of non-cilimports in 1981, but this share had increased to almost 85Z by 1988.

- ix -
Box 1: ADJUSTMENT POLICIES, 1983/84-1988/89
Instruments Policy Description
Exchange Rate (i) Rupiah devalued by 282 (IMF method) in March 1983.(ii) Exchange rate made more flexible since March 1983.(iii) Rupiah devalued by 31Z (IMF method) in September 1986.(iv) Exchange rate allowed to depreciate against a falling
US dollar since September 1986.
Fiscal Policy Wi A major tax reform initiated, starting in January1984.
(ii) Follow-up steps taken to strengthen tax
administration.(iii) Large capital and import-intensive projects rephased.
Civ) Major cutbacks in government real capital spending.
(v) Tight control maintained since 1983 on the use ofnon-concessicnal import-related credits.
(vi) Restraints on civil service employment and salaries.
Monetary and (i) A major financial reform initiated in June 1983,
Financial involving removal of interest rate and credit
Policies ceilings for st.-te bank operations and introductionof new instruments of monetary control.
Cii) A new set of financial measures introduced in Octoberand December 1988, aimed at enhancing financialsector efficiency and boosting capital markets.
Ciii) Improved monetary management to control inflation.
(iv) Improved short-term monetary management to curb
exchange rate speculation.
Trade Policy Ci) An across-the-board reduction in nominal tariffs,implemented in March 1985.
(ii) Measures to provide internationally priced inputs toexporters announced on May 6, 1986.
(iii) Signiticant reduction in import-licensing restric-tions, initiated through a series of measures, inOctober 1986, January and December 1987, and November
1988.(iv) Steps taken in December 1987 to reduce the anti-
export bias of trade policy by reducing regulatory
restrictions for exporters.
Regulatory (i) Steps taken through the May and October 1986,
Reforms and January and December 1987 packages to reduce theinvestment and capacity licensing requirements, relaxforeign investment regulations, and reduce the role
of the local content program.
(ii) Reorganization of custom-, ports, and shipping
operations in April 198f to reduce freight costs and
cut procedural time.(iii) Substantial deregulation of maritime activities
announced in November 1988 to reduce cost and
encourage private sector participation.
Source: World Bank, Country Economic Report, May 1989.

* x *
Box 2t INDONESIA--KEY ECONOMIC INDICATORS, 1981-88
Key Parameters 1981 1982 1983 1984 1985 1986 1987 1988
Annual Average Growth(Percent)
GDP 6.6 -0.3 3.3 6.4 1.7 3.7 3.9 4.7GDP p.c. 4.4 -2.4 1.1 4.2 -1.A 1.7 1.9 2.6Non-Oil GDP 8.6 4.2 3.8 4.5 3.8 3.9 4.6 5.6Agriculture 4.8 1.1 1.9 4.2 4.2 2.6 1.8 3.8Manufacturing 9.5 0.9 2.7 6.2 6.2 4.9 7.1 9.0
Consumption 10.1 6.6 1.8 3.3 2.7 2.3 2.2 4.0Public 9.8 9.6 -2.6 3.4 7.4 0.1 -3.7 1.5Private 10.2 6.0 2.7 3.3 1.8 2.7 3.3 4.4
Investment 12.9 8.7 -1.1 -5.9 -6.0 -7.0 1.9 7.0Public n.a. 20.2 -3.7 -12.9 2.4 -19.6 -1.7 6.3Private n.a. -1.9 1.8 1.5 -13.8 6.8 4.9 7.6
Inflation 8.6 9.0 10.7 11.7 4.9 5.5 9.6 8.7
In Percent of GDP
Exports 26.7 20.4 26.8 25.6 23.4 21.0 27.3 27.0Non-Oil Exports 4.5 4.0 6.8 7.0 7.3 9.3 13.2 15.2
Imports 29.7 28.1 32.4 28.5 25.9 26.9 29.9 29.8Trade 56.4 48.5 59.2 54.1 49.3 48.0 57.2 56.8Current Account -2.9 -7.6 -5.5 -2.7 -2.3 -5.6 -2.2 -2.3Budget Balance -1.3 -4.4 -2.2 0.8 -2.8 -3.9 -2.4 -2.8National Savings 27.8 22.6 21.4 22.0 22.0 17.9 20.0 19.8Public 9.2 8.2 9.4 10.2 8.3 4.9 5.7 6.0Private 18.6 14.4 12.0 11.8 13.7 13.0 14.3 13.8
Debt/GDP /a 17.6 20.9 28.9 28.2 33.4 45.1 61.8 55.9Debt Service Ratio /a 8.2 11.4 12.1 16.5 19.6 30.9 29.2 31.5Gross External
Debt ($ b1n) 16.3 19.8 23.4 24.0 28.3 34.3 43.2 43.5Net Fore-gnAssets ($ bin) 10.8 7.5 10.0 11.7 12.6 9.6 10.8 10.0
/a Debt service excludes prepayments. All debt figures refer to public andpublicly guaranteed debt.
Source: World Bank.
Growth was spearheaded by the manufacturing sector, which showed an annualincrease of about 342 per year between 1982-87, picking up to 38Z in1986-88. As a result of favorable overall export growth, the currentaccount deficit of the balance of payments has been reduced from 7.6% ofGDP in 1982 to about 2.32 in 1988. Net foreign assets, at approximately$10 billion in 1988, were equivalent to 4.2 months of imports, compared toa ratio of 2.0 months of imports in 1982/83.

- xi -
Debt Issues
9. The debt service ratio amounted to 31.5Z in 1988 (Box 2). Thereasons for the growth in debt have been identified as the depreciation ofthe US dollar in relation to the currencies in which Indonesia is indebted,rising international interest rates, and the continuing current accountdeficit in the balance of payments.l/ There are indications, however, thatthe debt situation is improving. The debt/GDP ratio declined from about62Z in 1987 to about 56Z in 1988, and the ratio of debt to exports alsofell, partly as a result of good export performance.
Social Impact
10. The pace and pattern of real growth is a critical determinant ofemployment and earnings. In the urban formal sector, economic growth is adeterminant also of the level of employment. There is evidence of anincrease in open unemployment in urban areas, but it is not clear as to howmuch of this is directly related to budgetary resource constraints whichreduced the rate of labor absorption. Labor earnings are estimated to havedeclined in trade, and real wages of construction workers and civilservants have also been stagnant. The available evidence suggests astagnation or even a decline in real labor earnings during the adjustment.
11. Apart from economic growth, specific government expenditureprograms, such as those with respect to education, health, family planning,water supply, and housing, can have an impact on living standards,especially on the poorer segments of the population. The resource crun:hhas limited the growth of these expenditures. The Government has,therefore, redefined its priorities, protecting the most vital socialprograms and improving the delivery system. The Bank's sector work showsthat despite these attempts there is some evidence that the availabilityand quality of some essential services may have suffered. While publi:sector investment expenditure declined by an annual average of 2.0% between1981-88 (Table 4.3), private investment remained positive by slightly under1Z, and picked up strongly in 1987 and 1988 to an annual average of 6.252.The non-oil sector, which is relatively labor intensive, grew faster thanoverall GDP (Table 4.2). Non-oil exports, especially a wide range otlabor-intensive manufactures, also showed phenomenal growth, rising from a:.annual average of 33.8Z in 1982/83-1986/87, to 42.6% in 1986/87-1987/8(Table 3.9). This robust non-oil export performance moderated adverseeffects resulting from lower rates of growth of public expenditures andinvestment.
1/ Indonesia: Strategy for Growth and Structu:al Change, World Bank ReNo. 7758-IND, May 3, 1989.

- xii -
Major Issues of Adjustment and Growth
Expenditure Reduction Policy
12. A conservative fiscal strategy has been at the core of Indonesia'sadjustment program. This has meant an increase in the tax ratio and areduction in expenditures, principally, public sector capital expenditure.The policies and measures have, in conjunction with monetary and exchangerate policies, restored better internal and external balance.Nevertheless, the current inflation rate of 82-9Z is still regarded ashigh. Any measures to reduce this would necessitate an intensification ofcurrent fiscal/monetary stringency. It must be recognized, however, thatin the long term, public sector investment deficits may adversely affectthe creation of inf,.astructure needed to promote private sectordevelopment. Public investment also contributes to employment expansion.While :here is an obvious case for a revival of investment, it has to beaccompanied by policies and measures to raise levels of domestic savings.Additional savings may be generated through improved financial performanceof state economic enterprises, greater efficiency in governmentexpenditures (lower ICORs), and an increase in the tax ratio, which isestimated to be low by standards or comparators in the Asian region.
Interest Rate Strategy
13. The second issue concerns the dualistic impact of interest ratepolicy. In the Indonesian system, the government is constitutionallyprohibited from borrowing in domestic markets or from the Central Bank.Hence, its fiscal deficit is financed from foreign sources. Indonesia alsohas a system of open capital markets. Hence, Indonesia has to keep itsdomestic interest rate at a level that assures it of an inflow of foreigncapital sufficient in amount to finance its non-aid current accountdeficit.
14. The interest rate differential, which meets this test, is based onthe difference between domestic inflation and inflation in the princ rxloverseas financial markets plus the expected depreciation of the Indonesiancurrency and the risk premium demanded by foreign savers for holdingdeposits in rupiah. Technically, therefore, the higher the level ofinflation in Indonesia, and the greater the expected exchange depreciation(the current assumption is for an annual 5Z depreciation of the realeffective exchange rate), and the greater the risk premium (dictated by tleDebt/GDP ratio), the higher the required domestic-international interestrate differential. A policy dilemma occurs when high interest ratesincrease debt service and deter private investment. This calls for a mchstronger fiscal effort and improved incentives for promoting domestL:savings. Given Indonesia's open capital market, exchange rate strategybecomes subject to interest rate concerns; continued depreciation of theexchange rate drives the interest rate higher because foreign savers newto be covered against future exchange depreciation. Thus, policies topromote external balance through continued exchange rate depreciation co-LJindirectly act as a disincentive to domestic investment and add to de:tservice if interest rates are driven higher.

- xiii -
15. Interest rates can be kept down by reducing the non-aid currentaccount deficit and improving access to concessionary capital transfers.This could be supplemented by foreign private investment, which, in turn,would require improvements in the regulatory framework. Major efforts arealso needed to increase national savings, which have declined as a share ofGDP (see Box 2). One of the ways in which this may be achieved is byslowing the rate of growth of consumption and targetting it appropriately.The policy issue, therefoLa, is the extent to which consumption growthshould be restrained in order to promote higher levels of investment,without increasing the non-aid current account deficit, or inducing a risein interest rates. The main instrument to achieve this is an improvedfiscal strategy. The budget for 1989/90 demonstrates that the governmenthas made a start in this direction.
Exchange Rate Variations
16. The real effective rate depreciated at an annual rate of 13Zbetween 1981-88. The Five Year Plan 1989-94 (Repelita V) assumes an annual5: depreciation of the real effective exchange rate. The question iswhether an annual depreciation of 5Z would be adequate for maintaining theexport advantage that has been gained over the last few years al.d forimproving the current account deficit, currently running at approximately2.3Z of GDP. Indonesia's export competitiveness has benefited in recentycars from the appreciation of the Taiwanese currency and the overheatingin Thailand's economy. These features have provided added "protection" tothe real effective exchange rate. Any lessening of the constraintshamppring exports of Indonesia's competitors could exercise greaterpre-ssure on its exchange rate, in the absence of countervailing policies.
The 'cy issue is whether intensified monetary restraint is desirable asa :eans of protecting the foreign exchange reserve or whether greater
r tness in the management of the real effective exchange rate is;aried as a means to safeguard Indonesia's export competitiveness. The:viing inflation rate of approximately 91 would seem to suggest a
more cautious monetary policy than now exists. GOI should, at the.am::> tm:.e, be prepared to respond to any change in its international
t.....g competitiveness by an appropriate change in its real effectiveex:>ance rate.
Trade Regime
Important steps have been taken, since March 1985, to free thet:a., regime from a complex licensing system and regulatory environment.
t rst round of reforms centered on a shift from licensing to tariffs.o e ths process has been almost completed with respect to manufactures,
ynly just begun in agriculture. The next steps are to complete thistrcn. As licensing restrictions have been reduced, there has been are use of temporary import surcharges imposed on an ad hoc basis to
the protective equivalence of the licenses. The next step would:ationalize these; they should be removed or converted into tariffs-his is justified.

- xiv -
18. The deregulation of past controls that hindered trade has been astep in the right direction. However, the reforms to date have beendetermined by an ad hoc committee with shifting membership and powerdistribution. The changes, announced by decree and with specific contentand timing, are difficult to forecast. There is a need to formalize thedecision-making process in this regard through the establishment ofappropriate institutions at a sufficiently high level in the administrationwith a properly staffed secretariat, which would be as free as possiblefrom political interests. The objective should be to make the decision-making processes on both trade policy and administration as transparent andpredictable as possible.
Export Restrictions
19. Export restrictions consist of bans, quotas, the designation ofapproved exporters, and quality controls. Bans are aimed at increasingvalue-added before the export stage. Quotas have the same objective. aswell as securing domestic supplies. Approved exporters, or marketingorganizations, restrict access to export trade to a few rent-seekingindividuals. While quality control is desirable for maintaining exportmarkets, it could also act as a channel for conferring rents. In view oftheir distortive effects, it is desirable that the entire system of exportrestrictions be reviewed. There may be an argument for bans, but theireffect on value-added needs to be documented. Similarly, the justificationfor quotas and the distribution of resulting rents should be examineC.There is also a strong case for granting approved exporter status freely toapplicants meeting clearly stated requirements. Considerable scope existsfor making the quality control administration more transparent.
Sustaining Program Benefits
20. Indonesia's effort at economic stabilization and stru ladjustment, which began in 1983 and gained momentum over the last tnreeyears, is on a sound path. It has necessitated courageous policiesmeasures and imposed hardship on some sections of the community thro:hreduced expenditure, which exacerbated underlying unemployment prep .However, the basis is being laid for future growth with stability. 71consolidate the progress that has been achieved bo far, Indonesia will necdto focus on continued improvement in investment promotion, savinc:mobilization and private sector development. Further steps are neeiod toimplement the program of tariff rationalization, liberalization of theregulatory environment for production and trade, and to strengthen G_'sin-house policy analysis and implementation capability.
21. There is a case for increasing the national investment ra,e'its present level of 20Z of GDP, to promote a higher rate of ecngrowth and to generate increased employment. During the adjustntnt t*..Indonesia permitted the growth of consumption to exceed the growthc:But given the rising debt service and limited domestic savinCs nacceleration of investment will require some curtailment of cons-:ptia commensurate growth in export income. Export growth has been very obut further acceleration may be limited. Therefore, an expandied s3vinrgeffort must be the key to future economic progress.

- xv -
22. The liberalization of the trade regime, combined with an improvedenvironment for private investment, has led to a rapid growth of productionin the non-oil sector and exports. Given the complexity of the regulatorysystem, the response to the changes has been exceptional. The incentivescreated by a realistic exchange rate strategy have complemented themovement on trade liberalization. But further action is necessary. Themovement from the licensing system to tariffs in the manufacturing sectoris nearly complete, while it has just begun in agriculture. The next stepsare to complete this transition and to move to unify and rationalize thetariff system. These actions must be complemented by measures to improvethe transparency of the regulatory system and simplify and codify laws andregulations relating to corporate and commercial activity. Given thelimited savings available and the need to absorb the latest in managementpractice and skills, further liberalization of the laws relating to foreignprivate investment may be appropriate.
23, Parall,l action is also required to further improve the regulatorysystem governing investment. In this context, an important step would bethe abolition of the investment licensing system for industry, in favor ofa free system with a short negative list of controlled sectors. This wouldprovide a greater measure of transparency and help toward attractingforeign private investment. This should be matched by a credible legalstructure for business, which should, is a minimum, include specific andenforceable bankruptcy provisions.
24. Sustainability of the benefits reaped so far would also depend onthe formalization of the process of adjustment and structural changethrough the creation of an appropriate administrative framework. It wouldnecessitate the establishment of a Tariff Commission which would berelatively free of political interest and would have the resources toundertake policy analysis and make appropriate recommendations forimplementing the program of trade liberalization. It will also have thetask of monitoring progress and conducting surveys to assess impact. Thesewould be valuable feedback into the policy-making process.
Pole of the Bank
Conditionalities
25. The Bank's strategy for promoting Indonesia's trade policy reformsdeparted from the conventional pattern. In this case, the loans were aresponse to actions that were taken within the framework of a medium-termadjustment program that had been clearly spelled out by the Government andsupported by the Bank.2/ Hence, no ex ante conditionality was attached to
2/ Tbese were articulated in two Statements on Economic and Trade Policy,dated December 19, 1986, and February 29, 1988, respectively, addressedto the President of the World Bank by the Hon. Ali Wardhana, Indonesia'sMinistry Coordinator for the Economy, Finance, and Industry.President's Report No. P-4429-INS, dated December 30, 1986, andPresident's Report No. P-4794-INS, dated April 19, 1988.

- xvi -
either TPAL I or TPAL II. The strategy succeeded for two reasons. First,the Indonesian government had been exposed to a range of in-depth and highquality economic and sector work, conducted by the Bank for almost adecade. This provided the analytical basis for the deregulation actionstaken by the Government in 1985. The assistance provided by a well staffedResident Mission, complemented by economists from headquarters, facilitatedan active policy dialogue. Second, the economic crisis that wasprecipitated by the fall in the price of oil, beginning in 1981 andaccentuated in 1986, gave the Government a unique opportunity to implementadjustment measures that the Bank had proposed but the Government hadpostponed. The Bank supported this action effectively. It complementedits studies on trade policy with technical assistance to facilitateimplementation of reforms and focussed its dialogue on the priority areasgermane to a successful adjustment effort.
Economic and Sector Work
26. The Bank's analytical support and policy dialogue contributed tothe articulation of appropriate policy responses to problems ofmacroeconomic management. In the aftermath of the collapse of oil pricesin 1986, the Bank's macroeconomic orientations focussed on five criticaladjustment areas: (i) exchange rate management, to respond to externalshocks and maintain the competitiveness of non-oil exports; (ii)appropriate fiscal and monetary strategies, to control expenditure andreduce inflationary pressure; (iii) public resource mobilization, througheffective tax administration and improved cost recovery policies: (iv)focussed expenditure priorities, especially for O&M and poverty-relatedprograms; and (v) external debt management and debt service.
27. In the early 1980s, the Bank was in the vanguard of advocates iorgreater deregulation of the economy and liberalization of the trade regine.Major studies on trade and industrial policy issues were completed in 1981and 1985.3/ They identified the costs of the complex regulatory environmentfor business and charted the broad policy directions for the f_ule.Concurrent with the devaluation of the rupiah in 1986, G0I ne4_Ete astrategy for implementing reforms with respect to the trade regime a eregulatory system. The Bank responded with two studies: (I) er : sregulation and (ii) trade policy reform and implementotion. Both swill be completed in 1989. At the request of GOI. the Bank h s a:soinitiated a major study of the financial sector. This report wil 'Ilebasis for a continuing dialogue on financial sector policies. Te: aassistance on maritime sector reforms has been provided under the Na aPorts Development Project (FY85) and continued by a Ba-fi-e edconsultant within the Ministry of Communications.
3, Selected Issues in Industrial Development Strategy, World EaSelected Issues of Industrial Development, World Bank, 19E5.

- xvii -
Coordinating the Assistance Strategy
28. The technical advice provided by the Bank with respect to theimplementation of trade policy reforms was important to Indonesia. Thiswas reinforced by two trade policy loans, totalling US$300 million. Itprovided valuable balance-of-payments support during a period when .his wasunder pressure due to liberalization. Equally important was the catalyticrole the Bank played vis-a-vis the Intergovernmental Group for Indonesia(IGGI) in mobilizing substantial financial support for Indonesia (Box 3).As a result, Indonesia was able to capture significant resource transferson concessionary terms. Without such assistance, the process of adjustmentcould have been more painful and necessitated greater hardship for thepoorer segments of the population. The concessionary assistance from IGGIinter alia enabled GOI to restructure its external debt obligations bypaying off its commercial liabilities. Consequently, the debt profile inthe next decade is projected to remain within manageable dimensions.
Box 3: INDONESIA: WORLD BANK ASSISTANCE, 1981-88 /a(US$ millions)
1981 1982 1983 1984 1985 1986 1987 1988
Commitments 837 977 1,210 987 1,068 982 1,418 1,067- Project loans 837 977 1,210 987 1,068 707 614 767- Sector loans 275 504
- Special assistance 300 300
Disbursements 451 661 608 881 815 846 1,389 1,650Repayments 161 223 273 325 407 660 899 1,088Net transfers 290 438 335 556 408 186 490 562
Memo ItemTotal IGGI
net transfers /b 682 688 495 666 477 173 960 1,411.
/a Includes IDA./b Includes IBRD and IDA.
Source: Debt Recording System, IEC, World Bank.
Project Support
29. A cluster of projects supportive of the objectives of the tradepolicy adjustment program complemented the Bank's assistance strategy f.rgrowth and export diversification. A manpower development and trainingoj1 ect, which was approved in May 1986, has as its core objectives the
establishment of a national vocational training system to train

- xviii -
approximately 20,000 pupils each year in key skills and occupations. Twoexport development loans, the first of which was approved in May 1986, weredesigned to strengthen Indonesia's efforts at export diversificationthrough the provision of technical assista,ce and training facilities andthe availability of long-term credit for export-oriented investments. Thishas been followed by an industrial restructuring project, which providesdirect financ'al and technical assistance to selected individualenterprises that have difficulty in adjusting to the increasinglycompttitive environment consequent on investment deregulation and tradeliberalization. The three subsectors initially selected for this purposeare engineering, textiles, and pulp and paper. A loan for private sectordevelopment wil.l reinforce the objectives of the trade policy adjustmentloans and provide for close monitoring of the progress of the macroeconomicand trade policy reforms.
Collaboration with IMF
30. Theze has been close coordination with the IMF with respect toTPAL I and .I. It took the form of informal exchanges and consultationsduring loan preparation. IMF staff reviewed reports pertaining to theloans and fully supported them. The latest IMF Consultation Report wasissued on April 15, 1988. Indonesia has had no stand-by or extendedarrangements with the Fund since 1973. Its last purchase from the IMF wasfor SDR463 million in May 1987, under the Compensatory Financing Facility.This purchase increased Indonesia's total outstanding IMF obligations toSDR505 million at the end of 1987. After the last Consultation Report, theIMF Executive Board expressed its satisfaction that Indonesia's exchangesystem remained free of restrictions on payments and transfers for currentinternational transactions. Effective May 7, 1988, Indonesia acceptedArticle VIII status in the IMF.
Loan Administration and Coordination
31. Procurement and disbursement procedures for TPAL I and II weredesigned to ensure a quick resource transfer. The loans reimbursed 10OZ offoreign expenditures for eligible imports by the public or private sector,fcr which payments were made after the date of loan signing. There was noretroactive financing under the loans. The loans specified a standard listof ineligible imports, i. e. goods intended for military and paramilitarypurposes or for luxury consumption; goods financed from other officialmultilateral or bilateral sources; uranium; and goods procured undercontracts of less than US$100,000. All purchases in the amount of US$5nillion equivalent or more were to be procured through InternationalCompetitive Bidding (ICB) in accordance with Bank guidelines. Both loanswere largely used to finance private sector imports of industrial raw.aterials. The counterpart funds generated by imports financed under theloans were credited to a special account in Bank Indonesia and were used to!1nance priority public expenditure programs included in the Government's.adget. Table 6.1 in the PPAM provides a description of the product groups
financed under TPALs I and II, together w-th the sources from which theywt-re purchased.

- xix -
Conclusions and Recommendations
32. The Indonesian experience in economic stabilization and tradepolicy adjustment raises a number of interesting strategic and technicalissues, which are discussed in more detail in Chapter VII.
(a) Strategy Issues
First, the Bank was correct in consistently adhering to a policyand issue-oriented schedule of economic and sector work over time,despite variations in the quality of the country policy dialogue.Consequently, the Bank was able to capture an opportunity when itwas presented.
Second, structural adjustment seems to work better in a stablefinancial environment. Indonesia's sequencing of economicstabilization prior to formal structural adjustment wasappropriate.
Thi-d, adjustment is easier to accomplish and works more smoothlywher. the international environment for trade is favorable.Indonesia benefitted from export constraints in Taiwan andThailand.
Fourth, concessionary resource transfers remove the sting from thehardships resulting from adjustment. In Indonesia's case, itinter alia helped in changing the composition of external debt andalleviated the debt servicing burden.
Fifth, the short-run focus of expenditure adjustment on investmentmay be a good policy choice on economic and political grounds.While growth in investment after the initial phase of the programis necessary for its ultimate success, an initial pause may assistinvestors in making right decisions, while support of consumptionduring the program enhances its political acceptability.
(b) Macroeconomic Issues
First, interest rates have a central role to play, givenIndonesia's open capital market and flexible exchange ratepolicies. In this case, the non-aid current account deficit isfinanced by capital movements responding to interest ratedifferentials which are sensitive to the level of dome 'ticinflation.
Second, periods of financial repression associated with aneconomic stabilization/adjustment program should not beprotracted, because of the adverse effects on regeneration ofeconomic and social infrastructure. The Indonesian adjustment.program, which commenced in 1983, has come to a point where tnepostponement of many worthwhile infrastructure projects may havebegun to act as a binding constraint on private investment aneconomic growth. Deficits, which have emerged in the socialsectors, also need to be redressed.

- xx -
Third, adjustment programs must be cognizant of the employmenteffects of reduced expenditure policies. A reversal of thesetrends requires much higher levels of investment. Careful choiceof projects, supported by appropriate technology, technicaltraining, and revitalization of domestic financial markets isnecessary.
(c) Trade Policy Issues
First, it is appropriate to sequence the process of tradeliberalization by reducing Non-Tariff Barriers (NTBs) prior tomovement on tariffs. This approach helps to moderate the shocksfrom an across-the-board reduction of trade protection, whileproviding industrialists with time to make necessary adjustments.It also furnishes the Government with revenue which could be usedto promote industrial restructuring.
Second, tariffs arid import surcharges serve as substitutes forNTBs. Hence, they must be seen as a transition to a stage inwhich levels of import protection will be determined on optimalcriteria. The proposed study of the Country Department on TradePolicy Reform is to be welcomed.
Third, the desirability of a system of export controls, especiallyexport bans, needs to be examined. Export bans and other forms ofrestraint on exports confer rents on those who obtain licenses, orthose who can circumvent them. They, therefore, create vestedinterests which may be difficult to dislodge.
Fourth, investment licensing arrangements constitute another formof protective device. Their dismantlement would represent a majorstep forward in promoting neutrality in the trade regime.
Fifth, the policy-making apparatus for trade protection should beformalized and backstopped by a working Secretariat that isproperly equipped and insulated from political interests. Theobjective should be to make the decision-making process on pulicyand administration as simple as possible.
Sixth, the legal framework for commerce and banking, as it nowexists, acts as a constraint on modcrnization of the economy. Itneeds to be made transparent and simplified.
(d) SustainabilitN and Implementation
33. Sustainability of the progress achieved so far in the field oftrade and investment will depend on attention to four major areas:
First, there is a need to incraase opportunities for gainfulemployment. This can only occur in an environment that isrelatively free of regimentation and one that promotes investment.

- xxi -
While concessionary capital flows have partially compensated forthe decline in oil revenues, they cannot be a permanent device tosustain consumption and investment. Greater efforts are needed toexpand domestic savings. This may require changes in fiscalstrategies, interest rate policies, and financial intermediationprocesses.
Second, further steps are needed to rationalize the tariff system.Such a process would sensitize domestic producers to efficiencycriteria. These actions need to be complemented by measures thatstrengthen the transparency of the trade regime.
Third, the regulatory system governing investment has to befurther simplified by the introduction of a short negative list.
Fourth, a formal administrative framework needs to be establishedfor the evaluation of the tariff system and for monitoring impactand providing appropriate feedback to the decision-makingagencies.
Overall Assessment
34. Indonesia's economic adjustment program, which began in the mid-1980s, was a response to the economic crisis, which had its genesis in asharp decline in oil prices and an adverse movement in its terms of trade.Its twin objectives were (a) macroeconomic stabilization and (b)improvements in resource allocative efficiency. The policies and measuresfor attaining economic stability necessitated reductions in governmentexpenditure, monetary restraint, high interest rates, improved fiscaleffort, removal of pricing policy distortions, and exchange ratecompetitiveness. The economy's structural disequilibria were addressed bypolicies to liberalize foreign trade and dismantle the complex regulatoryenvironment.
35. This shift in economic strategy yielded considerable dividends.The growth of inflation slowed down, budgetary and external current accountdeficits were reduced, and foreign exchange reserves strengthened. Thedebt service ratio, however, still remains at a high level, but prudentexternal debt management has led to improvements in the ratio ofoutstanding debt to GDP.
36. Important structural changes have occurred. A striking feattre isthe rapid increase in the growth of the non-oil economy and an outstandingnon-oil export performance. The manufacturing sector has been the fastestgrowing sectcr, in terms of it contribution to GDP as well as to exports.This increase stemned from important trade liberalization measures, whichreduced the anti-export bias in the system, and depreciation of the realeffective exchange rate. The export base has been diversified in ways thatcould not have been contemplated a few years back.

- xxii -
37. While these measures deserve to be commended, problems stillremain. The deregulation process, which has begun to get under way,requires rationalization of the tariff structure. The investment licensingsystem needs to be further simplified and put on the basis of a shortnegative list. While the first steps in trade and investmentliberalization have been relatively easy to undertake, the second stage ofthis process may be more difficult to undertake. This stage also has to beunderpinned by appropriate macroeconomic policies which promote financialstability and allocative efficiency. Policies toward this end would givehigh priority to an improvement in the operating efficiency of Indonesia'sState Economic Enterprises (SEEs).
38. Deficits in areas essential to the quality of life may have to beaddressed. Bottlenecks in economic infrastructure are assuming proportionswhich may act as a major constraint on future growth. Action on all thesefronts will require careful preparation, regular monitoring, and furtherBank support.
39. To sum up: the program of adjustment that was initiated by theIndonesian Government in 1983 and intensified in conjunction with TPALs Iand II yielded good initial results. The Bank's program of economic andsector work and complementary project support have been major components inthis process. Bank support during the adjustment process has beenappropriate, timely, and well sequenced. Its policy dialogue has beenclose and meaningful. The well staffed Resident Mission has, over a periodof two decades, made a major contribution toward forging a spirit of mutualrespect and trust in the relationship, which warrants further financialsupport with ex post conditionality.
PROGRAM PERFORMANCE AUDIT MEMORANDUM
INDONESIA
FIRST AND SECOND TRADE POLICY ADJUSTMENT LOANS(LOANS 2780-IND AND 2937-IND)
I. BACKGROUND
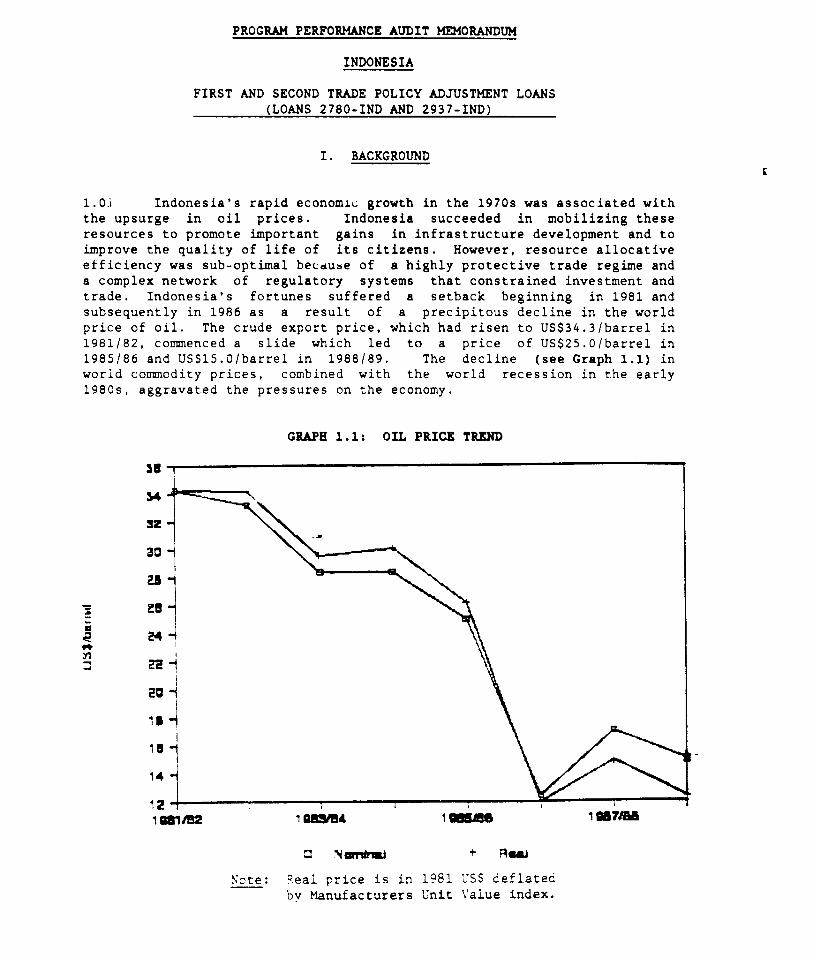
1.01 Indonesia's rapid economic growth in the 1970s was associated withthe upsurge in oil prices. Indonesia succeeded in mobilizing theseresources to promote important gains in infrastructure development and toimprove the quality of life of its citizens. However, resource allocativeefficiency was sub-optimal becdube of a highly protective trade regime anda complex network of regulatory systems that constrained investment andtrade. Indonesia's fortunes suffered a setback beginning in 1981 andsubsequently in 1986 as a result of a precipitous decline in the worldprice of oil. The crude export price, which had risen to US$34.3/barrel in1981/82, commenced a slide which led to a price of US$25.0/barrel in1985/86 and US$15.0/barrel in 1988/89. The decline (see Graph 1.1) inworld commodity prices, combined with the world recession in the early1980s, aggravated the pressures on the economy.
GRAPH 1.1: OIL PRICE TREND
32
3
2422
14.
12i OW1/82 1 SAM l eS 1 M71M
0 Ncrr*mi + aws
Note: Real price is in 1981 USS deflatedby Manufacturers Unit Value index.

- 2 -
1.02 Since mid-1985, the depreciation of the US dollar has been anothersource of external shock. As a large proportion of Indonesia's foreigndebt is denominated in currencies that have appreciated vis-a-vis thedollar, Indonesia's total debt in dollar terms has surged, causing asignificant increase in debt service payments (interest and amortization).The combination of lower oil prices and adverse affects of internationalcurrency fluctuations has caused a rapid increase in Indonesia's debt ser-vice burden.
1.03 The magnitude of the adverse effect of external shocks isillustrated in Table 1.1. On average, Indonesia lost some 9Z-10Z of itsGNP per annum due to external disturbances over the 1983-1988 period. Theloss of income was especially large during the 1981-88 period. Asexpected, the terms of trade effect was dominant. The interest rate effectwas minimal, but the exchange rate effect significantly worsened in 1988.Clearly, the burden of the external shocks has been substantial and haspresented a major challenge to policymakers. Indeed, without a forcefulpolicy response, this large loss of income could have easily destabilizedthe economy.
Table 1.1: IMPACT OF EXTERNAL SHOCKS1983/84-1988/89 /a(Percent of GNP)
Actual Estimated Average1983/84 1984/85 1985/86 1986/87 1987/88 1988/89 1983-88
Loss of IncomeTerms of Trade Effect 2.5 2.0 5.7 15.6 13.3 14.1 8.9,1981 Prices)
Exchange Rate Effect -0.2 -0.3 -0.4 0.3 0.9 1.5 0.3(1981 Exchange Rate)
:nterest Rate Effect 0.6 0.4 0.1 0.0 -0.5 0.0 0.1f1981 Interest Rate)
Total Effect 2.9 2.1 5.4 15.9 13.7 15.6 9.3
-a The effect of a shock in any year is measured as the difference between1981 price and current price values, and expressed as percentage of GNP.
Source: World Bank staff estimates.

- 3 -
II. ADJUSTMENT: OBJECTIVES AND POLICIES
A. Background to Trade Policy Adjustment Loans (TPAL) I and II
2.01 Indonesia's adjustment program was initiated in 1983 and has beenintensified since the collapse of oil prices in 1986. In broad terms, twotypes of policy adjustments have been made. First, the Government hasadopted more austere macroeconomic policies to restore financial stability.Second, to sustain the development momentum over the medium to longer term,it has embarked on a major program to restructure the economy, aimed atreducing Indonesia's heavy dependence on oil as a source of foreign ex-change and budgetary revenues and improving economic efficiency. The keyelements of this structural adjustment program include a range of measuresto strengthen domestic resource mobilization, expand non-oil exports, andpromote a more competitive and dynamic non-oil economy.
B. Trade Policy Adjustment Loan I
2.02 The Government's adjustment program was intensified following theexternal shocks of 1986, and the Bank supported the Government's recentreform efforts, particularly as it has related to trade and industrialpolicy, with the first Trade Policy Adjustment Loan (TPAL I). An importantdistinguishing feature of this loan was that the policy measures it sup-ported were announced prior to loan appraisal. This approach was consider-ed appropriate because: (a) the Bank's prior discussions with the Govern-ment had resulted in a common understanding of the measures that needed tobe taken; (b) analysis of the measures to be supported by TPAL I showedthem to be substantive and deserving of support; (c) it was recognized fromthe outset that the measures taken were part of a medium-term adjustmentprogram to which the Government was strongly committed, and that subsequentreforms could provide the basis for a series of policy-based loans; and (d)the Government's strong track record on economic management provided thebasis for expecting that further policy measures would be taken.
2.03 The objectives of the loan were to: (a) support the substantialreforms, especially in the area of trade policy, undertaken by the Govern-ment during 1986 and to monitor their implementation; (b) assist the Gov-ernment of Indonesia (GOI) to bring about an early recovery in economicactivity consistent with external and domestic financial stability; and (c)maintain the policy dialogue on further -eforms for promoting the effi-ciency and longer term viability of the economy. These objectives were tobe achieved partly through balance of payments support and partly throughon-going consultation on policy issues and improved institutional arrange-ments for administration of the trade regime. A related technical assis-tance loan was to be processed to finance a number of macroeconomic andtrade related studies. In particular, an up-to-date effective rate ofprotection study was identified as a priority in order to gain a clearerpicture of the economy-wide distortions created by the existing traderegime. It was also suggested that the refor-. process could be assisted ifthe Governpc established a permanent body to coordinate future Governmenteffort on deregulation.

2.04 GOI policies can be grouped under five categories:
(a) Macroeconomic Adjustment
2.05 In January 1986, an austere budget was announced for 1986/87.Current expenditures, other than interest on external debt, were budgetedto remain basically flat in nominal terms. Capital expenditures (includingtransfers to public enterprises) were reduced by almost 25Z, with therupiah development budgets of government departments cut by 40X-55Z. Inmaking these cuts, GOI also focussed the composition of the publicinvestment program, giving priority to: (a) the completion of on-goingprojects; (b) the provision of counterpart funds for foreign-aidedprojects; (c) projects with a particular focus on equity and employment;and (d) the funding of operations and maintenance (O&M) expenditures.
(b) Export Promotion
2.06 Faced with the prospect of lower oil prices over the medium term,the rupiah was devalued by 31Z (from Rp 1,134 to Rp 1,644 per US dollar) onSeptember 12, 1986.
(c) Financial Policies
2.07 Throughout 1986/87, GOI maintained a conservative monetary stance.During the first 6 months of 1986/87, total rupiah liquidity grew at anannual rate of 14Z and domestic credit at 282. This marked a considerableslowdown from the previous year (1985/86), when rupiah liquidity rose by27Z and domestic credit by 421.
(d) Trade Policy
2.08 In May 1986, the Government announced a package of measuresdesigned to provide internationally priced inputs to exporters. Under thescheme, "producer-exporters" were given the option of importing theirinputs free from licensing restrictions and exempt from import duties. OnOctober 25, 1986, GOI announced a package of trade reforms to reduce importrestrictions, improve industrial efficiency and promote non-oil exports:(a) all restrictive import licensing arrangements were removed for 165items (e.g. tires, glass, paper, dyes, synthetic fibers, some electricalappliances and vehicle parts); (b) import licensing restrictijns wererelaxed on 110 items (e.g. chemicals and machinery) for actual users andlicensed agents; (c) tariff rates were increased for 154 items, tocompensate for the removal of NTBs; and (d) tariff rates for another 152items not produced domestically (e.g. certain chemicals, steel products,and electrical components) were lowered, mostly to the range of 0-5z.
(e) Foreign Investment
2.09 As part of the May 6, 1986 package, the Government took a numberof steps to promote foreign investments: (a) the requiremeats for localparticipation in joint ventures were relaxed for investment in certainpriority subsectors which are important for exporters and employmentgeneration; (b) the validity of investment licenses was extended to 30

- 5 -
years; and (c) the operational limitations on joint ventures with majoritylocal participation were eased. Further changes were introduced in October1986, to treat foreign investors more like domestic investors. Inparticular: (i) foreign investment was allowed in existing firms inpriority sectors, especially for exports (whereas previously foreigninvestors had to set up new joint-venture companies); (ii) investment bymultilateral financial institutions (IFC, ADB, IDB) was to be treated asnational participation; (iii) foreign investment companies were givenaccess to export credit from state banks on the same terms as domesticfirms; (iv) foreign investment companies were allowed to act as marketingchannels for export products of other companies; and (v) ceilings on theswap facility for foreign exchange coverage were removed, thereby providingjoint ventures access to investment credits from state banks on roughly thesame terms as for domestic companies.
C. Trade Policy Adjustment Loan II
2.10 In the first period of adjustment (1982-85), the Governmentimplemented policies to mobilize domestic resources (the financial andfiscal reforms of 1983) and launched a program of trade reforms (themaritime and tariff reforms of 1985). The latter program was reinforced bythe second round of trade policy reforms in 1986, which were supported bythe first Trade Policy Adjustment Loan. Since 1986, the Government hasintensified its program of adjustment by: (a) extending the program oftrade policy reform; (b) beginning to deregulate industry; (c) relaxingpolicies governing foreign investment; and (d) extending its 1983 financialsector reforms. The primary objective of these reforms, in conjunctionwith the macroeconomic adjustment measures, was to raise economicefficiency and to increase earnings from non-oil exports. This new set ofmeasures was supported by a second Trade Policy Adjustment Loan whichfocussed on (i) trade policy, (ii) industrial deregulation and foreigninvestment and (iii) financial sector reform.
(a) Trade Policy Reform
2.11 GOI maintained the momentum on trade policy reform in 1987 throughtwo major packages announced on January 15, 1937 and December 24, 1987, anda series of smaller policy actions. These measures: (i) continued theshift from import restrictions to tariff-based protection; (ii) adheredstrictly to the lower tariff ceiling in setting tariff rates on theproducts removed from NTB protection; (iii) continued steps toward tariffrationalization; (iv) broadened the scope of the system giving exportersaccess to inputs at internationally competitive prices; and (v) reducedremaining export restrictions.
2.12 The January and December packages of 1987 marked substantialprogress in GOI's primary objective of moving away from a trade regimedependent on NTBs leading to the removal of an additional 342 items fromlicense control, accounting for 20% of all items and 23% of total importvalue previously restricted. The share of manufacturing productionprotected by import licensing declined from 42Z at the end of 1986 to 351at the end of 1987. The reduction in NTBs was concentrated in activitieswith the highest effective rates of protection. In addition to the removal
of import licensing restrictions, the January and December packages relaxedsome of the remaining restrictions, particularly in the textile andengineering goods sectors, by placing them under the IP (actual user)license category. This is the least restrictive license, and allows allproducers who require these items as inputs to import them freely. As aresult of the measures taken during 1987, virtually all production intextiles falls under the unrestricted or IP license category. Similarprogress was made in many branches of the engineering goods sector,although several final goods remained under restrictive license or importbans.
2.13 The second main element of the 1987 trade reforms related totariff policy. Tariff adjustments aimed at conforming to the reduced leveland dispersion of the new tariff structure were introduced in 1985. Underthe two trade reform packages of 1987, tariffs for 121 items were adjustedupwards and tariffs for 178 items lowered. Temporary surcharges were alsoimposed on 51 import items. The increases in tariffs compensated for theeffects of the removal of import licensing restrictions, but remainedwithin the lower tariff ceilings set in 1985. The reductions in tariffs inthe January 1987 package (as in the earlier October 1986 package)concentrated on products not locally produced, and were intended to offsetthe cost-raising effects of the September 1986 devaluation. The Decemberreductions went beyond this limited objective by reducing tariffs on somedomestically produced items that were removed from import licenserestriction in earlier decrees, thereby marking an important beginningtoward the next trade reform objective of further tariff rationalization.The need to obtain a special export license was abolished; several exportbans and quotas were removed; and access by exporters to the May 6 schemebroadened.
(b) Industrial Deregulation and Foreign Investment Policies
2.14 A start was made in 1985 when the investment process wasstreamlined. In 1986, fields of investment open to both foreign anddomestic companies were specified more clearly and the number of areas opento private foreign and domestic investment was expanded substantially.Moreover, foreign investment companies were given greater access todomestic capital and financial institutions, and domestic ownershiprequirements were eased.
2.15 Firms were allowed to increase production by up to 30Z of theirlicensed capacity without requiring new investment approval and diversifyproduction within much broader product categories, thereby improvingoperational flexibility and promoting greater competition. Requirementsfor investment licenses were streamlined and additional fields ofinvestment opened to private domestic and foreign investors. A series ofmeasures relaxed foreign investment regulations: domestic ownershiprequirements were eased significantly; restrictions prohibiting foreign-owned companies from marketing Indonesian export goods were removed;foreign firms were allowed to purchase domestic inputs without restriction;and rules regarding the hiring of expatriate personnel were relaxed.

- 7-
(c) Financial Sector Reform
2.16 In June 1983, GOI launched a comprehensive reform of the financialsector, which included a liberalization of most interest rate controls onstate bank deposits, the elimination of credit ceilings for all banks, anda reduction in the number of programs qualifying for new Bank Indonesialiquidity credits. These reforms had a far-reaching impact on thefinancial system, successfully increasing domestic resource mobilization,promoting greater competition and market orientation, and improving theallocation of credit. Bank Indonesia also introduced a range of newmonetary instruments (e.g. SBIs and SBPUs)1/ to improve monetary managementand encourage development of an active interbank money market. In July1987, an auction system was introduced to determine SBI and SBPU volumesand discount rates, which, in combination with other monetary measures,helped ease the speculative pressure against the rupiah.
2.17 Concerns about the longer term effect of high interest rates oninvestment and the financial viability of enterprises, and the relativelack of term transformation in the banking system, led GOI to undertakespecific measures in December 1987 to strengthen the role of equitymarkets. First, to increase the supply of securities, listing requirementson the Jakarta Stock Exchange, which now lists only 24 companies with amarket capitalization of about US$60 million, were simplified through theelimination of all but three pieces of essential documentation. Second,supportive measures were introduced to improve the institutional framework(e.g. pricing mechanisms) and the operation of capital market institutions(e.g. underwriters, guarantors, stock traders). Third, GOI created anover-the-counter (OTC) market to enable smaller, less well-establishedcompanies to mobilize investment requirements through the capital market.Finally, in an attempt to strengthen the demand for securities, GOI plannedto encourage the issue of bearer shares and also allow foreign investors topurchase shares in the OTC market.
III. MAJOR ISSUES IN TRADE POLICY ADJUSTMENT
A. Macroeconomic Policy
3.01 Indonesia is an example of a country adopting a policy ofstructural reform and deregulation after a successful stabilization effort.The average rate of inflation on the CPI has been 7.9Z since 1982; in 1988,it was 8.5Z. The macroeconomic policy package of the period of TPALs I andII, 1987-88, has included a fiscal effort that has raised non-oil tax
1/ SBIs are Central Bank certificates and SBPUs are private sectorpromissory notes held by banks, and rediscounted by the Central Bank.
- 8 -
revenue significantly and produced a primary budget surplus. Monetarypolicy has been tight enough to keep real interest rates sufficiently aboveworld rates to maintain international reserves at a satisfactory level,while at the same time stimulating growth in private investment. After twosuccessful discrete real devaluations, the exchange rate now is graduallydepreciating in real terms against a currency basket.
3.02 The results of this policy package have been impressive.Inflation has been contained below 10% in 1987 and 1988, despite a 31%devaluation in September 1986. The real growth rate of national income was42-5% in 1987 and 1988 in the face of terms of trade shocks of about132-15Z each year. Non-oil exports doubled from 1985/86 to 1988/89, andthe non-interest current account shows an estimated surplus of 2.1Z of GNPin 1988/89. The debt service and debt to GNP ratios increased sharply asoil revenues fell, but these have been stable in 1987-8P, as the GOI hasamortized high-interest commercial debt using concessional loans, partlyleveraged on the $600 million provided by the TPALs.
3.03 Indonesia is a good example for the application of the classicSalter-Swan analysis of policy for internal and external balance in a"small" open economy with a pegged exchange rate.2/ Indonesia hasinternationally open capital markets and an exchange rate that is pegged atany point in time to a currency basket. If we take low inflation as thesign of internal balance and stable foreign exchange reserves as the signof external balance, we can apply the Salter-Swan analysis, with fiscalpolicy aimed at internal balance and monetary policy aimed at externalbalance. With a mild increase in inflation following the 1986 devaluation,and some apparent loss in reserves in 1988, the analysis would call for atightening of both fiscal and monetary policy. This has been the directionof policy since 1987.
Fiscal Policy and Internal Balance
3.04 The overall stance of fiscal policy tightened from the early 1980sto the beginning of the TPAL period, and tightened again during thatperiod. The evolution of the central government budget since the early1980s is summarized in Table 3.1. The overall deficit was 4.4? of GDP in1982/83, and external interest payments were 1.1Z of GDP. Thus, theprimary, non-interest deficit was 3.3Z. By 1985/86, the overall deficitwas down to 2.8?, and the primary deficit was down to 0.9?.
2/ See W. Salter, "Internal and External Balance: The Role of Price andExpenditure Effects," Economic Record, August 1959, 226-38, and T. Swan,"Longer Run Problems of the Balance of Payments," in R. E. Caves andH. G. Johnson, eds., Readings in International Economics (Irwin, 1968).

- 9 -
Table 3.1: CENTRAL GOVERNMENT BUDGET, 1982/83-89/90(Rp. Trillion at Current Prices)
Actuals Estimated
1982/83 1985/86 1986/87 1987/88 1988/89 1989/90
Revenues and Grants 11.9 18.8 16.7 21.8 23.5 24.9
Oil and LNG Taxes 7.6 10.7 6.3 10.4 9.5 8.0Non-Oil Taxes 3.8 6.4 7.9 9.0 11.9 14.3Non-Tax Revenues /a 0.4 1.5 2.2 2.0 1.6 2.0
Grants 0.1 0.2 0.3 0.4 0.5 0.6
Current Expenditures 8.2 12.7 13.4 15.5 16.8 19.2
External Interest 0.7 1.8 2.8 3.8 4.3 5.0
Subsidies 1.4 1.4 0.9 1.4 1.0 0.7Other 6.1 9.5 9.7 10.3 11.5 13.5
Government Savings 3.7 6.1 3.3 6.3 6.7 5.7
Capital Expenditure 6.6 8.7 7.3 9.2 10.5 10.0
Overall Balance -2.9 -2.7 -4.0 -2.9 -3.8 -4.0
Financed by:External Loans (Net) 2.0 1.8 3.7 2.8 4.2 4.3
Disbursements 2.7 4.3 6.8 8.8 11.2 12.1Principal Repayments 0.7 2.5 3.1 6.0 7.0 7.8
Asset Drawdown /b 0.9 0.9 0.3 0.1 -0.4 0.0
Memo Items (Z of GDP):
Non-Oil Taxes 5.9 6.7 7.8 7.6 8.9 9.6Government Savings 5.7 6.4 3.3 5.3 4.9 3.9
Overall Balance -4.4 -2.8 -3.9 -2.4 -2.8 -2.9Total Expenditure 22.7 22.6 20.3 20.7 20.1 19.7
Net Domestic Erpenditure /c 11.4 8.5 3.8 4.1 2.2 0.8
Primary Balance /d -3.3 -0.9 -1.2 0.7 0.4 0.6
/a Includes domestic oil surplus in 1986/87.
lb Excludes gain from valuation adjustment in 1986/87, estimated at Rp.1.8 trillion.
/c Defined as the domestic content of expenditure less non-oil revenues.d Defined as overall balances less interest payments.
Source: Ministry of Finance and World Bank staff estimates.

- 10 -
3.05 From 1985/86 to 1986/87, the first year of the TPAL, oil and LNGtax revenue fell from Rp 10.7 to Rp 6.3 trillion, or from 11.2Z to 6.2Z ofGDP as the oil price fell. This revenue shortfall increased the primarydeficit by just 0.3Z of GDP, as non-oil tax effort was raised and capitalexpenditures were reduced. Thus, while the overall deficit increased to3.9Z of GDP in 1986/87, the increase was far less than the shortfall in oiland LNG revenues, reflecting a substantial fiscal effort.
3.06 During the TPAL period of 1987/88 and 1988/89, oil and non-oil taxrevenues were increased. Total expenditure as a percent of GDP has beenflat since 1986/87. As a result, the overall deficit was reduced to about2.52 of GDP in both years. The primary balance moved into surplus in1987/88; in 1988/89 the surplus is estimated at 0.42 of GDP.
3.07 The World Bank staff projections for the 1989/90 budget show aroughly constant, but still tight, budget stance. Total expenditure fallsslightly, from 20.12 to 19.72 of GDP. Oil and LNG tax revenues areprojected to fall, based on the assumption that the average price of oilfor the year will be $14 per barrel. Non-oil taxes continue to rise to9.6? of GDP. The net result is a roughly constant overall deficit andprimary surplus, as fractions of GDP.
3.08 An important aspect of the fiscal picture is the increase in non-oil tax effort since the tax reform of 1984. Table 3.1 shows non-oil taxesrising from 5.9Z of GDP in 1982/83, before the reform, to 8.9Z in 1988/89,and a projected 9.61 in 1989/90. This is below the level of other ASEANresource-rich countries, 12.1? for the Philippines and 14.9? for Thailandin 1987 (see Indonesia: Strategy for Growth and Structural Change, ReportNo. 7758-IND, May 3, 1989, hereafter Report, Table 2.8). But it does showsubstantial progress, and in 1988/89 Indonesia still had oil and LNGrevenues of 6.6? of GDP. The main sources of the increase in non-oil taxeffort have been the income and value-added taxes, as is shown in Table3.2. The 1984 tax reform began the substitution of the VAT for the salestax, and the efficiency of collection of the income tax has been increased.The result was a jump in the sales/VAT percent of GDP in 1985/86, and inthe income tax percent in 1986/87. The two ratios to GDP have continued toincrease, to a combined total of 7.2? projected in 1989/90. This increasesince 1984 represents an increase in tax efficiency because it has shiftedthe tax base from production toward income and expenditure. Thus, the non-oil tax effort shows substantial improvement and a continuation of thetrend during should be expected and encouraged.
3.09 At the macroeconomic level, the fiscal situation in Indonesiaseems stable and improving. The public debt ratios increased substantiallyfrom 1984 to 1986/87. Tie ratio of debt to GDP reached 65.7Z in 1987, andfell slightly in 1988. [Report, Graph 1.3] Virtually all of theGovernment's debt is held abroad, since the constitution prohibits domesticborrowing. So a comparison at this point of debt to exports is alsorelevant. The debt indicators are summarized, in comparison to othercountries, in Table 3.3. The debt-export ratio peaked in 1986, and hasdecreased since. Public debt was 2.2 times exports in 1987 in Table 3.3.The DOD/GNP ratio of 65.7? is higher than the average of 48.1? for the"highly indebted countries*, but the ratio of 2.2 times exports is belowtheir average of 2.7.
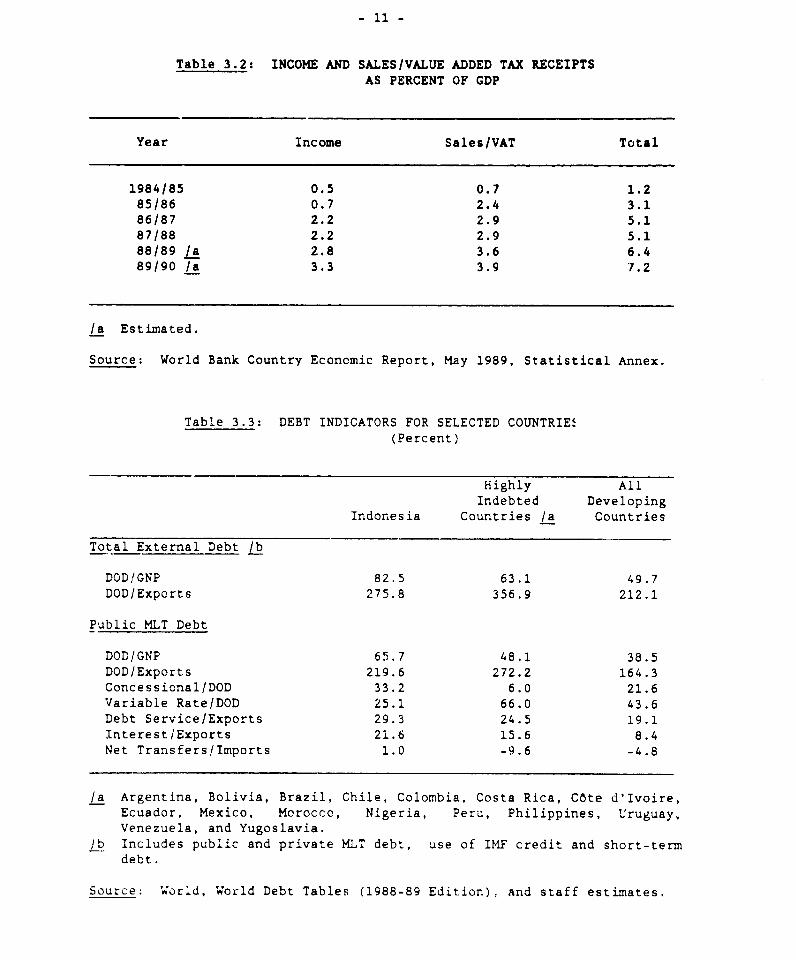
- 11 -
Table 3.2: INCOME AND SALES/VALUE ADDED TAX RECEIPTSAS PERCENT OF GDP
Year Income Sales/VAT Total
1984/85 0.5 0.7 1.285/86 0.7 2.4 3.186/87 2.2 2.9 5.187/88 2.2 2.9 5.188/89 /a 2.8 3.6 6.489/90 /a 3.3 3.9 7.2
/a Estimated.
Source: World Bank Country Economic Report, May 1989, Statistical Annex.
Table 3.3: DEBT INDICATORS FOR SELECTED COUNTRIES(Percent)
Highly AllIndebted Developing
Indonesia Countries /a Countries
Total External Debt /b
DOD/GNP 82.5 63.1 49.7DOD/Exports 275.8 356.9 212.1
Public MLT Debt
DOD/GNP 65.7 48.1 38.5DOD/Exports 219.6 272.2 164.3Concessional/DOD 33.2 6.0 21.6Variable Rate/DOD 25.1 66.0 43.6Debt Service/Exports 29.3 24.5 19.1Interest/Exports 21.6 15.6 8.4Net Transfers/Imports 1.0 -9.6 -4.8
/a Argentina, Bolivia, Brazil, Chile, Colombia, Costa Rica, C6te d'Ivoire,Ecuador, Mexico, Morocco, Nigeria, Peru, Philippines, Uruguay,Venezuela, and Yugoslavia.
/b Includes public and private MLT debt, use of IMF credit and short-termdebt.
Source: World, World Debt Tables (1988-89 Edition), and staff estimates.

- 12 -
3.10 The falling debt/GDP ratio reflects the high growth rate relativeto real borrowing rate, and the shift of the primary budget to surplus.The standard formula for the growth of the debt/GDP ratio is:
(1) db - (r - n)b + p.
where b is the ratio of debt to GDP, db is its rate of growth, r is thereal interest rate, n is the growth rate of the tax base, and p is theprimary deficit. Both r greater than n and a primary deficit contribute toa growing debt/GDP ratio (db>0). As shown in Table 3.1, the budget hasshown a primary surplus since 1987/88, so p in the formula is negative.The real growth rate of GDP was 4.7Z in 1988, and Tables 3.1 and 3.2 showtax effort rising. So the growth rate of the tax base n is greater thanthe growth rate of GDP.
3.11 The average real borrowing rate r on Indonesia's debt is wellbelow the growth rate n in the formula. In 1987, 33.2Z of Indonesia'spublic debt was at concessional rates, compared to 6Z for the highly in-debted countries. Table 3.1 shows large amounts of both disbursements andamortization payments on external public debt since 198:/,96. In 1989/90,disbursements are estimated at 8.2Z of GDP, and amortization at 5.3Z.These gzoss flows represent Indonesia's borrowing at concessional rates,partially by levering the TPALs, and simultaneously retiring commercialdebt. This continuing twist of the debt structure toward concessional debtbrings down the average borrowing rate r in the formula. So the rising taxeffort and the debt strategy make the borrowing rate r less than the growthrate n, so the first term in the formula is also negative.
3.12 Thus, after the terms-of-trade shocks of 1986-1988, Indonesia'sdebt, which is at the same time public and foreign, grew quickly relativeto GDP. But the fiscal program has provided a primary surplus and growthof the non-oil tax base, and the debt strategy the reduction in theborrowing rate. These together have stabilized the debt ratios and turnedtheir paths downward. These trends should be applauded and expected tocontinue.
3.13 In the Salter-Swan analysis, fiscal policy is aimed primarily atinternal balance, represented here by a low rate of inflation. Indicatorsof domestic inflation are shown in Table 3.4. The relatively highinflation rates of the early 1980s were reduced to 52-7Z on the generalindicators in 1985 and 1986, as the primary budget deficit was reduced (seeTable 3.1). The 312 nominal devaluation in September 1986 raised tradedgoods prices in late 1986 and 1987, as shown by the "proximate indicators"in Table 3.4. These show increases of 22Z and 16Z for import and exportgoods, respectively, and 13% for rice, in 1987.
3.14 The inflation rate on the export and import goods price indexesslowed in 1988 o about 12Z. The inflation rate of the rice price,however, continued to increase, to 31% in 1988. This reflected an increaseof the sam'e amount in the world price (US dollar price in Bangkok,International Financial Statistics 4/89) in 1988. The rising rice price islikely to produce upward pressure on non-traded goods prices through wages.

- 13 -
Table 3.4: DOMESTIC INFLATION DICATORS, 1n4-00(Percent Change: Perted Average) Le
1960 1 IM IMfl 1964 88 j96 1987 1988
General Indicators
CPI-17 cities 18.1 16.9 9.5 11.8 10.5 4.7 5.8 9.5 Lb 6.5 /bWPI Ic 19.4 9.8 8.2 20.9 11.4 5.2 6.9 20.7 10.0 dNon-oil GDP deflator 23.0 10.2 6.6 14.3 12.0 6.6 7.1 9.8 9.6
Specific Indicators
CPI-Jakerta 17.9 6.6 9.0 10.7 11.7 4.9 5.5 9.6 l 8.7 b
CPI-22 cities /a 38.7 13.6 10.9 14.9 7.3 7.9 6.2 14.1 8.9
KFW-K3 /f 19.8 12.0 7.3 10.0 12.2 12.7 13.6 21.9 9.7
Nine essential commodities
- Urban 17.8 8.6 9.7 14.8 11.3 2.4 5.4 6.7 13.4
- Rural 18.5 16.6 12.7 19.9 12.5 -1.1 11.6 12.9 17.1
Farmers' household
consumption J 20.6 15.8 12.1 23.7 18.6 11.6 12.2 16.7 5.3
Proximate Indicators
Import goods prices 16.6 9.8 5.2 20.9 13.0 5.3 6.4 22.6 11.5 d
Export goods prices /c 17.4 -1.4 3.1 38.8 14.0 0.9 13.0 30.8 7.7
Urban rice prices Li 12.9 9.4 12.9 19.8 5.8 -2.6 -10.6 11.6 24.8
Non-traded goods prices 17.6 7.6 14.1 16.3 13.6 6.9 3.7 8.2 4.7
a Previous economic reports used a year-end basis./b Revised estimates reflecting adjusted rice prices for Jakarta.c Excluding exports of oil and gas.
/d Revised estimates reflecting adjusted import prices.
* Weighted average of individual city indexe*.
f Physical Minimum Requirements index for 3-child family; weighted average for 26
provinces (excluding East Timor).
L Component of CPI-17 cities index.
h Unweighted average of Java and Madura and Outer Islands./ Component of Farmers' Terms and Trade index; weighted average for Youyakarta and
West, Central, and East Java.
L1 For 1980-1984, wholesale price in Jakarta. For 1964-1988, weighted average ofurban medium-quality retail rice prices In 26 provinces (excluding East Timor).
Source: Central Bureau of Statistics and World Bank staff estimates.

- 14 -
3.15 The single best indicator for internal balance is probably theinflation rate for non-traded goods. This is the last row in Table 3.4.With the price of imported inputs and rice rising, and some shift of demandtoward non-traded goods with the devaluation, non-traded goods prices roseby 8.2Z in 1987. But even with some pressure from the rice price,inflation for non-traded goods was down to 4.7Z in 1988. This shows thatthe devaluation of 1986 did change the ratio of traded to non-traded goods,and was not passed through to a general increase in prices.
3.16 In terms of maintenance of internal balance, the tightening offiscal policy from a primary deficit of 1.2Z of GDP in 1986/87 to a surplusof 0.7Z in 1987/88 and 0.4Z in 1988/89 was the complement to thedevaluation that prevented its spread to the general price level. Withnon-traded goods inflation still at 4.7Z in 1988, continuation of thistight fiscal position with a 1Z primary surplus, rather than the projectedslight easing to 0.4Z might be in order.
Monetary Policy and External Balance
3.17 The proximate target for monetary policy in the Salter-Swananalysis for Indonesia is external balance, represented by the maintenanceof the desired foreign exchange reserve position. This assignment ofpolicy is required by the combination of open capital markets and a peggedexchange rate. While the exchange rate is adjusted against a cur-encybasket daily, it is not floating. At any point in time, the authoritiesare committed to the existing nominal rate against the dollar. In thissituation, monetary policy must be tight enough to keep interest rates highenough that the private capital inflow finances the current account deficitless official net borrowing. This is the degree of tightness that willmaintain the level of reserves. With a stable demand for money as afunction of real income, the price level, expected inflation, and theinterest rate, given values for the first three variables and a proximatetarget for the interest rate sets the demand for money. This, in turn,sets the growth in the domestic component of the monetary base that isconsistent with stable foreign exchange reserves. Indonesian monetarypolicy is a good example of the monetary componeat or the classic analysis.
3.18 This mode of operation of monetary policy is set out in Tables3.5-3.7. Table 3.5 shows net foreign assets (NFA) of the monetary systemand the Central Bank and imports since 1984, omitting 1986 when the datawould have to be adjusted for the September maxi-devaluation. The dollarvalues of NFA in the monetary system and the Central Bank were about thesame in 1984 and 2987. Then in 1988, NFA of the Central Bank fell by $1.7billion, and NFA of the system fell by $1.2 billion, implying an increaseof $0.5 billion in the banking system. Imports in dollars fell in theslowdown in 1985, and then recovered to $16.3 billion in 1988.
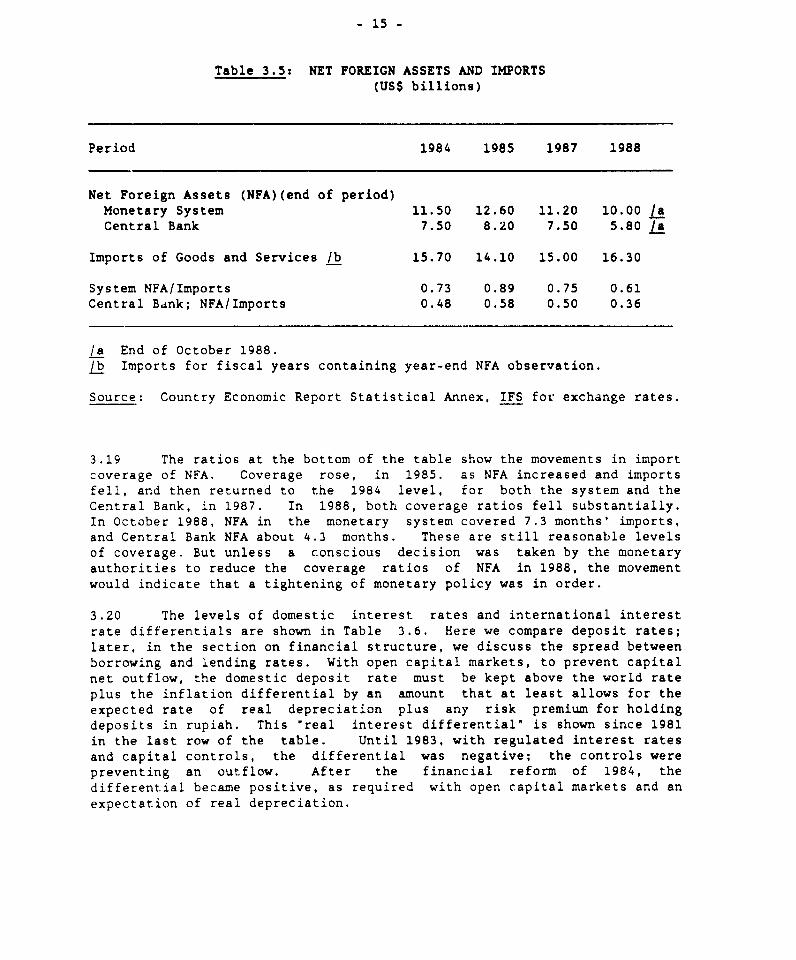
- 15 -
Table 3.5: NET FOREIGN ASSETS AND IMPORTS(US$ billions)
Period 1984 1985 1987 1988
Net Foreign Assets (NFA)(end of period)Monetary System 11.50 12.60 11.20 10.00 /aCentral Bank 7.50 8.20 7.50 5.80 /a
Imports of Goods and Services /b 15.70 14.10 15.00 16.30
System NFA/Imports 0.73 0.89 0.75 0.61Central Bank; NFA/Imports 0.48 0.58 0.50 0.36
/a End of October 1988.lb Imports for fiscal years containing year-end NFA observation.
Source: Country Economic Report Statistical Annex, IFS for exchange rates.
3.19 The ratios at the bottom of the table show the movements in importcoverage of NFA. Coverage rose, in 1985. as NFA increased and importsfell, and then returned to the 1984 level, for both the system and theCentral Bank, in 1987. In 1988, both coverage ratios fell substantially.In October 1988, NFA in the monetary system covered 7.3 months' imports,and Central Bank NFA about 4.3 months. These are still reasonable levelsof coverage. But unless a conscious decision was taken by the monetaryauthorities to reduce the coverage ratios of NFA in 1988, the movementwould indicate that a tightening of monetary policy was in order.
3.20 The levels of domestic interest rates and international interestrate differentials are shown in Table 3.6. Here we compare deposit rates;later, in the section on financial structure, we discuss the spread betweenborrowing and Lending rates. With open capital markets, to prevent capitalnet outflow, the domestic deposit rate must be kept above the world rateplus the inflation differential by an amount that at least allows for theexpected rate of real depreciation plus any risk premium for holdingdeposits in rupiah. This "real interest differential" is shown since 1981in the last row of the table. Until 1983, with regulated interest ratesand capital controls, the differential was negative; the controls werepreventing an outflow. After the financial reform of 1984, thedifferential became positive, as required with open capital markets and anexpectation of real depreciation.

- 16 -
Table 3.6: DOMESTIC INTEREST RATES, 1981-1988(Annual Averages: Percent p.a.)
1981 1983 1984 1985 1986 1987 1988
Deposit Rates /a 6.0 14.6 18.0 14.5 14.6 17.0 17.6Real Deposit Rates lb -10.7 2.8 7.5 9.8 8.8 7.5 9.1Average Lending Rates
(all banks) /c 15.0 18.7 23.0 20.5 20.2 21.2 21.5Real Lending Rates /d 4.8 4.4 11.0 '3.9 13.1 11.4 12.0
Memo Items
International Interest Rates /e 16.7 9.9 11.2 8.6 6.9 7.3 8.0Inflation Differential between
Indonesia and USA /f 6.5 7.5 6.2 1.0 3.8 6.2 5.3Swap Premium /Z 5.1 5.1 5.1 5.1 5.1 g 9.1 9.1 /hDifferential between Lending
and Borrowing Rates 4.1 5.0 6.0 5.6 4.2 3.9Real Interest Differential /c -17.2 -2.8 0.6 4.9 3.9 3.5 4.3
/a Six-month deposit rate of state banks./b Using CPI-17 cities as deflator./c Weighted average interest rate for non-priority credits./d Using non-oil GDP deflator./e Six-month LIBOR for US$ deposits./f Using CPI./g A new premium of 8.1 was set in September 1986./h Since October 27, 1988, the swap premium is determined on the basis of
the differential between LIBOR and the average domestic deposit./i Deposit rate less international rate less inflation differential.
Source: Bank Indonesia, International Financial Statistics (IMF), andWorld Bank staff estimates.
3.21 In 1985, the real interest differential was increased to 4.9percentage points. Then, in 1986, it was reduced to 3.9 points, andfurther to 3.5 points in 1987. It may be that this differential was toosmall, and accounts for the drop in the reserve/import coverage ratios in1988 that are shown in Table 3.5. The reaction to the fall in coverage canbe seen in the increase in the differential in 1988.

- 17 -
3.22 The maxi-devaluation in 1986 may have sensitized the markets tothe possibility of further action. In addition, the audit team was toldduring the mission that the new plan, REPELITA V, incorporates an assump-tion of a real depreciation of about 5Z per year. Some further real depre-ciation may be needed to stimulate manufacturing exports, but its expecta-tion requires that the real interest differential be increased to continueto stabilize reserves and finance the current account deficit. Theadjustment of monetary policy to restore the real interest differential ofabout 4.52 seems to have come in 1988.
3.23 The data on monetary aggregates in Table 3.7 confirm thistightening. The growth rate of reserve money was reduced from around 20?in 1985-86 to 10.71 in 1987 and 9.6Z in 1988. Growth in Ml slowedaccordingly, to 8.6? in 1987 and 8.0 in 1988. Since these growth ratesare lower than that of nominal GDP, the ratios of reserve money and Ml toGDP fell in 1987 and 1988, after rising the previous two years. This snowsa substantial tightening of monetary policy. The combination of low RM/GDPratio and a 9Z rate of inflation makes the inflation tax trivial inIndonesia. The tax revenue is about 0.54 (= .09 x .06) percent of GDP.
Table 3.7: MONETARi' AGGREGATES, 1984-88(Rp. billions)
End of Period 1984 1985 1986 1987 1988 /a
Reserve Money (RM) 5,473 3,435 7,808 8,646 7,966Percent Change 12.0 19.4 21.3 10.7 S.6 /b
Ml 8,541 10,104 11,677 12,685 13,165Percent Change 12.8 18.3 15.6 8.6 8.0 /b
Quasi Money (QM) 9,356 13,049 15,984 21,200 27,977Percent Change 31.9 39.5 22.5 32.6 33.6 /b
RM/GDP (Z) 6.3 6.8 8.1 7.5 6.1 /c
M1/GDP (2) 9.8 10.7 12.2 11.1 10.0 /c
QM/GDP (Z) 10.7 13.8 16.7 18.5 21.3 /c
/a Stock figures for end of November./b November 1988 over November 1987.c Assumes estimated GDP of Rp. 131,146 billion.
Source: Country Economic Report, May 1989, Statistical Appendix.

- 18 -
3.24 The rise in the ratio of quasi money (QM) to GDP since 1984 pre-sumably reflects the financial reform that began then and has continuedunder the TPALs, and the reduction of inflation shown in Table 3.4. Thecontinued growth in the QM/GDP ratio since 1986 is also consistent with thepublic's expectation of continued low inflation despite the devaluation.Thus, the movement of the monetary aggregates is consistent with a gradualtightening of policy, combined with a growing public demand for deposits inthe banking system. The only modification of this policy stance that mightbe recommended is that it be tightened slightly to raise the internationalinterest differential if the Central Bank's net foreign asset position isto be strengthened.
Exchange Rate Policy and the Trade Balance
3.25 The paths of the nominal and real effective exchange rates ofIndonesia since 1981 are shown in Graph 3.1. The trend real depreciationfrom 1981 to 1988 is 13? per year. The upwar.' drift in 1982 and the slowdownward movement in 1983-85 were the result essentially of pegging to theU.S. dollar. The real appreciation of 1982 was followed by a jumpdevaluation of 28Z in March 1983. The drift of 1983-85 was ended withanother jump devaluation of 31Z in September 1986. This accounts for thesteep movement from 1985 to 1987 in the graph. From September 1986 to theend of 1988 the real effective rate has shown P real depreciation of about52 at an annual rate.
GRAPH 3.1: EXCHANGE RATE MOVEMENT
120
110 -
go-I
1=51 1AM IAOS low 18m 18M 1087 1ow
0 NEER + REER
NEER - Nominal Effective Exchage ate.REE - Real Effective Echamge Late.

- 19 -
3.26 Before the jump devaluation of 1986, exchange rate policy wasanalyzed and conducted in terms of the dollar. Since September 1986, ithas been conducted in terms of the effective rate, computed using tradeweights. The Central Bank computes the real effective rate as up to dateas possible. Then on the basis of short-term projections, it can computethe movement of the nominal rate against the dollar that will keep the realeffective rate moving along the desired path.3/ This is approximately therate set daily by the Bank. Since September 1986, the real effective ratehas depreciated at an annual rate of about 5%. The next five-year(REPELITA V) plan assumes an annual depreciation of 5% in real effectiveterms.
3.27 Given that the real effective rate depreciated at an annual rateof 13% on average from 1981 to 1988, one might ask whether a 5% annual rateof depreciation will succeed in maintaining the improvement in the tradebalance that has been achieved since 1986. A potential answer would bethat the tightening of monetary and fiscal policy since 1986 has raised theequilibrium real exchange rate, so that a slower rate of depreciation is inorder. The jump devaluat!on of September 1986 adjusted for theexpansionary policies that had been pursued until then; a slower rate ofdepreciation is justified by the new tighter policies.
3.28 This is a plausible scenario, but the consistency of exchange ratepolicy and monetary and fiscal policy should be carefully moritored in themacroeconomic framework discussed in Chapter 2 of the Report. The3.5Z-4.OZ domestic-international rate interest differentials of 1986 and1987 shown in the bottom line of Table 3.6 may not be consistent with a 5%expected real depreciation, once the persistence of this movement comes tobe perceived by the markets. A monetary policy aimed at maintaining anequilibrium level of reserves may ultimately have to aim at a higherinterest rate differential, as shown in the 1988 correction.
3.29 The balance of payments since 1981/82 is summarized in Table 3.8.Here we focus on the trade and current account developments, and relatethem to the path of the real exchange rate. Earlier we discussed theoverall balance, that is, movements in official net foreign assets. Later,capital movements will be discussed under the heading of the debt strategy.The trade balance shows an improvement from the early 1980s to 1985/86, adrop in 1986/87, as the price of oil fell, and then a sharp recoverybeginning 1987/88. The important underlying movement, however, is in thenon-oil trade position.
3/ The methodology for the computation of the movement of the nominal rateagainst the numeraire that gives the desired movement of the realeffective rate is developed in W. H. Branson and L. T. Katseli,"Cutrency Baskets and Real Effective Exchange Rates," in M. Gersovitz,et al, eds., The Theory and Experience of Economic Development, London,George Allen and Unwin, 1982.

- 20 -
Table 3.8: BALANCE OF PAYMENTS, 1981/82-1988/89(US$ billion at current prices)
Actuals Estimated1981/82 1982/83 1985/86 1986/87 1987/88 1988/89
Merchandise Exports (FOB) 23.0 18.6 18.5 13.7 18.1 19.8- Oil and LNG 18.8 14.7 12.3 7.0 8.6 7.7- Non-oil 4.2 3.9 6.2 6.7 9.5 12.1
Merchandise Imports (CIF) -20.0 -20.6 -14.4 -12.7 -14.2 -15.5- Oil and LNG -5.4 -4.8 -3.2 -2.3 -2.4 -2.1- Non-oil -14.6 -15.8 -11.2 -10.4 -11.8 -13.4
Trade Balance 3.0 -2.0 4.1 1.0 3.9 4.3
Non-factor services (net) -2.6 -1.7 -1.9 -1.6 -1.5 -1.8Interest payments (MLT) -1.3 -1.5 -2.1 -2.4 -2.8 -3.0Other factor services (net) -1.9 -2.2 -2.3 -1.2 -1.5 -1.7Official transfers 0.1 0.1 0.2 0.2 0.3 0.3
Current Account Balance -2.7 -7.3 -2.0 -4.0 -1.6 -1.9- Oil and LNG 9.8 7.2 5.9 2.4 3.8 3.0- Non-oil -12,5 -14.5 -7.9 -6.4 -5.4 -4.9
Public MLT loans (net) 2.2 4.0 1.4 2.7 2.1 2.7- Disbursements (3.3) (5.1) (3.9) (5.2) (6.0) 7.1- Principal Repayments /a (-1.1) (-1.1) (-2.5) (-2.5) (-3.9) (4.4)
Other capital (net) 0.6 0.0 1.5 -1.7 0.7 -1.6Use of net foreign assets -0.1 3.3 -0.9 3.0 -1.2 0.8
Memo Items:Net official reserves 6.4 3.0 5.8 5.0 6.0 5.4
- Months of imports (3.7) (2.0) (5.5) (4.3) (4.6) (3.7)Total net foreign assets 10.8 7.5 12.6 9.6 10.8 /b 10.0Current account/GNP (Z) -3.0 -7.9 -2.4 -5.9 -2.3 -2.5Non-interest current account
balance -1.2 -5.6 0.5 -1.3 1.5 1.6- Z of GNP -1.3 -6.0 0.7 -1.9 2.3 2.1
MLT debt service/exports (Z) /c 10.4 16.8 24.4 37.3 33.9 36.3
/a Includes prepayments of US$420 million in 1985/86, US$626 million in1987/88 and US$341 million in 1988/89.
/b Excludes US$326 million of prepayments, committed during the year but notcompleted until June 1988.
/c Debt service excluded prepayments; denominator is gross exports of goodsand services.
Source: Bank Indonesia and World Bank staff estimates.
- 21 -
3.30 In the early 1980s, non-oil trade showed a deficit of $10-11billion. By 1985/86, before the fall in the oil price and the trade policyreform, this deficit was down to $5.0 billion. In 1986/87, as the net oiland LNG surplus fell by $4.4 billion, the non-oil trade deficit was reducedto $3.7 billion. Adjustment in non-oil trade began as the oil price felltBy 1988/89, under the policies supported by the TPALs, the non-oil deficitis estimated to be down to $1.3 billion.
3.31 Within non-oil trade, imports fell from the level of $14-16 bil-lion in the early 1980s to $11 billion in 1985/86. They remained aroundthat level during the adjustment years of 1986-1988, and are estimated torise to $13 billion in 1988/89, as the import regime is deregulated. Non-oil exports increased from the $4 billion level in the early 1980s to $6-7billion in 1985-87, and are estimated at $12.1 billion in 1988/89. It isdifficult to separate the effects on non-oil exports of the real devalua-tion in 1986 from the trade policy reform, but the jump in non-oil exportsby nearly $3 billion in 1987/88 must be partially attributable to exchangerate policy.
3.32 Non-oil merchandise exports are disaggregated in Table 3.9. Inthe table, it is clear that manufactures have led non-oil export growththroughout the period since the Pr y 1980s, with textiles and plywoodproducts leading until 1986/87. But growth since 1986/87, during theperiod of the TPALs, has been strongest in the diverse group of "others"among manufactured goods. This group was 30Z of manufactures exports in1986/87; by 1988/89 it rose to 38Z. This is a product group that has beengreatly energized by the combination of exchange rate policy and tradepolicy reform.
3.33 A further disaggregation of the other manufactures group is shownin Table 3.10. There, three groups of especially fast growth can be seen.The first is plastics and ceramics, with over 2001 growth per year since1985. The second is a diverse group of glass and metal products,furniture, shoes, and iron and steel, with growth rates of 100Z-125Z. Thethird is a more traditional group of paper and rubber products, andmatting, with 80Z-90% growth. The audit mission visited eight exporters inthe manufacturing sector. All reported positive effects from the exchangerate and trade regimes. One manufacturer of metal and plastic productsreported exports growing from $1.0 million per month in 1987 to $1.5million in 1988 and an anticipated $3.0 million per month in 1989. Thisexporter, and the others in the "other" manufacturing, viewed the change inthe trade regime as permanent and pervasive. They are proceeding with anexpansion of capacity to continue export growth.

- 22 -
Table 3.9: NON-OIL MERCHANDISE EXPORTS, 1982/83-1988/89
Value at Current Prices Real Growth Rates(US$ Million) (Z p.a.)
Actual Estimate 1982/83- 1986/87- 1987/881982/83 1986/87 1987/88 1988/89 1986/87 1987/88 1988/89
AgriculturalCommodities 2,398 3,262 3,885 4,592 7.3 15.0 3.7
Timber Products 575 436 627 760 -4.2 13.8 9.7Rubber 615 /52 1,055 1,278 4.9 12.6 0.6Coffee 363 752 497 555 6.7 -11.4 12.0Palm Oil 103 114 214 328 15.9 23.7 12.4Tea 116 106 119 138 8.2 -5.3 9.2Shrimp 204 317 368 580 7.2 56.9 20.0Rattan 82 99 162 56 6.8 16.5 -67.4Others 340 687 844 898 9.9 23.8 3.0
Minerals & Metals 676 725 1,080 1,381 9.9 15.0 -3.5
Tin 349 156 143 172 -3.0 -8.4 12.8Gold 0 61 308 260 - 347.8 -11.7Aluminum 48 201 245 313 53.4 -14.1 -27.0Copper 115 144 186 227 5.7 7.0 7.9Nickel (Total) 139 112 146 350 -1.6 -20.4 20.8Others 25 52 51 59 27.0 -26.3 -21.3
Manufactured Goods 854 2,744 4,537 6,128 33.8 42.6 27.1
Textiles 180 744 1,283 1,757 42.0 50.9 26.5Plywood/PanelProducts 324 1,156 1,834 2,034 35.5 29.5 10.4
Others 350 814 1,420 2,338 27.1 51.9 45.2
Total Non-OilExports 3,928 6,731 9,502 12,100 13.6 25.8 13.6
Source: Central Bureau of Statistics and World Bank staff estimates.

- 23 -
Table 3.10: MAJOR ITEMS WITHIN "OTHER' MANUFACTURED EXPORTS(US$ million at current prices)
NominalActual Estimate Growth Rate
1985 1986 1987 1988 1985-88( p.a.)
Plastics 1.5 12.5 24.7 56.1 232.7Ceramics 0.5 1.2 4.5 14.1 212.8Glass and Glass Products 8.3 12.7 30.7 93.7 124.1Other Articles of Basic Metal 5.4 7.6 17.4 56.9 119.6Sandal, Shoes 8.2 8.8 23.5 82.6 116.1Furniture 7.1 9.2 27.2 69.7 113.9Iron and Steel 34.2 69.5 196.0 296.2 105.2Paper and Paper Products 20.9 31.8 95.8 138.2 87.5Rubber Products 7.5 11.3 24.2 48.8 86.5Matting 13.3 19.4 47.2 76.4 79.2Cement 21.5 39.8 56.1 75.6 52.1Other 93.8 122.7 91.9 240.7 36.9Processed Food 56.7 81.5 105.9 139.2 34.9Pharmaceutical Products 6.5 7.0 9.4 15.4 33.3Leather and Leather Products 37.5 43.9 53.8 77.6 27.4Fertilizer 80.0 127.3 86.0 134.1 18.8Animal Feed 90.8 97.8 113.2 147.5 17.5
Total 493.5 703.9 1,007.6 1,762.6 52.8
Source: Central Bureau of Statistics and World Bank staff estimates.
3.34 In summary, the exchange rate policy put in place after thedevaluation of 1986 is supporting growth in non-traditional manufacturesexports, as well as exports in the agriculture, mineral, and traditionalmanufact,ires sectors. The anticipation of a continued real depreciationwith an open capital market places a constraint on monetary policy to holdreal interest rates by a prescribed margin well above world rates. If thisbegins to depress domestic investment, the policy of gradual realdepreciation may have to be reconsidered. But during the TPAL period,exchange rate policy succeeded in supporting an extremely rapid adjustmentof the non-oil trade balance.
Macroeconomic Policy Issues
3.35 The two important issues for macroeconomic policy that emerge fromthe above analysis are a possible need to tighten further, or not to ease,on both monetary and fiscal policy, and the maintenance of consistency ofthese poiicy settings with exchange rate policy. The reduction of the realinterest rate differential against LIBOR in 1986 and 1987 may not have been
- 24 -
consistent with continued financing of the current account deficit. Thisrequired some tightening on monetary policy, which happened in 1988. Theslight easing on the fiscal side from a primary surplus of 0.72 of GDP in1987/88 to 0.4? in 1988/89 may need to be reversed. Both of these minorcorrections would contribute to a further reduction in inflation.
3.36 The policy of gradual real depreciation is recognized by theauthorities and the Bank staff to place a constraint on monetary policy tohold real interest rates above world rates. This has not yet had aperceptible depressive effect on investment in the tradeable goods sectorsor in construction. But the connection of interest rates to exchange ratepolicy, and the potential effect of interest rates on investment, makeconsistency of monetary and fiscal policy, exchange rate policy, andinvestment a high priority for the medium-term macroeconomic framework.This priority is recognized in the Report.
3.37 The decline in public capital expenditure has been felt in areascritical to the promotion of economic growth (e.g. power, transportationand telecommunications). However, any rise in public fixed investment willinevitably increase pressures on the non-aid current account deficit aswell as interest rates. This could deter private investment. GOI hasthree alternatives: it could lower its level of net foreign assets,increase borrowings of concessionary foreign assistance, or raise thelevels of domestic savings. While the first two alternatives must be seenas essentially temporary palliatives, the longer-term solution has torevolve around an increase in domestic savings. The opportunities forimproving savings are discussed in Chapter VI.
B. Trade Policy Reform
3.38 Before the deregulation and reform that began in 1986, Indonesiantrade was highly regulated, mainly through a system of import licensing andexport restrictions in some areas and other direct interventions in others.Data are available that indicate the degree of restriction on the importside. The evidence on the export side is more impressionistic. Table 3.11shuws that in mid-1986, 42.9Z of import value was under license, protecting41.4Z of total domestic production and 52Z of manufacturing.
3.39 The policy direction on exports since 1986 has been to reducerestrictions and permit inputs into export production to enter free of dutyand VAT. Some export restrictions remain, such as bans on export of rawrattan, logs, and low-grade rubber, quotas on several agricultural exports,and administratively-controlled, approved exporter regulations and exportquality control. But under the successful implementation of the "May 6"program that was begun on May 6, 1986, producers who export 65Z of theiroutput can import inputs free of duty and VAT. Taxes are paid ex-post oninputs used for domestic production.
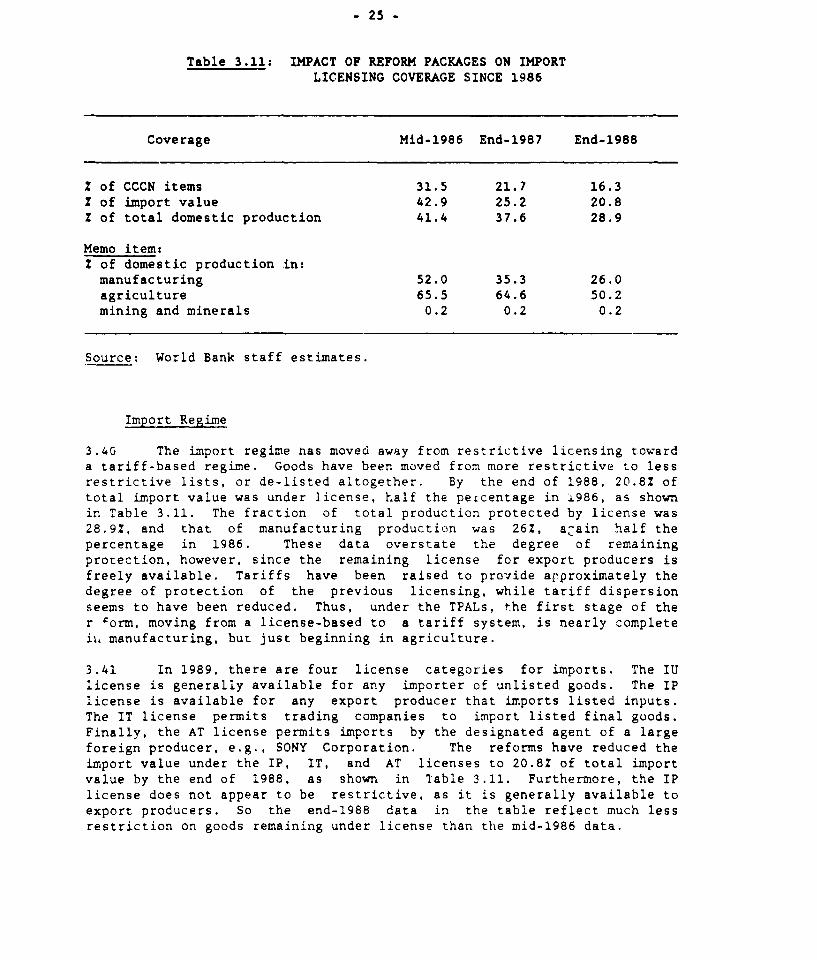
- 25 -
Table 3.11: IMPACT OF REFORM PACKAGES ON IMPORTLICENSING COVERAGE SINCE 1986
Coverage Mid-1986 End-1987 End-1988
X of CCCN items 31.5 21.7 16.32 of import value 42.9 25.2 20.8X of total domestic production 41.4 37.6 28.9
Memo item:Z of domestic production in:manufacturing 52.0 35.3 26.0agriculture 65.5 64.6 50.2mining and minerals 0.2 0.2 0.2
Source: World Bank staff estimates.
Import Regime
3.40 The import regime nas moved away from restrictive licensing towarda tariff-based regime. Goods have been moved from more restrictive to lessrestrictive lists, or de-listed altogether. By the end of 1988, 20.81 oftotal import value was under license, half the percentage in !986, as shownin Table 3.11. The fraction of total production protected by license was28.9Z, and that of manufacturing production was 26Z, aCain half thepercentage in 1986. These data overstate the degree of remainingprotection, however, since the remaining license for export producers isfreely available. Tariffs have been raised to provide arproximately thedegree of protection of the previous licensing, while tariff dispersionseems to have been reduced. Thus, under the TPALs, the first stage of ther 'orm, moving from a license-based to a tariff system, is nearly completeii, manufacturing, but just beginning in agriculture.
3.41 In 1989, there are four license categories for imports. The IUlicense is generally available for any importer of unlisted goods. The IPlicense is available for any export producer that imports listed inputs.The IT license permits trading companies to import listed final goods.Finally, the AT license permits imports by the designated agent of a largeforeign producer, e.g., SONY Corporation. The reforms have reduced theimport value under the IP, IT, and AT licenses to 20.8Z of total importvalue by the end of 1988, as shown in I-able 3.11. Furthermore, the IPlicense does not appear to be restrictive, as it is generally available toexport producers. So the end-1988 data in the table reflect much lessrestriction on goods remaining under license than the mid-1986 data.

- 26 -
3.42 The changes in the tariff schedule for the entire economy aresummarized in Table 3.12, and changes across broad sectors are shown inTable 3.13. Table 3.12 shows the tariff cut that took place in 1985, andthe fairly constant average level since then. This average has beenmaintained as imports have been moved from more restrictive to lessrestrictive license categories. The 1985 cut increased the index of tariffdispersion from 61.5 to 107.8. The index has been subsequently reduced bythe reforms since 1985.
Table 3.12: CHANGES IN THE TARIFF SCHEDULE FORTHE WHOLE ECONOMY SINCE 1985 /a
Pre-1985 1985 1988 1989
Average Tariff Rates (Z)
Unweighted 37.3 27.0 24.0 24.4Weighted- by import value 22.0 13.0 14.5 14.D- I-y domestic production /b 17.1 16.6 17.0
Index of Dispersion /c 61.5 107.8 90.0 84.4
/a "Pre-1985" refers to the 1983 Tariff Law in effect from 1983 to 1985;1985 reflects rates in effect after the 1985 reform; 1988 refers torates in effect after the November 1988 package; and 1989 refers to theHarmonized System as provided by the Department of Finance in February1989. Tariffs are inclusive of surcharges and specific duties havebeen converted to ad valorem equivalents.
/b Based on a sample of 1,200 tariff positions.
/c Measured by the coefficient of variation.
Source: Ministry of Finance, Central Bureau of Statistics and World Bankstaff estimates.
3.43 The weighted (wgt) average tariffs in Table 3.13 show smallincreases from the post-cut levels in 1985 to 1989 in agriculture andmanufacturing, and a large drop in dispersion in manufacturing. Thedispersion index generally fell in the disaggregated manufacturing sectors.Combining the information in Tables 3.11 and 3.13, we see that protectionof the manufacturing sector by import licensing has been reduced by morethan hal.f since 1986, tariff dispersion has been reduced, and the averagetariff level has been maintained. The tariff schedule remains escalated,with effective protection highest for consumer goods and perhaps negativefor intermediate goods. This is the basis for the judgment that the firststage of reform is nearly complete in the manufacturing sector.

- 27 -
Table 3.13: LEVEL AND DISPERSION OF TARIFFSIN BROAD SECTORS. 1985 AND 1989
1985 CCCN Schedule 1989 HS ScheduleAverage Tariff Index of Average Tariff Inder of
UNW WGT Dispersion UNW WGT Dispersion(2) (2) (Z) (Z)
Agriculture 17.4 2.9 69.1 16.9 4.2 69.3
Mining 4.6 1.0 87.6 4.5 1.0 89.7
Manufacturing 28.4 23.8 106.6 25.5 15.4 82.9
A. Manufacturing sectors:- Food, beer, tobacco 36.6 15.6 86.4 28.4 15.0 61.3- Textile and leather 56.0 30.7 74.0 44.0 31.9 43.9- Wood and products 29.6 40.1 46.6 30.8 40.0 41.6- Paper and printing 21.6 17.3 62.9 20.3 10.4 65.9- Chems, petrol., coal 17.0 6.8 137.7 16.7 7.3 113.5- Non-metal minerals 35.5 15.8 86.9 34.1 16.8 63.4- Basic metals 10.4 8.4 71.8 11.7 9.4 112.5- Metal prod., machin. 19.6 16.9 93.6 20.3 19.7 99.4- Other manufacturing 32.0 26.1 54.9 4.1 29.7 49.0
B. Manufactured products:- Consumer goods 46.3 31.9 77.1 39.1 31.3 53.6- Intermediate goods 14.7 9.4 85.9 15.4 9.9 91.7- Capital goods 17.2 13.1 130.4 16.4 16.3 103.7
Key to Table:UNW = unweighted average tariffWGT - weighted average, using import weights
Source: Ministry of Finance and Central Bureau of Statistics.
3.44 In the agricultural sector, the extent of protection by licensingwas the same at the end of 1987 as in the middle of 1986. The first stepsin removing license protection came in November 1988, reducing coveragefrom 64.6% to 50.2% in Table 3.10. The average tariff in agriculture in1989 is much lower than in manufacturing, as is shown in Table 3.13, buthas a high degree of dispersion. This pattern of broad license coverageand low average but highly dispersed tariffs in agriculture reflects aselective use of protection. This presumably leads to over-investment insome low-return agricultural sectors.

- 28 -
3.45 The structure of effective protection in Indonesia as of early1989 is summarized at the one-digit aggregate level in Table 3.14. Theestimates are from a model that is on line at the resident mission. Theyare based on a 1987 study that used the 1981 input-output structure, andthe tariff changes prior to the November 1988 decrees. The study iscurrently being updated.
Table 3.14: EFFECTIVE RATES OF PROTECTION
Industry Sector Output VA(O) VA(U) NRP ERP RERPRps. bill. Z I Z Z Z
1 Food crops 16,450.8 83.6 66.8 15 25.2 10.12 Estate and other crops 5,829.6 74.6 65.6 7 13.6 -0.13 Livestock 4,873.6 49.9 37.7 23 32.3 16.34 Forestry 1,598.2 86.1 107.7 -17 -20.1 -29.85 Fishing 2,132.9 76.8 59.1 25 30.0 14.26 Mining and quarrying 14,785.4 86.4 86.8 0 -0.4 -12.57 Food, beverages and
tobacco 17,976.4 18.1 9.0 23 101.1 76.88 Textiles/clothes/footwear 3,808.2 30.9 14.6 35 111.8 86.29 Wood product;s 3,888.8 36.9 30.8 3 19.9 5.4
10 Paper products 1,123.4 34.2 29.4 22 16.3 2.211 Chemicals 2,856.8 42.2 25.7 21 64.5 44.612 Oil and gas 10,702.4 37.8 38.3 0 -1.2 -13.213 Non-metallic products 5,396.0 33.8 20.9 23 62.0 42.414 Basic metals 1,871.8 39.9 34.7 8 15.0 1.115 Engineering 6,585.8 29.9 13.5 38 121.6 94.816 Other manufacturing 486.9 36.0 17.1 38 111.1 85.6
(0) = Effects of existing policies(U) = Relative to free trade
Source: World Bank Staff Estimates (John Wilton Program, January 1989).
3.46 The last column in the table gives the real effective rate ofprotection (RERP) for the 16 aggregate sectors. The high protectionsectors are foods (7), textiles/clothes/footwear (8), and engineering (15),and other manufacturing (16). The latter is the sector with fastest exportgrowth, as was shown in Table 3.9 earlier. Medium protection in the40Z-45Z range is afforded the chemicals (11) and non-metallic manufactures(13). Negative protection goes to forestry (4), mining and quarrying (6),and oil and gas (12). This ranking of sectors by effective protectionrates may be sensible for Indonesia. Tariff rationalization may involvemainly reducing the range of RERPs, rather than reordering them in a majorway.
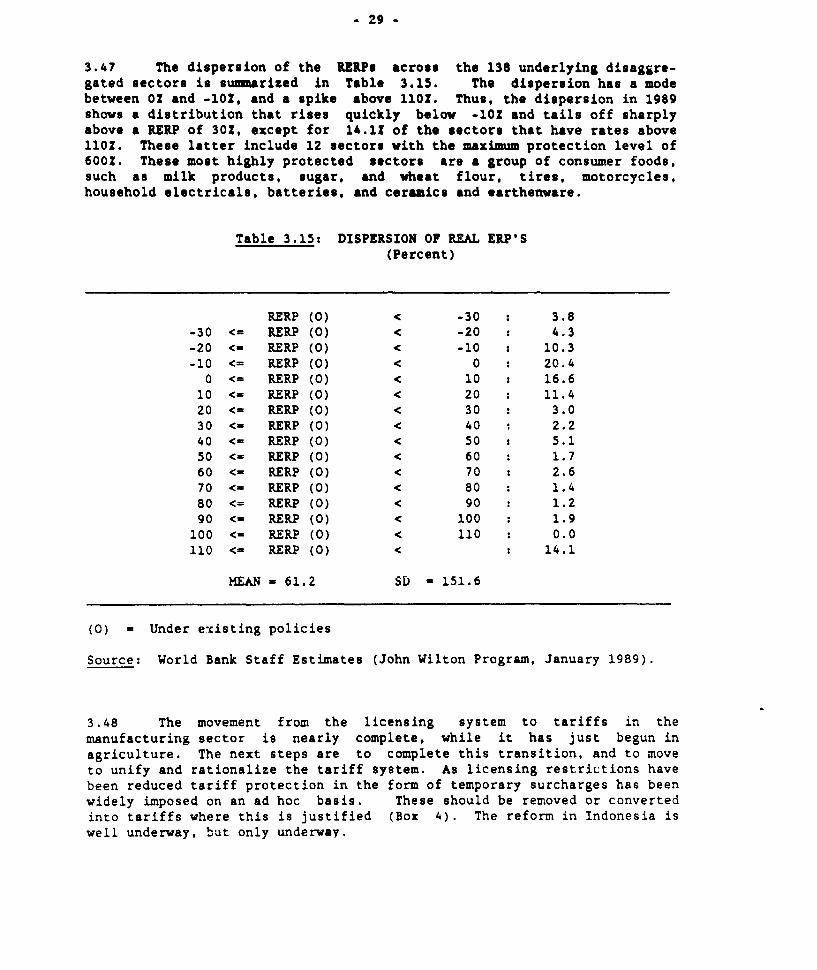
. 29 -
3.47 The dispersion of the RERPs across the 138 underlying disaggre-gated sectors is summarized in Table 3.15. The dispersion has a modebetween O and -10?, and a spike above 110Z. Thus, the dispersion in 1989shows a distribution that rise. quickly below -102 and tails off sharplyabove a RERP of 30Z, except for 14.1% of the sectors that have rates above110Z. These latter include 12 sectors with the maximum protection level of600Z. These most highly protected sectors are a group of consumer foods,such as milk products, sugar, and wheat flour, tires, motorcycles,household electricals, batteries, and ceramics and earthenware.
Table 3.15: DISPERSION OF REAL ERP'S(Percent)
RERP (0) < -30 3.8-30 <= RERP (0) < -20 : 4.3-20 <- RERP (0) < -10 : 10.3-10 <= RERP (0) < 0 20.4
0 <= RERP (0) < 10 : 16.6
10 <- RERP (0) < 20 : 11.420 <- RERP (0) < 30 : 3.030 <- RERP (0) < 40 2.2
40 <- RERP (0) < 50 : 5.150 <= RERP (0) < 60 : 1.7
60 <- RERP (0) < 70 : 2.6
70 <= RERP (0) < 80 : 1.4
80 <= RERP (0) < 90 : 1.2
90 <= RERP (0) < 100 : 1.9100 <= RERP (0) < 110 : 0.0110 <= RERP (0) <: 14.1
MEAN - 61.2 SD * 151.6
(0) = Under existing policies
Source: World Bank Staff Estimates (John Wilton Program, January 1989).
3.48 The movement from the licensing system to tariffs in themanufacturing sector is nearly complete, while it has just begun inagriculture. The next steps are to complete this transition, and to moveto unify and rationalize the tariff system. As licensing restrictions havebeen reduced tariff protection in the form of temporary surcharges has beenwidely imposed on an ad hoc basis. These should be removed or convertedinto tariffs where this is justified (Box 4). The reform in Indonesia iswell underway, but only underway.

- 30 -
3.49 The second aspect of the import regime that requires attention isits administration. The reforms to date have been determined by an ad hoccommittee run from the Finance Ministry, with a shifting membership andpower distribution. The changes are announced by decrees whose specificcontent and timing cannot be forecast. This may be necessary during thefirst stages of the reform, to circumvent the formation of opposingcoalitions against specific reforms. But while the general direction ofthe policy reforms is known to the interested parties, their erraticprogress makes investment decision-making difficult. Thus, gradually thepolicy-making body should be institutionalized, perhaps as an evolvingtariff commission. Any new decrees should be accompanied with cleardirections for their implementation (forms for license applications, etc.)and a clear statement on which previous regulation they supersede. Theobjective should be to make the decision-making processes on both tradepolicy and administration as transparent and predictable as possible.
Export Policy
3.50 Export policy currently, and during the TPAL period, works throughtwo distinct channels. The first is a range of export restrictions, whichare intended to guide the private sector either away from some exportactivities or into particular forms of export activity. The second is the"May 6," or P4BM (for its administration) program, which allows exportproducers to import inputs free of duty and VAT. Progress on removing orrationalizing export restrictions has been mixed since 1986, while the P4BMprogram has been quite successful.
3.51 The export restrictions are bans, quotas, designation of anapproved exporter, and quality controls. The sectors to which they applyare shown in Table 3.16. The bans are aimed at increasing value-addedbefore the export stage. The quotas seem to either have that objective orto secure domestic supply. The approved exporters, or marketing organiza-tions limit access to exporting, and create rents ior those approved.There is an obvious argument for quality control to insure access to theinternational market, but its administration also can provide rents. Theremay be an argument for some of the bans, but their effect on value-addedshould be documented. Similarly, the justification for the quotas and thedistribution of the resulting rents should be examined. The approvedexporter status should be freely granted to applicants meeting clearlystated requirements, and the quality control administration should betransparent. The desirability of the entire system of export restrictionsshould be reviewed.

- 31 -
Box 4: EFFECT OF A SHIFT FROM QUOTAS TO TARIFFS
D SI
U
Pi
L K\P1
HM N
SD1
Quantity
The effect of the switch from quota licensing to tariffsis illustrated here. Domestic supply and demand are SS1 and DD1,respectively. The world price is Pw, and the free trade, domesticoutput would be at point H on the supply curve, consumption at point Ron the demand curve, and imports would be HR. If a quota is imposed atQi, the price rises to Pi, and imports fall to LK. The area LMNK isrent to the licensed import agent. The switch to a tariff can holdimports to LK, if the tariff rate is (Pi-Pw)/Pw. In this case, the rentLMNK becomes tariff revenue to the government, In fact, tariff revenueshave increased by 50Z in Indonesia from 1986/87 to projected 1989/90.

- 32 -
Table 3.16: SECTORS WITH EXPORT RESTRICTIONS, 1989
Restriction Sectors
Export ban Some coffee and rubber, raw and semi-processrattan, hide, logs, scrap and steel
Export quota Fertilizer, salt, flour, rice, paper, soybeans,crude palm oil
Approved exporter Pepper, cassia vera, nutmeg, sawnwood, plywood
Quality control Fish, manioc, shrimp, coffee, tea, pepper,spices, vegetable oil, cocoa beans, rubber,wood products
Source: Report, May 1989, fn 12, p. 61.
3.52 The P4BM program allows export producers to import inputs free ofduty and VAT. A producer who exports 65Z of output can obtain an IPlicense which provides exemption from duty on inputs, with ex-post paymenton the percent used for domestic production. A producer with a smallerexport proportion can obtain a duty drawback ex-post. Data on implementa-tion of the program are shown in Table 3.17. By the end of 1988, 1,098firms were using the program, with $626 million imports actually covered,almost all through exemption. Two aspects of the program deserve somescrutiny. First, approvals are running four times realized imports.Presumably, this is because producers obtain approval for the maximumexpected imports, but the size of the difference remains to be explained.Second, the preponderance of exemptions could mean that the administrationof drawbacks is costly. On the other side, it may be that the 65Zprovision is not binding.
Table 3.17: IMPLEMENTATION OF MAY 6 SCHEME
No. of Value of Imports Value of Taxes /a Processing TimeFirms (US$ million) (US$ million) (No. of days)
Duty Duty For ForApproved Realized Exempt Drawback Exempt Drawback
1986 (July-Dec) 242 236 65 76 0 12 241987 (Jan-Dec) 482 902 297 230 6 7 171988 (Jan-Dec) 1,098 2,447 626 855 20 6 13
/a On approval basis.
Source: Agency for Export Facilities and Financial Data Processing (P4BM).

- 33 -
3.53 The administration of the PABM program seems quite efficient.Table 3.17 shows a short and falling processing time for approval. Theadministration has a program for training exporters to make theirapplications directly using a personal computer, so that approval isimmediate. As of 1989, an export producer can obtain a permanent IPlicense and bring in all imports duty-free through P4BH. The audit missioninterviewed several export firms that were fully satisfied with theoperation of the program.
Trade Policy Issues
3.54 The main issues for trade policy are clear. Deregulation onimports and exports should proceed, and the administration of trade policyshould be rationalized and inbEiLutionalized. The first stage of shiftingfrom a licensing system to a tariff-based system that is approximatelyequally protective on average has been nearly completed for manufactures,and barely begun for agriculture. The second stage of unifying andrationalizing the tariff structure comes next for manufactures. The shiftto a tariff-based system must be completed for agriculture.
3.55 The analysis of effective protection above suggests that the ra-tionalization of the tariff structure can concentrate on the sectors withextremely high tariffs, mostly at the consumer end of the agriculturalsector, and also at the consumer end of manufactures. These tariffspresumably reflect concern about food security and past attempts at importsubstitution in the area of consumer manufacturing. The rationalizationprocess might focus on these two areas.
3.56 On the export side, the priority might be to re-examine the roleof export restrictions. Some of them in the agricultural sector, again,may reflect food security concerns. And some of the quality controls,especially in the agricultural sector, might legitimately reflect concernfor reputation on international markets. But these should be administeredwith clear criteria for entry. The bans that are meant to generateupstream value-added should be evaluated along with local-contentrequirements for foreign direct investment. These policies should be aimedat the same target, and their application, where appropriate, integrated.
3.57 Improvement of the administration of trade policy includes boththe institutional mechanism for making policy, and the mechanism forimplementing and evaluating it. The first stage of deregulation, shiftingfrom licenses to tariffs, may have required that the policy decisions bemade quickly and by an ad hoc, high-level committee, in order to prevent orforestall the formation of effective opposing coalitions. In a sense,policy may have had to be made by a politically moving target in order tosucceed. However, once the import regime is converted to a tariff base,and the export restrictions have been rationalized, trade policy should beset in as transparent and stable a fashion as possible. This will minimizeuncertainty in the private sector and provide a stable environment forinvestment.

- 34 -
3.58 These considerations argue for the establishment of a stable,high-level committee chaired by a minister responsible for trade policy.This group would be responsible for major decisions in rationalizing thetariff structure, removing export restrictions, and regulating inwardforeign investment and trade generally. The trade minister will need abureaucracy that can effectively analyze trade and tariff issues and dealwith GATT questions. The bureaucracy will also need an arm that deals withappeals for protection within the GATT codes, and under the trade legisla-tion set by the policy committee. The bureaucracy might include a tariffcommission that is somewhat independent of the political process, whichwould be responsible for the economic analysis of the tariff and traderegimes.
C. Industrial Policy Reform
3.59 Before the beginning of industrial deregulation in 1986, industryin Indonesia was highly regulated. The jurisdictions and mandates of theregulators at several levels of government was uncoordinated, giving riseto "excessive and sometimes contradictory regulations", to use the words ofthe Report (p. 6). The system was highly controlled but unplanned. Thecombination of domestic investment and capacity licensing and restrictionon foreign investment made Indonesia a country with rigid internal capitalcontrols.
3.60 Provincial and local regulations on investment and land use andlabor regulations further hampered both the level and allocation of invest-ment and economic activity in general. In addition the legal framework forbusiness is outmoded; court decisions are not recorded, for example. Theseinstitutional rigidities are increasingly costly in an economy that ismodernizing and diversifying, and becoming increasingly open.
3.61 In 1986 the government began to ease and rationalize industrialregulation in investment, both domestic and foreign. Continued progress inthese areas is high on the current agenda. At the end of 1988, regulationsgoverning the internal shipping industry were rewritten. Also in 1988,reform measures were taken in the financial sector. These actions show thegovernment's intent to streamline and rationalize the system of industrialregulation, but in this area the action is just beginning.
Investment and Capacity Licensing
3.62 Until 1986, Indonesia had an extremely rigid investment licensingsystem, in which existing firms in a sector essentially had veto authorityover new entrants. The principle guiding licensing of new investments orcapacity expansion was that no new capacity was needed if existing firmswere successfully supplying the market. Since there is always some priceat which supply equals demand, it was rarely difficult for existing firmsto show that they could meet the demand. In this system, the rents did nothave to be sought!

- 35 -
3.63 In 1987, the licensing system was relaxed somewhat. Firms are nowallowed to expand capacity by 30Z with ex post notification rather thanpermission. The categories of products for which investment is licensedhave been broadened so that producers can be more flexible in their choiceof product mix. The number of separate licenses that are needed has beenreduced, and the Investment Authority (BKPM) has instituted a wone-stop"system for obtaining licenses. Operating licenses are now good for thelife of the firm. rather than requiring periodic renewal. Beginning in1986, restrictions on inward foreign direct investments have also beeneased.
3.64 The results of this partial easing of the licensing regime andrequirements on foreign investment are shown in Table 3.18. Domesticinvestment approvals in real terms tripled from 1985 to 1988, and approvedforeign investments more than quadrupled. Since the officials in BKPM getadministrative credit points for the amount of investment they approve, itwould be interesting to obtain comparable data on actual investment. Thesedata are not available, apparently. Nevertheless, real progress is beingmade on licensing and foreign investment.
Table 3.18: INVESTMENT APPROVALS BY BKPM
Period 1985 1986 1987 1988
Domestic (Rp trillion) 3.7 4.4 10.3 14.9Z change 19 134 45
Domestic (1985 prices) /a 3.7 4.1 8.2 10.7Z change 11 100 30
Foreign (US$ billion) 0.9 0.8 1.5 4.4Z change -11 88 193
/a Using WPI general index excluding petroleum exports.
Source: Project Completion Report, Indonesia Trade Policy Adjustment Loan(Loan ), Table 1.
3.65 Much, however, remains to be done. The existing investmentrestrictions are summarized in Table 3.19. The four categories ofinvestment licenses are described in the note. In categories I-III, thehigher category includes the lower ones. Thus, if a sector is open forforeign investment, category I, then it is also open for domesticinvestment, category II, and small-scale investment, category III. Thelicensing system is positive, so the uncove:.1 items, 26% percent of thetotal, can be invested in only at the discretion of the relevant ministry.The restriction "existing firms only" is particularly important in themetal products sector, where the effective protection rates are 85Z-95Z(see Table 3.14).
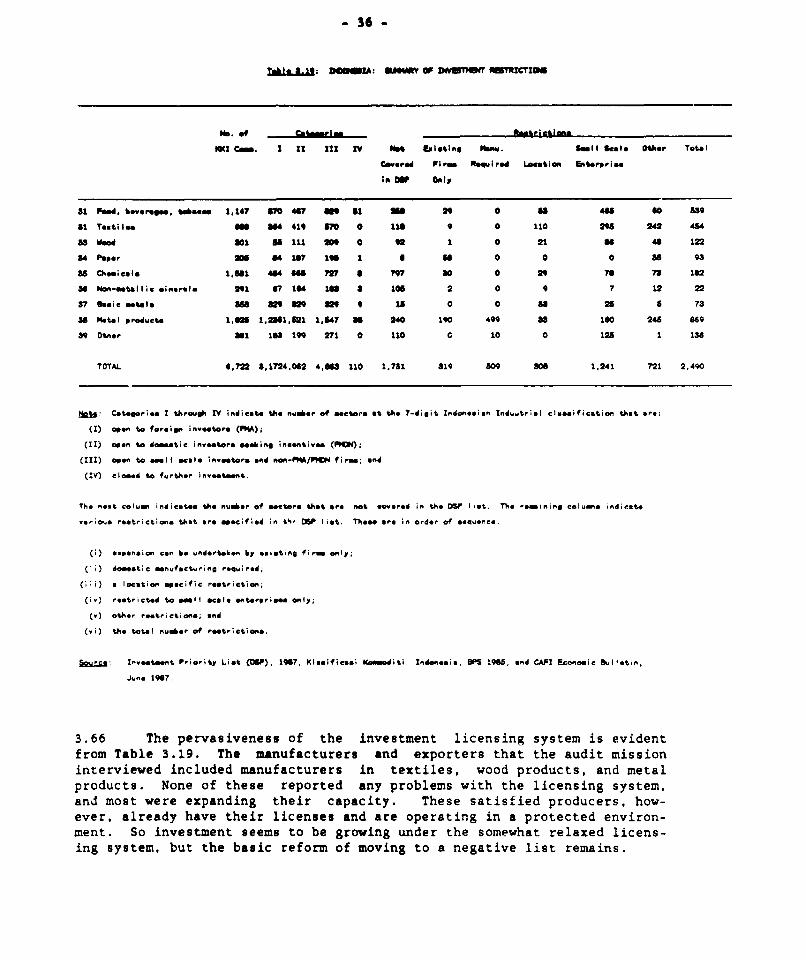
- 36 -
Iale.A.n2: D IA. AnPY OF DW eer MEMICrzIo
MD. of Cataem Rsrtians
MIe Cm. I II 11 IV Net aisleting M1an. S"It Seale other Total
Covered Firma Required Location Enterprise
IN DP Only
81 Feed, baverage. tobeecee 1147 80 467 MS St MA 20 0 al 488 s0 539
81 Texti lem M U4 419 670 0 its 9 0 110 298 242 454
as Wood 801 56111 0N 0 GR 1 0 21 U 48 122
34 Paper 906 04187 106 1 6 88 0 0 0 U8 93
8 Cheeicle 1.S 484 668 727 6 797 30 0 29 75 73 182
36 Non-eetsallic minerla 291 67 164 18 3 106 2 0 9 7 12 22
37 Beasc mtele 88 8 829 8 0 18 0 0 88 21 8 73
38 Metal product. 1,026 1,2311,521 1,847 as 240 190 499 83 10 248 869
39 Otner 31 183 1 9 271 0 110 0 10 0 125 1 138
TOTAL 6,722 8,1724,062 4,688 110 1,761 819 509 306 1,241 721 2,490
-4&: Categories I through IV indicate the number of *ector* at the 7-digit Indonesian Indu.,trial classification that are:
(I) open to foreign investors (PMA);
(II) open to domestic inve*tors eseking incentives (PHDN);
(III) open to amll eel Investors and non-PHA/PMN f irme; and
(IV) Cced to further investment.
The next column indicate the number of sectors that are not covered in the D5P list. The remaining columns indicate
various restrictions that are specified in tS, DSP list, Thee are in order of sauence:
(i) opanmsion can be undertaken by existing firma only;
(;;) domestic manufacturing required;
(iii) a location specific restriction;
(iv) restricted to alI ecale enterprises only;
(v) other restrictions; and
(vi) the total numer of restrictions.
Surce Ineet*nt Priority List (DBP), 1967, Klaifics; Komoditi Indonesia, BPS 195, and CAFI Economic Bulletin,
June 1907.
3.66 The pervasiveness of the investment licensing system is evidentfrom Table 3.19. The manufacturers and exporters that the audit missioninterviewed included manufacturers in textiles, wood products, and metalproducts. None of these reported any problems with the licensing system,and most were expanding their capacity. These satisfied producers, how-ever, already have their licenses and are operating in a protected environ-ment. So investment seems to be growing under the somewhat relaxed licens-ing system, but the basic reform of moving to a negative list remains.
- 37 -
Financial Reform
3.67 The financial industry in Indonesia is highly concentrated, withthe largest five institutions controlling 65Z-75Z of total assets amongbanks, insurance companies, pension funds, and non-bank financialinstitutions (NBFIs). Government involvement is pervasive; the governmentowns the five largest banks. Bank Indonesia (BI) subsidizes lending forinvestment via a system of liquidity credits, in which commercial banks canrefinance loans at BI at rates well below market. These credits are around402 of total private credit, and over 80Z of them flow through state banks.
3.68 In October and December of 1988, the government announced majorreforms for the financial industry. The main objectives are to improve itsefficiency and to increase the availability of long-term financing.Several measures were aimed at increasing the ease of entry into thebanking sector, notably for foreign and rural banks. Strte enterprises cannow place up to 50% of their deposits with non-state banks. Limits oninterbank borrowing were eliminated, and the maturity of SBIs (the noteissued by BI in lieu of government debt, used as the counterpart in open-market operations) was increased from 7 days to 6 months. Maximum loanconcentration ratios and minimum capital requirements were specified forbanks and NEFIs. An OTC market has been established, and private stockexchanges are now allowed to be established. Reserve requirements wereunified, and set at 2Z.
3.69 These measures are a substantial departure from past practice, andtheir implementation will strengthen the industry. Freer entry and theprovision for capital requirements and maximum loan concentration shouldreduce the spread of lending rates over deposit rates. Allowing depositsfrom state enterprises to non-state banks will strengthen their position.Whether the reserve requirement should be set so low is an issue we take upbelow. One might also question the emphasis on long-term finance. It maybe better to concentrate on improving BI regulation of the banking system,recognizing that investors can roll over short-term debt with confidence,as long as the banking system is stable.
Industrial and Financial Policy Issues
3.70 The most important next step in industrial policy is eliminationof the investment licensing system in favor of a free system with a shortnegative list of controlled sectors. This should be followed byrationalization of the provincial and local regulations governing invest-ment. These steps would allow Indonesia to make a substantial move towardits efficiency frontier. A second major priority is to revamp, or ratherto create, a credible legal structure for business. This should includespecific and enforceable bankruptcy provisions.
3.71 In the financial sector, formulation of prudential regulations andstrengthening BI's supervisory capacity and performance are the highestpriority. The reforms of 1988 are a major step in the right direction; theBI staff and procedures should be strengthened in order to implement them.The one potentially troublesome step in the 1988 reforms is the low setting

- 38 -
of the reserve ratio. This may appear desirable for reducing the spread.But with SBIs available at 152, one can expect the banking system to stayloaned up. As long as there is a substantial spread between the rate on asafe asset and zero-return reserves, there is no reason to expect banks tohold excess reserves. This means that the money multiplier will becomevery large, reaching 50 at the limit. This will make the monetary systemextremely sensitive to open-market operations. Either paying interest onreserves or an increase in the reserve ratio would reduce this sensitivity.
3.72 Overall, the progress made in industrial policy reform beginningin 1986 is quite substantial. A good beginning has been made, and theobjective of policy now should be to keep up the momentum.
IV. IMPACT OF THE ADJUSTMENT PROGRAM
4.01 The impact of the adjustment program at the macroeconomic levelhas been discussed in detail under the heading of "macroeconomic policy* inChapter 3. The growth rate of real national income was maintained at 42-5Zin 1987 and 1988, despite terms of trade shocks of 132-15% each year.Inflation was heid below 1OZ as measured by the CPI or non-oil GDP deflatordespite a 312 devaluation in 1986. The rate of inflation in non-tradedgoods prices was 4.7Z in 1988. Non-oil exports doubled from 1985/86 to1988/89, and the non-interest current account shows a surplus of about 2.6%in 1988/89. The debt service and debt to GNP ratios increased as oilrevenues fell, but these stabilized in 1987-88, and are projected to fallbeginning in 1989. Thus, the combination of tight monetary and fiscalpolicy, and devaluation that did not get passed through into wages and non-traded prices, and therefore moved the real exchange rate, resulted in anexemplary adjustment effort at the macro level.
4.02 The impact has also been striking at the sectoral and microlevels. The growth of non-oil manufacturing has been especially strong; itis now the fastest growing sector in the economy. Non-oil exports nowfinance nearly 852 of non-oil imports. On the expenditure side, however,the impact has fallen mainly on investment. The ratio of consumption toGDP was about the same in 1988 as in 1981. So the burden of adjustment hasbeen largely shifted to the future, in the form of reduced investmentduring the adjustment period.
4.03 This pattern of adjustment may be good policy in the Indonesiancase. During a period of major transition in the economic regime aninvestment pause might be expected, as private and public investors wait tosee the shape of the new economy. In addition, it may be essentialpolitically to maintain consumption during the transition, in order not todiscredit immediately the change in policy. And the efficiency gains fromthe reforms could easily raise the growth path relative to the one thatexisted after the shocks but before the reforms. Thus, the point here isnot to criticize the choice of the composition of expenditure adjustment,but to caution that investment should increase as a share of GDP in thenear future, as the economy is re-shaped along more outward- and market-oriented lines.

- 39 -
4.04 In this chapter we discuss the sectoral and micro impacts ofadjustment summarized above. First we look at the sectoral adjustment onthe production side. Next we look at the expenditure side. Then we turnto impacts on income, employment, and social indicators.
A. Structure of Production
4.05 Some important aspects of the changes in the structure ofproduction are summarized in Table 4.1. Indonesia's dependence on oilincome has been substantially reduced and the role of more promising andsustainable sources of growth such 4s manufacturing has increased. Thestrong positive response of non-oil exports, manufacturing production, andprivate investment to the adjustment program has been especiallyencouraging. The process of structural transformation is not complete, butwith sustained progress in implementing on-going reforms and initiatIng newpolicy changes in required areas, Indonesia can be expected to reach ahigher real growth path on a self-sustained basis.
Table 4.1: INDONESIA'S ECONOMIC STRUCTURE, 1981/82-1988/89(Percent)
1981/82 1985/86 1988/89
Oil/LNG to Total Exports /a 80.8 66.6 35.8Non-Oil Exports to Non-Oil Imports /a 28.8 55.4 90.3Oil/LNG Revenues to Total Revenues 70.7 57.5 41.3Government Expenditure to GDP 22.1 22.6 20.1Private Fixed Investment to Total Fixed
Investment /b 52.1 47.9 56.9Manufacturing to Non-Oil GDP /b 8.4 8.8 9.5
/a Goods only; in current dollars.lb Calendar year basis; in 1983 prices.
Source: World Bank staff estimates.
4.06 The adjustment program also helped to sustain a better thanexpected rate of economic growth, despite the loss of oil income and taxrevenues. As shown in Table 4.2, economic growth was reduced significantlyover the adjustment period, but remained positive, even in per capitaterms. The contribution of factors underlying rapid growth during the1970s--rice, import-substituting manufacturing and large public investment--weakened in the adjustment phase. Nevertheless, given the severity ofthe external shocks, the ability to sustain a 3Z per year growth rate of

- 40 -
the overall economy and a 4Z growth of the non-oil economy whilestabilizing the budget, the current account, and inflation is a notableperformance. Furthermore, there are encouraging signs of economic recoveryas indicated by the upward trend in the rate of growth of the non-oileconomy since 1987, reaching 5.1Z in 1988.
4.07 The recovery in the growth uf non-oil manufacturing in 1987 and1988 is an important aspect of the data in Table 4.2. During the 1970s,import-substituting manufacturing grew rapidly. Table 4.2 shows a growthrate of 14.1Z per year for non-oil manufacturing in 1974-81. The slumpduring the adjustment period reduced the average growth for 1982-86 to 42.But by 1988 the yearly growth rate in non-oil manufacturing was up to 92,the fastest-growing sector once more. The encouraging aspect of thisresurgence of growth in non-oil manufacturing is that now it is export-oriented. This is now the leading growth sector of the economy.
Table 4.2: OVERALL AND SECTORAL GDP PERFORMANCE, 1973-1988 /a(Real Growth, Percent Per Annum)
1973-81 1981-86 1987 1988
GDP 7.5 3.0 3.9 4.7Non-Oil GDP 8.0 3.9 4.6 5.6Agriculture 3.4 2.7 1.8 3.8Manufacturing /b 14.1 4.0 7.1 9.0Services, etc. 10.0 4.5 5.6 5.6
Memo Item:Per Capita GDP 5.2 0.8 1.9 2.7
/a CBS is currently reviewing its data and methodology for estimating GDP.This is expected to result in higher estimates of real growth rates forsome sectors, especially in 1988.
/b Excludes LNG and oil refineries.
Source: Central Bureau of Statistics.
B. Impact on Expenditure
4.08 The lower growth of GDP in conjunction with the deterioration inthe terms of trade had an adverse effect on national incomes during1982-86, as is shown in Table 4.3. The reduction in revenues brought aboutsubstantial cutback in public investment. F-rivate investment fell notice-ably up to 1985 but has been recovering since then. The growth rate of

- 41 -
private consumption also declined significantly, although consumption grewfaster than national income. Overall, the main adjustment came in thepublic sector, especially in public investment. As a result of expenditurerestraints, especially the large reduction in budget-financed capitalspending, the share of public expenditure (consumption and investment) fellfrom 22.4Z of GDP in 1981 to 18.0 in 1988. In the private sector, thedecline in investment growth in the first few years of the adjustmentperiod was caused by higher real interest rates and lower aggregate demand.Since 1986, private investment has been recovering, responding to improvedincentives resulting from regulatory reforms and a more buoyant level ofeconomic activity.
Table 4.3: IMPACT OF ADJUSTMENT POLICIES ON NATIONAL EXPENDITURE(1973-1988)
Composition ofReal Growth Rate Expenditures
(2 p.a.) (2 of GDP) /a1973-81 1981-88 1987 1988 1981 1988
National Income /b 11.4 1.8 4.7 4.8 97.9 88.6
Consumption 8.2 3.3 2.2 4.0 69.5 69.3Public 10.1 2.2 -3.7 1.5 10.6 9.8Private 7.8 3.4 3.3 4.4 58.9 59.5
Fixed Investment 11.7 -0.5 1.9 7.0 24.7 18.9Public 11.0 -2.0 -1.7 6.3 11.8 8.2Private 12.3 0.7 4.9 7.6 12.9 10.7
Memo Item:Per Capita National Income 9.1 -0.2 2.7 2.8Per Capita Private Consumption 5.5 1.4 1.3 2.4
/a In 1983 prices.lb Gross National Income corrected for terms-of-trade changes.
Source: Central Bureau of Statistics and World Bank staff estimates.
4.09 The sharp decline in the growth rate of investment over the1981-88 period as a whole has reduced the pace of capital formation,thereby lowering the expansion of the economy's productive capacity. Theadverse effect on output growth, however, has been partially offset byimprovements in the efficiency of use of cap,tal, brought about by improvedallocation of resources resulting from interest rate deregulation, realexchange rate depreciation, regulatory reforms and reordering of public

- 42 -
expenditure priorities. Although there is still substantial scope forfurther efficiency gains, it will be difficult to sustain economic recoveryover the medium term without a sustained expansion of private investment.Similarly, continued cutbacks in public infrastructure investment can haveserious adverse effects on the profitability of private investment over themedium term by creating bottlenecks resulting from inadequate availabilityof essential services.
C. The Social Impact of Adjustment
4.10 The pace and pattern of real growth is a critical determinant ofemployment and earnings. Given the structure of Indonesia's labor markets,a slowdown in economic activity is largely manifested in a reduction inlabor earnings rather than in employment levels.4/ However, in the urbanformal sector, economic growth is a determinant also of the level ofempl-yment. Indeed, available evidence suggests that there has been anincrease in the rate of open unemployment in the urban areas. Much of thisunemployment is concentrated among upper-secondary school leavers. Because
flexibility of urban educated job seekers is rather limited, a slowdown indemand, brought about by lower economic growth and budgetary resourceconstraints, has reduced the rate of their absorption in employment.
4.11 For the bulk of the work force (outside urban formal employment),the main adjustment burden has fallen on earnings. Thus, labor earningshave fallen in trade, and real wages of construction workers and civil
servants have stagnated. In manufacturing, real wages have continued togrow, but at a slower pace than before the external shocks. Real wage
rates in ag.iculture have also stagnated. On the whole, available evidence
suggests a stagnation or even a decline in real labor earnings during theadjustment period.
4.12 As noted, the average inflation rate came down in the adjustmentperiod, especially for non-traded goods. Howevpr, specific price indexes
for low-income rural groups show higher inflation rates than the geneial
indicators and the surge in rice prices during 1987-88 appears to havesignificantly hurt the poor. Thus, reflecting the higher rice prices, the
cost of nine essential commodities (index] in 1988 grew by 13Z for urbanareas and by 17Z for rural areas. These price increases were higher than
the economy-wide indicators of inflation (9Z-102 for the CPI and non-oil
GDP deflator).
4/ Recent data show that more than half of all employment is in agricultureand over 70Z in rural areas. Employment outside agriculture is
concentrated on services, with manufacturing accounting for only 20Z of
non-agricultural employment. Outside government services, low and
unstable earnings in informal sector activities predom,nate in urban
areas. The considerable flexibility of rural and urban informal labor
markets allows a rapid expansion of emp:oyment during periods of low
economic growth, but at reduced real earnings.

- 43 -
4.13 Apart from economic growth, specific government expenditure pro-grams can have a significant impact on the living standards of the popula-tion, especially of the poor. Important in this respect are expenditureson education, health, family planning, water supply and housing. Buoyed bygrowing oil revenues during the 1970s, the Government financed large expan-sion programs in many of these areas, especially in health, family plan-ning, and education. The resource crunch that occurred in the wake of theexternal disturbances has severely limited the growth of these expendi-tures. The Government has responded by redefining priorities, aimed atprotecting important social programs (INPRES) and improving the quality ofservices (emphasis on O&M). Nevertheless, there is some evidence that theavailability and quality of many essential services may have weakened.5/
V. SUSTAINING PROGRAM BENEFITS
5.01 Responding to the sharp decline in its income, resulting from thefall in international oil prices in the early 1980s, Indonesia initiated atwo-pronged effort to stabilize its economy and establish the conditionsfor longer term economic growth through structural adjustment. Theseefforts have resulted in considerable dividends for the economy. Anunfinished igenda, however, still remains. The success with whichIndonesia addresses this agenda will determine the degree to which thebenefits of the adjustment can be sustained. The principal issues are:(a) investment promotion; (b) savings mobilization; (c) private sectordevelopment; aind (d) export performance and debt management.
(a) Investment
5.02 The retrenchment in national expenditure that accompanied theeconomic stabilization program inevitably left its stamp on public expen-diture, whose share fell from 22Z of GDP in 1981 to 171 in 1988. Privateinvestment also declined in the early years of the adjustment period, buthas recovered somewhat since 1986. There is a need to increase thenational investment rate from the present 18Z of GDP, in order to promotehigher levels of growth and provide much needed infrastructure in the areasof power, transportation, and telecommunications; these investments shouldfacilitate private investment in the non-oil sector, which will constitutethe mainstream of growth in the future. The adjustment process alsoaffected investments in social development, e.g. health and education.Efforts to redress this, and especially to increase the absorption ofadditions to the work force, will necessitate an increase in investment.
5/ Some partial indicators reported in the Bank's sector work include: therelative neglect of the KIP programs; the inability to achieve the pipedwater supply targets; the reduced quality of health services; lowquality of schooling; and resource cu,backs in family planning andnutrition programs.
- 44 -
(b) Savings Mobilization
5.03 The promotion of an enhanced volume of investment in a non-inflationary environment and avoidance of an increase in external debt,would require a corresponding increase in savings effort. Table 5.1reveals that there has been a steady decline in national savings and theresulting savings investment gap has been consistently financed by foreignsavings. A low savingslinvestment ratio could exercise a binding con-straint on future economic growth. The current burden of debt service alsosuggests that the growth in savings will need to exceed the growth in GDPfor several years. Fortunately for Indonesia, there are several avenuesfor improving its savings effort.
5.04 Despite improvements in the efficiency of tax administration andthe introduction of the VAT, there is considerable scope for improvingIndonesia's tax effort, which lags considerably behind that of itscomparators in the ASEAN region. Private savings have responded to theimprovement in real interest rates recently, but further efforts may beneeded to improve the efficiency of the financial intermediation process.Further improvements in the process of savings mobilization are alsopossible through an improvement in the financial performance of publicenterprises.
(c) Incentives for Private Sector Development
5.05 The reforms associated with the structural adjustment process haveled to a sharp improvement in the growth of non-oil GDP, resulting in arapid increase in its share of exports. The core policy instrument in thisstrategy has been the maintenance of a competitive real effective exchangerate combined with reforms in the trade regime, which removed the anti-export bias. These measures were reinforced by considerable progress inliberalizing the regulatory framework governing foreign and domesticprivate investment, production capacity, and exports. While much has beendone to improve the environment for facilitating production, furtherderegulation measures, supported by policies to simplify and codify thelaws relating to corporate and commercial activities, need to be addressed.
5.06 The interest rate strategy pursued by GOI also has an importantrole to play in a strategy for promoting private sector investment. Theeconomic stabilization measures that were implemented led to high realinterest rates. While this has led to an incentive for savers, it hasacted as a disincentive for investors. One aspect of this problem derivesfrom the large differential between deposit and lending rates in thebanking system. While the spread has fallen from the very high levels ofearlier years, continued attention to this facet is necessary if privateinvestment is to be promoted. The high domestic interest rates are also areciprocal of the external current account deficit. Given Indonesia's opencapital markets, the financing of this deficit necessitates an interestrate that is high enough to compensate for expected exchange depreciationand inflation.

- 45 -
Table 5.1: SAVING-INVESTMENT BALANCES, 1981-1988 /a(Percent of GDP at Current Prices)
1981 1982 1983 1984 1985 1986 1987 1988
Total Domestic Investment 29.7 29.1 27.7 25.5 24.3 23.4 23.2 22.2Fixed Investment 24.2 25.9 25.7 22.5 20.8 20.5 19.9 20.3Change in Stocks 5.5 3.3 1.9 3.0 3.5 2.9 3.3 1.9
National Savings 27.8 22.6 21.4 22.0 22.0 17.6 20.0 19.8Saving-Investment Gap - 1.9 - 6.5 - 6.3 - 3.5 - 2.3 - 5.5 - 3.2 - 2.4Foreign Savings /b 1.9 6.5 6.3 3.5 2.3 5.5 3.2 2.4
Public SectorGross Domestic
Investment /c 10.7 12.7 12.6 10.3 10.9 9.7 9.3 9.1Savings 9.2 8.2 9.4 10.2 8.3 4.9 5.7 6.0Saving-Investment Gap - 1.5 - 4.5 - 3.2 - 0.1 - 2.6 - 4.8 - 3.6 - 3.1
Private SectorGross Domestic Investment 19.0 16.4 15.1 15.2 13.4 13.7 13.9 13.1Fixed Investment 13.5 13.2 13.2 12.2 9.9 10.8 10.6 11.2Change in Stocks 5.5 3.3 1.9 3.0 3.5 2.9 3.3 1.9Savings 18.6 14.4 12.0 11.8 13.7 13.0 14.3 13.8Saving-Investment Gap - 0.4 - 2.0 - 3.1 - 3.4 0.3 - 0.7 0.4 0.7
/a All data converted to calendar year basis./b Current account deficit./c Fixed investment only. Investment in stock changes is assumed to be
financed by the private sector.
Source: Central Bureau of Statistics and World Bank staff estimates.
(d) External Trade and Debt
5.07 There are several elements in the international economic environ-ment that have a bearing on Indonesia's efforts to promote growth withfinancial stability (see Table 5.2). Foremost is the growth in the worldeconomy, because the transmission effects via Indonesia's terms of tradecan make a significant difference. OECD growth prospects are crucial tothe success of this effort but equally, concerted efforts are needed toreduce or eliminate trade barriers on Indonesian exports of manufactures.In the absence of such liberalization, the growth in Indonesia's non-oilexports could well slow down over the next decade.
5.08 A large portion of Indonesia's fcreign debt is denominated incurrencies that have appreciated in terms of the United States dollar.Dollar depreciation has exacerbated Indonesia's debt service payments in

- 46 -
recent years. Unless there is a significant rise in export earnings, thistoo could exercise a binding constraint on future growth, unlesscompensated for by a rise in net resource transfers to Indonesia onconcessionary terms. Indonesia's strategy of prepaying some of itsexternal debt is one way of offsetting the adverse consequences of dollardepreciation on its external debt service. In the past, it seems thatIndonesia has lost when the U.S. dollar depreciated, because thedenomination of the debt was skewed away from the U.S. dollar relative tothe denomination of export receipts. If this has been the case, BankIndonesia should avail itself of IMF facilities for diversifying its debtdenomination to optimal portfolio proportions.
Table 5.2: SELECTED INDICATORS OF INTERNATIONALECONOMIC ACTIVITY, 1988-2000
Estimated Projected Growth Rate(Z p.a.)1988- 1990- 1995
1988 1989 1990 1995 2000 1990 1995 2000
Economic ActivityOECD Growth (Z p.a.) 4.0 2.0 2.3 3.0 3.0 2.2 3.0 3.0
Price Indices (1985=100)Commodity Prices inConstant Dollars /b 84.0 78.7 77.1 81.8 81.2 -4.6 1.2 -0.1
Manufacturing UnitValues in CurrentDollars 140.7 149.5 151.7 183.0 226.6 3.8 3.8 4.4
Oil Prices (US$/barrel)In 1985 Dollars /c 10.7 10.4 10.9 12.0 13.4 1.0 1.9 2.2In Current Dnllars 15.0 15.5 16.6 22.0 30.4 7.0 5.8 6.7
Interest Rates (Z)LIBOR /d 8.0 8.5 8.4 6.9 6.7Real Interest Rate /c 4.2 3.1 2.8 2.4 1.7
/a End of period./b Nominal price index for 33 commodities (excluding energy), deflated by the
World Bank's manufacturing unit value (MUV) index./c Deflated by MUV index./d Six-month London Interbank Offered Rate./e LIBOR deflated by the change in the US GNP deflator.
Source: World Bank staff estimated.

- 47 -
VI. ROLE OF THE BANK
6.01 The Bank's strategy for promoting the trade adjustment policy reformsdeparted from its conventional pattern in that rather than making the loanconditional on the implementation of agreed policy reforms and tranchingdisbursements to accord with performance, it designed the loans as a supportingmechanism for actions that were taken within an agreed framework of a medium-term adjustment program. This strategy has apparently succeeded very well.There were two reasons for this. First, the Indonesian authorities had beenexposed to a range of in-depth and high quality economic and sector workconducted by the Bank for almost a decade. The assistance of the ResidentMission, which was well staffed and complemented by economists fromheadquarters, enabled the Bank to participate in an active policy dialogue andto render whatever help was needed in addressing day-to-day problems in economicmanagement. Second, the onset of the economic crisis precipitated by the fallin the price of oil in the early eighties, and subsequently in 1986, offered theadministration an opportunity to implement adjustment measures which were longoverdue. The Bank was positioned to capture this very effectively.
(a) Economic and Sector Work
6.02 Beginning in early 1980 and subsequently in 1985, the Bankcompleted studies of Trade and Industrial policy issues. They set the tone
for key reforms relating to deregulation and trade. These were followed up
by technical assistance to the Government's Trade and Industrial Policy
Steering Committee and the mounting of a study of the Financial Sector. In
conducting its policy dialogue on macroeconomic issues, the Bank focussed
intensively on five areas:
(i) exchange rate management(ii; fiscal and monetary policy
(iii) resource mobilization and tax administration
(iv) public expenditure priorities, and(v) external debt management.
These were highly pertinent to the adjustment effort. The appraisal andsupervision of the two Trade Policy Adjustment loans facilitated this
dialogue.
(b) Coordinating the Assistance Strategy
6.03 The two Trade Policy Adjustment Loans played a catalytic role in
mobilizing donor support within the umbrella of the IGGI, for Indonesia's
adjustment effort. A significant part of the loans were on concessional
terms and this enabled GOI to address the twin problems of debt management
resulting from the depreciation of the U.S. dollar, and rising
international interest rates. The combined effect of early prepayment of
commercial debt facilitated by concessional loans--and the improved fiscal
effort put Indonesia into a position where it could cope with the servicing
of its external debt over the coming years, without seriously jeopardizing
its development effort.

- 48 -
(c) Cooperation with the IMF
6.04 A close and continuous dialogue evolved with the IMF throughoutthe adjustment program. IMF staff reviewed reports associated with TPAL Iand TPAL II and supported the loans. IMF representatives were also invitedto Board presentations of the loans. The most recent IMF ConsultationReport was released on April 15, 1988. Indonesia has no standby arrange-ment or extended arrangement with the IMF. Indonesia's last purchase fromthe IMF amounted to SDR 463 million in May 1987 under the CompensatoryFinancing Facility. This purchase increased Indonesia's total outstandingIMF obligations to SDR 505 million at the end of 1987. After the lastConsultation Report, the IMF Executive Board expressed its satisfactionthat Indonesia's exchange system remained free of restrictions on paymentsand transfers for current international transactions. Indonesia acceptedArticle VIII status in the Fund, with effect from May 7, 1988.
(d) Conditionality
6.05 No ex ante conditionality was attached to TPAL I and TPAL II.When the Bank and the country are in an on-going cooperative relationship,there appears to be little need for specific conditionality. The countryknows that if it deviates from the policy course that it and the Bank haveagreed on, even implicitly, it may have to forego Bank assistance in thefuture. So the Rank can rely on the country's interest in maintaining"good standing" with the Bank. In this situation, the Bank can lend,conditional on past events, as predictors of the future course of policy.
(e) Loan Administration and Coordination
6.06 Procurement and disbursement procedures of TPAl I and II weredesigned to ensure rapid drawdown of loan proceeds. The loans were used toreimburse 100% of foreign expenditures for eligible imports by the publicor private sector for which payments were made after the date of loansigning. There was no retroactive financing under the loans. The loansspecified a standard list of ineligible imports, i.e., goods intended formilitary and paramilitary purposes, or for luxury consumption; goodsfinanced from other official multilateral or bilateral sources; uranium;and goods procured under contracts of less than US$100,000. Bank Indonesiawas responsible for maintaining and administering the loan account.
6.07 All purchases in the amount of US$5 million equivalent or morewere to be procured through International Competitive Bidding (ICB) inaccordance with Bank guidelines. Procurement by the private or publicsector of goods contracted at a price less than US$5 million equivalentwere handled on the basis of normal commercial practice or following normalGovernment procurement procedures acceptable to the Bank. Disbursements ofeligible import expenditures were based on Statements of Expenditures(SOEs) for imports valued at less that US$5 million; for imports above thisamount full documentation was required. Since all contracts submitted tothe Bank by the Borrower were below US$5 million, no ICB was involved inprocurement, and the loans' were disbursed on the basis of SOE procedures.
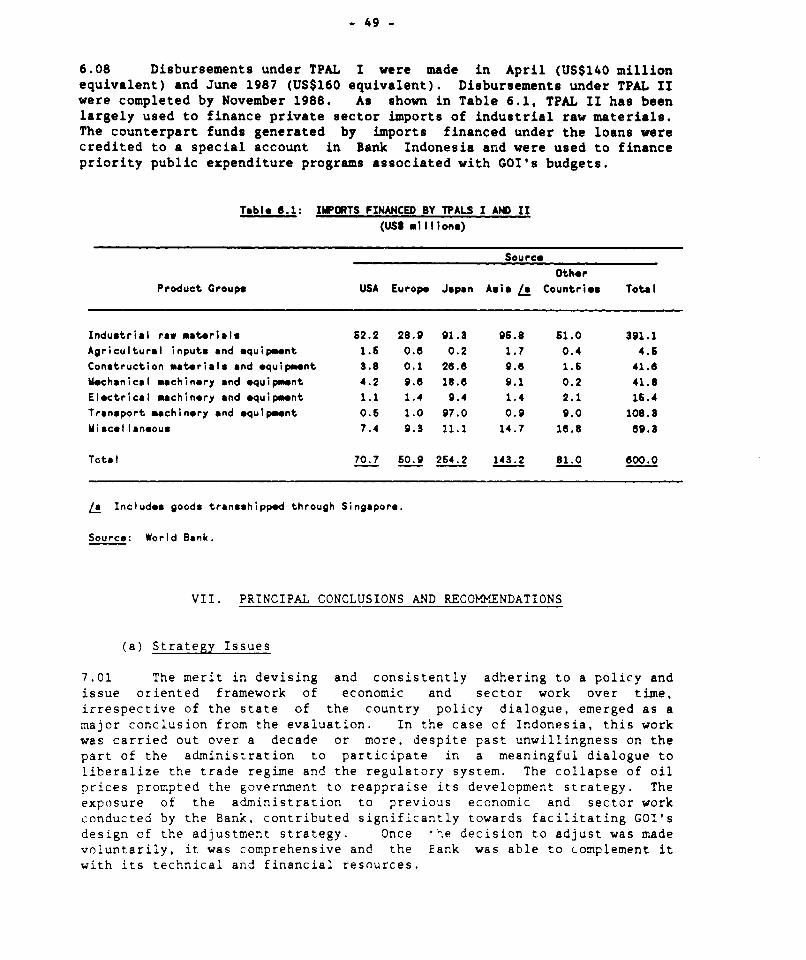
- 49 -
6.08 Disbursements under TPAL I were made in April (US$140 millionequivalent) and June 1987 (US$160 equivalent). Disbursements under TPAL IIwere completed by November 1988. As shown in Table 6.1, TPAL II has beenlargely used to finance private sector imports of industrial raw materials.The counterpart funds generated by imports financed under the loans werecredited to a special account in Bank Indonesia and were used to financepriority public expenditure programs associated with GOI's budgets.
Table 6.1: IMPORTS FINANCED BY TPALS I AND II(US millIons)
SourceOther
Product Groups USA Europe Japan Asia / Countries Total
Industrial raw materials 62.2 28.9 91.3 96.8 51.0 391.1Agricultural inputs and equipment 1.5 0.6 0.2 1.7 0.4 4.6Construction materials and equipment 8.8 0.1 26.8 9.6 1.6 41.6Mechanical machinery and equipment 4.2 9.6 18.8 9.1 0.2 41.8Electrical machinery and equipment 1.1 1.4 9.4 1.4 2.1 15.4Transport machinery and equipment 0.5 1.0 97.0 0.9 9.0 108.3Miscellaneous 7.4 9.3 11.1 14.7 18.8 69.3
Total 70.7 50.9 254.2 143.2 81.0 600.0
L Includes goods transshipped through Singapore.
Source: World Bank.
VII. PRINCIPAL CONCLUSIONS AND RECOMMENDATIONS
(a) Strategy Issues
7.01 The merit in devising and consistently adhering to a policy andissue oriented framework of economic and sector work over time,irrespective of the state of the country policy dialogue, emerged as amajor conclusion from the evaluation. In the case of Indonesia, this workwas carried out over a decade or more, despite past unwillingness on thepart of the administration to participate in a meaningful dialogue toliberalize the trade regime and the regulatory system. The collapse of oilprices prompted the government to reappraise its development strategy. Theexposure of the administration to previous economic and sector workconducted by the Bank, contributed significantly towards facilitating GOI'sdesign of the adjustment strategy. Once t.e decision to adjust was made
voluntarily, it was comprehensive and the Eank was able to complement itwith its technical and financial resources.
- 50 -
7.02 The second conclusion which emerges from the evaluation is thatstructural adjustment works better in a stable financial environment. Thismeans that economic stabilization precedes structural adjustment. InIndonesia's case, the process of economic stabilization commenced two tothree years prior to the initiation of the trade policy adjustment program.The rupiah was devalued in March 1983 and the exchange rate made moreflexible. This was followed by a major financial reform starting in June1983 involving removal of interest rate and credit ceilings for state bankoperations, followed by a tax reform in early 1984. Consequently, steadyimprovements occurred with respect to reduction of inflation, the centralgovernment budget deficit and the current account of the balance ofpayments. Indonesia was, therefore, well positioned to commence itsstructural adjustment when it was formally initiated in 1986.
7.03 The third conclusion is that structural reform is easier toimplement and works smoothly when the international economic environment isfavorable to the country that is adjusting. In Indonesia's case, OECDgrowth rates were high in 1987 and 1988 and this facilitated exports.Indonesia competes with Thailand and Taiwan (China) in internationalmarkets. The overheating of the Thai economy and the currency appreciationin Taiwan benefitted Indonesian exports. In the absence of these factors,Indonesia would have had to take even more stringent expenditure reducingand exchange rate policies to achieve the same level of export performancethat it did.
7.04 The fourth conclusion is that the short-run focus of expenditureadjustment on investment may be a good policy choice, for several reasons.
(1) It spreads the cost of the program into future generations, whowill benefit from it.
(2) In a period of rapid and uncertain policy change, an investmentpause is natural, or investors wait until the new policy directionis clear. It also provides an opportunity to weed outunprofitable investment programs.
(3) The point of the program is to make the economy more efficient, orto lift it to a higher growth path. So a pause in investment canbe afforded.
(4) Finally, support of consumption during the program may increaseits political acceptability.
Thus, while growth in investment after the initial phase of the program isnecessary for its ultimate success, an initial pause, to supportconsumption, may be optimal.
-. 05 Finally, the adjustment process needs to be accompanied bycositive net international resource transfers (Box 3), because they help toPase the shocks imposed by adjustment in t.- period of high debt service.:ndonesia is saddled with a high debt/GDP ratio as well as debt service.

- 51 -
The depreciation of the U.S. dollar compounded Indonesia's debt serviceburden, since a significant portion of its external debt is denominated innon-dollar currencies. Depreciation of the U.S. dollar after 1985 addedUS$7.4 billion (232) to Indonesia's public debt at end-1988 and US$1.2billion (20Z) to its debt servicing during 1988. High internationalinterest rates worsened the transfer problem for Indonesia. This adversedevelopment was, however, more than compensated by timely and substantialconcessionary resource transfers. Indonesia was able to use this assis-tance to prepay much of its commercial debt. Consequently the debt profilein the next decade is projected to be within manageable dimensions, sincethe ratios of DOD to GNP and exports have been steadily falling since 1987;these trends are expected to continue throughout the 1990s.
(b) Macroeconomic Issues
7.06 First, interest rates have a central role to play givenIndonesia's open capital market. In this case, the non-aid current accountdeficit is equilibrated by capital movements responding to interest ratedifferentials. The domestic interest rate is, therefore, determined tosome extent by the prevailing international interest rate, the domestic andinternational inflationary differential and the risk premium associatedwith deposits held in rupiah. Hence the only way to lower the domesticinterest rate is to reduce the external current account deficit. One wayto achieve this is to increase domestic savings; ideally domestic savingswould need to grow faster than GDP if the external current account deficitis to be removed.
7.07 Second, periods of financial austerity associated with an economicstabilization/adjustment program should not be protracted. The Indonesianprogram commenced in 1983 and intensified in 1986. Many worthwhile capitalinvestments have been postponed or curtailed. Deficits in power, trans-portation, and telecommunications could become a binding constraint onpublic and private sector development and export growth. Sizeable deficitshave also emerged in the social sectors, with a need to increase expendi-ture in health and edL ation. While it is right to expect the exportsector to generate the required savings for investment in the futurecapital stock, there is scope for increasing savings through an improvementin tax effort, better financial performance of state economic enterprises,and enhanced private savings.
7.08 Third, adjustment programs need to be cognizant of the incomeeffects of reduced expenditure policies. Indonesia's adjustment programhas necessitated a curtailment in capital expenditure (principally in thepublic sector) and this may have reduced labor absorption. The evidence isthat the adjustment was facilitated by declining real wages in the formalsector and reduced earnings in the informal sector. A reversal of thesetrends can occur if improvements in the policy environment are matched byan increase in national investm-nt beyond the 20Z of GDP now recorded.This would require careful choice of projects, appropriate technology,technical training, and revitalization of domestic financial markets.Improvements in the regulatory system and the financial sector willcontinue to require priority attention.

- 52 -
(c) Trade Policy Issues
First, it is appropriate to sequence the process of tradeliberalization by replacing Non-Tariff Barriers (NTBs) withtariffs prior to reducing protection. This approach helps tomoderate the shocks from a sudden reduction of trade protection.while providing industrialists with time to make necessaryadjustments. It also furnishes the Government with revenue whichcould be used to promote industrial restructuring.
Second, tariffs and import surcharges serve as substitutes forNTBs. Hence, they must be seen as a transition to a stage inwhich levels of import protection will be determined on optimalcriteria. The proposed study of the Country Department on TradePolicy Reform is to be welcomed.
Third, the desirability of a system of export controls, especiallyexport bans, needs to be examined. Export bans and other forms ofrestraint on exports confer rents on those who obtain licenses, orthose who can circumvent them. They, therefore, create veste'interests which may be difficult to dislodge.
Fourth, investment licensing arrangements constitute another formof protective device. Their dismantlement would represent a majorstep forward in promoting neutrality in the trade regime.
Fifth, the policy-making apparatus for trade protection should beformalized and backstopped by a working Secretariat that isproperly equipped and insulated from political interests. Theobjective should be to make the decision-making process on policyand administration as simple and transparent as possible.
Sixth, the legal framework for commerce and banking, as it nowexists, acts as a constraint on modernization of the economy. Itneeds to be mrde transparent and simplified.
(d) Sustainability and Implementation
7.09 Sustainability of the progress achieved so far in the field oftrade and investment will depend on attention to four major areas:
First, there is a need to increase opportunities for gainfulemployment. This can only occur in an environment that isrelatively free of regimentation and one that promotes investment.While concessionary capital flows have partially compensated forthe decline in oil revenues, they cannot be a permanent device tosustain consumption and investment. Greater efforts are needed toexpand domestic savings. This may require changes in fiscalstrategies, interest rate policies, and financial intermediationprocesses.

- 53 -
Second, further steps are needed to rationalize the tariff systemand reduce tariff variance. Such a process would sensitizedomestic producers to efficiency criteria. These actions need tobe complemented by measures that strengthen the transparency ofthe trade regime.
Third, the regulatory system governing investment has to befurther simplified by the introduction of a short negative list.
Fourth, a formal administrative framework needs to be establishedfor the evaluation of the tariff system and for monitoring impactand providing appropriate feedback to the decision-makingagencies.
Overall Assessment
7.10 Indonesia's economic adjustment program, which began in the mid-1980s, was a response to the economic crisis, which had its genesis in asharp decline in oil prices and an adverse movement in its terms of trade.Its twin objectives were (a) macroeconomic stabilization and (b) improve-ments in resource allocative efficiency. The policies and measures forattaining economic stability necessitated reductions in government expendi-ture, monetary restraint, high interest rates, improved fiscal effort,removal of pricing policy distortions, and exchange rate competitiveness.The economy's structural disequilibria were addressed by policies toliberalize foreign trade and dismantle the complex regulatory environment.
7.11 This shift in economic strategy yielded considerable dividends.Inflation slowed down, budgetary and external current account deficits werereduced, and foreign exchange reserves strengthened. The debt serviceratio, however, still remains at a high level, but prudent external debtmanagement has led to improvements in the ratio of outstanding debt to GDP.
7.12 Important structural changes have occurred. A striking feature isthe rapid increase in the growth of the non-oil economy and an outstandingnon-oil export performance. The manufacturing sector has been the fastestgrowing sector, in terms of it contribution to GDP as well as to exports.This increase stemmed from important trade liberalization measures, whichreduced the anti-export bias in the system, and depreciation of the realeffective exchange rate. The export base has been diversified in ways thatcould not have been contemplated a few years back.
7.13 While these measures deserve to be commended, problems stillremain. The deregulation process, which has begun to get under way,requires rationalizatio. of the tariff structure. The investment licensingsystem needs to be further simplified and put on the basis of a shortnegative list. While the first steps in trade and investment liberaliza-tion have been relatively easy to undertake, the second stage of thisprocess may be more difficult to undertake. This stage also has to beunderpinned by appropriate macroeconomic policies which promote financialstability and allocative efficiency. Policies toward this end would givehigh priority to an improvement in the operating efficiency of Indonesia'sState Economic Enterprises (SEEs).

. 54 -
7.14 Deficits in areas essential to the quality of life may have to beaddressed. Bottlenecks in economic infrastructure are assuming proportionswhich may act as a major constraint on future growth. Action on all thesefronts will require careful preparation, regular monitoring, and furtherBank support.
7.15 To sum up: the program of adjustment that was initiated by theIndonesian Government in 1983 and intensified in conjunction with TPALs Iand II yielded good initial results. The Bank's program of economic andsector work and complementary project support have been major components inthis process. Bank support during the adjustment process has beenappropriate, timely, and well sequenced. Its policy dialogue has beenclose and meaningful. The well staffed Resident Mission has, over a periodof two decades, made a major contribution toward forging a spirit of mutualrespect and trust in the relationship, which warrants further financialsupport with ex post conditionality.

- 55 -
ANNEX IPage 1 of 9
MINISTER COORDINATOR FOR THE ECONOMY. FINANCE.INDUSTRY AND DEVELOPMENT SUPERVISION
REPUULIC OF INDONESIA
Jakarta, Deceuber 19, 1986
No SR-42/1. UI4/1986
Mr. Barber ConablePresidentMhe World Balk1818 H St., N.W.Washington, D.C. 20433U. S. A.
Dear M-r. F-esident:
Gover,nnt's S:acemant on Economic and Trade Policv
2e Government of Indonesia wishes to request a Loan from the
4orld Bank u. support of a program of economic adjustment, especially
in the area of trade policy. This Letter provides a description of the
current situation, the actions which the Government has taken and the
direction of future actions.
Macro-Econac Background
1. Indonesia has faced many challenges in the econoic sector mainly
caused by the start of a considerable oil price decline and the worldeconocc recession. In order to cope with the tough situation, the
Governmnt in 1983 started to take various actions that were of a short-
term nature as well as those that had a long-term scope, beginning with
the rephasing of large projects, devaluation, overall and fundamental
revision of the taxation system, reducticrus in subsidies and deregulationof the banking sector. For the purpose of increasing non-oil export,IRES (Presidential Instrxtion) No. 4 of 1985 was issued with the
objective of overcoming the "'h%i cost eccxxrn" problem, particularlyin the custos, port operation and sea trasportation sectors.

- 56 -ANNEX IPage 2 of 9
MINISTER COORDINATOR FOR THE ECONOMY, FINANCE.INDUSTRY AND DEVELOPMENT SUPERVISION
REPUBLIC OF INDONESIA
2. In 1986, the sharp drop in the international price of oil canaed
severe deterioration in Indoesia's balance of payants and the Govern-
ment's budget. The Governt has taken a series of masures to deIa
with the situation as it unfolded. Anticipating weakness in the oil mzket,tne Goverturant introduiced an aus tere budget, incorporating sharp
cutbacks (24+%) in developmnt expenditures. With the exception of so=,
foreign aided projects, there were no nw investants started with gpvern-
ment funding in this fiscal year. bxetary policy was also tightered,
leading to a considerable slowing down of credit expansion. As oil prices
continued to slip in md-year and as it beca clear that even in the
o :er. he oi. price d reaio far belo the Lels prevailing
in 1985, tne Goverrnent decided to devalue the Indonesia Rpiah by
31 percent. Thi.s substantial devaluation prevented the loss of foreign
excnange reserves through speculation and should be a powerful means
of stabilizing the balance of paynnts and iWproving the conditions for
an early recovery in economic activity and incoas.
3. ith continued pr%dece in fiscal and mnetary policies, the
Govermenr expects to halt the deterioration in the balance of payents.
Rapid adjusment of the balance of payments is essential because the
burden of exturnul debt, despite recent constraints an public borrowlng.
is hi&h in relation to the now reduced levels of export earnings-
dtle the total debt service ratio was 26. in 1985/86, it is now estimated
at about 377. in 1986/87. 4ile the current account deficit will xxavoidebly
widen to about ' 4,1 billion in 1986/87, an imoortant objective of Macro-
econouic management would be to reduce the aual current account deficit
to a level below $ 2 billion within the rext tw years .
4. The key to inprovencnt in the balance of payients is accelerated
growt, of rn-oil e1ports. The Gover,net is heartened by their growth
- 57-
ANNEX IPage 3 of 9
MINISTER COOROINATOR FOR THE ECONOMY, FINANCE.INDUSTRY AND DEVELOPMENT SUPERVISION
REPUBLIC OF INOONESIA
in recent years, frm $ 3.9 billion in 1982/83 to $ 6.2 billion last year.No doubt, the recent devaluation will give an added boost to ron-oil
exports, encouraging the utilization of available excess capacity in
the short run and enhancing o -runities for profitable export-oriented
inves: cs in the adiun term Recog=izing the vical iLTor-,mce af
encouraging non-oil e.-ports, toA Covemnt incroduced - May L9E6
a special package of measures designed to ensure that exporters are able
to buy their inputs at internationally competitive prices. One elecent
of this scheme is the i.port duty examption/drawback available to
exporters . Another i-Tortant facilicy provided by this schee is ta:
ma3Lr ex7crers cza, :=c= -_-eir -pucs c rec::y as neece d.c.e:e.:
bypassirg the preva.'ing non-cariff res rains iports. e.r eer.ence
in me last several -_nths indicates that the >ay 6 sch.ee -s being
=ple zed smochly and efficiently, providi;ng *angible s-ppc to ex%crzers.
5. The Government is fully aware that providing special exertpons
to exporters is only an interim stage in capleting the necessary refcn
in the uxderlying trade regulation themelves. SustaLned g in non-
oil exports in a highly competitive international carket, with the ever-
present threat of protectionism in the industrial countries, requ:res
that Indknesian manulacturing enterprises operate at =uch higher levels
of efficiency. Achieving this goal will require changes in the
structure of incentives to redress their current bias against exports.
!:* present system of protection is contri:buting to the high
costs in the Indonesian economy and it is the intention of the Governm:nt
to rationalize this system as speedily as possible.
Principles of Trade Pclicy
6. The policy of raticnaliza:.on of protection is ai~nd a: the
following objecves :

- 58 -
ANNEX IPage 4 of 9
MINISTER COORDINATOR FOR T4E ECONOMY, FINANCE.INDUSTRY AND DEVELOPMENT SUPERVISION
REPUBLIC OF INDONESIA
- establishing a prc-ection structure based minly on tariffsrather than impor .censes and thus permitting mre precisemeasurement of th actual degree of protection granted toIndonesian producers;
- reducing the current bias in incentives against export
activities and in favour of import substitution; and
- Limiting the level of protection, with special provision
for infant industries which would enjoy higher levels of
jro!ec:ion for szecif'ed tie periods.
The decision to -ve iaa from non-tariff barriers and rel.v on
tariffs is based on several considerations. First, tariffs provide a
more transparent form of protection, which autaatically prevents
domestic suppliers from increasing prices above world prices by =re than
the tariff rate. Second, tariffs are sinler to adinister; non-tariff
L :riers create the potential for abuse and can lead to protracted
negotiations amngst the parties concerned. Third, tariffs are easier
to adjust so as to rationalize the structure of protection. Finally,
tariffs will contribute to the Goveznment 's budgetary revenues and help
stport priority developm t programs.
Rcent Trade Measures and Future Directions
8. During the early 1980s, restrictive importer arrangements were
i=pnsed on a range of products. By 1985, about one quarter of imports
were subject to licensing restrictions. Of these, very few were actually
subject to formal quotas. There have be n no new iiport restrictions
incroduced since March 1986 and the mesures of October 25 signify the
beginning of the trend in the opposite direction.
- 59
ANNEX IPage 5 of 9
MINISTER COOROINATOR FOR TNE ECONOMY, FýNANCE.INDUSTRY AND DEVELOPMENT SUPERVISION
REPUBLIC OF INOONESIA
9. Under the October 25 tasurs, the Goverrment revaked 6 decrees
restricting iport licensing for 317 ites. Must iportantly, approved
i=porter restrictions were abolished for 165 ites, including cires,
glass, paper and som engineering goods. Another 55 items, including
chemcals and knocked-down equimenc, :now --e corec wiezut
r es air. by ry :rcàdcer in ±e rmou.:s -eurd as :nut : -4s
production process. For 50 items, primarily transport machiner,, selected
overseas suppliers will be allomd to apoint licensed gent:s aorovd
by the Minis:ry of strf, for the purpcse of standardizing the prouct
"yes and esuing sa:isfac::r; after sales ser.:ces. 7here WiL'. e no
... e rezw__n - -. :ams :eL :r-.z-j2=se
and producers of :-'e -:ers only.
10. For 154 of the izes where .r- licensing resri:ic.s were
rezeved or relaxed, tariffs were increased to protec :he balance of
payments and provide cransi:ional protecticn to cmestic prcòcers.Hawever, with or.y 3 exceptiorns, the new :ariffs are wi.tii ±e cariff
ceiling of 60.. Tariffs on another i. .:ems not produced dcastically
w.re reduced, mostly to 0-5. To protect domsric producers againspredatory dmping, izport surcharges may be introduced on specified
items. However, the Governmnt will only do this on a higly seleccive
and temporary basis, and only after balancing producer and c.nsurerinteres ts.
Ii. The recent package of neasues has still lef: Lzort- res-r.c.ons
in place on some pportant product groups such as agricu,t-raZ.. oupuz,
steel, plastics, etc. These areas are cr:ly being scru.i.ized with
a view to achieving further progress in rationalising t'e systea ofprotection as rapidly as pcssible. : is the Gcver-k:e's objective to
- 60 -
ANNEX I
Page 6 of 9
MINISTER COOPDINATOR FOR THE ECONOMY. FINANCLINOUSTRY AND DEVELOPMENT SUPtRVISION
REPUBLIC OF INOONESIA
eliminate gradually all non-tariff restrictLOns on iqports except on asmaLl grou of produts that are ha ul to health, strategic to natical
defense or involve special economic and social considerations. We expect
to make frther tangible progress in this direction within the next year.
12. The process of evLng -rm cn-,:av_!f oar-ers o a c asf ased
system of protection has involved some increases in tariff levels.
The Governmet has accepted this as an interim measure in order to gain
wider acceptance of the remaval of import restrictions. In the medium
:er=, nowever, it will be necessary to rationalize the s:r.;c7re of
orcr cc ake the induscrial sector =re efficien:, ra:cicnalize
cce excessive level of protection and increase expor- capacit-
13. The process of racionalizing tariffs will scar: with an early
review of 1:ports chat crently attract cariffs above the raticnal
maximu race of 607. establised in the 1985 tariff reform, followed by a
phased redccion in the maximrn nominal cariff race over =he r.ext couple of
years. The Govenrent intends to prepare a systematic medi=m cerm plan for
tariff reform. For this pupose, it will establish appropriate organization
and processes to monitor regularly the levels and dispersion of tariff
rates, both nominal and effective, with a view to reducing the differential
between maximun and -inirm rates.
Investment Licensing and Public Enterprises
14. The purpose of the progressive r Lonalization :he level and
system of protection is to expose Indonas -'s industry to ;ncreased
comoetition from abroad. This will induce it to make the s=r:ctural
adjustecs necessary to iarove the efficient utilization of existing
resources and foster the creation of a productive system capable,of
ccpeting with foreign goods on a firm footing. The Government

- 61 -
ANNEX I
Page 7 of 9
MINISTER COORDINATOR FOR THE ECONOMY. FINANCE.INDUSTRY AND DEVELOPMENT SUPERVISION
REPUlC OF INDONESIA
recognizes that realizing the full potential impact of these inprovemts
would also require relaxation of restrictive licensing arrangements on
private investment and domestic trade. Laportant steps in this direction
for foreign investors have already been taken in the May 6 and October
25 packages. Restrictions on domestic invesiment and trade will be
thoroughly studied during the next year. The objective would be to
initiate extensive deregulation in this area based on the findings of
the study. Greater freedom from licensing procedures would unleash
entrepreneurial talent and mbilize more financial resources for
inves =ent.
15. The unLsatisfactory financial and operating perforamce of public
enterprises has izposed addi:ional strain on the Governent budet: and,
even more importantly, has inhibited progress towards enhancing the
efficiency of econoic activity in Indonesia. The Government has
initiated a program to review the perforance of selected public encer-
prises and to identify appropriate areas for reform, i4ncluding changes
in the system of governmnt supervision and control, as well as in :he
mnagement and financial structre of individual public enterprses.
During the next year Goverrent expec-s to corplece hie consolidaicn
of public !nccr7rise Lccounts. deAIorp in irrr')ri ito .. *'.irn
through rehajinatiin, 7erger or divestitue.
Macro Policy Fro-e4ork.
16. A stable macro-econcr-c ErV4ronen is Lportant i" promoting an
outward oriented industrial strucrure and enhancing Productive efficiency.
As noted earlier, regaining stabilitvy in the balance of payments in the
face of lower oil prices is an important objective of the Government.

- 62 -
ANNEX IPage 8 of 9
MINISTER COOROINATOR FOR THE ECONOMY. FINANCE.INDUSTRY AND DEVELOPMENT SUPERVISION
REPUBLIC OF INDONESIA
Ever since the first signs of weakening in the oil markets, the Goven t
has iposed strict limits on extetnal borroing and austerity in itsown budget operations. These policies have helped to restrain inflation
to low levels, but: have also -ed :o a dramtic slowdown in economic
growth. :t is hoped that -he ongcing refonn of industrial and trade
policies will provide the incentives to tap new sources of groWth and
lead gradually to a recover in econoic activity and incoms . At the
same ri, continued budgetar- and mnetarv restraint is vital in
mainaining acr3 econ-c s:ahi. an acheving =e required adjust-
-. w ±:-er:-aL: ng the price of oil,
4: Js necessar: : a .. ::re -jdge: for 1.987'88. The Governrt
is taking steps to rcbilize greater dom,stic revenues and itends to
restrain budgeited expmenditres to ihe sam level in real term as in
Lhe current y,ear. : alloatina develoment expenditures, the highest
priority will be given = providing sacisfac:orily expendirures for operation
and Aintenance so ha- greater cutpu .ca be ob:ained from available
capital stock, especially in :iras:rucure :acii:es. Ongoing projects
will be reviewed an- orly -ncse .rc'ecns cha: rrcrise sa:isfacrorv economic
returns iLLI De funded his L. iv :ac severii pro;eccs, inciuding
som w ft :oreig, .. j7ay :-ave o De c-, back .'..w projects ul be
under:ake prc-äag irey -ave :erT - . econocic aec:s a onl; where
foreign assistance -s availaole or su.:azle :er-s. An i.portanr consideration
will be the capac-:v f -e pr:ec: .en- -Xi7s to execute the pro4ect
at the requrred pace.
18. The Gove ren :.a ns i - :s s'=crng cmrm z.e to the present foreign
exchange system. ax&=-e ra:e poLicv will continue to ezphasize the objective

- 63 -
ANNEX IPage 9 cf 9
MINISTER COORDINATOR FOR THE ECONOMY. FINANCE.INDUSTRY AND DEVELOPMENT SUPERVISION
REPUBLIC OF INDONESIA
of maintaining international coopetitiveness of the Indonesian ecary,
taking account of price and exchange rate movemnts in trading partners
and competitor countries. An austere budget will assist in restraining
the growth of zney and credit to levels cnsistent with the growth of
real incomes. 'hile sore price increases are inevitable in the aftermth
of the last devaluation, the Governent aims to redcte the inflation rate
to below 7 percent per anno by 1988.
19. As in the past, the Government will act pronptly to make the
recuisize DoLicv adj,stn;s 'f a f=ndamental 7acro-eccncmic diseuil1i-
:riu. emerzes.
Yo-urs sincerely,
Ali ardana
Miniscer foordinator for theEconoy,- 7inance and :ncustry
- 64 -
ANNEX IIIb~iI~Page 1 of 9
MINISTER COORDINATOR FOR THE ECONOMY. FINANCE.INDUSTRY AND DEVELOPMENT SUPERVISION
REPUBLIC OF INDONESIA
Jakarta, February 29, 1988No. :SR-14/M.EKUIN/1988
Mr. Barber ConablePresidentThe World Bank1818 H St., N.W.Washington, D.C. 20433U. S. A.
Dear Mr. President:
Governmnt's Stateent on Economie and Trade Policy
1. The Gcrnmt of Indonesia wishes to request a second loan ftan the
World Bank in support of a program of ecoromLc adjust1nt, especially in the
area of trade policy. This letter provides a description of the current
situation, the measures ;hich the Goverment has taken and the direction of
future policy actions.,
Progress on Econcmic Adjustment
2. In my last letter to you, dated December 19, 1986, I described the
impact of the sharp drop in oil prices on Indonesia's balance of Dayments and
the Goveret 's Budget during 1986, and the actions that the Governmt had
taken in response. Of particular importance were the austere Budget
implacented during 1986/87, the 31% devaluation of the Rupiah in Sertenber
1986 and the package of trade refor initiated in October 1986. -he
Goverment has continued and extended its econoxic adjustment program du-in,
1987. Another austere Budget has been inpl-eated during 1987/88, with no
increase in civil service salaries and further reductions in real development
swrpdi4sg. With h exreptin ..f som foreign-aided proiects, there were no
mjor new irvesets started with goverrn t fundin in this fiscal vea-.
xtrtary policy was also tightened, leading to a slowdyn of liquidity
expansion and reversing speculative pressures against the Rupiah in mLd-1987.

- 65 -
ANNEX IIPage 2 of 9
MINISTER COORDINATOR FOR THE ECONOMY, FINANCE.INDUSTRY AND DEVELOPMENT SUPERVISION
REPUBLIC OF INDONESIA
The Govertnen t's prudent fiscal and nonetary policies have helped to containdonstic inflation below 9% and preserve the Competitive advantawe provided bythe 1986 devaluation.
3. The Govenment has also mnintained the antun of deregulation in
trade policy and industrial licensing during the past year. These Ueasures,
together with the competitive exchange rate, have stpported a very encouraging
expansion of non-oil exports. Non-oil export earnings are now projected to
exceed US$ 9 billion in 1987/88, one third higher that last year. Because of
this strong performance, we expect to achieve our target of reducing thecurrent account deficit frm over US$ 4 billion in 1986/87 to less thanUS$ 2 billion in 1988/89. During the transition period, Indonesia has been
greatly assisted in financing its balance of payments by concessional programaid and local-cost financing from the IGGI. Because of the Goverriuet's
prudent debt management strategy, and the improved export perfomance, thedebt service ratio is expected to stabilize arotnd 37% this year. The
deregulation drive has also provided a needed boost to econoic activity: (DP
growth has been sustained at around 3% p.a. and private investmnc (domstic
and foreign) has recovered strongly from the low 1986 levels.
4. Witi the restoration of external and doetic balance, it is
essential to revive growth of the non-oil economy to about 5% p.a., in order
to absorb the growing labor force at adequate levels of productivity and
incanes. The adjustment masures taken by the Government, including the
ongoing program cf trade and industrial policy reforms, are considered to be
an important prerequisite for econcmc recovery. ITh adjustment process must,
therefore, continue. The continued expansion of ron-oil exports is a key
elanent of this Atrategy, for their direct; contribution to prduction and
employmnnt, as well as their role in reducing the burden of external debt and
improving Indonesia' s creditworthiness in world financial markets. in the

- 66 -
ANNEX IIPage 3 of 9
MINISTER COORDINATOR FOR THE ECONOMY, FINANCE.INDUSTRY AND DEVELOPMENT SUPERVISION
REPUGLIC OF INDONESIA
meantim, continued support from the international canmnity will be required
to finasce the iport requireents related to the export drive ad
restructuring of the industrial sector. The proposed loan from the World Ba*would provide such finicing durizng the cong year, while also showingsupport for the Gowent's growth-oriented adjustmnt program. As sudh, it
can give an importat signal to other donors to extend appropriate assistancein continued support of the adjusa- t process.
5. The Gowzment's strategy of growth with adjustat will require
f%uther structural reform in three key areas: trade policy, industrial
regulation and the financial sector. The brLad directions of the Govrment's
policies in these areas, as well as supporting policies to maintain a stable
macrocaonidc envirnment, are set out below.
Trade Policy Reform
6. he Gowrment remains strongly comitted to the objectives of trade
policy as set out in my December 1986 letter, namely:
- establishing a protection structure based on tariffs rather than
import licenses, thereby providing a more imiform and transparent
lewl of protection to Indonesian producers;
- reducing the past bias in incentives against export activities and in
favour of inport stbtitution; and
- limiting the level of protection, with special provision for infant
indkutries which would enjoy higher levels of protection for
specified time periods.
To achieve these objectives, the Goverment has put into place a mallfunctioning mechanism that allow exporters to have easy access to inputs at
inteznationally copetitive prices, while slmultaneously phasing out export

- 67 -
ANNEX IIPage 4 of 9
MINISTER COORDINATOR FOR THE ECONOMY, FINANCE.INDUSTRY AND DEVELOPMENT SUPERVISION
REPUBLIC OF INDONESIA
subsidies. The Gowroont has also focussed on elimdnating remaining exportrestrictions and strengthwdng support for export infrastructure and
services. Recogizing the sustained growth of non-oil exports will require a
broad based improvement in the structure of incentives, the Government has
initiated a major progran to reduce and rationalize import protection. Steps
to reduce the role of import licensing testrictions and now toward
tariff-only based protection are now well underway.
7. The trade reform measures announced in October 1986 and supported under
the first Trade Policy Adjustment Loan represented the first step in a process
of moving away fran restrictive importer arrangements. This trend has been
reinforced by two subsequent reform packages announced in January and Deca4ber
1987. These two packages removed import licensing restrictions on 313 iten
in the textiles, s .eel, and machinery sectors. Much of the inproveant in the
machinery sector was gained by reducing the number of gpods rectricted to sole
agents (AT), with some 111 of these being removed from licnse control. This
involved renoving coet of the AT license restrictions that have been added
since the original Presidential Decree of 1972. The DeceIbr package also
made a start on remving licenses in the previously untouched area of food and
beverages. Oerall, about 237. of the import value previously restricted has
been zeoved fran licensing control during 1987, bringing the total to 42%
since October 1986. We expect to make further tangible progress in this
direction within the next year, especially in those areas where import
licensing restrictions still provide high protection to domstic production.
Preparatory work is currently underway in a number of subsectors. The
Government's end objective is to eliminate all non-tariff restrictions on
iaports except on a small grou of prodcts that are hamfui to health,
strategic to national defense or involve special ecomaic and social
causiderations.

- 68 -
ANNEX IIPage 5 of 9
MINISTER COORDINATOR FOR THE ECONOMY, FINANCE.INDUSTRY AND DEVELOPMENT SUPERVISION
REPUBLIC OF INDONE1IA
8. Mh Gow.zmnt has also continued to review and revise import tariffrates. In Deceber 1987, tariffs mere increased an 121 itmn and teaporarysurcharges wre imposed on 50 itn , most of which were rnoved franrestrictive import licensing. This shift toward tariff-only protection is inline with the objectives set out above. At the saw tima, tariffs on 179
itn were lowered during 1987. These reductions were initially focussed on
imported inputs not produced locally, so as to offset the cost-raising effectsof the 1986 devaluation. However, in December 1987, the Goverment also
lowered the tariffs on some item removed from license restrictions unider an
earlier decree (e.g., paper products). Over the mediun term, it will also be
necessary to rationalize the structure of tariffs in order to reduce excessive
and disparate levels of protection. For this puroose, the Governiment is
preparing a revised tariff schedule based on the haz=xized systen, as part of
a mediun-term plan for tariff reform. Substantial progress in this area is
expected during the coming year. Already, a start has been made on reviewing
and reducing some tariffs raised in earlier reform packages. The Government
has also clarified that import surcharges will be inposed on a temporary basis
only, and their justification will be regularly reviewed.
9. The December package also addresses export restrictions and sinplifiesexporter procedures. 7he APE (Exporter Identification Nuaber), APES(Provisional Export Identification Nuber) and the APET (Limited Exporter
Identification Number) have now been abolished. Ikder the new regulations,
both domstic and joint ventures will only have to present their Business
Pem=Lt to prove their exporter identity. The only exceptions are for ooductssubject to international trading arrangeo ts or where Indonesia is a major
supplier to world markets. Export bans on 10 item (primarily processed wood
products) and export quotas on 24 itam (e.g., refined coon and palm oil,
tires, Jeallary) have also been abolished.

- 69 -
ANNEX IIPage 6 of 9
MINISTER COORDINATOR FOR THE ECONOMY. FINANCE.INDUSTRY AND DEVELOPMENT SUPERVISION
REPUBLIC OF INDONESIA
10. To help prepare proposals for further reform, the Goverment hasrecently set up the Trade and Industrial Policy Steering CoumLttee (TIPSC).
The World Bank is providing assistance to develop the technical capability of
TIPSC and undertake studies of trade and industrial policy issues. A study on
effective protection rates has already been ccmpleted.
Dmestic Licensing Reforms
11. The Goverrment recognizes that trade policy reforms need to be
coWpemted by measures to simplify and relax other aspects of the regulatory
framnork. Considerable progress in this area has been made during 1987.Early in the year, several new sectors were opened to foreign and domstic
private investors, the nter of licenses required to establish and operate
firm were significantly reduced, and greater flexibility was introduced into
production decisions through the "broad-banding" of product categories.
Further steps were taken in the Decenber package to support the export drive.
Joint vtxmure trading companies may now be established to export industrial
products and joint venture production companies may market both their own and
others' industrial products. Complementary regulations have been promulgated
to lower the local participation requirennts for joint vientures and relax
rules for the employment of expatriate personnel. To promote tourism
development, the number of licenses required to construct ho:els and other
tourist facilities has been drastically reduced and the sector has been fully
opened to foreign investment.
12. Despite these improvents, the regulatory envirorment in Incnesia
rmains ccmplex and often danting to potential new investors. To better
understand the critical bottlenecks, TIPSC with World Bank assistance will
ate a stui&yranielarim-imu ing 1988. This -tudy willbe used to formulate and inplanent a phased progran of deregulation over the

- 70 -
ANNEX IIPage 7 of 9
MINISTER COORDINATOR FOR THE ECONOMY, FINANCE.INDUSTRY AND DEVELOPMENT SUPERVISION
REPUBLIC OF INDONESA
medLum term. During the con.ng year, the Governmt expects to mke furtherprogress on simplifying and relaxing do=stic licensing restrictions.Priority will be given to opening additional sectors to dAus tic and foreigpprivate investant, and strealining license application procedures. For the
electrmics subsector, a nw policy is being formilated to complumnt the
recent trade refornm in this area. The Governmnt will also review the systmof capacity licensing to ensure that firms ca-n benefit fully frm the
"broad-banding" masures adopted in 1987.
Financial Sector Reform
13. The Indonesian financial system has undergone considerable changs sitce
the 1983 reforum, which eliminat-d most interest rate cotrols and credit
Ceilings. These reform have had a very positive impact an resource
mobilization, with time and savings deposits rising by more than 1707. over the
past four years. In order to diversify the range of financial instrunents,
the Goverrnent announced further masures to strengthen the role o: equLty
arkets in December 1987. Listing requirements on the Jakarta stock Exchangehave been simplified and actions taken to inprove the operations of capital
market institutions. The Government has also announed the creation of an
over-the-counter (OTC) market to enable smaller, less well-established
campanies to nobilize investment requirmnts through the capital market. In
order to strengthen the demand for securities, the Government will encourape
the issue of bearer shares and allow foreign investors to purchase shares in
the (TC market.
14. Despite these improvements, the Goverrnmt is still concerned about
the capacity of the financial system to support he process of econom.crestructring and recovery. The cost and availability of credit, especially
for long-term investnt ftuds, will critically determine the ability of
- 71 -ANNEX IIPage 8 of 9
MINISTER COORDINATOR FOR THE ECONOMY. FINANCE.INOUSTRY AND DEVKLOPMENT SUPERVISION
REP"BLIC OF INDONESIA
business enterprises to take advatage of the deregulation process curretlyunderway. Related issues of financial sector efficiency and devel at will
be addressed irr5int World Bank-Govenumt study to be coupleted cbming
1988/89. The Goverment intinds to use the findings of this study in the
design of future financial sector reforns.
Macroeconcmc Management
15, A stable macroeconomic enviroramt is important ir. prunting an
outward-ortented industriai structure and enhancing productive efficiency. Asnoted earlier, regaining stability in the halace of paynents in the face of
lower oil prices is a primary objective of the Goveument and considerable
progress in this direction has already been made. To sustain the process of
adj1anent, another austere Budget has been announced for 1988/89. The Budget
is based on a prudit oil price assumption of US$ 16/barrel and euphasizes the
importance of continued inprovenats in non-oil tax aft1nistration. For the
third year in a row, no provision has been made for an increase in civil
service salaries (this will only be considered if the resource position is
better than expected) and development spending is budgeted to fall in real
terms. In allocating expenditures, the hihest priority will be given to
operations and maintenance, to inprove the productivity of existing
infrastructure. New projects will be undertaken only when they are shown to
have very high economic returns and where foreign assistamce is available on
sultable terms.
16. The Govertnut has also taken steps to contain investnent by public
enterprises. Tight control has been kept on utilization of non-concessional
import-related credits and equity participation in public enterprises funded
dhrough the Budget has been reduced to minimal levels. These policies are to
be maintained during 1988/89. With IMF assistance, a preliminary

- 72 -
ANNEX IIPage 9 of 9
MINISTER COORDINATOR FOR THE ECsNOMY, FINANCE.INDUSTRY AND DEVELOPMENT SUPERVISION
REPUBLIC OF INDONESIA
consoli tion of the financial accounts of public enterprises was completed in
January 1988. The President of Indnesia has also requested a review of the
financial performance of all public enterprises, to identify potential
candidates for rehabilitation, arger or divestiture. The data for this
review have now been collected and the Govermet intends to take appropriate
action in the near future. The Goverrmet also intends to continue its review
of the regulatory franework, with the objective of improving the efficiency
and operating perfonmance of public enterprises over the edian term.
17. The Government mintains its strong emaimnent to the present foreign
exchange system. Exchange rate policy will continue to emphasize the
objective of maintaining international competitiveness of the Indonesian
eonany, taking account of price and exchange rate movements in trading
partners and coapetitive countries. The austere Budget annunced for 1988/89
will help restrain domestic deand and monetary expansion. With these
policies, the Governmnt aims to reduce the inflation rate to below 7% p.a.
during 1988 and thereby maintain a coopetitive exchange rate.
18. As in this past, the Goverrmet will act pretly to make the requisite
policy adjust ts if an tnexpected macroeconomic disequilibriun emerges.
Sincerely yours,
Ali Wardana
Minister Coordinator for theEcooy, Finance and Industry
- 73 -
PROJECT COMPLETION REPORT
TRADE POLICY ADJUSTMENT LOAN
(LOAN 2780-IND)
I. Introduction
1.1 During the 1970s, the IuConesian economy grew at 82 per annum.This growth was supported by a rapid expansion of net oil/LNG exportearnings, which rose from US$0.6 billion in 1973/74 to a peak ofUS$10.6 billion in 1980/81. In that year, oil/LNG accounted for 75Z ofexport earnings and 70Z of budget revenues. However, since the early1980s, the external environment faced by Indonesia has worsenedconsiderably. Over the past five years, real oil prices (adjusted forrising import costs) have faller by more than 502. with most of thedecline occurring since 1986. At the same time, the burden ofIndonesia's external debt increased sharply due to the depreciation ofthe US Dollar since mid 1985.
1.2 In the absence of a firm policy response these externaldevelopments threatened to undermine Indonesia's balance of paymentsposition and cause serious dislocation in the domestic economy.Fortunately the Government met the challenge by adopting a series ofmeasures which stabilized the economy and created the conditions foradjustment and growth over the medium term. The key elements of thisprogram included prudent fiscal and monetary policies, appropriateexchange rate management, increased domestic mobilization, andimprovements in the trade and industrial policy regime. The Bank's TradePolicy Adjustment Loan (TPAL I), for US$300 million equivalent(Loan No. P-4429-IND), provided both financial and technical support forthis program of reform.
The Emergence of Structural Problems
1.3 During the 1982-85 period, Indonesia had to adjust to the steadyweakening of the oil market, the onset of a worldwide recession, and thedecline in the prices of several important primary exports (e.g., rubber,palm oil and tin). By 1982/83, Indonesia's current account deficit hadwidened to US$7.2 billion (7.72 of GNP). In response, the Governmentinitiated an adjustment program designed to maintain balance of paymentsand fiscal stability, while reducing the economy's dependence on oilrevenues. The competitiveness of Indonesia's non-oil exports wasenhanced by a 282 devaluation of the Rupiah in March 1983 followed bymore flexible exchange rate management; and public expenditure wassharply reduced through the rephasing of many large projects and cutbacksin budgetary subsidies. In addition, resource mobilization wasstrengthened following comprehensive financial and tax reforms; and majorefficiency improvements were made in customs, ports and shipping.
1.4 By 1985/86, these measures had succeeded in restoringmacroeconomic stability (see Table 1). The current account deficitdeclined to US$1.9 billion (2.42 of GNP) in 1985/86; and significantprogress was made in controlling inflation, which was brought below 52.These adjustments led to short-term costs in the form of slower growth of

- 74 -
output and incomes, reduced private and public investment, low rates ofcapacity utilization, and the emergence of financial problems amongindustrial enterprises. Problems in the industrial sector werecompounded by high and variable levels of protection provided by aproliferation of import licensing restrictions. Nevertheless, prior tothe unexpected collapse of oil prices in 1986, Indonesia seemed to havelargely overcome its balance of payments difficulties and restoredmacroeconomic stability.
Table 1: RECENT ECONOMIC DEVELOPMENTS /a
Actuals Estimate1978-82 1982-85 1986 1987
Real growth rates (Z p.a.)
GDP 5.3 3.8 3.6 3.7Non-oil GDP 6.9 4.0 3.8 4.3
- Agriculture 5.0 3.7 2.5 2.3
- Mining 9.2 6.5 4.0 3.1
- Manufacturing 9.3 4.4 6.3 6.9- Construction 11.0 0.7 2.2 5.6- Other services 9.3 4.6 4.3 4.9
National income .. 2.2 -2.5 4.2
Private consumption .. 2.8 3.1 3.6
Fixed investment 13.5 -4.4 -7.0 0.6- Public .. -3.2 -15.6 -3.9- Private .. -5.8 3.1 5.0
Non-oil exports 10.5 17.1 2.8 24.2Non-oil imports 13.8 -10.7 -12.4 0.8
Ratios (Z) /b
Budget balance/GDP -4.1 -2.9 -4.6 -2.7Current account/GNP -7.7 -2.4 -6.2 -3.1Debt service/exports 16.4 25.4 36.8 34.7Fixed investment/GDP 25.9 20.8 20.5 19.7
Prices
Oil price (US$/bbl) lb 32.9 25.0 12.5 17.0Termc "f trade (1983/84=100) /b 109.3 93.3 62.6 69.2Domestic inflation (Z p.a.) 13.9 8.4 9.1 9.3
/a Balance of payments data are for fiscal years (starting April 1).Other indicators are for calendar years.
/b last year of multi-year periods.
Source: Central Bureau of Statistics and World Bank staff estimates.

- 75 -
1.5 Ir 1986, the economy again suffered a series of setbacks.Average crt_e oil prices fell by almost one-half from US$25/barrel in1985/86 to below US$13/barrel in 1986/87. The loss of oil revenues wasequivalent to one-third of both domestic budget revenues and merchandiseexports. Indonesia sufferel further external shocks from the weakeningof non-oil commodity prices and the sharp depreciatioi& of the US dollar.Indonesia was vulnerable to the decline of the US dollar because itsexports were mostly dollar dominated whereas about 60Z of its externaldebt was in appreciating currencies. These trends led to a 34Zdeterioration in the terms of trade and a jump in the debt-service ratiofrom 262 in 1985 to 372 in 1986. It is estimated that all of theincrease in the public debt service ratio since 1985 is due to thecombined impact of lower oil prices and exchange rate changes. Althoughthe Government had been adjusting appropriately since the first signs ofa deteriorating external envirorment, nothing could have prepared theeconomy for the magnitude of the new external shocks. Nor could theGovernment afford to make up this loss through additional commercialborrowing, as the decline in oil revenues was unlikely to be transitoryand Indonesia already had a large overhang of external debt.
The Government's Response
1.6 The Government responded to this second deterioration in theexternal environment by announcing a series of adjustment measuresintended to contain the balance of payments deficit by bringing nationalspending in line with the reduced level of national income. TheGovernment also intensified its efforts to promote a more competitive anddynamic non-oil economy. There were four key elements to theGovernment's strategy:
(a) First, the Government adopted more austere fiscal andmonetary policies. Current expenditures, excluding debtrepayments, were to be held flat in nominal terms, andsubstantial cuts were made in capital expenditures.Monetary expansion was also controlled to reduce thepressure on domestic prices and the demand for imports.
(b) To further restrain aggregate demand and to encourage theprocess of structural change, the Government announced a31% devaluation of the currency on September 12, 1986.This adjustment was considered appropriate in light of theprojected loss in oil earnings and the need to preemptdisruptive capital outflows. In order to alter the marketpsychology, which focused exclusively on rupiah/US dollarmovements, Bank Indonesia also began to quote rates againstfive currencies and the SDR.
(c) To achieve the Government's budgetary target and to restoredomestic balance, the Government continued its efforts tostrengthen domestic resource mobilization. Accordingly,the Government pursued a more flexible interest rate policyto stabilize and attract domestic deposits and took stepsto increase non-oil tax revenues.

(d) Lastly, the Government embarked on a series of deregulationmeasures intended to improve the trade and industrialpolicy regime. GOI's objectives were to develop a moreefficient manufacturing sector, stimulate non-oil exportsand thereby encourage the restructuring of the economy overthe medium term.
Trade Policy Adjustment Loan
1.7 The Bank's first Trade Policy Adjustment Loan (TPAL I) supportedthis adjustment program, particularly as it related to trade and industrypolicy. An important distinguishing feature of this loan was that thepolicy measures it supported were announced prior to loan appraisal. Theapproach was considered appropriate because: (a) the Bank's priordiscussior.s with the Government had resulted in a common understanding ofthe measures that needed to be taken; (b) analysis of the measures to besupported by TPAL I showed them to be substantive and deserving ofsupport; (c) it was recognized from the outset that the measures takenwere part of a medium-term adjustment program to which the Government wasstrongly committed, and that subsequent reforms could provide the basisfor a series of policy-based loans; and (d) the Government's strongrecord on economic management provided the basis for expecting thatfurther policy measures would be taken. The loan was prepared followingthe September devaluation and GOI's announcement of the October 25 tradereform measures. The loan reflected the close dialogue between the Bankand GOI on macro-management and trade issues, both of which werehighlighted in the preceding economic report 'Indonesia: Adjusting toLower Oil Revenues' (Report No. 6201-IND, dated May 20, 1986).
1.8 Throughout the 1970's and early 1980's, Indonesia's trade andindustrial policies were inward-looking, promoting investment in highly
protected activities geared to supply the domestic market. At the startof the decade the primary instrument of protection was a high anddisparate import tariff structure. As pressures from the slowdown in thedomestic economy in the early 1980s began to build, tariff protection wassupplemented by a proliferation of non-tariff barriers, in the form ofimport licenses. However, as the costs of the protective regime becameapparent and the need to encourage non-oil exports became more pressing,GOI began to reverse its policy stance, announcing two significantreforms during 1985: first, an across-the-board reduction in tariffswhich reduced the level and dispersion of tariffs and lowered the ceilingfrom 225Z to 601; and, second, a complete overhaul of customs, ports andshipping operations. Reductions in these distortions increased therelative importance of non-tariff barriers (NTBs). By the end of 1985,more than 1,700 items (CCCN categories) were subject to import licensing.1/These items accounted for over 40Z of both total import value and tradeddomestic production. Although import licenses varied considerably intheir degree of restrictiveness, by 1986, the import licensing system wasthe most important distortionary influence in the trade regime,contributing not only to the high level and variability of protection butalso fostering unproductive "rent-seeking" behavior.
1/ Of the 1700 items, only 296 had a formal quota imposed. In addition,there were 24 products under import ban (including automobiles,motorcycles, televisions and radios as completely built-up units).
- 77 -
1.9 Responding to this situstion, GOI embarked upon a major programof trade and industrial policy reforms in 29P6. The first step was takenon May 6, 1986, when GOI announced a package of measureq eesigned toprovide internationally-priced inputs to exportets. Indonesia'saccession to the GATT Code on Subsidies and Countervailing !'uties in 1985required withdrawal of the Export Certificate Scheme. As a result, itbecame necessary .o find an alternative method to protect thecompetitiveness of Indonesian exporters from the 'high-cost localeconomy and import license restrictions. The May 6 program was designedto do this by allowing 'producer-exporters' the option of importing theirinputs free of restrictions and exempt from import duties. Thesignificance of the program goes beyond allowing imports to be brought induty free as it also allowa exporters to bypass import licenserestrictions. In addition, a duty drawback facility was created toenable indirect exporters to reclaim import duties.
1.10 In October 1986, following the 312 devaluation of the previousmonth, GOI embarked upon a more fundamental program of reform. Theintention was to initiate a phased program to reduce import licenses andmove towards an import regime based solely on tariffs. Under the Octoberpackage, import restrictions were removed on 197 items, accounting for11 of all items and 192 of total import value previously restricted. Asa result, the share of manufacturing production protected by restrictiveimport licensing declined by about 14Z. The October package focussed ona number of highly protected activities such as chemicals, paints anddyes, tires and tubes, hides and leather, and glass. A start was alsomade in relaxing import licensing restrictions in the mechanical andelectrical equipment subsectors.
1.11 The Bank's analysis of of these reforms, coupled with theGovernment's strong record of macroeconomic management, provided thebasis for TPAL I. The objectives of the Loan were to: (a) support thesubstantial reforms, especially in the area of trade policy, undertakenby the Government during 1986 and to monitor their implementation; (b)assist GOI to bring about an early recovery in economic activityconsistent with external and domestic financial stability; and (c)maintain the policy dialogue on further reforms for promoting theefficiency and longer-term viability of the economy. These objectiveswere to be achieved partly through balance of payments support and partlythrough ongoing consultation on policy issues and improved institutionalarrangements for administration of the trade regime. A related technicalassistance loan wag to be processed in the near future, to finance anumber of macroeconomic and trade related studies. In particular, anup-to-date effective rate of protection study was identified as apriority, to gain a clearer picture of economywide distortions created bythe existing trade regime. The Bank also proposed that Governmentestablish a Trade and Industry Policy Steering Committee to coordinatefuture Government effort on deregulation.
1.12 In addition to the steps already taken, GOI's "Statement onEconomic and Trade Policy' provided a clear indication that theGovernment would continue to maintain macroeconomic stability and thatfurther progress in implementing structural reforms would be forthcoming.In terms of follow-up steps, the Bank explained that it would monitorclosely, through frequent consultation with GOI, the progress on

- 78 -
implementation of Gol's package of measures on trade reform andmacroeconomic management. In particular, the Bank would pay attentionto: (a) continued prudence on fiscal and monetary policies, includingscrutiny of the public investment program; (b) continued appropriateexchange rate management; (c) further measures to reduce non-tariffbarriers (NTBs) and rationalize the tariff structure; and (d) progress onstudies of industrial regulations and public enterprises. The Bank alsoexplained that if satisfactory progress in these areas were made, afollow-up loan could be considered in about a year.
II. Implementation of the Reform Program
Macro-economic Management
2.1 GOI managed to contain the overall budget deficit for 1986/87 to4.6Z of GDP, below the Government's target of 5? (see Table 2). This wasachieved by an appropriate combination of revenue raising and expenditurereducing policies. An increased effort to implement the series of taxreforms introduced in 1984-86 -- designed to simplify the tax code andbroaden the revenue base -- resulted in a 25Z increase in non-oil taxes.2/Non-tax revenues also increased as a result of the Government decision tomaintain domestic fuel prices at the pre-1986 level despite the fall inworld prices. On the expenditure side, the Government kept currentexpenditures close to budgeted levels. Civil servants salaries werefrozen, and a reduction in subsidies partly offset the increase ininterest payments on external debt resulting from the Septemberdevaluation. Capital expenditures were also tightly controlled.Development expenditures were reduced by about 25? in real terms in1986/87. This decline occurred despite significant improvements in theimplementation of foreign aided projects, and reflected the very cautiousattitude adopted by Government towards rupiah spending. As a result, therupiah development spending by Departments (excluding Defense) isestimated to have been cut by almost 60Z. Reduced rupiah developmentexpenditure is the major reason for the sharp decline in net domesticexpenditure (i.e., the domestic content of government spending less non-oil revenues), which fell from 8.3Z of GDP in 1985/86 to 4.1Z in 1986/87,indicating the severe economic restraint imposed by the budget.
2.2 GOI's austere budgetary stance was supported by appropriatemonetary policy. Despite two episodes of capital flight and theinevitable monetary problems associated with the September devaluation,the monetary authorities maintained stability in the financial markets.Adjusting for valuation changes resulting from the September devaluation,total domestic credit rose by 21.8Z in 1986, significantly below the rateof expansion in 1985.
2.3 GOI's cautious approach to fiscal and monetary policy wasmaintained in 1987/88. Although the Government's resource position in1987/88 turned out to be better than budgeted, due to higher oil pricesand a further increase in non-oil taxes, expenditures remained tightlyrestrained. Civil service salaries were frozen for a second year, butoverall current expenditures increased because of the continued rise in
2/ For more details see Chapter 3, 'Indonesia: Strategy for EconomicRecovery', Report No. 6694-1ND, May 5, 1987.

- 79 -
Table 2: CENTRAL GO'VERNMENT BUDGET, 1982/83-1987/88(Rp. trillion at current prices)
Actuals Budget Estimate1982/83 1985/86 1986/87 1987/88 1987/88
Revenues and grants 12.0 18.6 16.5 17.3 21.7Oil and LNG taxes 7.6 10.7 6.3 6.9 10.1Non-oil taxes 3.8 6.3 7.9 3.1 9.5Non-tax revenues Ia 0.4 1.5 2.2 1.2 1.8Grants 0.1 0.1 0.1 0.1 0.3
Current expenditures /b 8.2 12.4 13.2 13.0 15.2External interest 0.7 1.8 2.8 3.4 3.8Subsidies 1.4 1.1 0.5 0.2 1.2Other 6.1 9.5 9.9 9.4 10.2
Government savings 3.7 6.3 3.3 4.3 6.5Capital expenditure 6.4 9.0 8.0 6.4 9.7Overall balance -2.7 -2.8 -4.7 -2.0 -3.2Financed by:External loans (net) 2.1 1.8 3.8 2.0 3.1Disbursements 2.8 4.4 7.1 5.4 8.0
- Project aid (2.0) (3.5) (4.1) (4.4) (5.3)- Other /c (0.8) (0.9) (3.0) (1.0) (2.7)
Amortization 0.7 2.6 3.3 3.4 4.9Asset drawdown /d 0.6 0.9 0.9 0.0 0.1
Memo itemis (Z of GDP):Revenue and grants 18.3 19.6 16.2 14.7 18.5Non-oil taxes 5.9 6.6 7.8 7.8 8.1Government savings 5.7 6.6 3.2 3.7 5.6Overall balance -4.1 -2.9 -4.6 -1.7 -2.7Total expenditure 22.4 22.5 20.8 16.5 21.2Net domestic expen-
diture /e 11.0 8.3 4.1 1.0 4.0
/a Includes doneAtic oil surplus in 1986/87./b Derived from routine expenditure by deducting amortization and adding
the fertilizer subsidy, export certificates, defense spending and therecurrent component of development expenditure.
/c Refers to program loans, special local-cost financing and commercialborrowing.
/d Excludes gain from valuation adjustment in 1986/87, estimated at Rp.1.8 trillion.
/e Defined as the domestic content of expenditure less non-oil revenues.
Source: Ministry of Finance and World Bank staff estimates.
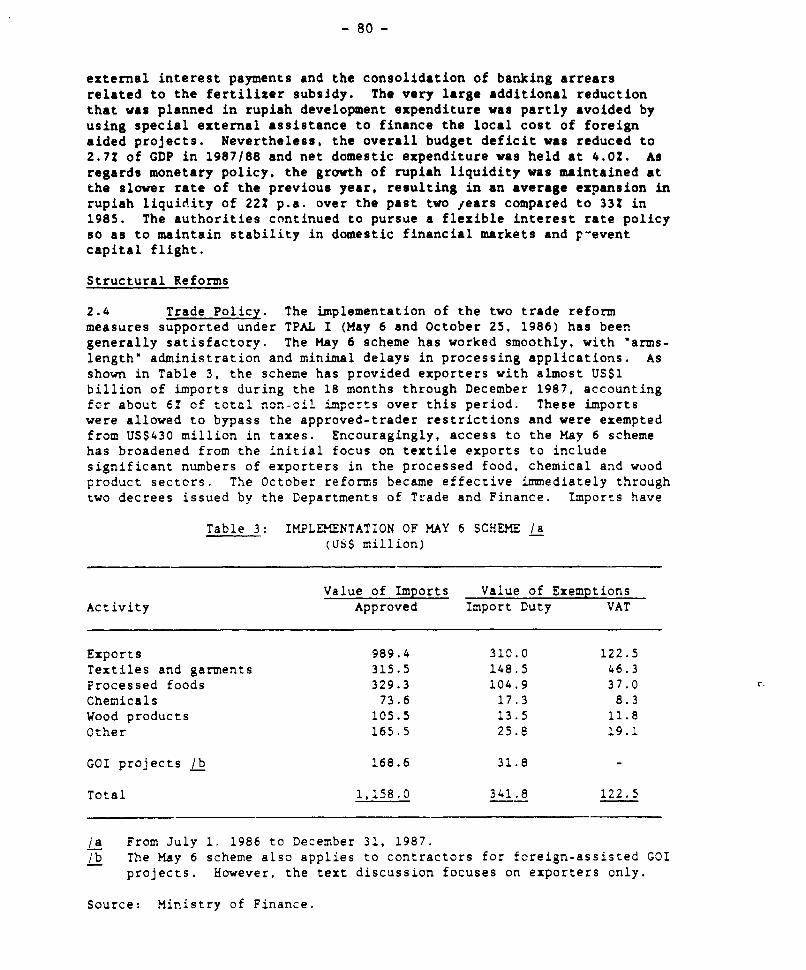
- 80 -
external interest payments and the consolidation of banking arrearsrelated to the fertilizer subsidy. The very large additional reductionthat was planned in rupiah development expenditure was partly avoided byusing special external assistance to finance the local cost of foreignaided projects. Nevertheless, the overall budget deficit was reduced to2.7Z of GDP in 1987/88 and net domestic expenditure was held at 4.0?. Asregards monetary policy, the growth of rupiah liquidity was maintained atthe slower rate of the previous year, resulting in an average expansion inrupiah liquidity of 222 p.a. over the past two fears compared to 33? in1985. The authorities continued to pursue a flexible interest rate policyso as to maintain stability in domestic financial markets and p-eventcapital flight.
Structural Reforms
2.4 Trade Policy. The implementation of the two trade reformmeasures supported under TPAL I (May 6 and October 25, 1986) has beengenerally satisfactory. The May 6 scheme has worked smoothly, with 'arms-length" administration and minimal delays in processing applications. Asshown in Table 3, the scheme has provided exporters with almost US$1billion of imports during the 18 months through December 1987, accountingfor about 6! of total non-cil imports over this period. These importswere allowed to bypass the approved-trader restrictions and were exemptedfrom US$430 million in taxes. Encouragingly, access to the May 6 schemehas broadened from the initial focus on textile exports to includesignificant numbers of exporters in the processed food, chemical and woodproduct sectors. The October reforms became effective imediately throughtwo decrees issued by the Departments of Trade and Finance. Imports have
Table 3: IMPLEMENTATION OF MAY 6 SCHEME /a(US$ million)
Value of Imports Value of ExemptionsActivity Approved Import Duty VAT
Exports 989.4 310.0 122.5Textiles and garments 315.5 148.5 46.3Processed foods 329.3 104.9 37.0Chemicals 73.6 17.3 8.3Wood products 105.5 13.5 11.8Other 165.5 25.8 19.1
GOI projects /b 168.6 31.8 -
Total 1,158.0 341.8 122.5
/a From July 1. 1986 to December 31. 1987./b The May 6 scheme also applies to contractors for foreign-assisted GOI
projects. However, the text discussion focuses on exporters only.
Source: Ministry of Finance.

- 81 -
subsequently increased sharply for items removed from licensingrestrictions or where tariffs were reduced. For example, third quartercomparisons from 1986 to 1987 show import value increases of 35Z for basicchemicals. 261 for dyes and tanning materials, 61? for textiles andfibers, and 352 for motor vehicle components. However there have beensome bureaucratic delays in clarifying license application requirementsand procedures (e.g., for sole agencies), while high tariffs haveconstrained the import of some items removed from licensing restrictions(e.g., paper products). As noted below, a start has been made in tacklingthese problems under the 1987 reform packages. Finally, the Governmentalso established, in July 1987, a Trade and Industry Policy SteeringCommittee (TIPSC) to coordinate future deregulation measures.
2.5 GOT has maintained the momentum of trade policy reform, along thelines laid out in the Government's "Statement on Economic and TradePolicy". Two major trade reform packages were announced onJanuary 15. 1987 and December 24, 1987, supported by a series of smallerpolicy actions. These measures, have: (i) continued the shift fromimport restrictions to tariff-based protection; (ii) adhered strictly tothe lower tariff ceiling in setting tariff rates on the products removedfrom NTB protection; (iii) taken initial steps toward tariffrationalization; (iv) broadened the scope of the May 6 scheme givingexporters access to inputs at ir 3rnationally competitive prices; and(v) reduced remaining export cictions.
2.6 The measures taken in 1987 provided the basis for the Bank'sSecond Trade Policy Adjustment Loan, which is currently being disbursed.3/In brief, the January and December packages have together resulted in theremoval of an additional 342 items from license control, accounting for20Z of all items and 23? of total import value previously restricted.More importantly, the share of manufacturing production protected byimport licensing has declined further from 42Z at the end of 1986 to 35?at the end of 1987 (see Table 4). And, as the effective rate ofprotection study which was undertaken as a result of TPAL I shows, thereduction in NTBs has been concentrated in those activities with thehighest effective rates of protection.4/ The January and December packageshave also relaxed some of the remaining restrictions, particularly in thetextile and engineering goods sectors, by placing them under the IP(actual user) license category. This is the least restrictive license,and allows all producers who require these items as inputs to import themfreely. As a result of the measures taken during 1987, virtually allproduction in textiles falls under the unrestricted or IP licensecategory. Given, in addition, the relatively easy access of exporters tothe May 6 scheme, the textile sector is now largely free of importlicensing restrictions. Similar progress has been made in many branchesof the engineering goods sector, although several final goods remain underrestrictive license or import bans.
3/ Approved by the Executive Directors on May 10, 1988, (ReportNo. P-4794-IND). For detailed assessment of January and Decemberreforms see Annex VI.
4/ The results of the Effective Protection Study are summarized in thePresident's Report for TPAL II (Report No. P-4794-IND).

- 82 -
Table 4: EFFECT OF REFORM PACKAGES ON IMPORT LICENSINGCOVERAGE SINCE 1986
Before After After AfterShare covered under Reforms Oct. 1986 Jan. 1987 Dec. 1987Import Licensing (Z) (mid-1986) Reforms /a Reforms /b Reforms /b
Import items 31.4 27.9 25.7 21.7
Value of imports 42.9 34.9 31.5 25.2
Manufacturing productions 49.1 42.4 38.8 34.8
/a Measures supported under TPAL I./b Measures supported under TPAL II.
Source: President's Report for TPAL II, Annex VI, Table VI.1
2.7 The trade reform measures in both 1986 and 1987 also involvedchanges in import tariff rates. The major corrective tariff reformoccurred in 1985, and the net impact of the subsequent trade reformpackages has been small (see Table 5). In total 275 tariffs were adjustedupwards and 331 tariffs were lowered.5/ The increased tariffs compensatedfor the effects of the removal of import licensing restructions, butremained within the tariff ceiling set in 1985. The reductions in tariffsfocussed on those products not produced locally, and were intended tooffset the cost raising effects of the September 1986 devaluation.However, it should be noted that the December reductions went beyond thislimited objective by reducing tariffs on some domestically produced itemsthat were removed from import license restriction in earlier decrees, butafforded a higher tariff. This is the first step towards the next phaseof trade reform, i.e., rationalizing the general tariff structure.
2.8 Lastly, the December package has made more substantial progressthan the previous two packages in eliminating some of the directimpediments to exports. The need to obtain a special export license wasabolished; several export bans and quotas have been removed: and access byexporters to the May 6 scheme has been broadened. These reforms willreduce the impediments to exporters by eliminating redundant regulations.Furthermore, they will reduce substantially the anti-export bias of thetrade regime for existing exporters, thereby increasing the relativeprofitability of exports and bolstering the export drive.
2.9 Industrial Deregulation and Foreign Investment Policies.Progress in trade policy reform has highlighted the need for complementarymeasures on industrial deregulation. The performance of the industrial
5/ For detailed examination of these changes see President's Report forTPAL I (Report No. P-4429 IND) and TPAL II (Report No. P-4794 IND).

- 83 -
Table 5: RECENT CHANGES IN THE TARIFF SCHEDULE /a
1980 Schedule 1985 Schedule End-1987 ScheduleNo. of 2 of CCCN No. of Z of CCCN No. of 2 of CCCN 1o. ofTariff tariff items tariff items tariff itens
Rates b categories covered categories covered categories covered
0? 1 6.5 1 16.3 1 9.1
Up to 52 4 29.2 2 32.0 2 35.4Up to 102 6 39.5 3 44.9 3 47.8Up to 152 7 41.9 4 50.3 4 52.5Up to 202 8 47.8 5 64.0 5 62.5Up to 302 10 58.7 6 81.8 6 80.5Up to 402 12 70.6 7 91.5 7 90.2Up to 50Z 14 77.9 8 96.2 8 95.4
Up to 60Z 15 90.1 9 99.6 9 99.5Up to 802 17 95.1 9 99.6 9 99.5Up to 1002 19 99.6 10 99.9 10 99.9
Up to 2002 24 99.9 11 100.0 11 100.0Up to 2252 25 100.0
/a Table shows cumulative number of tariff categories and percent of CCCNitems covered at various tariff rates. Specific tariffs are excluded.
/b As of December 24, 1987.
Source: Ministry of Finance and World Bank staff estimates.
sector has been hindered by a multitude of domestic regulations and
licensing procedures, particularly investment and capacity licensing.Moreover, additional regulations controlling the activities of foreigninvestment companies have restricted the flexibility of these firms and
reduced the attractiveness of Indonesia to foreign investors. Recognizing
these impediments to private sector growth and investment, the Government
has taken a series of steps to simplify and relax the regulatoryframework.6/
2.10 A start was made in 1985 when the investment process was
streamlined. In 1986, fields of investment open to both foreign and
domestic companies were specified more clearly and the number of areas
open to private foreign and domestic investment was expanded
substantially. Moreover, foreign investment companies were given greater
access to domestic capital and financial institutions, and domestic
ownership requirements were eased.
2.11 The Government's drive to revitalize the orivate sector andencourage foreign investment gained momentum during 1987. A number of
6/ For detailed assessment see Annex VI Section B of President's Report
for TPAL II.
- 84 -
major steps were taken to relax the investment and capacity licensingsystem and ease foreign investment regulations. As a result of measurestaken in June, firms are now allowed to increase production by up to 302of their licensed capacity without requiring new investment approval.More significantly, firms have been permitted to diversify productionwithin much broader product categories, thereby improving the operationalflexibility of firms and promoting greater competition. Furthermore, therequirements for investment licenses were streamlined and additionalfields of investment opened to private domestic and foreign investors.The December package included a series of measures to relax foreigninvestment regulations: domestic ownership requirements were easedsignificantly; restrictions prohibiting foreign-owned companies frommarketing Indonesian export goods were removed; foreign firms are nowallowed to purchase domestic input without restriction; and rulesregarding the hiring of expatriate personnel were relaxed. These stepshave addressed key concerns expressed by foreign investors in Indonesiaand will reduce differences in treatment between foreign and domesticfirms. Together with the broader regulatory measures, they have removedmany of the disincentives to foreign investors and have improvedsubstantially the climate for foreign investment in Indonesia.
2.12 Financial Sector Reform. In June 1983, GOI launched acomprehensive reform of the financial sector, which included aliberalization of most interest rate controls on state bank deposits, theelimination of credit ceilings for all banks, and a reduction in thenumber of programs qualifying for new Bank Indonesia liquidity credits.These reforms have had a far-reaching impact on the financial system,successfully increasing domestic resource mobilization, promoting greatercompetition and market orientation, and improving the allocation ofcredit. Over the past three years, Bank Indonesia has also introduced arange of new monetary instruments (e.g., SBIs, SBPUs)7/ to improvemonetary management and encourage development of an active interbank moneymarket. In July 1987, an auction system was introduced to determine SBIand SBPU volumes and discount rates, which, in combination with othermonetary measures, helped ease the speculative pressure against theRupiah.
2.13 Concerns about the longer-term effect of high interest rates oninvestment and the financial viability of enterprises, and the relativelack of term transformation in the banking system, led GOI to undertakespecific measures in December 1987 to strengthen the role of equitymarkets. First, to increase the supply of securities, listingrequirements on the Jakarta Stock Exchange, which now lists only 24companies with a market capitalization of about US$60 million, weresimplified through the elimination of all but three pieces of essentialdocumentation. Second, supportive measures were introduced to improve theinstitutional framework (e.g., pricing mechanisms) and the operation ofcapital market institutions (e.g., underwriters, guarantors, stocktraders). Third, GOI created an over-the-counter (OTC) market to enablesmaller, less well-established companies to mobilize investmentrequirements through the capital market. Finally, in an attempt tostrengthen the demand for securities, GOI will encourage the issue ofbearer shares and will allow foreign investors to purchase shares in theOTC market.
7/ SBIs are Central Bank certificates and SBPUs are private sectorpromissory notes held by banks, and rediscounted by the Central Bank.

- 85 -
Technical Assistance
2.14 The planned technical assistance loan to TPAL I did notmaterialize. In developing the follow-up technical assistance projectfour separate separate components had been identified: trade policy andindustrial regulations support, public enterprise review, macroeconomicflow of funds analysis, and review of the investment planning andbudgeting system. Unfortunately, it proved too difficult to process sucha wide range of technical assistance at the same pace. The proposedpublic enterprise review posed particular problems as the Government feltthat a strong Bank presence would hinder rather than further publicenterprise reform at this stage. As a result, alternative funding for thethree other components was found under ongoing Bank projects and from theIMF.
2.15 In anticipation of these problems, the first phase of the tradepolicy and industrial regulation work -- an effective rate of protectionstudy -- was financed under the Bank's Fifth BAPINDO Project (LoanNo. 2277-IND). GOI gave its full support to this effort, and theconsultants were able to finish the study as scheduled by December 1987.Also, in appraising TPAL I and II the Bank has produced datasets andanalytical tools relevant to analyzing the significance of the reformeffort. Follow-up technical seminars have been organized and theGovernment is now using the output from both these exercises in its ownanalytical work. The second phase of the trade and industry work -- whichfocuses on documenting and assessing the domestic industrial regulatoryframework -- was started and is being undertaken by Bank staff. This willbe incorporated with the work done in the first phase under a longer termtechnical assistance effort designed to support the newly formed Trade andIndustry Policy Steering Committee.
2.16 With respect to public enterprises, although the planned reviewhas been deferred, some progress has been made. With IMF assistance, apreliinary consolidation of the financial accounts of public enterpriseswas completed in January 1988. The President of Indonesia has also askedfor a review of the financial performance of all public enterprises, toidentify potential candidates for rehabilitation, merger or divestiture.The data for this review have now been collecteu, and the Government hasindicated that it intends to initiate a program of reform. In addition,the Government has also taken steps to contain investment by publicenterprises. Since 1986 tight control has been kept on utilization ofnon-concessional import-related credits and equity participation in publicenterprises funded through the Budget has been reduced to minimal levels.
III. Impact of the Reform Program and Costs of Adjustment
Impact of Reform Program
3.1 As a result of the Government's fiscal and monetary policies,inflation was held to about 9Z p.a. since 1986 -- a remarkable achievementgiven the magnitude of the September 1986 devaluation. This preserved thecompetitive advantage provided by the devaluation and greatly improved the

- 86 -
profitability of non-oil exports. In response to this real exchange rateadjustment, as well as the recent deregulation measures, exports haveincreased substantially. Non-oil exports are estimated to have risen toUS$9.4 billion in 1987/1988, an increase of 40Z in nominal terms and 24?in real terms over 1986/87. About two thirds of this increment wascontributed by manufactured goods, despite the slower growth of textiles(which accounted for a third of manufactured exports in 1986/87). Volumegrowth of manufactured goods is estimated at 402 in 1987/88. Furthermore,this growth has been achieved across a wide range of products (e.g., paperproducts, furniture, shoes, batteries), some of which were exported forthe first time. Import demand has been restrained due to the Government'sprudent fiscal and monetary policy and the September 1986 devaluation.Although there has been a recovery over the past year, the real level ofnon-oil imports is still 12? lower than in 1985/86.
3.2 Because of the strong non-oil export performance and demandrestraint on imports, the current account deficit was contained atUS$4.2 billion (6.22 of GNP) in 1986/87 and reduced to an estimatedUS$2.0 billion (3.12 of GNP) in 1987/88 (see Table 6). The financing ofthese deficits and higher arortization payments has been easedconsiderably by the provision of special external assistance, in the formof fast-disbursing program aid and local-cost financing. Disbursements ofspecial assistance totalled about US$0.5 billion in 1986/87 andUS$1.4 billion in 1987/88, 8/ or 121 of total non-oil imports over thepast year. As such, special assistance has played a very valuable role inhelping the Government push ahead with its trade deregulation measures,and by cushioning the economy against the deflationary impact of the dropin oil prices, has facili,ated the recovery of private investment andgrowth. In April 1987, Indonesia also obtained US$606 million from ti.eIMF's Compensatory Finance Facility (CFF). By the end of 1987/88, BankIndonesia was able to rebuild its net official reserves to US$5.6 billion,equivalent to 4.4 months of imports. This relatively high level ofreserves is considered appropriate. given Indonesia's open capital accountand the need to ride out occasional episodes of speculation.
3.3 The Government's balanced adjustment program has also helped tosustain a better-than-expected rate of economic growth, despite the lossof oil revenues. Total ;DP grew on average by 3.7? p.a. in 1986 and 1987.Most of this growth came from the non-oil economy. Within the non-oileconomy, a decline in the growth rates of the agriculture and miningsectors was more than offset by improvements in the performance of themanufacturing, construction and service sectors. Overall performance wasbuoyed by the strong growth of non-oil exports, while restraining factorswere the drought in 1987 and cuts in government spending. There were alsoencouraging signs of a recovery in private investment, by both domesticand foreign joint-venture investors, in response to better marketconditions and improvements in the regulatory environment.9/ In the
8/ This included disbursements from TPAL 1, the local cost financing ofWorld Bank projects by Japan EXIM Bank, and extra program aid andlocal-cost financing from IGGI members.
9/ Approvals of domestic investment by the Investment Coordinating Board(BKPM) jumped more than 130Z in rupiah terms in 1987, whereas foreigninvestment approvals rose by 76Z in dollar terms, in both casesdirected primarily towards export activities.

- 87 -
Table 6: BALANCE OF PAYMENTS, 1982/83-1987/88(US$ billion at current prices)
Actuals Estimate1982/83 1985/86 1986/87 1987/88
Merchandise exports (fob) 18.6 18.5 13.7 17.9
- Oil & LNG (14.7) (12.3) (7.0) (8.5)
- Non-oil (3.9) (6.2) (6.7) (9.4)
Merchandise imports (cif) -20.6 -14.2 -12.7 -14.1
- Oil & LNG (-4.8) (-3.2) (-2.3) (-2.5)
- Non-oil (-15.8) (11.0) (-10.4) (-11.6)
Trade balance -2.0 4.3 1.0 3.8
Net non-factor services -1.7 -1.7 -1.5 -1.5
Resource balance -3.7 2.6 -0.5 2.3
Net factor services &transfers -3.5 -4.5 -3.7 -4.3
Current account balance -7.2 -1.9 -4.2 -2.0
of which:- Oil & LNG Ia 7.2 5.9 2.4 3.7
- Non-oil -14.4 -7.8 -6.6 -5.7
Net public MLT loans /b 4.0 1.4 2.8 2.4
- Disbursements (5.1) (3.9) (5.4) (6.3)
- Amortization /c (-1.1) (-2,5) (-2.6) (-3.9)
Net other capital /d -0.1 1.4 -1.6 0.8
Use of net foreign assets 3.3 -0.9 3.0 -1.2
Memo items:Net official reserves /e 3.0 5.8 5.0 5.6
- Months of imports (1.7) (5.5) (4.3) (4.4)
Total net foreign assets If 7.5 12.6 9.6 10.8 gCurrent account/GNP (Z) -7.8 -2.4 -6.2 -3.1
/a Gross earnings from oil/LNG exports less payments for imports and
services related to the sector./b Includes credits for LNG expansion, LPG and paraxylene projects.
c Includes prepayments of US$420 million in 1985/86 and US$626 million
in 1987/88 (to be completed by June 1988).
/d Includes direct foreign investment, oil/LNG exports credits, a.'
private capital flows, valuation adjustments, and errors and
omissions./e Net of outstanding drawings from IMF's Buffer Stock and Compensatory
Financing Facilities.If Of the banking system (Bank Indonesia and commercial banks).
fg Includes US$326 million of prepayments to be completed by June 1988.
Source: Bank Indonesia and World Bank staff estimates.
- 88 -
manufacturing sector, this revival in investment seems to be broad-based,cutting across all industries and firm-size classes. A noteworthyelement is that much of the increase in manufacturing investment was forexport activities.
Costs of Adiustment
3.4 The combination of GDP growth and an improvement in Indonesia'sterms of trade helped support a real increase in national income of 4.22in 1987, as compared to a decline of 2.5Z in 1986. Even so, in percapita terms, national income at the end of 1987 will still be lower thanin 1981. GOI has acted 'o contain the social costs of this income lossby: (a) giving priority to public spending on agriculture and localinfrastructure; (b) promoting non-oil exports, which are generally morelabor-intensive; and (c) adopting a more supportive attitude towardactivities in the intormal sector, particularly in urban areas. Forexample, the share of agriculture and regional development programs indevelopment expenditure was increased from 18.32 in 1985/86 to 26.2Z inthe 1988/89 budget. Social programs were also protected, with the shareof education, health and urban services remaining flat at about 201,although the level of absolute cuts has been substantial.
3.5 While slower growth in domestic demand and greater importcompetition have affected some activities, broad-based export growth andthe recovery of private investment have had a salutary effect onemployment growth. Many of the fastest-growing export items -- includingagricultural products, textiles and garments -- are labor-intensive andimportant employment-generating activities. Nevertheless, despite thesepositive actions which have moderated the social costs of adjustment, theGovernment remains concerned about employment and income growth asIndonesia's labor force is expected to expand by about eight million overthe next five years.
3.6 An additional area of concern in this adjustment period is theeffects of devaluation and high real interest rates on the financialposition of firms. Although there is little overt evidence of a rise inbankruptcies or widespread financial stress, the portfolios of somefinancial institutions remain weak, and will require careful monitoringto ensure that the financial system can adequately support the adjustmentprocess.
IV. Loan Administration, Use and Coordination
Procurement and Disbursement
4.1 Procurement and disbursement procedures for TPAL I were designedto ensure rapid drawdown of loan proceeds. The loan was used toreimburse 100Z of foreign expenditures for eligible imports by the publicor private sector for which payments were made after the date of loansigning. There was no retroactive financing under the loan. The loanspecified a standard list of ineligible imports, i.e., goods intended formilitary or paramilitary purposes, or for luxury consumption: goodsfinanced from other official multilateral or bilateral sources; uranium;and goods procured under contracts of less than US$100,000. BankIndonesia was responsible for maintaining and administering the loan
- 89 -
account. All purchases in the amount of US$5 million equivalent or morewere to be procured through International Competitive Bidding (ICB)inaccordance with Bank guidelines. Procurement by the private or publicsector of goods contracted at a price less than US$5 million equivalentwere handled on the basis of normal commercial practice or followingnormal Government procurement procedures acceptable to the Bank.Disbursements of eligible import expenditures would be based onStatements of Expenditures (SOEs) for imports valued at less thanUS$5 million; for imports above this amount full documentation would berequired. Since all contracts submitted to the Bank by the Borrower werebelow US$5.0 million, no ICB was involved in procurement, and the loanwas disbursed on the basis of SOE procedures. Disbursements under TPAL Iwere concentrated in April (US$140 million equivalent) and June 1987(US$160 million equivalent), and proceeded smoothly. The loan has beenlargely used to finance private sector imports of raw materials andintermediate goods. The counterpart funds generated by imports financedunder TPAL I were credited to a special account in Bank Indonesia andwere used to finance priority public expenditure programs associated withthe Government's 1987-88 Budget.
Use of Counterpart Funds
4.2 The counterpart funds generated by imports financed under theTPAL I were credited to a special account in the Bank Indonesia and wereused to finance priority public expenditure programs associated with theGovernment's Budget.
Coordination with the IMF
4.3 There was good interaction between the Bank and the IMF on theTPAL I program. This took the form of informal exchanges andconsultations during loan preparation. The IMF staff participated inreviewing the reports associated with TPAL I, and fully supported theloan.
4.4 The latest IMF Consultation Report was issued on April 15, 1988.GOI has not had any standby or extended arrangements with the IMF since1973. GOI's last purchase from the IMF was for SDR 463 million in May1987 unaer the Compensatory Financing Facility (CFF). This purchaseincreased Indonesia's total outstanding 7MF obligations toSDR 505 million at the end of 1987. After the last Consultation Report,the IMF Executive Board expressed its satisfaction that "Indonesiamaintains an exchange system which is free of restrictions on paymentsand transfers for current international transactions." EffectiveMay 7. 1988, the Government of Indonesia has accepted Article VIIIstatus.
V. Evaluation and Remaining Agenda
Evaluation
5.1 In evaluating an adjustment operation, three benchmarks arerelevant. First, were the policy measures supported by the loan fullyimplemented? Second, did the economic performance resulting from thepolicy actions match the expectations at loan appraisal? Third, howeffective was the loan in supporting a sustainable medium-term adjustmentprocess?

- 90 -
5.2 On the first, the outcome was unequivocal, since the loan wasbased on policy actions already taken. Moreover, the policy measureshave been implemented well and without undue administrative delays. Onthe second benchmark, the results to date have exceeded expectations atloan appraisal. As noted, the fiscal deficit for 1986/87 was below theGovernment target and a further large reduction was achieved in 1987/88.This, together with tight monetary management, helped curb inflation andmaintain the large gains in competitiveness. Most impressively, non-oilexports reached $9.4 billion in 1987/88 compared with $7.5 billionprojected at loan appraisal. This surge in non-oil exports, and somewhathigher oil prices, permitted higher import levels and supported morerobust growth than projected (4.31 actual non-oil GDP growth in 1987compared with 0.9Z projected), while also reducing the current accountdeficit more substantially than anticipated ($2.0 billion deficitcompared with a projected deficit of $2.7 billion). Overall, therefore,the economic outcomes and reduction in macroeconomic imbalances have beenimpressive and exceeded expectations at loan appraisal.
5.3 Finally, the loan has contributed to sustaining the medium-termadjustment process in a number of ways. It has helped mobilize flexibleexternal finance for budgetary and balance of payments support. Thisspecial assistance, and the early and strong supply response resultingfrom the measures supported by the loan, have in turn created a betterclimate for further deregulation. The technical assistance provided bythe Bank subsequent to the loan and the Bank's policy discussions withthe Government have assisted in delineating these further steps. Asnoted, a series of further policy measures were taken following theapproval of TPAL I. A comparison of the actual steps taken since theloan was approved with the "areas for follow-up' identified in the PolicyFramework clearly indicates the Government's commitment to the adjustmentprogram. Significant steps have been taken to improve the trade regimefurther through the reduction of import licensing and reform of exportpolicies. In the area of industrial deregulation, the Government'sefforts went beyond what was expected by actually initiating steps torelax investment licensing and t'king steps to simplify and ease foreigninvestment regulations. Regarding public enterprises, the Government(with IMF assistance) completed a preliminary consolidation of thefinancial accounts of public enterprises, but an actual program of reformhas yet to be announced. Finally, GOI has pursued, as suggested in thePolicy Framework, appropriate macroeconomic policies through a prudentfiscal and monetary stance and sound exchange rate management.
5.4 One of the clearest lessons from the Indonesian experience isthat understanding the Government's own agenda is a prerequisite for thistype of policy based lending. This enables the Bank to identify areaswhere the Government is considering reform early on in the decision-making process. As a result, the Bank has focussed on those issues whereopenness to policy advice, and hence the potential impact of Bankinvolvement, is greatest. The maintenance of a well staffed ResidentMission has facilitated this process and provided the capacity to respondto Government's initiatives in a timely and substantive manner.
5.5 One constraint to the pace and direction of reform that has beenidentified during the TPAL I process is the shortage of skilled andpolicy-oriented staff within GOI. Although there has been significant

- 91 -
progress in the process of policy formulation during the 1980s, muchdepends on a few over-stretched individuals at the higher echelons ofGovernment. Greater emphasis needs to be placed in building up theinstitutional capacity within Government to undertake analysis andformulate policy reforms.
5.6 In conclusion, it appears that the Bank's approach of proceedingwith a series of untranched loans linked to actions already taken hasbeen appropriate. This has permitted the Bank to provide clear supportto the ongoing adjustment effort, while allowing the Government to pursuevigorously future reforms without explicit ties to a Bank loan. On theother hand, the appraisal and supervision of TPAL I (and subsequentlyTPAL II) provided an important framework for furthering the policydialogue. While TPAL I will have to be evaluated eventually as part ofthe continuing adjustment program, the results to date are encouraging.The early and substantive follow-up measures that provided the basis forTPAL II suggest that TPAL I has provided a useful first step in whatappears to be a successful adjustment process.
The Remaining Agenda
5.7 Adjustment in Indonesia is proceeding well. Substantialprogress has been made in reducing external and internal imbalances.Moreover, exchange rate depreciation, trade reforms and industrialderegulation have strengthened competitiveness, reduced production costsand improved allocative efficiency in the economy leading to a sharpincrease in exports and a strong revival of private investment.Nonetheless, the lower price of oil and the steep increase in debtservice suggest that stabilization efforts must continue to reduce fiscaland external deficits to sustainable levels during the next two years.
5.8 At the same time, investment must be maintained at its currentrate and eventually increased to support the export drive and to providethe basis for economic recovery. Over the medium term, the non-oileconomy must grow at least 5Z per annum to absorb the growing labnr forceand permit a meaningful reduction in the level of poverty. This illrequire policies that continue to restructure the economy whilestimulating investment. Since much of the momentum for growth will comefrom export expansion and improvements in economywide efficiency, astrat-gy of growth with adjustment also will provide the best means toprotect and improve the creditworthiness of the economy. Improveddomestic resource mobilization and non-oil export growth will steadilyclose internal and external resource gaps, providing the basis for growthwithout recourse to special external support.
5.9 The Government remains committed to maintaining appropriatemacroeconomic policies supported by the necessary structural adjustmentreform. This has been demonstrated in the recently announced Budget for1988/89 which anticipates further restraint in both current and capitalexpenditures. For the third year in a row, the Government has decided tofreeze civil service salaries, and real capital spending is projected tofall. The Government is also actively considering further reforms in thetrade, industry and financial sectors. To support the Government in thiseffort, the Bank has provided technical assistance to the Trade andIndustrial Policy Steering Committee (TIPSC), which was formed as aresult of TPAL I. A proposal for longer term technical assistance has

- 92 -
been drawn up that will consolidate and improve upon the data base andanalysis undertaken under the effective rate of protection study and theongoing industrial regulation study. It is hoped that this will make auseful contribution towards building up the institutional capacity withinGovernment to address trade and industry related issues.
5.10 The Bank is continuing to support GOI's reform program. via theongoing Second Trade Policy Adjustment Loan.10/ This Loan provides thenecessary vehicle through which to continue work started under TPAL I, aswell as providing financial support during the adjustment period. UnderTPAL II, t'e Bank has emphasized that particular attention will continueto be paid to (a) further measures to reduce NTBs and rationalize thetariff structure; (b) continued progress on simplifying the regulatoryframework and reducing the scope of industrial licensing; (c) the studyof complementary reforms in the financial sector, to support industrialrestructuring and recovery; (d) appropriate fiscal and monetary policies,to reduce the current account deficit, control inflation and preserve acompetitive exchange rate; and (e) prudent external debt management;including limits on import-related credits and careful scrutiny ofproposals for large capital-intensive projects. It is hoped thatsatisfactory progress in these areas could be the basis for a thirdadjustment loan from the Bank in about a year.
10/ Approved by Executive Directors on April 19, 1988, Report No. P-4794-IND.

- 93 -
PROJECT COMPLETION REPORT
INDONESIA
TRADE POLICY ADJUSTMENT LOAN II(LOAN 2937-IND)
Introduction
1. The external environment faced by Indonesia has worsened considerably
since the early 1980s, with sharply lower oil prices, and more recently, the
depreciation of the US Dollar. The Government of Indonesia (GOI) has
responded effectively to this challenge, taking decisive actions to restrain
domestic demand, mobilize additional resources and set in train the structural
changes needed to develop the non-oil economy. The World Bank has supported
GOI's recent reform efforts through two adjustment loans: Trade Policy
Adjustment Loan I (TPAL I) approved on February 3, 1987 1/ and Trade Policy
Adjustment Loan II (TPAL II) approved on May 10, 1988. Both loans were for
US$300 million.
2. The objectives of TPAL II were to: (a) support the substantial
reforms, especially in the area of trade policy, undertaken by GOI during
1987, and ensure that they are implemented well; (b) assist GOI to bring about
an early recovery in economic activity consistent with external and domestic
financial stability; and (c) maintain the policy dialogue on further reform,
including the preparation of a medium-term plan for tariff rationalization.
These objectives were to be achieved partly through our ongoing dialogue on
policy issues and partly through balance of payments support. In addition to
providing direct financing for general imports, the loan played a catalytic
role in mobilizing US$2 billion of fast-disbursing special assistance during
1988/89. These additional resources have enabled GOI to push ahead with its
deregulation measures, and by cushioning the economy against the deflationary
impact of the drop in oil prices, have facilitated the recovery in private
investment and growth.
3. As with TPAL I, the loan supported policy measures announced prior to
Board presentation. This approach was considered appropriate because:
(a) the Bank's prior discussions with GOI had resulted in a common
understanding of the measures that needed to be taken; (b) analysis of the
measures to be supported by TPAL II showed them to be substantive and
deserving of support; (c) the measures taken were part of a medium-term
adjustment program to which GOI is strongly committed, and subsequent reforms
could provide the basis for a follow-up adjustment loan; and (d) GOI's strong
track record on economic management provided the basis for expecting that
further policy measures would be taken. The record of the past year indicates
that our confidence in GOI's commitment to the adjustment effort was not
misplaced.
4. As reviewed below, implementation of the reform program has proceeded
well and the results--in terms of stabilizing the economy and pror'oting
structural change--have been very encouraging. Over the past year, GOI has
maintained its sound macroeconomic policies and extended the reform process in
1/ The Project Completion Report for TPAL I was submitted OED on June 30,
1988.

- 94 -
three key areas: trade policy, maritime transport and the financial sector.Additional measures are expected soon in the areas of investment licensing andpublic enterprise reform. Progress in some areas has exceeded expectations(e.g., financial sector reform) while in others it has lagged behind (e.g.,tariff rationalization). However, overall, progress in the key areasidentified under TPAL II for monitoring and follow-up has been satisfactory.Accordingly, a third adjustment loan for private sector development is nowunder preparation and is expected to be presented to the Bank's Board in June1989. The proposed amount is US$350 million.
Implementation of the Reform Program
5. A key prerequisite for the success of GOI's reform program has beensound macroeconomic policies. Over the past three years, civil servicesalaries have been frozen and real capital spending by the Central Governmenthas been cut by more than 202. At the same time, a strong effort has beenmade to increase budget revenues, primarily through improvements in taxadministration. As a result, the ratio of non-oil taxes to GDP has risen from8.42 in 1985/86 to 10.8Z in 1988 89 (see Table 1). The combination of
Table 1: IMPLEMENTATION OF POLICY REFORMS
1985 1986 1987 1988
1. Fiscal policy /aNon-oil taxes (Z of non-oil GDP) 8.4 9.8 9.4 10.9Net domestic expenditure (Z of GDP)/b 8.5 3.8 4,1 2.2Primary balance (Z of GDP) -0.9 -1.1 0.8 0.4
2. Monetary policyReserve money growth (Z p.a.) 17.6 21.3 11.0 -5.7
3. Real effective exchange rate -2.9 -23.0 -26.6 -2.9(Z change) /c
4. Coverage of NTBs (Z)CCCN items 31.5 27.9 21.7 16.3Import value 42.9 34.9 25.5 20.8Domestic production 41.4 39.5 37.6 28.9Manufacturing production 52.0 43.8 35.3 26.0
5. Investment approvals /dDomestic (Rp. trillion) 3.7 4.4 10.3 14.9Foreign (US$ billion) 0.9 0.8 1.5 4.4
/a All data relate to the Central Government only./b The domestic content of expenditure less non-oil revenues./c Based on annual average data./d By BKPM.

- 95 -
expenditure restraint and tax effort has helped to improve the fiscal positionof the Central Government, with a decline in net domestic expenditure as aratio to GDP and generation of a primary surplus. Monetary policy was alsotightened, as reflected in the declining growth rate of reserve money. Theprudent fiscal and monetary stance has helped to contain domestic inflation toabout 9Z per annum over the past two years. At the same time, the nominalvalue of the Rupiah has been gradually depreciated against a basket ofcurrencies. As a result, the real effective exchange has continued todecline, preserving the competitive advantage provided by the devaluation inSeptember 1986.
6. In the area of trade policy reform, the loan was based on measurestaken during 1987 to reduce the coverage of non-tariff barriers (NTBs).Through two packages, in January and December 1987, GOI removed 342 itemsfrom import licensing restrictions. As shown in Table 1, these reformsaccounted for 20Z of all items and 221 of import value previously restricted.More importantly, they reduced the coverage of NTBs from 44Z to 35? ofmanufacturing production. Most of the reforms were in highly-protectedmanufacturing subsectors--such as textiles, garments and footwear, basicmetals and engineering goods--where import licensing restrictions had the mostdeleterious effect on internati-nal competitiveness and allocative efficiency.2/Follow-up discussions with GOI and interviews with firms suggest that thesemeasures have been implemented smoothly. The issuance of import licenses isfairly quick and non-discriminatory, and information regarding the reforms isbeing disseminated to the firm level.3/
7. Additional measures were taken during 1987 to eliminate some of thedirect impediments to exports: (a) the need to obtain a special exportlicense was abolished; (b) several export bans and quotas were removed;4/ and(c) access by exporters to internationally-priced inputs (through the May 6scheme) was broadened. As shown in Table 2, utilization of the May 6 schemehas continued to expand rapidly, in terms of number of firms and import valuecovered, while average processing times have been reduced.
2/ Because of the dominant role of agriculture, and the limited reforms inthis sector, the coverage of NTBs for the economy as a whole fell onlyslightly, from 40? to 38? during 1987. Follow-up measures to extendthe reforms into the agriculture sector were taken in 1988 (see para.14). These have significantly reduced the share of domestic productionunder NTBs.
3/ More recently, in November 1988, all existing import license holders(some 4,880) were required to reregister. By February 1, 3,667 hadreapplied and 3,645 (99?) had been approved. Some 42 new importerswere also registered during January and February 1989. Import Iicensesare now valid for as long as the importer remains in business, whereaspreviously licenses had to be renewed every 3 to 5 years.
4/ During 1988, some new export bans (e.g., semi-processed rattan, lowest-grade rubber) were imposed to increase domestic value added and/orprotect the environment. The justification for these bans needs to bereviewed, taking into account market conditions for these products andthe impact of the bans on domestic employment and income distribution.

- 96 -
Table 2: IMPLEMENTATION OF MAY 6 SCHEME
Value of imports Processing timeNo. of (US$ million) (no. of days)Firms Approved Realized Exemptions Drawbacks
1986 ja 242 236 65 12 241987 482 902 297 7 171988 1,098 2,447 626 6 13
/a From July.
Source: BPKE/PDK.
8. Under the two trade reform packages of 1987, tariffs for 121 itemswere raised and tariffs for 178 items were lowered. Temporary surcharges werealso imposed on 51 import items. The tariff increases compensated for theeffects of the removal of import licensing restrictions, but remained withinthe lower tariff ceiling set in 1985. The tariff reductions in the January1987 package were concentrated on products not produced domestically, and wereintended to offset the cost-raising effects of the September 1986 devaluation.The reductions in December 1987 went beyond this limited objective by reducingsome tariffs on domestically-produced goods that were removed from licenserestrictions under earlier decrees. As shown in Table 3, the cumulativeeffect of tariff changes since 1985 has been to reduce the range ofdispersion, with little effect on the average tariff rate. However, in movingoff NTBs, split tariffs and surcharges were used to protect some domesticproducers.5/ As a result, there are still marked differences between andwithin sectors in the level and dispersion of tariffs. This reinforces theimportance of broadening the trade reform effort to include a comprehensiverationalization of the tariff schedule.
9. Progress on tariff reform has been slower than expected, due todelays in strengthening GOI's institutional capacity to undertake trade andindustrial policy analysis. Despite strenuous efforts by Bank staff,proposals for technical assistance did not materialize. One of theconstraints has been the absence of a clear focal point within GCt for tradeand industrial policy work. In response to this situation, GOI has recentlyreconstituted the high-level team on tariffs, under the chairmanship of theJunior Minister of Finance. In addition to tariffs and surcharges, this teamalso has responsibility for related issues of trade and industrial policy. Tobe effective, this team will require technical assistance to build up itsanalytical capacity.
5/ "Split tariff" positions are used to subdivide a standard seven or ninedigit CCCN/HS product description into finer product groups withdifferential tariffs or NTBs applied. Surcharges are also used as ade facto anti-dumping device.

- 97 -
Table 3: CHANGES IN THE TARIFP SCHEDULE /a
Pre-1985 1985 1988 1989
Average tariff rates (2)Unweighted 37.3 27.0 24.0 24.4Weighted by:
- Import value 22.0 13.0 14.5 14.5- Domestic production 26.0 17.1 16.6 17.0
Index of dispersion /b 61.5 107.8 90.0 84.4
/a Tariffs are inclusive of surcharges and specific duties have beenconverted to ad valorem equivalents.
lb Measured by the coefficient of dispersion.
Source: Ministry of Finance and World Bank staff estimates.
10. A number of major steps were taken during 1987 to relax and simplifythe investment and capacity licensing system. Firms are now allowed toincrease production by up to 30Z of their licensed capacity without requiringnew investment approval and to diversify production within much broaderproduct categories, thereby improving the operational flexibility of firms andpromoting greater competition. Furthermore, the requirements for investmentlicenses were streamlined and additional fields of investment opened toprivate domestic and foreign investors. The December package included aseries of measures to relax foreign investment regulations: domesticownership requirements were eased significantly; restrictions prohibitingforeign-owned companies from marketing Indonesian export goods were removed;foreign firms are now allowed to purchase domestic inputs without restriction;and rules regarding the hiring of expatriate personnel were relaxed, Thesesteps have addressed key concerns expressed by foreign investors in Indonesiaand reduce differences in treatment between foreign and domestic firms.Together with the broader regulatory measures, these changes in the investmentand capacity licensing system have significantly improved the environment forprivate investment. This is reflected in Table 1, which shows that investmentapprovals by BKPM have risen by 230Z for domestic investors and 4302 forforeign investors over the past two years.
Impact of the Reform Program
11. The two core objectives of GOI's adjustment program are:(a) restoration of financial stability; and (b) sustained recovery of growth.Progress has been good on both fronts. As regards financial stability, theprompt stabilization measures taken in response to the external shocks of 1986contained the c.irrent account deficit to around 6% cf GNP in 1986/87 andreduced it to below 32 of GNP over the past two years (see Table 4).

- 98 -
Inflation has also been held to about 92 per annum over the past two years,preserving the competitive advantage provided by the 1986 devaluation.Indonesia's debt burden remained high in 1988, with the debt service ratioover 36Z. However, a number of debt indicators (e.g., debt exports, debt/GNP)have already started to decline and all debt indicators are projected toimprove steadily over the next few years. This trend reflects the favorabledebt structure (reinforced by the availability of special assistance) and thestrong economic recovery (especially for non-oil exports). GOI remainscommitted to servicing its debts on schedule.
Table 4: IMPACT OF POLICY REFORMS(growth rates, Z p.a.)
1985 1986 1987 1988
Economic activityGDP 1.7 3.7 3.9 4.7Non-oil GDP 3.8 3.9 4.6 5.6
Fixed investment -6.0 -7.0 1.9 7.0Public 2.4 -19.6 -1.7 6.3Private -13.8 6.8 4.9 7.6
External tradeNon-oil exports 10.1 3.2 25.8 13.6Non-oil imports -13.3 -13.6 5.0 6.6
Other indicatorsDomestic inflation /a 4.7 5.8 9.5 8.5Current account/GNP (Z) -2.4 -5.9 -2.3 -2.5Debt service ratio (Z) /b 24.4 37.3 33.9 36.3
/a As measured by the urban consumer price index (adjusted)./b Debt service excludes prepayments.
Source: World Bank staff estimates.
12. The measures taken have helped to provide the basis for a sustainedrecovery of growth in three ways:
(a) In response to the real exchange rate adjustment, and accompanyingderegulation measures, non-oil exports have increased substantiallyfrom US$6.7 billion in 1986/87 to an estimated US$12.1 billion in1988/89, a real increase of 20Z per annum. Much of this growth hascome from a diversifying base of manufactured goods, with many smalland medium-sized private firms contributing substantially.

- 99 -
(b) There is also evidence of resurgence in private investment,especially in export-oriented activities. The sharp increase ininvestment approvals by BKPM is noted above. Implementation of theseapprovals is reflected in Table 4, where the growth of privateinvestment is estimated to have accelerated to 8Z in 1988. Togetherwith the severe constraint on public investment, this has led to achange in the structure of investment, with the private sector nowaccounting for about 542 (up from 492 in 1985).
(c) The recent reform measures have also had a positive effect oneconomic efficiency. As shown in Table 5, the return per unit ofinvestment had declined sharply in 1982-85, as the pace of economicgrowth began to slow and NTBs were imposed to protect inefficientdomestic industries. This trend is also reflected in the high ICORand fall in total factor productivity (TFP). However, after 1985,there has been a noticeable improvement in all three of theseefficiency indicators.
These positive developments have supported a steady increase in the growthrate of non-oil GDP from 3.8Z in 1985 to an estimated 5.6Z in 1988. With theresurgence of private investment and momentum of the export drive, there isevery expectation that this recovery will be sustained.
Table 5: MACROECONOMIC EFFICIENCY INDICATORS
1974-81 1981-85 1986-88
Rate of return on investment (Z p.a.) 31.4 13.1 21.8ICOR 2.8 7.8 5.2Total factor productivity change (Z p.a.) 0.9 -2.5 1.0
Source: World Bank staff estimates.
13. The recovery in economic growth has helped to contain the socialcosts of adjustment. GOI has also acted directly to reallocate publicspending to poverty-related programs. For example, the shares of developmentexpenditure allocated for social services and agriculture have beensignificantly increased over the past five years. An effort has also beenmade to protect regional transfers, which normally finance small-scale andlabor-intensive infrastructure projects at the local level. Even so, becauseof the overall budget constraint, the availability and quality of many basicservices has weakened. More fundamentally, because of the severe terms oftrade loss, per capita incomes are still lower than in 1981. The main burdenof adjustment has fallen on earnings, with real labor earnings in agricultureand services probably stagnating or declining during the recent adjustmentperiod. However, part of the adjustment in the labor market has occurred as

- 100 -
an increase in the rate of open unemployment in urban areas, especially amongyoung school leavers. These trends reinforce the importance of sustaining ahigher growth path over the medium term, to absorb the rapidly expanding laborforce at higher levels of productivity and income. By restoring stability andpromoting restructuring in the economy, GOI's reform program is laying a solidfoundation for achievement of this objective.
Progress on the Remaining Agenda
14. Over the past year, GOI has pushed ahead aggressively with itsprogram of adjustment. A central element continues to be maintenance ofprudent and stable macroeconomic policies. In the new budget for 1989/90,announced in January, provision is made for an increase in civil servicesalaries (by 15Z). This is appropriate under current circumstances. However,the overall fiscal stance remains cautious, with a primary surplus anddeclining net domestic expenditure. These trends reflect the strong emphasisplaced on public resource mobilization. Several important measures in thisarea have already been announced: (a) power tariffs were raised an average by25Z on April 1, 1989; (b) VAT has been extended to the wholesale level andmost services; (c) the rates and number of items subject to luxury taxes havebeen increased; and (d) the Government intends to eliminate pesticidesubsidies during the coming year.
15. A major package of new trade policy measures was announced inNovember 1988. A further 295 items have been removed from restrictive importlicenses, accounting for an additional 17Z of all items and 1OZ of importvalue previously restricted. The impact on the share of total domesticproduction protected by import licensing is much larger than previouspackages, declining from 38Z at end-1987 to 292 by end-1988.6/ This reflectsan effort to push the reform effort into the agriculture, food and beveragessectors (e.g., tobacco, rubber, fruits, palm/coconut oil, processed meat,cigarettes), which constitute a substantial share oi domestic value added.With respect to manufacturing, the November package is significant in that itremoved all license restrictions on fertilizers as well as plastics, ahitherto difficult area of reform, and made further in-roads into the steeland textile subsectors. The November package also adjusted tariffs and/orsurcharges on 191 items, including 25 items for which specific duties havebeen replaced by ad valorem duties. In addition, Indonesia moved to the newHarmonized System of coding and classifying items on January 1, 1989.
16. GOI also introduced a sweeping reform of maritime transportregulations in 1988. First, the compulsory scrapping policy for ships wassuspended in February. This was followed in November by a major deregulationof the shipping industry which: (a) reduced and simplified business licenseprocedures; (b) allowed shipping lines to determine their own route structureand schedules; and (c) allowed national lines to charter foreign flag vesselsand form new joint venture companies with foreign lines. This comprehensiveset of reforms has removed virtually all regulatory impediments to development
6/ Of th 29Z of domestic production remaining under NTBs, 16 percentagepoints relate to rice, where the Government maintains importrestrictions for food security objectives. Indonesia is an efficientproducer of rice for the domestic market.

- 101 -
of an efficient and responsive maritime transport industry. Our preliminaryjudgement is that as a result Indonesia now has a more open and unregulatedshipping industry than most other maritime nations. In response to this majorshift in the policy environment, over 40 new shipping companies have alreadybeen licensed. This resurgence of competition will have a strong positiveeffect on the quality of shipping services and transport costs.
17. Finally, GOI has moved ahead with a basic reform of the financialsector. Competition in the banking system is to be stimulated by:(a) facilitating entry of new banks; (b) easing restrictions on establishingnew branches; (c) permitting public enterprises to place up to 502 of theirdeposits with private banks; (d) allowing banks and non-bank financialinstitutions (NBFIs) to issue shares on the capital market, and NBFIs to issuecertificates of deposits (previously limited to banks); and (e) easing therequirements to become a foreign exchange bank. Measures to develop thecapital markets include: (a) a withholding tax on time deposits to redressthe discrimination against other financial assets; (b) allowing the privatesector to operate stock exchanges; (c) the establishment of an over-the-counter (OTC) market (announced in late 1987); and (d) simplified entry intoinsurance, leasing, factoring, venture capital, consumer finance andsecurities activities. Finally, steps have been taken to improve thestability of the financial system, by strengthening prudential regulations andthe instruments for monetary control.
18. These measures represent a dramatic departure from the past whenregulations facilitated the domination of state banks and prevented thedevelopment of other segments of the financial market. Implementation ofthese changes will obviously take time, but thpre are already signs that thestructure of the financial sector will be significantly altered. In thebanking sector, for example, two smaller banks have had access to BankIndonesia clearing facilities suspended--an action that usually leads toclosure.7/ Other banks are reported to be merging. By the end of February1989, new licenses had been issued for 7 new national commercial banks, 3joint ventures with foreign banks and 47 secondary banks. Several foreignbanks are actively considering opening branches. In addition, activity on theJakarta stock exchange has picked up sharply since October 1988, and the firstissue on the new OTC market was successfully completed in early 1989. Notsurprisingly, monetary conditions were initially unsettled after thederegulation measures were announced. However, the situation has now returnedto normal, with inter-bank rates around 12-15%, and no flight of privatecapital overseas.
19. In two other areas, new reforms are expected to be announced in thenear future. First, further changes are planned in the investment licensingsystem. In order to make the system more transparent, and to relax licensingrestrictions, GOI intends to transform the Investment Priority (DSP) list froma lcag and incomplete positive list to a short negative list. Second, GOI hasrecently completed a review of the financial performance of most publicenterprises, to identify potential candidates for divestment orreorganization. It is expected that a number of public enterpris9s will enter
7/ Bank Indonesia has reaffirmed that it will not provide funds to banksthat are facing structural problems and weak management.

- 102 -
into joint ventures with the private sector or issue shares to the public.This latter option was dependent upon recent measures to develop the capitalmarkets.
The Role of the World Bank
20. By any standard, GOI's efforts to restore macroeconomic stability andto accelerate the pace of structural change have been remarkably successful.The agenda for policy reform has been well developed and the Government'scredibility for making difficult but correct decisions has been clearlyestablished in the period since 1983. The World Bank has played an importantrole in these accomplishments. In particular, the Bank has maintained a veryclose policy dialogue with GOI based on the ESW program and technicalassistance from the Resident Mission. This dialogue has been coordinated withIMF and IFC initiatives. At the same time, our annual economic reports,combined with the two adjustment loans (TPAL I and II). have enabled the Bankto play a catalytic role in mobilizing substantial additional externalassistance from the Inter-Governmental Group on Indonesia (IGGI) to supportthe adjustment effort. Disbursements of special assistance totalledUS$2 billion in 1988/89, including US$300 million from TPAL II andUS$350 million of cofinancing from OECF.
21. The Bank's analytical support and policy dialogue has contributed todefining appropriate policy responses to emerging issues of macroeconomicmanagement. Since the collapse of oil prices in 1986, our macroeconomic workhas focussed on five major policy areas: (a) exchange rate management, torespond to external shocks and maintain the competitiveness of non-oilexports; (b) prudent fiscal and monetary policies, to reduce aggregate demandand control inflationary pressures; (c) public resource mobilization, throughmore effective tax administration and improved cost recovery; (d) morefocussed expenditure priorities, especially for O&M and poverty-relatedprograms; and (e) external debt management and borrowing strategy.
22. The World Bank prepared major studies on trade and industrial policyissues in 1981 and 1985. These studies helped to identify the costs of theincreasingly cumbersome regulatory environment in Indonesia, and to show thebroad directions for future policy change. With the subsequent decline in oilprices, the push for reforms within Indonesia gathered momentum. At the timeof the devaluation in 1986, the Government asked for analytical support andadvice from the Bank on how to proceed with reforms in the trade regime andregulatory environment. The related analysis provided by Bank staff will beformally presented in two studies--on enterprise regulations and on tradepolicy reform and implementation--to be completed later in 1989. At therequest of GOI, the Bank also initiated a major study of the financial sectorin 1988. The main mission visited Indonesia in July 1988 and its preliminaryfindings fed into the reforms announced later in the year. The completedreport will be the basis for a continuing dialogue on financial sectorpolicies. Technical assistance on maritime sector reforms was provided underthe National Ports Development Project (FY85) and continued by a Bank-financedconsultant within the Ministry of Communications.

- 103 -
Loan Adminttration and Coordination
23. Procurement and disbursement procedures for TPAL II were designed toensure rapid drawdown of loan proceeds. The loan was used to reimburse 1002of foreign expenditures for eligible imports by the public or private sectorfor which payments were made after the date of loan signing. There was noretroactive financing under the loan. The loan specified a standard list ofineligible imports, i.e., goods intended for military and paramilitarypurposes, or for luxury consumption; goods financed from other officialmultilateral or bilateral sources; uranium; and goods procured under contractsof less than US$100,000. Bank Indonesia was responsible for maintaining andadministering the loan account. All purchases in the amount of US$5 millionequivalent or more were to be procured through International CompetitiveBidding (ICB) in accordance with Bank guidelines. Procurement by the privateor public sector of goods contracted at a price less than US$5 millionequivalent were handled on the basis of normal commercial practice orfollowing normal Government procurement procedures acceptable to the Bank.Disbursements of eligible import expenditures would be based on Statements ofExpenditures (SOEs) for imports valued at less than US$5 million; for importsabove this amount full documentation would be required. Since all contractssubmitted to the Bank by the Borrower were below US$5.0 million, no ICB wasinvolved in procurement, and the loan was disbursed on the basis of SOEprocedures.
24. Disbursement for reimbursement of eligible import expenditures wasbased on documentation prepared by Societe Generale de Surveillance S.A. (SGS)in the course of their customs inspection services. SGS is one of the firmsqualified by the Bank to provide trade verification services in Bankoperations. In the case of Indonesia, SGS certification provides particularlystrong assurance under the system established by INPRES 4/1985. The SGScertificate provides verification of the goods being imported including thequality and quantity of imports and the applicable prevailing C&F exportmarket price in the country of supply. The SGS certificate is also requiredfor the release of the goods at the port of entry. The SGS certificate,therefore, provides all the information needed to ensure compliance witheligibility requirements for purposes of the Bank loan.
25. Disbursements under TPAL II were completed by November 1988. Thebulk of disbursements occurred in August (402) and October (482). As shown inTable 6, the loan has been largely used to finance private sector imports ofindustrial raw materials. The counterpart funds generated by imports financedunder TPAL II were credited to a sDecial account in Bank Indonesia and wereused to finance priority public expenditure programs associated with GOI's1988/89 budget.
26. There was good coordination with the IMF on the TPAL II program.This took the form of informal exchanges and consultations during loanpreparation. IMF staff reviewed the reports associated with TPAL II and fullysupported the loan. The latest IMF Consultation Report was issued on April 6,1989. GOI has not had any standby or extended arrangements with the IMF since1973. GOI's last purchase from the IMF was for SDR 463 million in May 1987

- 104 -
under the Compensatory Financing Facility (CFF). This purchase representedIndonesia's total outstanding IMF obligations at the end of 1988. After the lastConsultation Report (in 1988), the IMF Executive Board expressed its satisfactionthat 'Indonesia maintains an exchange system which is free of restrictions onpayments and transfers for current international transactions.' Effective Hay 7,1988. the Government of Indonesia has accepted Article VIII status.
Table 6: IMPORTS FINANCED BY TPAL II(US$ million)
SourceOther Other
Product groups USA Europe Japan Asia/a countries Total
Industrial raw materials 22.9 17.6 37.0 60.7 42.1 180.3Agricultural inputs & equipment 1.4 0.6 0.2 1.5 0.1 3.8Construction materials & equipment 3.3 0.1 5.5 0.5 0.7 10.1Mechanical machinery & equipment 0.6 2.1 3.3 7.0 0.2 13.2Electrical machinery & equipment 0.8 1.0 1.4 1.0 0.8 5.0Transport machinery & equipment 0.5 0.4 32.7 0.6 8.2 42.4Miscellaneous 4.1 7.3 8.0 17.1 8.7 45.2
Total 33.6 29.1 88.1 88.4 60.8 300.0
/a Includes goods transhipped through Hong Kong and Singapore.
Source: Bank Indonesia.

BORR( COMER T
ATTArcmfr
The Wurlj bank
r ig 71 .. ti6 ." 0 .5 - "
l;n. - --- n~o - - "l g - . Ul, .lic
Crm:itnt uit.n the d'.a..caja oc h T LMP5 an 1 , GC't.st. y ¶ a A - i $d. ku n
fl. n .. .- ; v'afre .'. '..
Pste x.-: rara, 32"TA 1ha te.- -M v "
F'age .9 j.uca ö.I35:"h (,.r.t. r .rna~> that kL 'it dn'.ias aC n:Lhe± pQl...cous t.h.xt it a.nd thei 2a.d k.a'se agrewd on, e~n amplII.i.tJ.
w4 -
:7-


![NPIK [ NOMOR POKOK IMPORTIR KHUSUS ] :](https://img.dokumen.tips/doc/110x75/55aabfee1a28ab43568b468b/npik-nomor-pokok-importir-khusus-.jpg)


![IT [ IMPORTIR TERTENTU ] :](https://img.dokumen.tips/doc/110x75/58ed62721a28ab2d388b45a1/it-importir-tertentu--5906b943d4c30.jpg)


