Embed Size (px)
Citation preview

Document of The World Bank
FOR OFFICIAL USE ONLY
Report No: 27180-IN
PROJECT APPRAISAL DOCUMENT
O N A
PROPOSED LOAN
IN THE AMOUNT OF US$39.5 MILL ION
TO THE
REPUBLIC OF INDIA
FOR THE
KARNATAKA URBAN WATER SECTOR IMPROVEMENT PROJECT
March 12, 2004
Energy & Infrastructure Sector Unit South Asia Regional Office
T h i s document has a restricted distribution and may be used by recipients only in the performance o f their official duties. I t s contents mav not otherwise be disclosed without World Bank authorization.
Pub
lic D
iscl
osur
e A
utho
rized
Pub
lic D
iscl
osur
e A
utho
rized
Pub
lic D
iscl
osur
e A
utho
rized
Pub
lic D
iscl
osur
e A
utho
rized
Pub
lic D
iscl
osur
e A
utho
rized
Pub
lic D
iscl
osur
e A
utho
rized
Pub
lic D
iscl
osur
e A
utho
rized
Pub
lic D
iscl
osur
e A
utho
rized

CURRENCY EQUIVALENTS
(Exchange Rate Effective March 09, 2004)
Currency Unit = Indian Rupees (Rs.) INR1 = US$0.022 US$1 = INR45.24
F ISCAL YEAR April 1 -- March 31
ABBREVIATIONS AND ACRONYMS
A C A Additional Central Assistance ADB Asian Development Bank APL Adjustable Program Lending CAS Country Assistance Strategy CEEPHO DEA Department o f Economic Affairs DffD Department for International Development DMA Department o f Municipal Administration ECOP Environmental Codes o f Practice EMP Environmental Management Plan FMR Financial Management Reports G O Government Order GO1 Govemment o f India G o K Government o f Kamataka IRR Internal Rate o f Return KPTCL Kamataka Power Transmission Corporation L imi ted
Central Public Health and Environmental Engineering Organization
KUIDFC KSUWSC K U W S D B LEA M&E NGO NPV NRW oc O&M P M U PPP PSP SEMF SHP swc TA UDD
Kamataka Urban Infrastructure Development & Finance Corporation Kamataka State Urban Water Supply Council Kamataka Urban Water Supply and Drainage Board L imi ted Environmental Assessment Monitor ing & Evaluation N o n Governmental Organization Net Present Value N o n Revenue Water Operator Consultant Operation and Maintenance Project Management Unit Public Private Partnership Private Sector Participation Social and Environmental Management Framework Sanitation and Hygiene Promotion State Water Council Technical Assistance Urban Development Department

FOR OFFICIAL USE ONLY
UGD ULB U S AID U W S WASIS WSS W&S WSP-SA
Underground Drainage Urban Local Bodies Uni ted States Agency for International Development Urban Water Sector Water and Sanitation Information System Water Supply and Sanitation Water and Sanitation Water and Sanitation Program - South Asia
Vice President: Praful C. Pate1 Country ManagedDirector: Michael F. Carter
Sector ManagerDirector: Sonia Hammam Task Team Leader/Task Manager: Oscar E. Alvarado/Christophe Bosch
This document has a restricted distribution and may be used by recipients only in the performance of their official duties. I t s contents may not be otherwise disclosed without W o r l d Bank authorization.


INDIA KARNATAKA URBAN WATER SECTOR IMPROVEMENT PROJECT
CONTENTS
A. Project Development Objective
1. Project development objective 2. K e y performance indicators
B. Strategic Context
1. Sector-related Country Assistance Strategy (CAS) goal supported by the project 2. M a i n sector issues and Government strategy 3. Sector issues to be addressed by the project and strategic choices
C. Project Description Summary
1. Project components 2. K e y pol icy and institutional reforms supported by the project 3. Benefits and target population 4. Institutional and implementation arrangements
D. Project Rationale
1. Project alternatives considered and reasons for rejection 2. Ma jo r related projects financed by the Bank and/or other development agencies 3. Lessons learned and reflected in the project design 4. Indications o f borrower commitment and ownership 5. Value added o f Bank support in this project
E. Summary Project Analysis
1. Economic 2. Financial 3. Technical 4. Institutional 5. Environmental 6. Social 7. Safeguard Policies
F. Sustainability and Risks
Page
3 3
4 4 6
6 9 9
10
10 11 12 13 13
13 15 17 18 20 22 25
1. Sustainability 2. Critical r isks
26 26

3. Possible controversial aspects 27
G. Main Conditions
1. Effectiveness Condition 2. Other
H. Readiness for Implementation
I. Compliance with Bank Policies
Annexes
Annex 1: Project Design Summary Annex 2: Detailed Project Description Annex 3: Estimated Project Costs Annex 4: Cost Benefit Analysis Summary Annex 5: Financial Summary for Revenue-Earning Project Entities, or Financial Summary Annex 6: (A) Procurement Arrangements
(B) Financial Management and Disbursement Arrangements Annex 7: Project Processing Schedule Annex 8: Documents in the Project F i le Annex 9: Statement o f Loans and Credits Annex 10: Country at a Glance Annex 1 1 : Photographs o f existing Water and Drainage Services in Participating Cities Annex 12: Summary o f Environmental Assessments Annex 13: Urban Water and Sanitation Sector Policy in Karnataka
27 28
28
29
30 34 45 46 52 65 74 83 84 85 89 91 92
103
MWS) IBRD 32942: Karnataka - Location o f Three Participating Urban Local Bodies.

INDIA Kamataka Urban Water Sector Improvement Project
Project Appraisal Document South Asia Regional Office
SASE1
[BRD rotal:
late: March 12,2004 Sector ManagerDirector: Sonia Hammam Zountry ManagedDirector: Michael F. Carter 'roject ID: PO82510 Lending Instrument: Specific Investment Loan (SIL)
Team Leader: Oscar E. Alvarado Sector(s): Water supply (95%), Sub-national government administration (5%) Theme(s): Other urban development (P), Access to urban ~ r v i c e S for the Poor (PI, Pollution management and environmental health (S), Decentralization (S), Administrative and civ i l service reform (S)
[XI Loan [ ] Credit [ ]Grant [ ]Guarantee [ ]Other:
For LoanslCreditslOthers: Loan Currency: United States Dollar Amount (US$m): $39.5 Borrower Rationale for Choice of Loan Terms Available on File: Yes Proposed Terms (IBRD): Variable-Spread Loan (VSL) Grace period (years): 5 Commitment fee: 0.75%
Years to maturity: 20 Front end fee (FEF) on Bank loan: 1.00% Pavment for FEF: Catitalize from Loan Proceeds
35.41 4.09 39.50 47.44 4.09 5 1.53

1 Exdected effectiveness date: 0513 112004 Expected closina date: 1213 112008 I
- 2 -

A. Project Development Objective
1. Project development objective: (see Annex 1)
T h e Vision: The long-term vision for the urban water sector (UWS) in the State o f Kamataka i s to tum i ts performance into high quality and sustainable services in al l i t s urban local bodies (ULBs). The strategy to achieve th is vision i s to carryout a phased program, including incremental steps towards full service coverage and high-quality service provision in an efficient and fmancially sustainable fashion.
In the medium-term, the strategy envisages achieving water supply and sanitation (WSS) service provision models that would be provided by autonomous, customer responsive, and commercially-oriented utilities, including effective public-private partnerships (PPP). In the short term, a state level sector policy reform would be implemented and at the local level, demonstration cities would be selected to participate in testing such initial reforms.
Project Development Objective: The main objectives o f the proposed project are to: (a) launch Government o f Karnataka (GoK)'s UWS reform process based on the "Urban Drinking Water and Sanitation Policy Statement of GoK" (approved by the cabinet o f GoK in M a y 2003); and (b) improve U W S services in the participating ULBs (Hubli-Dhanvad, Belgaum, and Gulbarga) and demonstrate that sustainable, efficient, and commercially-oriented service provision can be achieved. The detailed objectives o f each project component are described in section C.
2. Key performance indicators: (see Annex 1)
Component A. The progress in GoK's sector reform process will be measured through the following: At the State Level: 0 Establishment and operationalization o f the Kamataka State Urban Water Supply Council
(KSUWSC). 0 Implementation o f capacity strengthening activities to support the ULB level reform. 0 Development o f the State Water and Sanitation Information System (WASIS). 0 Establishment o f urban WSS sector investments and tariff frameworks. 0 Establishment o f legal and regulatory framework. 0 Preparation o f WSS legislation. At the ULB Level: 0 0
0
Completion o f city-wide engineering feasibility studies. Implementation o f transition plans, including ringfencing o f WSS accounts and improvements in billing and collection system. Definition o f the scope and scale o f follow-on Private Sector Participation (PSP) and scaling-up in other ULBs.
Component B. Improvement in services will be measured against the following: For each ULB: 0 Improved overall water supply availability and quality resulting from priority investments for
bulk water supplies and distribution network improvements.
- 3 -

0
For each demonstration zone: 0
Implementation o f the social awareness and communication strategy.
Volumetric tariff adopted according to agreed principles in order to recover no less than 50 percent o f Operation and Maintenance (O&M) costs at init ial stage and no less than 80 percent by the end o f the Project. Weighed average o f 75 percent or higher achieved for the following eight indicators: 0
(1) continuous (aiming at 24-hour, 7 days per week al l year) supply to the zone - emergency stoppages not to exceed 12 hours and no more than one emergency stoppage per 3 months (20 percent weight);
(2) water quality as per norms and monitored through testinghampling (5 percent weight); (3) supply to the zone to be metered both in respect to f low and pressure and continuous records
(4) physical losses within the Demonstration Zone not to exceed 10 l i ters per connection per hour maintained (5 percent weight);
based on average pressure within the Demonstration Zone o f 10 meters, adjusted proportionately in respect to the actual average zone pressure (10 percent weight);
receiving the lowest pressure in the period 6 a.m. to 10 p.m.) (10 percent weight);
street storage tanks, adoption o f volumetric tariff structure (20 percent weight);
(5) minimum pressure 6 meters (i.e. measured at the customer meter o f the property connection
(6) 100 percent metering o f property connections (individual and shared), standpipes and feeds to
(7) billing/collection rate to exceed 70 percent (10 percent weight); and (8) high level o f customer satisfaction (70 percent) measured by polls (20 percent weight).
B. Strategic Context 1. Sector-related Country Assistance Strategy (CAS) goal supported by the project: (see Annex 1) Document number: : 25057-IN Date of latest CAS discussion: December 5, 2002
The proposed project i s consistent with the Bank Group Country Assistance Strategy (CAS) for India, discussed by the Executive Directors on December 5,2002. The CAS l is ts support for PSP in the UWS as a program priority and recognizes that provision o f adequate infrastructure would be critical in promoting private sector growth. The project i s also consistent with India's Tenth Five Year Plan, which recognizes that infrastructure bottlenecks have become a major constraint on growth and, therefore, poverty alleviation. The Bank's plan to support the reform-minded states through programmatic interventions i s also consistent with the project approach which envisages a long-term involvement in the U W S in the state o f Karnataka.
Sustainable access to WSS services i s a high priority that i s now well-recognized in the international development agenda. Access to safe water has been declared as a basic human right by the United Nations and i s widely recognized to directly contribute to poverty alleviation, the main focus o f the CAS. The project would also contribute to achieving the Millennium Development Goals, which emphasizes safe and sustainable drinking water and sanitation as well as their important health impacts.
2. Main sector issues and Government strategy:
Key pervasive issues that affect the UWS in Karnataka are discussed below:
- 4 -

Gaps in Sector Performance: The sector suffers from some chronic inefficiencies, including unreliable service quality, and limited coverage. At the technical level, problems include sub-optimal resource allocation, mismatched capacity investments, and poor (O&M) practices. These are compounded by uneconomic tariff structure/levels, poor collection efficiency, and high levels o f leakage and non-revenue water. While sector information systems are deficient, service coverage with authorized connections in all three participating ULBs i s estimated to be less than 50 percent. In addition, the state experienced severe drought conditions during the summer o f 2002.
Inadequate Institutional Framework: Urban WSS provision in the state o f Karnataka i s the responsibility o f the ULBs, except for Bangalore, which has a water utility. However, the functions for WSS services, e.g. O&M, sewerage services, billing and collection o f the tariffs, and capital development works etc. are fragmented among different departments within the ULBs and outside agencies l ike KUWSDB (Kamataka Urban Water Supply and Drainage Board) with little coordination. This set-up does not fully address the issues for efficient service management or proper asset maintenance.
Limited Capacity and Financial Sustainability at the ULB level: Since WSS operation and accounts are not separated from other municipal services and there i s l imited capacity to track costs and capital expenditures accurately at the ULB level, the magnitude o f deficits incurred by the water sector i s difficult to assess. However, studies indicate that al l ULBs show operating losses, and normally the tariffs only cover one-third or less o f O&M costs. The increasing deficits encountered by the ULBs are covered by general revenues. Lack o f funds also leads to deficient services (maintenance neglect, only a few hours per week o f service). The amount and sources o f these subsidies, which presumably come from the statehational level, have not been estimated but are likely to be significant.
Weak Enabling Environment for PSP: Several factors inhibit PSP in the sector: low tariffs that lead to poor cost recovery; lack o f a credible regulatory framework; and lack o f a legal framework permissive to PSP. A more conducive environment requires policy and legal changes in the institutional, regulatory, and legal frameworks.
Government Strategy -- Karnataka's Fiscal Reform Program and Sectoral Reforms: GoK has begun a wide-ranging reform program, combining fiscal, govemance and sectoral reforms, which have been supported by the Bank through the Second Karnataka Economic Restructuring Loadcredi t during 2001/2002. Several elements o f this reform program support the proposed urban water sector reforms. GoK recently released a comprehensive state water policy, which envisions adopting a river basin approach for al l future water resource management in the state, restructuring government functions for more effective management, and revising water tar i f fs to meet O&M needs. GoK has already embarked on th is process through creating the "Urban Drinking Water and Sanitation Policy Statement" that covers the key reform elements for the sector (Annex 13) and through preparing a strategy and action plan for the implementation o f this policy statement. In addition, G o K has announced plans to increase PPPs in the sector and in December 2001, increased water tariffs in Bangalore by 50 percent, the f i rst such increase in five
- 5 -

years. These developments are good indications o f GoK's commitment to carry out sector reform and to reduce the fiscal burden that the sector imposes on state finances.
3. Sector issues to be addressed by the project and strategic choices:
The proposed project would: 0
0
0
support GoK's overall U W S reform process, which envisages the creation o f sound institutional and regulatory frameworks and an enabling environment for PSP; improve U W S service quality in the three participating ULBs; develop reliable mechanisms to measure sector performance in terms o f quantity and continuity o f service delivery, efficiency improvements, tariff levels, cost recovery, as well as progress made in reform; and facilitate capacity building and financial management at both the state and local level. 0
C. Project Description Summary 1. Project components (see Annex 2 for a detailed description and Annex 3 for a detailed cost breakdown):
The project comprises three components: (A) Sector Development and Technical Assistance; (B) Physical Investments in three ULBs to improve their water supply services and demonstrate the feasibility o f continuous safe water supply in pilot areas; and (C) Project Implementation Support.
A. Sector Development and Technical Assistance Al. Policy Implementation and State Level Institutional Strengthening A2. Strengthening o f Service Delivery and Preparation of follow-on Project in three Participating ULBs B. Physical Investments B 1. Priority Investments B2. Works in City Distribution Networks in all three ULBs B3. Demonstration Projects
0.89
1.66
27.63 5.77
13.79 1.39
0.0 1.7 0.80
3.2 1.50
0.0 53.6 19.53 11.2 4.62 26.8 11.61
2.7 1.04 C. Project Implementation Support Total Project Costs 5 1.13 99.2 39.10 99.0
Front-end fee 0.40 0.8 0.40 1 .o Total Financing Required 5 1.53 100.0 39.50 100.0
0.0 2.0
3.8
0.0 49.4 11.7 29.4 2.6
Component A. Sector Development and Technical Assistance The objectives o f this component are to: (i) assist GoK in finalizing i t s policy reform agenda and to carry out initial implementation steps o f staged sector reforms; and to (ii) prepare business model and PSP process for service provision in the three participating ULB and other cities in Karnataka.
Al. Policy Implementation and State Level Institutional Strengthening (US%0.89 million) The following activities will be carried out to initiate the implementation o f the "Urban Drinking Water and Sanitation Policy Statement of GoK".
- 6 -

a Establishment and operationalization of KSUWSC: The Kamataka State Urban Water and Sanitation Council (KSUWSC) i s envisaged to be established by the end o f 2004, to oversee and be responsible for policy definition and implementation, planning and programming, technical assistance, development o f sector information system, norms, and certain regulatory functions for the UWS in Karnataka. Urban Development Department (UDD) o f GoK wil l manage the sector reform component through i t s policy/technical cell housed within KUIDFC until the KSUWSC i s operational.
b Strengthening of Service Delivery in ULBs: The following capacity strengthening activities will be carried out to support the ULB level reform in the state: (i) institutional options for service provision; (ii) technical assistance strategy and action plan to enable UWS reform at the ULB level; (iii) revenue collection action plan; and (iv) public awareness and communication strategy.
c Development of the WASIS: This activity would assist GoK in designing a sector Management Information System (MIS) and in supporting the actual setuphnitial implementation phase, and consist of: (i) task A: development o f an information system, collection o f data from al l ULBs, training o f the primary users, and development o f formats for periodic information updates; and (ii) task B: benchmarking o f the service provision levels.
d Water and Sanitation Sector Investment and Tariff Frameworks: This activity would assist GoK in better managing its UWS finances, and consists of: (i) task A: study to establish an integrated state UWS sector financial policy, which would look at several financial scenarios and sources o f funds to help comply with the state sector goals; and (ii) task B : study to develop a framework for WSS pricing through tariffs, which would examine the WSS pricing policies, taking into account the regulatory, financial, and social aspects o f service delivery.
e Review and establishment of legal and regulatory framework: This activity would assist GoK in designing the regulation strategy, legal basis and action plan, and starting up o f essential but basic regulatory functions, including pricing, service accounting and benchmarking.
f for the sector, recommend necessary changes to the existing legislation, and prepare the corresponding legislative (or in some cases executive) proposal.
Preparation of UWS Legislation: This study would assess the current legal framework
A2. Strengthening of service delivery and preparation of follow-on project in the three participating ULBs (US$ 1.66 million)
a City-wide Engineering Feasibility Studies: This would include a short-term service improvement plan, network mapping and modeling, master plans for longer term rehabilitatiodexpansion, and environmental and social assessment. Sanitation strategies and business plans would also be developed, including analysis o f fmancial feasibility and strategic plan, and proposals for the selection o f alternative institutional modalities and PPP options for each city;
- 7 -

b Transition plans: This study would help assure a smooth transition from the Operator Consultant (OC) to the subsequent operator, and include ringfencing o f WSS accounts, improvements in billing and collection system for WSS tariffs, and designing o f new roles and functions at the ULB levels;
C
communication strategy, and other financial, legal environmental, and social studies. Other studies related to the PPP preparation: This includes asset evaluation,
d Strategy to scale up thisproject to other cities in Karnataka: This would include engineering feasibility studies, development o f business plans, and other studies required to define institutional modalities for service delivery in about four or five medium-sized cities in Karnataka.
Component B. Physical Investments The objectives o f this component are to: (i) improve the service provision and attain continuous service in selected demonstration zones <f the three participating ULBs; (ii) generate credibility in the overall program and learn lessons on the challenges faced in the demonstration zones for scaling up continuous service provision in the entire ULBs; and (iii) simultaneously improve the efficiency o f bulk supply operations and distribution networks and attain init ial improvements in water service provision to al l the residents o f the ULBs.
B1. Priority Investments (US$ 27.63 million): Priority Investments are planned to increase the bulk supply to the ULBs, and the basic works include reducing leakage from transmission mains by rehabilitationheplacement o f pipes, augmenting and extending the transmission mains, feeder mains to the reservoirs, replacing pumps and provision o f bulk f low meters at critical points on transmission system. This subcomponent also includes technical audits and third party inspection for the priority investments, and a R&R Impact evaluation study.
B2. Works in City Distribution Networks in all three ULBs (US$5.78 million): This subcomponent would provide short term improvements to majority o f the most water-stressed users in each ULB. In particular, the hours o f supply per week will be increased for al l or a significant part o f the city population. This way, there will be no impediments to the provision o f continuous water supply to the demonstration zones as the general conditions in the rest o f the city will also be improved and social acceptance o f the demonstration projects wil l be gained.
B3. Demonstration Projects (US$ 13.79 million): This subcomponent envisages to demonstrate that 24-hour continuous supply i s achievable and to show the benefits -- health, technical, operational and commercial -- it brings. The four demonstration projects (two demo areas are in Hubli-Dhanvad) wil l focus on parts o f the city distribution system and include works to enable the area to be isolated from rest o f the system and fed from a single point; system component upgrades to permit continuous, pressurized supply; identification o f supply and underground drainage “bottlenecks” and ad hoc low-cost system improvements. An Operator Consultant (OC) will be hired to for about three years to finalize the works, design the works, prepare the bidding documents, procure contractors, sign contracts wi th the contractors, and supervise the contractors’ work. This subcomponent supports the fees and any bonuses to be paid to the OC based on their performance, the supervision o f the OC contract, and technical audits. This
- 8 -

subcomponent will also facilitate: (i) awareness creation and communication between and across stakeholders within and outside the demo zone; (ii) formation o f local level forums for stakeholder interactions; (iii) customer education on proper use o f 24/7 supply systems and healthhygiene behavior, and (iv) participatory monitoring o f outcomes in the demo zones.
Component C. Project Implementation (US$1.39 million) This subcomponent will finance the project's incremental operational costs and studies related to project management and implementation, including; (i) incremental, short term consultants for KUIDFC for the duration o f the project; (ii) preparation and establishment o f a monitoring and evaluation system; (iii) costs related to the financial management systems within KUIDFC; (iv) training for staff o f the Project Management Unit o f KUIDFC; and (v) incremental operating cost at KUIDFC, including supervision costs.
2. Key policy and institutional reforms supported by the project:
As described above in project description, the KSUWSC will be established to articulate all policy and institutional elements required to promote UWS reform at the State and ULB level. The KSUWSC would be responsible for sector planning, funds allocation, initial regulatory functions, and technical assistance/training to ULBs. In addition, the existing legal and regulatory framework will be reviewed and UWS legislation be prepared. Wi th regards to sector financing, an integrated WSS sector financial policy will be established and a fi-amework for WSS tariffs will be developed.
The project would also support ULB level reform through exploring institutional options for service delivery, developing action plans to improve revenue and collection performance, and implementing the public awareness and communication strategy.
3. Benefits and target population:
The target beneficiaries o f the sector development and technical assistance component would be the general urban population in Kamataka, totaling approximately 16.8 mil l ion (approximately 33 percent o f the state population o f 53 million). The general physical investment component would benefit al l water consumers in the three participating ULBs, totaling 1.8 mil l ion as o f 2001 (940,000 in Hubli-Dhanvad, 425,000 in Belgaum, and 430,000 in Gulbarga). The demonstration project would target the people in the demonstration zones, which correspond to 7 - 14 percent o f the population in each city, totaling about 230,000.
Immediate benefits outside the three participating ULBs will be mostly related to better fund allocation for investment and some improvement in U W S service performance. In the long term, it i s envisaged that the reform measures taken under this project would be the driving force for the ULBs in Kamataka to become the real catalyst to turn around the current situation o f generalized poor performance into sustainable high quality services for all.
The major benefits in the three ULBs would include; increased hours (currently one to two hours supply every two days in Belgaum and Gulbarga, and one to two hours supply every three to five days in Hubli-Dhanvad) and more equitable water supply; higher water pressure which would make the current practice o f pumping directly from the mains unnecessary; and customer
- 9 -

satisfaction which provides incentives for the ULBs to provide sustainable service. These benefits would lead to broader access to sanitation facilities; higher standards o f cleanliness, and reduced pollution. Broader access to adequate water supply on a reliable basis would also benefit industrial consumption thus support economic development. The investments in the three ULBs would have a demonstration effect and serve as a stepping stone to scaling up reform. A successful implementation o f the project would open the door to widespread and quicker sector reform in Kamataka, and quite probably in other Indian states. See also cost benefits analysis in Annex 4.
4. Institutional and implementation arrangements:
KUIDFC will be the implementation agency for this project. Other important participants include: (i) GoK, which has constituted a State-level Committee for overall steering o f the project throughout i t s cycle; (ii) GoK’s UDD which will drive and manage the sector reform component (AI) through i t s policy/technical cell housed within KUIDFC until the proposed KSUWSC i s operational; (iii) KUWSDB, which will act as an agent o f KUIDFC for the design, technical aspects o f procurement, and constructiodsupervision o f the priority investments (component B 1); and (iv) the ULBs which, as main beneficiaries, will follow-up, participate, and facilitate implementation o f components A2, B I, B2, and B3.
To carry out i t s responsibilities, KUIDFC has established a Project Management Unit (PMU) which will provide for project technical and financial follow-up, coordinatelcarry out al l project procurement, prepare reports, coordinate al l financial management tasks including audits, and in general become KUIDFC interlocutor with the ULBs, other participants in project execution, and the Bank. See detailed implementation arrangements for each component in Annex 2 table.
To assure clear responsibilities and ru les o f the game, “Guidelines for Project Implementation” will be issued by GoK in the form o f a Government Order (GO), specifying the roles and responsibilities o f all project participants. This GO will be back-to-back with the OC’s contract with KUIDFC, KUWSDB and the ULBs. The GO i s a condition for project effectiveness, and detailed in section G. 1.
D. Project Rationale 1. Project alternatives considered and reasons for rejection:
The current project concept has evolved from previous proposed approaches to UWS reform and developments in Karnataka. The main alternatives considered are described below.
Combination of Urban Management and WSS: The original project concept envisaged covering both urban management and WSS under one project. Ths approach was too complex and created confusion for GoK on the nature o f policy and institutional reforms required in the sector, which requires separate dynamics. Therefore, the scope was revised to separate the two sectors and to develop two stand-alone projects.
Management Contract for I 3 ULBs: The stand-alone water project was init ially developed to introduce PSP through a management contract for 13 ULBs selected by the GoK. Since most o f
- 1 0 -

the ULBs are scattered over more than two-thirds o f Kamataka, clustering water operations to attract private operators was proposed, However, the feasibility o f such a complex institutional arrangement was questioned and the scope was later narrowed to fewer ULBs and a step-wise PSP approach.
Sector Issue
Adjustable Program Loan (APL): Reviewing the nature o f reforms to be undertaken and given the timeframe required for such reforms to take place, an APL was proposed to be used. However, because the GoK i s at an early stage o f developing an agreed action p lan to implement reform in the sector, the definit ion o f milestones and triggers for subsequent loans was problematic, and thus th is approach was rejected.
Project
Stand-alone Investment and Technical Assistance: Finally, it was decided that the f i rst phase project will be supported through a specific investment loan that wou ld finance urgent investments and technical support to GoK and the participating ULBs. Progress will be reviewed and evaluated during the implementation o f this f i rst phase project. Additional analysis will be undertaken, as necessary, before the subsequent phase projects are initiated. A three-phase program over 8-10 years i s envisaged.
2. Major related projects financed by the Bank and/or other development agencies (completed, ongoing and planned).
Bank-financed Improvement o f state urban governance/decentralization and soundness o f municipal finance and accountability Provision o f water supply, sanitation and flood protection
Provision o f water supply and sanitation services
Improvement o f Urban Management Capacity and Support Basic Urban Service Investment
Provision o f water supply and sanitation system
Promotion o f Private Infrastructure Investment
Provision o f water supply and waste
Karnataka Urban Sector Reform Project (under preparation)
Andhra Pradesh Urban Reform & Municipal Services Project (under preparation) Delhi Water Supply and Sanitation Project (under preparation) Tamil Nadu Urban Development Project I (Cr. 18234" completed September 30, 1997) Hyderabad Water Supply and Sanitation Project (Cr. 2115-WLn. 3181-IN, completed March 31, 1998) Private Infrastructure Finance (IL&FS) Project Ln. 3992-IN completed June 30,2003 Andhra Pradesh District
Latest Supervision (PSR) Ratings
(Bank-finance Implementation
Progress (IP)
wojects only)
Objectiie (DO)
S
S
S
S
- 11 -

disposal systems
Provision of sewerage disposal services
Provision of water supply and sewerage
Improvement o f Urban Management Capacity and Support Basic Urban Service Investment Other development agencies Asian Development Bank
USAID
iP/DO Ratings: HS (Highly Satisfactory), S (Highly Unsatis
Poverty Initiatives Project (Ln. 33324" ongoing) Bombay Sewage Disposal Project (Cr.27563lLn. 3923-IN, completed December 3 1,2003) Madras Water Supply Project I1 (Ln.39074"Ln. 39076-IN, ongoing) Tamil Nadu Urban Development Project I1 (Ln. 44784" ongoing)
Karnataka Urban Development Project (ongoing) Karnataka Urban Development and Coastal Environment Management Project (ongoing) Rajasthan Urban Infrastructure Development Project (ongoing) Financial Institutions Reform and Expansion Project (FIRE I) (completed) FIRE I1 (ongoing)
(Satisfactory), U (Unsatisfactory), I- ICtOry)
3. Lessons learned and reflected in the project design:
The Bank has supported few urban water supply projects in the past 10 years, all o f them in big cities, and since 1996 there have been no new projects in the sector. Past Bank supported projects in India's UWS have proven to have sustainability problems largely due to: (i) lack o f a long-term vision and o f a step-wise approach considered to tackle the complex sector; (ii) uneven improvements in the sector policy and institutional reform aspects o f the project; (iii) lack o f adequate beneficiary involvement in the project cycle; and (iv) predisposition o f UWS institutions towards construction rather than creation o f an enabling environment for improved service delivery. In addition to the lessons learned from previous Bank projects, key elements from the economic and sector work during the fiscal years 2001 through 2003, including the Bank's urban water strategy, capacity building and learning initiative, and the Bank's rules o f engagement, have been incorporated in the project design. Given the project's emphasis on future private sector involvement , lessons learned from an Operations Evaluation Department review, "An evaluation o f private sector participation in water supply and sanitation under projects assisted by the Wor ld Bank" have also been incorporated in the project design. Based on these lessons, the key principles o f project design agreed wi th the client include:
(i) Implementation strategy and action plan for the "Urban Drinking rater and Sanitation Policy Statement of GoK" will be carried out with a long term vision and step wise approach; Municipal-level reform, including ring-fencing o f WSS operations and adoption o f a (ii)
- 12-

computerized billing and collection system, will be implemented to ensure that sufficient capacity i s built at the local level to manage WSS operations in preparing for future PSP; The project will start with a small-scale demonstration project to ensure that up-front reforms are undertaken before major expansion and management transformation take place; and A communication strategy will be developed and the local-level planning processes would be participatory and include full consultation with the municipal managers, community and other stakeholders to ensure their ownership and commitment to the project.
(iii)
(iv)
The project wil l take into account and draw lessons from reforms o f the state-level UWS carried out in other federal countries such as Mexico and Brazil.
4. Indications of borrower commitment and ownership:
GoK's commitment to reform i s high, as evidenced by actions already taken. Despite the delays experienced in considering earlier concepts o f the project, GoK has remained keen on working with the Bank based on the new concept. GoK has also made PSP in the urban water sector as one o f i t s priorities and it i s fully aware that a significant amount o f upstream work i s necessary for successful PSP schemes. Demonstrated interest and commitment to reform include issuance o f the "Urban Drinking Water and Sanitation Policy Statement of GoK" and preparation o f a strategy and action plan for implementation. Commitment and ownership o f the participating ULBs appears to be high, as demonstrated by the active participation o f al l Mayors, Municipal Commissioners, and senior engineers from al l the ULBs throughout project preparation.
5. Value added of Bank support in this project:
Since the Bank has a long history o f involvement in India's water sector, the lessons learned will be put to good use in the proposed project. In addition, the Bank can make available to the state i t s considerable knowledge on international experience and best practices in the sector.
GO1 has requested the Bank to assist in a few select states in operationalizing sector reforms mandated under the 74th Constitutional Amendment. I t believes the Bank will provide a strong demonstration effect nationwide. Furthermore, given the long-term nature o f implementing institutional reform statewide and the sizeable investments required to meet the needs in this sector, the Bank i s uniquely positioned to support both the reform process and the potential future investments associated wi th it.
Other agencies active in the sector include the United States Agency for International Development (USAID), the Asian Development Bank (ADB), and the Department for International Development (Dff D). Lessons leamed from the institutional framework adopted by ADB will be incorporated into the project.
E. Summary Project Analysis (Detailed assessments are in the project file, see Annex 8)
1. Economic (see Annex 4):
- 13-

Cost benefit 0 Cost effectiveness 0 Other (specify) An economic analysis has been carried out to determine the project's economic viability. A cost-benefit framework has been applied on the project as a whole and on the main sub-projects individually. 'with' and 'without the project' scenarios have been defined to identify the project's incremental costs and benefits. Cost effectiveness criteria has also been applied to all major sub-components as part o f project design. Project altematives have been screened for their economic viability, priority level, cost effectiveness, and other social and environmental criteria. Sensitivity analysis has been done on the major r isks identified during project preparation.
NPV=US$4.4 million; ERR = 16 % (see Annex 4)
Belgaum
In the base scenario, the net present value o f the project i s Rs. 202.7 mil l ion (US$4.4 million). The internal rate o f return i s 16 percent, above the discount rate o f 12 percent. The findings are detailed in the table below:
8.3 1 13%
I NPV IRs. Million) I IRR
Guibarga Hubli-Dhanvad
Demonstration zones (coping costs approach) TOTAL
54.7 16% 114.0 21% 25.7 14%
202.7 16%
For the Investment Component, the objective was to assess the costs and benefits o f the priority investments and o f improving service levels in the demonstration zones from the current extremely low baseline up to continuous supply levels. To this end, the analysis has established baseline indicators wherever possible including private coping costs, costs to the utility, and externalities. Using the revealed preference approach, the analysis has attempted to estimate benefits such as reduction in private coping costs and system efficiency gains, and contrast them to the incremental investment and O&M costs required to improve service levels. Benefits have also been assessed using the stated preference approach, drawing upon the willingness-to-pay information gathered as part o f the social assessment.
Economic analysis will also be carried out during project implementation on the TA component. The proposed private sector contract and associated investments to improve the UWS situation on a city-wide basis will also be assessed using the data generated in the demonstration zones. The analysis will assist in setting both the performance targets (e.g., non-revenue water (NRW) reduction, energy savings) and the investment levels required to achieve the economic and financial viability o f the possible follow-on project. The economic analysis will also cover issues such as tariff levels and structure, cost recovery and affordability, subsidies, fiscal impacts, cross-subsidization among users, and the economics o f investing in wastewater collection and treatment.
Although the Social Assessment study has provided indications o f coping costs and willingness to pay, a more detailed demand assessment and analysis needs to be carried out during
- 1 4 -

implementation, to establish a baseline against which improvements would be measured at regular intervals. The demand assessment (to be funded by the Water and Sanitation Program - South Asia) for the three ULBs will analyze the ‘demand side ’ perspectives, including consumer preferences and affordability aspects for 24/7 and other improvements in water supply services. The study will analyze the baseline situation including the existing coping costs and consumer satisfaction; additional services desired and the acceptable tar i f fs for improved levels o f services.
The 24/7 demonstration project will initiate a move towards metering and volumetric pricing, with tariff rationalization as an instrument for financial sustainability and demand management. As part o f the project institutional component, a tariff policy for urban WSS services will be designed, including possible cross-subsidies for the poor, for the 3 ULBs and at the State level.
Although the ”Urban Drinking Water and Sanitation Policy Statement of GoK“ highlights the need for Monitoring and Evaluation (M&E) as well as reporting arrangements, at present there i s no customer interface and no monitoring system in place. Recognizing the need to supply urban water services in accordance to what consumers want and are willing to pay for, an M&E program for the 3 ULBs (including the non-demo zones) will be designed. The design o f a M&E template will be the first step in institutionalizing customer surveys as instruments o f public accountability and the information will be useful as inputs into operations and planning process, including the design o f effective tariff policies. A pilot program will be carried out over a period o f six months, and lessons to be incorporated for a broader ro l l out. Alternate institutional arrangements, including local institutions (colleges, schools etc.) could be involved in the M&E program and the dissemination o f information.
2. Financial (see Annex 4 and Annex 5): NPV=US$ million; FRR = % (see Annex 4)
The long term objective set by GoK through i t s “Urban Drinking Water and Sanitation Policy Statement” i s to “establish an appropriate cost recovery mechanism through adequate tari f f to ensure that revenues cover O & M costs, debt service plus a reasonable retum on capital”. In view o f this, the financial health o f the ULBs have been analyzed. Preliminary results show that none o f the ULBs currently cover even hal f o f their O&M costs through tariff revenues, and when depreciation and interests are taken into account, the results deteriorate significantly. The table below shows that a large portion o f the deficit i s covered by state subsidies, including grants, share o f salaries, grants adjusted by KUWSDB and Kamataka Power Transmission Corporation Limited (KPTCL), which are categorized as revenue in the ULB accounts. GoK has recognized that in the medium term, subsidies and grants will continue to be needed, but their plan i s to focus more on targeting the poor and providing sanitation.
- 15-

Table 1: Cost recovery levels in the participating ULBs: H D M C Belgaum Gulbarga
A. O&M cost recovery level in 200 112 19% 39% 17% B. Full cost recovery level in 2001/2 16% 24% 11% C. Full cost recovery including grants in 200112 87% 83% 49%
Where: A. B. C.
includes WSS tar i f f and tax revenues/O&M costs. includes WSS tariff and tax revenuedfull cost including O&M, depreciation, and interests. includes WSS tariff and tax revenues plus share o f SFC salary, grants adjusted by K U W S D B loan and KPTCL/ fu l l cost including O&M, depreciation, and interests.
Wi th regards to financing o f the UWS at the state level, the project envisages to assist GoK in carrying out the state sector development strategy/action plan, including detailed fiscal allocation o f state resources. With regards to ULB level reform, the project envisages to assist the ULBs through the following studies:
(i) Ring-fencing the WSS Operations: To improve the efficiency and accountability for the sector, the ULBs will separate their WSS accounts from rest o f the municipal services using a workbook developed during project preparation. As a first step, operating revenues and expenses for the WSS activities, as well as the demo zone accounts will be recorded separately. Capacity building o f 2-3 municipal staff in each ULB to perform th is activity will be conducted in close coordination with a state-wide initiative undertaken by GoK, aiming at computerizing the municipal accounts.
(ii) Improvement in U W S Billing and Collection: To improve the bill collection rate which has been deteriorating during the past four years, down to only 37 percent for Hubli-Dharwad, 53 percent for Belgaum, and 30 percent for Gulbarga, a computerized customer database and a billing and collection system will be developed and implemented. These systems will also separate the demonstration zone bills which will be different for each consumer depending on their consumption level, and have a more frequent billing cycle. The bill collection target by project closure i s set for 70 percent in the demonstration zones.
(iii) Defining the Water Tariff Structure: Using the project cost estimates, data collected from the ULBs, KUWSDB, and KPTCL and revenue and cost related assumptions, a simple analysis was done to estimate the level o f tariff increase necessary to achieve cost recovery in the medium to long term.
Table 2: Annual Tariff Increase Necessary to Reach Cost Recovery in Five/Ten Years: H D M C Belgaum Gulbarga
O&M cost recovery by 2007 52% 18% 61% O&M cost recovery b y 2012 25% 7 yo 25% Full cost recovery (incl. depreciation and debt ) by 2007 28% 35% 80% Full cost recovery (incl. depreciation and debt) by 2012 26% 12% 29%
The TA component o f the project will assist GoK and the ULBs to develop sound tari f f policies at the municipality level and a volumetric tariff system in the demonstration zones. In summary,
- 1 6 -

the following methodology and principles will be used for water pricing in the demonstration zones: (i) There will be careful transition to volumetric pricing by using both flat rate and volumetric
billing in parallel for a few months, accompanied with social intermediatiodcommunication activities; The volumetric rate will be at least Rs.lO/m3, which corresponds to what the users are actually paying now for 30 liters per capita per day (lpcd). The detailed tariff structures in the demonstration zones wil l be finalized by June 30, 2005; Connection subsidy policy will also be examined; and Init ial target for the tariffs will be to cover no less than 50 percent o f O&M costs and progressively increases to no less than 80 percent O&M costs by the end o f this project.
(ii)
(iii) (iv)
In the rest o f the ULBs, there will be a step wise tariff increase along with service improvements resulting from the priority/distribution network investments.
Fiscal Impact:
GoK has confirmed their intention to pass the Loan proceeds to the ULBs as grants due to the pi lot nature o f the project. Since the project, through i t s sector development components, envisages to develop and adopt state financial policies that include WSS tariffs that aim to gradually achieve cost recovery and reduce state subsidies to the sector, i t i s expected that there will be positive fiscal impact on the state finances in the medium to long run.
3. Technical: The project faces several technical challenges mainly in attempting to provide high quality 24-hour service in demonstration zones. The main challenges stem mostly from the unknown, but presumed very poor condition o f the distribution systems, lack o f proper system maps, current practice o f intermittent supplies, possibility o f providing sufficient water to demonstration zones without affecting the supplies to other areas, availability o f bulk water, lack o f metering o f supplies, lack o f proper sewerage systems, quality o f water, and the current limited technical capacity o f the ULB WSS departments. These challenges are addressed through three separate sub-components, and are discussed in the project description summary section above and in Annex 2.
Under components B 1 and B2, priority investments and works in city distribution networks will be implemented to benefit the whole population in al l three ULBs. This would address the potential social issues associated with the demonstration projects.
Under component B3, demonstration projects will be carried out and show a programmatic improvement o f distribution systems and customer connection arrangements in limited parts o f the city (called demonstration zones, covering 7- 14 percent o f city’s population). This init ial process would reveal the challenges, provide scope to identify appropriate solutions, demonstrate that 24/7 water supply i s achievable, and show the benefits. Ultimately, the goal i s to expand the 24/7 supply regime to the whole distribution system in subsequent projects, based on the lessons learned in the current project.
- 1 7 -

Init ial Diagnostic Studies identified feasible demonstration zones in each o f the three ULBs, and provided a basis (for preliminary identification o f works needed and developing performance criteria etc.) for drafting the Terms o f Reference for the OC. The OC develops a strategy for achieving the performance targets demanded o f them, identifies works required, procures contractors, implements works and operates the zones for 2 years using ULB staff. During this operation, subsequent project would be prepared to expand the 24/7 supply to the whole o f the ULBs.
City Wide Engineering Feasibility Studies for the 3 participating ULBs would be carried out under Component A 2 to roll-out the 24/7 water supply to the entire ULB. In the f i rst phase, detailed network mapping and modeling, and identification o f critical bottlenecks in the city-wide distribution system to be implemented as Component B 2 would be taken up. In the second phase, addressing engineering issues related to scaling up the project to cover the entire ULB, development o f strategy for roll ing out 24/7 supply to the entire ULB and addressing waste water collection and treatment would be taken up. Similar studies would also be carried out in 2-3 additional ULBs in Kamataka under Component A2.
4. Institutional:
4.1 Executing agencies:
As described above under project description summary section, overall implementation responsibility will l i e with KUIDFC, a company registered under the Companies Ac t and fully owned by GoK. Other important participants in project implementation include: (i) The State-level Steering Committee for overall steering o f the project throughout i ts entire cycle, comprising (inter alia) Principal Secretary, UDD; Secretary, MUDA; Managing Director, KUIDFC; Managing Director, KUWSDB; Director, Municipal Administration, and Director, GoK Project Monitoring Cell;(ii) UDD, which will drive and manage the sector reform component through i t s policy/technical cell housed within KUIDFC unti l the KSUWSC i s operational; (iii) KUWSDB, which will act as an agent o f the KUIDFC for the design, technical aspects o f procurement, and constructiodsupervision o f the priority investments; and (iv) the three ULBs, which will permanently participate as part o f the State-level steering committee and through the ULB-based Project Implementation Units (PIUs), and wil l be consulted and informed throughout project implementation.
Deep engagement and participation o f the ULB staff would be important for institutional strengthening, particularly with regards to the demonstration projects for several reasons: (a) to gain ownership by the ULB, which i s responsible for the service; (b) to transfer knowledge o f local engineers; and (c) to use the acquired knowledge to upgrade and train other municipal staff.
4.2 Project management:
To carry out i t s responsibilities, KUIDFC has established a P M U which will provide for the technical and financial follow-up, coordinate/carry out a l l project procurement, prepare reports, coordinate all financial management tasks including audits, and in general become KUIDFC interlocutor with the ULBs, other participants in project execution, and the Bank. The PMU's organization, staffing, functions, procedures, manuals and costs have al l been agreed. The P M U i s
- 18-

headed by KUIDFC's Managing Director and i s composed o f a field-based PIU, with divisions located in each ULB, and HQ-based departments including: (i) project coordination and procurement, (ii) finance, accounts, disbursement and reporting, (iii) social and environment, (iv) legal, (v) land acquisition, and a policy/technical cell reporting to GoWUDD. Strengthening measures o f the P M U are planned during project implementation, e.g. on social and environmental management, and procurement. Detailed implementation arrangements by component i s described under section C, Project Description.
4.3 Procurement issues:
The project would support procurement o f consultancies for the Sector Development and Technical Assistance (Component A) and the Project Implementation Support (Component C), as well as the procurement o f Goods, Works and Consultancies for Physical Investments (Component B).
The investment component envisages selection o f an OC who would be responsible for an engineering consultancy and operation o f the demonstration zones for a period o f about three years. For procurement o f goods and works in such zones, the OC will prepare an investment plan for review and agreement with KUIDFC and the ULBs, be responsible for preparation o f the bidding documents, invitation o f bids, and award o f contract (on behalf o f KUIDFC). For the priority investments and works in city distribution networks, KUIDFC wil l procure the required goods and works, with the technical assistance o f KUWSDB throughout the process including planning, assistance in preparation the bidding documents, follow-up the bidding process, elaboration o f evaluation reports and assistance during negotiations. KUIDFC will be permanently accompanying the process and will take key decisions including call for bids, bid awards, and contract signing.
All procurement o f goods and works shall be in accordance with the Guidelines for procurement under IBRD Loans and IDA Credits; January 1995, Revised January and August 1996, September 1997, and January 1999. The procurement o f Consultancies for the project shall be in accordance with Guidelines for Selection and Employment o f Consultants by Wor ld Bank Borrowers; January 1997, Revised September 1997, January 1999, and May 2002. The capacity and capability o f KUIDFC to carry out the procurement for the project as per the Bank's Guidelines was assessed during the preparation o f the project and strengthening measures agreed as per details in Annex 6A.
4.4 Financial management issues:
Although this will be the f i rst Bank project to be implemented by KUIDFC, the accounting function i s adequately staffed and fully computerized. The company maintains accounts project wise using the customized software 'Tally". Financial management systems and procedures that require strengthening have been addressed during project preparation. Capacity building initiatives include the adoption o f a financial management manual, which will document the accounting policies and procedures o f the organization. The internal control mechanisms within the organization are being strengthened by the setting up o f an internal audit department in KUIDFC.
A Manager Finance will be deputed to the P M U and work under the oversight o f the Executive Director Finance to handle all aspects o f project accounting, payments, financial reporting and
- 1 9 -

audit. The P M U will receive funds for the project (on behalf o f KUIDFC) from GoK, make project expenditures, record transactions, and maintain project accounts. I t wil l also be the nodal agency for ordering, receiving and paying for goods. All payments to contractors will be localized in KUIDFC to avoid procedural delays and bottlenecks. Payments will be made on the basis o f certified bills submitted by them as per contractual terms. In the demonstration zones, the contractors will submit their bills to the OC who will check the technical specifications, record them in the measurements book, and certify for payment. Thereafter, the bills will be routed to the P M U where they will be checked by the Manager Finance and paid. A similar process will be followed for the priority investments where contractors’ bills will be routed through KUWSDB. The OC and KUWSDB will assist the P M U in the preparation o f works budgets for the upgradation o f networks in the demonstration zones.
The audit o f project expenditures wil l be carried out by a firm o f Chartered Accountants. The project will produce quarterly Financial Monitoring Reports (FMRs) in formats that will be agreed with the Bank. (further details in Annex 6B).
5. Environmental: 5.1 Summarize the steps undertaken for environmental assessment and EMP preparation (including consultation and disclosure) and the significant issues and their treatment emerging from this analysis.
Because o f the nature and the small size o f the investments considered under the project, no significant environmental impacts are expected. However, a Limited Environmental Assessment (LEA) o f the envisaged works was undertaken to assess the extent and significance o f environmental impacts o f the proposed physical investments in three ULBs. In order to mitigate adverse environmental impacts during planning and implementation o f works, an Environmental Management Plan (EMP), including Environmental Codes o f Practice (ECOPs), has been prepared by an independent environmental consultant, working closely with the engineerinddesign consultant. The EMP will be h l l y integrated in the contract for implementation and operation o f the demonstration projects and will be the responsibility o f the OC implementing the works.
Environmental Category: B (Partial Assessment)
The significant adverse environmental issues during the construction phase in the demo zones include:
a. Temporary disruption o f water supplies including possible flooding and leakages during the isolation o f demo zones, leak detection and replacement o f mains;
b. Increased dust and noise levels during earth excavation activities; and c. Temporary disruption to traffic during construction.
Most o f the above mentioned environmental impacts during construction would be temporary and reversible, and will be addressed using the recommendations in the ECOPs and EMPs. Other construction phase impacts such as disruption to water supplies and possible flooding would be addressed by providing alternative water supply through tankers during the period o f construction, and by providing alternative bypasses and leak control system (for details see the EMP) .
The significant adverse environmental impacts expected during the operational phase include: a. Generation o f additional quantity o f waste water from zones leading to possible
- 20 -

contamination o f surfacehub surface water source; and b. Possible flooding o f low lying areas due to overflow o f storm water drains
I t i s expected that the increased water supply (and per capita consumption) in al l the demo zones (and wards) wil l be primarily due to reduced leakages from the distributiodtransmission lines and wastages from the public stand posts. The demonstration project does not propose to strengthen the existing sanitation facility, and would use the existing sewerage system in the three cities for disposal o f additional quantity o f waste water, which i s not likely to create major problems such as flooding or overflow. However, the issue o f sewage collection and disposal including a feasibility study to analyze various alternative solutions will be considered and costed as a significant priority during the subsequent phases o f this project.
The significant positive environmental impacts during the operational phase include: a. Possible improvement in water quality and, improved health and hygiene due to reduction
in leakages and cross contamination with sewer lines; and b. Better control and management o f environmental issues due to improved monitoring.
The LEA has pointed out interesting findings on water quality at supply end and consumer end. The report finds high bacteriological contamination (or microbiological pathogen number (MPN) count) in water samples collected for each demo zone. I t i s assessed that the water quality problems at the consumer end may be largely due to ingress o f contaminated water to the system, which the low residual chlorine levels cannot deal with. The project i s likely to result in improved water quality and health and hygiene in the demo zone. (See Additional Annex 12 for details on the results o f the LEA). 5.2 What are the main features o f the EMP and are they adequate?
For each expected environmental impacts, the EMP outlines the mitigative measures to manage impacts arising out o f proposed activities during the construction and operational phase o f the project. I t also assigns responsible agencies for coordinating respective mitigative measures. The E M P also includes the that uses the Central Public Health and Environmental Engineering Organization (CEEPHO) manual as the basis. The ECOPs i s expected to be a usefu l guidance tool to OC and design engineers for integrating environmental aspects in planning, design, construction, operation and management o f water supply sub-projects. The ECOPs may be helpful to mainstream environmental aspects and broadly covers the recommendations on:
a) Project Planning - environmental screening and scoping; b) Design Phase: basic design considerations, quality standards, selection of source,
development of source, transmission of water, treatment of water, distribution system; c) Construction: source development and intake works, conveyance and transmission
mains, pumping stations/booster stations, treatment plant, storage reservoirs, distribution network; and
d) O&M: source and intake works, transmission main, pumping/booster stations, treatment plant, storage reservoirs, distribution network.
Overall environmental implementation supervision would be the responsibility o f KUIDFC, the
-21 -
implementing agency. However, KUIDFC wil l coordinate with designated local engineers at the ULBs in Hubli-Dhanvad, Belgaum and Gulbarga for planning and ensuring effective implementation o f EMPs. The implementation arrangement for the EMP and ECOP requires an engineer to be designated at each ULB, who will be responsible for ensuring the implementation o f the requirements. The OC implementing the project would have an environmental specialist on the team who will prepare a plan to operationalize the EMPs and will be responsible for ensuring that contractors strictly adhere to EMP and ECOPs provisions.
5.3 For Category A and B projects, timeline and status o f EA: Date o f receipt o f final draft: August 1 1,2003
The project EA was completed and thereafter disclosed at the Bank Infoshop, by GoK at KUIDFC's web site, and in public libraries in the three participating ULBs.
5.4 How have stakeholders been consulted at the stage o f (a) environmental screening and (b) draft EA report on the environmental impacts and proposed environment management plan? Describe mechanisms o f consultation that were used and which groups were consulted?
As part o f the Environmental Assessment (EA) and in coordination with the social intermediation activities (see section 6 below), public consultations were held in the ULBs to identify environmental issues seen by communities and stakeholders. Project beneficiaries and local NGOs were consulted about the project's environmental aspects during project preparation and will be consulted again during implementation. LEA and EMP reports are made publicly available in Karnataka Urban Department and public library.
5.5 What mechanisms have been established to monitor and evaluate the impact o f the project on the environment? Do the indicators reflect the objectives and results o f the EMP?
Environmental performance indicators have been identified as part o f the overall project indicators, to monitor and evaluate the impact o f the project on the environment. The plan prepared to be prepared by the consultant operator will include, a program, indicators, estimated budget and institutional measures necessary to monitor and evaluate project's impacts on the environment.
6. Social: 6.1 Summarize key social issues relevant to the project objectives, and specify the project's social development outcomes.
The desired social development outcomes expected out o f project interventions are: (i) Substantial positive effect on women (time and effort) and better health for the entire family through assured supply o f safe water in adequate quantities made available to all households; (ii) Improved and equitable coverage o f un-served and under served poor house holds at reasonable cost; and (iii) Empower users through mechanisms for voice and choice (redress o f complaints, easier methods for tariff payment, etc.).
A participatory Social Assessment has been undertaken as part o f the project preparation activities. Findings from the Social Assessment and interactions and observations o f Bank missions during the field visi ts to the three selected towns indicate:
- 22 -

Oualitv o f service: Water supply service i s poor in terms o f quality, quantity, and reliability. The intermittent supply combined with unsanitary conditions around water supply points ensure contamination o f the water supply. In households with private connections (between 70 to 90 percent o f the population in each city), water collection engages the entire family during the unreliable hours o f supply. Given the low pressure in the system, most households have built pits in front o f their houses to tap the water at a lower level. This results in unsanitary conditions at the water collection point. Households compete with each other by using powered pumps connected to the supply line. There are visible (time spent, water purchased from tankers) and not so visible costs (cost o f electricity for pumping water f iom supply line and from primary collection point to elevated reservoirs, loss o f productivity and expenses for medical treatment and investment in subsidiary sources) incurred by households. Substantial private investments (drilling o f bore wells) are taking place each year in extension areas, causing undesirable environmental effects. However, even such households in extension areas are willing to switch to public supply if quality o f service delivery could be assured. There i s an alarming amount o f waste o f water from public stand posts.
Poor households: Locations o f vulnerable groups (slums and resettlement colonies o f slum dwellers) are un-served or often grossly under-served. Poor households, which depend on stand posts, waste time and effort in collecting water, often under unsanitary conditions, with women being the main sufferers.
Tariff collections: Tarif f collection from registered connections lag from six months to two years. Often the arrears i s not due to unwillingness to pay current tariffs but rather a lack o f follow-up by the ULB and/or additional effort needed from the customer to pay the bill. Substantial number o f unregistered users draw water from the system without having to pay either the connection charges or the monthly tariff. In the absence o f political will to take penal action, the errant households continue to draw water.
Willinmess to pay: Prima facie, consumers are willing to pay a higher tariff for a better service level. Even stand post users and s l u m dwellers were willing to pay tariff for a better level o f service, though they may want to negotiate the tariff. However, this willingness to pay i s adversely affected by crisis o f ULB credibility in the mind o f consumers. The ULB’s “willingness to charge” seems to be a major hurdle, more than willingness to pay (by consumers).
Crisis o f institutional credibility Consumers have little or no say on the timings and fiequency o f water supply. While the service levels at the 3 ULBs are varied, in general, people have very little faith in the ULBs to deliver reliable and quality supply. They seem to be happy to get regular supply (even once in two days) and perceive 24/7 supply as a hypothetical dream.
Awareness o f health issues: While the communities keep their indoors ‘clean” and their water vessels sparkling, there i s little awareness among communities on adverse health impact o f the present intermittent supply.
The findings from the Social Assessment indicate that a comprehensive set o f interventions are needed. In addition to institutional, technical and managerial interventions, substantial social
- 23 -

intermediation and communication efforts are needed supported through actual demonstration o f the feasibility (technical, economic, institutional and managerial) o f high quality services.
6.2 Participatory Approach: How are key stakeholders participating in the project?
Getting stakeholders together and building consensus i s one o f the biggest challenges o f the project. The thrust o f the proposed approach i s to keep stakeholders informed o f sector reform and i t s benefits, consulted in developing plans and implementation arrangements, and enlisted in the reform process to ensure their proactive and beneficial engagement. Lessons from successful (or otherwise) results o f past reform efforts that have been incorporated include: clear public understanding o f reform measures and their benefits, transparency, building consensus and support for reform, addressing stakeholder concerns, and a credible and coordinated communication and consultation process.
Wi th th is in view, the preparation efforts have focused on carrying out a detailed stakeholder analysis, public consultations with all key stakeholders, focus group discussions with identified groups (women, poor households, elected representatives etc.). A communication strategy has been prepared and this strategy, in turn, has been presented and discussed in stakeholder forums in each o f the three participating ULBs before finalization. The communication strategy emphasizes stake holder participation and outlines a strategy for their continued participation at al l stages o f the project and thereafter (including institutional arrangements to facilitate the process) during post-implementation.
6.3 How does the project involve consultations or collaboration with NGOs or other civil society organizations?
NGOs and c iv i l society organizations have been associated with the preparation o f the project. The Bank preparation teams have been regularly meeting with many o f these organizations during missions, and the response received has been very encouraging. NGO services would continue to be utilized for community consultations and social intermediation efforts. Local community-based and professional organizations have volunteered to assist in creating awareness and monitoring implementation processes.
6.4 What institutional arrangements have been provided to ensure the project achieves i t s social development outcomes?
A Social Assessment has been undertaken as part o f project preparation to design the project processes and institutions. Some important features o f the exercise include emphasis placed on: (i) stakeholder analysis; (ii) communication strategy; (iii) extensive stakeholder consultations; (iv) continuation o f the Social Assessment in the form o f social intermediation efforts in the demonstration zones; (v) putting in place an institutional framework for continued stakeholder involvement consistent with the 74th constitutional amendment; (vi) specific measures for inclusion, transparency, and accountability o f key stakeholders; (vii) 24/7 customer complaint centers for grievance redressal; and (viii) participatory monitoring systems.
6.5 How will the project monitor performance in terms o f social development outcomes?
- 24 -

As part o f the Social Assessment, baseline data for the demonstration zones has been collected and monitoring indicators developed on a participatory basis. The proposed institutional arrangement at the ward level, (leading ultimately to the ULB level as the project i s scaled up during subsequent phases) will enable communities to monitor performance. Norms have been laid out for service standards and the OC would be held accountable for performance against norms. The proposed 24/7 customer complaint centers wil l provide continuous access to local communities to voice their grievances and seek remedial action.
7. Safeguard Policies: 7.1 Are any o f the following safeguard policies triggered by the project?
7.2 Describe provisions made by the project to ensure compliance with applicable safeguard policies.
Environmental Assessment: OP 4.0 1 on environmental assessment i s triggered. Because o f the nature and the small size o f the investments considered under the project, no significant environmental impacts are expected. The LEA o f the envisaged works, and an EMP including ECOPs will be fully integrated in the contract for implementation and operation o f priority works and demonstration projects and will be the responsibility o f the consulting firm implementing the works.
Indigenous Peoples: The project will not cause any adverse impact to indigenous people. The Social Assessment has examined the applicability or otherwise o f the Bank's Operational Directive on Indigenous Peoples (OD 4.20), taking into account the key characteristics o f identifying such groups as defined in the Operational Directive. Findings from the Social Assessment (based on surveys o f the demonstration zones, consultations with scheduled tribes (STs) and other potential groups and discussions wi th knowledgeable professionals and academia) indicate that O D 4.20 i s not triggered.
Cultural Property: The LEA noted that there are no cultural properties along the right o f way o f the proposed investment activities in the demo zones. However, the possibility o f a chance find can not be ruled out. Therefore, procedures for addressing a chance find o f cultural properties are included in the E M P and the environmental codes o f practice. A contract clause would be inserted in the agreement for construction activities in the demo zones.
Involuntary Resettlement: The project envisages to optimize the bulk supply pipeline routes to
- 25 -
derive maximum benefits to the end users. Some o f these benefits are increased technical soundness o f the project, reduced leakages, cost savings (due to reduced length o f pipelines and lengths o f service roads to be built) and uninterrupted supply for 24/7 to demonstration zones and improvement in water supply tb rest o f the city in the selected ULBs. Land acquisition under the current project i s l ikely to be minor and impact on individual farmers i s not expected to be substantial. No resettlement i s contemplated as no structures would be acquired or demolished. Social assessment has also indicated that share cropping i s not practiced in the project areas. In view o f land acquisition involved, OP 4.12 on involuntary resettlement i s treated as triggered. In this context, a land acquisition framework has been prepared to apply for any minor land acquisition that may take place under KUWASSIP I. The project will make every effort to minimize land acquisition and also attempt to minimize temporary adverse impacts and compensate affected persondfamilies for such temporary effects. The project will also ensure that affected persons are consulted well ahead and are involved in planning remedial actions. The project will adopt transparent procedures for determination o f compensation based on market prices and a resettlement action plan would be prepared consistent with this frame work. Vulnerable groups will receive additional support to ensure that their livelihood i s not affected adversely. Investments under future potential follow-on projects may warrant land acquisition depending on the nature o f investments proposed and a more comprehensive resettlement and rehabilitation policy would be developed, if needed, during the implementation o f the current project .
Risk From Outputs to Objective
Other safeguard policies such as OP 4.04 Natural Habitat and OP 4.36 Forestry are not triggered by the proposed project and th is has been confirmed in the LEA.
Risk Rating Risk Mitigation Measure
F. Sustainability and Risks 1. Sustainability:
Because o f the project's demonstration nature and phased approach, i t s overall sustainability wil l be gauged by the depth o f sector reform and maintenance o f service provision in the three participating ULBs. I t i s crucial that key sector reforms-legal, institutional and regulatory frameworks-be h l ly implemented to reinforce the enabling environment to improve financial, managerial, administrative and technical performance o f participating ULBs, ultimately leading to better modes o f service provision. The adoption o f a qualified OC to manage the demonstration zones and the training o f ULB personnel for such functions will help sustain the services over the long term. Also, the demonstration projects will test elements o f the sustainability o f a subsequent larger project.
2. Critical R i s k s (reflecting the failure o f critical assumptions found in the fourth column o f Annex 1):
M Counterparts have been nominated for each project componentkpecialty, and strengthening needs identified. Consultants can be engaged to supplement KUIDFC staff where required.
- 26 -

Lack o f commitment and ownership o f the project.
ULBs' lack o f willingness to achieve proposed levels o f cost recovery.
Administrative and procurement difficulties and delays to procure goods and works necessary to implement the priority works and demo projects by the Operating Consultant. ULBs/GoK will not accept private operator (follow-on project).
From Components to Outputs State water sector reform advances
Resistance from U L B s to advance in service level reform. Resistance o f ULBs to PSP.
slowly.
Overall Risk Rating
i isk Rating - H (High Risk), S (Substantial Ri!
M
S
M
M
S
M
S
S , M (Modest Risk),
Proper implementation and supervision mangements made for the project. Communication strategy established to increase project awareness at ULB level. Communication strategy. A selection criteria for the demo areas would be the stated willingness o f the beneficiaries to pay a higher tariff in return for substantially improved levels o f service. As a condition o f further support beyond the first phase, tariffs would be restructured and increased to a level that covers high percentage o f O&M costs. The contract will clearly indicate that procurement o f goods, works, and services under the contract are the responsibility o f the Operating Consultant.
Communication strategy, continuous involvement o f ULBs in initial project's preparatiodimplementation process.
Sector development component. Permanent dialogue and close follow-up. Permanent dialogue, awareness campaign and workshops. Participation in implementation. Permanent dialogue, dissemination o f advantages o f PSP, support f rom state policy.
Negligible or Low Risk)
3. Possible Controversial Aspects:
None identified.
G. Main Loan Conditions 1. Effectiveness Condition
The following events are specified as additional conditions to the effectiveness o f this Agreement within the meaning o f Section 12.0 1 (c) o f the General Conditions:
a. The Project Agreement has been duly authorized or ratified by Kamataka, and i s legally bindmg upon Karnataka in accordance with i t s terms.
b. Guidelines for project implementation has been issued by G o K in the form o f a GO, specifying roles and responsibilities o f project participants
c. The Project Implementation Plan has been adopted.
- 27 -

2. Other [classify according to covenant types used in the Legal Agreements.]
Financial Covenants
In addition to the standard financial covenants, the following apply: a. KUIDFC shall submit FMRs to the Bank showing actual versus budgeted expenditures,
forecasts o f cash requirements, physical and financial progress and procurement contract management information within 45 days o f the close o f every quarter beginning with the first quarter after project effectiveness in the format agreed with the Bank.
b. KUIDFC shall submit an audit report o f the continuing entity to the Bank within 6 months o f the close o f each financial year including the period o f retroactive financing agreed with the Bank. The f i rs t audit report shall be submitted to the Bank in the six months following the year o f project effectiveness.
c. KUIDFC shall submit to the Bank an audit report on project expenditures no later than six months o f the close o f the financial year starting with the year o f loan effectiveness.
Other Covenants
GoK shall ensure that, no later than June 30,2005: a. a proposal for the creation o f the KSUWSC shall have been presented to the competent
authority for adoption; and b. an investment framework and tariff policy for the urban WSS sector o f Karnataka shall have
been adopted.
H. Readiness for Implementation 1. a) The engineering design documents for the first year's activities are complete and ready for the start
of project implementation. c] 1. b) Not applicable.
E 2. The procurement documents for the first year's activities are complete and ready for the start o f
Ed 3. The Project Implementation Plan has been appraised and found to be realistic and o f satisfactory
17 4. The following items are lacking and are discussed under loan conditions (Section G):
project implementation.
quality.
- 28 -

I. Compliance with Bank Policies 1.: I. This project complies with a l l applicable Bank policies, ir. 2 The following exceptions to Bank policies are recommended for approval. The project complies with
all other applicable Bank policies.
Team keader Sector ManagerlDirector Country ManagerlDirector
- 29 -

Annex 1: Project Design Summary INDIA Karnataka Urban Water Sector Improvement Project
Sector Indicators: 1. Urban water sector reform implemented by the Government o f Kamataka (GoK) and the participating ULBs.
2. Improved urban water service delivery in the participating ULBs.
jector-related CAS Goal: 'overty alleviation through mproved and sustainable irovision o f water supply and anitation (WSS) services in he urban local bodies (ULBs) if Kamataka.
Sector/ country reports: Status reports o f Department o f Economic Affairs (DEA) and municipal statistics produced by GoK.
'roject Development lbjective: . Launch G o K s urban water ector reform process based in the state urban water )olicy.
Outcome I Impact Indicators: 1.1, The reform base i s established and initial reform activities are camed out. 1.2 The ground for Private Sector Participation (PSP) i s prepared as a realistic option for water and sanitation provision. 1.3 An enabling legal, regulatory, and financing frameworks are established for the sector. 2.1 Possibility o f continuous water supply i s demonstrated. 2.2 Priority bottlenecks to improve quantity o f water supply are solved. 2.3 Increased consumer awareness, commitment, and ownership for reform are
!. Improve urban water upply and sanitation services n participating ULBs and lemonstrate that sustainable, :fficient, and commercially riented service provision can )e achieved.
Project reports:
1.1 Progress reports from implementing agencies, mid-term-review evaluation, Implementation Completion Report (ICR), Operations and Evaluations Department (OED) end o f project evaluation.
2.1 Progress reports from implementing agencies, mid-term review evaluation, ICR, OED end o f project evaluation. 2.2 Customer satisfaction surveys.
from Goal to Bank Mission) nplementation o f state and x a l level reforms w i l l ontribute to improved erformance o f urban water ector and i t s long te rm ustainability .
From Objective to Goal)
. GoK, State l ine agencies nd ULBs maintain ommitment to urban water ector reforms. ,. No major natural disaster lr political disturbance would lccur during the mplementation period.
- 30 -

lutput from each Zomponent: :omponent A l : State water iolicy implementation i s nitiated.
:omponent A2: krengthening o f Service Ielivery and Preparation o f :ollow-on Project in the 3 'articipating ULBs
2omponent B 1 : Priority nvestments are completed.
2omponent B2: Distribution ietworks are improved.
:omponent B3: lemonstration projects are ompleted.
Output Indicators:
A 1 (i) Establishment and operationalization o f the Kamataka State Urban Water Supply Council (KSUWSC). (ii) Establishment o f a policy framework for allocation o f funds and investment and pricing o f WSS services. (iii) Establishment o f a State Water and Sanitation Information System. A2 (i) Implementation o f financial management pilots in the participating ULBs, including separation o f WSS accounts and computerized bil l ing and collection systems. (ii) Definition o f the scope and scale o f follow-on private sector participation and scaling up in other ULBs. B 1 Improved overall water supply availability and quality in the three ULBs. Satisfactory technical audit and third party inspection o f priority investments. B2 Improved overall water supply availability and quality in the three ULBs. B3 (i) Volumetric tari f f adopted according to agreed principles in order to recover no less than 50% o f O&M costs init ially and no less than 80% by project closure in the demo zones. (ii) Substantial improvement o f water supply services in the demo areas, characterized by combined weighted average (at least 75%) o f the following indicators: a. Continuous supply to zone-emergency stoppages no to exceed 12 hours and no more than one emergency stoppage per 3 months (20% weight);
'reject reports:
i o K progress reports.
'rogress reports from ULBs nd KUIDFC.
'rogress reports from GoK .nd KUIDFC.
'roject reports and audit eports.
'rogress reports from ULBs .nd KUIDFC.
'rogress reports from LJLBs md KUIDFC.
from Outputs to Objective)
. Timely completion o f ,olicy studies.
!. Adequate capacity at al l evels.
1. Strong commitment and iwnership o f the project at the state and local level.
4. Willingness o f ULBs to mprove their performance.
5. No unexpected delay I ssues wi th engineering Horks.
- 31 -

2omponent C: Smooth project mplementation
b. Water quality as per noms and monitored through testinghampling (5% weight); c. Supply to zone to be metered both in respect to flow and pressure and continues records maintained (5% weight); d. Physical losses within the demo zone not to exceed 10 liters per connection per hour based on average pressure within the demo zone o f 10 meters, adjusted proportionately in respect to the actual average zone pressure (10% weight); e. Maximum pressure within the demo zone 15 meters and minimum pressure 8 meters (1 0% weight); f. 100% metering o f property connections, standpipes, and feeds to street storage tanks, adoption o f volumetric tariff structure (20% weight); g. Billing and collection rate to exceed 70% (10% weight); and h. High level o f customer satisfaction (70%) measured by polls (20% weight). C. Project implementation according to the schedule.
'roject reports.
- 32 -

Project Components I Sub-components: A. Sector Development and Technical Assistance: 1 .Policy Implementation and State Level Institutional Strengthening 2. Strengthening o f Service Delivery and Preparation of Follow-on Project in the 3 Participating ULBs B. Physical Investments 1, Priority Investments 2. Works in City Distribution Networks 3. Demonstration Projects C. Project Implementation
Kev Performance
nputs: (budget for each :omponent) ,255 mil l ion
i47.20 mil l ion
; 1.39 mil l ion
'roject reports:
, Project reports.
:. Project reports.
I. Project reports
[from Components to Outputs) 1. Ownership and commitmeiit at the state level to implement the strategic plan for the state urban water and sanitation policy.
2. Ownership and commitment at ULB level to improve their WSS service delivery performance.
3. Ownership and commitment at implementing agency level to perform their duties without delay.
- 33 -

Annex 2: Detailed Project Description INDIA: Karnataka Urban Water Sector Improvement Project
The project comprises o f three components: (1) sector development and technical assistance (TA); (2) investments in three ULBs to improve their water supply services and demonstrate the feasibility o f continuous safe water supply in pilot areas; and (3) project implementation support. By Component:
Project Component A. Sector Development and Technical Assistance - US$2.55 million
This component aims at supporting Government o f Karnataka (GoK) to carry out its urban water sector (UWS) reform agenda and help prepare the possible follow-on investment project. I t has two subcomponents as described below:
A1 Policy Implementation and State Level Institutional Strengthening (US% 0.89 million)
The objective o f this subcomponent Al. i s to assist GoK in finalizing its policy reform agenda and to cany out init ial implementation steps o f staged sector reforms. These reforms are based on the new “Urban Drinking Water and Sanitation Policy Statement o f G o K ’ (presented in annex 13 ), approved by the State Cabinet, GoK in May 2003. The Urban Development Department (UDD), GoK and Karnataka Urban Infrastructure Development and Finance Corporation (KUIDFC) carried out a policy strategy and implementation plan study, which identified specific activities to operationalize the policy statement, some o f which have been included in th is subcomponent. They include the following technical assistance and training activities.
(a) (KSUWSC) : GoK plans to establish a KSUWSC, whose responsibilities would policy definition and implementation, planning and programming, technical assistance, development o f sector information system, norms, and certain regulatory functions in the UWS. This activity would include: (i) carrying out the concept and detailed design o f the KSUWSC, including i t s location within the institutional framework, charter and documents required for i t s legal creation, main functions and responsibilities, organizational structure and staffing, and start-up plan; (ii) actual approval process and creation o f the KSUWSC; and (iii) preparation o f the f i rs t two years o f work program and capacity strengthening plan, including training, equipment, systems, and strategic action plan. The objective o f th is activity i s to have the KSUWSC up and running according to its designed role by year 2005. The intermediate goal i s complete the establishment o f the KSUWSC by the end o f 2004.
Establishment and operationalization of Karnataka State Urban Water Supply Council
(b) be responsible for sector strengthening via provision o f technical assistance and other means. Meanwhile the following capacity strengthening activities will be carried out:
Strengthening of Service Delivery in ULBs: As per the policy vision, the KSUWSC will
(i) several departments and institutions, making it a recognized inefficient mode, as it lacks accountability and transparency. To improve this situation, several institutional service delivery
Institutional Options for Sewice Provision. Urban water service i s scattered among
- 34 -

models, both public and private will be explored, and a strategy for a new institutional framework for the state would be proposed. Pilot case study proposals wil l be offered, including agglomeration economics in the WSS.
(ii) Technical Assistance Strategy and Action Plan to enable WSS sector reform at the ULB level. This study would be based on the recommendations o f the institutional options for service provision.
(iii) commercial systems in pilot ULBs.
Revenue Collection Action Plan. This study will set up a strategy to improve the existing
(iv) Public Awareness and Communication Strategy. The above strategies, reform proposals and action plans need be duly communicated to inform the public and to gain their support. A communications strategy for the State i s under preparation by grant funds. Building upon such a strategy, this subcomponent will assist with actual communications and awareness campaigns.
(c) Development of the State Water and Sanitation Information System (WASIS): The WSS sector lacks a credible information system, which i s key to al l planning exercises regarding investing for improving physical systems and service provision, and to develop and apply fund allocation mechanisms, criteria, and technical assistance programs. The objective o f this activity i s to assist GoK in financing the design (conceptual and physical) o f a sector Management Information Systems (MIS) and in assisting with the actual setup / initial implementation phase. This activity would include purchase o f equipment (as per consultants estimated requirements), training, and advice in the initial setup. I t entails two main tasks:
Task A: To develop an information system, collect data from al l ULBs, provide training o f the primary users, and develop formats for periodic information updates.
Task B: Benchmarking o f the service provision levels. The possibility o f establishing a benchmarking system, recognized as a powerful tool to help self-regulate service providers, will stem from the WSS information system established under Task A. There i s also a larger benchmarking initiative through Water and Sanitation Program (WSP) that would set the framework for India and would look at several pilots, including Kamataka. The proposed activity would follow the two related activities described above and establish the f i rs t benchmarking process in the state.
(4 Water and Sanitation Sector Investment and Tariff Frameworks
This activity consists o f the following two tasks:
Task A. Resource allocation through programs i s perhaps the most powerful instrument the state has to provide incentives for reform in the ULBs, since most investments are originated and fimded by the state. The new water policy calls for a trend towards cost recovery and efficiency. This proposed activity would assist the state in establishing an integrated state WSS sector financial policy. The study would also look at several financial scenarios and sources o f hnds to
- 35 -

help comply with the state sector goals.
Task B. Framework for WSS pricing - tariffs. This study would examine the WSS pricing policies, taking into account the regulatory, financial, and social aspects o f service delivery. The study would then develop tariff guidelines and general good practice elements at the state level. The study would also propose ways for the state (KSUWSC) to strengthen its capacity to provide assistance to ULBs in setting appropriate tariffs for their WSS service. The three' participating ULBs would be the pilots for this effort.
(e) the f irst steps in establishing a regulatory framework for the WSS sector. Following this initial setup, full regulatory functions at the state level, including economic regulation and quality o f service, contracts, and long term endeavors, will evolve as needed. The state regulatory function would be primarily housed in the KSUWSC. This activity would assist GoK in designing the regulation strategy, legal basis and action plan, and starting up o f essential but basic regulatory functions, including pricing, service accounting and benchmarking.
Review and establishment of legal and regulatory framework: The idea i s to provide
@ for the sector, recommend necessary changes to the existing legislation, and prepare the corresponding legislative (or in some cases executive) proposal. Based on these, a framework for regulatory regime would be established and detailed design o f the regulatory function at the state level, including definition o f its contents and scope, legal support, organizational needs, implementation strategy, and phasing would be defined.
Preparation of WSS Legislation: This study would assess the current legal framework
A2 Strengthening o f service delivery and preparation of follow-on project in the 3 participating ULBs (US$ 1.66 million)
The demonstration projects in Belgaum, Gulbarga and Hubli-Dharwad will provide a temporary institutional arrangement, namely a partnership with the Operator Consultant (OC), a private operator in selected demonstration zones. Areas outside o f the demonstration zones will continue to receive services under the existing arrangements, from KUWSDB in Hubli-Duarwad, and from the ULB water departments in Belgaum and Gulbarga. A t the end o f the temporary arrangement in the demonstration zones with the OC, it i s envisaged that the service will be transferred to an operator who would be responsible for providing the service for a substantially longer te rm to the entire urban areas o f the three participating cities. This subcomponent wil l assist GoK's medium term vision by: (i) carrying out studies to define the institutional setup; (ii) bidding and contracting the future management contract; (iii) assisting in the transition phase; and (iv) carrying out studies to scale up in other cities. This subcomponent comprises o f the following studies:
(i) City-wide Engineering Feasibility Studies, including a short-term service improvement plan, network mapping and modeling, and master plans for longer term rehab/expansion, and environmental and social assessment, for both water supply and underground drainage. Business plans including analysis o f altemative institutional modalities for service delivery, fmancial feasibility analysis and strategic plan, and the proposals for the selection o f a modality o f public-private partnership for each city, although a combined administration for the three would
- 36 -

be an alternative to consider. Preparation and assistance in bidding and contracting the PPP operator;
(ii) Transition plans including the identification o f activities prior to the selection o f the service operation scheme. The objective i s to help assure a smooth transition from the OC to the subsequent operator. This includes: (i) basic improvements to WSS operations in the three cities in key areas (ring-fencing o f the WSS accounts, better commercial systems to make them more compatible with those to be used in the demonstration zones, basic training and dissemination o f lessons from the demo zones operation, and design new role and fimctions at the ULB levels;
(iii) Carrying out other studies related to the preparation o f the PPP, including asset evaluation, communication strategy, and other financial, legal environmental, and social studies. including the design o f the institutional reorganization and transition plan at the ULB level to respond to i t s new role o f contract supervisor; and
(iv) Strategy to scale up this project to other cities in Kamataka. This includes engineering feasibility studies, development o f business plans, and other studies required to define institutional modalities for service delivery in about four or five medium-sized cities in Kamataka.
Project Component 8. Physical Investments - US$47.19 million
As described in Section E3, the project faces many challenges to demonstrate the benefits o f 24/7 supply. These challenges are addressed through selected investments in each o f the three ULBs and through carrying out relevant studies. The various subcomponents are described below:
B1: Priority Investments (US$ 27.63 million)
The primary objective o f Priority Investments are explained in Section C l . At the time o f project appraisal, Kamataka Urban Water Supply & Drainage Board (KUWSDB) i s already implementing certain works to enhance the bulk supply system capacity and efficiency. The Priority Investments proposed under the project would complement the works taken up by KUWSDB. Energy Audits have been carried out on the bulk supply systems o f each o f the ULBs, whose recommendations are taken care o f either through KUWSDB works or through Priority Investments. A phased approach i s followed in implementing Priority Investments. After these investments are made, the bulk system would meet 2001 demands in Hubli-Dharwad, and 201 1 demands in Belgaum and Gulbarga.
Specific objectives and works in each o f the ULBs are as follows:
In Belgaum, the priority investments are targeted at replacing and rehabilitating bulk supply infrastructure, which will significantly reduce leakages from the transmission system and remove supply bottlenecks. Proposed works include: (i) replacement o f the transmission mains; (ii) installment o f suitable capacity pumps at Pump House 1 (PH1); and (iii) capacity expansion o f feeder mains to some o f the reservoirs within the system. Once these measures are taken, the existing bulk supply infrastructure would have sufficient capacity to satisfy the city's present demands.
- 37 -

In Gulbarga, Priority Investments aim at increasing supply and rehabilitating the water sources o f supply -- Bheema river, Bennithora river and Bhosga Tank. The Priority Investments for Bheema would f ix the leakages and increase the supply capacity (additional 50 Mld). The city receives supplies from Bheema through a PSC main, which i s in a very weak state. I t i s proposed to replace this pipe with an MS pipe o f higher capacity (55 Mld - for ha l f o f 203 1 demand), upgrade the pumping station at the headworks and an intermediate pumping station, and construct additional filter beds (15 Mld) at Shor Gumbaz treatment plant which treats part o f the water from this source. The Priority Investments for Bennithora source relate to rehabilitation o f only the transmission main, achieving significant leakage reduction and resulting in a saving o f about 1.8 Mld. The Bhosga tank i s unreliable, and hence will not be used in future for regular supplies.
In Hubli-Dharwad, Priority Investments seek to achieve significant increase in water supplied to Hubli (which requires 2/3 o f total supplies) from 38 Mld presently to 49 Mld, by laying the "Dharwad by-pass main". This main i s o f 1076 mm diameter MS pipe o f 23 km long f iom Ameenbavi near Dhanvad to Nrupatungabetta in Hubli, by-passing an existing reservoir on a hillock in Dhanvad. This arrangement would ensure significant reduction in power consumption, and remove the bottleneck in transmission to Hubli caused by the use o f an existing pipeline with a smaller diameter. Under Priority Investments, pumps would also be installed at Ameenbavi and feeder mains to reservoirs are laid within the city. O f the two sources in Hubli-Dharwad - Malaprabha and Neersagar, the former i s more reliable. Hence Priority Investments are planned to make the bulk water system depend more on Malaprabha, and depend on Neersagar only to the extent o f 50% o f i t s nominal yield based on past 38 years o f data.
In all the ULBs, bulk f low meters are proposed to be installed on the transmission mains at strategic locations, to facilitate water audit. The locations o f bulk f low meters along with maps are available in the summary reports prepared by KUWSDB.
This sub-component also includes:
Technical Audit and Third Party Inspection o f Priority Investments. KUWSDB would act as an agent o f KUIDFC for design, procurement assistance, and construction supervision for the Priority Investments. The fee charged by KUWSDB would be financed by GoK's own funds. The following additional services required for Priority Investments would be supported under this subcomponent: (i) third party technical audit consultant; and (ii) third party inspection agent. Similarly, the strategy and plans prepared by the OC will be critically reviewed by a third party technical audit consultant.
R&R Impact evaluation study.
B2: Works in city distribution networks in all 3 ULBs (US$5.78 million)
- 38 -

The main objective o f this subcomponent i s to provide short term improvements to majority o f the most water-stressed users in each ULB. In particular, the hours o f supply per week (and proportionate increase in the total water received by customers o f the service) by all, or a significant part, o f each o f the cities will be improved. In implementing this subcomponent, it will be ensured that there are no impediments to the provision o f continuous water supply to the demonstration zones, especially with regards to the quantity and quality o f service in the distribution systems outside o f the demonstration zone boundaries. Another important objective o f th is subcomponent i s to improve the general conditions in the rest o f the city to gain social acceptance o f the demonstration projects.
This component would entail procurement o f the civi l works and supervision o f their construction. The selection o f the civi l works would be based on the City-wide Engineering Feasibility Studies (activity under component A2) which assess the situation and identify critical bottlenecks and constraints, including those related to sufficient provision o f water to the demo zones, and formulate the most cost-effective solutions according to preset criteria, and design o f the selected solutions.
The work entailed in identifying and implementing improvements to the distribution networks would be based on the data acquired through the following activities identified under this subcomponent:
i. Analysis o f the system and end-user data in order to determine per capita supply for each scheduled area with the intention o f identifying areas with exceptionally high per capita usage, which could indicate high loss or wastage that need to be addressed.
ii. Development o f a separate hydraulic model o f the complete distribution system for each o f the 4 cities.
iii. Identification o f bottlenecks limiting the supply reaching the scheduled areas through consultation with operational staff and use o f the models.
iv. Devising o f solutions for the problem areas and testing o f their efficacy - and possible effects on adjacent supply areas - using the models.
v. Design o f those interventions graded highest and within the preset budget as agreed with KUIDFC and the ULBs.
vi. Procurement o f the contractors to implement the works.
Typical works would include those related to elimination o f sections o f pipelines imposing unnecessary throttles on supply, pipe replacement where physical losses are excessively high, network sectorization, augmentation o f the capacity o f tanks and reservoirs and/or construction o f new ones, rehabilitation or replacement o f pumps, and improvements to water quality caused by infiltration o f contaminated groundwater, and major bottlenecks in underground drainage etc.
- 39 -

Selection criteria for Proposed Interventions
The proposed interventions would need to: a) Be derived from a comprehensive analysis o f the entire city network and are consistent with a
long-term strategy for a network solution; b) Have the least cost per unit savings in physical losses; (note: th is would take care o f the
economic evaluation); c) Be implemented in less than two years; d) Show a maximum value per intervention; e) Contribute to equalize distribution to all o f the scheduled supply areas; and f) Demonstrate that operation capacity i s assured for operation and maintenance.
In addition: 0 Works regarding bulk supply are eligible but should also be part o f a long-term solution, and
should not overlap with the proposed priority investments. Bulk water supply should also come along with associated improvements in the network. There would be a total preset value for the interventions for each city (to be defined after corresponding studies have been finalized) - including both bulk supply and distribution network interventions. Expansion to new users are not eligible. Commencement o f the work in each o f the cities i s strictly contingent upon the existence of up to date plans o f the distribution network serving the whole city and a database o f the city’s properties and their individual connection status to the distribution network. These records are being prepared under a separate contract being taken up by GOK.
0
0
0
B3: Demonstration Projects (US$13.79 million)
This subcomponent comprises o f studies, works, and management for the demonstration zones in the three cities: Belgaum, Gulbarga and Hubli-Dhanvad. The proposed demonstration projects will only benefit the populatiodproperties within the demonstration zones, constituting between 7-14 percent o f the cities’ total population. The main objectives o f the Demonstration Projects are:
to demonstrate to al l stakeholders, by concentrating on a small Demonstration Zone within each ULB supply area, that 24-hour7 continuous water supply i s achievable and to monitor the tangible benefits - health, technical, operational and commercial - to be derived from this type
to establish, within the chosen Demonstration Zone, a customer billing, collection and support service, and to provide an improved, continuous (Le. 24 hours per day, 7 days a week throughout the year) water supply service for a period o f 2 years; and to monitor the situations within the small zones pre- and post-investment, in order to quantify the social, economic, and other benefits resulting from the demonstration projects e.g. reduction in water-related disease; leakage reduction; improved basis for billing usage.
o f supply;
- 4 0 -

One operator (Operation-Consultant) wil l be hired to manage the demonstration projects in al l three participating ULBs. This subcomponent comprise o f the works required for the above demo zones and for guaranteeing bulk water supply in sufficient quantity and quality to the demonstration zones. Typical works would include pipeline connections and chlorination devises.
This subcomponent also includes:
a Operator consultant fees. With regard to the demonstration zones, the OC will be responsible for finalizing the works, designing the works, preparing the bidding documents, procuring contractors, signing contracts with the contractors, and supervising the contractors' work. Hence: (i) the fee for the OC; and (ii) any bonuses to be paid to the OC based on their performance will be supported under this sub-component.
Technical Audit o f Demonstration Proiects. The strategy and plans prepared by the OC will be critically reviewed by a third party technical audit consultant.
Communication strategy and social intermediation (both within and outside the demo zones). This subcomponent will supplement the designed communication strategy and social intermediation process in order to create an enabling environment for reforms. Specifically, the subcomponent will facilitate: (i) awareness creation and communication between and across stakeholders within and outside the demo zone; (ii) formation o f local level and ULB level institutions/forums for stakeholder interactions; (iii) carry out customer education on proper use o f 24/7 supply systems and healthhygiene behavior; and (iv) participatory monitoring o f outcomes in the demo zones. These objectives have been spelt out as part o f the communication strategy developed during project preparation. This subcomponent will finance social intermediation and communication service activities such as: (i) spreading project awareness among demo zone households in the initial period; (ii) formation o f inclusive water user associations in the ward level (under 74th amendment) and enabling them to become effective forums for two way information exchange and monitoring; (iii) dissemination o f reliable information on project related developments on an ongoing basis; (iv) identification o f critical social issues and concerns as these emerge and bringing them to the attention o f implementing agencies; (v) conduct o f Sanitation and Hygiene Promotion (SHP) campaigns in the demo zones; (vi) awareness campaigns on proper use and conservation o f water under 24/7 supply conditions; (vii) awareness campaigns and seminars on the logic and necessity o f proposed tariffs; (viii) dissemination o f outcomes fiom demo zone area to wider range o f stakeholders in the ULB (through seminars/workshops, cross visits, media coverage etc); and (ix) monitor sector related developments, gauge stake holder perception and disseminate suitable information for acceptance o f reforms by key stakeholders.
0
a
Project Component C. Project Implementation - US$ 1.39 million
KUIDFC, as the agency responsible for project implementation, will strengthen i t s capacity to face the implementation requirements. This entails establishing and operationalizing a project monitoring cell exclusively for the project. This subcomponent will finance the project's incremental operational costs and studies related to project management and implementation, establishment of monitoring system, financial management system training, and consultancies
-41 -

related to the project. In particular this sub-component supports:
(i) Incremental, short term consultants for KUIDFCLJDD, for the duration o f the project; (ii) Preparation and establishment o f a monitoring and evaluation system, and costs related to financial management systems within KUIDFCLJDD; (iii) Training for staff o f monitoring cell o f KUIDFC and municipal reforms cell o f UDD; and (iv) Incremental operating cost at KUIDFC, including supervision costs.
- 42 -

Detailed implementation arrangements by component are described in the table below:
Component Overall project and sector reform
Component A1 (Policy Implementation and State Level Institutional Strengthening)
Component A2 (Strengthening o f Service Delivery, and Preparation of follow-on projects in ULBs)
Component B 1 (Priority Investments)
Component B2 (Works in c i ty distribution networks in a l l three ULB s)
Implementation G o K has constituted a State-level Committee for overall steering o f the project throughout i t s entire cycle, comprising: (i) Principal Secretary, UDD; (ii) Secretary, Mt.JDA; (iii) MD, KUIDFC; (iv) MD, KUWSDB; (v) Director, Municipal Administration, and (vi) Director, G o K Project Monitor ing Cell; For the implementation o f this component, G o K has created a policy/technical cell within KUIDFC, consisting o f a few core sector experts and call ing upon consultants as needed, that wi l l function as a technical secretariat reporting t o UDD. This arrangement would facilitate coordination as we l l as speed up hiring and administrative matters. KUIDFC wil l be responsible for procurement o f various studies and activities under this component, and signing the contracts. The responsibilities and activities o f this team will be taken over by the Kamataka State Urban Water Supply Council (KSUWSC), as soon as it i s established under the project and . .
becomes operational. This component wi l l be managed by the K U I D F C PMU, assisted b y the PIUs located in the h B s , in close consultation with UDD, the Department o f Municipal Administration (DMA), the KUWSDB, and the ULBs. The DMA which deals with sub-state (municipal) aspects o f urban sector reform is being strengthened under the proposed and parallel Bank- funded Municipal Reform Project. The KUWSDB will act as an agent o f the K U I D F C for the design, technical aspects o f procurement, and constructiodsupervision o f the pr ior i ty investments. K U W S & D B will participate in evaluation o f bids, and KUIDFC’s Tender Committee wi l l award the contracts. An independent Third Party Technical Audit consultant wil l be appointed to audit the works in close collaboration with K U W S D B . A Third Party Inspection agent wil l test pipes and equipment. All Contractors payments will be released by KUIDFC with the certification o f K U W S D B to pay. K U W S D B has established a small central unit, including engineering and procurement capacity, and will establish separate units in each o f the ULB for works supervision. Further details on KUWSDB’s implementation arrangements are given in Project Implementation Plan (PIP). The U L B s wil l be the owners o f completed works, K U W S D B will operate them o n their behal f (as per the current agreements between the U L B s and KUWSDB), with the exception o f Belgaum where the ULB itsel f will be operating part o f them. This component will be identif ied through an in i t ia l study and mapping o f the cities’ distribution networks, under the first phase o f City-wide Engineering feasibility Studies (under Component 1B). The identzj?ed works would be contracted by KUIDFC and OC wil l supervise and monitor implementation.
- 4 3 -
Component B 3 (Demonstration Projects)
The Demonstration Projects will be implemented by KUIDFC b y procuring an Operator-Consultant (OC). There will be a single O C contract for a l l the three ULBs. The OC will study the Demonstration Zones in each o f the ULB, prepares a strategy for achieving the performance targets demanded o f them, estimates the cost o f works, and prepares procurement and implementation plans. The strategy, plans and costs wou ld be crit ically reviewed by the Third Party Technical Audit consultant (who would also audit Priority Investments -- see para above). Based on the agreed strategy by KUIDFC in consultation with the ULBs, O C wil l prepare the bidding documents, which would be again reviewed by the Third Party Technical Audit consultant. The works would be tendered out by the OC, who wil l also sign the contracts. The payments to the contractors would be vetted and certif ied by the O C and passed o n to K U I D F C fo r payment. KUIDFC releases payments expeditiously through a Special Account, with a balance o f Rs. 50 m i l l i on a l l the times in its commercial bank, similar to the arrangement currently in place under ADB-funded projects. Further details on Financial Management arrangements will be elaborated in FM Manual.
Monitor ing Impacts o f Continuous Supply wou ld be done by KUIDFC, through establishing a monitor ing system, information campaigns, workshops and surveys etc.
- 44 -

Annex 3: Estimated Project Costs INDIA Karnataka Urban Water Sector Improvement Project
47.44
1. SECTOR DEVELOPMENT AND TECHNICAL ASSISTANCE 2. PHYSICAL INVESTMENTS 3. PROJECT IMPLEMENTATION Total Baseline Cost Physical Contingencies Price Continaencies
4.09
1 Total Project Costs
Total Financina Reauired Front-end fee
1 Total Project Costs
Front-end fee Total Financing Required
38.26 1.19
41.58 1.66 4.20
47.44
47.44 3.69 51.13
0.40 0.40 47.44 4.09 5 1.53
2.92 0.08 3.31 0.07 0.3 1 3.69 0.40
2.44
41.18 1.27
44.89 1.73 4.5 1
51.13 0.40
5 1.53
Works Goods Services (including Training) IOC
35.73 2.53 8.08 1.10
1.25 0.38 2.06 0.00
36.98 2.91
10.14 1.10
I Identifiable taxes and duties are 0 (USSm) and the total project cost, net o f taxes, is 51.53 (USSm). Therefore, the project cost sharing ratio is 76.65% o f
total project cost net o f taxes.
- 45 -

Annex 4: Cost Benefit Analysis Summary INDIA Karnataka Urban Water Sector Improvement Project
NPV (Rs. Million)
Priority investments Belgaum 8.3 Gulbarga 54.7 Hubli-Dhanvad 114.0
Demonstration zones (coping costs 25.7
Summary of Benefits and Costs:
IRR
13% 16% 21% 14%
This Annex describes variables and assumptions used to calculate the project’s economic rate o f return, and refers to the economic model available in the project’s electronic files.
approach) TOTAL
A cost-benefit framework i s used to assess the financial and economic viability, o f the investment component o f the project. With and without project scenarios are defined in order to identify the incremental costs and benefits o f the project, and evaluate the principal economic indicators o f the project, that is, the net present value (NPV) and the internal rate o f return (IRR). Due to the relative openness o f India’s economy, no macroeconomic conversion factors have been used to convert financial to economic flows -- the Standard Conversion Factor has been conservatively set at 1.0. However, a sectoral conversion factor has been applied for power costs, because prevailing prices do not reflect the hll cost o f energy. The analysis i s modeled over 15 years @eriod 2004-2020). The cash flows are discounted using a discount rate o f 12 percent which i s assumed to be a proxy o f the opportunity cost o f capital in India and which i s also the Bank’s typical hurdle rate for water and sanitation projects. Project costs are detailed in Annex 2 above.
202.7 16%
Consistent with good practice, the analysis assesses the incremental costs and benefits o f the sub-projects individually. Key sub-components have also been subjected to the least-cost test as part o f engineering designs, including a review o f alternatives
In the base scenario, the net present value o f the project i s Rs. 202.7 millions. The internal rate o f return i s 16%, above the discount rate. Because economic benefits have not been fully quantified, notably health benefits and increases in property value, this rate i s probably an underestimate, therefore demonstrating the economic viability o f the project.
- 4 6 -

1. Sector Development and TA (Components A. 1 and 2)
The net benefits o f this component are difficult to quantify but are expected to be positive. Sector development activities, if successfully implemented, will provide the necessary foundation and support for sector reform at both the State and the ULB level, which should ultimately translate into more sustainable investments and better water supply & sanitation services. Tangible economic benefits should results from the implementation o f sector reform by leveraging capital investments. This component has not been included in the cost-benefit analysis, which implies that incremental benefits are expected to equal incremental costs.
2. Prioritv investments (Component Bl.)
The two main economic benefits derived from the priority investments are:
. An increase in the bulk supply o f water to all 4 o f the cities involved, resulting in higher per
- Power savings resulting from more efficient pumping and network redesign. capita availability; and
For all ULBs, the value o f water i s estimated at Rs. 10/m3 (USD 0.22/m3), which i s derived from the current l ow price o f Rs. 50 per connection per month and the current water consumption level (about 5 m3 per month per connection). I t should be noted that, according to the household survey, more than two-thirds o f households are supplementing their water needs with the purchase o f tankered water at a cost o f Rs. 50-100/m3, which reveals a high willingness-to-pay for basic water needs (on the le f t o f the demand curve). While no demand curve could be constructed due to lack o f data, the above information shows that it i s l ikely that the use o f the current effective price (Rs. 10/m3) as a proxy o f the value o f water i s an underestimate. A more detailed assessment, to be conducted during implementation and measuring users' response to expected improvements, should provide an improved assessment and understanding o f the demand for water services. This would be key to a better design o f the follow-on project.
la. Belgaum
In Belgaum, investments will include the replacement o f 28.4 km o f leaking pipelines for the Rakkasakoppa and Hidkal schemes, 1.8 km o f feeder mains, and the erection o f centrifugal Pumps.
The expected benefits from the project are an additional 10 Mld supplied to Belgaum due to the reduction o f leakages, bottlenecks and more efficient pumping. Incremental pumping costs are not assumed to be significant as increased pumping would be offset by efficient gains in terms o f energy use per volume o f water (due to the replacement o f pumps) and unit o f water delivered per unit o f water produced (due to the replacement o f pumps).
With total investment costs o f Rs. 227.6 mil l ion (base cost), and the value o f water delivered in Belgaum at Rs. 10 / m3 (see details above), the NPV would be Rs. 8.3 million, and the IRR 13%.
- 47 -

lb . Gulbarga
In Gulbarga, investments will focus on the Bhima scheme which i s the only perennial, secure supply o f water. The Bhosga source o f water to the city has proved extremely unreliable and i t has not been possible to source any water from it for the last 3 years. The Bennithora scheme has limited potential for further extension.
Investments will include the rehabilitation o f the Bennithora transmission main (10.5 km), resulting in a saving o f about 3 Mld, and the construction o f a second pumping main for the Bhima scheme (19.2 km), which will upgrade its capacity from 12.5 Mld to 50 Mld, and reduce the risk for Gulbarga to rely on this dilapidated main for a large proportion o f i t s supply. For the Bhima scheme, new pumps will also be commissioned, and additional filter units will be constructed at the treatment plant to increase capacity.
The expected benefits of the project are an additional 12 Mld supplied to Gulbarga due to the reduction o f leakages. More benefits are expected from the additional capacity but the analysis conservatively estimates that out o f the total 37.5 Mld available only 10 Mld will be put to use.
With total investment costs o f Rs. 326.1 mil l ion (base cost), and the value o f water delivered in Gulbarga at Rs. 10 / m3 (see details above), the N P V would be Rs. 54.7 million, and the IRR 16%.
IC. Hubli-Dharwad
Both Hubli and Dhanvad are suffering far worse restrictions on their water supply than either Belgaum or Gulbarga, once in 7 days compared with once in 2 days for the latter two cities.
The main element o f the project consists o f the construction o f a separate main (23 km) which will by-pass the city o f Dhanvad, avoid an existing length o f main from Dharwad to Hubli which currently acts as a throttle on the amount o f water that can be passed to the city, thus increasing the water supplied to Hubli from the present 38 Mld to 49 Mld.
A t present this flow i s pumped to a high level reservoir in Dhanvad and then gravitated down to Hubli - t h i s unnecessary pumping head resulting in excess power. The by-pass main will save on the power needed to pump the water to Hubli - estimated to amount to an annual saving o f 3.8 mil l ion KWh, or Rs. 19 mil l ion annually (assuming an economic cost o f bulk energy o f Rs. 5 / KWh).
In addition, the project will include the construction o f 5 feeder mains within Hubli to overcome bottlenecks on the system feeding the distribution networks from the new transmission main.
With total investment costs o f Rs. 270.1 mil l ion (base cost), the value o f the additional 1 1 Mld delivered in Hubli at Rs. 10 / m3 (this water would be used immediately, given the severe scarcity conditions in Hubli), and total energy savings of Rs. 19 million, the N P V would be Rs. 114.0
- 48 -

million, and the IRR 21%.
3. Works in citv distribution networks in all 3 ULBs (Component B2.)
The main objective o f this subcomponent i s to provide short term improvements to majority o f the water-stressed users outside the demonstration zones, particularly the hours o f supply per week. Because the exact nature o f these investments has not yet been defined, it i s not possible to derive an ex-ante rate o f return for this subcomponent. However, the identification o f these small-scale investments which will start as a matter o f priority and will result from network surveys and modelling, mainly to locate the major bottlenecks. Given the limited budget available for these immediate works in the city networks, before more substantial interventions can be designed and implemented in a follow-on project, their selection and prioritization will be done according to a set criteria (see details in Annex 2 above). The selection criteria will include both cost-effectiveness (have the least cost per unit savings in physical losses) and cost-benefit criteria (show a positive net benefit based on the increased volume o f water distributed). If this economic criteria i s used, investments under this subcomponent are expected to have at least a positive NPV. I t i s therefore assumed that works in city distribution networks wil l at the minimum have a neutral impact on the overall economic rate o f return o f the project.
4. Demonstration areas (Component B3.)
The benefits from converting to continuous, fully pressurized systems (“24/7 supply”) are well established. They include:
considerable risk to health substantially reduced operational techniques can be used to influence water supply and demand
* distribution system i s not subjected to unnecessary stress . improvement o f the household economy . much less customer inconvenience
Investment and operation costs were estimated on the basis o f Scenario 2 in the engineering study, which includes: (i) base costs to establish the demo zone; (ii) replacement o f 50% o f service connections; (iii) replacement o f 40% o f the existing distribution network; and (iv) new meters installed at 100% o f the connections. The total number o f beneficiaries (based on existing connections) i s about 20000 households.
Two different methods were used to assess the economic benefits o f this subcomponent: (i) the stated preference approach, using the stated incremental willingness-to-pay for the level o f service (24/7) proposed as a proxy o f the net benefits, and (ii) the revealed preference approach, using the value o f the coping costs that are expected to be offset by the introduction o f 24/7 as a measure o f the net benefits.
j‘i) Willingness-to-pay (WTP) approach. The household survey carried out for the social assessment indicates that on average households would be willing to pay an extra Rs. 125 per connection per month for 24/7 service. The NPV for all the zones would be minus Rs. 156.7
- 49 -

mil l ion and the IRR 2%.
(ii) Coping costs approach. The household survey revealed that on average households spend Rs. 250 per month in coping costs, mainly to supplement their water needs with water from tankers, water vendors and other sources (e.g. tubewells and pumps), and spend significant amount o f time
fetching water. About a third o f households have made substantial investments in building sumps and roof tanks, while most o f the remaining 2/3 have invested in d r u m s and vessels. Other coping costs that were not fully assessed in the household survey include health costs, loss o f amenity reflected in lower property values, etc. These would be studied in more detail through the demand assessment/monitoring which will be carried out during project implementation. They are not included in the present analysis because o f the difficulty in carrying out an ex-ante analysis and predicting impacts with a sufficient degree o f confidence. Assuming that coping costs to supplement water needs wil l be fully offset by the introduction o f 24/7 service, the NPV would be Rs. 25.7 mil l ion and the IRR 14%.
The significant differences found in the use o f either method are not entirely surprising. Indeed, willingness-to-pay i s stated on the basis o f incomplete information on the real coping costs incurred, and a certain skepticism as to whether the promised level o f service (that would reduce or even offset certain coping costs) will materialize. This i s actually why the Government o f Karnataka selected this gradual approach, starting with a pilot l imited to about 10% o f the population -- to demonstrate and convince the majority that a move to world-class service i s indeed feasible, and generate support -- including for higher user charges -- for a scaled-up project, in the rest o f the ULBs and elsewhere in the State.
In addition, a substantially lower rate o f return would be expected for a demonstration project compared to the future, scaled-up citywide phase. The main reason i s that the Operator-Consultant fixed costs (mainly expatriate staff) are disproportionately high for a demo project -- it doesn't take much more expatriate inputs to run an entire system with 30000 connections that a demo zone almost 10 times smaller.
- 50 -

Main Assumptions:
Base scenario Investments costs increase bv 20% (mior i tv investments)
The key assumptions have been included in the above text describing the analysis:
NPV IRFt 202.7 16%
54.9 13%
Sensitivity analysis / Switching values of critical items:
Coping costs 50% smaller than expected (demo zones) Energy savings reduced by 50% (priority investments)
Sensitivity tests have been carried out on the critical variables. The values o f these variables will be monitored during supervision as better quality information becomes available. The results, presented in the table below, indicate a relative robustness o f the rate o f return. Some key project risks, however, are o f commitment to reform / political nature and cannot be adequately measured in a conventional cost-benefit analysis.
20.3 12% 145.9 15%
IInvestments/O&M costs increase bv 50% fdemo zones) I 56.31 13%1 I Investments costs increase b v 20% (orioritv) and 50% (demo) I -91.61 11OA I Value o f water i s reduced bv 20% (mior i tv investments) I 46.91 13%1
- 51 -

Annex 5: Financial Summary INDIA: Karnataka Urban Water Sector Improvement Project
Overview
One o f the development objectives o f the Project i s to improve urban WSS services in the participating ULBs and demonstrate that sustainable, efficient, and commercially-oriented service provision can be achieved. Financial sustainability i s one o f the key factors that would contribute to such a goal, and requires significant attention, as the historical /current financial performance o f the sector has been very poor.
According to the Urban Drinking Water and Sanitation Policy Statement of GoK, “Given that potable piped water i s expensive, it i s necessary for natural resource sustainability and commercial viability o f operations to recover from the users the cost o f providing this service . The longer te rm objective i s to establish an appropriate cost recovery mechanism through adequate tariff to ensure that revenues cover operation and maintenance (O&M) costs, debt service plus a reasonable return on capital”. However, reaching such full cost recovery level even in the long term can be an enormous challenge for the ULBs o f Kamataka, as they currently cover only a small portion o f their O&M expenses through tariff revenues. Subsidies and grants for the service providers will therefore continue to be needed in the medium term, but the focus should be more on targeting the poor and providing sanitation.
In keeping the long term full cost recovery goal in mind, a step-wise approach would need to be taken to facilitate the reform process and address the numerous issues along the way. With regards to financing o f the sector at the state level, the Project envisages to assist GoK in carrying out among other studies, the state sector development strategy/action plan, including detailed fiscal allocation o f state. With regards to ULB level reform, the Project envisages to assist the participating ULBs through the following studies:
Ring-fencing the WSS Operations: Assistance will be given to the ULBs separate their WSS accounts from rest o f the municipal services using the workbook developed during project preparation. As a first step, record keeping o f the operating revenues and expenses will be done separately for the WSS activities. WSS accounts for the demo zones will be recorded separately as well. Capacity building o f 2-3 municipal staff in each ULB on basic accounting o f WSS services will be also conducted.
Improvement in WSS Billing and Collection: Assistance will be given to the ULBs to improve their billing and collection system. A computerized customer database system wil l be created and ways to improve the ULBs’ billing and collection performance will be suggested and implemented. This will be done in coordination with the computerization project undertaken by GoK, through KUIDFC. Billing and collection information for the demo zones will be recorded separately from rest o f the zones as well, as they would adopt a volumetric pricing system based on metered consumption.
Defining the WSS Tariff Structure: An additional task will be included in the proposed
- 52 -

study, “Water and Sanitation Sector Investment and Tarif f Frameworks”. In the context o f formulating the state tariff policy/structure/guidelines, an appropriate tariff structure, including the volumetric tariff structure and rates in the demo zones will be developed for each participating ULB. Attention will be given to target cost recovery levels, subsidy policy, awareness creation o f the new tariff structure, and willingness to pay by the poor, etc.
Ring-fencing the WSS Operations
Currently, a typical municipality operates the water supply services through its water department which invests, operates, and maintains the water related assets, while the health department covers sanitation services and the revenue department bills and collects the WSS related tariffs and taxes. In many cases, KUWSDB i s also involved not only with regards to assets creation, but also in performing O&M activities, due to the poor capacity o f the municipal water departments. This arrangement o f recording the WSS related revenues and expenses in various departments within and outside o f the municipality makes it difficult to provide a clear overview o f the financial situation o f their WSS operation.
The cost recovery data and the level o f subsidies flowing into the WSS sector in Karnataka are also very difficult to measure, as there are many recorded and unrecorded subsidies in the accounts, and the ULBs are not accustomed to separating the WSS accounts from rest o f the municipal services. The cash-based, single-entry accounting system widely used in the state does not provide sufficient information for constructing balance sheets and income statements. Moreover, the little information obtained from the existing accounts indicates that there i s no information on the existing municipal assets, and the recorded financial data i s often inconsistent and unreliable.
In order to find out the historical and current cost recovery levels for WSS sector, a workbook has been developed during project preparation to ring-fence the WSS accounts from rest o f the municipal services. Using the methodology outlined in the workbook, WSS financial statements for the past three years have been constructed by an independent accountant using the existing data obtained from the municipalities, KUWSDB, and KPTCL (attached at the end o f th is section). As mentioned above, construction o f the balance sheet, income statement, and cash flow statement i s very difficult due to lack o f key information on assets etc. However, this effort i s envisaged to continue during project implementation by building the capacity o f the municipal managers to systematically record WSS related transactions in a separate format.
Currently, there i s a state wide project undertaken by GoK to computerize the municipal accounts o f Kamataka. The modules that include the following: (i) registration o f births & deaths; (ii) trade license; (iii) water supply billing & collection; (iv) property tax; and (v) municipal accounting, have been developed and feedback from the municipalities are being incorporated. To change the municipal accounting system, computerize it, and build municipal capacity to use them effectively would be a challenging task which may take a long time. Therefore, the Project plans to initiate the separation o f accounts by only recording the WSS activities in a simple spreadsheet, so that the data can later be merged into GoK’s computer project once it i s in effect. This activity will fall under the sub-component A 2 o f the sector development component and be implemented in
- 53 -

close coordination with GoK's project to maintain consistency o f the accounting programs in the state.
Two to three staff in each municipality will be trained to reconstruct the financial statements for the WSS operations by separating the accounts related to WSS for the past years following the double entry accounting system. The staff who have leamed to separate WSS accounts will be assigned to continue the recording o f the WSS transactions on a daily basis to develop separate financial statements for the WSS operation in a computerized system. Such strengthening o f the financial management system would enable the municipalities and GoK to accurately estimate the sector budget, maintain transparency o f WSS-related revenues and costs, and monitor the project performance indicators.
Improvement in WSS Billing and Collection
Another key activity to be included in the sector development component o f the Project i s the improvement o f WSS billing and collection performance for the three participating ULBs. As indicated in the table below, the bill collection rate in the past four years has been deteriorating for Hubli-Dhanvad, from 80% in FY98/99 to 37% in FY01/02, while it has remained in the range o f 49-59% for Belgaum, and 28-35% for Gulbarga. The Project envisages to improve the collection performance through introducing a computerized system (as described below) and by creating incentives for the OC, who will be managing the demonstration projects. The bill collection target set for al l the demonstration zones i s 70% and this performance target has been given a 20% weight for determining the overall success o f the demonstration zone. The weighted average o f the indicators (details under section A2, Key Performance Indicators) would need to reach 75% or higher for being success.
Table: Historical Bill Collection Rates
Hubli-Dharwad Belgaum Gulbarga 1997- 1998 70% 56% 41% 1998- 1999 80% 49% 32% 1999-2000 76% 51% 28% 2000-200 1 63% 59% 35% 200 1-2002 37% 53% 30%
The GoK funded computerization project described in the previous section includes an Oracle-based billing and collection system. An early introduction o f th is computerized billing and collection system would facilitate monitoring o f the WSS bills o f the customers and their payment records.
As a f i rst step, an electronic customer database will be created in each ULB by putting the existing manually recorded customer information in the computers. Consultants will be hired to assist the ULBs in finalizing this database and to implement electronic recording o f h tu re bills and payments. Initially, the bills for al l domestic customers will be identical, as the ULBs charge them the same flat rate. However, once the continuous water supply i s achieved and metering i s completed, volumetric tariffs will be adopted in the demonstration zones. The computerized
- 54 -

billing and collection system will enable recording o f the demo-zone bills which will be different for each consumer depending on their consumption level, and have a more frequent billing cycle. I t i s also expected that the billing and collection system will be linked electronically to various collection centers as well as the ULBs' ring-fenced accounting system for WSS operations.
In addition to the introduction o f the computerized billing and collection system, the Project envisages to develop various measures for improving the bill collection performance in each ULB. The exact methodologies wil l be selected by the municipal managers and the consultants, but they could include: (i) efforts to remind the customers o f their dues, including advertisement in newspapers and microphone announcements of customers with accumulated arrears; (ii) performance incentive system for the municipal staff in charge o f billing and collection; and (iii) enforcement o f disconnection o f the accounts.
Defining the WSS Tariff Structure
In 1996, Hubli-Dhanvad had introduced a volumetric tariff system that sets rates for each cubic meter o f water used, depending on the consumption level and consumer class. However, this system has not been implemented for many years due to the severe drought and inefficient service, resulting in non-functioning o f meters. Therefore, all three ULBs are currently applying fixed tariff rates for the various groups o f consumers. Hubli-Dharwad and Gulbarga charge annual rates o f Rs. 540 for domestic consumers, Rs. 1,080 for non-domestic, and Rs. 2,160 for commercial customers. Belgaum has increased i t s tariff in FY 02/03 by 78% for domestic to Rs. 800, and tripled the rates for non-domestic and commercial consumers, to Rs. 9,000 and Rs. 15,000 respectively. If i t i s assumed that an average household consumes 15 liter per month, the per l iter rate for domestic customers would correspond to Rs 3 ($0.06) for Hubli-Dhanvad and Gulbarga, and Rs 4.4 ($0.09).
Table: Annual Tariffs Charged in FY01/02 (Rs)
Domestic Non-domestic Commercial
Hubli-Dhanvad Belgaum (New Tar i f f Gulbarga
540 450 (800) 540 1,080 3,000 (9,000) 1,080 2,160 5,000 (15,000) 2,160
effective FY02103)
The Sector Development component o f the Project will assist GoK and the ULBs to develop sound tariff policies at the municipality level and a volumetric tariff system in the demonstration zones. In addition to following the long run marginal cost method set by GoK policy, the new volumetric tariff structure will be incorporating: (i) the cost recovery target, based on the financial analysis; and (ii) the needs o f the poor and low income groups o f the population, based on the social assessment and willingness to pay studies. Charging the consumers for the quantity o f water they have consumed would not only introduce fairness to the tari f f structure, but also facilitates the monitoring and planning o f the water production, as they can be derived from the true demand and consumption. To facilitate the transition and to gain support from the sector stakeholders, implementation of the new volumetric structure will be adopted only after the continuous water supply has been achieved, accompanied with communication campaigns and
- 55 -

social awareness work.
In summary, the following methodology and principles will be used for water pricing in the demonstration zones: (i) There will be carefid transition to volumetric pricing by using both flat rate and volumetric
billing in parallel for a few months, accompanied with social intermediatiodcommunication activities;
actually paying now for 30 lpcd. The detailed tariff structures in the demonstration zones will be finalized by June 30,2005;
(ii) The volumetric rate will be at least Rs. 10/m3, which corresponds to what the users are
(iii) Connection subsidy policy will also be examined; and (iv) Init ial target for the tariffs will be to cover no less than 50% o f O&M costs and progressively
increases to no less than 80% O&M costs by the end o f this project.
In the rest o f the ULBs, there will be a step wise tariff increase along with service improvements resulting from the priority/distribution network investments.
Financial Summary o f the three ULBs’ WSS Operations
During project preparation, data has been collected to get an overview o f the financial health o f the participating ULBs, as well as their WSS operations. Currently, the municipalities follow the procedures contained in the Karnataka Municipal Accounts code and maintain records o f transactions entered and compile the monthly abstract o f receipts and expenses from these records. Effective control i s exercised in ensuring that al l expenses are within the budget approved (historical financial statements for the three ULBs are attached at the end o f this section).
Preliminary cost recovery analysis has been conducted by estimating the revenues and expenses for the WSS operations. The total WSS related revenues include water sales revenues, other water and sewerage charges that include taxes, and a deduction o f an estimate o f 2% loss on receivables. The O&M costs for the WSS operations include: (i) power and chemicals which normally amount to 27% - 28% o f total O&M expenses for Belgaum and Gulbarga, and 34% for Hubli-Dhanvad; (ii) salaries and wages, which are calculated by estimating the number o f municipal staff and their time spent on WSS operations; (iii) repair and maintenance, which could be underestimated given the poor capacity at the municipal level to maintain their assets properly; (iv) supply o f bulk water charges from KUWSDB; and (v) other costs. Total costs would include estimated depreciation o f 5% and interests on loan and bulk water supply. O&M cost recovery i s calculated by dividing the total revenue with O&M costs. Full cost recovery i s calculated by dividing the total revenue with total WSS related costs, including O&M, depreciation, and debt service.
Results o f the analysis show that the total WSS related revenue cover 87% o f the related expenses for Hubli-Dhanvad, 83% for Belgaum, and 48% for Gulbarga. However, these cost recovery indicators are misleading, as the numerators include all forms o f grants from the state, including SFC grants, share o f salaries, grants adjusted by KUWSDB and KPTCL, which are categorized as revenue in their accounts. If these grants and subsidies are excluded from the revenue figures, the O&M cost recovery from WSS related revenues (tari f fs and water & sanitation tax) declines to
- 56 -

19% for Hubli-Dhanvad, 39% for Belgaum, and 17% for Gulbarga. If debt service and depreciation costs are taken into account, these figures further worsen to 16% in Hubli-Dhanvad, 24% in Belgaum, and 11% in Gulbarga. Given that the municipal staff lack sufficient sk i l l s and capacity to perform proper repair and maintenance o f the WSS assets, even these cost recovery figures could be concluded to be underestimated.
Table: Cost Recovery Levels for the WSS Operations in FY01/02 HDMC Belgaum Gulbarga
A. O&M cost recovery level in 200112 19% 39% 17% B. Full cost recovery level in 200112 16% 24% 11% C. Full cost recovery including grants in 200112 87% 83% 49%
Note: A. B. C. full cost including
WSS tariff and tax revenues / O&M costs WSS tariff and tax revenues / full cost including O&M, depreciation, and interests WSS tariff and tax revenues plus share of SFC salary, grants adjusted by KUWSDB loan and KPTCL /
O&M, depreciation, and interests
The low tariff levels, poor collection performance, and rising expenses have contributed to widening o f the gap between the revenues and costs for al l ULBs over the years. In addition, sewerage charges are either non-existent or covered under the property tax and diff icult to estimate. Increasing the tariff has been challenging, as any such proposal f iom the municipalities has to go through a process o f approval by the municipal counsels. However, preliminary consumer interviews and surveys conducted in the region (details in section E6 on social aspects) suggest that customers are willing to pay significantly more for better services.
Using the project cost estimates, data collected from the ULBs, KUWSDB, and KPTCL and revenue and cost related assumptions, a simple and preliminary financial model has been constructed to do a back o f an envelope calculation to estimate the level o f tariff increase necessary to achieve cost recovery in the medium to long term (projected income statements for the three ULBs are attached at the end o f this section). Although the analysis i s based on data that could lack reliability and consistency, and a number o f rough assumptions have been used, the preliminary results indicate that two o f the ULBs will remain in deep financial trouble at least for the next ten years.
Table: Annual Tar i f f Increase Necessary to Reach Cost Recovery in Five/Ten Years:
HDMC Belgaum Gulbarga O&M cost recovery by 2007 52% 18% 61% O&M cost recovery by 2012 25% 7% 25% Full cost recovery (incl. depreciation and debt ) by 2007 28% 35% 80% Full cost recovery (incl. depreciation and debt) by 2012 26% 12% 29%
- 57 -

Belgaum, mainly due to its recent tariff increase requires the least drastic tariff increases o f 7% to 18% to reach O&M cost recovery in five to ten years. However, Hubli-Dharward and Gulbarga would require significant tariff increases, ranging from 25% to 61% annually to reach O&M cost recovery in five to ten years. Hubli-Dharwad and Belgaum will continue to be in a huge financial deficit that would require state subsidies for the foreseeable future, even if minor tariff increases would take place.
Through its sector development components and improvements in service delivery (investment component 2), the Project aims to strengthen the management o f the WSS operations and introduce operational efficiency to improve the financial health o f the ULBs. Since it i s difficult and complex to monitor the financial statements o f the entire ULBs’ WSS operations due to lack o f reliable baseline data and systematic recording o f the accounts performance targets have not been established for the whole geographical area served by the ULBs. However, establishment o f such indicators are expected to be the conditions for any follow on operations.
Project’s Financial Impacts and Long Term Vision
Through implementing the Project’s priority investments, visible improvements in WSS service delivery i s expected to be achieved, including: (i) increased hours o f water supply service; (ii) more equitable supply across different areas in each participating ULB; and (iii) broader access to sanitation facilities (including in the slums). These improvements are expected to form as grounds for the ULBs to increase the WSS tariffs for all beneficiaries and thereby improve the WSS cost recovery levels. To ensure that the investments made will be sustainable in the future, i t would be crucial to secure commitment from the ULBs to adopt a financially, economically, and socially sound pricing structure along with improvements in service delivery.
The demonstration project that i s planned to be implemented in four zones o f the three ULBs envisages to demonstrate that 24-hour continuous supply i s achievable and to show the benefits-health, technical, operational and commercial-it brings. Continuous supply would enable full metering o f consumption, which would make the adoption o f volumetric tariffs possible. This i s in line with the state policy which states that “in a realistic time frame o f about five years, efforts wil l be made and ULBs encouraged to achieve 100% metering and volumetric pricing based on long run marginal costs”.
In the long run, GoK considers PPP to be one o f the key options to help bring institutional reforms and to achieve increased operational efficiency and revenue generation. The Project envisages to introduce transparency into the WSS sector’s financial statements, adopt a sound tariff level for the participating ULBs, and introduce a volumetric system for metered clients, which would create an enabling ground for better management and commercial orientation for the provision o f WSS services in the ULBs. Such developments are expected to lay the grounds for successful implementation o f a possible future PPP contract, which will be studies under the Project’s sector development component.
- 58 -

Municipal Financial Statements
Comparison of Budget VS Actual: Hubli Dharwad Municipal Corporation
Particulars 1999-2000 2000-2001 2001-2002 Budget Actual Budget Actual Budget Actual
Receipts Taxes Fees Miscellaneous Grants Total of Receipts
Expenses Pay and Allowances Contingency Pension & Gratuitty Ma jo r Works Other Works Water Supply Health Department Electrical (Lighting Department) Interest on Repayments Miscellaneous & Other Exps Social Welfare and Weaker section 0 253.15 0 245.18 0 96.89 Total of Expenses 6003.94 4236.51 6036.65 6058.98 6588.29 4637.89 SurplusKleficit (438.15) (122.16) 1523.07 107.19 164.82 (508.29)
Data extracted f rom Municipal i ty Records and respective year's Budget documents The diff. Betw. the receipt and payment is due to non inclusion o f opening and closing balance o f the bank
- 59 -

Comparison of Budget VS Actual: Belgaum Municipal Corporation
951 128.95 43 1.25 233.8
1312.5 3057.5
I Particulars
546.96 937 61.56 124.5 78.14 354.87
148.18 276.06 1862.01 1769.5
2696.85 3461.93
Receipts Taxes Fees Capital receipts Miscellaneous Receipts Grants and Contribution Total of Receipts
Expenses Pay and Allowances Pension and Gratuity Ma jo r Works Other Works Water Supply Helath /Hospitality Lightings Miscellaneous and Other Exps Social and Welfare exps I Total of Expenses
947 142.97 141.08 191.1 2106
3528.15
ISurolus/Deficit
545.62 75
72.59 164.07
1725 2582.28
1999-2000 2000-2001 2001-2002 Ludget ]Actual ]Budget ]Actual IBudget IActual
I 553.26 66.97 69.91
142.83 1968.66
2801.63
839.4
96.45
201.7 136.3
2906.95 150.55
978.57 169.95 311.51
17.21 715.41
89.47 223.35 102.15 135.15
-45.92 23.46
256.67 293.62
13.86 746.66
140.1 210.94 92.16
138.59
43.03
1072.5
161.7
157.4 158.02
3359.22 168.93
SourcesBasis of Data 1. Data extracted from Municipal i ty Records and respective year's Budget documents 2. The diff. Betw. receipt and payment i s due to non inclusion o f opening and closing balance o f the bank
- 60 -

Particulars
Receipts Municipal Rates & Taxes Fees Miscellaneous Reciepts Grants & Contributions
TOTAL OF RECEIPTS
Expenses Pay and Allowances
Major Works Water supply Lightning Publi Helath Miscellaneous Scocial welfare TOTAL OF EXPENSES
Pension & Gratuity
- 6 1 -
1990-2000 2000-2001 2001-2002 Budget Actual Budget Actual Budget Actual
478.71 179.46 676.79 207.52 690.50 252.37 180.00 108.96 202.00 223.89 253.00 133.87 190.20 39.34 263.05 54.18 205.35 54.07
1336.50 1049.59 1451.50 934.99 1590.00 1211.82
2185.41 1377.35 2593.34 1420.58 2738.85 1652.13
534.15 519.35 538.57 528.42 1473.31 454.58 0.00 0.00 0.00 0.00 0.00 0.00
419.00 377.14 432.00 401.30 300.00 462.55 0.00 0.00 0.00 109.72 100.00 288.83
170.00 13.43 145.00 58.64 102.00 167.91 211.90 259.67 206.50 104.49 158.05 122.07 195.25 57.44 224.50 19.67 205.00 30.67 189.39 177.94 134.53 185.43 205.00 63.29
1719.69 1404.97 1681.10 1407.67 2543.36 1589.90
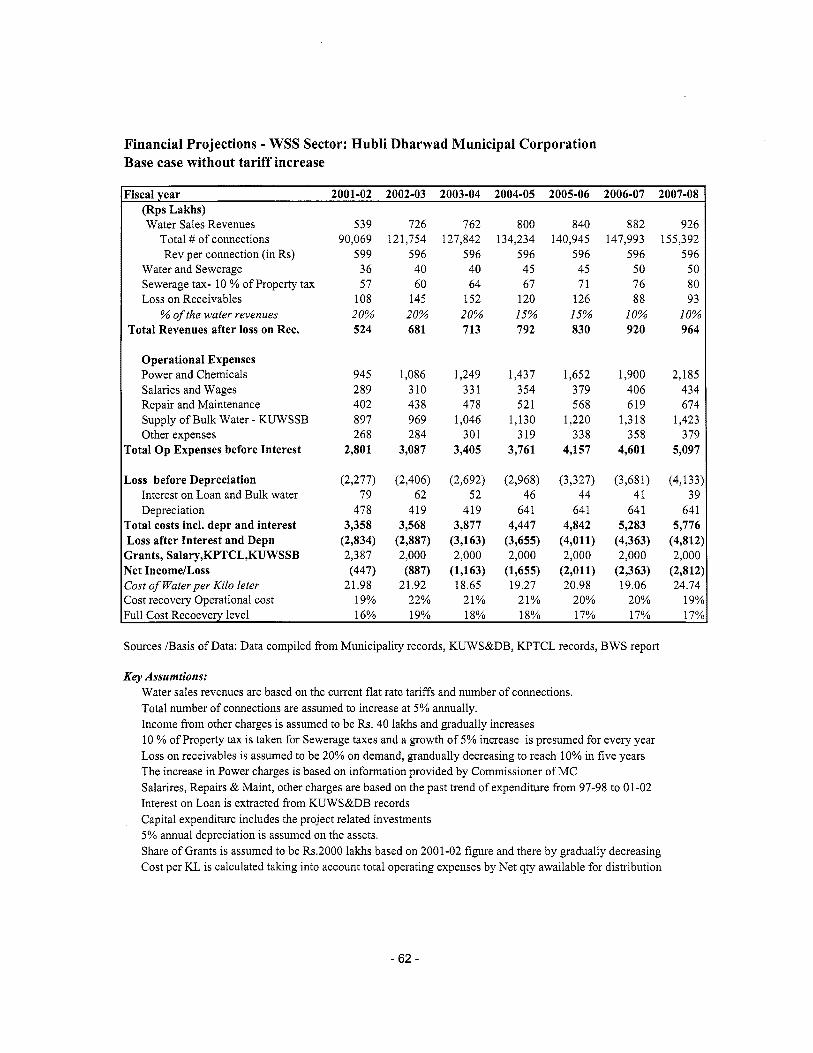
Financial Projections - WSS Sector: Hubli Dharwad Municipal Corporation Base case without tariff increase
Fiscal year 2001-02 2002-03 2003-04 2004-05 2005-06 2006-07 2007-08 (Rps Lakhs) Water Sales Revenues
Total # o f connections Rev per connection (in Rs)
Water and Sewerage Sewerage tax- 10 % o f Property tax Loss o n Receivables
% of the water revenues Tota l Revenues after loss on Rec.
Operational Expenses Power and Chemicals Salaries and Wages Repair and Maintenance Supply o f Bulk Water - KUWSSB Other expenses
rotal Op Expenses before Interest
;ass before Depreciation Interest on Loan and Bulk water Depreciation
rotal costs incl. depr and interest Loss after Interest and Depn ;rants, Salary,KPTCL,KUWSSB Yet IncomeILoss 2ost of Waterper Kilo leter 2ost recovery Operational cost
539 90,069
599 36 57
108 20% 524
726 762 121,754 127,842
596 596 40 40 60 64
145 152 20% 20% 681 713
945 1,086 1,249 289 3 10 331 402 438 478 897 969 1,046 268 284 301
2,801 3,087 3,405
(2,277) 79
478 3,358
(2,834)
(447) 2,387
21.98 19%
(2,406) 62
419 3,568
(2,887) 2,000 (887)
21.92 22%
(2,692) 52
419 3,877
(3,163) 2,000
(1,163) 18.65
21%
800 840 882 926 34,234 140,945 147,993 155,392
596 596 596 596 45 45 50 50 67 71 76 80
120 126 88 93 15% 15% 10% 10% 792 830 920 964
1,437 1,652 1,900 2,185 354 379 406 434 52 1 568 619 674
1,130 1,220 1,318 1,423 319 338 358 379
3,761 4,157 4,601 5,097
(2,968) 46
641 4,447
(3,655) 2,000
(1,655) 19.27
21%
(3,327) 44
64 1 4,842
(4,011) 2,000
(2,011) 20.98
20%
(3,68 1) 41
64 1 5,283
(4,363) 2,000
(2,363) 19.06
20%
(4,133 39
64 1 5,776
(4,812 2,000
(2,812 24.74
19% kll Cost Recoevery level 16% 19% 18% 18% 17% 17% 17%
Sources B a s i s o f Data: Data compiled f rom Municipal i ty records, KUWS&DB, K P T C L records, B W S report
Key Assumtions: Water sales revenues are based on the current f lat rate tariffs and number o f connections. Total number o f connections are assumed to increase at 5% annually. Income f rom other charges is assumed to be Rs. 40 lakhs and gradually increases 10 % o f Property tax i s taken for Sewerage taxes and a growth o f 5% increase is presumed for every year Loss on receivables is assumed to be 20% on demand, grandually decreasing to reach 10% in f ive years The increase in Power charges is based on information provided by Commissioner o f MC Salarires, Repairs & Maint, other charges are based on the past trend o f expenditure f rom 97-98 to 01-02 Interest on Loan is extracted f rom K U W S & D B records Capital expenditure includes the project related investments 5% annual depreciation is assumed on the assets. Share o f Grants is assumed to be Rs.2000 lakhs based on 2001-02 figure and there by gradually decreasing Cost per IU is calculated taking into account total operating expenses by Ne t qty awailable fo r distribution
- 62 -

Financial Projections - WSS Sector: Belgaum Municipal Corporation Base case without tariff increase
'iscal year 2001-02 2002-03 2003-04 2004-05 2005-06 2006-07 2007-08 (Rps Lakhs) Water Sales Revenues
Total # o f connections Rev. per connection (in Rs)
Water and Sewerage Sewerage tax- 10 % o f Prop. tax Loss on Receivables
% of the water revenues Total Revenues after loss on Rec.
Operational Expenses Power and Chemicals Salaries and Wages Repair and Maintenance Supply o f Bulk Water - K U W S S B Other expenses
'otal Op. Expenses before Interest
,oss before Depreciation Interest on Loan and Bulk water Interest on Power charges Depreciation
'otal costs incl. Depr. and interest Loss after Interest and Depn irants, Salary,KPTCL,KUWSSB Jet Incomenoss Operational cost per KL :ost recovery Operational cost
180 30,334
594 131 31 36
20% 306
215 202 105 260
10 792
(486) 237
3 253
1,285 (979) 763
(217) 6.99 39%
386 30,798
1,254 130 32 77
20% 471
226 212 107 273
11 828
(357) 224
253 1,305 (834) 700
(134) 7.10 57%
406 32,338
1,254 130 34 81
20% 488
226 222 109 286
11 855
(367) 212
253 1,319 (831) 700
(131) 6.42 57%
426 33,955
1,254 130 36 64
15% 527
238 234 111 301
11 894
(367) 199
253 1,346 (8 18) 700
(118) 6.55 59%
447 35,653
1,254 130 37 67
15% 547
249 245 114 316
11 935
(388) 186
439 1,560
700
7.59 59%
(1,012)
(312)
469 37,435
1,254 130 39 47
10% 592
262 257 116 331
11 978
(387) 173
439 1,590
700
6.70 60%
(998)
(298)
493 39,307
1,254 130 41 49
10% 615
275 270 118 348
12 1,023
(409: 160
439 1,622
(1,007: 700
(307: 6.84 60%
'ull Cost Recovery level 24% 36% 3 7% 39% 3 5% 37% 38%
Sources /Basis o f Data: Data compiled f rom Municipal i ty records, KUWS&DB, KPTCL records, B W S report
Key Assumtions: Water sales revenues are based on the current f lat rate tariffs and number o f connections. Total number o f connections are assumed to increase at 5% annually. Income f rom other charges is assumed to be Rs. 130 lakhs over time. 10 % o f Property tax is taken for Sewerage taxes and a growth o f 5% increase is presumed for every year Loss on receivables is assumed to be 20% on demand, grandually decreasing to reach 10% in f ive years The increase in Power charges is based on information provided by Commissioner o f M C Salarires, Repairs & Maint, other charges in are based on the past trend o f expenditure f rom 97-98 to 01-02 Interest o n Loan is extracted f rom K U W S & D B records Capital expenditure includes the project related investments 5% annual depreciation is assumed on the assets. Share o f Grants is assumed t o be Rs.700 lakhs based on 2001-02 figure. Cost per KL is calculated taking into account total operating expenses by N e t qty awailable for distribution
- 63 -

Financial Projections - WSS Sector: Gulbarga Municipal Corporation Base case without tariff increase
'iscal year 2001-02 2002-03 2003-04 2004-05 2005-06 2006-07 2007-08 (Rps Lakhs) Water Sales Revenues
Total # o f connections Rev. per connection (in Rs)
Water and Sewerage Sewerage taxes- 10 % o f Property tax Loss on Receivables
% of the water revenues Total Revenues after loss on Rec.
Operational Expenses Power and Chemicals Salaries and Wages Repair and Maintenance Other expenses
'otal Op Expenses before Interest
,oss before Depreciation Interest on Loan and Bulk water Depreciation
'otal costs incl. Depr. and interest Loss after Interest and Depn irants, Salary,KPTCL,KUWSSB Jet IncomefLoss Operational cost per KL lost recovery Operational cost
126 167 176 22,614 30,359 31,877
555 552 552 28 35 35 10 10 11 25 33 35
20% 20% 20% 139 179 187
230 252 278 114 122 131 339 370 403 150 153 156 834 898 968
(695) 259 192
1,285
486
15 17%
(1,146)
(660)
(719) 25 1 199
1,348 (1,168)
200 (968)
16 20%
(782) 242 199
1,409 (1,223)
3 00 (923)
15 19%
185 194 204 214 33,471 35,144 36,902 38,747
552 552 5 52 552 35 35 35 35 11 12 13 13 28 29 20 21
15% 15% 10% 10% 203 212 231 241
306 336 370 407 140 150 161 172 439 479 522 5 69 160 163 166 169
1,045 1,128 1,218 1,317
(841) 234 199
1,477
500
8 19%
(1,274)
(774)
(9 16) 225 439
1,792
500
10 19%
(1,580)
(1,080)
(987) 216 439
1,874 (1,643)
500 (1,143)
11 19%
(1,076 208 439
1,964 (1,723
500 (1,223
11 189
'ill cost recovery level 11% 13% 13% 14% 12% 12% 129
Sources /Basis o f Data: Data compiled from Municipality records, KUWS&DB, KPTCL records, BWS report
Key Assumtions: Water sales revenues are based on the current flat rate tariffs and number o f connections. Total number o f connections are assumed to increase at 5% annually. Income from other charges i s assumed to be Rs. 35 lakhs over time. 10 % o f Property tax i s taken for Sewerage taxes and a growth o f 5% increase i s presumed for every year Loss on receivables i s assumed to be 20% on demand, grandually decreasing to reach 10% in five years The increase in Power charges i s based on information provided by Commissioner o f M C Salarires, Repairs & Maint, other charges are based on the past trend o f expenditure from 97-98 to 01-02 Interest on Loan i s extracted from KUWS&DB records Capital expenditure includes the project related investments 5% annual depreciation i s assumed on the assets. Share o f Grants i s assumed to be Rs200 there by gradually increasing Cost per KI, i s calculated taking into account total operating expenses by N e t qty awailable for distribution
- 64 -

Annex 6(A): Procurement Arrangements INDIA: Karnataka Urban Water Sector Improvement Project
Procurement
A. Institutional Capacity/ Readiness:
The project will be implemented by Karnataka Urban Infrastructure Development Finance Corporation (KUIDFC), a company registered under the Companies Act, and fully owned by the Government o f Karnataka (GoK). KUIDFC wil l have the overall responsibility for handling all the Procurement under the Project. The procurement o f Goods and Works under Priority Investment Component (B 1) will be handled by KUIDFC with assistance from Karnataka Urban Water Supply & Drainage Board (KUWSDB). For this component, KUWSDB will assist most o f the process, including the services o f design, technical aspects o f procurement, preparation o f bid documents, preparation o f evaluation bids, participation in the evaluations committee and supervision o f works. KUWSDB has experienced engineers to handle procurement including some engineers who have received procurement training from ASCI, Hyderabad. The evaluation o f bids will be done by the Tender Committee o f KUIDFC which also has a member from KUWSDB. The approval for award o f contract will be granted by the Approval Committee which will have amongst others Secretary (M&UDAS) and Finance Secretary (GoK) as i ts members. I t s other members will be MD, KUIDFC; MD, KUWSDB; Commissioner o f the respective Urban Local Body (ULB) and the Chief Engineer, Rural Development Engineering Department. Bidding documents for the major works to be executed in the f i rst year have been prepared and shared with Bank.
Implementation o f the Works in city distribution networks component (B2) will be handled directly by KUIDFC, except for those related to assuring bulk supply to the Demonstration Projects who will be handled by the Operator Consultant (OC). Because o f i ts nature and possible relation to the works in the demonstration zones, KUIDFC will closely coordinate with the OC. Also, the procurement plan for this component wil l be cleared by the Bank.
For implementing the Demonstration Projects component (B3), KUIDFC will select an Operator-Consultant (OC). The pre-qualification process for selection o f this OC has already started and the application for pre-qualification have been received by KUIDFC and are under evaluation. The OC so selected will prepare the procurement plan for Goods and Works required for implementation o f this component. This procurement plan will be cleared with KUIDFC and the Bank. The procurement o f Goods and Works for this component will then be handled by the OC on behalf o f the KUIDFC following the Bank Guidelines.
The procurement o f the Consultancy Services under al l the Components o f the project will be directly handled by KUIDFC.
The capacity assessment o f KUIDFC was carried out during the project preparation. KUIDFC i s the Nodal Agency o f GoK for implementation and monitoring o f Urban Infrastructure Projects throughout Karnataka. I t does not have any internal procurement ru les and follows the State
- 65 -

Government rules for all state funded projects. In case o f externally funded projects, KUIDFC follows the procurement guidelines o f the funding agencies. Though it i s currently executing two ADB projects, KUIDFC has not handled any World Bank funded project so far.
The procurement set up in KUIDFC will be headed by Assistant General Manager who would be supported by an Assistant Engineer having 7-8 years experience in Procurement. The Assistant General Manager and the Assistant Engineer have both received training for procurement under World Bank funded projects from NIFM, Faridabad and ASCI, Hyderabad respectively.
KUIDFC has already appointed one additional procurement specialist who has earlier worked in World Bank Funded Rural Water Supply Project and is, therefore, conversant with the World Bank procedures and Guidelines. KUIDFC also proposes to appoint at least two more procurement specialists who have procurement experience in the World Bank Funded projects.
With these steps to strengthen i ts capacity, KUIDFC will be able to handle the procurement under the project. However, it will be necessary that KUIDFC imparts training to i t s staff handling Procurement to refresh their knowledge o f the procedures under the World Bank funded procurement.
B. Procurement Methods:
All Goods and Works financed under the Loan shall be procured in accordance with the World Bank's Guidelines for Procurement, January 1995, revised January and August 1996, September 1997 and January 1999. Consulting services to be funded through the Bank's Loan shall be procured in accordance with the World Bank's Guidelines for the Selection and Employment o f Consultants by the Wor ld Bank Borrowers, January 1997, revised September 1997, January 1999 and May 2002. All c iv i l works, goods and services will be procured using India-specific Model Standard Pre-qualification, Biding Documents and RFPs for Bank funded projects. Specific procurement arrangements are summarized in Tables A and Al, and are briefly described below.
Works (US $ 36.69 million)
National Competitive Bidding N C B )
Works relating to "Priority Investment" will include replacementhehabilitation o f existing pipe lines (two contract packages o f estimated value US$4.23 mil l ion and US$2.39 mi l l ion respectively) and addition to treatment plant (US$2.2 million) for Gulbarga; replacement o f existing pipeline and construction o f Ground Level Storage Reservoir in Belgaum (two contract packages o f estimated value US$ 2.8 mil l ion and US$ 2.3 million); providing and laying pipelines and Feeder lines (in three packages o f estimated value US$4.76 million, US$ 0.91 mil l ion and US$0.52 million) in Hubli-Dhanvad. These works will be awarded following NCB procedures as per para 3.3 and 3.4 o f the Guidelines. The maximum value o f one contract i s up to U S $4.76 million. NCB i s considered a preferred method as the works are not l ikely to be o f interest to foreign bidders in view o f the nature & geographical spread o f the works.
- 66 -

Works relating to the improvement o f city distribution networks typically would include those related to elimination o f sections o f pipelines imposing unnecessary throttles on supply, pipe replacement where physical losses are excessively high, network sectorization, augmentation o f the capacity o f tanks and reservoirs andor construction o f new ones, improvements to water quality caused by infiltration o f contaminated groundwater, etc. Works for this component estimated to cost the equivalent o f US$ 100,000 or more per contract will be awarded following N C B procedures as per para. 3.3 and 3.4 o f the Guidelines.
Procurement o f Small Works
The works relating to "Demonstration Zone" estimated to cost the equivalent o f US$ 100,000 or more per contract will also be awarded following NCB procedures as per para 3.3 and 3.4 o f the Guidelines. Works relating to Demonstration Zone, and to the distribution networks estimated to cost less than U S $ 100,000 per contract may: (a) be procured under lump sum price contracts awarded on the basis o f quotation obtained from three (3) qualified domestic contractors in response to a written invitation. The invitation shall include a detailed description o f the works including basic specifications, the required completion date, a basic form o f agreement acceptable to the Bank and relevant drawings where applicable. The award shall be made to the contractor who offers the lowest price quotation for the required work and who has the experience and resources to complete the contract successfully. The exact details o f these works will, however be finalized after the Operator-Consultant i s selected and he finalizes the procurement plan.
Goods (US$2.91 million).
International Competitive Bidding : 0 Goods for "Priority Investment" would include supply and installation o f pumps and
accessories for the three ULBs in two packages o f estimated value US$ 1.01 mil l ion and US$ 0.46 million. These goods will be procured following ICB procedures in accordance with Section I1 o f the Bank Guidelines. Goods for "Demonstration Zone" with estimated cost @ US$ 500,000 and above wil l also be procured following I C B procedures in accordance with Section I1 o f the Bank Guidelines.
0
National Competitive Bidding : Goods estimated to cost less than US$ 500,000 equivalent per contract will be procured following NCB procedures in accordance with provisions o f paragraph 3.3 and 3.4 o f the Guidelines.
National/lrternational Shopping: Goods l ike computers, printers and fax machines etc. estimated to cost US$ 50,000 equivalent and less per contract will be procured following NationaUInternational Shopping procedures in accordance with provisions o f paragraph 3.5 and 3.6 o f the Bank Guidelines.
Consultant Services (US$ 7.82 million).
- 67 -

Consultant services wi l l be procured as follows:
Quality- and Cost-based Selection: Except as otherwise provided consultants’ services shall be procured under contracts awarded in accordance with the provisions o f Section I1 o f the Consultant Guidelines, and the provisions o f paragraphs 3.13 through 3.18 thereof applicable to quality- and cost-based selection o f consultants.
In relation to the preceding paragraph, the short l i s t o f NGOs and consultants for services estimated to cost less than $500,000 equivalent per contract may comprise entirely national consultants in accordance wi th the provisions o f paragraph 2.7 and footnote 8 o f the Consultant Guidelines.
Other Procedures for the Selection of Consultants:
Individual Consultants Services for tasks that meet the requirements set forth in paragraph 5.1 o f the Consultant Guidelines shall be procured under contracts awarded to individual consultants in accordance with the provisions o f paragraphs 5.1 through 5.4 o f the Consultant Guidelines.
Selection Based on Consultants’ Oualifications Services for the establishment o f a Karnataka State Urban Water Supply Council, development o f UWS investment and tariff frameworks, and design and implementation o f the legal and regulatory framework, under Part A. 1 (a), (d) and (e) o f the Project, respectively, estimated to cost less than $100,000 equivalent per contract, may be procured under contracts awarded in accordance with the provisions o f paragraphs 3.1 and 3.7 o f the Consultant Guidelines.
Single Source Selection Legal consultants’ services and services for third party inspection under Parts A. 1 and B. 1 .of the Project, respectively, estimated to cost less than $100,000 equivalent per contract, may, with the Bank’s prior agreement, be procured in accordance with the provisions o f paragraphs 3.8 through 3.1 1 o f the Consultant Guidelines.
Review by the Bank o f Procurement Decisions
1. Procurement Planning
Prior to the issuance o f any invitations to prequalify for bidding or to bid for contracts, the proposed procurement plan for the Project shall be hrnished to the Bank for i t s review and approval, in accordance with the provisions o f paragraph 1 o f Appendix 1 to the Guidelines. Procurement o f all goods and works shall be undertaken in accordance with such procurement plan as shall have been approved by the Bank, and with the provisions o f said paragraph 1. Annual procurement plans would be reviewed by Bank.
- 68 -

2. Prior Review
With respect to each contract for works and Goods estimated to cost the equivalent o f US$ 500,000 or more, the procedures set forth in paragraphs 2 and 3 o f Appendix 1 to the Guidelines shall apply.
3. Post Review
With respect to each contract not governed by paragraph 2 o f this Part, the procedures set forth in paragraph 4 o f Appendix 1 to the Guidelines shall apply.
Consultancy Contracts
Prior review
1. With respect to each contract for employment o f consulting f i rmsht i tu t ions estimated to cost the equivalent o f U S $ 100,000 or more, the procedures set forth in paragraphs 1,2 3 and 5 o f Appendix 1 to the Consultant Guidelines shall apply; and
2. cost the equivalent o f US$ 50,000 or more, the qualifications, experience, terms o f reference, and terms o f employment of the consultants shall be furnished to IDA for i t s prior review and approval.
With respect to each contract for the employment o f individual consultants estimated to
The contracts shall be awarded only after said approval shall have been given.
With respect to each contract not governed by above, the procedures set forth in paragraph 4 o f Appendix 1 to the Guidelines shall apply provided that the generic TORS and short l is ts for critical assignments have been cleared by the Bank.
NCB Provisions
All N C B contracts shall be awarded in accordance with the provisions o f Paragraphs 3.3 and 3.4 o f the Guidelines for Procurement under IBRD Loans and IDA Credits, January 1995, Revised January and August 1996, September 1997, and January 1999. In this regard al l N C B contracts to be financed from the proceeds o f the Loan shall follow the following procedures:
Only the model bidding documents for NCB agreed with Go1 Task Force (and as amended from time to time) shall be used for bidding.
Invitations to bid shall be advertised in at least one widely circulated national daily newspaper, at least 30 days prior to the deadline for the submission o f bids.
0 N o special preference will be accorded to any bidder either for price or for other terms and conditions when competing with foreign bidders, state owned enterprises, small scale
- 69 -

enterprises or enterprises from any given state.
0 Except with the prior concurrence o f the Bank, there shall be no negotiation of price with the bidders, even with the lowest evaluated bidder.
0 Re-bidding shall not be carried out without the prior concurrence o f the Bank. The system o f rejecting bids outside a predetermined margin or bracket o f prices shall not be used in the project.
Extension o f bid validity shall not be allowed without the prior concurrence o f the Bank: (i) for the first request for extension if it i s longer than eight weeks; and (ii) for a l l subsequent requests for the extension irrespective o f the period (such concurrence will be considered by the Bank only in cases o f Force Majeure and circumstances beyond the control o f the Purchaser/Emplo yer).
0 Rate contracts entered into by Directorate General o f Supplies & Disposals, will not be acceptable as a substitute for N C B procedures. Such contracts will be, however, acceptable for any procurement under National Shopping Procedures.
0 Two or three envelope system will not be used.
Procurement Information
Procurement information will be collected and recorded as follows:
(a) (b) Comprehensive periodic reports indicating:
Prompt reporting o f contract award information by KUIDFC.
1. revised costs estimates for individual contracts and total cost; 2. revised timings of procurement actions including advertising, bidding, contracts award and completion time for individual contracts; and 3. compliance with aggregate limits on the specified methods o f procurement,
(c) The Borrower's completion report to be received by the Bank within three months o f the Loan closing date.
- 70 -

Procurement methods (Table A)
1. Works
2. Goods
3. Services
84. Miscellaneous
5. Front-end fee
Table A: Project Costs by Procurement Arrangements (US$ million equivalent)
0.00 32.15 4.54 0.30 36.99 (0.00) (25.72) (3.63) (0.00) (29.35) 1.88 0.00 1.03 0.00 2.91
(1 .88) (0.00) (1.03) (0.00) (2.91) 0.00 0.00 7.82 3.41 11.23
(0.00) (0.00) (6.84) (0.00) (6.84) 0.00 0.00 0.00 0.00 0.00
0.00 0.00 0.40 0.00 0.40 (0.00) (0.001 (0.40) (0.00) (0.40)
(0.00) (0.00) (0.00) (0.00) (0.00)
Total 1.88 32.15 13.79 3.71 51.53 (1.88) (25.72) (11.90) (0.00) (39.50)
I' Figures in parentheses are the amounts to be financed by the Bank Loan. All costs include contingencies.
Includes civi l works and goods to be procured through national shopping, consulting services, services o f contracted staff o f the project management office, training, technical assistance services, and incremental operating costs related to (i) managing the project, and (ii) re-lending project funds to local government units. I t also includes the Loan front end fee.
Figures in above table do not include taxes.
- 71 -

Table A I : Consultant Selection Arrangements (optional) (US$ million equivalent)
" Including contingencies
Note: QCBS = Quality- and Cost-Based Selection QBS = Quality-based Selection SFB = Selection under a Fixed Budget LCS = Least-Cost Selection CQ = Selection Based on Consultants' Qualifications Other = Selection of individual consultants (per Section V of Consultants Guidelines), Commercial Practices, etc. N.B.F. = Not Bank-financed Figures in parentheses are the amounts to be financed by the Bank Loan.
- 72 -

Prior review thresholds (Table 8)
* Demonstration Zone 2. Goods
Table B: Thresholds for Procurement Methods and Prior Review'
. . I
<loo Shopping >500 ICB 1.53 (>.5)
1. Works Priority Investment > 100 NCB I 16.5 (>.5)
<500 but >50 <50
NCB Shopping
3. ServicesFirms
Individual Consultants 4. Miscellaneous 5. Miscellaneous 6. Miscellaneous
>loo As per Bank Guidelines 3.32 (>.l)
< 50 >.05
Total value of contracts subject to prior review: Will be clear only after the procurement plan for Demonstration Zone i s finalized. Present value at US$ 8.7 million.
One every 6 months (includes special procurement supervision for post-reviewlaudits)
Overall Procurement Risk Assessment: Average Frequency o f procurement supervision missions proposed:
*The details will be finalized after Operator-Consultant prepares a procurement plan for Demonstration Zone.
"Thresholds generally differ by country and project. Consult "Assessment o f Agency's Capacity to Implement Procurement" and contact the Regional Procurement Adviser for guidance.
- 73 -

Annex 6(B): Financial Management and Disbursement Arrangements INDIA: Karnataka Urban Water Sector Improvement Project
Financial Management
1. Summary o f the Financial Management Assessment
KUWSIP will be implemented by Karnataka Urban Infrastructure Development and Finance Corporation (KUIDFC), a company registered under the Companies Act o f India and wholly owned by the Government o f Karnataka (GoK) through a Project Management Unit (PMU) set up for the purpose. Although this will be the f i rst Bank project to be implemented by the company, it i s important to note that the accounting function i s adequately staffed and fully computerized. The company follows accrual double entry book keeping in accordance with the statutory guidelines applicable to company accounts. Accounts are maintained project wise and trial balances for different projects are consolidated to form the accounts o f the company. Historically, KUIDFC has used interest income on idle project hnds to meet i t s administrative expenditure. However, a GoK order has stopped that practice with effect from 2004. Therefore, from April 1,2004, KUIDFC will meet i t s administrative expenses from a 1% management fee that will be levied on the cost o f projects managed by it. For the purpose o f KUWSIP, th is will be met from the counterpart contribution o f GoK. In order to clearly define accounting practices, the development o f a Financial Management Manual has been initiated. In addition, al l financial management systems and procedures that require strengthening have been addressed during project preparation. Capacity building initiatives include the deputation o f accounting staff to the project, the initiation o f the development o f a financial management manual which will document the accounting policies and procedures o f the organization and the setting up o f an internal audit department in the company. These activities will be completed by negotiation.
The P M U will implement both the TA and investment components. I t will receive funds for the project (on behalf o f KUIDFC) from GoK, make project expenditures, record transactions and maintain project accounts. I t wil l also be the nodal agency for ordering, receiving and paying for goods. All payments to contractors wil l be localized in KUIDFC to avoid procedural delays and bottlenecks. Payments will be made on the basis o f certified bills submitted by them as per contractual terms.
Reporting and Monitoring
KUIDFC will prepare FMRs in formats that will be specified in the Financial Management Manual. The FMRs will show actual versus budgeted expenditures, forecasts o f cash requirements, physical and financial progress and procurement contract management information. The FMRs will be designed by the financial and engineering department o f KUIDFC to facilitate the monitoring o f physical progress juxtaposed against financial progress.
All the works, goods and services will be broken down into discrete sections and assigned weights that wil l reflect the financial outflow on account o f any one section. In this way, both the Task team and the FM group will be able to use the same set o f reports for monitoring the project. FMRs will also provide a reconciliation o f expenditures claimed from the Bank with expenditures incurred annually. The f i rst FMR for the project will be submitted to the Bank within 45 days o f
- 74 -

the end o f the f i rs t quarter from the date o f loan effectiveness. KUIDFC wil l prepare FMRs in formats that will be specified in the Financial Management Manual. The FMRs will show actual versus budgeted expenditures, forecasts o f cash requirements, physical and financial progress and procurement contract management information. FMRs will also provide a reconciliation o f expenditures claimed from the Bank with expenditures incurred annually.
Funds Flow
Go1 will open a special account in RBI to receive disbursements under the project from the Bank. This Special Account will be operated by the CAAA. Go1 wil l make funds available to GoK under the usual ACA mechanism on 70% loan and 30% grant basis periodically. The entire funds requirement for the project including counterpart funding will be budgeted in GoK budget as an identifiable single line item.
There will be an initial advance o f Rs. 50 mil l ion to help the project get started from the GoK. Thereafter, KUIDFC will requisition money from GoK quarterly based on forecasted expenditures. The money will be credited to the company’s PD account from where i t will be transferred to the company’s commercial bank account.
GoK will allow KUIDFC to maintain a balance o f Rs. 50 mil l ion as an imprest in i t s commercial bank through the l i fe o f the project. The risk o f delay in flow o f funds to the project will be mitigated by this arrangement.
- 75 -

Action TOR for Intemal and Extemal Auditors
First draft o f FM Manual
Appointment o f Intemal Auditors
Responsible person Date to be completed Mr. Chil lal - Manager Done Finance KUIDFC Mr. Chil lal - Manager Done Finance KUIDFC Mr. Chil lal - Manager Within one quarter o f project
~~
Appointment o f Extemal Auditors
First draft o f FMRs formats and
- 76 -
. .
Finance KUIDFC effectiveness- Mr. Chil lal - Manager Finance KUIDFC effectiveness Mr. Chil lal - Manager Done
Within one quarter o f project
preparation o f an Excel based dummy model for generation o f FMRs
-
Finance KUIDFC

FM Risk Analysis Table
Risk Flags
Project Complexity
Simplicity in project design and implementation arrangements i s maintained by using KUIDFC as the nodal agency o f execution o f investments and the state's urban det"ent for TA comuonents.
Funds F low
All expenditures, approvals and accounts for the project are centralized at KUIDFC. This arrangement avoids multiple payment points and simplifies project financial management arrangements.
Disbursement Arrangements
There i s o f delay in funds transfer to the project because o f fiscal strain on the state.
Borrower Staffing
Project management and accounts s taf f have project experience but are inexperienced with Bank requirements. Accounting is considered i book keeping function with transactional control o f expenditure being the main objective
Accounting System
Accounting practices and procedures o f KUIDFC are not documented. The basis for apportionment o f administration and other expenditures to projects i s currently not clear causing a lack o f transparency in recording
Risk rating
L o w
L o w
Medium
Medium
High
- 77 -
Mitigation
Not required
Not required
Ths risk i s mitigated by the establishmen o f a bank account outside the treasury system which will maintain an imprest balance o f Rs. 50 mi l l ion at a l l times.
Staff capacity will be built by the : a) monitoring system where accounting information wil l be used for decision making
development and use o f a financial
b) development o f FM manual w h c h wil l lay down al l accounting procedures clearly
This risk will be mitigated by the development o f a Financial Management Manual which wil l set out accounting procedures to be followed consistently across the company.

accounting transactions.
Intemal Control
A weak internal control system in KUIDFC takes away from the assurance that the Bank gets from statutory audit on the use o f project funds.
Audit Arrangements
Arrangements for statutory and project audit are adequate. past experience with timeliness and quality o f audit reports with the same auditor, familiarity o f auditor with Bank requirements.
Overall risk rating
High
Medium
Medium
This risk wil l be mitigated by the strengthening of the internal control function through the setting up of an internal audit department. This department wil l be staffed by people drawn from the State Audit Department.
Assurance on quality o f audit reports wil l be come from the fact that auditors’ ToRs will be approved by the Bank. Follow up and timeliness of audit reports wil l be ensured by the Manager Finance who will be the single point o f contact for the Bank.
The FM assessment for this project has been set against the general background o f the governance and control environment in Karnataka (as assessed by the Kamataka SFAA) which i s stronger than in most other Indian states. However, there are areas such as cash f low management, government accounting and budgeting that are in need o f reform in Kamataka which impede the smooth functioning o f public financial management arrangements. To address this, and to facilitate smooth f low o f funds from the state to the project, GoK will provide an init ial corpus o f Rs. 50 mi l l ion to start the project. Thereafter, the state government wil l make finds available to the project in advance every quarter based on projected funds requirements presented by KUIDFC. GoK will allow KUIDFC to maintain a balance o f Rs. 50 mill ion in i t s commercial bank account at al l times to meet project expenditures. This arrangement will be approved by the Empowered Committee o f the state as a part o f the project approval package.
Country Issues
The following issues identified as generic to India are relevant to this project:
1. transactional control over expenditure. Financial information i s not considered a tool for decision making.
The accounting system o f KUIDFC concentrates mainly on book keeping and
2. have been shared with KUIDFC and it has been agreed that finalized ToRs for external auditors will be prepared by KUIDFC and cleared by the Bank prior to project implementation.
The quality o f audit reports may be an issue. To address this, model TORS for auditors
- 78 -

3, Timely availability o f funds for the project could be an issue given the fiscal stress in Karnataka. To circumvent this, project authorities have worked out a system whereby they wil l be allowed to maintain an imprest balance o f Rs. 50 mill ion in a commercial bank account outside the State Treasury system. In this way, the fiscal strain on the state exchequer will be prevented from affecting project fund flows.
Agency Audit Report Audited by KUIDFC Entity Auht Statutory Auditors
with a separate opinion on project expenditures
CAAA- Audit report o f C&AG Special Special Account Account
Country issues with respect to preparation o f FMRs and installation o f a computerized PFMS will
Due Date 30th September
30th September
2. Audit Arrangements
External Audit
The following audit reports will be receiv financial year:
not apply to the project as the accounts function i s already computerized.
Bank within six months from th d by th close o f the
The consolidated accounts o f KUIDFC are audited by a firm o f Chartered Accountants appointed by the state AG. The AG o f Kamataka also carries out a test audit o f transactions. For the purpose o f the project, the statutory auditors will provide an opinion on project expenditures as a part o f their overall opinion on the accounts o f KUIDFC. For this purpose, a TOR for enabling the auditors to express an opinion on project expenditures will be appended to the TOR for statutory audit o f the Corporation. The Bank will receive a single audit report each year in keeping with the new audit policy. The Authorized Allocations and reimbursements from the Bank will be held by the RBI in a Special Account which will be operated by the CAAA and audited by the C A G o f India. The audit reports o f this Special Account will be received by the Bank within 6 months o f the close o f the financial year.
- 79 -

Internal Audit
An intemal audit function has been set up in KUIDFC. This function i s headed by an officer drawn from the state audit cadre. H e will carry out h i s duties as Internal auditor with assistance from a fm o f Chartered Accountants. The internal auditors will ensure that the accounting practices followed in the organization conform with statutory and donor requirements. They wil l ensure that procedures set down in the company’s manual for reporting o f transactions, authorizations, payments and procurements are followed. All systemic issues identified by intemal auditors will be brought to the notice o f project authorities and rectified immediately. TOR for the internal auditors will be agreed between KUIDFC and the Bank.
3. Disbursement Arrangements Go1 will open a Special Account with RBI to receive disbursements under this project and will make funds available to the state government under the Additional Central Assistance (ACA) mechanism on 70% loan and 30% grant basis. The state government will pass on the assets created to the ULBs as a grant. The whole funds requirement for the project including counterpart contribution will budgeted by GoK as an identifiable, single head budget item annually.
Under the arrangement for KUWSIP, GoK will provide an initial corpus o f Rs. 50 mil l ion to start the project. Thereafter, the state govemment wil l make fimds available to the project in advance every quarter based on projected funds requirements presented by KUIDFC. GoK will allow KUIDFC to maintain a balance o f Rs. 50 mil l ion in i t s commercial bank account at all times to meet project expenditures. This arrangement will be approved by the Empowered Committee o f the state as a part o f the project approval package. All project payments will be made by KUIDFC using th is money at i t s disposal.
- 80 -

Allocation of loan proceeds (Table C)
3) b) NGO services and training 4) Operating Costs
Total Project Costs with Bank
Table C: Allocation of Loan Proceeds
0.15 100% 0.80 80% until December 3 1,2006 and 60%
thereafter
39.10
local expenditures (ex-factory cost), and 80% o f local expenditures for other items
orocured locallv
Financing Front-end fee
13) a) Consultant's services I 5.90 I 90% I
0.40 Amount due under section 2.04 o f this Aaeement
/Total I 39.50 I I
Use of statements of expenditures (SOEs):
Disbursements for the project will be made using the traditional method o f SOE based disbursements below the prior review threshold and documented claims above the prior review limits. The prior review limits for different categories o f expenditure will be as follows:
Goods US$500,000; Works US$500,000; Consultancy Services U S $ 100,000 for f i r m s and U S $ 50,000 for individual consultants; and For operating costs and training, under such terms and conditions as the Bank shall specify by notice to the Borrower.
The FMR based method o f disbursement may be opted for by the Go1 and GoK at a later date with prior intimation to the Bank. If FMR based disbursement i s adopted, it must be based on formats mutually agreed between the Bank and GoK.
Special account: The Special Account will be maintained in Reserve Bank o f India and operated by the Department o f Economic Affairs (DEA) o f Government o f India (GoI). The authorized allocation o f the Special Account will be US$4.0 mil l ion representing about four months o f disbursements from the loan. The project will submit withdrawal applications to the Controller o f Aid, Accounts and Audit (CAA&A) in DEA for onward submission to the Bank for replenishment o f the Special Account for reimbursement.
-81 -

Retroactive Financing:
A total amount not exceeding US$ 500,000 from categories 3A (Consultant Services) and 4 (Incremental Operating Costs) combined would be considered eligible for retroactive financing, for expenditures made after May 3 1,2003.
- 82 -

Annex 7: Project Processing Schedule INDIA: Karnataka Urban Water Sector Improvement Project
Negotiations
Planned Date of Effectiveness
ITime taken to prepare the project (months) I 19 I 19 I
0 I 11 212004 02/26/2004 0513 112004
]First Bank mission (identification) I 0911 912002 I 0911 912002 I kppraisal mission departure I 1 O i l 312003 I 1011 312003 I
Prepared by: Kamataka Urban Infrastructure Development Finance Corporation
Preparation assistance: Project preparation was assisted financially by: Department for International Development - Private Infrastructure Advisory Facility, and the Wor ld Bank Institute.
Bank staff who worked on the projec
0. Alvarado C. Bosch M. M h o P. Goel R. R. Mohan S. K. Bahl/S.Krishnan N. V. V. Raghava S. Srivastava M. Fernandes L. MacArthur R. Soopramanian H. B r o w d M . Fowler S. Myers A. Mej ia E. Ijjasz
Name included:
Speciality Team LeaderlSr. Water & Sanitation Specialist Co-Task Team LeaderlSr. Water & Sanitation Economist Sr. Financial Analyst Financial Management Specialist Sr. Social Development Specialist Sr. Procurement Specialist Municipal Engineer Environmental Specialist Program Assistant Program Assistant Sr. Counsel Disbursement officer Technical Consultant Peer Reviewer Peer reviewer
- 83 -

Annex 8: Documents in the Project File* INDIA: Karnataka Urban Water Sector Improvement Project
A. Project Implementation Plan
Borrower's Project Implementation Plan - Draft version, November 2003.
B. Bank Staff Assessments During Project preparation Bank staff carried out various assessments regarding institutional, financial, social, and technical aspects. These are available as annexes o f the preparation missions aide memoires.
C. Other 0
0
0
0 0
0
*Including electronic files
Technical Assessment o f Water Schemes (for Hubli-Dhanvad, Belgaum & Gulbarga). By BWS, June 2003 Strategy & Implementation Plan for Urban Drinking Water and Sanitation Sector. By IDECK, December 2003 Environmental Assessment o f Demonstration Projects & Priority Investments in Hubli-Dharwad, Belgaum & Gulbarga. By Wilbur Smith Associates PvT. Ltd., August 2003 Rapid Social Assessment and Communications strategy. By Samaj Vikas, December 2003 Resettlement Action Plan (for Hubli-Dhanvad). February 2004 Financial Assessment and Capacity Building o f the Municipalities in Karnataka. By Parthasarathy Venketesan, January 2004
- 84 -

Annex 9: Statement of Loans and Credits INDIA: Karnataka Urban Water Sector improvement Project
16-Mar-2004 Difference between expected
and actual disbursements" Original Amount in US$ Millions
Project ID FY Purpose IBRD IDA SF GEF Cancel. Undisb. Orig Frm Rev'd P 0 7 3 3 6 9 P 0 5 0 6 5 5 P 0 7 3 7 7 6 PO79865 PO72123 PO71272 PO67606 PO50649 PO76467 P 0 7 5 0 5 6 PO73094 PO50647 PO72539 P 0 5 0 6 5 3 P 0 5 0 6 6 6 PO40610 PO74018 P 0 6 9 8 8 9 PO71033 PO67216 P 0 3 8 3 3 4 P 0 5 9 2 4 2 PO55455 PO35173 PO55454 PO50658 PO70421 PO71244 PO10566 PO67543 PO09972 PO10505 PO35172 PO55456 PO59501 PO67330 PO49770 PO45049 PO50657 PO50667 PO50637 PO41264 PO45051 PO45050 PO50651 PO50646 PO35824 PO10561 PO10496 PO38021 PO35827 PO49385 PO10511
2004 MAHAR RWSS 2004 RAJASTHAN HEALTH SYSTEMS DEVELOPMEN 2004 ALLAHABAD BYPASS 2004 GEF Biosafety Project 2003 Tech/Engg Quality Improvement Project 2003 AP RURAL POV REDUCTION 2003 UP ROADS 2003 TNROADS 2003 Chatt DRPP 2003 Food 8 Drugs Capacity Building Project 2003 AP COMM FOREST MANG 2002 UmAR PRADESH WATER SECTOR RESTRUCTU 2002 KERALA STATE TRANSPORT 2002 KARNATAKA RWSS II 2002 MUMBAI URBAN TRANSPORT PROJECT 2002 RAJ WSRP 2002 Gujarat Emergency Earthquake Reconstruct 2002 MIZORAM ROADS 2002 KARN TANK MGMT 2001 KAR WSHD DEVELOPMENT 2001 RAJ POWER I 2001 MPDPIP 2001 RAJ DPEP II 2001 POWERGRID II 2001 KERALA RWSS 2001 TECHN EDUC 111 2001 KARNHWYS 2001 Grand Trunk Road Improvement Project 2001 GUJARAT HWYS 2001 LEPROSY II 2000 NATIONAL HIGHWAYS 111 PROJECT 2000 RAJASTHAN DPlP 2000 UP POWER SECTOR RESTRUCTURING PROJEC 2000 IN-Telecommunications Sector Reform TA 2000 IN-TA for Econ Reform Project 2000 IMMUNIZATION STRENGTHENING PROJECT 2000 REN EGY I1 2000 APDPIP 2000 UP Health Systems Development Project 2000 UP DPEP Ill 1999 TN URBAN DEV II 1999 WTRSHD MGMT HILLS II 1999 2ND NATL HlViAlDS CO 1999 RAJASTHAN DPEP 1999 MAHARASH HEALTH SYS 1999 UP SODIC LANDS II 1998 DIVAGRC SUPPORT 1998 NATL AGR TECHNOLOGY 1998 DRISSA HEALTH SYS 1998 DPEP 111 (BIHAR) 1998 WOMEN 8 CHILD DEVLPM 1996 AP ECON RESTRUCTURIN 1997 MALARIA CONTROL
0.00 0.00
240.00 0.00
0.00 0.00
488.00 348.00
0.00 0.00 0.00
0.00 255.00
0.00 463.00
0.00 0.00 0.00 0.00 0.00
180.00 0.00
0.00 450.00
0.00 0.00
360.00 589.00 381.00
0.00 516.00
0.00 150.00 62.00 0.00 0.00
80.00 0.00 0.00 0.00
105.00 85.00 0.00 0.00 0.00 0.00
79.90 96.60 0.00
0.00 0.00
301.30 0.00
181.00 89.00 0.00
0.00 250.00 150.03
0.00 0.00
112.56 54.03
108,OO 149.20
0.00 151.60 79.00
140.00 442.80
60.00
98.90 100.40
0.00 110.10 74.40 0.00
65.50 64.90 0.00 0.00 0.00
30.00 0.00
100.48 0.00 0.00
45.00 142.60 50.00
111.00 110.00 182.40
0.00 50.00
191.00 05.70
134.00 194.10 50.00
100.00 76.40
152.00 300.00 241.90 164.60
0.00 0.00 0.00 0.00 0.00 0.00
0.00 0.00
0.00 0.00 0.00 0.00 0.00 0.00 0.00 0.00 0.00 0.00 0.00 0.00
0.00 0.00 0.00 0.00
0.00 0.00 0.00
0.00 0.00 0.00 0.00
0.00 0.00 0.00 0.00 0.00 0.00 0.00
0.00 0.00 0.00 0.00 0.00 0.00 0.00 0.00 0.00
0.00 0.00 0.00 0.00 0.00 0.00
0.00 0.00 0.00 I .oo 0.00 0.00 0.00 0.00 0.00 0.00 0.00 0.00 0.00 0.00 0.00
0.00 0.00 0.00
0.00 0.00 0.00 0.00 0.00 0.00 0.00 0.00 0.00 0.00 0.00 0.00 0.00 0.00
0.00 0.00
0.00 0.00 0.00 0.00 0.00
0.00 0.00 0.00 0.00 0.00 0.00 0.00 0.00 0.00
0.00 0.00
0.00 0.00 0.00
0.00 0.00 0.00
0.00 0.00 0.00
0.00 0.00
0.00 0.00 0.00 0.00 0.00 0.00 0.00
0.00 0.00 0.00
0.00 0.00 0.00 0.00 0.00 0.00 0.00 0.00 0.00 0.00 0.00 0.00 0.00 0.00
0.00 20.00
0.00 0.00
0.00 0.00 0.00
0.00 0.00 0.00 0.00 0.00
16.96 0.00 0.00 0.00
0.00 0.00 0.00 0.00
46.50
179.41 89.39
237.60 0.90
274.66 156.47 454.99 334.52 117.10 58.52
109.39 166.56 224.28 167.65 504.29 153.65 351.70
58.48 11 3.64 109.45 93.96
103.14 56.35
251.02 63.32 54.90
289.78 482.57 274.60
5.61 374.31 92.26 17.30 28.47 40.54
104.45 110.12 63.80 91.93 58.65 16.96 37.01 66.15 43.01 66.59 86.77 18.34 61.75 56.65 86.48
187.06 130.17 47.49
-6.67 0.00 4.27 0.10
12.85 18.67 50.37 -6.18 -4.48 5.46
-1.24 66.07 4.95
27.08 57.60 38.27
304.57 2.51
14.67 50.42 71.12 34.92 3.79
135.69 20.03 22.95 81.45
247.57 164.27
3.57 229.53 60.59 13.97 46.83 10.73 16.60 57.83 6.37
30.37 52.29 12.39 35.04 44.09 35.33 75.04 66.01 20.10 66.77 46.43 78.21
153.85 128.09 93.65
0.00 0.00 0.00 0.00 0.00
0.00 0.00
0.00 0.00 0.00
0.00 0.00 0.00
0.00 0.00 0.00 0.00
0.00 0.00 0.00 0.00 0.00 0.00 3.71
-5.37 -0.10 0.00 0.00
19.32 0.00 5.85
-3.56 0.00 0.00
1.48 0.00
13.72 0.00
0.00 0.00 0.00 0.00 0.00
14.14 -5.47 0.00
19.30 6.75 0.00
-8.71 0.00 0.00
25.00
- 85 -

Difference between expected and actual
disbursements' Original Amount in US$ Millions
Project ID FY Purpose IBRD IDA SF GEF Cancel. Undisb. Orig Frm Rev'd PO43728 1997 ENV CAPACITY BLDG TA 0.00 50.00 0.00 0.00 0.94 3.94 9.33 0.00
PO10473 1997 TUBERCULOSIS CONTROL 0.00 142.40 0.00 0.00 13.04 57.67 74.49 73.68 PO09995 1997 STATE HIGHWAYS I(AP) 350.00 0.00 0.00 0.00 0.00 33.36 33.36 -208.64 P 0 3 6 0 6 2 1997 ECODEVELOPMENT 0.00 28.00 0.00 20.00 5.86 2.19 9.64 6.55 P 0 0 9 5 8 4 1997 ECODEVELOPMENT 0.00 0.00 0.00 0.00 2.34 0.10 3.75 0.00
PO35158 1997 AP IRRIGATION 111 175.00 150.00 0.00 0.00 45.00 41.91 94.39 27.72 PO44449 1997 RURAL WOMEN'S DEVELOPMENT 0.00 19.50 0.00 0.00 6.72 5.81 13.44 2.00 PO10531 1997 REPRODUCTIVE HEALTH1 0.00 248.30 0.00 0.00 0.00 62.87 54.95 54.99 PO35170 1996 ORISSA POWER SECTOR 350.00 0.00 0.00 0.00 95.00 27.21 122.21 -9.03 PO10529 1996 ORISSA WRCP 0.00 290.90 0.00 0.00 0.00 39.46 62.40 39.75 PO35825 1996 STATE HEALTH SYS II 0.00 350.00 0.00 0.00 0.00 23.08 59.09 0.00 PO10522 1995 ASSAM RURAL INFRA 0.00 126.00 0.00 0.00 0.00 14.78 32.00 32.00 PO10461 1995 MADRAS WAT SUP II 275.80 0.00 0.00 0.00 189.30 2.88 192.18 2.71 PO10476 1995 TAMIL NADU WRCP 0.00 282.90 0.00 0.00 25.01 21.56 85.30 54.20
Total: 6.380.80 6,680.80 0.00 21.00 466.67 7.761.24 3,651.30 161.98
- 86 -

INDIA STATEMENT OF IFC's
Held and Disbursed Portfolio Feb 29 - 2004
In Mill ions US Dollars
Committed Disbursed IFC IFC
FY Approval Company Loan Equity Quasi Partic Loan Equity Quasi Partic TCWdCICI 0.00 0.00 3.92 0.00 0.00 1998
1990 2002 2000 1989 1989 2004 1996 2002 2001 1997 1988 1997 2002 2002103 2003 1994 1992193 1997 2001104 2001 2003 2001 1984191 2001/03 1997 1990192 2002 2004 1995 2003 2003 1997 1995 2001 1994 1994198100 1994 2003 1998 1995100 1998 2001
TDICI-VECAUS I1 TELCO Tanflora Park Tata Electric UCAL UPL United Riceland Usha Martin Vysya Bank WIV WTI Walden-Mgt India Webdunia ATL Alok Ambuja Cement Arvind Mills Asian Electronic BILT BTVL Balrampur Basix Ltd. Bihar Sponge CCIL CEAT CESC COSMO Caim Energy Centurion Bank DQEL Dewan EEPL
GE Capital GTF Fact GVK Global Trust Gujarat Ambuja HDFC IAAF ICICI-SPIC Fine IDFC IIEL
EXB-STG
Total Portfolio:
0.00 0.00
50.00 0.00
16.56 0.00
17.50 9.19
21.00 0.00 0.00 0.00 0.00 0.00 2.29
17.50 0.00 0.00 0.00 0.00 0.00
15.47 0.00 0.00 2.08
19.60 18.00 8.75
40.00 0.00 0.00
12.51 0.00 0.31 0.00 0.00 0.00 0.00 0.00
100.00 0.00 0.00 0.00 0.00
3.92 0.15 0.00 0.51 0.00 0.03 0.00 0.00 3.60 3.66 2.05 0.20 0.02 2.00 0.00 0.00 4.94 3.33 5.06 0.00
10.00 0.00 0.98 0.05 0.00 0.00 0.00 0.00 0.00 0.77 1.50 0.00 0.03 0.00 4.39 2.39 7.45 0.36 4.88 0.00 1.97 2.79
15.46 3.16
0.00 0.00 0.00 0.00 0.00 0.00 0.00 0.00 0.00 0.00 0.00 0.00 0.00 0.00 0.00 0.00 0.00 0.00 0.00
15.00 0.00 0.00 0.00 0.00 0.00 0.00 0.00 0.00 0.00 0.00 0.50 0.00 0.00 0.00 0.00 0.00 0.00 0.00 0.00 0.00 0.00 0.00 0.00
0.00 0.00 0.00 0.00 0.00 0.00 0.00 0.00 0.00 0.00 0.00 0.00 0.00 0.00 0.00 0.00 0.00 0.00 0.00 0.00 0.00 0.00 0.00 0.00 0.00
40.13 0.00 0.00 0.00 0.00 0.00 0.00 0.00 0.00 0.00 0.00 0.00 0.00
100.00 0.00 0.00 0.00
0.00 50.00
0.00 16.56 0.00
17.50 9.19,
21.00 0.00 0.00 0.00 0.00 0.00 1.76 0.00 0.00 0.00 0.00 0.00 0.00
15.47 0.00 0.00 1.16
19.60 18.00 8.75 0.00 0.00 0.00
12.51 0.00 0.3 1 0.00 0.00 0.00 0.00 0.00
100.00 0.00 0.00 0.00
0.15 0.00 0.00 0.00 0.03 0.00 0.00 3.60 3.66 2.05 0.20 0.02 0.67 0.00 0.00 4.94 3.33 5.06 0.00
10.00 0.00 0.98 0.05 0.00 0.00 0.00 0.00 0.00 0.77 1 S O 0.00 0.03 0.00 4.39 2.39 7.45 0.36 4.88 0.00 1.81 2.79
15.46
0.00 0.00 0.00 0.00 0.00 0.00 0.00 0.00 0.00 0.00 0.00 0.00 0.00 0.00 0.00 0.00 0.00 0.00
15.00 0.00 0.00 0.00 0.00 0.00 0.00 0.00 0.00 0.00 0.00 0.50 0.00 0.00 0.00 0.00 0.00 0.00 0.00 0.00 0.00 0.00 0.00 0.00
0.00 0.00 0.00 0.00 0.00 0.00 0.00 0.00 0.00 0.00 0.00 0.00 0.00 0.00 0.00 0.00 0.00 0.00 0.00 0.00 0.00 0.00 0.00 0.00 0.00
40.13 0.00 0.00 0.00 0.00 0.00 0.00 0.00 0.00 0.00 0.00 0.00 0.00
100.00 0.00 0.00 0.00
0.00 0.00 0.00 2.06 0.00 0.00 740.31 172.49 43.24 146.13 517.78 139.99 43.24 146.13
- 87 -

Anorovals Pending Commitment
FY Approval 2000 2003 2004 2004 2003 2001 2003 2004 2002 2001
Company Loan Equity Quasi Partic APCL 0.01 0.00 0.00 0.00 BHF 0.01 0.01 0.00 0.00 CGL 0.02 0.00 0.00 0.00 CIFCO 0.00 0.02 0.00 0.00 DQEL 0.00 0.00 0.00 0.00 GI Wind Farms 0.01 0.00 0.00 0.00 Niko Resources 0.01 0.00 0.00 0.00 Ocean Sparkle 0.00 0.00 0.00 0.00 TELCO 1 0.02 0.00 0.00 0.00 Vysya Bank 0.00 0.00 0.00 0.00
Total Pending Commitment: 0.08 0.03 0.00 0.00
- 88 -

Annex I O : Country at a Glance INDIA: Karnataka Urban Water Sector ImDrovement Proiect
POVERTY and SOCIAL
2002 Population, mid-year (millions) GNI per capita (Atlas method, US$) GNI (Atlas method, US$ billions)
Average annual growth, 1996.02
Population (%) Labor force 1%) Most recent estimate (latest year available, 1996-021 Poverty (% of population below national poverfy lineJ Urban population (% of total population) Life expectancy at birth (years) Infant mortality (per 1,000 live birfhs) Child malnutrition (% of children under 5) Access to an improved water source (x ofpopulation) Illiteracy (% ofpopulation age 75+) Gross primary enrollment (% of school-age population)
Male Female
KEY ECONOMIC RATIOS and LONG-TERM TRENDS 1982
GDP (US$ billions) 194.8 Gross domestic investment/GDP 21.7 Exports of goods and services/GDP 6.1 Gross domestic savings/GDP 18.3 Gross national savings/GDP 19.2
Current account balancdGDP Interest payments/GDP Total debtlGDP Total debt service/exports Present value of debt/GDP Present value of debtkxports
-2.0 0.4
14.1 13.6
1982-92 1992-02 (average annual growth) GDP 5.6 6.0 GDP Der caDita 3.4 4.2
India
1,048.3 470
494.8
1.7 2.2
29 28 63 67
84 41
102 111 92
1992
244.2 23.8 9.0
21.8 21.8
-1.6 1.4
37.0 28.0
2001
5.2 3.5
South Asia
1,401 460 640
1.8 2.3
28 63 71
84 44 97
108 89
2001
478.5 22.3 13.5 23.5 25.5
0.1 0.8
20.4 11.7 14.2 84.7
2002
4.6
Low- income
2,495 430
1,072
1.9 2.3
30 59 81
76 37 95
103 87
2002
510.2 22.8 15.2 24.2 26.3
0.6 0.7
20.6 13.9
2002-06
6.2 3.0 4.7
STRUCTURE of the ECONOMY
(% of GDP) Agriculture Industry
Services
Private consumption General government consumption Imports of goods and services
Manufacturing
~ Development diamond'
I Life expectancy
! T
~
I GNI Gross per primary capita nroilment
1
Access to improved water source
ow-income group ! - lndja L I
Economic ratios.
Trade
T
Indebtedness
lndta Low-income group - 1982 1992 2001 2002 1 Growth of investment and GDP (%)
35.9 30.9 25.0 22.7 25.8 26.7 25.7 26.6 16.2 16.2 15.3 15.6 38.3 42.3 49.4 50.7
69.9 65.8 10.7 11.2 12.5 12.5 8.4 9.8 14.1 15.6
65.9 65.0 ~ '' 97 98 99 00 07 i 2 I -GDI *GDP
(average annual growth) Agriculture 3.1 2.5 6.5 Industry 6.7 6.2 3.4
Manufacturing 6.5 6.6 3.6 Services 6.8 8.2 6.8
Private consumption 5.3 5.0 6.2 General aovernment consumption 6.1 7.1 3.0 Gross domestic investment Imports of goods and services
5.7 7.2 1.6 9.5 I ---Expotts *Imports ' 5.7 12.0 4.0 8.1
- 89 -

PRICES and GOVERNMENT FINANCE
Domestic prices (% change) Consumer prices Implicit GDP deflator
Government finance (% of GDP, includes current grants) Current revenue Current budget balance Overall surplusideficit
TRADE
(US$ millions) Total exports (fob)
Marine products Ores and minerals Manufactures
Total imports (cit) Food Fuel and energy Capital goods
Export price index (1995=100) Import price index (1995=100) Terms of trade (1995=100)
BALANCE of PAYMENTS
(US$ millions) Exports of goods and services Imports of goods and services Resource balance
Net income Net current transfers
Current account balance
Financing items (net) Changes in net reserves
Memo: Reserves including gold (US$ millions) Conversion rate (DEC, /ocal/US$J
EXTERNAL DEBT and RESOURCE FLOWS
(US$ millions) Total debt outstanding and disbursed
IBRD IDA
Total debt service IBRD IDA
Composition of net resource flows Official grants Official creditors Private creditors Foreign direct investment Portfolio equity
World Bank program Commitments Disbursements Principal repayments Net flows Interest payments Net transfers
105,210
1982 1992
Composition of 2002 debt (US$ mill.) I
6.7 12.6 7.7 8.8
.. 18.7
.. -3.2
.. -7.2
1982 1992
9,490 18,869 377 602 445 738
5,109 14,039 16,468 24,316 1,071 507 5,957 6,100 2,662 4,532
94 95 125 96 75 99
1982 1992
12,377 23,599 18,352 27,917 -5,975 -4,318
-335 -3,423 2,510 3,852
-3,800 -3,889
3,101 4,692 699 -803
4,896 9,832 9.7 30.6
1982 1992
27,546 90,264 1,395 9,326 6,983 15,438
2,054 7,697 172 1,395 72 267
394 363 1,352 2,543 1,180 1,563
0 313 0 244
1,889 2,678 1,397 1,954
98 834 1,300 1,119
146 828 1,153 292
3.1 4 3 I:: 3.9
-7'4 j -GDPdeflator +CPI -10.5 -10.9 I 2o01 2o02 1 Export and Import levels (US$ mill.) 1
44,915 53,000 ~80,000 1.237 1.381 I 1,262 1,900 60000
33,370 38,353 57,618 65,474 40000 2,043 2,368 2oooo
14,000 17,640 9,882 12,746 1 o
96 97 98 99 00 01 02 90 101 93 100 1 vd Exports Imports 97 101
2o01 2o02 Current account balance to GDP (Oh)
65,580 77,986 1 T 73,706 84,254 -8,126 -6,268
-3,601 -4,882 l o 12,125 14,448
398 3,298
11 359 13.682 /1 -11,757 -16i980 1.2 i I
I I 54,106 75,428
47.7 48.4
2001
97,516 7,015
20,402
9,327 1,372
569
384 365
-1,569 4,741 1,951
2,190 2,089 1,467
622 474 148
5,141 21,642
13,042 3,029
637
410 -3,657 -1,861 3,611
944
1,523 1,465 3,196
-1,730 470
-2,200
I I G: 4,093 A: 5,141
j
F 51,061
I I A - I B R D E ~ Bilateral B ~ IDA D - Other multilateral F - Private IC- IMF G ~ Short-term
- 90 -

Additional Annex 11 INDIA: Karnataka Urban Water Sector Improvement Project
Existing intermittent water service in typical neighborhoods in Belgaum, Hubli-Dharwad and Gulbarga. Pictures taken in Belgaum, Hubli-Dharwad and Gulbarga, September, 2002.
-91 -

Additional Annex 12: Summary of Environmental Assessment INDIA: Karnataka Urban Water Sector Improvement Project
1.0 Background
Karnataka Urban Water Sector Improvement Project (KUWSIP) i s a medium term sectoral reform project initiated by the Government o f Karnataka. The project envisages setting a policy, institutional and regulatory environment in urban water and sanitation sector that would enable service improvements, sustainable investments and coverage expansion. This sectoral reform process that will take place gradually and incrementally i s being launched through a small-scale demonstration projects in three urban local bodies o f Gulbarga, Belgaum and Hubli-Dhanvad.
These init ial investments comprise demonstration projects in selected zones o f the project cities and priority investments to improve bulk water supplies and to demonstrate the feasibility o f continuous and safe water supply.
While these investments are expected to improve the environmental conditions, quality o f service and develop the water and sanitation infrastructure, adverse environmental impacts are anticipated if the investments are not planned, sited, designed, constructed, operated and maintained properly. Considering these aspects, the Government o f Karnataka through KUIDFC, has commissioned Wilbur Smith Associates Private Limited, Bangalore to carry out Limited Environmental Assessment o f the proposed investments and for providing guidance/quality assurance in:
0 5 5
integration o f environmental aspects in the work done by the engineering consultant; planning for environmental activities to be carried out during project implementation; and drafting Environmental Code o f Practice, Terms o f Reference for Sectoral Environmental Assessment (SEA) and Sectoral Environmental Management Framework for the subsequent phases o f KUWSIP.
2.0 Project Area Profile
Hubli-Dharwad Spread over an area o f 202 sq.km., the twin cities o f Hubli-Dhanvad houses a population o f 786,018. These cites are the major commercial, industrial and educational centers o f Karnataka and ranked as the second biggest after the state capital, Bangalore.
About 70 MLD o f water (as against the designed capacity o f 130 MLD) i s supplied once in 5 to 7 days from two surface water bodies o f Malaprabha and Neersagar and 70% o f Hubli-Dhanvad population i s provided with water supply facilities (45% through house service connections and 25% through public taps or tanker supplies). The remaining population depend on own sources such as Bore Wells, Open Wells, etc.
Belgaum The city o f Belgaum houses a population o f about 399,600 over an area o f 83.93 sq.km. and i s ranked as the fifth largest city o f Karnataka. The city i s popular for the presence o f defence

establishments and the major industries such as Tata Power and Indian Aluminium.
About 55 MLD o f water i s supplied every alternate day from two surface sources o f Rakaskop and Hedkal dam to the residents o f the city and about 70% o f the population i s provided with water supply facilities. The remaining population depend on own sources such as Bore Wells, Open Wells, etc.
Gulbarga Located at about 600 km from Bangalore, Gulbarga i s spread over an area o f about 60 sq.km. and houses a population o f 427,929.The city primarily i s a regional market and service center. About 30 MLD o f water (against the design supply o f 66 MLD) i s supplied once 2 or 3 days to the residents o f Gulbarga from three surface sources o f Bhosaga, Bennithora and Bhima Rivers and about 50% o f the population i s provided with water supply facilities. The remaining population depend on own sources such as Bore Wells, Open Wells, etc.
3.0 Project Description
Demonstration Zones Based on detailed diagnostic surveys in 3 to 4 zones in each o f the project cities, the engineering consultants have identified the following zones for implementation and demonstration o f the continuous water supply:
0 0
0
0
0
Hubli Zone comprising wards 27,28 and parts o f wards 29 and 32; Dhanvad Zone comprising wards 8,9, 10 and 11; Belgaum South Zone comprising wards 3,4,5,6 and parts o f wards 7 and 8; Belgaum North Zone comprising wards 45 and 47; and Gulbarga Zone comprising wards 22,23,24,33,34,35,36,40,41,42,43,47,48 and 49.
Priority Investments Further to enhance the bulk water supply levels in the project cities, specific priority investments were identified by the engineering consultants for implementation in KUWSIP. City wise these priority investments are discussed below:
Hubli-Dharwad 0 laying an exclusive transmission main o f 1210 mm diameter MS pipe, for a length o f about
23 km from Aminbhavi treatment plant, by-passing Dhanvad and avoiding the existing 900 mm diameter transmission main from Dhanvad; replacement, reinforcement and extension o f feeder mains o f about 18 km by C I pipes in Hubli; and replacement, reinforcement and extension o f feeder mains o f about 15 km by C I pipes in Dharwad.
0
0
- 93 -

Belgaum 0 replacement o f 525 mm cast iron rising main by mild steel pipes for a length o f 3.05 km
from Hindalaga pumping station to treatment plant to avoid high level o f joint losses and friction losses; replacement o f 1200 mm prestressed concrete pipe by mild steel pipe for a length o f 5 km from Hidkal Dam, between Pump Houses 2 and 3; replacement o f old, worn out pumps in Pump House 1 by 2 No. 400HP centrifugal pumps, plus transferring one o f the two 400HP stand-by pumps o f Pump House 2 to Pump House 1 as a stand-by pump; construction o f a new reservoir at the water treatment plant; and replacement and reinforcement o f feeder mains within the distribution system.
0
0
0
0
Gulbarga 0
0
0
0
0
0 sand filters at WTP.
replacing 900mm dia PSC &sing Main by MS pipes for a length o f 10.46 K m s from pump house Bheema river to B.P.Tank; replacing 1200mm dia PSC Gravity Ma in by MS pipes for a length o f 5.10Kms from B.P. Tank to IPS; replacing 900mm dia RCC Rising Main by MS pipe for a length o f 6.840 K m s from IPS to Water Treatment Plant; additional vertical pumps at Bheema river pumping station; pumps for the intermediate pumping station; and
4.0 Environmental Assessment of the Project
The environmental assessment o f the project proposals carried out by the consultants comprised:
0 review o f all applicable policies, regulations and administrative framework within which KUWSIP i s to be implemented (including Operational Policies and Directives o f the World Bank; study o f base line environmental profile o f the project cities in general and demonstration zones in particular; and conducting base line sample surveys o f water quality and soil characteristics to assess the quality o f water supplied and the potential o f cross contamination.
0
0
4. I Review of Environmental Policies and Institutions
Demonstration Zones The review o f the environmental policies concluded that the demonstration projects in the project area will not necessitate any detailed environmental assessment studies. However project activities in Gulbarga demonstration zone, could trigger OP 4.1 1 in the event o f chance finding o f Cultural Properties during excavation works for the distribution net works (the alignment o f which i s not known at this stage o f the project).
- 94 -

Also during the construction stage the project would:
require consent from the state pollution control board to operate the DG set under Air (Prevention & Control o f Pollution) Act, 1981; and attract Noise Control Regulations under Environment (Protection) Act, 1986.
During the operation phase of the project the excess wastewater generated if not treated to the disposal standards will attract the provisions o f Environment (Protection) Act, 1986.
Priority Investments All the priority investments excepting the laying and replacement and rehabilitation o f pumps in Belgaum and Gulbarga will require an appropriate management plan after finalizing the exact alignment o f the project.
Also during construction stage the project would:
require consent from the state pollution control board to operate the DG set under Air (Prevention & Control o f Pollution) Act, 1981; and attract Noise Control Regulations under Environment (Protection) Act, 1986.
During the operation stage, the storage and handling o f chlorine for disinfecting the water will necessitate consent from the Pollution Control Board as per the provisions o f Manufacture, Storage and Handling o f Hazardous Chemicals Rules, 1989.
4.2 Base Line Environmental Profile
The detailed base l ine environmental profile both in the demonstration zones indicate that none o f the three project cities present any sensitive environmental features that could be affected by the proposed improvements by KUWSIP. All the project cities and the demonstration zones show similar features to the other, excepting historical monuments in Gulbarga.
However i t i s significant to note that the demonstration zones o f the project cites have few nalas and surface water bodies receiving wastewater and storm water from upstream catchment areas. Water supply augmentation in these zones through the project i s expected to have a negative impacts on these water bodies and provision safe wastewater disposal arrangements need to be considered in the project planning and design stages.
- 95 -

4.3 Base Line Sample Surveys
In order to establish the water quality issues and assess the possible impacts o f the proposed continuous water supply in the selected demonstration zones, the following sample surveys were also conducted in the demonstration zones o f the project cities:
0
Analysis o f water quality at supply end by collecting samples at the source, treatment plant, storage reservoir and the public taps; Analysis o f water quality at consumer end by analyzing water quality after 5,15 and 30 minutes o f supply; and Analysis o f soil characteristics in the vicinity o f the distribution system to assess the potential o f cross contamination.
These samples surveys indicated that the quality o f water at supply end in all the three cities meets the standards o f I S 10500. However, at the consumer end the water supplied in the initial 10 minutes presented Coliforms in the samples, which indicates the cross contamination in the distribution system. This was further substantiated in the analysis o f soil samples, wherein varied levels o f bacterial count was observed.
5.0 Impacts and Environmental Management Plan
No major environmental impacts are anticipated due to the project proposals in KUWSIP. The critical issues will be to ensure adequate safety and precautionary measures to minimize impacts during construction and provision o f sanitation facilities in the demonstration zone to avoid contamination surfacehub-surface sources during operation.
While the impacts are not very severe and permanent, care has to be taken to ensure that the ambient environmental conditions do not deteriorate. The impacts due to the priority investments are specific to the activity undertaken and cannot be generalized. Table 1 presents the summary o f major impacts o f the projects and recommended mitigative measures for the same.
- 96 -

An Environmental Code o f Practice along with the Terms o f Reference for carrying out EA studies for Category A and Category B projects i s also prepared and presented in the report.
Project Activity Environmental Impacts
A. Demonstration Zones I. Construction Stage
3 . Temporary Disruption to Traffic during construction
1. Temporary Disruption o f Water supplies
2. Flooding and Leakage o f Water in the Influence Area
I I 4. Safety hazards to labor
1. Altemative Water Supply Arrangements such as Tanker Supply shall be Provided 2. Appropriate Bypass and Leak
5. Safety hazards to households in the
Earth in the areas o f operation
Respective Municipal Corporation Respective
4. Adequate Safety Precautions such as helmets, safety shoes etc. shall be provided to the labor 5. Provision o f temporary crossings/ bridges in the implementation area 6. Transportation and disposal o f excess earth to a designated disposal site 7. Creation o f Soil Barriers or mounds.
s and EMP
Respective Municipal Corporation Local traffic Police
Contractor
Respective Municipal Corporation and
11. Operation Phase Continuous Supply o f Water During
Control Arrangements shall be Ensured 3. Appropriate Traffic Diversion Plans shall be prepared and implemented during the construction
7 . Soil Erosion o f Deposited earth
8. Increased dust levels due to earth work excavation activities 9. Disturbance to other Utilities
10. Increased Noise Levels during Construction
1. Generation o f Additional Quantity o f Wastewater from
Municipal Corporation Respective Municipal Corporation and Local Traffic Police.
9. Scheduling activities in consultation with the other utility agencies such as telephone cables and sewer lines etc. and ensuring minimum disturbance to the uti l i t ies 10. Use o f l ow noise generating equipment for a l l the activities,
Contractor
Contractor
I Contractor I Respective 8. Immediate transport o f
accumulated waste or frequent Municipal watering o f excavated earth Coruoration
construction during nights
1. Provision o f Adequate Respective centralizeddecentralized Municipal
97 -

Operation individual sanitation facilities in the demonstration zone
'roject Activi ty
Corporation
A. Demonstration Zones 11. Operation Phase
B. Pr io r i t y Investments General
the Zones leading to contamination o f surface I sub-surface sources 2. Flooding o f Low Lying Areas due to overflow o f storm water drains
Environmental Impacts
3. Problems o f Water Supply Allocation to non-demonstration zones
4. Improvement o f health and hygiene o f the communities due to improved water quality 5. Reduction o f illegal connections, pit taps, etc. leading to reduction damages to infrastructure 6. Reduction in community investment on water storage, pumping and other expenditure leading to positive economic imoacts 7.Reduced Community Disputes on water supply within the zone
1. Increase in Dust Levels to due to earth work and other construction activities
2. Accumulation o f Excess Earth
3. Disruption o f traffic f low in the roads and during construction
4. Disruption o f Utilities such
2. Augmentation and Respective
drainage network in the Corporation
Mit igative Measures
3. Minimization o f leakages in the system and ensuring that current water supply levels are maintained in the other zones 1 Carrying out extensive awareness and communication campaigns to eliminate apprehensions o f the people o f other zones Positive Impact
Positive Impact
Positive Impact
Positive Impact
1. Transportation o f excess earth to identified disposal sites at frequent intervals and watering the spoil banks regularly 2. Disposal o f unused I excess earth at an environmentally suitable disposal site 3. Provision o f bypass arrangemen during construction periods and completing the works at shortest possible time 4. Preparation o f utility shifting
igencies Responsible
lespective Municipal Zorporation
Contractor
KUWSDB, Contractor
Traffic Police, KUWSDB, Contractor.
Telecom
- 98 -
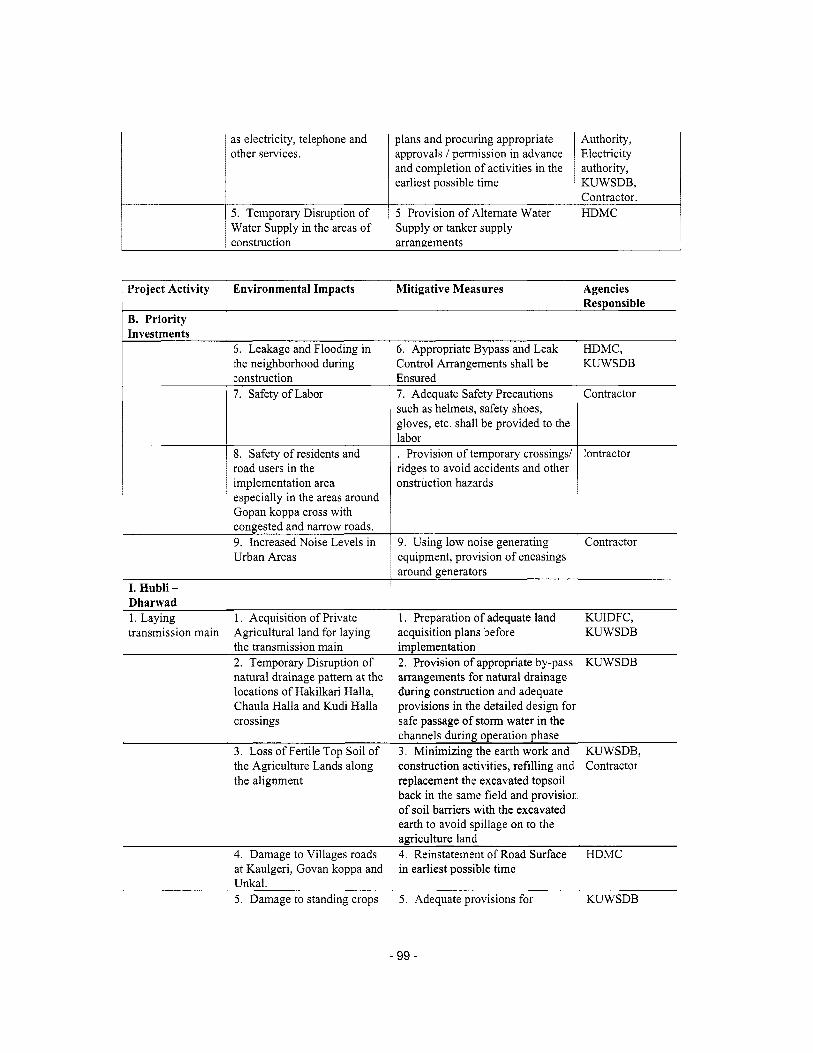
as electricity, telephone and other services.
5. Temporary Disruption o f Water Supply in the areas o f construction
plans and procuring appropriate approvals / permission in advance and completion o f activities in the earliest possible time
5 Provision o f Altemate Water Supply or tanker supply arrangements
Mitigative Measures ~
Project Activity
B. Priority Investments
1. Preparation o f adequate land acquisition plans before implementation 2. Provision o f appropriate by-pass arrangements for natural drainage during construction and adequate provisions in the detailed design for safe passage o f storm water in the channels during operation phase 3. Xlinimizing the earth work and construction activities, refi l l ing and replacement the exca\.ated topsoil back in the same field and provision o f soil barriers with the excavated earth to avoid spillage on to the agriculture land 4. Reinstatement o f Road Surface in earliest possible time
I. Hubli - Dharwad 1. Laying transmission main
Environmental Impacts
5. Leakage and Flooding in the neighborhood during :onstruction 7. Safety o f Labor
8. Safety o f residents and road users in the implementation area especially in the areas around Gopan koppa cross with congested and narrow roads. 9. Increased Noise Levels in Urban Areas
1. Acquisition o f Private Agricultural land for laying the transmission main 2. Temporary Disruption o f natural drainage pattern at the locations o f Hakilkari Halla, Chaula Halla and Kudi Halla crossings
3. Loss o f Fertile Top Soil o f the Agriculture Lands along the alignment
4. Damage to Villages roads at Kaulgeri, Govan koppa and Unkal. 5. Damage to standing crops
6. Appropriate Bypass and Leak Control Arrangements shall be Ensured 7. Adequate Safety Precautions such as helmets, safety shoes, gloves, etc. shall be provided to the labor . Provision o f temporary crossings/ ridges to avoid accidents and other onstruction hazards
9. Using l o w noise generating equipment, provision o f encasings around generators
5. Adequate provisions for
Authority, Electricity authority, KUWSDB, Contractor. H D M C
Agencies Responsible
HDMC, KUWSDB
Contractor
:ontractor
Contractor
KUIDFC, KUWSDB
KUWSDB
KUWSDB, Contractor
H D M C
KUWSDB
- 99 -

2. Belgaum 1. Replacement o f C I rising main with MS pipes from Hindalga to Laxmi Tek (3.05
during break down o f the transmission main or maintenance operations
1. Acquisition o f Private Agricultural land for laying the transmission main for the init ial length o f around 500m in Hindalgi village.
compensation to the affected land owners during maintenance works
1. Preparation o f adequate land acquisition plans before implementation
Project Activity
B. Priority [nvestments 2. Belgaum
2. Replacement 3 f PSC main from Hidakal dam to pumping stations with M S Pipe (5 w
Environmental Impacts
2. Appropriate clearances from the Jail authorities for the pipeline routing. 3. Loss o f vegetation in the land owned by the ja i l authorities.
4. Loss o f Fertile Top Soil o f the Agriculture Lands along the alignment
5. Damage to road surface Vijaya nagar and Rakaskopp road. 6. Damage to standing crops during break down o f the transmission main or maintenance operations 1. Appropriate clearances from the road authorities for the pipeline routing
2. Disruption o f natural drainage during construction due to three canal crossings between Hudali railway gate and Suldal cross, two big nallas at the Ankalgi village
Mitigative Measures
2. Prior approval and clearances from relevant authorities
3 , Minimization o f tree cutting md detailed inventory o f the number o f type o f trees lost due to the alignment and appropriate compensatory plantation for loss o f trees 4. Minimizing the earth work and construction activities, refilling and replacement the excavated topsoil back in the same field and provision o f soil barriers with the excavated earth to avoid spillage on to the agriculture land 5. Reinstatement o f Road Surface in earliest possible time
6. Adequate provisions for compensation to the affected land owners during maintenance works
1. Finalization o f mode and method o f replacement and procuring appropriate clearances
2. Provision o f appropriate by-pass arrangements for natural drainage during construction and adequate provisions in the detailed design for safe passage o f storm water in the channels during
00 -
~ KUWSDB
Agencies Responsible
KUWSDB
KUWSDB, Contractor
KUWSDB, Contractor
City Corporation o f Belgaum
KUWSDB
KUIDFC, KUWSDB
KUWSDB, Contractor

causeway 1 and causeway 2. 3. Clearance o f encroachments in the stretch passing through Ankalgi village.
Project Activity
operation phase 3. Preparation o f appropriate KUWSDB, rehabilitation plans as per WB guidelines
KUIDFC
B. Priority Investments 3.Gulbarga 1. Replacement o f Trunk M a i n from Bhima River-22.4 km
2. Installation o f New Pumps at Pumping Stations
Environmental Impacts
1. Acquisition o f Private Agricultural land for laying the transmission main near Bhima river jack well at Sardagi village till i t reaches the S H 19. 2. Loss o f Fertile Top Soil o f the Agriculture Lands along the alignment
3. Appropriate clearances from the Highway authorities for the pipeline routing since around 17 km o f the pipeline is routed through the S H 19. 4. Loss o f vegetation along the highway.
5. Damage to road at o ld Javergi and new Javergi road junction, SH 19 and Sardagi village junction on the Highway and roads in the residential areas starting from N G O colony up to the treatment plant. 6. Railway crossing at CIB colony and passage through main bus stand 7. Relocation o f encroachments on the existing pipeline at Baratabad. 8. Possible acquisition o f small temple opposite the j a i l along: SH19. 1. Increased noise pollution during installation
Mitigative Measures
I. Preparation o f adequate land icquisition plans before .mplementation
2. Minimizing the earth work and :onstruction activities, refi l l ing md replacement the excavated topsoil back in the same field 3. Prior approval and clearances from relevant authorities
4. Minimization o f tree cutting and detailed inventory o f the number o f type o f trees lost due to the alignment and appropriate compensatory plantation for loss o f trees 5. Reinstatement o f Road Surface in earliest possible time
6. Necessary clearances from the railway authorities and transport authorities 7. Preparation o f appropriate rehabilitation plans as per WB guidelines 8. Preparation o f appropriate rehabilitation plans as per WB guidelines 1. Use o f low noise generating equipment, provision o f Personal Protective equipment, ear muffs,
igencies Responsible
CUWSDB
KUWSDB, Eontractor
KUWSDB
KUWSDB
City Corporation o f Gulbarga
KUWSDB
KUWSDB
KUWSDB
Contractor
- 101 -

etc. for the construction labor and avoiding construction activities during nights
- 102 -

Additional Annex 13: Urban W&S Sector Policy Statement in Karnataka INDIA: Karnataka Urban Water Sector Improvement Project
The policy statement below was issued by the Government o f Kamataka on May 3, 2003.
URBAN DRINKING WATER AND SANITATION POLICY STATEMENT OF THE GOVERNMENT OF KARNATAKA
INTRODUCTION:
Good quality reliable drinking water supply and sanitation are essential basic needs o f every citizen. I t has been the endeavor o f successive Governments o f Kamataka to satisfy this need for al l i t s citizens. I t i s an on-going effort which aims at meeting the growing demand both in the urban and rural areas. The policy framework for rural drinking water provision i s already in place. In vie o f the different institutional structure, and different sets o f issues involved in the delivery o f the services o f urban areas, i t i s necessary to have a separate policy statement for this sector. A detailed sector strategy paper to action plan will be issued later to carry forward the objectives outlined in this statement.
Increasing urbanization has resulted in greater pressure on the existing urban water supply and sanitation systems leading to increasing demand on the one hand to augment the source and improve distribution, and on the other to increase the coverage o f under ground drainage (UGD). At the same time, as stated in the State Water Policy brought out by the Department o f the Water Resources, there i s an urgent need to conserve the l imited water resources o f the State to ensure sufficient availability o f water for various needs as well as for the future. The Government's efforts, therefore, have to focus on raising the levels o f efficiency in the management o f drinking water systems in urban areas so as to give satisfactory service to the citizens while at the same time discouraging over exploitation o f resources and preventing wastage.
OBJECTIVE :
The Government o f Karnataka in partnership with urban local bodies in the State, the Kamataka Urban Water Supply and Drainage Board (KUWSDB) and the Bangalore Water Supply and Sewerage Board (BWSSB) wil l continue and strengthen i t s efforts to provide al l residents o f urban areas o f the State, piped water supply and sanitation services at or near their dwellings. The effort o f the Government o f Karnataka and i t s partner agencies will be to:
0 ensure universal coverage o f water and sanitation services that people want and are willing to pay for; to do so in a manner that preserves the sustainability o f the precious water resources of the State, protects and enhances the commercial and economic sustainability o f the operations & at the same time; and ensure a minimum level o f service to all citizens.
- 103-

INSTITUTIONAL ARRANGEMENTS:
Government of Karnataka: The Government o f Karnataka will continue to be responsible for:
policy formulation; ensuring provision o f the bulk o f the resources required for capacity creation; regulation monitoring and evaluation o f the efficiency o f operations, including prescribing reporting requirements, procurement procedures, etc.; setting minimal service standards; encouraging the use o f public private partnership as well as private sector participation to achieve the sector goals; promotion o f the economic and commercial viability o f water supply systems and the exploitation o f economies o f scale and scope by appropriate aggregation options; institution o f necessary incentives for urban local bodies and other service providers to implement sector reforms; and ensuring coordination and collaboration among the various agencies both at the policy and operation level through the establishment o f appropriate committees and agencies.
Urban Local Bodies (ULBs): In accordance with the principle enshrined in Article 243(W) o f the Constitution o f India read with the Twelfth Schedule, ULBs will be responsible for water supply and sewerage services from water catchment to waste water treatment. The Government o f Kamataka, however, will have the responsibility to monitor that ULBs, provide quality services in accordance with the standards prescribed at the State level. ULBs will have the choice o f providing the services directly through public bodies or through such appropriate Private Sector Participation (PSP) arrangements. Given however, the paramount need for financial and commercial viability o f the operations, the State will monitor strictly policies relating to minimal tariff operational autonomy o f the municipal water operations, etc.
KUWSDB and BWSSB: The Kamataka Urban Water Supply and Drainage Board will continue to be responsible for capacity creations and augmentation in all ULBs and O&M in selected ULBs for the present. Over the medium term, the KUWS&DB will be restructured and i t s role redefined. In the longer term, the KUWS&DB could become a publicly owned independent provider o f technical assistance and management support to ULBs who do not have adequate capacity. Similarly, the appropriate rate o f BWSSB will be defined in the action for the Bangalore City and surrounding areas.
TARIFF:
Given that piped water supply i s expensive, i t i s necessary both for natural resource sustainability and commercial viability o f operations to recover from the users o f water, the full cost o f providing service. The longer term objective i s to establish an appropriate cost recovery mechanism through adequate tariff to ensure that revenues cover operations and maintenance costs, debt service plus a reasonable retum on capital. In the medium term, however, subsidies will continue to be needed and will be focused in areas such as pockets and communities o f
- 104 -

extreme poverty and investments with large scale externalities l ike waste water treatment.
Tari f f wil l be structured in a manner such as to disincentives excessive consumption and wastage o f water, whilst ensuring at least a minimum "l i fe line" supply to the poor. In a realistic time frame o f about five years, efforts wil l be made and ULBs encouraged to achieve 100 percent metering and volumetric pricing based on long run marginal costs.
CAPITAL INVESTMENTS:
Though considerable amount o f capital expenditure has been undertaken for creation o f water supply capacity, this has not been the result entirely o f a coherent plan. The consequences have been:
a mismatched capacities; a no objective criterion based prioritization;
incremental and hence expensive capital decisions leading to duplication and avoidable expenditures.
To deal with al l urban water supply investment issues appropriate state level mechanisms will be established. A revised demand driven urban water action plan based on the principles outlined in this statement will be prepared and the GoK will adopt this after discussing it with al l the relevant agencies. Future capital investments in the sector will be in accordance with this plan. Investments will be guided by the principle o f optimal utilization o f water and water system infrastructure and financial resources, and the financial as well as the social returns on investment.
PFUVATE SECTOR PARTICIPATION (PSP):
To improve efficiency in service provision, continuously update technology and ultimately bring in private investment into sector, the GoK will actively encourage private sector participation. Given the current state o f the sector, PSP will necessarily have to be gradual. Preparatory work for PSP in the sector l ike fostering a culture o f commercialization, encouraging out sourcing, building local capacity and most importantly identifying an expediting the necessary legislative institutional and regulatory changes that are necessary o f PSP will be undertaken in the meanwhile. Given the very different sizes o f urban areas in the State, the GoK will allow a range o f different PSP methods o f service provision and service providers.
NEXT STEPS:
The sector strategy and action plan to be announced as a follow up to this policy will contain details o f the legislative, institutional and coordination mechanisms that are needed to be put in place to cany forward the policy.
- 105 -

- 106-

MAP SECTION