Embed Size (px)
Citation preview
W PS 2O9POLICY RESEARCH WORKING PAPER 2089
Corporate Diversification Some East Asian firms diversifyto circumvent external factor
in East Asia markets subject to high
transaction costs. Other
The Role of Ultimate Ownership diversify as a means of
expropriation by large
and Group Affiliation stockholders. There is
evidence that group affiliation
Stijn Claessens is used to complement firm-
Simeon Djankov level diversification in the
Joseph P. H. Fan creation of internal markets.
Larry H. P. Lang
The World Bank
Financial Operatiolns Vice Presidency
Financial Economics Unit
March 1999
Pub
lic D
iscl
osur
e A
utho
rized
Pub
lic D
iscl
osur
e A
utho
rized
Pub
lic D
iscl
osur
e A
utho
rized
Pub
lic D
iscl
osur
e A
utho
rized
Pub
lic D
iscl
osur
e A
utho
rized
Pub
lic D
iscl
osur
e A
utho
rized
Pub
lic D
iscl
osur
e A
utho
rized
Pub
lic D
iscl
osur
e A
utho
rized

I; 1(Y RESFARCH WORKING PAPER 2089
Summary findings
Using data for more than 2,000 companies from nine Group affiliation is widespread among publicly traded
East Asian economies, Claessens, Djankov, Fan, and corporations in East Asia. Group-affiliated firms are on
Lang examine the interactions between ultimate average associated with diversification discounts. Further
ownership, group affiliation, and corporate analysis reveals that the discounts are attributable to
diversification. diversified firms in the more developed East Asian
They find evidence that allocating resources within economies. By contrast, group affiliation positively
business groups is associated with higher market contributes to diversification performance in less
valuation when external markets are less developed. developed economies.
They also find that group affiliation and firm-level The authors find that group-affiliated firms are more
diversification are used complementarily to exploit the likely to diversify in developing economies but are
relative cost-effectiveness of internal markets. equally likely to diversify in developed economies. When
They reject the hypothesis that diversification patterns diversifying in more developed economies, group-
can be explained by large blockholders' incentive to affiliated firms destroy more value than do independent
reduce risk. But they find support for the hypothesis that firms. In developilng economies, group-affiliated firms
controlling owners use diversification to expropriate are more likely than independent firms to benefit from
other shareholders. diversification in developing economies.
This paper - a product of the Financial Economics Unit, Financial Operations Vice Presidency - is part of a larger effort
in the vice presidency to study corporate performance patterns in East Asia. Copies of the paper are available free from the
World Bank, 1818 H Street NW, Washington, DC 20433. Please contact Rose Vo, room MCI0-628, telephone 202-473-
3722, fax 202-522-2031, Internet address hvolCiworldbank.org. Policy Research Working Papers are also posted on the
Web at http://www.worldbank.org/html/dec/Publications/Workpapers/home.html. The authors may be contacted at
cclaessensCiworldbank.org or sdjankovCkworldbank.org. March 1999. (30 pages)
The Policy Research Workinig Paper Series disseminates the finidings of wvork in progress to encourage the exchange of ideas about
development issues. An objective of the series is to get the findings out quickly, even if the presentations are less than fully polished. Thepapers carry the names of the authors and should be cited accordingly. The findings, interpretations, and conclusions expressed in this
paper are entirely those of the authors. They do not necessarily represent the view of the World Bank, its Executive Directors, or the
countries they represent.
Produced by the Policy Research Dissemination Center

Corporate Diversification in East Asia: The Role ofUltimate Ownership and Group Affiliation
Stijn Claessens*, Simeon Djankov*, Joseph P.H. Fan**, and Larry H.P. Lang***
* World Bank** Hong Kong University of Science and Technology
*** The University of Chicago
We thank Andrei Shleifer and Rene Stulz for helpfiul suggestions, and Ying Lin for excellent researchassistance. A Corresponding author: tel. (202) 473 4748; EM: sdjankovgworldbank.org

Corporate Diversification in East Asia: The Role ofUltimate Ownership and Group Affiliation
1. Introduction
Group affiliation and large block-holders are prevalent features of public corporations
in East Asia (Prowse, 1992; La Porta et al, 1999a; Claessens et al., 1998a), in contrast to
publicly traded companies in the United States which are typically independent and widely-
held. This provides an opportunity to study the role of group affiliation and large block-
holders in corporate policies and performance. In particular, we study how corporate
diversification policy interacts with the group affiliation and ultimate ownership structure of
East Asian firms. We create a unique database containing group affiliation, ultimate
ownership, and diversification data for over 2,000 companies during 1991 through 1996 in
nine East Asian economies.
Using these data, we test three hypotheses pertaining to the causes of diversification.'
The first hypothesis is that East Asian fimns diversify to create internal factor markets which
are more cost-effective in allocating resources compared to external markets (Williamson,
21985; Khanna and Palepu, 1997). The second hypothesis is that corporations diversify
because their ultimate owners wish to reduce their firm-specific risk (Amihud and Lev,
1981).3 We raise a third hypothesis, which has not been tested in the context of
I Previous studies have extensively discussed the motivation and effects of diversification. See Montgomery(1994) for a review.
We use the term "intemal markets" more broadly to capture within-firm markets for raw materials, labor, andfinancial capital. A number of recent studies discuss the costs and benefits of internal markets for financialcapital. See, for example, Gertner et al. (1994), Lamont (1997), Rajan et al. (1997), Stein (1997), Scharfsteinand Stein (1997), Scharfstein (1998), and Shin and Stulz (1998).3 Although we are primarily concerned with large block-holders' risk reduction incentives, we do not rule outthe possibility that risk reduction benefit minority shareholders. Aron (1988) and Hermalin and Katz (1993)argue that diversification alleviates the moral-hazard problem firms face with respect to their managers, becauseit provides multiple performance measures.
1

diversification, namely that diversification is a means for the ultimate owners to expropriate
wealth from minority shareholders.4
We find that diversification is associated with a 5 percent discount of firm value in
East Asia.s The discounts are less pronounced in diversified firms in the poorer economies.
This finding is consistent with the internal market hypothesis recently supported by Khanna
and Palepu (1998a, b) in the case of Chile and India, Perotti and Gelfer (1998) in the case of
Russia, and Fauver et al. (1998) in the global context. Our main goal, however, is to establish
how group affiliation and the firm-level diversification interact with each other, and how they
jointly affect the advantages of internal markets. One conjecture is that group affiliation
serves as an alternative means to firm-level diversification in creating internal markets, i.e.,
there exists a substitutive relationship. Alternatively, group affiliation could complement
firm-level diversification in moving resources within internal markets.
We compare the diversification patterns between firms which are affiliated with
corporate groups and firms which are independent. Surprisingly, we find that group-affiliated
firms are more likely to diversify than independent firms, particularly in less-developed
economies. We also find that the diversification discount reported for the whole sample can
be attributed to group-affiliated firms. This is in part because group affiliation amplifies the
negative effects of firm-level diversification on firm valuation. We argue that when external
markets are subject to high transaction cost, as is the case in less developed countries, group
affiliation is a lower-cost mechanism compared to pure firm-level diversification in
governing business transactions.
4 In a general context, Burkart et al. (1997) and La Porta et al. (1999a) discuss the conflict of interest betweenlarge and small shareholders and the resulting likelihood of expropriation. Burkart et al. (1998) discuss theissues in the context of takeovers. Holderness and Sheehan (1991) provide case-study evidence for the UnitedStates. Denis et al. (1997) provide evidence that managers of US firms pursue value-destroying diversificationbecause they hold only small amounts of stock in their companies.5 The 5-percent discount is comparable to those in prior studies (Lins and Servaes, 1998, and Claessens et al.,1998a). Some studies document larger diversification discounts for U.S. firms (Lang and Stulz, 1994; Bergerand Ofek, 1995; Comment and Jarrell, 1995; Servaes, 1996). However, there is other evidence suggesting that
2
We also test the risk reduction and the expropriation hypotheses. The analysis centers
on the structure of ultimate cash-flow and control rights and their relation with firm
diversification. As argued in Stulz (1988) in the context of tender offers, and Shleifer and
Vishny (1997) in the context of expropriation, the allocation of cash-flow and control rights
can affect corporate policies and firm value. We hence examine whether firm diversification
in East Asia can be attributed to a divergence between ultimate owners' control rights and
cash flow rights. Unlike most U.S. corporations, public corporations in East Asia are
characterized by deviations of control from cash flow rights, caused by cross shareholdings,
stock pyramids, and multiple class stocks. These practices allow owners to gain effective
control of their firms with minimum amount of cash investment. Larger divergence implies
lower firm-specific risk for the owners. It is therefore less necessary to pursue firm
diversification for risk reduction purposes. Larger divergence also implies the opportunity
and incentives for expropriation through diversification increases, because of the weaker link
between firms' performance and owners' wealth. These conflicting interests become stronger
at higher levels of control. We find that larger divergence between control and cash-flow
rights is associated with more diversification, especially at high control levels. This evidence
rejects risk reduction as the reason for diversification and lends support to the expropriation
hypothesis.
The paper proceeds as follows. Section 2 describes the sample and empirical
measures. Section 3 provides an analysis of the effects of group affiliation. Section 4 tests
the internal market hypothesis in the context of corporate diversification in East Asia, with an
emphasis on the role of group affiliation. Section 5 tests the risk reduction and the
expropriation hypotheses through an analysis of the firms' ultimate ownership structure and
diversification patterns. Section 6 concludes.
diversification actually involves benefits foT U.S. fnmns (Matsusaka, 1993; Klein, 1997; HubbaTd and Palia,
3
2. Data and measurement
This study uses data for over 2,000 companies from nine Asian economies-Hong
Kong, Indonesia, South Korea, Japan, Malaysia, Philippines, Singapore, Taiwan and
Thailand-for the year 1996 as assembled in Claessens et al. (1998a).6 We restrict the
sample to firms with sufficient segment and financial data to construct empirical measures,
particularly the diversification measure. Of the 2,980 firms with complete ownership data,
2,187 firms have one or several years of the necessary segment and financial data. Assuming
that the ownership structures of the firms do not change substantially over time, we end up
with a sample of 9,559 firm-years spanning from 1991 through 1996.7
For each of the companies in the database, we identify who the ultimate owners are,
what their share of cash-flow and control rights is, and whether the company is affiliated with
a business group. The corporate group information is supplied by the data sources detailed in
Claessens et al. (1998a). The procedure of identifying ultimate owners is similar to the one
used in La Porta et al. (1999b). An ultimate owner is defined as the shareholder who has at
least 5 percent of the control rights of the company and who is not controlled by anybody
else. If a company does not have an ultimate owner, we classify it as widely-held. We
further classify ultimate owners into four types: widely-held corporations, widely-held
1998; Klein and Saidenberg, 1998).6Worldscope contains fmancial, segment, and block ownership information on companies from 49 countries.The database has been used in several other international studies (for example, Fauver et al. (1998), La Porta etal. (1998a, b), Lins and Servaes (1998) and Claessens et al. (1998a, b)). As our starting point for the datacollection, we use the Worldscope database, which generally provides the names and holdings of large owners.Worldscope has over 8,000 publicly-traded firms in the nine East Asian countries, but only 2,300 companiesprovide detailed ownership information. We supplement the data with information from the Asian CompanyHandbook 1999, the Japan Company Handbook 1999, the 1997 Annual Reports of the Hong Kong, Jakarta,Seoul, Kuala Lumpur, and Manila Stock Exchanges, as well as with ownership data from the Korean Fair TradeCommission, the Securities Exchange of Thailand Companies Handbook (1998), and the Singapore InvestmentGuide (1998). We exclude 852 companies across the nine countries, which have proxy ownership that cannotbe traced to a specific owner. In all cases, we collect the ownership structure as of December 1996 or the end ofthe 1996 accounting year. We end up with 2,980 companies for which have complete ownership informationand where we can trace the ultimate owners.
4

financial institutions, families, including individuals with large stakes, and the state.
Although a company can have more than one ultimate owner, our present analysis focuses on
the largest ultimate owner, i.e., the ultimate owner who has the most control rights.
We further identify the cash-flow rights which support the control by ultimate owners,
as our definition of ownership relies on both cash-flow and control rights. This distinction
can make an enormous difference in the analysis. Suppose, for example, that a family owns
10% of the stock of publicly-traded Firm A, which in turn has 20% of the stock of Firm B.
We would say that the family controls 10% of Firm B, the weakest link in the chain of voting
rights. In contrast, we would say that the family owns 2% of the cash flow rights of Firm B,
the product of the two ownership stakes along the chain. To make the distinction between
cash-flow and control rights, we use firm-specific information on pyramiding structures,
cross-holdings, and deviations from one-share-one-vote rules.
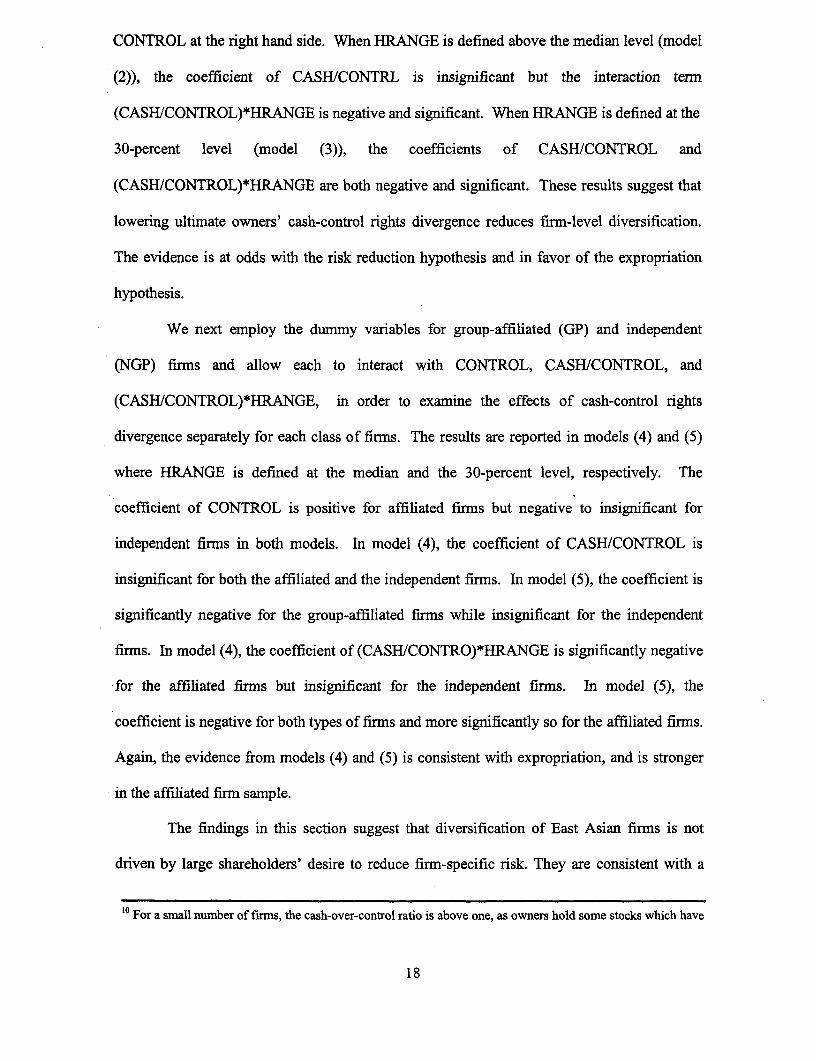
Figure 1: The Leophairatana Group
The Leophairatana |
41 16 22 241 36 42 26
|At3S PIaslia0 Na6bo,4 l T0,i CS,a 3 |~ Thai ldostm6 | | Bgkok Unio0 | TPI' Polene |w . ~~~Pe0ochemnicl | O,,00I,lIr 0 ,uc l 00one
27 Oil7o, ;0
C. e. A6~Mi.Pifi.
o StoOe ~
313P- ._+I Phih,pm,j,
36
7T'he number of useable observations (firm-years) in the following analysis may be less than 9,559 due tomissing data.

To understand the variety of ownership structures that determine the ultimate control of
companies, we provide two examples from our data. The examples show some of the
complications in the construction of ultimate ownership and the wealth of data that are
necessary to ensure proper tracing of the ultimate owners in East Asian corporations. Figure
1 shows the organizational structure of the Leophairatana group, the fifth largest family-
controlled group in Thailand. The group was founded by the late Porn Leophairatana who
established the first corporate enterprise, Hong Yiah Seng Co., in 1946. Initially the group
specialized in retailing textile products, but later moved to agro-industry by incorporating
United Grain Co., and the financial sector, by incorporating Cathay Finance and Bangkok
Union Insurance. The group is best-known for its activities in the petrochemical industry,
where it has large companies in Thailand and the Philippines. The group had 37 affiliates in
1996, of which five (Thai Petrochemical Industry Corp., TPI Polene, National Petrochemical,
Bangkok Union Insurance, and Cathay Finance) were listed on the Stock Exchange of
Thailand.
We first look at the ultimate ownership structure of Asian Dragon Oil Refinery (left
panel of Figure 1). The company's controlling owner with 44% of the voting rights is
National Petrochemical, which in turn is controlled by the Leophairatanas who have 16% of
the voting rights. We then say that the Leophairatanas have the ultimate control of Asian
Dragon Oil refinery with 16% of the voting rights, the weakest link in the chain of control,
and about 6% of the cash-flow rights, the product of ownership along the chain. We also
study the ultimate ownership structure of TPI Concrete (right panel of Figure 1). The
Leophairatana family has a 26% direct control of TPI Polene. In turn, TPI Polene has a 37%
control of TPI Concrete. Thus the family has control of 26% of the votes in TPI Concrete,
with about 6% of the cash-flow rights.
6

These examples show that ultimate cash-flow and control rights are described both by
their level, and by the type of shareholder. More complicated cases which involve cross-
holdings of companies within the group, and longer chains of control through pyramiding are
discussed in Claessens et al. (1998b). For the purposes of the subsequent analysis, we
assume that any corporation which is at least 20% controlled by the owner of the business
group is an affiliate. This cut-off level is identical to the one used in La Porta et al. (1999b),
and allows us to create a dummy variable for business group membership.
Having built the ultimate ownership structure of each firm in our data, we next group
firms which are controlled by the same ultimate owner. The data requirements make it
impossible to track all business groups in each country-there are 150 family-controlled
groups in Thailand alone. Since our data are restricted to listed companies, many privately-
controlled firms affiliated with groups do not appear at all. We hence focus on the largest
twelve business groups in each country in terms of market capitalization.8
We define the diversification level of a firm as the number of industries in which the
firm operates. This number count reasonably captures the breadth of the firm's activities. To
determine firms' diversification levels, we employ segment information. Worldscope reports
segmental sales breakdown and business description for the three latest available fiscal years.
Relatively fewer companies are covered by the database in earlier years. To increase sample
8 The following large business groups are identified in the data, given by the name of the controlling owner:Hong Kong (Li-ka Shing, Nina Wang, Henry Fok, Stanley Ho, the Kwok brothers, Lee Shan Kee, Chen DinHwa, Sir Adrian and Sir John Swrite, Cheng Yu-Tung, the Chuang brothers, and the Ng family); Indonesia(Salim, Sinar Mas, Astra, Lippo, Gudang Garam, Djarum, Dharmala, Bob Hasan, Barito Group, ArgoManunggal, and Bakrie); Japan (Mitsui, Mitsubishi, Yasuda, Sanwa, Dai-ichi, Industrial Bank of Japan, TokaiBank, Daiwa Bank, Hankyu); Korea (Hyundai, Samsung, LG, Daewoo, Sunkyung, Ssangyong, Hanjin, Kia,Hanwha, Lotte, Kumho, Doosan), Malaysia and Singapore8 (Lee Seng Wee, Kuok, Hong Leong, Amanah Raya,Pernas Charter, Yeoh Tiong Lay, Berjaya, Haw Par brothers, the Arab-Malaysian Fund, Harrison andGrosfield); the Philippines (Ayala, Soriano, Aboitiz, Concepcion, Gokongwei, Sy, Go, Ty, Lopez, and Rosario);Taiwan (Farmosa, Koumintang, Lee, Li, Chen), and Thailand (Sirivadhanabhakdis, Sophonpaniches, Lamsams,Techapaibuls, Wanglees, Chearavanonts, Phatrasits, Leophairatanas, Shinawatras, Kajanapas, Viriyapraikit, andChirathivats).
7

size, we collected additional segment data from the 1994-1998 autumn editions of the Asian
Company Handbook and the Japan Company Handbook.
Since companies report their segment data at different levels of detail, we follow
Claessens et al. (1998a) and group the companies' segments according to the two-digit
Standard Industry Classification (SIC) system. This procedure involves two steps. In the
first step, we assign the four-digit SIC codes reported by Worldscope to the appropriate
segments. In many cases we are able to obtain one-to-one matches between SIC codes and
segments. Some companies report different numbers of SIC codes from their segment
numbers. If a segment can not be associated with any reported SIC code, we determine the
segment's SIC code according to its business description. If a segment is associated with
multiple SIC codes, it is broken down equally so that each segment is associated with one
SIC code. In the second step, we redefine segments at the two-digit SIC level and aggregate
segment sales to that level as well.
Following Lins and Servaes (1998) and Fauver et al. (1998), we classify firms as
single-segment if at least 90 percent of their total sales are derived from one two-digit SIC
segment. Firms are classified as multi-segment if they operate in more than one two-digit
SIC industry and none of their two-digit SIC segments accounts for more than 90 percent of
total firm sales. Lastly, we measure a firm's diversification level as the number of its
segments defined at the two-digit SIC level.
To measure firm diversification performance, we employ the excess value approach
of Berger and Ofek (1995) and modified by several recent cross-country studies (Lins and
Servaes, 1998, and Fauver et al., 1998). This approach defines the excess value as the natural
logarithm of the ratio of the firm's actual value to its imputed value. Market capitalization,
the market value of common equity plus the book value of debt, is used as the measure of
actual firm value. The imputed value is calculated as follows. We first compute median
8

market-to-sales ratio for each two-digit SIC industry in each country using only single-
segment firms. The market-to-sales ratio is the market capitalization divided by firm sales.
We then multiply the level of sales in each segment of a firm by its corresponding industry
median market-to-sales ratio.9 The imputed value of the firm is obtained by summing the
multiples across all segments.
3. The analysis of group affiliation
To provide evidence on the significance of business groups in East Asia, we report the
fraction of firms affiliated with business groups in each country (Table 1). In Indonesia,
Japan, the Philippines, and South Korea, the majority of companies in the sample are group
affiliates. In Hong Kong, Malaysia, and Thailand, over 40 percent of the sample firms are
affiliated with business groups. Business groups are less important in Singapore and Taiwan,
where only 20 and 12 percent of firms are group-affiliated, respectively.
One explanation for the prevalence of business groups in East Asia is the creation of
internal factor markets for capital, labor, and raw materials. If the corresponding external
markets are subject to distortions, the internal markets can be lower-cost alternatives to
govern factor transactions (Coase, 1937, Williamson, 1985). Following this argument, group
affiliation could be a substitute for firm-level diversification in creating internal markets. To
examine the substitution hypothesis, we compare the incidence of group affiliation between
multi- and single-segment firms. Also from Table 1, multi-segment firms in 7 of the 9
countries have higher degree of group-affiliation than single-segment firms. The differences
are statistically significant for Hong Kong, Japan, South Korea, Singapore, and Taiwan. In
the remaining four countries, multi-segment and single-segment firms are equally likely to be
9 In the computation of the industry median market-to-sales ratio, we restrict the number of single-segment firmsto be at least three. In some cases, we do not have sufficient number of fnms to compute the medians. In thesecases, we use the median capital value of broader industry groups as defined by Campbell (1996). When an
9

group-affiliated. Overall, the statistics indicate that group-affiliated finns are more
diversified than are independent firms. This is inconsistent with the substitution hypothesis
which predicts less diversification of group-affiliated firms relative to independent firms.
Table 2 provides further comparison between group-affiliated firrns and independent
finns using the pooled sample. In terms of segment number, the group-affiliated firrns have
an average of 2.35 segments, about the same as that of the independent firms. Consistent with
the country-by-country results, over 58 percent of the group-affiliated firms are multi-
segment, significantly higher than the 54 percent reported for the independent firms. Again,
the evidence is not consistent with the substitution hypothesis arguing for a negative relation
between group affiliation and firn-level diversification.
Table 2 also compares the structure of ultimate ownership between group-affiliated
and independent firms. The mean level of ultimate owners' cash flow rights is 12 percent for
affiliated firms, significantly lower than the average 22 percent cash-flow rights associated
with the ultimate owners of independent firms. Similarly, the mean control level by the
ultimate owners of group-affiliated firms is 16 percent, significantly lower than the average
24 percent control level associated with the ultimate owners of independent firms. For both
types of firms, the mean cash flow rights level is lower than the control rights level.
There are also differences across ownership types. Of the group-affiliated firmns, 3.84
percent are controlled by widely-held corporations, 61.09 percent by widely-held financial
institutions, 33.49 percent by families, 0.82 percent by the state, and 0.75 percent are widely-
held. Of the independent firms, the corresponding percentages are 22.56, 7.43, 46.91, 16.51,
and 6.60. These statistics show that financial institutions dominate other types of ultimate
owners in controlling group-affiliated firms. On the other hand, families dominate in
controlling independent firms. Lastly, the mean excess value (before taking logs) of group-
industry has fewer than three single-segment furms even defined broadly as in the Campbell study, we use the
10

affiliated firms is significantly lower than that of the independent finns, suggesting poorer
performance. Group-affiliated firms also have lower accounting profitability, measured by
operating income over sales, higher leverage, measured by total debt over total assets, and
larger size, measured by total assets.
The analysis so far indicates that group-affiliated firms' diversification performance is
poorer than that of independent firms. We now examine the relation in a regression
framework to control for other impacting factors. We regress the excess value (EXV) on the
diversification level (DIVER), operating income over sales (OPINC), total debt to assets
(LEV), and the natural logarithm of firm assets (Log(ASSETS)). The inclusion of the latter
three variables is to control for the effects of short-term profitability, leverage, and firm size
on excess value. We also include country and year dummy variables to control for fixed
effects. Table 3 presents the results of the ordinary least square regressions. In models (1)
and (2), DIVER is a dummy variable equal to one if the firm has a multiple number of
segments, zero otherwise. In model (3) and (4), DIVER is the number of firm segments.
Initially we focus on the results of model (1) and (3). The estimated coefficients of
DIVER are both negative and significant at the one-percent level, suggesting that
diversification by East Asian firms is on average associated with value discounts. When
diversification level is measured by the multi-segment dummy variable, the discount is
around 5 percent. The magnitude of the discount is comparable to those reported in prior
studies (Lins and Servaes, 1998, and Claessens et al., 1998a). In model (2) and (4), we
separately assess the diversification performance of group-affiliated and independent firms.
We create a dummy variable for group-affiliated firms (GP) and another dummy variable for
independent firms (NGP). GP and NGP are then each interacted with DIVER. The results
indicate that the diversification discount is mainly attributed to group-affiliated firns. The
median of all firms in the country. This procedure avoids the loss of observations.
11

estimated coefficients for GP*DIVER are both negative and significant in models (2) and (4).
The coefficient on NGP*DIVER is insignificant in model (2) and only weakly negative in
model (4). Confirming the earlier findings, firms affiliated with business groups are
associated with inferior diversification performance relative to independent firms.
4. The internal-market hypothesis
The intemal market hypothesis states that diversification is more likely to be
beneficial in less developed economies, for their external markets are subject to more
distortions and hence are more costly. This could influence the results of the previous section
as firms in more developed markets could account for the occurrence of the diversification
discount. To study the role of group-affiliation in internal markets, we examine how the level
of economic development affects the diversification performance of group-affiliated and
independent firms. As before, we regress EXV on GP*DIVER and NGP*DIVER. In
addition, the two terms are each interacted with per-capita gross national products (GNP) of
the firm's country of origin, where GNP serves as a proxy for the level of economic
development. We again control for the effects of short-term profitability, leverage, and firm
size by including OPINC, LEV, and Log(ASSETS) as additional explanatory variables.
Lastly, we include year dummy variables to control for fixed-time effects.
The results are presented in Table 4. In model (1), DIVER is the multiple-segment
dummy variable. In model (2), DIVER is the number of firm segments. The estimated
coefficients of GP*DIVER and NGP*DIVER are both insignificantly different from zero,
suggesting group affiliation per se does not explain diversification performance. The
estimated coefficients of GP*DIVER*GNP, however, are negative and significant at the one-
percent level in both models. The evidence suggests that the diversification performance of
group-affiliated firms is negatively related to the level of economic development. In contrast,
12

the coefficients of NGP*DIVER*GNP are insignificant, suggesting a lack of relation between
independent firms' diversification performance and economic development.
We next use an alternative approach to examine the effects of economic development
on diversification performance. This approach uses discrete measures to capture differences
in economic development among countries. The nine countries are classified into three
different income groups, following the World Bank classification. Hong Kong, Japan,
Singapore, and Taiwan are classified as high-income countries. Korea and Malaysia are
classified as higher-middle-income countries. The remaining three countries (Indonesia, the
Philippines, and Thailand) are classified as lower-middle-income countries. We create a
dummy variable, HINCOME, equal to one if the firm's is from the high-income countries,
zero otherwise, and a dummy variable, LINCOME, equal to one if the firm is from the lower-
middle-income countries. We then run the excess value regressions that interact each of the
two income dummy variables with GP*DIVER and NGP*DIVER. This in effect treats the
higher-middle-income countries as the numeraire.
The results are presented in models (3) and (4) of Table 4. As before, DIVER stands
for the multi-segment dummy variable and the number of firm segments in model (3) and (4),
respectively. First, we focus on the interaction terms associated with group-affiliated firms.
The coefficient of GP*DIVER*HINCOME is negative and significant in both models. In
contrast, the coefficient of GP*DIVER*LINCOME is positive and significant in model (3)
but insignificant in model (4). The evidence suggests that diversification by group-affiliated
firms in high-income countries is associated with poorer performance, but the reverse is true
in the lower-middle-income countries. Next we study the interaction terms for independent
firms. The coefficient of NGP*DIVER*HINCOME is insignificant in model (3) but is
negative and significant at the 5-percent level in model (4). The coefficient of
NGP*DIVER*LINCOME is insignificant in both models. This suggests that diversification
13

by independent firms in less developed economies does not hurt performance. In more
developed economies, there is weak evidence that performance worsens when independent
firms diversify. The negative relation between diversification performance and economic
development is consistent with the internal market hypothesis and with the findings of Fauver
et al. (1998).
The stark contrast in diversification perfornance of group-affiliated firms at different
levels of economic development requires further explanation. The evidence points to the
possibility that group affiliation and firm-level diversification are complementary in affecting
the net benefits (costs) of internal markets. In less developed economies where internal
markets provide net benefits, the combination of group affiliation and firm-level
diversification could be the lowest-cost method of governing transactions. In more
developed economies where external markets are competitive, business group affiliation may
raise the costs of firm diversification. Our evidence in models (3) and (4) is consistent with
the complementarity argument.
We next examine the effects on diversification of group affiliation, economic
development, and their interactions (Table 5). The dependent variable in all three models is
the number of segments. All models control for short-term profitability, leverage, firm size,
and year effects. In model (1), we include the group-affiliation dummy variable (GP) and
control for the fixed-country effects. The estimated coefficient of GP in model (1) is positive
and significant at the one-percent level. This confirms our earlier finding that group-
affiliated firms are more likely to diversify than independent firms. In model (2), we also
include GNP and allow it to interact with GP. The coefficient of GP remains positive and
significant. The coefficient of GNP is still positive, suggesting higher diversification by
firms in more developed countries. The coefficient of the interaction term (GP*GNP) is
14

negative and significant at the one-percent level, suggesting a negative relation between
economic development and group-affiliated firms' diversification levels.
Model (3) uses discrete income-level dummy variables to further investigate the
interactive effects of economic development and group affiliation. The coefficient of
LINCOME is significantly negative, suggesting less diversification in lower income
countries. The coefficient of GP*HINCOME is insignificantly different from zero, while the
coefficient of GP*LINCOME is positive and significant at the one-percent level. The
evidence suggests that group-affiliated firms are more likely to diversify in the lower income
countries relative to independent firms. They are equally likely to diversify in the higher
income countries.
The interactive effects conform with the valuation effects in Table 4. The higher
incidence of diversification by group-affiliated firms in less developed countries is consistent
with the view that group affiliation and firm-level diversification complement each other in
lowering the costs of resource allocation.
5. The Risk Reduction and Expropriation Hypotheses
So far we have found that East Asian firms' diversification patterns and their
performance are related to group affiliation and economic development. We are able to
attribute some of the relations to the internal market hypothesis. We are still left, however, to
answer why some firms' diversification is associated with a discount.
In this section, we examine two possible explanations for the diversification discount:
risk reduction by large block-holders and expropriation of minority shareholders. The risk
reduction hypothesis states that diversification is a means for large shareholders to reduce the
risks associated with their firm-specific investments. Risk reduction need not benefit small
shareholders whose wealth is more diversified. In fact, it could hurt small shareholders since
15

managers may pass on positive net-present-value (NPV) projects if they are overly risky to
the large owners or invest in low-risk projects even if these projects have negative NPV. The
expropriation hypothesis states that large owners have the incentive to expropriate minority
shareholders by making investments that benefit themselves at the expense of minority
shareholders. Examples are channeling corporate resources to projects that generate utility
for the large owners but provide little benefits to the minority owners.
Both the risk reduction and the expropriation hypotheses predict that the possibility of
value-destroying diversification increases as the ownership stake of large block-holders
increases. If there is divergence between cash-flow and control rights, however, this relation
may change. If cash-flow rights are low-but control rights high-an ultimate controlling
owner has little incentives to diversify in order to reduce firm-specific risk. At the same
when control rights are high and cash-flow rights low, expropriation is more likely since the
controlling owner gains in private benefits but bears little of the consequences of the
reduction in the firm's value. Thus we should be able to distinguish the two hypotheses by
examining the diversification patterns of the firms at high levels of control, and with levels of
cash-flow rights. In the presence of divergence between cash-flow and control rights, the
expropriation hypothesis predicts the incidence of value-destroying diversification at high
levels of control right, but low cash-flow rights, while the risk reduction hypothesis predicts a
low incidence of diversification.
Before we formally test the two hypotheses, it is useful to examine how East Asian
firms' diversification patterns correlate with their ultimate owners' control levels. We report
mean diversification statistics across different levels of ultimate owners' control (Table 6).
Initially, we focus on the overall patterns. For widely-held firms, the average segment
number is 2.18 (Panel A). The average segment number increases as the control level
increases. It reaches its maximum (over 2.58) at some control level between 20 and 30
16

percent. Then it decreases and finally reaches 2.20 at the highest control level (50% or
above). Panel B reports the fraction of firms with multiple segments across control levels. A
similar inverse bowl-shape pattern emerges. The multi-segment fraction initially increases
from 0.49 at the widely-held level to 0.63 at the 20-percent level, then begins to decrease and
eventually dropped to 0.52 percent at the 50-percent-or-above level. We also examine group-
affiliated and independent firms separately and find similar inverse bowl-shape patterns.
This evidence is consistent with the expropriation hypothesis and is at odds with the risk
reduction hypothesis. The simple comparisons across control levels do not account, however,
for the possibility of divergence between cash-flow and control rights. If existent, such
divergence may explain the pattern of diversification.
We next investigate whether East Asian firms' diversification patterns are related to
the divergence of their ultimate owners' cash flow from control rights. To proxy for
divergence, we construct a variable, CASH/CONTROL, where CASH and CONTROL are the
ultimate owner's cash flow and control rights percentages, respectively. By construction, the
variable is inversely related to divergence and is bounded between zero and one.10 We
perform regression analysis after deleting zero-value control rights observations (Table 7). In
model (1), we regress the number of segments on divergence. The estimated coefficient for
CASH/CONTROL is negative and significant at the one-percent level, suggesting that a lower
divergence of cash flow and control rights is associated with less diversification.
We next examine the effects of divergence at higher levels of control rights. We
construct a dummy variable HRANGE equal to one if the owner's control is greater than the
sample median, and otherwise zero. Alternatively, we assign HRANGE a value one if the
control is greater than 30 percent, and otherwise zero. We modify the regression model by
allowing the divergence variable to interact with HRANGE and adding an additional variable
17
CONTROL at the right hand side. When HRANGE is defined above the median level (model
(2)), the coefficient of CASH/CONTRL is insignificant but the interaction term
(CASH/CONTROL)*HRANGE is negative and significant. When HRANGE is defined at the
30-percent level (model (3)), the coefficients of CASH/CONTROL and
(CASH/CONTROL)*HRANGE are both negative and significant. These results suggest that
lowering ultimate owners' cash-control rights divergence reduces firm-level diversification.
The evidence is at odds with the risk reduction hypothesis and in favor of the expropriation
hypothesis.
We next employ the dummy variables for group-affiliated (GP) and independent
(NGP) firms and allow each to interact with CONTROL, CASH/CONTROL, and
(CASH/CONTROL)*HRANGE, in order to examine the effects of cash-control rights
divergence separately for each class of firms. The results are reported in models (4) and (5)
where HRANGE is defined at the median and the 30-percent level, respectively. The
coefficient of CONTROL is positive for affiliated firms but negative to insignificant for
independent firns in both models. In model (4), the coefficient of CASH/CONTROL is
insignificant for both the affiliated and the independent firms. In model (5), the coefficient is
significantly negative for the group-affiliated firms while insignificant for the independent
firms. In model (4), the coefficient of (CASH/CONTRO)*HRANGE is significantly negative
for the affiliated firms but insignificant for the independent firms. In model (5), the
coefficient is negative for both types of firms and more significantly so for the affiliated firms.
Again, the evidence from models (4) and (5) is consistent with expropriation, and is stronger
in the affiliated firm sample.
The findings in this section suggest that diversification of East Asian firms is not
driven by large shareholders' desire to reduce firm-specific risk. They are consistent with a
° For a small number of firms, the cash-over-control ratio is above one, as owners hold some stocks which have
18

view that large owners use diversification to extract private gains at the expense of minority
shareholders. In a companion paper (Claessens et al, 1998b), we study the relation between
market valuation and ownership structure in East Asian countries and find that divergences in
control rights from cash-flow rights are indeed associated with minority shareholder
expropriation.
6. Summary and conclusions
We examine the role of business group affiliation and ultimate ownership structure in
East Asian firms' diversification policy and performance. We document that group affiliation
is wide-spread among publicly-traded corporations in East Asia. Group-affiliated firms are
on average associated with diversification discounts. Further analysis reveals that the
discounts are attributable to diversified firms in the more developed East Asian economies.
In contrast, group-affiliation positively contributes to diversification performance in less
developed economies. These results are consistent with the internal market hypothesis.
We further compare the diversification patterns and performance between group-
affiliated and independent firms. We find that group-affiliated firms are more likely to
diversify in less developed economies but equally likely to diversify in more developed
economies. When diversifying in more developed economies, group-affiliated firms destroy
more value than do independent firms. Group-affiliated firms are more likely than
independent firms to benefit from diversification in less developed economies. The evidence
is consistent with the hypothesis that group affiliation enhances the effects of finn-level
diversification.
We also seek to explain why diversification by some firns is associated with poor
performance. We propose risk reduction and expropriation by ultimate owners as two
no voting rights.
19
alternative explanations. To test these hypotheses, we examine the cash-flow and control
structure of ultimate ownership. We document an inverse bowl-shape relationship between
diversification level and control level. This pattern is inconsistent with the risk reduction
hypothesis which predicts a continuous increase, but is consistent with the expropriation
hypothesis. Increasing ultimate owners' control increases their ability to expropriate minority
shareholders. The ultimate owners have the incentive to do so because they enjoy the
benefits but only bear part of the costs. We also find that the firms' diversification levels are
positively related to the degree of divergence of their ultimate owners' cash flow and control
rights, particularly at high control levels. The evidence is inconsistent with risk reduction and
lends further support to the expropriation hypothesis.
In summary, we provide evidence that some East Asian firms diversify to circumvent
external factor markets that are subject to high transaction costs. Others diversify as a means
of expropriation by large stock-holders. There is evidence that group affiliation is used to
complement firm-level diversification in the creation of internal markets. Future research
into the specific relations between group affiliation and firm-diversification would help us
understand more about the causes and effects of the organizational structure of firms.
20

References
Aron, Debra J., 1988, "Ability, Moral Hazard, Firm Size, and Diversification," Rand Journalof Economics, 19, 72-87.
Barclay, Michael and Clifford Holderness, 1989, "Private Benefits from Control of PublicCorporations," Journal of Financial Economics, 25, 371-95.
Berger, Philip G. and Eli Ofek, 1995, "Diversification's Effect on Firm Value," Journal ofFinancial Economics, 37, 39-65.
Burkart, Mike, Denis Gromb, and Fausto Panunzi, 1997, "Large Shareholders, Monitoring,and the Value of the Firm," Quarterly Journal of Economics, 112, 693-728.
Burkart, Mike, Denis Gromb, and Fausto Panunzi, 1998, "Why Higher Takeover PremiaProtect Minority Shareholders?" Journal of Political Economy, 106, 172-204.
Campbell, J. , 1996, "Understanding Risk and Return", Journal of Political Economy, 104,298-345.
Claessens, Stijn, Simeon Djankov, Joseph P.H. Fan, and Larry H.P. Lang, 1998a,"Diversification and Efficiency of Investment by East Asian Corporations," WorldBank, Working Paper.
Claessens, Stijn, Simeon Djankov, Joseph P.H. Fan, and Larry H.P. Lang, 1998b,"Expropriation of Minority Shareholders: Evidence from East Asian Corporations,"World Bank, Working Paper.
Coase, Ronald, 1937, "The Nature of the Firm," Economica 4, 386-405.
Comment, Robert and Gregg A. Jarrell, 1995, "Corporate Focus and Stock Returns," Journalof Financial Economics 37, 67-87.
Demsetz, Harold and Kenneth Lehn, 1985, "The Structure of Ownership: Causes andConsequences," Journal of Political Economy 93, 1155-77.
Denis, D.J., D.K. Denis and A. Sarin, 1997, "Agency Problem, Equity Ownership, andCorporate Diversification," Journal of Finance 52, 135-160.
Gertner, R., D. Scharfstein, and J. Stein, 1994, "Internal vs. External Capital Markets,"Quarterly Journal of Economics 109, 1211-1230.
Fauver, L., J. Houston and A. Naranjo, 1998, "Capital Market Development, Legal Systemsand the Value of Corporate Diversification: A Cross-Country Analysis," Mimeo,University of Florida.
Hermalin, Benjamin E., and Michael L. Katz, 1993, "Corporate Diversification and Agency,"Mimeo, University of California, Berkeley.
Holderness, C. and D. Sheehan, 1988, "The role of majority shareholders in publicly heldcompanies," Journal of Financial Economics, 20, 317-346.
21

Holdemess, Clifford G. and Dennis P. Sheehan, 1991, "Monitoring an Owner," Journal ofFinancial Economics, 30, 325-346.
Hubbard, R.G. and D. Palia, 1998, "A Reexamination of the Conglomerate Merger Wave inthe 1960s: An Internal Capital Market Approach," Journal of Finance, forthcoming.
Jensen, Michael C. and William H. Meckling, 1992, "Specific and General Knowledge, andOrganizational Structure," in Lars Werin and Hans Wijkander eds., ContractEconomics, Cambridge, MA: Blackwell Publishers.
Khanna, Tarun, and Krishna Palepu, 1997, "Why Focused Strategies May Be Wrong forEmerging Markets," Harvard Business Review, July-August, 41-51.
Khanna, Tarun, and Krishna Palepu, 1998a, "Policy Shocks, Market Intermediaries, andCorporate Strategy: The Evolution of Business Groups in Chile and India," WorkingPaper, Harvard Business School.
Khanna, Tarun, and Krishna Palepu, 1998b, "The Future of Business Groups in EmergingMarkets: Long Run Evidence from Chile," Journal of Economics and ManagementStrategy, forthcoming.
Klein, Peter G., 1997, "Were the Conglomerates Inefficient? A Reconsideration," Mimeo,University of Georgia.
Klein, Peter G., and Marc Saidenberg, 1998, "Diversification, Organization, and Efficiency:Evidence from Bank Holding Companies," Working Paper, University of Georgia andFederal Reserve Bank of New York.
La Porta, Rafael, Florencio Lopez-de-Silanes, Andrei Shleifer, and Robert W. Vishny, 1998a,"Law and Finance," Journal of Political Economy, forthcoming.
La Porta, Rafael, Florencio Lopez-de-Silanes, Andrei Shleifer, and Robert W. Vishny, 1998b,"Corporate Ownership around the World," Journal of Finance, forthcoming.
Lamont, O., 1997, "Cash Flows and Investment: Evidence from Internal Capital Markets,"Journal of Finance 52, 83-109.
Lang, Larry H.P. and Rene M. Stulz, 1994, "Tobin's q, Corporate Diversification, and FirmPerformance," Journal of Political Economy, 102, 1248-1280.
Lins, K. and H. Servaes, 1998, "Is Corporate Diversification Beneficial in EmergingMarkets?" Working Paper, University of North Carolina.
Matsusaka, John G., 1993, "Takeover Motives during the Conglomerate Merger Wave,"Rand Journal of Economics, 24, 357-379.
McConnell, John and Henri Servaes, 1990, "Additional Evidence on Equity Ownership andCorporate Value," Journal of Financial Economics, 27, 595-612.
Montgomery, Cynthia A., 1994, "Corporate Diversification," Journal of EconomicPerspectives, 8, 163-178.
Morck, R., A. Shleifer and R. Vishny, 1988, "Management Ownership and Market Valuation:An Empirical Analysis," Journal of Financial Economics 20, 293-315.
22

Perotti, Enrico C. and Stanislav Gelfer, 1998, "Investment Financing in Russian Financial-Industrial Groups," Working Paper, University of Amsterdam and CEPR, andRussian-European Center for Economy Policy.
Prowse, Stephen, 1992, "The Structure of Corporate Ownership in Japan," Journal ofFinance, 47, 1121-1140.
Rajan, R., H. Servaes, and L. Zingales, 1997, "The Cost of Diversity: The DiversificationDiscount and Inefficient Investment," Working Paper, The University of Chicago.
Scharfstein, D.S., 1998, "The Dark Side of Internal Capital Markets II: Evidence fromDiversified Conglomerates," Working Paper, MIT Sloan School of Management.
Scharfstein, David and Jeremy Stein, 1997, "The Dark Side of Internal Capital Markets:Divisional Rent-Seeking and Inefficient Investment", NBER working paper no 5969.
Servaes, Henri, 1996, "The Value of Diversification During the Conglomerate MergerWave," Journal ofFinance, 51, 1201-1225.
Shin, H. and R. Stulz, 1998, "Are Internal Capital Markets Efficient?" Quarterly Journal ofEconomics, 113, 531-552.
Shleifer, Andrei and Robert Vishny, 1986, "Large Shareholders and Corporate Control,"Journal of Political Economy, 94, 461-488.
Shleifer, Andrei and Robert Vishny, 1988, "Management Entrenchment, the Case ofManager-Specific Investments," Journal of Financial Economics, 25, 123-139.
Stein, Jeremy C., 1997, "Internal Capital Markets and the Competition for CorporateResources," Journal of Finance, 52, 111-133.
Stulz, Rene M., 1988, "Managerial Control of Voting Rights: Financing Policies and theMarket for Corporate Control," Journal of Financial Economics, 20, 25-54.
Williamson, Oliver E., 1985, The Economic Institutions of Capitalism, New York, NY: TheFree Press.
23
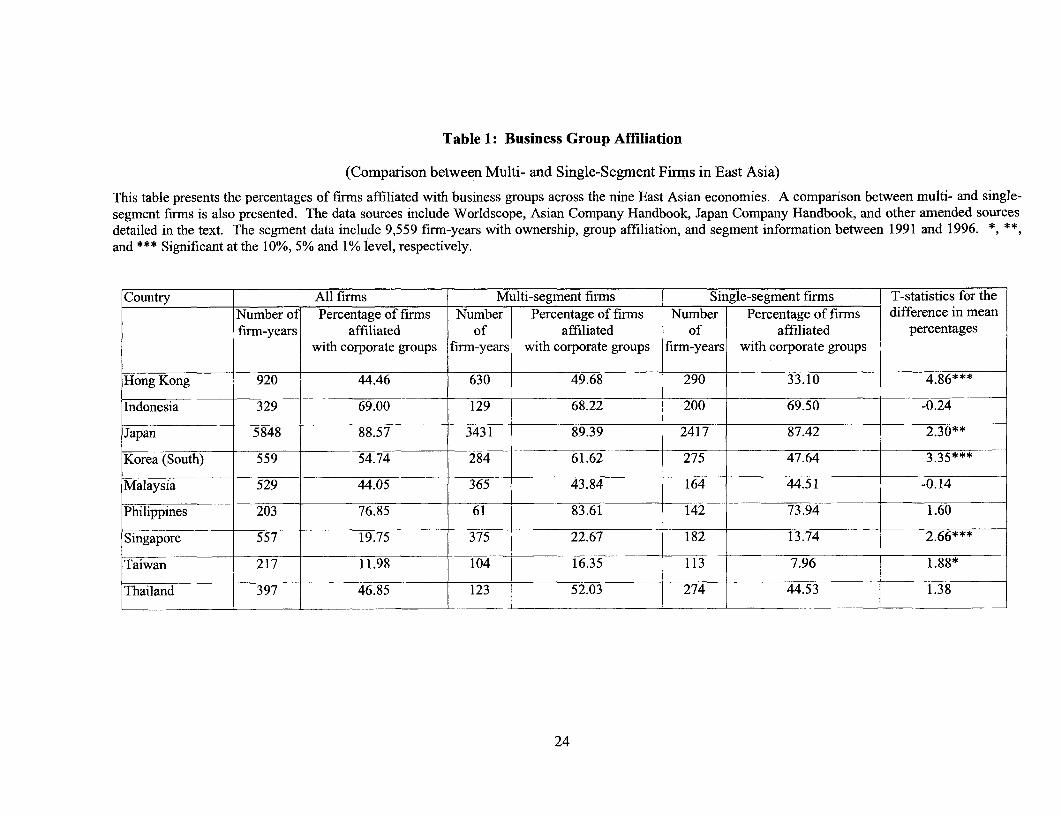
Table 1: Business Group Affiliation
(Comparison between Multi- and Single-Segment Firms in East Asia)
This table presents the percentages of firms affiliated with business groups across the nine East Asian economies. A comparison between multi- and single-segment firms is also presented. The data sources include Worldscope, Asian Company Handbook, Japan Company Handbook, and other amended sourcesdetailed in the text. The segment data include 9,559 firm-years with ownership, group affiliation, and segment information between 1991 and 1996. *, *and *** Significant at the 10%, 5% and 1% level, respectively.
Country All firms Multi-segment firms Single-segment firms T-statistics for theNumber of Percentage of firms Number Percentage of firms Number Percentage of firms difference in meanfirm-years affiliated of affiliated of affiliated percentages
with corporate groups firm-years with corporate groups firm-years with corporate groups
Hong Kong 920 44.46 630 49.68 290 33.10 4.86***
Indonesia 329 69.00 129 68.22 200 69.50 -0.24
Japan 5848 88.57 3431 89.39 2417 87.42 2.30**
Korea (South) 559 54.74 284 61.62 275 47.64 3.35***
Malaysia 529 44.05 365 43.84 164 44.51 -0.14
Philippines 203 76.85 61 83.61 142 73.94 1.60
Singapore 557 19.75 375 22.67 182 13.74 2.66***
Taiwan 217 11.98 104 16.35 113 7.96 1.88*
Thailand 397 46.85 123 52.03 274 44.53 1.38
24

Table 2: Ultimate Ownership and Diversification Structures
(Comparison between Group Affiliated and Independent Firms)
This table presents the mean statistics of diversification levels and performance, ulfimate ownership structures,and other descriptive variables for the East Asian firms. The data sources include Worldscope, Asian CompanyHandbook, Japan Company Handbook, and other amended sources detailed in the text. The segment andfinancial data include 9,559 firn-years between 1991 and 1996. The group affiliation and ultimate ownershipdata include 2,187 firms in 1996. *** Significant at the 1% level.
Total Group affiliated Independent T-statistic forfirms firms difference in means
Average number of segments 2.34 2.35 2.33 0.42
Percentage of firms with 57.56 58.83 54.37 3.97***multiple segments
Percentage of cash flow rights of 14.93 11.58 21.67 -17.12***the ultimate owner
Percentage of control rights of 18.63 16.08 23.76 -12.62***the ultimate owner
Percentage of firms controlled 10.06 3.84 22.56 -11.48***by widely-held corporations
Percentage of firms controlled 43.25 61.09 7.43 33.43***by widely-held financialinstitutions
Percentage of firms controlled 37.95 33.49 46.91 -6.02***by families
Percentage of firms controlled 6.04 0.82 16.51 -1 1.22***by the State
Percentage of widely-held firms 2.70 0.75 6.60 -6.16***
Average excess value 1.30 1.24 1.45 -3.71***(before log, 9349 observations)
Average ratio of 0.07 0.06 0.11 -7.96***operating income to sales
Average ratio of 0.29 0.30 0.26 7.05***total debt to assets
Average assets in millions of 8084 9531 4458 8.06***U.S. constant dollars
25

Table 3: Corporate Diversification and Performance
(Comparison between Group-Affiliated and Independent Firms)
This table reports the OLS regression results of the relations between the East Asian firms' diversification levelsand their performance. The dependent variable in all models is the excess value as defined in the text. InEquations (1) and (2), DIVER is a dummy variable equals one if the firm has multiple segments, otherwise zero.In Equations (3) and (4), DIVER is the number of firm segments. GP is a dummy variable equals one if the firmis a member firm of a corporate group, otherwise zero. NGP is a dummy variable equals one if the firm is anindependent firn that does not belong to any corporate group, otherwise zero. OPINC is operating income oversales. LEV is total debt over assets. Log(ASSETS) is the natural logarithm of firm assets in millions of the U.S.constant dollar. The regressions control for fixed-country and fixed-year effects (not reported). The sampleincludes 9,326 observations (firm-years). Financial and segment data are between 1991 and 1996. The groupaffiliation data include 2,187 firms in 1996. Numbers in parentheses are standard errors. Asterisks denote thelevel of significance: *** 1%; ** 5%; * 10%.
(1) (2) (3) (4)INTERCEPT 0.3621 0.3799 0.3810 0.4068
(0.2486) (0.2485) (0.2482) (0.2480)
DIVER -0.0497*** -0.0290***(0.0139) (0.0047)
GP*DIVER -0.0682*** -0.0359***(0.0150) (0.0050)
NGP*DIVER 0.0044 -0.0110*(0.0213) (0.0064)
OPINC -0.0388 -0.0378 -0.0400 -0.0390(0.0280) (0.0280) (0.0280) (0.0279)
LEV 0.4167*** 0.4184*** 0.4354*** 0.4360***(0.0303) (0.0303) (0.0304) (0.0304)
Log(ASSETS) 0.0325*** 0.0325*** 0.0334*** 0.0334***(0.0038) (0.0038) (0.0038) (0.0038)
Adjusted R2 0.0352 0.0362 0.0377 0.0395
26

Table 4: Group Affiliation, Economic Development, and Diversification Performance
This table reports the OLS regression results of the interactive effects of group affiliation and economicdevelopment on fmns' diversification performance. The dependent variable is the excess value as defined in thetext. In Equations (1) and (3), DIVER is a dummy variable which equals one if the firm has multiple segments,zero otherwise. In Equations (2) and (4), DIVER is the number of firm segment(s). GP is a dummy variableequals one if the firm is a member firm of a corporate group, otherwise zero. NGP is a dummy variable equalsone if the fim is an independent firn that does not belong to any corporate group, otherwise zero. GNP is theper-capita GNP of the frm's country origin. HINCOME is the high-income-country dummy variable equals oneif the firm is from Hong Kong, Singapore, Taiwan, or Japan. LINCOME is the lower-middle-income-countrydummny variable equals one if the firm is from Indonesia, Philippines, or Thailand. The numeraire is higher-mniddle income countries. The regressions control for fixed-year effects (not reported). The sample includes9,326 observations (firm-years). Financial and segment data are between 1991 and 1996. The group affiliationdata include 2,187 firms in 1996. They are taken as constant over time and merged with the segment andfinancial data before used in the regressions. Numbers in parentheses are standard errors. Asterisks denote thelevel of significance: * 1%; ** 5%; * 10%.
(1) (2) (3) (4)
0.4667* 0.4862** 0.4328* 0.4280*INTERCEPT (0.2469) (0.2467) (0.2469) (0.2467)
GP*DIVER 0.0443 -0.0097(0.0322) (0.0089)
NGP*DIVER 0.0345 0.0008(0.0354) (0.0096)
GP*DIVER*GNP -4.4988*** -0.996***(1.0341) (0.2801)
NGP*DIVER*GNP -1.7991 -0.5348(1.5749) (0.4178)
HINCOME 0.0388 0.0738***(0.0239) (0.0253)
LINCOME 0.1190*** 0.1254***(0.0336) (0.0442)
GP*DIVER*HINCOME -0.0805*** -0.0362***(0.0163) (0.0054)
NGP*DIVER*HINCOME -0.0093 -0.0135**(0.0236) (0.0068)
GP*DIVER*LINCOME 0.1689*** 0.0313(0.0537) (0.0199)
NGP*DIVER*LINCOME -0.0034 -0.0057(0.0678) (0.0272)
OPINC -0.0294 -0.0302 -0.0272 -0.0284(0.0275) (0.0276) (0.0275) (0.0275)
LEV 0.3999*** 0.412*** 0.3874*** 0.4008***(0.0296) (0.0296) (0.0297) (0.0297)
Log(ASSETS) 0.0282*** 0.0298*** 0.0294*** 0.0301***(0.0036) (0.0036) (0.0037) (0.0037)
Adjusted R2 0.0306 0.0328 0.0331 0.0344
27

Table 5: Group Affiliation, Economic Development, and Diversification
This table reports the OLS regression results of the interactive effects of group affiliation and economnicdevelopment on diversification levels. The dependent variable in all models is the number of firm segment(s).GP is a dummy variable equals one if the firm is a member firm of a corporate group, otherwise zero. GNP isthe per-capita GNP of the firm's country origin. HINCOME is the high-income-country dummy variable equalsone if the firm is from Hong Kong, Singapore, Taiwan, or Japan. LINCOME is the lower-middle-income-country dunmmy variable equals one if the firm is from Indonesia, Philippines, or Thailand. The numeraire ishigher-middle income countries (Korea and Malaysia). OPINC is operating income over sales. LEV is totaldebt over assets. Log(ASSETS) is the natural logarithm of firmn assets in rnillions of the 1982 constant U.S.dollar. Model (1) controls for fixed-country and fixed-year effects. Model (2) and (3) control for fixed-yeareffects. All fixed effects are not reported. The sample includes 9,525 firm-years between 1991 and 1996.Numbers in parentheses are standard errors. Asterisks denote the level of significance: *** 1%; ** 5%; * 10%.
(1) (2) (3)
INTERCEPT 2.0867*** 2.8952*** 3.2797***(0.3722) (0.3792) (0.3772)
GP 0.1664*** 0.1466** 0.0263(0.0374) (0.0691) (0.0874)
GNP 14.1457***(2.5052)
GP*GNP -9.4195***(2.9392)
HINCOME 0.0402(0.0704)
LINCOME -1.0392***(0.0978)
GP*HINCOME -0.0843(0.0956)
GP*LINCOME 0.3094**(0.1303)
OPINC 0.0235 0.2092*** 0.2200***(0.0605) (0.0620) (0.0610)
LEV 1.2946*** 1.0289*** 1.0592***(0.0645) (0.0655) (0.0649)
Log(ASSETS) -0.0332*** -0.0578*** -0.0691***(0.0082) (0.0083) (0.0081)
Adjusted 12 0.0994 0.0325 0.0560
28
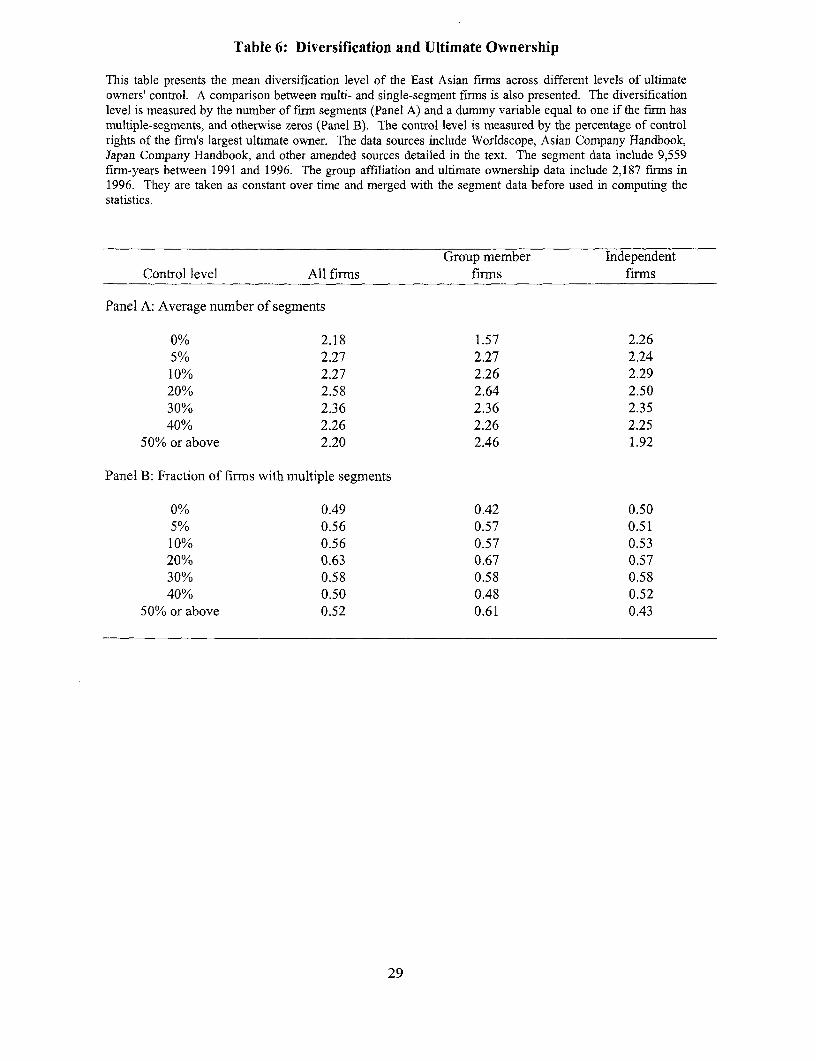
Table 6: Diversification and Ultimate Ownership
This table presents the mean diversification level of the East Asian firms across different levels of ultimateowners' control. A comparison between multi- and single-segment firms is also presented. The diversificationlevel is measured by the number of firm segments (Panel A) and a dummy variable equal to one if the firm hasmultiple-segments, and otherwise zeros (Panel B). The control level is measured by the percentage of controlrights of the firm's largest ultimate owner. The data sources include Worldscope, Asian Company Handbook,Japan Company Handbook, and other amended sources detailed in the text. The segment data include 9,559firm-years between 1991 and 1996. The group affiliation and ultimate ownership data include 2,187 firms in1996. They are taken as constant over time and merged with the segment data before used in computing thestatistics.
Group member IndependentControl level All firms firms firms
Panel A: Average number of segments
0% 2.18 1.57 2.265% 2.27 2.27 2.2410% 2.27 2.26 2.2920% 2.58 2.64 2.5030% 2.36 2.36 2.3540% 2.26 2.26 2.25
50% or above 2.20 2.46 1.92
Panel B: Fraction of firms with multiple segments
0% 0.49 0.42 0.505% 0.56 0.57 0.5110% 0.56 0.57 0.5320% 0.63 0.67 0.5730% 0.58 0.58 0.5840% 0.50 0.48 0.52
50% or above 0.52 0.61 0.43
29

Table 7: Testing the Risk Reduction and Expropriation Hypotheses
The dependent variable in all models is the number of firm segments. Divergence of cash-flow to control rightsis measured as the ratio CASH/CONTROL, where CASH and CONTROL are the percentages of cash-flow andcontrol rights held by the largest owner. HRANGE is a dummy variable indicating high control range. In models(2) and (4), HRANGE equals one if the control rights are greater than the sample median, zero otherwise. Inmodels (3) and (5), HRANGE equals one if control rights are greater than 30 percent. GP is a dummy variableequals one if the firm is a member firm of a corporate group, otherwise zero. NGP is a dummy variable, equalto one if the finm is independent, zero otherwise. OPINC is operating income over sales. LEV is total debt overassets. Log(ASSETS) is the natural logarithm of firm assets in millions of the 1982 constant U.S. dollar. Theregressions control for fixed year effects. The sample includes 9,283 firm-years (zero control-rightsobservations are deleted) between 1991 and 1996. Numbers in parentheses are standard errors. Asterisksdenote the level of significance: *** 1%; ** 5%; * 10%.
(1) (2) (3) (4) (5)
INTERCEPT 2.1655*** 2.2146*** 2.0505*** 2.1142*** 1.9743***(0.3721) (0.3742) (0.3743) (0.3735) (0.3743)
CONTROL 0.1458 0.7918***(0.1734) (0.2386)
CASH/CONTROL -0.1405*** -0.0679 -0.1162***(0.0452) (0.0543) (0.0456)
(CASHICONTROL)* -0.1307*** -0.3340***HRANGE (0.0510) (0.0732)
CONTROL*GP 0.8444*** 1.1842***(0.2197) (0.2793)
CONTROL*NGP -0.7316*** -0.2273(0.2323) (0.3594)
(CASH/CONTROL)* -0.0395 -0.0995**GP (0.0565) (0.0487)
(CASH/CONTROL)* 0.1267 0.0209NGP (0.1168) (0.0782)
(CASH/CONTROL)* -0.1711 *** -0.2946***HRANGE*GP (0.0623) (0.1002)
(CASH/CONTROL)* -0.1343 -0.2128**HRANGE*NGP (0.1217) (0.1049)
OPINC 0.0217 0.0257 0.0281 0.0222 0.0240(0.0606) (0.0607) (0.0606) (0.0605) (0.0605)
LEV 1.2656*** 1.2729*** 1.2690*** 1.2765*** 1.2688***
(0.0656) (0.0657) (0.0656) (0.0656) (0.0655)
Log(ASSETS) -0.0206*** -0.0249*** -0.0189** -0.0250*** -0.0189**
(0.0084) (0.0087) (0.0085) (0.0087) (0.0086)
Adjusted R2 0.0968 0.0972 0.0986 0.1017 0.1021
30

Policy Research Working Paper Series
ContactTitle Author Date for paper
WPS2072 Growth, Poverty, and Inequality: Quentin T. Wodon March 1999 J. BadamiA Regional Panel for Bangladesh 80425
WPS2073 Politics, Transaction Costs, and the Antonio Estache March 1999 G. Chenet-SmithDesign of Regulatory Institutions David Martimort 36370
WPS2074 Light and Lightning at the End of Antonio Estache March 1999 G. Chenet-Smiththe Public Tunnel: Reform of the Martin Rodriguez-Pardina 38370Electricity Sector in the SouthernCone
WPS2075 Between Group Inequality and Quentin T. Wodon March 1999 J. BadamiTargeted Transfers 80425
WPS2076 Microdeterminants of Consumption, Quentin T. Wodon March 1999 J. BadamiPoverty, Growth, and Inequality in 80425Bangladesh
WPS2077 Change in the Perception of the Branko Milanovic March 1999 C. ArgayosoPoverty Line during Times of Branko Jovanovic 33592Depression: Russia 1993-96
WPS2078 Valuing Mortality Reduction in India: Nathalie B. Simon March 1999 T. TourouguiA Study of Compensationg-Wage Maureen L. Cropper 87431Differentials Anna Alberini
Seema Arora
WPS2079 Is More Targeting Consistent with Martin Ravallion March 1999 P. SaderLess Spending 33902
WPS2080 Monitoring Targeting Performance Martin Ravallion March 1999 P. SaderWhen Decentralized Allocations to 33902the Poor Are Unobserved
WPS2081 Reforming C6te d'Ivoire's Cocoa John McIntire March 1999 P. KokilaMarketing and Pricing System Panos Varangis 33716
WPS2082 Gross Worker and Job Flows in a John C. Haltiwanger March 1999 S. FallonTransition Economy: An Analysis Milan Vodopivec 38009of Estonia
WPS2083 INFRISK: A Computer Simulation Mansoor Dailami March 1999 B. NedrowApproach to Risk Management in ilya Lipkovich 31585Infrastructure Project Finance John Van DyckTransactions
WPS2084 Future Inequality in Carbon Dioxide Mark T. Heil March 1999 C. Anguizco&Emissions and the Projected Impact Quentin T. Wodon 39230of Abatement Proposals

Policy Research Working Paper Series
Contact
Title Author Date for paper
WPS2085 Monitoring Banking Sector Fragility: Asli Demirgov-Kunt March 1999 K. Labrie
A Multivariate Logit Approach with Enrica Detragiache 31001
an Application to the 1996-97Banking Crises
WP82086 Deregulating Technology Transfer David Gisselquist March 1999 L. Tabada
in Agriculture: Reform's Impact Carl Pray 36896
on Turkey in the 1980s
WPS2087 Male-Female Differences in Labor Peter F. Orazem March 1999 S. Fallon
Market Outcomes during the Early Milan vodopivec 38009
Transition to Market: The Case ofEstonia and Slovenia
WPS2088 Expropriation of Minority Stijn Claessens March 1999 R. VoShareholders: Evidence from East Simeon Djankov 33722
Asia Joseph P. H. FanLarry H. P. Lang