Embed Size (px)
Citation preview
WORLD BANK MIDDLE EAST AND NORTH AFRICA REGION
INTEGRATION IN THE MAGHREB
WORLD BANK MIDDLE EAST AND NORTH AFRICA REGION
Economic Integration in the Maghreb
ECONOMIC
Pub
lic D
iscl
osur
e A
utho
rized
Pub
lic D
iscl
osur
e A
utho
rized
Pub
lic D
iscl
osur
e A
utho
rized
Pub
lic D
iscl
osur
e A
utho
rized
Pub
lic D
iscl
osur
e A
utho
rized
Pub
lic D
iscl
osur
e A
utho
rized
Pub
lic D
iscl
osur
e A
utho
rized
Pub
lic D
iscl
osur
e A
utho
rized

Economic Integration in the Maghreb
Office of the Chief EconomistMiddle East and North Africa RegionThe World Bank
WORLD BANK MIDDLE EAST AND NORTH AFRICA REGION OCTOBER 2010
©2010 The International bank of Reconstruction and Development/The World Bank1818H Street, NWWashington DC 20433Telephone: 202 473 1000Internet www.worldbank.orgE-mail [email protected]
All rights reserved.
This volume is a product of the Social and Economic Development Group of the Middle East and North Africa Region of the World Bank. The findings, interpretations, and conclusions expressed herein are those of the author (s) and do not necessarily reflect the views of the Board of Executive Directors of the World Bank or the govern-ments they represent.
The World Bank does not guarantee the accuracy of the data included in this work. The boundaries, colors, de-nominations, and other information shown on any map in this work do not imply any judgment on the part of the World Bank concerning the legal status of any territory or the endorsement or acceptance of such boundaries.
Rights and Permissions
The material in this work is copyrighted. Copying and/or transmitting portions or all of this work without permis-sion may be a violation of applicable law. The World Bank encourages dissemination of its work and will normally grant permission promptly.
For permission to photocopy or reprint any part of this work, please send a request with complete information to the Copyright Clearance Center, Inc, 222 Rosewood Drive, Danvers, MA 09123, USA, telephone 978–750–8400, fax 978–750–4470, www.copyright.com.
All other queries on rights and licenses, including subsidiary rights, should be addressed to the Office of the Publisher, World Bank, 1818H Street, NW, Washington, DC 20433, USA, fax 202–522–2422, e-mail [email protected].
Cover photograph: © World Bank/Dana Smilie.
A FREE PUBLICATION
ContentsAcknowledgements iv
Foreword v
Acronyms and Abbreviations vii
Executive Summary 1
1. Introduction 2
2. Participation in Integration Agreements 5
3. Integration through Trade, Capital, and Labor Flows 7
4. Financial Integration 13
5. Integration through Physical Infrastructure 15
6. Constraints to Integration in the Maghreb 18
Conclusion 21
Boxes
Box 1 Potential Gains of Trade Integration in the Maghreb 3Box 2 The Main Characteristics of the Financial System in the Maghreb 14
Tables
Table 1 Importance of Trade in the Maghreb (% of GDP) 8Table 2 Maghreb Trade with the EU (2008) 9Table 3 Distribution of Services Trade by Category
(% total trade in services) 10Table 4 International Migrants by Development Group and
Arab World Sub-regions 12Table 5 Logistics Performance Index 2010 20
Figures
Figure 1 Total Trade (% GDP) 8Figure 2 Share of Intra-Maghreb Trade 9Figure 3 Participation in Intra-Maghreb Trade 9
iv
Figure 4 Concentration and Diversification Indices of Export Products in MENA 10
Figure 5 FDI and Remittances (% GDP) 11Figure 6 Trends in Remittances (% GDP) 11Figure 7 Applied Tariff Rates for Maghreb Countries (2006) 19Figure 8 Ease of Doing Business Ranking 19Figure 9 Logistics Performance Index 19
Annexes
Annex 1 Trade Agreements in the MENA Region 25Annex 2 Statistical Tables 26
Acknowledgements
This report was prepared by Mustapha Rouis and Komlan Kounetsron under the guidance of Farrukh Iqbal, Acting Chief Economist, and Shamshad Akhtar, Vice President, Middle East and North Africa Region. The authors are grateful to Jean-Pierre Chauffour, Sid’Ahmed Ould Cheikhna, Ndiame Diop, Abdelmoula Ghzala, Bernard M. Hoekman, Lili Mottaghi, and Khalid El Massnaoui from the World Bank for their comments on earlier versions. Isabelle Chaal Dabi and Liliane Vert (World Bank) provided valuable administrative assistance, and Amanda Green (Consultant) edited the report.
C O N T E N T S
v
ForewordThough the Middle East and North Africa (MENA) region has weath-
ered the recent global financial and economic crisis relatively well,
it still faces daunting medium-term challenges. These include high
unemployment (especially among young people), vulnerability to oil
and food price shocks and water scarcity and inefficiencies of public
sectors. Integration of the region into the global economy has been
slow. Of particular concern is the stagnation in the region’s share of
global non-oil exports, an indication of missed opportunities for di-
versification and growth. Integration within the region, while rising,
is also on the low side when compared with other middle- and high-
income regional blocs.
Over the last year or so, there has been an increasing momentum on the part of the region and the World Bank Group to focus on a set of initiatives to promote more cooperation within the region. These initiatives include a host of analyt-ical pieces to examine the current state of regional collaborative arrangements with emphasis on assessing and explor-ing ways of fostering greater trade inte-gration, labor mobility and migration prospects, prospects for energy integra-tion and resource sharing and infrastruc-ture development to reduce nontariff barriers.
The region has been able to make some inroads, albeit at different degrees in each of the geographical groupings, to support the integration of the Arab world into the global economy. To start off the removal of intra-regional tariffs under the Pan-Arab Free Trade Area (PAFTA)
and the adoption of low common tariffs by the Gulf Cooperation Council (GCC) which coupled with improvements in infrastructure, especially roads and tele-communications is generating benefits. But much remains to be done, espe-cially in reducing nontariff barriers to trade, harmonizing policies and proce-dures, and facilitating cross-border trade through development of infrastructure links and trade facilitation. Fortunately, trade in services has recently emerged on the agenda of national and regional authorities—this is an area of substantial potential welfare gain for the region.
Recognizing the problems, the World Bank has been working closely with the MENA region to develop and imple-ment regional activities—investment projects, institution-building, harmoni-zation of policies and procedures—that are likely to enhance economic growth
F O R E W O R D
vi
and address common challenges across the re-gion. As part of this endeavor, the Office of the Chief Economist, MENA Region, has pre-pared a series of reports to assess the achieve-ments of the region with respect to integration. The first report, “2008 Economic Developments and Prospects,” looks at the role of integration in global competitiveness for the region as a whole and special reports have been pre-pared to take stock of the regional cooperative frameworks, their issues and prospects. These reports examine economic integration among three sub-regions: the Gulf countries (Bahrain,
Kuwait, Oman, Qatar, Saudi Arabia, and the United Arab Emirates), the Maghreb (Algeria, Libya, Mauritania, Morocco, and Tunisia), and the Mashreq (Iraq, Jordan, Lebanon, Syria, and West Bank and Gaza). Egypt is sometimes classified in the literature as a Mashreq coun-try though with ties with North Africa given its location.
Shamshad AkhtarVice President
Middle East and North Africa RegionThe World Bank
vii
Acronyms and Abbreviations
AMF Arab Monetary FundAMU Arab Maghreb UnionASEAN Association of Southeast Asian NationsBMICE The Maghreb Bank for Investment and Foreign TradeCEN-SAD Community of Sahel-Saharan StatesCOMESA Common Market for Eastern and Southern AfricaEU European UnionFDI Foreign direct investmentGAFTA Greater Arab Free Trade AgreementGCC Gulf Cooperation CouncilGDP Gross domestic productGSM Global system for mobile communicationIMF International Monetary FundMENA Middle East and North AfricaMERCOSUR Mercado Común Sur (Argentina, Brazil, and Uruguay)MFN Most Favored NationNAFTA North American Free Trade AgreementNPLs Nonperforming loansNTMS Nontariff measuresOECD Organization for Economic Cooperation and DevelopmentOTRI Overall Trade Restrictiveness IndexPAFTA Pan-Arab Free Trade AreaSTRI Services Trade Restrictiveness IndexTRAINS Trade Analysis and Information SystemTTRI Tariff-only Trade Restrictiveness IndexUNCTAD United Nations Conference on Trade and DevelopmentWDI World Development IndicatorsWTO World Trade Organization

1
Executive Summary
This report reviews the status of Maghreb countries’ economic inte-
gration with the world, with the Arab world, and within the Maghreb
itself.1 It focuses on trade in goods and services, labor and capital
flows, financial integration and cross-border infrastructure integra-
tion. It discusses the potential benefits of and key constraints to great-
er integration.
Maghreb countries’ trade with the Arab world and with the rest of the world is relatively small, with exports concen-trated in a few commodities. There are wide country variations, however, with Morocco and Tunisia exhibiting higher trade volume and export diversification.
Despite the establishment of the Arab Maghreb Union over two decades ago, the bulk of the Maghreb’s trade is with Europe. The level of intra-Maghreb trade is lower than that of many of the world’s trading blocs. In 2007, intra-Maghreb trade represented less than 2 percent of the subregion’s combined gross domestic product (GDP) and less than 3 percent of the subregion’s total trade. Some of the reasons for this low performance include high barriers to trade, logistical bottlenecks, lack of pro-duction base diversification, and politi-cal considerations.
The focus on trade liberalization with the European Union (EU) provides an oppor-tunity for individual Maghreb countries to lock in policies that would eventually help them harmonize policies within their own region. The same argument can be made regarding accession to the World Trade Organization (WTO). The Maghreb countries would reap significant addition-al benefits if, in parallel to reforms under-taken to improve trade liberalization with Europe, they improved conditions for streamlined trade among themselves.
There is significant potential for trade in services in the financial sector, trans-portation and logistics, and communi-cations and information, among other sectors. According to some studies, com-prehensive services reforms that involve increased competition and regulatory streamlining would yield benefits that are at least twice the magnitude of those achieved through tariff removal alone.
1 See World Bank (2006) and Hufbauer and Brunel, eds. (2008) for extensive coverage of issues related to economic integration in the Maghreb. Both studies provide recommendations on how to achieve the potential benefits of regional integration. They underline the need for economic reforms that reduce tariff and nontariff barriers, create a better investment climate, and foster regulatory harmonization.
2
Chapter 1 Introduction
The Maghreb subregion comprises five countries: Algeria, Libya,
Mauritania, Morocco, and Tunisia. All but Mauritania are part of
the Middle East and North Africa (MENA) region. Taken together,
the Maghreb countries comprised 86 million people (around one-
fourth of MENA) and US$ 391 billion in GDP (more than one-third
of MENA) in 2008. Algeria and Morocco are the largest countries,
accounting for over three-quarters of the subregion’s population and
two-thirds of the subregion’s GDP.
The countries of the Maghreb are quite diverse in terms of resource endowments. Libya is a resource-rich and labor-importing country and Algeria a resource-rich and labor-abundant one. Both are undergoing economic transitions. The other three countries are resource-poor, labor-abundant countries.
Though quite large geographically, a high proportion of the subregion’s land is desert and thus not suitable for agriculture. However, Morocco and Tunisia have relatively significant tracts of arable and cultivated land. The subregion’s main natural resources are oil, metallic and nonmetallic minerals, and fisheries. In the context of renewable energy, the Maghreb could be a major source of solar energy.
Like the rest of the MENA region, the Maghreb countries face major development challenges. These include a rapidly growing young population, high unemployment rates, and vulnerability to price shocks and climate change. The subregion also faces some political and security challenges, including extremism.
In light of these challenges, consensus is growing that the subregion could improve its economic performance through regional integration (Box 1).2 Deep integration refers to service sector and investment climate reforms aimed at improving competi-tion and market contestability. A World Bank study (Brenton et. al. 2006) suggests that per-capita GDP in each of the three countries examined—Algeria, Morocco, and
2 See also Bchir, et. al. (2006). The study suggests that the overall gains from liberalizing trade in goods (includ-ing the removal of nontariff measures) could reach at least US$ 350 million and outstrip the static gains, with productivity improvements as the main driver. The estimate is based on a simulation and includes Egypt among the North African countries.
3
I N T R O D U C T I O N C H A P T E R 1
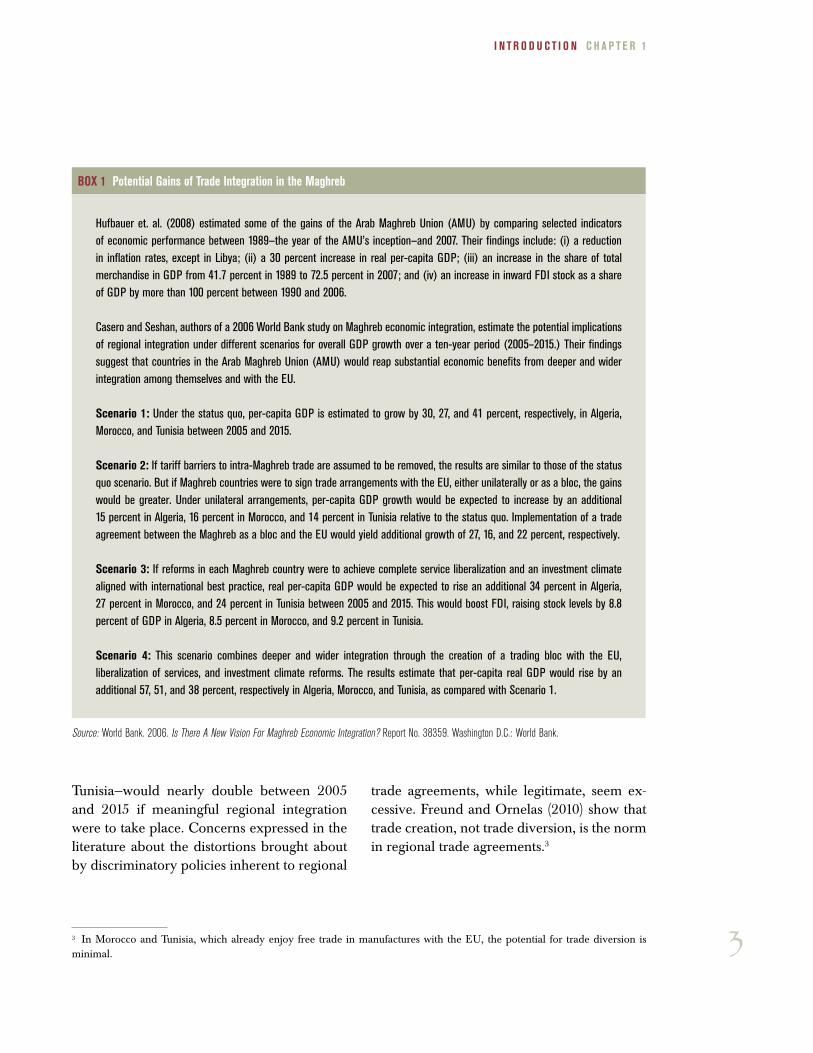
Tunisia—would nearly double between 2005 and 2015 if meaningful regional integration were to take place. Concerns expressed in the literature about the distortions brought about by discriminatory policies inherent to regional
trade agreements, while legitimate, seem ex-cessive. Freund and Ornelas (2010) show that trade creation, not trade diversion, is the norm in regional trade agreements.3
3 In Morocco and Tunisia, which already enjoy free trade in manufactures with the EU, the potential for trade diversion is minimal.
BOx 1 Potential Gains of Trade Integration in the Maghreb
Hufbauer et. al. (2008) estimated some of the gains of the Arab Maghreb Union (AMU) by comparing selected indicators of economic performance between 1989—the year of the AMU’s inception—and 2007. Their findings include: (i) a reduction in inflation rates, except in Libya; (ii) a 30 percent increase in real per-capita GDP; (iii) an increase in the share of total merchandise in GDP from 41.7 percent in 1989 to 72.5 percent in 2007; and (iv) an increase in inward FDI stock as a share of GDP by more than 100 percent between 1990 and 2006.
Casero and Seshan, authors of a 2006 World Bank study on Maghreb economic integration, estimate the potential implications of regional integration under different scenarios for overall GDP growth over a ten-year period (2005–2015.) Their findings suggest that countries in the Arab Maghreb Union (AMU) would reap substantial economic benefits from deeper and wider integration among themselves and with the EU.
Scenario 1: Under the status quo, per-capita GDP is estimated to grow by 30, 27, and 41 percent, respectively, in Algeria, Morocco, and Tunisia between 2005 and 2015.
Scenario 2: If tariff barriers to intra-Maghreb trade are assumed to be removed, the results are similar to those of the status quo scenario. But if Maghreb countries were to sign trade arrangements with the EU, either unilaterally or as a bloc, the gains would be greater. Under unilateral arrangements, per-capita GDP growth would be expected to increase by an additional 15 percent in Algeria, 16 percent in Morocco, and 14 percent in Tunisia relative to the status quo. Implementation of a trade agreement between the Maghreb as a bloc and the EU would yield additional growth of 27, 16, and 22 percent, respectively.
Scenario 3: If reforms in each Maghreb country were to achieve complete service liberalization and an investment climate aligned with international best practice, real per-capita GDP would be expected to rise an additional 34 percent in Algeria, 27 percent in Morocco, and 24 percent in Tunisia between 2005 and 2015. This would boost FDI, raising stock levels by 8.8 percent of GDP in Algeria, 8.5 percent in Morocco, and 9.2 percent in Tunisia.
Scenario 4: This scenario combines deeper and wider integration through the creation of a trading bloc with the EU, liberalization of services, and investment climate reforms. The results estimate that per-capita real GDP would rise by an additional 57, 51, and 38 percent, respectively in Algeria, Morocco, and Tunisia, as compared with Scenario 1.
Source: World Bank. 2006. Is There A New Vision For Maghreb Economic Integration? Report No. 38359. Washington D.C.: World Bank.
4
C H A P T E R 1 I N T R O D U C T I O N
Since the mid-1980s, the countries in the sub-region have moved to reform their economies at different speeds and with different results.
�� Algeria’s transition to a market economy is proceeding slowly. Steps toward liberal-izing trade have slowed down since 2008 and, as a result, the long-awaited WTO accession has not yet occurred. Reforms to improve the business environment and expand privatization have been deferred. Public banks control more than 90 percent of banking assets, and credit intermedia-tion is underdeveloped.
�� Libya, with its sizeable oil wealth, has man-aged to achieve decent living standards for its citizens, which compare favorably with other MENA countries. The main issue facing Libya is the transition to a competi-tive, market-led economy. The country would benefit greatly from enhancing the investment climate, with strong institu-tions to support open markets; developing the banking system so that it can play its full role in financing investment; enhanc-
ing human resources; and improving the quality of governance.
�� Mauritania is the country in the subre-gion that faces the greatest challenges on all fronts, notably weak administrative capacity, poor infrastructure, and a defi-cient business environment. The economy remains undiversified. Maintaining mac-roeconomic stability and transparently managing natural resource wealth are two areas of high priority for the government.
�� Morocco has gained advanced status within the framework of the EU’s Neigh-borhood Policy, marking the culmination of the process of deepening integration between Morocco and the EU based on reforms undertaken by Morocco to mod-ernize and open its economy.
�� Tunisia has made important strides in re-forming its economy since the mid-1980s, notably in macroeconomic management, trade, the financial sector, and the busi-ness-enabling environment. However, the country continues to pursue a cautious policy regarding privatization.
5
Participation in Integration Agreements
Maghreb countries are involved in a variety of bilateral and mul-
tilateral integration agreements (Annex 1). Mauritania, Morocco,
and Tunisia are the only Maghreb countries with membership in the
WTO. All five countries are founders of the AMU, which was es-
tablished in February 1989 by the Treaty of Marrakech, whose ob-
jectives are: (i) consolidation of fraternal relations between member
states, the realization of progress and well-being in their communi-
ties, and protection of their rights; (ii) progressive achievement of the
free movement of people, services, goods, and capital between mem-
ber states; and (iii) adoption of common policies in all spheres. In the
economic domain, the common policy aims to ensure the industrial,
agricultural, commercial, and social development of member states.
The end goal of establishing an economic union in the Maghreb will
require the following steps, as agreed in the treaty: a free trade area,
including the dismantlement of all tariff and nontariff obstacles to
trade; a customs union with a common external tariff with the rest of
the world; and a common market with no remaining restrictions on
the movement of production factors.
The AMU is governed by a council of all heads of state. Decisions are reached with a unanimous vote by the heads of all five states. Other governing institutions include the council of Prime Ministers, the council of Ministers of Foreign Affairs, the per-manent General Secretariat, and various specialized ministerial commissions. The permanent General Secretariat is headquartered in Rabat. There are four specialized ministerial commissions dealing with human resources, infrastructure, economy and finance, and food security.
Chapter 2
6
C H A P T E R 2 PA R T I C I PAT I O N I N I N T E G R AT I O N A G R E E M E N T S
In addition to their membership in the AMU, Libya, Morocco, and Tunisia are members of the Pan-Arab Free Trade Area (PAFTA), which was signed in 1997. Morocco and Tunisia are founders of the Agadir Agreement for the Es-tablishment of a Free Trade Zone, signed in 2004. Three Maghreb countries have signed association agreements with the EU: Tuni-sia in 1995, Morocco in 1996, and Algeria in 2002. All Maghreb countries are members of the League of Arab States, founded in 1945, which has historically taken the lead on inte-gration efforts in the region. In addition, Mo-rocco signed a free trade agreement with the United States in 2006. Mauritania withdrew from the Economic Community of West Afri-can States (ECOWAS) in 2001 and joined the Community of Sahel-Saharan States (CEN-SAD) in 2009.
Many of these intraregional agreements have yet to become fully operational or achieve their stated objectives. For example, the AMU aimed to intensify trade among mem-ber countries in order to enable the creation of a North Africa customs union by 1995 and an economic common market by 2000. Yet none of these measures has been achieved,
and intra-Maghreb trade remains low despite some reform efforts on the part of Maghreb countries.
On the positive side, PAFTA has benefited the region by spurring the removal of tariffs on in-traregional trade,4 as well as marked improve-ments in customs clearance procedures. These are the findings of a survey (Hoekman and Zarrouk 2000) of trading firms in nine PAFTA countries, including Morocco and Tunisia. The survey covered official trade and tax poli-cies, administrative requirements that confront traders, and the costs and quality of transport infrastructure.
There are some indications that, while EU association agreements have significantly in-creased Maghreb countries’ imports from the EU, they have not had a positive impact on exports to the EU (see, for example, Cieslik and Hagemejer 2007).5 Overall, the subregion comprises two countries that are quite ad-vanced in trade openness (though the agenda is unfinished) and two major countries that are not yet WTO members (Algeria and Libya). This might help explain the pattern of trade and investment within the region.
4 The average uniform tariff equivalent of all tariffs (ad valorem and specific) for the MENA region fell from 14.7 percent in 2002 to 6.7 percent in 2007, and by another 0.8 percent during 2008–2009 in spite of the global economic crisis. The MENA region was the region where tariffs decreased the most, especially on manufactured goods, during the financial crisis. See Chauffour 2010.5 This finding was based on an augmented gravity model for seven MENA countries for which association agreements have been signed, but estimates for individual MENA countries show significant heterogeneity. In the case of bilateral imports, the authors obtained positive coefficients on the indicator variables for the new EU association agreements only for Morocco, Tuni-sia, and Turkey. In the case of bilateral exports, all estimated parameters displayed negative signs.
7
Integration through Trade, Capital, and Labor Flows
As compared with its potential, trade in the Maghreb is low in terms
of both intraregional exchanges and trade with MENA and the
rest of the world. Based on a gravity model, Al-Atrash and Youssef
(2007) found that Maghreb countries traded less with the rest of
the world than the model would have predicted. Furthermore, the
level of regional trade among Maghreb countries is low compared
with other trading blocs.6 There are some indications, however,
that official data do not fully capture trade within the region. This
is particularly true for trade between Libya and Tunisia, and be-
tween Algeria and Tunisia. Quite recently, there has been some
dynamism in trade and, to some extent, investment, particularly
between Tunisia and the three other North African countries.7 Some
of the reasons for the overall low performance in trade include high
barriers to trade, the lack of diversification of the production base
(though this should be treated cautiously),8 logistical bottlenecks,
and political conditions.
6 Intraregional trade was 65 percent at the inception of the EU, 41 percent for NAFTA, 14 percent for MER-COSUR, and 16 percent for ASEAN. Merchandise trade within the Maghreb (as a share of total merchandise trade) is the lowest among comparator regional trading blocs.7 Libya is a big importer of health and tourism services from Tunisia, as is Algeria to some extent. It should also be mentioned that recent years have seen a rapid rise in trade, as illustrated by the case of Tunisia. Over the period 2003–2008, exports from Tunisia to Libya grew from nearly US$ 500 million in 2003 to nearly US$ 1.1 billion in 2008. Exports to Algeria rose from US$ 100 million to US$ 500 million over the same period. Tunisia’s imports from both countries saw a similar pattern. There was also a surge in cross-border investment, though the amount is still modest.8 The attribution of lower regional trade to the similarity of production structures within the region should be treated cautiously. Similarity indices are often calculated at a highly aggregated level. Yet there are huge oppor-tunities for intraindustry trade at a disaggregated level (8+ digit level).
Chapter 3
8
C H A P T E R 3 I N T E G R AT I O N T H R O U G H T R A D E , C A P I TA l , A N D l A B O R F l O W S
Trade in Goods
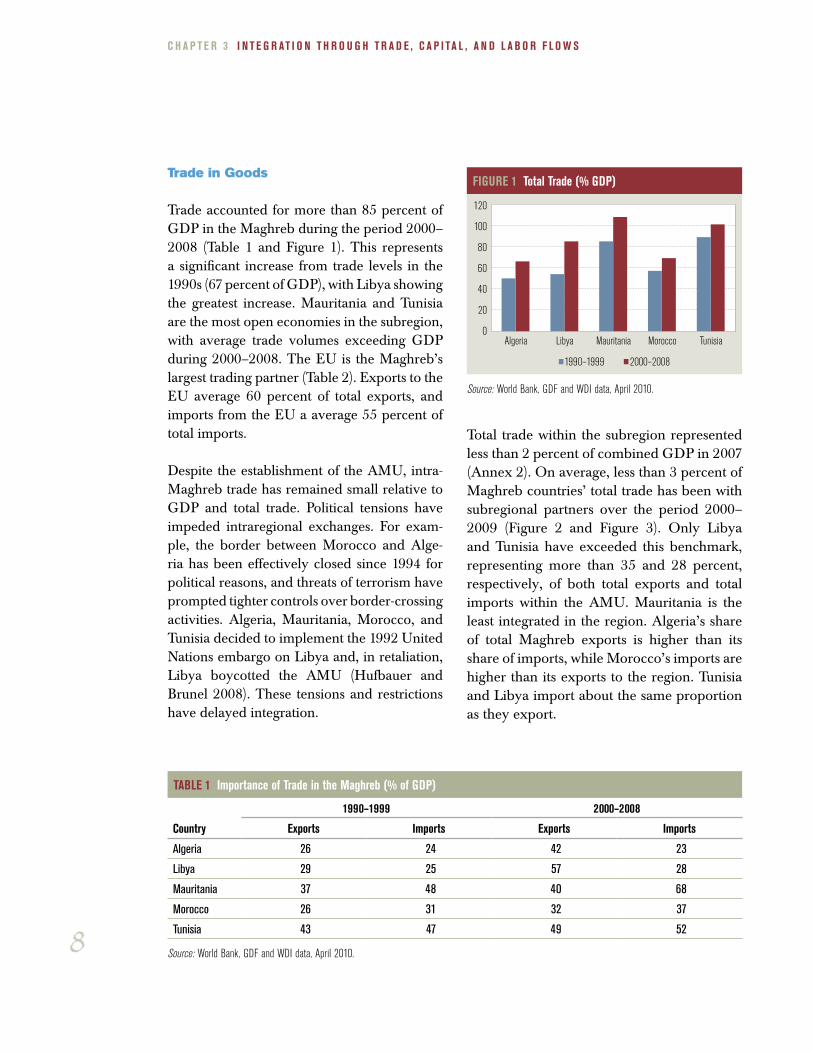
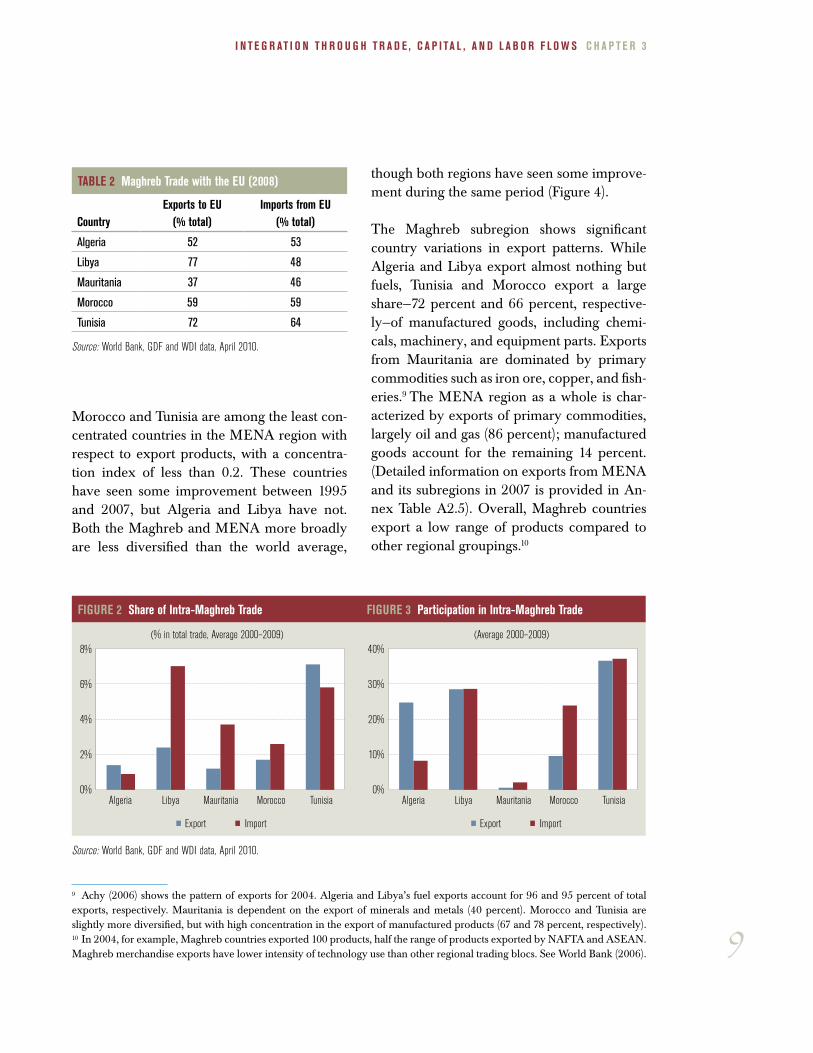
Trade accounted for more than 85 percent of GDP in the Maghreb during the period 2000–2008 (Table 1 and Figure 1). This represents a significant increase from trade levels in the 1990s (67 percent of GDP), with Libya showing the greatest increase. Mauritania and Tunisia are the most open economies in the subregion, with average trade volumes exceeding GDP during 2000–2008. The EU is the Maghreb’s largest trading partner (Table 2). Exports to the EU average 60 percent of total exports, and imports from the EU a average 55 percent of total imports.
Despite the establishment of the AMU, intra-Maghreb trade has remained small relative to GDP and total trade. Political tensions have impeded intraregional exchanges. For exam-ple, the border between Morocco and Alge-ria has been effectively closed since 1994 for political reasons, and threats of terrorism have prompted tighter controls over border-crossing activities. Algeria, Mauritania, Morocco, and Tunisia decided to implement the 1992 United Nations embargo on Libya and, in retaliation, Libya boycotted the AMU (Hufbauer and Brunel 2008). These tensions and restrictions have delayed integration.
Total trade within the subregion represented less than 2 percent of combined GDP in 2007 (Annex 2). On average, less than 3 percent of Maghreb countries’ total trade has been with subregional partners over the period 2000–2009 (Figure 2 and Figure 3). Only Libya and Tunisia have exceeded this benchmark, representing more than 35 and 28 percent, respectively, of both total exports and total imports within the AMU. Mauritania is the least integrated in the region. Algeria’s share of total Maghreb exports is higher than its share of imports, while Morocco’s imports are higher than its exports to the region. Tunisia and Libya import about the same proportion as they export.
TABlE 1 Importance of Trade in the Maghreb (% of GDP)
Country
1990–1999 2000–2008
Exports Imports Exports Imports
Algeria 26 24 42 23
Libya 29 25 57 28
Mauritania 37 48 40 68
Morocco 26 31 32 37
Tunisia 43 47 49 52
Source: World Bank, GDF and WDI data, April 2010.
FIGURE 1 Total Trade (% GDP)
0
20
40
60
80
100
120
Algeria Libya Mauritania Morocco Tunisia
1990–1999 2000–2008
Source: World Bank, GDF and WDI data, April 2010.
9
I N T E G R AT I O N T H R O U G H T R A D E , C A P I TA l , A N D l A B O R F l O W S C H A P T E R 3
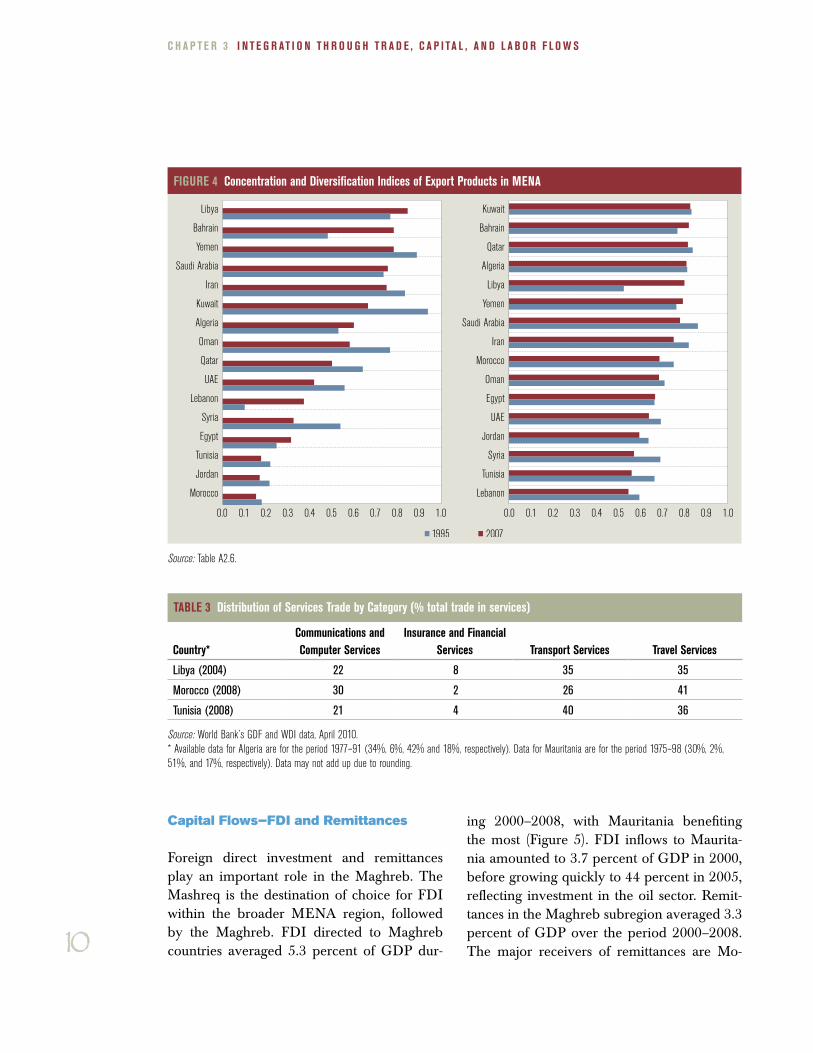
Morocco and Tunisia are among the least con-centrated countries in the MENA region with respect to export products, with a concentra-tion index of less than 0.2. These countries have seen some improvement between 1995 and 2007, but Algeria and Libya have not. Both the Maghreb and MENA more broadly are less diversified than the world average,
though both regions have seen some improve-ment during the same period (Figure 4).
The Maghreb subregion shows significant country variations in export patterns. While Algeria and Libya export almost nothing but fuels, Tunisia and Morocco export a large share—72 percent and 66 percent, respective-ly—of manufactured goods, including chemi-cals, machinery, and equipment parts. Exports from Mauritania are dominated by primary commodities such as iron ore, copper, and fish-eries.9 The MENA region as a whole is char-acterized by exports of primary commodities, largely oil and gas (86 percent); manufactured goods account for the remaining 14 percent. (Detailed information on exports from MENA and its subregions in 2007 is provided in An-nex Table A2.5). Overall, Maghreb countries export a low range of products compared to other regional groupings.10
TABlE 2 Maghreb Trade with the EU (2008)
CountryExports to EU
(% total)Imports from EU
(% total)
Algeria 52 53
Libya 77 48
Mauritania 37 46
Morocco 59 59
Tunisia 72 64
Source: World Bank, GDF and WDI data, April 2010.
FIGURE 2 Share of Intra-Maghreb Trade FIGURE 3 Participation in Intra-Maghreb Trade
1810 12 17 16
0%
2%
4%
6%
8%
Algeria Libya Mauritania Morocco Tunisia
(% in total trade, Average 2000–2009)
Export Import
1810 12 17 16
Algeria Libya Mauritania Morocco Tunisia
Export Import
0%
10%
20%
30%
40%(Average 2000–2009)
Source: World Bank, GDF and WDI data, April 2010.
9 Achy (2006) shows the pattern of exports for 2004. Algeria and Libya’s fuel exports account for 96 and 95 percent of total exports, respectively. Mauritania is dependent on the export of minerals and metals (40 percent). Morocco and Tunisia are slightly more diversified, but with high concentration in the export of manufactured products (67 and 78 percent, respectively).10 In 2004, for example, Maghreb countries exported 100 products, half the range of products exported by NAFTA and ASEAN. Maghreb merchandise exports have lower intensity of technology use than other regional trading blocs. See World Bank (2006).
10
C H A P T E R 3 I N T E G R AT I O N T H R O U G H T R A D E , C A P I TA l , A N D l A B O R F l O W S
Capital Flows—FDI and Remittances
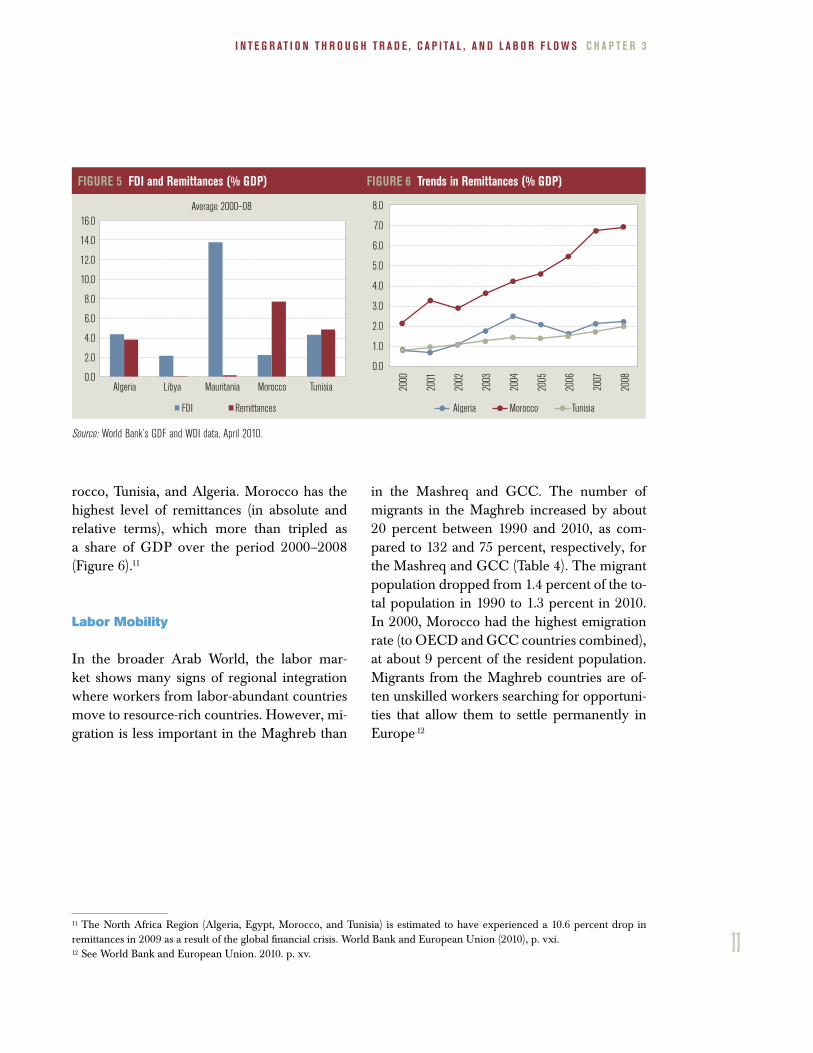
Foreign direct investment and remittances play an important role in the Maghreb. The Mashreq is the destination of choice for FDI within the broader MENA region, followed by the Maghreb. FDI directed to Maghreb countries averaged 5.3 percent of GDP dur-
ing 2000–2008, with Mauritania benefiting the most (Figure 5). FDI inflows to Maurita-nia amounted to 3.7 percent of GDP in 2000, before growing quickly to 44 percent in 2005, reflecting investment in the oil sector. Remit-tances in the Maghreb subregion averaged 3.3 percent of GDP over the period 2000–2008. The major receivers of remittances are Mo-
TABlE 3 Distribution of Services Trade by Category (% total trade in services)
Country*Communications and Computer Services
Insurance and Financial Services Transport Services Travel Services
Libya (2004) 22 8 35 35
Morocco (2008) 30 2 26 41
Tunisia (2008) 21 4 40 36
Source: World Bank’s GDF and WDI data, April 2010.* Available data for Algeria are for the period 1977–91 (34%, 6%, 42% and 18%, respectively). Data for Mauritania are for the period 1975–98 (30%, 2%, 51%, and 17%, respectively). Data may not add up due to rounding.
FIGURE 4 Concentration and Diversification Indices of Export Products in MENA
Libya
Bahrain
Yemen
Saudi Arabia
Iran
Kuwait
Algeria
Oman
Qatar
UAE
Lebanon
Syria
Egypt
Tunisia
Jordan
Morocco
Libya
Bahrain
Yemen
Saudi Arabia
Iran
Kuwait
Algeria
Oman
Qatar
UAE
Lebanon
Syria
Egypt
Tunisia
Jordan
Morocco
0.0 0.20.1 0.3 0.5 0.7 0.90.4 0.6 0.8 1.00.0 0.20.1 0.3 0.5 0.7 0.90.4 0.6 0.8 1.0
1995 2007
Source: Table A2.6.
11
I N T E G R AT I O N T H R O U G H T R A D E , C A P I TA l , A N D l A B O R F l O W S C H A P T E R 3
rocco, Tunisia, and Algeria. Morocco has the highest level of remittances (in absolute and relative terms), which more than tripled as a share of GDP over the period 2000–2008 (Figure 6).11
Labor Mobility
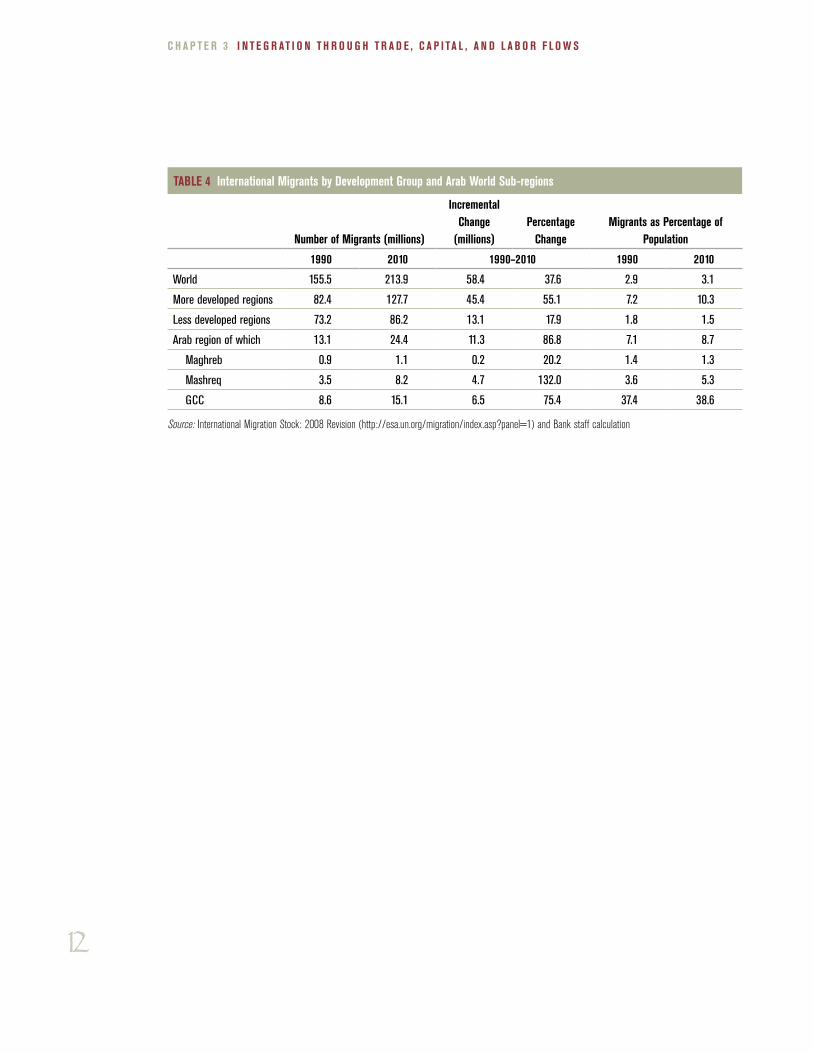
In the broader Arab World, the labor mar-ket shows many signs of regional integration where workers from labor-abundant countries move to resource-rich countries. However, mi-gration is less important in the Maghreb than
in the Mashreq and GCC. The number of migrants in the Maghreb increased by about 20 percent between 1990 and 2010, as com-pared to 132 and 75 percent, respectively, for the Mashreq and GCC (Table 4). The migrant population dropped from 1.4 percent of the to-tal population in 1990 to 1.3 percent in 2010. In 2000, Morocco had the highest emigration rate (to OECD and GCC countries combined), at about 9 percent of the resident population. Migrants from the Maghreb countries are of-ten unskilled workers searching for opportuni-ties that allow them to settle permanently in Europe.12
11 The North Africa Region (Algeria, Egypt, Morocco, and Tunisia) is estimated to have experienced a 10.6 percent drop in remittances in 2009 as a result of the global financial crisis. World Bank and European Union (2010), p. vxi.12 See World Bank and European Union. 2010. p. xv.
FIGURE 5 FDI and Remittances (% GDP) FIGURE 6 Trends in Remittances (% GDP)
Average 2000–08
0.0
2.0
4.0
6.0
8.0
10.0
12.0
14.0
16.0
FDI Remittances
0.0
1.0
2.0
3.0
4.0
5.0
6.0
7.0
8.0
2000
2001
2002
2003
2004
2005
2006
2007
2008
Algeria Libya Mauritania Morocco Tunisia
Algeria Morocco Tunisia
Source: World Bank’s GDF and WDI data, April 2010.
12
C H A P T E R 3 I N T E G R AT I O N T H R O U G H T R A D E , C A P I TA l , A N D l A B O R F l O W S
TABlE 4 International Migrants by Development Group and Arab World Sub-regions
Number of Migrants (millions)
Incremental Change
(millions)Percentage
ChangeMigrants as Percentage of
Population
1990 2010 1990–2010 1990 2010
World 155.5 213.9 58.4 37.6 2.9 3.1
More developed regions 82.4 127.7 45.4 55.1 7.2 10.3
Less developed regions 73.2 86.2 13.1 17.9 1.8 1.5
Arab region of which 13.1 24.4 11.3 86.8 7.1 8.7
Maghreb 0.9 1.1 0.2 20.2 1.4 1.3
Mashreq 3.5 8.2 4.7 132.0 3.6 5.3
GCC 8.6 15.1 6.5 75.4 37.4 38.6
Source: International Migration Stock: 2008 Revision (http://esa.un.org/migration/index.asp?panel=1) and Bank staff calculation
13
Financial Integration
Although financial systems in the Maghreb have seen improvement
in recent years, much remains to be done. Thus far, reforms have
focused more on global than on regional integration. Gradually, each
country has been lifting restrictions on cross-border capital flows and
foreign ownership in order to strengthen domestic financial markets.
For example, Tunisia aims to achieve full capital convertibility with a
freely floating exchange rate, and Morocco is transitioning to a flex-
ible exchange rate.
Aware of the importance of modernizing their financial sectors, Maghreb countries have initiated reforms to improve their financial sectors (Box 2). Reforms in Morocco have targeted the legal and regulatory framework. Tunisia’s objectives are to improve bank governance, to increase transparency and accountability, and to strengthen the regulatory framework. Algeria has modernized its financial system with the promul-gation of the Currency and Credit Law in 1990, which liberalized the sector. Reforms in Mauritania are nascent and focused on the regulatory and legal framework of microfinance, exchange market, and the money market. Finally, Libya is in the pro-cess of reforming the predominantly state-owned financial system.13 Despite these re-forms, serious challenges remain to ensuring a sound banking system, strengthening competition in banking, deepening financial markets, strengthening financial sector oversight, and upgrading financial sector infrastructure.
Financial integration is of great importance in the Maghreb. The AMU treaty envis-aged the creation of a regional bank, the Maghreb Bank for Investment and Foreign Trade (BMICE). The agreement was signed in 1991, and the Maghreb Ministerial Commission for Finance approved the draft statute for the BMICE in March 2006. The BMICE will be headquartered in Tunisia with a subscribed capital of US$ 500 million and is expected to be fully operational in the fall of 2010.
Chapter 4
13 In 2005, the Maghreb countries decided to revive their efforts at regional integration with support from the In-ternational Monetary Fund (IMF). They focused on four areas: trade facilitation, financial integration, promotion of the private sector, and joint projects. Four high-level regional conferences were held, but so far only limited progress has been achieved. Some actions have been taken toward harmonizing payment systems and technical platforms, but these remain modest. Agreement was reached to start the Maghreb Bank for Investment and For-eign Trade by this fall after lengthy delays. A few bilateral agreements between central banks have been signed.
14
C H A P T E R 4 F I N A N C I A l I N T E G R AT I O N
The Arab Monetary Fund is coordinating planned improvements to financial integration in MENA, which also benefits the Maghreb subregion. Reforms include ongoing work to identify obstacles to further integration, a project to harmonize payments systems in the region, and analytical work on financial regu-lation. It is important to note that MENA fi-
nancial systems are generally weak compared to other regions (for example, with regard to transparency and crisis resolution mecha-nisms). Improving transparency and designing cross-border resolution mechanisms will be even more challenging at a regional level than domestically.
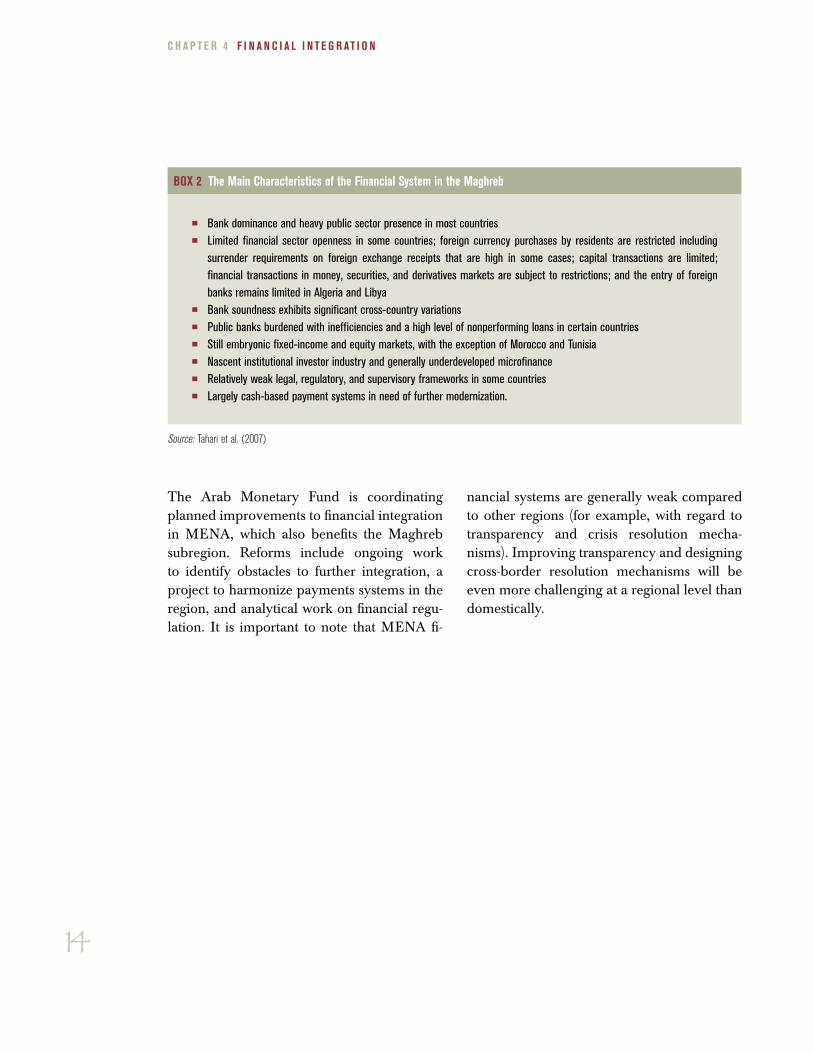
BOx 2 The Main Characteristics of the Financial System in the Maghreb
�� Bank dominance and heavy public sector presence in most countries�� Limited financial sector openness in some countries; foreign currency purchases by residents are restricted including
surrender requirements on foreign exchange receipts that are high in some cases; capital transactions are limited; financial transactions in money, securities, and derivatives markets are subject to restrictions; and the entry of foreign banks remains limited in Algeria and Libya
�� Bank soundness exhibits significant cross-country variations�� Public banks burdened with inefficiencies and a high level of nonperforming loans in certain countries�� Still embryonic fixed-income and equity markets, with the exception of Morocco and Tunisia�� Nascent institutional investor industry and generally underdeveloped microfinance�� Relatively weak legal, regulatory, and supervisory frameworks in some countries�� Largely cash-based payment systems in need of further modernization.
Source: Tahari et al. (2007)
15
Integration through Physical Infrastructure
There is growing evidence of the importance of improved infrastruc-
ture and cross-border trade facilitation on the volume of trade and the
extent of economic integration. According to a review of the literature
on this subject (World Bank 2006), a 10-percent increase in transport
costs may reduce trade volume by more than 20 percent, and the de-
cline in transport costs accounts for 8 percent of average world growth
since 1945. Doubling the number of paved airports per square kilome-
ter of territory in a country would be expected to boost imports by 14
percent, and doubling the kilometers of paved roads per 100 square
kilometers would increase trade by an estimated 13 percent.
Most countries in the subregion have made good progress on investing in and re-forming infrastructure and cross-border trade institutions such as customs. There are areas, however, where investment and reforms are still needed to better integrate the subregion. On the infrastructure side, there are missing road links between Algeria and Morocco; railway links and standardization between Algeria, Morocco, and Tu-nisia; and highway links between Libya and Tunisia. Most of the bottlenecks relate to standardization and harmonization of procedures and institutional capacity building (including training and information sharing). The World Bank is carrying out a study on cross-border trade facilitation and infrastructure in the Maghreb with a view to helping the concerned countries to develop an action plan similar to the one recently completed for the Mashreq.14
Transport Sector15
While road density in the Maghreb is higher than the average in Central and Eastern Europe (and in the MENA region), access to railway infrastructure is lower in the
Chapter 5
14 The World Bank’s work aims to complement the priorities of the Regional Transport Action Plan for the Medi-terranean Region (2007–2013) prepared by the European Union under the Euromed Initiative.15 For a summary of the progress made on transportation and logistics in Algeria, Morocco, and Tunisia, see Benabderrazik (2008).
16
C H A P T E R 5 I N T E G R AT I O N T H R O U G H P H y S I C A l I N F R A S T R U C T U R E
Maghreb. Morocco and Tunisia have higher-density road networks, but only in Tunisia is the road system well developed and maintained. In the domain of maritime transport, Morocco holds the lead due to its strategic geographical position and its 3,000 kilometers of Mediter-ranean and Atlantic coastline. Morocco has 26 ports and Algeria has 10. The Maghreb’s per-formance on air travel is less strong than other regions, and the main airlines remain small.
Morocco has recently initiated reforms to liber-alize the transport sector. In 2003, the country undertook reforms to upgrade the road trans-port sector and open it up to foreign compe-tition. In 2005, Morocco connected its road network with that of Mauritania by building the Nouadhibou–Nouakchott road. The public railway company was restructured in the late 1990s, and the state-owned maritime company was restructured in 2004. A partial liberaliza-tion of air transport took effect in 2004 with two major objectives: making Casablanca Moham-med V Airport a hub for North and West Af-rica and attracting 10 million tourists by 2010. These reforms have contributed to improving the quality of the transport sector in Morocco.
Additional reforms are still needed. These reforms include privatizing port services and promoting private investment in ports, facili-tating foreign investors’ access to trade-related transport, modernizing and restructuring state-owned enterprises in the railway sector, and liberalizing airport and air transport services.
Telecommunications Sector
The telecommunications sector serves as in-put for most other economic activities. Most importantly, the sector plays the role of con-nector both within national economy and with
the global economy. Jansen and Nordas (2004) found a positive correlation between the ratio of trade to GDP and the density of fixed and mobile phone lines.
The Maghreb lags behind regional compara-tors on telecommunications infrastructure. Countries in the Maghreb are characterized by low fixed telephone and high mobile phone densities, as well as high costs for making calls. With regard to Internet and multimedia ser-vices, the Maghreb is comparable to East Asia in terms of usage but lingers behind other re-gions on cost and quality. Though the benefits of harmonizing telecommunications policies in the context of regional integration are less evident than for other services, regional coop-eration in telecommunications can be a good channel for sharing experiences and good practices. This is the case, for example, among ASEAN economies.
Maghreb countries have initiated telecommu-nications reforms. Ongoing initiatives include the separation of regulatory functions from operational functions, the creation of indepen-dent regulators, privatization of the incumbent telecommunications company, the gradual opening of the fixed-wire network to compe-tition, tendering of competing GSM licenses, and the full liberalization of value-added ser-vices. Mauritania has shown more interest in opening its network to regional companies. Three-quarters of the telecommunications sec-tor in Mauritania is owned by Maroc Telecom and Tunisian companies.
Power and Water Sectors
Power and water are excellent drivers for re-gional integration in the Maghreb. In recent years, many interconnection projects have
17
I N T E G R AT I O N T H R O U G H P H y S I C A l I N F R A S T R U C T U R E C H A P T E R 5
allowed the countries of the Maghreb to be hooked to their neighbors’ transmission net-works. However, the low capacity of these connections permits only emergency and peak exchanges. To further regional integration, several expansions of capacity are planned, including the North Africa–Middle East–Eu-rope Mediterranean Power Pool to connect the power grids of Algeria, Morocco, Tunisia, Lib-ya, Egypt, Spain, and the Middle East. In terms of alternative energy sources, the Maghreb, to-gether with other countries in MENA, has the world’s best potential for production of solar power.
The Maghreb performs relatively well within the MENA region on access to electricity, water supply, and sanitation services. Tunisia
has achieved universal coverage in urban ar-eas and 24-hour service. In Morocco, the four largest cities enjoy universal coverage. How-ever, Algeria uses an intermittent supply sys-tem. The use of government subsidies in the Maghreb ensures that the cost to consumers of power and water services is relatively low.
The acceptable performance of the Maghreb’s power and water sectors could be enhanced through a number of reforms. These sectors continue to be dominated by state-owned mo-nopolies, as recent reforms to introduce com-petition, restructure the state-owned utilities, and liberalize and modernize the regulatory framework remain marginal. Within the sub-region, Morocco has made the most meaning-ful progress in reforming its electricity sector.
18
Constraints to Integration in the Maghreb
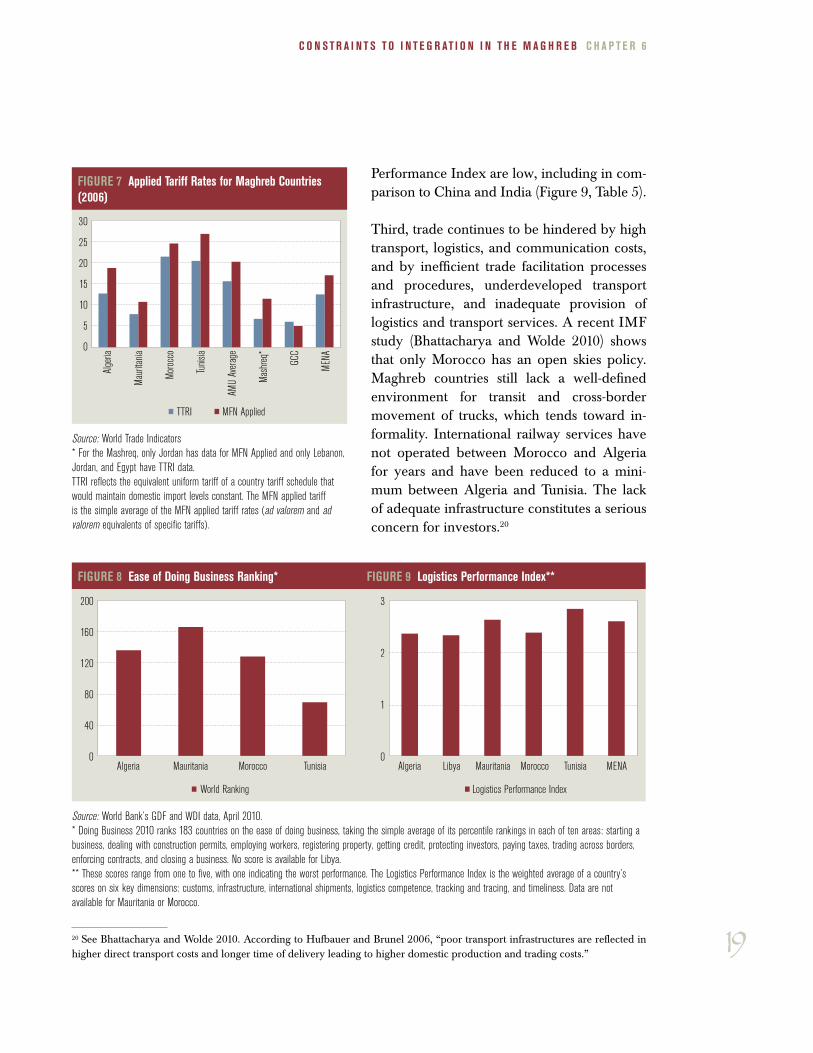
Trade in the Maghreb has suffered as a result of high tariff levels.
The level of applied tariffs in Maghreb countries is nearly double the
world average (Hufbauer and Brunel 2008). Applied Most Favored
Nation (MFN) tariffs are 19 percent in Algeria and over 20 percent in
Tunisia and Morocco. This high level of protection has serious impli-
cations for trade in the region.16 Firms have an incentive to produce
import-competing goods, which can limit trade. High duties on im-
ported inputs lower the competitiveness of products exported from
the region. There are also significant nontariff barriers to trade in the
Maghreb. Using Trade Analysis and Information System (TRAINS)
data,17 the Peterson Institute indicates that Algeria applies nontariff
measures to 417 products as compared to 746 and 1,204, respective-
ly, for Tunisia and Morocco (Figure 7).18
Second, notwithstanding recent improvements in some Maghreb countries (notably Tunisia and Morocco),19 the overall investment climate in the subregion could be strengthened substantially to promote trade, growth, and jobs. With the exception of Tunisia, all the countries in the subregion rank in the bottom third of the world’s countries on the ease of doing business (Figure 8). Overall scores on the Logistics
Chapter 6
16 See Brenton et al. 2006 for a detailed discussion of these implications.17 Trade Analysis and Information System.18 Nontariff measures (NTMs) have become the most important barriers to trade in the Arab world. These include straightforward border closures, excessive delays resulting from lengthy clearance and inspection pro-cesses, the large number of documents and signatures needed to process a trade transaction, and the frequency of problems with customs and other government authorities. According to the Tariff-only Trade Restrictiveness Index (TTRI), only the South Asia region had higher levels of tariff restrictiveness than the MENA region in 2008. When NTMs are included in the calculation of the overall trade restrictiveness index (OTRI), the MENA region comes across as the most restrictive region in the world, driven by high NTMs on agriculture goods. See Chauffour 2010.19 As reflected in Doing Business reports and the Logistics Performance Indices, World Bank Group.
19
C O N S T R A I N T S T O I N T E G R AT I O N I N T H E M A G H R E B C H A P T E R 6
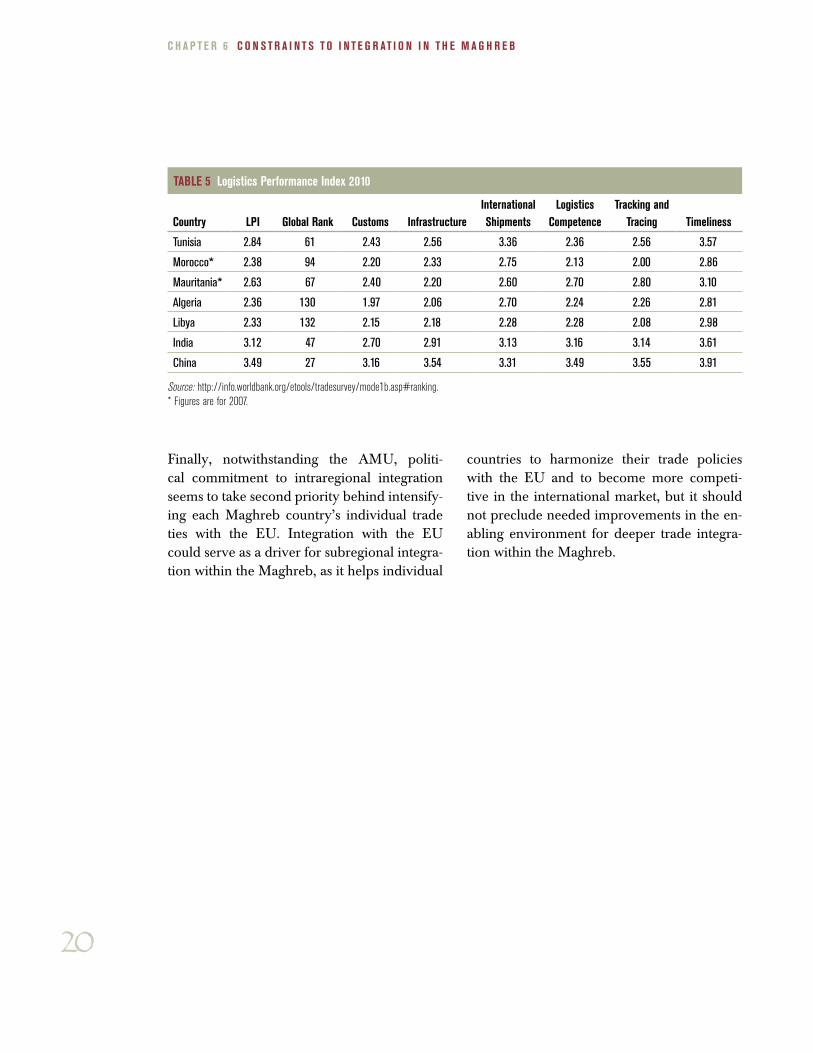
Performance Index are low, including in com-parison to China and India (Figure 9, Table 5).
Third, trade continues to be hindered by high transport, logistics, and communication costs, and by inefficient trade facilitation processes and procedures, underdeveloped transport infrastructure, and inadequate provision of logistics and transport services. A recent IMF study (Bhattacharya and Wolde 2010) shows that only Morocco has an open skies policy. Maghreb countries still lack a well-defined environment for transit and cross-border movement of trucks, which tends toward in-formality. International railway services have not operated between Morocco and Algeria for years and have been reduced to a mini-mum between Algeria and Tunisia. The lack of adequate infrastructure constitutes a serious concern for investors.20
FIGURE 7 Applied Tariff Rates for Maghreb Countries (2006)
0
5
10
15
20
25
30
TTRI MFN Applied
Alge
ria
AMU
Aver
age
GCC
MEN
A
Mash
req*
Maur
itania
Moro
cco
Tunis
ia
Source: World Trade Indicators* For the Mashreq, only Jordan has data for MFN Applied and only Lebanon, Jordan, and Egypt have TTRI data.TTRI reflects the equivalent uniform tariff of a country tariff schedule that would maintain domestic import levels constant. The MFN applied tariff is the simple average of the MFN applied tariff rates (ad valorem and ad valorem equivalents of specific tariffs).
FIGURE 8 Ease of Doing Business Ranking* FIGURE 9 logistics Performance Index**
1810 12 17 16
Algeria Mauritania Morocco Tunisia
1810 12 17 16
Algeria Libya Morocco MENAMauritania Tunisia0
40
80
120
160
200
World Ranking
0
1
2
3
Logistics Performance Index
Source: World Bank’s GDF and WDI data, April 2010.* Doing Business 2010 ranks 183 countries on the ease of doing business, taking the simple average of its percentile rankings in each of ten areas: starting a business, dealing with construction permits, employing workers, registering property, getting credit, protecting investors, paying taxes, trading across borders, enforcing contracts, and closing a business. No score is available for Libya. ** These scores range from one to five, with one indicating the worst performance. The Logistics Performance Index is the weighted average of a country’s scores on six key dimensions: customs, infrastructure, international shipments, logistics competence, tracking and tracing, and timeliness. Data are not available for Mauritania or Morocco.
20 See Bhattacharya and Wolde 2010. According to Hufbauer and Brunel 2006, “poor transport infrastructures are reflected in higher direct transport costs and longer time of delivery leading to higher domestic production and trading costs.”
20
C H A P T E R 6 C O N S T R A I N T S T O I N T E G R AT I O N I N T H E M A G H R E B
Finally, notwithstanding the AMU, politi-cal commitment to intraregional integration seems to take second priority behind intensify-ing each Maghreb country’s individual trade ties with the EU. Integration with the EU could serve as a driver for subregional integra-tion within the Maghreb, as it helps individual
countries to harmonize their trade policies with the EU and to become more competi-tive in the international market, but it should not preclude needed improvements in the en-abling environment for deeper trade integra-tion within the Maghreb.
TABlE 5 logistics Performance Index 2010
Country lPI Global Rank Customs InfrastructureInternational Shipments
logistics Competence
Tracking and Tracing Timeliness
Tunisia 2.84 61 2.43 2.56 3.36 2.36 2.56 3.57
Morocco* 2.38 94 2.20 2.33 2.75 2.13 2.00 2.86
Mauritania* 2.63 67 2.40 2.20 2.60 2.70 2.80 3.10
Algeria 2.36 130 1.97 2.06 2.70 2.24 2.26 2.81
Libya 2.33 132 2.15 2.18 2.28 2.28 2.08 2.98
India 3.12 47 2.70 2.91 3.13 3.16 3.14 3.61
China 3.49 27 3.16 3.54 3.31 3.49 3.55 3.91
Source: http://info.worldbank.org/etools/tradesurvey/mode1b.asp#ranking.* Figures are for 2007.
21
As in MENA more broadly, trade between the Maghreb countries
and the rest of the world is limited, with exports concentrated in
a few commodities or products. There are wide country variations,
however, with Morocco and Tunisia exhibiting higher trade volumes
and greater export diversification. The bulk of Maghreb trade is with
Europe, which is partly a reflection of historical conditions, the na-
ture of trade commodities, and, more recently, efforts on the part of
individual countries to liberalize trade with Europe.
Conclusion
Despite the establishment of the AMU some two decades ago, trade within the Maghreb remains low in absolute and relative terms and by comparison to other world trading blocs. In 2007, intra-Maghreb trade represented less than 2 percent of the subregion’s combined GDP and less than 3 percent of total sub-regional trade. This goes against the con-ventional gravity model, which predicts that countries trade more with nearby countries. Some of the reasons for the Maghreb’s low trade performance in-clude high barriers to trade, logistical bottlenecks, lack of diversification of the production base, and political con-siderations. The region has seen some increases in intraregional infrastructure links and trade facilitation improve-ments, but much remains to be done, no-tably on cross-border facilitation logistics and physical infrastructure investments.
The focus on trade liberalization with the EU is a welcome development, as it enables individual Maghreb countries to lock in policies that would eventually help them harmonize their own poli-cies. The same argument can be made
regarding accession to the WTO. It will be critical for Maghreb countries to align and harmonize their policies so as to reduce market segmentation and the costs arising from border trade barriers. Countries in the subregion would reap significant additional benefits if, in par-allel to their work on liberalizing trade with Europe, they improved conditions for trade among themselves and within MENA more broadly. The high level of market and product concentration is a source of vulnerability for the Maghreb economies. One of the key policy steps that Arab countries can take in the con-text of PAFTA is the streamlining of non-tariff measures, which are exceptionally high in the Maghreb.
Trade in services varies from one Maghreb country to another and over time. Morocco has seen the most sub-stantial growth in the services trade as a share of GDP in recent years. Tunisia is the most active country, with trade representing more than 20 percent of GDP. Both countries are net exporters of services (especially tourism), while Al-geria is a net importer. Comprehensive
22
C O N C l U S I O N
services reforms in areas such as the financial sector, transportation and logistics, and com-munications and information, which involve increased competition and regulatory stream-lining, would yield benefits that are two to three times the magnitude of those achieved
through tariff removal alone. The capital mar-ket is also showing signs of integration, with countries implementing significant structural reforms (particularly Morocco and Tunisia) and investors from the GCC searching for op-portunities.
23
Achy, Lahcen. 2006. Assessing Regional Integration Potential in North Africa. United Nations Economic Commission for Africa.
Bchir, Mohammed Hedi, Hakim Ben Hammouda, Nassim Oulmane, and Mustapha Sadni Jallab. 2006. The Cost of non-Maghreb: Achieving the Gains from Eco-nomic Integration. Africa Trade Policy Center, Work in Progress No. 44, Eco-nomic Commission for Africa.
Benabderrazik, Hassan. 2008. “Opportunities for Logistical Improvements through Maghreb Integration,” in Gary Clyde Hufbauer, and Claire Brunel, eds. Maghreb Regional and Global Integration: A Dream to Be Fulfilled. Peterson Institute for International Economics. www.piie.com/publications/chapters_preview/4266/11iie4266.pdf
Bhattacharya, Rina, and Hirut Wolde. 2010. Constraints on Trade in the MENA Re-gion. IMF Working Paper No. 31.
Brenton, Paul, Eugenia Baroncelli, and Mariem Malouche. 2006. Trade and Invest-ment Integration of the Maghreb. MENA Working Paper Series No. 44. Wash-ington, D.C., World Bank.
Chauffour, Jean-Pierre. 2010. “Furthering Intra-Regional Integration in the Arab World.” Mimeo. World Bank.
Cieslik, Andrzej, and Jan Hagemerjer. 2009. Assessing the impact of the EU-spon-sored trade liberalization in the MENA countries. Journal of Economic Integra-tion 2 (24): 344–369.
DeRosa, Dean A. 2008. “Prospects for Greater Global and Regional Integration in the Maghreb.” Draft. Peterson Institute for International Economics.
Freund, Caroline, and Emanuel Ornelas. 2010. Regional Trade Agreements. Policy Research Working Paper No. 5314. Washington, D.C., World Bank.
Hoekman, Bernard, and Jamel Zarrouk, eds. 2000. Catching Up with the Competi-tion: Trade Opportunities and Challenges for Arab Countries. Ann Arbor: Uni-versity of Michigan Press, 9–44.
Hufbauer, Gary Clyde, and Claire Brunel. 2008. Maghreb Regional and Global Inte-gration: A Dream to be Fulfilled. Policy Analyses in International Economics No. 86. Peterson Institute for International Economics.
Jansen, Marion and Nordas, Hildegunn Kyvik. 2004. Institutions, Trade Policy and Trade Flows. WTO Staff Working Paper No. ERSD-2004–02.
Konan, Denise Eby. 2003. “Alternative Paths to Prosperity: Trade Liberalization in Egypt and Tunisia,” in Ahmed Galal and Bernard Hoekman, eds. Arab Econmic Integration: Between Hope and Reality. Egyptian Center for Economic Studies.
Tahari, Amor, Patricia Brenner, Erik De Vrijer, Marina Moretti, Abdelhak Senhadji, Gabriel Sensenbrenner, and Juan Solé. 2007. Financial Sector Reform and Pros-pects for Financial Integration in Maghreb Countries. IMF Working Paper No. 125.
World Bank. 2006. Is There A New Vision For Maghreb Economic Integration? World Bank Report No. 38359. Washington, D.C.: World Bank.
References
24
R E F E R E N C E S
World Bank. 2008. 2008 Economic Develop-ments and Prospects: Regional Integration for Global Competitiveness. Middle East and North Africa Region.
World Bank and European Union. 2010. Mid-dle East and North Africa Region: Labor Migration from North Africa: Develop-ment Impact, Challenges, and Policy Op-tions. Volume I: Main Report.
Yeats. Alexander J,. and Francis Ng. 2000. Be-yond the Year 2000: Implications of the Middle East Recent Trade Performance,î in Bernard Hoekman and Jamel Zarrouk, eds., Catching Up with the Competition: Trade Opportunities and Challenges for Arab Countries. Ann Arbor: University of Michigan Press, 9–44.
25
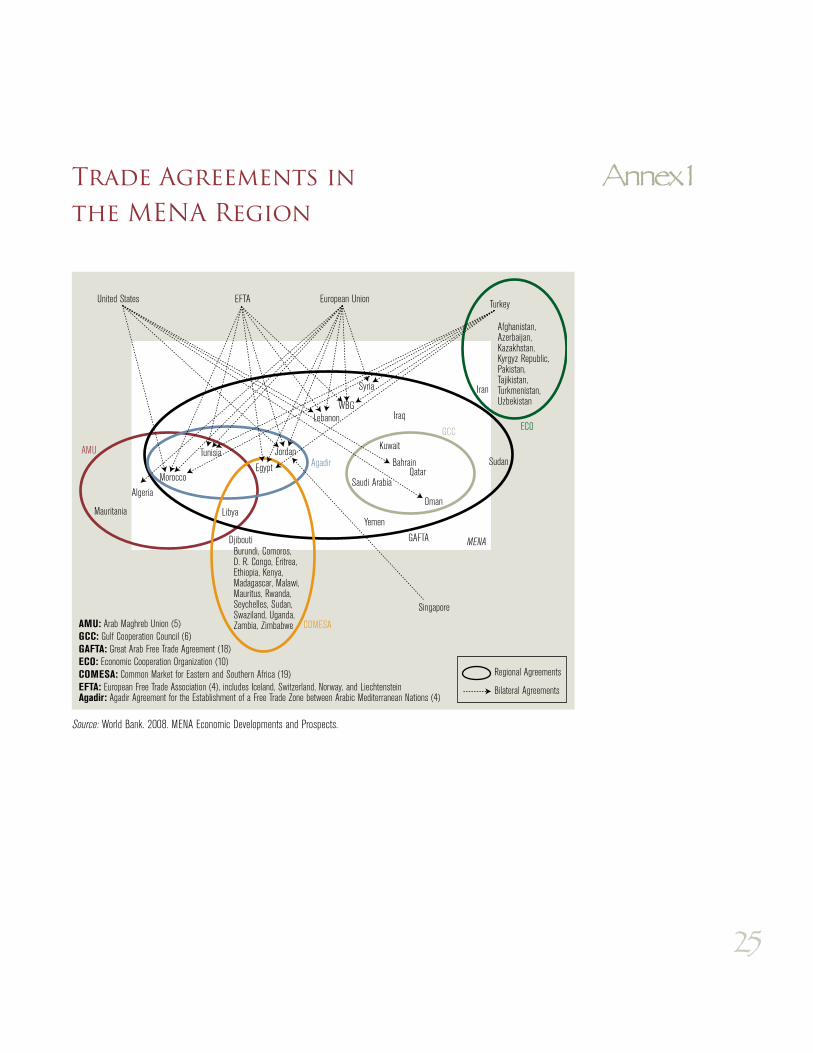
Trade Agreements in the MENA Region
United States EFTA European Union Turkey
Iran
IraqWBG
GAFTA
Sudan
Djibouti
Mauritania
Singapore
Regional Agreements
Bilateral Agreements
MENA
Afghanistan,Azerbaijan,Kazakhstan,Kyrgyz Republic,Pakistan,Tajikistan,Turkmenistan,Uzbekistan
Burundi, Comoros,D. R. Congo, Eritrea,Ethiopia, Kenya,Madagascar, Malawi,Mauritus, Rwanda,Seychelles, Sudan,Swaziland, Uganda,Zambia, ZimbabweAMU: Arab Maghreb Union (5)
GCC: Gulf Cooperation Council (6)GAFTA: Great Arab Free Trade Agreement (18)ECO: Economic Cooperation Organization (10)COMESA: Common Market for Eastern and Southern Africa (19)EFTA: European Free Trade Association (4), includes Iceland, Switzerland, Norway, and LiechtensteinAgadir: Agadir Agreement for the Establishment of a Free Trade Zone between Arabic Mediterranean Nations (4)
ECOGCC
Agadir
COMESA
AMU
Libya
Bahrain
Yemen
Saudi Arabia
Kuwait
AlgeriaOman
Qatar
Lebanon
Syria
EgyptTunisia Jordan
Morocco
Source: World Bank. 2008. MENA Economic Developments and Prospects.
Annex 1
26
Statistical TablesAnnex 2
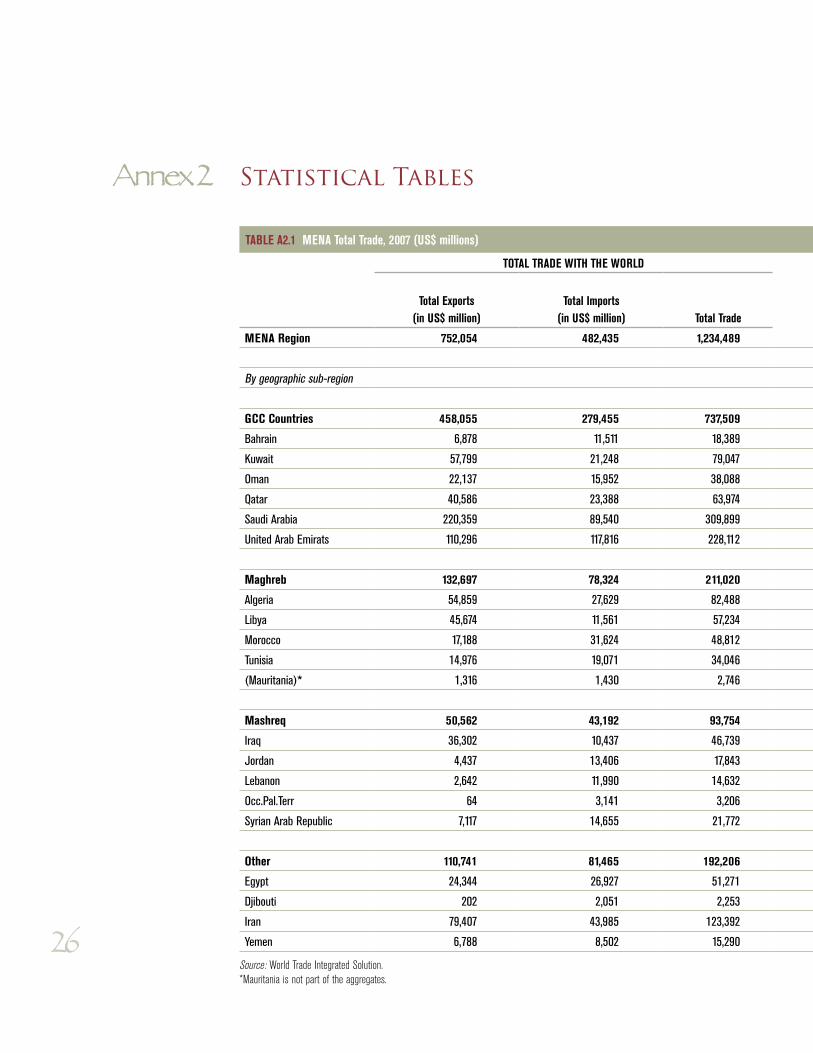
TABlE A2.1 MENA Total Trade, 2007 (US$ millions)
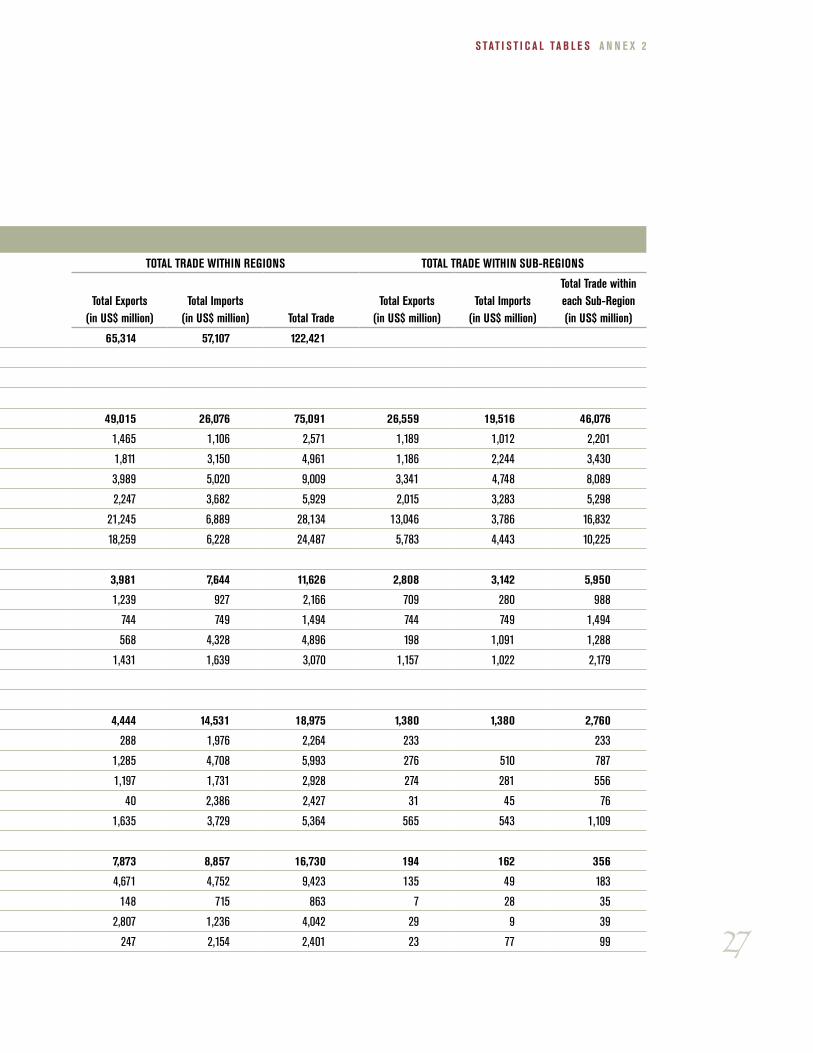
TOTAl TRADE WITH THE WORlD TOTAl TRADE WITHIN REGIONS TOTAl TRADE WITHIN SUB-REGIONS
Total Exports (in US$ million)
Total Imports (in US$ million) Total Trade
Total Exports (in US$ million)
Total Imports (in US$ million) Total Trade
Total Exports (in US$ million)
Total Imports (in US$ million)
Total Trade within each Sub-Region (in US$ million)
MENA Region 752,054 482,435 1,234,489 65,314 57,107 122,421
By geographic sub-region
GCC Countries 458,055 279,455 737,509 49,015 26,076 75,091 26,559 19,516 46,076
Bahrain 6,878 11,511 18,389 1,465 1,106 2,571 1,189 1,012 2,201
Kuwait 57,799 21,248 79,047 1,811 3,150 4,961 1,186 2,244 3,430
Oman 22,137 15,952 38,088 3,989 5,020 9,009 3,341 4,748 8,089
Qatar 40,586 23,388 63,974 2,247 3,682 5,929 2,015 3,283 5,298
Saudi Arabia 220,359 89,540 309,899 21,245 6,889 28,134 13,046 3,786 16,832
United Arab Emirats 110,296 117,816 228,112 18,259 6,228 24,487 5,783 4,443 10,225
Maghreb 132,697 78,324 211,020 3,981 7,644 11,626 2,808 3,142 5,950
Algeria 54,859 27,629 82,488 1,239 927 2,166 709 280 988
Libya 45,674 11,561 57,234 744 749 1,494 744 749 1,494
Morocco 17,188 31,624 48,812 568 4,328 4,896 198 1,091 1,288
Tunisia 14,976 19,071 34,046 1,431 1,639 3,070 1,157 1,022 2,179
(Mauritania)* 1,316 1,430 2,746
Mashreq 50,562 43,192 93,754 4,444 14,531 18,975 1,380 1,380 2,760
Iraq 36,302 10,437 46,739 288 1,976 2,264 233 233
Jordan 4,437 13,406 17,843 1,285 4,708 5,993 276 510 787
Lebanon 2,642 11,990 14,632 1,197 1,731 2,928 274 281 556
Occ.Pal.Terr 64 3,141 3,206 40 2,386 2,427 31 45 76
Syrian Arab Republic 7,117 14,655 21,772 1,635 3,729 5,364 565 543 1,109
Other 110,741 81,465 192,206 7,873 8,857 16,730 194 162 356
Egypt 24,344 26,927 51,271 4,671 4,752 9,423 135 49 183
Djibouti 202 2,051 2,253 148 715 863 7 28 35
Iran 79,407 43,985 123,392 2,807 1,236 4,042 29 9 39
Yemen 6,788 8,502 15,290 247 2,154 2,401 23 77 99
Source: World Trade Integrated Solution.*Mauritania is not part of the aggregates.
27
S TAT I S T I C A l TA B l E S A N N E x 2
TABlE A2.1 MENA Total Trade, 2007 (US$ millions)
TOTAl TRADE WITH THE WORlD TOTAl TRADE WITHIN REGIONS TOTAl TRADE WITHIN SUB-REGIONS
Total Exports (in US$ million)
Total Imports (in US$ million) Total Trade
Total Exports (in US$ million)
Total Imports (in US$ million) Total Trade
Total Exports (in US$ million)
Total Imports (in US$ million)
Total Trade within each Sub-Region (in US$ million)
MENA Region 752,054 482,435 1,234,489 65,314 57,107 122,421
By geographic sub-region
GCC Countries 458,055 279,455 737,509 49,015 26,076 75,091 26,559 19,516 46,076
Bahrain 6,878 11,511 18,389 1,465 1,106 2,571 1,189 1,012 2,201
Kuwait 57,799 21,248 79,047 1,811 3,150 4,961 1,186 2,244 3,430
Oman 22,137 15,952 38,088 3,989 5,020 9,009 3,341 4,748 8,089
Qatar 40,586 23,388 63,974 2,247 3,682 5,929 2,015 3,283 5,298
Saudi Arabia 220,359 89,540 309,899 21,245 6,889 28,134 13,046 3,786 16,832
United Arab Emirats 110,296 117,816 228,112 18,259 6,228 24,487 5,783 4,443 10,225
Maghreb 132,697 78,324 211,020 3,981 7,644 11,626 2,808 3,142 5,950
Algeria 54,859 27,629 82,488 1,239 927 2,166 709 280 988
Libya 45,674 11,561 57,234 744 749 1,494 744 749 1,494
Morocco 17,188 31,624 48,812 568 4,328 4,896 198 1,091 1,288
Tunisia 14,976 19,071 34,046 1,431 1,639 3,070 1,157 1,022 2,179
(Mauritania)* 1,316 1,430 2,746
Mashreq 50,562 43,192 93,754 4,444 14,531 18,975 1,380 1,380 2,760
Iraq 36,302 10,437 46,739 288 1,976 2,264 233 233
Jordan 4,437 13,406 17,843 1,285 4,708 5,993 276 510 787
Lebanon 2,642 11,990 14,632 1,197 1,731 2,928 274 281 556
Occ.Pal.Terr 64 3,141 3,206 40 2,386 2,427 31 45 76
Syrian Arab Republic 7,117 14,655 21,772 1,635 3,729 5,364 565 543 1,109
Other 110,741 81,465 192,206 7,873 8,857 16,730 194 162 356
Egypt 24,344 26,927 51,271 4,671 4,752 9,423 135 49 183
Djibouti 202 2,051 2,253 148 715 863 7 28 35
Iran 79,407 43,985 123,392 2,807 1,236 4,042 29 9 39
Yemen 6,788 8,502 15,290 247 2,154 2,401 23 77 99
28
A N N E x 2 S TAT I S T I C A l TA B l E S
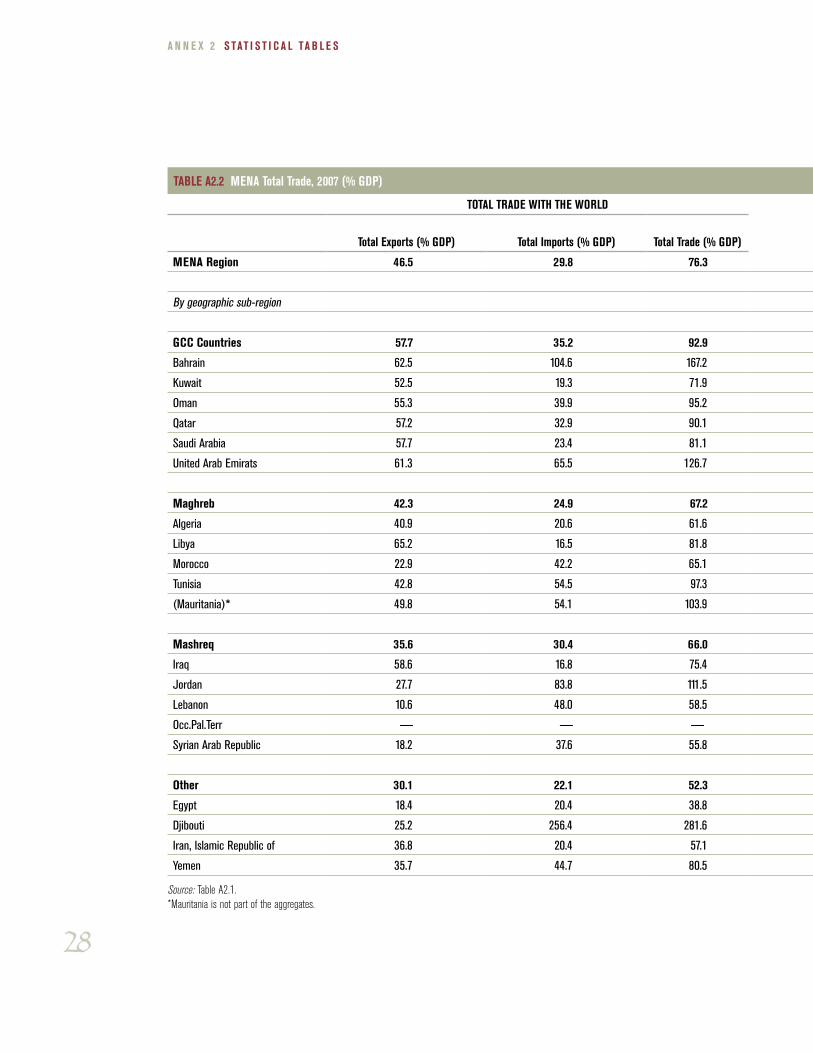
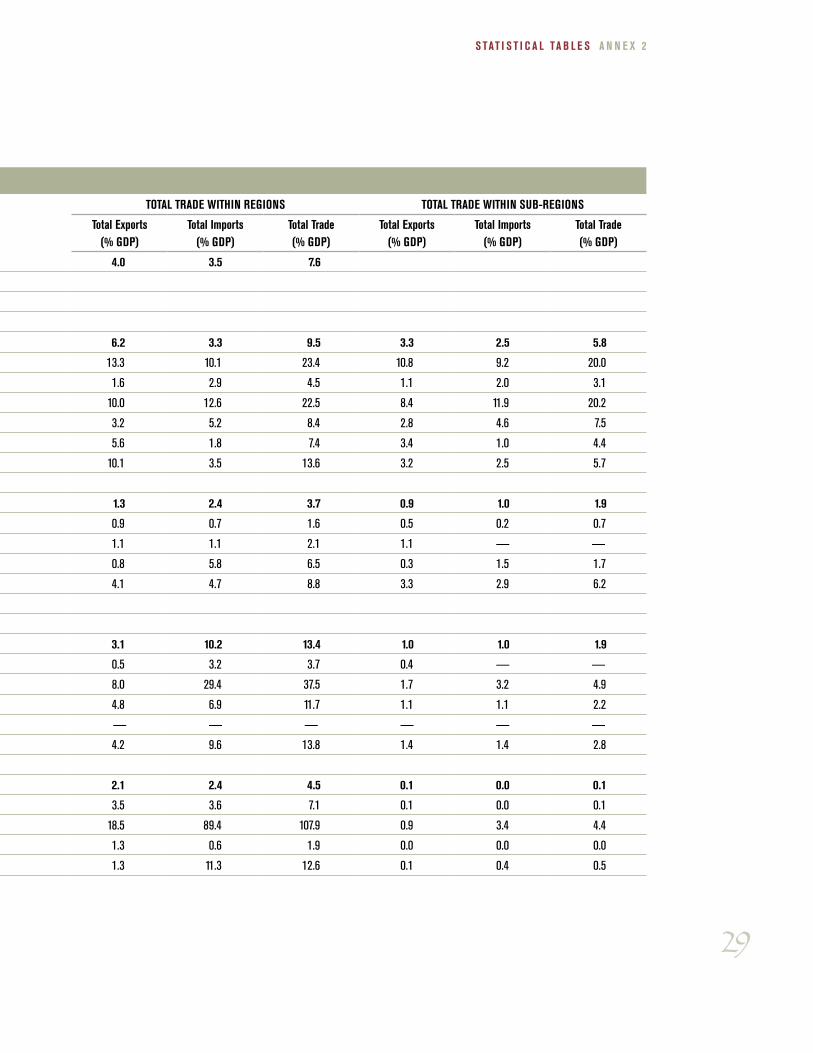
TABlE A2.2 MENA Total Trade, 2007 (% GDP)
TOTAl TRADE WITH THE WORlD TOTAl TRADE WITHIN REGIONS TOTAl TRADE WITHIN SUB-REGIONS
Total Exports (% GDP) Total Imports (% GDP) Total Trade (% GDP)Total Exports
(% GDP)Total Imports
(% GDP)Total Trade (% GDP)
Total Exports (% GDP)
Total Imports (% GDP)
Total Trade (% GDP)
MENA Region 46.5 29.8 76.3 4.0 3.5 7.6
By geographic sub-region
GCC Countries 57.7 35.2 92.9 6.2 3.3 9.5 3.3 2.5 5.8
Bahrain 62.5 104.6 167.2 13.3 10.1 23.4 10.8 9.2 20.0
Kuwait 52.5 19.3 71.9 1.6 2.9 4.5 1.1 2.0 3.1
Oman 55.3 39.9 95.2 10.0 12.6 22.5 8.4 11.9 20.2
Qatar 57.2 32.9 90.1 3.2 5.2 8.4 2.8 4.6 7.5
Saudi Arabia 57.7 23.4 81.1 5.6 1.8 7.4 3.4 1.0 4.4
United Arab Emirats 61.3 65.5 126.7 10.1 3.5 13.6 3.2 2.5 5.7
Maghreb 42.3 24.9 67.2 1.3 2.4 3.7 0.9 1.0 1.9
Algeria 40.9 20.6 61.6 0.9 0.7 1.6 0.5 0.2 0.7
Libya 65.2 16.5 81.8 1.1 1.1 2.1 1.1 — —
Morocco 22.9 42.2 65.1 0.8 5.8 6.5 0.3 1.5 1.7
Tunisia 42.8 54.5 97.3 4.1 4.7 8.8 3.3 2.9 6.2
(Mauritania)* 49.8 54.1 103.9
Mashreq 35.6 30.4 66.0 3.1 10.2 13.4 1.0 1.0 1.9
Iraq 58.6 16.8 75.4 0.5 3.2 3.7 0.4 — —
Jordan 27.7 83.8 111.5 8.0 29.4 37.5 1.7 3.2 4.9
Lebanon 10.6 48.0 58.5 4.8 6.9 11.7 1.1 1.1 2.2
Occ.Pal.Terr — — — — — — — — —
Syrian Arab Republic 18.2 37.6 55.8 4.2 9.6 13.8 1.4 1.4 2.8
Other 30.1 22.1 52.3 2.1 2.4 4.5 0.1 0.0 0.1
Egypt 18.4 20.4 38.8 3.5 3.6 7.1 0.1 0.0 0.1
Djibouti 25.2 256.4 281.6 18.5 89.4 107.9 0.9 3.4 4.4
Iran, Islamic Republic of 36.8 20.4 57.1 1.3 0.6 1.9 0.0 0.0 0.0
Yemen 35.7 44.7 80.5 1.3 11.3 12.6 0.1 0.4 0.5
Source: Table A2.1.*Mauritania is not part of the aggregates.
29
S TAT I S T I C A l TA B l E S A N N E x 2
TABlE A2.2 MENA Total Trade, 2007 (% GDP)
TOTAl TRADE WITH THE WORlD TOTAl TRADE WITHIN REGIONS TOTAl TRADE WITHIN SUB-REGIONS
Total Exports (% GDP) Total Imports (% GDP) Total Trade (% GDP)Total Exports
(% GDP)Total Imports
(% GDP)Total Trade (% GDP)
Total Exports (% GDP)
Total Imports (% GDP)
Total Trade (% GDP)
MENA Region 46.5 29.8 76.3 4.0 3.5 7.6
By geographic sub-region
GCC Countries 57.7 35.2 92.9 6.2 3.3 9.5 3.3 2.5 5.8
Bahrain 62.5 104.6 167.2 13.3 10.1 23.4 10.8 9.2 20.0
Kuwait 52.5 19.3 71.9 1.6 2.9 4.5 1.1 2.0 3.1
Oman 55.3 39.9 95.2 10.0 12.6 22.5 8.4 11.9 20.2
Qatar 57.2 32.9 90.1 3.2 5.2 8.4 2.8 4.6 7.5
Saudi Arabia 57.7 23.4 81.1 5.6 1.8 7.4 3.4 1.0 4.4
United Arab Emirats 61.3 65.5 126.7 10.1 3.5 13.6 3.2 2.5 5.7
Maghreb 42.3 24.9 67.2 1.3 2.4 3.7 0.9 1.0 1.9
Algeria 40.9 20.6 61.6 0.9 0.7 1.6 0.5 0.2 0.7
Libya 65.2 16.5 81.8 1.1 1.1 2.1 1.1 — —
Morocco 22.9 42.2 65.1 0.8 5.8 6.5 0.3 1.5 1.7
Tunisia 42.8 54.5 97.3 4.1 4.7 8.8 3.3 2.9 6.2
(Mauritania)* 49.8 54.1 103.9
Mashreq 35.6 30.4 66.0 3.1 10.2 13.4 1.0 1.0 1.9
Iraq 58.6 16.8 75.4 0.5 3.2 3.7 0.4 — —
Jordan 27.7 83.8 111.5 8.0 29.4 37.5 1.7 3.2 4.9
Lebanon 10.6 48.0 58.5 4.8 6.9 11.7 1.1 1.1 2.2
Occ.Pal.Terr — — — — — — — — —
Syrian Arab Republic 18.2 37.6 55.8 4.2 9.6 13.8 1.4 1.4 2.8
Other 30.1 22.1 52.3 2.1 2.4 4.5 0.1 0.0 0.1
Egypt 18.4 20.4 38.8 3.5 3.6 7.1 0.1 0.0 0.1
Djibouti 25.2 256.4 281.6 18.5 89.4 107.9 0.9 3.4 4.4
Iran, Islamic Republic of 36.8 20.4 57.1 1.3 0.6 1.9 0.0 0.0 0.0
Yemen 35.7 44.7 80.5 1.3 11.3 12.6 0.1 0.4 0.5
Source: Table A2.1.*Mauritania is not part of the aggregates.
30
A N N E x 2 S TAT I S T I C A l TA B l E S
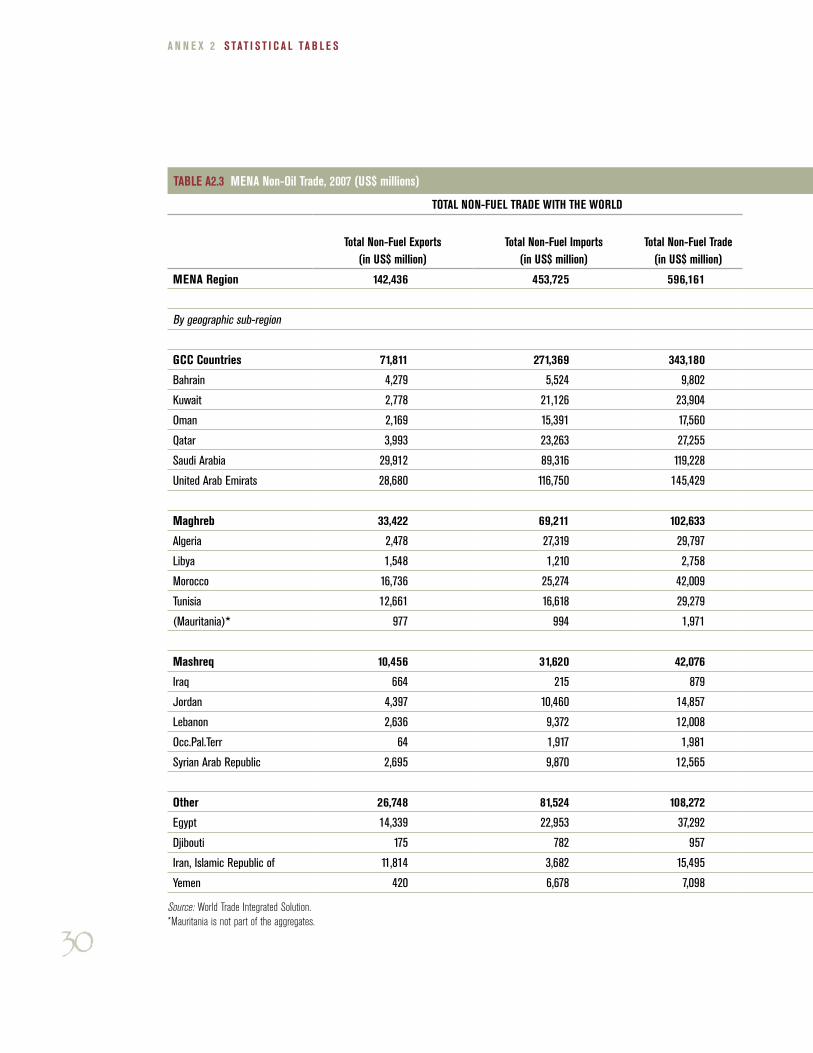
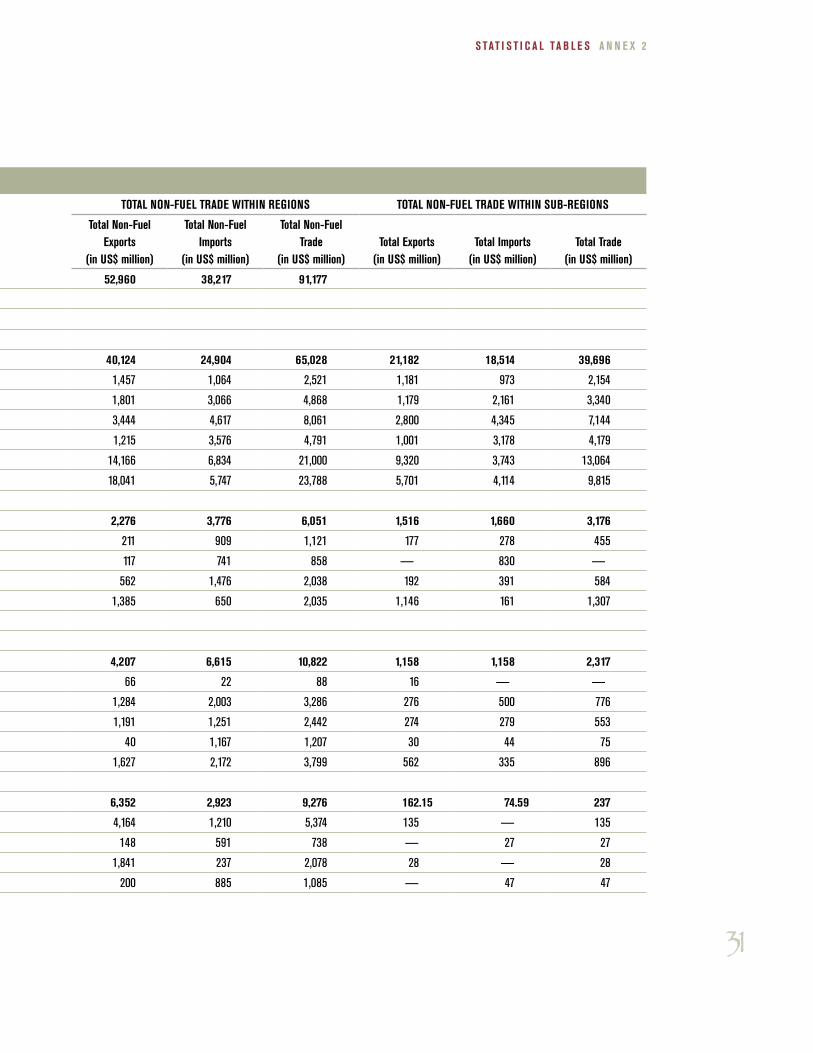
TABlE A2.3 MENA Non-Oil Trade, 2007 (US$ millions)
TOTAl NON-FUEl TRADE WITH THE WORlD TOTAl NON-FUEl TRADE WITHIN REGIONS TOTAl NON-FUEl TRADE WITHIN SUB-REGIONS
Total Non-Fuel Exports (in US$ million)
Total Non-Fuel Imports (in US$ million)
Total Non-Fuel Trade (in US$ million)
Total Non-Fuel Exports
(in US$ million)
Total Non-Fuel Imports
(in US$ million)
Total Non-Fuel Trade
(in US$ million)Total Exports
(in US$ million)Total Imports
(in US$ million)Total Trade
(in US$ million)
MENA Region 142,436 453,725 596,161 52,960 38,217 91,177
By geographic sub-region
GCC Countries 71,811 271,369 343,180 40,124 24,904 65,028 21,182 18,514 39,696
Bahrain 4,279 5,524 9,802 1,457 1,064 2,521 1,181 973 2,154
Kuwait 2,778 21,126 23,904 1,801 3,066 4,868 1,179 2,161 3,340
Oman 2,169 15,391 17,560 3,444 4,617 8,061 2,800 4,345 7,144
Qatar 3,993 23,263 27,255 1,215 3,576 4,791 1,001 3,178 4,179
Saudi Arabia 29,912 89,316 119,228 14,166 6,834 21,000 9,320 3,743 13,064
United Arab Emirats 28,680 116,750 145,429 18,041 5,747 23,788 5,701 4,114 9,815
Maghreb 33,422 69,211 102,633 2,276 3,776 6,051 1,516 1,660 3,176
Algeria 2,478 27,319 29,797 211 909 1,121 177 278 455
Libya 1,548 1,210 2,758 117 741 858 — 830 —
Morocco 16,736 25,274 42,009 562 1,476 2,038 192 391 584
Tunisia 12,661 16,618 29,279 1,385 650 2,035 1,146 161 1,307
(Mauritania)* 977 994 1,971
Mashreq 10,456 31,620 42,076 4,207 6,615 10,822 1,158 1,158 2,317
Iraq 664 215 879 66 22 88 16 — —
Jordan 4,397 10,460 14,857 1,284 2,003 3,286 276 500 776
Lebanon 2,636 9,372 12,008 1,191 1,251 2,442 274 279 553
Occ.Pal.Terr 64 1,917 1,981 40 1,167 1,207 30 44 75
Syrian Arab Republic 2,695 9,870 12,565 1,627 2,172 3,799 562 335 896
Other 26,748 81,524 108,272 6,352 2,923 9,276 162.15 74.59 237
Egypt 14,339 22,953 37,292 4,164 1,210 5,374 135 — 135
Djibouti 175 782 957 148 591 738 — 27 27
Iran, Islamic Republic of 11,814 3,682 15,495 1,841 237 2,078 28 — 28
Yemen 420 6,678 7,098 200 885 1,085 — 47 47
Source: World Trade Integrated Solution.*Mauritania is not part of the aggregates.
31
S TAT I S T I C A l TA B l E S A N N E x 2
TABlE A2.3 MENA Non-Oil Trade, 2007 (US$ millions)
TOTAl NON-FUEl TRADE WITH THE WORlD TOTAl NON-FUEl TRADE WITHIN REGIONS TOTAl NON-FUEl TRADE WITHIN SUB-REGIONS
Total Non-Fuel Exports (in US$ million)
Total Non-Fuel Imports (in US$ million)
Total Non-Fuel Trade (in US$ million)
Total Non-Fuel Exports
(in US$ million)
Total Non-Fuel Imports
(in US$ million)
Total Non-Fuel Trade
(in US$ million)Total Exports
(in US$ million)Total Imports
(in US$ million)Total Trade
(in US$ million)
MENA Region 142,436 453,725 596,161 52,960 38,217 91,177
By geographic sub-region
GCC Countries 71,811 271,369 343,180 40,124 24,904 65,028 21,182 18,514 39,696
Bahrain 4,279 5,524 9,802 1,457 1,064 2,521 1,181 973 2,154
Kuwait 2,778 21,126 23,904 1,801 3,066 4,868 1,179 2,161 3,340
Oman 2,169 15,391 17,560 3,444 4,617 8,061 2,800 4,345 7,144
Qatar 3,993 23,263 27,255 1,215 3,576 4,791 1,001 3,178 4,179
Saudi Arabia 29,912 89,316 119,228 14,166 6,834 21,000 9,320 3,743 13,064
United Arab Emirats 28,680 116,750 145,429 18,041 5,747 23,788 5,701 4,114 9,815
Maghreb 33,422 69,211 102,633 2,276 3,776 6,051 1,516 1,660 3,176
Algeria 2,478 27,319 29,797 211 909 1,121 177 278 455
Libya 1,548 1,210 2,758 117 741 858 — 830 —
Morocco 16,736 25,274 42,009 562 1,476 2,038 192 391 584
Tunisia 12,661 16,618 29,279 1,385 650 2,035 1,146 161 1,307
(Mauritania)* 977 994 1,971
Mashreq 10,456 31,620 42,076 4,207 6,615 10,822 1,158 1,158 2,317
Iraq 664 215 879 66 22 88 16 — —
Jordan 4,397 10,460 14,857 1,284 2,003 3,286 276 500 776
Lebanon 2,636 9,372 12,008 1,191 1,251 2,442 274 279 553
Occ.Pal.Terr 64 1,917 1,981 40 1,167 1,207 30 44 75
Syrian Arab Republic 2,695 9,870 12,565 1,627 2,172 3,799 562 335 896
Other 26,748 81,524 108,272 6,352 2,923 9,276 162.15 74.59 237
Egypt 14,339 22,953 37,292 4,164 1,210 5,374 135 — 135
Djibouti 175 782 957 148 591 738 — 27 27
Iran, Islamic Republic of 11,814 3,682 15,495 1,841 237 2,078 28 — 28
Yemen 420 6,678 7,098 200 885 1,085 — 47 47
Source: World Trade Integrated Solution.*Mauritania is not part of the aggregates.
32
A N N E x 2 S TAT I S T I C A l TA B l E S
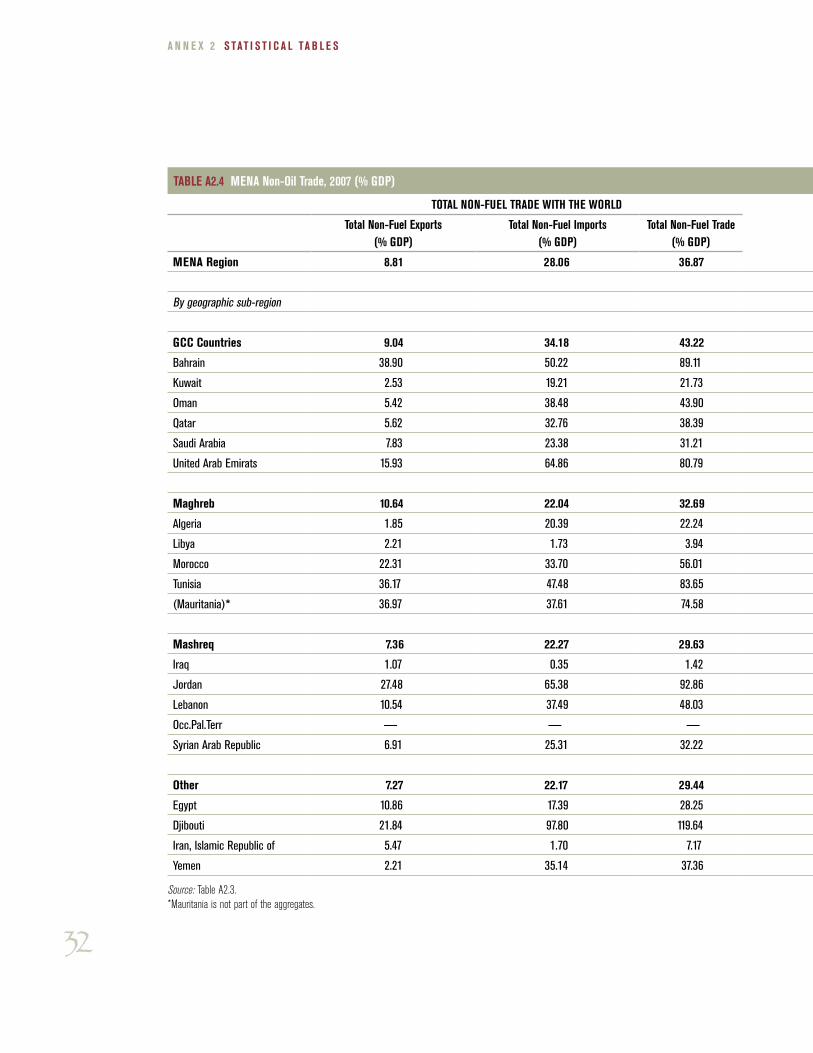
TABlE A2.4 MENA Non-Oil Trade, 2007 (% GDP)
TOTAl NON-FUEl TRADE WITH THE WORlD TOTAl NON-FUEl TRADE WITHIN REGIONS TOTAl TRADE WITHIN SUB-REGIONS
Total Non-Fuel Exports (% GDP)
Total Non-Fuel Imports (% GDP)
Total Non-Fuel Trade (% GDP)
Total Non-Fuel Exports (% GDP)
Total Non-Fuel Imports (% GDP)
Total Non-Fuel Trade (% GDP)
Total Non-Fuel Exports (% GDP)
Total Non-Fuel Imports (% GDP)
Total Non-Fuel Trade (% GDP)
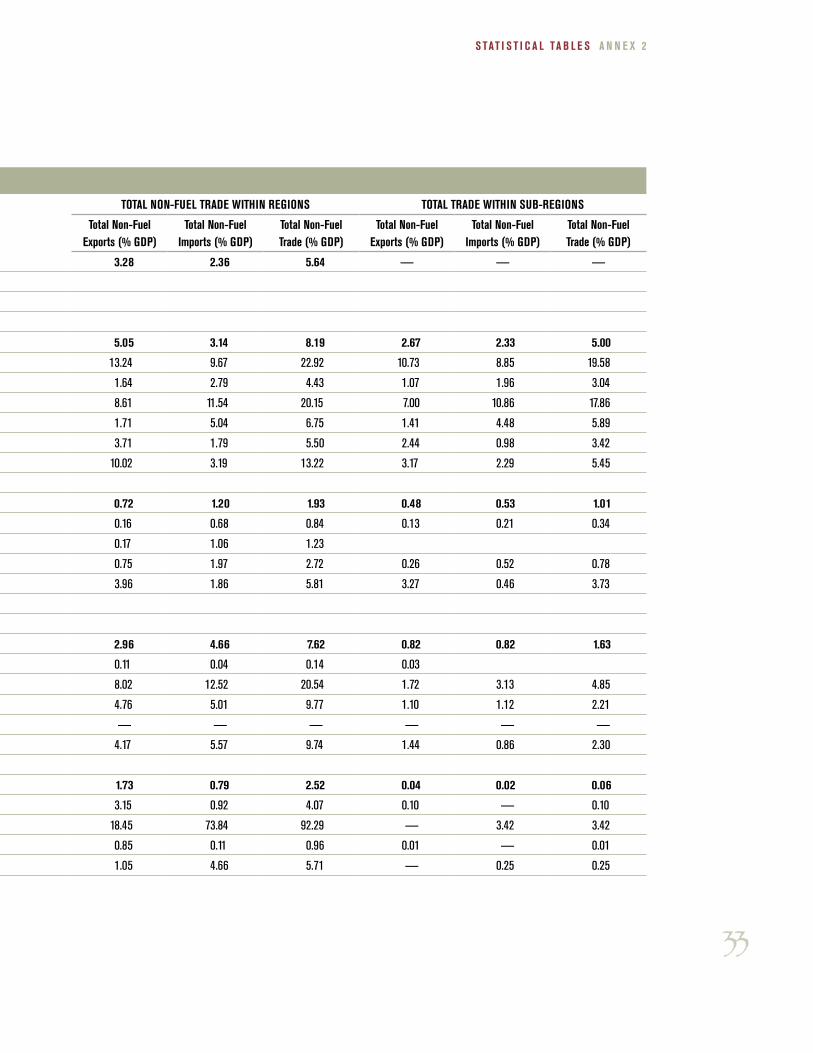
MENA Region 8.81 28.06 36.87 3.28 2.36 5.64 — — —
By geographic sub-region
GCC Countries 9.04 34.18 43.22 5.05 3.14 8.19 2.67 2.33 5.00
Bahrain 38.90 50.22 89.11 13.24 9.67 22.92 10.73 8.85 19.58
Kuwait 2.53 19.21 21.73 1.64 2.79 4.43 1.07 1.96 3.04
Oman 5.42 38.48 43.90 8.61 11.54 20.15 7.00 10.86 17.86
Qatar 5.62 32.76 38.39 1.71 5.04 6.75 1.41 4.48 5.89
Saudi Arabia 7.83 23.38 31.21 3.71 1.79 5.50 2.44 0.98 3.42
United Arab Emirats 15.93 64.86 80.79 10.02 3.19 13.22 3.17 2.29 5.45
Maghreb 10.64 22.04 32.69 0.72 1.20 1.93 0.48 0.53 1.01
Algeria 1.85 20.39 22.24 0.16 0.68 0.84 0.13 0.21 0.34
Libya 2.21 1.73 3.94 0.17 1.06 1.23
Morocco 22.31 33.70 56.01 0.75 1.97 2.72 0.26 0.52 0.78
Tunisia 36.17 47.48 83.65 3.96 1.86 5.81 3.27 0.46 3.73
(Mauritania)* 36.97 37.61 74.58
Mashreq 7.36 22.27 29.63 2.96 4.66 7.62 0.82 0.82 1.63
Iraq 1.07 0.35 1.42 0.11 0.04 0.14 0.03
Jordan 27.48 65.38 92.86 8.02 12.52 20.54 1.72 3.13 4.85
Lebanon 10.54 37.49 48.03 4.76 5.01 9.77 1.10 1.12 2.21
Occ.Pal.Terr — — — — — — — — —
Syrian Arab Republic 6.91 25.31 32.22 4.17 5.57 9.74 1.44 0.86 2.30
Other 7.27 22.17 29.44 1.73 0.79 2.52 0.04 0.02 0.06
Egypt 10.86 17.39 28.25 3.15 0.92 4.07 0.10 — 0.10
Djibouti 21.84 97.80 119.64 18.45 73.84 92.29 — 3.42 3.42
Iran, Islamic Republic of 5.47 1.70 7.17 0.85 0.11 0.96 0.01 — 0.01
Yemen 2.21 35.14 37.36 1.05 4.66 5.71 — 0.25 0.25
Source: Table A2.3.*Mauritania is not part of the aggregates.
33
S TAT I S T I C A l TA B l E S A N N E x 2
TABlE A2.4 MENA Non-Oil Trade, 2007 (% GDP)
TOTAl NON-FUEl TRADE WITH THE WORlD TOTAl NON-FUEl TRADE WITHIN REGIONS TOTAl TRADE WITHIN SUB-REGIONS
Total Non-Fuel Exports (% GDP)
Total Non-Fuel Imports (% GDP)
Total Non-Fuel Trade (% GDP)
Total Non-Fuel Exports (% GDP)
Total Non-Fuel Imports (% GDP)
Total Non-Fuel Trade (% GDP)
Total Non-Fuel Exports (% GDP)
Total Non-Fuel Imports (% GDP)
Total Non-Fuel Trade (% GDP)
MENA Region 8.81 28.06 36.87 3.28 2.36 5.64 — — —
By geographic sub-region
GCC Countries 9.04 34.18 43.22 5.05 3.14 8.19 2.67 2.33 5.00
Bahrain 38.90 50.22 89.11 13.24 9.67 22.92 10.73 8.85 19.58
Kuwait 2.53 19.21 21.73 1.64 2.79 4.43 1.07 1.96 3.04
Oman 5.42 38.48 43.90 8.61 11.54 20.15 7.00 10.86 17.86
Qatar 5.62 32.76 38.39 1.71 5.04 6.75 1.41 4.48 5.89
Saudi Arabia 7.83 23.38 31.21 3.71 1.79 5.50 2.44 0.98 3.42
United Arab Emirats 15.93 64.86 80.79 10.02 3.19 13.22 3.17 2.29 5.45
Maghreb 10.64 22.04 32.69 0.72 1.20 1.93 0.48 0.53 1.01
Algeria 1.85 20.39 22.24 0.16 0.68 0.84 0.13 0.21 0.34
Libya 2.21 1.73 3.94 0.17 1.06 1.23
Morocco 22.31 33.70 56.01 0.75 1.97 2.72 0.26 0.52 0.78
Tunisia 36.17 47.48 83.65 3.96 1.86 5.81 3.27 0.46 3.73
(Mauritania)* 36.97 37.61 74.58
Mashreq 7.36 22.27 29.63 2.96 4.66 7.62 0.82 0.82 1.63
Iraq 1.07 0.35 1.42 0.11 0.04 0.14 0.03
Jordan 27.48 65.38 92.86 8.02 12.52 20.54 1.72 3.13 4.85
Lebanon 10.54 37.49 48.03 4.76 5.01 9.77 1.10 1.12 2.21
Occ.Pal.Terr — — — — — — — — —
Syrian Arab Republic 6.91 25.31 32.22 4.17 5.57 9.74 1.44 0.86 2.30
Other 7.27 22.17 29.44 1.73 0.79 2.52 0.04 0.02 0.06
Egypt 10.86 17.39 28.25 3.15 0.92 4.07 0.10 — 0.10
Djibouti 21.84 97.80 119.64 18.45 73.84 92.29 — 3.42 3.42
Iran, Islamic Republic of 5.47 1.70 7.17 0.85 0.11 0.96 0.01 — 0.01
Yemen 2.21 35.14 37.36 1.05 4.66 5.71 — 0.25 0.25
Source: Table A2.3.*Mauritania is not part of the aggregates.
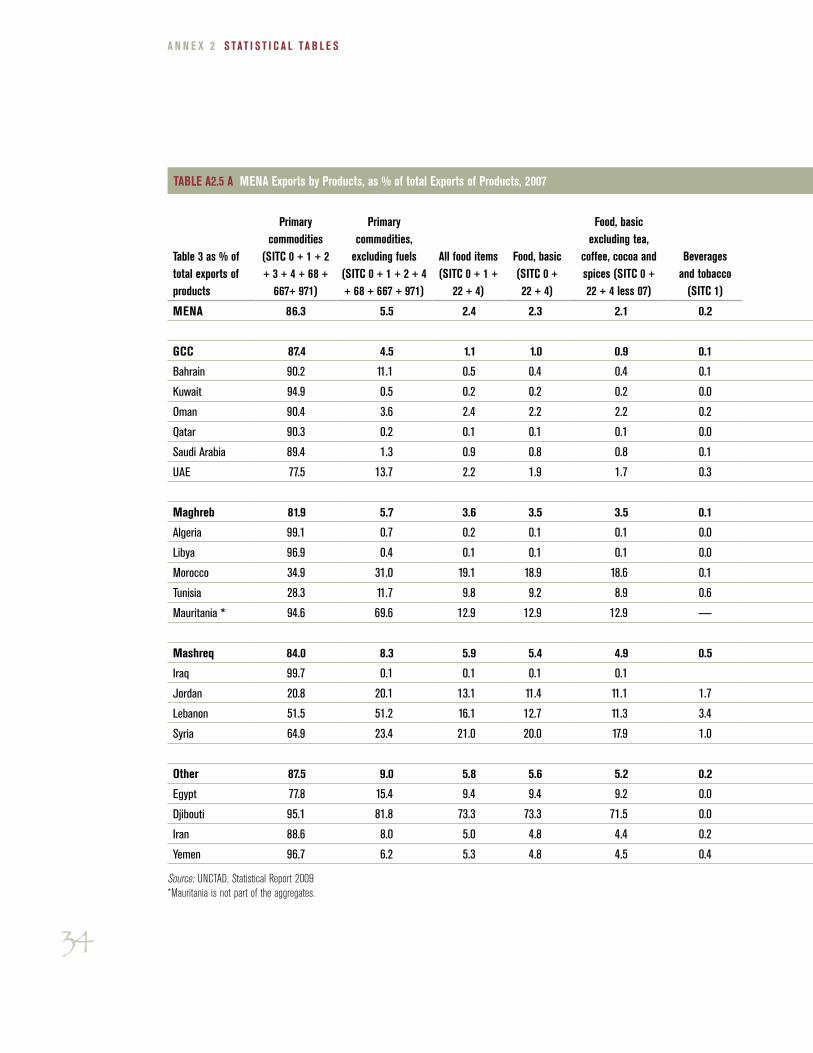
34
A N N E x 2 S TAT I S T I C A l TA B l E S
TABlE A2.5 A MENA Exports by Products, as % of total Exports of Products, 2007
Table 3 as % of total exports of products
Primary commodities
(SITC 0 + 1 + 2 + 3 + 4 + 68 +
667+ 971)
Primary commodities,
excluding fuels (SITC 0 + 1 + 2 + 4 + 68 + 667 + 971)
All food items (SITC 0 + 1 +
22 + 4)
Food, basic (SITC 0 + 22 + 4)
Food, basic excluding tea,
coffee, cocoa and spices (SITC 0 + 22 + 4 less 07)
Beverages and tobacco
(SITC 1)
Agricultural raw materials (SITC
2 less 22, 27 and 28)
Ores, metals, precious stones
and non-monetary gold
(SITC 27 + 28 + 68 + 667 + 971)
Ores and metals (SITC 27 + 28 + 68)
Non-ferrous metals
(SITC 68)
Other ores and metals
(SITC 27 + 28)
Pearls, precious stones and non-monetary gold (SITC 667 +
971) Fuels (SITC 3)
MENA 86.3 5.5 2.4 2.3 2.1 0.2 0.2 2.9 1.6 0.9 0.7 1.3 80.7
GCC 87.4 4.5 1.1 1.0 0.9 0.1 0.1 3.3 1.4 0.9 0.4 1.9 82.8
Bahrain 90.2 11.1 0.5 0.4 0.4 0.1 0.0 10.6 10.6 9.0 1.6 0.0 79.1
Kuwait 94.9 0.5 0.2 0.2 0.2 0.0 0.1 0.2 0.2 0.0 0.2 0.0 94.4
Oman 90.4 3.6 2.4 2.2 2.2 0.2 0.0 1.2 1.2 0.6 0.6 0.0 86.8
Qatar 90.3 0.2 0.1 0.1 0.1 0.0 0.0 0.1 0.1 0.0 0.1 0.0 90.1
Saudi Arabia 89.4 1.3 0.9 0.8 0.8 0.1 0.1 0.4 0.3 0.1 0.2 0.1 88.1
UAE 77.5 13.7 2.2 1.9 1.7 0.3 0.3 11.2 3.4 2.5 0.9 7.8 63.8
Maghreb 81.9 5.7 3.6 3.5 3.5 0.1 0.3 1.8 1.8 0.4 1.4 0.0 76.2
Algeria 99.1 0.7 0.2 0.1 0.1 0.0 0.0 0.5 0.5 0.1 0.4 0.0 98.4
Libya 96.9 0.4 0.1 0.1 0.1 0.0 0.0 0.3 0.2 0.0 0.2 0.1 96.5
Morocco 34.9 31.0 19.1 18.9 18.6 0.1 1.5 10.4 10.3 2.2 8.2 0.1 3.8
Tunisia 28.3 11.7 9.8 9.2 8.9 0.6 0.5 1.4 1.4 0.4 1.0 0.0 16.6
Mauritania * 94.6 69.6 12.9 12.9 12.9 — 0.0 56.7 53.9 — 53.9 2.8 25.0
Mashreq 84.0 8.3 5.9 5.4 4.9 0.5 0.3 2.1 1.4 0.3 1.1 0.7 75.7
Iraq 99.7 0.1 0.1 0.1 0.1 0.0 0.0 0.0 0.0 99.6
Jordan 20.8 20.1 13.1 11.4 11.1 1.7 0.3 6.7 5.9 0.9 5.0 0.8 0.7
Lebanon 51.5 51.2 16.1 12.7 11.3 3.4 1.0 34.1 17.2 3.2 14.0 16.9 0.3
Syria 64.9 23.4 21.0 20.0 17.9 1.0 1.2 1.2 1.2 0.7 0.5 41.5
Other 87.5 9.0 5.8 5.6 5.2 0.2 0.6 2.6 2.5 1.5 1.0 0.1 78.5
Egypt 77.8 15.4 9.4 9.4 9.2 0.0 1.9 4.0 3.3 1.7 1.6 0.7 62.4
Djibouti 95.1 81.8 73.3 73.3 71.5 0.0 2.8 5.7 2.1 0.3 1.8 3.6 13.2
Iran 88.6 8.0 5.0 4.8 4.4 0.2 0.4 2.5 2.5 1.6 0.9 0.0 80.6
Yemen 96.7 6.2 5.3 4.8 4.5 0.4 0.2 0.8 0.3 0.1 0.2 0.5 90.5
Source: UNCTAD, Statistical Report 2009*Mauritania is not part of the aggregates.
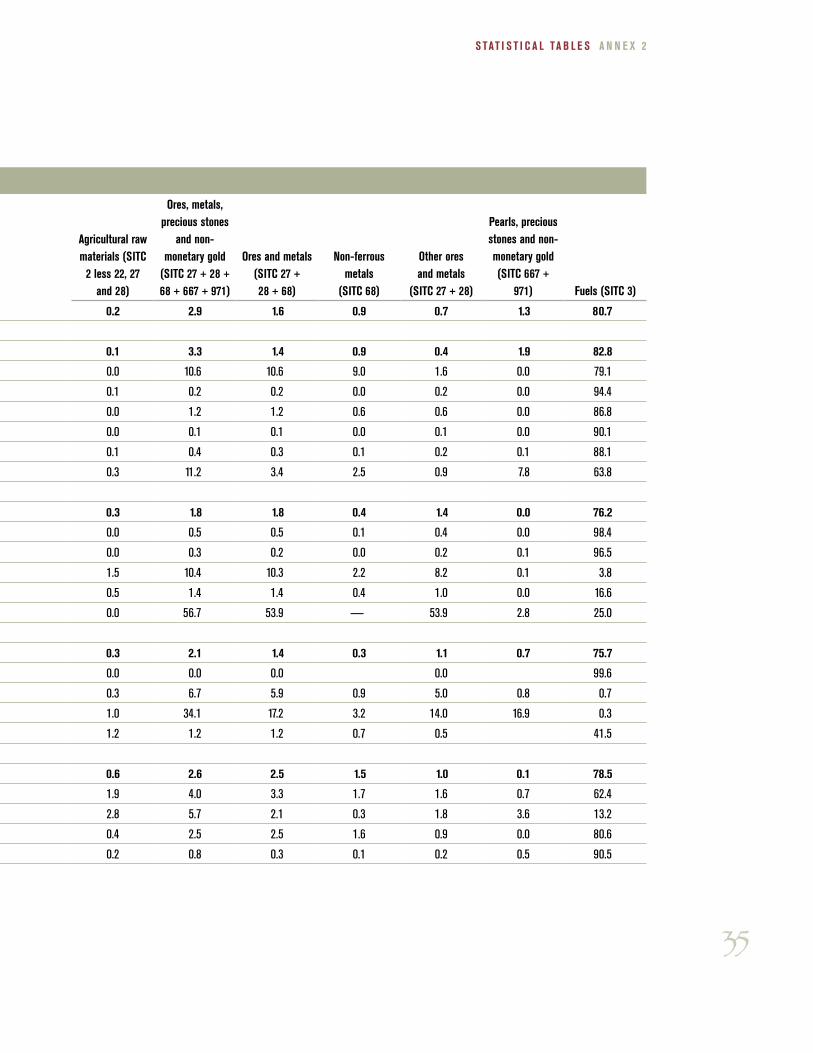
35
S TAT I S T I C A l TA B l E S A N N E x 2
TABlE A2.5 A MENA Exports by Products, as % of total Exports of Products, 2007
Table 3 as % of total exports of products
Primary commodities
(SITC 0 + 1 + 2 + 3 + 4 + 68 +
667+ 971)
Primary commodities,
excluding fuels (SITC 0 + 1 + 2 + 4 + 68 + 667 + 971)
All food items (SITC 0 + 1 +
22 + 4)
Food, basic (SITC 0 + 22 + 4)
Food, basic excluding tea,
coffee, cocoa and spices (SITC 0 + 22 + 4 less 07)
Beverages and tobacco
(SITC 1)
Agricultural raw materials (SITC
2 less 22, 27 and 28)
Ores, metals, precious stones
and non-monetary gold
(SITC 27 + 28 + 68 + 667 + 971)
Ores and metals (SITC 27 + 28 + 68)
Non-ferrous metals
(SITC 68)
Other ores and metals
(SITC 27 + 28)
Pearls, precious stones and non-monetary gold (SITC 667 +
971) Fuels (SITC 3)
MENA 86.3 5.5 2.4 2.3 2.1 0.2 0.2 2.9 1.6 0.9 0.7 1.3 80.7
GCC 87.4 4.5 1.1 1.0 0.9 0.1 0.1 3.3 1.4 0.9 0.4 1.9 82.8
Bahrain 90.2 11.1 0.5 0.4 0.4 0.1 0.0 10.6 10.6 9.0 1.6 0.0 79.1
Kuwait 94.9 0.5 0.2 0.2 0.2 0.0 0.1 0.2 0.2 0.0 0.2 0.0 94.4
Oman 90.4 3.6 2.4 2.2 2.2 0.2 0.0 1.2 1.2 0.6 0.6 0.0 86.8
Qatar 90.3 0.2 0.1 0.1 0.1 0.0 0.0 0.1 0.1 0.0 0.1 0.0 90.1
Saudi Arabia 89.4 1.3 0.9 0.8 0.8 0.1 0.1 0.4 0.3 0.1 0.2 0.1 88.1
UAE 77.5 13.7 2.2 1.9 1.7 0.3 0.3 11.2 3.4 2.5 0.9 7.8 63.8
Maghreb 81.9 5.7 3.6 3.5 3.5 0.1 0.3 1.8 1.8 0.4 1.4 0.0 76.2
Algeria 99.1 0.7 0.2 0.1 0.1 0.0 0.0 0.5 0.5 0.1 0.4 0.0 98.4
Libya 96.9 0.4 0.1 0.1 0.1 0.0 0.0 0.3 0.2 0.0 0.2 0.1 96.5
Morocco 34.9 31.0 19.1 18.9 18.6 0.1 1.5 10.4 10.3 2.2 8.2 0.1 3.8
Tunisia 28.3 11.7 9.8 9.2 8.9 0.6 0.5 1.4 1.4 0.4 1.0 0.0 16.6
Mauritania * 94.6 69.6 12.9 12.9 12.9 — 0.0 56.7 53.9 — 53.9 2.8 25.0
Mashreq 84.0 8.3 5.9 5.4 4.9 0.5 0.3 2.1 1.4 0.3 1.1 0.7 75.7
Iraq 99.7 0.1 0.1 0.1 0.1 0.0 0.0 0.0 0.0 99.6
Jordan 20.8 20.1 13.1 11.4 11.1 1.7 0.3 6.7 5.9 0.9 5.0 0.8 0.7
Lebanon 51.5 51.2 16.1 12.7 11.3 3.4 1.0 34.1 17.2 3.2 14.0 16.9 0.3
Syria 64.9 23.4 21.0 20.0 17.9 1.0 1.2 1.2 1.2 0.7 0.5 41.5
Other 87.5 9.0 5.8 5.6 5.2 0.2 0.6 2.6 2.5 1.5 1.0 0.1 78.5
Egypt 77.8 15.4 9.4 9.4 9.2 0.0 1.9 4.0 3.3 1.7 1.6 0.7 62.4
Djibouti 95.1 81.8 73.3 73.3 71.5 0.0 2.8 5.7 2.1 0.3 1.8 3.6 13.2
Iran 88.6 8.0 5.0 4.8 4.4 0.2 0.4 2.5 2.5 1.6 0.9 0.0 80.6
Yemen 96.7 6.2 5.3 4.8 4.5 0.4 0.2 0.8 0.3 0.1 0.2 0.5 90.5
Source: UNCTAD, Statistical Report 2009*Mauritania is not part of the aggregates.
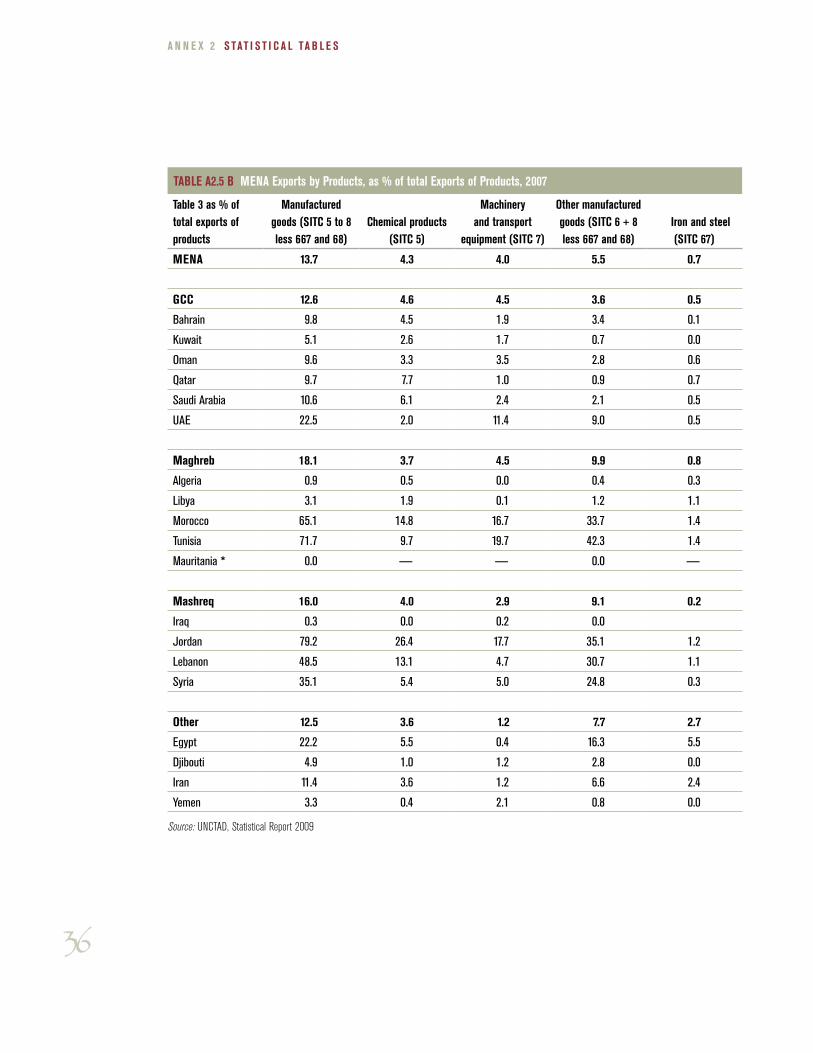
36
A N N E x 2 S TAT I S T I C A l TA B l E S
TABlE A2.5 B MENA Exports by Products, as % of total Exports of Products, 2007
Table 3 as % of total exports of products
Manufactured goods (SITC 5 to 8 less 667 and 68)
Chemical products (SITC 5)
Machinery and transport
equipment (SITC 7)
Other manufactured goods (SITC 6 + 8 less 667 and 68)
Iron and steel (SITC 67)
MENA 13.7 4.3 4.0 5.5 0.7
GCC 12.6 4.6 4.5 3.6 0.5
Bahrain 9.8 4.5 1.9 3.4 0.1
Kuwait 5.1 2.6 1.7 0.7 0.0
Oman 9.6 3.3 3.5 2.8 0.6
Qatar 9.7 7.7 1.0 0.9 0.7
Saudi Arabia 10.6 6.1 2.4 2.1 0.5
UAE 22.5 2.0 11.4 9.0 0.5
Maghreb 18.1 3.7 4.5 9.9 0.8
Algeria 0.9 0.5 0.0 0.4 0.3
Libya 3.1 1.9 0.1 1.2 1.1
Morocco 65.1 14.8 16.7 33.7 1.4
Tunisia 71.7 9.7 19.7 42.3 1.4
Mauritania * 0.0 — — 0.0 —
Mashreq 16.0 4.0 2.9 9.1 0.2
Iraq 0.3 0.0 0.2 0.0
Jordan 79.2 26.4 17.7 35.1 1.2
Lebanon 48.5 13.1 4.7 30.7 1.1
Syria 35.1 5.4 5.0 24.8 0.3
Other 12.5 3.6 1.2 7.7 2.7
Egypt 22.2 5.5 0.4 16.3 5.5
Djibouti 4.9 1.0 1.2 2.8 0.0
Iran 11.4 3.6 1.2 6.6 2.4
Yemen 3.3 0.4 2.1 0.8 0.0
Source: UNCTAD, Statistical Report 2009
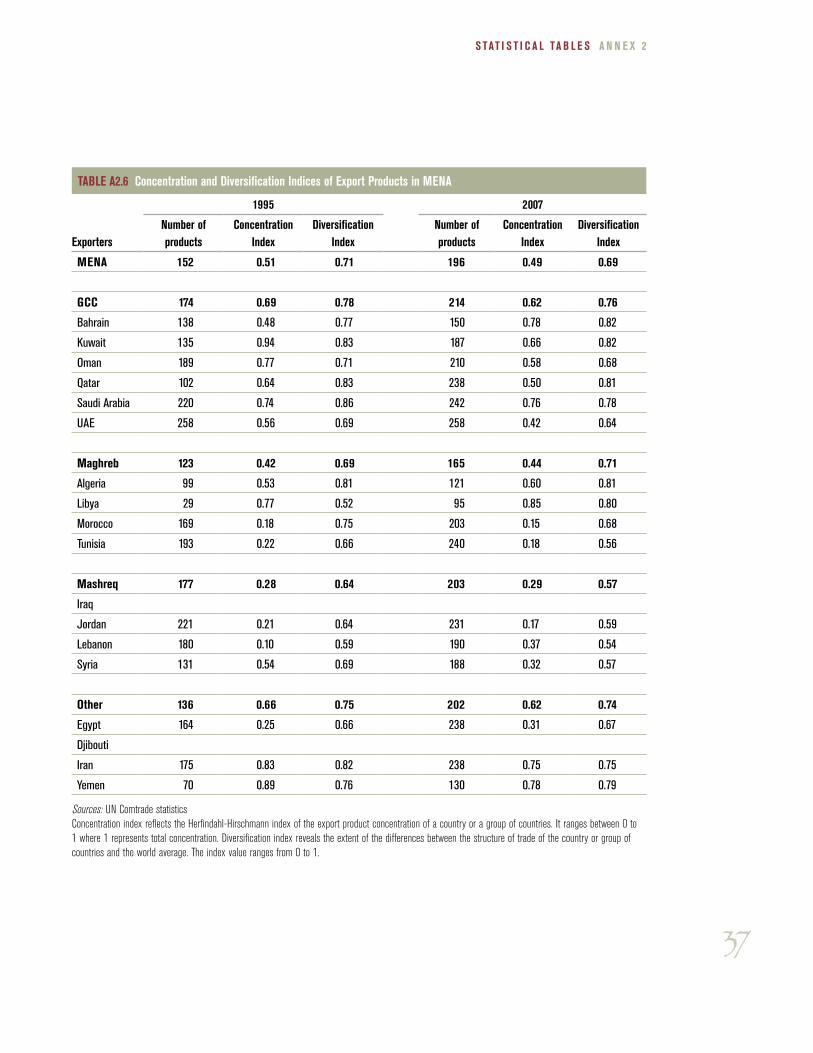
37
S TAT I S T I C A l TA B l E S A N N E x 2
TABlE A2.6 Concentration and Diversification Indices of Export Products in MENA
1995 2007
ExportersNumber of products
Concentration Index
Diversification Index
Number of products
Concentration Index
Diversification Index
MENA 152 0.51 0.71 196 0.49 0.69
GCC 174 0.69 0.78 214 0.62 0.76
Bahrain 138 0.48 0.77 150 0.78 0.82
Kuwait 135 0.94 0.83 187 0.66 0.82
Oman 189 0.77 0.71 210 0.58 0.68
Qatar 102 0.64 0.83 238 0.50 0.81
Saudi Arabia 220 0.74 0.86 242 0.76 0.78
UAE 258 0.56 0.69 258 0.42 0.64
Maghreb 123 0.42 0.69 165 0.44 0.71
Algeria 99 0.53 0.81 121 0.60 0.81
Libya 29 0.77 0.52 95 0.85 0.80
Morocco 169 0.18 0.75 203 0.15 0.68
Tunisia 193 0.22 0.66 240 0.18 0.56
Mashreq 177 0.28 0.64 203 0.29 0.57
Iraq
Jordan 221 0.21 0.64 231 0.17 0.59
Lebanon 180 0.10 0.59 190 0.37 0.54
Syria 131 0.54 0.69 188 0.32 0.57
Other 136 0.66 0.75 202 0.62 0.74
Egypt 164 0.25 0.66 238 0.31 0.67
Djibouti
Iran 175 0.83 0.82 238 0.75 0.75
Yemen 70 0.89 0.76 130 0.78 0.79
Sources: UN Comtrade statisticsConcentration index reflects the Herfindahl-Hirschmann index of the export product concentration of a country or a group of countries. It ranges between 0 to 1 where 1 represents total concentration. Diversification index reveals the extent of the differences between the structure of trade of the country or group of countries and the world average. The index value ranges from 0 to 1.
WORLD BANK MIDDLE EAST AND NORTH AFRICA REGION
INTEGRATION IN THE MAGHREB
WORLD BANK MIDDLE EAST AND NORTH AFRICA REGION
Economic Integration in the Maghreb
ECONOMIC