Embed Size (px)
Citation preview

United States Department of Agriculture Foreign
Agricultural Service Circular Series W April 2009
AP 04-09
World Agricultural Production
India Rapeseed Yield Series
0
0.2
0.4
0.6
0.8
1
1.2
Tons
per
Ha
Yield 0.91 0.74 0.86 0.94 1.01 0.91 0.95 0.87 0.96 1.06
1999/00 2000/01 2001/02 2002/03 2003/04 2004/05 2005/06 2006/07 2007/08 2008/09
India’s Rapeseed Production Boosted The USDA forecasts India's 2008/09 rapeseed production at 7.0 million tons, up 0.42 million or 6 percent from last month, and up 1.55 million or 28 percent from last year. The area harvested is forecast at 6.6 million hectares, down 0.4 million from last month or 6 percent, but up 0.9 million or 16 percent from last year. A record yield is forecast at 1.06 tones per hectare, up 0.1 from last year or 11 percent. The latest government of India data indicates that rabi or winter season rapeseed planting is up from last year. The government’s sowing progress report of March 13, 2009 shows the area planted estimated at 6.6 million hectares, compared to 5.98 million for the same time last season. USDA-FAS analyst’s in-country field observations and discussions conducted in March, 2009 indicated that approximately 80 percent of the crop has been harvested. The estimated record yield and increase in rapeseed area from last season is due to favorable weather conditions throughout the growing season. In addition, farmers continue to respond to the strong Minimum Support Price (MSP) policy. Large harvests are expected in key
Approved by the World Agricultural Outlook Board

2
production regions of Rajasthan, Utter Pradesh, and Haryana. (For more information, contact, Dath Mita at 202-720-7339.)
Argentine Soybeans Suffer through Season The USDA forecasts Argentine soybean production for 2008/09 at 39.0 million tons, down 4 million tons, a 9 percent reduction from last month’s 43.0 million tons. Area is estimated at 16.5 million hectares, a 4 percent decrease over last month’s 17.2 million hectares. Yield is forecast at 2.36 tons per hectare, lower than last month’s 2.50, compared to the record high 2.99 in 2006/07 and the 5-year average of 2.70. The earlier hot and dry weather pattern continues decreasing pod number and limiting bean count and size within each pod. Scattered rains have not provided enough moisture to parched fields in order to salvage better-than-normal production. The diverse planting dates for soybeans have aided insect movement as pests continued to find harbor in more immature fields. The erratic rains, once thought to have helped second crop soybeans and some late-planted first crop beans, have not necessarily benefited plants into harvest. In some cases, indeterminate soybean plants have initiated flowering again, leaving plants with a wider mix of seed maturity in fields. In other cases, plants have increased late season-leaf canopy thus compromising seed-fill and yield. During April temperatures dipped to 7oC for two nights within the province of Buenos Aires. This has elicted concern that some second crop soybeans as well as late-flowering first-crop beans may not make full maturity. Harvesting soy at low seed moisture is critical in Argentina as facilities are not available to dry down soybeans. Some seed lots have already come in with a portion of the harvest as immature green beans, lessening crop quality. By April 2, 2009, 25 percent of the crop had been harvested as compared to only 11 percent last year. With over 30 percent of the crop now out of the field, the hope is that more fields are not turned over to grazing or lost to frost, further lessen tonnage this year. (For more information, contact Denise McWilliams 202-720-0107.) Argentine Grain Sorghum Limited in Yield The USDA forecasts Argentine grain sorghum production for 2008/09 at 2.3 million tons, down 0.7 million tons, a 23 percent reduction from last month’s 3.0 million tons. Area is estimated at 0.70 million hectares, the same as last month. Yield is forecast at 3.29 tons per hectare, down from 4.29 tons per hectare last month, compared to the record high 5.09 tons per hectare in 2002/03 and the 5-year average of 4.66 tons per hectare. Even a heat-tolerant crop such as grain sorghum was not immune from the hot, dry conditions in Argentina this year. Much of the crop was planted later than normal. Panicle size varies greatly this season because of the variable heat, drought and available soil moisture reserves throughout the season. In drier areas, irregular grain filling is most noticeable, as well as quickening crop progress toward maturity. In some of these poor crop regions, fields are not being treated for aphids and sorghum midge. Many fields show inconsistency in yields, particularly in the provinces of Santa Fe, Entre Rios and Buenos Aires. Grain sorghum in the province of Buenos Aires is showing irregular plant
Foreign Agricultural Service/USDAOffice of Global Analysis
April 2009

3
development with physiological stages varying from flowering in the South to mature in the North. Sorghum within the province of Cordoba has some fields in good condition and others that show lack of moisture from the soil profile for final grain-fill. Fields are better near Venado Tuerto, but only with average yields. Within Entre Rios, seed development is mixed. Some fields are being converted from grain collection to forage. In this province, yields vary depending on amount of moisture received within the area. Crops within Santa Fe are generally poor, with some already directly grazed or harvested for forage use later. Within the department of San Jeronimo, near the town of Lopez, 60 percent of the crop is lost. Much of this crop was cut for forage in La Pampa. Crop condition is also very poor in Chaco. Temperatures for several consecutive days during the season were so high in one region of Chaco that some fields are showing leaf burn from sun scorch. (For more information, contact Denise McWilliams 202-720-0107.)
Foreign Agricultural Service/USDAOffice of Global Analysis
April 2009

4
This report uses information from the Foreign Agricultural Service’s (FAS) global network of agricultural attachés and counselors, official statistics of foreign governments and other foreign source materials, and the analysis of economic data and satellite imagery. Estimates of foreign area, yield, and production are from the International Production Assessment Division, FAS, and are reviewed by USDA’s Inter-Agency Commodity Estimates Committee. Estimates of U.S. area, yield, and production are from USDA’s National Agricultural Statistics Service. Numbers within the report may not add to totals because of rounding. This report reflects official USDA estimates released in the World Agricultural Supply and Demand Estimates (WASDE-467) April 11, 2009. Printed copies are available from the National Technical Information Service. Download an order form at http://www.ntis.gov/products/specialty/usda/fas_a-g.asp, or call NTIS at 1-800-363-2068. The FAS International Production Assessment Branch prepared this report. The next issue of World Agricultural Production will be released after 9:30 a.m. Eastern Time, May 9, 2009.
Conversion Table
Metric tons to bushels
Wheat, soybeans = MT * 36.7437 Corn, sorghum, rye = MT * 39.36825 Barley = MT * 45.929625 Oats = MT * 68.894438
Metric tons to 480-lb bales
Cotton = MT * 4.592917
Metric tons to hundredweight
Rice = MT * 22.04622
Area & weight
1 hectare = 2.471044 acres 1 kilogram = 2.204622 pounds
Foreign Agricultural Service/USDAOffice of Global Analysis
April 2009

For further information, contact: U.S. Department of Agriculture
Foreign Agricultural Service Office of Global Analysis
International Production Assessment Division Ag Box 1051, Room 4630, South Building
Washington, DC 20250-1051 Telephone: (202) 720-1156 Fax: (202) 720-1158
GENERAL INFORMATIONDivision Director Brad Doorn 202-690-0131 [email protected] Deputy Director Tom St. Clair 202-720-2974 [email protected] Remote Sensing Specialist Brad Doorn 202-690-0131 [email protected] USDA Remote Sensing Advisor Glenn Bethel 202-720-1280 [email protected] Program Analyst Mary Jackson 202-720-0886 [email protected] Agricultural Economist Paul Provance 202-720-0873 [email protected] COUNTRY- AND REGION-SPECIFIC INFORMATION South America Denise McWilliams 202-720-0107 [email protected] Europe and North Africa Bryan Purcell 202-690-0138 [email protected] FSU-12, Argentina Mark Lindeman 202-690-0143 [email protected] Canada, Mexico, Central America, Arnella Trent 202-720-0881 [email protected] Caribbean China, East Asia Paulette Sandene 202-690-0133 [email protected] South America South Asia, Indonesia, Dath Mita 202-720-7339 [email protected] Australia & New Zealand Sub-Saharan Africa, Brazil Curt Reynolds 202-690-0134 [email protected] Middle East and South East Asia Michael Shean 202-720-7366 [email protected] Eastern United States vacant Western United States Jim Crutchfield 202-690-0135 [email protected]
5Foreign Agricultural Service/USDAOffice of Global Analysis
April 2009

Million Metric Tons
Table 01 World Crop Production Summary
World
-
Total
Foreign
North
America
North
America
North
America
EU-27
-
Former
Soviet
Former
Soviet
Asia
(WAP)
Asia
(WAP)
Asia
(WAP)
Asia
(WAP)
Asia
(WAP)
South
America
South
America
Selected
Other
Selected
Other
Selected
Other
All
Others
none
-
none
-
United
States
Mexico
-
Canada
-
none
-
Russia
-
Ukraine
-
China
-
India
-
Indo-
nesia
Paki-
stan
Thai-
land
Argen-
tina
Brazil
-
South
Africa
Turkey
-
none
-
Aus-
tralia
Commodity
---Million metric tons---
Wheat
2006/07 86.417.52.110.82.216.0nr21.3nr69.4108.514.044.9124.93.225.349.2546.4595.6
2007/08 prel. 86.615.51.913.83.816.8nr23.3nr75.8109.313.949.4119.43.620.155.8553.2609.1
2008/09 proj.
Mar 76.316.82.021.55.88.4nr21.5nr78.6113.025.963.7150.34.028.668.0616.4684.4
Apr 73.816.82.021.56.08.4nr21.5nr78.6113.025.963.7150.34.028.668.0614.0682.1
Coarse Grains
2006/07 153.110.97.86.653.227.03.93.66.733.8159.119.230.2137.429.123.1280.0704.8984.8
2007/08 prel. 149.89.513.711.561.327.03.93.67.540.6159.114.629.3136.530.827.8349.9726.61,076.4
2008/09 proj.
Mar 156.610.412.511.152.218.74.23.67.837.5173.126.240.7160.132.227.2326.1774.01,100.1
Apr 154.010.312.511.153.218.04.33.67.837.5172.826.240.7160.132.327.2326.1771.51,097.6
Rice, Milled
2006/07 123.30.4nr0.27.70.718.35.535.393.4127.20.10.41.70.2nr6.3414.2420.4
2007/08 prel. 126.10.4nr0.08.20.819.35.735.896.7130.20.10.51.70.2nr6.3425.6431.9
2008/09 proj.
Mar 126.50.4nr0.18.30.819.46.336.398.9135.10.10.51.60.2nr6.5434.4441.0
Apr 126.50.4nr0.18.50.819.46.336.398.9135.10.10.51.60.2nr6.5434.6441.1
Total Grains
2006/07 362.828.89.917.663.143.722.130.342.0196.5394.833.275.5264.032.648.4335.51,665.32,000.8
2007/08 prel. 362.425.315.625.473.444.623.232.643.3213.1398.628.679.2257.634.647.9412.01,705.42,117.4
2008/09 proj.
Mar 359.527.614.532.666.327.923.631.444.0215.0421.252.2104.9312.036.455.8400.61,824.82,225.5
Apr 354.227.514.532.667.727.223.731.444.0215.0420.952.2104.9312.036.555.8400.61,820.12,220.7
Oilseeds
2006/07 37.12.30.61.162.053.20.65.37.929.955.26.88.124.30.612.696.8307.6404.4
2007/08 prel. 37.71.81.31.464.151.70.64.78.233.953.46.06.924.40.612.482.5309.1391.5
2008/09 proj.
Mar 36.21.91.42.259.546.40.65.09.035.558.310.28.827.00.716.089.1318.6407.7
Apr 36.01.71.42.259.542.40.65.09.035.658.310.28.827.00.716.089.1314.4403.5
Cotton
2006/07 17.93.80.11.47.00.80.09.90.021.835.5nrnr1.60.7nr21.6100.4122.0
2007/08 prel. 16.93.10.00.67.40.70.08.90.024.637.0nrnr1.50.6nr19.2101.4120.6
2008/09 proj.
Mar 15.82.30.01.45.80.70.09.00.023.035.8nrnr1.20.6nr13.095.6108.6
Apr 15.72.30.01.45.80.70.09.00.023.035.8nrnr1.20.6nr12.895.5108.3
1/ Includes wheat, coarse grains, and rice (milled) shown above.
Foreign Agricultural Service/USDAOffice of Global Analysis
April 2009

Table 02 Wheat Area, Yield, and Production
From last month From last year
MMTPercent
Yield
(Metric tons per hectare)
Apr 2006/07 MMT
Country / Region
Area
(Million hectares)
Production
(Million metric tons)
Change in Production
2006/07
Prel.
2007/08 Mar Mar
Prel.
2007/08 Apr
Prel.
2007/08 Mar Apr Percent
2008/09 Proj.2008/09 Proj. 2008/09 Proj.
2006/07
212.25World 11.9872.99-0.35-2.38682.05217.79 224.43 224.68 2.81 2.80 3.05 3.04 595.62 609.06 684.43
18.94United States 21.8612.210.000.0068.0320.64 22.54 22.54 2.60 2.70 3.02 3.02 49.22 55.82 68.03
193.31Total Foreign 10.9960.79-0.39-2.38614.03197.15 201.89 202.15 2.83 2.81 3.05 3.04 546.40 553.24 616.40
none
23.61China, Peoples Republic of 3.393.700.000.00113.0023.72 24.00 24.00 4.59 4.61 4.71 4.71 108.47 109.30 113.00
South Asia
26.40 India 3.682.790.000.0078.6028.00 28.15 28.15 2.63 2.71 2.79 2.79 69.35 75.81 78.60
8.36 Pakistan -7.73-1.800.000.0021.508.40 8.20 8.20 2.55 2.77 2.62 2.62 21.28 23.30 21.50
2.19 Afghanistan -55.22-1.850.000.001.502.20 1.60 1.60 1.42 1.52 0.94 0.94 3.10 3.35 1.50
Former Soviet Union - 12
23.70 Russian Federation 28.9514.300.000.0063.7024.50 26.70 26.70 1.89 2.02 2.39 2.39 44.90 49.40 63.70
5.50 Ukraine 86.3312.000.000.0025.905.95 7.05 7.05 2.55 2.34 3.67 3.67 14.00 13.90 25.90
12.40 Kazakhstan, Republic of -24.70-4.100.000.0012.5012.75 12.90 12.90 1.09 1.30 0.97 0.97 13.50 16.60 12.50
1.30 Uzbekistan, Republic of -3.23-0.200.000.006.001.30 1.36 1.36 4.50 4.77 4.41 4.41 5.85 6.20 6.00
EU-27
5.24 France 19.016.230.000.0039.005.24 5.50 5.50 6.75 6.26 7.09 7.09 35.39 32.77 39.00
3.12 Germany 24.835.170.000.0026.002.99 3.17 3.17 7.20 6.96 8.20 8.20 22.43 20.83 26.00
1.83 United Kingdom 30.324.010.000.0017.231.83 2.08 2.08 8.04 7.22 8.30 8.30 14.74 13.22 17.23
2.18 Poland 7.800.650.000.008.972.11 2.28 2.28 3.24 3.94 3.94 3.94 7.06 8.32 8.97
1.96 Spain 5.320.340.000.006.691.83 2.00 2.00 2.85 3.47 3.35 3.35 5.58 6.35 6.69
1.77 Italy 35.722.550.000.009.702.03 2.47 2.47 3.72 3.52 3.93 3.93 6.59 7.15 9.70
0.68 Denmark 9.130.410.000.004.900.68 0.64 0.64 7.04 6.63 7.69 7.69 4.77 4.49 4.90
1.08 Hungary 41.681.660.000.005.651.11 1.13 1.13 4.06 3.59 5.02 5.02 4.38 3.99 5.65
1.80 Romania 150.004.500.000.007.501.85 2.11 2.11 2.64 1.62 3.55 3.55 4.75 3.00 7.50
0.92 Bulgaria 79.841.910.000.004.301.04 1.10 1.10 3.45 2.30 3.91 3.91 3.18 2.39 4.30
9.68Canada 42.668.560.000.0028.618.64 10.03 10.03 2.61 2.32 2.85 2.85 25.27 20.05 28.61
11.80Australia 55.377.660.000.0021.5012.70 13.50 13.50 0.92 1.09 1.59 1.59 10.82 13.84 21.50
Middle East
8.60 Turkey 8.391.300.000.0016.808.60 8.60 8.60 2.03 1.80 1.95 1.95 17.50 15.50 16.80
6.50 Iran -33.33-5.000.000.0010.006.90 5.85 5.85 2.23 2.17 1.71 1.71 14.50 15.00 10.00
1.70 Syria -48.35-1.954.350.092.091.67 0.80 1.49 2.47 2.42 2.50 1.40 4.20 4.04 2.00
North Africa
1.29 Egypt -4.74-0.39-5.02-0.427.881.29 1.29 1.23 6.43 6.43 6.43 6.43 8.27 8.28 8.30
3.11 Morocco 135.632.150.000.003.732.57 2.86 2.86 2.04 0.62 1.31 1.31 6.33 1.58 3.73
5.29Argentina -50.00-8.400.000.008.405.76 4.20 4.20 3.03 2.92 2.00 2.00 16.00 16.80 8.40
21.32Others 7.954.59-3.17-2.0562.3821.49 22.34 21.98 2.54 2.69 2.88 2.84 54.22 57.79 64.43
World and Selected Countries and Regions 4/9/2009 9:17:38 AM
Foreign Agricultural Service/USDAOffice of Global Analysis
April 2009

Table 03 Total Coarse Grain Area, Yield, and Production
From last month From last year
MMTPercent
Yield
(Metric tons per hectare)
Apr 2006/07 MMT
Country / Region
Area
(Million hectares)
Production
(Million metric tons)
Change in Production
2006/07
Prel.
2007/08 Mar Mar
Prel.
2007/08 Apr
Prel.
2007/08 Mar Apr Percent
2008/09 Proj.2008/09 Proj. 2008/09 Proj.
2006/07
304.76World 1.9621.12-0.23-2.541,097.55317.98 313.78 312.40 3.23 3.39 3.51 3.51 984.76 1,076.44 1,100.09
32.52United States -6.79-23.770.000.00326.0939.89 36.97 36.97 8.61 8.77 8.82 8.82 280.00 349.86 326.09
272.24Total Foreign 6.1844.89-0.33-2.54771.47278.09 276.81 275.43 2.59 2.61 2.80 2.80 704.76 726.58 774.01
none
31.41China, Peoples Republic of 8.6113.70-0.17-0.30172.8032.15 32.26 32.14 5.07 4.95 5.37 5.38 159.10 159.11 173.10
South America
15.15 Brazil -13.25-8.131.921.0053.2116.00 15.48 15.48 3.51 3.83 3.37 3.44 53.18 61.34 52.21
4.07 Argentina -33.32-8.98-3.75-0.7017.974.85 3.75 3.75 6.65 5.56 4.99 4.80 27.04 26.95 18.67
EU-27
3.75 France 16.294.340.000.0030.953.83 4.14 4.14 6.97 6.94 7.48 7.48 26.13 26.61 30.95
3.59 Germany 21.104.180.000.0023.983.58 3.86 3.86 5.87 5.53 6.21 6.21 21.05 19.80 23.98
6.13 Poland -3.82-0.720.000.0018.086.17 6.22 6.22 2.39 3.05 2.91 2.91 14.66 18.79 18.08
4.24 Spain -2.24-0.380.000.0016.474.27 4.55 4.55 3.07 3.95 3.62 3.62 13.00 16.85 16.47
1.60 Italy 5.340.600.000.0011.891.55 1.57 1.57 7.09 7.30 7.56 7.56 11.32 11.29 11.89
1.75 Hungary 99.265.600.000.0011.241.63 1.77 1.77 5.66 3.46 6.35 6.35 9.87 5.64 11.24
1.02 United Kingdom 18.841.110.000.007.011.05 1.19 1.19 5.93 5.64 5.88 5.88 6.07 5.90 7.01
3.11 Romania 93.364.430.000.009.173.15 3.14 3.14 3.10 1.50 2.92 2.92 9.64 4.74 9.17
Former Soviet Union - 12
17.10 Russian Federation 38.7911.380.000.0040.7017.40 17.75 17.75 1.77 1.69 2.29 2.29 30.20 29.33 40.70
7.82 Ukraine 79.7711.640.000.0026.226.79 7.59 7.59 2.45 2.15 3.45 3.45 19.18 14.59 26.22
2.17 Kazakhstan, Republic of -23.22-0.700.000.002.322.18 2.18 2.18 1.12 1.38 1.06 1.06 2.42 3.02 2.32
Africa
17.95 Nigeria 10.832.600.000.0026.6017.25 17.95 17.95 1.45 1.39 1.48 1.48 26.00 24.00 26.60
3.78 South Africa, Republic of -8.67-1.190.000.0012.514.18 3.88 3.88 2.05 3.27 3.23 3.23 7.76 13.70 12.51
4.55 Ethiopia 11.250.93-16.79-1.869.244.68 5.98 4.88 1.74 1.77 1.86 1.89 7.93 8.30 11.10
0.93 Egypt 0.590.040.580.047.280.93 0.94 0.94 7.78 7.78 7.74 7.74 7.21 7.23 7.24
27.31India -7.78-3.160.000.0037.4727.76 27.55 27.55 1.24 1.46 1.36 1.36 33.81 40.63 37.47
Southeast Asia
3.30 Indonesia 3.330.250.000.007.753.56 3.70 3.70 2.03 2.11 2.09 2.09 6.70 7.50 7.75
2.61 Philippines -5.18-0.380.820.066.902.74 2.66 2.75 2.39 2.66 2.57 2.51 6.23 7.28 6.84
1.03 Thailand 9.040.352.160.094.261.03 1.06 1.06 3.73 3.78 3.95 4.04 3.85 3.91 4.17
9.38Mexico 4.871.500.310.1032.289.52 9.61 9.64 3.11 3.23 3.35 3.35 29.14 30.78 32.18
6.12Canada -2.27-0.630.000.0027.197.40 6.33 6.33 3.78 3.76 4.30 4.30 23.15 27.82 27.19
5.92Australia -4.26-0.490.000.0011.067.00 6.44 6.44 1.11 1.65 1.72 1.72 6.58 11.55 11.06
4.36Turkey 8.810.84-0.77-0.0810.324.38 4.33 4.25 2.50 2.16 2.40 2.43 10.90 9.48 10.40
82.14Others 4.736.17-0.64-0.88136.6183.07 80.95 80.74 1.61 1.57 1.70 1.69 132.65 130.44 137.49
World and Selected Countries and Regions 4/9/2009 9:17:48 AM
Foreign Agricultural Service/USDAOffice of Global Analysis
April 2009

Table 04 Corn Area, Yield, and Production
From last month From last year
MMTPercent
Yield
(Metric tons per hectare)
Apr 2006/07 MMT
Country / Region
Area
(Million hectares)
Production
(Million metric tons)
Change in Production
2006/07
Prel.
2007/08 Mar Mar
Prel.
2007/08 Apr
Prel.
2007/08 Mar Apr Percent
2008/09 Proj.2008/09 Proj. 2008/09 Proj.
2006/07
149.35World -0.56-4.46-0.08-0.65786.45160.17 157.38 156.98 4.76 4.94 5.00 5.01 711.05 790.91 787.10
28.59United States -7.18-23.790.000.00307.3935.01 31.83 31.83 9.36 9.46 9.66 9.66 267.50 331.18 307.39
120.77Total Foreign 4.2019.33-0.14-0.65479.07125.16 125.55 125.15 3.67 3.67 3.82 3.83 443.55 459.74 479.72
none
28.46China, Peoples Republic of 8.6713.200.000.00165.5029.48 29.40 29.40 5.33 5.17 5.63 5.63 151.60 152.30 165.50
South America
14.00 Brazil -13.82-8.102.021.0050.5014.70 14.20 14.20 3.64 3.99 3.49 3.56 51.00 58.60 49.50
2.80 Argentina -38.64-8.500.000.0013.503.41 2.25 2.25 8.04 6.45 6.00 6.00 22.50 22.00 13.50
7.38Mexico 5.931.400.000.0025.007.33 7.45 7.45 3.03 3.22 3.36 3.36 22.35 23.60 25.00
EU-27
1.47 France 8.761.270.000.0015.801.53 1.75 1.75 8.70 9.49 9.03 9.03 12.78 14.53 15.80
1.06 Italy 6.320.600.000.0010.101.01 1.06 1.06 8.87 9.41 9.53 9.53 9.40 9.50 10.10
1.22 Hungary 122.334.930.000.008.961.08 1.20 1.20 6.64 3.73 7.47 7.47 8.10 4.03 8.96
2.56 Romania 90.993.570.000.007.502.55 2.50 2.50 3.32 1.54 3.00 3.00 8.50 3.93 7.50
0.31 Poland 6.620.110.000.001.840.26 0.32 0.32 4.08 6.57 5.68 5.68 1.26 1.72 1.84
7.80India -10.34-1.960.000.0017.008.26 8.30 8.30 1.94 2.30 2.05 2.05 15.10 18.96 17.00
1.06Canada -9.01-1.050.000.0010.601.37 1.17 1.17 8.47 8.50 9.06 9.06 8.99 11.65 10.60
3.30Indonesia 3.330.250.000.007.753.56 3.70 3.70 2.03 2.11 2.09 2.09 6.70 7.50 7.75
1.70Ukraine 54.054.000.000.0011.401.90 2.40 2.40 3.76 3.89 4.75 4.75 6.40 7.40 11.40
1.17Serbia 48.001.950.000.006.001.21 1.30 1.30 5.48 3.36 4.62 4.62 6.42 4.05 6.00
0.72Egypt 0.700.040.680.046.220.72 0.73 0.73 8.58 8.58 8.52 8.52 6.15 6.17 6.18
2.61Philippines -5.18-0.380.820.066.902.74 2.66 2.75 2.39 2.66 2.57 2.51 6.23 7.28 6.84
1.07Vietnam -1.52-0.07-9.40-0.474.531.15 1.20 1.14 3.96 4.00 4.17 3.97 4.25 4.60 5.00
1.00Thailand 9.090.352.440.104.201.00 1.02 1.02 3.80 3.85 4.02 4.12 3.80 3.85 4.10
1.00Russian Federation 67.092.650.000.006.601.30 1.65 1.65 3.60 3.04 4.00 4.00 3.60 3.95 6.60
Sub-Saharan Africa
2.90 South Africa, Republic of -8.84-1.160.000.0012.003.30 3.00 3.00 2.52 3.99 4.00 4.00 7.30 13.16 12.00
4.70 Nigeria 21.541.400.000.007.904.00 4.70 4.70 1.66 1.63 1.68 1.68 7.80 6.50 7.90
1.69 Ethiopia 22.670.85-9.80-0.504.601.77 2.30 1.98 2.23 2.12 2.22 2.33 3.78 3.75 5.10
1.25 Zimbabwe -23.81-0.130.000.000.401.30 0.90 0.90 0.56 0.40 0.44 0.44 0.70 0.53 0.40
0.43Turkey 43.101.250.000.004.150.45 0.52 0.52 6.59 6.44 7.98 7.98 2.80 2.90 4.15
29.12Others 4.232.85-1.24-0.8870.1229.79 29.87 29.76 2.27 2.26 2.38 2.36 66.05 67.28 71.00
World and Selected Countries and Regions 4/9/2009 9:17:38 AM
Foreign Agricultural Service/USDAOffice of Global Analysis
April 2009

Table 05 Barley Area, Yield, and Production
From last month From last year
MMTPercent
Yield
(Metric tons per hectare)
Apr 2006/07 MMT
Country / Region
Area
(Million hectares)
Production
(Million metric tons)
Change in Production
2006/07
Prel.
2007/08 Mar Mar
Prel.
2007/08 Apr
Prel.
2007/08 Mar Apr Percent
2008/09 Proj.2008/09 Proj. 2008/09 Proj.
2006/07
57.05World 15.6820.86-0.45-0.69153.8457.55 55.76 55.35 2.39 2.31 2.77 2.78 136.47 132.98 154.53
1.19United States 13.970.640.000.005.211.42 1.52 1.52 3.29 3.23 3.42 3.42 3.92 4.58 5.21
55.86Total Foreign 15.7420.22-0.46-0.69148.6256.13 54.24 53.82 2.37 2.29 2.75 2.76 132.55 128.41 149.31
none
10.00Russian Federation 47.607.450.000.0023.109.80 9.70 9.70 1.81 1.60 2.38 2.38 18.10 15.65 23.10
EU-27
2.03 Germany 15.701.630.000.0012.021.92 1.97 1.97 5.91 5.42 6.11 6.11 11.97 10.39 12.02
1.67 France 29.292.780.000.0012.251.70 1.80 1.80 6.25 5.58 6.81 6.81 10.40 9.48 12.25
3.23 Spain -2.59-0.300.000.0011.303.22 3.50 3.50 2.58 3.60 3.23 3.23 8.32 11.60 11.30
0.88 United Kingdom 20.891.060.000.006.140.89 1.04 1.04 5.95 5.69 5.93 5.93 5.24 5.08 6.14
0.67 Denmark 12.960.410.000.003.530.63 0.72 0.72 4.83 4.98 4.93 4.93 3.25 3.13 3.53
1.22 Poland -11.05-0.440.000.003.571.23 1.21 1.21 2.59 3.25 2.95 2.95 3.16 4.01 3.57
0.53 Czech Republic 21.340.400.000.002.300.50 0.48 0.48 3.59 3.80 4.77 4.77 1.90 1.89 2.30
0.56 Finland -1.86-0.040.000.001.950.53 0.61 0.61 3.50 3.72 3.18 3.18 1.97 1.98 1.95
0.31 Sweden 25.160.360.000.001.800.32 0.41 0.41 3.63 4.48 4.41 4.41 1.11 1.44 1.80
0.33 Italy -2.94-0.040.000.001.190.35 0.33 0.33 3.89 3.55 3.63 3.63 1.30 1.23 1.19
0.29 Hungary 41.980.440.000.001.480.32 0.33 0.33 3.68 3.21 4.45 4.45 1.08 1.04 1.48
0.21 Austria 15.540.130.000.000.940.19 0.19 0.19 4.44 4.20 5.04 5.04 0.91 0.81 0.94
5.20Ukraine 110.006.600.000.0012.604.10 4.15 4.15 2.18 1.46 3.04 3.04 11.35 6.00 12.60
3.22Canada 7.250.800.000.0011.784.00 3.50 3.50 2.97 2.75 3.37 3.37 9.57 10.98 11.78
4.18Australia -2.66-0.190.000.007.004.93 4.50 4.50 1.02 1.46 1.56 1.56 4.26 7.19 7.00
3.60Turkey -6.67-0.400.000.005.603.60 3.40 3.40 2.08 1.67 1.65 1.65 7.50 6.00 5.60
0.83China, Peoples Republic of 18.490.52-2.94-0.103.300.77 0.96 0.89 3.74 3.60 3.54 3.71 3.12 2.79 3.40
1.70Iran -33.33-1.000.000.002.001.70 1.30 1.30 1.76 1.76 1.54 1.54 3.00 3.00 2.00
2.19Morocco 66.710.510.000.001.271.99 2.18 2.18 1.16 0.38 0.58 0.58 2.54 0.76 1.27
1.80Kazakhstan, Republic of -28.00-0.700.000.001.801.80 1.80 1.80 1.06 1.39 1.00 1.00 1.90 2.50 1.80
1.02Ethiopia 9.520.13-29.33-0.621.480.98 1.30 0.95 1.33 1.38 1.62 1.56 1.35 1.36 2.10
0.55Belarus 17.650.300.000.002.000.65 0.55 0.55 2.45 2.62 3.64 3.64 1.35 1.70 2.00
0.70India -7.52-0.100.000.001.230.77 0.75 0.75 1.74 1.73 1.64 1.64 1.22 1.33 1.23
0.34Argentina 8.840.130.000.001.600.44 0.48 0.48 3.76 3.35 3.33 3.33 1.27 1.47 1.60
0.35Mexico 0.000.000.000.000.900.35 0.35 0.35 2.57 2.57 2.57 2.57 0.90 0.90 0.90
1.41Iraq -59.34-0.63-4.22-0.020.431.44 0.50 0.50 0.89 0.74 0.90 0.86 1.25 1.06 0.45
0.70Algeria 0.000.000.000.000.700.70 0.70 0.70 1.00 1.00 1.00 1.00 0.70 0.70 0.70
6.15Others 3.270.420.340.0513.386.30 5.54 5.54 2.05 2.06 2.41 2.41 12.57 12.96 13.33
World and Selected Countries and Regions 4/9/2009 9:17:39 AM
Foreign Agricultural Service/USDAOffice of Global Analysis
April 2009

Table 06 Oats Area, Yield, and Production
From last month From last year
MMTPercent
Yield
(Metric tons per hectare)
Apr 2006/07 MMT
Country / Region
Area
(Million hectares)
Production
(Million metric tons)
Change in Production
2006/07
Prel.
2007/08 Mar Mar
Prel.
2007/08 Apr
Prel.
2007/08 Mar Apr Percent
2008/09 Proj.2008/09 Proj. 2008/09 Proj.
2006/07
12.96World 4.571.16-0.34-0.0926.6513.16 13.06 13.00 1.78 1.94 2.05 2.05 23.08 25.49 26.74
0.63United States -1.98-0.030.000.001.290.61 0.57 0.57 2.14 2.16 2.28 2.28 1.36 1.31 1.29
12.33Total Foreign 4.921.19-0.35-0.0925.3612.56 12.49 12.44 1.76 1.93 2.04 2.04 21.73 24.17 25.45
none
3.60Russian Federation 7.410.400.000.005.803.70 3.70 3.70 1.36 1.46 1.57 1.57 4.90 5.40 5.80
1.54Canada -9.07-0.430.000.004.271.82 1.45 1.45 2.51 2.58 2.94 2.94 3.85 4.70 4.27
EU-27
0.54 Poland -12.75-0.190.000.001.300.59 0.56 0.56 1.92 2.55 2.32 2.32 1.04 1.49 1.30
0.35 Finland 0.330.000.000.001.230.35 0.37 0.37 2.92 3.52 3.29 3.29 1.03 1.22 1.23
0.50 Spain -11.29-0.150.000.001.160.53 0.52 0.52 1.84 2.47 2.24 2.24 0.92 1.30 1.16
0.18 Germany 8.520.060.000.000.790.18 0.18 0.18 4.51 4.09 4.39 4.39 0.83 0.73 0.79
0.20 Sweden 0.900.010.000.000.900.20 0.23 0.23 3.18 4.37 3.91 3.91 0.64 0.89 0.90
0.12 United Kingdom 5.620.040.000.000.750.13 0.13 0.13 6.02 5.52 5.74 5.74 0.73 0.71 0.75
0.11 France 17.110.070.000.000.490.11 0.10 0.10 4.44 3.88 4.72 4.72 0.48 0.42 0.49
0.16 Italy 0.830.000.000.000.360.16 0.14 0.14 2.45 2.33 2.55 2.55 0.40 0.36 0.36
0.07 Denmark 3.230.010.000.000.320.06 0.07 0.07 3.97 4.92 4.32 4.32 0.27 0.31 0.32
0.20 Romania 38.340.100.000.000.350.21 0.21 0.21 1.71 1.19 1.64 1.64 0.35 0.25 0.35
0.06 Czech Republic 6.290.010.000.000.170.06 0.05 0.05 2.67 2.69 3.45 3.45 0.16 0.16 0.17
0.06 Hungary 50.000.060.000.000.180.06 0.06 0.06 2.56 2.07 3.00 3.00 0.15 0.12 0.18
0.04 Austria 12.120.010.000.000.110.03 0.03 0.03 3.74 3.19 4.11 4.11 0.13 0.10 0.11
0.02 Ireland 23.610.030.000.000.180.02 0.02 0.02 7.35 7.20 7.74 7.74 0.13 0.14 0.18
0.06 Lithuania 3.330.000.000.000.120.06 0.06 0.06 1.07 1.94 2.03 2.03 0.06 0.12 0.12
1.00Australia 42.350.360.000.001.200.90 1.00 1.00 0.75 0.94 1.20 1.20 0.75 0.84 1.20
0.44Ukraine 72.730.400.000.000.950.35 0.45 0.45 1.59 1.57 2.11 2.11 0.70 0.55 0.95
0.50China, Peoples Republic of 0.000.000.000.000.600.50 0.50 0.50 1.20 1.20 1.20 1.20 0.60 0.60 0.60
0.25Belarus 50.000.300.000.000.900.25 0.25 0.25 2.20 2.40 3.60 3.60 0.55 0.60 0.90
0.35Brazil 0.000.000.000.000.480.35 0.35 0.35 1.36 1.36 1.36 1.36 0.48 0.48 0.48
0.25Argentina 6.380.030.000.000.500.22 0.26 0.26 1.60 2.10 1.96 1.96 0.40 0.47 0.50
0.08Chile 0.000.000.000.000.380.08 0.08 0.08 4.75 4.75 4.75 4.75 0.38 0.38 0.38
0.09Norway 0.000.000.000.000.360.09 0.09 0.09 4.19 4.19 4.19 4.19 0.36 0.36 0.36
0.10Turkey 0.000.00-31.03-0.090.200.10 0.16 0.10 2.10 2.00 1.87 2.00 0.21 0.20 0.29
0.14Kazakhstan, Republic of 0.000.000.000.000.160.16 0.16 0.16 1.00 1.00 1.00 1.00 0.14 0.16 0.16
0.07Serbia 0.000.000.000.000.120.07 0.07 0.07 1.85 1.85 1.85 1.85 0.12 0.12 0.12
1.26Others 5.050.050.000.001.041.23 1.25 1.25 0.79 0.80 0.83 0.83 0.99 0.99 1.04
World and Selected Countries and Regions 4/9/2009 9:17:38 AM
Foreign Agricultural Service/USDAOffice of Global Analysis
April 2009

Table 07 Rye Area, Yield, and Production
From last month From last year
MMTPercent
Yield
(Metric tons per hectare)
Apr 2006/07 MMT
Country / Region
Area
(Million hectares)
Production
(Million metric tons)
Change in Production
2006/07
Prel.
2007/08 Mar Mar
Prel.
2007/08 Apr
Prel.
2007/08 Mar Apr Percent
2008/09 Proj.2008/09 Proj. 2008/09 Proj.
2006/07
5.67World 21.543.070.060.0117.346.18 6.51 6.49 2.19 2.31 2.66 2.67 12.41 14.27 17.33
0.11United States 26.880.040.000.000.200.10 0.11 0.11 1.65 1.57 1.86 1.86 0.18 0.16 0.20
5.56Total Foreign 21.483.030.060.0117.146.08 6.40 6.38 2.20 2.32 2.68 2.69 12.23 14.11 17.13
none
EU-27
1.32 Poland 8.450.260.000.003.391.32 1.40 1.40 1.99 2.38 2.43 2.43 2.62 3.13 3.39
0.54 Germany 38.921.050.000.003.750.67 0.74 0.74 4.91 4.02 5.08 5.08 2.64 2.70 3.75
0.10 Spain 6.950.020.000.000.280.11 0.11 0.11 1.61 2.33 2.47 2.47 0.16 0.26 0.28
0.05 Lithuania 24.240.040.000.000.210.07 0.08 0.08 1.76 2.36 2.70 2.70 0.09 0.17 0.21
0.04 Latvia 8.840.020.000.000.200.06 0.06 0.06 2.72 3.12 3.40 3.40 0.12 0.18 0.20
0.03 France 1.670.000.000.000.120.03 0.03 0.03 4.65 4.44 4.69 4.69 0.12 0.12 0.12
0.03 Denmark 8.700.010.000.000.150.03 0.03 0.03 4.64 4.93 5.17 5.17 0.13 0.14 0.15
0.02 Czech Republic 20.790.040.000.000.220.04 0.04 0.04 3.41 4.81 5.00 5.00 0.08 0.18 0.22
0.03 Austria 16.400.030.000.000.220.05 0.05 0.05 3.48 4.02 4.15 4.15 0.09 0.19 0.22
0.02 Sweden 8.700.010.000.000.150.03 0.03 0.03 4.92 5.52 5.36 5.36 0.12 0.14 0.15
0.04 Hungary 48.050.040.000.000.110.04 0.04 0.04 2.54 1.97 2.59 2.59 0.10 0.08 0.11
0.01 Slovakia 51.850.030.000.000.080.02 0.03 0.03 2.38 2.57 3.15 3.15 0.03 0.05 0.08
0.02 Finland -28.74-0.030.000.000.060.03 0.02 0.02 2.32 2.72 2.58 2.58 0.05 0.09 0.06
0.01 United Kingdom -2.630.000.000.000.040.01 0.01 0.01 6.14 6.33 6.17 6.17 0.04 0.04 0.04
0.02 Romania 95.450.020.000.000.040.01 0.01 0.01 1.94 1.69 3.07 3.07 0.03 0.02 0.04
0.01 Greece 17.860.010.000.000.030.02 0.02 0.02 1.79 1.87 1.83 1.83 0.03 0.03 0.03
0.02 Portugal -9.090.000.000.000.020.02 0.02 0.02 1.04 1.05 0.95 0.95 0.02 0.02 0.02
1.80Russian Federation 15.380.600.000.004.502.10 2.20 2.20 1.67 1.86 2.05 2.05 3.00 3.90 4.50
0.55Belarus 23.080.300.000.001.600.60 0.50 0.50 2.18 2.17 3.20 3.20 1.20 1.30 1.60
0.36Ukraine 90.910.500.000.001.050.35 0.45 0.45 1.67 1.57 2.33 2.33 0.60 0.55 1.05
0.16Canada 37.340.090.000.000.320.11 0.13 0.13 2.34 2.12 2.46 2.46 0.38 0.23 0.32
0.13Turkey -5.66-0.024.170.010.250.13 0.15 0.13 2.07 2.04 1.60 1.92 0.27 0.27 0.24
0.05Argentina 0.000.000.000.000.060.05 0.05 0.05 1.15 1.15 1.15 1.15 0.06 0.06 0.06
0.07Kazakhstan, Republic of 0.000.000.000.000.050.07 0.07 0.07 0.71 0.71 0.71 0.71 0.05 0.05 0.05
0.04Australia 0.000.000.000.000.020.04 0.04 0.04 0.57 0.57 0.57 0.57 0.02 0.02 0.02
0.00Switzerland 0.000.000.000.000.020.00 0.00 0.00 6.67 6.67 6.67 6.67 0.02 0.02 0.02
0.08Others 7.110.010.000.000.210.09 0.10 0.10 1.87 2.14 2.15 2.15 0.16 0.20 0.21
World and Selected Countries and Regions 4/9/2009 9:17:40 AM
Foreign Agricultural Service/USDAOffice of Global Analysis
April 2009

Table 08 Sorghum Area, Yield, and Production
From last month From last year
MMTPercent
Yield
(Metric tons per hectare)
Apr 2006/07 MMT
Country / Region
Area
(Million hectares)
Production
(Million metric tons)
Change in Production
2006/07
Prel.
2007/08 Mar Mar
Prel.
2007/08 Apr
Prel.
2007/08 Mar Apr Percent
2008/09 Proj.2008/09 Proj. 2008/09 Proj.
2006/07
39.21World -1.34-0.85-1.98-1.2662.4139.73 39.96 39.55 1.41 1.59 1.59 1.58 55.29 63.26 63.67
2.00United States -5.05-0.640.000.0012.002.75 2.94 2.94 3.52 4.60 4.08 4.08 7.03 12.64 12.00
37.21Total Foreign -0.42-0.21-2.44-1.2650.4136.98 37.02 36.61 1.30 1.37 1.40 1.38 48.26 50.62 51.67
none
Sub-Saharan Africa
7.40 Nigeria 10.001.000.000.0011.007.40 7.40 7.40 1.42 1.35 1.49 1.49 10.50 10.00 11.00
6.75 Sudan 4.440.200.000.004.706.60 6.60 6.60 0.77 0.68 0.71 0.71 5.20 4.50 4.70
1.46 Ethiopia -1.50-0.04-20.64-0.682.621.53 1.88 1.55 1.58 1.73 1.76 1.69 2.32 2.66 3.30
1.45 Burkina 19.440.2912.850.211.801.45 1.62 1.62 1.05 1.04 0.98 1.11 1.52 1.51 1.60
0.89 Tanzania, United Republic of 0.000.000.000.000.900.90 0.90 0.90 0.96 1.00 1.00 1.00 0.85 0.90 0.90
1.50 Niger 7.530.072.560.031.001.50 1.50 1.50 0.53 0.62 0.65 0.67 0.80 0.93 0.98
0.31 Uganda 0.000.000.000.000.490.31 0.31 0.31 1.58 1.58 1.58 1.58 0.49 0.49 0.49
0.50 Mozambique 7.140.030.000.000.380.50 0.50 0.50 0.70 0.70 0.75 0.75 0.35 0.35 0.38
0.32 Ghana 77.420.120.000.000.280.21 0.34 0.34 0.98 0.75 0.81 0.81 0.32 0.16 0.28
0.07 South Africa, Republic of 3.850.010.000.000.270.09 0.09 0.09 2.51 2.89 3.00 3.00 0.18 0.26 0.27
South Asia
8.51 India -8.70-0.690.000.007.247.93 7.50 7.50 0.84 1.00 0.97 0.97 7.15 7.93 7.24
0.26 Pakistan -3.97-0.010.000.000.150.25 0.24 0.24 0.61 0.60 0.60 0.60 0.16 0.15 0.15
South America
0.62 Argentina -21.77-0.64-23.33-0.702.300.71 0.70 0.70 4.52 4.14 4.29 3.29 2.80 2.94 3.00
0.70 Brazil 0.000.000.000.002.000.85 0.85 0.85 2.13 2.35 2.35 2.35 1.50 2.00 2.00
1.60Mexico 1.610.101.610.106.301.78 1.75 1.78 3.64 3.49 3.54 3.54 5.81 6.20 6.20
0.73China, Peoples Republic of -6.25-0.12-10.00-0.201.800.50 0.50 0.45 2.98 3.84 4.00 4.00 2.18 1.92 2.00
0.61Australia -21.88-0.670.000.002.401.03 0.80 0.80 2.09 2.99 3.00 3.00 1.28 3.07 2.40
0.16Egypt 0.000.000.000.000.900.16 0.16 0.16 5.63 5.63 5.63 5.63 0.90 0.90 0.90
EU-27
0.06 France -16.67-0.050.000.000.240.05 0.04 0.04 5.56 5.88 6.00 6.00 0.31 0.29 0.24
0.04 Italy 19.170.040.000.000.230.03 0.04 0.04 5.67 5.68 6.05 6.05 0.22 0.19 0.23
3.27Others 4.580.15-0.32-0.013.433.20 3.31 3.24 1.05 1.02 1.04 1.06 3.44 3.28 3.44
World and Selected Countries and Regions 4/9/2009 9:17:41 AM
Foreign Agricultural Service/USDAOffice of Global Analysis
April 2009

Table 09 Rice Area, Yield, and Production
From last month From last year
MMTPercent
Yield
(Metric tons per hectare)
Apr 2006/07 MMT
Country / Region
Area
(Million hectares)
Production
(Million metric tons)
Change in Production
2006/07
Prel.
2007/08 Mar Mar
Prel.
2007/08 Apr
Prel.
2007/08 Mar Apr Percent
2008/09 Proj.2008/09 Proj. 2008/09 Proj.
2006/07
153.89World 2.139.180.030.15441.10154.21 155.50 155.38 4.07 4.18 4.23 4.23 420.43 431.92 440.95
1.14United States 2.700.170.000.006.521.11 1.20 1.20 7.73 8.09 7.68 7.68 6.27 6.34 6.52
152.75Total Foreign 2.129.010.030.15434.59153.09 154.30 154.18 4.05 4.15 4.20 4.20 414.16 425.58 434.44
none
East Asia
28.94 China, Peoples Republic of 3.744.880.000.00135.1028.92 29.20 29.20 6.28 6.43 6.61 6.61 127.20 130.22 135.10
1.69 Japan 1.250.100.360.038.031.67 1.67 1.63 6.34 6.51 6.58 6.78 7.79 7.93 8.00
0.96 Korea, Republic of 9.870.440.000.004.840.95 0.94 0.94 6.60 6.28 6.99 6.99 4.68 4.41 4.84
0.60 Korea, Democratic Peoples Rep 21.810.330.000.001.860.60 0.59 0.59 4.89 3.94 4.89 4.89 1.90 1.53 1.86
South Asia
44.00 India 2.292.210.000.0098.9043.77 44.00 44.00 3.18 3.31 3.37 3.37 93.35 96.69 98.90
11.20 Bangladesh 3.130.900.000.0029.7011.00 11.40 11.40 3.88 3.93 3.91 3.91 29.00 28.80 29.70
2.58 Pakistan 10.530.600.000.006.302.55 2.90 2.90 3.18 3.35 3.26 3.26 5.45 5.70 6.30
Southeast Asia
11.90 Indonesia 1.260.450.000.0036.2511.90 11.90 11.90 4.60 4.66 4.72 4.72 35.30 35.80 36.25
7.20 Vietnam -2.46-0.601.170.2823.787.41 7.29 7.31 4.82 4.98 4.88 4.93 22.92 24.38 23.50
10.27 Thailand 0.520.100.000.0019.4010.60 10.70 10.68 2.69 2.76 2.75 2.75 18.25 19.30 19.40
7.00 Burma, Union of -8.67-0.930.000.009.807.09 6.70 6.70 2.61 2.61 2.52 2.52 10.60 10.73 9.80
4.19 Philippines 1.090.11-0.54-0.0610.594.35 4.49 4.40 3.70 3.83 3.76 3.82 9.78 10.48 10.65
2.52 Cambodia 1.490.060.000.004.282.53 2.60 2.60 2.49 2.65 2.62 2.62 3.95 4.22 4.28
0.76 Laos 3.770.060.000.001.650.76 0.78 0.78 3.50 3.49 3.53 3.53 1.60 1.59 1.65
0.65 Malaysia 3.730.060.660.011.530.65 0.68 0.66 3.30 3.49 3.46 3.57 1.39 1.48 1.52
South America
2.97 Brazil 3.670.302.460.208.502.87 2.90 2.90 3.81 4.20 4.21 4.31 7.70 8.20 8.30
0.35 Peru -8.70-0.160.000.001.700.31 0.31 0.31 6.63 8.62 7.95 7.95 1.60 1.86 1.70
Sub-Saharan Africa
2.05 Nigeria 10.000.300.000.003.302.20 2.30 2.30 2.36 2.27 2.39 2.39 2.90 3.00 3.30
1.35 Madagascar 0.000.000.000.002.301.35 1.33 1.33 2.59 2.67 2.72 2.72 2.24 2.30 2.30
EU-27
0.23 Italy 0.000.000.000.000.870.23 0.23 0.23 6.28 6.28 6.28 6.28 0.87 0.87 0.87
0.11 Spain -9.69-0.050.000.000.470.10 0.10 0.10 7.04 7.23 6.94 6.94 0.52 0.52 0.47
0.67Egypt 0.050.000.000.004.390.67 0.67 0.67 10.08 10.07 10.04 10.04 4.38 4.39 4.39
0.62Iran -31.13-0.680.000.001.500.63 0.58 0.58 4.84 5.24 3.95 3.95 1.98 2.18 1.50
9.97Others 2.800.53-1.56-0.3119.559.99 10.06 10.09 2.90 2.92 3.03 2.97 18.83 19.01 19.86
World and Selected Countries and Regions
Yield is on a rough basis, before the milling process
Production is on a milled basis, after the milling process
4/9/2009 9:17:41 AM
Foreign Agricultural Service/USDAOffice of Global Analysis
April 2009
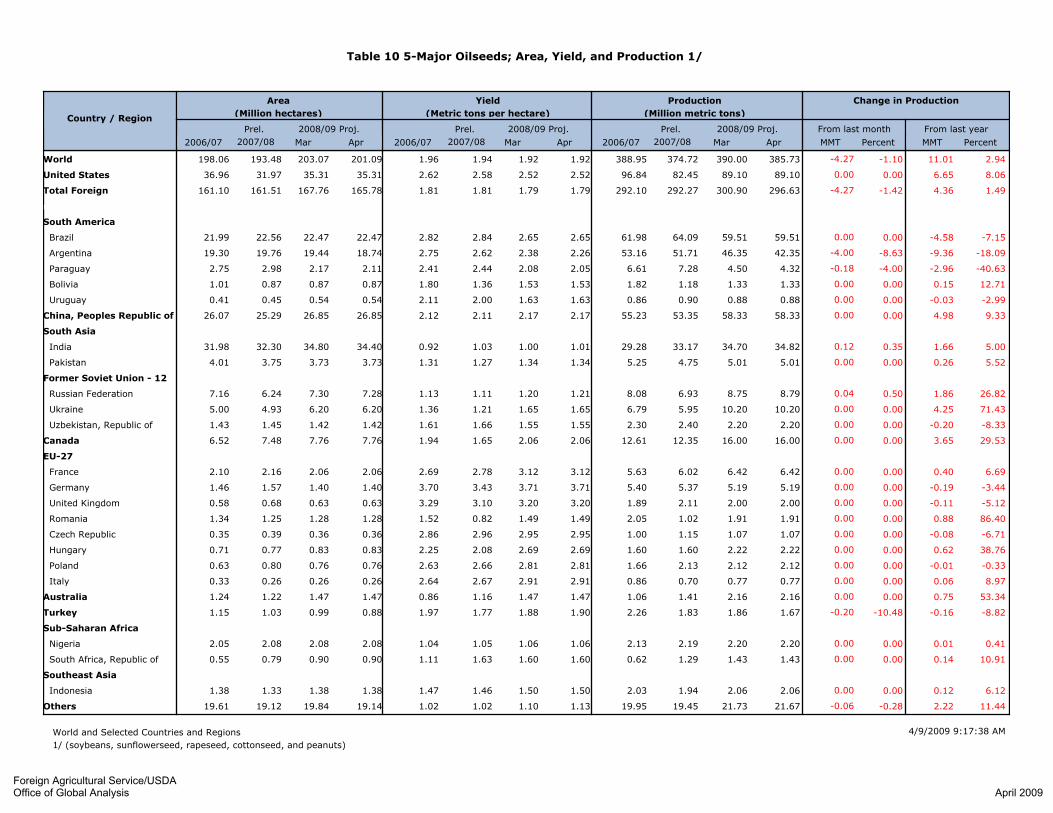
Table 10 5-Major Oilseeds; Area, Yield, and Production 1/
From last month From last year
MMTPercent
Yield
(Metric tons per hectare)
Apr 2006/07 MMT
Country / Region
Area
(Million hectares)
Production
(Million metric tons)
Change in Production
2006/07
Prel.
2007/08 Mar Mar
Prel.
2007/08 Apr
Prel.
2007/08 Mar Apr Percent
2008/09 Proj.2008/09 Proj. 2008/09 Proj.
2006/07
198.06World 2.9411.01-1.10-4.27385.73193.48 203.07 201.09 1.96 1.94 1.92 1.92 388.95 374.72 390.00
36.96United States 8.066.650.000.0089.1031.97 35.31 35.31 2.62 2.58 2.52 2.52 96.84 82.45 89.10
161.10Total Foreign 1.494.36-1.42-4.27296.63161.51 167.76 165.78 1.81 1.81 1.79 1.79 292.10 292.27 300.90
none
South America
21.99 Brazil -7.15-4.580.000.0059.5122.56 22.47 22.47 2.82 2.84 2.65 2.65 61.98 64.09 59.51
19.30 Argentina -18.09-9.36-8.63-4.0042.3519.76 19.44 18.74 2.75 2.62 2.38 2.26 53.16 51.71 46.35
2.75 Paraguay -40.63-2.96-4.00-0.184.322.98 2.17 2.11 2.41 2.44 2.08 2.05 6.61 7.28 4.50
1.01 Bolivia 12.710.150.000.001.330.87 0.87 0.87 1.80 1.36 1.53 1.53 1.82 1.18 1.33
0.41 Uruguay -2.99-0.030.000.000.880.45 0.54 0.54 2.11 2.00 1.63 1.63 0.86 0.90 0.88
26.07China, Peoples Republic of 9.334.980.000.0058.3325.29 26.85 26.85 2.12 2.11 2.17 2.17 55.23 53.35 58.33
South Asia
31.98 India 5.001.660.350.1234.8232.30 34.80 34.40 0.92 1.03 1.00 1.01 29.28 33.17 34.70
4.01 Pakistan 5.520.260.000.005.013.75 3.73 3.73 1.31 1.27 1.34 1.34 5.25 4.75 5.01
Former Soviet Union - 12
7.16 Russian Federation 26.821.860.500.048.796.24 7.30 7.28 1.13 1.11 1.20 1.21 8.08 6.93 8.75
5.00 Ukraine 71.434.250.000.0010.204.93 6.20 6.20 1.36 1.21 1.65 1.65 6.79 5.95 10.20
1.43 Uzbekistan, Republic of -8.33-0.200.000.002.201.45 1.42 1.42 1.61 1.66 1.55 1.55 2.30 2.40 2.20
6.52Canada 29.533.650.000.0016.007.48 7.76 7.76 1.94 1.65 2.06 2.06 12.61 12.35 16.00
EU-27
2.10 France 6.690.400.000.006.422.16 2.06 2.06 2.69 2.78 3.12 3.12 5.63 6.02 6.42
1.46 Germany -3.44-0.190.000.005.191.57 1.40 1.40 3.70 3.43 3.71 3.71 5.40 5.37 5.19
0.58 United Kingdom -5.12-0.110.000.002.000.68 0.63 0.63 3.29 3.10 3.20 3.20 1.89 2.11 2.00
1.34 Romania 86.400.880.000.001.911.25 1.28 1.28 1.52 0.82 1.49 1.49 2.05 1.02 1.91
0.35 Czech Republic -6.71-0.080.000.001.070.39 0.36 0.36 2.86 2.96 2.95 2.95 1.00 1.15 1.07
0.71 Hungary 38.760.620.000.002.220.77 0.83 0.83 2.25 2.08 2.69 2.69 1.60 1.60 2.22
0.63 Poland -0.33-0.010.000.002.120.80 0.76 0.76 2.63 2.66 2.81 2.81 1.66 2.13 2.12
0.33 Italy 8.970.060.000.000.770.26 0.26 0.26 2.64 2.67 2.91 2.91 0.86 0.70 0.77
1.24Australia 53.340.750.000.002.161.22 1.47 1.47 0.86 1.16 1.47 1.47 1.06 1.41 2.16
1.15Turkey -8.82-0.16-10.48-0.201.671.03 0.99 0.88 1.97 1.77 1.88 1.90 2.26 1.83 1.86
Sub-Saharan Africa
2.05 Nigeria 0.410.010.000.002.202.08 2.08 2.08 1.04 1.05 1.06 1.06 2.13 2.19 2.20
0.55 South Africa, Republic of 10.910.140.000.001.430.79 0.90 0.90 1.11 1.63 1.60 1.60 0.62 1.29 1.43
Southeast Asia
1.38 Indonesia 6.120.120.000.002.061.33 1.38 1.38 1.47 1.46 1.50 1.50 2.03 1.94 2.06
19.61Others 11.442.22-0.28-0.0621.6719.12 19.84 19.14 1.02 1.02 1.10 1.13 19.95 19.45 21.73
World and Selected Countries and Regions
1/ (soybeans, sunflowerseed, rapeseed, cottonseed, and peanuts)
4/9/2009 9:17:38 AM
Foreign Agricultural Service/USDAOffice of Global Analysis
April 2009

Table 11 Soybean Area, Yield, and Production
From last month From last year
MMTPercent
Yield
(Metric tons per hectare)
Apr 2006/07 MMT
Country / Region
Area
(Million hectares)
Production
(Million metric tons)
Change in Production
2006/07
Prel.
2007/08 Mar Mar
Prel.
2007/08 Apr
Prel.
2007/08 Mar Apr Percent
2008/09 Proj.2008/09 Proj. 2008/09 Proj.
2006/07
94.23World -0.94-2.08-2.02-4.51218.7690.79 96.44 95.60 2.52 2.43 2.32 2.29 237.44 220.84 223.27
30.19United States 10.547.680.000.0080.5425.96 30.21 30.21 2.88 2.81 2.67 2.67 87.00 72.86 80.54
64.04Total Foreign -6.59-9.75-3.16-4.51138.2364.83 66.24 65.39 2.35 2.28 2.15 2.11 150.43 147.98 142.74
none
South America
20.70 Brazil -6.56-4.000.000.0057.0021.30 21.40 21.40 2.85 2.86 2.66 2.66 59.00 61.00 57.00
16.30 Argentina -15.58-7.20-9.30-4.0039.0016.60 17.20 16.50 2.99 2.78 2.50 2.36 48.80 46.20 43.00
2.40 Paraguay -42.65-2.90-2.50-0.103.902.60 1.80 1.78 2.58 2.62 2.22 2.19 6.20 6.80 4.00
0.85 Bolivia 14.290.150.000.001.200.73 0.73 0.73 1.94 1.44 1.64 1.64 1.65 1.05 1.20
0.37 Uruguay -6.63-0.060.000.000.780.42 0.49 0.49 2.24 2.00 1.60 1.60 0.82 0.83 0.78
East Asia
9.28 China, Peoples Republic of 20.002.800.000.0016.808.70 9.30 9.30 1.72 1.61 1.81 1.81 15.97 14.00 16.80
0.09 Korea, Republic of 18.420.020.000.000.140.08 0.09 0.09 1.73 1.50 1.59 1.59 0.16 0.11 0.14
0.14 Korea, Democratic Peoples Rep 0.000.000.000.000.160.14 0.14 0.14 1.19 1.19 1.19 1.19 0.16 0.16 0.16
0.14 Japan 0.000.000.000.000.230.14 0.14 0.14 1.58 1.63 1.63 1.63 0.23 0.23 0.23
8.12India 4.300.40-3.00-0.309.708.80 9.60 9.60 0.95 1.06 1.04 1.01 7.69 9.30 10.00
1.20Canada 22.220.600.000.003.301.17 1.21 1.21 2.88 2.31 2.73 2.73 3.46 2.70 3.30
Former Soviet Union - 12
0.71 Ukraine 23.080.150.000.000.800.63 0.55 0.55 1.25 1.03 1.45 1.45 0.89 0.65 0.80
0.82 Russian Federation 14.110.096.290.040.740.71 0.73 0.71 0.99 0.92 0.97 1.05 0.81 0.65 0.70
Southeast Asia
0.62 Indonesia 2.560.020.000.000.800.60 0.62 0.62 1.31 1.30 1.29 1.29 0.82 0.78 0.80
0.19 Vietnam -26.83-0.11-26.83-0.110.300.28 0.28 0.20 1.39 1.46 1.46 1.50 0.26 0.41 0.41
0.15 Thailand -14.29-0.030.000.000.180.14 0.12 0.12 1.45 1.50 1.50 1.50 0.21 0.21 0.18
0.12 Burma, Union of -3.230.00-31.43-0.060.120.12 0.15 0.12 0.98 1.01 1.17 1.00 0.12 0.12 0.18
EU-27
0.18 Italy 12.750.050.000.000.460.13 0.14 0.14 3.10 3.14 3.41 3.41 0.55 0.41 0.46
0.05 France -25.00-0.020.000.000.070.03 0.02 0.02 2.73 2.75 2.75 2.75 0.12 0.09 0.07
Sub-Saharan Africa
0.18 South Africa, Republic of 41.840.120.000.000.400.17 0.23 0.23 1.13 1.71 1.74 1.74 0.21 0.28 0.40
0.43 Nigeria 0.000.000.000.000.450.44 0.44 0.44 1.02 1.02 1.02 1.02 0.44 0.45 0.45
0.15 Uganda 0.000.000.000.000.170.15 0.15 0.15 1.10 1.10 1.10 1.10 0.17 0.17 0.17
0.17Serbia 6.060.020.000.000.350.15 0.15 0.15 2.12 2.20 2.41 2.41 0.35 0.33 0.35
0.05Mexico 110.530.080.000.000.160.05 0.07 0.07 1.48 1.43 2.46 2.46 0.08 0.08 0.16
0.10Iran 8.330.020.000.000.260.10 0.11 0.11 2.40 2.40 2.36 2.36 0.24 0.24 0.26
0.55Others 5.740.041.310.010.770.46 0.41 0.41 1.92 1.59 1.86 1.88 1.06 0.73 0.76
World and Selected Countries and Regions 4/9/2009 9:17:34 AM
Foreign Agricultural Service/USDAOffice of Global Analysis
April 2009

Table 12 Cottonseed Area, Yield, and Production
From last month From last year
MMTPercent
Yield
(Metric tons per hectare)
Apr 2006/07 MMT
Country / Region
Area
(Million hectares)
Production
(Million metric tons)
Change in Production
2006/07
Prel.
2007/08 Mar Mar
Prel.
2007/08 Apr
Prel.
2007/08 Mar Apr Percent
2008/09 Proj.2008/09 Proj. 2008/09 Proj.
2006/07
33.79World -9.26-4.27-0.61-0.2641.8332.32 30.22 30.08 1.36 1.43 1.39 1.39 45.83 46.09 42.08
5.15United States -32.78-1.960.000.004.024.25 3.13 3.13 1.29 1.41 1.28 1.28 6.67 5.98 4.02
28.64Total Foreign -5.75-2.31-0.68-0.2637.8128.08 27.09 26.96 1.37 1.43 1.41 1.40 39.16 40.12 38.07
none
6.00China, Peoples Republic of -3.24-0.470.000.0014.036.20 6.00 6.00 2.32 2.34 2.34 2.34 13.91 14.50 14.03
South Asia
9.17 India -7.55-0.800.000.009.809.50 9.35 9.35 1.00 1.12 1.05 1.05 9.13 10.60 9.80
3.25 Pakistan 3.230.130.000.004.003.00 2.90 2.90 1.33 1.29 1.38 1.38 4.32 3.88 4.00
Former Soviet Union - 12
1.43 Uzbekistan, Republic of -8.33-0.200.000.002.201.45 1.42 1.42 1.61 1.66 1.55 1.55 2.30 2.40 2.20
0.60 Turkmenistan 3.920.020.000.000.530.60 0.60 0.60 0.78 0.85 0.88 0.88 0.47 0.51 0.53
0.26 Tajikistan, Republic of -17.78-0.040.000.000.190.25 0.23 0.23 1.00 0.90 0.80 0.80 0.26 0.23 0.19
0.20 Kazakhstan, Republic of -30.61-0.086.250.010.170.20 0.16 0.16 1.26 1.23 1.00 1.06 0.25 0.25 0.16
South America
1.09 Brazil -21.17-0.580.000.002.161.08 0.89 0.89 2.38 2.54 2.44 2.44 2.61 2.74 2.16
0.40 Argentina -13.56-0.030.000.000.200.31 0.30 0.30 0.71 0.76 0.68 0.68 0.29 0.24 0.20
Middle East
0.64 Turkey -29.13-0.30-20.00-0.180.720.52 0.45 0.35 2.05 1.95 2.00 2.09 1.31 1.02 0.90
0.21 Syria -9.26-0.050.000.000.500.20 0.18 0.18 2.10 2.76 2.78 2.78 0.45 0.55 0.50
0.12 Iran -17.09-0.02-22.40-0.030.100.12 0.13 0.10 1.02 0.98 0.96 0.97 0.12 0.12 0.13
0.15Australia 125.130.240.000.000.430.08 0.16 0.16 2.90 2.55 2.62 2.62 0.42 0.19 0.43
EU-27
0.33 Greece -17.02-0.070.000.000.360.32 0.25 0.25 1.37 1.36 1.42 1.42 0.45 0.43 0.36
0.05 Spain -54.39-0.03-39.53-0.020.030.05 0.05 0.05 1.27 1.06 0.86 0.52 0.07 0.06 0.04
Sub-Saharan Africa
0.70 Burkina 26.340.050.000.000.240.40 0.44 0.44 0.51 0.47 0.53 0.53 0.36 0.19 0.24
0.46 Mali -22.05-0.030.000.000.100.28 0.19 0.19 0.49 0.45 0.52 0.52 0.22 0.13 0.10
0.20 Cameroon 19.050.020.000.000.130.14 0.16 0.16 0.91 0.75 0.78 0.78 0.18 0.11 0.13
0.16 Sudan 73.210.040.000.000.100.06 0.09 0.09 0.72 0.93 1.08 1.08 0.12 0.06 0.10
0.35 Zimbabwe -2.78-0.010.000.000.180.38 0.38 0.38 0.54 0.47 0.46 0.46 0.19 0.18 0.18
0.38 Nigeria 4.640.010.000.000.200.40 0.40 0.40 0.46 0.49 0.51 0.51 0.17 0.19 0.20
0.23 Benin -7.88-0.010.000.000.150.23 0.21 0.21 0.68 0.71 0.74 0.74 0.16 0.17 0.15
0.27 Uganda 67.310.040.000.000.090.27 0.27 0.27 0.31 0.19 0.32 0.32 0.08 0.05 0.09
0.25Egypt -52.94-0.18-20.79-0.040.160.25 0.14 0.14 1.28 1.36 1.50 1.19 0.32 0.34 0.20
0.12Mexico 0.000.000.000.000.230.12 0.12 0.12 1.89 1.85 1.85 1.85 0.22 0.23 0.23
0.30Burma, Union of 0.000.000.000.000.160.30 0.30 0.30 0.53 0.53 0.53 0.53 0.16 0.16 0.16
1.34Others 7.790.050.000.000.681.37 1.33 1.33 0.49 0.46 0.51 0.51 0.65 0.63 0.68
World and Selected Countries and Regions 4/9/2009 9:17:30 AM
Foreign Agricultural Service/USDAOffice of Global Analysis
April 2009

Table 13 Peanut Area, Yield, and Production
From last month From last year
MMTPercent
Yield
(Metric tons per hectare)
Apr 2006/07 MMT
Country / Region
Area
(Million hectares)
Production
(Million metric tons)
Change in Production
2006/07
Prel.
2007/08 Mar Mar
Prel.
2007/08 Apr
Prel.
2007/08 Mar Apr Percent
2008/09 Proj.2008/09 Proj. 2008/09 Proj.
2006/07
20.25World 8.932.870.450.1635.0120.77 21.83 21.69 1.52 1.55 1.60 1.61 30.71 32.14 34.85
0.49United States 40.160.670.000.002.340.48 0.61 0.61 3.21 3.44 3.83 3.83 1.57 1.67 2.34
19.76Total Foreign 7.232.200.480.1632.6720.29 21.22 21.08 1.47 1.50 1.53 1.55 29.14 30.47 32.52
none
3.96China, Peoples Republic of 7.470.970.000.0014.003.95 4.20 4.20 3.25 3.30 3.33 3.33 12.89 13.03 14.00
South Asia
5.91 India 7.940.520.000.007.126.40 6.85 6.85 0.91 1.03 1.04 1.04 5.39 6.60 7.12
0.11 Pakistan 0.000.000.000.000.100.11 0.11 0.11 0.90 0.90 0.90 0.90 0.10 0.10 0.10
Sub-Saharan Africa
1.24 Nigeria 0.000.000.000.001.551.25 1.25 1.25 1.23 1.25 1.25 1.25 1.52 1.55 1.55
0.59 Senegal 114.500.380.000.000.710.61 0.77 0.77 0.77 0.55 0.93 0.93 0.46 0.33 0.71
0.48 Chad 109.870.250.000.000.470.50 0.35 0.35 0.94 0.45 1.32 1.32 0.45 0.22 0.47
0.47 Ghana 0.000.000.000.000.440.47 0.47 0.47 0.94 0.94 0.94 0.94 0.44 0.44 0.44
1.00 Sudan 0.000.000.000.000.851.00 1.00 1.00 0.85 0.85 0.85 0.85 0.85 0.85 0.85
0.48 Congo, Democratic Rep of the 0.000.000.000.000.370.48 0.48 0.48 0.78 0.78 0.78 0.78 0.37 0.37 0.37
0.35 Burkina 0.000.000.000.000.350.35 0.35 0.35 0.99 1.01 1.01 1.01 0.34 0.35 0.35
0.21 Guinea -17.72-0.060.000.000.260.22 0.21 0.21 1.24 1.45 1.24 1.24 0.26 0.32 0.26
0.31 Cameroon 0.000.000.000.000.240.31 0.31 0.31 0.76 0.77 0.77 0.77 0.24 0.24 0.24
0.25 Mali 0.000.000.000.000.280.25 0.25 0.25 1.10 1.10 1.10 1.10 0.28 0.28 0.28
0.22 Malawi 0.000.000.000.000.270.22 0.22 0.22 0.93 1.20 1.20 1.20 0.20 0.27 0.27
0.15 Cote d'Ivoire 0.000.000.000.000.150.15 0.15 0.15 1.00 1.00 1.00 1.00 0.15 0.15 0.15
0.21 Uganda 0.000.000.000.000.150.21 0.21 0.21 0.70 0.70 0.70 0.70 0.15 0.15 0.15
0.13 Central African Republic 0.000.000.000.000.140.13 0.13 0.13 1.12 1.12 1.12 1.12 0.14 0.14 0.14
0.16 Benin 7.440.010.000.000.130.14 0.16 0.16 0.81 0.86 0.81 0.81 0.13 0.12 0.13
0.29 Mozambique 0.000.000.000.000.110.29 0.29 0.29 0.38 0.38 0.38 0.38 0.11 0.11 0.11
0.26 Niger 0.000.000.000.000.110.26 0.26 0.26 0.42 0.42 0.42 0.42 0.11 0.11 0.11
0.04 South Africa, Republic of -2.540.000.000.000.120.05 0.06 0.06 1.93 2.19 2.02 2.02 0.08 0.12 0.12
Southeast Asia
0.75 Indonesia 8.700.100.000.001.250.72 0.75 0.75 1.60 1.60 1.67 1.67 1.20 1.15 1.25
0.65 Burma, Union of 0.000.0013.640.121.000.67 0.80 0.67 1.40 1.50 1.10 1.49 0.91 1.00 0.88
0.25 Vietnam 2.040.018.700.040.500.25 0.26 0.25 1.86 1.96 1.77 2.00 0.47 0.49 0.46
0.07 Thailand 0.880.000.000.000.120.07 0.07 0.07 1.77 1.75 1.77 1.77 0.12 0.11 0.12
South America
0.20 Argentina 4.000.030.000.000.650.23 0.24 0.24 2.88 2.77 2.71 2.71 0.58 0.63 0.65
0.12 Brazil 0.000.000.000.000.250.12 0.12 0.12 2.17 2.17 2.17 2.17 0.25 0.25 0.25
0.06Egypt 0.000.000.000.000.190.06 0.06 0.06 3.17 3.17 3.17 3.17 0.19 0.19 0.19
0.05Mexico 6.060.000.000.000.070.04 0.05 0.05 1.56 1.69 1.56 1.56 0.07 0.07 0.07
0.82Others -1.19-0.01-0.530.000.750.83 0.84 0.83 0.88 0.91 0.90 0.90 0.72 0.76 0.75
World and Selected Countries and Regions 4/9/2009 9:17:31 AM
Foreign Agricultural Service/USDAOffice of Global Analysis
April 2009

Table 14 Sunflowerseed Area, Yield, and Production
From last month From last year
MMTPercent
Yield
(Metric tons per hectare)
Apr 2006/07 MMT
Country / Region
Area
(Million hectares)
Production
(Million metric tons)
Change in Production
2006/07
Prel.
2007/08 Mar Mar
Prel.
2007/08 Apr
Prel.
2007/08 Mar Apr Percent
2008/09 Proj.2008/09 Proj. 2008/09 Proj.
2006/07
23.27World 18.344.99-0.25-0.0832.2221.46 23.62 23.17 1.28 1.27 1.37 1.39 29.81 27.23 32.30
0.72United States 19.370.250.000.001.550.81 0.97 0.97 1.36 1.60 1.60 1.60 0.97 1.30 1.55
22.56Total Foreign 18.294.74-0.26-0.0830.6720.65 22.65 22.20 1.28 1.26 1.36 1.38 28.84 25.93 30.75
none
Former Soviet Union - 12
5.90 Russian Federation 30.091.700.000.007.355.00 6.00 6.00 1.14 1.13 1.23 1.23 6.75 5.65 7.35
3.90 Ukraine 54.762.300.000.006.503.40 4.25 4.25 1.36 1.24 1.53 1.53 5.30 4.20 6.50
0.25 Moldova, Republic of 150.000.240.000.000.400.24 0.23 0.23 1.52 0.67 1.78 1.78 0.38 0.16 0.40
0.43 Kazakhstan, Republic of 17.780.040.000.000.270.35 0.43 0.43 0.63 0.64 0.62 0.62 0.27 0.23 0.27
South America
2.40 Argentina -46.24-2.150.000.002.502.62 1.70 1.70 1.46 1.77 1.47 1.47 3.50 4.65 2.50
0.04 Uruguay 38.890.030.000.000.100.04 0.05 0.05 1.02 2.00 1.92 1.92 0.04 0.07 0.10
0.16 Bolivia 0.000.000.000.000.130.14 0.14 0.14 1.06 0.93 0.93 0.93 0.17 0.13 0.13
0.85China, Peoples Republic of 20.000.250.000.001.500.80 0.85 0.85 1.76 1.56 1.76 1.76 1.50 1.25 1.50
EU-27
0.64 France 21.850.280.000.001.580.52 0.60 0.60 2.16 2.52 2.62 2.62 1.39 1.30 1.58
0.54 Hungary 41.510.440.000.001.500.51 0.55 0.55 2.20 2.07 2.74 2.74 1.18 1.06 1.50
0.63 Spain 25.890.180.000.000.890.60 0.69 0.69 0.96 1.17 1.28 1.28 0.61 0.70 0.89
0.15 Italy 0.360.000.000.000.280.13 0.12 0.12 2.12 2.21 2.43 2.43 0.31 0.28 0.28
0.11 Slovakia 28.570.040.000.000.170.07 0.07 0.07 2.12 2.05 2.55 2.55 0.23 0.13 0.17
South Asia
2.15 India -1.32-0.020.000.001.201.90 2.00 2.00 0.60 0.64 0.60 0.60 1.28 1.22 1.20
0.41 Pakistan 17.500.100.000.000.690.38 0.45 0.45 1.28 1.52 1.52 1.52 0.52 0.58 0.69
0.48Turkey 18.570.13-2.35-0.020.830.48 0.50 0.50 1.77 1.46 1.70 1.66 0.85 0.70 0.85
0.32South Africa, Republic of 3.210.030.000.000.900.57 0.60 0.60 0.98 1.54 1.50 1.50 0.31 0.87 0.90
0.54Burma, Union of 1.370.015.710.020.370.54 0.97 0.55 0.65 0.68 0.36 0.67 0.35 0.37 0.35
0.21Serbia 88.460.230.000.000.490.13 0.20 0.20 1.90 2.00 2.45 2.45 0.40 0.26 0.49
0.08Canada -20.49-0.030.000.000.100.08 0.06 0.06 2.00 1.58 1.59 1.59 0.15 0.12 0.10
0.02Australia -12.16-0.010.000.000.070.05 0.06 0.06 1.06 1.54 1.18 1.18 0.02 0.07 0.07
2.38Others 49.040.94-2.72-0.082.872.12 2.14 2.11 1.41 0.91 1.37 1.36 3.34 1.92 2.95
World and Selected Countries and Regions 4/9/2009 9:17:34 AM
Foreign Agricultural Service/USDAOffice of Global Analysis
April 2009

Table 15 Rapeseed Area, Yield, and Production
From last month From last year
MMTPercent
Yield
(Metric tons per hectare)
Apr 2006/07 MMT
Country / Region
Area
(Million hectares)
Production
(Million metric tons)
Change in Production
2006/07
Prel.
2007/08 Mar Mar
Prel.
2007/08 Apr
Prel.
2007/08 Mar Apr Percent
2008/09 Proj.2008/09 Proj. 2008/09 Proj.
2006/07
26.52World 19.589.480.730.4257.9128.14 30.96 30.56 1.70 1.72 1.86 1.90 45.16 48.43 57.49
0.41United States 0.920.010.000.000.660.47 0.40 0.40 1.53 1.39 1.64 1.64 0.63 0.65 0.66
26.11Total Foreign 19.849.480.740.4257.2527.68 30.56 30.16 1.71 1.73 1.86 1.90 44.53 47.78 56.83
none
EU-27
1.43 Germany -3.65-0.190.000.005.131.55 1.37 1.37 3.73 3.44 3.73 3.73 5.34 5.32 5.13
1.41 France 3.040.140.000.004.771.62 1.43 1.43 2.93 2.87 3.34 3.34 4.12 4.63 4.77
0.58 United Kingdom -5.12-0.110.000.002.000.68 0.63 0.63 3.29 3.10 3.20 3.20 1.89 2.11 2.00
0.62 Poland -0.42-0.010.000.002.120.80 0.75 0.75 2.65 2.67 2.82 2.82 1.65 2.13 2.12
0.29 Czech Republic -6.54-0.070.000.001.000.36 0.33 0.33 3.01 3.01 3.03 3.03 0.88 1.07 1.00
0.13 Denmark 5.850.030.000.000.620.18 0.18 0.18 3.48 3.28 3.47 3.47 0.44 0.58 0.62
0.14 Hungary 32.000.160.000.000.660.23 0.25 0.25 2.43 2.20 2.64 2.64 0.34 0.50 0.66
0.10 Romania 92.000.350.000.000.720.34 0.39 0.39 1.68 1.10 1.87 1.87 0.18 0.38 0.72
0.12 Slovakia 55.760.180.000.000.500.15 0.18 0.18 2.11 2.08 2.78 2.78 0.26 0.32 0.50
0.09 Sweden 6.280.010.000.000.240.09 0.10 0.10 2.45 2.53 2.49 2.49 0.22 0.22 0.24
0.15 Lithuania 6.060.020.000.000.350.17 0.20 0.20 1.13 1.90 1.75 1.75 0.17 0.33 0.35
0.08 Latvia 3.770.010.000.000.220.10 0.10 0.10 1.45 2.14 2.20 2.20 0.12 0.21 0.22
0.04 Austria 27.780.040.000.000.180.05 0.06 0.06 3.26 3.00 3.29 3.29 0.14 0.14 0.18
0.11 Finland -21.05-0.020.000.000.090.09 0.07 0.07 1.38 1.27 1.38 1.38 0.15 0.11 0.09
0.06 Estonia 10.090.010.000.000.120.07 0.08 0.08 1.35 1.49 1.50 1.50 0.09 0.11 0.12
5.98China, Peoples Republic of 13.501.430.000.0012.005.64 6.50 6.50 1.83 1.87 1.85 1.85 10.97 10.57 12.00
South Asia
6.64 India 28.441.556.380.427.005.70 7.00 6.60 0.87 0.96 0.94 1.06 5.80 5.45 6.58
0.25 Pakistan 18.420.040.000.000.230.26 0.27 0.27 1.30 0.75 0.83 0.83 0.32 0.19 0.23
0.31 Bangladesh 4.760.010.000.000.220.30 0.30 0.30 0.76 0.71 0.73 0.73 0.24 0.21 0.22
5.24Canada 32.243.070.000.0012.606.23 6.49 6.49 1.72 1.53 1.94 1.94 9.00 9.53 12.60
1.05Australia 46.480.500.000.001.561.06 1.20 1.20 0.54 1.00 1.30 1.30 0.57 1.07 1.56
Former Soviet Union - 12
0.39 Ukraine 163.641.800.000.002.900.90 1.40 1.40 1.54 1.22 2.07 2.07 0.60 1.10 2.90
0.45 Russian Federation 10.760.070.000.000.700.54 0.58 0.58 1.16 1.18 1.22 1.22 0.52 0.63 0.70
0.11 Belarus 120.000.300.000.000.550.15 0.24 0.24 1.07 1.67 2.29 2.29 0.12 0.25 0.55
0.10Paraguay 20.000.030.000.000.180.10 0.10 0.10 1.50 1.50 1.80 1.80 0.15 0.15 0.18
0.23Others 31.170.140.000.000.610.34 0.38 0.38 1.19 1.35 1.58 1.58 0.27 0.46 0.61
World and Selected Countries and Regions 4/9/2009 9:17:31 AM
Foreign Agricultural Service/USDAOffice of Global Analysis
April 2009

Table 16 Copra, Palm Kernel, and Palm Oil Production
Country / Region
Production
(Million metric tons)
2006/07
Prel.
2007/08
2008/09 Proj.
Mar Apr MMT Percent MMT Percent
Change in Production
From last month From last year
Oilseed, Copra
0.00 0.00 0.10 0.04 Philippines 2.20 2.602.602.50
0.00 0.00 0.10 0.07 Indonesia 1.44 1.601.601.50
0.00 0.00 0.04 0.06 India 0.62 0.740.740.70
0.00 0.00 0.00 0.00 Vietnam 0.24 0.240.240.24
0.00 0.00 0.00 0.00 Mexico 0.23 0.230.230.23
0.00 0.00 0.01 0.08 Papua New Guinea 0.13 0.130.130.13
0.00 0.00 0.00 0.00 Thailand 0.07 0.070.070.07
0.00 0.00 0.00 0.00 Sri Lanka 0.06 0.070.070.07
0.00 0.00 0.00 0.00 Mozambique 0.05 0.050.050.05
0.00 0.00 0.00 0.00 Cote d'Ivoire 0.05 0.050.050.05
0.00 0.00 0.24 0.04 World 5.27 5.965.965.72
Oilseed, Palm Kernel
0.00 0.00 0.56 0.12 Indonesia 4.45 5.355.354.79
0.04 0.01 0.08 0.02 Malaysia 3.94 4.614.574.53
0.00 0.00 0.00 0.00 Nigeria 0.67 0.670.670.67
0.00 0.00 0.07 0.33 Thailand 0.23 0.280.280.21
0.00 0.00 0.00 0.00 Colombia 0.17 0.170.170.17
-0.01 -0.08 0.01 0.10 Papua New Guinea 0.10 0.110.120.10
0.00 0.00 0.00 0.00 Cote d'Ivoire 0.08 0.080.080.08
0.00 0.00 0.00 0.00 Cameroon 0.07 0.070.070.07
0.00 0.00 0.00 0.00 Ecuador 0.06 0.060.060.06
0.00 0.00 0.00 0.00 Congo, Democratic Rep of t 0.06 0.060.060.06
0.03 0.00 0.72 0.06 World 10.18 11.8211.7911.10
Oil, Palm
0.00 0.00 1.40 0.08 Indonesia 16.60 19.7019.7018.30
0.00 0.00 0.13 0.01 Malaysia 15.29 17.7017.7017.57
0.00 0.00 0.35 0.33 Thailand 1.17 1.401.401.05
0.00 0.00 -0.03 -0.04 Colombia 0.77 0.800.800.83
0.00 0.00 0.00 0.00 Nigeria 0.81 0.820.820.82
0.00 0.00 0.02 0.05 Papua New Guinea 0.38 0.430.430.40
0.00 0.00 0.00 0.00 Ecuador 0.34 0.340.340.34
0.00 0.00 0.00 0.00 Cote d'Ivoire 0.32 0.320.320.32
0.00 0.00 0.00 0.00 Costa Rica 0.29 0.290.290.29
0.00 0.00 0.00 0.00 Congo, Democratic Rep of t 0.18 0.180.180.18
0.00 0.00 1.89 0.05 World 37.35 43.1943.1941.31
World and Selected Countries and Regions4/9/2009 9:17:39 AM
Foreign Agricultural Service/USDAOffice of Global Analysis
April 2009

Table 17 Cotton Area, Yield, and Production
From last month From last year
MBalesPercent
Yield
(Kilograms per hectare)
Apr 2006/07 MBales
Country / Region
Area
(Million hectares)
Production
(Million 480 lb. bales)
Change in Production
2006/07
Prel.
2007/08 Mar Mar
Prel.
2007/08 Apr
Prel.
2007/08 Mar Apr Percent
2008/09 Proj.2008/09 Proj. 2008/09 Proj.
2006/07
34.71World -10.17-12.26-0.28-0.31108.3433.09 31.03 30.99 765.00 794.00 762.00 761.00 121.99 120.60 108.65
5.15United States -33.20-6.38-1.58-0.2112.834.25 3.13 3.13 912.00 985.00 907.00 893.00 21.59 19.21 13.04
29.55Total Foreign -5.80-5.88-0.10-0.1095.5128.84 27.90 27.86 740.00 765.00 746.00 746.00 100.40 101.39 95.61
none
6.00China, Peoples Republic of -3.24-1.200.000.0035.806.20 6.00 6.00 1,288.00 1,299.00 1,299.00 1,299.00 35.50 37.00 35.80
South Asia
9.17 India -6.50-1.600.000.0023.009.44 9.35 9.35 518.00 567.00 536.00 536.00 21.80 24.60 23.00
3.25 Pakistan 1.120.100.000.009.003.00 2.90 2.90 663.00 646.00 676.00 676.00 9.90 8.90 9.00
Former Soviet Union - 12
1.43 Uzbekistan, Republic of -9.91-0.550.000.005.001.45 1.42 1.42 815.00 833.00 767.00 767.00 5.35 5.55 5.00
0.60 Turkmenistan 3.850.050.000.001.350.60 0.60 0.60 435.00 472.00 490.00 490.00 1.20 1.30 1.35
0.26 Tajikistan, Republic of -20.83-0.130.000.000.480.25 0.23 0.23 551.00 523.00 450.00 450.00 0.65 0.60 0.48
0.20 Kazakhstan, Republic of -30.40-0.198.750.040.440.20 0.16 0.16 698.00 680.00 544.00 592.00 0.63 0.63 0.40
Sub-Saharan Africa
0.70 Burkina 25.930.180.000.000.850.40 0.44 0.44 404.00 367.00 421.00 421.00 1.30 0.68 0.85
0.46 Mali -22.22-0.100.000.000.350.28 0.19 0.19 375.00 345.00 401.00 401.00 0.79 0.45 0.35
0.35 Zimbabwe -3.16-0.020.000.000.460.38 0.38 0.38 311.00 272.00 264.00 264.00 0.50 0.48 0.46
0.23 Benin -8.00-0.040.000.000.460.23 0.21 0.21 448.00 465.00 489.00 489.00 0.48 0.50 0.46
0.21 Cote d'Ivoire 0.000.000.000.000.230.20 0.19 0.19 317.00 245.00 258.00 258.00 0.31 0.23 0.23
0.20 Cameroon 19.050.040.000.000.250.14 0.16 0.16 397.00 327.00 340.00 340.00 0.37 0.21 0.25
0.38 Nigeria 4.440.020.000.000.470.40 0.40 0.40 229.00 248.00 259.00 259.00 0.40 0.45 0.47
0.16 Sudan 72.730.080.000.000.190.06 0.09 0.09 306.00 399.00 460.00 460.00 0.23 0.11 0.19
South America
1.09 Brazil -21.20-1.560.000.005.801.08 0.89 0.89 1,393.00 1,488.00 1,427.00 1,427.00 7.00 7.36 5.80
0.40 Argentina -7.54-0.050.000.000.650.31 0.30 0.30 435.00 494.00 472.00 472.00 0.80 0.70 0.65
0.13 Paraguay -25.00-0.030.000.000.080.06 0.06 0.06 279.00 363.00 272.00 272.00 0.16 0.10 0.08
Middle East
0.63 Turkey -25.81-0.800.000.002.300.52 0.38 0.38 1,313.00 1,298.00 1,318.00 1,318.00 3.80 3.10 2.30
0.21 Syria -17.39-0.200.000.000.950.20 0.17 0.17 1,038.00 1,252.00 1,217.00 1,217.00 1.02 1.15 0.95
0.12 Iran -18.75-0.08-27.78-0.130.330.12 0.13 0.10 757.00 726.00 754.00 708.00 0.40 0.40 0.45
0.14Australia 125.810.780.000.001.400.07 0.16 0.16 2,041.00 2,077.00 1,859.00 1,859.00 1.35 0.62 1.40
EU-27
0.33 Greece -16.98-0.230.000.001.100.32 0.25 0.25 924.00 916.00 958.00 958.00 1.40 1.33 1.10
0.05 Spain -54.05-0.100.000.000.090.05 0.05 0.05 892.00 746.00 370.00 370.00 0.21 0.19 0.09
0.25Egypt -47.50-0.4810.530.050.530.24 0.13 0.13 863.00 907.00 796.00 879.00 0.98 1.00 0.48
0.12Mexico -0.81-0.010.000.000.620.11 0.10 0.10 1,231.00 1,227.00 1,326.00 1,326.00 0.65 0.62 0.62
2.50Others 6.610.21-1.72-0.063.372.54 2.57 2.56 283.00 271.00 291.00 287.00 3.25 3.16 3.43
World and Selected Countries and Regions 4/9/2009 9:17:40 AM
Foreign Agricultural Service/USDAOffice of Global Analysis
April 2009

TABLE 18
The table below presents a 27-year record of the differences between the Aprilprojection and the final estimate. Using world wheat production as an example,changes between the April projection and the final estimate have averaged2.1 million tons (0.4 percent) and ranged from -6.8 to 6.5 million tons. TheApril projection has been below the final 16 times and above the final 11 times.
RELIABILITY OF PRODUCTION PROJECTIONS
COMMODITY AND PROJECTION AND FINAL ESTIMATES, 1981/82 - 2007/08 1/
REGION Difference Lowest Highest Below Above
Average Average Difference Final Final
Percent ---Million metric tons--- Number of years 2/
WHEAT
World 0.4 2.1 -6.8 6.5 16 11
U.S. 0.1 0.0 -0.2 0.1 11 6
Foreign 0.5 2.1 -6.8 6.5 16 11
COARSE GRAINS 3/
World 0.8 6.7 -19.2 13.3 21 6
U.S. 0.0 0.1 -0.2 1.3 11 6
Foreign 1.1 6.8 -19.2 13.3 22 6
RICE (Milled)
World 1.1 3.8 -13.3 10.8 21 6
U.S. 1.0 0.1 -0.2 0.2 10 4
Foreign 1.1 3.8 -13.3 10.8 21 6
SOYBEANS
World 1.5 2.1 -4.0 5.9 16 11
U.S. 1.0 0.6 -2.5 1.8 11 11
Foreign 2.4 1.8 -4.6 5.4 18 9
COTTON
World 1.1 1.0 -5.1 0.8 22 4
U.S. 0.2 0.0 -0.2 0.3 10 10
Foreign 1.3 1.0 -5.1 0.8 21 5
UNITED STATES -------Million bushels-------
CORN 0.0 2 -8 38 1 1
SORGHUM 0.0 0 0 4 0 2
BARLEY 0.3 1 -3 11 11 4
OATS 0.1 0 -2 1 4 3
2/ May not total 27 if projection was the same as the final.
3/ Includes corn, sorghum, barley, oats, rye, millet, and mixed grain.
April 2009 Office of Global Analysis, FAS, USDA
1/ The final estimate for 1981/82-2007/08 is defined as the first November estimate following the marketing year.
Foreign Agricultural Service/USDAOffice of Global Analysis
April 2009