Embed Size (px)
Citation preview

UNITED STATES DEPARTMENT OF AGRICULTURE
NATIONAL AGRICULTURAL STATISTICS SERVICE
AGRICULTURAL
STATISTICS
2020
UNITED STATES GOVERNMENT PRINTING OFFICE
WASHINGTON: 2020
For sale by the Superintendent of Documents, U.S. Government Printing Office Internet: bookstore.gpo.gov Phone: toll free (866) 512-1800; DC area (202) 512-1800
Fax: (202) 512-2104 Mail: Stop IDCC, Washington, DC 20402-0001

ii
Agricultural Statistics 2020
Agricultural Statistics, 2020 was prepared under the direction of Jackie Ross, Secretatary of the Agri-cultural Statistics Board, National Agricultural Statistics Service. Vincent Davis, Carolyne Foster, and Tanya Ray were responsible for coordination and technical editorial work.
The USDA and NASS invite you to explore their information via their respective web sites: http://www.usda.gov/ and http://www.nass.usda.gov/.
For information on NASS products you may call the Agricultural Statistics Hotline, 1–800–727–9540 or send e-mail to [email protected].
We gratefully acknowledge the cooperation of the contributors to this publication. Source notes below each table credit the various Government agencies which collaborated in providing information.
CONTENTS
Page Introduction ................................................................................ iii
Weights, measures and conversion factors ....................... iv
I—Grain and feed: Total grain supply ...................................................... I-1 Food grains:
Wheat ..................................................................... I-1 Rye ......................................................................... I-13 Rice ........................................................................ I-16
Feed grains: Corn ....................................................................... I-23 Oats ........................................................................ I-31 Barley ..................................................................... I-35 Sorghum ................................................................. I-40
Animal units fed ........................................................ I-47 Feedstuffs ................................................................... I-48 Millet .......................................................................... I-48
II—Cotton, tobacco, sugar crops and honey: Cotton ......................................................................... II-1 Sugarbeets .................................................................. II-9 Sugarcane ...................................................................II-10 Sugar ..........................................................................II-11 Honey .........................................................................II-14 Tobacco ......................................................................II-17
III—Oilseeds, fats and oils: Cottonseed ................................................................. III-1 Flaxseed ..................................................................... III-5 Peanuts ....................................................................... III-8 Soybeans ....................................................................III-13 Sunflower ...................................................................III-22 Peppermint and spearmint .........................................III-26 Olive oil .....................................................................III-27 Fats and oils ...............................................................III-27
IV—Vegetables and melons: Vegetables and melons .............................................. IV-1 Vegetable shipments ..................................................IV-35 Per capita utilization ..................................................IV-37 Cold storage holdings ................................................IV-40
V—Fruits, tree nuts and horticultural specialties: Fruits .......................................................................... V-1 Tree nuts ....................................................................V-39 Coffee and tea ............................................................V-44 Mushrooms ................................................................V-46 Flowers .......................................................................V-47 Cold storage holdings ................................................V-58
VI—Hay, seeds and minor field crops: Hay .............................................................................VI-1 Beans, dry edible .......................................................VI-10 Peas, dry .....................................................................VI-14 Hops ...........................................................................VI-14
Page VII—Cattle, hogs and sheep:
Cattle and calves ........................................................VII-1 Hogs ...........................................................................VII-14 Sheep and lambs ........................................................VII-22 Wool ...........................................................................VII-29 Goats and mohair ......................................................VII-33 Meats ..........................................................................VII-38 Hides ..........................................................................VII-47 Cold storage holdings ................................................VII-53
VIII—Dairy and poultry statistics: Cows, milk products ..................................................VIII-1 Dairy products ...........................................................VIII-16 Chickens .....................................................................VIII-27 Turkeys ......................................................................VIII-32 Eggs ...........................................................................VIII-34 Cold storage ...............................................................VIII-37
IX—Farm resources, income and expenses: Economic trends ........................................................ IX-1 Number of farms, land in farms ............................... IX-1 Farm labor ..................................................................IX-21 Farm production, distribution, and value ..................IX-24 Prices ..........................................................................IX-31 Farm income ..............................................................IX-38
X—Insurance, credit and cooperatives: Crop losses ................................................................. X-1 Insurance .................................................................... X-4 Credit and loan programs ..........................................X-11 Farmers’ cooperatives ................................................X-13
XI—Stabilization and price-support programs: Commodity Credit Corporation ................................XI-1 Farm Service Agency programs ................................XI-11 Marketing orders ........................................................XI-13
XII—Agricultural conservation and forestry statistics: Conservation Reserve Programs ...............................XII-1 Forestry ......................................................................XII-19
XIII—Consumption and family living: Population ..................................................................XIII-1 Food consumption and nutrition ...............................XIII-1 Food Costs .................................................................XIII-5 Nutrition Assistance Programs ..................................XIII-6
XIV—Fertilizers and pesticides: Field crops .................................................................XIV-1 Fruits ..........................................................................XIV-19 Vegetables ..................................................................XIV-20
XV—Miscellaneous agricultural statistics: Agricultural imports and exports ..............................XV-1 Fishery statistics ........................................................XV-14 Refrigeration statistics ...............................................XV-28 Alaska statistics .........................................................XV-29 Crop rankings ............................................................XV-30 Crop progress .............................................................XV-31
Appendix I: Telephone contact list ........................................................Appendix-1
Index ..........................................................................................Index-1

iii
Introduction Agricultural Statistics is published each year to meet the diverse need for a reliable reference book
on agricultural production, supplies, consumption, facilities, costs, and returns. Its tables of annual data cover a wide variety of facts in forms suited to most common use. The historical series in this volume are generally of data from 2010 and later.
Inquiries concerning more current or more detailed data, past and prospective revisions, or the sta-tistical methodology used should be addressed directly to the agency credited with preparing the table. Most of the data were prepared or compiled in the U.S. Department of Agriculture.
Foreign agricultural trade statistics include Government as well as non-Government shipments of merchandise from the United States and Territories to foreign countries. They do not include U.S. shipments to the U.S. Armed Forces abroad for their own use or shipments between the States and U.S. Territories. The world summaries of production and trade of major farm products are prepared by the U.S. Department of Agriculture from reports of the U.S. Department of Commerce, official statistics of foreign governments, other foreign source materials, reports of U.S. Agricultural Attache and Foreign Service Officers, and the result of office research.
Statistics presented in many of the tables represent actual counts of the items covered. Most of the statistics relating to foreign trade and to Government programs, such as numbers and amounts of loans made to farmers, and amounts of loans made by the Commodity Credit Corporation, etc., are data of this type. A large number of other tables, however, contain data that are estimates made by the Department of Agriculture.
The estimates for crops, livestock, and poultry made by the U.S. Department of Agriculture are prepared mainly to give timely current State and national totals and averages. They are based on data obtained by sample surveys of farmers and of people who do business with farmers. The survey data are supplemented by information from the Censuses of Agriculture taken every five years and check data from various sources. Being estimates, they are subject to revision as more data become available from commercial or Government sources. Unless otherwise indicated, the totals for the United States shown in the various tables on area, production, numbers, price, value, supplies, and disposition are based on official Department estimates. They exclude States for which no official esti-mates are compiled.
DEFINITIONS
‘‘Value of production’’ as applied to crops in the various tables, is derived by multiplying produc-tion by the estimated season average price received by farmers for that portion of the commodity actually sold. In the case of fruits and vegetables, quantities not harvested because of low prices or other economic factors are not included in value of production. The word ‘‘Value’’ is used in the inventory tables on livestock and poultry to mean value of the number of head on the inventory date. It is derived by multiplying the number of head by an estimated value per head as of the date.
The word ‘‘Year’’ (alone) in a column heading means calendar year unless otherwise indicated. ‘‘Ton’’ when used in this book without qualifications means a short ton of 2,000 pounds.

iv AGRICULTURAL STATISTICS 2020
WEIGHTS, MEASURES, AND CONVERSION FACTORS
The following table on weights, measures, and conversion factors covers the most important agri-cultural products, or the products for which such information is most frequently asked of the U.S. Department of Agriculture. It does not cover all farm products nor all containers for any one product.
The information has been assembled from State schedules of legal weights, various sources within the U.S. Department of Agriculture, and other Government agencies. For most products, particularly fruits and vegetables, there is a considerable variation in weight per unit of volume due to differences in variety or size of commodity, condition and tightness of pack, degree to which the container is heaped, etc. Effort has been made to select the most representative and fairest average for each prod-uct. For those commodities which develop considerable shrinkage, the point of origin weight or weight at harvest has been used.
The approximate or average weights as given in this table do not necessarily have official standing as a basis for packing or as grounds for settling disputes. Not all of them are recognized as legal weight. The table was prepared chiefly for use of workers in the U.S. Department of Agriculture who have need of conversion factors in statistical computations.
WEIGHTS, MEASURES, AND CONVERSION FACTORS
Commodity Unit1
Approximate net weight
U.S. Metric
Pounds Kilograms Alfalfa seed ....... Bushel .............. 60 27.2 Apples ............... .....do ................ 48 21.8
Do .............. Loose pack ...... 38–42 17.2–19.1 Do .............. Tray pack ......... 40–45 18.1–20.4 Do .............. Cell pack .......... 37–41 16.8–18.6
Apricots ............. Lug (brent-wood) 2 ......... 24 10.9
Western ......... 4–basket crate 3 26 11.8 Artichokes:
Globe ............. Ctn, by count and loose pack .............. 20–25 9.1–11.3
Jerusalem ...... Bushel .............. 50 22.7 Asparagus ......... Crate (NJ) ........ 30 13.6 Avocados .......... Lug 4 ................. 12–15 5.4–6.8 Bananas ............ Fiber folding
box 5.40 18.1
Barley ................ Bushel .............. 48 21.8 Beans:
Lima, dry ....... .....do ................ 56 25.4 Other, dry ...... .....do ................ 60 27.2
Sack ................. 100 45.4 Lima
unshelled Bushel .............. 28–32 12.7–14.5
Snap .............. .....do ................ 28–32 12.7–14.5 Beets:
Topped .......... Sack ................. 25 11.3 Bunched ........ 1⁄2 crate 2 dz-
bchs .............. 36–40 16.3–18.1 Berries frozen pack:
Without sugar 50–gal. barrel ... 380 172 3 + 1 pack ..... .....do ................ 425 193 2 + 1 pack ..... .....do ................ 450 204
Blackberries ...... 12, 1⁄2-pint bas-ket.
6 2.7
Bluegrass seed Bushel .............. 14–30 6.4–13.6 Broccoli ............. Wirebound
crate.20–25 9.1–11.3
Broomcorn (6 bales per ton)
Bale .................. 333 151
Broomcorn seed Bushel .............. 44–50 20.0–22.7 Brussels sprouts Ctn, loose pack 25 11.3 Buckwheat ........ Bushel .............. 48 21.8 Butter ................ Block ................ 55,68 25,30.9 Cabbage ........... Open mesh bag 50 22.7
Do .............. Flat crate (13⁄4 bu) ................ 50–60 22.7–27.2
Do .............. Ctn, place pack 53 24.0 Cantaloups ........ Crate 6 .............. 40 18.1 Carrots .............. Film plastic
Bags, mesh sacks & car-tons holding 48 1 lb. film bags ............. 55 24.9
Commodity Unit1
Approximate net weight
U.S. Metric
Pounds Kilograms Without tops .. Burlap sack ...... 74–80 33.6–36.3
Castor beans .... Bushel .............. 41 18.6 Castor oil .......... Gallon7 ............ 8 3.6 Cauliflower ........ W.G.A. crate .... 50–60 22.7–27.2
Do .............. Fiberboard box wrapper leaves re-moved film-wrapped, 2 layers ............ 23–35 10.4–15.9
Celery ............... Crate 8 .............. 60 27.2 Cherries ............ Lug (Camp-
bell) 9 ............ 16 7.3 Do .............. Lug ................... 20 9.1
Clover seed ...... Bushel .............. 60 27.2 Coffee ............... Bag .................. 132.3 60 Corn:
Ear, husked ... Bushel10 .......... 70 31.8 Shelled .......... ......do ............... 56 25.4 Meal .............. ......do ............... 50 22.7 Oil .................. Gallon7 ............ 7.7 3.5 Syrup ............. .....do ................ 11.72 5.3 Sweet ............ Wirebound
crate ............. 50 22.7 Do .............. Ctn, packed 5
oz. ears ........ 50 22.7 Do .............. WDB crate,
41⁄2–5 oz. (from FL & NJ) ................ 42 19.1
Cotton ............... Bale11 , gross ... 500 227 Do .............. Bale11 , net ....... 480 218
Cottonseed ....... Bushel12 .......... 32 14.5 Cottonseed oil ... Gallon7 ............ 7.7 3.5 Cowpeas ........... Bushel .............. 60 27.2 Cranberries ....... Barrel ............... 100 45.4
Do .............. 1⁄4–bbl. box 13 ... 25 11.3 Cream, 40-per-
cent butterfat.Gallon .............. 8.38 3.80
Cucumbers ....... Bushel .............. 48 21.8 Dewberries ........ 24–qt. crate ...... 36 16.3 Eggplant ............ Bushel .............. 33 15.0 Eggs, average
size ................ Case, 30 dozen 47.0 21.3 Escarole ............ Bushel .............. 25 11.3 Figs, fresh ......... Box single
layer 14 .......... 6 2.7 Flaxseed ........... Bushel .............. 56 25.4 Flour, various .... Bag .................. 100 45.4
Do .............. Ctn or Crate, Bulk .............. 30 13.6
Garlic ................ Ctn of 12 tubes or 12 film bag pkgs 12 cloves each .. 10 4.5
See footnotes on page viii.

v AGRICULTURAL STATISTICS 2020
WEIGHTS AND MEASURES—Continued
Commodity Unit 1
Approximate net weight
U.S. Metric
Pounds Kilograms Grapefruit:
Florida and Texas ........ 1⁄2–box mesh
bag ................ 40 18.1 Florida ........... 13⁄5 bu. box ....... 85 38.6 Texas ............ 12⁄5 bu. box ....... 80 36.3 California and
Arizona ...... Box 15,16 ........... 67 30.4 Grapes:
Eastern ......... 12–qt. basket ... 20 9.1 Western ........ Lug ................... 28 12.7
Do .............. 4–basket crate 17 .......... 20 9.1
Hempseed ........ Bushel .............. 44 20.0 Hickory nuts ..... .....do ................ 50 22.7 Honey ............... Gallon ............... 11.84 5.4 Honeydew
melons .......... 2⁄3 Ctn 28–32 12.7–14.5 Hops ................. Bale, gross ....... 200 90.7 Horseradish
roots .............. Bushel .............. 35 15.9 Do .............. Sack ................. 50 22.7
Hungarian millet seed .............. Bushel .............. 48–50 21.8–22.7
Kale .................. Ctn or crate ...... 25 11.3 Kapok seed ...... ......do ............... 35–40 15.9–18.1 Lard .................. Tierce ............... 375 170 Lemons:
California and Arizona ...... Box 18 ............... 76 34.5 Do .............. Carton .............. 38 17.2
Lentils ............... Bushel .............. 60 27.2 Lettuce, iceberg carton packed
24.43–52 19.5–23.6
Lettuce, hot- house ............ 24-qt. basket .... 10 4.5
Limes (Florida) Box ................... 88 39.9 Linseed oil ........ Gallon7 ............. 7.7 3.5 Malt ................... Bushel .............. 34 15.4 Maple syrup ...... Gallon ............... 11.02 5.0 Meadow fescue
seed .............. Bushel .............. 24 10.9 Milk ................... Gallon ............... 8.6 3.9 Millet ................. Bushel .............. 48–60 21.8–27.2 Molasses:
edible ............ Gallon ............... 11.74 5.3 inedible ......... ......do ............... 11.74 5.3
Mustard seed ... Bushel .............. 58–60 26.3–27.2 Oats .................. ......do ............... 32 14.5 Olives ............... Lug ................... 25–30 11.3–13.6 Olive oil ............ Gallon ............... 7 7.6 3.4 Onions, dry ....... Sack ................. 50 22.7 Onions, green
bunched ........ Ctn, 24-dz bchs 10–16 4.5–7.3 Oranges:
Florida ........... Box ................... 90 40.8 Texas ............ Box ................... 85 38.5 California and
Arizona ...... Box 15 ............... 75 34.0 Do .............. Carton .............. 38 17.2
Orchardgrass seed .............. Bushel .............. 14 6.4
Palm oil ............ Gallon7 ............. 7.7 3.5 Parsnips ........... Bushel .............. 50 22.7 Peaches ........... ......do ............... 48 21.8
Do .............. 2 layer ctn or lug ................. 22 10.0
Do .............. 3⁄4-Bu, Ctn/crate 38 17.2 Peanut oil ......... Gallon7 ............. 7.7 3.5 Peanuts,
unshelled: Virginia type .. Bushel .............. 17 7.7 Runners,
South-east-ern ............. ......do ............... 21 9.5
Commodity Unit 1
Approximate net weight
U.S. Metric
Pounds Kilograms Spanish:
South-eastern ... ......do ............... 25 11.3
South-western .. ......do ............... 25 11.3
Pears: California ....... Bushel .............. 48 21.8 Other ............. ......do ............... 50 22.7
Do .............. Std box, 4/5 bu 45–48 20.4–21.8 Do .............. Ctn, Tight-fill
pack .............. 36–37 16.3–16.7 Peas:
Green, unshelled ... Bushel .............. 28–30 12.7–13.6
Dry ................ ......do ............... 60 27.2 Peppers, green ......do ............... 25–30 11.3–13.6
Do .............. 11⁄2 bu carton ... 28 12.7 Perilla seed ...... Bushel .............. 37–40 16.8–18.1 Pineapples ........ Carton .............. 40 18.1 Plums and
prunes: Ctn & lugs ........ 28 12.7 Do .............. 1⁄2-bu. basket ... 30 13.6
Popcorn: On ear ........... Bushel10 .......... 70 31.8 Shelled .......... ......do ............... 56 25.4
Poppy seed ...... ......do ............... 46 20.9 Potatoes ........... Bushel .............. 60 27.2
Do .............. Barrel ................ 165 74.8 Do .............. Box ................... 50 22.7 Do .............. ......do ............... 100 45.4
Quinces ............ Bushel .............. 48 21.8 Rapeseed ......... ......do ............... 50–60 22.7–27.2 Raspberries ...... 1⁄2-pint baskets 6 2.7 Redtop seed ..... Bushel .............. 50–60 22.7–27.2 Refiners’ syrup Gallon ............... 11.45 5.2 Rice:
Rough ........... Bushel .............. 45 20.4 Do .............. Bag ................... 100 45.4 Do .............. Barrel ................ 162 73.5
Milled ............ Pocket or bag ... 100 45.4 Rosin ................ Drum, net ......... 520 236 Rutabagas ........ Bushel .............. 56 25.4 Rye ................... ......do ............... 56 25.4 Sesame seed ... ......do ............... 46 20.9 Shallots ............. Crate (4–7 doz.
bunches) ....... 20–35 9.1–15.9 Sorgo:
Seed ............. Bushel .............. 50 22.7 Syrup ............ Gallon ............... 11.55 5.2
Sorghum grain 19 Bushel .............. 56 25.4
Soybeans ......... ......do ............... 60 27.2 Soybean oil ...... Gallon7 ............. 7.7 3.5 Spelt ................. Bushel .............. 40 18.1 Spinach ............ ......do ............... 18–20 8.2–9.1 Strawberries ..... 24-qt. crate ....... 36 16.3
Do .............. 12-pt. crate ....... 9–11 4.1–5.0 Sudangrass
seed .............. Bushel .............. 40 18.1 Sugarcane:
Syrup (sulfured or un-sulfured) Gallon ............... 11.45 5.2
Sunflower seed Bushel .............. 24–32 10.9–14.5 Sweet potatoes Bushel20 .......... 55 24.9
Do .............. Crate ................ 50 22.7 Tangerines:
Florida ........... Box ................... 95 43.1 Arizona .......... Box ................... 75 34.0 California ....... Box ................... 75 34.0
See footnotes on page viii.

vi AGRICULTURAL STATISTICS 2020
WEIGHTS AND MEASURES—Continued
Commodity Unit 1
Approximate net weight
U.S. Metric
Pounds Kilograms Timothy seed .... Bushel .............. 45 20.4 Tobacco:
Maryland ....... Hogshead ......... 775 352 Flue-cured ..... .....do ................ 950 431 Burley ............ .....do ................ 975 442 Dark air-cured .....do ................ 1,150 522 Virginia fire-
cured .....do ................ 1,350 612 Kentucky and
Tennessee fire-cured .....do ................ 1,500 680
Cigar-leaf ...... Case ................. 250–365 113–166 Do .............. Bale .................. 150–175 68.0–79.4
Tomatoes ......... Crate ................ 60 27.2 Do .............. Lug box ............ 32 14.5 Do .............. 2-layer flat ........ 21 9.5
Tomatoes, hot-house 12-qt. basket .... 20 9.1
Tung oil ............ Gallon7 ............. 7.8 3.5
Commodity Unit 1
Approximate net weight
U.S. Metric
Pounds Kilograms Turnips:
Without tops .. Mesh sack ........ 50 22.7 Bunched ........ Crate 6 .............. 70–80 31.8–36.3
Turpentine ........ Gallon ............... 7.23 3.3 Velvetbeans
(hulled) Bushel .............. 60 27.2 Vetch seed ....... .....do ................ 60 27.2 Walnuts ............ Sacks ............... 50 22.7 Water 60° F ...... Gallon ............... 8.33 3.8 Watermelons .... Melons of aver-
age or me-dium size ...... 25 11.3
Wheat ............... Bushel .............. 60 27.2 Various com-
modities ........ Short ton .......... 2,000 907 Do .............. Long ton ........... 2,240 1,016 Do .............. Metric ton ......... 2,204.6 1,000
See footnotes on page viii.
To Convert From Avoirdupois Pounds
To Multiply by
Kilograms ....................................................................................0.45359237 Metric tons ..................................................................................0.00045359237
Conversion Factors
1 Metric ton=2,204.622 pounds 1 Kilogram=2.2046 pounds 1 Acre=0.4047 hectares 1 Hectare=2.47 acres 1 Square mile=640 acres=259 hectares 1 Gallon=3.7853 liters

vii AGRICULTURAL STATISTICS 2020
CONVERSION FACTORS
Commodity Unit Approximate equivalent
Apples ....................................................... 1 pound dried ...................... 7 pounds fresh; beginning 1943, 8 pounds fresh Do ..................................................... 1 pound chops ..................... 5 pounds fresh Do ..................................................... 1 case canned 21 ................. 1.4 bushels fresh
Applesauce ............................................... ......do 21 ............................... 1.2 bushels fresh Apricots ..................................................... 1 pound dried ...................... 6 pounds fresh Barley flour ................................................ 100 pounds .......................... 4.59 bushels barley Beans, lima ............................................... 1 pound shelled ................... 2 pounds unshelled Beans, snap or wax .................................. 1 case canned 22 ................. 0.008 ton fresh Buckwheat flour ........................................ 100 pounds .......................... 3.47 bushels buckwheat Calves ....................................................... 1 pound live weight ............. 0.611 pound dressed weight (1999 average) Cattle ......................................................... ......do ................................... 0.607 pound dressed weight (1999 average) Cane syrup ............................................... 1 gallon ................................ 5 pounds sugar Cherries, tart ............................................. 1 case canned 21 ................. 0.023 ton fresh Chickens ................................................... 1 pound live weight ............. 0.72 pound ready-to-cook weight Corn, shelled ............................................. 1 bushel (56 lbs.) ................. 2 bushels (70 pounds) of husked ear corn Corn, sweet ............................................... 1 case canned 22 ................. 0.030 ton fresh Cornmeal:
Degermed .............................................. 100 pounds .......................... 3.16 bushels corn, beginning 1946 Nondegermed ........................................ ......do ................................... 2 bushels corn, beginning 1946
Cotton ....................................................... 1 pound ginned .................... 3.26 pounds seed cotton, including trash 23 Cottonseed meal ....................................... 1 pound ................................ 2.10 pounds cottonseed Cottonseed oil ........................................... ......do ................................... 5.88 pounds cottonseed Dairy products:
Butter ..................................................... ......do ................................... 21.1 pounds milk Cheese .................................................. ......do ................................... 10 pounds milk Condensed milk, whole ......................... ......do ................................... 2.3 pounds milk Dry cream .............................................. ......do ................................... 19 pounds milk Dry milk, whole ...................................... ......do ................................... 7.6 pounds milk Evaporated milk, whole ......................... ......do ................................... 2.14 pounds milk Malted milk ............................................ ......do ................................... 2.6 pounds milk Nonfat dry milk ...................................... ......do ................................... 11 pounds liquid skim milk Ice cream 24 ........................................... 1 gallon ................................ 15 pounds milk Ice cream 24 (eliminating fat from butter
and concentrated milk).......do ................................... 12 pounds milk
Eggs .......................................................... 1 case .................................. 47 pounds Eggs, shell ................................................ ......do ................................... 41.2 pounds frozen or liquid whole eggs
Do ..................................................... ......do ................................... 10.3 pounds dried whole eggs Figs ........................................................... 1 pound dried ...................... 3 pounds fresh in California; 4 pounds fresh
elsewhere Flaxseed ................................................... 1 bushel ............................... About 21⁄2 gallons oil Grapefruit, Florida ..................................... 1 case canned juice 22 ......... 0.64 box fresh fruit Hogs .......................................................... 1 pound live weight ............. 0.737 pound dressed weight, excluding lard
(1999 average) Linseed meal ............................................ 1 pound ................................ 1.51 pounds flaxseed Linseed oil ................................................. ......do ................................... 2.77 pounds flaxseed Malt ........................................................... 1 bushel (34 lbs.) ................. 1 bushel barley (48 lbs.) Maple syrup .............................................. 1 gallon ................................ 8 pounds maple sugar Nuts:
Almonds, imported ................................ 1 pound shelled ................... 31⁄2 pounds unshelled Almonds, California ............................... ......do ................................... 2.22 pounds unshelled through 1949; 2 pounds
thereafter Brazil ..................................................... ......do ................................... 2 pounds unshelled Cashews ................................................ ......do ................................... 4.55 pounds unshelled Chestnuts .............................................. ......do ................................... 1.19 pounds unshelled Filberts ................................................... ......do ................................... 2.22 pounds unshelled through 1949; 2.5 pounds
thereafter Pecans:
Seedling ................................................ ......do ................................... 2.78 pounds unshelled Improved ............................................... ......do ................................... 2.50 pounds unshelled
Pignolias ................................................... ......do ................................... 1.3 pounds unshelled Pistachios .................................................. ......do ................................... 2 pounds unshelled Walnuts:
Black ...................................................... ......do ................................... 5.88 pounds unshelled Persian (English) ................................... ......do ................................... 2.67 pounds unshelled
Oatmeal .................................................... 100 pounds .......................... 7.6 bushels oats, beginning 1943 Oranges, Florida ....................................... 1 case canned juice 22 ......... 0.53 box fresh Peaches, California, freestone ................. 1 pound dried ...................... 51⁄3 pounds fresh through 1918; 6 pounds fresh
for 1919–28; and 61⁄2 pounds fresh from 1929 to date
Peaches, California, clingstone ................ ......do ................................... 71⁄2 pounds fresh Peaches, clingstone .................................. 1 case canned 21 ................. 1 bushel fresh
Do ..................................................... ......do ................................... 0.0230 ton fresh Peanuts ..................................................... 1 pound shelled ................... 11⁄2 pounds unshelled Pears ......................................................... 1 pound dried ...................... 61⁄2 pounds fresh Pears, Bartlett ........................................... 1 case canned 22 ................. 1.1 bushels fresh
Do ..................................................... ......do ................................... 0.026 ton fresh
See footnotes on page viii.

viii AGRICULTURAL STATISTICS 2020
CONVERSION FACTORS—Continued
Commodity Unit Approximate equivalent
Peas, green .............................................. 1 pound shelled ................... 21⁄2 pounds unshelled Do ..................................................... 1 case canned 22 ................. 0.009 ton fresh (shelled)
Prunes ....................................................... 1 pound dried ...................... 2.7 pounds fresh in California; 3 to 4 pounds fresh elsewhere
Raisins ...................................................... 1 pound ................................ 4.3 pounds fresh grapes Rice, milled (excluding brewers) .............. 100 pounds .......................... 152 pounds rough or unhulled rice Rye flour ................................................... ......do ................................... 2.23 bushels rye, beginning 1947 Sheep and lambs ...................................... 1 pound live weight ............. 0.504 pound dressed weight (1999 average) Soybean meal ........................................... 1 pound ................................ 1.27 pounds soybeans Soybean oil ............................................... ......do ................................... 5.49 pounds soybeans Sugar ........................................................ 1 ton raw .............................. 0.9346 ton refined Tobacco .................................................... 1 pound farm-sales weight .. Various weights of stemmed and unstemmed,
according to aging and the type of tobacco (See circular 435, U.S. Dept. of Agr.)
Tomatoes .................................................. 1 case canned 22 ................. 0.018 ton fresh Turkeys ..................................................... 1 pound live weight ............. 0.80 pound ready-to-cook weight Wheat flour ............................................... 100 pounds .......................... 2.30 bushels wheat 25 Wool, domestic apparel shorn .................. 1 pound greasy .................... 0.48 pounds scoured Wool, domestic apparel pulled ................. ......do ................................... 0.73 pound scoured
1 Standard bushel used in the United States contains 2,150.42 cubic inches; the gallon, 231 cubic inches; the cranberry barrel, 5,826 cubic inches; and the standard fruit and vegetable barrel, 7,056 cubic inches. Such large-sized products as apples and potatoes sometimes are sold on the basis of a heaped bushel, which would exceed somewhat the 2,150.42 cubic inches of a bushel basket level full. This also applies to such products as sweetpotatoes, peaches, green beans, green peas, spinach, etc.
2 Approximate inside dimensions, 45⁄8 by 121⁄2 by 161⁄8 inches. 3 Approximate inside dimensions, 41⁄2 by 16 by 161⁄8 inches. 4 Approximate dimensions, 41⁄2 by 131⁄2 by 161⁄8 inches. 5 Approximate inside dimensions, 13 by 12 by 32 inches. 6 Approximate inside dimensions, 13 by 18 by 215⁄8 inches. 7 This is the weight commonly used in trade practices, the actual weight varying according to temperature conditions. 8 Approximate inside dimensions, 93⁄4 by 16 by 20 inches. 9 Approximate inside dimensions, 41⁄8 by 111⁄2 by 14 inches. 10 The standard weight of 70 pounds is usually recognized as being about 2 measured bushels of corn, husked, on the
ear, because it required 70 pounds to yield 1 bushel, or 56 pounds, of shelled corn. 11 For statistical purposes the bale of cotton is 500 pounds or 480 pounds net weight. Prior to Aug. 1, 1946, the net
weight was estimated at 478 pounds. Actual bale weights vary considerably, and the customary average weights of bales of foreign cotton differ from that of the American square bale.
12 This is the average weight of cottonseed, although the legal weight in some States varies from this figure of 32 pounds. 13 Approximate inside dimensions, 91⁄4 by 101⁄2 by 15 inches. 14 Approximate inside dimensions, 13⁄4 by 11 by 161⁄8 inches. 15 Approximate inside dimensions, 111⁄2 by 111⁄2 by 24 inches. 16 Beginning with the 1993-94 season, net weights for California Desert Valley and Arizona grapefruit were increased from
64 to 67 pounds, equal to the California other area net weight, making a 67 pound net weight apply to all of California. 17 Approximate inside dimensions, 43⁄4 by 16 by 161⁄8 inches. 18 Approximate inside dimensions, 97⁄8 by 13 by 25 inches.6 by 16 by 161⁄8 inches. 19 Includes both sorghum grain (kafir, milo, hegari, etc.) and sweet sorghum varieties. 20 This average of 55 pounds indicates the usual weight of sweetpotatoes when harvested. Much weight is lost in curing
or drying and the net weight when sold in terminal markets may be below 55 pounds. 21 Case of 24 No. 21⁄2 cans. 22 Case of 24 No. 303 cans. 23 Varies widely by method of harvesting. 24 The milk equivalent of ice cream per gallon is 15 pounds. Reports from plants indicate about 81 percent of the butterfat
in ice cream is from milk and cream, the remainder being from butter and concentrated milk. Thus the milk equivalent of the milk and cream in a gallon of ice cream is about 12 pounds.
25 This is equivalent to 4.51 bushels of wheat per barrel (196 pounds) of flour and has been used in conversions, begin-ning July 1, 1957. Because of changes in milling processes, the following factors per barrel of flour have been used for earlier periods: 1790–1879, 5 bushels; 1880–1908, 4.75 bushels, 1909–17, 4.7 bushels; 1918 and 1919, 4.5 bushels; 1920, 4.6 bushels; 1921–44, 4.7 bushels; July 1944–Feb. 1946, 4.57 bushels; March 1946–Oct. 1946, average was about 4.31 bushels; and Nov. 1946–June 1957, 4.57 bushels.

I–1
CHAPTER I
STATISTICS OF GRAIN AND FEED
This chapter contains tables for wheat, rye, rice, corn, oats, barley, sorghum grain, and feedstuffs. Estimates are given of area, production, disposition, supply and disappearance, prices, value of pro-duction, stocks, foreign production and trade, price-support operations, animal units fed, and feed consumed by livestock and poultry.
Table 1-1.—Total grain: Supply and disappearance, United States, 2008–2016 1
Year 2
Supply Disappearance
Ending stocks Beginning
stocks Production Imports Total Domestic use Exports
Total disappear-
ance
Million Million Million Million Million Million Million Million metric tons metric tons metric tons metric tons metric tons metric tons metric tons metric tons
2008 ......... 54.3 400.4 7.1 461.9 314.4 81.6 396.0 65.9 2009 ......... 66.3 418.0 6.4 490.8 331.1 83.4 414.5 76.3 2010 ......... 76.3 399.6 6.0 481.9 333.1 90.8 423.9 58.0 2011 ......... 58.0 385.1 6.8 449.9 326.3 74.2 400.0 49.9 2012 ......... 49.9 355.7 11.0 416.6 318.7 53.1 371.8 44.7 2013 ......... 44.7 433.9 9.0 487.1 345.3 90.2 435.6 51.8 2014 ......... 51.5 442.4 8.5 503.4 348.8 84.6 433.3 69.7 2015 ......... 69.6 432.2 8.4 509.3 349.7 83.1 432.8 76.8 2016 ......... 76.8 475.3 7.4 560.5 365.2 98.0 463.2 96.5
1 Aggregate data on corn, sorghum, barley, oats, wheat, rye, and rice. 2 The marketing year for corn and sorghum be-gins September 1; for oats, barley, wheat, and rye, June 1; and for rice, August 1.
ERS, Market and Trade Economics Division, (202) 694–5313.
Table 1-2.—Wheat: Area, yield, production, and value, United States, 2010–2019
Year
Area
Yield per harvested acre Production
Marketing year average price
per bushel received by
farmers 2
Value of production 2 Planted 1 Harvested
1,000 acres 1,000 acres Bushels 1,000 bushels Dollars 1,000 dollars
2010 ..................... 52,620 46,883 46.1 2,163,023 5.70 12,579,125 2011 ..................... 54,277 45,687 43.6 1,993,111 7.24 14,269,225 2012 ..................... 55,294 48,758 46.2 2,252,307 7.77 17,383,149 2013 ..................... 56,236 45,332 47.1 2,134,979 6.87 14,604,442 2014 ..................... 56,841 46,385 43.7 2,026,310 5.99 11,914,954 2015 ..................... 54,999 47,318 43.6 2,061,939 4.89 10,018,323 2016 ..................... 50,116 43,848 52.7 2,308,663 3.89 9,179,190 2017 ..................... 46,052 37,555 46.4 1,740,910 4.72 8,255,119 2018 ..................... 47,815 39,612 47.6 1,885,156 5.16 9,661,916 2019 ..................... 45,158 37,162 51.7 1,920,139 4.55 8,882,766
1 Includes area seeded in preceding fall for winter wheat. 2 Includes allowance for loans outstanding and purchases by the Government valued at the average loan and purchase rate, by States, where applicable.
NASS, Crops Branch, (202) 720–2127.

I–2 GRAIN AND FEED
Table 1-3.—Wheat, by type: Area, yield, production, and value, United States, 2010–2019
Year
Area
Yield per harvested acre Production
Marketing year average price
per bushel received by
farmers 2
Value of production 2 Planted 1 Harvested
Winter wheat
1,000 acres 1,000 acres Bushels 1,000 bushels Dollars 1,000 dollars
2010 ................ 36,576 31,219 46.5 1,452,313 5.37 7,835,595 2011 ................ 40,596 32,378 46.1 1,493,130 6.81 10,154,257 2012 ................ 40,897 34,609 47.1 1,630,387 7.55 12,245,482 2013 ................ 43,230 32,650 47.3 1,542,902 6.89 10,590,949 2014 ................ 42,409 32,299 42.6 1,377,216 5.92 8,036,108 2015 ................ 39,681 32,346 42.5 1,374,690 4.80 6,555,216 2016 ................ 36,149 30,235 55.3 1,672,522 3.57 6,114,353 2017 ................ 32,726 25,301 50.2 1,270,282 4.32 5,522,949 2018 ................ 32,542 24,742 47.9 1,183,939 5.08 5,985,308 2019 ................ 31,159 24,327 53.6 1,304,003 4.50 5,999,460
Durum wheat
1,000 acres 1,000 acres Bushels 1,000 bushels Dollars 1,000 dollars
2010 ................ 2,503 2,462 41.2 101,482 5.98 633,469 2011 ................ 1,337 1,280 36.8 47,043 9.68 445,186 2012 ................ 2,138 2,122 38.4 81,501 8.18 682,317 2013 ................ 1,400 1,338 43.3 57,976 7.46 432,733 2014 ................ 1,407 1,346 40.2 54,056 8.81 482,417 2015 ................ 1,951 1,911 44.0 84,009 7.36 615,160 2016 ................ 2,412 2,360 44.0 103,914 6.01 608,093 2017 ................ 2,307 2,106 26.0 54,777 6.35 344,791 2018 ................ 2,073 1,974 39.5 77,985 5.33 412,749 2019 ................ 1,339 1,175 45.7 53,756 4.90 257,103
Other spring wheat 3
1,000 acres 1,000 acres Bushels 1,000 bushels Dollars 1,000 dollars
2010 ................ 13,541 13,202 46.1 609,228 6.49 4,110,061 2011 ................ 12,344 12,029 37.7 452,938 8.24 3,669,782 2012 ................ 12,259 12,027 44.9 540,419 8.24 4,455,350 2013 ................ 11,606 11,344 47.1 534,101 6.73 3,580,760 2014 ................ 13,025 12,740 46.7 595,038 5.75 3,396,429 2015 ................ 13,367 13,061 46.2 603,240 4.78 2,847,947 2016 ................ 11,555 11,253 47.3 532,227 4.56 2,456,744 2017 ................ 11,019 10,148 41.0 415,851 5.71 2,387,379 2018 ................ 13,200 12,896 48.3 623,232 5.31 3,263,859 2019 ................ 12,660 11,660 48.2 562,380 4.65 2,626,203
1 Seeded in preceding fall for winter wheat. 2 Obtained by weighting State prices by quantity sold. 3 Includes small quantities of Durum wheat grown in other States.
NASS, Crops Branch, (202) 720–2127.

I–3 AGRICULTURAL STATISTICS 2020
Table 1-4.—Wheat: Stocks on and off farms, United States, 2010–2019
Year beginning
September
All wheat
On farms Off farms 1
Sept. 1 Dec. 1 Mar. 1 Jun. 1 Sept. 1 Dec. 1 Mar. 1 Jun. 1
1,000 bushels
2010 ............... 812,100 550,000 288,010 130,915 1,637,517 1,382,946 1,137,292 732,083 2011 ............... 633,000 405,200 217,100 112,030 1,513,669 1,257,318 982,245 630,590 2012 ............... 572,900 399,500 236,970 120,150 1,542,209 1,271,079 997,860 597,739 2013 ............... 555,000 398,400 237,530 96,995 1,314,637 1,076,451 819,435 493,288 2014 ............... 713,450 472,800 278,710 155,170 1,193,770 1,056,830 861,697 597,224 2015 ............... 650,200 503,450 319,800 197,210 1,446,889 1,242,457 1,051,862 778,393 2016 ............... 728,200 571,280 349,500 191,755 1,816,830 1,508,080 1,309,175 988,847 2017 ............... 492,500 394,180 259,310 130,475 1,774,275 1,479,335 1,236,131 968,414 2018 ............... 632,700 504,280 367,870 206,545 1,757,071 1,505,205 1,225,201 873,216 2019 ............... 734,500 519,470 338,690 231,995 1,611,025 1,321,305 1,076,724 811,847
Year beginning
September
Durum wheat 2
On farms Off farms 1
Sept. 1 Dec. 1 Mar. 1 Jun. 1 Sept. 1 Dec. 1 Mar. 1 Jun. 1
1,000 bushels
2010 ............... 71,200 46,600 35,700 22,100 28,931 21,742 20,720 13,366 2011 ............... 34,900 24,500 17,900 15,200 28,828 23,507 17,899 10,270 2012 ............... 43,600 36,700 21,400 13,600 24,842 24,306 21,088 9,450 2013 ............... 42,900 32,800 20,700 12,800 23,465 21,175 17,430 8,724 2014 ............... 38,700 23,900 16,200 10,250 19,121 20,147 21,454 15,406 2015 ............... 44,900 35,700 17,700 12,190 29,146 24,787 24,785 15,609 2016 ............... 65,500 49,200 32,400 18,350 26,386 23,719 20,584 17,953 2017 ............... 33,400 30,700 25,800 14,950 32,756 25,351 23,740 19,996 2018 ............... 51,800 46,700 40,600 26,050 38,260 36,830 33,789 28,920 2019 ............... 49,600 33,200 23,500 17,700 38,773 31,187 27,898 25,147
1 Includes stocks at mills, elevators, warehouses, terminals, and processors. 2 Included in all wheat. NASS, Crops Branch, (202) 720–2127.

I–4 GRAIN AND FEED
Table 1-5.—Wheat: Supply and disappearance, by class, United States, 2015–2019 1
Item Year beginning June
2015 2016 2017 2018 2019
Million bushels
All wheat: Stocks, June 1 ........................................ 752 976 1,181 1,099 1,080 Production .............................................. 2,062 2,309 1,741 1,885 1,920
Supply 2 ........................................... 2,927 3,402 3,079 3,119 3,105
Exports 3 ................................................. 778 1,051 906 937 965 Domestic disappearance ........................ 1,174 1,171 1,075 1,102 1,096
Stocks, May 31 ............................... 976 1,181 1,099 1,080 1,044
Hard red winter: Stocks, June 1 ........................................ 294 446 589 581 516 Production .............................................. 830 1,082 750 662 833
Supply 2 ........................................... 1,130 1,533 1,346 1,248 1,351
Exports 3 ................................................. 227 453 373 332 376 Domestic disappearance ........................ 458 490 392 400 454
Stocks, May 31 ............................... 446 589 581 516 521
Soft red winter: Stocks, June 1 ........................................ 154 157 215 205 158 Production .............................................. 359 345 293 286 239
Supply 2 ........................................... 518 510 512 495 401
Exports 3 ................................................. 120 91 91 128 92 Domestic disappearance ........................ 241 204 216 209 204
Stocks, May 31 ............................... 157 215 205 158 105
Hard red spring: Stocks, June 1 ........................................ 212 272 235 191 263 Production .............................................. 568 491 384 587 522
Supply 2 ........................................... 842 830 707 845 838
Exports 3 ................................................. 254 319 229 259 268 Domestic disappearance ........................ 316 276 287 324 289
Stocks, May 31 ............................... 272 235 191 263 280
Durum: Stocks, June 1 ........................................ 26 28 36 35 55 Production .............................................. 84 104 55 78 54
Supply 2 ........................................... 143 162 143 165 150
Exports 3 ................................................. 29 25 18 22 42 Domestic disappearance ........................ 86 101 90 88 65
Stocks, May 31 ............................... 28 36 35 55 43
White: Stocks, June 1 ........................................ 67 74 105 87 88 Production .............................................. 221 286 259 272 272
Supply 2 ........................................... 294 368 371 365 366
Exports 3 ................................................. 147 163 195 197 187 Domestic disappearance ........................ 73 100 90 81 84
Stocks, May 31 ............................... 74 105 87 88 95
1 Data except production are approximations. 2 Total supply includes imports. 3 Import and exports include flour and products in wheat equivalent.
ERS, Market and Trade Economics Division, (202) 694–5285.

I–5 AGRICULTURAL STATISTICS 2020
Table 1-6.—Wheat: Supply and disappearance, United States, 2010–2019
Year be-ginning June
Supply Disappearance
Ending stocks May 31
Begin-ning
stocks
Produc-tion
Im-ports 1 Total
Domestic use Ex-ports 1
Total dis-
appear-ance Food Seed Feed 2 Total
Million bushels
2010 ...... 976 2,207 97 3,236 926 71 85 1,081 1,291 2,373 863 2011 ...... 863 1,993 112 2,969 941 76 159 1,176 1,051 2,227 743 2012 ...... 743 2,252 124 3,119 951 73 365 1,389 1,012 2,401 718 2013 ...... 718 2,135 172 3,025 955 76 228 1,259 1,176 2,435 590 2014 ...... 590 2,026 151 2,768 958 79 113 1,151 864 2,015 752 2015 ...... 752 2,062 113 2,927 957 67 149 1,174 778 1,951 976 2016 ...... 976 2,309 118 3,402 949 61 161 1,171 1,051 2,222 1,181 2017 ...... 1,181 1,741 158 3,079 964 63 47 1,075 906 1,981 1,099 2018 ...... 1,099 1,885 135 3,119 955 59 88 1,102 937 2,039 1,080 2019 ...... 1,080 1,920 105 3,105 962 61 73 1,096 965 2,061 1,044
1 Imports and exports include flour and other products expressed in wheat equivalent. 2 Approximates feed and residual use and includes negligible quantities used for distilled spirits.
Totals may not add due to independent rounding. ERS, Market and Trade Economics Division, (202) 694–5296. Data as of September 21, 2020.
Table 1-7.—All Wheat: Area, yield, and production, by State and United States, 2017–2019
State Area planted 1 Area harvested
2017 2018 2019 2017 2018 2019
1,000 acres
Alabama ................. 150 160 130 100 110 85 Arizona ................... 115 96 34 105 77 33 Arkansas ................ 200 175 110 125 95 50 California ................ 420 425 420 182 147 122 Colorado ................ 2,260 2,260 2,150 2,029 1,954 2,000 Delaware ................ 75 75 60 60 45 50 Florida 2 ................. 20 15 (NA) 10 10 (NA) Georgia .................. 160 200 150 70 70 50 Idaho ...................... 1,175 1,191 1,195 1,109 1,136 1,125 Illinois ..................... 500 600 650 470 560 550 Indiana ................... 290 310 330 240 260 260 Iowa 2 .................... 16 16 (NA) 8 6 (NA) Kansas ................... 7,600 7,700 6,900 6,950 7,300 6,500 Kentucky ................ 480 450 460 310 300 330 Louisiana 2 ............. 20 15 (NA) 13 10 (NA) Maryland ................ 410 360 345 185 200 165 Michigan ................ 480 510 540 425 470 480 Minnesota .............. 1,170 1,621 1,450 1,135 1,575 1,400 Mississippi ............. 45 55 45 25 30 21 Missouri ................. 640 740 550 540 520 390 Montana ................. 5,140 5,390 5,450 4,665 5,165 5,175 Nebraska ............... 1,120 1,100 1,070 1,020 1,010 970 Nevada 2 ................ 29 23 (NA) 14 8 (NA) New Jersey ............ 23 18 19 17 15 14 New Mexico ........... 330 320 360 135 105 105 New York ............... 140 110 90 125 95 66 North Carolina ....... 450 460 290 375 370 225 North Dakota ......... 6,680 7,735 7,505 6,260 7,635 6,620 Ohio ....................... 490 490 500 460 450 385 Oklahoma .............. 4,500 4,400 4,200 2,900 2,500 2,750 Oregon ................... 775 800 740 763 770 730 Pennsylvania ......... 210 195 180 150 145 140 South Carolina ....... 90 80 70 75 65 45 South Dakota ......... 1,887 1,883 1,500 1,196 1,628 1,375 Tennessee ............. 370 380 280 275 285 215 Texas ..................... 4,700 4,500 4,500 2,350 1,750 2,050 Utah ....................... 134 130 125 120 103 116 Virginia ................... 210 230 180 145 155 105 Washington ............ 2,195 2,220 2,260 2,140 2,165 2,205 West Virginia 2 ....... 8 7 (NA) 4 3 (NA) Wisconsin .............. 210 240 195 170 200 150 Wyoming ................ 135 130 125 105 115 110
United States ......... 46,052 47,815 45,158 37,555 39,612 37,162
See footnote(s) at end of table.

I–6 GRAIN AND FEED
Table 1-7.—All Wheat: Area, yield, and production, by State and United States, 2017–2019—Continued
State Yield per harvested acre Production
2017 2018 2019 2017 2018 2019
Bushels 1,000 bushels
Alabama ................. 77.0 72.0 72.0 7,700 7,920 6,120 Arizona ................... 100.8 102.6 104.0 10,589 7,898 3,432 Arkansas ................ 52.0 55.0 52.0 6,500 5,225 2,600 California ................ 68.2 81.5 59.4 12,404 11,985 7,244 Colorado ................ 43.2 36.1 49.0 87,598 70,504 98,000 Delaware ................ 73.0 71.0 72.0 4,380 3,195 3,600 Florida 2 ................. 37.0 36.0 (NA) 370 360 (NA) Georgia .................. 47.0 54.0 56.0 3,290 3,780 2,800 Idaho ...................... 81.8 91.9 87.8 90,723 104,410 98,755 Illinois ..................... 76.0 66.0 67.0 35,720 36,960 36,850 Indiana ................... 74.0 71.0 62.0 17,760 18,460 16,120 Iowa 2 .................... 68.0 58.0 (NA) 544 348 (NA) Kansas ................... 48.0 38.0 52.0 333,600 277,400 338,000 Kentucky ................ 77.0 66.0 76.0 23,870 19,800 25,080 Louisiana 2 ............. 46.0 65.0 (NA) 598 650 (NA) Maryland ................ 71.0 63.0 75.0 13,135 12,600 12,375 Michigan ................ 79.0 76.0 71.0 33,575 35,720 34,080 Minnesota .............. 66.9 59.0 57.0 75,935 92,930 79,800 Mississippi ............. 58.0 49.0 47.0 1,450 1,470 987 Missouri ................. 68.0 59.0 63.0 36,720 30,680 24,570 Montana ................. 27.3 38.3 42.4 127,430 197,630 219,265 Nebraska ............... 46.0 49.0 57.0 46,920 49,490 55,290 Nevada 2 ................ 105.7 112.5 (NA) 1,480 900 (NA) New Jersey ............ 64.0 62.0 66.0 1,088 930 924 New Mexico ........... 30.0 15.0 30.0 4,050 1,575 3,150 New York ............... 67.0 69.0 63.0 8,375 6,555 4,158 North Carolina ....... 55.0 57.0 56.0 20,625 21,090 12,600 North Dakota ......... 37.9 47.6 48.5 237,133 363,483 320,760 Ohio ....................... 74.0 75.0 56.0 34,040 33,750 21,560 Oklahoma .............. 34.0 28.0 40.0 98,600 70,000 110,000 Oregon ................... 63.0 67.0 68.0 48,069 51,590 49,640 Pennsylvania ......... 72.0 65.0 73.0 10,800 9,425 10,220 South Carolina ....... 49.0 54.0 48.0 3,675 3,510 2,160 South Dakota ......... 34.8 44.4 48.0 41,678 72,294 66,055 Tennessee ............. 70.0 65.0 67.0 19,250 18,525 14,405 Texas ..................... 29.0 32.0 34.0 68,150 56,000 69,700 Utah ....................... 52.0 52.0 54.0 6,240 5,356 6,264 Virginia ................... 66.0 60.0 62.0 9,570 9,300 6,510 Washington ............ 66.6 70.8 64.7 142,500 153,210 142,735 West Virginia 2 ....... 69.0 46.0 (NA) 276 138 (NA) Wisconsin .............. 68.0 71.0 64.0 11,560 14,200 9,600 Wyoming ................ 28.0 34.0 43.0 2,940 3,910 4,730
United States ......... 46.4 47.6 51.7 1,740,910 1,885,156 1,920,139
(NA) Not available. 1 Includes area planted preceding fall. 2 Estimates discontinued in 2019. NASS, Crops Branch, (202) 720–2127.

I–7 AGRICULTURAL STATISTICS 2020
Table 1-8.—Wheat, by type: Area, yield, and production, by State and United States, 2017–2019
State Area planted 1 Area harvested
2017 2018 2019 2017 2018 2019
1,000 acres
Winter wheat
Alabama ..................... 150 160 130 100 110 85 Arizona 2 .................... 25 22 (NA) 16 4 (NA) Arkansas .................... 200 175 110 125 95 50 California .................... 385 380 390 155 110 100 Colorado .................... 2,250 2,250 2,150 2,020 1,950 2,000 Delaware .................... 75 75 60 60 45 50 Florida 2 ..................... 20 15 (NA) 10 10 (NA) Georgia ...................... 160 200 150 70 70 50 Idaho .......................... 720 720 730 670 680 680 Illinois ......................... 500 600 650 470 560 550 Indiana ....................... 290 310 330 240 260 260 Iowa 2 ........................ 16 16 (NA) 8 6 (NA) Kansas ....................... 7,600 7,700 6,900 6,950 7,300 6,500 Kentucky .................... 480 450 460 310 300 330 Louisiana 2 ................. 20 15 (NA) 13 10 (NA) Maryland .................... 410 360 345 185 200 165 Michigan .................... 480 510 540 425 470 480 Minnesota 2 ............... 10 11 (NA) 5 5 (NA) Mississippi ................. 45 55 45 25 30 21 Missouri ..................... 640 740 550 540 520 390 Montana ..................... 1,750 1,650 2,000 1,590 1,570 1,900 Nebraska ................... 1,120 1,100 1,070 1,020 1,010 970 Nevada 2 .................... 14 13 (NA) 5 5 (NA) New Jersey ................ 23 18 19 17 15 14 New Mexico ............... 330 320 360 135 105 105 New York ................... 140 110 90 125 95 66 North Carolina ........... 450 460 290 375 370 225 North Dakota ............. 70 85 85 35 70 70 Ohio ........................... 490 490 500 460 450 385 Oklahoma .................. 4,500 4,400 4,200 2,900 2,500 2,750 Oregon ....................... 700 720 740 690 695 730 Pennsylvania ............. 210 195 180 150 145 140 South Carolina ........... 90 80 70 75 65 45 South Dakota ............. 910 830 860 520 660 770 Tennessee ................. 370 380 280 275 285 215 Texas ......................... 4,700 4,500 4,500 2,350 1,750 2,050 Utah ........................... 120 120 125 108 94 116 Virginia ....................... 210 230 180 145 155 105 Washington ................ 1,700 1,700 1,750 1,650 1,650 1,700 West Virginia 2 ........... 8 7 (NA) 4 3 (NA) Wisconsin .................. 210 240 195 170 200 150 Wyoming .................... 135 130 125 105 115 110
United States ............. 32,726 32,542 31,159 25,301 24,742 24,327
Other spring wheat
Colorado 2 ................. 10 10 (NA) 9 4 (NA) Idaho .......................... 430 460 460 415 445 440 Minnesota .................. 1,160 1,610 1,450 1,130 1,570 1,400 Montana ..................... 2,500 2,900 2,900 2,290 2,820 2,760 Nevada 2 .................... 15 10 (NA) 9 3 (NA) North Dakota ............. 5,350 6,550 6,700 5,050 6,490 5,950 Oregon 2 .................... 75 80 (NA) 73 75 (NA) South Dakota ............. 970 1,050 640 670 965 605 Utah 2 ........................ 14 10 (NA) 12 9 (NA) Washington ................ 495 520 510 490 515 505
United States ............. 11,019 13,200 12,660 10,148 12,896 11,660
Durum wheat
Arizona ....................... 90 74 34 89 73 33 California .................... 35 45 30 27 37 22 Idaho .......................... 25 11 5 24 11 5 Montana ..................... 890 840 550 785 775 515 North Dakota ............. 1,260 1,100 720 1,175 1,075 600 South Dakota 2 .......... 7 3 (NA) 6 3 (NA)
United States ............. 2,307 2,073 1,339 2,106 1,974 1,175
See footnote(s) at end of table.

I–8 GRAIN AND FEED
Table 1-8.—Wheat, by type: Area, yield, and production, by State and United States, 2017–2019—Continued
State Yield per harvested acre Production
2017 2018 2019 2017 2018 2019
Bushels 1,000 bushels
Winter wheat
Alabama ..................... 77.0 72.0 72.0 7,700 7,920 6,120 Arizona 2 .................... 100.0 40.0 (NA) 1,600 160 (NA) Arkansas .................... 52.0 55.0 52.0 6,500 5,225 2,600 California .................... 64.0 77.0 50.0 9,920 8,470 5,000 Colorado .................... 43.0 36.0 49.0 86,860 70,200 98,000 Delaware .................... 73.0 71.0 72.0 4,380 3,195 3,600 Florida 2 ..................... 37.0 36.0 (NA) 370 360 (NA) Georgia ...................... 47.0 54.0 56.0 3,290 3,780 2,800 Idaho .......................... 80.0 90.0 87.0 53,600 61,200 59,160 Illinois ......................... 76.0 66.0 67.0 35,720 36,960 36,850 Indiana ....................... 74.0 71.0 62.0 17,760 18,460 16,120 Iowa 2 ........................ 68.0 58.0 (NA) 544 348 (NA) Kansas ....................... 48.0 38.0 52.0 333,600 277,400 338,000 Kentucky .................... 77.0 66.0 76.0 23,870 19,800 25,080 Louisiana 2 ................. 46.0 65.0 (NA) 598 650 (NA) Maryland .................... 71.0 63.0 75.0 13,135 12,600 12,375 Michigan .................... 79.0 76.0 71.0 33,575 35,720 34,080 Minnesota 2 ............... 45.0 60.0 (NA) 225 300 (NA) Mississippi ................. 58.0 49.0 47.0 1,450 1,470 987 Missouri ..................... 68.0 59.0 63.0 36,720 30,680 24,570 Montana ..................... 42.0 50.0 50.0 66,780 78,500 95,000 Nebraska ................... 46.0 49.0 57.0 46,920 49,490 55,290 Nevada 2 .................... 107.0 120.0 (NA) 535 600 (NA) New Jersey ................ 64.0 62.0 66.0 1,088 930 924 New Mexico ............... 30.0 15.0 30.0 4,050 1,575 3,150 New York ................... 67.0 69.0 63.0 8,375 6,555 4,158 North Carolina ........... 55.0 57.0 56.0 20,625 21,090 12,600 North Dakota ............. 37.0 43.0 53.0 1,295 3,010 3,710 Ohio ........................... 74.0 75.0 56.0 34,040 33,750 21,560 Oklahoma .................. 34.0 28.0 40.0 98,600 70,000 110,000 Oregon ....................... 63.0 67.0 68.0 43,470 46,565 49,640 Pennsylvania ............. 72.0 65.0 73.0 10,800 9,425 10,220 South Carolina ........... 49.0 54.0 48.0 3,675 3,510 2,160 South Dakota ............. 40.0 48.0 52.0 20,800 31,680 40,040 Tennessee ................. 70.0 65.0 67.0 19,250 18,525 14,405 Texas ......................... 29.0 32.0 34.0 68,150 56,000 69,700 Utah ........................... 52.0 52.0 54.0 5,616 4,888 6,264 Virginia ....................... 66.0 60.0 62.0 9,570 9,300 6,510 Washington ................ 73.0 76.0 70.0 120,450 125,400 119,000 West Virginia 2 ........... 69.0 46.0 (NA) 276 138 (NA) Wisconsin .................. 68.0 71.0 64.0 11,560 14,200 9,600 Wyoming .................... 28.0 34.0 43.0 2,940 3,910 4,730
United States ............. 50.2 47.9 53.6 1,270,282 1,183,939 1,304,003
Other spring wheat
Colorado 2 ................. 82.0 76.0 (NA) 738 304 (NA) Idaho .......................... 85.0 95.0 89.0 35,275 42,275 39,160 Minnesota .................. 67.0 59.0 57.0 75,710 92,630 79,800 Montana ..................... 21.0 34.0 37.0 48,090 95,880 102,120 Nevada 2 .................... 105.0 100.0 (NA) 945 300 (NA) North Dakota ............. 41.0 49.0 49.0 207,050 318,010 291,550 Oregon 2 .................... 63.0 67.0 (NA) 4,599 5,025 (NA) South Dakota ............. 31.0 42.0 43.0 20,770 40,530 26,015 Utah 2 ........................ 52.0 52.0 (NA) 624 468 (NA) Washington ................ 45.0 54.0 47.0 22,050 27,810 23,735
United States ............. 41.0 48.3 48.2 415,851 623,232 562,380
Durum wheat
Arizona ....................... 101.0 106.0 104.0 8,989 7,738 3,432 California .................... 92.0 95.0 102.0 2,484 3,515 2,244 Idaho .......................... 77.0 85.0 87.0 1,848 935 435 Montana ..................... 16.0 30.0 43.0 12,560 23,250 22,145 North Dakota ............. 24.5 39.5 42.5 28,788 42,463 25,500 South Dakota 2 .......... 18.0 28.0 (NA) 108 84 (NA)
United States ............. 26.0 39.5 45.7 54,777 77,985 53,756
(NA) Not available. 1 Includes area planted preceding fall. 2 Estimates discontinued in 2019. NASS, Crops Branch, (202) 720–2127.

I–9 AGRICULTURAL STATISTICS 2020
Table 1-9.—Wheat: Support operations, United States, 2013–2019
Marketing year
beginning June 1
Income support
payment rates per bushel 1
Program price levels per bushel
Put under loan Acquired by
CCC under loan program 5
Owned by CCC at end of marketing
year Loan 2 Target/ Reference 3
Quantity Percentage of production 4
Million Million Million Dollars Dollars Dollars bushels Percent bushels bushels
2013/2014 ... 0.52/0.00 2.94 4.17 24.7 1.2 0 0 2014/2015 ... 0.00 2.94 5.50 43.1 2.1 0 0 2015/2016 ... 0.61 2.94 5.50 80.9 3.9 0 0 2016/2017 ... 1.61 2.94 5.50 150.7 6.5 0 .25 0 2017/2018 ... 0.85 2.94 5.50 44.7 2.6 0 0 2018/2019 ... 0.34 2.94 5.50 65.1 5.9 0 0 2019/2020 6 0.92 3.38 5.50 69.1 3.6 0 0
1 The first entry is the direct payment rate and the second entry is the counter-cyclical payment rate for 2013/2014. For 2013/2014, producers who participated in the Average Crop Revenue (ACRE) program got a 20 percent reduction in their di-rect payment, not calculated in this table. For 2014/2015 and after, the entry is the price loss coverage (PLC) payment rate. Agricultural Risk Coverage (ARC) is also available, but payment rates are established at the county or farm levels. 2 For 2013/2014, producers who participated in the ACRE program got a 30 percent reduction in their loan rate, not calculated in this table. 3 Target applies to 2013/2014 and Reference applies beginning with 2014/2015. 4 Percent of production is on a grain basis. 5 Acquisitions as of September 30, 2020. 6 2019/20 payment rate as of the July 31, 2020 NASS Agricultural Prices Report.
FPAC-BC, Commodity Analysis Branch.
Table 1-10.—Wheat: Marketing year average price and value, by State and United States, 2017–2019
State Marketing year average price per bushel Value of production
2017 2018 2019 1 2017 2018 2019 1
Dollars 1,000 dollars
Alabama ............... 4.60 4.95 5.05 35,420 39,204 30,906 Arizona ................ 7.06 7.01 6.55 70,822 55,038 22,480 Arkansas .............. 4.46 4.88 4.85 28,990 25,498 12,610 California .............. 5.42 6.39 6.10 67,730 76,413 44,336 Colorado .............. 3.88 4.61 3.95 339,873 324,789 387,100 Delaware .............. 4.63 4.90 4.95 20,279 15,656 17,820 Florida 2 ............... 4.00 4.40 (NA) 1,480 1,584 (NA) Georgia ................ 4.10 4.80 4.90 13,489 18,144 13,720 Idaho .................... 4.64 5.15 5.05 426,305 539,010 500,954 Illinois ................... 4.59 4.77 4.95 163,955 176,299 182,408 Indiana ................. 4.78 4.90 4.95 84,893 90,454 79,794 Iowa 2 .................. 3.90 4.75 (NA) 2,122 1,653 (NA) Kansas ................. 4.07 4.93 4.05 1,357,752 1,367,582 1,368,900 Kentucky .............. 4.68 5.19 5.25 111,712 102,762 131,670 Louisiana 2 ........... 4.20 5.10 (NA) 2,512 3,315 (NA) Maryland .............. 4.63 4.90 4.95 60,815 61,740 105,806 Michigan .............. 4.54 5.08 5.20 152,431 181,458 177,216 Minnesota ............ 5.76 5.25 4.70 438,062 487,796 375,060 Mississippi ........... 4.30 4.88 5.10 6,235 7,174 5,034 Missouri ............... 4.47 4.84 5.15 164,138 148,491 126,536 Montana ............... 5.34 5.24 4.65 695,891 1,041,736 1,022,114 Nebraska ............. 4.03 4.71 3.80 189,088 233,098 210,102 Nevada 2 .............. 4.70 5.18 (NA) 7,233 4,749 (NA) New Jersey .......... 4.60 4.90 4.95 5,005 4,557 4,574 New Mexico ......... 4.20 4.75 4.50 17,010 7,481 14,175 New York ............. 4.88 5.31 5.50 40,870 34,807 22,869 North Carolina ..... 4.70 4.80 5.30 96,938 101,232 66,780 North Dakota ....... 5.74 5.09 4.45 1,362,415 1,848,508 1,424,229 Ohio ..................... 4.90 5.08 5.25 166,796 171,450 113,190 Oklahoma ............ 3.98 5.10 4.30 392,428 357,000 473,000 Oregon ................. 5.16 5.80 5.70 245,537 298,465 282,948 Pennsylvania ....... 5.21 5.30 5.55 56,268 49,953 56,721 South Carolina ..... 4.20 4.70 5.25 15,435 16,497 11,340 South Dakota ....... 5.52 5.24 4.55 233,427 378,573 298,447 Tennessee ........... 4.60 5.24 5.45 88,550 97,071 78,507 Texas ................... 3.89 5.17 4.40 265,104 289,520 306,680 Utah ..................... 5.20 6.00 4.95 32,448 30,998 31,007 Virginia ................. 4.60 4.70 5.00 44,022 43,710 32,550 Washington .......... 4.85 5.51 5.55 690,902 844,592 790,976 West Virginia 2 ..... 4.70 4.90 (NA) 1,297 676 (NA) Wisconsin ............ 4.15 4.55 4.35 47,974 64,610 41,760 Wyoming .............. 3.90 4.75 3.90 11,466 18,573 18,447
United States ....... 4.72 5.16 4.55 8,255,119 9,661,916 8,882,766
(NA) Not available. 1 Preliminary. 2 Estimates discontinued in 2019. NASS, Crops Branch, (202) 720–2127.

I–10 GRAIN AND FEED
Table 1-11.—International Wheat: Area, yield, and production in specified countries, 2017/2018–2019/2020
Country
Area Yield per hectare Production
2017/ 2018
2018/ 2019
2019/ 2020
2017/ 2018
2018/ 2019
2019/ 2020
2017/ 2018
2018/ 2019
2019/ 2020
1,000 hectares Metric tons 1,000 metric tons
European Union ... 26,160 25,581 26,065 5.78 5.35 5.91 151,125 136,863 154,000 China ................... 24,508 24,268 23,730 5.48 5.42 5.63 134,334 131,430 133,590 India ..................... 30,785 29,651 29,319 3.20 3.37 3.53 98,510 99,870 103,600 Russia .................. 27,370 26,344 27,312 3.11 2.72 2.70 85,167 71,685 73,610 United States ....... 15,198 16,030 15,039 3.12 3.20 3.48 47,380 51,306 52,258 Canada ................ 8,983 9,881 9,660 3.38 3.26 3.35 30,377 32,201 32,350 Ukraine ................ 6,642 6,718 7,050 4.06 3.73 4.11 26,981 25,057 29,000 Pakistan ............... 9,050 8,800 8,798 2.94 2.85 2.91 26,600 25,100 25,600 Argentina ............. 5,800 6,050 6,500 3.19 3.22 3.00 18,500 19,500 19,500 Turkey .................. 7,800 7,615 7,200 2.69 2.50 2.50 21,000 19,000 18,000 Iran ....................... 6,700 6,700 6,700 2.09 2.16 2.51 14,000 14,500 16,800 Australia ............... 10,919 10,159 10,100 1.92 1.70 1.51 20,941 17,298 15,200 Kazakhstan .......... 11,912 11,354 11,339 1.24 1.23 1.01 14,802 13,947 11,452 Egypt .................... 1,320 1,320 1,370 6.40 6.40 6.40 8,450 8,450 8,770 Uzbekistan ........... 1,446 1,400 1,400 4.80 4.29 4.86 6,941 6,000 6,800 Brazil .................... 1,916 2,042 2,040 2.23 2.66 2.55 4,264 5,428 5,200 Afghanistan .......... 2,104 2,000 2,300 2.04 1.80 2.17 4,281 3,600 5,000 Ethiopia ................ 1,717 1,840 1,850 2.81 2.61 2.60 4,831 4,800 4,800 Iraq ....................... 2,200 1,700 2,400 1.82 1.77 2.00 4,000 3,000 4,800 Syria ..................... 1,100 1,100 1,600 2.00 1.82 3.00 2,200 2,000 4,800 Algeria .................. 1,600 2,074 2,100 1.50 1.90 1.91 2,400 3,940 4,000 Morocco ............... 3,321 2,850 2,750 2.14 2.58 1.46 7,091 7,340 4,000 Mexico ................. 667 540 593 5.24 5.56 5.42 3,494 3,000 3,215 Belarus ................. 718 660 750 3.65 2.75 3.83 2,620 1,815 2,875 Serbia .................. 540 648 580 4.26 4.63 4.48 2,300 3,000 2,600 Azerbaijan ............ 596 680 700 2.97 3.00 2.86 1,770 2,040 2,000 Nepal ................... 770 760 760 2.31 2.35 2.35 1,780 1,786 1,786 South Africa ......... 492 503 540 3.12 3.71 2.78 1,535 1,868 1,500 Tunisia ................. 579 536 620 1.91 2.00 2.42 1,104 1,070 1,500 Turkmenistan ....... 900 750 880 1.11 0.93 1.71 1,000 700 1,500 Chile ..................... 236 223 230 6.23 6.28 6.30 1,469 1,400 1,450 Bangladesh .......... 370 320 340 3.12 3.44 3.53 1,153 1,100 1,200 Moldova ............... 336 372 352 3.72 3.13 3.25 1,251 1,163 1,145 Paraguay ............. 510 485 480 2.00 2.80 2.38 1,020 1,360 1,140 Japan ................... 213 212 212 4.56 4.06 4.53 972 860 960 Tajikistan .............. 286 300 300 3.15 2.33 2.77 900 700 830 Uruguay ............... 186 198 230 2.37 3.68 3.30 440 728 760 Saudi Arabia ........ 2 87 120 5.00 5.75 5.83 10 500 700 Sudan .................. 168 200 200 2.76 2.98 3.00 463 595 600 Kyrgyzstan ........... 250 300 280 2.40 2.05 2.11 601 616 590 Switzerland .......... 90 90 90 6.00 6.00 6.00 540 540 540 Norway ................. 76 58 80 5.28 2.19 5.25 401 127 420 New Zealand ....... 41 42 45 9.88 8.81 9.11 405 370 410 Mongolia .............. 366 342 327 0.63 1.28 1.10 231 436 360 Albania ................. 68 75 72 4.04 4.13 4.17 275 310 300 Macedonia ........... 73 71 80 2.74 3.39 3.75 200 241 300 Bosnia and
Herzegovina ..... 65 73 71 4.45 4.00 4.01 289 292 285 Bolivia .................. 200 150 200 1.51 1.20 1.40 302 180 280 Peru ..................... 128 127 130 1.50 1.54 1.62 192 195 210 Kenya ................... 86 170 125 1.92 2.12 1.60 165 360 200 Libya .................... 165 165 165 1.21 1.21 1.21 200 200 200 Armenia ............... 81 66 60 2.17 2.83 3.00 176 187 180 Zambia ................. 27 22 24 7.19 5.18 6.33 194 114 152 Lebanon ............... 39 40 41 3.33 3.25 3.42 130 130 140 Yemen ................. 100 100 90 1.50 1.40 1.56 150 140 140 Burma .................. 87 85 65 1.55 1.53 1.54 135 130 100 Georgia ................ 44 43 40 2.23 2.49 2.50 98 107 100 Tanzania .............. 102 100 100 1.00 1.00 1.00 102 100 100 Zimbabwe ............ 44 56 25 3.59 3.57 4.00 158 200 100
FAS, Office of Global Analysis, (202) 720-6301. Prepared or estimated on the basis of official USDA production, supply, and distribution statistics from foreign governments.

I–11 AGRICULTURAL STATISTICS 2020
Table 1-12.—Wheat and flour: United States imports, 2010–2019
Year beginning
June All wheat grain All wheat flour 1 All wheat products 2 Total all wheat 3
1,000 bushels 1,000 bushels 4 1,000 bushels 4 1,000 bushels
2010 ..................... 69,053 11,283 16,582 96,918 2011 ..................... 84,382 10,666 18,068 113,116 2012 ..................... 96,103 10,151 18,063 124,317 2013 ..................... 141,665 11,535 19,267 172,467 2014 ..................... 116,973 14,332 19,944 151,249 2015 ..................... 76,433 15,822 20,470 112,725 2016 ..................... 83,849 14,574 19,717 118,140 2017 ..................... 120,746 16,814 20,424 157,984 2018 ..................... 97,657 17,016 19,959 134,633 2019 ..................... 65,345 17,095 22,569 105,009
1 Includes meal, groats, and durum. 2 Includes bulgur, couscous, and selected categories of pasta. 3 Totals may not add due to rounding. 4 Expressed in grain-equivalent bushels.
ERS, Market and Trade Economics Division, (202) 694–5285. Data as of September 21, 2020.
Table 1-13.—Wheat: International trade, 2017/2018–2019/2020
Country 2017/2018 2018/2019 2019/2020
1,000 metric tons 1,000 metric tons 1,000 metric tons Principle importing countries:
Egypt ...................................................... 12,407 12,347 12,500 Indonesia ................................................ 10,763 10,934 11,000 Turkey .................................................... 6,043 6,366 10,500 Brazil ...................................................... 7,021 7,020 7,500 Philippines .............................................. 6,059 7,546 7,300 Algeria .................................................... 8,172 7,515 6,500 Bangladesh ............................................ 6,472 5,100 6,500 Japan ...................................................... 5,876 5,726 5,900 Mexico .................................................... 5,245 4,861 5,200 Nigeria .................................................... 5,162 4,585 5,100 European Union ..................................... 5,824 5,762 4,800 Morocco .................................................. 3,676 3,724 4,800 Korea, South .......................................... 4,269 3,908 4,100 China ...................................................... 3,937 3,145 4,000 Yemen .................................................... 3,010 3,675 3,800 Vietnam .................................................. 4,709 3,149 3,500 Thailand .................................................. 3,173 2,899 3,300 Saudi Arabia ........................................... 3,449 2,898 3,200 Afghanistan ............................................ 3,300 3,700 3,000 Uzbekistan .............................................. 3,119 2,837 3,000 United States .......................................... 4,301 3,674 2,858 Sudan ..................................................... 2,580 2,222 2,600 Iraq ......................................................... 4,158 3,915 2,500 Kenya ..................................................... 2,158 2,000 2,300 Peru ........................................................ 2,030 2,109 2,100
Principle exporting countries: Russia .................................................... 41,431 35,838 35,000 United States .......................................... 23,383 23,310 32,000 Canada ................................................... 24,655 25,477 27,216 European Union ..................................... 22,000 24,404 23,000 Ukraine ................................................... 17,775 16,019 20,500 Argentina ................................................ 12,730 12,188 13,500 Australia ................................................. 13,849 9,006 8,000 Kazakhstan ............................................. 6,194 6,350 6,800 Turkey .................................................... 9,000 8,296 6,000 Pakistan .................................................. 1,004 1,006 1,100 Serbia ..................................................... 1,147 526 1,100 China ...................................................... 781 1,090 900 Brazil ...................................................... 840 1,078 700 Moldova .................................................. 230 602 600 Paraguay ................................................ 650 410 600 Egypt ...................................................... 656 600 600 Mexico .................................................... 230 538 550 India ........................................................ 569 496 500 Iran ......................................................... 1,206 1,965 500 Nigeria .................................................... 400 400 400 Egypt ...................................................... 318 274 300 Mexico .................................................... 292 293 300 India ........................................................ 44 325 300 Iran ......................................................... 277 286 280 Nigeria .................................................... 257 275 275
FAS, Office of Global Analysis, (202) 720-6301. Prepared or estimated on the basis of official USDA production, supply, and distribution statistics from foreign governments.

I–12 GRAIN AND FEED
Table 1-14.—Wheat and flour: United States exports by country of destination, 2017–2019
Country of destination Year
2017 2018 2019
Metric tons Metric tons Metric tons
Wheat: Mexico ................................................ 3,698,250 2,802,765 3,547,379 Philippines .......................................... 2,447,963 2,644,825 2,925,508 Japan .................................................. 3,049,192 2,860,604 2,578,881 Nigeria ................................................ 1,638,036 814,014 2,112,984 Korea, South ....................................... 1,554,669 1,533,432 1,265,940 Taiwan ................................................ 1,091,326 983,300 1,263,598 Indonesia ............................................ 1,492,946 779,435 1,263,598 Egypt ................................................... 180,349 120,672 827,885 Italy(*) ................................................. 411,961 485,893 749,096 Yemen(*) ............................................. 442,004 480,893 739,849 Thailand .............................................. 735,769 696,252 669,581 Colombia ............................................. 833,326 407,750 646,350 Guatemala .......................................... 537,856 547,946 590,410 Algeria ................................................. 840,476 307,864 565,918 Malaysia .............................................. 224,883 191,605 496,407 Iraq ...................................................... 256,404 882,123 472,469 Peru .................................................... 488,441 241,716 466,879 Ecuador .............................................. 289,191 266,703 428,658 Brazil ................................................... 286,837 266,462 416,427 Chile .................................................... 328,770 297,856 374,240 Dominican Republic ............................ 368,341 291,581 308,326 Ethiopia(*) ........................................... 321,720 218,500 304,277 Honduras ............................................ 231,985 326,588 298,535 Vietnam ............................................... 115,071 277,097 297,534 El Salvador ......................................... 317,902 278,781 267,562 China .................................................. 1,514,399 396,987 236,062 Bangladesh ......................................... 308,155 449,751 225,973 Jamaica .............................................. 179,086 194,670 208,377 Canada ............................................... 50,751 65,126 155,127 South Africa ........................................ 128,868 33,283 153,919 Rest of World ...................................... 2,805,708 2,100,517 2,044,556
World Total ......................................... 27,170,635 22,244,480 26,871,465
Wheat flour: Mexico ................................................ 181,521 195,588 201,996 Canada ............................................... 93,358 53,654 51,768 Djibouti ................................................ 1,254 1,071 3,033 Bahamas, The .................................... 2,133 2,057 2,530 Dominican Republic ............................ 2,637 2,019 2,187 Netherlands Antilles(*) ........................ 2,166 2,157 2,178 Malaysia .............................................. 1,100 1,325 2,099 Sweden ............................................... 1,730 1,763 1,858 Leeward-Windward Islands(*) ............. 839 1,015 1,144 Trinidad and Tobago .......................... 804 1,126 1,119 Panama .............................................. 602 503 892 Barbados ............................................ 796 763 649 China .................................................. 1,204 571 593 Korea, South ....................................... 1,343 276 531 United Arab Emirates ......................... 1,089 983 491 Haiti ..................................................... 0 0 423 Japan .................................................. 744 487 417 New Zealand(*) ................................... 584 405 406 Colombia ............................................. 111 340 390 Taiwan ................................................ 148 182 380 Brazil ................................................... 347 472 371 Guatemala .......................................... 405 585 367 Turks and Caicos Islands ................... 266 368 331 Netherlands ........................................ 199 219 268 Cayman Islands .................................. 165 175 213 Micronesia .......................................... 370 223 204 Jamaica .............................................. 144 280 200 Venezuela ........................................... 114 41 184 Palau ................................................... 170 168 183 Saudi Arabia ....................................... 103 146 180 Rest of World ...................................... 2,463 7,502 1,915
World Total ......................................... 298,906 276,464 279,498
(*) Denotes a country that is a summarization of its component countries. FAS, Office of Global Analysis, (202) 720-6301. Prepared or estimated on the basis of official USDA production, supply,
and distribution, supply, and distribution statistics from foreign governments.

I–13 AGRICULTURAL STATISTICS 2020
Table 1-15.—Rye: Area, yield, production, disposition, and value, United States, 2010–2019
Year
Area Yield per harvested
acre Production
Marketing year average price
per bushel received by
farmers 2
Value of production 2 Planted 1 Harvested
1,000 acres 1,000 acres Bushels 1,000 bushels Dollars 1,000 dollars
2010 ............... 1,256 270 27.7 7,480 5.18 38,767 2011 ............... 1,227 239 25.3 6,051 7.81 47,250 2012 ............... 1,271 250 26.2 6,542 7.69 50,304 2013 ............... 1,451 278 27.4 7,626 7.95 60,598 2014 ............... 1,434 258 27.9 7,189 7.74 55,639 2015 ............... 1,584 365 31.8 11,616 6.50 75,497 2016 ............... 1,891 411 32.5 13,337 5.12 68,343 2017 ............... 1,961 300 34.2 10,252 4.70 48,180 2018 ............... 2,011 273 30.9 8,432 6.27 52,870 2019 ............... 1,865 310 34.3 10,622 6.11 64,863
1 Area planted in preceding fall. 2 2018 data is preliminary. NASS, Crops Branch, (202) 720–2127.
Table 1-16.—Rye: Supply and disappearance, United States, 2010–2019
Year begin-ning June
Supply Disappearance
Ending stocks May 31
Begin-ning
stocks
Produc-tion Imports Total
Domestic use
Exports
Total dis-
appear-ance 2 Food Seed Indus-
try 1 Residual
use Total
1,000 bushels
2010 .. 932 7,480 5,552 13,964 3,300 3,000 3,000 3,714 13,014 149 13,163 801 2011 .. 801 6,051 5,994 12,846 3,310 3,000 3,010 2,917 12,237 157 12,394 452 2012 .. 452 6,542 8,966 15,960 3,400 3,000 3,020 5,829 15,249 310 15,559 401 2013 .. 401 7,626 9,213 17,240 3,430 3,000 3,030 7,227 16,687 268 16,955 285 2014 .. 285 7,189 9,320 16,794 3,460 3,000 3,040 6,465 15,965 240 16,205 589 2015 .. 589 11,616 8,757 20,962 3,630 3,000 3,050 10,646 20,326 181 20,507 455 2016 .. 455 13,337 6,586 20,378 3,500 6,168 4,110 5,727 19,505 175 19,680 698 2017 .. 698 10,252 8,825 19,775 3,530 5,445 4,250 5,800 19,025 157 19,182 593 2018 .. 593 8,432 11,964 20,989 3,550 6,982 3,890 6,000 20,422 148 20,570 419 2019 .. 419 10,622 11,899 22,940 3,570 7,285 4,680 6,100 21,635 205 21,840 1,100
1 Includes commercial adhesives, packaging materials, thatching, mattresses, hats, and paper. 2 Totals may not add due to independent rounding.
ERS, Market and Trade Economics Division, (202) 694–5302.

I–14 GRAIN AND FEED
Table 1-17.—Rye: Area, yield, and production, by State and United States, 2017–2019
State Area planted 1 Area harvested
2017 2018 2019 2017 2018 2019
1,000 acres 1,000 acres 1,000 acres 1,000 acres 1,000 acres 1,000 acres
Georgia .................. 210 190 (D) 25 15 (D) Minnesota .............. (D) (D) 50 (D) (D) 18 North Dakota ......... (D) (D) 85 (D) (D) 57 Oklahoma .............. 260 240 260 45 50 55 Pennsylvania ......... (D) (D) 100 (D) (D) 14 Wisconsin .............. (D) (D) 220 (D) (D) 20 Other States 2 ........ 1,491 1,581 1,150 230 208 146
United States ......... 1,961 2,011 1,865 300 273 310
State Yield per harvested acre Production
2017 2018 2019 2017 2018 2019
Bushels Bushels Bushels 1,000 bushels 1,000 bushels 1,000 bushels
Georgia .................. 19.0 26.0 (D) 475 390 (D) Minnesota .............. (D) (D) 39.0 (D) (D) 702 North Dakota ......... (D) (D) 45.0 (D) (D) 2,565 Oklahoma .............. 24.0 22.0 27.0 1,080 1,100 1,485 Pennsylvania ......... (D) (D) 26.0 (D) (D) 364 Wisconsin .............. (D) (D) 34.0 (D) (D) 680 Other States 2 ........ 37.8 33.4 33.1 8,697 6,942 4,826
United States ......... 34.2 30.9 34.3 10,252 8,432 10,622
(D) Withheld to avoid disclosing data for individual operations. 1 Includes area planted preceding fall. 2 In 2017 and 2018, Other States include Illinois, Kansas, Maine, Maryland, Michigan, Minnesota, Nebraska, New Jersey, New York, North Caro-lina, North Dakota, Pennsylvania, South Carolina, South Dakota, Texas, Virginia, and Wisconsin. Beginning in 2019, Other States include Georgia, Illinois, Kansas, Michigan, Nebraska, New York, North Carolina, South Dakota, and Texas.
NASS, Crops Branch, (202) 720–2127.
Table 1-18.—Rye: Marketing year average price and value, by State and United States, 2017–2019
State Marketing year average price per bushel Value of production
2017 2018 2019 1 2017 2018 2019 1
Dollars Dollars Dollars 1,000 dollars 1,000 dollars 1,000 dollars
Georgia ................ 5.10 7.05 (D) 2,423 2,750 (D) Minnesota ............ (D) (D) 5.50 (D) (D) 3,861 North Dakota ....... (D) (D) 4.55 (D) (D) 11,671 Oklahoma ............ 5.05 7.55 8.20 5,454 8,305 12,177 Pennsylvania ....... (D) (D) 5.90 (D) (D) 2,148 Wisconsin ............ (D) (D) 7.00 (D) (D) 4,760 Other States 2 ...... 4.63 6.02 6.27 40,303 41,815 30,246
United States ....... 4.70 6.27 6.11 48,180 52,870 64,863
(D) Withheld to avoid disclosing data for individual operations. 1 Preliminary. 2 In 2017 and 2018, Other States include Illi-nois, Kansas, Maine, Maryland, Michigan, Minnesota, Nebraska, New Jersey, New York, North Carolina, North Dakota, Pennsylvania, South Carolina, South Dakota, Texas, Virginia, and Wisconsin. Beginning in 2019, Other States include Geor-gia, Illinois, Kansas, Michigan, Nebraska, New York, North Carolina, South Dakota, and Texas.
NASS, Crops Branch, (202) 720-2127.

I–15 AGRICULTURAL STATISTICS 2020
Table 1-19.—International Rye: Area, yield, and production in specified countries, 2017/2018–2019/2020
Country
Area Yield Production
2017/ 2018
2018/ 2019
2019/ 2020
2017/ 2018
2018/ 2019
2019/ 2020
2017/ 2018
2018/ 2019
2019/ 2020
1,000 hectares Metric tons per hectare 1,000 metric tons
European Union ... 1,931 1,920 2,070 3.84 3.23 3.84 7,405 6,208 7,950 Russia .................. 1,171 957 823 2.17 2.00 1.73 2,540 1,914 1,424 Belarus ................. 256 252 200 2.62 2.00 3.25 670 503 650 Ukraine ................ 172 149 110 2.97 2.66 3.09 510 396 340 Canada ................ 101 79 100 3.39 2.99 3.30 342 236 330 Turkey .................. 101 110 110 3.17 2.91 2.91 320 320 320 United States ....... 121 110 125 2.15 1.95 2.16 260 214 270 Argentina ............. 45 49 56 1.91 1.78 2.14 86 87 120 Norway ................. 9 3 9 5.56 3.00 5.56 50 9 50 Australia ............... 40 44 44 0.75 0.68 0.68 30 30 30 Kazakhstan .......... 31 22 23 1.26 1.05 1.00 39 23 23 Bosnia and
Herzegovina ..... 3 4 4 3.67 2.75 3.50 11 11 14 Switzerland .......... 2 2 2 5.50 5.50 5.50 11 11 11 Serbia .................. 4 4 4 2.50 2.50 2.50 10 10 10 Macedonia ........... 4 4 4 2.00 2.25 2.00 8 9 8 Brazil .................... 4 4 4 1.50 2.00 1.75 6 8 7 Chile ..................... 1 1 1 5.00 5.00 5.00 5 5 5 Albania ................. 1 1 1 3.00 3.00 3.00 3 3 3 South Africa ......... 20 20 20 0.15 0.15 0.15 3 3 3
FAS, Office of Global Analysis, (202) 720-6301. Prepared or estimated on the basis of official USDA production, supply, and distribution, supply, and distribution statistics from foreign governments.
Table 1-20.—Rye: 1 International trade, 2017/2018–2019/2020 2
Country 2017/2018 2018/2019 2019/2020
1,000 metric tons 1,000 metric tons 1,000 metric tons Principle exporting countries:
European Union ..................................... 81 195 200 Canada ................................................... 193 144 150 Ukraine ................................................... 38 88 30 Russia .................................................... 71 283 25 United States .......................................... 4 4 5
Principle importing countries:
United States .......................................... 224 304 305 European Union ..................................... 61 298 25 Israel ....................................................... 21 15 20 Japan ...................................................... 21 23 20 Belarus ................................................... 15 21 10 Korea, South .......................................... 3 3 5 Norway ................................................... 4 18 5 Canada ................................................... 1 2 2 Switzerland ............................................. 2 2 2 Bosnia and Herzegovina ........................ 1 1 1 Ukraine ................................................... 0 2 1 ................................................................. ........................................ ........................................ ........................................
1 Flour and products reported in terms of grain equivalent. 2 Year beginning July 1. FAS, Office of Global Analysis, (202) 720-6301. Prepared or estimated on the basis of official USDA production, supply,
and distribution statics from foreign governments.

I–16 GRAIN AND FEED
Table 1-21.—Rice, rough: Area, yield, production, and value, United States, 2010–2019
Year Area planted Area harvested Yield per acre Production
Marketing year average price
per cwt. received
by farmers
Value of production
1,000 acres 1,000 acres Pounds 1,000 cwt Dollars 1,000 dollars
2010 ............... 3,636 3,615 6,725 243,104 12.70 3,183,213 2011 ............... 2,689 2,617 7,067 184,941 14.50 2,737,423 2012 ............... 2,700 2,679 7,463 199,939 15.10 3,067,365 2013 ............... 2,490 2,463 7,694 189,500 16.30 3,175,107 2014 ............... 2,954 2,933 7,576 222,215 13.40 3,075,618 2015 ............... 2,625 2,584 7,472 193,080 12.20 2,421,111 2016 ............... 3,150 3,097 7,237 224,145 10.40 2,384,690 2017 ............... 2,463 2,374 7,507 178,228 12.90 2,360,439 2018 ............... 2,946 2,910 7,692 223,833 12.60 2,903,041 2019 ............... 2,540 2,472 7,471 184,675 13.00 2,459,035
NASS, Crops Branch, (202) 720–2127.
Table 1-22.—Rice, rough: Stocks on and off farms, United States, 2010–2019
Year beginning previous
December
On farms Off farms 1
Dec. 1 Mar. 1 Aug. 1 Dec. 1 Mar. 1 Aug. 1
1,000 cwt
2010 ........................... 51,880 23,465 1,200 104,726 80,516 29,176 2011 ........................... 63,617 33,895 3,772 109,869 86,720 37,917 2012 ........................... 41,180 23,825 910 105,689 82,666 35,052 2013 ........................... 39,385 18,430 640 108,650 85,839 29,880 2014 ........................... 36,935 14,995 305 96,636 73,959 26,299 2015 ........................... 47,865 25,810 1,480 110,061 86,658 41,293 2016 ........................... 43,245 18,255 3,762 101,804 90,507 34,983 2017 ........................... 48,595 21,600 4,693 111,734 85,969 34,077 2018 ........................... 31,570 12,565 1,902 88,104 70,831 21,962 2019 ........................... 40,115 23,305 6,663 98,602 80,515 31,927
1 Stocks at mills and in attached warehouses, in warehouses not attached to mills, and in ports or in transit. NASS, Crops Branch, (202) 720–2127.
Table 1-23.—Rice, by length of grain: Harvest, yield, and production, United States, 2010–2019
Year
Area harvested Yield per acre Production
Long grain
Medium grain
Short grain
Long grain
Medium grain
Short grain
Long grain
Medium grain
Short grain
1,000 1,000 1,000 1,000 1,000 1,000 acres acres acres Pounds Pounds Pounds cwt cwt cwt
2010 ................ 2,826 746 43 6,486 7,660 6,195 183,296 57,144 2,664 2011 ................ 1,739 834 44 6,691 7,861 6,880 116,352 65,562 3,027 2012 ................ 1,979 643 57 7,291 8,059 6,737 144,280 51,819 3,840 2013 ................ 1,762 654 47 7,464 8,385 6,685 131,896 54,840 3,142 2014 ................ 2,196 700 37 7,407 8,175 6,292 162,665 57,222 2,328 2015 ................ 1,848 698 38 7,219 8,162 7,121 133,401 56,973 2,706 2016 ................ 2,403 651 43 6,927 8,377 7,319 166,465 54,533 3,147 2017 ................ 1,748 587 39 7,314 8,155 6,438 127,850 47,867 2,511 2018 ................ 2,176 693 41 7,517 8,274 7,112 163,578 57,339 2,916 2019 ................ 1,730 708 34 7,261 8,004 7,047 125,610 56,669 2,396
NASS, Crops Branch, (202) 720-2127.

I–17 AGRICULTURAL STATISTICS 2020
Table 1-24.—Rice, rough, by length of grain: Stocks in all positions, United States, 2010–2019
Year beginning previous
December Dec. 1 Mar. 1 Jun. 1 Aug. 1 Oct. 1 1
1,000 cwt
Long grain
2010 ................ 103,430 67,910 37,041 19,532 (2) 2011 ................ 123,521 86,864 54,636 32,847 (2) 2012 ................ 93,027 68,469 37,552 22,034 (2) 2013 ................ 99,111 69,313 (NA) 19,439 (2) 2014 ................ 84,738 56,125 31,622 14,010 (2) 2015 ................ 106,786 71,243 42,295 23,917 (2) 2016 ................ 91,814 66,307 36,305 19,801 (2) 2017 ................ 106,700 71,636 47,199 28,198 (2) 2018 ................ 81,250 57,863 31,903 17,431 (2) 2019 ................ 95,679 71,492 46,335 29,146 (2)
Medium grain
2010 ................ 49,264 33,395 18,344 9,527 3,053 2011 ................ 46,853 31,548 15,327 7,870 1,366 2012 ................ 50,935 35,978 20,272 12,983 1,870 2013 ................ 45,349 32,558 (NA) 10,057 2,029 2014 ................ 45,497 30,491 17,294 11,631 6,691 2015 ................ 48,483 39,505 27,988 18,169 7,892 2016 ................ 50,582 40,718 26,960 18,347 3,732 2017 ................ 50,547 33,644 17,612 9,878 3,180 2018 ................ 35,376 23,512 11,901 5,561 546 2019 ................ 40,000 30,178 15,829 8,564 1,660
Short grain
2010 ................ 3,912 2,676 2,023 1,317 (2) 2011 ................ 3,112 2,203 1,410 972 (2) 2012 ................ 2,907 2,044 1,282 945 (2) 2013 ................ 3,575 2,398 (NA) 1,024 (2) 2014 ................ 3,336 2,348 1,435 963 (2) 2015 ................ 2,657 1,720 1,057 687 (2) 2016 ................ 2,653 1,737 999 597 (2) 2017 ................ 3,082 2,289 1,533 694 (2) 2018 ................ 3,048 2,021 1,246 872 (2) 2019 ................ 3,038 2,150 1,377 880 (2)
(NA) Not available. 1 California only. 2 Not published to avoid disclosing individual reports. NASS, Crops Branch, (202) 720–2127.
Table 1-25.—Rough and milled rice (rough equivalent): Supply and disappearance, United States, 2009–2018 1
Year begin-ning
August
Supply Disappearance Ending stocks July 31 Beginning
stocks Produc-
tion Imports Total Food, in-dustrial, & residual 2
Seed Total Exports Total dis-appear-
ance
Million cwt
2009 ... 30.4 219.9 19.0 269.3 121.3 3.1 124.4 108.4 232.8 36.5 2010 ... 36.5 243.1 18.3 297.9 134.5 2.4 136.9 112.6 249.5 48.5 2011 ... 48.5 184.9 19.4 252.8 108.4 2.4 110.8 100.9 211.7 41.1 2012 ... 41.1 199.9 21.1 262.1 116.9 2.2 119.0 106.6 225.7 36.4 2013 ... 36.4 189.5 23.1 249.0 121.5 2.4 123.9 93.3 217.2 31.8 2014 ... 31.8 222.2 24.6 278.7 131.8 2.1 133.9 96.3 230.2 48.5 2015 ... 48.5 193.1 24.1 265.7 109.8 2.5 112.3 107.0 219.3 46.5 2016 ... 46.5 224.1 23.5 294.1 131.3 2.0 133.2 114.8 248.0 46.0 2017 ... 46.0 178.2 26.9 251.2 132.5 2.3 134.8 87.0 221.8 29.4 2018 3 29.4 224.2 29.0 282.6 (NA) (NA) 135.0 98.0 233.0 49.6
(NA) Not available. 1 Consolidated supply and disappearance of rough and milled rice. Milled rice data converted to a rough basis using annually derived extraction rates as factors. 2 The residual includes unaccounted losses in transporting, processing, and marketing. 3 Projected as of March 8, 2019.
ERS, Market and Trade Economics Division, (202) 694–5292. Sources: USDA, ERS using data from USDA, National Agricultural Statistics Service, Quick Stats and USDA, World Agricultural Outlook Board, World Agricultural Supply and De-mand Estimates report.

I–18 GRAIN AND FEED
Table 1-26.—Rice, by length of grain: Area, yield, and production, by State and United States, 2017–2019
State Area harvested Yield per acre Production
2017 2018 2019 2017 2018 2019 2017 2018 2019
Long grain
1,000 1,000 1,000 1,000 1,000 1,000 acres acres acres Pounds Pounds Pounds cwt cwt cwt
Arkansas ........ 955 1,240 935 7,510 7,550 7,550 71,721 93,620 70,593 California ....... 7 11 10 7,400 6,000 7,300 518 660 730 Louisiana ....... 366 392 361 6,720 7,160 6,380 24,595 28,067 23,032 Mississippi ..... 114 139 111 7,400 7,350 7,350 8,436 10,217 8,159 Missouri ......... 151 211 166 7,460 7,760 7,360 11,265 16,374 12,218 Texas ............. 155 183 147 7,300 8,000 7,400 11,315 14,640 10,878
United States 1,748 2,176 1,730 7,314 7,517 7,261 127,850 163,578 125,610
Medium grain
1,000 1,000 1,000 1,000 1,000 1,000 acres acres acres Pounds Pounds Pounds cwt cwt cwt
Arkansas ........ 148 181 190 7,340 7,330 7,160 10,863 13,267 13,604 California ....... 398 453 453 8,620 8,810 8,580 34,308 39,909 38,867 Louisiana ....... 29 44 53 6,580 6,880 6,370 1,908 3,027 3,376 Mississippi ..... - - 2 (X) (X) 7,150 - - 143 Missouri ......... 9 9 7 7,060 7,950 7,550 635 716 529 Texas ............. 3 6 3 5,100 7,000 5,000 153 420 150
United States 587 693 708 8,155 8,274 8,004 47,867 57,339 56,669
Short grain 1
1,000 1,000 1,000 1,000 1,000 1,000 acres acres acres Pounds Pounds Pounds cwt cwt cwt
Arkansas ........ 1 1 1 6,000 6,000 6,000 60 60 60 Calfornia ........ 38 40 33 6,450 7,140 7,080 2,451 2,856 2,336
United States 39 41 34 6,438 7,112 7,047 2,511 2,916 2,396
- Represents zero. (X) Not applicable. 1 Sweet rice acreage included with short grain. NASS, Crops Branch, (202) 720–2127.
Table 1-27.—Rice: Area, yield, and production, by State and United States, 2017–2019
State Area planted Area harvested
2017 2018 2019 2017 2018 2019
1,000 1,000 1,000 1,000 1,000 1,000 acres acres acres acres acres acres
Arkansas ................ 1,161 1,441 1,156 1,104 1,422 1,126 California ................ 445 506 498 443 504 496 Louisiana ............... 400 440 425 395 436 414 Mississippi ............. 115 140 117 114 139 113 Missouri ................. 169 224 187 160 220 173 Texas ..................... 173 195 157 158 189 150
United States ......... 2,463 2,946 2,540 2,374 2,910 2,472
State Yield per harvested acre Production
2017 2018 2019 2017 2018 2019
1,000 1,000 1,000 Pounds Pounds Pounds cwt cwt cwt
Arkansas ................ 7,490 7,520 7,480 82,644 106,947 84,257 California ................ 8,410 8,620 8,450 37.277 43,425 41,933 Louisiana ............... 6,710 7,130 6,380 26,503 31,094 26,408 Mississippi ............. 7,400 7,350 7,350 8,436 10,217 8,302 Missouri ................. 7,440 7,770 7,370 11,900 17,090 12,747 Texas ..................... 7,260 7,970 7,350 11,468 15,060 11,028
United States ......... 7,507 7,692 7,471 178,228 223,833 184,675
NASS, Crops Branch, (202) 720–2127.

I–19 AGRICULTURAL STATISTICS 2020
Table 1-28.—Rice: Marketing year average price and value, by State and United States, 2017–2019
State Marketing year average price per cwt. Value of production
2017 2018 2019 1 2017 2018 2019 1
Dollars Dollars Dollars 1,000 dollars 1,000 dollars 1,000 dollars
Arkansas ........ 11.10 10.70 11.70 917,348 1,148,378 985,807 California ........ 20.30 21.30 18.50 756,723 924,953 775,761 Louisiana ....... 11.70 11.20 11.70 310,085 348,253 308,974 Mississippi ..... 11.50 10.80 11.50 97,014 110,344 95,473 Missouri ......... 12.00 10.70 12.00 142,800 182,863 152,964 Texas ............. 11.90 12.50 12.70 136,469 188,250 140,056
United States 12.90 12.60 13.00 2,360,439 2,903,041 2,459,035
1 Preliminary. NASS, Crops Branch, (202) 720–2127.
Table 1-29.—Rice, milled, by length of grain: Stocks in all positions, United States, 2010–2019
Year beginning previous
December
Whole kernels (head rice)
Dec. 1 Mar. 1 Jun. 1 Aug. 1 Oct.. 1 1
Long grain
1,000 cwt 1,000 cwt 1,000 cwt 1,000 cwt 1,000 cwt
2010 ................ 2,022 2,370 2,043 2,511 (2) 2011 ................ 2,665 3,038 3,291 1,924 (2) 2012 ................ 2,699 1,856 1,906 1,550 1 2013 ................ 2,574 3,144 (NA) 1,704 (2) 2014 ................ 3,348 2,379 (3) 1,556 (2) 2015 ................ 2,308 1,952 2,523 1,792 (2) 2016 ................ 2,716 2,616 3,463 2,022 (2) 2017 ................ 2,453 2,659 2,056 1,969 (2) 2018 ................ 2,307 1,717 2,633 2,026 (2) 2019 ................ 2,037 1,657 2,451 2,422 (2)
Medium grain
1,000 cwt 1,000 cwt 1,000 cwt 1,000 cwt 1,000 cwt
2010 ................ 1,496 1,472 1,188 799 454 2011 ................ 1,743 1,803 981 845 399 2012 ................ 1,406 935 1,041 496 281 2013 ................ 1,638 772 (NA) 726 (2) 2014 ................ 1,285 1,584 1,601 472 603 2015 ................ 1,694 1,139 1,662 878 1,430 2016 ................ 1,279 1,459 1,030 1,324 389 2017 ................ 1,017 971 1,292 609 388 2018 ................ 1,220 1,317 909 804 (2) 2019 ................ 988 1,057 748 466 281
Short grain
1,000 cwt 1,000 cwt 1,000 cwt 1,000 cwt 1,000 cwt
2010 ................ 73 74 47 60 (2) 2011 ................ 97 62 53 45 (2) 2012 ................ 199 49 60 38 69 2013 ................ 99 64 (NA) 61 28 2014 ................ 58 48 (2) 47 (2) 2015 ................ 51 59 54 37 (2) 2016 ................ 75 62 41 40 (2) 2017 ................ 65 75 101 45 (2) 2018 ................ 62 62 56 43 (2) 2019 ................ 78 48 42 52 (2)
See footnote(s) at end of table.

I–20 GRAIN AND FEED
Table 1-29.—Rice, milled, by length of grain: Stocks in all positions, United States, 2010–2019—Continued
Year beginning previous
December
Broken kernels
Dec. 1 Mar. 1 Jun. 1 Aug. 1 Oct. 1 1
Second heads
1,000 cwt 1,000 cwt 1,000 cwt 1,000 cwt 1,000 cwt
2010 ................ 1,374 707 961 670 (2) 2011 ................ 888 634 817 992 (2) 2012 ................ 1,037 1,021 778 870 (2) 2013 ................ 1,231 1,225 (NA) 1,104 (2) 2014 ................ 1,243 1,064 1,159 797 (2) 2015 ................ 727 1,663 1,227 1,120 (2) 2016 ................ 1,385 1,550 1,634 1,436 (2) 2017 ................ 1,777 1,924 1,222 1,588 (2) 2018 ................ 1,968 1,559 887 566 (2) 2019 ................ 676 1,046 665 701 (2)
Screenings 3
1,000 cwt 1,000 cwt 1,000 cwt 1,000 cwt 1,000 cwt 2010 ................ 52 20 34 93 ...............................2011 ................ 110 91 153 75 ...............................2012 ................ 192 82 145 51 ...............................2013 ................ 136 271 (NA) 153 ...............................2014 ................ 96 118 72 92 ...............................2015 ................ 118 115 153 88 ...............................2016 ................ 56 61 70 33 ...............................2017 ................ 82 81 76 84 ...............................2018 ................ 107 118 205 138 ...............................2019 ................ 12 136 123 217 ...............................
Brewers
1,000 cwt 1,000 cwt 1,000 cwt 1,000 cwt 1,000 cwt 2010 ................ 662 252 247 247 (2) 2011 ................ 799 647 673 786 (2) 2012 ................ 710 551 532 573 (2) 2013 ................ 1,241 1,189 (NA) 384 (2) 2014 ................ 575 651 589 747 (2) 2015 ................ 748 941 1,153 141 (2) 2016 ................ 734 387 678 551 (2) 2017 ................ 401 510 650 798 (2) 2018 ................ 1,038 687 364 285 (2) 2019 ................ 170 223 707 525 (2)
(NA) Not available. 1 California only; included in Second heads. 2 Not published to avoid disclosing individual oper-ations. 3 Screenings included in Second heads in California.
NASS, Crops Branch, (202) 720–2127.

I–21 AGRICULTURAL STATISTICS 2020
Table 1-30.—Rice, rough: Support operations, United States, 2016–2019
Marketing year beginning August 1
Price loss coverage payment
rates per cwt
Program price levels per cwt
Put under loan Acquired by CCC under
loan program 1
Owned by CCC at end of marketing
year Loan Reference Quantity Percentage
of production
Dollars Dollars Dollars Million cwt Percent 1,000 cwt 1,000 cwt Long grain 2016/2017 ......... 4.36 6.50 14.00 30.24 18.16 0 0 2017/2018 ......... 2.50 6.50 14.00 17.07 13.35 0 0 2018/2019 ......... 3.20 6.50 14.00 21.11 12.88 0 0 2019/2020 2 ....... 2.00 7.00 14.00 16.53 13.16 0 0
Medium grain 3 2016/2017 ......... 3.90 6.50 14.00 16.74 29.02 0 0 2017/2018 ......... 2.30 6.50 14.00 12.19 24.20 0 0 2018/2019 ......... 1.70 6.50 14.00 15.19 25.21 0 0 2019/2020 2 ....... 2.30 7.00 14.00 18.02 30.49 0 0
Temperate Japonica 4 2016/2017 ......... 2.00 6.50 16.10 16.40 35.09 0 0 2017/2018 ......... 0.00 6.50 16.10 10.98 29.86 0 0 2018/2019 ......... 0.00 6.50 16.10 12.95 30.29 0 0 2019/2020 2 ....... 0.00 7.00 17.30 14.38 34.91 0 0
1 Acquisitions as of September 30, 2020. 2 Payment rate as of the July 31, 2020 NASS Agricultural Prices Re-port. 3 Medium Grain includes all short grain rice and medium grain rice for the marketing assistance loan program. The quantity under loan for 2014/2015 includes the medium and short grain rice in California. The medium and short grain rice in California is also shown in the Temperate Japonica section below. 4 Temperate Japonica Rice is medium and short grain rice in California starting with the 2014/2015 crop. Prior to the 2014/2015 crop, temperate japonica rice was classified as medium grain rice for program purposes.
FPAC-BC, Commodity Analysis Branch, (202) 690-0734.
Table 1-31.—Rice: United States exports (milled basis), by country of destination, 2017–2019 1
Country of destination
Year
2017 2018 2019
Metric tons Metric tons Metric tons Mexico ........................................................ 924,842 756,638 851,271 Haiti ............................................................ 530,530 412,253 451,253 Japan ......................................................... 302,873 274,054 339,480 Canada ...................................................... 222,000 240,358 251,726 Korea, South .............................................. 152,693 111,325 162,159 Honduras ................................................... 148,212 196,139 159,044 Iraq ............................................................. 33,472 156,906 154,048 Colombia .................................................... 118,927 147,059 147,357 Nicaragua ................................................... 6,697 10,675 132,034 Saudi Arabia .............................................. 119,821 94,255 117,331 Guatemala ................................................. 113,077 121,320 111,791 Jordan ........................................................ 140,970 80,921 93,337 El Salvador ................................................ 66,328 78,712 76,544 Costa Rica ................................................. 72,176 73,582 74,719 Taiwan ....................................................... 51,620 46,887 64,550 Libya .......................................................... 72,502 75,610 56,973 Venezuela .................................................. 239,062 42,218 53,776 Panama ...................................................... 49,386 23,925 51,317 Dominican Republic ................................... 41,245 20,176 22,816 Guinea ....................................................... 37,137 4,588 21,929 Israel(*) ...................................................... 14,661 10,376 19,865 Benin .......................................................... 27,791 11,753 18,090 Cote d’Ivoire ............................................... 4,171 19,003 11,875 Vietnam ...................................................... 375 180 11,249 Australia(*) ................................................. 11,985 10,020 9,969 Togo ........................................................... 30 625 9,446 Liberia ........................................................ 20,231 9,279 8,683 Hong Kong ................................................. 18,240 6,212 7,985 United Kingdom ......................................... 30,070 25,341 7,622 Bahamas, The ........................................... 7,643 7,362 7,546 Rest of World ............................................. 263,847 136,639 130,219
World Total ................................................ 3,842,612 3,204,392 3,636,401
(*) Denotes a country that is a summarization of its component countries. 1 Year beginning Jan 1. FAS, Grain and Feed Division, (202) 720–6219. www.fas.usda.gov/grain/default.html.

I–22 GRAIN AND FEED
Table 1-32.—International Rice, milled: Area, yield, and production in specified countries, 2017/2018–2019/2020
Country
Area Yield per hectare Production
2017/ 2018
2018/ 2019
2019/ 2020
2017/ 2018
2018/ 2019
2019/ 2020 2017/2018 2018/2019 2019/2020
1,000 hectares Metric tons 1,000 metric tons
China ............. 30,747 30,189 29,690 6.92 7.03 7.06 148,873 148,490 146,730 India ............... 43,774 43,800 44,000 3.86 3.99 4.02 112,760 116,480 118,000 Indonesia ....... 12,250 12,100 12,000 4.76 4.78 4.79 37,000 36,700 36,500 Bangladesh .... 11,272 11,770 11,830 4.35 4.45 4.55 32,650 34,909 35,850 Vietnam .......... 7,645 7,615 7,665 5.79 5.83 5.91 27,657 27,767 28,300 Thailand ......... 10,756 10,830 10,000 2.90 2.85 2.80 20,577 20,340 18,500 Burma ............ 7,100 7,100 7,100 2.91 2.90 2.93 13,200 13,175 13,300 Philippines ..... 4,844 4,741 4,700 4.01 3.93 4.05 12,235 11,732 12,000 Japan ............. 1,557 1,550 1,545 6.87 6.79 6.94 7,787 7,657 7,800 Pakistan ......... 2,800 2,880 2,900 4.02 3.80 3.88 7,500 7,300 7,500 Brazil .............. 1,973 1,700 1,680 6.12 6.18 6.25 8,204 7,140 7,140 United States 961 1,178 1,000 8.41 8.62 8.38 5,659 7,107 5,864 Cambodia ...... 3,184 3,240 3,190 2.86 2.91 2.92 5,554 5,742 5,688 Nigeria ........... 3,600 3,600 3,600 2.08 2.11 2.16 4,725 4,788 4,900 Egypt .............. 762 462 760 8.18 8.78 8.20 4,300 2,800 4,300 Korea, South .. 755 738 730 7.02 6.99 6.84 3,972 3,868 3,744 Nepal ............. 1,490 1,500 1,500 3.34 3.73 3.53 3,310 3,730 3,530 Sri Lanka ....... 769 975 900 4.30 4.72 4.44 2,248 3,131 2,720 Madagascar ... 1,425 1,500 1,500 2.18 2.67 2.80 1,984 2,560 2,688 Peru ............... 422 438 425 7.20 7.99 7.53 2,097 2,415 2,208 Laos ............... 964 856 985 3.29 3.12 3.30 2,000 1,680 2,050 Tanzania ........ 1,170 1,200 1,200 2.46 2.58 2.58 1,896 2,046 2,046
FAS, Office of Global Analysis, (202) 720-6301. Prepared or estimated on the basis of official USDA production, supply, and distribution, supply, and and distribution statistics from foreign governments.
Table 1-33.—Rice, milled equivalent: International trade, 2017/2018–2019/2020
Country 2017/2018 2018/2019 2019/2020
1,000 metric tons
Principle exporting countries: India ........................................................ 12,041 10,420 12,500 Thailand .................................................. 11,056 7,562 9,800 Vietnam .................................................. 6,590 6,581 6,500 Pakistan .................................................. 4,011 4,500 4,000 China ...................................................... 1,364 2,770 2,858 United States .......................................... 2,764 2,971 2,800 Burma ..................................................... 2,750 2,500 2,600 Cambodia ............................................... 1,300 1,350 1,300 Uruguay .................................................. 756 800 785 Brazil ...................................................... 1,152 830 650 Paraguay ................................................ 653 689 650 Guyana ................................................... 455 414 414 Argentina ................................................ 426 370 330 European Union ..................................... 349 302 300 Russia .................................................... 139 153 150 South Africa ............................................ 112 112 125 Kazakhstan ............................................. 95 88 100 Cote d’Ivoire ........................................... 80 100 100 Egypt ...................................................... 50 20 95 Guinea .................................................... 80 100 90
Principle importing countries: Philippines .............................................. 1,300 3,600 2,600 China ...................................................... 5,500 3,000 2,400 European Union ..................................... 2,007 2,150 2,200 Nigeria .................................................... 2,000 1,900 1,500 Saudi Arabia ........................................... 1,290 1,425 1,450 Cote d’Ivoire ........................................... 1,370 1,350 1,350 Iraq ......................................................... 1,130 1,200 1,200 Brazil ...................................................... 562 900 1,100 Iran ......................................................... 1,200 1,200 1,100 Senegal .................................................. 1,100 1,100 1,050 South Africa ............................................ 1,074 1,010 1,050 United States .......................................... 874 920 1,032 Indonesia ................................................ 2,350 600 1,000 Malaysia ................................................. 800 1,000 1,000 Ghana ..................................................... 780 900 950 United Arab Emirates ............................. 775 850 925 Mexico .................................................... 813 744 785 Nepal ...................................................... 670 630 750 Japan ...................................................... 686 631 685 Kenya ..................................................... 575 625 675
FAS, Office of Global Analysis, (202) 720-6301. Prepared or estimated on the basis of official USDA production, supply, and distribution statistics from foreign governments.

I–23 AGRICULTURAL STATISTICS 2020
Table 1-34.—Food grains: Average price, selected markets and grades, 2010–2019 1
Calendar year 2
Kansas City Minneapolis (rail)
Portland Wheat No.
1 Soft White
St. Louis Wheat, No. 2 Soft Red
Winter (truck)
Wheat, No. 1 Hard Winter,
Ordinary Protein
(rail)
Wheat, No. 1 Hard Winter,
13% protein (rail)
Wheat, No. 2 Soft Red Winter (rail)
Wheat, No. 1 Hard Amber Durum (milling)
(rail)
Wheat, No. 1 Dark
Northern Spring
(rail), 14% protein
Rye, No. 2, 20 day delivery (truck)
Dollars per bushel
2010 ............ 5.90 6.58 6.03 8.75 7.79 4.58 5.45 5.36 2011 ............ 8.44 9.17 7.87 ................... 11.36 ................... 7.08 7.49 2012 ............ 8.47 8.96 7.25 ................... 9.69 ................... 7.74 7.56 2013 ............ 7.22 8.60 6.67 (NA) 8.08 (NA) 7.67 6.97 2014 ............ 7.89 7.95 5.72 (NA) 8.73 5.75 7.09 6.45 2015 ............ 6.05 6.16 4.43 (NA) 7.00 5.75 5.88 4.81 2016 ............ 4.80 5.50 3.35 (NA) 6.60 4.48 4.95 4.32 2017 ............ 5.03 6.25 3.98 (NA) 7.18 4.07 4.99 4.36 2018 ............ 6.22 6.67 6.19 (NA) 7.12 5.38 5.88 (NA) 2019 ............ 5.62 6.10 4.79 (NA) 6.56 7.12 5.91 5.14
Calendar year 2
Chicago Wheat, No. 2
Soft Red Winter (rail)
Denver Wheat, No. 1 Hard
Winter (truck red)
S.W. Louisiana Milled Rice Arkansas Milled Rice Texas Milled Rice
Medium Long Medium Long Long
Dollars per bushel Dollars per cwt
2010 ............ 5.36 5.00 30.80 23.12 29.68 23.91 26.46 2011 ............ 6.83 7.36 33.47 26.20 34.99 27.10 29.25 2012 ............ 7.44 7.44 28.89 25.77 27.91 26.18 27.18 2013 ............ 6.84 7.27 30.56 28.48 28.68 28.52 29.61 2014 ............ 5.89 6.38 30.76 27.04 31.30 27.62 29.15 2015 ............ 5.08 4.77 27.88 23.30 27.41 23.35 25.31 2016 ............ 4.31 3.35 27.39 22.65 22.92 23.01 23.92 2017 ............ 4.22 3.45 22.88 22.88 23.75 22.52 23.07 2018 ............ 4.88 4.52 29.43 22.54 27.41 27.41 26.37 2019 ............ 4.91 4.21 31.50 22.84 30.93 24.52 26.34
(NA) Not available. 1 Simple average of daily prices. 2 For wheat and rye, crop year begins in June. For rice, crop year begins in August.
AMS, Livestock and Grain Market News branch, (202) 720–6231.
Table 1-35.—Corn: Area, yield, production, and value, United States, 2010–2019
Year
Area planted,
all purposes
Corn for grain Corn for silage
Area har-
vested
Yield per har-
vested acre
Production
Marketing year
average price per bushel
Value of production
Area har-
vested
Yield per har-vested acre
Produc-tion
1,000 1,000 1,000 1,000 1,000 1,000 acres acres Bushels bushels Dollars dollars acres Tons tons
2010 ... 88,192 81,446 152.6 12,425,330 5.18 64,529,628 5,567 19.3 107,314 2011 ... 91,936 83,879 146.8 12,313,956 6.22 76,651,242 5,935 18.4 109,091 2012 ... 97,291 87,365 123.1 10,755,111 6.89 74,155,299 7,419 15.7 116,148 2013 ... 95,365 87,451 158.1 13,828,964 4.46 61,927,548 6,281 18.8 118,296 2014 ... 90,597 83,136 171.0 14,215,532 3.70 52,951,760 6,371 20.1 128,048 2015 ... 88,019 80,753 168.4 13,601,964 3.61 49,339,261 6,237 20.4 127,311 2016 ... 94,004 86,748 174.6 15,148,038 3.36 51,304,297 6,206 20.3 126,020 2017 ... 90,167 82,733 176.6 14,609,407 3.36 49,567,854 6,385 20.0 127,434 2018 ... 88,871 81,276 176.4 14,340,369 3.61 52,102,404 6,120 19.9 121,564 2019 ... 89,700 81,482 168.0 13,691,561 3.85 52,911,254 6,587 20.2 132,807
NASS, Crops Branch, (202) 720–2127.

I–24 GRAIN AND FEED
Table 1-36.—Corn: Area, yield, and production, by State and United States, 2017–2019
State Area planted for all purposes Area harvested for grain
2017 2018 2019 2017 2018 2019
1,000 acres
Alabama ............................. 250 255 320 235 245 305 Arizona ............................... 65 80 90 32 20 37 Arkansas ............................ 620 660 770 595 645 725 California ............................ 430 430 460 80 65 60 Colorado ............................ 1,460 1,460 1,550 1,300 1,190 1,300 Connecticut ........................ 24 23 23 (NA) (NA) (NA) Delaware ............................ 180 170 185 171 166 180 Florida ................................ 75 95 90 37 62 54 Georgia .............................. 290 325 395 245 285 350 Idaho .................................. 340 350 385 115 125 148 Illinois ................................. 11,200 11,000 10,500 10,950 10,800 10,200 Indiana ............................... 5,350 5,300 5,000 5,200 5,120 4,820 Iowa ................................... 13,300 13,200 13,500 12,900 12,750 13,050 Kansas ............................... 5,500 5,450 6,400 5,200 4,980 6,020 Kentucky ............................ 1,320 1,330 1,550 1,220 1,220 1,450 Louisiana ........................... 620 500 460 550 490 450 Maine ................................. 31 30 29 (NA) (NA) (NA) Maryland ............................ 480 440 510 420 380 460 Massachusetts ................... 15 14 14 (NA) (NA) (NA) Michigan ............................ 2,250 2,250 2,000 1,890 1,890 1,610 Minnesota .......................... 8,050 7,900 7,800 7,630 7,460 7,260 Mississippi ......................... 520 480 660 500 460 620 Missouri ............................. 3,400 3,500 3,200 3,250 3,330 2,990 Montana ............................. 115 115 115 65 68 60 Nebraska ........................... 9,550 9,600 10,100 9,300 9,300 9,810 Nevada .............................. 12 13 15 (NA) (NA) (NA) New Hampshire ................. 14 13 12 (NA) (NA) (NA) New Jersey ........................ 77 70 77 70 60 68 New Mexico ....................... 125 135 145 43 35 46 New York ........................... 1,000 1,070 1,020 485 615 545 North Carolina ................... 890 910 990 840 830 930 North Dakota ..................... 3,420 3,150 3,500 3,230 2,930 3,230 Ohio ................................... 3,400 3,500 2,800 3,150 3,300 2,570 Oklahoma .......................... 350 310 370 305 270 330 Oregon ............................... 85 75 80 44 40 48 Pennsylvania ..................... 1,400 1,350 1,350 950 920 950 Rhode Island ..................... 2 2 2 (NA) (NA) (NA) South Carolina ................... 350 340 380 325 310 350 South Dakota ..................... 5,700 5,300 4,530 5,080 4,860 3,910 Tennessee ......................... 750 720 970 710 670 910 Texas ................................. 2,450 2,200 2,500 2,240 1,750 2,150 Utah ................................... 80 70 85 20 22 26 Vermont ............................. 82 85 81 (NA) (NA) (NA) Virginia ............................... 500 485 540 340 325 380 Washington ........................ 170 165 170 80 85 90 West Virginia ..................... 50 46 52 33 33 38 Wisconsin .......................... 3,900 3,900 3,800 2,930 3,170 2,680 Wyoming ............................ 95 95 95 63 70 67
United States ..................... 90,167 88,871 89,700 82,733 81,276 81,482
See footnote(s) at end of table.

I–25 AGRICULTURAL STATISTICS 2020
Table 1-36.—Corn: Area, yield, and production, by State and United States, 2017–2019—Continued
State
Corn for grain
Yield per harvested acre Production
2017 2018 2019 2017 2018 2019
1,000 acres
Alabama ............................. 167.0 156.0 147.0 39,245 38,220 44,835 Arizona ............................... 195.0 220.0 231.0 6,240 4,400 8,547 Arkansas ............................ 183.0 181.0 175.0 108,885 116,745 126,875 California ............................ 167.0 173.0 168.0 13,360 11,245 10,080 Colorado ............................ 143.0 130.0 123.0 185,900 154,700 159,900 Connecticut ........................ (NA) (NA) (NA) (NA) (NA) (NA) Delaware ............................ 189.0 145.0 161.0 32,319 24,070 28,980 Florida ................................ 161.0 157.0 161.0 5,957 9,734 8,694 Georgia .............................. 176.0 176.0 160.0 43,120 50,160 56,000 Idaho .................................. 203.0 213.0 205.0 23,345 26,625 30,340 Illinois ................................. 201.0 210.0 181.0 2,200,950 2,268,000 1,846,200 Indiana ............................... 180.0 189.0 169.0 936,000 967,680 814,580 Iowa ................................... 202.0 196.0 198.0 2,605,800 2,499,000 2,583,900 Kansas ............................... 132.0 129.0 133.0 686,400 642,420 800,660 Kentucky ............................ 178.0 175.0 169.0 217,160 213,500 245,050 Louisiana ........................... 184.0 173.0 165.0 90,160 77,850 89,925 Maine ................................. (NA) (NA) (NA) (NA) (NA) (NA) Maryland ............................ 172.0 146.0 161.0 72,240 55,480 74,060 Massachusetts ................... (NA) (NA) (NA) (NA) (NA) (NA) Michigan ............................ 159.0 153.0 149.0 300,510 289,170 239,890 Minnesota .......................... 194.0 182.0 174.0 1,480,220 1,357,720 1,263,240 Mississippi ......................... 189.0 185.0 174.0 94,500 85,100 107,880 Missouri ............................. 170.0 140.0 155.0 552,500 466,200 463,450 Montana ............................. 70.0 85.0 95.0 4,550 5,780 5,700 Nebraska ........................... 181.0 192.0 182.0 1,683,300 1,785,600 1,785,420 Nevada .............................. (NA) (NA) (NA) (NA) (NA) (NA) New Hampshire ................. (NA) (NA) (NA) (NA) (NA) (NA) New Jersey ........................ 167.0 141.0 155.0 11,690 8,460 10,540 New Mexico ....................... 134.0 187.0 135.0 5,762 6,545 6,210 New York ........................... 161.0 159.0 158.0 78,085 97,785 86,110 North Carolina ................... 142.0 113.0 111.0 119,280 93,790 103,230 North Dakota ..................... 139.0 153.0 141.0 448,970 448,290 455,430 Ohio ................................... 177.0 187.0 164.0 557,550 617,100 421,480 Oklahoma .......................... 126.0 134.0 137.0 38,430 36,180 45,210 Oregon ............................... 212.0 195.0 237.0 9,328 7,800 11,376 Pennsylvania ..................... 161.0 140.0 153.0 148,120 124,600 162,180 Rhode Island ..................... (NA) (NA) (NA) (NA) (NA) (NA) South Carolina ................... 136.0 127.0 106.0 44,200 39,370 37,100 South Dakota ..................... 145.0 160.0 145.0 736,600 777,600 566,950 Tennessee ......................... 171.0 168.0 177.0 121,410 112,560 161,070 Texas ................................. 140.0 108.0 133.0 313,600 189,000 285,950 Utah ................................... 176.0 182.0 143.0 3,520 4,004 3,718 Vermont ............................. (NA) (NA) (NA) (NA) (NA) (NA) Virginia ............................... 140.0 146.0 144.0 47,600 47,450 54,720 Washington ........................ 225.0 220.0 237.0 18,000 18,700 21,330 West Virginia ..................... 152.0 152.0 165.0 5,016 5,016 6,270 Wisconsin .......................... 174.0 172.0 168.0 509,820 545,240 450,240 Wyoming ............................ 155.0 164.0 123.0 9,765 11,480 8,241
United States ..................... 176.6 176.4 168.0 14,609,407 14,340,369 13,691,561
(NA) Not available. NASS, Crops Branch, (202) 720–2127.

I–26 GRAIN AND FEED
Table 1-37.—Corn: Supply and disappearance, United States, 2009–2018
Year beginning
September 1
Supply Disappearance
Ending stocks
Aug. 31 Beginning stocks
Produc-tion Imports Total 1
Domestic use
Exports Total dis-appearance
Food, alcohol, and in-dustrial
Seed Feed and residual
Million bushels
2009 ......... 1,673 13,067 8 14,749 5,939 27.8 5,096 1,979 13,041 1,708 2010 ......... 1,708 12,425 28 14,161 6,403 29.6 4,770 1,831 13,033 1,128 2011 ......... 1,128 12,314 29 13,471 6,400 31.0 4,512 1,539 12,482 989 2012 ......... 989 10,755 160 11,904 6,013 31.0 4,309 730 11,083 821 2013 ......... 821 13,831 36 14,688 6,501 29.7 5,004 1,921 13,456 1,232 2014 ......... 1,232 14,217 32 15,481 6,566 29.3 5,287 1,867 13,750 1,731 2015 ......... 1,731 13,602 68 15,401 6,617 30.6 5,118 1,899 13,664 1,737 2016 ......... 1,737 15,148 57 16,942 6,856 29.3 5,470 2,294 14,649 2,293 2017 ......... 2,293 14,609 36 16,939 7,027 29.6 5,304 2,438 14,798 2,140 2018 ......... 2,140 14,430 28 16,509 6,764 29.1 5,429 2,066 14,288 2,221
Latest data may be preliminary or projected. 1 Total may not add due to rounding. ERS, Market and Trade Economics Division, (202) 694–5313. Source: USDA, World Agricultural Outlook Board, World
Agricultural Supply and Demand Estimates and supporting materials.
Table 1-38.—Corn: Stocks on and off farms, United States, 2010–2019
Year beginning previous
December
On farms Off farms 1
Dec. 1 Mar. 1 Jun. 1 Sep. 1 2 Dec. 1 Mar. 1 Jun. 1 Sep. 1 2
1,000 bushels
2010 ................... 7,405,000 4,548,000 2,131,400 485,100 3,497,460 3,145,787 2,178,671 1,222,687 2011 ................... 6,302,000 3,384,000 1,681,500 314,950 3,754,769 3,139,228 1,988,832 812,695 2012 ................... 6,175,000 3,192,000 1,482,000 313,700 3,471,823 2,831,356 1,666,204 675,327 2013 ................... 4,586,000 2,669,200 1,260,100 275,000 3,446,732 2,730,726 1,506,144 546,185 2014 ................... 6,380,000 3,860,500 1,863,200 462,000 4,072,532 3,147,623 1,988,516 769,904 2015 ................... 7,087,000 4,380,000 2,275,000 593,000 4,124,380 3,369,806 2,177,988 1,138,164 2016 ................... 6,829,000 4,335,000 2,471,400 627,400 4,406,178 3,487,233 2,239,679 1,109,658 2017 ................... 7,611,000 4,908,000 2,841,400 787,000 4,772,471 3,713,992 2,387,682 1,506,303 2018 ................... 7,739,000 5,002,000 2,750,000 620,000 4,827,501 3,890,126 2,554,704 1,520,335 2019 ................... 7,451,000 5,131,000 2,949,600 814,100 4,485,798 3,482,206 2,252,636 1,406,649
1 Includes stocks at mills, elevators, warehouses, terminals, and processors. 2 Old crop only. NASS, Crops Branch, (202) 720–2127.

I–27 AGRICULTURAL STATISTICS 2020
Table 1-39.—Corn: Utilization for silage, by State and United States, 2017–2019
State
Silage
Area harvested Yield per acre Production
2017 2018 2019 2017 2018 2019 2017 2018 2019
1,000 1,000 1,000 1,000 1,000 1,000 acres acres acres Tons Tons Tons tons tons tons
Alabama ............. 7 5 7 17.0 16.0 13.0 119 80 91 Arizona ............... 32 58 50 31.0 29.0 29.0 992 1,682 1,450 Arkansas ............ 2 3 7 19.0 21.0 16.0 38 63 112 California ............ 345 360 395 26.5 26.5 27.5 9,143 9,900 10,665 Colorado ............. 130 190 175 25.5 22.0 24.0 3,315 4,180 4,200 Connecticut ........ 20 20 21 19.5 19.0 21.0 390 380 441 Delaware ............ 7 3 4 19.5 24.0 23.0 137 72 92 Florida ................ 35 30 35 19.0 21.0 20.0 665 630 700 Georgia ............... 35 30 25 16.0 21.0 22.0 560 630 550 Idaho .................. 220 220 235 30.0 30.0 28.0 6,600 6,600 6,580 Illinois ................. 190 100 170 17.0 20.0 20.0 3,230 2,000 3,400 Indiana ................ 110 100 110 21.0 21.0 20.0 2,310 2,100 2,200 Iowa .................... 330 270 360 21.0 20.5 22.0 6,930 5,535 7,920 Kansas ............... 250 390 250 21.5 13.5 17.5 5,375 5,265 4,375 Kentucky ............. 85 90 80 20.0 21.0 21.0 1,700 1,890 1,680 Louisiana ............ 1 2 3 20.0 20.0 19.0 20 40 57 Maine .................. 27 27 26 18.0 20.0 19.0 486 540 494 Maryland ............. 50 45 40 20.5 19.0 22.0 1,025 855 880 Massachusetts ... 12 12 11 19.0 20.0 20.0 228 240 220 Michigan ............. 340 340 340 18.5 17.5 18.5 6,290 5,950 6,290 Minnesota ........... 360 340 460 21.5 22.0 19.0 7,740 7,480 8,740 Mississippi .......... 7 7 7 18.0 15.0 15.0 126 105 105 Missouri .............. 70 100 70 15.0 13.0 16.0 1,050 1,300 1,120 Montana ............. 25 37 50 20.0 20.0 23.0 500 740 1,150 Nebraska ............ 210 220 200 19.5 21.0 23.0 4,095 4,620 4,600 Nevada ............... 10 7 12 24.0 26.0 25.0 240 182 300 New Hampshire .. 13 12 11 20.0 21.0 20.0 260 252 220 New Jersey ........ 6 6 7 19.5 19.0 22.0 117 114 154 New Mexico ........ 80 95 90 25.0 22.0 20.0 2,000 2,090 1,800 New York ............ 495 445 445 18.0 19.0 18.0 8,910 8,455 8,010 North Carolina .... 40 50 50 18.0 18.0 16.0 720 800 900 North Dakota ...... 160 170 140 10.0 15.0 19.5 1,600 2,550 2,730 Ohio .................... 210 160 170 20.0 20.0 19.0 4,200 3,200 3,230 Oklahoma ........... 20 20 20 20.0 11.0 13.0 400 220 260 Oregon ............... 40 34 35 24.0 23.0 24.0 960 782 840 Pennsylvania ...... 420 390 380 21.5 19.0 20.0 9,030 7,410 7,600 Rhode Island ...... 2 2 2 18.0 21.0 20.0 36 42 40 South Carolina ... 16 19 13 18.0 14.0 14.0 288 266 182 South Dakota ..... 510 360 340 12.5 16.5 17.5 6,375 5,940 5,950 Tennessee .......... 30 38 40 22.0 19.0 20.0 660 722 800 Texas .................. 150 270 280 22.0 16.0 20.0 3,300 4,320 5,600 Utah .................... 56 45 55 25.0 23.0 24.0 1,400 1,035 1,320 Vermont .............. 76 79 77 16.5 19.0 18.0 1,254 1,501 1,386 Virginia ............... 135 135 135 18.0 19.0 19.0 2,430 2,565 2,565 Washington ........ 90 80 80 27.0 26.0 23.0 2,430 2,080 1,840 West Virginia ...... 16 11 12 20.0 19.0 20.0 320 209 240 Wisconsin ........... 880 670 1,040 19.0 20.0 17.5 16,720 13,400 18,200 Wyoming ............ 30 23 22 24.0 24.0 24.0 720 552 528
United States ...... 6,385 6,120 6,587 20.0 19.9 20.2 127,434 121,564 132,807
NASS, Crops Branch, (202) 720–2127.

I–28 GRAIN AND FEED
Table 1-40.—Corn for grain: Marketing year average price and value, by State and United States, 2017–2019
State Marketing year average price per bushel Value of production
2017 2018 2019 1 2017 2018 2019 1
Dollars Dollars Dollars 1,000 dollars 1,000 dollars 1,000 dollars
Alabama ....................... 4.04 4.11 4.20 158,550 157,084 188,307 Arizona ......................... 4.55 4.96 5.30 28,392 21,842 45,299 Arkansas ...................... 3.64 3.80 3.90 396,341 443,631 494,813 California ...................... 4.20 4.40 4.55 56,112 49,478 45,864 Colorado ...................... 3.37 3.70 3.95 626,483 572,390 631,605 Delaware ...................... 4.02 4.11 4.30 129,922 98,928 124,614 Florida .......................... 4.47 4.47 4.50 26,628 43,511 39,123 Georgia ........................ 4.33 4.35 4.50 186,710 218,196 252,000 Idaho ............................ 4.21 4.42 4.50 98,282 117,683 136,530 Illinois ........................... 3.41 3.62 3.85 7,505,240 8,210,160 7,107,870 Indiana ......................... 3.56 3.78 4.10 3,332,160 3,657,830 3,339,778 Iowa ............................. 3.31 3.59 3.80 8,625,198 8,971,410 9,818,820 Kansas ......................... 3.20 3.28 3.60 2,251,392 2,299,864 2,962,442 Kentucky ...................... 3.69 3.84 4.10 801,320 819,840 1,004,705 Louisiana ..................... 3.72 3.86 3.95 335,395 300,501 355,204 Maryland ...................... 4.02 4.11 4.30 290,405 228,023 318,458 Michigan ...................... 3.46 3.72 4.00 1,039,765 1,075,712 959,560 Minnesota .................... 3.18 3.47 3.65 4,707,100 4,711,288 4,610,826 Mississippi ................... 3.68 3.80 4.00 347,760 323,380 431,520 Missouri ....................... 3.41 3.68 3.90 1,884,025 1,715,616 1,807,455 Montana ....................... 3.41 3.79 3.50 15,516 21,906 23,940 Nebraska ..................... 3.35 3.58 3.80 5,639,055 6,392,448 6,784,596 New Jersey .................. 3.75 3.90 4.30 43,838 32,994 45,322 New Mexico ................. 3.90 4.30 4.40 22,472 28,144 27,342 New York ..................... 4.07 4.16 4.27 317,806 406,786 367,690 North Carolina ............. 4.24 4.39 4.45 505,747 411,738 459,374 North Dakota ............... 3.04 3.32 3.55 1,364,869 1,488,323 1,616,777 Ohio ............................. 3.61 3.74 4.20 2,012,756 2,307,954 1,770,216 Oklahoma .................... 3.59 3.86 4.10 137,964 139,655 185,361 Oregon ......................... 3.78 4.13 4.45 35,260 32,214 50,623 Pennsylvania ............... 3.87 4.22 4.40 573,224 525,812 713,592 South Carolina ............. 4.40 4.50 4.65 194,480 177,165 172,515 South Dakota ............... 3.09 3.38 3.70 2,276,094 2,628,288 2,097,715 Tennessee ................... 3.55 3.76 3.95 431,006 423,226 636,227 Texas ........................... 3.70 4.13 4.30 1,160,320 780,570 1,229,585 Utah ............................. 3.96 4.31 4.40 13,939 17,257 16,359 Virginia ......................... 3.96 4.06 4.15 188,496 192,647 227,088 Washington .................. 4.05 4.11 4.15 72,900 76,857 88,520 West Virginia ............... 3.95 4.08 4.15 19,813 20,465 26,021 Wisconsin .................... 3.30 3.52 3.70 1,682,406 1,919,245 1,665,888 Wyoming ...................... 3.35 3.69 3.85 32,713 42,361 31,728
United States ............... 3.36 3.61 3.85 49,567,854 52,102,404 52,911,254
1 Preliminary. NASS, Crops Branch, (202) 720–2127.

I–29 AGRICULTURAL STATISTICS 2020
Table 1-41.—International Corn: Area, yield, and production in specified countries, 2017/2018–2019/2020
Country
Area Yield per hectare Production
2017/ 2018
2018/ 2019
2019/ 2020
2017/ 2018
2018/ 2019
2016/ 2017
2017/ 2018
2018/ 2019
2019/ 2020
1,000 hectares Metric tons 1,000 metric tons
United States ............... 33,481 32,891 32,975 11.08 11.08 10.55 371,096 364,262 347,782 China ........................... 42,399 42,129 41,280 6.11 6.11 6.32 259,071 257,330 260,770 Brazil ........................... 16,600 17,500 18,100 4.94 5.77 5.58 82,000 101,000 101,000 European Union .......... 8,258 8,241 8,700 7.51 7.82 7.47 62,007 64,440 65,000 Argentina ..................... 5,200 6,100 6,200 6.15 8.36 8.07 32,000 51,000 50,000 Ukraine ........................ 4,433 4,567 5,000 5.44 7.84 7.16 24,115 35,805 35,800 India ............................. 9,380 9,275 9,300 3.07 2.99 3.07 28,753 27,715 28,500 Mexico ......................... 7,322 7,200 6,800 3.77 3.83 3.68 27,569 27,600 25,000 South Africa ................. 2,634 2,597 3,000 4.98 4.55 5.33 13,104 11,824 16,000 Russia ......................... 2,694 2,373 2,504 4.90 4.81 5.70 13,201 11,415 14,275 Canada ........................ 1,406 1,431 1,450 10.03 9.70 9.24 14,095 13,885 13,400 Indonesia ..................... 3,650 3,700 3,900 3.26 3.24 3.26 11,900 12,000 12,700 Nigeria ......................... 6,540 6,500 6,500 1.59 1.69 1.69 10,420 11,000 11,000 Ethiopia ....................... 2,230 2,300 2,300 3.77 3.63 3.65 8,400 8,350 8,400 Philippines ................... 2,604 2,480 2,550 3.11 3.07 3.18 8,084 7,608 8,100 Serbia .......................... 1,000 900 950 4.00 7.78 7.11 4,000 7,000 6,750 Egypt ........................... 800 850 800 8.00 8.00 8.00 6,400 6,800 6,400 Tanzania ...................... 4,200 4,200 4,200 1.59 1.49 1.48 6,681 6,273 6,200 Pakistan ....................... 1,230 1,320 1,330 4.64 4.62 4.59 5,701 6,100 6,100 Turkey ......................... 530 530 520 10.00 10.76 11.54 5,300 5,700 6,000
FAS, Office of Global Analysis, (202) 720-6301. Prepared or estimated on the basis of offical USDA production, supply, and distribution statistics from foreign governments.
Table 1-42.—Corn: International trade, 2017/2018–2019/2020
Country 2017/2018 2018/2019 2019/2020
Metric tons
Principle exporting countries: United States .......................................... 61,916 52,457 43,817 Argentina ................................................ 24,154 39,749 36,000 Brazil ...................................................... 22,473 37,000 33,500 Ukraine ................................................... 18,036 30,321 32,000 Russia .................................................... 5,532 2,770 4,700 Serbia ..................................................... 1,749 3,629 2,900 European Union ..................................... 2,069 1,170 2,500 Paraguay ................................................ 819 2,836 2,200 Canada ................................................... 1,739 2,800 2,000 Burma ..................................................... 1,400 1,500 1,400 South Africa ............................................ 1,936 1,797 900 Mexico .................................................... 958 718 700 Cambodia ............................................... 500 500 500 India ........................................................ 500 500 500 Moldova .................................................. 1,089 419 400 Vietnam .................................................. 460 581 400 Laos ........................................................ 200 200 200 Zambia ................................................... 50 100 200 Indonesia ................................................ 1,200 600 100 Thailand .................................................. 400 100 100
Principle importing countries: European Union ..................................... 18,465 25,209 21,000 Mexico .................................................... 16,129 16,658 17,500 Japan ...................................................... 15,668 16,047 16,000 Vietnam .................................................. 8,600 10,200 11,500 Korea, South .......................................... 10,018 10,856 10,800 Iran ......................................................... 8,900 9,000 10,000 Egypt ...................................................... 9,464 9,367 9,900 China ...................................................... 3,456 4,483 7,000 Colombia ................................................ 5,201 6,048 6,200 Algeria .................................................... 4,184 4,521 4,500 Taiwan .................................................... 4,410 4,508 4,300 Malaysia ................................................. 3,645 3,674 4,000 Peru ........................................................ 3,402 3,694 4,000 Saudi Arabia ........................................... 3,983 3,662 4,000 Morocco .................................................. 2,558 2,341 3,000 Turkey .................................................... 2,719 2,876 3,000 Chile ....................................................... 2,132 2,300 2,600 Israel ....................................................... 1,861 1,611 2,000 Canada ................................................... 1,669 2,633 1,500 Dominican Republic ............................... 1,329 1,536 1,500
FAS, Office of Global Analysis, (202) 720-6301. Prepared or estimated on the basis of official USDA production, supply, and distribution statistics from foreign governments.

I–30 GRAIN AND FEED
Table 1-43.—Corn: Support operations, United States, 2013–2019
Marketing year beginning
September 1
Income support pay-ment rates per bushel 1
Program price levels per bushel
Put under loan Acquired by CCC under
loan program 5
Owned by CCC at end of marketing
year Loan 2 Target/ reference 3
Quantity Percentage
of production 4
Million Million Million Dollars Dollars Dollars bushels Percent bushels bushels
2013/2014 ............ 0.28/0.00 1.95 2.63 460 3.3 0 0 2014/2015 ............ 0.00 1.95 3.70 574 4.0 0 0 2015/2016 ............ 0.09 1.95 3.70 746 5.5 0 0 2016/2017 ............ 0.34 1.95 3.70 880 5.8 0 0 2017/2018 ............ 0.35 1.95 3.70 980 6.7 0 0 2018/2019 ............ 0.10 1.95 3.70 919 6.4 0 0 2019/2020 ............ 0.00 2.20 3.70 805 5.9 0 0
1 The first entry is the direct payment rate and the second entry is the counter-cyclical payment rate for 2004/2005-2013/ 2014. For 2009/2010-2013/2014, producers who participated in the Average Crop Revenue (ACRE) program got a 20 per-cent reduction in their direct payment, not calculated in this table. For 2014/2015 and after, the entry is the price loss cov-erage (PLC) payment rate. For 2017/2018, projected PLC payment rate is based on March 2018 WASDE MY price. Agricul-tural Risk Coverage (ARC) is also available, but payment rates are established at the county or farm levels. 2 For 2009/ 2010-2013/2014, producers who participated in the ACRE program got a 30 percent reduction in their loan rate, not cal-culated in this table. 3 Target applies to 2003/2004-2013/2014 and Reference applies beginning with 2014/ 2015. 4 Percent of production is on a grain basis. 5 Acquisitions as of January 31, 2020.
FPAC-BC, Commodity Analysis Branch.
Table 1-44.—Corn: United States exports, specified by country of destination, 2017–2019 1
Country of destination 2017 2018 2019
Metric tons
Mexico ........................................................ 14,698,071 16,698,898 14,305,372 Japan ......................................................... 12,378,239 15,267,093 10,461,561 Colombia .................................................... 4,798,510 5,511,589 3,911,611 Canada ...................................................... 837,742 1,971,476 2,104,913 Korea, South .............................................. 4,000,781 7,264,399 1,880,096 Taiwan ....................................................... 2,256,756 3,208,807 1,182,447 Peru ........................................................... 3,216,248 3,074,252 1,029,891 Guatemala ................................................. 859,355 1,149,313 1,001,003 Costa Rica ................................................. 835,332 850,465 847,215 Honduras ................................................... 489,966 617,583 674,390 Saudi Arabia .............................................. 1,599,150 1,724,045 623,485 El Salvador ................................................ 456,031 601,587 587,544 Panama ...................................................... 475,507 507,012 503,289 Dominican Republic ................................... 562,416 939,054 368,859 China .......................................................... 811,069 290,173 309,474 Nicaragua ................................................... 257,712 338,400 287,332 Jamaica ...................................................... 295,841 277,224 253,266 New Zealand(*) .......................................... 521 46,531 126,597 Israel(*) ...................................................... 107,459 814,810 84,791 Trinidad and Tobago ................................. 80,752 91,781 80,079 Philippines .................................................. 56,060 167,333 78,843 Vietnam ...................................................... 541 1,908,658 65,266 Morocco ..................................................... 575,272 820,957 61,752 Cuba .......................................................... 230,863 116,599 57,999 Haiti ............................................................ 36,594 17,832 47,579 Guyana ...................................................... 34,735 44,549 41,076 Venezuela .................................................. 336,081 509,994 34,898 Hong Kong ................................................. 32,103 34,105 34,322 Barbados .................................................... 29,655 36,042 29,536 Ecuador ...................................................... 838,625 4,254 27,601 Rest of World ............................................. 2,358,569 4,844,101 81,577
World Total ................................................ 52,746,556 69,748,916 41,305,372
1 Data Source: U.S. Census Bureau trade data. Excludes seed, popcorn. FAS, Office of Global Analysis, (202) 720-6301.

I–31 AGRICULTURAL STATISTICS 2020
Table 1-45.—Oats: Area, yield, production, and value, United States, 2010–2019
Year
Area Yield per harvested
acre Production
Marketing year average price
per bushel received by
farmers
Value of production Planted 1 Harvested
1,000 acres 1,000 acres Bushels 1,000 bushels Dollars 1,000 dollars
2010 ............. 3,113 1,267 64.6 81,856 2.52 218,536 2011 ............. 2,349 875 57.3 50,126 3.49 175,523 2012 ............. 2,700 1,005 61.2 61,486 3.89 243,018 2013 ............. 2,980 1,009 64.1 64,642 3.75 239,643 2014 ............. 2,753 1,035 67.9 70,232 3.21 241,472 2015 ............. 3,088 1,275 70.2 89,455 2.12 214,415 2016 ............. 2,829 979 66.0 64,628 2.06 153,824 2017 ............. 2,589 804 61.7 49,585 2.59 139,635 2018 ............. 2,746 865 64.9 56,130 2.66 167,640 2019 2 .......... 2.810 826 64.3 53,148 2.95 162,711
1 Relates to the total area of oats sown for all purposes, including oats sown in the preceding fall. 2 Price and value are preliminary. NASS, Crops Branch, (202) 720–2127.
Table 1-46.—Oats: Stocks on and off farms, United States, 2010–2019
Year beginning September
On farms Off farms 1
Sep. 1 Dec. 1 Mar. 1 Jun. 1 Sep. 1 Dec. 1 Mar. 1 Jun. 1
2010 ................... 45,850 34,100 26,950 14,580 70,722 66,911 59,361 53,049 2011 ................... 30,300 24,600 19,550 11,070 47,391 54,244 55,044 43,869 2012 ................... 34,100 26,100 18,900 11,380 50,872 47,051 33,726 24,957 2013 ................... 37,150 25,650 19,800 9,710 26,339 22,394 15,323 15,029 2014 ................... 41,400 31,300 20,810 15,120 32,910 35,670 38,609 38,625 2015 ................... 47,800 36,750 26,800 18,350 46,066 45,981 48,429 38,452 2016 ................... 37,400 30,430 22,320 13,540 41,190 45,058 40,885 36,790 2017 ................... 33,950 23,300 17,240 11,410 38,039 43,166 37,699 29,606 2018 ................... 39,200 25,410 18,050 10,500 35,573 41,864 32,232 27,314 2019 ................... 37,900 24,770 16,970 10,070 22,153 29,139 30,722 26,738
1 Includes stocks at mills, elevators, warehouses, terminals, and processors. NASS, Crops Branch, (202) 720–2127.
Table 1-47.—Oats: Supply and disappearance, United States, 2009–2018
Year beginning
June 1
Supply Disappearance
Ending stocks
May 31 1 Beginning stocks
Produc-tion Imports Total
Domestic use
Exports Total dis-appearance
Food, alcohol, and in-dustrial
Seed Feed and residual
Million bushels
2009 ......... 84 91 95 270 66 8 113 2 190 80 2010 ......... 80 82 85 247 67 7 103 3 180 68 2011 ......... 68 50 94 212 69 7 78 2 157 55 2012 ......... 55 61 93 209 68 8 96 1 173 36 2013 ......... 36 65 97 198 66 7 98 2 173 25 2014 ......... 25 70 109 204 69 8 71 2 150 54 2015 ......... 54 89 86 229 69 7 93 2 172 57 2016 ......... 57 65 90 212 70 6 82 3 161 50 2017 ......... 50 50 89 189 71 7 68 2 148 41 2018 ......... 41 56 87 184 71 7 66 2 146 38
1 Privately held: Includes quantity under loan and farmer-owned reserve. Latest data may be preliminary or projected. Totals may not add due to rounding. ERS, Market and Trade Economics Division, (202) 694–5313. Source: USDA, World Agricultural Outlook Board, World
Agricultural Supply and Demand Estimates and supporting materials.

I–32 GRAIN AND FEED
Table 1-48.—Oats: Area, yield, and production, by State and United States, 2017–2019
State Area planted 1 Area harvested
2017 2018 2019 2017 2018 2019
1,000 acres
Alabama ............................. 40 40 (NA) 10 15 (NA) Arkansas ............................ 11 10 5 8 7 3 California ............................ 110 110 75 10 6 2 Colorado ............................ 50 95 (NA) 9 7 (NA) Georgia .............................. 50 60 70 15 15 15 Idaho .................................. 50 40 60 10 10 12 Illinois ................................. 35 40 70 20 25 10 Iowa ................................... 115 135 215 42 33 69 Kansas ............................... 100 120 120 25 18 18 Maine ................................. 22 21 22 21 19 19 Michigan ............................ 55 75 70 40 50 25 Minnesota .......................... 170 180 240 95 105 100 Missouri ............................. 30 35 50 13 16 6 Montana ............................. 70 70 70 18 23 24 Nebraska ........................... 110 125 120 35 22 18 New York ........................... 55 69 56 35 43 39 North Carolina ................... 35 30 22 10 11 7 North Dakota ..................... 295 300 355 80 105 115 Ohio ................................... 60 55 75 20 30 25 Oklahoma .......................... 45 50 100 16 10 25 Oregon ............................... 25 20 20 10 5 9 Pennsylvania ..................... 70 65 85 40 35 50 South Carolina ................... 20 19 (NA) 8 7 (NA) South Dakota ..................... 290 290 245 60 95 75 Texas ................................. 455 450 400 60 50 40 Washington ........................ 16 17 (NA) 4 4 (NA) Wisconsin .......................... 180 200 265 85 90 120 Wyoming ............................ 25 25 (NA) 5 9 (NA)
United States ..................... 2,589 2,746 2,810 804 865 826
State Yield per harvested acre Production
2017 2018 2019 2017 2018 2019
Bushels 1,000 bushels
Alabama ............................. 60.0 63.0 (NA) 600 945 (NA) Arkansas ............................ 85.0 75.0 70.0 680 525 210 California ............................ 65.0 70.0 60.0 650 420 120 Colorado ............................ 65.0 50.0 (NA) 585 350 (NA) Georgia .............................. 49.0 71.0 55.0 735 1,065 825 Idaho .................................. 71.0 84.0 92.0 710 840 1,104 Illinois ................................. 79.0 83.0 65.0 1,580 2,075 650 Iowa ................................... 77.0 63.0 58.0 3,234 2,079 4,002 Kansas ............................... 54.0 49.0 64.0 1,350 882 1,152 Maine ................................. 67.0 67.0 76.0 1,407 1,273 1,444 Michigan ............................ 54.0 63.0 57.0 2,160 3,150 1,425 Minnesota .......................... 75.0 59.0 62.0 7,125 6,195 6,200 Missouri ............................. 65.0 45.0 47.0 845 720 282 Montana ............................. 47.0 43.0 55.0 846 989 1,320 Nebraska ........................... 49.0 69.0 63.0 1,715 1,518 1,134 New York ........................... 55.0 54.0 60.0 1,925 2,322 2,340 North Carolina ................... 66.0 66.0 71.0 660 726 497 North Dakota ..................... 58.0 82.0 86.0 4,640 8,610 9,890 Ohio ................................... 70.0 65.0 46.0 1,400 1,950 1,150 Oklahoma .......................... 42.0 48.0 50.0 672 480 1,250 Oregon ............................... 83.0 99.0 97.0 830 495 873 Pennsylvania ..................... 58.0 46.0 53.0 2,320 1,610 2,650 South Carolina ................... 51.0 62.0 (NA) 408 434 (NA) South Dakota ..................... 70.0 82.0 82.0 4,200 7,790 6,150 Texas ................................. 45.0 50.0 50.0 2,700 2,500 2,000 Washington ........................ 42.0 46.0 (NA) 168 184 (NA) Wisconsin .......................... 59.0 61.0 54.0 5,015 5,490 6,480 Wyoming ............................ 85.0 57.0 (NA) 425 513 (NA)
United States ..................... 61.7 64.9 64.3 49,585 56,130 53,148
(NA) Not available. 1 Relates to the total area of oats sown for all purposes, including oats sown in the preceding fall. NASS, Crops Branch, (202) 720–2127.

I–33 AGRICULTURAL STATISTICS 2020
Table 1-49.—Oats: Support operations, United States, 2013–2019
Marketing Year beginning
June 1
Income support pay-ment rates per bushel 1
Program price levels per bushel
Put under loan Acquired by CCC under
loan program 5
Owned by CCC at end of marketing
year Loan 2 Target/ reference 3
Quantity Percentage
of production 4
Million Million Million Dollars Dollars Dollars bushels Percent bushels bushels
2013/2014 ...... 0.02/0.00 1.39 1.79 0.3 0.5 0 0 2014/2015 ...... 0.00 1.39 2.40 0.5 0.7 0 0 2015/2016 ...... 0.28 1.39 2.40 1.1 1.3 0 0 2016/2017 ...... 0.34 1.39 2.40 0.8 1.2 0 0 2017/2018 ...... 0.00 1.39 2.40 0.4 0.8 0 0 2018/2019 ...... 0.00 1.39 2.40 0.4 0.7 0 0 2019/2020 ...... 0.00 2.00 2.40 1.1 2.1 0 0
1 The first entry is the direct payment rate and the second entry is the counter-cyclical payment rate for 2004/2005-2013/ 2014. For 2009/2010-2013/2014, producers who participated in the Average Crop Revenue (ACRE) program got a 20 per-cent reduction in their direct payment, not calculated in this table. For 2014/2015 and after, the entry is the price loss cov-erage (PLC) payment rate. Agricultural Risk Coverage (ARC) is also available, but payment rates are established at the county or farm levels. 2 For 2009/2010-2013/2014, producers who participated in the ACRE program got a 30 percent re-duction in their loan rate, not calculated in this table. 3 Target applies to 2003/2004-2013/2014 and Reference applies be-ginning with 2014/2015. 4 Percent of production is on a grain basis. 5 Acquisitions as of January 31, 2020.
FPAC-BC, Commodity Analysis Branch.
Table 1-50.—Oats: Marketing year average price and value of production, by State and United States, 2017–2019
State Marketing year average price per bushel Value of production
2017 2018 2019 1 2017 2018 2019 1
Dollars Dollars Dollars 1,000 dollars 1,000 dollars 1,000 dollars
Alabama ............... 4.05 4.50 (NA) 2,430 4,253 (NA) Arkansas .............. 2.80 2.75 2.80 1,904 1,444 588 California .............. 2.90 (D) 3.00 1,885 (D) 360 Colorado .............. 3.20 3.66 (NA) 1,872 1,281 (NA) Georgia ................ 3.67 4.15 4.10 2,697 4,420 3,383 Idaho .................... 2.73 2.80 2.65 1,938 2,352 2,926 Illinois ................... 3.39 3.12 4.10 5,356 6,474 2,665 Iowa ..................... 2.54 2.93 3.50 8,214 6,091 14,007 Kansas ................. 2.93 3.32 3.15 3,956 2,928 3,629 Maine ................... 2.80 2.80 3.40 3,940 3,564 4,910 Michigan .............. 2.91 3.31 3.50 6,286 10,427 4,988 Minnesota ............ 2.15 2.49 2.70 15,319 15,426 16,740 Missouri ............... 3.25 3.00 3.70 2,746 2,160 1,043 Montana ............... 2.86 2.71 2.75 2,420 2,680 3,630 Nebraska ............. 2.62 2.85 3.00 4,493 4,326 3,402 New York ............. 2.20 2.92 2.40 4,235 6,780 5,616 North Carolina ..... 2.60 3.10 3.10 1,716 2,251 1,541 North Dakota ....... 2.55 2.41 2.50 11,832 20,750 24,725 Ohio ..................... 3.51 3.76 3.70 4,914 7,332 4,255 Oklahoma ............ 3.02 2.75 2.30 2,029 1,320 2,875 Oregon ................. 2.65 (D) 3.20 2,200 (D) 2,794 Pennsylvania ....... 3.57 4.02 4.25 8,282 6,472 11,263 South Carolina ..... 3.64 3.95 (NA) 1,485 1,714 (NA) South Dakota ....... 2.45 2.67 2.90 10,290 20,799 17,835 Texas ................... 4.28 4.82 4.40 11,556 12,050 8,800 Washington .......... 2.26 2.18 (NA) 380 401 (NA) Wisconsin ............ 2.78 2.77 3.20 13,942 15,207 20,736 Wyoming .............. 3.10 3.60 (NA) 1,318 1,847 (NA) Other States ........ (X) 3.16 (X) - 2,891 -
United States ....... 2.59 2.66 2.95 139,635 167,640 162,711
(D) Withheld to avoid disclosing data for individual. (NA) Not available. (X) Not applicable. 1 Preliminary. NASS, Crops Branch, (202) 720–2127.

I–34 GRAIN AND FEED
Table 1-51.—International Oats: Area, yield, and production in specified countries, 2017/2018–2019/2020
Country
Area Yield per hectare Production
2017/ 2018
2018/ 2019
2019/ 2020
2017/ 2018
2018/ 2019
2019/ 2020
2017/ 2018
2018/ 2019
2019/ 2020
1,000 hectares Metric tons 1,000 metric tons
European Union ....................... 2,666 2,711 2,552 3.02 2.85 3.10 8,058 7,715 7,920 Russia ...................................... 2,780 2,725 2,429 1.96 1.73 1.82 5,448 4,715 4,420 Canada .................................... 1,052 1,005 1,160 3.55 3.42 3.59 3,733 3,436 4,160 Australia ................................... 874 680 675 1.40 1.31 1.39 1,227 888 935 Brazil ........................................ 340 376 381 1.87 2.11 2.17 634 795 825 United States ........................... 325 350 334 2.22 2.33 2.31 720 815 771 China ........................................ 475 500 525 1.16 1.15 1.19 550 575 625 Belarus ..................................... 150 151 150 3.33 2.27 3.00 500 342 450 Chile ......................................... 108 75 80 5.31 5.13 5.50 573 385 440 Ukraine ..................................... 208 198 180 2.31 2.14 2.39 481 423 430 Argentina .................................. 220 238 143 2.24 2.40 2.31 492 572 330 Norway ..................................... 68 69 70 4.16 2.09 4.29 283 144 300 Kazakhstan .............................. 213 235 243 1.34 1.43 1.10 285 336 267 Turkey ...................................... 113 100 100 2.21 2.30 2.30 250 230 230 Algeria ...................................... 85 85 85 1.29 1.29 1.29 110 110 110 Mexico ...................................... 44 50 50 1.64 2.06 1.80 72 103 90 Serbia ....................................... 30 30 30 2.17 2.17 2.17 65 65 65 Bosnia and Herzegovina ......... 11 14 14 2.73 2.79 3.00 30 39 42 Morocco ................................... 30 45 45 1.17 1.40 0.89 35 63 40 South Africa ............................. 15 20 25 1.53 1.65 1.60 23 33 40 New Zealand ............................ 6 5 6 5.83 5.00 5.50 35 25 33 Albania ..................................... 15 13 14 2.27 2.08 2.14 34 27 30 Uruguay ................................... 19 26 14 1.68 2.04 1.86 32 53 26
FAS, Office of Global Analysis, (202) 720-6301. Prepared or estimated on the basis of official USDA production, supply, and distribution, supply, and and distribution statistics from foreign governments.
Table 1-52. Oats: International trade, 2017/2018–2019/2020
Country 2017/2018 2018/2019 2019/2020
1,000 metric tons
Principle exporting countries: Canada ................................................... 1,631 1,734 1,800 Australia ................................................. 550 240 250 European Union ..................................... 186 106 125 Russia .................................................... 28 122 110 Chile ....................................................... 38 38 40 United States .......................................... 35 25 29 Kazakhstan ............................................. 10 29 20 Ukraine ................................................... 9 8 10 Argentina ................................................ 0 0 5 Brazil ...................................................... 4 6 5 Serbia ..................................................... 1 1 2
Principle importing countries: United States .......................................... 1,537 1,493 1,637 China ...................................................... 389 224 200 Mexico .................................................... 129 151 100 Japan ...................................................... 44 46 50 Switzerland ............................................. 51 54 50 South Africa ............................................ 39 23 40 Ecuador .................................................. 41 30 30 Norway ................................................... 16 92 30 Korea, South .......................................... 46 31 25 Algeria .................................................... 7 1 20 India ........................................................ 19 21 20 Belarus ................................................... 2 26 10 Canada ................................................... 14 11 10 Bosnia and Herzegovina ........................ 6 3 5 Colombia ................................................ 1 5 5 European Union ..................................... 4 14 5 Turkey .................................................... 0 0 5 Uruguay .................................................. 6 5 5 Serbia ..................................................... 1 1 3 Morocco .................................................. 2 2 2 Ukraine ................................................... 0 3 1 Kazakhstan ............................................. 0 1 0
FAS, Office of Global Analysis, (202) 720-6301. Prepared or estimated on the basis of official USDA production, supply, and distribution statistics from foreign governments.

I–35 AGRICULTURAL STATISTICS 2020
Table 1-53.—Barley: Area, yield, production, and value, United States, 2010–2019
Year
Area Yield per
harvested acre Production
Marketing year average price per bushel received
by farmers
Value of production Planted 1 Harvested
1,000 acres 1,000 acres Bushels 1,000 bushels Dollars 1,000 dollars
2010 ......... 2,872 2,465 73.1 180,241 3 .86 691,573 2011 ......... 2,564 2,241 69.1 154,788 5 .35 808,741 2012 ......... 3,660 3,274 66.9 218,990 6 .43 1,371,381 2013 ......... 3,528 3,040 71.3 216,745 6 .06 1,265,798 2014 ......... 3,031 2,497 72.7 181,542 5 .30 914,955 2015 ......... 3,583 3,158 69.1 218,187 5 .52 1,149,831 2016 ......... 3,059 2,565 77.9 199,914 4 .96 949,876 2017 ......... 2,486 1,962 73.0 143,258 4 .47 624,184 2018 ......... 2,548 1,982 77.5 153,527 4 .62 697,598 2019 ......... 2,721 2,182 77.7 169,566 4 .60 761,152
1 Barley sown for all purposes, including barley sown in the preceding fall. NASS, Crops Branch, (202) 720–2127.
Table 1-54.—Barley: Stocks on and off farms, United States, 2010–2019
Year beginning
September
On farms Off farms 1
Sep. 1 Dec. 1 Mar. 1 June 1 Sep. 1 Dec. 1 Mar. 1 June 1
1,000 bushels
2010 ................ 125,070 91,660 67,370 40,440 98,818 88,720 89,985 75,059 2011 ................ 93,050 55,320 57,700 26,040 82,007 82,999 80,424 63,311 2012 ................ 112,550 72,580 26,480 9,670 85,226 85,473 67,248 50,317 2013 ................ 105,620 81,340 35,180 15,840 90,470 88,063 81,897 64,557 2014 ................ 97,820 74,510 43,830 19,110 81,997 81,625 77,734 63,145 2015 ................ 135,840 96,670 41,990 20,940 83,132 83,738 76,247 57,639 2016 ................ 130,600 99,100 57,910 27,740 99,737 93,429 79,832 74,370 2017 ................ 90,400 74,340 56,490 27,050 89,283 84,528 88,211 79,314 2018 ................ 91,350 72,070 48,540 26,420 83,456 80,561 81,491 68,061 2019 ................ 116,720 87,630 46,180 22,870 73,112 69,756 75,216 63,653
1 Includes stocks at mills, elevators, warehouses, terminals, and processors. NASS, Crops Branch, (202) 720–2127.
Table 1-55.—Barley: Supply and disappearance, United States, 2009–2018
Year beginning
June 1
Supply Disappearance Ending stocks May 31
Beginning stocks
Produc-tion Imports Total
Domestic use
Exports Total dis-appearance Total 1
Food, alcohol, and in-dustrial
Seed Feed and residual
Million bushels
2009 ......... 89 227 17 332 159 5 47 6 216 115 2010 ......... 115 180 9 305 154 5 50 8 216 89 2011 ......... 89 155 16 260 149 6 37 9 200 60 2012 ......... 60 219 23 302 141 6 66 9 222 80 2013 ......... 80 217 19 316 148 5 66 14 234 82 2014 ......... 82 182 24 287 154 6 34 14 209 79 2015 ......... 79 218 19 315 153 5 44 11 213 102 2016 ......... 102 200 10 312 158 4 39 4 205 106 2017 ......... 106 143 9 259 153 4 2 5 164 94 2018 ......... 94 154 6 254 143 5 15 5 167 87
1 Privately held: Includes quantity under loan and farmer-owned reserve. Includes quantity under loan and farmer–owned reserve. Latest data may be preliminary or projected. Totals may not
add due to independent rounding. ERS, Market and Trade Economics Division, (202) 694–5313.

I–36 GRAIN AND FEED
Table 1-56.—Barley: Area, yield, and production, by State and United States, 2017–2019
State Area planted 1 Area harvested
2017 2018 2019 2017 2018 2019
1,000 acres 1,000 acres 1,000 acres 1,000 acres 1,000 acres 1,000 acres
Alaska 2 .............................. (X) 5 6 (X) 4 5 Arizona ............................... 20 14 17 17 11 14 California ............................ 75 65 60 29 26 43 Colorado ............................ 70 60 54 68 53 52 Delaware ............................ 32 25 21 18 14 14 Idaho .................................. 530 550 540 510 530 520 Kansas 3 ............................. (NA) 17 14 (NA) 6 4 Maine 3 ............................... (NA) 17 16 (NA) 16 15 Maryland ............................ 50 45 32 27 24 17 Michigan 3 .......................... (NA) 20 11 (NA) 5 8 Minnesota .......................... 80 80 70 68 67 55 Montana ............................. 770 790 920 565 600 740 New York 3 ......................... (NA) 10 10 (NA) 8 4 North Carolina 3 ................. (NA) 11 11 (NA) 8 6 North Dakota ..................... 520 470 580 400 385 445 Oregon ............................... 47 43 40 38 26 31 Pennsylvania ..................... 60 45 35 45 33 25 South Dakota 3 ................... (NA) 48 37 (NA) 13 9 Utah ................................... 25 21 17 18 16 10 Virginia ............................... 30 30 30 11 9 7 Washington ........................ 95 85 95 85 67 84 Wisconsin 3 ........................ (NA) 25 24 (NA) 10 8 Wyoming ............................ 82 72 81 63 51 66
United States 4 ................... 2,486 2,548 2,721 1,962 1,982 2,182
State Yield per harvested acre Production
2017 2018 2019 2017 2018 2019
1,000 1,000 1,000 Bushels Bushels Bushels bushels bushels bushels
Alaska 2 .............................. (X) 43.0 38.0 (X) 172 190 Arizona ............................... 131.0 100.0 126.0 2,227 1,100 1,764 California ............................ 50.0 69.0 66.0 1,450 1,794 2,838 Colorado ............................ 132.0 145.0 138.0 8,976 7,685 7,176 Delaware ............................ 85.0 78.0 80.0 1,530 1,092 1,120 Idaho .................................. 95.0 101.0 104.0 48,450 53,530 54,080 Kansas 3 ............................. (NA) 31.0 33.0 (NA) 186 132 Maine 3 ............................... (NA) 73.0 82.0 (NA) 1,168 1,230 Maryland ............................ 76.0 70.0 85.0 2,052 1,680 1,445 Michigan 3 .......................... (NA) 43.0 44.0 (NA) 215 352 Minnesota .......................... 76.0 76.0 67.0 5,168 5,092 3,685 Montana ............................. 51.0 56.0 59.0 28,815 33,600 43,660 New York 3 ......................... (NA) 58.0 52.0 (NA) 464 208 North Carolina 3 ................. (NA) 80.0 66.0 (NA) 640 396 North Dakota ..................... 65.0 74.0 72.0 26,000 28,490 32,040 Oregon ............................... 62.0 53.0 78.0 2,356 1,378 2,418 Pennsylvania ..................... 70.0 63.0 70.0 3,150 2,079 1,750 South Dakota 3 ................... (NA) 55.0 43.0 (NA) 715 387 Utah ................................... 75.0 86.0 93.0 1,350 1,376 930 Virginia ............................... 73.0 70.0 65.0 803 630 455 Washington ........................ 53.0 73.0 70.0 4,505 4,891 5,880 Wisconsin 3 ........................ (NA) 45.0 46.0 (NA) 450 368 Wyoming ............................ 102.0 100.0 107.0 6,426 5,100 7,062
United States 4 ................... 73.0 77.5 77.7 143,258 153,527 169,566
(NA) Not available. (X) Not applicable. 1 Includes area planted in the preceding fall. 2 Alaska data previously included in a separate table for Alaska. 3 Estimates began in 2018. 4 Beginning in 2018, United States total includes data for Alaska.
NASS, Crops Branch, (202) 720–2127.

I–37 AGRICULTURAL STATISTICS 2020
Table 1-57.—Barley: Marketing year average price and value, by State and United States, 2017–2019
State Marketing year average price per bushel Value of production
2017 2018 2019 1 2017 2018 2019 1
Dollars Dollars Dollars 1,000 dollars 1,000 dollars 1,000 dollars
Alaska 2 .............................. (X) 5.20 5.20 (X) 894 988 Arizona ............................... 3.91 3.84 4.20 8,708 4,224 7,409 California ............................ 4.82 4.84 4.60 6,989 8,683 13,055 Colorado ............................ 4.60 4.55 4.55 41,290 34,967 32,651 Delaware ............................ 2.90 2.60 3.10 4,437 2,839 3,472 Idaho .................................. 4.75 5.03 4.90 230,138 269,256 264,992 Kansas 3 ............................. (NA) 3.20 3.30 (NA) 595 436 Maine 3 ............................... (NA) 2.90 3.05 (NA) 3,387 3,752 Maryland ............................ 2.90 2.60 3.10 5,951 4,368 4,480 Michigan 3 .......................... (NA) 2.45 3.00 (NA) 527 1,056 Minnesota .......................... 4.33 4.22 4.40 22,377 21,488 16,214 Montana ............................. 4.34 4.62 4.40 125,057 155,232 192,104 New York 3 ......................... (NA) 2.90 3.85 (NA) 1,346 801 North Carolina 3 ................. (NA) 2.70 3.25 (NA) 1,728 1,287 North Dakota ..................... 4.31 4.24 4.15 112,060 120,798 132,966 Oregon ............................... 2.99 3.28 3.90 7,044 4,520 9,430 Pennsylvania ..................... 3.10 2.90 3.90 9,765 6,029 6,825 South Dakota 3 ................... (NA) 3.65 3.85 (NA) 2,610 1,490 Utah ................................... 3.08 3.69 3.80 4,158 5.077 3,534 Virginia ............................... 2.60 2.60 3.00 2,088 1,638 1,365 Washington ........................ 3.09 4.40 4.55 13,920 21,520 26,754 Wisconsin 3 ........................ (NA) 4.00 5.00 (NA) 1,800 1,840 Wyoming ............................ 4.70 4.72 4.85 30,202 24,072 34,251
United States ..................... 4.47 4.62 4.60 624,184 697,598 761,152
(NA) Not available. (X) Not applicable. 1 Preliminary. 2 Alaska data previously included in a separate table for Alaska. 3 Estimates began in 2018. 4 Beginning in 2018, United States total includes data for Alaska.
NASS, Crops Branch, (202) 720–2127.
Table 1-58.—Barley: Support operations, United States, 2013–2019
Marketing year beginning June 1
Income support payment rates per bushel 1
Program price levels per bushel
Put under loan Acquired by CCC under
loan program 5
Owned by CCC at end
of mar-keting year Loan 2 Target/
reference 3 Quantity
Percentage of
production 4
Million Million Million Dollars Dollars Dollars bushels Percent bushels bushels
2013/2014 .................. 0.24/0.00 1.95 2.63 4.2 1.9 0 0 2014/2015 .................. 0.00 1.95 4.95 3.9 2.1 0 0 2015/2016 .................. 0.00 1.95 4.95 8.3 3.8 0 0 2016/2017 .................. 0.00 1.95 4.95 9.3 4.6 0 0 2017/2018 .................. 0.50 1.95 4.95 4.5 3.1 0 0 2018/2019 .................. 0.33 1.95 4.95 5.1 3.3 0 0 2019/2020 .................. 0.35 2.50 4.95 6.1 3.6 0 0
1 The first entry is the direct payment rate and the second entry is the counter-cyclical payment rate for 2004/2005-2013/ 2014. For 2009/2010-2013/2014, producers who participated in the Average Crop Revenue (ACRE) program got a 20 per-cent reduction in their direct payment, not calculated in this table. For 2014/2015 and after, the entry is the price loss cov-erage payment rate. Agricultural Risk Coverage (ARC) is also available, but payment rates are established at the county or farm levels. 2 For 2009/2010-2013/2014, producers who participated in the ACRE program got a 30 percent reduction in their loan rate, not calculated in this table. 3 Target applies to 2003/2004-2013/2014 and Reference applies beginning with 2014/2015. 4 Percent of production is on a grain basis. 5 Acquisitions as of January 31, 2020.
FPAC-BC, Commodity Analysis Branch.

I–38 GRAIN AND FEED
Table 1-59.—International Barley: Area, yield, and production in specified countries, 2017/2018–2019/2020
Country
Area Yield per hectare Production
2017/ 2018
2018/ 2019
2019/ 2020
2017/ 2018
2018/ 2019
2019/ 2020
2017/ 2018
2018/ 2019
2019/ 2020
1,000 hectares Metric tons 1,000 metric tons
European Union ..... 12,095 12,278 12,380 4.85 4.56 5.07 58,654 55,947 62,750 Russia .................... 7,714 7,784 8,403 2.62 2.15 2.37 20,211 16,737 19,939 Canada ................... 2,114 2,395 2,700 3.73 3.50 3.85 7,891 8,380 10,400 Ukraine ................... 2,652 2,569 2,700 3.28 2.96 3.52 8,695 7,604 9,500 Australia ................. 4,124 3,719 3,950 2.24 2.24 2.23 9,254 8,310 8,800 Turkey .................... 3,400 3,600 3,800 1.88 1.94 2.08 6,400 7,000 7,900 Kazakhstan ............ 2,069 2,516 2,977 1.60 1.58 1.29 3,305 3,971 3,830 Argentina ................ 935 1,200 1,000 4.00 4.22 3.80 3,740 5,060 3,800 United States ......... 794 802 883 3.93 4.17 4.18 3,119 3,343 3,692 Iran ......................... 1,600 1,550 1,700 1.94 1.81 2.12 3,100 2,800 3,600 Ethiopia .................. 955 1,000 1,000 2.13 2.20 2.30 2,032 2,200 2,300 Algeria .................... 763 1,026 1,025 1.27 1.90 2.00 968 1,950 2,050 Syria ....................... 800 800 1,500 0.97 0.50 1.33 777 400 2,000 India ....................... 656 661 696 2.66 2.69 2.35 1,747 1,781 1,633 Iraq ......................... 775 600 1,200 1.26 1.30 1.33 975 780 1,600 Belarus ................... 452 429 400 3.14 2.20 3.50 1,420 944 1,400 Morocco ................. 1,893 1,597 1,450 1.30 1.82 0.83 2,466 2,910 1,200 Mexico .................... 358 353 360 2.81 2.82 2.81 1,005 996 1,010 China ...................... 330 263 260 3.29 3.64 3.46 1,085 957 900 Azerbaijan .............. 319 337 320 2.48 2.72 2.72 792 916 870
FAS, Office of Global Analysis, (202) 720-6301. Prepared or estimated on the basis of official USDA production, supply, and distribution statistics from foreign governments.
Table 1-60.—Barley: International trade, 2017/2018–2019/2020
Country 2017/2018 2018/2019 2019/2020
1,000 metric tons
Principle importing countries: Saudi Arabia ........................................... 8,000 6,500 7,500 China ...................................................... 8,144 5,181 6,500 Iran ......................................................... 3,200 3,100 3,000 Japan ...................................................... 1,253 1,158 1,200 Morocco .................................................. 429 204 1,000 Jordan .................................................... 773 916 900 Brazil ...................................................... 547 656 700 Turkey .................................................... 753 279 700 Libya ....................................................... 438 888 650 European Union ..................................... 451 127 600 Tunisia .................................................... 604 639 500 Kuwait ..................................................... 521 474 400 United Arab Emirates ............................. 263 476 400 Colombia ................................................ 324 341 350 Israel ....................................................... 234 236 300 Thailand .................................................. 147 206 300 India ........................................................ 211 135 250 Algeria .................................................... 522 323 200 Egypt ...................................................... 21 78 200 Lebanon ................................................. 197 191 200 Mexico .................................................... 5 1 200 Belarus ................................................... 49 197 175 United States .......................................... 199 128 174
Principle exporting countries: European Union ..................................... 5,667 5,899 5,000 Russia .................................................... 2,951 5,884 4,800 Australia ................................................. 9,190 5,725 4,600 Ukraine ................................................... 5,354 4,289 3,800 Argentina ................................................ 2,556 2,500 3,100 Canada ................................................... 1,546 2,021 2,200 Kazakhstan ............................................. 682 1,347 1,800 United States .......................................... 95 111 109 Turkey .................................................... 14 0 100 Uruguay .................................................. 114 5 100 Serbia ..................................................... 26 53 85 Moldova .................................................. 117 127 70 India ........................................................ 1 1 7 Belarus ................................................... 16 0 0 Azerbaijan .............................................. 7 0 0
FAS, Office of Global Analysis, (202) 720-6301. Prepared or estimated on the basis of official USDA production, supply, and distribution statistics from foreign governments.

I–39 AGRICULTURAL STATISTICS 2020
Table 1-61.—Grains and grain products: Food availability, United States, 2009–2018
Year 1
Wheat Rye Rice (milled)
Total 2
Per capita availability
Total 2 Per capita
availability of rye flour
Total 4 Per capita availability Flour 3 Non-milled
product
Million Million Million bushels Pounds Pounds bushels Pounds cwt. Pounds
2009 ...... 920 134.7 2.3 3.3 0.5 62.6 20.4 2010 ...... 928 134.8 2.3 3.3 0.5 63.1 20.4 2011 ...... 925 132.5 2.3 3.3 0.5 (NA) (NA) 2012 ...... 952 134.3 2.3 3.4 0.5 (NA) (NA) 2013 ...... 945 135.0 2.3 3.4 0.5 (NA) (NA) 2014 ...... ...................... 134.7 ...................... 3.5 0.5 (NA) (NA) 2015 ...... ...................... 133.0 ...................... 3.6 0.5 (NA) (NA) 2016 ...... ...................... 131.7 ...................... 3.7 0.5 (NA) (NA) 2017 ...... ...................... 131.8 ...................... 3.8 0.5 (NA) (NA) 2018 ...... ...................... 132.1 ...................... 3.6 0.5 (NA) (NA)
Year 1
Corn Oats Barley
Total 5
Per capita availability of food products
Total 6
Per capita availability
of food products
Total 7
Per capita availability
of food products 8
Flour and meal
Hominy and grits
Food Starch Total
Million Million Million bushels Pounds Pounds Pounds Pounds bushels Pounds bushels Pounds
2009 ...... 986 19.3 9.3 4.4 33.0 66.2 4.7 6.9 0.7 2010 ...... 973 19.3 9.3 4.5 33.1 67.2 4.7 6.8 0.7 2011 ...... 989 19.9 9.6 4.6 34.1 68.8 4.8 6.8 0.7 2012 ...... 980 19.8 9.5 4.6 33.9 68.1 4.7 6.5 0.6 2013 ...... 958 19.8 9.5 4.6 33.9 66.2 4.5 7.5 0.7 2014 ...... ................ 19.9 9.5 4.6 34.0 66.4 4.5 7.7 0.7 2015 ...... ................ 19.9 9.5 4.6 34.0 68.0 4.6 8.0 0.8 2016 ...... ................ 20.0 9.5 4.7 34.2 69.0 4.6 9.0 0.8 2017 ...... ................ 21.0 9.5 4.7 35.2 72.0 4.8 9.5 0.9 2018 ...... ................ 21.0 9.5 4.7 35.2 72.5 4.8 9.7 0.9
Estimates of corn syrup and sugar are unofficial estimates; industry data were not reported after April 1968. Annual data and per capita estimates for rice are unavailable beyond 2010 due to a large and unexplained decline in the
implied total domestic and residual use estimate. (NA) Not available. 1 Data are in marketing year; for corn, September 1-August 31; for oats and barley, June 1-May 31;
and rice, August 1-July 31. Wheat, rye, syrup, and sugar are in calendar year. 2 Excludes quantities used in alcoholic bev-erages. 3 Includes white, whole wheat, and semolina flour. 4 Does not include shipments to U.S. territories. Excludes rice used in alcoholic beverages. Includes imports and rice used in processed foods and pet foods. 5 Includes an allowance for the quantity used as hominy and grits. This series is not adjusted for trade. 6 Oats used in oatmeal, prepared breakfast foods, infant foods, and food products. 7 Malt for food, breakfast food uses, pearl barley, and flour. 8 Malt equivalent of barley food products.
ERS, Market & Trade Economics Division, (202) 694-5290. All figures are estimates based on data from private industry sources, the U.S. Department of Commerce, the Internal Revenue Service, and other Government agencies.

I–40 GRAIN AND FEED
Table 1-62.—Sorghum: Area, yield, production, and value, United States, 2010–2019
Year
Area planted
for all pur-poses 1
Sorghum for grain 2 Sorghum for silage
Area harvested
Yield per harvested
acre
Produc-tion
Marketing year aver-age price per cwt 3
Value of production 3
Area harvested
Yield per harvested
acre
Produc-tion
1,000 1,000 1,000 1,000 1,000 1,000 acres acres Bushels bushels Dollars dollars acres Tons tons
2010 .. 5,369 4,806 71.9 345,464 8.96 1,616,773 272 12.5 3,412 2011 .. 5,451 3,945 54.0 212,993 10.70 1,259,635 226 10.4 2,353 2012 .. 6,259 4,995 49.6 247,742 11.30 1,606,237 353 11.9 4,196 2013 .. 8,076 6,585 59.6 392,331 7.64 1,716,927 380 14.3 5,420 2014 .. 7,138 6,401 67.6 432,575 7.20 1,721,330 315 13.1 4,123 2015 .. 8,459 7,851 76.0 596,751 5.91 2,064,638 306 14.6 4,475 2016 .. 6,690 6,163 77.9 480,261 4.98 1,352,438 298 14.0 4,171 2017 .. 5,629 5,044 71.7 361,871 5.75 1,168,526 282 13.4 3,772 2018 .. 5,690 5,061 72.1 364,986 5.82 1,180,847 264 12.6 3,326 2019 .. 5,265 4,675 73.0 341,460 6.00 1,151,709 339 11.9 4,019
1 Grain and sweet sorghum for all uses, including syrup. 2 Includes both grain sorghum for grain, and sweet sorghum for grain or seed. 3 Based on the reported price of grain sorghum.
NASS, Crops Branch, (202) 720–2127.
Table 1-63.—Sorghum grain: Stocks on and off farms, United States, 2010–2019
Year beginning previous Dec.
On farms Off farms 1
Dec. 1 Mar. 1 Jun. 1 Sep. 1 Dec. 1 Mar. 1 Jun. 1 Sep. 1
1,000 1,000 1,000 1,000 1,000 1,000 1,000 1,000 bushels bushels bushels bushels bushels bushels bushels bushels
2010 ................ 48,000 23,680 10,700 4,500 202,759 151,873 77,162 36,740 2011 ................ 30,500 13,020 3,140 2,030 207,168 158,027 76,894 25,420 2012 ................ 27,850 12,800 4,120 1,160 123,101 95,266 54,405 21,792 2013 ................ 17,600 10,850 2,710 602 122,247 80,685 38,398 14,551 2014 ................ 32,950 15,950 4,500 1,945 198,466 159,784 87,924 32,087 2015 ................ 30,500 9,000 2,960 1,895 192,094 110,856 31,329 16,514 2016 ................ 51,500 25,000 9,700 3,755 271,035 176,584 80,654 32,877 2017 ................ 43,000 21,250 8,620 4,280 266,079 159,495 76,088 29,179 2018 ................ 33,800 13,250 5,220 3,355 193,692 127,006 60,113 31,499 2019 2 .............. 44,200 24,990 9,470 3,210 214,580 167,736 107,962 60,451
1 Includes stocks at mills, elevators, warehouses, terminals, and processors. 2 Preliminary. NASS, Crops Branch, (202) 720–2127.
Table 1-64.—Sorghum: Supply and disappearance, United States, 2009–2018
Year beginning
September 1
Supply Disappearance
Ending stocks
Aug. 31 1 Beginning stocks Production Total
Domestic use
Exports Total disappearance
Food, alcohol,
and industrial
Seed Feed and residual
Million bushels
2009 ......... 55 382 436 89 1 141 164 395 41 2010 ......... 41 345 387 84 1 123 152 359 27 2011 ......... 27 213 241 84 1 69 63 218 23 2012 ......... 23 248 280 94 1 93 76 265 15 2013 ......... 15 392 408 69 1 93 211 374 34 2014 ......... 34 433 467 14 1 82 352 449 18 2015 ......... 18 597 620 136 1 104 342 583 37 2016 ......... 37 480 519 114 1 133 238 485 33 2017 ......... 33 362 397 60 1 102 200 362 35 2018 ......... 35 365 400 105 1 138 93 336 64
1 Includes quantity under loan and farmer–owned reserve. Latest data may be preliminary or projected. Totals may not add due to independent rounding. ERS, Market and Trade Economics Division, (202) 694–5313. Source: USDA, World Agricultural Outlook Board, World
Agricultural Supply and Demand Estimates and supporting materials.l

I–41 AGRICULTURAL STATISTICS 2020
Table 1-65.—Sorghum: Area, yield, and production, by State and United States, 2017–2019
State Area planted for all purposes
Sorghum for grain
2017 2018 2019
Area harvested
2017 2018 2019
1,000 acres 1,000 acres 1,000 acres 1,000 acres 1,000 acres 1,000 acres
Arkansas ................ 9 12 (NA) 7 10 (NA) Colorado ................ 410 355 365 360 325 310 Georgia .................. 21 25 (NA) 12 15 (NA) Illinois ..................... 17 18 (NA) 15 16 (NA) Kansas ................... 2,600 2,800 2,600 2,450 2,650 2,400 Louisiana ............... 15 8 (NA) 13 6 (NA) Mississippi ............. 5 4 (NA) 4 3 (NA) Missouri ................. 30 30 (NA) 23 21 (NA) Nebraska ............... 180 230 200 130 170 130 New Mexico ........... 85 80 (NA) 48 47 (NA) North Carolina ....... 22 18 (NA) 17 8 (NA) Oklahoma .............. 315 300 300 295 240 260 South Dakota ......... 270 260 250 170 200 175 Texas ..................... 1,650 1,550 1,550 1,500 1,350 1,400
United States ......... 5,629 5,690 5,265 5,044 5,061 4,675
State Yield per harvested acre Production
2016 2017 2018 2016 2017 2018
1,000 1,000 1,000 Bushels Bushels Bushels bushels bushels bushels
Arkansas ................ 78.0 77.0 (NA) 546 770 (NA) Colorado ................ 52.0 53.0 41.0 18,720 17,225 12,710 Georgia .................. 54.0 53.0 (NA) 648 795 (NA) Illinois ..................... 83.0 111.0 (NA) 1,245 1,776 (NA) Kansas ................... 82.0 88.0 85.0 200,900 233,200 204,000 Louisiana ............... 91.0 84.0 (NA) 1,183 504 (NA) Mississippi ............. 72.0 90.0 (NA) 288 270 (NA) Missouri ................. 107.0 100.0 (NA) 2,461 2,100 (NA) Nebraska ............... 89.0 94.0 93.0 11,570 15,980 12,090 New Mexico ........... 35.0 38.0 (NA) 1,680 1,786 (NA) North Carolina ....... 55.0 60.0 (NA) 935 480 (NA) Oklahoma .............. 53.0 50.0 51.0 15,635 12,000 13,260 South Dakota ......... 68.0 80.0 80.0 11,560 16,000 14,000 Texas ..................... 63.0 46.0 61.0 94,500 62,100 85,400
United States ......... 71.7 72.1 73.0 361,871 364,986 341,460
(NA) Not available. NASS, Crops Branch, (202) 720–2127.
Table 1-66.—Sorghum silage: Area harvested, yield, and production, by State and United States, 2017–2019
State
Silage
Area harvested Yield per acre Production
2017 2018 2019 2017 2018 2018 2017 2018 2019
1,000 1,000 1,000 1,000 1,000 1,000 acres acres acres Tons Tons Tons tons tons tons
Arkansas ......... 1 1 (NA) 16.0 18.0 (NA) 16 18 (NA) Colorado ......... 25 8 18 15.0 14.0 17.0 375 112 306 Georgia ........... 8 8 (NA) 13.0 11.0 (NA) 104 88 (NA) Illinois .............. 1 1 (NA) 12.0 14.0 (NA) 12 14 (NA) Kansas ............ 85 60 95 13.0 15.0 11.0 1,105 900 1,045 Louisiana ......... 1 1 (NA) 12.0 12.0 (NA) 12 12 (NA) Mississippi ....... 1 1 (NA) 8.0 10.0 (NA) 8 10 (NA) Missouri ........... 5 7 (NA) 19.0 12.0 (NA) 95 84 (NA) Nebraska ......... 20 20 60 11.0 11.0 10.0 220 220 600 New Mexico .... 17 18 (NA) 11.0 11.0 (NA) 187 198 (NA) North Carolina 4 7 (NA) 10.0 10.0 (NA) 40 70 (NA) Oklahoma ........ 12 12 16 18.0 5.0 10.0 216 60 160 South Dakota .. 37 40 65 11.0 12.5 13.0 407 500 845 Texas .............. 65 80 85 15.0 13.0 12.5 975 1,040 1,063
United States .. 282 264 339 13.4 12.6 11.9 3,772 3,326 4,019
(NA) Not available. NASS, Crops Branch, (202) 720–2127.

I–42 GRAIN AND FEED
Table 1-67.—Sorghum grain: Marketing year average price and value of production, by State and United States, 2017–2019
State Marketing year average price per cwt Value of production
2017 2018 2019 1 2017 2018 2019 1
Dollars Dollars Dollars 1,000 dollars 1,000 dollars 1,000 dollars
Arkansas .............. 5.66 (D) (NA) 1,731 (D) (NA) Colorado .............. 5.45 4.93 4.70 57,133 47,555 33,453 Georgia ................ 7.96 7.40 (NA) 2,889 3,294 (NA) Illinois ................... 6.37 6.14 (NA) 4,441 6,107 (NA) Kansas ................. 5.58 5.59 5.85 627,772 730,009 668,304 Louisiana ............. 6.19 6.10 (NA) 4,101 1,722 (NA) Mississippi ........... 5.72 (D) (NA) 923 (D) (NA) Missouri ............... 5.60 6.40 (NA) 7,718 7,526 (NA) Nebraska ............. 5.15 5.45 5.85 33,368 48,771 39,607 New Mexico ......... 6.12 6.98 (NA) 5,758 6,981 (NA) North Carolina ..... 6.50 6.60 (NA) 3,403 1,774 (NA) Oklahoma ............ 5.64 5.95 6.15 49,382 39,984 45,667 South Dakota ....... 5.64 5.86 5.95 36,511 52,506 46,648 Texas ................... 6.30 6.64 6.65 333,396 230,913 318,030
Other States 2 ...... (X) 6.36 (X) - 3,705 -
United States ....... 5.75 5.82 6.00 1,168,526 1,180,847 1,151,709
(D) Withheld to avoid disclosing data for individual operations. (NA) Not available. (X) Not applicable. 1 Preliminary. 2 Includes data withheld above.
NASS, Crops Branch, (202) 720–2127.
Table 1-68.—Sorghum grain: Support operations, United States, 2013–2019
Marketing year beginning
September 1
Income support payment rates per
cwt 1
Program price levels per cwt Put under support Acquired by CCC under
loan program 5
Owned by CCC at end of marketing
year Loan 2 Target/ reference 3 Quantity
Percentage of
production 4
Dollars Dollars Dollars Million cwt Percent Millions cwt Million cwt
2013/2014 ...... 0.63/0.00 3.48 4.70 0.3 0.1 0 0 2014/2015 ...... 0.00 3.48 7.05 0.4 0.2 0 0 2015/2016 ...... 0.64 3.48 7.05 1.4 0.4 0 0 2016/2017 ...... 1.16 3.48 7.05 1.9 0.7 0 0 2017/2018 ...... 0.73 3.48 7.05 1.3 0.6 0 0 2018/2019 ...... 1.25 3.48 7.05 1.2 0.6 0 0 2019/2020 ...... 1.10 3.93 7.05 1.6 0.8 0 0
1 The first entry is the direct payment rate and the second entry is the counter-cyclical payment rate for 2004/2005-2013/ 2014. For 2009/2010-2013/2014, producers who participated in the Average Crop Revenue (ACRE) program got a 20 per-cent reduction in their direct payment, not calculated in this table. For 2014/2015 and after, the entry is the price loss cov-erage (PLC) payment rate. For 2017/2018, projected PLC payment rate is based on March 2018 WASDE MY price. Agricul-tural Risk Coverage (ARC) is also available, but payment rates are established at the county or farm levels. 2 For 2009/ 2010-2013/2014, producers who participate in the ACRE program get a 30 percent reduction in their loan rate, not cal-culated in this table. 3 Target applies to 2003/2004-2013/2014 and Reference applies beginning with 2014/ 2015. 4 Percent of production is on a grain basis. 5 Acquisitions as of January 31, 2020.
FPAC-BC, Commodity Analysis Branch.

I–43 AGRICULTURAL STATISTICS 2020
Table 1-69.—International Sorghum: Area, yield, and production in specified countries, 2017/2018–2019/2020
Country
Area Yield per hectare Production
2017/ 2018
2018/ 2019
2019/ 2020
2017/ 2018
2018/ 2019
2019/ 2020
2017/ 2018
2018/ 2019
2019/ 2020
1,000 hectares Metric tons 1,000 metric tons
United States ....... 2,041 2,048 1,892 4.50 4.53 4.58 9,192 9,271 8,673 Nigeria ................. 5,820 5,800 5,900 1.19 1.17 1.17 6,939 6,800 6,900 Ethiopia ................ 1,900 1,900 1,900 2.72 2.71 2.74 5,170 5,150 5,200 Mexico ................. 1,350 1,350 1,350 3.37 3.48 3.33 4,545 4,700 4,500 Sudan .................. 5,024 3,919 4,600 0.96 0.89 0.96 4,803 3,475 4,400 India ..................... 5,412 7,000 7,000 0.69 0.71 0.57 3,743 4,953 4,000 China ................... 506 720 750 4.87 4.79 4.80 2,465 3,450 3,600 Argentina ............. 700 630 575 4.29 3.97 4.35 3,000 2,500 2,500 Brazil .................... 782 732 730 2.73 2.97 2.88 2,136 2,177 2,100 Niger .................... 3,821 3,700 3,700 0.51 0.57 0.51 1,945 2,100 1,900 Burkina ................. 1,667 1,800 1,800 0.82 1.07 1.00 1,366 1,930 1,800 Mali ...................... 1,386 1,500 1,500 1.03 0.98 0.87 1,424 1,470 1,300 Cameroon ............ 852 850 850 1.59 1.41 1.41 1,352 1,200 1,200 Australia ............... 1,147 1,100 1,100 0.83 0.90 0.86 946 988 950 Chad .................... 388 285 335 2.64 2.74 2.60 1,023 780 871 Tanzania .............. 124 135 157 5.32 5.46 5.22 660 737 820 Bolivia .................. 783 800 800 0.96 0.84 1.00 755 672 800 Egypt .................... 140 140 140 5.36 5.36 5.36 750 750 750 European Union ... 600 600 600 1.11 1.08 1.17 667 650 700 South Sudan ........ 462 496 250 2.72 2.58 1.60 1,257 1,278 400
FAS, Office of Global Analysis, (202) 720-6301. Prepared or estimated on the basis of official USDA production, supply, and distribution statistics from foreign governments.
Table 1-70.—Sorghum: International trade, 2017/2018–2019/2020
Country 2017/2018 2018/2019 2019/2020
1,000 metric tons
Principle exporting countries: United States .......................................... 5,089 2,351 3,429 Argentina ................................................ 36 196 200 Nigeria .................................................... 100 100 100 Ukraine ................................................... 123 93 100 Ethiopia .................................................. 75 75 75 India ........................................................ 125 51 50 Australia ................................................. 456 110 40 China ...................................................... 43 49 40 Kenya ..................................................... 129 41 30 Bolivia ..................................................... 21 18 20 Paraguay ................................................ 4 15 15 Brazil ...................................................... 1 33 5 Burkina ................................................... 5 5 5 South Africa ............................................ 6 5 5 Sudan ..................................................... 100 50 5 Tanzania ................................................. 5 5 5 Uganda ................................................... 5 5 5 European Union ..................................... 2 7 2 Thailand .................................................. 5 1 2
Principle importing countries: China ...................................................... 4,436 652 1,300 Mexico .................................................... 98 596 700 Japan ...................................................... 594 452 500 European Union ..................................... 420 759 200 Sudan ..................................................... 150 160 200 Kenya ..................................................... 119 129 150 South Sudan .......................................... 148 26 150 Chile ....................................................... 76 40 100 Colombia ................................................ 56 0 50 Somalia .................................................. 80 85 50 South Africa ............................................ 48 60 50 Taiwan .................................................... 64 70 50 Uganda ................................................... 35 35 40 Eritrea ..................................................... 30 60 30 Botswana ................................................ 4 1 25 Cameroon ............................................... 15 25 25 Chad ....................................................... 25 25 25 Niger ....................................................... 25 25 25 Pakistan .................................................. 63 27 25 Israel ....................................................... 29 36 20 Philippines .............................................. 21 36 20 Rwanda .................................................. 20 20 20
FAS, Office of Global Analysis, (202) 720-6301. Prepared or estimated on the basis of official USDA production, supply, and distribution statistics from foreign governments.

I–44 GRAIN AND FEED
Table 1-71.—International Mixed grain: Area, yield, and production in specified countries, 2017/2018–2019/2020
Country
Area Yield per hectare Production
2017/ 2018
2018/ 2019
2019/ 2020
2017/ 2018
2018/ 2019
2019/ 2020
2017/ 2018
2018/ 2019
2019/ 2020
1,000 hectares Metric tons 1,000 metric tons
Bangladesh .......... 35 35 35 0.71 0.71 0.71 25 25 25 Canada ................ 66 90 95 2.76 2.96 2.79 182 266 265 European Union ... 3,900 3,872 4,016 3.93 3.39 3.64 15,320 13,138 14,600 Switzerland .......... 10 10 10 6.00 6.00 6.00 60 60 60 Turkey .................. 1 1 1 1.00 1.00 1.00 1 1 1
FAS, Office of Global Analysis, (202) 720-6301. Prepared or estimated on the basis of official USDA production, supply, and distribution statistics from foreign governments.
Table 1-72.—Commercial feeds: Disappearance for feed, United States, 2007–2018
Year beginning October
Oilseed cake and meal
Soybean Cottonseed Linseed Peanut 1 Sunflower Canola Total
1,000 Short tons
2009 ......... 30,640 767 210 91 415 1,984 33,109 2010 ......... 30,301 1,079 208 112 281 2,968 33,354 2011 ......... 31,552 982 194 109 197 3,753 34,491 2012 ......... 28,999 1,012 199 123 241 4,260 31,913 2013 ......... 29,514 811 153 130 268 4,750 31,862 2014 ......... 32,277 794 212 141 224 4,891 35,038 2015 ......... 33,118 638 196 144 288 4,975 35,520 2016 ......... 33,420 687 190 177 293 5,011 41,290 2017 ......... 36,971 708 166 ...................... 261 4,616 ......................2018 ......... 35,952 750 173 ...................... 270 4,842 ......................
Year beginning October
Animal protein Mill products 3 Total com-
mercial feeds
Tankage and meat meal
Fish meal
Dried milk 2 Total Wheat
millfeeds
Gluten feed and
meal 4
Rice millfeeds
Alfalfa meal Total
1,000 Short tons
2007 ......... 2,367 197 356 2,920 6,863 4,560 580 225 12,228 54,148 2008 ......... 2,302 182 364 2,848 6,514 5,166 547 225 12,453 51,065 2009 ......... 2,260 178 338 2,775 6,445 5,203 574 225 12,447 50,316 2010 ......... 2,027 298 436 2,762 6,204 5,034 608 225 12,070 51,156 2011 ......... (NA) 198 463 2,857 6,404 5,772 535 225 12,936 54,038 2012 ......... (NA) 198 368 2,728 6,345 5,707 531 225 12,808 51,709 2013 ......... (NA) 198 219 2,545 6,345 5,651 447 225 12,669 51,827 2014 ......... (NA) 198 248 2,608 6,603 5,837 845 225 13,510 56,048 2015 ......... 2,594 198 248 3,041 6,513 5,921 235 225 12,894 56,434 2016 ......... 2,933 198 248 3,379 9,101 5,864 579 225 15,768 60,438
This data has not been updated, but contains the most recent data available. 1 Year beginning August 1. 2 Includes dried skim milk, and whey for feed, but does not include any milk products fed on farms. 3 Other mill products that are not listed include screenings, hominy, and oats feed etc., for which no statistics are available. 4 Adjusted for export data.
ERS, Market and Trade Economics Division, (202) 694–5313.

I–45 AGRICULTURAL STATISTICS 2020
Table 1-73.—High-protein feeds: Quantity for feeding, high-protein animal units, quantity per animal unit, and prices, United States, 2007–2016
Year beginning October
Quantity for feeding 1
High- protein animal units
Quantity per
animal unit
High protein
feed prices
Oilseed meal
Animal protein
Grain protein 3 Total Soybean
meal
Other oilseed meals 2
Total
Index 1,000 1,000 1,000 1,000 1,000 1,000 Million numbers tons tons tons tons tons tons units Pounds 1992=100
2007 ................ 36,555 2,945 39,500 3,207 2,715 45,422 71 1,271 173 2008 ................ 33,827 2,282 36,109 3,113 3,076 42,298 71 1,193 171 2009 ................ 33,703 2,262 35,965 3,049 3,098 42,112 70 1,195 153 2010 ................ 33,331 2,814 36,145 2,950 2,998 42,093 69 1,214 177 2011 ................ 34,695 2,721 37,416 3,037 3,437 43,890 68 1,290 203 2012 ................ 31,899 2,689 34,587 2,965 3,398 40,951 68 1,212 239 2013 ................ 32,466 2,166 34,632 2,879 3,365 40,877 67 1,225 250 2014 ................ 35,506 2,546 38,052 2,929 3,476 44,456 67 1,319 191 2015 ................ 36,430 2,211 38,641 3,450 3,526 45,616 69 1,313 166 2016 ................ 36,630 2,686 39,316 3,858 3,492 46,665 71 1,316 159
This data has not been updated, but contains the most recent data available. 1 In terms of 44 percent protein soybean meal equivalent. 2 Includes cottonseed, linseed, peanut meal, and sunflower meal. 3 Beginning 1974, adjusted for exports of corn gluten feed and meal.
ERS, Market and Trade Economics Division, (202) 694–5313.
Table 1-74.—Feed concentrates: Fed to livestock and poultry, 2007–2016
Year beginning October
Feed grains
Wheat 2 Rye 2 By-
product feeds 3
Total con-centrates
Grain con-
suming animal units
Concen- trates fed per grain-
con-suming animal
unit
Corn 1 Sor-ghum 1
Oats 2 and
barley 2 Total
Million Million Million Million Million Million Million Million tons tons tons tons tons tons tons tons Millions Tons
2007 ............. 163.9 4.6 3.2 171.7 4.9 0.1 62.0 238.8 92.7 2.58 2008 ............. 143.6 6.6 3.2 153.4 3.4 0.1 58.2 215.1 91.7 2.35 2009 ............. 142.7 3.9 3.0 149.6 3.2 0.1 57.3 210.1 92.4 2.27 2010 ............. 133.6 3.4 2.7 139.7 2.1 0.1 57.7 196.6 92.9 2.15 2011 ............. 126.3 1.9 3.0 131.3 10.8 0.1 57.7 202.9 93.1 2.18 2012 ............. 120.6 2.6 3.6 126.9 11.6 0.1 57.6 196.7 92.3 2.13 2013 ............. 140.1 2.6 3.1 145.7 1.8 0.1 57.7 206.3 90.5 2.28 2014 ............. 148.0 2.3 2.5 152.8 4.7 0.1 63.3 220.9 92.4 2.39 2015 ............. 143.2 3.0 2.7 148.9 3.5 0.1 63.6 216.1 94.2 2.29 2016 ............. 153.0 3.6 2.4 159.0 2.2 0.1 68.0 229.3 95.8 2.39
This data has not been updated, but contains the most recent data available. 1 Marketing year beginning September 1. 2 Marketing year beginning June 1. 3 Oilseed meals, animal protein feeds, mill byproducts, and mineral supplements.
ERS, Market and Trade Economics Division, (202) 694–5313.

I–46 GRAIN AND FEED
Table 1-75.—Feed: Consumed per head and per unit of production, by class of live-stock or poultry, with quantity expressed in equivalent feeding value of corn, 2007–2016
Year beginning October
Dairy cattle Beef cattle Sheep and lambs
Milk cows
Other dairy cattle
per head
Cattle on feed
per head Jan. 1 1
Other beef cattle
per head
All beef cattle
per head
Cattle and
calves per 100 pounds
pro-duced 2
Per head
Per 100 pounds
pro-duced 3 Per head
Per 100 pounds
milk produced
Pounds Pounds Pounds Pounds Pounds Pounds Pounds Pounds Pounds
2007 ............ 12,949 65 6,526 9,114 5,307 5,993 1,261 1,271 1,718 2008 ............ 12,265 60 6,473 8,854 5,283 5,895 1,214 1,263 1,741 2009 ............ 12,303 59 6,425 8,942 5,269 5,896 1,227 1,260 1,680 2010 ............ 12,013 57 6,378 8,403 5,253 5,815 1,183 1,254 1,695 2011 ............ 12,030 57 6,369 8,056 5,263 5,782 1,145 1,261 1,669 2012 ............ 11,918 57 6,364 7,830 5,255 5,717 1,137 1,261 1,659 2013 ............ 12,143 56 6,434 8,677 5,314 5,891 1,143 1,269 1,631 2014 ............ 12,345 56 6,453 8,912 5,292 5,919 1,183 1,265 1,649 2015 ............ 12,224 55 6,399 8,577 5,280 5,838 1,173 1,260 1,649 2016 ............ 12,408 55 6,905 9,398 5,282 5,958 1,180 1,265 1,624
Year beginning October
Poultry
Hogs per 100 pounds
pro-duced
Horses and
mules two
years and
over per head
Hens and pullets Chickens raised Broilers produced Turkeys raised
Per head Jan. 1
Per 100 eggs
Per head
Per 100 pounds
live weight
Per head
Per 100 pounds
pro-duced
Per head
Per 100 pounds
pro-duced
Pounds Pounds Pounds Pounds Pounds Pounds Pounds Pounds Pounds Pounds
2007 ............ 136 47 28 1,045 11 197 86 313 574 3,832 2008 ............ 126 44 27 1,017 10 175 84 270 496 3,735 2009 ............ 119 43 26 1,077 10 180 85 293 487 3,707 2010 ............ 113 40 24 1,037 9 162 82 285 487 3,650 2011 ............ 119 42 25 1,019 10 163 79 272 486 3,663 2012 ............ 117 41 25 1,049 9 160 78 252 447 3,641 2013 ............ 119 40 26 1,156 9 165 82 255 471 3,674 2014 ............ 115 41 30 1,321 10 173 89 287 516 3,723 2015 ............ 106 43 28 1,255 10 164 85 290 483 3,695 2016 ............ 115 43 28 1,316 10 170 87 284 498 3,728
This data has not been updated, but contains the most recent data available. 1 Feed consumed by all cattle divided by the number on feed January 1. 2 Feed for all cattle, except milk cows, divided by the net live-weight production of cattle and calves. It includes the growth on dairy heifers and calves as well as all beef cattle. 3 Including wool produced.
ERS, Market and Trade Economics Division, (202) 694–5313.
Table 1-76.—Feed: Consumed by livestock and poultry, by type of feed, with quantity expressed in equivalent feeding value of corn, 2007–2016
Year beginning October
Concentrates Harvested roughage Pasture Total
Million tons Million tons Million tons Million tons
2007 ............... 239 80 163 482 2008 ............... 215 83 158 456 2009 ............... 210 83 156 450 2010 ............... 200 81 155 435 2011 ............... 203 76 155 434 2012 ............... 197 75 155 427 2013 ............... 206 78 149 433 2014 ............... 221 82 148 450 2015 ............... 216 81 155 452 2016 ............... 229 81 160 470
This data has not been updated, but contains the most recent data available. ERS, Market and Trade Economics Division, (202) 694–5313.

I–47 AGRICULTURAL STATISTICS 2020
Table 1-77.—Animal units fed: Grain-consuming, roughage-consuming, and grain-and- roughage-consuming, United States, 2007–2016 1
Year beginning October
Grain-consuming 2 Roughage-consuming 3 Grain and roughage-consuming 4
1,000 units 1,000 units 1,000 units
2007 ............................. 95,118 71,479 80,042 2008 ............................. 92,702 70,887 78,782 2009 ............................. 91,687 70,452 78,111 2010 ............................. 92,411 69,352 77,720 2011 ............................. 93,104 68,023 77,192 2012 ............................. 92,311 67,593 76,617 2013 ............................. 90,502 66,758 75,347 2014 ............................. 92,433 67,413 76,532 2015 ............................. 94,187 69,498 85,126 2016 ............................. 95,771 70,917 80,814
This data has not been updated, but contains the most recent data available. 1 Index series based on average feeding rates for years 1969–71. In calculations for the feeding years 1969 to date, cattle numbers used are the new categories shown in the Livestock and Poultry Inventory, published by NASS, USDA. 2 Livestock and poultry numbers weighted by all concentrates consumed. 3 Livestock and poultry numbers weighted by all roughage (including pasture) con-sumed. 4 Livestock and poultry numbers weighted by all feed (including pasture) fed to livestock.
ERS, Market and Trade Economics Division, (202) 694–5313.
Table 1-78.—Feed grains: Average price, selected markets and grades, 2010–2019 1
Calendar year
Kansas City Minneapolis
Corn, No. 2 Yellow (truck)
Corn, No. 2 White (rail)
Sorghum, No. 2 Yellow (truck)
Corn, No. 2 Yellow
Barley, No. 3 or Better malting
Oats, No. 2 White
Dollars per bushel
2010 ........... 4.08 4.27 6.94 3.65 4.70 2.74 2011 ........... 6.81 7.11 11.73 6.58 6.96 3.72 2012 ........... 7.17 7.29 11.81 6.87 7.06 3.67 2013 ........... 6.28 6.35 10.40 5.97 6.35 3.90 2014 ........... 4.07 4.30 7.30 3.83 6.23 4.02 2015 ........... 3.76 3.82 6.97 3.45 6.23 2.84 2016 ........... 3.49 3.93 5.59 3.18 (NA) 2.57 2017 ........... 3.43 3.62 5.61 3.19 4.70 3.43 2018 ........... 3.57 3.73 5.87 3.21 2.74 2.96 2019 ........... 3.85 4.00 6.28 3.55 2.79 3.17
Calendar year
Omaha: Corn, No. 2 Yellow (truck)
Chicago: Corn, No. 2 Yellow
Texas High Plains: Sorghum, No. 2
Yellow
Memphis Corn, No. 2 Yellow
St. Louis: Corn, No. 2 Yellow (truck)
Dollars per bushel Dollars per cwt
2010 ........... 4.03 4.16 7.81 4.25 4.26 2011 ........... 6.72 6.78 12.64 6.85 7.08 2012 ........... 7.06 6.86 13.15 6.95 7.08 2013 ........... 6.23 5.81 10.51 6.07 6.25 2014 ........... 3.99 4.03 7.26 4.33 4.84 2015 ........... 3.66 3.68 6.72 3.87 3.87 2016 ........... 3.34 3.61 5.53 3.67 3.70 2017 ........... 3.29 3.44 5.85 (NA) 3.62 2018 ........... 3.49 3.50 5.85 (NA) 3.73
1 Simple average of daily prices. AMS, Livestock and Grain Market News Branch, (202) 720–6231.

I–48 GRAIN AND FEED
Table 1-79.—Feedstuffs: Average price per ton bulk, in wholesale lots, at leading markets, 2010–2019
Year beginning October
Soybean meal
Cottonseed meal
Linseed meal
Meat meal
Fish meal Wheat bran
Wheat middlings
48% protein
41% protein
41% protein
34% protein
50% protein
60% protein Kansas
City Minneapolis
Decatur Kansas City Memphis
Min-neapolis
Kansas City Gulf Coast
Dollars per ton
2010 ........ 313.47 249.72 212.57 210.80 299.05 1,265.78 94.62 94.44 2011 ........ 333.73 310.43 275.43 242.60 342.84 1,198.89 176.20 172.74 2012 ........ 439.77 336.79 303.37 282.67 391.49 1,168.09 175.06 192.91 2013 ........ 464.61 430.80 333.42 (NA) 467.00 (NA) 129.57 182.40 2014 ........ 478.26 410.64 369.30 (NA) 456.61 1,466.28 119.45 117.43 2015 ........ 341.20 333.31 291.97 (NA) 328.33 1,531.77 98.42 93.66 2016 ........ 328.64 290.99 247.63 (NA) 275.20 1,386.72 75.10 73.51 2017 ........ 307.57 246.30 209.00 (NA) 254.17 1,291.67 75.47 69.59 2018 ........ 334.68 307.24 264.85 (NA) 270.39 (NA) 141.88 (NA) 2019 ........ 300.28 271.81 224.58 (NA) 233.60 (NA) 125.95 92.46
Year beginning October
Wheat shorts or middlings
Wheat millrun Gluten feed Hominy feed
Distillers’ dried grains
Alfalfa meal
Kansas City Portland 21% protein
Midwest Lawrenceburg
Dehydrated, 17% protein Sun-cured
Illinois Points Kansas City Kansas City
Dollars per ton
2010 ........ 94.62 124.06 ..................... 115.61 122.77 210.36 178.16 2011 ........ 176.20 187.71 ..................... 206.85 202.42 254.72 243.29 2012 ........ 174.78 219.71 ..................... ..................... 200.00 347.23 .....................2013 ........ 129.99 228.57 166.35 202.42 236.07 339.28 275.70 2014 ........ 119.41 191.60 165.00 124.84 172.22 324.74 267.10 2015 ........ 98.42 170.20 98.28 103.53 164.40 283.53 206.99 2016 ........ 75.10 144.76 90.72 92.12 148.60 253.90 185.82 2017 ........ 74.08 131.65 (NA) 95.20 (NA) 227.37 190.02 2018 ........ 102.72 143.33 (NA) (NA) 80.00 247.07 231.43 2019 ........ 90.70 162.26 106.27 106.30 (NA) 306.44 (NA)
(NA) Not available. AMS, Livestock and Grain Market News Branch, (202) 720–6231.
Table 1-80.—International Millet: Area, yield, and production in specified countries, 2017/2018–2019/2020
Country
Area Yield per hectare Production
2017/ 2018
2018/ 2019
2019/ 2020
2017/ 2018
2018/ 2019
2019/ 2020
2017/ 2018
2018/ 2019
2019/ 2020
1,000 hectares Metric tons 1,000 metric tons
India ........... 9,221 8,146 8,000 1.26 1.26 1.36 11,640 10,236 10,900 Niger .......... 6,999 7,000 7,000 0.54 0.55 0.54 3,790 3,847 3,800 China ......... 861 870 900 2.96 2.53 2.56 2,548 2,200 2,300 Nigeria ....... 2,212 2,000 2,000 0.68 1.06 1.00 1,500 2,119 2,000 Mali ............ 2,156 2,000 2,000 0.69 0.92 0.73 1,493 1,840 1,450 Burkina ...... 1,223 1,200 1,200 0.68 0.99 0.92 828 1,189 1,100 Ethiopia ..... 464 450 450 2.32 2.22 2.44 1,078 1,000 1,100 Sudan ........ 2,142 3,000 2,500 0.45 0.67 0.40 954 2,000 1,000 Senegal ..... 850 850 850 1.03 1.06 1.00 875 897 850 Chad .......... 1,165 1,100 1,100 0.57 0.69 0.64 660 756 700 Russia ....... 235 187 350 1.34 1.16 1.25 315 217 437 Tanzania .... 333 350 350 1.17 0.90 1.00 389 316 350 Pakistan ..... 489 476 470 0.69 0.65 0.64 335 307 300 Nepal ......... 260 260 260 0.96 0.96 0.96 250 250 250 Burma ........ 240 240 240 1.00 1.00 1.00 240 240 240 Uganda ...... 151 175 175 1.42 1.45 1.37 214 253 240 Guinea ....... 194 200 200 1.09 1.07 1.00 211 214 200 Ghana ........ 167 160 160 1.00 1.09 1.09 167 175 175 Ukraine ...... 58 55 90 1.50 1.47 1.89 87 81 170 Cameroon .. 72 72 72 1.39 1.39 1.39 100 100 100
FAS, Office of Global Analysis, (202) 720-6301. Prepared or estimated on the basis of official USDA production, supply, and distribution statistics from foreign governments.

I–49 AGRICULTURAL STATISTICS 2020
Table 1-81.—Proso millet: Area, yield, production, and value, United States, 2010–2019
Year
Area Yield per
harvested acre Production
Marketing year average price per bushel received
by farmers
Value of production Planted Harvested
1,000 acres 1,000 acres Bushels 1,000 dollars Dollars 1,000 dollars
2010 ....... 390 363 31.8 11,535 4.54 52,419 2011 ....... 370 338 27.1 9,149 6.01 54,974 2012 ....... 335 205 15.0 3,075 15.10 46,548 2013 ....... 720 638 28.9 18,436 4.61 84,915 2014 ....... 505 430 31.4 13,483 3.35 45,104 2015 ....... 445 418 33.9 14,159 2.93 41,547 2016 ....... 443 413 30.4 12,558 2.87 36,065 2017 ....... 478 403 36.9 14,889 3.32 49,444 2018 ....... 443 390 29.7 11,595 5.22 60,566 2019 ....... 506 465 35.7 16,608 4.99 82,907
NASS, Crops Branch, (202) 720–2127.
Table 1-82.—Proso millet: Area, yield, and production, by State and United States, 2017–2019
State Area planted Area harvested
2017 2018 2019 2017 2018 2019
1,000 acres 1,000 acres 1,000 acres 1,000 acres 1,000 acres 1,000 acres
Colorado .............. 320 300 340 290 270 320 Nebraska ............. 105 95 115 86 81 106 South Dakota ....... 53 48 51 27 39 39
United States ....... 478 443 506 403 390 465
State Yield per acre Production
2017 2018 2019 2017 2018 2019
1,000 1,000 1,000 Bushels Bushels Bushels bushels bushels bushels
Colorado .............. 38.5 28.0 37.0 11,165 7,560 11,840 Nebraska ............. 32.0 32.0 31.0 2,752 2,592 3,286 South Dakota ....... 36.0 37.0 38.0 972 1,443 1,482
United States ....... 36.9 29.7 35.7 14,889 11,595 16,608
NASS, Crops Branch, (202) 720–2127.
Table 1-83.—Proso millet: Marketing year average price and value, by State and United States, 2017–2019
State Marketing year average price per bushel Value of production
2017 2018 2019 2017 2018 2019
Dollars Dollars Dollars 1,000 dollars 1,000 dollars 1,000 dollars
Colorado .............. 3.32 5.42 5.20 37,068 40,975 61,568 Nebraska ............. 3.13 5.07 4.69 8,614 13,141 15,411 South Dakota ....... 3.87 4.47 4.00 3,762 6,450 5,928
United States ....... 3.32 5.22 4.99 36,065 60,566 82,907
NASS, Crops Branch, (202) 720–2127.

II–1
CHAPTER II
STATISTICS OF COTTON, TOBACCO, SUGAR CROPS, AND HONEY
In addition to tables on cotton, tobacco, sugar, and honey, this chapter includes tables on fibers other than cotton and syrups. Cottonseed data, however, are in the following chapter on oilseeds, fats, and oils.
Table 2-1.—Cotton: Area, yield, production, market year average price, and value, United States, 2010–2019
Year
Area Yield per harvested
acre Production
Marketing year average price
per pound received by
farmers 2
Value of production 2 Planted Harvested
1,000 acres 1,000 acres Pounds 1,000 bales 1 Dollars 1,000 dollars
2010 ............ 10,974.2 10,698.7 812 18,101.8 0.846 7,346,868 2011 ............ 14,735.4 9,460.9 790 15,573.2 0.935 6,985,976 2012 ............ 12,264.4 9,321.8 892 17,313.8 0.757 6,291,813 2013 ............ 10,407.0 7,359.4 822 12,909.2 0.838 5,191,505 2014 ............ 11,148.4 9,351.8 838 16,319.4 0.657 5,147,241 2015 ............ 8,580.5 8,074.9 766 12,888.0 0.645 3,988,978 2016 ............ 10,073.5 9,507.8 867 17,169.9 0.705 5,813,774 2017 ............ 12,717.5 11,100.4 905 20,922.5 0.719 7,222,535 2018 ............ 14,100.3 10,205.8 864 18,367.0 0.723 6,375,167 2019 ............ 13,737.8 11,804.5 817 20,102.0 0.623 6,012,662
1Value based on 480-pound net weight bale. 2 Based on marketings and monthly prices received from August1, 2019 - December 31, 2019.
NASS, Crops Branch, (202) 720–2127.
Table 2-2.—Cotton: Marketing year average price per pound, and value, by State and United States, 2017–2019
State Marketing year average price per pound Value of production 1
2017 2018 2019 2 2017 2018 2019 2
Dollars Dollars Dollars 1,000 dollars 1,000 dollars 1,000 dollars Upland:
Alabama ................. 0.729 0.730 0.640 282,735 311,155 331,776 Arizona ................... 0.727 0.680 0.659 169,246 142,637 150,252 Arkansas ................ 0.710 0.708 0.616 366,019 385,039 413,952 California ................ (D) (D) 0.527 (D) (D) 46,798 Florida .................... 0.729 0.709 0.577 54,238 35,053 52,622 Georgia .................. 0.750 0.741 0.635 801,000 695,354 807,720 Kansas ................... (D) 0.600 0.609 (D) 98,208 84,773 Louisiana ................ 0.715 0.755 0.669 138,653 152,208 186,250 Mississippi .............. 0.738 0.751 0.597 478,578 527,022 458,496 Missouri .................. 0.747 0.712 0.579 268,920 314,761 283,478 New Mexico ........... 0.507 (D) 0.535 27,500 (D) 33,384 North Carolina ........ 0.709 0.748 0.596 252,177 252,046 303,245 Oklahoma ............... 0.712 0.653 0.597 348,595 213,766 183,398 South Carolina ....... 0.726 0.747 0.589 164,134 150,595 141,360 Tennessee ............. 0.680 0.696 0.609 238,925 257,242 280,627 Texas ..................... 0.663 0.679 0.589 2,950,085 2,232,552 1,809,408 Virginia ................... 0.699 0.718 0.609 64,420 62,380 64,310 Other States 3 ........ 0.734 0.702 (X) 152,146 101,433 -
United States ......... 0.686 0.703 0.603 6,757,371 5,931,451 5,631,849
American-Pima: Arizona ................... (D) (D) (D) (D) (D) (D) California ................ (D) (D) (D) (D) (D) (D) New Mexico ........... (D) (D) (D) (D) (D) (D) Texas ..................... (D) (D) (D) (D) (D) (D) Other States 3 ........ 1.390 1.150 1.099 465,164 443,716 380,813
United States ......... 1.390 1.150 1.099 465,164 443,716 380,813
All: United States ......... 0.719 0.723 0.623 7,222,535 6,375,167 6,012,662
(D) Withheld to avoid disclosing data for individual operations. 1 Value based on 480-pound net weight bale. 2 Based on marketings and monthly prices received from August 1, 2019-December 31, 2019. 3 Includes data withheld above.
NASS, Crops Branch, (202) 720–2127.

II–2 GRAIN AND FEED
Table 2-3.—Cotton: Area, yield, production, and type by State and United States, 2017–2019
State Area planted Area harvested
2017 2018 2019 2017 2018 2019
1,000 acres 1,000 acres 1,000 acres 1,000 acres 1,000 acres 1,000 acres Upland:
Alabama ............. 435.0 510.0 540.0 430.0 497.0 535.0 Arizona ............... 160.0 160.0 160.0 159.0 159.0 158.0 Arkansas ............ 445.0 485.0 620.0 438.0 480.0 610.0 California ............ 88.0 48.0 55.0 87.0 47.0 54.0 Florida ................ 99.0 117.0 112.0 98.0 93.0 111.0 Georgia ............... 1,280.0 1,430.0 1,400.0 1,270.0 1,305.0 1,390.0 Kansas ............... 93.0 165.0 175.0 90.0 152.0 153.0 Louisiana ............ 220.0 195.0 280.0 217.0 189.0 270.0 Mississippi .......... 630.0 620.0 710.0 625.0 615.0 700.0 Missouri .............. 305.0 325.0 380.0 297.0 322.0 368.0 New Mexico ........ 66.0 77.0 63.0 46.0 56.0 47.0 North Carolina .... 375.0 430.0 510.0 367.0 415.0 500.0 Oklahoma ........... 590.0 780.0 640.0 555.0 550.0 480.0 South Carolina ... 250.0 300.0 300.0 248.0 275.0 297.0 Tennessee .......... 345.0 360.0 410.0 340.0 355.0 405.0 Texas .................. 7,000.0 7,750.0 7,050.0 5,500.0 4,350.0 5,400.0 Virginia ............... 84.0 98.0 103.0 83.0 97.0 102.0
United States ...... 12,465.0 13,850.0 13,508.0 10,850.0 9,957.0 11,580.0
American Pima:
Arizona ............... 15.0 14.5 7.5 15.0 14.5 7.5 California ............ 216.0 211.0 205.0 215.0 210.0 202.0 New Mexico ........ 7.5 6.8 5.3 7.4 6.8 5.0 Texas .................. 14.0 18.0 12.0 13.0 17.5 10.0
United States ...... 252.5 250.3 229.8 250.4 248.8 224.5
All: United States ...... 12,717.5 14,100.3 13,737.8 11,100.4 10,205.8 11,804.5
State Yield per harvested acre Production 1
2017 2018 2019 2017 2018 2019
Pounds Pounds Pounds 1,000 bales 2 1,000 bales 2 1,000 bales 2 Upland:
Alabama ............. 902 858 969 808.0 888.0 1,080.0 Arizona ............... 1,464 1,319 1,443 485.0 437.0 475.0 Arkansas ............ 1,177 1,133 1,102 1,074.0 1,133.0 1,400.0 California ............ 1,297 1,910 1,644 235.0 187.0 185.0 Florida ................ 759 532 822 155.0 103.0 190.0 Georgia ............... 841 719 915 2,225.0 1,955.0 2,650.0 Kansas ............... 1,051 1,077 910 197.0 341.0 290.0 Louisiana ............ 894 1,067 1,031 404.0 420.0 580.0 Mississippi .......... 1,038 1,141 1,097 1,351.0 1,462.0 1,600.0 Missouri .............. 1,212 1,373 1,330 750.0 921.0 1,020.0 New Mexico ........ 1,179 977 1,328 113.0 114.0 130.0 North Carolina .... 969 812 1,018 741.0 702.0 1,060.0 Oklahoma ........... 882 595 640 1,020.0 682.0 640.0 South Carolina ... 912 733 808 471.0 420.0 500.0 Tennessee .......... 1,033 1,041 1,138 732.0 770.0 960.0 Texas .................. 809 756 569 9,270.0 6,850.0 6,400.0 Virginia ............... 1,110 896 1,035 192.0 181.0 220.0
United States ...... 895 847 803 20,223.0 17,566.0 19,380.0
American Pima:
Arizona ............... 966 943 896 30.2 28.5 14.0 California ............ 1,407 1,662 1,616 620.0 727.0 680.0 New Mexico ........ 863 812 864 13.3 11.5 9.0 Texas .................. 960 933 912 26.0 34.0 19.0
United States ...... 1,341 1,545 1,544 699.5 801.0 722.0
All: United States ...... 905 864 817 20,922.5 18,367.0 20,102.0
1 Production ginned and to be ginned. 2 480-pound net weight bales. NASS, Crops Branch, (202) 720–2127.

II–3 AGRICULTURAL STATISTICS 2020
Table 2-4.—Cotton, American Upland: Support operations, United States, 2013–2019
Marketing Year beginning August 1
Income support payment rates per pound 1
Program price levels per pound
Put under Loan Acquired by
CCC under loan program 4
Owned by CCC at end
of mar-keting year Loan 2 Target/
Reference 3 Quantity
Percentage of
production
1,000 1,000 1,000 Cents Cents Cents bales Percent bales bales
2013/2014 .......... 6.67/0 52.00 71.25 3,981 32.4 0 0 2014/2015 .......... (NA) 52.00 (NA) 7,625 48.4 0 0 2015/2016 .......... (NA) 52.00 (NA) 6,758 54.3 0 0 2016/2017 .......... (NA) 52.00 (NA) 9,373 56.4 0 0 2017/2018 .......... (NA) 49.49 (NA) 9,597 46.7 0 .1 0 2018/2019 .......... 2.17 52.00 36.70 8,250 47.0 73 0 2019/2020 5 ........ 6.14 52.00 36.70 11,787 61.3 0 0
(NA) Not available. 1 The first entry is the direct payment rate and the second entry is the counter-cyclical payment rate for 2004/2005-2013/2014. For 2009/2010-2013/2014, producers who participate in the Average Crop Revenue (ACRE) pro-gram get a 20 percent reduction in their direct payment, not calculated in this table. The Agricultural Act of 2014 excludes upland cotton as a covered commodity for the Agricultural Risk Coverage and Price Loss Coverage Programs. The Bipar-tisan Budget Act of 2018 amended the Agricultural Act of 2014 to make seed cotton a covered commodity for the Agriculture Risk Coverage and Price Loss Coverage Programs effective with the 2018 crop year. The Agriculture Improvement Act of 2018 continued seed cotton as a covered commodity for the Agriculture Risk Coverage and Price Loss Coverage Programs. Beginning with 2018, the income support payment rate is the Price Loss Coverage payment rate for seed cotton. 2 For 2009/2010-2013/2014, producers who participate in the ACRE program get a 30 percent reduction in their loan rate, not cal-culated in this table. 3 Target applies to 2003/2004-2013/2014 and Reference applies beginning with 2014. Beginning with 2018, Reference Price is for seed cotton. Beginning with 2019, value represents Effective Reference Price for seed cot-ton. 4 Aquisitions as of September 30, 2020. 5 Payment rate as of the July 31, 2020 NASS Agricultural Prices Report.
FPAC-BC, Commodity Analysis Branch.
Table 2-5.—International Cotton: Area, yield, and production in specified countries, 2017/2018–2019/2020
Country
Area Yield Production
2017/ 2018
2018/ 2019
2019/ 2020
2017/ 2018
2018/ 2019
2019/ 2020
2017/ 2018
2018/ 2019
2019/ 2020
1,000 hectares Kilograms per hectare 1,000 480 lb. bales
India ............. 12,600 12,600 13,000 501 446 494 29,000 25,800 29,500 China ........... 3,400 3,500 3,450 1,761 1,726 1,720 27,500 27,750 27,250 United States 4,492 4,130 4,777 1,014 968 902 20,923 18,367 19,800 Brazil ............ 1,175 1,640 1,700 1,708 1,726 1,665 9,220 13,000 13,000 Pakistan ....... 2,700 2,300 2,500 661 719 575 8,200 7,600 6,600 Uzbekistan ... 1,250 1,100 1,010 672 648 754 3,860 3,275 3,500 Turkey .......... 470 520 560 1,853 1,549 1,322 4,000 3,700 3,400 Greece ......... 230 245 280 1,157 1,253 1,283 1,222 1,410 1,650 Mexico ......... 210 243 225 1,617 1,555 1,519 1,560 1,735 1,570 Benin ............ 530 650 675 468 469 468 1,140 1,400 1,450 Mali .............. 705 725 735 432 381 400 1,400 1,270 1,350 Argentina ..... 320 380 360 558 642 605 820 1,120 1,000 Burkina ......... 850 630 575 307 294 379 1,200 850 1,000 Cote d’Ivoire 327 392 425 536 520 512 805 937 1,000 Turkmenistan 545 545 545 535 364 399 1,340 910 1,000 Burma .......... 249 240 240 634 635 635 725 700 700 Australia ....... 530 380 60 1,972 1,261 2,449 4,800 2,200 675 Cameroon .... 225 250 260 484 523 540 500 600 645 Sudan .......... 180 180 200 575 605 653 475 500 600 Tajikistan ...... 185 180 180 671 502 689 570 415 570 Tanzania ...... 350 420 450 143 194 242 230 375 500 Azerbaijan .... 130 130 140 569 653 700 340 390 450 Kazakhstan .. 125 128 125 523 587 644 300 345 370 Egypt ............ 91 141 100 718 772 762 300 500 350 Chad ............ 120 60 250 181 145 283 100 40 325 Spain ............ 63 65 65 1,016 1,005 1,005 294 300 300 Iran ............... 85 80 80 640 748 748 250 275 275 Togo ............. 160 180 185 299 308 312 220 255 265 Ethiopia ........ 60 77 80 639 687 680 176 243 250 Nigeria ......... 270 270 270 190 190 190 235 235 235
FAS, Office of Global Analysis, (202) 720–6301. Prepared or estimated on the basis of official USDA production, supply, and distribution statistics from foreign governments.

II–4 GRAIN AND FEED
Table 2-6.—Cotton: United States exports by country of destination, 2017–2019
Country of destination Year
2017 2018 2019
Metric tons Metric tons Metric tons Cotton linters:
Japan .................................................. 11,088 6,629 3,258 China .................................................. 6,473 5,515 3,146 Vietnam ............................................... 9 134 773 Germany(*) ......................................... 1,123 980 662 Thailand .............................................. 0 619 460 Malaysia .............................................. 0 0 278 United Kingdom .................................. 35 19 43 Costa Rica .......................................... 6 0 36 Turkey ................................................. 31 23 34 Canada ............................................... 45 71 31 Chile .................................................... 31 19 29 Guatemala .......................................... 4 31 25 Sweden ............................................... 10 27 24 Mexico ................................................ 0 0 22 Colombia ............................................. 0 0 21 Nigeria ................................................ 3 0 19 South Africa ........................................ 0 12 17 Australia(*) .......................................... 0 0 17 Netherlands ........................................ 5 0 11 Dominican Republic ............................ 0 0 1 Spain ................................................... 1,760 229 0 Argentina ............................................ 100 41 0 France(*) ............................................. 151 32 0 Brazil ................................................... 47 27 0 Korea, South ....................................... 76 18 0 Trinidad and Tobago .......................... 8 17 0 Italy(*) ................................................. 0 13 0 United Arab Emirates ......................... 4 11 0 Singapore ........................................... 0 6 0 Libya ................................................... 0 6 0 Rest of World ...................................... 81 3 0
World Total ......................................... 21,088 14,480 8,907
Cotton <1: Vietnam ............................................... 15,417 31,740 79,517 Indonesia ............................................ 12,510 29,613 23,347 Thailand .............................................. 6,196 17,821 16,521 Taiwan ................................................ 8,383 17,391 15,145 Turkey ................................................. 12,198 19,355 13,257 Pakistan .............................................. 949 5,948 13,134 China .................................................. 15,386 26,059 10,937 Japan .................................................. 3,043 6,637 8,222 Korea, South ....................................... 681 4,843 8,217 Bangladesh ......................................... 635 2,919 6,138 India .................................................... 571 7,613 3,353 Malaysia .............................................. 415 1,035 2,445 Mexico ................................................ 1,028 1,139 1,204 Hong Kong .......................................... 7 66 952 Colombia ............................................. 2 1 901 Ecuador .............................................. 0 0 647 Oman .................................................. 0 0 555 British Indian Ocean Territory ............ 0 0 351 Guatemala .......................................... 119 551 238 Italy(*) ................................................. 431 327 23 Peru .................................................... 0 20 21 Portugal .............................................. 0 31 6 Dominican Republic ............................ 93 23 6 Jordan ................................................. 5 0 5 Venezuela ........................................... 0 0 4 Israel(*) ............................................... 0 0 4 Spain ................................................... 0 0 2 Paraguay ............................................ 0 0 1 Honduras ............................................ 0 0 1 Brazil ................................................... 19 0 1 Rest of World ...................................... 1,590 919 0
World Total ......................................... 79,676 174,053 205,154
See footnote(s) at end of table.

II–5 AGRICULTURAL STATISTICS 2020
Table 2-6.—Cotton: United States exports by country of destination, 2017–2019—Continued
Country of destination Year
2017 2018 2019
Metric tons
Cotton >1 <1 1/8: Vietnam ............................................... 322,337 348,245 320,042 Mexico ................................................ 195,692 176,629 145,610 Turkey ................................................. 116,639 157,895 120,106 Bangladesh ......................................... 30,798 65,779 98,497 Indonesia ............................................ 91,705 112,260 84,546 Pakistan .............................................. 53,161 99,618 70,106 China .................................................. 103,464 88,241 55,229 India .................................................... 15,475 19,633 49,425 Thailand .............................................. 46,598 48,507 37,962 Taiwan ................................................ 26,514 32,660 35,413 Guatemala .......................................... 31,766 38,031 29,106 Malaysia .............................................. 15,024 26,394 25,692 El Salvador ......................................... 10,855 13,809 14,668 Colombia ............................................. 12,304 15,845 10,843 Korea, South ....................................... 15,716 20,335 10,170 Japan .................................................. 12,488 10,117 9,965 Peru .................................................... 10,620 16,766 5,435 Egypt ................................................... 295 803 4,691 Ecuador .............................................. 3,745 8,466 3,753 Philippines .......................................... 8,015 6,097 3,425 Portugal .............................................. 2,485 2,480 2,429 Honduras ............................................ 392 319 2,029 Bahrain ............................................... 764 800 1,528 Italy(*) ................................................. 137 1,906 1,081 Hong Kong .......................................... 0 2 1,051 Oman .................................................. 0 0 405 Netherlands ........................................ 48 63 300 Belgium-Luxembourg(*) ...................... 304 277 156 Austria ................................................. 0 0 97 Nicaragua ........................................... 0 616 80 Rest of World ...................................... 13,692 5,254 437
World Total ......................................... 1,141,032 1,317,845 1,144,277
Pima >= 1 3/8: India .................................................... 34,327 36,931 40,782 China .................................................. 28,410 38,823 33,377 Vietnam ............................................... 4,649 7,378 12,178 Pakistan .............................................. 2,717 5,457 10,338 Turkey ................................................. 548 2,362 6,964 Peru .................................................... 3,946 6,236 5,652 Thailand .............................................. 2,097 2,852 2,768 Bangladesh ......................................... 1,109 1,972 2,724 Austria ................................................. 785 982 2,242 El Salvador ......................................... 41 40 2,011 Egypt ................................................... 1,920 3,282 1,738 Indonesia ............................................ 3,210 2,053 1,355 Malaysia .............................................. 296 137 1,051 Venezuela ........................................... 0 496 1,000 Bahrain ............................................... 0 178 850 Japan .................................................. 3,084 1,417 791 Germany(*) ......................................... 39 861 789 Taiwan ................................................ 455 1,383 744 Italy(*) ................................................. 78 84 330 Ethiopia(*) ........................................... 0 0 294 Korea, South ....................................... 483 0 196 United Kingdom .................................. 67 248 152 Honduras ............................................ 0 0 139 Greece ................................................ 0 0 116 Brazil ................................................... 0 271 104 Guatemala .......................................... 39 0 99 Colombia ............................................. 134 39 97 Slovenia .............................................. 0 0 80 Mexico ................................................ 306 19 58 Portugal .............................................. 0 1 40 Rest of World ...................................... 7 9 0
World Total ......................................... 88,747 113,510 129,061
See footnote(s) at and of table.

II–6 GRAIN AND FEED
Table 2-6.—Cotton: United States exports by country of destination, 2017–2019—Continued
Country of destination Year
2017 2018 2019
Metric tons Metric tons Metric tons Cotton Other > 1 1/8:
Vietnam ............................................... 284,136 367,884 448,940 Pakistan .............................................. 114,925 233,734 276,534 China .................................................. 379,305 332,112 275,435 Turkey ................................................. 280,913 210,148 252,415 India .................................................... 159,555 91,222 239,341 Indonesia ............................................ 177,783 193,063 135,594 Bangladesh ......................................... 119,566 131,511 115,961 Korea, South ....................................... 125,903 93,778 77,369 Thailand .............................................. 63,088 76,714 64,705 Malaysia .............................................. 32,463 34,739 36,916 Taiwan ................................................ 46,805 54,689 35,716 Peru .................................................... 34,051 30,962 35,450 Guatemala .......................................... 9,382 15,412 20,598 Mexico ................................................ 28,226 13,964 12,988 Egypt ................................................... 14,808 22,520 10,724 Costa Rica .......................................... 7,423 9,281 8,573 Ecuador .............................................. 11,118 7,376 7,232 Japan .................................................. 8,490 6,312 7,043 Honduras ............................................ 2,476 4,199 5,066 Philippines .......................................... 4,510 6,243 3,616 Colombia ............................................. 8,666 6,390 2,017 Algeria ................................................. 0 675 1,770 Nicaragua ........................................... 717 1,259 1,765 El Salvador ......................................... 2,269 2,653 1,094 Tunisia ................................................ 799 459 1,058 Portugal .............................................. 504 122 957 Dominican Republic ............................ 185 176 874 Bahrain ............................................... 2,624 2,217 834 Italy(*) ................................................. 1,631 799 613 Hong Kong .......................................... 124 420 529 Rest of World ...................................... 20,482 19,394 2,676
World Total ......................................... 1,942,927 1,970,423 2,084,403
(*) Denotes a country that is a summarization of its component countries. Users should use cautious interpretation on quantity reports using mixed units of measure. Quantity line items will
only include statistics on the units of measure that are equal to, or are able to be converted to, the assigned unit of measure of the grouped commodities.
FAS, Office of Global Analysis, (202) 720–6301.

II–7 AGRICULTURAL STATISTICS 2020
Table 2-7.—Cotton, excluding linters: United States exports and imports, 2017–2019
Area/Partners of Destination Year beginning August
2017 2018 2019
Metric tons
Exports: Vietnam ............................................... 643,745 729,216 834,027 Turkey ................................................. 423,336 412,162 360,243 China .................................................. 502,957 571,651 355,623 Pakistan .............................................. 187,406 317,087 320,653 India .................................................... 240,827 160,850 291,434 Indonesia ............................................ 321,331 345,488 225,843 Bangladesh ......................................... 139,819 194,854 186,186 Mexico ................................................ 219,210 206,572 172,874 Thailand .............................................. 125,633 144,903 122,579 Korea, South ....................................... 130,162 131,949 97,703 Taiwan ................................................ 91,823 101,354 93,808 Malaysia .............................................. 44,972 53,681 65,320 Guatemala .......................................... 42,725 46,786 53,688 Peru .................................................... 42,486 52,186 50,294 Japan .................................................. 26,387 26,467 21,982 Egypt ................................................... 20,919 24,647 18,686 El Salvador ......................................... 13,901 14,549 15,831 Colombia ............................................. 17,878 24,895 15,798 Ecuador .............................................. 14,076 15,829 13,199 Philippines .......................................... 14,125 12,418 10,054 Costa Rica .......................................... 8,618 8,482 8,772 Honduras ............................................ 2,950 4,141 5,382 Algeria ................................................. 0 0 3,208 Bahrain ............................................... 4,330 3,154 2,797 Portugal .............................................. 2,989 2,482 2,668 Austria ................................................. 785 1,736 2,334 Nicaragua ........................................... 449 1,938 2,149 Italy(*) ................................................. 1,894 3,096 2,054 Hong Kong .......................................... 123 494 1,484 Switzerland(*) ...................................... 908 992 1,382 Rest of World ...................................... 47,421 24,994 7,114
World Total ......................................... 3,334,183 3,639,054 3,365,168
Country of origin Year beginning August
2017 2018 2019
Metric tons
Imports: Germany(*) ............................................. 17 38 12 Spain ...................................................... 0 0 6 Korea, South .......................................... 0 0 6 Turkey .................................................... 1 0 1 Tanzania ................................................. 0 0 1 China ...................................................... 0 4 0 Japan ...................................................... 0 0 0 Mexico .................................................... 0 0 0 Peru ........................................................ 0 0 0 Italy(*) ..................................................... 0 0 0 Brazil ...................................................... 0 1 0 Canada ................................................... 0 0 0 Denmark(*) ............................................. 0 0 0 Egypt ...................................................... 140 100 0 France(*) ................................................ 1 0 0 Hong Kong ............................................. 0 0 0 India ........................................................ 818 7 0 Kazakhstan ............................................. 35 0 0 Morocco .................................................. 0 1 0 Pakistan .................................................. 0 0 0 Taiwan .................................................... 1 0 0
World Total ............................................. 1,013 150 26
(*) Denotes a country that is a summarization of its component countries. All zeroes for a data item may show that statistics exist in the other import type. Users should use cautious interpretation on quantity reports using mixed units of measure. Quantity line items will only
include statistics on the units of measure that are equal to, or are able to be converted to, the assigned unit of measure of the grouped commodities.
FAS, Office of Global Analysis, (202) 720-6301. Data Source: USDA FAS Global Agricultural Trade System (GATS)-BICO- HS10.

II–8 GRAIN AND FEED
Table 2-8.—Cotton: International trade, 2017/2018–2019/2020 1
Country 2017/2018 2018/2019 2019/2020
1,000 480 lb. bales
Principle exporting countries:
United States ........................................................ 16,279 14,763 16,500 Brazil ..................................................................... 4,174 6,018 8,800 India ...................................................................... 5,182 3,511 3,600 Greece .................................................................. 1,076 1,355 1,500 Benin ..................................................................... 1,000 1,400 1,400 Australia ................................................................ 3,915 3,632 1,300 Mali ....................................................................... 1,300 1,350 1,300 Cote d’Ivoire .......................................................... 620 895 1,000 Burkina .................................................................. 1,225 940 900 Cameroon ............................................................. 400 575 600 Argentina ............................................................... 168 545 500 Sudan .................................................................... 350 425 500 Malaysia ................................................................ 152 313 450 Mexico ................................................................... 350 500 425 Tajikistan ............................................................... 505 350 425 Azerbaijan ............................................................. 162 384 350 Turkey ................................................................... 325 482 350 Kazakhstan ........................................................... 250 275 300 Spain ..................................................................... 239 322 300 Uzbekistan ............................................................ 1,000 750 300 Egypt ..................................................................... 220 350 250 Tanzania ............................................................... 90 200 250 Togo ...................................................................... 200 225 250 Turkmenistan ........................................................ 625 150 250 Chad ..................................................................... 250 100 200 Zambia .................................................................. 117 156 200
Principle importing countries:
China ..................................................................... 5,710 9,640 8,250 Bangladesh ........................................................... 7,600 7,200 7,300 Vietnam ................................................................. 7,000 6,900 6,800 Turkey ................................................................... 4,024 3,499 4,300 Pakistan ................................................................ 3,400 2,850 4,200 Indonesia .............................................................. 3,517 3,051 3,000 India ...................................................................... 1,677 1,800 2,300 Malaysia ................................................................ 739 744 1,000 Thailand ................................................................ 1,149 1,075 950 Mexico ................................................................... 925 850 800 Korea, South ......................................................... 904 781 600 Taiwan .................................................................. 632 592 525 Egypt ..................................................................... 550 520 500 Iran ........................................................................ 325 300 300 Japan .................................................................... 262 230 250 Peru ...................................................................... 242 214 250 El Salvador ........................................................... 156 177 180 Portugal ................................................................. 184 174 170 Italy ....................................................................... 171 159 160 Guatemala ............................................................ 118 148 150 Mauritius ............................................................... 115 120 120 Russia ................................................................... 200 150 100
1 Marketing year beginning August 1. FAS, Office of Global Analysis, (202) 720–6301. Prepared or estimated on the basis of official USDA production, supply,
and distribution statistics from foreign governments.

II–9 AGRICULTURAL STATISTICS 2020
Table 2-9.—Sugarbeets: Area, yield, production, and value, United States, 2010–2019 1
Year
Area Yield per
harvested acre Production
Marketing year average price per
ton received by farmers
Value of production Planted Harvested
1,000 acres 1,000 acres tons 1,000 tons 1,000 dollars
2010 ............ 1,171.9 1,156.1 27.7 32,034 66.90 2,142,162 2011 ............ 1,232.8 1,213.2 23.8 28,896 69.40 2,004,116 2012 ............ 1,230.1 1,204.1 29.3 35,224 66.40 2,338,789 2013 ............ 1,198.0 1,154.0 28.4 32,789 46.60 1,526,821 2014 ............ 1,162.5 1,146.3 27.3 31,285 46.00 1,440,068 2015 ............ 1,159.8 1,145.4 30.9 35,371 47,20 1,669,310 2016 ............ 1,163.4 1,126.4 32.8 36,920 35.70 1,318,267 2017 ............ 1,131.4 1,113.8 31.7 35,317 41.20 1,456,165 2018 ............ 1,113.1 1,096.4 30.4 33,282 35.50 1,177,992 2019 ............ 1,132.0 979.3 29.2 28,600 38.40 1,099,574
1 Relates to year of intended harvest for fall planted beets in central California and to year of planting for overwintered beets in central and southern California.
NASS, Crops Branch, (202) 720–2127.
Table 2-10.—Sugarbeets: Area, yield, and production, by State and United States, 2017–2019
State Area planted Area harvested Yield per harvested acre Production
2017 2018 2019 2017 2018 2019 2017 2018 2019 2017 2018 2019
1,000 1,000 1,000 1,000 1,000 1,000 1,000 1,000 1,000 acres acres acres acres acres acres Tons Tons Tons tons tons tons
California 1 ... 25.0 24.6 24.5 24.4 24.6 24.5 43.7 48.8 44.1 1,066 1,200 1,080 Colorado ...... 29.4 26.3 25.1 29.0 25.5 24.4 35.7 32.6 30.7 1,035 831 749 Idaho ........... 167.0 163.0 171.0 166.0 163.0 165.0 39.2 40.5 39.0 6,507 6,602 6,435 Michigan ...... 144.0 150.0 146.0 143.0 148.0 145.0 25.2 29.1 28.6 3,604 4,307 4,147 Minnesota .... 420.0 415.0 424.0 409.0 408.0 336.0 30.6 25.7 25.0 12,515 10,486 8,400 Montana ...... 42.9 43.5 41.8 42.7 42.4 36.5 32.7 31.1 31.6 1,396 1,319 1,153 Nebraska ..... 46.1 45.5 44.0 45.2 44.1 42.1 31.8 31.9 25.4 1,437 1,407 1,069 North Dakota 214.0 202.0 212.0 212.0 199.0 170.0 30.4 28.8 26.0 6,445 5,731 4,420 Oregon ........ 9.1 9.3 10.0 9.1 9.3 9.8 36.7 39.4 38.5 334 366 377 Washington 2 1.8 1.8 2.0 1.8 1.8 2.0 48.2 48.2 45.4 87 87 91 Wyoming ..... 32.1 32.1 31.6 31.6 30.7 24.7 28.2 30.8 28.3 891 946 679
United States 1,131.4 1,113.1 1,132.0 1,113.8 1,096.4 979.3 31.7 30.4 29.2 35,317 33,282 28,600
1 Relates to year of intended harvest for fall planted beets in central California and to year of planting for overwintered beets in central and southern California.
NASS, Crops Branch, (202) 720–2127.
Table 2-11.—Sugarbeets: Production and value, by State and United States, 2017–2018
State
Production Marketing year average price per ton received by farmers
Value of production
2017 2018 2017 2018 2017 2018
1,000 tons 1,000 tons Dollars Dollars 1,000 dollars 1,000 dollars
California 1 ..... 1,066 1,200 47.70 47.70 50,848 52,088 Colorado ........ 1,035 831 31.60 29.20 32,706 24,265 Idaho .............. 6,507 6,602 40.20 46.00 261,581 303,692 Michigan ........ 3,604 4,307 38.30 35.10 138,033 150,158 Minnesota ...... 12,515 10,486 42.50 27.50 531,888 288,365 Montana ......... 1,396 1,319 41.30 41.40 57,655 54,607 Nebraska ....... 1,437 1,407 33.70 30.00 48,427 42,210 North Dakota 6,445 5,731 44.20 35.60 284,869 204,024 Oregon ........... 334 366 40.20 46.00 13,427 16,836 Washingtion 2 87 87 40.20 46.00 3,497 4,002 Wyoming ........ 891 946 37.30 39.90 33,234 37,745
United States 35,317 33,282 41.20 35.50 1,456,165 1,177,992
1 Relates to year of intended harvest for fall planted beets in central California and to year of planting for overwintered beets in central and southern California.
NASS, Crops Branch, (202) 720–2127.

II–10 GRAIN AND FEED
Table 2-12.—Sugarcane for sugar and seed: Area, yield, production, and value, United States, 2010–2019
Year
Area harvested Yield per acre 1 Production 1
For sugar For seed Total For sugar For seed For sugar and seed For sugar For seed Total
1,000 1,000 1,000 1,000 1,000 1,000 acres acres acres Tons Tons Tons tons tons tons
2010 ............ 825.3 52.2 877.5 31.1 32.5 31.2 25,663 1,697 27,360 2011 ............ 827.1 45.5 872.6 33.5 32.7 33.5 27,738 1,486 29,224 2012 ............ 854.9 47.5 902.4 35.7 36.4 35.7 30,500 1,727 32,227 2013 ........... 859.6 51.2 910.8 33.8 33.9 33.8 29,023 1,521 30,761 2014 ............ 823.7 44.8 868.5 35.1 34.1 35.0 28,895 1,529 30,424 2015 ............ 831.1 43.6 874.7 36.8 35.9 36.7 30,535 1,567 32,122 2016 ............ 853.2 49.9 903.1 35.6 35.0 35.6 30,371 1,747 32,118 2017 ............ 851.5 52.6 904.1 36.6 39.1 36.8 31,182 2,056 33,238 2018 ............ 859.6 40.1 899.7 38.3 40.1 38.4 32,934 1,608 34,542 2019 ............ 870.3 42.9 913.2 34.8 38.5 35.0 30,287 1,650 31,937
Year Marketing year average price per ton received by farmers
Value of production
Of cane used for sugar Of cane used for sugar and seed 2
Dollars 1,000 dollars 1,000 dollars
2010 ............ 41.70 1,069,537 1,140,636 2011 ............ 47.20 1,308,951 1,379,498 2012 ............ 41.90 1,276,631 1,348,361 2013 ............ 31.40 910,377 962,807 2014 ............ 34.70 1,002,138 1,054,657 2015 ............ 31.20 953,328 1,000,620 2016 ............ 32.60 990,209 966,757 2017 ............ 31.00 966,757 1,025,524 2018 ............ 33.40 1,100,218 1,154,907 2019 ............ 37.80 1,144,859 1,207,893
1 Net tons. 2 Price per ton of cane for sugar used in evaluating value of production for seed. NASS, Crops Branch, (202) 720–2127.
Table 2-13.—Sugarcane for sugar and seed: Production and value, by State and United States, 2017–2018
State
Sugarcane for sugar Sugar and seed: Value of production 1
Production 2 Price per ton Value of production
2017 2018 2017 2018 2017 2018 2017 2018
1,000 1,000 1,000 1,000 1,000 1,000 tons tons Dollars Dollars dollars dollars dollars dollars
Florida ........... 16,237 16,555 37.90 31.10 615.382 514,861 642,102 536,662 Louisiana ....... 13,455 15,003 23.90 37.20 321,575 558,112 352,382 590,030 Texas ............. 1,490 1,376 20.00 19.80 29,800 27,245 31,040 28,215
United States 31,182 32,934 31.00 33.40 966,757 1,100,218 1,025,524 1,154,907
1 Price per ton of cane for sugar used in evaluating value of production for seed. 2 Net tons. NASS, Crops Branch, (202) 720–2127.

II–11 AGRICULTURAL STATISTICS 2020
Table 2-14.—Sugarcane for sugar and seed: Area, yield, and production, by State and United States, 2017–2019
State Area harvested Yield per acre 1 Cane production 1
2017 2018 2019 2017 2018 2019 2017 2018 2019
1,000 1,000 1,000 1,000 1,000 1,000 For sugar: acres acres acres Tons Tons Tons tons tons tons
Florida ................ 397 397 397 40.9 41.7 42.8 16,237 16,555 16,992 Louisiana ............ 414 425 442 32.5 35.3 27.7 13,455 15,003 12,243 Texas .................. 40.5 37.6 31.3 36.8 36.6 33.6 1,490 1,376 1,052
United States ...... 851.5 859.6 870.3 36.6 38.3 34.8 31,182 32,934 30,287
For seed:
Florida ................ 15.7 15.3 13.7 44.9 45.8 47.6 705 701 652 Louisiana ............ 35.6 23.5 27.0 36.2 36.5 34.0 1,289 858 918 Texas .................. 1.3 1.3 2.2 48.0 37.9 36.5 62 49 80
United States ...... 52.6 40.1 42.9 39.1 40.1 38.5 2,056 1,608 1,650
For sugar and seed:
Florida ................ 412.7 412.3 410.7 41.1 41.9 43.0 16,942 17,256 17,644 Louisiana ............ 449.6 448.5 469.0 32.8 35.4 28.1 14,744 15,861 13,161 Texas .................. 41.8 38.9 33.5 37.1 36.6 33.8 1,552 1,425 1,132
United States ...... 904.1 899.7 913.2 36.8 38.4 35.0 33,238 34,542 31,937
1 Net tons. NASS, Crops Branch, (202) 720–2127.
Table 2-15.—Sugar, cane (raw value 1 ): Refiners’ raw stocks, receipts, meltings, continental United States, 2010–2019
Year Jan. 1 stocks Receipts 2 Meltings
1,000 tons
2010 .................................... 346 5,754 5,843 2011 .................................... 257 5,776 5,534 2012 .................................... 498 5,880 5,805 2013 .................................... 574 5,956 5,938 2014 .................................... 592 6,099 6,135 2015 .................................... 556 6,319 6,552 2016 .................................... 322 6,473 6,434 2017 .................................... 362 6,272 6,096 2018 .................................... 538 6,328 6,339 2019 .................................... 528 6,487 6,450
1 Raw value is the equivalent in terms of 96° sugar. 2 Receipts include refiners’ total offshore raw sugar receipts in conti-nental U.S. ports, whether entered through the customs or held pending availability of quota and raw cane sugar produced from sugarcane in the continental United States.
FPAC-BC, Commodity Analysis Branch, (202) 690-0734.
Table 2-16.—Sugar, cane and beet: Domestic marketings, by source of supply, continental United States, 2017–2019
Area of supply 2017 2018 2019
1,000 tons
Domestic areas
Mainland (beet) .......................................... 5,529 5,096 5,045 Mainland and Hawaii (cane) ...................... 3,843 3,937 4,018
Total domestic areas ................................. 9,371 9,033 9,063
FPAC-BC, Commodity Analysis Branch, (202) 690-0734.

II–12 GRAIN AND FEED
Table 2-17.—Sugar, cane and beet (refined): Stocks, production, and food use deliveries, continental United States, 2010–2019
Item and year Cane refiners
Sugarbeet processors
Importers of direct
consumption sugar
Mainland cane processors 1 Total
1,000 short tons, raw value
Stocks as of Jan. 1 2
2010 .............................. 484 1,456 0 8 1,947 2011 .............................. 466 1,691 0 4 2,161 2012 .............................. 315 1,597 0 6 1,918 2013 .............................. 388 2,013 0 3 2,404 2014 .............................. 572 1,603 0 5 2,180 2015 .............................. 351 1,589 0 4 1,944 2016 .............................. 413 1,889 0 4 2,307 2017 .............................. 325 2,029 0 0 2,354 2018 .............................. 316 1,716 0 0 2,032 2019 .............................. 288 1,889 0 0 2,177
Sugar Production
2010 .............................. 5,833 4,758 0 23 10,615 2011 .............................. 5,476 4,561 0 19 10,056 2012 .............................. 5,841 5,070 0 16 10,927 2013 .............................. 5,883 4,881 0 17 10,781 2014 .............................. 6,106 4,895 0 10 11,012 2015 .............................. 6,528 4,878 0 42 11,448 2016 .............................. 6,419 4,990 0 82 11,491 2017 .............................. 6,084 5,198 0 0 11,282 2018 .............................. 6,303 5,322 0 0 11,625 2019 .............................. 6,366 4,668 0 0 11,034
Food and Beverage Deliveries 3
2010 .............................. 5,615 4,514 904 20 11,054 2011 .............................. 5,554 4,552 995 17 11,118 2012 .............................. 5,630 4,633 977 18 11,257 2013 .............................. 5,834 4,777 949 15 11,575 2014 .............................. 6,058 4,875 796 11 11,740 2015 .............................. 6,274 4,614 1,034 11 11,933 2016 .............................. 6,373 4,809 921 12 12,115 2017 .............................. 5,976 5,425 682 0 12,083 2018 .............................. 6,219 5,121 705 0 12,045 2019 .............................. 6,317 5,099 644 0 12,060
1 Sugar for human consumption only. 2 Stocks include sugar in bond and in Customs custody and control. 3 Consists of all refined sugar.
FPAC-BC, Commodity Analysis Branch, (202) 690-0734.
Table 2-18.—Sugar (raw and refined): Average price per pound at specified markets, 2010–2019
Year
Cane sugar
Refined beet: Mid-west markets,
U.S. wholesale
Retail price, granulated: United States
Raw, 96 centrifugal
Intercontinental contract No. 11, nearby
futures, world price
Duty fee paid, New York, U.S. price
Cents Cents Cents Cents
2010 ......... 22.49 35.97 53.23 62.86 2011 ......... 27.22 38.12 56.22 68.30 2012 ......... 21.69 28.90 43.38 69.41 2013 ......... 17.46 20.46 27.22 64.32 2014 ......... 16.34 24.15 32.86 60.90 2015 ......... 13.14 24.88 33.88 65.36 2016 ......... 18.13 27.65 29.65 64.19 2017 ......... 15.81 27.92 31.33 64.76 2018 ......... 12.25 25.37 35.54 61.63 2019 ......... 12.36 26.16 36.14 59.01
ERS, Market and Trade Economics Division, (202) 694–5247. Compiled from the following sources: (New York) Coffee, Sugar & Cocoa Exchange; the U.S. Department of Labor, Bureau of Labor Statistics; Milling and Baking News, New York Board of Trade; Intercontinental Exchange,.

II–13 AGRICULTURAL STATISTICS 2020
Table 2-19.—Sugar, centrifugal: International trade, 2017/2018–2019/2020
Country 2017/2018 2018/2019 2019/2020
1,000 metric tons, raw value
Principle exporting countries:
Brazil .................................. 28,200 19,600 18,620 Thailand ............................. 10,907 9,300 10,500 India ................................... 2,236 4,700 5,000 Australia ............................. 3,600 3,800 3,500 Guatemala ......................... 1,881 1,999 2,019 Mexico ................................ 1,146 2,337 1,693 South Africa ....................... 768 1,041 1,600 European Union ................. 3,920 1,800 1,500 Eswatini .............................. 519 680 760 Colombia ............................ 732 720 750 Algeria ................................ 610 651 671 Cuba .................................. 553 592 610 Russia ................................ 621 315 605 Pakistan ............................. 1,600 600 500 Morocco ............................. 380 450 470 El Salvador ........................ 449 451 465 United Arab Emirates ........ 458 430 430 Belarus ............................... 393 400 420 Nicaragua ........................... 388 421 420 Mauritius ............................ 390 347 360
Principle importing countries:
Indonesia ........................... 4,298 5,362 4,500 China .................................. 4,350 4,100 4,000 United States ..................... 2,972 2,816 2,866 Bangladesh ........................ 2,654 2,455 2,480 Algeria ................................ 2,349 2,217 2,170 Malaysia ............................. 2,002 2,125 2,050 European Union ................. 1,341 1,900 2,000 Nigeria ................................ 1,870 1,870 1,890 Korea, South ...................... 1,864 1,996 1,860 Saudi Arabia ...................... 1,486 1,528 1,600 India ................................... 2,071 1,300 1,500 United Arab Emirates ........ 2,804 1,573 1,330 Canada .............................. 1,243 1,285 1,325 Japan ................................. 1,240 1,187 1,196 Iraq ..................................... 1,340 1,154 1,175 Morocco ............................. 1,128 1,058 1,142 Venezuela .......................... 1,030 1,000 1,000 Iran ..................................... 237 851 851 Egypt .................................. 990 860 830 Sudan ................................. 827 805 825
FAS, Office of Global Analysis, (202) 720–6301. Prepared or estimated on the basis of official USDA production, supply, and distribution statistics from foreign governments.
Table 2-20.—U.S. Sugar (raw value): Supply and use, includes Puerto Rico, 2009/10–2018/19
Fiscal Year Beginning stocks Production Imports Exports Total deliveries,
domestic use
1,000 short tons
2009/10 .......... 1,534 7,963 3,320 211 11,152 2010/11 .......... 1,498 7,831 3,738 248 11,422 2011/12 .......... 1,378 8,488 3,632 269 11,313 2012/13 .......... 1,979 8,981 3,224 274 11,776 2013/14 .......... 2,158 8,462 3,742 306 12,246 2014/15 .......... 1,810 8,656 3,553 185 12,019 2015/16 .......... 1,815 8,989 3,341 74 12,051 2016/17 .......... 2,054 8,970 3,244 95 12,258 2017/18 .......... 1,876 9,293 3,277 170 12,185 2018/19 .......... 2,008 8,948 2,875 35 12,270
ERS, Market and Trade Economics Division, (202) 694–5247. Source: ERS Sugar and Sweetener Outlook

II–14 GRAIN AND FEED
Table 2-21.—Honey: United States exports for consumption, by country of destination, 2017–2019
Country 2017 2018 2019
Metric tons Metric tons Metric tons Philippines .......................................... 747 812 672 Canada ............................................... 647 739 635 Korea, South ....................................... 787 507 583 Japan .................................................. 208 538 571 Kuwait ................................................. 487 150 407 Yemen(*) ............................................. 59 72 180 China .................................................. 316 120 155 United Arab Emirates ......................... 125 157 135 India .................................................... 0 59 130 Panama .............................................. 51 66 99 Trinidad and Tobago .......................... 21 20 70 Barbados ............................................ 57 48 64 Vietnam ............................................... 198 511 56 Hong Kong .......................................... 27 41 45 Bahamas, The .................................... 102 76 44 Netherlands Antilles(*) ........................ 31 31 42 Bahrain ............................................... 43 51 40 Taiwan ................................................ 10 6 34 Bermuda ............................................. 38 37 24 Singapore ........................................... 93 19 23 Nicaragua ........................................... 0 0 20 Pakistan(*) .......................................... 31 25 16 United Kingdom .................................. 1 5 14 Cambodia ........................................... 3 14 12 Austria ................................................. 0 11 11 Germany(*) ......................................... 3 0 11 Costa Rica .......................................... 2 4 10 Netherlands ........................................ 0 0 8 Romania) ............................................ 0 0 8 Cayman Islands .................................. 7 5 7 Rest of World ...................................... 383 287 45
World Total ......................................... 4,478 4,407 4,169
(*) Denotes a country that is a summarization of its component countries. FAS, Office of Global Analysis, (202) 720-6301. Data Source: U.S. Census Bureau Trade Data, as of March 10, 2020.

II–15 AGRICULTURAL STATISTICS 2020
Table 2-22.—Honey: Number of colonies, yield, production, stocks, price, and value, United States, 2010–2019 1
State Honey
producing colonies 2
Yield per colony Production 3 Stocks Dec 15 4 Average price
per pound 5 Value of
production
1,000 Pounds 1,000 pounds 1,000 pounds Cents 1,000 dollars
2010 ......... 2,692 65.6 176,462 45,018 161.9 285,692 2011 ......... 2,491 59.6 148,357 36,761 176.5 261,850 2012 ......... 2,539 56.0 142,296 31,829 199.2 283,454 2013 ......... 2,641 56.6 149,550 38,175 214 320,037 2014 ......... 2,741 65.1 178,310 41,207 217 386,933 2015 ......... 2,661 58.9 156,705 42,205 208 325,946 2016 ......... 2,780 58.4 162,246 41,314 212 343,962 2017 ......... 2,684 55.5 149,025 30,671 220 327,855 2018 ......... 2,828 54.5 154,008 29,303 221 340,358 2019 ......... 2,812 55.8 156,922 41,022 197 309,136
1 For producers with 5 or more colonies that also qualify as a farm. Colonies which produced honey in more than one State were counted in each State. 2 Honey producing colonies are the maximum number of colonies from which honey was taken during the year. It is possible to take honey from colonies which did not survive the entire year. 3 Due to round-ing, total colonies multiplied by total yield may not exactly equal production. 4 Stocks held by producers. 5 Average price per pound based on expanded sales.
NASS, Livestock Branch, (202) 720–3570.
Table 2-23.—Honey: Number of colonies, yield, production, stocks, price and value, by State and United States, 2018 1
State Honey
producing colonies 2
Yield per colony Production Stocks Dec 15 3 Average price
per pound 4 Value of
production 5
1,000 Pounds 1,000 pounds 1,000 pounds Cents 1,000 dollars
Alabama ............ 6 45 270 14 372 1,004 Arizona .............. 24 38 912 109 301 2,745 Arkansas ............ 28 50 1,400 84 188 2,632 California ........... 335 41 13,735 3,022 211 28,981 Colorado ............ 31 48 1,488 283 205 3,050 Florida ................ 215 49 10,535 737 240 25,284 Georgia .............. 98 34 3,332 200 276 9,196 Hawaii ................ 17 103 1,751 18 192 3,362 Idaho .................. 96 31 2,976 655 196 5,833 Illinois ................. 11 41 451 108 483 2,178 Indiana ............... 7 46 322 106 358 1,153 Iowa ................... 38 49 1,862 1,005 240 4,469 Kansas ............... 5 73 365 95 310 1,132 Kentucky ............ 4 41 164 34 543 891 Louisiana ........... 45 83 3,735 261 191 7,134 Maine ................. 12 32 384 92 298 1,144 Michigan ............ 97 44 4,268 768 249 10,627 Minnesota .......... 119 61 7,259 1,161 194 14,082 Mississippi ......... 20 87 1,740 70 207 3,602 Missouri ............. 9 45 405 36 283 1,146 Montana ............. 160 92 14,720 3,680 190 27,968 Nebraska ........... 40 59 2,360 850 201 4,744 New Jersey ........ 13 31 403 165 747 3.010 New York ........... 56 48 2,688 833 324 8,709 North Carolina ... 10 33 330 63 576 1,901 North Dakota ..... 550 72 39,600 4,752 187 74,052 Ohio ................... 14 73 1,022 491 372 3,802 Oregon ............... 93 35 3,255 1,009 236 7,682 Pennsylvania ..... 19 44 836 309 389 3,252 South Carolina ... 16 48 768 15 317 2,435 South Dakota ..... 255 47 11,985 5,154 191 22,891 Tennessee ......... 7 46 322 84 411 1,323 Texas ................. 132 56 7,392 1,035 212 15,671 Utah ................... 26 41 1,066 75 210 2,239 Vermont ............. 7 48 336 94 376 1,263 Virginia ............... 4 40 160 35 724 1,158 Washington ........ 77 43 3,311 563 215 7,119 West Virginia ..... 6 37 222 38 433 961 Wisconsin .......... 51 45 2,295 711 295 6,770 Wyoming ............ 39 56 2,184 175 191 4,171 .Other States 6 7 36 39 1,399 314 602 8,422
United States 7 8 2,828 54.5 154,008 29,303 221 340,358
1 For producers with 5 or more colonies that also qualify as a farm. Colonies which produced honey in more than one State were counted in each State. 2 Honey producing colonies are the maximum number of colonies from which honey was taken during the year. It is possible to take honey from colonies which did not survive the entire year. 3 Stocks held by producers. 4 Average price per pound based on expanded sales. 5 Value of production is equal to production multi-plied by average price per pound. 6 Alaska, Connecticut, Delaware, Maryland, Massachusetts, Nevada, New Hampshire, New Mexico, Oklahoma, and Rhode Island not published separately to avoid disclosing data for individual oper-ations. 7 Due to rounding, total colonies multiplied by total yield may not exactly equal production. 8 United States value of production will not equal summation of States.
NASS, Livestock Branch, (202) 720–3570.

II–16 GRAIN AND FEED
Table 2-24.—Honey: Number of colonies, yield, production, stocks, price and value, by State and United States, 2019 1
State Honey
producing colonies 2
Yield per colony Production Stocks Dec 15 3 Average price
per pound 4 Value of
production 5
*COM008* 1,000 Pounds 1,000 pounds 1,000 pounds Cents 1,000 dollars
Alabama ............ 7 42 294 44 320 941 Arizona .............. 23 46 1,058 201 197 2,084 Arkansas ............ 20 55 1,100 176 153 1,683 California ........... 335 48 16,080 3,216 156 25,085 Colorado ............ 33 46 1,472 500 214 3,150 Florida ................ 205 45 9,225 830 248 22,878 Georgia .............. 102 33 3,366 370 261 8,785 Hawaii ................ 16 80 1,280 51 128 1,638 Idaho .................. 92 32 2,944 677 167 4,916 Illinois ................. 11 39 429 116 431 1,849 Indiana ............... 9 55 495 198 395 1,955 Iowa ................... 38 55 2,090 1,170 224 4,682 Kansas ............... 7 79 553 171 295 1,631 Kentucky ............ 6 41 246 44 450 1,107 Louisiana ........... 54 72 3,888 428 204 7,932 Maine ................. 15 35 525 110 292 1,533 Michigan ............ 94 50 4,700 1,363 236 11,092 Minnesota .......... 118 59 6,962 3,063 163 11,348 Mississippi ......... 22 80 1,760 141 185 3,256 Missouri ............. 10 43 430 73 332 1,428 Montana ............. 173 86 14,878 5,802 148 22,019 Nebraska ........... 39 52 2,028 223 146 2,961 New Jersey ........ 15 28 420 155 333 1,399 New York ........... 59 58 3,422 1,027 449 15,365 North Carolina ... 14 42 588 118 406 2,387 North Dakota ..... 520 65 33,800 6,422 140 47,320 Ohio ................... 15 67 1,005 442 342 3,437 Oregon ............... 87 32 2,784 1,141 207 5,763 Pennsylvania ..... 19 50 950 409 424 4,028 South Carolina ... 16 47 752 45 501 3,768 South Dakota ..... 270 72 19,440 7,582 153 29,743 Tennessee ......... 8 57 456 91 465 2,120 Texas ................. 126 60 7,560 1,814 230 17,388 Utah ................... 22 29 638 89 206 1,314 Vermont ............. 6 48 288 84 434 1,250 Virginia ............... 5 39 195 49 751 1,464 Washington ........ 81 35 2,835 1,191 212 6,010 West Virginia ..... 6 37 222 47 450 999 Wisconsin .......... 46 47 2,162 692 299 6,464 Wyoming ............ 39 56 2,184 306 135 2,948 Other States 6 7 30 47 1,418 351 591 8,380
United States 7 8 2,812 55.8 156,922 41,022 197 309,136
1 For producers with 5 or more colonies that also qualify as a farm. Colonies which produced honey in more than one State were counted in each State. 2 Honey producing colonies are the maximum number of colonies from which honey was taken during the year. It is possible to take honey from colonies which did not survive the entire year. 3 Stocks held by producers. 4 Average price per pound based on expanded sales. 5 Value of production is equal to production multi-plied by average price per pound. 6 Alaska, Connecticut, Delaware, Maryland, Massachusetts, Nevada, New Hampshire, New Mexico, Oklahoma, and Rhode Island not published separately to avoid disclosing data for individual oper-ations. 7 Due to rounding, total colonies multiplied by total yield may not exactly equal production. 8 United States value of production will not equal summation of States.
NASS, Livestock Branch, (202) 720–3570.

II–17 AGRICULTURAL STATISTICS 2020
Table 2-25.—U.S. per capita caloric sweeteners estimated deliveries for domestic food and beverage use, by calendar year 2009–2018 1 2
Calendar year
U.S. population 3
(July 1)
Refined sugar 4 HFCS
Corn Sweeteners Pure
honey Edible syrups
Total caloric
sweeteners Glucose syrup Dextrose Total
Millions Pounds, dry basis
2009 ....... 307.2 63.4 49.7 13.0 2.7 65.3 0.9 0.6 130.3 2010 ....... 309.3 66.0 48.4 12.6 2.9 64.0 1.0 0.7 131.7 2011 ....... 311.6 66.0 46.7 12.2 2.9 61.8 1.1 0.7 129.6 2012 ....... 313.9 66.7 45.8 12.5 2.7 61.0 1.1 0.7 129.5 2013 ....... 316.1 68.0 43.8 12.0 2.6 58.4 1.2 0.7 128.3 2014 ....... 318.4 68.2 43.4 12.2 3.0 58.6 1.3 0.8 128.9 2015 ....... 320.7 69.1 42.6 12.3 3.0 57.8 1.3 0.9 129.0 2016 ....... 323.1 69.5 41.4 12.4 2.7 56.5 1.3 0.7 128.0 2017 ....... 325.1 69.1 40.5 13.1 3.0 56.5 1.4 0.7 127.7 2018 ....... 327.2 68.5 37.6 13.1 3.0 53.7 1.4 0.7 124.4
1 Per capita deliveries of sweeteners by U.S. processors and refiners and direct-consumption imports to food manufactur-ers, retailers, and other end users represent the per capita supply of caloric sweeteners. The data exclude deliveries to manufacturers of alcoholic beverages. Actual human intake of caloric sweeteners is lower because of uneaten food, spoil-age, and other losses. See Table 51 of the Sugar and Sweeteners Yearbook series for estimated intake of sugar. 2 Totals may not add due to rounding. 3 Source: U.S. Census Bureau. 4 Based on U.S. sugar deliveries for do-mestic food and beverage use.
ERS, Market and Trade Economics Division (202) 694–5247. Source: ERS Sugars and Sweeteners Outlook.
Table 2-26.—Tobacco: Area, yield, production, price, and value, United States, 2010–2019
Year Area harvested Yield per acre Production
Marketing year average price per pound received
by farmers
Value of production
Acres Pounds 1,000 pounds Dollars 1,000 dollars
2010 ............... 337,500 2,128 718,190 1.782 1,279,920 2011 ............... 325,040 1,841 598,252 1.857 1,110,737 2012 ............... 336,245 2,268 762,709 2.027 1,557,604 2013 ............... 356,250 2,033 724,266 2.181 1,579,823 2014 ............... 378,480 2,316 876,689 2.094 1,835,663 2015 ............... 328,850 2,188 719,563 2.006 1,443,320 2016 ............... 319,660 1,967 628,720 2.007 1,262,087 2017 ............... 321,470 2,209 710,161 2.058 1,461,855 2018 ............... 291,430 1,830 533,241 2.051 1,093,418 2019 ............... 227,120 2,060 467,956 2.009 946,252
Table 2-27.—Tobacco: Area, yield, and production, by State and United States, 2017–2019
State Area harvested Yield per harvested acre Production
2017 2018 2019 2017 2018 2019 2017 2018 2019
1,000 1,000 1,000 Acres Acres Acres Pounds Pounds Pounds pounds pounds pounds
Georgia ............ 12,500 12,500 9,000 2,100 1,900 2,100 26,250 23,750 18,900 Kentucky .......... 80,500 68,100 57,400 2,277 1,973 2,150 183,300 134,370 123,390 North Carolina 163,900 152,750 117,400 2,197 1,649 1,999 360,040 251,925 234,700 Pennsylvania ... 8,100 7,800 5,700 2,344 2,231 2,509 18,990 17,400 14,300 South Carolina 12,000 12,300 8,300 2,100 1,800 1,900 25,200 22,140 15,770 Tennessee ....... 21,100 15,700 13,300 2,038 2,523 2,292 43,000 39,610 30,490 Virginia ............ 23,370 22,280 16,020 2,284 1,977 1,898 53,381 44,046 30,406
United States ... 321,470 291,430 227,120 2,209 1,830 2,060 710,161 533,241 467,956

III–1
CHAPTER III
STATISTICS OF OILSEEDS, FATS, AND OILS
This chapter includes information on cottonseed, flaxseed, olive oil, peanuts, soybeans, and fats and oils. Most butter statistics are included in the chapter on dairy and poultry statistics. Lard data are mostly in the chapter on livestock.
Table 3-1.—Cottonseed: All cotton harvested area and cottonseed production, farm disposition, marketing year average price per ton received by farmers, and value, United States, 2010–2019
Year Harvested area of all cotton
Cottonseed
Production Farm disposition Marketing year
average price 2 Value of
production Sales to oil mills Other 1
1,000 acres 1,000 tons 1,000 tons 1,000 tons Dollars 1,000 dollars 2010 ......... 10,698.7 6,096.1 3,252.9 2,843.2 161.00 988,656 2011 ......... 9,460.9 5,370.0 2,695.0 2,675.0 260.00 1,413,343 2012 ......... 9,321.8 5,666.0 2,985.0 2,681.0 252.00 1,456,245 2013 ......... 7,539.4 4,203.0 2,070.0 2,133.0 246.00 1,054,003 2014 ......... 9,351.8 5,125.0 2,459.0 2,666.0 194.00 1,015,607 2015 ......... 8,074.9 4,043.0 1,916.0 2,127.0 227.00 932,894 2016 ......... 9,507.8 5,369.0 2,921.0 2,448.0 195.00 1,055,924 2017 ......... 11,100.4 6,422.0 3,059.0 3,363.0 142.00 911,925 2018 ......... 10,205.8 5,631.0 2,435.0 3,196.0 155.00 878,254 2019 ......... 11,804.5 5,945.0 2,575.0 3,370.0 159.00 1,021,832
1 Includes planting seed, feed, exports, inter-farm sales, shrinkage, losses, and other uses. 2 2018 based on monthly prices received from August 1, 2018 - December 31, 2018.
NASS, Crops Branch, (202) 720–2127.
Table 3-2.—Cottonseed: Production and farm disposition, by State and United States, 2018 and 2019
State
Production Farm disposition Seed for planting 1
2018 2019 Sales to oil mills Other 2
2018 2019 2018 2019 2018 2019
1,000 1,000 1,000 1,000 1,000 1,000 1,000 1,000 tons tons tons tons tons tons tons tons
Alabama ........................ 254.0 267.0 43.0 46.0 211.0 221.0 3.1 3.0 Arizona .......................... 156.0 136.0 3.0 ................ 153.0 136.0 1.1 1.0 Arkansas ....................... 366.0 472.0 268.0 280.0 98.0 192.0 3.7 3.7 California ....................... 342.0 290.0 62.0 69.0 280.0 221.0 2.0 1.8 Florida ........................... 27.0 57.0 26.0 39.0 1.0 18.0 0.5 0.6 Georgia .......................... 546.0 778.0 202.0 296.0 344.0 482.0 6.5 6.2 Kansas .......................... 106.0 85.0 ................ ................ 106.0 85.0 0.9 1.1 Louisiana ....................... 135.0 192.0 107.0 121.0 28.0 71.0 1.6 1.4 Mississippi ..................... 451.0 503.0 240.0 265.0 211.0 238.0 4.4 4.3 Missouri ......................... 310.0 253.0 150.0 117.0 160.0 136.0 2.1 2.2 New Mexico ................... 42.0 26.0 ................ ................ 42.0 26.0 0.5 0.5 North Carolina ............... 224.0 308.0 10.0 4.0 214.0 304.0 3.1 3.3 Oklahoma ...................... 197.0 191.0 124.0 132.0 73.0 59.0 4.0 3.7 South Carolina .............. 117.0 116.0 30.0 41.0 87.0 75.0 1.5 1.5 Tennessee ..................... 219.0 301.0 175.0 255.0 44.0 46.0 2.3 2.3 Texas ............................. 2,088.0 1,902.0 995.0 910.0 1,093.0 992.0 41.6 39.3 Virginia .......................... 51.0 68.0 ................ ................ 51.0 68.0 0.6 0.6
United States ................. 5,631.0 5,945.0 2,435.0 2,575.0 3,196.0 3,370.0 79.5 76.5
1 Included in ’’other’’ farm disposition. Seed for planting is produced in crop year shown, but used in the following year. 2 Includes planting seed, feed, exports, inter-farm sales, shrinkage, losses, and other uses.
NASS, Crops Branch, (202) 720–2127.

III–2 OILSEEDS, FATS, AND OILS
Table 3-3.—Cottonseed: Marketing year average price per ton and value of production, by State and United States, crop of 2017–2019
State Marketing year average price per ton Value of production
2017 2018 2019 1 2017 2018 2019 1
Dollars Dollars Dollars 1,000 dollars 1,000 dollars 1,000 dollars
Alabama ................. 118.00 118.00 119.00 24,072 29,972 37,485 Arizona ................... 183.00 214.00 242.00 31,293 33,384 40,172 Arkansas ................ 152.00 152.00 175.00 53,352 55,632 79,975 California ................ 226.00 260.00 305.00 72,998 88,920 98,820 Florida .................... 100.00 110.00 120.00 4,400 2,970 6,360 Georgia .................. 116.00 113.00 115.00 74,008 61,698 86,365 Kansas ................... 170.00 175.00 170.00 9,860 18,550 15,300 Louisiana ............... 160.00 148.00 157.00 20,320 19,980 29,045 Mississippi ............. 156.00 157.00 163.00 67,392 70,807 82,641 Missouri ................. 152.00 153.00 169.00 38,760 47,430 58,812 New Mexico ........... 164.00 200.00 210.00 6,560 8,400 9,660 North Carolina ....... 118.00 127.00 142.00 25,606 28,448 45,156 Oklahoma .............. 116.00 140.00 152.00 34,104 27,580 29,032 South Carolina ....... 133.00 123.00 124.00 16,685 14,391 18,352 Tennessee ............. 137.00 143.00 157.00 31,510 31,317 46,629 Texas ..................... 138.00 159.00 167.00 393,576 331,992 329,658 Virginia ................... 121.00 133.00 135.00 6,292 6,783 8,370
United States ......... 142.00 155.00 159.00 911,925 878,254 1,021,832
1 Based on monthly prices received from August 1, 2019 - December 31, 2019. NASS, Crops Branch, (202) 720–2127.
Table 3-4.—Cottonseed: Crushings, output of products and product prices, United States, 2009–2018
Year beginning
August Quantity crushed
Cottonseed products and prices
Oil Cake and meal
Quantity Price 1 Quantity Price 2
1,000 tons Million pounds Cents per pound 1,000 tons Dollars per ton
2009 ........... 1,901 617 40.27 883 220.90 2010 ........... 2,563 835 54.50 1,163 273.84 2011 ........... 2,400 755 53.22 1,090 275.13 2012 ........... 2,500 800 48.60 1,125 331.52 2013 ........... 2,000 630 60.66 900 377.51 2014 ........... 1,900 610 45.74 855 304.27 2015 ........... 1,500 465 45.87 705 261.19 2016 ........... 1,769 542 40.92 805 208.61 2017 ........... 1,854 561 31.87 845 260.88 2018 ........... 1,900 590 33.0-36.0 855 225-265
1 Tanks, f.o.b. Valley Points. 2 41 percent protein, solvent, Memphis. ERS, Field Crops Branch, (202) 694–5300. Compiled from annual reports of the U.S. Department of Commerce.
Table 3-5.—International meal, cottonseed: Production in specified countries, 2017/2018–2019/2020
Country 2017/2018 2018/2019 2019/2020
1,000 metric tons
India ............................. 4,301 3,975 4,535 China ............................ 4,116 4,093 4,038 Brazil ............................ 1,310 1,875 1,900 Pakistan ....................... 1,465 1,395 1,350 United States ............... 766 678 726 Turkey .......................... 710 732 605 Uzbekistan ................... 651 558 600 Benin ............................ 145 166 173 Mali .............................. 167 172 162 European Union ........... 130 135 158 Turkmenistan ............... 205 144 153 Australia ....................... 386 300 145 Burma .......................... 141 134 131 Burkina ......................... 116 97 104 Cameroon .................... 84 88 95
FAS, Office of Global Analysis, (202) 720-6301. Prepared or estimated on the basis of official USDA production, supply, and distribution statistics from foreign governments.

III–3 AGRICULTURAL STATISTICS 2020
Table 3-6.—Cottonseed and Cottonseed oil: United States exports by country of destination, 2017–2019
Country of destination 2017 2018 2019
Metric tons Metric tons Metric tons Cottonseed:
Korea, South ........................... 123,769 131,012 118,194 Saudi Arabia ........................... 77,740 82,694 65,686 Japan ...................................... 53,872 63,478 58,636 Mexico ..................................... 120,085 95,329 36,400 Morocco .................................. 4,228 6,194 6,077 United Arab Emirates ............. 6,784 11,270 3,068 Oman ...................................... 1,292 1,145 2,865 Canada ................................... 2,477 3,366 2,865 Qatar ....................................... 1,259 4,872 1,991 Taiwan .................................... 258 325 1,675 Jordan ..................................... 1,740 1,576 1,483 China ....................................... 0 2,330 985 Malaysia .................................. 0 0 579 United Kingdom ...................... 0 744 168 Colombia ................................. 8 6 86 Hong Kong .............................. 0 0 8 Guatemala .............................. 0 1 1 Bangladesh ............................. 519 824 0 Costa Rica .............................. 19 0 0 Indonesia ................................ 988 894 0 Italy(*) ...................................... 686 745 0 Lebanon .................................. 302 639 0 Panama ................................... 0 1 0 Philippines ............................... 0 420 0 Spain ....................................... 49 0 0 Trinidad and Tobago .............. 1 5 0 Vietnam ................................... 0 50 0
World Total ............................. 396,075 407,919 300,768
Cottonseed oil: Mexico ..................................... 22,013 17,089 21,069 Australia(*) .............................. 4,347 7,782 9,964 Canada ................................... 5,141 6,304 3,990 Libya ....................................... 0 0 1,805 Malaysia .................................. 7,350 8,080 1,304 Japan ...................................... 591 1,101 1,242 Korea, South ........................... 0 43 110 Vietnam ................................... 0 0 101 India ........................................ 261 1,857 84 Thailand .................................. 59 108 31 Brazil ....................................... 32 65 28 Portugal ................................... 133 71 15 Belgium-Luxembourg(*) .......... 0 56 13 Turkey ..................................... 29 20 9 Germany(*) ............................. 0 1 6 United Kingdom ...................... 0 9 5 China ....................................... 0 0 5 Peru ........................................ 0 0 3 Colombia ................................. 0 1 3 El Salvador ............................. 0 0 2 Chile ........................................ 0 29 1 United Arab Emirates ............. 24 0 0 Argentina ................................. 8 38 0 Bahamas, The ........................ 2 5 0 Belize ...................................... 5 0 0 Costa Rica .............................. 0 2 0 Egypt ....................................... 0 3,150 0 Guatemala .............................. 207 0 0 Honduras ................................ 48 0 0 Hungary .................................. 0 26 0 Rest of World .......................... 1,519 1,485 0
World Total ............................. 41,770 47,319 39,791
(*) Denotes a country that is a summarization of its component countries. FAS, Office of Global Analysis, (202) 720-6301. Data Source: U.S. Census Bureau Trade Data
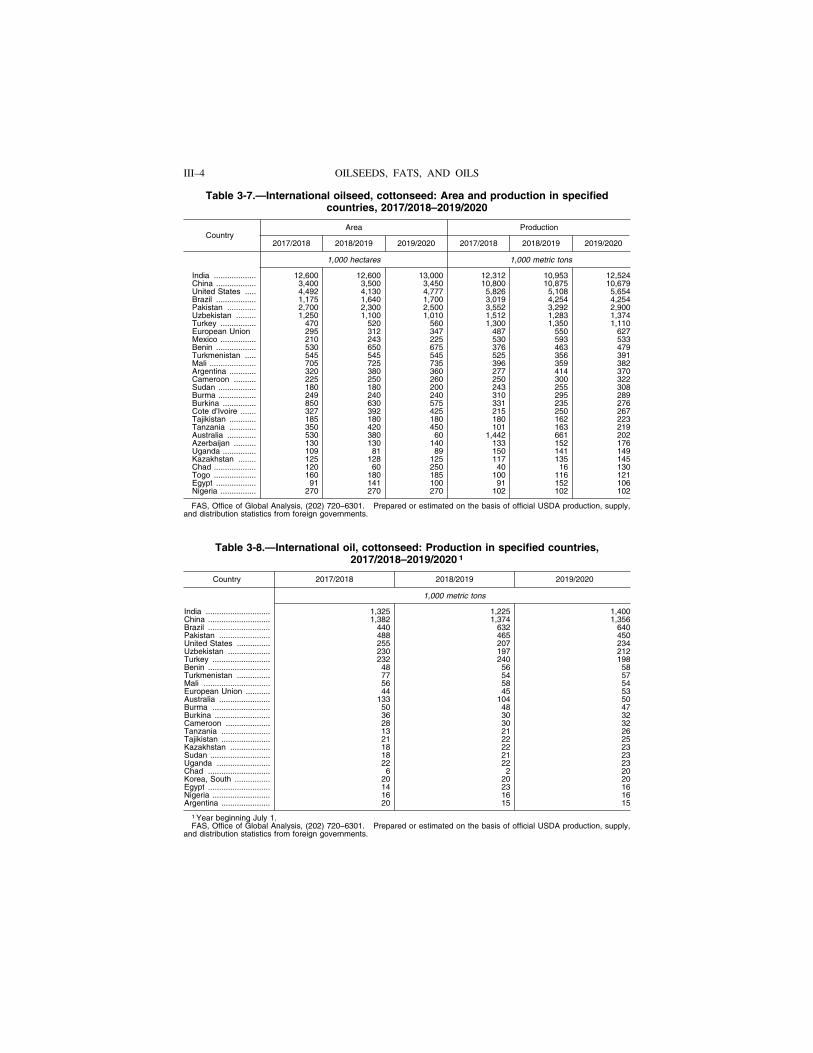
III–4 OILSEEDS, FATS, AND OILS
Table 3-7.—International oilseed, cottonseed: Area and production in specified countries, 2017/2018–2019/2020
Country Area Production
2017/2018 2018/2019 2019/2020 2017/2018 2018/2019 2019/2020
1,000 hectares 1,000 metric tons
India ................... 12,600 12,600 13,000 12,312 10,953 12,524 China .................. 3,400 3,500 3,450 10,800 10,875 10,679 United States ..... 4,492 4,130 4,777 5,826 5,108 5,654 Brazil .................. 1,175 1,640 1,700 3,019 4,254 4,254 Pakistan ............. 2,700 2,300 2,500 3,552 3,292 2,900 Uzbekistan ......... 1,250 1,100 1,010 1,512 1,283 1,374 Turkey ................ 470 520 560 1,300 1,350 1,110 European Union 295 312 347 487 550 627 Mexico ................ 210 243 225 530 593 533 Benin .................. 530 650 675 376 463 479 Turkmenistan ..... 545 545 545 525 356 391 Mali ..................... 705 725 735 396 359 382 Argentina ............ 320 380 360 277 414 370 Cameroon .......... 225 250 260 250 300 322 Sudan ................. 180 180 200 243 255 308 Burma ................. 249 240 240 310 295 289 Burkina ............... 850 630 575 331 235 276 Cote d’Ivoire ....... 327 392 425 215 250 267 Tajikistan ............ 185 180 180 180 162 223 Tanzania ............ 350 420 450 101 163 219 Australia ............. 530 380 60 1,442 661 202 Azerbaijan .......... 130 130 140 133 152 176 Uganda ............... 109 81 89 150 141 149 Kazakhstan ........ 125 128 125 117 135 145 Chad ................... 120 60 250 40 16 130 Togo ................... 160 180 185 100 116 121 Egypt .................. 91 141 100 91 152 106 Nigeria ................ 270 270 270 102 102 102
FAS, Office of Global Analysis, (202) 720–6301. Prepared or estimated on the basis of official USDA production, supply, and distribution statistics from foreign governments.
Table 3-8.—International oil, cottonseed: Production in specified countries, 2017/2018–2019/2020 1
Country 2017/2018 2018/2019 2019/2020
1,000 metric tons
India ............................. 1,325 1,225 1,400 China ............................ 1,382 1,374 1,356 Brazil ............................ 440 632 640 Pakistan ....................... 488 465 450 United States ............... 255 207 234 Uzbekistan ................... 230 197 212 Turkey .......................... 232 240 198 Benin ............................ 48 56 58 Turkmenistan ............... 77 54 57 Mali .............................. 56 58 54 European Union ........... 44 45 53 Australia ....................... 133 104 50 Burma .......................... 50 48 47 Burkina ......................... 36 30 32 Cameroon .................... 28 30 32 Tanzania ...................... 13 21 26 Tajikistan ...................... 21 22 25 Kazakhstan .................. 18 22 23 Sudan ........................... 18 21 23 Uganda ........................ 22 22 23 Chad ............................ 6 2 20 Korea, South ................ 20 20 20 Egypt ............................ 14 23 16 Nigeria .......................... 16 16 16 Argentina ...................... 20 15 15
1 Year beginning July 1. FAS, Office of Global Analysis, (202) 720–6301. Prepared or estimated on the basis of official USDA production, supply,
and distribution statistics from foreign governments.

III–5 AGRICULTURAL STATISTICS 2020
Table 3-9.—Flaxseed: Area, yield, production, disposition, and value, United States, 2010–2019
Year Area planted
Area harvested
Yield per harvested acre Production
Marketing year average price
per bushel received by
farmers
Value of production
1,000 acres 1,000 acres Bushels 1,000 bushels Dollars 1,000 dollars
2010 ..................... 421 418 21.7 9,056 12.20 110,251 2011 ..................... 178 173 16.1 2,791 13.90 38,570 2012 ..................... 349 336 17.3 5,798 13.80 79,919 2013 ..................... 181 172 19.5 3,356 13.80 46,325 2014 ..................... 311 302 21.1 6,368 11.80 75,077 2015 ..................... 463 456 22.1 10,095 8.95 90,561 2016 ..................... 374 366 23.7 8,656 8.00 69,352 2017 ..................... 303 272 14.1 3,842 9.53 36,340 2018 ..................... 208 198 22.6 4,466 9.89 43,533 2019 ..................... 374 319 20.0 6,395 8.85 56,062
NASS, Crops Branch, (202) 720–2127.
Table 3-10.—Flaxseed: Area, yield, and production, by State and United States, 2017–2019
State Area planted Area harvested
2017 2018 2019 2018 2017 2019
1,000 acres 1,000 acres 1,000 acres 1,000 acres 1,000 acres 1,000 acres
Montana ............. 52 39 99 38 37 89 North Dakota ...... 245 165 275 229 158 230 South Dakota 1 ... 6 4 (NA) 5 3 (NA)
United States ...... 303 208 374 272 198 319
State Yield per harvested acre Production
2017 2018 2019 2017 2018 2019
Bushels Bushels Bushels 1,000 bushels 1,000 bushels 1,000 bushels
Montana ............. 9.0 17.0 15.0 342 629 1,335 North Dakota ...... 15.0 24.0 22.0 3,435 3,792 5,060 South Dakota 1 ... 13.0 15.0 (NA) 65 45 (NA)
United States ...... 14.1 22.6 20.0 3,842 4,466 6,395
(NA) Not available. 1 Estimates discontinued in 2019. NASS, Crops Branch, (202) 720–2127.
Table 3-11.—Flaxseed: Marketing year average price and value of production, by State and United States, 2017–2019
State Marketing year average price per bushel Value of production
2017 2018 2019 2017 2018 2019
Dollars Dollars Dollars 1,000 dollars 1,000 dollars 1,000 dollars
Montana ................. 8.73 8.89 8.45 2,986 5,592 11,281 North Dakota ......... 9.53 9.89 8.85 32,736 37,503 44,781 South Dakota 1 ....... 9.50 9.73 (NA) 618 438 (NA)
United States ......... 9.53 9.89 8.85 36,340 43,533 56,062
(NA) Not available. 1 Estimates discontinued in 2019. NASS, Crops Branch, (202) 720–2127.

III–6 OILSEEDS, FATS, AND OILS
Table 3-12.—Flaxseed: Support operations, United States, 2012–2018
Marketin year beginning
June 1
Income sup-port payment
rates per bushels 1
Program price levels per bushel
Put under loan Acquired by CCC under
loan program 4
Owned by CCC at end of marketing
year Loan 2 Target/ Reference 3
Quantity Percentage of production
Dollars Dollars Dollars 1,000 Percent 1,000 1,000 bushels bushels bushels
2012/2013 ...... 0.45/0.00 5.65 7.10 26.8 0.5 0 0 2013/2014 ...... 0.45/0.00 5.65 7.10 10.7 0.3 0 0 2014/2015 ...... 0.00 5.65 11.28 37.5 0.6 0 0 2015/2016 ...... 2.33 5.65 11.28 269.6 2.7 0 0 2016/2017 ...... 3.28 5.65 11.28 236.1 2.7 0 0 2017/2018 ...... 1.75 5.65 11.28 76.8 1.9 0 0 2018/2019 ...... 1.47 5.65 11.28 81.4 1.8 0 0
1 The first entry is the direct payment rate and the second entry is the counter-cyclical payment rate for 2004/2005-2013/ 2014. For 2009/2010-2013/2014, producers who participated in the Average Crop Revenue (ACRE) program got a 20 per-cent reduction in their direct payment, not calculated in this table. For 2014/2015 and after, the entry is the price loss cov-erage payment rate. For 2017/2018, projected PLC payment rate is based on March 2018 WASDE MY price. Agricultural Risk Coverage (ARC) is also available, but payment rates are established at the county or farm levels. 2 For 2009/2010- 2013/2014, producers who participated in the ACRE program get a 30 percent reduction in their loan rate, not calculated in this table. 3 Target applies to 2003/2004-2013/2014 and Reference applies beginning with 2014/2015. 4 Acquisitions as of September 30, 2019.
FPAC-BC, Commodity Analysis Branch.
Table 3-13.—Flaxseed: Supply and disappearance, United States, 2009–2018
Year beginning
June
Supply Disappearance
Stocks June 1 Production Imports Total Total used
for seed Exports Crushings 1 Total
domestic disappearance 2
1,000 1,000 1,000 1,000 1,000 1,000 1,000 1,000 bushels bushels bushels bushels bushels bushels bushels bushels
2009 ......... 2,552 7,423 6,283 16,258 341 1,752 12,000 14,701 2010 ......... 1,557 9,056 6,040 16,653 144 2,130 11,635 14,483 2011 ......... 2,170 2,791 8,286 13,247 279 654 10,500 12,127 2012 ......... 1,120 5,798 6,928 13,846 147 1,020 11,000 12,922 2013 ......... 924 3,356 6,759 11,039 252 599 8,700 10,276 2014 ......... 763 6,368 7,464 14,595 375 528 11,850 13,787 2015 ......... 808 10,095 4,481 15,339 303 870 10,700 12,425 2016 ......... 2,914 8,656 3,091 14,661 245 1,332 10,500 12,491 2017 ......... 2,170 3,842 5,125 11,137 168 480 9,000 10,337 2018 3 ....... 1,629 4,466 5,524 11,619 162 335 9,300 10,819
1 From domestic and imported seed. 2 Total supply minus exports and stocks June 1 of following year. 3 Forecast. ERS, Field Crops Branch, (202) 694–5300.

III–7 AGRICULTURAL STATISTICS 2020
Table 3-14.—Flaxseed and linseed oil and meal: Average price Minneapolis, 2009–2018
Year Average price received by farmers per bushel
Minneapolis
Oil, per pound 1 Linseed meal, per ton 2
Dollars Cents Dollars
2009 ............... 8.15 86.52 217.24 2010 ............... 12.20 67.49 223.23 2011 ............... 13.90 (NA) 238.35 2012 ............... 13.80 (NA) 320.13 2013 ............... 13.80 (NA) 359.42 2014 ............... 11.80 (NA) 263.90 2015 ............... 8.95 (NA) 234.78 2016 ............... 8.00 (NA) 313.17 2017 ............... 9.53 (NA) 236.92 2018 3 ............. 9.25-10.25 (NA) 195-235
(NA) Not available. 1 Raw oil in tank cars. 2 Bulk carlots, 34 percent protein. 3 Forecast. ERS, Field Crops Branch, (202) 694–5300.
Table 3-15.—Flaxseed crushed; production, imports, and exports of linseed oil, cake, and meal; and June 1 stocks of oil, United States, 2009–2018
Year beginning June
Total flaxseed crushed
Linseed oil Linseed cake and meal
Stocks June 1 Production Exports Production Imports for
consumption Exports
1,000 Million Million Million 1,000 1,000 1,000 bushels pounds pounds pounds tons tons tons
2009 ................... 12,000 73 234 103 216 3 10 2010 ................... 11,635 37 227 101 209 7 7 2011 ................... 10,500 38 205 89 189 8 3 2012 ................... 11,000 35 215 94 198 6 5 2013 ................... 8,700 35 170 58 157 1 6 2014 ................... 11,850 35 231 52 213 3 4 2015 ................... 10,700 35 209 17 193 7 4 2016 ................... 10,500 35 205 15 189 6 5 2017 ................... 9,000 35 176 14 162 7 3 2018 1 ................ 9,300 35 181 23 167 10 4
1 Forecast. ERS, Field Crops Branch, (202) 694–5300.

III–8 OILSEEDS, FATS, AND OILS
Table 3-16.—Peanuts: Area, yield, production, disposition, marketing year average price per pound received by farmers, and value, United States, 2010–2019
Year Area planted
Peanuts for nuts
Area harvested Yield per acre Production 1 Marketing year
average price 2 Value of
production
1,000 acres 1,000 acres Pounds 1,000 pounds Cents 1,000 dollars
2010 ..................... 1,288.0 1,255.0 3,312 4,156,840 21.0 938,611 2011 ..................... 1,140.6 1,080.6 3,386 3,658,590 25.0 1,168,587 2012 ..................... 1,638.0 1,604.0 4,211 6,753,880 34.0 2,026,326 2013 ..................... 1,067.0 1,043.0 4,001 4,173,170 27.0 1,055,095 2014 ..................... 1,353.5 1,322.5 3,923 5,188,665 23.0 1,158,251 2015 ..................... 1,625.0 1,560.9 3,845 6,001,357 21.3 1,160,560 2016 ..................... 1,671.0 1,536.0 3,634 5,581,570 19.7 1,088,165 2017 ..................... 1,871.6 1,775.6 4,007 7,115,410 22.9 1,634,017 2018 ..................... 1,425.5 1,373.5 4,001 5,495,935 21.5 1,169,953 2019 ..................... 1,427.7 1,391.7 3,949 5,496,087 20.1 1,129,584
1 Estimates comprised of quota and non-quota peanuts. 2 Based on marketings and monthly prices received from August 1, 2019 - December 31, 2019.
NASS, Crops Branch, (202) 720–2127.
Table 3-17.—Peanuts, farmer stock: Stocks, production, and quantity milled, United States, 2010–2019
Year beginning
August Stocks Aug. 1 1 Production
harvested for nuts 1 Imports Total supply Milled 1 2
1,000 pounds
2010 ............... 991,394 4,156,840 163 5,148,397 3,976,460 2011 ............... 769,016 3,658,590 1,299 4,428,905 3,949,494 2012 ............... 272,838 6,753,880 3,117 7,029,835 4,979,182 2013 ............... 1,924,996 4,173,170 174 6,098,340 4,955,484 2014 ............... 1,059,524 5,188,665 11 6,248,200 4,775,454 2015 ............... 1,445,310 6,001,357 287 7,446,954 4,998,028 2016 ............... 1,051,096 5,581,570 574 6,633,240 4,699,164 2017 ............... 732,966 7,115,410 0 7,848,376 4,448,304 2018 ............... 1,916,798 5,495,935 4,232 7,416,965 4,498,876 2019 ............... 1,627,938 5,466,487 3 7,094,428 4,472,126
1 Net weight basis. 2 Includes peanuts milled for seed. NASS, Crops Branch, (202) 720–2127, ERS, and Foreign trade from the Bureau of the Census.
Table 3-18.—Peanuts: Crushings, and oil and meal stocks, production, and foreign trade, United States, 2010–2019
Year beginning
August
Peanuts crushed (shelled basis)
Peanut oil Peanut cake and meal
Stocks Aug. 1 1
Production of crude Imports Exports 2 Stocks
Aug. 1 3 Production
1,000 pounds
2010 ............... 441,017 6,888 190,110 60,012 15,933 7,045 250,043 2011 ............... 453,835 6,836 188,479 28,290 15,646 9,959 250,037 2012 ............... 493,835 2,478 210,702 10,359 12,598 10,446 270,328 2013 ............... 497,272 (NA) 209,808 55,265 8,940 (NA) 268,554 2014 ............... 506,677 (NA) 214,041 30,174 18,840 (NA) 278,380 2015 ............... 531,770 2,667 226,219 93,314 10,253 3,197 291,193 2016 ............... 659,966 4,868 283,689 40,445 11,908 5,460 357,751 2017 ............... 528,750 10,646 231,748 71,354 10,943 8,750 282,346 2018 ............... 486,398 9,250 219,334 58,844 9,399 4,552 255,683 2019 ............... 580,628 10,181 254,109 3,338 26,843 4,721 304,718
(NA) Not available. 1 Crude plus refined. 2 Reported as edible peanut oil and crude peanut oil; in this tabulation added without converting. 3 Holding at producing mills only.
NASS, Crops Branch, (202) 720–2127, ERS, and Foreign trade from the Bureau of the Census.

III–9 AGRICULTURAL STATISTICS 2020
Table 3-19.—Cleaned peanuts (roasting stock): Supply and disposition, United States, 2010–2019
Year beginning
August
Supply Disposition
Stocks Aug. 1 Production Imports Total Exports
Domestic disappearance
Total Per capita
1,000 1,000 1,000 1,000 1,000 1,000 pounds pounds pounds pounds pounds pounds Pounds
2010 ............... 52,929 268,956 163 322,048 78,693 184,385 0.60 2011 ............... 58,970 226,481 1,299 286,750 66,819 179,965 0.58 2012 ............... 39,966 323,731 3,117 366,814 194,821 100,098 0.32 2013 ............... 71,895 323,607 174 395,676 143,921 178,602 0.56 2014 ............... 73,153 248,170 11 321,334 168,504 112,495 0.35 2015 ............... 40,335 251,484 287 292,106 418,066 (157,559) (0.49) 2016 ............... 31,599 230,537 574 262,710 183,379 46,853 0.14 2017 ............... 32,478 225,475 0 257,953 159,366 43,054 0.13 2018 ............... 55,533 188,223 4,232 247,988 140,540 64,814 0.20 2019 ............... 42,633 194,835 3 237,471 550,735 (350,601) (1.06)
NASS, Crops Branch, (202) 720–2127, ERS, and Foreign trade from the Bureau of the Census.
Table 3-20.—Shelled peanuts (all grades): Supply, exports, and quantity crushed, United States, 2010–2019
Year beginning
August
Supply
Exports Crushed Stocks Aug. 1 Production Imports Total
Edible Oil stock Edible Oil stock
1,000 1,000 1,000 1,000 1,000 1,000 1,000 1,000 pounds pounds pounds pounds pounds pounds pounds pounds
2010 ............... 554,295 35,498 2,450,639 357,130 46,031 3,443,593 395,554 441,017 2011 ............... 473,878 43,380 2,399,094 345,565 203,836 3,465,753 352,994 453,835 2012 ............... 466,310 52,883 3,125,786 351,284 90,472 4,086,735 741,109 493,205 2013 ............... 547,965 33,883 3,098,392 373,008 65,709 4,118,957 708,391 497,272 2014 ............... 519,824 25,364 2,997,078 391,728 69,278 4,003,272 675,930 506,677 2015 ............... 431,674 31,012 3,141,099 442,650 66,951 4,113,386 839,203 531,770 2016 ............... 467,139 65,350 2,944,760 448,377 114,730 4,040,356 852,040 659,966 2017 ............... 482,010 26,372 2,853,147 358,282 127,903 3,847,714 810,578 528,750 2018 ............... 535,730 24,232 2,932,229 368,168 84,172 3,944,531 785,928 486,398 2019 ............... 540,802 23,498 2,908,778 405,622 79,280 3,957,980 786,790 580,628
NASS, Crops Branch, (202) 720–2127, ERS, and Foreign trade from the U.S. Bureau of the Census.

III–10 OILSEEDS, FATS, AND OILS
Table 3-21.—Peanuts: Shelled (raw basis) by types, used in primary products and apparent disappearance of peanuts, United States, 2010–2019
Type and year beginning August
Edible grades used in products Apparent disappear-
ance 2 Peanut butter 1
Peanut snack
Peanut candy
Other products Total
1,000 1,000 1,000 1,000 1,000 1,000 pounds pounds pounds pounds pounds pounds
Virginia and Valencia: 2010 .......................... (D) 62,708 16,070 (D) 211,194 .......................2011 .......................... (D) 78,333 17,856 (D) 203,958 .......................2012 .......................... 82,981 83,722 17,731 8,452 192,888 .......................2013 .......................... 86,759 85,298 17,109 13,373 202,536 .......................2014 .......................... 102,340 91,909 12,079 26,440 232,768 .......................2015 .......................... 108,156 89,766 14,319 26,258 238,494 .......................2016 .......................... 118,109 92,331 13,427 23,606 247,473 .......................2017 .......................... 129,823 84,479 15,455 28,998 258,754 .......................2018 .......................... 120,939 81,418 15,589 18,753 236,696 .......................2019 .......................... 140,527 94,614 9,145 19,836 264,121 .......................
Runner: 2010 .......................... 1,076,521 319,529 365,260 13,036 1,774,346 .......................2011 .......................... 1,091,541 303,631 360,797 14,840 1,770,809 .......................2012 .......................... 1,143,108 309,860 347,428 12,195 1,812,591 .......................2013 .......................... 1,128,206 337,934 (D) (D) 1,844,490 .......................2014 .......................... 1,196,277 329,930 348,367 26,737 1,901,311 .......................2015 .......................... 1,186,810 408,726 346,831 35,128 1,977,495 .......................2016 .......................... 1,215,212 370,766 379,549 33,156 1,998,683 .......................2017 .......................... 1,179,186 434,139 346,985 66,943 2,027,254 .......................2018 .......................... 1,213,018 380,165 349,081 93,897 2,036,161 .......................2019 .......................... 1,259,768 (D) 372,153 (D) 2,084,164 .......................
Spanish: 2010 .......................... (D) 12,940 14,122 (D) 35,207 .......................2011 .......................... (D) 8,104 16,025 (D) 27,390 .......................2012 .......................... (D) 6,847 16,755 (D) 25,389 .......................2013 .......................... (D) 6,564 15,996 (D) (D) .......................2014 .......................... (D) 6,638 15,410 (D) 27,188 .......................2015 .......................... (D) 7,200 16,355 (D) 28,225 .......................2016 .......................... (D) 7,195 14,725 (D) 26,801 .......................2017 .......................... (D) 6,227 17,064 (D) 28,851 .......................2018 .......................... 8,480 (D) 16,266 (D) 30,840 .......................2019 .......................... 9,969 (D) 14,349 (D) 30,622 .......................
All types: 2010 .......................... 1,213,229 395,177 395,452 16,890 2,020,748 2,880,304 2011 .......................... 1,197,748 390,068 394,678 19,661 2,002,155 2,742,724 2012 .......................... 1,227,859 400,429 381,914 20,664 2,030,866 3,417,047 2013 .......................... 1,218,170 429,796 395,726 29,103 2,072,795 3,508,060 2014 .......................... 1,303,755 428,477 375,856 53,179 2,161,267 3,471,308 2015 .......................... 1,299,634 505,692 377,505 61,388 2,244,219 3,513,946 2016 .......................... 1,338,195 470,292 407,701 56,769 2,272,957 3,417,244 2017 .......................... 1,314,567 524,845 379,504 95,943 2,843,609 3,159,849 2018 .......................... 1,342,437 467,676 380,936 112,651 2,790,098 3,296,059 2019 .......................... 1,410,264 481,430 395,647 91,567 2,959,536 3,339,239
(D) Data withheld to avoid disclosure of individual operations. 1 Excludes peanut butter made by manufacturers for own use in candy. Includes peanut butter used in spreads, sandwiches, and cookies. 2 Apparent disappearance represents stocks beginning of year plus production, minus stocks at end of year. Includes edible grades and oilstocks.
NASS, Crops Branch, (202) 720–2127, and ERS.

III–11 AGRICULTURAL STATISTICS 2020
Table 3-22.—Peanuts: Area, yield, and production, by State and United States, 2017–2019
State
Area planted Peanuts for nuts
2017 2018 2019 Area harvested
2017 2018 2019
1,000 acres
Alabama ............. 195.0 165.0 160.0 193.0 161.0 158.0 Arkansas ............ 30.0 26.0 34.0 29.0 23.0 33.0 Florida ................ 195.0 155.0 165.0 185.0 143.0 155.0 Georgia ............... 835.0 665.0 670.0 825.0 655.0 660.0 Mississippi .......... 44.0 25.0 20.0 43.0 24.0 19.0 New Mexico ........ 7.6 5.5 4.7 7.6 5.5 4.7 North Carolina .... 119.0 102.0 104.0 117.0 98.0 102.0 Oklahoma ........... 22.0 16.0 15.0 21.0 15.0 14.0 South Carolina ... 122.0 87.0 65.0 118.0 80.0 62.0 Texas .................. 275.0 155.0 165.0 210.0 145.0 160.0 Virginia ............... 27.0 24.0 25.0 27.0 24.0 24.0
United States ...... 1,871.6 1,425.5 1,427.7 1,775.6 1,373.5 1,391.7
State
Peanuts for nuts
Yield per harvested acre Production
2017 2018 2019 2017 2018 2019
Pounds 1,000 pounds
Alabama ............. 3,650 3,550 3,350 704,450 571,550 529,300 Arkansas ............ 5,300 4,900 5,200 153,700 112,700 171,600 Florida ................ 3,450 3,950 3,800 638,250 564,850 589,000 Georgia ............... 4,330 4,390 4,200 3,572,250 2,875,450 2,772,000 Mississippi .......... 4,000 3,900 4,000 172,000 93,600 76,000 New Mexico ........ 3,500 2,850 3,210 26,600 15,675 15,087 North Carolina .... 4,100 3,870 4,350 479,700 379,260 443,700 Oklahoma ........... 3,780 3,070 4,100 79,380 46,050 57,400 South Carolina ... 4,000 3,400 3,800 472,000 272,000 235,600 Texas .................. 3,320 3,200 3,100 697,200 464,000 496,000 Virginia ............... 4,550 4,200 4,600 122,850 100,800 110,400
United States ...... 4,007 4,001 3,949 7,115,410 5,495,935 5,496,087
NASS, Crops Branch, (202) 720–2127.
Table 3-23.—Peanuts: Marketing year average price, and value of production, by State and United States, 2017–2019
State Marketing year average price per pound Value of production
2017 2018 2019 1 2017 2018 2019
Dollars 1,000 dollars
Alabama ................. 0.221 0.208 0.185 155,683 114,566 97,921 Arkansas ................ 0.212 0.190 0.198 32,277 21,850 33,977 Florida .................... 0.229 0.207 0.202 146,159 104,328 118,978 Georgia .................. 0.221 0.205 0.192 789,467 592,963 532,224 Mississippi ............. 0.206 0.202 0.186 35,432 19,392 14,136 New Mexico ........... 0.289 0.292 0.282 7,687 4,818 4,255 North Carolina ....... 0.237 0.230 0.223 113,689 87,906 98,945 Oklahoma .............. 0.250 0.234 0.235 19,845 10,881 13,489 South Carolina ....... 0.224 0.217 0.198 105,728 59,384 46,649 Texas ..................... 0.286 0.275 0.292 199,399 131,588 144,832 Virginia ................... 0.239 0.221 0.219 28,651 22,277 24,178
United States ......... 0.229 0.215 0.201 1,634,017 1,169,953 1,129,584
1 Based on monthly prices received from August 1, 2019 - December 31, 2019. NASS, Crops Branch, (202) 720–2127.

III–12 OILSEEDS, FATS, AND OILS
Table 3-24.—Peanuts, farmer’s stock: Support operations, United States, 2012–2018
Marketing year beginning August 1
Income support payment rates per short ton 1
Program price levels per short ton
Put under support Acquired by CCC under
loan program
Owned by CCC at end of marketing
year Loan 2 Target/ Reference 3
Quantity Percentage
of production
Dollars Dollars Dollars 1,000 short tons
Percent 1,000 short tons
1,000 short tons
2012/2013 ........ 36.00/0.00 355.00 495.00 2,640 78.2 55.9 0.0 2013/2014 ........ 36.00/0.00 355.00 495.00 1,452 69.6 6.1 2.5 2014/2015 ........ 95.00 355.00 535.00 2,123 81.8 173.2 6.8 2015/2016 ........ 149.00 355.00 535.00 2,233 74.4 0.0 0.0 2016/2017 ........ 141.00 355.00 535.00 2,270 79.9 39.1 0.0 2017/2018 ........ 77.00 355.00 535.00 2,735 75.6 121.7 0.0 2018/2019 ........ 105.00 355.00 535.00 2,340 85.7 90.8 0.0
1 The first entry is the direct payment rate and the second entry is the counter-cyclical payment rate for 2004/2005-2013/ 2014. The 2014 Act eliminated direct payments and replaced the counter-cyclical rate with a new reference price. For 2009/ 2010-2013/2014, producers who participated in the Average Crop Revenue (ACRE) program got a 20 percent reduction in their direct payment, not calculated in this table. For 2014/2015 and after, the entry is the price loss coverage payment rate. For 2017/2018, projected PLC payment rate is based on March 2018 WASDE MY price. Agricultural Risk Coverage (ARC) is also available, but payment rates are established at the county or farm levels. 2 For 2009/2010-2013/2014, producers who participate in the ACRE program get a 30 percent reduction in their loan rate, not calculated in this table. 3 Target ap-plies to 2003/2004-2013/2014 and Reference applies beginning with 2014/2015. 4 Acquisitions as of September 30, 2019.
FPAC-BC, Commodity Analysis Branch.
Table 3-25.—International oilseed, peanut: Area and production in specified countries, 2017/2018–2019/2020
Country Area Production
2017/2018 2018/2019 2019/2020 2017/2018 2018/2019 2019/2020
1,000 hectares 1,000 metric tons
China ..................... 4,608 4,620 4,600 17,092 17,333 17,500 India ....................... 4,888 4,990 4,700 6,650 4,720 6,200 Nigeria ................... 2,820 2,820 2,800 4,248 4,422 3,500 United States ......... 719 556 563 3,228 2,493 2,493 Sudan .................... 2,215 3,065 2,300 1,648 2,884 1,800 Burma .................... 989 1,034 885 1,572 1,583 1,375 Argentina ............... 382 326 320 867 1,419 1,255 Senegal .................. 1,254 1,250 1,200 1,412 1,450 1,100 Tanzania ................ 1,000 1,000 1,000 1,100 1,100 1,100 Indonesia ............... 580 570 550 1,075 1,025 990 Chad ...................... 768 770 770 870 890 850 Guinea ................... 670 680 680 696 770 750 Cameroon .............. 430 430 430 600 600 600 Brazil ...................... 139 147 155 516 435 550 Niger ...................... 922 925 900 462 592 500 Vietnam .................. 190 190 190 450 458 469
FAS, Office of Global Analysis, (202) 720–6301. Prepared or estimated on the basis of official USDA production, supply, and distribution statistics from foreign governments.
Table 3-26.—International meal, peanut: Production in specified countries, 2017/2018–2019/2020
Country 2017/2018 2018/2019 2019/2020
1,000 metric tons
China ............................ 3,580 3,660 3,680 India ............................. 1,555 1,385 1,510 Burma .......................... 325 325 325 Sudan ........................... 259 268 272 Nigeria .......................... 245 245 245 Tanzania ...................... 170 170 170 United States ............... 128 116 132 Argentina ...................... 117 117 130 Senegal ........................ 76 90 108 Burkina ......................... 90 90 96 Chad ............................ 84 84 84 Brazil ............................ 73 62 70 Cameroon .................... 57 57 57 Niger ............................ 54 54 54 Congo (Kinshasa) ........ 50 50 50
FAS, Office of Global Analysis, (202) 720–6301. Prepared or estimated on the basis of official USDA production, supply, and distribution statistics from foreign governments.

III–13 AGRICULTURAL STATISTICS 2020
Table 3-27.—Soybeans: Area, yield, production, and value, United States, 2010–2019
Year Area planted
Soybeans for beans
Area harvested
Yield per acre Production
Marketing year average price per bushel received by
farmers 1
Value of production 1
1,000 acres 1,000 acres Bushels 1,000 bushels Dollars 1,000 dollars
2010 ......... 77,404 76,610 43.5 3,331,306 11.30 37,571,277 2011 ......... 75,046 73,776 42.0 3,097,179 12.50 38,542,177 2012 ......... 77,198 76,144 40.0 3,042,044 14.40 43,723,144 2013 ......... 76,820 76,233 44.0 3,357,004 13.00 43,570,161 2014 ......... 83,296 82,611 47.5 3,928,070 10.10 39,484,465 2015 ......... 82,660 81,742 48.0 3,926,779 8.95 35,195,882 2016 ......... 83,453 82,706 51.9 4,296,496 9.47 40,694,573 2017 ......... 90,162 89,542 49.3 4,411,633 9.33 41,308,740 2018 ......... 89,167 87,594 50.6 4,428,150 8.48 36,819,008 2019 ......... 76,100 75,021 47.4 3,558,281 8.75 31,202,680
1 Based on marketings and monthly prices received from August 1, 2019 - December 31, 2019. NASS, Crops Branch, (202) 720–2127.
Table 3-28.—Soybeans: Stocks on and off farms, United States, 2009–2018
Year be-ginning previous
December
On farms Off farms 1
Dec. 1 Mar. 1 June 1 Sep. 1 2 Dec. 1 Mar. 1 June 1 Sep. 1 2
1,000 1,000 1,000 1,000 1,000 1,000 1,000 1,000 bushels bushels bushels bushels bushels bushels bushels bushels
2009 ......... 1,229,500 656,500 226,300 35,100 1,109,050 645,289 369,859 103,098 2010 ......... 1,091,000 609,200 232,600 35,400 1,187,084 660,868 338,523 115,485 2011 ......... 1,139,000 505,000 217,700 48,500 1,230,885 743,800 401,583 166,513 2012 ......... 910,000 555,000 179,000 38,250 1,056,161 819,488 488,465 131,120 2013 ......... 955,000 456,700 171,100 39,550 1,198,621 541,320 263,564 101,007 2014 ......... 1,218,000 381,900 109,100 21,325 1,309,744 611,928 295,945 70,666 2015 ......... 1,308,500 609,200 246,300 49,700 1,405,577 717,399 380,768 140,910 2016 ......... 1,335,000 727,500 281,300 41,560 1,564,056 803,406 590,481 155,169 2017 ......... 1,485,000 668,500 332,500 87,900 1,675,679 1,070,433 633,356 213,695 2018 ......... 1,935,000 855,000 377,000 101,000 1,810,824 1,254,303 842,329 337,105
1 Includes stocks at mills, elevators, warehouses, terminals, and processors. 2 Old crop only. NASS, Crops Branch, (202) 720–2127.
Table 3-29.—Soybeans, soybean meal, and oil: Average price at specified markets, 2009–2018
Year 1 Soybeans per bushel: No. 1 Yellow Chicago
Soybean oil per pound crude, tanks, f.o.b. Decatur
Soybean meal per short ton: 48 percent protein Decatur
Dollars Cents Dollars
2009 ........... 9.91 35.95 311.27 2010 ........... 13.14 53.20 345.52 2011 ........... 13.49 51.90 393.53 2012 ........... 14.86 47.13 468.11 2013 ........... 13.51 38.23 489.94 2014 ........... 9.84 31.60 368.49 2015 ........... 9.54 29.86 324.56 2016 ........... 9.77 32.55 316.88 2017 ........... 9.53 30.04 345.02 2018 2 ......... 8.89 28.5-31.5 295-335
1 Year beginning September for soybeans and October for oil and meal. 2 Forecast. ERS, Field Crops Branch, (202) 694–5300.

III–14 OILSEEDS, FATS, AND OILS
Table 3-30.—Soybeans: Supply and disappearance, United States, 2008–2017
Year beginning September
Supply
Stocks by position
Production Total 1 On-Farm, Sep 1
Terminal market, interior mill,
elevator, and warehouse
Beginning, Sep- Nov
1,000 bushels 1,000 bushels 1,000 bushels 1,000 bushels 1,000 bushels
2008 ..................... 47,000 158,034 205,034 2,967,007 3,185,304 2009 ..................... 35,100 103,098 138,198 3,360,931 3,513,717 2010 ..................... 35,400 115,485 150,885 3,331,306 3,496,640 2011 ..................... 48,500 166,513 215,013 3,097,179 3,328,324 2012 ..................... 38,250 131,120 169,370 3,042,044 3,251,930 2013 ..................... 39,550 101,007 140,557 3,357,004 3,569,338 2014 ..................... 21,325 70,666 91,991 3,928,070 4,053,306 2015 ..................... 49,700 140,910 190,610 3,926,779 4,140,930 2016 ..................... 41,560 155,169 196,729 4,296,496 4,515,506 2017 ..................... 87,900 213,695 301,595 4,411,633 4,735,050
Year beginning September
Disappearance
Crushed 2 Seed, feed and residual Exports Total
1,000 bushels 1,000 bushels 1,000 bushels 1,000 bushels
2008 ........................... 1,661,922 105,890 1,279,294 3,047,106 2009 ........................... 1,751,686 112,098 1,499,048 3,362,832 2010 ........................... 1,648,043 128,607 1,504,978 3,281,627 2011 ........................... 1,703,019 90,684 1,365,251 3,158,954 2012 ........................... 1,688,903 94,944 1,327,526 3,111,373 2013 ........................... 1,733,888 104,900 1,638,559 3,477,347 2014 ........................... 1,873,494 146,779 1,842,423 3,862,696 2015 ........................... 1,886,237 115,325 1,942,639 3,944,201 2016 ........................... 1,901,198 146,296 2,166,417 4,213,911 2017 ........................... 2,054,932 551,017 2,129,101 4,735,050
1 Includes imports. 2 Reported by the U.S. Department of Commerce. ERS, Field Crops Branch, (202) 694–5300.
Table 3-31.—Soybeans: Support operations, United States, 2013–2019
Marketing year beginning
September 1
Income support payment rates per bushels 1
Program price levels per bushel
Put under loan Acquired by CCC under
loan program 4
Owned by CCC at end of marketing
year Loan 2 Target/ Reference 3
Quantity Percentage of production
Dollars Dollars Dollars Million Percent Million Million bushels bushels bushels
2013/2014 ...... 0.44/0.00 5.00 6.00 49 1.5 0 0 2014/2015 ...... 0.00 5.00 8.40 80 2.0 0 0 2015/2016 ...... 0.00 5.00 8.40 124 3.2 0 0 2016/2017 ...... 0.00 5.00 8.40 105 2.4 0 0 2017/2018 ...... 0.00 5.00 8.40 145 3.3 0 0 2018/2019 ...... 0.00 5.00 8.40 218 4.8 0 0 2019/2020 ...... 0.00 6.20 8.40 142 4.0 0 0
1 The first entry is the direct payment rate and the second entry is the counter-cyclical payment rate for 2004/2005-2013/ 2014. For 2009/2010-2013/2014, producers who participated in the Average Crop Revenue (ACRE) program got a 20 per-cent reduction in their direct payment, not calculated in this table. For 2014/2015 and after, the entry is the price loss cov-erage (PLC) payment rate. For 2017/2018, projected PLC payment rate is based on March 2018 WASDE MY price. Agricul-tural Risk Coverage (ARC) is also available, but payment rates are established at the county or farm levels. 2 For 2009/ 2010-2013/2014, producers who participated in the ACRE program got a 30 percent reduction in their loan rate, not cal-culated in this table. 3 Target applies to 2003/2004-2013/2014 and Reference applies beginning with 2014/ 2015. 4 Acquisitions as of September 30, 2019.
FPAC-BC, Commodity Analysis Branch.

III–15 AGRICULTURAL STATISTICS 2020
Table 3-32.—Soybeans for beans: Area, yield, and production, by State and United States, 2017–2019
State Area planted Area harvested
2017 2018 2019 2017 2018 2019
1,000 1,000 1,000 1,000 1,000 1,000 acres acres acres acres acres acres
Alabama ................. 350 345 265 345 335 260 Arkansas ................ 3,530 3,270 2,650 3,500 3,210 2,610 Delaware ................ 160 170 155 158 168 153 Florida 1 .................. 15 18 (NA) 14 12 (NA) Georgia .................. 155 145 100 150 130 93 Illinois ..................... 10,600 10,800 9,950 10,550 10,500 9,860 Indiana ................... 5,950 6,000 5,400 5,940 5,960 5,360 Iowa ....................... 10,000 9,950 9,200 9,940 9,830 9,120 Kansas ................... 5,150 4,750 4,550 5,110 4,690 4,490 Kentucky ................ 1,950 1,950 1,700 1,940 1,930 1,690 Louisiana ............... 1,270 1,340 890 1,250 1,190 860 Maryland ................ 500 530 480 495 515 475 Michigan ................ 2,280 2,330 1,760 2,270 2,310 1,730 Minnesota .............. 8,150 7,750 6,850 8,090 7,650 6,770 Mississippi ............. 2,190 2,230 1,660 2,170 2,190 1,630 Missouri ................. 5,950 5,850 5,100 5,910 5,780 5,010 Nebraska ............... 5,700 5,650 4,900 5,670 5,590 4,840 New Jersey ............ 100 110 95 99 107 92 New York ............... 270 335 235 265 325 225 North Carolina ....... 1,700 1,650 1,540 1,690 1,570 1,520 North Dakota ......... 7,100 6,900 5,600 7,050 6,840 5,450 Ohio ....................... 5,100 5,050 4,300 5,090 5,020 4,270 Oklahoma .............. 655 640 465 640 600 440 Pennsylvania ......... 610 640 620 605 630 610 South Carolina ....... 400 390 335 390 330 320 South Dakota ......... 5,650 5,650 3,500 5,610 5,580 3,440 Tennessee ............. 1,690 1,700 1,400 1,660 1,670 1,370 Texas ..................... 210 175 80 185 135 73 Virginia ................... 600 600 570 590 590 560 West Virginia 1 ....... 27 29 (NA) 26 27 (NA) Wisconsin .............. 2,150 2,220 1,750 2,140 2,180 1,700
United States ......... 90,162 89,167 76,100 89,542 87,594 75,021
State Yield per harvested acre Production
2017 2018 2019 2017 2018 2019
Bushels Bushels Bushels 1,000 1,000 1,000 bushels bushels bushels
Alabama ................. 46.0 40.0 36.0 15,870 13,400 9,360 Arkansas ................ 51.0 50.5 49.0 178,500 162,105 127,890 Delaware ................ 51.0 41.5 47.0 8,058 6,972 7,191 Florida 1 .................. 34.0 37.0 (NA) 476 444 (NA) Georgia .................. 42.0 39.5 29.0 6,300 5,135 2,697 Illinois ..................... 58.0 63.5 54.0 611,900 666,750 532,440 Indiana ................... 54.0 57.5 51.0 320,760 342,700 273,360 Iowa ....................... 57.0 56.0 55.0 566,580 550,480 501,600 Kansas ................... 37.5 43.0 41.5 191,625 201,670 186,335 Kentucky ................ 53.0 51.0 46.0 102,820 98,430 77,740 Louisiana ............... 54.0 51.5 48.0 67,500 61,285 41,280 Maryland ................ 51.0 47.5 44.0 25,245 24,463 20,900 Michigan ................ 42.5 47.5 41.0 96,475 109,725 70,930 Minnesota .............. 47.5 49.0 44.0 384,275 374,850 297,880 Mississippi ............. 53.0 54.0 50.0 115,010 118,260 81,500 Missouri ................. 49.5 44.5 46.0 292,545 257,210 230,460 Nebraska ............... 57.5 58.0 58.5 326,025 324,220 283,140 New Jersey ............ 45.0 39.5 37.0 4,455 4,227 3,404 New York ............... 45.0 52.0 48.0 11,925 16,900 10,800 North Carolina ....... 40.0 33.0 35.0 67,600 51,810 53,200 North Dakota ......... 34.5 35.0 32.0 243,225 239,400 174,400 Ohio ....................... 49.5 56.0 49.0 251,955 281,120 209,230 Oklahoma .............. 29.0 28.0 29.0 18,560 16,800 12,760 Pennsylvania ......... 48.0 44.5 49.0 29,040 28,035 29,890 South Carolina ....... 38.0 29.0 26.0 14,820 9,570 8,320 South Dakota ......... 43.0 45.0 42.5 241,230 251,100 146,200 Tennessee ............. 50.0 45.5 47.0 83,000 75,985 64,390 Texas ..................... 37.0 31.5 28.0 6,845 4,253 2,044 Virginia ................... 44.0 42.0 34.0 25,960 24,780 19,040 West Virginia 1 ....... 54.0 53.0 (NA) 1,404 1,431 (NA) Wisconsin .............. 47.5 48.0 47.0 101,650 104,640 79,900
United States ......... 49.3 50.6 47.4 4,411,633 4,428,150 3,558,281
(NA) Not available.1 Estimates discontinued in 2019. NASS, Crops Branch, (202) 720–2127.

III–16 OILSEEDS, FATS, AND OILS
Table 3-33.—Soybeans: Crushings, and oil and meal stocks, production, and foreign trade, United States, 2008–2017
Year beginning October
Soybeans crushed
Soybean oil Soybean cake and meal
Stocks Oct. 1 Production Exports Stocks Oct. 1 Production Exports
1,000 bushels Million pounds
Million pounds
Million pounds
1,000 tons 1,000 tons 1,000 tons
2008 ......... 1,661,922 2,485 18,745 2,193 294 39,102 8,497 2009 ......... 1,751,686 2,861 19,615 3,359 235 41,707 11,159 2010 ......... 1,648,043 3,406 18,888 3,233 302 39,251 9,081 2011 ......... 1,703,019 2,675 19,740 1,464 350 41,036 9,750 2012 ......... 1,688,903 2,590 19,820 2,163 300 39,875 11,146 2013 ......... 1,733,888 1,655 20,130 1,877 275 40,685 11,578 2014 ......... 1,873,494 1,165 21,399 2,014 250 45,062 13,107 2015 ......... 1,886,237 1,855 21,950 2,243 260 44,672 11,954 2016 ......... 1,901,198 1,687 22,123 2,556 264 44,787 11,580 2017 1 ...... 2,054,932 1,711 23,772 2,447 401 49,226 12,400
1 Forecast. ERS, Field Crops Branch, (202) 694–5300. Data from the U.S. Department of Commerce.
Table 3-34.—Soybeans for beans: Marketing year average price and value, by State and United States, 2017–2019
State Marketing year average price per bushel Value of production
2017 2018 2019 1 2017 2018 2019 1
Dollars Dollars Dollars 1,000 dollars 1,000 dollars 1,000 dollars
Alabama ..................... 9.43 8.50 9.25 149,654 113,900 86,580 Arkansas .................... 9.77 8.81 9.00 1,743,945 1,428,145 1,151,010 Delaware .................... 9.19 8.25 8.30 74,053 57,519 59,685 Florida 2 ...................... 8.85 8.10 (NA) 4,213 3,596 (NA) Georgia ...................... 9.62 7.90 9.00 60,606 40,567 24,273 Illinois ......................... 9.60 8.74 9.15 5,874,240 5,827,395 4,871,826 Indiana ....................... 9.61 8.73 9.10 3,082,504 2,991,771 2,487,576 Iowa ........................... 9.25 8.46 8.65 5,240,865 4,657,061 4,338,840 Kansas ....................... 9.00 7.93 8.40 1,724,625 1,599,243 1,565,214 Kentucky .................... 9.70 8.79 9.10 997,354 865,200 707,434 Louisiana ................... 9.67 8.95 8.75 652,725 548,501 361,200 Maryland .................... 9.20 8.12 8.30 232,254 198,640 173,470 Michigan .................... 9.39 8.53 8.90 905,900 935,954 631,277 Minnesota .................. 9.17 8.40 8.60 3,523,802 3,148,740 2,561,768 Mississippi ................. 9.74 8.85 8.90 1,120,197 1,046,601 725,350 Missouri ..................... 9.48 8.56 8.90 2,773,327 2,201,718 2,051,094 Nebraska ................... 9.08 8.20 8.40 2,960,307 1,920,604 2,378,376 New Jersey ................ 9.30 7.98 8.60 41,432 33,731 29,274 New York ................... 9.26 8.20 8.30 110,426 137,760 89,640 North Carolina ........... 9.50 8.66 8.80 642,200 448,675 468,160 North Dakota ............. 8.88 7.98 8.10 2,159,838 1,910,412 1,412,640 Ohio ........................... 9.62 8.69 9.15 2,423,807 2,442,933 1,914,455 Oklahoma .................. 9.10 7.89 8.40 168,896 132,552 107,184 Pennsylvania ............. 9.34 8.42 8.45 271,234 236,055 252,571 South Carolina ........... 9.52 9.10 9.15 141,086 87,087 76,128 South Dakota ............. 8.94 7.97 8.40 2,156,596 2,001,267 1,228,080 Tennessee ................. 9.70 8.75 9.05 805,100 664,869 582,730 Texas ......................... 8.90 7.59 7.90 60,921 32,280 16,148 Virginia ....................... 9.40 8.30 8.80 244,024 205,674 167,552 West Virginia 2 ........... 9.40 8.50 (NA) 13,198 12,164 (NA) Wisconsin .................. 9.34 8.49 8.55 949,411 888,394 683,145
United States ............. 9.33 8.48 8.75 41,308,740 36,819,008 31,202,680
(NA) Not available. 1 Preliminary. 2 Estimates discontinued in 2019. NASS, Crops Branch, (202) 720–2127.

III–17 AGRICULTURAL STATISTICS 2020
Table 3-35.—International oilseed, soybean: Area and production in specified countries, 2017/2018–2019/2020
Country Area Production
2017/2018 2018/2019 2019/2020 2017/2018 2018/2019 2019/2020
1,000 hectares 1,000 Metric tons
Brazil ....................... 35,150 35,900 36,900 122,000 117,000 126,000 United States .......... 36,236 35,448 30,360 120,065 120,515 96,841 Argentina ................ 16,300 16,600 17,000 37,800 55,300 54,000 China ...................... 8,245 8,413 9,300 15,283 15,967 18,100 Paraguay ................ 3,380 3,700 3,540 10,478 8,850 9,900 India ........................ 10,400 11,330 11,250 8,350 10,930 9,300 Canada ................... 2,935 2,540 2,300 7,717 7,267 6,000 Russia ..................... 2,568 2,739 2,776 3,621 4,027 4,359 Ukraine ................... 2,020 1,875 1,600 3,985 4,831 3,700 Bolivia ..................... 1,315 1,400 1,400 2,819 2,700 2,800 European Union ..... 926 926 910 2,540 2,664 2,600 Uruguay .................. 1,098 965 950 1,334 2,828 2,200 South Africa ............ 787 730 800 1,540 1,170 1,450 Nigeria .................... 1,000 1,000 1,000 994 1,054 1,100 Serbia ..................... 200 220 220 460 625 600 Indonesia ................ 420 410 400 540 520 510 Zambia .................... 225 192 196 351 303 281 Japan ...................... 150 147 150 249 213 253 Mexico .................... 263 191 150 433 335 235 Korea, North ........... 150 150 150 223 225 225 Iran ......................... 83 70 70 200 160 170 Burma ..................... 143 150 150 149 160 160 Bangladesh ............. 82 82 82 156 156 156 Turkey ..................... 24 25 27 90 95 105 Ethiopia ................... 39 42 40 84 120 100
FAS, Office of Global Analysis, (202) 720–6301. Prepared or estimated on the basis of official USDA production, supply, and distribution statistics from foreign governments.
Table 3-36.—Soybeans: United States exports by country of destination, 2017–2019
Country of destination 2017 2018 2019
Metric tons
China .............................................. 31,688,893 8,235,317 22,575,940 Mexico ............................................ 3,883,102 4,814,461 5,145,404 Egypt .............................................. 1,010,074 3,186,587 2,789,926 Japan ............................................. 2,299,038 2,268,969 2,451,291 Indonesia ........................................ 2,392,357 2,636,629 2,420,711 Netherlands .................................... 2,045,877 3,482,933 2,381,757 Taiwan ............................................ 1,447,092 2,261,542 1,845,002 Spain .............................................. 607,995 1,737,344 1,588,837 Thailand ......................................... 1,193,359 1,600,245 1,428,287 Bangladesh .................................... 1,049,387 1,192,983 1,136,758 Pakistan ......................................... 1,138,302 1,733,277 1,130,977 Korea, South .................................. 676,902 837,727 1,065,807 Vietnam .......................................... 742,066 1,254,697 802,931 Malaysia ......................................... 437,202 590,357 642,980 Colombia ........................................ 554,157 708,737 637,641 Canada ........................................... 385,971 776,012 519,799 Portugal .......................................... 123,156 538,550 407,969 Italy(*) ............................................. 75,523 879,428 405,958 Germany(*) ..................................... 1,314,686 1,203,633 400,558 Peru ................................................ 109,471 261,751 308,614 United Kingdom ............................. 100 326,895 289,920 Costa Rica ..................................... 296,126 297,643 271,070 Saudi Arabia .................................. 224,694 338,066 259,149 Tunisia ............................................ 221,094 451,168 218,864 Argentina ........................................ 256 1,986,162 203,017 Israel(*) ........................................... 79,454 118,187 140,329 Nepal .............................................. 0 5,861 139,047 Philippines ...................................... 234,239 167,119 136,657 France(*) ........................................ 64,900 182,732 133,745 Lebanon ......................................... 0 75,242 78,364 Rest of World ................................. 965,978 2,045,364 329,833
World Total ..................................... 55,261,450 46,195,618 52,287,140
(*) Denotes a country that is a summarization of its component countries. FAS, Office of Global Analysis, (202) 720–6301. Data Source: U.S. Census Bureau Trade Data.

III–18 OILSEEDS, FATS, AND OILS
Table 3-37.—Soybean oil: United States exports by country of destination, 2017–2019
Country of destination 2017 2018 2019
Metric tons
Korea, South ....................................... 264,506 281,161 356,797 Mexico ................................................ 241,240 149,136 134,293 Dominican Republic ............................ 176,792 142,728 128,614 Colombia ............................................. 52,752 75,474 84,871 Peru .................................................... 89,426 128,416 75,516 Guatemala .......................................... 33,489 27,013 32,628 Venezuela ........................................... 23,052 21,825 19,819 Jamaica .............................................. 12,200 17,200 15,029 Canada ............................................... 2 93,051 11,964 Mozambique ....................................... 8,407 7,565 11,859 Nicaragua ........................................... 12,402 48,857 11,428 Morocco .............................................. 7,137 10,867 9,995 Trinidad and Tobago .......................... 10,030 11,518 9,704 Senegal ............................................... 15,293 15,737 8,434 Pakistan .............................................. 4,121 5,772 6,815 Panama .............................................. 2,685 3,589 6,446 Cuba ................................................... 3,922 4,399 4,271 El Salvador ......................................... 3,558 4,391 4,083 Costa Rica .......................................... 6,583 7,779 3,018 United Arab Emirates ......................... 1,224 2,064 2,424 Honduras ............................................ 2,732 2,543 2,418 Malaysia .............................................. 1,933 1,894 2,201 Saudi Arabia ....................................... 129 327 1,755 Japan .................................................. 2,030 2,146 1,646 Bahamas, The .................................... 474 865 1,625 Kuwait ................................................. 979 1,761 1,545 Lebanon .............................................. 0 24 968 Jordan ................................................. 372 668 840 China .................................................. 422 401 590 Qatar ................................................... 30,332 888 482 Rest of World ...................................... 62,380 38,677 3,416
World Total ......................................... 1,070,602 1,108,733 955,492
Users should use cautious interpretation on quantity reports using mixed units of measure. Quantity line items will only include statistics on the units of measure that are equal to, or are able to be converted to, the assigned unit of measure of the grouped commodities.
FAS, Office of Global Analysis, (202) 720–6301. Data Source: U.S. Census Bureau Trade Data.
Table 3-38.—Soybean cake and meal: United States exports by country of destination, 2017–2019
Country of destination 2017 2018 2019
Metric tons
Philippines .......................................... 2,041,069 2,156,732 2,136,990 Mexico ................................................ 1,630,154 1,781,852 1,783,591 Colombia ............................................. 973,684 1,229,025 1,257,328 Canada ............................................... 916,203 998,377 977,677 Ecuador .............................................. 184,928 320,420 549,545 Dominican Republic ............................ 489,358 491,461 544,332 Vietnam ............................................... 192,398 762,580 537,417 Guatemala .......................................... 367,103 430,002 463,249 Japan .................................................. 250,131 330,619 340,274 Morocco .............................................. 215,372 553,234 328,033 Honduras ............................................ 238,532 273,006 291,041 El Salvador ......................................... 192,725 217,846 290,729 Burma ................................................. 91,088 153,197 269,240 Sri Lanka ............................................ 152,975 169,787 216,864 Panama .............................................. 200,093 218,113 201,016 Peru .................................................... 254,811 217,228 170,091 Venezuela ........................................... 301,804 182,796 150,332 Israel(*) ............................................... 146,714 53,657 146,821 Thailand .............................................. 366,966 344,341 142,710 Nicaragua ........................................... 104,700 107,284 134,451 Poland ................................................. 160 54,036 127,155 Jamaica .............................................. 116,497 126,079 115,197 Italy(*) ................................................. 2,029 125,119 106,126 Costa Rica .......................................... 63,374 108,712 105,559 Cuba ................................................... 27,005 0 90,391 United Kingdom .................................. 3,575 56,333 85,947 Spain ................................................... 114,261 354,736 69,964 Korea, South ....................................... 6,767 20,717 63,471 Belgium-Luxembourg(*) ...................... 54,600 55,079 57,759 Slovenia .............................................. 0 0 50,455 Rest of World ...................................... 979,339 1,124,450 568,964
World Total ......................................... 10,678,413 13,016,818 12,372,721
(*) Denotes a country that is a summarization of its component countries. Users should use cautious interpretation on quantity reports using mixed units of measure. Quantity line items will only include statistics on the units of measure that are equal to, or are able to be converted to, the assigned unit of measure of the grouped commodities.
FAS, Office of Global Analysis, (202) 720–6301. Data Source: U.S. Census Bureau Trade Data.

III–19 AGRICULTURAL STATISTICS 2020
Table 3-39.—International oil, soybean: Production in specified countries, 2017/2018–2019/2020
Country 2017/2018 2018/2019 2019/2020
1,000 metric tons
China ............................ 16,128 15,232 15,411 United States ............... 10,783 10,976 11,018 Argentina ...................... 7,236 7,910 8,500 Brazil ............................ 8,485 8,150 8,400 European Union ........... 2,841 2,945 3,021 India ............................. 1,386 1,730 1,495 Mexico .......................... 937 1,100 1,110 Russia .......................... 824 834 881 Paraguay ...................... 733 700 739 Egypt ............................ 582 620 656 Japan ........................... 468 468 474 Bolivia .......................... 425 470 470 Taiwan ......................... 383 401 420 Pakistan ....................... 375 375 410 Thailand ....................... 251 359 410 Bangladesh .................. 222 293 370 Canada ........................ 355 396 360 Iran ............................... 486 288 324 Turkey .......................... 250 250 259 South Africa ................. 220 220 238
FAS, Office of Global Analysis, (202) 720–6301. Prepared or estimated on the basis of official USDA production, supply, and distribution statistics from foreign governments.
Table 3-40.—International trade: Meal, soybean in specified countries, 2017/2018–2019/2020
Country 2017/2018 2018/2019 2019/2020
1,000 metric tons
Principle exporting countries: Argentina ............................................ 26,265 28,832 30,000 Brazil ................................................... 16,032 15,973 15,400 United States ...................................... 12,715 12,296 11,975 Paraguay ............................................ 2,625 2,333 2,550 Bolivia ................................................. 1,651 1,725 1,750 India .................................................... 1,863 2,200 1,450 China .................................................. 1,198 932 975 Ukraine ............................................... 365 777 700 Russia ................................................. 403 371 400 Canada ............................................... 357 425 325 European Union .................................. 395 374 300 Belarus ................................................ 135 204 245 Norway ................................................ 182 182 182 Vietnam ............................................... 120 100 110 South Africa ........................................ 91 85 85 Korea, South ....................................... 41 60 65 Turkey ................................................. 31 62 55 Nigeria ................................................ 49 50 50 Malaysia .............................................. 57 52 45 Serbia ................................................. 38 30 35
Principle importing countries: European Union .................................. 18,354 18,699 18,700 Vietnam ............................................... 4,850 5,400 5,450 Indonesia ............................................ 4,486 4,575 4,750 Thailand .............................................. 3,191 2,889 3,225 Philippines .......................................... 2,625 2,900 2,850 Iran ...................................................... 1,514 2,700 2,100 Mexico ................................................ 1,818 1,932 1,980 Korea, South ....................................... 1,846 1,900 1,925 Japan .................................................. 1,728 1,625 1,675 Colombia ............................................. 1,373 1,425 1,500 Algeria ................................................. 1,500 1,350 1,450 Malaysia .............................................. 1,609 1,578 1,400 Peru .................................................... 1,353 1,345 1,375 Ecuador .............................................. 1,145 1,150 1,170 Australia .............................................. 923 1,050 1,100 Canada ............................................... 1,022 1,018 1,050 Chile .................................................... 824 967 1,000 Saudi Arabia ....................................... 922 915 925 Turkey ................................................. 557 724 850 Morocco .............................................. 602 615 650
FAS, Office of Global Analysis, (202) 720–6301. Prepared or estimated on the basis of official USDA production, supply, and distribution statistics from foreign governments.

III–20 OILSEEDS, FATS, AND OILS
Table 3-41.—International trade: Oil, soybean in specified countries, 2017/2018–2019/2020
Country 2017/2018 2018/2019 2019/2020
1,000 metric tons
Principle exporting countries:
Argentina ............................................ 4,164 5,261 5,800 Brazil ................................................... 1,511 1,079 1,000 United States ...................................... 1,108 881 953 European Union .................................. 902 788 850 Paraguay ............................................ 702 654 710 Russia ................................................. 568 564 620 Bolivia ................................................. 380 350 370 Ukraine ............................................... 192 334 240 Canada ............................................... 157 169 165 China .................................................. 211 197 150 Malaysia .............................................. 124 123 125 Thailand .............................................. 70 80 90 Turkey ................................................. 58 85 90 Norway ................................................ 62 67 66 South Africa ........................................ 55 55 55 Serbia ................................................. 43 66 50 Saudi Arabia ....................................... 33 33 33 Egypt ................................................... 25 25 25 Vietnam ............................................... 40 25 25 Taiwan ................................................ 7 17 19
Principle importing countries:
India .................................................... 2,984 3,100 3,500 China .................................................. 481 783 1,100 Algeria ................................................. 720 760 770 Bangladesh ......................................... 859 1,038 700 Morocco .............................................. 502 536 545 Peru .................................................... 503 500 525 Colombia ............................................. 355 375 390 European Union .................................. 284 416 375 Korea, South ....................................... 276 300 295 United States ...................................... 152 180 204 Venezuela ........................................... 226 210 200 Dominican Republic ............................ 165 180 190 South Africa ........................................ 150 175 185 Mexico ................................................ 195 142 170 Iran ...................................................... 213 135 165 Egypt ................................................... 227 83 150 Chile .................................................... 67 100 115 Ecuador .............................................. 105 110 110 Malaysia .............................................. 88 100 110 Tunisia ................................................ 95 106 108 Cuba ................................................... 97 97 100 Korea, North ....................................... 90 100 100 Pakistan .............................................. 104 90 100
FAS, Office of Global Analysis, (202) 720–6301. Prepared or estimated on the basis of official USDA production, supply, and distribution statistics from foreign governments.
Table 3-42.—International trade: Oil, soybean local in specified countries, 2017/2018–2019/2020
Country 2017/2018 2018/2019 2019/2020
1,000 metric tons
Principle exporting countries:
Argentina ............................................ 4,567 5,400 5,900 Brazil ................................................... 1,410 1,008 1,000
Principle importing countries:
Brazil ................................................... 41 35 30
FAS, Office of Global Analysis, (202) 720–6301. Prepared or estimated on the basis of official USDA production, supply, and distribution statistics from foreign governments.

III–21 AGRICULTURAL STATISTICS 2020
Table 3-43.—International trade: Oilseed, soybean in specified countries, 2017/2018–2019/2020
Country 2017/2018 2018/2019 2019/2020
1,000 metric tons
Principle exporting countries: Brazil ................................................... 76,136 74,594 77,000 United States ...................................... 58,071 47,564 49,668 Argentina ............................................ 2,132 9,104 8,200 Paraguay ............................................ 6,029 4,901 5,900 Canada ............................................... 4,925 5,258 4,700 Ukraine ............................................... 2,757 2,531 2,450 Uruguay .............................................. 1,250 2,750 2,130 Russia ................................................. 892 797 950 European Union .................................. 276 179 250 India .................................................... 217 178 150 Serbia ................................................. 28 143 150 China .................................................. 134 116 125 Ethiopia ............................................... 93 95 80 Malaysia .............................................. 17 30 35 Nigeria ................................................ 28 30 30 Turkey ................................................. 20 25 25 Bolivia ................................................. 7 10 10 Chile .................................................... 7 8 8 South Africa ........................................ 34 5 5 Uganda ............................................... 5 5 5
Principle importing countries: China .................................................. 94,095 82,540 88,000 European Union .................................. 14,584 15,004 15,200 Mexico ................................................ 4,873 5,908 6,000 Argentina ............................................ 4,703 6,408 3,900 Egypt ................................................... 3,550 3,350 3,700 Thailand .............................................. 2,482 3,155 3,400 Japan .................................................. 3,256 3,300 3,350 Indonesia ............................................ 2,483 2,725 2,950 Taiwan ................................................ 2,666 2,730 2,850 Turkey ................................................. 2,777 2,600 2,800 Pakistan .............................................. 2,300 1,719 2,200 Russia ................................................. 2,237 2,066 2,200 Bangladesh ......................................... 1,179 1,733 1,900 Iran ...................................................... 2,559 2,000 1,850 Vietnam ............................................... 1,824 1,800 1,850 Korea, South ....................................... 1,256 1,365 1,450 Canada ............................................... 487 1,172 900 Malaysia .............................................. 690 770 825 Tunisia ................................................ 683 670 710 Saudi Arabia ....................................... 590 585 640
FAS, Office of Global Analysis, (202) 720–6301. Prepared or estimated on the basis of official USDA production, supply, and distribution statistics from foreign governments.
Table 3-44.—International trade: Oilseed, Soybeans local in specified countries, 2017/2018–2019/2020
Country 2017/2018 2018/2019 2019/2020
1,000 metric tons
Principle exporting countries: Brazil ................................................... 83,729 73,234 77,000 Argentina ............................................ 3,841 10,310 8,000
Principle importing countries: Argentina ............................................ 7,256 3,850 3,900 Brazil ................................................... 185 145 150
FAS, Office of Global Analysis, (202) 720–6301. Prepared or estimated on the basis of official USDA production, supply, and distribution statistics from foreign governments.

III–22 OILSEEDS, FATS, AND OILS
Table 3-45.—Sunflower, all: Area, yield, production, and value, United States, 2010–2019
Year Area planted
Area harvested
Yield per har-vested acre Production Price per cwt Value of
production
1,000 acres 1,000 acres Pounds 1,000 pounds Dollars 1,000 dollars
2010 ..................... 1,951.5 1,873.8 1,460 2,735,570 23.30 633,778 2011 ..................... 1,543.0 1,457.8 1,398 2,038,275 29.10 589,282 2012 ..................... 1,920.0 1,840.0 1,487 2,736,060 25.40 699,970 2013 ..................... 1,575.5 1,464.6 1,380 2,021,765 21.40 443,296 2014 ..................... 1,565.3 1,505.1 1,470 2,212,350 21.70 496,469 2015 ..................... 1,860.1 1,800.4 1,625 2,925,030 19.60 574,481 2016 ..................... 1,596.6 1,532.0 1,731 2,651,635 17.40 464,015 2017 ..................... 1,403.0 1,333.8 1,603 2,137,750 17.20 375,077 2018 ..................... 1,301.0 1,217.4 1,731 2,107,045 17.40 370,466 2019 ..................... 1,350.6 1,244.5 1,562 1,943,435 17.80 358,408
NASS, Crops Branch, (202) 720–2127.
Table 3-46.—Sunflower, oil varieties: Area, yield, production, and value, United States, 2010–2019
Year Area planted
Area harvested
Yield per har-vested acre Production Price per cwt. Value of
production
1,000 acres 1,000 acres Pounds 1,000 pounds Dollars 1,000 dollars
2010 ..................... 1,463.0 1,422.5 1,458 2,074,500 22.60 457,135 2011 ..................... 1,289.5 1,233.4 1,397 1,722,675 28.00 480,412 2012 ..................... 1,658.0 1,589.8 1,484 2,359,775 24.40 580,404 2013 ..................... 1,279.0 1,200.9 1,363 1,637,205 19.30 322,605 2014 ..................... 1,174.0 1,134.5 1,461 1,657,390 19.30 322,163 2015 ..................... 1,550.5 1,510.0 1,579 2,383,870 18.20 434,795 2016 ..................... 1,418.0 1,368.5 1,731 2,369,015 16.90 403,850 2017 ..................... 1,216.0 1,168.0 1,582 1,847,525 16.90 312,065 2018 ..................... 1,164.0 1,094.0 1,725 1,887,260 16.70 320,867 2019 ..................... 1,197.0 1,118.0 1,562 1,746,350 17.40 310,179
NASS, Crops Branch, (202) 720–2127.
Table 3-47.—Sunflower, non-oil varieties: Area, yield, production, and value, United States, 2010–2019
Year Area planted
Area harvested
Yield per harvested acre Production Price per cwt. Value of
production
1,000 acres 1,000 acres Pounds 1,000 pounds Dollars 1,000 dollars
2010 ..................... 488.5 451.3 1,465 661,070 26.60 176,643 2011 ..................... 253.5 224.4 1,406 315,600 33.80 108,870 2012 ..................... 262.0 250.2 1,504 376,285 29.60 119,566 2013 ..................... 296.5 263.7 1,458 384,560 31.30 120,691 2014 ..................... 391.3 370.6 1,497 554,960 31.50 174,306 2015 ..................... 309.6 290.4 1,863 541,160 26.60 139,686 2016 ..................... 178.6 163.5 1,729 282,620 21.20 60,165 2017 ..................... 187.0 165.8 1,750 290,225 21.00 63,012 2018 ..................... 137.0 123.4 1,781 219,785 22.80 49,579 2019 ..................... 153.6 126.5 1,558 197,085 22.40 48,229
NASS, Crops Branch, (202) 720–2127.

III–23 AGRICULTURAL STATISTICS 2020
Table 3-48.—Sunflower, all: Area, yield, production, and value, by type, State and United States, 2018–2019
Type and State Area planted Area harvested Yield per harvested acre
2018 2019 2018 2019 2018 2019
Oil: 1,000 acres 1,000 acres 1,000 acres 1,000 acres Pounds Pounds California .............. 58.0 49.0 57.0 49.0 1,300 1,400 Colorado .............. 58.0 47.0 49.0 44.0 1,100 1,000 Kansas ................. 43.0 37.0 41.0 32.0 1,500 1,400 Minnesota ............ 45.0 53.0 44.0 51.0 2,250 1,850 Nebraska ............. 25.0 28.0 24.0 26.0 1,420 1,300 North Dakota ....... 395.0 470.0 380.0 430.0 1,750 1,500 South Dakota ....... 520.0 485.0 480.0 460.0 1,830 1,700 Texas ................... 20.0 28.00 19.0 26.0 1,120 1,300
United States ....... 1,164.0 1,197.0 1,094 1,118.0 1,726 1,562
Non-oil: California .............. 2.0 1.6 2.0 1.6 1,200 1,300 Colorado .............. 8.0 12.0 7.0 11.0 1,150 1,400 Kansas ................. 10.0 8.0 8.5 7.3 1,500 1,250 Minnesota ............ 7.5 5.0 6.9 4.6 2,150 1,800 Nebraska ............. 12.0 9.0 9.5 8.5 1,400 1,300 North Dakota ....... 41.0 65.0 40.0 58.0 1,860 1,650 South Dakota ....... 51.0 48.0 45.0 31.0 1,950 1,600 Texas ................... 5.5 5.0 4.5 4.5 1,400 1,300
United States ....... 137.0 153.6 123.4 126.5 1,781 1,562
Total: California .............. 60.0 50.6 59.0 50.6 1,297 1,397 Colorado .............. 66.0 59.0 56.0 55.0 1,106 1,080 Kansas ................. 53.0 45.0 49.5 39.3 1,500 1,372 Minnesota ............ 52.5 58.0 50.9 55.6 2,236 1,846 Nebraska ............. 37.0 37.0 33.5 34.5 1,414 1,300 North Dakota ....... 436.0 535.0 420.0 488.0 1,760 1,518 South Dakota ....... 571.0 533.0 525.0 491.0 1,840 1,694 Texas ................... 25.5 33.0 23.5 30.5 1,174 1,300
United States ....... 1,301.0 1,350.6 1,217.4 1,244.5 1,731 1,562
Type and State Production Marketing year average price
per cwt Value of production
2018 2019 2018 2019 1 2018 2019 1
Oil: 1,000 lbs 1,000 lbs Dollars Dollars 1,000 dollars 1,000 dollars California .............. 74,100 68,600 (D) 27.10 (D) 18,591 Colorado .............. 53,900 44,000 (D) 18.40 (D) 8,096 Kansas ................. 61,500 44,800 (D) (D) (D) (D) Minnesota ............ 99,000 94,350 (D) (D) (D) (D) Nebraska ............. 34,080 33,800 15.50 17.00 5,282 5,746 North Dakota ....... 665,000 645,000 17.10 17.50 113,715 112,875 South Dakota ....... 878,400 782,000 (D) (D) (D) (D) Texas ................... 21,280 33,800 18.00 18.00 3,830 6,084 Other States 2 ...... ........................ ........................ 17.00 17.20 198,940 158,787
United States ....... 1,887,260 1,746,350 16.70 17.40 320,867 310,179
Non-oil: California .............. 2,400 2,080 (D) 24.20 (D) 503 Colorado .............. 8,050 15,400 (D) 20.80 (D) 3,203 Kansas ................. 12,750 9,125 (D) (D) (D) (D) Minnesota ............ 14,835 8,280 (D) (D) (D) (D) Nebraska ............. 13,300 11,050 25.60 21.00 3,405 2,321 North Dakota ....... 74,400 95,700 23.40 23.90 17,410 22,872 South Dakota ....... 87,750 49,600 (D) (D) (D) (D) Texas ................... 6,300 5,850 24.00 20.00 1,512 1,170 Other States 2 ...... ........................ ........................ 21.70 27.10 27,252 18,160
United States ....... 219,785 197,085 22.80 22.40 49,579 48,229
Total: California .............. 76,500 70,680 25.00 27.00 19,101 19,094 Colorado .............. 61,950 59,400 17.30 19.00 10,692 11,299 Kansas ................. 74,250 53,925 17.60 17.90 13,235 9,651 Minnesota ............ 113,835 102,630 18.40 18.90 21,272 19,526 Nebraska ............. 47,380 44,850 18.30 18.00 8,687 8,067 North Dakota ....... 739,400 740,700 18.10 18.30 131,125 135,747 South Dakota ....... 966,150 831,600 16.50 17.20 160,992 147,770 Texas ................... 27,580 39,650 19.40 18.30 5,342 7,254
United States ....... 2,107,045 1,943,435 17.40 17.80 370,446 358,408
(D) Withheld to avoid disclosing data for individual operations. 1 Preliminary. 2 Includes data withheld above. NASS, Crops Branch, (202) 720–2127.

III–24 OILSEEDS, FATS, AND OILS
Table 3-49.—International Oilseed, sunflowerseed: Area and production in specified countries, 2017/2018–2019/2020
Country Area Production
2017/2018 2018/2019 2019/2020 2017/2018 2018/2019 2019/2020
1,000 hectares 1,000 metric tons
Ukraine .................. 6,800 6,500 6,200 13,700 15,000 16,000 Russia .................... 7,146 7,944 8,363 10,362 12,710 15,305 European Union ..... 4,394 4,122 4,350 10,128 9,513 9,750 Argentina ............... 1,678 1,876 1,590 3,538 3,825 3,400 China ..................... 1,171 921 1,250 3,149 2,494 3,250 Turkey .................... 700 715 730 1,550 1,800 1,750 Kazakhstan ............ 883 850 815 903 848 918 United States ......... 540 493 504 970 956 882 Moldova ................. 385 364 356 804 789 806 South Africa ........... 602 515 610 862 680 750 Serbia .................... 220 220 220 540 680 660 Burma .................... 600 600 600 390 390 390 India ....................... 284 281 225 230 172 170 Pakistan ................. 80 120 140 90 144 145 Brazil ...................... 96 65 80 142 111 120 Uruguay ................. 50 56 60 78 90 100 Bolivia .................... 109 115 120 121 80 90 Canada .................. 26 27 29 58 57 63 Paraguay ............... 41 31 30 65 49 51 Iran ......................... 40 40 40 43 43 43
FAS, Office of Global Analysis, (202) 720–6301. Prepared or estimated on the basis of official USDA production, supply, and distribution statistics from foreign governments.
Table 3-50—Sunflowerseed: United States exports by country of destination, 2017–2019
Country 2017 2018 2019
Metric tons
Spain .................................... 19,785 19,790 16,450 Canada ................................. 17,168 14,218 15,474 Mexico .................................. 22,803 14,053 11,472 Israel(*) ................................. 2,491 3,462 1,945 Korea, South ........................ 1,818 1,484 1,170 Romania ............................... 684 794 1,078 Greece .................................. 1,559 1,492 1,039 Turkey ................................... 2,561 1,430 755 Egypt .................................... 2,210 539 655 Poland .................................. 0 419 499 Ukraine ................................. 0 201 492 Japan .................................... 1,068 526 483 Indonesia .............................. 0 14 339 Colombia .............................. 466 492 279 Germany(*) ........................... 577 361 257 Chile ..................................... 84 116 112 Jordan .................................. 1,472 490 100 Singapore ............................. 90 91 91 Argentina .............................. 354 44 81 Morocco ................................ 1,205 660 80 Malaysia ............................... 123 69 68 Kuwait ................................... 164 256 32 India ...................................... 0 0 28 Philippines ............................ 24 27 26 Lebanon ............................... 287 18 20 Netherlands .......................... 0 0 20 Hong Kong ........................... 5 0 15 Guatemala ............................ 6 3 13 Jamaica ................................ 8 0 9 Italy(*) ................................... 0 20 6 Rest of World ....................... 1,695 1,450 23
World Total ........................... 78,704 762,518 53,111
(*) Denotes a country that is a summarization of its component countries. FAS, Office of Global Analysis, (202) 720–6301. Data Source: U.S. Census Bureau Trade Data.

III–25 AGRICULTURAL STATISTICS 2020
Table 3-51.—Sunflowerseed oil: United States exports by country of destination, 2017–2019
Country 2017 2018 2019
Metric tons
Canada ...................................................... 17,580 20,694 21,671 Mexico ........................................................ 5,419 16,209 16,349 Malaysia ..................................................... 60 2,322 6,420 Germany(*) ................................................ 2 6 4,569 Korea, South .............................................. 179 257 1,162 Vietnam ...................................................... 475 1,507 1,105 Japan ......................................................... 2,606 901 864 Philippines .................................................. 0 18 695 Australia(*) ................................................. 47 1,471 658 Taiwan ....................................................... 1,028 624 532 Argentina .................................................... 0 39 466 Honduras ................................................... 626 732 326 India ........................................................... 5 45 198 Singapore ................................................... 28 13 153 Mali ............................................................ 0 0 120 Italy(*) ......................................................... 310 62 100 Indonesia ................................................... 59 11 91 China .......................................................... 364 35 84 Peru ........................................................... 6 18 52 Colombia .................................................... 2,694 14 49 New Zealand(*) .......................................... 0 13 43 United Kingdom ......................................... 13 0 38 Netherlands ................................................ 176 224 36 Thailand ..................................................... 14 44 31 Turkey ........................................................ 0 0 19 Brazil .......................................................... 27 8 8 Hong Kong ................................................. 18 6 6 Portugal ...................................................... 0 0 6 Uruguay ..................................................... 919 6 6 United Arab Emirates ................................ 0 0 4 Rest of World ............................................. 618 496 7
World Total ................................................ 33,272 45,773 55,869
(*) Denotes a country that is a summarization of its component countries. FAS, Office of Global Analysis, (202) 720–6301.
Table 3-52.—International oil, sunflowerseed: Production in specified countries, 2017/2018–2019/2020
Country 2017/2018 2018/2019 2019/2020
1,000 metric tons
Ukraine ....................................................... 5,913 6,364 6,772 Russia ........................................................ 4,192 4,875 5,660 European Union ......................................... 3,760 3,718 3,676 Argentina .................................................... 1,385 1,425 1,350 Turkey ........................................................ 892 1,022 979 China .......................................................... 645 466 717 South Africa ............................................... 352 293 335 Serbia ......................................................... 212 212 233 United States ............................................. 197 201 187 Kazakhstan ................................................ 213 138 169 Burma ........................................................ 131 131 131 Moldova ..................................................... 83 83 87 India ........................................................... 103 63 62 Pakistan ..................................................... 44 48 60 Iran ............................................................. 66 48 54 Brazil .......................................................... 57 49 51 Uruguay ..................................................... 31 36 40 Bolivia ........................................................ 52 34 39 Bosnia and Herzegovina ........................... 40 38 38 Egypt .......................................................... 37 37 35 Georgia ...................................................... 23 23 23 Belarus ....................................................... 10 22 20 Paraguay .................................................... 23 18 18 Mexico ........................................................ 14 14 15 Morocco ..................................................... 17 10 13 Australia ..................................................... 10 13 8 Israel .......................................................... 8 8 8 Guatemala ................................................. 7 7 7 Switzerland ................................................ 7 7 7 Macedonia ................................................. 6 4 5 Chile ........................................................... 3 3 3
FAS, Office of Global Analysis, (202) 720–6301. Prepared or estimated on the basis of official USDA production, supply, and distribution statistics from foreign governments.

III–26 OILSEEDS, FATS, AND OILS
Table 3-53.—Mint oil: Production and value, by State and United States, 2017–2019
State Production Price per pound Value of production
2017 2018 2019 2017 2018 2019 1 2017 2018 2019 1
1,000 1,000 1,000 1,000 1,000 1,000 pounds pounds pounds Dollars Dollars Dollars dollars dollars dollars
Peppermint: California 2 .......... 123 136 (NA) 22.80 (D) (NA) 2,804 (D) (NA) Idaho ................... 1,890 1,785 2,040 17.60 18.90 18.60 33,264 33,737 37,944 Indiana ................ 383 350 307 21.50 21.50 22.30 8,235 7,525 6,846 Oregon ................ 1,710 1,615 1,805 19.40 21.10 19.70 33,174 34,077 35,559 Washington ......... 1,440 1,320 1,300 16.50 19.40 19.30 23,760 25,608 25,090 Wisconsin 2 ......... 204 171 (NA) 18.50 (D) (NA) 3,774 (D) (NA) Other States 3 ..... ............... ............... ............... (X) 18.10 (X) ............... 5,542 ...............
United States ...... 5,750 5,377 5,452 18.30 19.80 19.30 105,011 106,489 105,439
Spearmint: Idaho ................... (D) (D) 154 (D) (D) (D) (D) 2,170 (D) Indiana ................ 167 216 281 17.00 (D) (D) 2,839 (D) (D) Michigan 2 ........... (D) (D) (NA) (D) (D) (NA) (D) (D) (NA) Oregon ................ 263 313 313 19.50 17.40 15.90 5,129 5,446 4,977 Washington ......... 2,100 1,748 1,665 15.60 16.70 17.40 32,832 29,229 28,995
Native .............. 1,320 1,264 (D) 16.60 16.50 (D) 21,912 20,856 (D) Scotch ............. 780 484 (D) 14.00 17.30 (D) 10,920 8,373 (D)
Other States 3 ..... 266 294 ............... 17.10 16.70 15.60 4,536 6,333 6,793
United States ...... 2,796 2,571 2,413 16.20 16.80 16.90 45,336 43,178 40,765
(D) Withheld to avoid disclosing data for individual operations. (NA) Not available. (X) Not applica-ble. 1 Preliminary. 2 Estimates discontinued in 2019. 3 Includes data withheld above.
NASS, Crops Branch, (202) 720–2127.
Table 3-54.—Peppermint oil: Area, yield, production, and value, United States, 2010–2019
Year Area harvested
Yield per harvested acre Production Price per pound Value of
production
1,000 acres Pounds 1,000 pounds Dollars 1,000 dollars 2010 ..................... 72.8 89 6,495 20.30 131,805 2011 ..................... 75.5 89 6,700 23.10 154,626 2012 ..................... 75.7 87 6,549 24.10 158,121 2013 ..................... 70.0 90 6,273 23.80 149,557 2014 ..................... 65.0 91 5,887 22.90 134,775 2015 ..................... 64.9 91 5,876 21.80 127,956 2016 ..................... 64.5 91 5,843 20.90 121,923 2017 ..................... 60.8 95 5,750 18.30 105,011 2018 ..................... 58.5 92 5,377 19.80 106,489 2019 ..................... 52.4 104 5,452 19.30 105,439
NASS, Crops Branch (202), 720–2127.

III–27 AGRICULTURAL STATISTICS 2020
Table 3-55.—Spearmint oil: Area, yield, production, and value, United States, 2010–2019
Year Area harvested
Yield per harvested acre Production Price per pound Value of
production
1,000 acres Pounds 1,000 pounds Dollars 1,000 dollars
2010 ..................... 18.6 125 2,318 16.20 37,553 2011 ..................... 17.3 132 2,286 18.60 42,438 2012 ..................... 20.0 119 2,386 19.50 46,521 2013 ..................... 24.5 119 2,926 19.10 55.829 2014 ..................... 24.4 114 2,784 19.80 54,977 2015 ..................... 25.8 114 2,930 18.30 53,664 2016 ..................... 24.5 131 3,208 17.30 55,378 2017 ..................... 22.3 125 2,796 16.20 45,336 2018 ..................... 20.8 124 2,571 16.80 43,178 2019 ..................... 18.5 130 2,413 16.90 40,765
NASS, Crops Branch, (202) 720–2127.
Table 3-56.—International oil, olive: Production in specified countries, 2017/2018–2019/2020
Country 2017/2018 2018/2019 2019/2020
1,000 metric tons
European Union ........... 2,220 2,400 2,100 Tunisia ......................... 280 120 250 Turkey .......................... 263 183 250 Morocco ....................... 140 200 170 Syria ............................. 100 100 140 Algeria .......................... 83 76 80 Argentina ...................... 44 26 40 Jordan .......................... 25 24 24 Lebanon ....................... 17 24 20 Saudi Arabia ................ 5 10 20 Libya ............................ 18 16 18 Australia ....................... 22 20 17 Chile ............................. 17 16 16 United States ............... 16 16 16 Israel ............................ 15 15 14 China ............................ 5 4 4
FAS, Office of Global Analysis, (202) 720–6301. Prepared or estimated on the basis of official USDA production, supply, and distribution statistics from foreign governments.
Table 3-58.—Fats and oils: Wholesale price per pound, 2013–2017 1
Item and market 2013 2014 2015 2016 2017
Cents Cents Cents Cents Cents
Coconut oil, crude, tanks, f.o.b. New York ..................... 44.26 60.21 52.27 69.12 80.36 Corn oil, crude, tank cars, f.o.b. Decatur ........................ 43.13 38.36 38.24 29.24 36.78 Cottonseed oil, crude, tank cars, f.o.b. Valley ................ 46.60 60.33 47.01 45.81 38.53 Palm oil, U.S. ports, refined ............................................ 41.13 39.86 32.10 34.39 35.67 Canola oil, Midwest ......................................................... 52.81 42.46 36.70 36.44 38.65 Soybean oil, crude, tank cars, f.o.b. Decatur ................. 44.98 36.83 30.20 31.58 32.06 Sunflower oil, crude, Minneapolis ................................... 62.79 59.77 38.03 55.27 53.40 Tallow, edible, number 1 delivered Chicago ................... 42.52 38.91 28.42 32.96 34.43
1 All prices are calendar year average. ERS, Market and Trade Economics Division, Field Crops Branch, (202) 694–5300. Compiled from the Chemical Marketing
Reporter, Milling and Baking News, and the Agricultural Marketing Service.

IV–1
CHAPTER IV
STATISTICS OF VEGETABLES AND MELONS
This chapter contains statistics on potatoes, sweet potatoes, and commercial vegetables and melons.
For potatoes and sweet potatoes, the estimates of area, production, value, and farm disposition per-tain to the total crop and include quantities produced both for sale and for use on farms where grown. Potato statistics are shown on a within-year seasonal grouping of winter, spring, summer, and fall crops, by States. Some States have production in more than one seasonal group.
Commercial vegetables for fresh market include 26 principal vegetable and melon crops in the major producing States. These estimates relate to crops which are grown primarily for sale and do not include vegetables and melons produced in farm and non-farm gardens. The bulk of the produc-tion of the principal vegetable and melon crops is for consumption in the fresh state. The commercial estimates of these crops include local market production from areas near consuming centers as well as production from well recognized commercial areas which specialize in producing supplies for ship-ment to distant markets. For fresh market vegetables and melons, value per unit and total value are on an f.o.b. basis.
For processing vegetables, the estimates of area, production, and value for each of 10 crops relate to production used by commercial canners, freezers, and other processors, except dehydrators. These estimates include raw products grown by processors themselves and those grown under contract or purchased on the open market. This production and the actual area harvested are not duplicated in the fresh market estimates for the same commodities. The production of those vegetables used for processing for which regular processing estimates are not made is included in the fresh market esti-mates. The processed segment of production for asparagus, broccoli, and cauliflower, combined with fresh market production during the year, is published separately at the end of the season. For proc-essed vegetables, value per unit and total value are at processing plant door.
Beginning in 2016, acreage and yield estimates for fresh market and processing utilizations were discontinued. Total production and utilized production are estimated for each crop. Harvested not sold estimates were added to the estimating program. This is defined as the difference between total pro-duction and total utilized production.

IV–2 STATISTICS OF VEGETABLES AND MELONS
Table 4-1.—Vegetables, principal: Fresh Market and Processing, Area Harvested, Production, and Value, by State and United States, 2017–2019
State Area harvested Total production
2017 2018 2019 2017 2018 2019
Acres Acres Acres 1,000 cwt 1,000 cwt 1,000 cwt
Alabama ............................. 5,400 5,900 (NA) 756.0 619.5 (NA) Arizona ............................... 127,000 (D) 123,900 35,019.0 (D) 35,018 California ............................ 1,039,900 985,800 972,400 437,802.4 464,180.6 451,426.0 Colorado ............................ (D) (D) 2,700 (D) (D) 1,147.5 Delaware ............................ (D) (D) (NA) (D) (D) (NA) Florida ................................ 172,700 172,800 170,700 38,117.5 34,121.0 34,509.9 Georgia .............................. 91,900 95,400 92,900 21,770.6 17,731.3 21,289.0 Idaho .................................. 16,400 12,300 10,900 9,491.5 7,827.0 8,938.0 Illinois ................................. 46,100 38,850 38,100 9,204.2 7,980.0 7,464.8 Indiana ............................... 27,800 28,000 11,100 9,018.2 10,219.2 3,543.0 Maryland ............................ (D) (D) (NA) (D) (D) (NA) Michigan ............................ 107,500 101,900 87,200 19,181.6 16,683.2 12,419.1 Minnesota .......................... 165,100 160,600 154,300 21,166.5 17,454.8 15,647.4 Mississippi ......................... - - 27,500 - - 4,262.5 Missouri ............................. 3,000 (D) (NA) 705.0 (D) (NA) New Jersey ........................ 28,800 28,500 10,600 4,197.4 3,533.3 1,630.0 New Mexico ....................... 14,700 15,000 15,300 6,082.0 5,611.0 5,254.5 New York ........................... 90,100 89,200 86,300 15,265.9 12,763.8 13,413.6 North Carolina ................... 37,300 36,500 126,300 7,458.6 6,614.5 24,732.0 Ohio ................................... 21,300 21,500 3,500 4,732.5 4,913.0 437.5 Oregon ............................... (D) (D) 79,000 (D) (D) 23,908.0 Pennsylvania ..................... 27,650 25,500 13,500 2,731.1 1,957.3 1,151.1 South Carolina ................... (D) 10,300 4,500 (D) 2,501.4 1,440.0 Tennessee ......................... 11,300 12,700 (NA) 1,786.9 1,626.6 (NA) Texas ................................. 67,600 62,000 50,100 14,692.5 15,926.3 13,477.2 Virginia ............................... 6,000 7,500 5,600 1,418.8 1,491.7 924.0 Washington ........................ 154,300 144,100 140,300 43,145.8 40,206.3 37,515.2 Wisconsin .......................... (D) (D) 155,900 (D) (D) 19,787.5 Other States 1 .................... 310,630 430,750 - 59,577.1 89,653.4 -
United States ..................... 2,572,480 2,485,100 2,382,600 763,321.1 763,615.2 739,335.8
State Utilized production Value of utilized production
2017 2018 2019 2017 2018 2019
1,000 cwt 1,000 cwt 1,000 cwt 1,000 dollars 1,000 dollars 1,000 dollars
Alabama ............................. 756.0 615.2 (NA) 16,659 15,379 (NA) Arizona ............................... 35,019.0 (D) 35,018.0 1,635,572 (D) 2,167,239 California ............................ 432,410.5 461,897.6 499,755.6 8,561,502 7,327,501 7,864,286 Colorado ............................ (D) (D) 1,109.6 (D) (D) 18,531 Delaware ............................ (D) (D) (NA) (D) (D) (NA) Florida ................................ 37,647.7 33,363.7 34,291.9 1,078,197 1,121,981 1,223,430 Georgia .............................. 21,376.3 17,702.3 20,825.6 476,744 452,589 517,659 Idaho .................................. 9,390.5 7,808.6 8,893.3 85,740 60,831 65,815 Illinois ................................. 9,069.0 7,949.0 7,458.2 43,077 39,577 44,205 Indiana ............................... 9,017.2 10,206.6 3,539.3 96,292 97,104 52,276 Maryland ............................ (D) (D) (NA) (D) (D) (NA) Michigan ............................ 19,166.0 16,633.1 12,352.7 301,363 273,314 213,547 Minnesota .......................... 21,027.4 17,430.1 15,477.7 110,856 116,288 76,579 Mississippi ......................... - - 4,262.5 - - 75,021 Missouri ............................. 702.2 (D) (NA) 8,445 (D) (NA) New Jersey ........................ 4,188.9 3,262.7 1,593.0 162,394 138,376 82,520 New Mexico ....................... 6,082.0 5,611.0 5,254.5 129,043 133,357 152,628 New York ........................... 14,782.0 12,528.2 13,108.7 246,805 209,911 233,112 North Carolina ................... 7,351.4 6,506.4 24,611.4 170,273 145,025 425,943 Ohio ................................... 4,707.5 4,899.0 434.0 94,499 103,562 9,911 Oregon ............................... (D) (D) 23,712.9 (D) (D) 192,879 Pennsylvania ..................... 2,678.5 1,905.7 1,136.0 76,175 59,224 25,389 South Carolina ................... (D) 2,495.3 1,402.6 (D) 68,470 16,022 Tennessee ......................... 1,759.2 1,584.1 (NA) 76,431 66,984 (NA) Texas ................................. 14,456.0 15,803.7 13,294.1 283,237 298,047 192,710 Virginia ............................... 1,413.9 1,439.2 903.7 54,146 43,653 16,427 Washington ........................ 41,868.9 39,330.3 36,759.8 368,660 351,475 362,740 Wisconsin .......................... (D) (D) 19,711.1 (D) (D) 128,310 Other States 1 .................... 59,496.2 89,342.7 - 591,782 1,747,898 -
United States ..................... 754,366.3 758,314.5 734,906.6 14,667,892 12,869,883 14,157,179
(D) Withheld to avoid disclosing data for individual operations. (NA) Not available. 1 Includes data withheld above. NASS, Crops Branch, (202) 720–2127.

IV–3 AGRICULTURAL STATISTICS 2020
Table 4-2.— Artichokes for fresh market and processing: Area, yield, production, value, and total value, United States, 2010-2019
Year Area harvested Yield per acre Utilized Production Value
Per cwt Total
Acres Cwt 1,000 cwt Dollars 1,000 dollars
2010 ..................... 7,200 120 864 50.20 43,373 2011 ..................... 7,400 135 999 51.10 51,049 2012 ..................... 7,300 145 1,059 54.30 57,504 2013 ..................... 7,100 135 959 61.00 58,499 2014 ..................... 7,300 130 949 57.60 54,662 2015 ..................... 6,800 135 918 87.80 80,600 2016 ..................... 6,800 145 986 78.80 77,697 2017 ..................... 7,200 130.0 936.0 70.00 65,520 2018 ..................... 6,900 145.0 1,000.5 63.00 63,032 2019 ..................... 7,200 125.0 1,008.0 78.00 78,624
Note: Beginning in 2016, Acreage and Yield estimates for fresh market and processing utilizations were discontinued. Total Production and Utilized Production are estimated for each crop. Harvested Not Sold estimates were added to the esti-mating program. This is defined as the difference between Total Production and Total Utilized Production. Table 4-2, 2016- 2018 includes utilized production.
NASS, Crops Branch, (202) 720–2127.
Table 4-3.—Asparagus for Fresh Market and Processing: Area planted and harvested, yield, production, price and value - State and United States, 2017–2019
State Area planted Area harvested
2017 2018 2019 2017 2018 2019
Acres Acres Acres Acres Acres Acres California ................ 8,300 6,200 5,300 8,000 6,000 5,200 Michigan ................ 12,000 10,000 10,000 11,300 9,500 9,400 New Jersey ............ 2,200 2,200 2,100 2,100 2,100 2,000 Washington ............ 5,100 4,500 4,500 4,900 4,100 4,100
United States ......... 27,600 22,900 21,900 26,300 26,300 20,700
State Yield per acre Utilized Production
2017 2018 2019 2017 2018 2019
Cwt Cwt Cwt 1,000 cwt 1,000 cwt 1,000 cwt California ................ 25.0 30.0 35.0 198.0 178.2 182.0 Michigan ................ 27.0 28.0 30.0 305.1 266.0 273.5 New Jersey ............ 34.0 33.0 32.0 71.4 69.3 63.7 Washington ............ 54.0 65.0 55.0 264.6 261.2 216.5
United States ......... 32.0 36.0 36.4 839.1 774.7 735.7
State Price per cwt Value of Production
2017 2018 2019 2017 2018 2019
Dollars Dollars Dollars 1,000 dollars 1,000 dollars 1,000 dollars California ................ 175.00 149.00 202.00 34,650 26,552 36,764 Michigan ................ 85.70 87.50 93.60 26,136 23,275 25,607 New Jersey ............ 183.00 167.00 256.00 13,054 11,562 16,302 Washington ............ 101.40 100.00 98.10 26,832 26,195 21,242
United States ......... 120.00 113.00 136.00 100,672 87,584 99,915
NASS, Crops Branch, (202) 720–2127.

IV–4 STATISTICS OF VEGETABLES AND MELONS
Table 4-4.—Asparagus for Fresh Market and Processing: Production, price and value by utilization - States and United States, 2017–2019
Utilization and State Utilized Production
2017 2018 2019
1,000 cwt 1,000 cwt 1,000 cwt Fresh market
California ........................ 198.0 178.2 182.0 Michigan ......................... 144.0 133.0 141.0 New Jersey ..................... (D) (D) (D) Washington .................... (D) (D) (D) Other States 1 ................. 311.0 306.4 257.0
United States .................. 653.0 617.6 580.0
Tons Tons Tons Processing
California ........................ - - - Michigan ......................... 8,055 6,650 6,627 New Jersey ..................... (D) (D) (D) Washington .................... (D) (D) (D) Other States 1 ................. 1,252 1,202 1,160
United States .................. 9,307 7,852 7,787
Utilization and State Price per unit
2017 2018 2019
Dollars per cwt Dollars per cwt Dollars per cwt Fresh market
California ........................ 175.00 149.00 202.00 Michigan ......................... 92.00 95.00 105.00 New Jersey ..................... (D) (D) (D) Washington .................... (D) (D) (D) Other States 1 ................. 123.00 117.00 139.00
United States .................. 132.00 122.00 151.00
Dollars per ton Dollars per ton Dollars per ton Processing
California ........................ (X) (X) (X) Michigan ......................... 1,600.00 1,600.00 1,630.00 New Jersey ..................... (D) (D) (D) Washington .................... (D) (D) (D) Other States 1 ................. 1,350.00 1,470.00 1,500.00
United States .................. 1,570.00 1,580.00 1,610.00
Utilization and State Value of utilized production
2016 2017 2018
1,000 dollars 1,000 dollars 1,000 dollars Fresh market
California ........................ 34,650 26,552 36,764 Michigan ......................... 13,248 12,635 14,805 New Jersey ..................... (D) (D) (D) Washington .................... (D) (D) (D) Other States 3 ................. 38,201 35,988 35,801
United States .................. 86,099 75,175 87,370
1,000 dollars 1,000 dollars 1,000 dollars Processing
California 1 ...................... - - - Michigan ......................... 12,888 10,640 10,802 New Jersey 2 .................. (D) (D) (D) Washington .................... (D) (D) (D) Other States 3 ................. 1,685 1,769 1,743
United States .................. 14,573 12,409 12,545
(D) Withheld to avoid disclosing data for individual operations. (X) Not applicable. 1 Includes data withheld above. NASS, Crops Branch, (202) 720–2127.

IV–5 AGRICULTURAL STATISTICS 2020
Table 4-5.—Snap Beans for Fresh Market and Processing: Area Harvested, Production, and Value - States and United States, 2017–2019
State Area harvested Total production
2017 2018 2019 2017 2018 2019
Acres Acres Acres 1,000 cwt 1,000 cwt 1,000 cwt
California ............................ 7,600 7,900 7,500 798.0 908.5 712.5 Delaware ............................ 2,200 1,700 (NA) 132.0 102.0 (NA) Florida ................................ 27,500 27,600 26,200 1,595.0 1,575.0 1,755.4 Georgia .............................. 10,600 11,900 10,200 646.6 559.3 612.0 Illinois ................................. 7,500 8,800 11,700 600.0 800.8 865.8 Indiana ............................... 2,400 2,600 (NA) 187.2 187.2 (NA) Maryland ............................ 3,000 3,000 (NA) 222.0 180.0 (NA) Michigan ............................ 17,800 18,200 17,600 1,780.0 1,365.0 1,601.6 Minnesota .......................... 4,700 2,800 3,400 493.5 215.6 323.0 New Jersey ........................ 2,600 2,700 (NA) 101.4 118.8 (NA) New York ........................... 24,000 26,300 30,200 1,752.0 2,104.0 2,144.2 North Carolina ................... 5,000 4,800 (NA) 185.0 216.0 (NA) Oregon ............................... 11,900 11,500 12,200 1,547.0 1,437.5 1,830.0 Pennsylvania ..................... 7,200 7,400 7,200 482.4 436.6 489.6 Tennessee ......................... 6,300 7,100 (NA) 384.3 269.8 (NA) Texas ................................. 6,700 2,800 (NA) 402.0 196.0 (NA) Washington ........................ 2,600 3,200 (NA) 205.4 246.4 (NA) Wisconsin .......................... 62,500 63,500 63,500 6,562.5 6,350.0 6,223.0
United States ..................... 212,100 213,800 189,700 18,076.3 17,073.5 16,557.1
State Utilized production Value of utilized production
2017 2018 2019 2017 2018 2019
1,000 cwt 1,000 cwt 1,000 cwt 1,000 dollars 1,000 dollars 1,000 dollars
California ............................ 796.4 908.5 712.5 55,532 69,008 47,766 Delaware ............................ 132.0 102.0 (NA) 2,522 2,385 (NA) Florida ................................ 1,572.7 1,373.1 1,755.4 81,453 58,702 68,866 Georgia .............................. 646.6 559.3 612.0 20,124 28,025 27,647 Illinois ................................. 600.0 800.8 865.8 3,750 9,294 11,588 Indiana ............................... 187.2 187.2 (NA) 2,893 3,123 (NA) Maryland ............................ 222.0 180.0 (NA) 4,264 3,456 (NA) Michigan ............................ 1,778.2 1,365.0 1,600.0 25,898 21,520 25,611 Minnesota .......................... 488.6 215.4 322.7 3,153 4,714 6,675 New Jersey ........................ 101.4 117.6 (NA) 4,539 5,986 (NA) New York ........................... 1,748.5 2,104.0 2,129.2 35,881 34,023 38,259 North Carolina ................... 184.3 214.3 (NA) 6,704 8,020 (NA) Oregon ............................... 1,547.0 1,437.5 1,830.0 27,429 23,596 26,202 Pennsylvania ..................... 482.4 435.3 489.1 10,220 8,057 8,612 Tennessee ......................... 382.4 265.5 (NA) 12,580 10,544 (NA) Texas ................................. 402.0 196.0 (NA) 3,618 5,723 (NA) Washington ........................ 205.4 246.4 (NA) 8,770 7,856 (NA) Wisconsin .......................... 6,562.5 6,337.3 6,223.0 40,115 47,877 42,254
United States ..................... 18,039.6 17,045.2 16,539.7 349,445 351,909 303,480
(NA) Not available. NASS, Crops Branch, (202) 720–2127.

IV–6 STATISTICS OF VEGETABLES AND MELONS
Table 4-6.—Broccoli, fresh market and processing: Area, yield, production, value per hundredweight and per ton, and total value, United States, 2013-2019 1
Year
Total crop
Area harvested Yield per acre Production Value 2
Per cwt Total
Acres Cwt 1,000 cwt Dollars 1,000 dollars
2013 ...... 131,500 162.0 21,360.0 42.80 913,520 2014 ...... 126,400 163.0 20,600.0 40.00 824,961 2015 ...... 124,400 176.0 21,888.0 48.40 1,058,770 2016 ...... 131,300 171.0 22,466.0 37.70 846,595 2017 ...... 128,600 158.5 20,384.0 45.40 925,716 2018 ...... 113,900 151.7 17,273.0 42.80 738,527 2019 ...... 111,600 156.3 17,439.5 50.00 872,629
Year
Fresh market Processing
Utilized Production
Value 2 Utilized Production
Value 3
Per cwt Total Per ton Total
1,000 cwt Dollars 1,000 dollars Tons Dollars 1,000 dollars
2013 ...... 20,664 .0 43.20 893,336 34,800 580.00 20,184 2014 ...... 19,910 .0 40.70 809,608 34,500 445.00 15,353 2015 ...... 21,104 .0 49.10 1,035,211 39,200 601.00 23,559 2016 ...... 21,548 .0 38.20 824,103 45,903 490.00 22,492 2017 ...... 19,908 .0 46.00 916,482 23,800 388.00 9,234 2018 ...... 16,778 .1 43.10 722,789 24,746 636.00 15,738 2019 ...... 16,641 .9 51.30 853,088 39,880 490.00 19,541
1 Sprouting broccoli only. Does not include broccoli rabe nor heading (cauliflower) broccoli. 2 Price and value at point of first sale. 3 Price and value at processing plant door.
NASS, Crops Branch, (202) 720–2127.
Table 4-7.—Broccoli: Area, production, and value, by State and United States, 2017–2019 1
State Area harvested Utilized production
2017 2018 2019 2017 2018 2019
Acres 1,000 cwt
Arizona ............. 9,600 10,900 11,900 1,344.0 1,308.0 1,478.5 California .......... 119,000 103,000 99,700 19,040.0 15,965.0 15,952.0
United States .... 128,600 113,900 111,600 20,384.0 17,273.0 17,439.5
State Price per cwt Value of utilized production
2017 2018 2019 2017 2018 2019
Dollars 1,000 dollars
Arizona ............. 56.20 45.20 45.20 75,533 59,122 86,275 California .......... 44.70 42.60 42.60 850,183 679,405 786,354
United States .... 45.40 42.80 50.00 925,716 738,527 872,629
Utilization and State
Utilized production Price per unit Value of utilized production
2017 2018 2019 2017 2018 2019 2017 2018 2019
1,000 cwt Dollars per cwt 1,000 dollars
Fresh Market
Arizona ............. 1,344.0 1,308.0 1,478.5 56.20 45.20 58.00 75,533 59,122 86,275 California .......... 18,564.0 15,470.1 15,154.4 45.30 42.90 50.60 840,949 663,667 766,813
United States .... 19,908.0 16,778.1 16,641.9 46.00 43.10 51.30 916,482 722,789 853,088
Tons Dollars per ton 1,000 dollars
Processing
Arizona ............. ................. ................. ................. (X) (X) (X) ................. ................. .................California .......... 23,800 24,746 24,746 388.00 636.00 490.00 9,234 15,738 19,541
United States .... 23,800 24,746 24,746 388.00 636.00 490.00 9,234 15,738 19,541
(X) Not applicable. 1 Sprouting broccoli only. Does not include broccoli rabe nor heading (cauliflower) broccoli. NASS, Crops Branch, (202) 720–2127.

IV–7 AGRICULTURAL STATISTICS 2020
Table 4-8.—Cabbage for fresh market and processing: Area Harvested, production, and value, by State and United States, 2017–2019
State Area harvested Total production
2017 2018 2019 2017 2018 2019
Acres 1,000 cwt
Arizona ............. 3,300 3,300 (D) 1,666.5 1,650.0 (D) California .......... 14,500 14,200 14,500 5,510.0 4,828.0 5,945.0 Florida ............... 8,600 8,900 8,200 3,096.0 3,204.0 2,952.0 Georgia ............. 3,800 2,900 4,800 1,596.0 1,160.0 1,920.0 Michigan ........... 3,900 3,700 4,500 1,326.0 1,295.0 1,530.0 New York .......... 12,700 10,100 11,700 5,270.5 3,939.0 4,446.0 North Carolina .. 2,700 2,800 (NA) 756.0 644.0 (NA) Texas ................ 6,000 5,000 (D) 1,800.0 1,350.0 (D) Wisconsin ......... 5,100 3,300 5,000 2,805.0 1,336.5 1,325.0 Other States ..... - - 10,400 - - 3,588.0
United States .... 60,600 54,200 59,100 23,826.0 19,406.5 21,706.0
State Utilized production Value of utilized production
2017 2018 2019 2017 2018 2019
1,000 cwt 1,000 dollars
Arizona ............. 1,666.5 1,650.0 (D) 29,164 33,495 (D) California .......... 5,510.0 4,828.0 5,945.0 158,625 181,533 212,237 Florida ............... 3,065.0 3,172.0 2,922.5 47,508 62,806 58,394 Georgia ............. 1,596.0 1,160.0 1,887.4 20,583 14,845 30,723 Michigan ........... 1,326.0 1,295.0 1,526.9 14,619 14,327 18,684 New York .......... 5,270.5 3,820.8 4,423.8 74,434 52,862 82,430 North Carolina .. 756.0 606.0 (NA) 11,416 10,120 (NA) Texas ................ 1,800.0 1,350.0 (D) 32,040 27,405 (D) Wisconsin ......... 2,805.0 1,336.5 1,325.0 42,918 10,698 15,598 Other States ..... - - 3,588.0 - - 100,854
United States .... 23,795.0 19,218.3 21,618.6 431,307 408,091 518,920
State Utilized production Price per unit Value of utilized production
2017 2018 2019 2017 2018 2019 2017 2018 2019
1,000 cwt Dollars per cwt 1,000 dollars
Fresh Market Arizona ............. (D) (D) (D) (D) (D) (D) (D) (D) (D) California .......... (D) 4,828.0 (D) (D) 37.60 (D) (D) 181,533 (D) Florida ............... 3,065.0 3,172.0 (D) 15.50 19.80 (D) 47,508 62,806 (D) Georgia ............. (D) (D) (D) (D) (D) (D) (D) (D) (D) Michigan ........... (D) 686.4 608.9 (D) 14.00 19.00 (D) 9,610 11,569 New York .......... 4,653.9 3,663.3 (D) 15.00 14.00 (D) 69,809 51,286 (D) North Carolina .. 756.0 606.0 (NA) 15.10 16.70 (NA) 11,416 10,120 (NA) Texas ................ 1,800.0 1,350.0 (D) 17.80 20.30 (D) 32,040 27,405 (D) Wisconsin ......... (D) (D) (D) (D) (D) (D) (D) (D) (D) Other States 1 ... 9,490.0 2,991.3 18,321.2 24.20 17.90 26.40 229,785 53,572 483,426
United States .... 19,764.9 17,297.0 18,930.1 19.80 22.90 26.10 390,558 396,332 494,995
Tons Dollars per ton 1,000 dollars
Processing Arizona ............. (D) (D) (D) (D) (D) (D) (D) (D) (D) California .......... (D) - (D) (D) (X) (D) (D) - (D) Florida ............... - - (D) (X) (X) (D) - - (D) Georgia ............. (D) (D) (D) (D) (D) (D) (D) (D) (D) Michigan ........... (D) 30,433 45,900 (D) 155.00 155.00 (D) 4,717 7,115 New York .......... 30,832 7,878 (D) 150.00 200.00 (D) 4,625 1,576 (D) North Carolina .. - - (NA) (X) (X) (NA) - - (NA) Texas ................ - - (D) (X) (X) (D) - - (D) Wisconsin ......... (D) (D) (D) (D) (D) (D) (D) (D) (D) Other States 1 ... 170,681 57,761 88,524 212.00 94.60 190.00 36,124 5,466 16,810
United States .... 201,513 96,072 134,424 202.00 122.00 178.00 40,749 11,759 23.925
(D) Withheld to avoid disclosing data for individual operations. (NA) Not available. 1 Includes data withheld above. NASS, Crops Branch, (202) 720–2127.

IV–8 STATISTICS OF VEGETABLES AND MELONS
Table 4-9.—Cantaloupes for fresh market: Area Harvested, production, and value, by State and United States, 2017–2019
State Area harvested Yield per acre
2017 2018 2019 2017 2018 2019
Acres 1,000 cwt
Arizona ............. 15,700 16,300 14,000 225.0 230.0 225.0 California .......... 34,300 31,500 32,800 275.0 265.0 250.0 Florida ............... 2,200 (D) 2,300 260.0 (D) 210.0 Georgia ............. 4,500 (D) 4,000 140.0 (D) 220.0 Indiana .............. 1,500 1,700 (NA) 230.0 225.0 (NA) North Carolina .. 1,200 1,200 (NA) 205.0 255.0 (NA) Pennsylvania .... 950 900 (NA) 145.0 120.0 (NA) South Carolina .. 900 (D) (NA) 310.0 (D) (NA) Texas ................ 2,000 2,000 (NA) 110.0 110.0 (NA) Other States 1 ... - 7,100 - (X) 210.0 (X)
United States .... 63,250 60,700 53,100 243.4 240.6 239.4
State Total production Utilized production
2017 2018 2019 2017 2018 2019
1,000 cwt 1,000 dollars
Arizona ............. 3,532.5 3,749.5 3,150.0 3,532.5 3,749.0 3,150.0 California .......... 9,432.5 8,347.5 8,200.0 9,432.5 8,347.5 8,200.0 Florida ............... 572.0 (D) 483.0 572.0 (D) 481.0 Georgia ............. 630.0 (D) 880.0 630.0 (D) 874.7 Indiana .............. 345.0 382.5 (NA) 345.0 382.5 (NA) North Carolina .. 246.0 306.0 (NA) 246.0 302.9 (NA) Pennsylvania .... 137.8 108.0 (NA) 135.0 106.9 (NA) South Carolina .. 279.0 (D) (NA) 279.0 (D) (NA) Texas ................ 220.0 220.0 (NA) 220.0 220.0 (NA) Other States 1 ... - 1,494.0 - ......................... 1,494.0 -
United States .... 15,394.8 14,607.0 12,713.0 15,392.0 14,602.8 12,705.8
State Price per cwt Value of utilized production
2017 2018 2019 2017 2018 2019
Dollars 1,000 dollars
Arizona ............. 23.90 23.20 25.60 84,427 86,977 80,640 California .......... 16.50 22.50 23.50 155,636 187,819 192,700 Florida ............... 18.00 (D) 17.00 10,296 (D) 8,179 Georgia ............. 24.60 (D) 25.00 15,498 (D) 21,868 Indiana .............. 24.00 22.50 (NA) 8,280 8,606 (NA) North Carolina .. 26.00 15.00 (NA) 6,396 4,544 (NA) Pennsylvania .... 32.90 38.80 (NA) 4,442 4,148 (NA) South Carolina .. 20.50 (D) (NA) 5,720 (D) (NA) Texas ................ 24.00 23.00 (NA) 5,280 5,060 (NA) Other States 1 ... (X) 23.00 (X) - 34,388 -
United States .... 19.20 22.70 23.90 295,975 331,542 303,387
(D) Withheld to avoid disclosing data for individual operations. (NA) Not available. (X) Not applicable. 1 Includes data with-held above.
NASS, Crops Branch, (202) 720–2127.

IV–9 AGRICULTURAL STATISTICS 2020
Table 4-10.—Carrot for fresh market and processing: Area Harvested, production, and value, by State and United States, 2017–2019
State Area harvested Total production
2017 2018 2019 2017 2018 2019
Acres 1,000 cwt
California .......... 58,500 64,300 69,900 21,645.0 38,580.0 43,338.0 Michigan ........... 4,000 4,000 (NA) 1,480.0 1,520.0 (NA) Texas ................ 1,900 1,600 (NA) 456.0 400.0 (NA) Washington ....... 7,000 5,900 6,400 4,900.0 3,658.0 4,864.0 Wisconsin ......... 4,500 4,000 3,300 2,520.0 1,720.0 1,600.5
United States .... 75,900 79,800 79,600 31,001.0 45,878.0 49,802.5
State Utilized production Value of utilized production
2017 2018 2019 2017 2018 2019
1,000 cwt 1,000 dollars
California .......... 21,645.0 38,464.3 43,338.0 635,624 687,631 827,126 Michigan ........... 1,480.0 1,520.0 (NA) 14,948 14,456 (NA) Texas ................ 456.0 400.0 (NA) 4,771 3,785 (NA) Washington ....... 4,900.0 3,658.0 4,864.0 31,966 19,982 29,415 Wisconsin ......... 2,515.0 1,714.8 1,600.5 8,820 7,092 6,977
United States .... 30,996.0 45,757.1 49,802.5 696,129 732,946 863,518
Utilization and State
Utilized production Price per unit Value of utilized production
2017 2018 2019 2017 2018 2019 2017 2018 2019
1,000 cwt Dollars per cwt 1,000 dollars
Fresh Market
California .......... (D) (D) (D) (D) (D) (D) (D) (D) (D) Michigan ........... (D) 410.4 (NA) (D) 19.00 (NA) (D) 7,798 (NA) Texas ................ (D) (D) (NA) (D) (D) (NA) (D) (D) (NA) Washington ....... (D) (D) 170.2 (D) (D) 57.00 (D) (D) 9,701 Wisconsin ......... 2.5 3.4 (D) 110.00 138.00 (D) 278 469 (D) Other States 1 ... 20,854.0 36,201.8 40,305.9 30.10 18.40 19.60 628,564 664,918 790,090
United States .... 20,856.5 36,615.6 40,476.1 30.20 18.40 19.80 628,842 673,185 799,791
Tons Dollars per ton 1,000 dollars
Processing
California .......... (D) (D) (D) (D) (D) (D) (D) (D) (D) Michigan ........... (D) 55,480 (NA) (D) 120.00 (NA) (D) 6,658 (NA) Texas ................ (D) (D) (NA) (D) (D) (NA) (D) (D) (NA) Washington ....... (D) (D) 234,688 (D) (D) 84.00 (D) (D) 19,714 Wisconsin ......... 125,622 85,570 (D) 68.00 77.40 (D) 8,542 6,623 (D) Other States 1 ... 381,351 316,023 231,628 154.00 147.00 190.00 58,745 46,480 44,013
United States .... 506,973 457,073 466,316 133.00 131.00 137.00 67,287 59,761 63,727
(D) Withheld to avoid disclosing data for individual operations. (NA) Not available. 1 Includes data withheld above. NASS, Crops Branch, (202) 720–2127.

IV–10 STATISTICS OF VEGETABLES AND MELONS
Table 4-11.—Cauliflower for fresh market and processing: Area harvested, yield, production, and value, United States, 2010-2019 1
Year Area for harvest Yield per acre Production Value 2
Per cwt. Total 3
Acres 1,000 cwt cwt Dollars 1,000 dollars
2010 .................. 38,460 184 .0 7,087.0 41.70 295,186 2011 .................. 36,430 183 .0 6,649.0 46.00 305,539 2012 .................. 36,070 185 .0 6,690.0 35.80 239,203 2013 .................. 36,830 181 .0 6,662.0 44.30 295,450 2014 .................. 35,070 181 .0 6,361.0 49.80 316,937 2015 .................. 37,210 176 .0 6,559.0 61.30 401,747 2016 .................. 41,900 178 .1 7,461.0 55.70 415,761 2017 .................. 45,800 198 .1 9,074.5 45.90 415,737 2018 .................. 44,900 211 .6 9,501.0 45.80 434,491 2019 .................. 45,500 221 .2 10,063.0 46.30 465,879
Note: Beginning in 2016, acreage and yield estimates for fresh market and processing utilizations were discontinued. Only total acreage and total yield will be published beginning in 2016. Total production and utilized production are estimated for each crop. Harvested not sold estimates were added to the estimating program. This is defined as the difference between total production and total utilized production.
1 Includes heading (cauliflower) broccoli. 2 Price and value at point of first sale. 3 Beginning in 2016, value of utilized production.
NASS, Crops Branch, (202) 720–2127.
Table 4-12.—Cauliflower for fresh market and processing: Area harvested, production, and value, by State and United States, 2017–2019
State Area harvested Total Production
2017 2018 2019 2017 2018 2019
Acres 1,000 cwt
Arizona ............. 5,700 6,100 6,700 1,054.5 1,159.0 1,139.0 California .......... 40,100 38,800 38,800 8,020.0 8,342.0 8,924.0
United States .... 45,800 44,900 45,500 9,074.5 9,501.0 10,063.0
State Utilized production Value of total production
2017 2018 2019 2017 2018 2019
1,000 cwt 1,000 dollars
Arizona ............. 1,054.5 1,159.0 1,139.0 86,153 79,739 99,549 California .......... 7,995.9 8,333.7 8,915.1 329,584 354,752 366,330
United States .... 9,050.4 9,492.7 10,054.1 415,737 434,491 465,879
Utilization and State
Utilized production Price per unit Value of utilized production
2017 2018 2019 2017 2018 2019 2017 2018 2019
1,000 cwt Dollars per cwt 1,000 dollars
Fresh Market
Arizona ............. 1,054.5 (D) (D) 81.70 (D) (D) 86,153 (D) (D) California .......... 7,635.0 (D) (D) 42.00 (D) (D) 320,670 (D) (D) Other States 1 ... - 9,309.1 10,045.2 (X) 46.00 46.30 - 428,563 465,594
United States .... 8,689.5 9,309.1 10,045.2 46.80 46.00 46.30 406,823 428,563 465,594
Tons Dollars per ton 1,000 dollars
Processing
Arizona ............. - (D) (D) (X) (D) (D) - (D) (D) California .......... 18,045 (D) (D) 494.00 (D) (D) 8,914 (D) (D) Other States 1 ... - 9,176 446 (X) 646.00 639.00 - 5,928 285
United States .... 18,045 9,176 446 494.00 646.00 639.00 8,914 5,928 285
(D) Withheld to avoid disclosing data for individual operations. (X) Not applicable. 1 Includes data withheld above. NASS, Crops Branch, (202) 720–2127.

IV–11 AGRICULTURAL STATISTICS 2020
Table 4-13.—Celery for fresh market and processing: Area harvested, yield, production, price, and value, United States, 2012–2019 1
Year Area harvested Yield per acre Production Value 2
Per cwt Total
Acres Cwt 1,000 cwt Dollars 1,000 dollars
2013 ............... 28,800 625 .0 18,003 25.40 457,765 2014 ............... 28,900 636 .0 18,393 17.10 314,134 2015 ............... 27,700 618 .0 17,110 24.80 424,664 2016 ............... 33,100 534 .0 17,676 18.10 319,321 2017 ............... 31,800 505 .9 16,089 20.10 322,047 2018 ............... 30,200 580 .0 17,516 25.00 436,818 2019 ............... 28,100 560 .0 15,736 30.20 474,711
Note: Beginning in 2016, acreage and yield estimates for fresh market and processing utilizations were discontinued. Only total acreage and total yield will be published beginning in 2016. Total production and utilized production are estimated for each crop. Harvested Not Sold estimates were added to the estimating program. This is defined as the difference between total production and total utilized production.
1 Mostly for fresh market use, but includes quantities used for processing. 2 Price and value at point of first sale. NASS, Crops Branch, (202) 720–2127.
Table 4-14.—Celery for fresh market and processing: Area harvested, production, price, and value, by State and United States, 2017–2019
State Area harvested Total Production
2017 2018 2019 2017 2018 2019
Acres 1,000 cwt
California .......... 29,700 28,300 28,100 14,850.0 16,414.0 15,736.0 Michigan ........... 2,100 1,900 (NA) 1,239.0 1,102.0 (NA)
United States .... 31,800 30,200 28,100 16,089.0 17,516.0 15,736.0
State Utilized production Value of total production
2017 2018 2019 2017 2018 2019
1,000 cwt 1,000 dollars
California .......... 14,805.5 16,397.6 15,720.3 305,411 417,347 474,711 Michigan ........... 1,239.0 1,102.0 (NA) 16,636 19,471 (NA)
United States .... 16,044.5 17,499.6 15,720.3 322,047 436,818 474,711
Utilization and State
Utilized production Price per unit Value of utilized production
2017 2018 2019 2017 2018 2019 2017 2018 2019
1,000 cwt Dollars per cwt 1,000 dollars
Fresh Market
California .......... (D) (D) (D) (D) (D) (D) (D) (D) (D) Michigan ........... (D) (D) (NA) (D) (D) (NA) (D) (D) (NA) Other States 1 ... 15,381.8 16,272.7 (D) 20.50 25.90 (D) 315,484 421,967 (D)
United States .... 15,381.8 16,272.7 (D) 20.50 25.90 (D) 315,484 421,967 (D)
Tons Dollars per ton 1,000 dollars
Processing
California .......... (D) (D) (D) (D) (D) (D) (D) (D) (D) Michigan ........... (D) (D) (NA) (D) (D) (NA) (D) (D) (NA) Other States 1 ... 33,136 61,344 (D) 198.00 242.00 (D) 6,563 14,954 (D)
United States .... 33,136 61,344 (D) 198.00 242.00 (D) 6,563 14,954 (D)
(D) Withheld to avoid disclosing data for individual operations. (NA) Not available. 1 Includes data withheld above. NASS, Crops Branch, (202) 720–2127.

IV–12 STATISTICS OF VEGETABLES AND MELONS
Table 4-15.—Sweet corn for fresh market and processing: Area harvested, production, price, and value, by State and United States, 2017–2019
State Area harvested Total Production
2017 2018 2019 2017 2018 2019
Acres 1,000 cwt
California .......... 33,500 33,800 33,600 6,365.0 6,084.0 6,048.0 Delaware .......... 10,800 11,200 (NA) 1,512.0 1,512.0 (NA) Florida ............... 39,000 39,700 41,000 5,460.0 4,764.0 4,715.0 Georgia ............. 25,100 29,000 26,900 4,016.0 4,350.0 3,228.0 Idaho ................. 3,900 3,900 (NA) 429.0 351.0 (NA) Illinois ................ 14,200 14,600 15,500 1,917.0 1,825.0 2,402.5 Indiana .............. 3,900 4,100 (NA) 351.0 389.5 (NA) Maryland ........... 7,100 8,100 (NA) 887.5 972.0 (NA) Michigan ........... 9,100 9,100 (NA) 910.0 837.2 (NA) Minnesota ......... 112,600 110,600 99,100 18,579.0 15,484.0 13,874.0 New Jersey ....... 6,300 6,400 (NA) 611.1 556.8 (NA) New York .......... 25,700 26,600 26,500 3,341.0 2,793.0 3,445.0 Ohio .................. 9,000 9,100 (NA) 810.0 864.5 (NA) Oregon .............. 23,900 28,900 23,700 4,541.0 5,924.5 4,858.5 Pennsylvania .... 11,600 10,600 (NA) 742.4 604.2 (NA) Washington ....... 74,000 72,000 75,000 15,540.0 16,560.0 15,750.0 Wisconsin ......... 54,900 56,400 49,400 9,662.4 9,588.0 8,645.0
United States .... 464,600 474,100 390,700 75,674.4 73,459.7 62,966.0
State Utilized production Value of total production
2017 2018 2019 2017 2018 2019
1,000 cwt 1,000 dollars
California .......... 6,365.0 6,084.0 6,048.0 196,042 175,828 172,368 Delaware .......... 1,512.0 1,512.0 (NA) 19,439 16,633 (NA) Florida ............... 5,460.0 4,764.0 4,696.1 158,340 142,920 140,883 Georgia ............. 3,935.7 4,345.7 3,050.5 98,393 111,684 75,042 Idaho ................. 427.7 347.5 (NA) 11,548 12,163 (NA) Illinois ................ 1,917.0 1,825.0 2,400.1 11,792 13,763 15,532 Indiana .............. 351.0 389.5 (NA) 9,126 8,959 (NA) Maryland ........... 883.1 972.0 (NA) 11,647 13,994 (NA) Michigan ........... 910.0 837.2 (NA) 20,930 19,256 (NA) Minnesota ......... 18,467.5 15,468.5 13,707.5 79,361 81,899 50,431 New Jersey ....... 607.4 542.9 (NA) 18,334 13,868 (NA) New York .......... 3,307.6 2,765.1 3,431.2 31,992 36,257 40,422 Ohio .................. 801.1 864.5 (NA) 20,829 23,342 (NA) Oregon .............. 4,541.0 5,924.5 4,839.1 36,283 44,492 38,103 Pennsylvania .... 737.2 590.9 (NA) 28,488 24,745 (NA) Washington ....... 15,493.4 16,560.0 15,750.0 94,772 84,080 85,806 Wisconsin ......... 9,652.7 9,588.0 8,575.8 44,863 40,181 33,470
United States .... 75,369.4 73,381.3 62,498.3 892,179 864,064 652,057
See footnote(s) at end of table.

IV–13 AGRICULTURAL STATISTICS 2020
Table 4-15.—Sweet corn for fresh market and processing: Area harvested, production, price, and value, by State and United States, 2017–2019—Continued
Utilization and State
Utilized production Price per unit Value of utilized production
2017 2018 2019 2017 2018 2019 2017 2018 2019
1,000 cwt Dollars per cwt 1,000 dollars
Fresh Market
California .......... 6,365.0 6,084.0 6,048.0 30.80 28.90 28.50 196,042 175,828 172,368 Delaware .......... 423.4 362.9 (NA) 31.00 30.00 (NA) 13,125 10,887 (NA) Florida ............... 5,460.0 4,764.0 4,696.1 29.00 30.00 30.00 158,340 142,920 140,883 Georgia ............. 3,935.7 4,345.7 3,050.5 25.00 25.70 24.60 98,393 111,684 75,042 Idaho ................. (D) 347.5 (NA) (D) 35.00 (NA) (D) 12,163 (NA) Illinois ................ 210.9 310.3 235.4 25.90 27.00 31.50 5,462 8,378 7,415 Indiana .............. 351.0 389.5 (NA) 26.00 23.00 (NA) 9,126 8,959 (NA) Maryland ........... 353.2 335.3 (NA) 26.00 33.00 (NA) 9,183 11,065 (NA) Michigan ........... 910.0 837.2 (NA) 23.00 23.00 (NA) 20,930 19,256 (NA) Minnesota ......... 668.8 588.4 263.6 33.50 46.00 24.80 22,405 27,066 6,537 New Jersey ....... 509.7 (D) (NA) 35.00 (D) (NA) 17,840 (D) (NA) New York .......... 795.2 1,027.8 809.6 28.70 28.60 37.30 22,822 29,395 30,198 Ohio .................. 801.1 864.5 (NA) 26.00 27.00 (NA) 20,829 23,342 (NA) Oregon .............. 454.1 521.4 685.0 29.50 27.30 25.00 13,396 14,234 17,125 Pennsylvania .... (D) (D) (NA) (D) (D) (NA) (D) (D) (NA) Washington ....... 808.1 447.1 630.0 35.50 43.90 34.20 28,688 19,628 21,546 Wisconsin ......... 405.8 326.0 354.4 30.80 26.80 21.60 12,499 8,737 7,655 Other States 1 ... 1,161.2 996.8 ................. 34.50 38.00 (X) 40,008 37,910 .................
United States .... 23,613.2 22,548.4 16,772.6 29.20 29.30 28.50 689,088 661,452 478,769
Tons Dollars per ton 1,000 dollars
Processing
California .......... ................. ................. ................. (X) (X) (X) ................. ................. .................Delaware .......... 54,432 57,456 (NA) 116.00 100.00 (NA) 6,314 5,746 (NA) Florida ............... ................. ................. ................. (X) (X) (X) ................. ................. .................Georgia ............. ................. ................. ................. (X) (X) (X) ................. ................. .................Idaho ................. (D) ................. (NA) (D) (X) (NA) (D) ................. (NA) Illinois ................ 85,307 75,738 108,233 74.20 71.10 75.00 6,330 5,385 8,117 Indiana .............. ................. ................. (NA) (X) (X) (NA) ................. ................. (NA) Maryland ........... 26,492 31,833 (NA) 93.00 92.00 (NA) 2,464 2,929 (NA) Michigan ........... ................. ................. (NA) (X) (X) (NA) ................. ................. (NA) Minnesota ......... 889,934 744,006 672,195 64.00 73.70 65.30 56,956 54,833 43,894 New Jersey ....... 4,889 (D) (NA) 101.00 (D) (NA) 494 (D) (NA) New York .......... 125,622 86,862 131,082 73.00 79.00 78.00 9,170 6,862 10,224 Ohio .................. ................. ................. (NA) (X) (X) (NA) ................. ................. (NA) Oregon .............. 204,345 270,157 207,701 112.00 112.00 101.00 22,887 30,258 20,978 Pennsylvania .... (D) (D) (NA) (D) (D) (NA) (D) (D) (NA) Washington ....... 734,265 805,644 756,000 90.00 80.00 85.00 66,084 64,452 64,260 Wisconsin ......... 462,346 463,100 411,070 70.00 67.90 62.80 32,364 31,444 25,815 Other States 1 ... 186 6,850 ................. 151.00 103.00 (X) 28 703 .................
United States .... 2,587,818 2,541,646 2,286,281 78.50 79.70 75.80 203,091 202,612 173,288
(D) Withheld to avoid disclosing data for individual operations. (NA) Not available. (X) Not applicable. 1 Includes data with-held above.
NASS, Crops Branch, (202) 720–2127.

IV–14 STATISTICS OF VEGETABLES AND MELONS
Table 4-16.—Cucumbers for fresh market and processing: Area harvested, production, price, and value, by State and United States, 2017–2019
State Area harvested Total Production
2017 2018 2019 2017 2018 2019
Acres 1,000 cwt
Alabama ........... 5,400 5,900 (NA) 756.0 619.5 (NA) California .......... 8,200 8,100 6,800 1,435.0 1,660.5 1,088.0 Delaware .......... (D) (D) (NA) (D) (D) (NA) Florida ............... 25,900 24,900 23,000 5,309.5 4,233.0 3,450.0 Georgia ............. 9,500 9,400 9,100 1,662.5 1,410.0 1,820.0 Michigan ........... 37,500 34,400 39,600 5,625.0 4,128.0 5,940.0 New Jersey ....... 2,900 2,600 (NA) 464.0 244.4 (NA) North Carolina .. 10,500 9,600 11,400 1,680.0 1,488.0 1,653.0 Ohio .................. 2,000 1,900 (NA) 340.0 294.5 (NA) South Carolina .. (D) (D) (NA) (D) (D) (NA) Texas ................ 6,100 4,900 (D) 610.0 475.3 (D) Wisconsin ......... 5,900 5,100 (D) 737.5 612.0 (D) Other States 1 ... 3,300 4,100 10,900 293.3 285.2 993.7
United States .... 117,200 110,900 100,800 18,912.8 15,450.4 14,944.7
State Utilized production Value of utilized production
2017 2018 2019 2017 2018 2019
1,000 cwt 1,000 dollars
Alabama ........... 756.0 615.2 (NA) 16,659 15,379 (NA) California .......... 1,435.0 1,660.5 1,088.0 35,485 33,781 30,133 Delaware .......... (D) (D) (NA) (D) (D) (NA) Florida ............... 5,309.5 4,233.0 3,443.1 137,601 118,524 89,277 Georgia ............. 1,662.5 1,410.0 1,801.8 43,853 35,212 46,172 Michigan ........... 5,625.0 4,123.9 5,928.1 79,739 55,418 70,560 New Jersey ....... 463.1 240.7 (NA) 16,431 7,028 (NA) North Carolina .. 1,664.9 1,482.0 1,653.0 28,699 25,582 25,478 Ohio .................. 332.2 294.5 (NA) 5,376 4,983 (NA) South Carolina .. (D) (D) (NA) (D) (D) (NA) Texas ................ 610.0 475.3 (D) 11,590 8,746 (D) Wisconsin ......... 736.0 603.4 (D) 11,531 12,913 (D) Other States 1 ... 292.8 282.3 991.6 5,049 5,433 17,174
United States .... 18,887.0 15,420.8 14,905.6 392,013 322,999 278,794
Utilization and State
Utilized production Price per unit Value of utilized production
2017 2018 2019 2017 2018 2019 2017 2018 2019
1,000 cwt Dollars per cwt 1,000 dollars
Fresh Market
Alabama ........... (D) (D) (NA) (D) (D) (NA) (D) (D) (NA) California .......... (D) 513.1 400.4 (D) 45.60 59.20 (D) 23,397 23,704 Delaware .......... (D) (D) (NA) (D) (D) (NA) (D) (D) (NA) Florida ............... 1,391.1 (D) (D) 29.20 (D) (D) 40,620 (D) (D) Georgia ............. (D) (D) (D) (D) (D) (D) (D) (D) (D) Michigan ........... 871.9 1,060.9 1,098.9 27.40 21.20 22.90 23,890 22,491 25,165 New Jersey ....... (D) 240.7 (NA) (D) 29.20 (NA) (D) 7,028 (NA) North Carolina .. 445.2 626.4 271.1 22.00 22.40 16.50 9,794 14,031 4,473 Ohio .................. 72.4 88.4 (NA) 32.10 27.80 (NA) 2,324 2,458 (NA) South Carolina .. (D) (D) (NA) (D) (D) (NA) (D) (D) (NA) Texas ................ 122.0 95.1 (D) 25.00 24.00 (D) 3,050 2,282 (D) Wisconsin ......... (D) (D) (D) (D) (D) (D) (D) (D) (D) Other States 1 ... 2,126.1 2,970.9 2,829.5 32.10 29.80 28.90 68,209 88,433 81,855
United States .... 5,028.7 5,595.5 4,599.9 29.40 28.60 29.40 147,887 160,120 135,197
See footnote(s) at end of table.

IV–15 AGRICULTURAL STATISTICS 2020
Table 4-16.—Cucumbers for fresh market and processing: Area harvested, production, price, and value, by State and United States, 2017–2019—Continued
Utilization and State
Utilized production Price per unit Value of utilized production
2017 2018 2019 2017 2018 2019 2017 2018 2019
Tons Dollars per ton 1,000 dollars
Processing
Alabama ........... (D) (D) (NA) (D) (D) (NA) (D) (D) (NA) California .......... (D) 57,370 34,381 (D) 353.00 187.00 (D) 10,384 6,429 Delaware .......... (D) (D) (NA) (D) (D) (NA) (D) (D) (NA) Florida ............... 195,921 (D) (D) 495.00 (D) (D) 96,981 (D) (D) Georgia ............. (D) (D) (D) (D) (D) (D) (D) (D) (D) Michigan ........... 237,656 153,149 241,461 235.00 215.00 188.00 55,849 32,927 45,395 New Jersey ....... (D) - (NA) (D) (X) (NA) (D) - (NA) North Carolina .. 60,984 42,780 69,095 310.00 270.00 304.00 18,905 11,551 21,005 Ohio .................. 12,988 10,308 (NA) 235.00 245.00 (NA) 3,052 2,525 (NA) South Carolina .. (D) (D) (NA) (D) (D) (NA) (D) (D) (NA) Texas ................ 24,400 19,012 (D) 350.00 340.00 (D) 8,540 6,464 (D) Wisconsin ......... (D) (D) (D) (D) (D) (D) (D) (D) (D) Other States 1 ... 160,961 208,649 170,352 378.00 475.00 415.00 60,799 99,028 70,768
United States .... 692,910 491,268 515,289 313.00 352.00 279.00 244,126 162,879 143,597
(D) Withheld to avoid disclosing data for individual operations. (NA) Not available. (X) Not applicable. 1 Includes data with-held above.
NASS, Crops Branch, (202) 720–2127.
Table 4-17.—Garlic for fresh market and processing: Area harvested, production, price, and value, by State and United States, 2017–2019
State Area harvested Total Production
2017 2018 2019 2017 2018 2019
Acres 1,000 cwt
California .......... 33,000 29,900 27,000 5,115.0 5,232.5 4,185.0
United States .... 33,000 29,900 27,000 5,115.0 5,232.5 4,185.0
State Utilized production Value of utilized production
2017 2018 2019 2017 2018 2019
1,000 cwt 1,000 dollars
California .......... 5,115.0 5,232.5 4,185.0 390,021 412,587 327,277
United States .... 5,115.0 5,232.5 4,185.0 390,021 412,587 327,277
Utilization and State
Utilized production Price per unit Value of utilized production
2017 2018 2019 2017 2018 2019 2017 2018 2019
1,000 cwt Dollars per cwt 1,000 dollars
Fresh Market
California .......... 1,754.4 1,831.4 1,464.8 184.00 190.00 190.00 322,810 347,966 278,312
United States .... 1,754.4 1,831.4 1,464.8 184.00 190.00 190.00 322,810 347,966 278,312
Tons Dollars per ton 1,000 dollars
Processing
California .......... 168,028 170,056 136,013 400.00 380.00 360.00 67,211 64,621 48,965
United States .... 168,028 170,056 136,013 400.00 380.00 360.00 67,211 64,621 48,965
NASS, Crops Branch, (202) 720–2127.

IV–16 STATISTICS OF VEGETABLES AND MELONS
Table 4-18.—Honeydew for fresh market: Area harvested, production, price, and value, by State and United States, 2017–2019
State Area harvested Yield per acre
2017 2018 2019 2017 2018 2019
Acres Cwt
California .......... 11,600 12,400 11,100 290.0 310.0 255.0
United States .... 11,600 12,400 11,100 290.0 310.0 255.0
State Total production Utilized production
2017 2018 2019 2017 2018 2019
1,000 cwt 1,000 cwt
California .......... 3,364.0 3,844.0 2,830.5 3,364.0 3,844.0 2,830.5
United States .... 3,364.0 3,844.0 2,830.5 3,364.0 3,844.0 2,830.5
State Price Value of utilized production
2017 2018 2019 2017 2018 2019
Dollars per cwt 1,000 dollars
California .......... 28.00 19.60 20.90 94,192 75,342 59,157
United States .... 28.00 19.60 20.90 94,192 75,342 59,157
NASS, Crops Branch, (202) 720–2127.
Table 4-19.—Head lettuce for fresh market: Area harvested, production, price, and value, by State and United States, 2017–2019
State Area harvested Yield per acre
2017 2018 2019 2017 2018 2019
Acres Cwt
Arizona ............. 39,200 38,600 37,300 315.0 310.0 335.0 California .......... 101,500 81,700 77,200 365.0 350.0 375.0
United States .... 140,700 120,300 114,500 351.1 337.2 362.0
State Total production Utilized production
2017 2018 2019 2017 2018 2019
1,000 cwt 1,000 cwt
Arizona ............. 12,348.0 11,966.0 12,495.5 12,348.0 11,966.0 12,495.5 California .......... 37,047.5 28,595.0 28,950.0 37,047.5 28,595.0 28,950.0
United States .... 49,395.5 40,561.0 41,445.5 49,395.5 40,561.0 41,445.5
State Price Value of utilized production
2017 2018 2019 2017 2018 2019
Dollars per cwt 1,000 dollars
Arizona ............. 45.90 37.90 86.90 566,773 453,511 1,085,859 California .......... 32.60 26.80 30.20 1,207,749 766,346 874,290
United States .... 35.90 30.10 47.30 1,774,522 1,219,857 1,960,149
NASS, Crops Branch, (202) 720–2127.

IV–17 AGRICULTURAL STATISTICS 2020
Table 4-20.—Leaf lettuce for fresh market: Area harvested, production, price, and value, by State and United States, 2017–2019
State Area harvested Yield per acre
2017 2018 2019 2017 2018 2019
Acres Cwt
Arizona ............. 9,400 9,700 9,800 225.0 240.0 230.0 California .......... 57,800 56,000 47,500 200.0 150.0 215.0
United States .... 67,200 65,700 57,300 203.5 163.3 217.6
State Total production Utilized production
2017 2018 2019 2017 2018 2019
1,000 cwt 1,000 cwt
Arizona ............. 2,115.0 2,328.0 2,254.0 2,115.0 2,328.0 2,254.0 California .......... 11,560.0 8,400.0 10,212.5 11,560.0 8,400.0 10,212.5
United States .... 13,675.0 10,728.0 12,466.5 13,675.0 10,728.0 12,466.5
State Price Value of utilized production
2017 2018 2019 2017 2018 2019
Dollars per cwt 1,000 dollars
Arizona ............. 65.40 44.70 102.70 138,321 104,062 231,711 California .......... 60.10 53.80 41.00 694,756 451,920 418,713
United States .... 60.90 51.80 52.20 833,077 555,982 650,424
NASS, Crops Branch, (202) 720–2127.
Table 4-21.—Romaine lettuce for fresh market: Area harvested, production, price, and value, by State and United States, 2017–2019
State Area harvested Yield per acre
2017 2018 2019 2017 2018 2019
Acres Cwt
Arizona ............. 27,200 26,900 23,900 340.0 330.0 330.0 California .......... 90,200 72,700 64,000 300.0 280.0 305.0
United States .... 117,400 99,600 87,900 309.3 293.5 311.8
State Total production Utilized production
2017 2018 2019 2017 2018 2019
1,000 cwt 1,000 cwt
Arizona ............. 9,248.0 8,877.0 7,887.0 9,248.0 8,877.0 7,887.0 California .......... 27,060.0 20,356.0 19,520.0 27,060.0 20,152.4 19,324.8
United States .... 36,308.0 29,233.0 27,407.0 36,308.0 29,029.4 27,211.8
State Price Value of utilized production
2017 2018 2019 2017 2018 2019
Dollars per cwt 1,000 dollars
Arizona ............. 55.50 37.50 44.30 513,264 332,888 349,394 California .......... 41.20 28.20 27.50 1,114,872 568,298 531,432
United States .... 44.80 31.00 32.40 1,628,136 901,186 880,826
NASS, Crops Branch, (202) 720–2127.

IV–18 STATISTICS OF VEGETABLES AND MELONS
Table 4-22.—Onions for fresh market and processing: Area harvested, production, price, and value, by State and United States, 2017–2019
State Area harvested Total Production
2017 2018 2019 2017 2018 2019
Acres 1,000 cwt
California ................ 44,800 41,000 43,500 21,056.0 18,450.0 18,270.0 Colorado ................. 3,600 2,600 2,500 1,656.0 1,170.0 1,147.5 Georgia ................... 10,800 10,800 9,500 3,780.0 2,808.0 3,040.0 Idaho ....................... 12,500 8,400 10,900 9,062.5 7,476.0 8,938.0 New Mexico ............ 7,100 7,100 6,600 4,828.0 4,189.0 3,993.0 New York ................ 6,900 7,500 7,000 3,036.0 2,250.0 2,240.0 Oregon .................... 24,500 19,300 20,300 16,163.5 15,494.0 14,921.0
Malheur County .. 13,700 11,800 12,500 9,521.5 9,794.0 9,500.0 All other counties 10,800 7,500 7,800 6,642.0 5,700.0 5,421.0
Texas ...................... 11,500 11,000 9,000 2,990.0 3,300.0 3,015.0 Washington ............. 29,800 21,900 19,900 19,817.0 17,301.0 14,328.0
United States .......... 151,500 129,600 129,400 82,389.0 72,438.0 69,892.5
State Utilized production Value of utilized production
2017 2018 2019 2017 2018 2019
1,000 cwt 1,000 dollars
California ................ 21,056.0 18,154.9 18,270.0 291,568 240,220 294,676 Colorado ................. 1,656.0 1,170.0 1,109.6 39,413 27,261 18,531 Georgia ................... 3,685.5 2,794.0 2,973.1 128,301 110,519 144,181 Idaho ....................... 8,962.8 7,461.1 8,893.3 74,192 48,668 65,815 New Mexico ............ 4,828.0 4,189.0 3,993.0 84,490 79,591 102,620 New York ................ 2,620.1 2,196.0 2,047.4 50,682 42,752 36,140 Oregon .................... 16,154.0 15,288.3 14,778.5 138,036 100,339 108,409
Malheur County .. 9,512.0 9,588.3 9,357.5 73,841 60,439 60,292 All other counties 6,642.0 5,700.0 5,421.0 64,195 39,900 48,117
Texas ...................... 2,990.0 3,234.0 2,954.7 73,913 61,380 51,038 Washington ............. 18,608.2 16,436.0 13,625.9 161,495 176,211 180,576
United States .......... 80,560.6 70,923.3 68,645.5 1,042,090 886,941 1,001,986
Utilization and State Utilized production Price per unit Value of utilized production
2017 2018 2019 2017 2018 2019 2017 2018 2019
1,000 cwt Dollars per cwt 1,000 dollars
Fresh Market
California ................ 15,328.8 8,542.4 9,719.6 14.50 19.40 23.50 222,268 165,723 228,411 Colorado ................. 1,656.0 (D) (D) 23.80 (D) (D) 39,413 (D) (D) Georgia ................... (D) (D) (D) (D) (D) (D) (D) (D) (D) Idaho ....................... 7,023.4 5,308.0 (D) 9.10 7.10 (D) 63,913 37,687 (D) New Mexico ............ 4,828.0 4,189.0 3,993.0 17.50 19.00 25.70 84,490 79,591 102,620 New York ................ 2,529.0 (D) 1,953.3 19.50 (D) 17.90 49,316 (D) 34,964 Oregon .................... 9,585.2 (D) 9,195.1 8.69 (D) 6.62 83,323 (D) 60,895
Malheur County .. (D) (D) (D) (D) (D) (D) (D) (D) (D) All other counties (D) (D) (D) (D) (D) (D) (D) (D) (D)
Texas ...................... (D) (D) (D) (D) (D) (D) (D) (D) (D) Washington ............. (D) 11,764.7 (D) (D) 12.00 (D) (D) 141,176 (D) Other States 1 ......... 19,435.6 18,628.8 22,981.9 16.70 16.10 17.80 324,905 300,467 408,978
United States .......... 60,386.0 48,432.9 47,842.9 14.40 15.00 17.50 867,628 724,644 835,868
See footnote(s) at end of table.

IV–19 AGRICULTURAL STATISTICS 2020
Table 4-22.—Onions for fresh market and processing: Area harvested, production, price, and value, by State and United States, 2017–2019—Continued
Utilization and State
Utilized production Price per unit Value of utilized production
2017 2018 2019 2017 2018 2019 2017 2018 2019
Tons Dollars per ton 1,000 dollars
Processing
California ............... 286,362 480,623 427,518 242.00 155.00 155.00 69,300 74,497 66,265 Colorado ............... ................ (D) (D) (X) (D) (D) ................ (D) (D) Georgia ................. (D) (D) (D) (D) (D) (D) (D) (D) (D) Idaho ..................... 96,969 107,654 (D) 106.00 102.00 (D) 10,279 10,981 (D) New Mexico .......... ................ ................ ................ (X) (X) (X) ................ ................ ................New York .............. 4,554 (D) 4,704 300.00 (D) 250.00 1,366 (D) 1,176 Oregon .................. 328,440 (D) 279,171 167.00 (D) 170.00 54,713 (D) 47,514
Malheur County (D) (D) (D) (D) (D) (D) (D) (D) (D) All other counties (D) (D) (D) (D) (D) (D) (D) (D) (D)
Texas .................... (D) (D) (D) (D) (D) (D) (D) (D) (D) Washington ........... (D) 233,564 (D) (D) 150.00 (D) (D) 35,035 (D) Other States 1 ....... 292,404 302,675 328,741 133.00 138.00 156.00 38,804 41,784 51,163
United States ........ 1,008,729 1,124,516 1,040,134 173.00 144.00 160.00 174,462 162,297 166,118
(D) Withheld to avoid disclosing data for individual operations. (X) Not applicable. 1 Includes data withheld above. NASS, Crops Branch, (202) 720–2127.
Table 4-23.—Green Peas for fresh market and processing: Area harvested, production, price, and value, by State and United States, 2017–2019
State Area harvested Total Production
2017 2018 2019 2017 2018 2019
Acres 1,000 cwt
Illinois ................ 5,600 4,000 (NA) 207.2 168.0 (NA) Minnesota ......... 46,000 45,800 51,800 1,932.0 1,328.2 1,450.4 New York .......... 8,900 6,700 (NA) 364.9 247.9 (NA) Oregon .............. 20,000 18,900 17,500 700.0 567.0 595.0 Washington ....... 31,200 32,400 32,300 1,840.8 1,782.0 1,905.7 Wisconsin ......... 22,500 23,300 26,500 967.5 978.6 1,086.5
United States .... 134,200 131,100 128,100 6,012.4 5,071.7 5,037.6
State Utilized production Value of utilized production
2017 2018 2019 2017 2018 2019
1,000 cwt 1,000 dollars
Illinois ................ 207.2 168.0 (NA) 2,223 2,477 (NA) Minnesota ......... 1,932.0 1,326.9 1,447.5 24,651 17,306 19,473 New York .......... 364.9 247.9 (NA) 6,760 3,351 (NA) Oregon .............. 700.0 567.0 595.0 8,706 7,190 6,896 Washington ....... 1,840.8 1,780.2 1,903.8 28,772 22,766 30,157 Wisconsin ......... 967.5 978.6 1,086.5 14,363 11,811 11,272
United States .... 6,012.4 5,068.6 5,032.8 85,475 64,901 67,798
Utilization and State
Utilized production Price per unit Value of utilized production
2017 2018 2019 2017 2018 2019 2017 2018 2019
1,000 cwt Dollars per cwt 1,000 dollars
Fresh Market
Illinois ................ (D) (D) (NA) (D) (D) (NA) (D) (D) (NA) Minnesota ......... 1.9 (D) (D) 73.10 (D) (D) 139 (D) (D) New York .......... 20.1 5.5 (NA) 115.00 89.00 (NA) 2,312 490 (NA) Oregon .............. (D) (D) (D) (D) (D) (D) (D) (D) (D) Washington ....... (D) (D) (D) (D) (D) (D) (D) (D) (D) Wisconsin ......... 12.6 1.0 1.1 329.00 275.00 281.00 4,145 275 309 Other States 1 ... 66.1 3.9 25.0 75.60 173.00 185.00 4,999 675 4,618
United States .... 100.7 10.4 26.1 138.00 115.00 189.00 11,595 1,440 4,927
See footnote(s) at end of table.

IV–20 STATISTICS OF VEGETABLES AND MELONS
Table 4-23.—Green Peas for fresh market and processing: Area harvested, production, price, and value, by State and United States, 2017–2019—Continued
Utilization and State
Utilized production Price per unit Value of utilized production
2017 2018 2019 2017 2018 2019 2017 2018 2019
Tons Dollars per ton 1,000 dollars
Processing
Illinois .................... (D) (D) (NA) (D) (D) (NA) (D) (D) (NA) Minnesota ............. 96,503 (D) (D) 254.00 (D) (D) 24,512 (D) (D) New York .............. 17,242 12,122 (NA) 258.00 236.00 (NA) 4,448 2,861 (NA) Oregon .................. (D) (D) (D) (D) (D) (D) (D) (D) (D) Washington ........... (D) (D) (D) (D) (D) (D) (D) (D) (D) Wisconsin .............. 47,746 48,881 54,271 214.00 236.00 202.00 10,218 11,536 10,963 Other States 1 ....... 134,093 191,913 196,068 259.00 256.00 265.00 34,702 49,064 51,908
United States ........ 295,584 252,916 250,339 250.00 251.00 251.00 73,880 63,461 62,871
(D) Withheld to avoid disclosing data for individual operations. (NA) Not available. 1 Includes data withheld above. NASS, Crops Branch, (202) 720–2127.
Table 4-24.—Bell peppers for fresh market and processing: Area harvested, production, price, and value, by State and United States, 2017–2019
State Area harvested Total Production
2017 2018 2019 2017 2018 2019
Acres 1,000 cwt
California .......... 15,900 13,500 15,000 6,678.0 6,075.0 5,400.0 Florida ............... 12,000 11,900 11,800 4,020.0 3,570.0 3,481.0 Georgia ............. 3,400 3,200 3,600 986.0 848.0 1,116.0 Michigan ........... 2,200 2,000 2,100 561.0 480.0 535.0 New Jersey ....... 3,400 3,400 3,500 952.0 935.0 1,050.0 New York .......... 900 1,400 (NA) 103.5 154.0 (NA) North Carolina .. 2,100 2,000 2,300 567.0 400.0 552.0 Ohio .................. 1,300 1,400 (NA) 292.5 280.0 (NA) Pennsylvania .... 1,000 900 (NA) 230.0 153.0 (NA)
United States .... 42,200 39,700 38,300 14,390.0 12,895.0 12,134.5
State Utilized production Value of utilized production
2017 2018 2019 2017 2018 2019
1,000 cwt 1,000 dollars
California .......... 6,504.4 6,075.0 5,400.0 282,452 210,007 181,400 Florida ............... 4,020.0 3,570.0 3,481.0 188,940 180,642 234,968 Georgia ............. 986.0 848.0 1,104.8 43,581 40,110 54,467 Michigan ........... 561.0 480.0 531.8 15,318 18,220 19,674 New Jersey ....... 951.0 929.4 1,042.7 39,381 39,726 45,854 New York .......... 97.3 154.0 (NA) 5,196 8,455 (NA) North Carolina .. 567.0 376.0 529.9 25,487 15,685 21,297 Ohio .................. 292.5 280.0 (NA) 11,700 12,040 (NA) Pennsylvania .... 213.9 151.8 (NA) 13,522 8,422 (NA)
United States .... 14,193.1 12,864.2 12,090.2 625,577 533,307 557,660
Utilization and State
Utilized production Price per unit Value of utilized production
2017 2018 2019 2017 2018 2019 2017 2018 2019
1,000 cwt Dollars per cwt 1,000 dollars
Fresh Market
California .......... 4,480.9 4,835.7 2,970.0 54.50 39.20 50.40 244,209 189,559 149,688 Florida ............... 4,020.0 3,570.0 3,481.0 47.00 50.60 67.50 188,940 180,642 234,968 Georgia ............. 986.0 848.0 1,104.8 44.20 47.30 49.30 43,581 40,110 54,467 Michigan ........... (D) (D) (D) (D) (D) (D) (D) (D) (D) New Jersey ....... (D) 865.8 924.0 (D) 44.80 47.50 (D) 38,788 43,890 New York .......... 97.3 154.0 (NA) 53.40 54.90 (NA) 5,196 8,455 (NA) North Carolina .. (D) (D) (D) (D) (D) (D) (D) (D) (D) Ohio .................. (D) 280.0 (NA) (D) 43.00 (NA) (D) 12,040 (NA) Pennsylvania .... (D) (D) (NA) (D) (D) (NA) (D) (D) (NA) Other States 1 ... 2,419.7 981.1 1,023.7 42.40 42.30 39.00 102,575 41,468 39,930
United States .... 12,003.9 11,534.6 9,503.5 48.70 44.30 55.00 584,501 511,062 522,943
See footnote(s) at end of table.

IV–21 AGRICULTURAL STATISTICS 2020
Table 4-24.—Bell peppers for fresh market and processing: Area harvested, production, price, and value, by State and United States, 2017–2019—Continued
Utilization and State
Utilized production Price per unit Value of utilized production
2017 2018 2019 2017 2018 2019 2017 2018 2019
Tons Dollars per ton 1,000 dollars
Processing
California ............... 101,172 61,965 121,500 378.00 330.00 261.00 38,243 20,448 31,712 Florida ................... ................ ................ ................ (X) (X) (X) ................ ................ ................Georgia ................. ................ ................ ................ (X) (X) (X) ................ ................ ................Michigan ................ (D) (D) (D) (D) (D) (D) (D) (D) (D) New Jersey ........... (D) 3,179 5,933 (D) 295.00 331.00 (D) 938 1,964 New York .............. ................ ................ (NA) (X) (X) (NA) ................ ................ (NA) North Carolina ....... (D) (D) (D) (D) (D) (D) (D) (D) (D) Ohio ...................... (D) ................ (NA) (D) (X) (NA) (D) ................ (NA) Pennsylvania ......... (D) (D) (NA) (D) (D) (NA) (D) (D) (NA) Other States 1 ....... 8,293 1,336 1,899 342.00 643.00 548.00 2,833 859 1,041
United States ........ 109,465 66,480 129,332 375.00 335.00 268.00 41,076 22,245 34,717
(D) Withheld to avoid disclosing data for individual operations. (NA) Not available. (X) Not applicable. 1 Includes data with-held above.
NASS, Crops Branch, (202) 720–2127.
Table 4-25.—Chili peppers for fresh market and processing: Area harvested, production, price, and value, by State and United States, 2017–2019
State Area harvested Total Production
2017 2018 2019 2017 2018 2019
Acres 1,000 cwt
Arizona ............. 1,200 1,100 (NA) 78.0 66.0 (NA) California .......... 4,800 2,700 1,500 1,872.0 1,039.5 382.5 New Mexico ...... 7,600 7,900 8,700 1,254.0 1,422.0 1,261.5 Texas ................ 2,400 2,500 (NA) 132.0 137.5 (NA)
United States .... 16,000 14,200 10,200 3,336.0 2,665.0 1,644.0
State Utilized production Value of utilized production
2017 2018 2019 2017 2018 2019
1,000 cwt 1,000 dollars
Arizona ............. 78.0 66.0 (NA) 2,039 2,660 (NA) California .......... 1,872.0 1,039.5 382.1 58,874 29,468 13,703 New Mexico ...... 1,254.0 1,422.0 1,261.5 44,553 53,766 50,008 Texas ................ 132.0 137.5 (NA) 8,096 8,873 (NA)
United States .... 3,336.0 2,665.0 1,643.6 113,562 94,767 63,711
Utilization and State
Utilized production Price per unit Value of utilized production
2017 2018 2019 2017 2018 2019 2017 2018 2019
1,000 cwt Dollars per cwt 1,000 dollars
Fresh Market
Arizona .............. (D) (D) (NA) (D) (D) (NA) (D) (D) (NA) California ........... 280.8 187.1 187.0 44.20 43.60 48.50 12,411 8,158 9,070 New Mexico ...... 263.3 270.2 227.1 30.00 37.00 38.00 7,899 9,997 8,630 Texas ................ (D) (D) (NA) (D) (D) (NA) (D) (D) (NA) Other States 1 ... 55.9 94.5 ................ 53.10 64.80 (X) 2,968 6,128 ................
United States .... 600.0 551.8 414.1 38.80 44.00 42.70 23,278 24,283 17,700
Tons Dollars per ton 1,000 dollars
Processing
Arizona .............. (D) (D) (NA) (D) (D) (NA) (D) (D) (NA) California ........... 79,560 42,620 9,754 584.00 500.00 475.00 46,463 21,310 4,633 New Mexico ...... 49,533 57,591 51,722 740.00 760.00 800.00 36,654 43,769 41,378 Texas ................ (D) (D) (NA) (D) (D) (NA) (D) (D) (NA) Other States 1 ... 7,704 5,448 ................ 930.00 992.00 (X) 7,167 5,405 ................
United States .... 136,797 105,659 61,476 660.00 667.00 748.00 90,284 70,484 46,011
(D) Withheld to avoid disclosing data for individual operations. (NA) Not available. (X) Not applicable. 1 Includes data with-held above.
NASS, Crops Branch, (202) 720–2127.

IV–22 STATISTICS OF VEGETABLES AND MELONS
Table 4-26.—Potatoes: Area, yield, production, season average price, and value, United States, 2009–2018
Year Area planted Area harvested
Yield per harvested acre Production
Season average price per cwt received by
farmers
Value of production
1,000 acres 1,000 acres Cwt 1,000 cwt Dollars 1,000 dollars
2009 ........... 1,071.2 1,044.0 414 432,601 8.25 3,557,574 2010 ........... 1,026.7 1,008.9 401 404,549 9.20 3,724,821 2011 ........... 1,100.7 1,078.5 399 430,037 9.41 4,044,869 2012 ........... 1,154.8 1,138.5 408 464,970 8.63 4,017,245 2013 ........... 1,063.9 1,050.9 414 434,652 9.75 4,237,284 2014 ........... 1,062.6 1,051.1 421 442,170 8.88 3,928,211 2015 ........... 1,066.1 1,054.4 418 441,205 8.76 3,865,538 2016 ........... 1,056.7 1,037.7 434 450,324 9.08 4,090,689 2017 ........... 1,052.6 1,044.5 432 450,921 9.17 4,133,073 2018 ........... 1,026.5 1,014.8 443 450,020 8.90 4,006,340
NASS, Crops Branch, (202) 720–2127.
Table 4-27.—Potatoes: Area harvested, yield, and production by seasonal group, by State and United States, 2016–2018
Season and State Area harvested Yield Production
2016 2017 2018 2016 2017 2018 2016 2017 2018
1,000 1,000 1,000 1,000 1,000 1,000 acres acres acres Cwt Cwt Cwt cwt cwt cwt
Spring: California .................. 30.4 33.5 31.0 390 435 395 11,856 14,573 12,245 Florida ...................... 22.9 28.7 20.8 235 250 265 5,382 7,175 5,512
United States ........... 53.3 62.2 51.8 323 350 343 17,238 21,748 17,757
Summer: Illinois ....................... 7.4 8.1 7.6 380 410 375 2,812 3,321 2,850 Kansas ..................... 4.2 4.1 3.3 300 380 430 1,260 1,558 1,419 Maryland .................. (D) 2.5 2.0 (D) 365 255 (D) 913 510 Missouri ................... 7.9 8.5 7.4 305 285 225 2,410 2,423 1,665 New Jersey .............. (D) 2.0 2.0 (D) 300 265 (D) 600 530 North Carolina ......... 13.6 15.1 12.2 220) 230 190 2,992 3,473 2,318 Texas ....................... 21.0 22.8 17.5 395 390 425 8,295 8,892 7,438 Virginia ..................... 4.1 4.5 4.4 290 265 235 1,189 1,193 1,034 Other States 1 .......... 4.6 .............. .............. 313 ............ ............ 1,440 ................ ................
United States ........... 62.8 67.6 56.4 325 331 315 20,398 22,373 17,764
Fall: Alaska 2 .................... (X) (X) 0.5 (X) (X) 280 (X) (X) 140 California .................. 7.9 8.2 7.3 445 405 440 3,516 3,321 3,212 Colorado .................. 57.1 55.6 55.0 389 382 395 22,236 21,220 21,722
San Luis Valley ... 51.5 51.5 51.6 385 375 390 19,828 19,313 20,124 All other areas .... 5.6 4.1 3.4 430 465 470 2,408 1,907 1,598
Idaho ........................ 324.0 310.0 315.0 430 435 450 139,320 134,850 141,750 Maine ....................... 46.5 47.5 48.5 325 320 310 15,113 15,200 15,035 Michigan .................. 47.0 49.5 48.0 370 370 380 17,390 18,315 18,240 Minnesota ................ 43.0 45.5 43.5 400 405 430 17,200 18,428 18,705 Montana ................... 11.0 11.1 11.1 335 340 350 3,685 3,774 3,885 Nebraska ................. 16.4 19.0 19.3 450 475 480 7,380 9,025 9,264 New York ................. 14.8 14.4 13.4 240 280 290 3,552 4,032 3,886 North Dakota ........... 72.0 74.0 73.0 300 330 325 21,600 24,420 23,725 Oregon ..................... 44.9 45.9 45.0 590 550 600 26,491 25,245 27,000 Washington .............. 169.0 164.0 160.0 625 605 630 105,625 99,220 100,800 Wisconsin ................ 68.0 70.0 67.0 435 425 405 29,580 29,750 27,135
United States 3 ......... 921.6 914.7 906.6 448 445 457 412,688 406,800 414,499
All Potatoes: United States 3 ......... 1,037.7 1,044.5 1,014.8 434 432 443 450,324 450,921 450,020
(D) Withheld to avoid disclosing data for individual operations. (X) Not applicable. 1 Includes data withheld above. 2 Previously included in Alaska table. 3 Beginning in 2018, United States total includes data for Alaska.
NASS, Crops Branch, (202) 720–2127.

IV–23 AGRICULTURAL STATISTICS 2020
Table 4-28.—Fall potatoes: Stocks held by growers, local dealers, and processors 1 - 13 Fall States: 2017 and 2018 1
State Current year Following year
Dec. 1, 2017 Feb. 1, 2018 Apr. 1, 2018 June 1, 2018
1,000 cwt
California ........................................ 2,600 1,800 1,100 (D) Colorado ........................................ 15,300 11,400 7,200 2,800 Idaho .............................................. 96,000 75,000 52,000 27,000 Maine ............................................. 11,500 8,500 5,000 1,700 Michigan ......................................... 11,000 6,900 3,800 (D) Minnesota ...................................... 13,600 10,400 7,200 3,900 Montana ......................................... 3,500 3,400 2,800 240 Nebraska ........................................ 5,400 3,900 2,100 (D) New York ....................................... 2,300 1,300 800 300 North Dakota .................................. 20,600 15,300 9,600 4,000 Oregon ........................................... 19,800 13,300 8,300 3,500 Washington .................................... 57,000 45,000 29,000 13,000 Wisconsin ....................................... 19,300 14,400 9,900 5,300 Other States 2 ................................ ................................ ................................ ................................ 2,000
United States ................................. 277,900 210,600 138,800 63,740
Klamath Basin 3 ............................. 5,000 3,300 1,800 (D)
State Current year Following year
Dec. 1, 2018 Feb. 1, 2019 Apr. 1, 2019 June 1, 2019
1,000 cwt
California ........................................ 2,200 (D) 900 (D) Colorado ........................................ 15,600 11,600 7,600 3,000 Idaho .............................................. 101,000 79,000 57,000 34,000 Maine ............................................. 10,900 7,800 4,700 1,500 Michigan ......................................... 10,500 6,700 3,400 300 Minnesota ...................................... 12,800 9,700 6,700 4,200 Montana ......................................... 3,700 3,600 3,100 70 Nebraska ........................................ 5,000 3,700 2,300 (D) New York ....................................... 2,000 (D) 800 400 North Dakota .................................. 17,000 11,700 6,900 2,800 Oregon ........................................... 21,100 14,500 9,800 3,900 Washington .................................... 57,500 46,000 29,500 14,800 Wisconsin ....................................... 20,000 15,700 12,000 4,700 Other States 2 ................................ ................................ 2,800 ................................ 700
United States ................................. 279,300 212,800 144,700 70,370
Klamath Basin 3 ............................. 5,100 (D) 1,700 (D)
(D) Withheld to avoid disclosing data for individual operations. 1 Stocks are defined as the quantity (whether sold or not) remaining in storage for all purposes and uses, including seed potatoes that are not yet moved, and shrinkage, waste, and other losses that occur after the date of each estimate. 2 Includes data withheld above. 3 Includes potato stocks in Cali-fornia and Klamath County, Oregon.
NASS, Crops Branch, (202) 720–2127.
Table 4-29.—Fall potatoes: Production and total stocks held by growers and local dealers, 13 Major States, 2009–2018
Crop year Production
Total stocks
Dec. 1 Following year
Feb. 1 Apr. 1 June 1
1,000 cwt 1,000 cwt 1,000 cwt 1,000 cwt 1,000 cwt 2009 ............ 383,962 265,800 203,500 128,700 55,120 2010 ............ 357,467 240,200 180,300 111,000 41,320 2011 ............ 382,318 253,000 187,500 115,650 43,340 2012 ............ 410,367 271,500 204,600 (NA) (NA) 2013 ............ 386,824 (NA) (NA) 119,050 46,885 2014 ............ 396,798 265,700 200,800 128,700 56,335 2015 ............ 404,701 262,700 198,100 125,700 51,280 2016 ............ 450,324 275,800 213,000 142,600 67,570 2017 ............ 450,921 277,900 210,600 138,800 63,740 2018 ............ 450,020 279,300 212,800 144,700 70,370
(NA) Not available. NASS, Crops Branch, (202) 720–2127.

IV–24 STATISTICS OF VEGETABLES AND MELONS
Table 4-30.—Potatoes: Production, seed used, and disposition, United States, 2009–2018
Year Production Total used for seed
Used on farms where produced
Sold For seed, feed, and household use Shrinkage and loss
1,000 cwt
2009 ........... 432,601 24,027 4,535 29,135 398,931 2010 ........... 404,549 25,100 4,227 24,996 375,326 2011 ........... 430,037 26,527 4,146 27,789 398,102 2012 ........... 464,970 25,656 4,850 28,505 431,615 2013 ........... 434,652 25,249 4,323 26,211 404,118 2014 ........... 442,170 26,259 4,192 26,762 411,216 2015 ........... 441,205 25,715 4,631 26,509 410,065 2016 ........... 450,324 26,167 4,437 26,883 419,004 2017 ........... 450,921 24,673 4,410 25,139 421,372 2018 ........... 450,020 24,973 4,047 25,526 420,447
NASS, Crops Branch, (202) 720–2127.
Table 4-31.—Potatoes: Utilization and processing, Program States, 2017 and 2018
Utilization items 2017 2018
1,000 cwt 1,000 cwt
Sales Table stock ............................................................................................. 109,824 106,462
Processing ............................................................................................. 284,411 289,209
Other sales Livestock feed .................................................................................... 1,913 697 Seed ................................................................................................... 25,224 24,079 Other Sales Total ............................................................................... 27,137 24,776
Total sales .......................................................................................... 421,372 420,447
Non-sales Seed used on farms where grown ..................................................... 3,526 3,491 Household use and used for feed on farms where grown ................ 884 556 Shrinkage and loss ............................................................................. 25,139 25,526
Total non-sales ................................................................................... 29,549 29,573
Total production .................................................................................. 450,921 450,020
Processing - United States 2016 2017
1,000 cwt 1,000 cwt
Processing Chips and shoestring ......................................................................... 58,751 62,700 All Dehydrated (including starch and flour) ........................................ 45,761 49,066 Frozen french fries ............................................................................. 155,798 162,640 Other frozen products ........................................................................ 13,803 15,956 Canned potatoes ................................................................................ 1,152 1,113 Other canned products (hash, stews, soups) .................................... 703 758 Other (including fresh pack, potato salad, vodka, etc) ...................... 6,160 5,550
Total .................................................................................................... 282,128 297,783
NASS, Crops Branch, (202) 720–2127.

IV–25 AGRICULTURAL STATISTICS 2020
Table 4-32.—Potatoes: Production, seed use, and farm disposition, by seasonal groups, by States and United States, 2017 crop 1
Season and State Production Total used for seed
Used on farms where produced
Sold For seed, feed, and household
use
Shrinkage and loss
1,000 cwt
Spring California .................... 14,573 776 227 291 14,055 Florida ........................ 7,175 684 17 145 7,013
United States ............. 21,748 1,460 244 436 21,068
Summer Illinois ......................... 3,321 127 .............................. 33 3,288 Kansas ....................... 1,558 114 .............................. .............................. 1,558 Maryland .................... 913 (D) (D) (D) (D) Missouri ...................... 2,423 183 .............................. .............................. 2,423 New Jersey ................ 600 (D) (D) (D) (D) North Carolina ............ 3,473 294 1 1 3,471 Texas ......................... 8,892 420 22 .............................. 8,870 Virginia ....................... 1,193 93 .............................. 4 1,189 Other States 2 ............. .............................. 84 1 1 1,511
United States ............. 22,373 1,315 24 39 22,310
Fall California .................... 3,321 203 .............................. 13 3,308 Colorado ..................... 21,220 1,383 981 1,550 18,689 Idaho .......................... 134,850 7,529 808 8,300 125,742 Maine ......................... 15,200 1,092 221 879 14,100 Michigan ..................... 18,315 1,344 379 623 17,313 Minnesota ................... 18,428 880 86 1,071 17,271 Montana ..................... 3,774 264 275 189 3,310 Nebraska .................... 9,025 546 259 640 8,126 New York ................... 4,032 375 56 236 3,740 North Dakota .............. 24,420 1,517 200 1,500 22,720 Oregon ....................... 25,245 882 271 1,575 23,399 Washington ................ 99,220 4,208 263 6,040 92,917 Wisconsin ................... 29,750 1,675 343 2,048 27,359
United States ............. 406,800 21,898 4,142 24,664 377,994
All potatoes United States ............. 450,921 24,673 4,4104 25,139 421,372
(D) Withheld to avoid disclosing data for individual operations. 1 Totals may not add due to rounding. 2 Includes data withheld above.
NASS, Crops Branch, (202) 720–2127.

IV–26 STATISTICS OF VEGETABLES AND MELONS
Table 4-33.—Potatoes: Production, seed use, and farm disposition, by seasonal groups, by States and United States, 2018 crop 1
Season and State Production Total used for seed
Used on farms where produced
Sold For seed, feed, and household use Shrinkage and loss
1,000 cwt
Spring California .................. 12,245 748 4 495 11,746 Florida 5,512 564 1 82 5,429
United States ........... 17,757 1,312 5 577 17,175
Summer Illinois ....................... 2,850 214 .................................. 20 2,830 Kansas ..................... 1,419 92 .................................. .................................. 1,419 Maryland .................. 510 48 1 1 508 Missouri .................... 1,665 163 .................................. 210 1,455 New Jersey .............. 530 33 .................................. 1 529 North Carolina .......... 2,318 391 .................................. .................................. 2,318 Texas ....................... 7,438 401 28 25 7,385 Virginia ..................... 1,034 119 .................................. .................................. 1,034
United States ........... 17,764 1,461 29 257 17,478
Fall California .................. 3,212 195 .................................. 62 3,150 Colorado ................... 21,722 1,350 945 1,616 19,161 Idaho ........................ 141,750 7,592 795 8,700 132,255 Maine ....................... 15,035 1,100 252 783 14,000 Michigan ................... 18,240 1,400 373 680 17,187 Minnesota ................. 18,705 738 67 1,028 17,610 Montana ................... 3,885 289 202 190 3,493 Nebraska .................. 9,264 566 217 825 8,222 New York ................. 3,886 343 45 181 3,660 North Dakota ............ 23,725 1,548 150 2,000 21,575 Oregon ..................... 27,000 1,148 341 1,680 24,979 Washington .............. 100,800 4,241 258 5,800 94,742 Wisconsin ................. 27,135 1,680 344 1,136 25,655
United States ........... 414,499 22,200 4,013 24,692 385,794
All potatoes United States ........... 450,020 24,973 4,047 25,526 420,447
1 United States and totals may not add due to rounding. NASS, Crops Branch, (202) 720–2127.

IV–27 AGRICULTURAL STATISTICS 2020
Table 4-34.—Potatoes, fresh & seed: United States exports by country of destination and imports by country of origin, 2017–2019
Country 2017 2018 2019
Metric tons
Imports Canada .................................... 501,679 486,399 412,260 Colombia ................................. 50 40 35 Ghana ...................................... 9 0 23 China ....................................... 0 4 15 Ecuador ................................... 30 32 14 Togo ........................................ 0 0 4 Peru ......................................... 1 3 1 Costa Rica ............................... 0 3 0 Netherlands ............................. 24 0 0
World Total .............................. 501,794 486,481 412,351
Exports Canada .................................... 265,211 207,226 278,047 Mexico ..................................... 93,206 113,027 100,529 Japan ....................................... 39,876 33,914 32,348 Taiwan ..................................... 42,883 30,443 32,172 Philippines ............................... 22,271 12,090 20,150 Korea, South ........................... 20,974 22,639 14,229 Malaysia .................................. 12,355 9,725 13,769 Dominican Republic ................ 6,230 8,207 8,609 Honduras ................................. 10,175 10,227 8,604 Thailand ................................... 3,057 5,630 7,447 Singapore ................................ 5,489 4,892 5,116 Hong Kong .............................. 3,648 3,346 4,293 Guatemala ............................... 3,032 2,411 3,892 Bahamas, The ......................... 1,531 1,495 2,316 Costa Rica ............................... 1,270 1,021 2,198 Vietnam ................................... 221 1,557 1,527 Leeward-Windward Islands(*) 1,212 1,741 1,459 Panama ................................... 3,139 2,981 1,398 Cayman Islands ...................... 743 968 968 Nicaragua ................................ 809 963 781 French Pacific Islands(*) ......... 262 449 757 Trinidad and Tobago ............... 807 601 733 United Arab Emirates .............. 558 653 633 El Salvador .............................. 618 406 593 Netherlands Antilles(*) ............ 285 389 517 Turks and Caicos Islands ....... 171 275 475 Kuwait ...................................... 81 70 361 Barbados ................................. 196 185 298 Chile ........................................ 142 183 290 Bermuda .................................. 262 302 274 Rest of World .......................... 5,614 3,040 1,432
World Total .............................. 546,324 481,056 546,210
(*) Denotes a country that is a summarization of its component countries. FAS, Office of Global Analysis, (202) 720-6301.
Table 4-35.—Potatoes (fresh market): Foreign trade, United States, 2009–2018 1
Year beginning July Imports for consumption Domestic exports
1,000 cwt. 1,000 cwt.
2009/2010 .......................................................................... 9,050 8,183 2010/2011 .......................................................................... 10,384 9,294 2011/2012 .......................................................................... 9,041 9,348 2012/2013 .......................................................................... 7,375 10,467 2013/2014 .......................................................................... 10,833 10,001 2014/2015 .......................................................................... 8,514 9,369 2015/2016 .......................................................................... 10,103 10,135 2016/2017 .......................................................................... 11,265 11,306 2017/2018 .......................................................................... 10,852 10,865 2018/2019 .......................................................................... .................................................. ..................................................
1 Includes seed. ERS, (202) 694–5253. Based on data from U.S. Department of Commerce, U.S. Census Bureau.

IV–28 STATISTICS OF VEGETABLES AND MELONS
Table 4-36.—Pumpkins for fresh market and processing: Area harvested, production, price, and value, by State and United States, 2017–2019 1
State Area harvested Total Production
2017 2018 2019 2017 2018 2019
Acres 1,000 cwt
California .......... 4,400 4,900 4,700 1,452.0 1,347.5 1,198.5 Illinois ................ 17,400 11,000 10,900 6,438.0 5,170.0 4,196.5 Indiana .............. 6,000 5,500 5,000 960.0 1,265.0 1,225.0 Michigan ........... 4,900 5,400 5,400 759.5 1,026.0 810.0 Minnesota ......... 1,800 1,400 (NA) 162.0 427.0 (NA) New Jersey ....... 2,100 1,700 (NA) 199.5 110.5 (NA) New York .......... 5,600 5,700 5,700 588.0 467.4 410.4 North Carolina .. 2,700 2,300 3,100 567.0 253.0 713.0 Ohio .................. 3,500 3,700 3,500 595.0 666.0 437.5 Oregon .............. 2,500 2,500 1,900 450.0 675.0 598.5 Pennsylvania .... 6,900 5,700 6,300 1,138.5 655.5 661.5 Tennessee ........ 1,400 1,600 (NA) 124.6 116.8 (NA) Texas ................ 4,500 4,900 (D) 877.5 1,617.0 (D) Virginia .............. 3,200 5,200 5,600 720.0 1,066.0 924.0 Washington ....... 2,600 2,400 2,600 468.0 300.0 442.0 Wisconsin ......... 2,800 3,700 (D) 420.0 244.2 (D) Other States ..... ......................... ......................... 6,500 ......................... ......................... 1,834.0
United States .... 72,300 67,600 61,200 15,919.6 15,406.9 13,450.9
State Utilized production Value of utilized production
2017 2018 2019 2017 2018 2019
1,000 cwt 1,000 dollars
California .......... 1,450.5 1,339.4 1,191.3 20,742 27,592 22,754 Illinois ................ 6,302.8 5,139.0 4,192.3 24,421 13,751 17,085 Indiana .............. 959.0 1,252.4 1,221.3 18,457 16,971 16,982 Michigan ........... 758.0 1,010.6 806.8 8,314 14,947 12,909 Minnesota ......... 139.3 419.3 (NA) 3,691 12,369 (NA) New Jersey ....... 198.1 108.8 (NA) 6,101 4,178 (NA) New York .......... 570.4 435.1 380.4 11,123 8,037 8,635 North Carolina .. 560.8 250.5 703.0 10,437 6,609 10,991 Ohio .................. 586.7 652.0 434.4 7,968 11,024 9,911 Oregon .............. 427.5 645.3 568.6 6,514 9,781 5,147 Pennsylvania .... 1,110.0 620.8 646.9 19,503 13,852 16,777 Tennessee ........ 111.6 103.4 (NA) 2,132 2,264 (NA) Texas ................ 864.3 1,615.4 (D) 23,163 24,069 (D) Virginia .............. 718.6 1,024.4 903.7 10,348 15,366 16,427 Washington ....... 446.5 296.1 399.6 12,604 11,844 15,544 Wisconsin ......... 396.5 214.7 (D) 11,023 2,791 (D) Other States ..... ......................... ......................... 1,772.8 ......................... ......................... 27,028
United States .... 15,600.6 15,127.2 13,221.1 196,541 195,445 180,190
See footnote(s) at end of table.

IV–29 AGRICULTURAL STATISTICS 2020
Table 4-36.—Pumpkins for fresh market: Area harvested, production, price, and value, by State and United States, 2017–2019 1—Continued
Utilization and State
Utilized production Price per unit Value of utilized production
2017 2018 2019 2017 2018 2019 2017 2018 2019
1,000 cwt Dollars per cwt 1,000 dollars
Fresh Market
California ........... 1,450.5 1,339.4 1,191.3 14.30 20.60 19.10 20,742 27,592 22,754 Illinois ................ (D) 325.7 537.2 (D) 16.80 18.40 (D) 5,472 9,884 Indiana .............. (D) (D) (D) (D) (D) (D) (D) (D) (D) Michigan ........... (D) (D) 806.8 (D) (D) 16.00 (D) (D) 12,909 Minnesota ......... 139.3 419.3 (NA) 26.50 29.50 (NA) 3,691 12,369 (NA) New Jersey ....... 198.1 108.8 (NA) 30.80 38.40 (NA) 6,101 4,178 (NA) New York .......... 570.4 (D) 380.4 19.50 (D) 22.70 11,123 (D) 8,635 North Carolina .. (D) (D) (D) (D) (D) (D) (D) (D) (D) Ohio .................. (D) (D) (D) (D) (D) (D) (D) (D) (D) Oregon .............. (D) 276.1 139.5 (D) 25.80 20.90 (D) 7,123 2,916 Pennsylvania .... (D) (D) (D) (D) (D) (D) (D) (D) (D) Tennessee ........ 111.6 103.4 (NA) 19.10 21.90 (NA) 2,132 2,264 (NA) Texas ................ 864.3 1,615.4 (D) 26.80 14.90 (D) 23,163 24,069 (D) Virginia .............. 718.6 1,024.4 (D) 14.40 15.00 (D) 10,348 15,366 (D) Washington ....... (D) 296.1 399.6 (D) 40.00 38.90 (D) 11,844 15,544 Wisconsin ......... 396.5 214.7 (D) 27.80 13.00 (D) 11,023 2,791 (D) Other States 1 ... 5,234.5 4,154.9 5,615.7 18.10 17.00 17.30 94,540 70,771 97,424
United States .... 9,683.8 9,878.2 9,070.5 18.90 18.60 18.70 182,863 183,839 170,066
Tons Dollars per ton 1,000 dollars
Processing
California ........... ................ ................ ................ (X) (X) (X) ................ ................ ................Illinois ................ (D) 240,664 182,758 (D) 34.40 39.40 (D) 8,279 7,201 Indiana .............. (D) (D) (D) (D) (D) (D) (D) (D) (D) Michigan ........... (D) (D) ................ (D) (D) (X) (D) (D) ................Minnesota ......... ................ ................ (NA) (X) (X) (NA) ................ ................ (NA) New Jersey ....... ................ ................ (NA) (X) (X) (NA) ................ ................ (NA) New York .......... ................ (D) ................ (X) (D) (X) ................ (D) ................North Carolina .. (D) (D) (D) (D) (D) (D) (D) (D) (D) Ohio .................. (D) (D) (D) (D) (D) (D) (D) (D) (D) Oregon .............. (D) 18,461 21,456 (D) 144.00 104.00 (D) 2,658 2,231 Pennsylvania .... (D) (D) (D) (D) (D) (D) (D) (D) (D) Tennessee ........ ................ ................ (NA) (X) (X) (NA) ................ ................ (NA) Texas ................ ................ ................ (D) (X) (X) (D) ................ ................ (D) Virginia .............. ................ ................ (D) (X) (X) (D) ................ ................ (D) Washington ....... (D) ................ ................ (D) (X) (X) (D) ................ ................Wisconsin ......... ................ ................ (D) (X) (X) (D) ................ ................ (D) Other States 1 ... 295,841 3,325 3,324 46.20 201.00 208.00 13,678 669 692
United States .... 295,841 262,450 207,538 46.20 44.20 48.80 13,678 11,606 10,124
(D) Withheld to avoid disclosing data for individual operations. (NA) Not available. (X) Not applicable. 1 Includes data with-held above.
NASS, Crops Branch, (202) 720–2127.

IV–30 STATISTICS OF VEGETABLES AND MELONS
Table 4-37.—Spinach for fresh market and processing: Area Harvested, production, price, and value, by State and United States, 2017–2019
State Area harvested Utilized production
2017 2018 2019 2017 2018 2019
Acres 1,000 cwt
Arizona ............. 12,200 11,100 (D) 1,830.0 1,887.0 (D) California .......... 46,400 44,200 50,100 5,104.0 5,525.0 7,014.0 Colorado ........... (D) (D) (NA) (D) (D) (NA) Maryland ........... (D) (D) (NA) (D) (D) (NA) New Jersey ....... 2,100 2,000 1,900 315.0 230.0 228.0 Texas ................ 2,800 2,800 (D) 672.0 322.0 (D) Other States 1 ... 1,230 1,350 13,800 169.6 138.5 2,364.0
United States .... 64,730 61,450 65,800 8,090.6 8,102.5 9,606.0
State Price per cwt Value of utilized production
2017 2018 2019 2017 2018 2019
Dollars 1,000 dollars
Arizona ............. 53.30 44.40 (D) 97,539 83,783 (D) California .......... 67.20 57.30 55.40 342,809 316,699 388,741 Colorado ........... (D) (D) (NA) (D) (D) (NA) Maryland ........... (D) (D) (NA) (D) (D) (NA) New Jersey ....... 28.70 22.70 29.20 9,039 5,230 6,658 Texas ................ 28.80 19.10 (D) 19,369 6,138 (D) Other States 1 ... 12.40 27.60 55.60 2,104 3,821 131,371
United States .... 58.20 49.90 54.80 470,860 415,671 526,770
State Utilized production Price per unit Value of utilized production
2017 2018 2019 2017 2018 2019 2017 2018 2019
1,000 cwt Dollars per cwt 1,000 dollars
Fresh Market Arizona ............. 1,830.0 1,887.0 (D) 53.30 44.40 (D) 97,539 83,783 (D) California .......... (D) (D) 6,284.5 (D) (D) 60.00 (D) (D) 377,070 Colorado ........... (D) (D) (NA) (D) (D) (NA) (D) (D) (NA) Maryland ........... (D) (D) (NA) (D) (D) (NA) (D) (D) (NA) New Jersey ....... (D) (D) (D) (D) (D) (D) (D) (D) (D) Texas ................ 463.7 132.0 (D) 39.30 38.80 (D) 18,223 5,122 (D) Other States 1 ... 4,339.9 4,724.4 2,420.4 78.50 66.10 56.60 340,801 312,356 137,111
United States .... 6,633.6 6,743.4 8,704.9 68.80 59.50 59.10 456,563 401,261 514,181
Tons Dollars per ton 1,000 dollars
Processing Arizona ............. ................. ................. (D) (X) (X) (X) ................. ................. (D) California .......... (D) (D) 36,473 (D) (D) 320.00 (D) (D) 11,671 Colorado ........... (D) (D) (NA) (D) (D) (NA) (D) (D) (NA) Maryland ........... (D) (D) (NA) (D) (D) (NA) (D) (D) (NA) New Jersey ....... (D) (D) (D) (D) (D) (D) (D) (D) (D) Texas ................ 10,416 9,499 (D) 110.00 107.00 (D) 1,146 1,016 (D) Other States 1 ... 62,434 58,457 8,580 211.00 229.00 107.00 13,151 13,394 918
United States .... 72,850 67,956 45,053 196.00 212.00 279.00 14,297 14,410 12,589
(D) Withheld to avoid disclosing data for individual operations. (NA) Not available. (X) Not applicable. 1 Includes data with-held above.
NASS, Crops Branch, (202) 720–2127.

IV–31 AGRICULTURAL STATISTICS 2020
Table 4-38.—Squash for fresh market and processing: Area Harvested, production, price, and value, by State and United States, 2017–2019
State Area harvested Total production
2017 2018 2019 2017 2018 2019
Acres 1,000 cwt
California .......... 7,700 6,700 7,300 1,309.0 1,038.5 1,460.0 Florida ............... 7,500 (D) 7,700 975.0 (D) 808.5 Georgia ............. 3,300 (D) 3,700 511.5 (D) 444.0 Michigan ........... 9,200 8,700 8,600 2,116.0 1,914.0 1,720.0 New Jersey ....... 3,300 3,500 3,200 363.0 325.5 288.0 New York .......... 5,400 4,900 5,200 810.0 808.5 728.0 North Carolina .. 2,800 3,500 4,400 271.6 612.5 572.0 Oregon .............. 5,000 4,300 3,400 1,500.0 1,333.0 1,105.0 Texas ................ 1,700 1,500 (NA) 153.0 88.5 (NA) Other States 1 ... ......................... 11,700 ......................... ......................... 1,272.0 .........................
United States .... 45,900 44,800 43,500 8,009.1 7,392.5 7,125.5
State Utilized production Value of utilized production
2017 2018 2019 2017 2018 2019
1,000 cwt 1,000 dollars
California .......... 1,288.1 968.9 1,455.6 45,022 30,973 58,339 Florida ............... 970.1 (D) 808.5 39,095 (D) 35,412 Georgia ............. 506.4 (D) 424.0 22,180 (D) 16,343 Michigan ........... 2,116.0 1,883.4 1,685.6 42,838 37,072 40,502 New Jersey ....... 362.6 307.3 258.6 16,313 8,387 13,706 New York .......... 802.7 805.3 696.7 30,737 24,174 27,226 North Carolina .. 271.1 611.3 561.7 12,313 18,306 20,311 Oregon .............. 1,500.0 1,333.0 1,101.7 17,369 13,194 8,122 Texas ................ 153.0 88.2 (NA) 9,746 3,481 (NA) Other States 1 ... ......................... 1,252.9 ......................... ......................... 57,335 .........................
United States .... 7,970.0 7,250.3 6,992.4 235,613 192,922 219,961
State Utilized production Price per unit Value of utilized production
2017 2018 2019 2017 2018 2019 2017 2018 2019
1,000 cwt Dollars per cwt 1,000 dollars
Fresh Market California .......... (D) 884.8 (D) (D) 33.20 (D) (D) 29,375 (D) Florida ............... 970.1 (D) 808.5 40.30 (D) 43.80 39,095 (D) 35,412 Georgia ............. 506.4 (D) (D) 43.80 (D) (D) 22,180 (D) (D) Michigan ........... 1,299.2 1,225.0 1,186.8 28.10 26.50 31.50 36,508 32,463 37,384 New Jersey ....... (D) (D) 258.6 (D) (D) 53.00 (D) (D) 13,706 New York .......... (D) (D) 587.5 (D) (D) 41.50 (D) (D) 24,381 North Carolina .. (D) (D) (D) (D) (D) (D) (D) (D) (D) Oregon .............. 217.5 122.6 82.9 43.00 46.90 35.30 9,353 5,750 2,926 Texas ................ 153.0 (D) (NA) 63.70 (D) (NA) 9,746 (D) (NA) Other States 1 ... 2,598.4 2,883.8 2,220.6 39.40 37.30 41.20 102,251 107,629 91,405
United States .... 5,744.6 5,116.2 5,144.9 38.10 34.20 39.90 219,133 175,217 205,214
Tons Dollars per ton 1,000 dollars
Processing California .......... (D) 4,206 (D) (D) 380.00 (D) (D) 1,598 (D) Florida ............... ................. (D) ................. (X) (D) (X) ................. (D) .................Georgia ............. ................. (D) (D) (X) (D) (D) ................. (D) (D) Michigan ........... 40,839 32,921 24,940 155.00 140.00 125.00 6,330 4,609 3,118 New Jersey ....... (D) (D) ................. (D) (D) (X) (D) (D) .................New York .......... (D) (D) 5,460 (D) (D) 521.00 (D) (D) 2,845 North Carolina .. (D) (D) (D) (D) (D) (D) (D) (D) (D) Oregon .............. 64,125 60,518 50,941 125.00 123.00 102.00 8,016 7,444 5,196 Texas ................ ................. (D) (NA) (X) (D) (NA) ................. (D) (NA) Other States 1 ... 6,304 9,057 11,305 339.00 448.00 325.00 2,134 4,054 3,588
United States .... 111,268 106,702 92,376 148.00 166.00 160.00 16,480 17,705 14,747
(D) Withheld to avoid disclosing data for individual operations. (NA) Not available. (X) Not applicable. 1 Includes data with-held above.
NASS, Crops Branch, (202) 720–2127.

IV–32 STATISTICS OF VEGETABLES AND MELONS
Table 4-39.—Sweet Potatoes: Area, yield, production, season average price per hundredweight received by farmers, and value, United States, 2010–2019
Year Area harvested Yield per acre Production Market year
average price 1 Value of
production
1,000 acres Cwt 1,000 cwt Dollars 1,000 dollars
2010 ..................... 116.9 204.0 23,845.0 19.80 472,218 2011 ..................... 129.7 208.0 26,964.0 18.80 505,938 2012 ..................... 126.6 209.0 26,482.0 17.40 461,861 2013 ..................... 113.2 219.0 24,785.0 24.10 597,217 2014 ..................... 135.2 219.0 29,584.0 23.90 706,916 2015 ..................... 153.1 203.0 31,016.0 21.80 675,583 2016 ..................... 163.3 193.0 31,546.0 20.70 651,514 2017 ..................... 159.3 224.0 35,646.0 18.40 657,021 2018 ..................... 144.4 190.0 27,378.0 23.20 634,228 2019 ..................... 146.7 217.9 31,972.5 18.50 588,125
1 Obtained by weighting State prices by production. NASS, Crops Branch, (202) 720–2127.
Table 4-40 .—Sweet Potatoes: Area harvested, production, season average price, and value, by State and United States, 2017–2019
State Area harvested Production
2017 2018 2019 2017 2018 2019
1,000 Acres 1,000 cwt
Arkansas ........... (D) 4.8 (NA) (D) 1,056.0 (NA) California ........... 21.0 21.0 21.5 6,510.0 7,770.0 8,170.0 Florida ............... (D) 5.8 (NA) (D) 812.0 (NA) Louisiana .......... 9.5 8.3 (NA) 2,185.0 2,200.0 (NA) Mississippi ........ 29.0 26.0 27.5 4,930.0 4,550.0 4,262.5 North Carolina .. 89.5 78.5 97.7 19,690.0 10,990.0 19,540.0 Other States 2 ... 10.3 ........................ ........................ 2,331.0 ........................ .............................
United States .... 159.3 144.4 146.7 35,646.0 27,378.0 31,972.5
State Price per cwt Value of production
2017 2018 2019 1 2017 2018 2019 1
Dollars 1,000 dollars
Arkansas ........... (D) 23.20 (NA) (D) 24,499 (NA) California .......... 23.70 23.60 23.30 154,287 183,372 189,236 Florida ............... (D) 47.90 (NA) (D) 38,895 (NA) Louisiana .......... 19.90 20.00 (NA) 43,482 44,000 (NA) Mississippi ........ 18.50 18.00 17.60 91,205 81,900 75,021 North Carolina .. 15.30 23.80 16.60 301,257 261,562 323,868 Other States 2 ... 28.60 (X) (X) 66,790 ......................... .........................
United States .... 18.40 23.20 18.50 657,021 634,228 588,125
(D) Withheld to avoid disclosing data for individual operations. (NA) Not available. (X) Not applicable. 1 Preliminary. 2 Includes data withheld above.
NASS, Crops Branch, (202) 720–2127.

IV–33 AGRICULTURAL STATISTICS 2020
Table 4-41.—Tomatoes for fresh market and processing: Area Harvested, production, and value, by State and United States, 2017–2019
State Area harvested Total production
2017 2018 2019 2017 2018 2019
Acres 1,000 cwt
California .......... 247,700 260,600 247,700 221,691.5 255,388.0 231,599.5 Florida ............... 28,000 27,000 26,000 8,400.0 7,560.0 7,800.0 Indiana .............. 7,800 7,600 (NA) 4,602.0 4,940.0 (NA) Michigan ........... 5,500 5,000 (NA) 3,080.0 2,750.0 (NA) New Jersey ....... 4,000 4,100 (NA) 1,120.0 943.0 (NA) North Carolina .. 3,200 3,000 (NA) 1,056.0 870.0 (NA) Ohio .................. 5,500 5,400 (NA) 2,695.0 2,808.0 (NA) South Carolina .. 2,800 3,200 (NA) 1,036.0 1,152.0 (NA) Tennessee ........ 3,600 4,000 (NA) 1,278.0 1,240.0 (NA) Virginia .............. 2,400 2,000 (NA) 696.0 420.0 (NA)
United States .... 310,500 321,900 273,700 245,654.5 278,071.0 239,399.5
State Utilized production Value of utilized production
2017 2018 2019 2017 2018 2019
1,000 cwt 1,000 dollars
California .......... 216,592.6 253,855.7 230,209.9 1,075,824 1,197,642 1,174,395 Florida ............... 7,988.4 6,917.4 7,729.8 262,020 344,131 425,912 Indiana .............. 4,602.0 4,940.0 (NA) 30,519 31,530 (NA) Michigan ........... 3,067.7 2,750.0 (NA) 35,987 35,352 (NA) New Jersey ....... 1,118.9 716.7 (NA) 39,202 42,411 (NA) North Carolina .. 999.0 863.9 (NA) 46,116 33,845 (NA) Ohio .................. 2,695.0 2,808.0 (NA) 48,626 52,173 (NA) South Carolina .. 1,033.9 1,150.8 (NA) 34,429 44,881 (NA) Tennessee ........ 1,265.2 1,215.2 (NA) 61,719 54,176 (NA) Virginia .............. 692.5 409.1 (NA) 43,518 27,774 (NA)
United States .... 240,055.2 275,626.8 237,939.7 1,677,960 1,863,915 1,600,307
State Utilized production Price per unit Value of utilized production
2017 2018 2019 2017 2018 2019 2017 2018 2019
1,000 cwt Dollars per cwt 1,000 dollars
Fresh Market California ......... 7,315.8 8,172.4 6,484.8 31.20 27.80 43.10 228,253 227,193 279,495 Florida ............. 7,988.4 (D) 7,729.8 32.80 (D) 55.10 262,020 (D) 425,912 Indiana ............ 32.2 49.4 (NA) 75.00 69.00 (NA) 2,415 3,409 (NA) Michigan .......... 406.6 495.0 (NA) 54.80 47.50 (NA) 22,282 23,513 (NA) New Jersey ..... 689.9 510.2 (NA) 53.90 80.90 (NA) 37,186 41,275 (NA) North Carolina (D) (D) (NA) (D) (D) (NA) (D) (D) (NA) Ohio ................ 649.5 561.6 (NA) 56.60 69.90 (NA) 36,762 39,256 (NA) South Carolina 1,033.9 1,150.8 (NA) 33.30 39.00 (NA) 34,429 44,881 (NA) Tennessee ...... (D) (D) (NA) (D) (D) (NA) (D) (D) (NA) Virginia ............ (D) (D) (NA) (D) (D) (NA) (D) (D) (NA) Other States 1 2,853.4 8,683.1 .................. 52.10 50.00 (X) 148,744 442,090 ................
United States .. 20,969.7 19,622.5 14,214.6 36.80 41.60 49.60 772,091 821,617 705,407
Tons Dollars per ton 1,000 dollars
Processing California ......... 10,463,839 12,284,163 11,186,256 81.00 79.00 80.00 847,571 970,449 894,900 Florida ............. .................. (D) .................. (X) (D) (X) ................ (D) ................Indiana ............ 228,489 244,530 (NA) 123.00 115.00 (NA) 28,104 28,121 (NA) Michigan .......... 133,056 112,750 (NA) 103.00 105.00 (NA) 13,705 11,839 (NA) New Jersey ..... 21,448 10,326 (NA) 94.00 110.00 (NA) 2,016 1,136 (NA) North Carolina (D) (D) (NA) (D) (D) (NA) (D) (D) (NA) Ohio ................ 102,275 112,320 (NA) 116.00 115.00 (NA) 11,864 12,917 (NA) South Carolina .................. .................. (NA) (X) (X) (NA) ................ ................ (NA) Tennessee ...... (D) (D) (NA) (D) (D) (NA) (D) (D) (NA) Virginia ............ (D) (D) (NA) (D) (D) (NA) (D) (D) (NA) Other States 1 5,160 28,566 .................. 506.00 624.00 (X) 2,609 17,836 ................
United States .. 10,954,267 12,792,655 11,186,256 82.70 81.50 80.00 905,869 1,042,298 894,900
(D) Withheld to avoid disclosing data for individual operations. (NA) Not available. (X) Not applicable. 1 Includes data with-held above.
NASS, Crops Branch, (202) 720–2127.

IV–34 STATISTICS OF VEGETABLES AND MELONS
Table 4-42.—Watermelon for fresh market and processing: Area harvested, production, and value, by State and United States, 2017–2019
State Area harvested Total production
2017 2018 2019 2017 2018 2019
Acres 1,000 cwt
Arizona ............. 3,500 (D) 5,000 1,802.5 (D) 2,525.0 California .......... 10,600 11,900 10,200 6,201.0 6,426.0 5,100.0 Delaware .......... 3,900 3,800 (NA) 1,092.0 1,026.0 (NA) Florida ............... 22,000 22,500 24,500 8,690.0 8,100.0 9,056.0 Georgia ............. 20,900 20,600 21,100 7,942.0 5,356.0 8,229.0 Indiana .............. 6,200 6,500 6,100 2,573.0 3,055.0 2,318.0 Maryland ........... 3,700 3,500 (NA) 1,110.0 1,050.0 (NA) Missouri ............ 3,000 (D) (NA) 705.0 (D) (NA) North Carolina .. 7,100 7,300 7,400 2,130.0 1,825.0 1,702.0 South Carolina .. 4,900 4,300 4,500 2,156.0 989.0 1,440.0 Texas ................ 22,000 23,000 23,000 6,380.0 7,820.0 6,670.0 Other States ..... ......................... 8,000 ......................... ......................... 3,698.0 .........................
United States .... 107,800 112,000 101,800 40,781.5 39,345.5 37,049.0
State Utilized production Value of utilized production
2017 2018 2019 2017 2018 2019
1,000 cwt 1,000 dollars
Arizona ............. 1,802.5 (D) 2,525.0 42,359 (D) 34,593 California .......... 6,176.2 6,393.9 5,100.0 117,348 116,369 105,060 Delaware .......... 1,092.0 1,026.0 (NA) 8,736 11,286 (NA) Florida ............... 8,690.0 8,043.3 8,974.4 152,944 160,866 161,539 Georgia ............. 7,727.6 5,345.3 8,097.3 84,231 76,438 101,216 Indiana .............. 2,573.0 3,055.0 2,318.0 27,017 27,915 35,294 Maryland ........... 1,110.0 1,039.5 (NA) 12,321 10,395 (NA) Missouri ............ 702.2 (D) (NA) 8,445 (D) (NA) North Carolina .. 2,102.3 1,799.5 1,702.0 22,705 22,314 23,998 South Carolina .. 2,153.8 987.0 1,402.6 26,276 17,174 16,022 Texas ................ 6,156.7 7,765.3 6,603.3 91,651 143,387 83,202 Other States ..... ......................... 3,694.0 ......................... ......................... 77,291 .........................
United States .... 40,286.3 39,148.8 36,722.6 594,033 663,435 560,924
State Utilized production Price per unit Value of utilized production
2017 2018 2019 2017 2018 2019 2017 2018 2019
1,000 cwt Dollars per cwt 1,000 dollars
Fresh Market Arizona ............ 1,802.5 (D) 2,525.0 23.50 (D) 13.70 42,359 (D) 34,593 California ......... 6,176.2 6,393.9 5,100.0 19.00 18.20 20.60 117,348 116,369 105,060 Delaware ......... 1,092.0 1,026.0 (NA) 8.00 11.00 (NA) 8,736 11,286 (NA) Florida ............. 8,690.0 8,043.3 8,974.4 17.60 20.00 18.00 152,944 160,866 161,539 Georgia ........... 7,727.6 5,345.3 8,097.3 10.90 14.30 12.50 84,231 76,438 101,216 Indiana ............ 2,573.0 (D) (D) 10.50 (D) (D) 27,017 (D) (D) Maryland ......... 1,110.0 1,039.5 (NA) 11.10 10.00 (NA) 12,321 10,395 (NA) Missouri ........... (D) (D) (NA) (D) (D) (NA) (D) (D) (NA) North Carolina 2,102.3 1,799.5 1,702.0 10.80 12.40 14.10 22,705 22,314 23,998 South Carolina 2,153.8 987.0 (D) 12.20 17.40 (D) 26,276 17,174 (D) Texas .............. (D) (D) 6,603.3 (D) (D) 12.60 (D) (D) 83,202 Other States 1 6,606.0 14,345.9 3,664.2 15.10 17.20 14.00 99,782 247,360 51,132
United States .. 40,033.4 38,980.4 36,666.2 14.80 17.00 15.30 593,719 662,202 560,740
Tons Dollars per ton 1,000 dollars
Processing Arizona ............ .................. (D) .................. (X) (D) (X) ................ (D) ................California ......... .................. .................. .................. (X) (X) (X) ................ ................ ................Delaware ......... .................. .................. (NA) (X) (X) (NA) ................ ................ (NA) Florida ............. .................. .................. .................. (X) (X) (X) ................ ................ ................Georgia ........... .................. .................. .................. (X) (X) (X) ................ ................ ................Indiana ............ .................. (D) (D) (X) (D) (D) ................ (D) (D) Maryland ......... .................. .................. (NA) (X) (X) (NA) ................ ................ (NA) Missouri ........... (D) (D) (NA) (D) (D) (NA) (D) (D) (NA) North Carolina .................. .................. .................. (X) (X) (X) ................ ................ ................South Carolina .................. .................. (D) (X) (X) (D) ................ ................ (D) Texas .............. (D) (D) .................. (D) (D) (X) (D) (D) ................Other States 1 12,646 8,420 2,815 24.80 146.00 146.00 314 1,233 184
United States .. 12,646 8,420 2,815 24.80 146.00 146.00 64 1,233 184
(D) Withheld to avoid disclosing data for individual operations. (NA) Not available. (X) Not applicable. 1 Includes data with-held above.
NASS, Crops Branch, (202) 720–2127.

IV–35 AGRICULTURAL STATISTICS 2020
Table 4-43.—Vegetables and melons, fresh: Total reported domestic rail, truck, and air shipments, 2019
Commodity Jan. Feb. Mar. Apr. May June July
Vegetables: 1,000 cwt
Artichokes ........................... 51 72 67 79 55 58 71 Artichokes-organic .............. 2 3 2 1 3 4 3 Asparagus ........................... .................. .................. .................. 17 112 123 11 Beans .................................. 182 176 232 229 224 120 43 Beans-organic ..................... .................. 1 .................. .................. .................. .................. ..................Beets ................................... 6 6 8 9 6 3 4 Beets-organic ...................... .................. .................. .................. 1 3 3 3 Broccoli ............................... 557 435 518 549 506 570 466 Broccoli-organic .................. 36 39 56 54 46 50 50 Brussels sprouts ................. 59 19 26 33 27 41 76 Cabbage ............................. 928 784 1,062 602 472 261 300 Cabbage-organic ................ 11 18 17 7 7 8 10 Carrots ................................ 627 624 670 651 694 568 578 Carrots-organic ................... 251 226 228 223 231 209 201 Cauliflower .......................... 494 375 496 435 468 419 362 Cauliflower-organic ............. 14 16 32 37 46 41 32 Celery ................................. 1,340 1,014 1,078 997 1,016 1,162 1,097 Celery-organic .................... 63 51 66 98 81 95 104 Chinese cabbage ................ 34 32 45 45 52 70 49 Corn, sweet ........................ 394 360 597 1,179 2,072 1,995 525 Corn, sweet-organic ........... .................. .................. .................. .................. .................. .................. ..................Cucumbers ......................... 35 1 126 336 366 397 297 Cucumbers-organic ............ .................. .................. 2 .................. .................. .................. ..................Eggplant .............................. 50 40 81 128 77 139 16 Eggplant-organic ................. 1 1 1 1 .................. .................. ..................Endive ................................. 16 16 13 11 3 2 2 Escarole .............................. 21 23 18 16 6 3 3 Greens ................................ 170 144 240 222 197 165 89 Greens-organic ................... 15 16 25 23 10 8 8 Lettuce, iceberg .................. 2,069 1,819 2,300 2,359 2,409 2,000 2,140 Lettuce, iceberg-organic ..... 10 9 16 26 19 15 25 Lettuce, other ...................... 337 320 358 273 224 179 195 Lettuce, other-organic ......... 6 7 9 8 3 5 4 Lettuce, romaine ................. 1,928 1,543 2,061 1,888 1,738 1,500 1,575 Lettuce, romaine-organic .... 92 84 137 153 114 103 113 Lettuce processed .............. 752 688 715 509 142 125 ..................
Commodity Aug. Sep. Oct. Nov. Dec. Total
Artichokes ........................... 67 52 61 48 29 710 Artichokes-organic .............. 2 3 2 1 2 28 Asparagus .......................... ................... ................... ................... ................... ................... 263 Beans ................................. 62 71 106 162 141 1,748 Beans-organic .................... ................... ................... ................... ................... ................... 1 Beets .................................. 4 5 6 6 4 67 Beets-organic ..................... 3 4 4 3 ................... 24 Broccoli ............................... 448 377 415 501 507 5,849 Broccoli-organic .................. 49 36 36 33 46 531 Brussels sprouts ................. 103 95 97 124 85 785 Cabbage ............................. 473 497 516 461 841 7,197 Cabbage-organic ................ 6 4 5 66 19 178 Carrots ................................ 590 535 592 534 573 7,236 Carrots-organic ................... 229 213 240 240 218 2,709 Cauliflower .......................... 411 364 367 435 477 5,103 Cauliflower-organic ............. 48 26 27 24 27 370 Celery ................................. 1,058 1,013 1,208 1,631 1,329 13,943 Celery-organic .................... 115 111 126 99 69 1,078 Chinese cabbage ............... 53 50 68 43 35 576 Corn, sweet ........................ 420 283 337 366 178 8,706 Corn, sweet-organic ........... ................... ................... ................... ................... 1 1 Cucumbers ......................... 474 389 326 287 137 3,171 Cucumbers-organic ............ ................... ................... 1 3 1 7 Eggplant ............................. 27 46 77 88 63 832 Eggplant-organic ................ ................... ................... ................... ................... 2 6 Endive ................................. 2 2 2 8 5 82 Escarole .............................. 3 3 4 11 12 123 Greens ................................ 109 95 145 417 302 2,295 Greens-organic ................... 7 6 9 10 11 148 Lettuce, iceberg .................. 2,248 2,040 1,936 1,697 2,042 25,059 Lettuce, iceberg-organic ..... 20 17 18 84 117 376 Lettuce, other ..................... 202 185 217 262 371 3,123 Lettuce, other-organic ........ 3 3 3 7 6 64 Lettuce, romaine ................. 1,577 1,451 1,515 1,439 1,739 19,954 Lettuce, romaine-organic .... 141 132 128 117 104 1,418 Lettuce processed .............. 141 124 149 801 792 4,938
See footnote(s) at end of table.

IV–36 STATISTICS OF VEGETABLES AND MELONS
Table 4-43.—Vegetables and melons, fresh: Total reported domestic rail, truck, and air shipments, 2019—Continued
Commodity Jan. Feb. Mar. Apr. May June July
Vegetables: 1,000 cwt
Onions, dry ............................ 4,631 3,492 3,632 4,034 4,358 3,890 3,877 Onions, dry-organic ............... 2 1 2 6 16 13 13 Onions, green ........................ 9 6 19 24 25 31 26 Onions, green-organic ........... ................. ................. ................. 1 2 2 2 Onions processed .................. 458 487 559 418 539 573 303 Parsley ................................... 43 41 36 45 44 37 45 Parsley-organic ...................... 1 1 1 1 1 2 2 Peppers, bell .......................... 247 251 383 529 740 885 665 Peppers, bell-organic ............. 3 2 3 3 ................. 8 14 Peppers, other ....................... 30 41 73 72 31 32 14 Peppers, other-organic .......... ................. ................. 1 ................. ................. ................. .................Potatoes, table ....................... 7,694 6,433 7,615 7,254 7,230 7,458 7,432 Potatoes, table-organic .......... 145 138 143 110 118 149 113 Potatoes, chipper ................... 3,922 4,031 4,794 3,825 3,863 5,799 5,378 Potatoes, chipper-organic ...... ................. ................. ................. 1 ................. ................. .................Potatoes, seed ....................... 265 203 4,173 7,416 2,007 112 10 Radishes ................................ 68 63 71 81 63 52 55 Spinach .................................. 199 202 210 104 52 42 53 Spinach-organic ..................... 47 48 67 22 1 2 3 Squash ................................... 117 142 215 212 237 119 132 Squash-organic ...................... 5 5 6 5 2 ................. .................Sweet potatoes ...................... 720 738 843 702 655 622 462 Sweet potatoes-organic ......... 5 7 7 5 6 4 16 Tomatoes ............................... 933 799 843 1,076 1,166 763 1,120 Tomatoes, greenhouse .......... ................. ................. 90 79 119 113 129 Toms, Grape Type ................. ................. ................. 106 112 115 143 122 Toms, Grape Type-
greenhouse ........................ 23 21 33 24 22 20 19 Toms, Cherry ......................... ................. ................. 26 30 23 27 24 Toms, Plum Type .................. ................. ................. ................. ................. 5 106 245 Toms, Plum Type-greenhouse 90 79 119 113 129 140 132
Total ....................................... 30,208 26,193 35,372 37,503 32,998 31,585 28,858
Commodity Aug. Sep. Oct. Nov. Dec. Total
Onions, dry ............................. 4,001 3,369 3,827 4,152 3,955 47,218 Onions, dry-organic ................ 2 1 1 1 .................. 58 Onions, green ......................... 29 28 31 33 22 283 Onions, green-organic ............ 2 1 2 1 .................. 13 Onions processed ................... 325 402 431 493 403 5,391 Parsley .................................... 47 43 45 49 39 514 Parsley-organic ....................... 2 1 2 1 2 17 Peppers, bell ........................... 659 677 636 699 395 6,766 Peppers, bell-organic .............. .................. .................. .................. 1 3 37 Peppers, other ........................ 10 .................. 26 56 26 411 Peppers, other-organic ........... .................. .................. .................. .................. .................. 1 Potatoes, table ........................ 7,092 6,841 7,010 8,275 7,077 87,411 Potatoes, table-organic ........... 87 66 100 124 126 1,419 Potatoes, chipper .................... 4,980 4,258 4,038 4,578 4,063 53,529 Potatoes, chipper-organic ....... .................. 3 .................. .................. .................. 4 Potatoes, seed ........................ 1 62 25 42 72 14,388 Radishes ................................. 58 55 52 58 82 758 Spinach ................................... 50 49 50 85 153 1,249 Spinach-organic ...................... 4 2 7 34 50 287 Squash .................................... 161 117 114 147 158 1,871 Squash-organic ....................... .................. .................. 1 5 8 37 Sweet potatoes ....................... 461 479 656 1,057 651 8,046 Sweet potatoes-organic .......... 3 5 7 7 7 79 Tomatoes ................................ 1,025 1,020 1,014 1,178 778 90 Tomatoes, greenhouse ........... 140 132 109 73 89 108 Toms, Grape Type ................. 103 60 41 44 84 107 Toms, Grape Type-
greenhouse ......................... 20 9 8 19 18 236 Toms, Cherry .......................... 13 9 9 9 16 27 Toms, Plum Type ................... 209 127 59 .................. .................. 751 Toms, Plum Type-greenhouse 109 73 89 108 81 1,262
Total ........................................ 28,688 26,121 27,133 31,337 28,643 351,067
See footnote(s) at end of table.

IV–37 AGRICULTURAL STATISTICS 2020
Table 4-43.—Vegetables and melons, fresh: Total reported domestic rail, truck, and air shipments, 2019–Continued
Commodity Jan. Feb. Mar. Apr. May June July
Melons: 1,000 cwt
Cantaloupe ............................. ................. ................. ................. 13 914 2,404 2,241 Cantaloupe-organic ................ ................. ................. ................. ................. 7 78 67 Honeydews ............................ ................. ................. ................. ................. 49 432 685 Honeydews-organic ............... ................. ................. ................. ................. 3 30 19 Mixed & misc. melons ........... ................. ................. ................. ................. 7 46 113 Mixed & misc.
melons-organic ................... ................. ................. ................. ................. 1 15 5 Watermelon, seeded .............. ................. ................. 1 150 472 484 390 Watermelon, seeded-organic ................. ................. ................. ................. ................. 3 6 Watermelon, seedless ........... ................. ................. 14 1,261 6,369 10,347 8,084 Watermelon,
seedless-organic ................ ................. ................. ................. ................. 12 118 144
Total ....................................... ................. ................. 15 1,424 7,834 13,957 11,754
Commodity Aug. Sep. Oct. Nov. Dec. Total
Cantaloupe ............................. 2,317 1,558 926 228 .................. 10,601 Cantaloupe-organic ................ 52 18 .................. .................. .................. 222 Honeydews ............................. 696 567 225 89 .................. 2,773 Honeydews-organic ................ 22 9 .................. .................. .................. 83 Mixed & misc. melons ............ 72 17 .................. .................. .................. 255 Mixed & misc.
melons-organic .................... 7 2 .................. .................. .................. 30 Watermelon, seeded .............. 323 87 4 .................. .................. 1,911 Watermelon, seeded-organic 2 .................. .................. .................. .................. 11 Watermelon, seedless ............ 6,733 2,832 254 11 .................. 35,905 Watermelon,
seedless-organic ................. 204 30 .................. .................. .................. 508
Total ........................................ 10,428 5,120 1,439 328 .................. 52,299
AMS, Fresh Fruit and Vegetable Specialty Crops, Market News Division, (202) 205–9690.
Table 4-44.—Commercially produced vegetables: Per capita utilization, United States, 2009–2018
Year
Farm weight equivalent
Total fresh and
processed Fresh 2
Processed
Total Canning Freezing Potatoes Others 1
Pounds Pounds Pounds Pounds Pounds Pounds Pounds
2009 ......... 349.0 141.3 207.7 98.8 21.4 76.7 10.8 2010 ......... 352.0 144.9 207.1 97.7 20.9 77.1 11.4 2011 ......... 342.2 142.2 200.3 89.6 22.0 76.4 12.3 2012 ......... 350.5 144.8 205.7 91.1 22.3 80.3 12.0 2013 ......... 341.1 141.2 199.9 90.3 19.6 79.0 11.0 2014 ......... 346.8 142.6 204.2 92.1 19.9 79.5 12.7 2015 ......... 337.2 141.9 195.3 80.6 20.5 81.3 12.9 2016 ......... 351.3 155.9 195.4 86.0 20.2 76.5 12.7 2017 ......... 357.3 157.4 199.9 83.3 21.4 83.0 12.2 2018 ......... 351.8 144.8 207.0 90.0 22.9 82.7 11.4
Year
Percentage of annual total
Fresh 2 Processed
Total Canning Freezing Potatoes Others 1
Percent Percent Percent Percent Percent Percent
2009 ......... 40.5 59.5 28.3 6.1 22.0 3.1 2010 ......... 41.2 58.8 27.7 6.0 21.9 3.2 2011 ......... 41.5 58.5 26.2 6.4 22.3 3.6 2012 ......... 41.3 58.7 26.0 6.4 22.9 3.4 2013 ......... 41.4 58.6 26.5 5.7 23.2 3.2 2014 ......... 41.1 58.9 26.6 5.7 22.9 3.7 2015 ......... 42.1 57.9 24.0 6.1 24.1 3.8 2016 ......... 42.3 57.7 25.5 6.0 22.4 3.8 2017 ......... 40.7 59.3 26.7 5.9 23.1 3.5 2018 ......... ............................ .......................... .......................... .......................... .......................... ..........................
1 Others include mushrooms, sweet potatoes, and onions for dehydrating market. 2 See table 4-45 for items included under Fresh category. Excludes melons.
ERS, Market and Trade Economics Division, (202) 694–5326.

IV–38 STATISTICS OF VEGETABLES AND MELONS
Table 4-45.—Vegetables, fresh: Per capita civilian availability (farm-weight basis), United States, 2009–2018 1
Year Asparagus Snap beans Broccoli Cabbage Carrots Cauliflower
Pounds Pounds Pounds Pounds Pounds Pounds 2009 ............ 1.3 1.7 6.2 7.3 7.4 1.7 2010 ............ 1.4 1.9 6.0 7.5 7.8 1.3 2011 ............ 1.4 1.7 6.0 6.6 7.5 1.2 2012 ............ 1.4 1.6 6.3 6.3 8.0 1.2 2013 ............ 1.4 1.6 6.9 6.9 8.0 1.3 2014 ............ 1.7 1.5 6.7 6.7 8.5 1.3 2015 ............ 1.5 1.6 7.4 6.3 8.8 1.6 2016 ............ 1.6 1.7 7.5 5.9 7.8 1.7 2017 ............ 1.6 1.6 7.1 6.2 7.4 2.4 2018 ............ 1.8 1.7 5.9 5.7 8.5 2.4
Year Celery Sweet Corn Cucumbers Head lettuce
Leaf/ romaine Garlic
Pounds Pounds Pounds Pounds Pounds Pounds 2009 ............ 6.2 9.2 6.8 16.1 10.0 2.4 2010 ............ 6.1 9.3 6.7 15.9 12.0 2.3 2011 ............ 6.0 8.2 6.4 15.8 11.7 2.3 2012 ............ 6.0 8.7 7.1 16.0 11.9 2.3 2013 ............ 5.5 8.9 7.3 14.1 11.4 2.3 2014 ............ 5.5 7.7 7.4 14.5 10.8 2.2 2015 ............ 5.1 8.6 7.6 13.6 11.9 2.4 2016 ............ 5.0 7.1 8.1 16.9 14.5 3.0 2017 ............ 4.7 7.2 7.4 15.3 15.1 3.0 2018 ............ 5.0 6.7 8.0 12.3 12.3 2.5
Year Onions Bell peppers Spinach Tomatoes 2 Others 3 Total
vegetables 4
Pounds Pounds Pounds Pounds Pounds Pounds 2009 ............ 19.6 9.8 2.0 19.6 18.4 141.3 2010 ............ 19.6 10.3 1.7 20.6 18.4 144.9 2011 ............ 19.1 10.6 1.8 21.0 18.8 142.2 2012 ............ 19.3 10.8 1.6 20.8 19.3 144.8 2013 ............ 18.5 10.0 1.6 20.3 18.8 141.2 2014 ............ 18.4 10.7 1.7 20.6 20.5 142.6 2015 ............ 18.3 10.7 1.7 20.6 18.3 141.9 2016 ............ 22.8 11.1 2.0 20.3 24.0 155.9 2017 ............ 25.1 11.3 1.9 20.5 24.6 157.4 2018 ............ 20.4 11.2 1.9 20.6 22.2 144.8
1 Fresh vegetable consumption computed for total commercial production for fresh market. Does not include production for home use. Consumption obtained by dividing the total apparent consumption by total July 1 population as reported by the Bureau of the Census. All data for calendar year. 2 After 1996, includes an ERS estimate of domestically produced hothouse tomatoes. Hothouse imports included in all years. 3 Includes artichokes, brussels sprouts, eggplant, endive/es-carole, garlic, radishes, green limas, squash, spinach, okra, pumpkins, kale, collards, turnip greens, and mustard greens. 4 Excludes melons, mushrooms, potatoes, and sweet potatoes.
ERS, Market and Trade Economics Division, (202) 694–5326.

IV–39 AGRICULTURAL STATISTICS 2020
Table 4-46.—Vegetables, canning: Per capita availability (farm weight), United States, 2009–2018
Year Cabbage Asparagus Snap beans Carrots Green peas
Pounds Pounds Pounds Pounds Pounds
2009 ............... 0.9 0.2 3.6 0.9 1.3 2010 ............... 1.0 0.1 3.7 0.8 1.1 2011 ............... 1.0 0.1 3.2 0.8 0.8 2012 ............... 1.2 0.1 2.9 0.8 0.8 2013 ............... 1.0 0.1 2.9 0.8 0.9 2014 ............... 1.0 0.1 2.8 0.7 0.7 2015 ............... 0.9 0.1 3.0 0.7 0.8 2016 ............... 1.0 0.1 3.2 1.1 0.8 2017 ............... 1.3 0.1 3.1 1.1 0.7 2018 ............... 0.8 0.1 2.9 0.9 0.6
Year Tomatoes Sweet corn Pickling Cucumbers Other 1 Total
Pounds Pounds Pounds Pounds Pounds
2009 ............... 70.3 7.6 5.1 2.3 98.8 2010 ............... 71.3 6.9 3.8 2.5 97.7 2011 ............... 65.8 5.8 2.8 2.6 89.6 2012 ............... 66.6 5.9 3.0 2.7 91.1 2013 ............... 66.0 5.8 3.2 2.7 90.3 2014 ............... 67.4 5.8 3.9 2.6 92.1 2015 ............... 56.3 5.3 3.4 2.9 80.6 2016 ............... 61.2 5.0 3.0 3.0 86.0 2017 ............... 57.9 5.0 3.7 2.9 83.3 2018 ............... 65.6 5.2 3.3 3.4 90.0
1 Includes beets, green limas (1992-2014), spinach, and miscellaneous imports (1990-2014). ERS, Market and Trade Economics Division, (202) 694–5326.
Table 4-47.—Vegetables, freezing: Per capita utilization (farm weight basis), United States, 2009–2018
Year Asparagus Snap beans Carrots Peas Broccoli
Pounds Pounds Pounds Pounds Pounds
2009 ............ 0 .1 1 .9 1 .5 1 .7 2 .5 2010 ............ 0 .1 2 .0 1 .5 1 .5 2 .5 2011 ............ 0 .1 1 .5 1 .6 1 .6 2 .7 2012 ............ 0 .1 1 .9 1 .2 1 .9 2 .6 2013 ............ 0 .1 2 .1 1 .7 1 .5 2 .5 2014 ............ 0 .1 1 .8 1 .2 1 .6 2 .6 2015 ............ 0 .1 1 .9 1 .4 1 .5 2 .6 2016 ............ 0 .2 2 .0 1 .9 1 .0 2 .6 2017 ............ 0 .1 1 .9 2 .4 1 .3 2 .4 2018 ............ 0 .1 1 .9 2 .2 1 .3 2 .5
Year Cauliflower Sweet Corn Other 1 Total vegetables excluding potatoes
Pounds Pounds Pounds Pounds
2009 ............ 0.4 9.1 4.3 21.4 2010 ............ 0.4 8.6 4.5 20.9 2011 ............ 0.4 9.8 4.3 22.0 2012 ............ 0.3 9.8 4.5 22.3 2013 ............ 0.3 7.0 4.3 19.6 2014 ............ 0.4 7.7 4.6 19.9 2015 ............ 0.3 8.0 4.7 20.5 2016 ............ 0.4 7.5 4.6 20.2 2017 ............ 0.5 8.0 4.7 21.4 2018 ............ 0.6 7.9 4.4 22.9
1 Includes green lima beans, spinach, and miscellaneous freezing vegetables. ERS, Market and Trade Economics Division, (202) 694–5326.

IV–40 STATISTICS OF VEGETABLES AND MELONS
Table 4-48.—Frozen Vegetables and potato products: Cold storage holdings, United States, 2018 and 2019
End of the month
Asparagus Green beans,
french cut Green beans,
Lima Green beans,
regular cut
2018 2019 2018 2019 2018 2019 2018 2019
1,000 pounds
January .......... 9,690 7,694 14,738 12,622 49,217 34,443 172,503 143,960 February ........ 8,119 7,136 13,923 12,025 45,506 29,861 155,853 130,780 March ............. 6,989 6,419 13,402 11,534 42,315 26,059 128,304 117,427 April ................ 6,036 5,714 12,230 11,471 37,826 18,879 109,337 110,140 May ................ 7,767 5,807 10,651 10,112 36,335 17,010 93,324 87,598 June ............... 10,855 7,220 11,184 9,879 33,421 14,441 81,164 82,556 July ................ 10,971 7,297 12,886 16,571 29,161 29,161 115,005 125,225 August ............ 10,120 6,454 14,413 21,160 33,072 33,072 172,836 163,225 September ..... 9,358 6,372 15,847 20,285 44,301 44,301 202,123 203,481 October .......... 8,933 6,344 15,328 19,950 47,691 47,691 190,921 185,412 November ...... 8,364 6,257 13,793 17,143 42,601 42,601 173,687 173,403 December ...... 8,106 6,002 13,747 14,887 38,647 38,647 152,495 155,713
End of the month
Broccoli, chopped & cut
Broccoli, spears Brussels sprouts Carrots, diced
2018 2019 2018 2019 2018 2019 2018 2019
1,000 pounds
January .......... 30,206 36,913 25,814 26,337 21,121 15,728 128,815 120,219 February ........ 31,302 39,476 29,513 28,628 20,636 13,164 121,470 116,148 March ............. 33,530 37,688 31,806 34,710 20,900 12,916 114,872 109,514 April ................ 36,759 35,876 34,494 40,829 20,736 13,341 108,053 105,619 May ................ 35,108 32,798 38,616 39,849 19,317 12,501 98,881 110,909 June ............... 34,532 32,061 45,339 43,927 17,361 12,774 84,708 100,442 July ................ 38,981 36,520 44,166 45,936 17,102 12,930 65,564 84,444 August ............ 41,735 43,555 44,250 48,278 15,536 12,823 53,967 72,505 September ..... 43,080 45,550 37,705 47,694 13,257 12,237 48,927 62,579 October .......... 41,796 39,750 35,174 46,109 13,410 12,982 86,070 113,935 November ...... 39,422 37,303 30,802 43,369 13,940 12,505 129,184 171,712 December ...... 37,761 34,048 26,691 41,991 15,680 13,254 125,994 173,673
End of the month
Carrots, other Cauliflower Sweet corn, cut Sweet corn, cob
2018 2019 2018 2019 2018 2019 2018 2019
1,000 pounds
January .......... 149,233 100,107 34,901 28,000 446,194 433,018 231,840 242,621 February ........ 136,166 93,262 36,257 26,134 403,945 394,400 207,582 226,032 March ............. 125,914 87,761 35,212 24,059 356,223 351,796 176,477 202,924 April ................ 119,288 77,125 32,896 23,981 312,151 295,948 142,645 169,151 May ................ 104,184 73,787 30,354 18,478 276,599 259,917 107,713 149,776 June ............... 94,449 64,844 25,340 18,926 240,908 240,636 79,134 137,539 July ................ 87,118 57,293 24,701 19,682 257,797 250,720 105,145 137,583 August ............ 84,641 53,727 24,088 18,565 443,885 461,516 208,224 246,139 September ..... 96,342 67,712 23,258 19,684 558,378 662,567 276,776 332,852 October .......... 105,654 86,019 30,422 21,973 592,617 674,400 307,075 345,723 November ...... 113,794 105,246 28,645 23,324 530,696 637,174 288,300 307,982 December ...... 110,822 98,720 29,760 24,382 475,712 567,306 269,689 275,612
End of the month
Greens, southern Okra Onions, other Onion rings
2018 2019 2018 2019 2018 2019 2018 2019
1,000 pounds
January .......... 13,243 11,889 20,870 37,915 53,999 52,133 14,859 17,588 February ........ 12,661 11,164 16,743 31,855 56,916 53,274 16,629 18,362 March ............. 11,268 10,351 14,666 21,396 60,604 59,335 17,190 15,731 April ................ 10,534 9,976 13,443 16,652 62,211 66,088 18,696 16,500 May ................ 9,144 10,514 12,632 17,388 60,049 73,692 18,698 16,229 June ............... 10,996 12,907 30,181 28,658 60,160 72,312 17,976 15,146 July ................ 12,352 15,254 41,318 43,014 58,276 64,400 16,534 12,880 August ............ 13,146 15,149 50,058 56,509 60,197 66,956 16,117 11,357 September ..... 12,725 14,477 54,779 58,883 55,390 64,243 16,875 12,238 October .......... 13,195 14,583 55,093 57,568 47,346 55,543 17,056 11,825 November ...... 12,778 13,272 48,631 52,782 48,431 52,817 16,801 15,724 December ...... 12,174 10,908 44,156 48,906 51,663 51,024 17,160 14,918
See footnote(s) at end of table.

IV–41 AGRICULTURAL STATISTICS 2020
Table 4-48.—Frozen Vegetables and potato products: Cold storage holdings, United States, 2018 and 2019—Continued
End of the month
Blackeye peas Green peas Peas & carrots mixed Spinach
2018 2019 2018 2019 2018 2019 2018 2019
1,000 pounds
January .......... 1,606 1,497 247,040 188,769 7,454 7,826 51,346 30,847 February ........ 1,655 1,394 223,679 174,792 8,135 7,391 50,691 28,965 March ............. 1,512 1,712 198,966 147,662 7,410 8,001 50,882 33,114 April ................ 1,357 1,495 190,125 132,510 8,083 7,954 51,731 34,603 May ................ 1,407 1,373 177,152 121,763 7,758 8,436 57,378 38,555 June ............... 1,293 1,413 284,008 233,194 6,754 9,098 57,896 41,009 July ................ 2,089 1,615 341,193 385,001 7,424 9,953 52,689 39,444 August ............ 2,009 1,655 319,549 352,447 7,605 9,545 44,851 34,753 September ..... 2,000 1,930 303,905 309,511 6,947 8,515 40,251 30,952 October .......... 2,037 1,904 268,892 277,596 7,457 8,423 38,782 32,030 November ...... 1,790 1,332 244,288 250,797 6,928 8,567 35,439 32,739 December ...... 1,479 1,227 207,808 212,684 7,262 9,058 30,994 33,492
End of the month
Squash Vegetables,
mixed Vegetables,
other Total
frozen vegetables
2018 2019 2018 2019 2018 2019 2018 2019
1,000 pounds
January .......... 65,820 55,342 59,410 52,405 563,016 535,862 2,412,935 2,193,735 February ........ 59,535 55,155 60,105 54,958 504,878 510,354 2,221,899 2,064,710 March ............. 54,323 52,618 53,310 53,253 461,985 476,131 2,018,060 1,902,111 April ................ 50,724 48,370 52,886 55,753 406,018 440,646 1,838,259 1,738,621 May ................ 48,427 43,275 54,013 48,189 376,945 377,702 1,682,452 1,575,658 June ............... 44,881 40,456 56,417 47,214 377,555 355,236 1,706,512 1,621,888 July ................ 44,933 37,843 60,139 52,260 422,205 354,953 1,867,749 1,821,909 August ............ 46,032 45,421 66,995 50,131 502,853 384,582 2,276,179 2,191,605 September ..... 48,877 46,079 63,700 47,185 569,778 423,955 2,544,579 2,530,067 October .......... 61,029 55,609 60,301 50,241 623,597 458,115 2,669,876 2,615,705 November ...... 60,200 58,825 56,423 41,737 606,165 455,499 2,548,102 2,555,201 December ...... 60,482 56,884 53,845 41,323 582,039 435,111 2,374,166 2,354,632
End of the month
Frozen potatoes
French fries Other frozen potatoes Total frozen potatoes
2018 2019 2018 2019 2018 2019
1,000 pounds
January .......... 1,001,232 1,030,263 257,077 234,970 1,258,309 1,265,233 February ........ 997,602 1,052,280 267,617 246,684 1,265,219 1,298,964 March ............. 964,870 1,038,225 260,942 253,586 1,225,812 1,291,811 April ............... 938,695 969,089 254,107 242,123 1,192,802 1,211,212 May ................ 889,808 932,737 266,879 240,164 1,156,687 1,172,901 June ............... 941,336 945,264 270,621 239,233 1,211,957 1,184,497 July ................ 859,456 907,021 237,286 227,235 1,096,742 1,134,256 August ........... 898,725 935,993 242,029 226,265 1,140,754 1,162,258 September ..... 932,954 921,903 252,068 238,779 1,185,022 1,160,682 October .......... 1,002,221 942,518 248,025 228,186 1,250,246 1,170,704 November ...... 962,841 954,826 235,592 226,101 1,198,433 1,180,927 December ...... 944,230 948,850 230,329 207,080 1,174,559 1,155,930
NASS, Livestock Branch, (202) 720–3570.

V–1
CHAPTER V
STATISTICS OF FRUITS, TREE NUTS, AND HORTICULTURAL SPECIALTIES
For most fruits, production is estimated at two levels—total and utilized. Total production is the quantity of fruit harvested plus quantities which would have been acceptable for fresh market or proc-essing but were not harvested or utilized because of economic and other reasons. Utilized production is the amount sold plus the quantities used on farms where grown and quantities held in storage. The difference between total and utilized production is the quantity of marketable fruit not harvested and fruit harvested but not sold or utilized because of economic and other reasons. Production relates to the crop produced on all farms, except for apples and strawberries. In accordance with Congres-sional enactment, the Department’s estimates of apple production since 1938 have related only to commercial production. The estimates for strawberries cover production on area grown primarily for sale. Statistics on utilization of fruit by commercial processors refer to first utilization, not necessarily final utilization. For example, frozen fruit includes fruit which may later be used for preserves.
The price shown for each crop is a marketing year average price for all methods of sales. Prices for most fresh fruit are the average prices producers received at the point of first sale, commonly referred to as the ‘‘average price as sold.’’ Since the point of first sale is not the same for all pro-ducers, prices for the various methods of sale are weighted by the proportionate quantity sold. For example, if in a given State part of the fruit crop is sold f.o.b. packed by growers, part sold as bulk fruit at the packinghouse door, and some sold retail at roadside stands, the fresh fruit average price as sold is a weighted average of the average price for each method of sale.
The annual estimates are checked and adjusted at the end of each marketing season on the basis of shipment and processing records from transportation agencies, processors, cooperative marketing associations, and other industry organizations. The estimates are reviewed (and revised if necessary) at 5-year intervals, when the Census of Agriculture data become available. The Department’s avail-able statistics are limited to the major tree fruits and nuts and to grapes, cranberries, and strawberries, and exclude some States where census data indicate production is of only minor importance.
Table 5-1.—Fruits and planted nuts: Bearing area, United States, 2009–2018
Year Citrus fruits 1 Major deciduous fruits 2
Miscellaneous Noncitrus 3 Nuts 4 Total
Acres
2009 ............ 844,800 1,739,670 306,280 1,159,700 4,050,450 2010 ............ 825,200 1,750,300 309,995 1,206,000 4,091,495 2011 ............ 809,200 1,744,240 315,510 1,261,500 4,130,450 2012 ............ 801,800 1,734,600 260,710 1,316,000 4,113,110 2013 ............ 791,200 1,757,980 347,950 1,409,000 4,306,130 2014 ............ 777,700 1,742,290 368,955 1,487,000 4,375,945 2015 ............ 764,900 1,729,230 371,150 1,533,000 4,398,280 2016 ............ 737,800 1,693,970 367,460 1,971,200 4,770,430 2017 ............ 709,800 1,680,250 351,680 2,076,800 4,818,530 2018 ............ 697,900 1,551,800 329,460 2,174,800 4,753,960
1 Grapefruit, lemons, oranges, tangelos, and tangerines. 2 Commercial apples, apricots, cherries, grapes, nectarines, peaches, pears, plums, and prunes. 3 Avocados, bananas, berries, coffee, cranberries, dates, figs, guavas, kiwifruit, olives, papayas, and strawberries. 4 Almonds, hazelnuts, macadamia nuts, pistachios, and walnuts. Bearing acreage estimates for pecans began in 2016.
NASS, Crops Branch, (202) 720–2127.

V–2 FRUITS, TREE NUTS, AND HORTICULTURAL SPECIALTIES
Table 5-2.—Fruits: Total production in tons, United States, 2009–2018 1
Year Apples, com-mercial crop 2 Pears Grapes (fresh
basis) Sweet
cherries Tart
cherries Apricots
Tons
2009 ......... 4,843,850 957,220 7,267,890 442,870 179,600 68,720 2010 ......... 4,641,050 813,600 7,432,120 313,220 95,200 66,380 2011 ......... 4,719,800 965,720 7,408,740 334,415 115,900 66,650 2012 ......... 4,496,150 851,240 7,530,883 424,000 42,600 60,800 2013 ......... 5,261,700 877,130 8,631,790 332,090 147,100 61,035 2014 ......... 5,931,550 831,610 7,883,830 363,640 152,100 64,928 2015 ......... 5,051,250 816,520 7,621,150 335,480 126,250 45,657 2016 ......... 5,747,500 738,770 7,697,030 350,240 164,650 64,050 2017 ......... 5,776,850 737,450 7,383,850 437,550 129,750 45,650 2018 ......... 5,128,500 805,500 7,596,000 344,400 149,150 39,550
Year Figs 3 (CA) (fresh basis) Plums (CA) Prunes (dry
basis) (CA) Olives (CA) Strawberries Avocados 4
Tons
2009 ......... 43,750 112,000 166,000 46,300 1,400,650 298,520 2010 ......... 40,910 142,000 130,000 206,000 1,426,000 174,330 2011 ......... 38,660 160,000 137,000 71,200 1,450,800 262,950 2012 ......... 35,200 115,000 138,000 160,000 1,526,000 (NA) 2013 ......... 33,000 100,600 85,000 166,000 1,523,500 182,920 2014 ......... 33,400 104,000 108,000 95,000 1,511,850 172,940 2015 ......... 31,700 92,500 112,000 179,000 1,532,750 228,990 2016 ......... 32,700 108,800 54,000 164,900 1,480,345 138,050 2017 ......... 31,200 117,900 105,000 192,300 1,360,400 187,680 2018 ......... (NA) 100,000 90,200 53,600 1,428,895 185,770
Year Nectarines Oranges 5 Tangerines and Mandarins 5 6 Grapefruit 5 Lemons 5 Tangelos 5 7
(FL)
Tons
2009 ......... 219,800 9,128,000 443,000 1,304,000 912,000 52,000 2010 ......... 233,200 8,243,000 596,000 1,238,000 882,000 41,000 2011 ......... 225,200 8,905,000 657,000 1,264,000 920,000 52,000 2012 ......... 188,900 8,982,000 644,000 1,153,000 850,000 52,000 2013 ......... 162,100 8,268,000 682,000 1,204,000 912,000 45,000 2014 ......... 187,300 6,768,000 732,000 1,047,000 824,000 40,000 2015 ......... 159,500 6,353,000 863,000 910,000 904,000 30,000 2016 ......... 151,350 6,088,000 935,000 803,000 904,000 18,000 2017 ......... 141,850 5,088,000 1,029,000 698,000 882,000 (NA) 2018 ......... 120,500 3,875,000 804,000 509,000 888,000 (NA)
Year Bananas 3 Kiwifruit (CA) Dates Papayas (HI) 8 Peaches Cranberries
Tons
2009 ......... 9,250 25,600 23,700 15,750 1,103,520 345,650 2010 ......... 8,900 32,700 29,000 15,050 1,149,430 340,410 2011 ......... 8,700 37,700 33,300 14,300 1,071,270 385,685 2012 ......... (NA) 29,600 31,100 (NA) 968,070 402,250 2013 ......... 7,250 27,600 30,500 12,100 905,371 447,870 2014 ......... 6,000 28,500 33,400 11,750 852,799 420,000 2015 ......... 4,530 20,900 39,000 12,600 844,780 428,150 2016 ......... 2,775 28,300 37,340 9,875 791,940 481,370 2017 ......... 3,305 33,600 43,320 11,125 700,770 419,703 2018 ......... (NA) 37,800 41,050 5,145 651,500 446,300
(NA) Not available. 1 For some crops in certain years, production includes some quantities unharvested for economic reasons or excess cullage fruit. 2 Estimates of the commercial crop refer to production in orchards of 100 or more bearing- age trees. 3 Estimates discontinued in 2018. 4 Year of bloom. 5 Year harvest was complete. 6 Beginning in 2015, tan-gerine and mandarin estimates are discontinued for Arizona. 7 Beginning in 2016, tangelos are included in tangerines and mandarins. 8 Utilized production.
NASS, Crops Branch, (202) 720–2127.

V–3 AGRICULTURAL STATISTICS 2020
Table 5-3.—Apples, commercial crop: Production and season average price per pound, by State and United States, 2016–2018
State Total production Utilized production Price per pound for crop of—
2016 2017 2018 2016 2017 2018 2016 2017 2018
Million pounds Dollars
California ............ 255.0 230.0 250.0 250.0 225.0 245.0 0.207 0.333 0.290 Connecticut 1 ...... 12.9 29.5 (NA) 12.5 29.3 (NA) 0.973 0.679 (NA) Idaho 1 ................ 55.2 47.4 (NA) 55.0 45.0 (NA) 0.175 0.181 (NA) Illinois 1 ............... 18.7 22.4 (NA) 18.1 21.4 (NA) 0.872 0.647 (NA) Maine 1 ............... 33.9 39.2 (NA) 33.7 37.5 (NA) 0.484 0.439 (NA) Maryland 1 .......... 40.6 48.4 (NA) 40.5 48.0 (NA) 0.262 0.193 (NA) Massachusetts 1 31.0 49.6 (NA) 30.4 48.5 (NA) 0.444 0.382 (NA) Michigan ............. 1,275.0 900.0 1,050.0 1,273.0 899.0 1,049.0 0.255 0.303 0.281 Minnesota 1 ......... 21.5 25.7 (NA) 20.9 24.2 (NA) 0.816 0.864 (NA) New Jersey 1 ...... 31.9 38.5 (NA) 31.0 37.0 (NA) 1.080 0.943 (NA) New York ............ 1,250.0 1,350.0 1,395.0 1,240.0 1,330.0 1,376.8 0.279 0.269 0.191 North Carolina 1 .. 114.0 104.0 (NA) 113.0 102.0 (NA) 0.238 0.247 (NA) Ohio 1 .................. 41.9 58.9 (NA) 41.4 58.4 (NA) 0.523 0.474 (NA) Oregon ............... 195.4 175.2 170.0 195.0 175.0 169.0 0.307 0.221 0.327 Pennsylvania ...... 467.0 528.0 488.0 464.0 526.0 484.1 0.192 0.223 0.222 Vermont 1 ............ 30.0 30.9 (NA) 29.8 30.7 (NA) 0.685 0.742 (NA) Virginia ............... 180.0 225.0 204.0 178.0 224.0 201.9 0.201 0.217 0.185 Washington ........ 7,320.0 7,500.0 6,700.0 6,900.0 7,200.0 6,365.0 0.341 0.338 0.343 West Virginia 1 .... 80.0 102.0 (NA) 79.8 101.0 (NA) 0.185 0.179 (NA) Wisconsin 1 ......... 41.0 49.0 (NA) 39.5 47.9 (NA) 0.552 0.549 (NA)
United States ...... 11,495.0 11,553.7 10,257.0 11,045.6 11,209.9 9,890.8 0.316 0.321 0.305
-Represents zero. (NA) Not available. 1 Estimates discontinued in 2018. NASS, Crops Branch, (202) 720–2127.
Table 5-4.—Apples: Production and value, United States, 2009–2018
Year
Apples, commercial crop
Total production Utilized production Marketing year average price 1 Value
Million pounds Million pounds Cents per pound 1,000 dollars
2009 ................ 9,687.7 9,435.6 23.1 2,182,003 2010 ................ 9,282.1 9,205.0 25.1 2,310,982 2011 ................ 9,439.6 9,328.8 30.3 2,830,784 2012 ................ 8,992.3 8,926.5 37.1 3,314,996 2013 ................ 10,523.4 10,431.7 30.2 3,147,435 2014 ................ 11,863.1 11,269.9 25.6 2,886,900 2015 ................ 10,102.5 10,022.9 33.6 3,365,665 2016 ................ 11,495.0 11,045.6 31.6 3,492,607 2017 ................ 11,553.7 11,209.9 32.1 3,601,447 2018 ................ 10,257.0 9,890.8 30.5 3,013,713
1 Fresh fruit prices are equivalent packinghouse-door returns for California, Michigan, New York, Pennsylvania, and Wash-ington; prices at point of first sale for other States. Processing prices are equivalent at processing plant door.
NASS, Crops Branch, (202) 720–2127.

V–4 FRUITS, TREE NUTS, AND HORTICULTURAL SPECIALTIES
Table 5-5.—International Apples, fresh: Production, 2016/2017–2018/2019
Country 2016/2017 2017/2018 2018/2019
metric tons
China .............................................. 40,393,000 41,390,000 31,000,000 European Union ............................. 12,722,620 10,013,600 14,008,570 United States ................................. 5,010,201 5,084,727 5,048,000 Turkey ............................................ 2,900,000 2,750,000 3,000,000 Iran ................................................. 2,799,200 2,799,200 2,799,200 India ............................................... 2,258,000 1,920,000 2,300,000 Russia ............................................ 1,509,148 1,359,580 1,503,100 Chile ............................................... 1,310,000 1,330,000 1,264,000 Ukraine ........................................... 1,099,200 1,099,200 1,099,200 Brazil .............................................. 1,049,300 1,049,300 1,049,300 South Africa ................................... 902,130 790,000 840,000 Japan ............................................. 765,000 765,000 765,000 Mexico ............................................ 716,930 714,149 660,000 Argentina ........................................ 560,000 560,000 590,000 New Zealand .................................. 523,000 575,500 561,000 Belarus ........................................... 509,300 509,300 509,300 Canada ........................................... 408,404 345,568 395,300 Serbia ............................................. 328,400 328,400 328,400 Australia ......................................... 308,300 308,300 308,300 Azerbaijan ...................................... 254,300 254,300 254,300 Kazakhstan .................................... 188,100 188,100 188,100 Kyrgyzstan ..................................... 135,600 135,600 135,600 Uruguay .......................................... 37,700 37,700 37,700 Guatemala ...................................... 26,500 26,500 26,500 Norway ........................................... 12,400 12,400 12,400 Colombia ........................................ 2,300 2,300 2,300 Taiwan ............................................ 1,483 1,451 1,500
World Total ..................................... 76,730,516 74,350,175 68,687,070
FAS, Office of Global Analysis, (202) 720-6301. Prepared or estimated on the basis of official USDA production, supply, and distribution statistics from foreign governments.
Table 5-6.—Apples, commercial crop: Production and utilization, United States, 2009–2018
Crop of— Total production
Utilized production
Utilization
Fresh
Processed (fresh basis)
Canned Dried Frozen Juice, cider & other 1
Million pounds
2009 ................ 9,687.7 9,435.6 6,296.4 1,158.2 161.2 236.2 1,583.6 2010 ................ 9,282.1 9,205.0 6,248.8 1,088.3 175.5 206.0 1,486.4 2011 ................ 9,439.6 9,328.8 6,312.9 1,123.7 183.5 190.5 1,517.8 2012 ................ 8,992.3 8,926.5 6,594.9 748.9 223.0 66.6 1,292.8 2013 ................ 10,523.4 10,431.7 6,918.7 1,311.2 161.0 249.3 1,791.0 2014 ................ 11,863.1 11,269.9 7,909.0 1,161.5 171.0 250.5 1,767.8 2015 ................ 10,102.5 10,022.9 6,928.1 1,121.1 179.0 187.5 1,527.5 2016 ................ 11,495.0 11,045.6 7,745.1 1,211.1 339.2 137.5 1,478.6 2017 ................ 11,553.7 11,209.9 7,815.8 1,161.9 370.0 119.0 1,574.8 2018 ................ 10,257.0 9,890.8 6,865.1 (NA) (NA) (NA) (NA)
1 Includes vinegar, wine, and slices for pie making. NASS, Crops Branch, (202) 720–2127.

V–5 AGRICULTURAL STATISTICS 2020
Table 5-7.—Apples, commercial crop: Production and utilization, by State and United States, crop of 2017 and 2018
State Total production
Utilized production
Utilization
Fresh
Processed (fresh basis)
Canned Dried Frozen Juice, cider & other 1
2017
Million pounds
California ............. 230.0 225.0 (D) ...................... .................. .................. ..................Connecticut .......... 29.5 29.3 25.9 ...................... .................. .................. ..................Idaho .................... 47.4 45.0 24.6 ...................... .................. .................. ..................Illinois ................... 22.4 21.4 (D) ...................... .................. .................. ..................Maine ................... 39.2 37.5 27.5 ...................... .................. .................. ..................Maryland .............. 48.4 48.0 16.4 ...................... .................. .................. ..................Massachusetts ..... 49.6 48.5 31.0 ...................... .................. .................. ..................Michigan .............. 900.0 899.0 490.0 210.0 .................. .................. 75.0 Minnesota ............ 25.7 24.2 22.0 ...................... .................. .................. ..................New Jersey .......... 38.5 37.0 28.0 ...................... .................. .................. ..................New York ............. 1,350.0 1,330.0 735.0 252.0 .................. .................. 284.0 North Carolina ..... 104.0 102.0 52.0 ...................... .................. .................. ..................Ohio ..................... 58.9 58.4 48.5 ...................... .................. .................. ..................Oregon ................. 175.2 175.0 148.0 ...................... .................. .................. ..................Pennsylvania ....... 528.0 526.0 236.0 220.0 .................. .................. 38.0 Vermont ............... 30.9 30.7 24.3 ...................... .................. .................. ..................Virginia ................. 225.0 224.0 91.0 ...................... .................. .................. ..................Washington .......... 7,500.0 7,200.0 5,650.0 (D) .................. .................. (D) West Virginia ....... 102.0 101.0 36.0 ...................... .................. .................. ..................Wisconsin ............ 49.0 47.9 37.0 ...................... .................. .................. ..................Other States 2 ...... ...................... ...................... 92.6 479.9 .................. .................. 997.8
United States ....... 11,553.7 11,209.9 7,815.8 1,161.9 370.0 123.0 1,574.8
State Total production Utilized production Fresh
2018
Million pounds
California .............. 250.0 245.0 (D) Connecticut 3 ........ (NA) (NA) (NA) Idaho 3 .................. (NA) (NA) (NA) Illinois 3 ................. (NA) (NA) (NA) Maine 3 ................. (NA) (NA) (NA) Maryland 3 ............ (NA) (NA) (NA) Massachusetts 3 ... (NA) (NA) (NA) Michigan .............. 1,050.0 1,049.0 545.0 Minnesota 3 .......... (NA) (NA) (NA) New Jersey 3 ........ (NA) (NA) (NA) New York ............. 1,395.0 1,376.8 747.7 North Carolina 3 ... (NA) (NA) (NA) Ohio 3 ................... (NA) (NA) (NA) Oregon ................. 170.0 169.0 (D) Pennsylvania ....... 488.0 484.1 233.8 Vermont 3 ............. (NA) (NA) (NA) Virginia ................. 204.0 201.9 83.6 Washington .......... 6,700.0 6,365.0 5,025.0 West Virginia 3 ..... (NA) (NA) (NA) Wisconsin 3 .......... (NA) (NA) (NA) Other States 2 ...... - - 230.0
United States ....... 10,257.0 9,890.8 6,865.1
(D) Data withheld to avoid disclosing data for individual operations. 1 Includes vinegar, wine, and slices for pie making. 2 Includes data withheld above and/or data for States not listed in this table. 3 Estimates discontinued in 2018.
NASS, Crops Branch, (202) 720–2127.

V–6 FRUITS, TREE NUTS, AND HORTICULTURAL SPECIALTIES
Table 5-8.—Fruits, fresh: United States exports by country of destination, 2017–2019
Country 2017 2018 2019
Metric tons
Fresh fruits, deciduous: Mexico .............................................................................. 428,149 462,730 424,824 Canada ............................................................................. 348,683 351,058 340,211 Taiwan .............................................................................. 94,584 81,088 116,561 Vietnam ............................................................................. 35,747 53,087 70,978 India .................................................................................. 105,352 153,411 58,616 Hong Kong ........................................................................ 76,718 58,102 49,181 Indonesia .......................................................................... 44,102 35,029 39,723 Korea, South ..................................................................... 32,244 40,267 31,808 Thailand ............................................................................ 20,002 21,799 26,791 Dominican Republic .......................................................... 22,705 24,990 26,011 China ................................................................................ 50,874 31,984 25,653 Japan ................................................................................ 21,222 23,297 24,454 Philippines ........................................................................ 24,977 23,201 24,402 Australia(*) ........................................................................ 18,754 20,729 20,702 Saudi Arabia ..................................................................... 22,961 20,927 20,204 Guatemala ........................................................................ 15,843 16,892 18,407 United Arab Emirates ....................................................... 35,014 24,802 17,150 Singapore ......................................................................... 12,042 13,075 12,712 Colombia ........................................................................... 16,794 13,381 11,728 El Salvador ....................................................................... 10,384 11,630 11,223 Malaysia ............................................................................ 14,856 18,989 11,178 Israel(*) ............................................................................. 8,999 14,478 10,870 Honduras .......................................................................... 10,741 9,322 10,713 New Zealand(*) ................................................................. 8,482 9,864 9,779 Costa Rica ........................................................................ 12,103 12,511 8,768 Peru .................................................................................. 6,490 4,718 7,040 Ecuador ............................................................................ 6,203 6,100 6,987 Panama ............................................................................ 8,239 7,317 6,126 Trinidad and Tobago ........................................................ 4,939 4,832 4,952 Chile .................................................................................. 3,210 3,815 3,990 Rest of World .................................................................... 46,368 40,839 35,359
World Total ....................................................................... 1,567,780 1,614,262 1,487,102
(*) Denotes a country that is a summarization of its component countries. All zeroes for a data item may show that statis-tics exist in the other import type. Consumption or General. Users should use cautious interpretation on Quantity reports using mixed units of measure. Quantity line items will only include statistics on the units of measure that are equal to, or are able to be converted to, the assigned unit of measure of the grouped commodities.
FAS, Office of Global Analysis, (202) 720-6301. Data Source: U.S. Census Bureau Trade Data.

V–7 AGRICULTURAL STATISTICS 2020
Table 5-9.—Apples: Foreign trade, United States, 2009–2018 1
Year beginning October
Imports, fresh and dried, in terms of fresh
Domestic exports
Fresh Dried, in terms of fresh 1
Metric tons Metric tons Metric tons
2009 ................ 225,717 748,054 22,127 2010 ................ 184,475 817,906 26,802 2011 ................ 219,305 856,819 28,492 2012 ................ 243,093 908,751 22,282 2013 ................ 243,875 848,671 23,741 2014 ................ 209,498 1,057,853 26,092 2015 ................ 233,564 746,893 27,894 2016 ................ 220,426 880,568 25,397 2017 ................ 181,452 996,498 18,652 2018 ................ 193,182 744,453 13,172
1 Dried converted to terms of fresh apples on following basis; 1 pound dried is equivalent to 8 pounds fresh. No re-exports reported.
ERS, Crops Branch, (816) 926–6007.
Table 5-10.—Apricots: Production and value, United States, 2009–2018
Year Total production Utilized production Market year average price per ton Value
Tons Tons Dollars 1,000 dollars
2009 ............... 68,720 68,690 654.00 44,912 2010 ............... 66,380 66,350 722.00 47,876 2011 ............... 66,650 66,620 616.00 41,056 2012 ............... 60,800 60,770 673.00 40,879 2013 ............... 61,035 61,028 737.00 44,987 2014 ............... 64,928 64,918 818.00 53,096 2015 ............... 45,657 45,507 1,010.00 45,889 2016 ............... 64,050 63,950 898.00 57,402 2017 ............... 45,650 45,500 979.00 44,556 2018 ............... 39,550 39,370 1,230.00 48,465
NASS, Crops Branch, (202) 720–2127.
Table 5-11.—Apricots: Production and marketing year average price per ton, by State and United States, 2016–2018
State Total production Utilized production Price for crop of—
2016 2017 2018 2016 2017 2018 2016 2017 2018
Tons Tons Tons Tons Tons Tons Dollars Dollars Dollars
California ......... 56,000 37,000 31,700 55,950 36,900 31,570 875.00 945.00 1,210.00 Washington ..... 8,050 8,650 7,850 8,000 8,600 7,800 1,060.00 1,130.00 1,330.00
United States .. 64,050 45,650 39,550 63,950 45,500 39,370 898.00 979.00 1,230.00
NASS, Crops Branch, (202) 720–2127.

V–8 FRUITS, TREE NUTS, AND HORTICULTURAL SPECIALTIES
Table 5-12.—Apricots: Production and utilization, United States, 2009–2018
Crop of— Total production
Utilized production
Utilization of quantities sold
Fresh Processed 1
Canned Dried (fresh basis)
Tons Tons Tons Tons Tons
2009 ..................... 68,720 68,690 25,170 23,120 9,000 2010 ..................... 66,380 66,350 23,510 20,340 10,000 2011 ..................... 66,650 66,620 23,990 17,230 12,000 2012 ..................... 60,800 60,770 23,130 16,640 9,500 2013 ..................... 61,035 61,028 25,228 14,550 10,000 2014 ..................... 64,928 64,918 25,812 17,550 9,500 2015 ..................... 45,657 45,507 19,104 9,000 9,000 2016 ..................... 64,050 63,950 28,500 13,350 11,000 2017 ..................... 45,650 45,500 22,300 8,400 (D) 2018 ..................... 39,550 39,370 23,870 (NA) (NA)
(D) Withheld to avoid disclosure of individual operations. (NA) Not available. 1 California only. Estimates discontinued in 2018.
NASS, Crops Branch, (202) 720–2127.
Table 5-13.—Apricots: Production and utilization, by State and United States, crop of 2018
State Total production
Utilized production
Utilization
Fresh Processed
Tons
California .............. 31,700 31,570 (D) (D) Washington .......... 7,850 7,800 (D) (D) Other States 1 ...... ...................................... ...................................... 23,870 15,500
United States ....... 39,550 39,370 23,870 15,500
(D) Withheld to avoid disclosure of individual operations. 1 Includes data withheld above. NASS, Crops Branch, (202) 720–2127.
Table 5-14.—Apricots: Foreign trade, United States, 2009–2018
Year beginning October
Domestic exports
Fresh Canned 1 Dried 1 Dried, in fruit salad 2
Total, in terms of fresh 3
Metric tons Metric tons Metric tons Metric tons Metric tons
2009 ..................... 5,555 1,308 1,011 389 11,691 2010 ..................... 5,646 1,389 708 470 10,283 2011 ..................... 7,459 660 634 519 11,191 2012 ..................... 7,774 646 533 547 10,978 2013 ..................... 6,859 755 473 504 9,831 2014 ..................... 5,402 621 370 409 7,749 2015 ..................... 7,249 508 668 214 11,045 2016 ..................... 7,775 718 894 163 12,887 2017 ..................... 4,458 666 749 88 8,784 2018 ..................... 5,010 560 859 106 9,827
1 Net processed weight. 2 Dried apricots are 121⁄3 percent of total dried fruit for salad. 3 Dried fruit converted to unproc-essed dry weight by dividing by 1.07. Unprocessed dry weight converted to terms of fresh fruit on the basis that 1 pound dried equals 5.5 pounds fresh. Canned apricots converted to terms of fresh on the basis that 1 pound canned equals 0.717 pounds fresh.
ERS, Crops Branch, (816) 926–6007.

V–9 AGRICULTURAL STATISTICS 2020
Table 5-15.—Avocados: Foreign trade, United States, 2009–2018
Year beginning October Imports
Metric tons
2009 ....................................................................................... 365,146 2010 ....................................................................................... 385,434 2011 ....................................................................................... 475,630 2012 ....................................................................................... 565,127 2013 ....................................................................................... 699,388 2014 ....................................................................................... 832,841 2015 ....................................................................................... 874,209 2016 ....................................................................................... 877,043 2017 ....................................................................................... 1,017,273 2018 ....................................................................................... 1,083,948
ERS, Crops Branch, (816) 926–5255.
Table 5-16.—Avocados: Total production, marketing year average price per ton, and value of utilized production, by State and United States, 2009/2010 to 2018/2019
Season California Florida
Production Price per ton Value Production Price per ton Value
Tons Dollars 1,000 dollars Tons Dollars 1,000 dollars
2009/2010 ....... 274,800 1,510.00 414,948 23,200 600.00 13,920 2010/2011 ....... 151,500 3,040.00 460,560 22,500 800.00 18,000 2011/2012 ....... 231,500 1,650.00 381,975 31,100 756.00 23,512 2012/2013 ....... (NA) (NA) (NA) (NA) (NA) (NA) 2013/2014 ....... 149,000 2,240.00 333,760 33,400 796.00 26,586 2014/2015 ....... 140,000 2,170.00 303,800 32,500 656.00 21,320 2015/2016 ....... 201,000 2,050.00 412,050 27,300 745.00 20,339 2016/2017 ....... 113,000 3,140.00 351,240 24,100 798.00 19,080 2017/2018 ....... 170,000 2,260.00 382,460 16,900 477.00 8,014 2018/2019 ....... 171,000 2,270.00 383,485 13,900 1,120.00 15,278
Season Hawaii United States
Production Price per ton Value Production Price per ton Value
Tons Dollars 1,000 dollars Tons Dollars 1,000 dollars
2009/2010 ....... 520 1,380.00 718 298,520 1,440.00 429,586 2010/2011 ....... 330 1,540.00 508 174,330 2,750.00 479,068 2011/2012 ....... 350 1,600.00 560 262,950 1,540.00 406,047 2012/2013 ....... (NA) (NA) (NA) (NA) (NA) (NA) 2013/2014 ....... 520 2,000.00 1,040 182,920 1,980.00 361,386 2014/2015 ....... 440 2,860.00 1,258 172,940 1,890.00 326,378 2015/2016 ....... 690 2,310.00 1,481 228,990 1,900.00 433,870 2016/2017 ....... 950 2,150.00 1,934 138,050 2,720.00 372,254 2017/2018 ....... 780 2,080.00 1,538 187,680 2,100.00 392,012 2018/2019 ....... 870 2,040.00 1,591 185,770 2,180.00 400,354
(NA) Not available. NASS, Crops Branch, (202) 720–2127.

V–10 FRUITS, TREE NUTS, AND HORTICULTURAL SPECIALTIES
Table 5-17.—Bananas: Bearing acreage, yield, utilized production, marketing year average price, and value, Hawaii, 2008–2017 1
Year Bearing acreage Yield per acre Utilized Production Price per pound Value
Acres 1,000 pounds 1,000 pounds Cents 1,000 dollars
2008 ............... 1,100 15.8 17,400 46.0 8,004 2009 ............... 1,100 16.8 18,500 55.0 10,175 2010 ............... 1,100 16.2 17,800 60.0 10,680 2011 ............... 1,000 17.4 17,400 65.0 11,310 2012 ............... (NA) (NA) (NA) (NA) (NA) 2013 ............... 1,250 11.6 14,500 90.0 13,050 2014 ............... 1,210 9.9 12,000 82.0 9,840 2015 ............... 1,150 8.0 9,060 91.2 8,265 2016 ............... 1,050 5.3 5,550 101.0 5,592 2017 ............... 950 7.0 6,610 91.2 6,028
(NA) Not available. 1 Estimates discontinued in 2018. NASS, Crops Branch, (202) 720–2127.
Table 5-18.—Kiwifruit: Area, yield, utilized production, marketing year average price, and value, California, 2009–2018
Year Bearing acreage Yield 1 Utilized Production Price per ton Value
Acres Tons Tons Dollars 1,000 dollars
2009 ............... 4,200 6.10 24,900 847 21,084 2010 ............... 4,200 7.79 32,500 768 24,961 2011 ............... 4,000 8.98 36,700 775 28,439 2012 ............... 3,700 8.00 27,100 1,020 27,508 2013 ............... 3,800 7.26 26,900 1,110 29,812 2014 ............... 3,700 7.70 27,900 1,190 33,333 2015 ............... 3,500 5.97 20,900 1,470 30,723 2016 ............... 3,900 7.26 28,300 1,570 44,431 2017 ............... 3,600 9.33 33,200 1,050 34,860 2018 ............... 3,900 9.70 37,800 870 32,886
1 Yield based on total production. NASS, Crops Branch, (202) 720-2127.
Table 5-19.—Cherries: Foreign trade, United States, 2009–2018
Year beginning October
Imports Domestic exports
Fresh Dried and preserved Fresh Canned
Metric tons Metric tons Metric tons Metric tons
2009 ........................... 13,601 5,036 58,737 13,758 2010 ........................... 23,126 5,076 71,542 13,544 2011 ........................... 17,250 6,289 101,073 16,127 2012 ........................... 10,362 6,350 66,937 14,491 2013 ........................... 12,033 6,614 87,626 17,761 2014 ........................... 16,096 10,517 74,707 19,035 2015 ........................... 11,463 8,067 75,952 17,465 2016 ........................... 12,422 8,125 111,772 17,107 2017 ........................... 14,509 9,194 86,648 18,805 2018 ........................... 10,005 9,472 84,318 12,836
ERS, Crops Branch, (816) 926–6007.

V–11 AGRICULTURAL STATISTICS 2020
Table 5-20.—Sweet cherries: Production and value, United States, 2009–2018
Year Total production Utilized production Marketing year average price per ton 1 Value
Tons Tons Dollars 1,000 dollars
2009 ..................... 442,870 385,625 1,330.00 513,330 2010 ..................... 313,220 307,630 2,330.00 715,684 2011 ..................... 334,415 330,290 2,530.00 834,585 2012 ..................... 424,000 418,415 2,020.00 843,313 2013 ..................... 332,090 295,950 2,610.00 771,798 2014 ..................... 363,640 358,910 2,140.00 766,551 2015 ..................... 335,480 333,886 2,250.00 751,122 2016 ..................... 350,240 343,090 2,250.00 773,021 2017 ..................... 437,550 433,020 2,060.00 891,652 2018 ..................... 344,400 342,070 1,860.00 637,700
1 Fresh fruit prices are equivalent packinghouse-door returns for Western States, and the average price as sold for other States. Quantities processed are priced at the equivalent processing plant door level.
NASS, Crops Branch, (202) 720–2127.
Table 5-21.—Tart cherries: Production and value, United States, 2009–2018
Year Total production Utilized production Marketing year average price per pound 1 Value
Million pounds Million pounds Dollars 1,000 dollars
2009 ..................... 359.2 320.8 0.192 61,628 2010 ..................... 190.4 183.2 0.222 40,741 2011 ..................... 231.8 230.3 0.300 69,072 2012 ..................... 85.2 85.0 0.594 50,520 2013 ..................... 294.2 291.1 0.359 104,395 2014 ..................... 304.2 300.6 0.355 106,810 2015 ..................... 252.5 251.1 0.347 87,037 2016 ..................... 329.3 318.7 0.274 87,335 2017 ..................... 259.5 254.1 0.224 56,868 2018 ..................... 214.4 288.8 0.196 56,635
1 Fresh fruit prices are equivalent packinghouse-door returns for Western States, and the average price as sold for other States. Quantities processed are priced at the equivalent processing plant door level.
NASS, Crops Branch, (202) 720–2127.

V–12 FRUITS, TREE NUTS, AND HORTICULTURAL SPECIALTIES
Table 5-22.—Sweet cherries: Production and season average price, by State and United States, 2016–2018
State Total production Utilized production Price 1
2016 2017 2018 2016 2017 2018 2016 2017 2018
Dollars Dollars Dollars Tons Tons Tons Tons Tons Tons per ton per ton per ton
California .............. 55,000 97,800 44,800 52,500 95,000 44,170 3,510.00 3,480.00 3,180.00 Michigan 2 ............ 22,610 21,300 (NA) 22,510 21,020 (NA) 808.00 765.00 (NA) Oregon ................. 62,080 55,900 54,600 59,080 55,400 54,100 1,340.00 1,270.00 1,310.00 Washington .......... 210,550 262,550 245,000 209,000 261,600 243,800 2,350.00 1,810.00 1,750.00
United States ....... 350,240 437,550 344,400 343,090 433,020 342,070 2,250.00 2,060.00 1,860.00
(NA) Not available. 1 Fresh fruit prices are equivalent packinghouse-door returns for California, Oregon, and Washington, and the average price as sold for other States. Quantities processed are priced at the equivalent processing plant door level. 2 Estimates discontinued in 2018.
NASS, Crops Branch, (202) 720–2127.
Table 5-23.—Tart cherries: Production and season average price, by State and United States, 2016–2018
State Total production Utilized production Price 1
2016 2017 2018 2016 2017 2018 2016 2017 2018
Million Million Million Million Million Million Dollars Dollars Dollars pounds pounds pounds pounds pounds pounds per Lb. per Lb. per Lb.
Michigan .............. 227.0 189.2 201.0 224.7 188.0 198.2 0.239 0.211 0.191 New York ............. 7.9 8.0 (D) 7.9 7.7 (D) 0.304 0.316 (D) Utah ..................... 52.8 26.0 45.0 49.6 25.0 41.0 0.353 0.304 0.222 Washington .......... 28.0 25.0 (D) 23.0 24.0 (D) 0.415 0.210 (D) Wisconsin ............ 13.6 11.3 10.9 13.5 9.4 10.0 0.302 0.224 0.193 Other States ........ ............... ............... 41.4 ............... ............... 39.6 (X) (X) 0.194
United States ....... 329.3 259.5 298.3 318.7 254.1 288.8 0.274 0.224 0.196
(D) Withheld to avoid disclosing data for individual operations. (X) Not applicable. 1 Fresh fruit prices are equivalent pack-inghouse-door returns for Oregon and Washington, and the average price as sold for other States. Quantities processed are priced at the equivalent processing plant door level.
NASS, Crops Branch, (202) 720–2127.

V–13 AGRICULTURAL STATISTICS 2020
Table 5-24.—Sweet cherries: Production and utilization, by State and United States, crop of 2018 1
State Total production
Utilized production
Utilization
Fresh 1 Processed 2
Canned Brined
Tons
California ................... 44,800 44,170 35,660 ............................. .............................Michigan 2 .................. (NA) (NA) (NA) ............................. .............................Oregon ....................... 54,600 54,100 41,000 ............................. (NA) Washington ................ 245,000 243,800 214,400 (NA) (NA)
United States ............. 344,400 343,090 291,060 (NA) (NA)
- Represents zero. (NA) Not available. 1 Includes ‘‘Home use.’’ 2 Estimates discontinued in 2018. NASS, Crops Branch, (202) 720–2127.
Table 5-25.—Tart cherries: Production and utilization, by State and United States, crop of 2018 1
State Total production
Utilized production
Utilization
Fresh 1 Processed
Canned 2 Frozen 2
Million pounds
Michigan .................... 201.0 198.2 0.2 (NA) (NA) New York ................... (D) (D) (D) ............................. .............................Utah ........................... 45.0 41.0 ............................. ............................. .............................Washington ................ (D) (D) (D) ............................. .............................Wisconsin .................. 10.9 10.0 0.3 ............................. .............................Other States 3 ............ 41.4 39.6 0.3 (NA) (NA)
United States ............. 298.3 288.8 0.8 (NA) (NA)
(D) Withheld to avoid disclosing data for individual operations. (NA) Not available. 1 Includes ‘‘Home use.’’ 2 Estimates discontinued in 2018. 3 Includes data withheld above and/or data for States not listed in this table.
NASS, Crops Branch, (202) 720–2127.

V–14 FRUITS, TREE NUTS, AND HORTICULTURAL SPECIALTIES
Table 5-26.—Sweet cherries: Production and utilization, United States, 2009–2018
Crop of— Total production
Utilized production
Utilization of quantities sold
Fresh 1 Processed
Other 2 Brined
Tons
2009 ..................... 442,870 385,625 296,750 29,053 51,571 2010 ..................... 313,220 307,630 244,340 21,905 38,234 2011 ..................... 334,415 330,290 258,920 25,495 39,625 2012 ..................... 424,000 418,415 332,555 35,795 47,065 2013 ..................... 332,090 295,950 217,950 28,535 44,945 2014 ..................... 363,640 358,910 268,010 40,360 47,041 2015 ..................... 335,480 333,886 250,806 .............................. 43,090 2016 ..................... 350,240 343,090 257,860 .............................. 51,600 2017 ..................... 437,550 433,020 348,920 .............................. 51,850 2018 ..................... 344,400 342,070 291,060 .............................. ..............................
1 Includes ‘‘Home use.’’ 2 Includes canned utilization and other processed utilizations from all States. NASS, Crops Branch, (202) 720–2127.
Table 5-27.—Tart cherries: Production and utilization, United States, 2009–2018
Crop of— Total production
Utilized production
Utilization of quantities sold
Fresh 1 Processed
Other 2 Frozen
Million pounds
2009 ..................... 359.2 320.8 1.3 35.3 232.0 2010 ..................... 190.4 183.2 0.8 21.2 125.9 2011 ..................... 231.8 230.3 0.5 37.3 154.1 2012 ..................... 85.2 85.0 0.4 18.3 59.8 2013 ..................... 294.2 291.1 1.2 92.4 158.4 2014 ..................... 304.2 300.6 1.9 63.3 198.9 2015 ..................... 252.5 251.1 1.2 .............................. 175.4 2016 ..................... 329.3 318.7 0.6 .............................. 240.6 2017 ..................... 259.5 254.1 0.8 .............................. 169.8 2018 ..................... 298.3 288.8 0.8 .............................. ..............................
1 Includes ‘‘Home use.’’ 2 Includes canned utilization and other processed utilizations from all states. NASS, Crops Branch, (202) 720–2127.

V–15 AGRICULTURAL STATISTICS 2020
Table 5-28.—Citrus fruit: Utilized production and value, United States, for season of 2009/2010 to 2018/2019
Season 1 Production Marketing year average returns per box 2 Value Quantities processed
Oranges 3
1,000 boxes Dollars 1,000 dollars 1,000 boxes
2009/2010 ...... 192,835 10.24 1,997,188 137,628 2010/2011 ...... 204,949 10.90 2,230,412 148,237 2011/2012 ...... 206,119 12.70 2,621,620 149,972 2012/2013 ...... 189,893 10.85 2,073,638 134,799 2013/2014 ...... 155,977 14.29 2,254,303 109,376 2014/2015 ...... 146,602 13.29 1,963,353 102,388 2015/2016 ...... 141,891 13.55 1,927,270 91,791 2016/2017 ...... 118,520 16.30 1,943,678 74,437 2017/2018 ...... 91,130 19.82 1,830,445 50,081 2018/2019 ...... 124,050 13.76 1,704,399 83,115
Grapefruit
2009/2010 ...... 30,400 9.65 291,424 13,231 2010/2011 ...... 30,360 9.29 283,597 14,276 2011/2012 ...... 27,650 10.08 279,033 13,121 2012/2013 ...... 28,950 8.87 256,524 14,340 2013/2014 ...... 25,200 9.60 241,686 12,389 2014/2015 ...... 21,950 9.85 216,258 9,755 2015/2016 ...... 19,400 13.09 254,318 8,794 2016/2017 ...... 16,960 15.12 256,917 7,123 2017/2018 ...... 12,480 16.71 207,970 5,136 2018/2019 ...... 13,810 15.04 206,541 6,889
Lemons
2009/2010 ...... 23,200 17.04 395,339 10,482 2010/2011 ...... 23,000 16.80 386,514 7,987 2011/2012 ...... 21,250 21.12 448,698 4,869 2012/2013 ...... 22,800 17.56 400,295 7,394 2013/2014 ...... 20,600 31.13 641,259 4,840 2014/2015 ...... 22,600 30.83 696,835 7,302 2015/2016 ...... 22,600 33.41 755,086 5,224 2016/2017 ...... 22,050 34.62 763,446 4,535 2017/2018 ...... 22,200 32.24 715,761 5,195 2018/2019 ...... 24,150 28.39 685,708 6,538
Tangerines and Mandarins 4
2009/2010 ...... 14,700 18.30 274,519 3,204 2010/2011 ...... 15,550 20.87 330,503 3,260 2011/2012 ...... 15,290 22.34 349,167 3,029 2012/2013 ...... 16,440 25.60 426,101 2,785 2013/2014 ...... 17,750 31.05 557,357 2,869 2014/2015 ...... 21,135 22.13 468,083 5,614 2015/2016 ...... 23,115 21.23 490,217 7,657 2016/2017 ...... 25,420 22.35 568,084 8,366 2017/2018 ...... 19,950 28.86 575,976 4,664 2018/2019 ...... 26,990 28.01 757,189 6,647
1 The crop year begins with the bloom of the first year shown and ends with completion of harvest the following year. 2 Equivalent packing-house door returns. 3 Includes small quantities of tangerines in Texas and Temples in Flor-ida. 4 Arizona and California tangelos and tangors included. Beginning in 2016/2017, Florida includes tangelos.
NASS, Crops Branch, (202) 720–2127.

V–16 FRUITS, TREE NUTS, AND HORTICULTURAL SPECIALTIES
Table 5-29.—Citrus fruit: Utilized production and marketing year average returns per box, by State, 2017/2018 and 2018/2019 1
Crop and State Utilized production Market year average price 2
2017/2018 2018/2019 2017/2018 2018/2019
1,000 boxes 3 1,000 boxes 3 Dollars Dollars Oranges
Early, midseason, and Navel varieties: California .................................................... 35,900 40,800 25.36 14.23 Florida ........................................................ 18,950 30,400 13.70 12.40 Texas ......................................................... 1,530 2,210 17.37 8.95
Total ........................................................... 56,380 73,410 20.92 13.26
Valencia: California .................................................... 8,300 9,000 22.00 9.99 Florida ........................................................ 26,100 41,350 22.85 18.25 Texas ......................................................... 350 290 25.60 16.60
Total ........................................................... 34,750 50,640 18.14 14.44
All oranges: California .................................................... 44,200 49,800 24.73 13.46 Florida ........................................................ 45,050 71,750 15.58 14.07 Texas ......................................................... 1,880 2,500 18.90 9.84
United States ............................................. 91,130 124,050 19.82 13.76
Grapefruit
California ....................................................... 3,800 3,200 18.34 17.49 Florida, all ...................................................... 3,880 4,510 18.87 18.93
Red ............................................................ 3,180 3,740 19.32 18.92 White 4 ........................................................ 700 770 16.81 18.98
Texas ............................................................. 4,800 6,100 13.56 10.69
United States ................................................. 12,480 13,810 16.71 15.04
Lemons
Arizona .......................................................... 1,000 1,350 34.20 30.89 California ....................................................... 21,200 22,800 32.15 28.25
United States ................................................. 22,200 24,150 32.24 28.29
Tangerines and Mandarins
California 5 ..................................................... 19,200 26,000 28.96 28.29 Florida ............................................................ 750 990 26.60 21.84
United States ................................................. 19,950 26,990 28.86 28.01
1 The crop year begins with the bloom of the first year shown and ends with completion of harvest the following year. 2 Equivalent packinghouse-door returns. 3 Net lbs. per box: oranges—California, 80; Florida, 90; and Texas, 85; grapefruit—California, 80, Florida, 95; Florida, 85; Texas, 80; lemons—80; tangerines and mandarins—California, 80. 4 Includes seedy grapefruit. 5 Includes tangelos and tangors.
NASS, Crops Branch, (202) 720–2127.

V–17 AGRICULTURAL STATISTICS 2020
Table 5-30.—International Citrus, fresh: Production in specified countries, 2017/2018-2019/2020
Country Production
2017/2018 2018/2019 2019/2020
1,000 metric tons
Grapefruit: China .................................................. 4,800 4,900 4,930 United States ...................................... 462 512 582 Mexico ................................................ 418 456 468 South Africa ........................................ 403 390 420 Turkey ................................................. 260 250 300 Israel ................................................... 144 139 155 European Union .................................. 107 108 89 Japan .................................................. 26 26 26
Lemons/limes: Mexico ................................................ 2,311 2,401 2,422 Argentina ............................................ 1,770 1,800 1,600 European Union .................................. 1,472 1,684 1,470 Turkey ................................................. 1,000 1,100 1,000 United States ...................................... 806 876 740 South Africa ........................................ 446 498 530 Israel ................................................... 65 68 75 Japan .................................................. 50 42 51 Morocco .............................................. 36 45 40 United Arab Emirates ......................... 5 5 5
Oranges: Brazil ................................................... 15,953 19,380 15,100 China .................................................. 7,300 7,200 7,300 European Union .................................. 6,270 6,505 5,840 United States ...................................... 3,560 4,833 4,898 Mexico ................................................ 4,737 4,389 4,417 Egypt ................................................... 3,120 3,600 3,000 Turkey ................................................. 1,905 1,900 1,800 South Africa ........................................ 1,586 1,500 1,560 Morocco .............................................. 1,021 1,183 815 Vietnam ............................................... 770 770 770 Argentina ............................................ 750 800 720 Australia .............................................. 525 510 500 Costa Rica .......................................... 315 295 310 Guatemala .......................................... 180 180 180 Israel ................................................... 76 68 76 Iraq ...................................................... 75 75 75 Mozambique ....................................... 68 68 68 Bangladesh ......................................... 21 21 21 Malaysia .............................................. 13 13 13 Japan .................................................. 6 6 6
Tangerines/mandarins: China .................................................. 21,200 22,000 23,000 European Union .................................. 2,913 3,213 2,643 Turkey ................................................. 1,550 1,650 1,500 Japan .................................................. 968 994 952 Morocco .............................................. 1,185 1,375 910 United States ...................................... 729 986 844 Korea, South ....................................... 577 608 645 South Africa ........................................ 356 390 420 Argentina ............................................ 350 450 390 Israel ................................................... 162 198 200 Thailand .............................................. 135 135 135 Philippines .......................................... 13 13 13
FAS, Office of Global Analysis, (202) 720-6301. Prepared or estimated on the basis of official USDA production, supply, and distribution statistics from foreign governments.

V–18 FRUITS, TREE NUTS, AND HORTICULTURAL SPECIALTIES
Table 5-31.—Fresh fruits, citrus: United States exports by country of destination, 2017–2019
Country of destination 2017 2018 2019
Metric tons
Canada ...................................................... 185,034 162,503 166,742 Korea, South .............................................. 226,947 163,937 155,299 Japan ......................................................... 125,874 110,944 119,065 Hong Kong ................................................. 95,831 94,244 81,899 Mexico ........................................................ 21,637 25,460 39,323 China .......................................................... 46,975 42,197 24,719 Australia(*) ................................................. 18,498 16,387 19,935 Taiwan ....................................................... 19,466 9,091 16,222 Singapore ................................................... 11,343 10,123 9,916 Malaysia ..................................................... 10,110 9,388 9,514 New Zealand(*) .......................................... 9,964 10,018 8,979 France(*) .................................................... 10,566 6,935 8,909 Netherlands ................................................ 7,858 9,856 6,816 Chile ........................................................... 6,876 6,918 5,867 Philippines .................................................. 5,737 3,790 3,961 Peru ........................................................... 2,735 2,394 2,599 Indonesia ................................................... 2,593 1,371 2,185 Ecuador ...................................................... 1,311 891 1,766 Bahamas, The ........................................... 1,518 1,564 1,707 Dominican Republic ................................... 761 1,411 1,584 Belgium-Luxembourg(*) ............................. 2,895 1,071 1,170 Thailand ..................................................... 1,729 1,537 1,034 Guatemala ................................................. 838 984 960 United Kingdom ......................................... 1,159 833 832 Vietnam ...................................................... 133 113 729 Panama ...................................................... 577 595 641 Barbados .................................................... 544 577 555 Cayman Islands ......................................... 353 299 540 Other Pacific Islands, NEC(*) .................... 119 281 517 French Pacific Islands(*) ............................ 331 474 356 Rest of World ............................................. 4,466 2,914 2,318
World Total ......................................... 824,779 699,097 696,656
(*) Denotes a country that is a summarization of its component countries. Users should use cautious interpretation on quantity reports using mixed units of measure. Quantity line items will only include statistics on the units of measure that are equal to, or are able to be converted to, the assigned unit of measure of the grouped commodities.
FAS, Office of Global Analysis,(202) 720–6301. Data Source: U.S. Census Bureau Trade Data.

V–19 AGRICULTURAL STATISTICS 2020
Table 5-32.—Fresh citrus fruits: Foreign trade, United States, 2009–2018
Year 1
Oranges Grapefruit Lemons Limes Tangerines
Imports Domestic exports Imports Domestic
exports Imports Domestic exports Imports Domestic
exports Imports Domestic exports
Metric Metric Metric Metric Metric Metric Metric Metric Metric Metric tons tons tons tons tons tons tons tons tons tons
2009 ...... 101,180 665,157 11,370 245,696 40,848 91,445 362,317 2,317 7,748 18,195 2010 ...... 92,159 752,613 7,103 225,836 56,278 97,275 352,956 2,550 6,101 30,419 2011 ...... 131,519 694,530 2,869 207,537 50,939 92,081 423,350 3,434 4,202 22,786 2012 ...... 130,812 679,660 11,862 182,725 38,152 104,031 438,830 4,389 3,614 23,529 2013 ...... 156,261 507,665 13,777 146,673 56,996 122,420 438,273 4,569 2,573 17,628 2014 ...... 152,211 523,345 9,291 140,729 85,519 109,663 499,221 3,954 4,565 18,713 2015 ...... 166,074 655,187 21,931 123,458 83,851 107,338 542,152 4,433 7,882 12,837 2016 ...... 172,345 613,808 26,845 108,030 110,252 106,831 602,749 4,846 2,250 12,916 2017 ...... 219,023 511,675 10,216 57,647 110,827 88,565 605,356 5,342 3,550 11,749 2018 ...... 195,781 476,937 15,206 57,395 135,860 89,978 643,428 6,860 4,003 11,531
1 Year beginning October for all commodities. ERS, Crops Branch, (816) 926–6007.
Table 5-33.—Concentrated citrus juices: Annual packs, Florida, 2009–2018
Season beginning December
Frozen concentrated juice 1
Orange 2 Grapefruit 2 Tangerine
1,000 gallons 1,000 gallons 1,000 gallons
2009 ..................... 82,260 7,904 740 2010 ..................... 82,106 9,297 1,374 2011 ..................... 106,432 9,059 1,083 2012 ..................... 76,132 7,437 928 2013 ..................... 35,655 5,745 825 2014 ..................... 28,878 4,504 1,046 2015 ..................... 22,269 3,275 276 2016 ..................... 17,916 2,187 .....................................................2017 ..................... 9,948 600 .....................................................2018 ..................... 21,012 696 .....................................................
1 Net pack. 2 Frozen orange juice reported in 42.0° Brix; Grapefruit 40.0° Brix. Includes concentrated juice for manufac-ture.
ERS, Crops Branch, (816) 926–6007.

V–20 FRUITS, TREE NUTS, AND HORTICULTURAL SPECIALTIES
Table 5-34.—Dates: Area, yield, total production, marketing year average price per ton, and value, California, 2009–2018
Year Bearing acreage Yield per acre Production Price per ton Value
Acres Tons Tons Dollars 1,000 dollars
2009 ............... 6,700 3.54 23,700 1,180 27,966 2010 ............... 7,700 3.77 29,000 1,270 36,830 2011 ............... 8,400 3.96 33,300 1,320 43,956 2012 ............... 8,800 3.53 31,100 1,340 41,674 2013 ............... 8,200 3.72 30,500 1,220 37,210 2014 ............... 10,000 3.34 33,400 1,510 50,434 2015 ............... 10,200 3.82 39,000 1,560 60,840 2016 ............... 12,300 3.04 37,340 2,020 75,156 2017 ............... 13,400 3.23 43,320 3,510 150,959 2018 ............... 13,100 3.13 41,050 3,800 152,175
NASS, Crops Branch, (202) 720–2127.
Table 5-35.—Dates: Foreign trade, United States, 2009–2018
Year beginning October Imports
Metric tons
2009 ....................................................................................... 12,094 2010 ....................................................................................... 20,113 2011 ....................................................................................... 22,875 2012 ....................................................................................... 23,945 2013 ....................................................................................... 28,974 2014 ....................................................................................... 32,189 2015 ....................................................................................... 27,939 2016 ....................................................................................... 21,900 2017 ....................................................................................... 35,823 2018 ....................................................................................... 27,930
ERS, Crops Branch, (816) 927–6007.
Table 5-36.—Cranberries: Area, yield, production, season average price per barrel, value and quantities processed, United States, 2009–2018 1
Year Area harvested
Yield per acre 2
Total production 3
Utilized production Price 4 Value Quantities
processed 5
Acres Barrels 6 Barrels 6 Barrels 6 Dollars 1,000 dollars Barrels 6
2009 ............... 38,500 179.6 6,913,000 6,913,000 44.20 305,669 6,580,000 2010 ............... 38,500 176.8 6,808,200 6,808,200 43.90 299,123 6,589,000 2011 ............... 38,500 200.4 7,713,700 7,713,700 44.80 345,561 7,473,200 2012 ............... 40,300 199.6 8,045,000 8,045,000 47.90 385,506 7,791,000 2013 ............... 42,000 211.4 8,957,400 8,880,700 32.40 287,322 8,559,300 2014 ............... 40,600 202.9 8,400,000 8,236,000 30.90 254,412 7,968,000 2015 ............... 40,900 206.7 8,563,000 8,455,000 31.00 261,853 8,004,800 2016 ............... 41,500 230.0 9,627,400 9,544,000 30.60 292,292 9,083,900 2017 ............... 39,900 209.1 8,394,050 8,343,150 30.20 252,088 8,010,250 2018 ............... 39,300 227.1 8,926,000 8,846,560 25.10 222,440 8,578,900
1 Estimates relate to Massachusetts, New Jersey, Oregon, Washington, and Wisconsin. 2 Derived from utilized produc-tion. 3 Differences between utilized and total production are quantities unharvested for economic reasons or excess cullage and/or set-aside production under provisions of the Cranberry Marketing Order. 4 Average price of utilized production. Equivalent returns at first delivery point, screened basis of utilized production. 5 Mainly for canning. 6 Barrels of 100 pounds.
NASS, Crops Branch, (202) 720–2127.

V–21 AGRICULTURAL STATISTICS 2020
Table 5-37.—Cranberries: Area, yield, production, and season average price per barrel, by State and United States, 2016–2018
State Area harvested Yield per acre 1
2016 2017 2018 2016 2017 2018
Acres Acres Acres Bbl. Bbl. Bbl.
Massachusetts ................... 12,900 12,300 12,700 174.3 154.0 180.4 New Jersey ........................ 3,100 2,700 3,100 208.4 178.8 165.3 Oregon ............................... 2,800 2,800 2,800 140.7 173.0 206.7 Washington 2 ...................... 1,600 1,500 (NA) 109.4 98.4 (NA) Wisconsin .......................... 21,100 20,600 20,700 288.2 259.5 267.8
United States ..................... 41,500 39,900 39,300 230.0 209.1 227.1
State Total production Price per barrel 3
2016 2017 2018 2016 2017 2018
Bbl. Bbl. Bbl. Dollars Dollars Dollars
Massachusetts ................... 2,268,000 1,911,400 2,290,000 30.70 31.50 22.30 New Jersey ........................ 653,000 473,300 512,000 43.10 36.60 31.10 Oregon ............................... 401,000 489,700 579,000 26.50 26.40 24.30 Washington 2 ...................... 175,400 147,650 (NA) 44.20 42.50 (NA) Wisconsin .......................... 6,130,000 5,372,000 5,545,000 29.20 29.20 25.90
United States ..................... 9,627,400 8,394,050 8,926,000 30.60 30.20 25.10
1 2016 and 2017 yield is based upon utilized production. 2018 yield is based upon total production. 2 Estimates discon-tinued in 2018. 3 Average price of utilized production. Equivalent returns at first delivery point, screened basis of utilized production.
NASS, Crops Branch, (202) 720–2127.
Table 5-38.—Figs: Total production, marketing year average price per ton, and value, California, 2008–2017 1
Year
Dried Total
Production (dry basis) Price per ton Production Price per
ton Value Total Standard Substandard
Tons 1,000 tons Tons Dollars Tons Dollars 1,000 dollars
2008 ............... 13,100 11,800 1,300 1,200 43,300 599 25,954 2009 ............... 13,300 12,000 1,300 1,540 43,750 695 30,422 2010 ............... 12,320 10,900 1,420 1,220 40,910 542 22,185 2011 ............... 11,560 10,140 1,420 1,230 38,660 526 20,336 2012 ............... 10,400 9,600 800 1,350 35,200 555 19,520 2013 ............... 9,300 8,600 700 1,500 33,000 610 20,143 2014 ............... 9,470 8,840 630 1,640 33,400 719 23,998 2015 ............... 8,940 8,320 620 1,760 31,700 799 25,333 2016 ............... 9,260 8,720 540 1,870 32,700 911 29,779 2017 ............... 9,100 8,570 530 1,490 31,200 916 28,568
1 Estimates discontinued in 2018. NASS, Crops Branch, (202) 720–2127.
Table 5-39.—Figs, dried: Foreign trade, United States, 2009–2018
Year beginning October Imports for consumption Domestic exports
Metric tons Metric tons
2009 ............... 4,035 5,795 2010 ............... 4,042 5,065 2011 ............... 4,236 5,449 2012 ............... 5,816 4,895 2013 ............... 10,294 4,537 2014 ............... 7,137 4,670 2015 ............... 11,821 3,964 2016 ............... 9,983 4,295 2017 ............... 12,427 3,353 2018 ............... 10,917 2,654
ERS, Crops Branch, (816) 926–6007.

V–22 FRUITS, TREE NUTS, AND HORTICULTURAL SPECIALTIES
Table 5-40.—Grapes: Production, price, and value, United States, 2009–2018
Year
Grapes
Production (fresh basis) Market year average price per ton 1 Value
Total Utilized
Tons Tons Dollars 1,000 dollars
2009 ..................... 7,267,890 7,240,310 566.00 4,101,600 2010 ..................... 7,432,120 7,429,490 542.00 4,023,967 2011 ..................... 7,408,740 7,401,370 576.00 4,262,945 2012 ..................... 7,530,883 7,524,443 752.00 5,661,096 2013 ..................... 8,631,790 8,620,810 712.00 6,135,301 2014 ..................... 7,883,830 7,871,580 740.00 5,822,250 2015 ..................... 7,621,150 7,621,080 776.00 5,914,468 2016 ..................... 7,697,030 7,694,900 818.00 6,294,150 2017 ..................... 7,383,850 7,383,160 881.00 6,507,849 2018 ..................... 7,596,000 7,596,000 871.00 6,615,121
1 Fresh fruit prices are equivalent packinghouse-door returns for California and Washington, and the average price as sold for other States. Quantities processed are priced at the equivalent processing plant door level.
NASS, Crops Branch, (202) 720–2127.
Table 5-41.—Grapes: Production and marketing year average price per ton, by State and United States, 2016–2018
State Total production Utilized production
2016 2017 2018 2016 2017 2018
Tons Tons Tons Tons Tons Tons California ................ 6,752,000 6,507,000 7,130,000 6,752,000 6,507,000 7,130,000
Raisin 1 ............... 1,570,000 1,301,000 1,545,000 1,570,000 1,301,000 1,545,000 Table 1 ................ 1,150,000 1,190,000 1,300,000 1,150,000 1,190,000 1,300,000 Wine ................... 4,032,000 4,016,000 4,285,000 4,032,000 4,016,000 4,285,000
Michigan 2 .............. 93,400 63,600 (NA) 93,400 63,500 (NA) Missouri 2 ............... 5,330 6,130 (NA) 5,330 6,100 (NA) New York 2 ............. 171,000 187,000 (NA) 171,000 187,000 (NA) North Carolina 2 ..... 4,900 7,210 (NA) 4,900 7,200 (NA) Ohio 2 ..................... 5,500 4,640 (NA) 5,470 4,600 (NA) Oregon 2 ................. 67,000 77,000 (NA) 67,000 77,000 (NA) Pennsylvania 2 ....... 85,800 91,700 (NA) 83,800 91,300 (NA) Texas 2 ................... 13,600 11,760 (NA) 13,500 11,660 (NA) Virginia 2 ................. 8,500 8,810 (NA) 8,500 8,800 (NA) Washington ............ 490,000 419,000 466,000 490,000 419,000 466,000
Juice ................... 220,000 190,000 205,000 220,000 190,000 205,000 Wine ................... 270,000 229,000 261,000 270,000 229,000 261,000
United States ......... 7,697,030 7,383,850 7,596,000 7,694,900 7,383,160 7,596,000
State Price per ton 3
2016 2017 2018
Dollars Dollars Dollars California ................ 832.00 899.00 877.00
Raisin 1 ............... 277.00 414.00 424.00 Table 1 ................ 1,340.00 1,330.00 978.00 Wine ................... 905.00 927.00 1,010.00
Michigan 2 ............... 312.00 379.00 (NA) Missouri 2 ................ 934.00 702.00 (NA) New York 2 ............. 373.00 369.00 (NA) North Carolina 2 ...... 895.00 734.00 (NA) Ohio 2 ..................... 554.00 644.00 (NA) Oregon 2 ................. 2,140.00 2,230.00 (NA) Pennsylvania 2 ........ 324.00 281.00 (NA) Texas 2 ................... 1,530.00 1,620.00 (NA) Virginia 2 ................. 1,980.00 2,170.00 (NA) Washington ............ 735.00 761.00 774.00
Juice ................... 213.00 220.00 220.00 Wine ................... 1,160.00 1,210.00 1,210.00
United States ......... 818.00 881.00 871.00
(NA) Not available. 1 Fresh equivalent of dried and not dried. 2 Estimates discontinued in 2018. 3 Fresh fruit prices are equivalent packinghouse-door returns for California and Washington, and the average price as sold for other States. Quan-tities processed are priced at the equivalent processing plant door level.
NASS, Crops Branch, (202) 720–2127.

V–23 AGRICULTURAL STATISTICS 2020
Table 5-42.—Grapes: Production and utilization, United States, 2009–2018
Crop of— Total production 1
Utilized production
Utilization of quantities sold
Fresh
Processed
Canned Dried (fresh basis)
Crushed for wine
Crushed for juice, etc. 2
Tons
2009 ................ 7,267,890 7,240,310 898,940 20,000 1,510,000 4,373,070 438,300 2010 ................ 7,432,120 7,429,490 953,290 25,000 1,777,000 4,270,300 403,900 2011 ................ 7,408,740 7,401,370 944,740 25,000 1,807,000 4,154,530 470,100 2012 ................ 7,530,883 7,524,443 963,483 20,000 1,488,000 4,706,470 346,490 2013 ................ 8,631,790 8,620,810 1,116,940 22,000 1,909,000 5,067,610 504,160 2014 ................ 7,883,830 7,871,580 1,053,040 21,000 1,721,000 4,526,020 549,920 2015 ................ 7,621,150 7,621,080 1,043,970 22,000 1,864,000 4,254,330 435,780 2016 ................ 7,697,030 7,694,900 1,039,950 19,000 1,478,000 4,667,830 488,420 2017 ................ 7,383,850 7,383,160 1,030,310 16,000 1,221,000 4,662,950 451,900 2018 ................ 7,596,000 7,596,000 1,098,900 (NA) (NA) (NA) (NA)
1 Total production includes utilized production plus production not harvested and harvested not sold. 2 Mostly juice, but includes some quantities used for jam, jelly, etc.
NASS, Crops Branch, (202) 720–2127.
Table 5-43.—Grapes: Production and utilization, by State and United States, crop of 2018
State Total production
Utilized production
Utilization
Fresh Processed
Tons
California ................... 7,130,000 7,130,000 1,098,900 6,031,100 Raisin ..................... 1,545,000 1,545,000 10,800 1,534,200 Table ...................... 1,300,000 1,300,000 1,088,100 211,900 Wine ....................... 4,285,000 4,285,000 ..................................... 4,285,000
Michigan 1 .................. (NA) (NA) (NA) (NA) Missouri 1 ................... (NA) (NA) (NA) (NA) New York 1 ................. (NA) (NA) (NA) (NA) North Carolina 1 ......... (NA) (NA) (NA) (NA) Ohio 1 ......................... (NA) (NA) (NA) (NA) Oregon 1 .................... (NA) (NA) (NA) (NA) Pennsylvania 1 ........... (NA) (NA) (NA) (NA) Texas 1 ....................... (NA) (NA) (NA) (NA) Virginia 1 .................... (NA) (NA) (NA) (NA) Washington ................ 466,000 466,000 ..................................... 466,000
Juice ....................... 205,000 205,000 ..................................... 205,000 Wine ....................... 261,000 261,000 ..................................... 261,000
United States ............. 7,596,000 7,596,000 1,098,900 6,497,100
(NA) Not available. 1 Estimates discontinued in 2018. NASS, Crops Branch, (202) 720–2127.

V–24 FRUITS, TREE NUTS, AND HORTICULTURAL SPECIALTIES
Table 5-44.—Grapes and raisins: Foreign trade, United States, 2009–2018
Year beginning October
Grapes Raisins 1
Imports, fresh Domestic exports, fresh Imports for consumption Domestic exports
Metric tons
2009 ..................... 602,273 284,092 24,289 173,049 2010 ..................... 557,397 334,609 18,813 154,541 2011 ..................... 557,310 378,504 19,336 142,997 2012 ..................... 566,038 366,088 17,102 131,980 2013 ..................... 500,977 421,560 14,904 174,024 2014 ..................... 554,674 366,143 20,588 132,274 2015 ..................... 532,383 329,973 25,421 124,775 2016 ..................... 625,371 330,190 14,753 136,454 2017 ..................... 580,062 333,931 46,411 104,550 2018 ..................... 643,553 370,511 29,380 84,051
1 Raisins converted to sweatbox or production basis by multiplying by 1.08. ERS, Crops Branch, (816) 926–6007.
Table 5-45.—Nectarines: Total Production, utilization, and value, United States, 2009–2018
Year Total Production
Utilization Marketing year average price per
ton Value
Fresh Processed (fresh basis)
Tons Tons Tons Dollars 1,000 dollars
2009 ..................... 219,800 219,800 (NA) 631.00 138,611 2010 ..................... 233,200 233,200 (NA) 553.00 129,075 2011 ..................... 225,200 225,200 (NA) 582.00 130,973 2012 ..................... 188,900 188,900 (NA) 767.00 144,906 2013 ..................... 162,100 148,300 13,800 772.00 125,113 2014 ..................... 187,300 170,000 9,300 866.00 162,221 2015 ..................... 159,500 150,600 6,600 910.00 143,061 2016 ..................... 151,350 145,600 5,600 885.00 133,791 2017 ..................... 141,850 135,200 5,600 911.00 128,255 2018 ..................... 120,500 (D) (D) 874.00 104,626
(D) Withheld to avoid disclosing data for individual operations. (NA) Not available NASS, Crops Branch, (202) 720–2127.

V–25 AGRICULTURAL STATISTICS 2020
Table 5-46.—Olives: Total production, marketing year average price, value, and processed utilization, California, 2009–2018
Year Total Production
Marketing year average price per ton
Value
Processed utilization
Crushed for oil Canned Limited Undersized
Tons Dollars 1,000 dollars Tons Tons Tons Tons
2009 ......... 46,300 696 32,209 20,000 24,500 1,500 300 2010 ......... 206,000 664 136,796 36,000 125,000 37,000 8,000 2011 ......... 71,200 733 52,168 42,000 26,500 2,200 500 2012 ......... 160,000 813 130,038 74,000 78,500 6,400 1,100 2013 ......... 166,000 813 134,881 75,000 78,800 10,500 1,700 2014 ......... 95,000 774 73,559 45,000 30,500 5,900 900 2015 ......... 179,000 894 160,043 101,000 60,000 14,600 3,400 2016 ......... 164,900 860 141,761 97,700 54,000 11,100 2,000 2017 ......... 192,300 974 186,649 101,000 70,000 17,300 3,400 2018 ......... 53,600 766 40,523 35,500 14,920 2,060 420
NASS, Crops Branch, (202) 720–2127.
Table 5-47.—Olives and olive oil: Foreign trade, United States, 2009–2018
Year beginning October
Imports
Olives Olive oil
In brine Dried Edible Inedible
Metric tons
2009 ....................................... 137,533 184 268,069 114 2010 ....................................... 117,915 206 290,226 258 2011 ....................................... 118,614 145 314,937 788 2012 ....................................... 119,035 131 296,029 379 2013 ....................................... 118,734 202 311,142 351 2014 ....................................... 119,442 130 310,110 163 2015 ....................................... 127,273 48 330,323 153 2016 ....................................... 121,988 47 315,493 156 2017 ....................................... 121,941 75 321,496 215 2018 ....................................... 141,063 123 319,443 196
ERS, Crops Branch, (816) 926–6007.
Table 5-48.—Papayas: Area, utilized production, utilization, marketing year average price, and value, Hawaii, 2009–2018
Year Area harvested
Utilized production
Utilization Price per pound Value
Fresh Processed
Acres 1,000 pounds 1,000 pounds 1,000 pounds Cents dollars
2009 ............ 1,325 31,500 30,300 1,200 45.0 14,186 2010 ............ 1,350 30,100 29,200 900 37.0 11,123 2011 ............ 1,300 28,600 27,700 900 34.0 9,722 2012 ............ (NA) (NA) (NA) (NA) (NA) (NA) 2013 ............ 700 24,200 23,000 1,200 34.4 8,316 2014 ............ 900 23,500 23,000 500 48.0 11,285 2015 ............ 900 25,200 (D) (D) 41.9 10,570 2016 ............ 700 19,750 (D) (D) 49.2 9,713 2017 ............ 1,100 22,250 (D) (D) 42.2 9,400 2018 ............ 800 10,290 7,000 3,290 55.4 5,702
(D) Withheld to avoid disclosing data for individual operations. (NA) Not available. NASS, Crops Branch, (202) 720–2127.

V–26 FRUITS, TREE NUTS, AND HORTICULTURAL SPECIALTIES
Table 5-49.—Peaches: Production and value, United States, 2009–2018
Year Total production Utilized production Marketing year average price 1 Value
1,000 tons 1,000 tons Dollars per ton 1,000 dollars
2009 ............... 1,103,520 1,082,420 548 593,387 2010 ............. 1,149,430 1,129,770 547 617,459 2011 ............... 1,071,270 1,042,340 563 587,228 2012 ............... 968,070 955,890 647 618,369 2013 ............... 905,371 890,181 618 550,243 2014 ............... 852,799 837,907 750 628,846 2015 ............... 844,780 823,005 732 602,214 2016 ............... 791,940 775,230 803 622,624 2017 ............... 700,770 694,220 864 599,862 2018 ............... 651,500 638,020 801 511,226
1 Fresh fruit prices are equivalent packinghouse-door returns for California and Washington except equivalent returns for bulk fruit at the first delivery point for California Clingstone, and the average price as sold for other States. Quantities pro- cessed are priced at the equivalent processing plant door level.
NASS, Crops Branch, (202) 720–2127.
Table 5-50.—Peaches: Production and utilization, United States, 2009–2018
Year Total production 1
Utilized production
Utilization of quantities sold
Fresh 2 Processed (fresh basis)
Canned 3 Dried Frozen 3 Other 4
Tons
2009 ......... 1,103,520 1,082,420 502,920 463,740 7,100 92,000 16,850 2010 ....... 1,149,430 1,129,770 566,400 428,470 12,700 104,400 17,800 2011 ......... 1,071,270 1,042,340 531,050 387,190 4,600 100,600 18,900 2012 ......... 968,070 955,890 480,750 364,640 9,800 90,210 10,490 2013 ......... 905,371 890,181 398,470 369,751 4,200 103,740 14,020 2014 ......... 852,799 837,907 393,200 330,220 4,200 95,290 14,497 2015 ......... 844,780 823,005 355,335 339,530 (NA) 108,400 (NA) 2016 ......... 791,940 775,230 333,350 322,350 (NA) 100,320 (NA) 2017 ......... 700,770 694,220 314,600 301,460 (NA) 62,500 (NA) 2018 ......... 651,500 638,020 279,790 (NA) (NA) (NA) (NA)
1 Includes harvested not sold and unharvested production for California Clingstone peaches. 2 Includes ‘‘Home use.’’ 3 Estimated discontinued in 2018. 4 Used for jams, preserves, pickles, wine, brandy, baby food, etc. Includes small quantities frozen for some years.
NASS, Crops Branch, (202) 720–2127.
Table 5-51.—Peaches: Foreign trade, United States, 2009–2018
Year beginning October
Domestic exports
Fresh Canned Canned, in fruit salad 1
Dried, in fruit salad 2 3
Total, in terms of fresh 4
Metric tons Metric tons Metric tons Metric tons Metric tons
2009 ............... 103,038 16,914 11,701 662 135,329 2010 ............... 103,523 25,636 15,568 801 149,175 2011 ............... 95,798 28,295 17,605 884 146,609 2012 ............... 102,140 25,526 21,811 931 154,648 2013 ............... 80,241 20,847 20,144 859 126,004 2014 ............... 84,680 18,007 20,098 696 126,653 2015 ............... 77,769 10,689 18,698 364 109,179 2016 ............... 54,845 7,378 19,441 278 83,207 2017 ............... 63,966 9,451 20,470 150 94,720 2018 ............... 73,555 5,848 19,602 181 100,012
1 Canned peaches are 40 percent of total canned fruit for salad. 2 Net processed weight. 3 Dried peaches are 21 per-cent of total dried fruit for salad. 4 Dried fruit converted to unprocessed dry weight by dividing by 1.08. Unprocessed dry weight converted to terms of fresh fruit on the basis that 1 pound dried equals 6.0 pounds fresh. Canned peaches converted to terms of fresh on basis that 1 pound canned equals about 1 pound fresh.
ERS, Crops Branch, (816) 926–6007.

V–27 AGRICULTURAL STATISTICS 2020
Table 5-52.—Peaches: Production and season average price, by State and United States, 2016–2018
State Total production Utilized production Price per ton 1
2016 2017 2018 2016 2017 2018 2016 2017 2018
Tons Tons Tons Tons Tons Tons Dollars Dollars Dollars
Alabama 2 ........ 3,300 1,500 (NA) 3,270 1,500 (NA) 1,390.00 2,750.00 (NA) California 569,000 553,000 479,000 569,000 550,000 475,870 616.00 701.00 639.00
Clingstone ... 322,000 297,000 259,000 322,000 296,000 256,950 518.00 474.00 480.00 Freestone ... 247,000 256,000 220,000 247,000 254,000 218,920 743.00 966.00 826.00
Colorado .......... 13,730 10,750 15,000 13,260 10,160 14,550 2,040.00 2,070.00 1,930.00 Georgia ............ 43,300 10,000 26,000 39,500 9,600 23,400 1,070.00 1,820.00 1,020.00 Idaho 2 ............. 7,770 5,220 (NA) 7,720 5,120 (NA) 900.00 1,290.00 (NA) Illinois 2 ............ 5,420 6,030 (NA) 5,370 5,880 (NA) 2,570.00 1,460.00 (NA) Maryland 2 ........ 2,550 4,060 (NA) 2,430 4,000 (NA) 1,280.00 1,320.00 (NA) Michigan .......... 11,000 9,600 12,000 10,900 9,500 11,940 885.00 1,140.00 1,060.00 Missouri 2 ......... 2,570 2,230 (NA) 2,540 2,230 (NA) 1,740.00 2,340.00 (NA) New Jersey ..... 18,470 24,580 23,000 18,400 24,570 23,000 1,430.00 1,560.00 1,780.00 New York 2 ....... 2,420 4,810 (NA) 2,410 4,720 (NA) 1,380.00 1,720.00 (NA) North Carolina 2 2,700 1,740 (NA) 2,700 1,740 (NA) 1,290.00 1,540.00 (NA) Ohio 2 ............... 1,570 4,730 (NA) 1,530 4,680 (NA) 1,750.00 1,720.00 (NA) Pennsylvania ... 16,000 21,400 17,400 15,800 21,000 16,970 1,210.00 1,180.00 1,220.00 South Carolina 63,300 11,000 65,800 52,800 10,400 59,220 1,290.00 1,700.00 1,210.00 Texas 2 ............. 4,400 2,700 (NA) 4,200 2,500 (NA) 2,200.00 2,500.00 (NA) Utah 2 ............... 5,160 3,400 (NA) 4,250 3,370 (NA) 1,640.00 1,460.00 (NA) Virginia 2 .......... 3,250 4,650 (NA) 3,250 3,950 (NA) 1,340.00 1,450.00 (NA) Washington ..... 12,530 12,770 13,300 12,400 12,700 13,070 1,090.00 963.00 696.00 West Virginia 2 3,500 6,600 (NA) 3,500 6,600 (NA) 1,090.00 940.00 (NA)
United States ... 791,940 700,770 651,500 775,230 694,220 638,020 803.00 864.00 801.00
(NA) Not available. 1 Fresh fruit prices are equivalent packing house-door returns for California and Washington except equivalent returns for bulk fruit at the first delivery point for California Clingstone, and the average price as sold for other States. Quantities processed are priced at the equivalent processing plant door level. 2 Estimates discontinued in 2018.
NASS, Crops Branch, (202) 720–2127.
Table 5-53.—Peaches: Production and utilization, by State and United States, crop of 2018
State Total production
Utilized production 1
Utilization
Fresh 2 Processed (fresh basis)
Tons
California 479,000 475,870 134,000 341,870 Clingstone ......................... 259,000 256,950 - 256,950 Freestone .......................... 220,000 218,920 134,000 84,920
Colorado ................................ 15,000 14,550 (D) (D) Georgia .................................. 26,000 23,400 23,400 - Michigan ................................. 12,000 11,940 (D) (D) New Jersey ............................ 23,000 23,000 (D) (D) Pennsylvania .......................... 17,400 16,970 13,940 3,030 South Carolina ....................... 65,800 59,220 (D) (D) Washington ............................ 13,300 13,070 (D) (D) Other States 3 ........................ (NA) (NA) 108,450 13,330
United States ......................... 651,500 638,020 279,790 358,230
- Represents zero. (D) Withheld to avoid disclosing data for individual operations. (NA) Not available. 1 Difference between total and utilized production is harvested not sold and unharvested production. 2 Includes ‘‘Home use.’’ 3 Includes data withheld above.
NASS, Crops Branch, (202) 720–2127.

V–28 FRUITS, TREE NUTS, AND HORTICULTURAL SPECIALTIES
Table 5-54.—Pears: Foreign trade, United States, 2009–2018
Year beginning October
Imports for consumption,
fresh
Domestic exports
Fresh 1 Canned Dried, in fruit salad 1 2
Canned, in fruit salad 3
Total, in terms of fresh fruit 4
Metric tons Metric tons Metric tons Metric tons Metric tons Metric tons
2009 ............... 62,808 159,677 7,112 525 10,238 180,342 2010 ............... 77,992 154,025 7,958 635 13,622 179,615 2011 ............... 64,000 197,633 8,681 702 15,404 226,146 2012 ............... 79,034 186,855 7,535 739 19,084 218,137 2013 ............... 81,586 200,928 6,283 682 17,626 229,139 2014 ............... 89,741 174,774 4,425 553 17,586 200,271 2015 ............... 79,523 148,454 5,824 289 16,361 172,464 2016 ............... 74,356 123,088 7,473 220 17,011 148,963 2017 ............... 79,887 120,757 7,428 119 17,911 146,848 2018 ............... 74,332 148,829 3,412 114 17,152 170,301
1 Net processed weight. 2 Dried pears are 162⁄3 percent of total dried fruit for salad. 3 Canned pears are 35 percent of total canned fruit for salad. 4 Dried converted to unprocessed dry weight by dividing by 1.03. Unprocessed dry weight con-verted to terms of fresh on the basis that 1 pound dried equals about 6.5 pounds fresh. Canned converted to terms of fresh on basis that 1 pound of canned equals about 1 pound fresh.
ERS, Crops Branch, (816) 926-6007.
Table 5-55.—Pears: Production and value, United States 2009–2018
Year Total production Utilized production Marketing year average price 1 Value
Tons Tons Dollars per ton 1,000 dollars
2009 ............... 957,220 955,820 372.00 355,662 2010 ............... 813,600 813,400 476.00 386,955 2011 ............... 965,720 965,110 380.00 366,552 2012 ............... 851,240 851,130 509.00 432,988 2013 ............... 877,130 876,520 491.00 430,660 2014 ............... 831,610 831,250 562.00 467,194 2015 ............... 816,520 803,130 615.00 494,190 2016 ............... 738,770 735,870 660.00 485,763 2017 ............... 737,450 731,350 710.00 519,290 2018 ............... 805,500 800,260 536.00 428,940
1 Fresh fruit prices are equivalent packinghouse-door returns for California, Oregon, and Washington, and the average price as sold for other States. Quantities processed are priced at the equivalent processing plant door level.
NASS, Crops Branch, (202) 720–2127.
Table 5-56.—Pears: Production and season average price per ton, by State and United States, 2016–2018
State and Variety
Total production Utilized production Price per ton 1
2016 2017 2018 2016 2017 2018 2016 2017 2018
Tons Tons Tons Tons Tons Tons Dollars Dollars Dollars
California ......... 175,000 195,000 161,500 175,000 192,000 161,000 548.00 501.00 480.00 Bartlett 2 ...... 141,000 162,000 (NA) 141,000 160,000 (NA) 500.00 420.00 (NA) Other 2 ........ 34,000 33,000 (NA) 34,000 32,000 (NA) 748.00 905.00 (NA)
Oregon ............ 214,910 226,050 246,000 214,010 224,950 245,260 720.00 785.00 575.00 Bartlett 2 ...... 53,660 53,850 (NA) 52,860 52,850 (NA) 635.00 776.00 (NA) Other 2 ........ 161,250 172,200 (NA) 161,150 172,100 (NA) 748.00 788.00 (NA)
Washington ..... 348,860 316,400 398,000 346,860 314,400 394,000 680.00 784.00 535.00 Bartlett 2 ...... 147,660 125,400 (NA) 146,660 124,400 (NA) 582.00 838.00 (NA) Other 2 ........ 201,200 191,000 (NA) 200,200 190,000 (NA) 752.00 748.00 (NA)
United States .. 738,770 737,450 805,500 735,870 731,350 800,260 660.00 710.00 536.00
(NA) Not available. 1 Fresh fruit prices are equivalent packinghouse-door returns for California, Oregon, and Washington, and the average price as sold for other States. Quantities processed are priced at the equivalent processing plant door level. 2 Estimates discontinued in 2018.
NASS, Crops Branch, (202) 720–2127.

V–29 AGRICULTURAL STATISTICS 2020
Table 5-57.—Pears: Production and utilization, by State and United States, crop of 2018
State and variety Total production Utilized production Utilization
Fresh 1 Processed
Tons
California .................... 161,500 161,000 54,100 106,900 Bartlett 2 ................ (NA) (NA) (NA) (NA) Other 2 ................... (NA) (NA) (NA) (NA)
Oregon ....................... 246,000 245,260 209,100 36,160 Bartlett 2 ................ (NA) (NA) (NA) (NA) Other 2 ................... (NA) (NA) (NA) (NA)
Washington ................ 398,000 394,000 294,500 99,500 Bartlett 2 ................ (NA) (NA) (NA) (NA) Other 2 ................... (NA) (NA) (NA) (NA)
United States 3 ........... 805,500 800,260 557,700 242,560
(NA) Not available. 1 Includes ‘‘Home use.’’ 2 Estimates discontinued in 2018. 3 Mostly canned, but includes small quantities dried, juiced, and other uses.
NASS, Crops Branch, (202) 720–2127.
Table 5-58.—Pears: Production and utilization, United States, 2009–2018
Crop of— Total production Utilized production Utilization of quantities sold— Fresh 1
Tons
2009 ........................... 957,220 955,820 603,800 2010 ........................... 813,600 813,400 531,430 2011 ........................... 965,720 965,110 643,710 2012 ........................... 851,240 851,130 551,820 2013 ........................... 877,130 876,520 584,730 2014 ........................... 831,610 831,250 550,080 2015 ........................... 816,520 803,130 514,780 2016 ........................... 738,770 735,870 505,000 2017 ........................... 737,450 731,350 486,150 2018 ........................... 805,500 800,260 557,700
1 Includes ‘‘Home use.’’ NASS, Crops Branch, (202) 720–2127.

V–30 FRUITS, TREE NUTS, AND HORTICULTURAL SPECIALTIES
Table 5-59.—Plums: Production, value, and utilization, California, 2009–2018
Season Total production
Utilized production
Marketing year average price per ton Value
Tons Tons Dollars 1,000 dollars
2009 ............... 112,000 112,000 514 57,568 2010 ............... 142,000 142,000 555 78,810 2011 ............... 160,000 160,000 402 64,320 2012 ............... 115,000 115,000 695 79,940 2013 ............... 100,600 98,600 665 65,527 2014 ............... 104,000 104,000 912 94,842 2015 ............... 92,500 91,500 996 91,125 2016 ............... 108,800 107,800 811 87,460 2017 ............... 117,900 114,900 1,000 114,897 2018 ............... 100,000 99,000 935 92,570
NASS, Crops Branch, (202) 720–2127.
Table 5-60.—Prunes (dried basis): Production, price and value, California, 2009–2018
Season Total production Utilized production Marketing year average price per ton Value
Tons Tons Dollars 1,000 dollars
2009 ............... 166,000 166,000 1,230.00 204,180 2010 ............... 130,000 130,000 1,350.00 175,500 2011 ............... 137,000 137,000 1,310.00 179,470 2012 ............... 138,000 138,000 1,330.00 183,540 2013 ............... 85,000 85,000 2,000.00 170,000 2014 ............... 108,000 108,000 2,470.00 266,760 2015 ............... 112,000 110,000 2,050.00 225,500 2016 ............... 54,000 54,000 2,180.00 117,720 2017 ............... 105,000 105,000 1,980.00 207,900 2018 ............... 90,200 90,200 2,160.00 194,832
NASS, Crops Branch, (202) 720–2127.

V–31 AGRICULTURAL STATISTICS 2020
Table 5-61.—Prunes: Foreign trade, United States, 2009–2018
Year beginning October
Imports Domestic exports
Fresh prunes and
plums
Otherwise prepared
or preserved
Dried prunes 1
Total, in terms of
fresh 2
Fresh prunes and
plums
Dried prunes 1
Dried, in fruit
salad 1 3
Total, in terms of
fresh 2
Metric tons
2009 .......... 27,226 805 620 29,559 47,213 65,070 1,355 219,664 2010 .......... 29,768 831 497 31,805 59,653 69,110 1,639 243,328 2011 .......... 24,105 822 565 26,311 56,788 67,529 1,810 236,801 2012 .......... 30,417 680 1,159 34,036 52,426 68,642 1,906 235,579 2013 .......... 13,625 821 6,844 32,129 41,741 48,498 1,759 172,216 2014 .......... 25,259 798 11,514 55,869 36,506 48,026 1,426 164,891 2015 .......... 26,533 985 19,183 77,221 29,660 38,342 746 131,139 2016 .......... 22,631 1,094 15,069 62,733 25,533 33,159 569 113,095 2017 .......... 22,432 1,038 9,737 48,644 31,026 37,281 307 128,611 2018 .......... 26,661 991 3,700 34,157 29,129 31,973 371 113,100
1 Net processed weight. 2 Exports and imports of dried prunes converted to unprocessed dry weight by dividing by 1.04. Unprocessed dry weight converted to terms of fresh fruit on the basis that 1 pound dried equals 2.7 pounds fresh. ‘‘Other-wise prepared or preserved’’ converted to terms of fresh fruit on the basis that 1 pound equals 0.899 pound fresh. 3 Dried prunes in salad estimated at 43 percent of total dried fruit for salad.
ERS, Crops Branch, (816) 926–6007.
Table 5-62.—Strawberries, commercial crop: Production and value per hundredweight, by State and United States, 2016–2018
Utilization, season, and State
Utilized Production Value per unit
2016 2017 2018 2016 2017 2018
1,000 cwt 1,000 cwt 1,000 cwt Dollars per cwt Dollars per cwt Dollars per cwt Fresh market:
California ........................ 20,829.7 18,996.1 20,285.7 123.00 123.00 104.00 Florida ............................ 1,947.5 (D) 2,450.0 166.00 (D) 115.00 New York ....................... 50.4 (D) (D) 235.00 (D) (D) North Carolina ................ 132.0 126.0 125.0 187.00 168.00 171.00 Oregon ........................... 34.9 32.8 (D) 108.00 195.00 (D) Washington .................... 29.3 (D) (D) 205.00 (D) (D) Other States1 ................. .................... 2,217.1 58.1 (X) 143.00 211.00
United States ................. 23,023.8 21,372.0 22,918.8 127.00 125.00 106.00
Processing: California ........................ 6,265.2 5,553.8 5,464.5 45.90 35.00 42.20 Florida ............................ .................... (D) .................... (X) (D) (X) New York ....................... .................... (D) (D) (X) (D) (D) North Carolina ................ .................... 2.7 .................... (X) 51.90 (X) Oregon ........................... 197.9 167.4 (D) 83.00 93.50 (D) Washington .................... 91.7 (D) (D) 88.00 (D) (D) Other States1 ................. .................... 78.8 167.6 (X) 69.10 88.30
United States ................. 6,554.8 5,802.7 5,632.1 47.60 37.20 43.60
(D) Withheld to avoid disclosing data for individual operations. (X) Not applicable. 1 Includes data withheld above. NASS, Crops Branch, (202) 720–2127.

V–32 FRUITS, TREE NUTS, AND HORTICULTURAL SPECIALTIES
Table 5-63.—Strawberries, commercial crop: Area, yield, production, value per hundred weight, and total value, United States, 2009–2018
Year Area for harvest Yield per acre Total production Value 2
Per cwt Total
Acres Cwt 1,000 cwt Dollars per cwt 1,000 dollars
2009 ... 58,080 482 28,013 76.00 2,129,585 2010 ... 56,890 501 28,520 79.30 2,260,733 2011 ... 57,250 507 29,016 82.40 2,391,406 2012 ... 58,310 523 30,520 80.40 2,453,039 2013 ... 60,410 504 30,470 85.60 2,609,038 2014 ... 59,895 505 30,237 93.30 2,821,854 2015 ... 58,010 528 30,655 73.00 2,239,301 2016 ... 53,760 550 .7 29,606 .9 110.00 3,243,711 2017 ... 53,200 511 .4 27,208 .0 107.00 2,895,813 2018 ... 49,220 580 .6 28,577 .9 93.50 2,670,523
Year
Fresh market 1 Processing
Production Value 2
Production Value 2
Per cwt Total Per cwt Total
1,000 cwt Dollars per cwt 1,000 dollars 1,000 cwt Dollars per cwt 1,000 dollars
2009 ... 22,880 86.10 1,970,920 5,133 30.90 158,665 2010 ... 23,196 90.80 2,105,492 5,324 29.20 155,241 2011 ... 23,324 94.00 2,193,379 5,692 34.80 198,027 2012 ... 24,552 91.80 2,253,854 5,968 33.40 199,185 2013 ... 25,085 96.50 2,421,370 5,385 34.90 187,668 2014 ... 24,543 105.00 2,579,425 5,694 42.60 242,429 2015 ... 24,372 79.90 1,946,121 6,283 46.70 293,180 2016 ... 23,023 .8 127.00 2,931,642 6,554 .8 47.60 312,069 2017 ... 21,372 .0 125.00 2,680,189 5,802 .7 37.20 215,624 2018 ... 22,918 .8 106.00 2,425,126 5,632 .1 43.60 245,397
1 Fresh market price and value at point of first sale. Processing price and value at processing plant door. 2 Mostly for fresh market, but includes some quantities used for processing in States for which processing estimates are not prepared.
NASS, Crops Branch, (202) 720–2127.
Table 5-64.—Strawberries, commercial crop: Area harvested, production, value per hundred weight, by State and United States, 2016–2018 1
Season and State
Area harvested Total production Value per unit
2016 2017 2018 2016 2017 2018 2016 2017 2018
Acres 1,000 cwt Dollars per cwt
California ....... 38,200 38,100 35,800 27,122.0 24,574.5 25,776.0 105.00 103.00 90.90 Florida ........... 9,500 9,500 9,800 1,947.5 2,137.5 2,450.0 166.00 140.00 115.00 New York ...... 1,260 1,200 700 50.4 46.8 30.8 235.00 229.00 204.00 North Carolina 1,100 1,000 1,000 132.0 135.0 125.0 187.00 166.00 171.00 Oregon .......... 2,400 2,200 1,100 232.8 200.2 110.0 86.70 110.00 107.00 Washington ... 1,300 1,200 820 122.2 114.0 86.1 116.00 107.00 107.00
United States 53,760 53,200 49,220 29,606.9 27,208.0 28,577.9 110.00 107.00 93.50
(NA) Not available. 1 Includes quantities used for fresh market and processing. NASS, Crops Branch, (202) 720–2127.

V–33 AGRICULTURAL STATISTICS 2020
Table 5-65.—Fruits, noncitrus: Production, utilization, and value, United States, 2009–2018 1
Year Utilized production Fresh 2
Processed Value of utilized
production Canned Dried Juice Frozen Wine Other
1,000 1,000 1,000 1,000 1,000 1,000 1,000 1,000 1,000 tons tons tons tons tons tons tons tons dollars
2009 ...... 18,069 7,562 1,394 2,148 1,235 742 4,373 269 11,811,298 2010 ...... 17,879 7,458 1,386 2,318 1,103 706 4,270 298 12,367,607 2011 ...... 18,147 7,702 1,301 2,399 1,153 737 4,154 316 13,910,375 2012 ...... 17,635 7,443 1,100 2,091 1,213 707 4,707 374 15,611,441 2013 ...... 19,433 7,718 1,373 2,321 1,630 827 5,068 497 16,220,440 2014 ...... 19,151 8,267 1,208 2,194 1,617 857 4,526 483 16,410,049 2015 ...... 18,334 7,702 1,252 2,323 1,391 881 4,255 530 16,602,493 2016 ...... 18,690 8,042 1,234 1,858 1,519 890 4,668 479 17,865,364 2017 ...... 18,455 8,107 1,188 1,754 1,477 731 4,665 531 18,589,066 2018 3 .... (NA) (NA) (NA) (NA) (NA) (NA) (NA) (NA) (NA)
(NA) Not available. 1 Includes the following crops: Apples, apricots, avocados, bananas, berries, cherries, cranberries, dates, figs, grapes, guavas, kiwifruit, nectarines, olives, papayas, peaches, pears, pineapples, plums, prunes, and straw-berries. 2 Includes local and roadside sales. 3 Estimates discontinued.
NASS, Crops Branch, (202) 720–2127.
Table 5-66.—Fruits, fresh: Total reported domestic rail, truck, and air shipments, 2018
Commodity Jan. Feb. Mar. Apr. May Jun. Jul.
Citrus: 1,000 cwt
Grapefruit ....... 812 599 448 609 417 407 308 Grapefruit-
organic ....... 19 19 20 27 27 27 18 Lemons .......... 616 616 1,780 1,716 1,724 1,716 927 Lemons-
organic ....... 104 104 320 81 81 81 12 Oranges ......... 5,794 5,558 5,614 4,328 4,310 3,358 659 Oranges-
organic ....... 111 111 111 56 56 56 51 Tangelos ........ 385 354 346 38 38 38 .....................Tangelos-
organic ....... 5 5 5 ..................... ..................... ..................... .....................Tangerines ..... 2,174 2,155 2,144 806 806 806 .....................Tangerines-
organic ....... 25 25 25 9 9 9 .....................Temples ......... 2 8 3 ..................... ..................... ..................... .....................
Total ............... 10,047 9,554 10,816 7,670 7,468 6,498 1,975
Commodity Aug. Sep. Oct. Nov. Dec. Total
1,000 cwt
Grapefruit ....... 309 309 291 614 814 5,937 Grapefruit-
organic ....... 18 18 15 18 15 241 Lemons .......... 922 916 1,370 1,379 1,393 15,075 Lemons-
organic ....... 12 12 65 65 65 1,002 Oranges ......... 621 637 2,649 2,957 3,074 39,559 Oranges-
organic ....... 51 51 78 78 78 888 Tangelos ........ ..................... ..................... 3 5 18 1,225 Tangelos-
organic ....... ..................... ..................... 3 3 1 22 Tangerines ..... ..................... 3 96 98 139 9,227 Tangerines-
organic ....... ..................... ..................... ..................... ..................... 2 104 Temples ......... ..................... ..................... ..................... ..................... ..................... 13
Total ............... 1,933 1,946 4,570 5,217 5,599 73,293
See footnote(s) at end of table.

V–34 FRUITS, TREE NUTS, AND HORTICULTURAL SPECIALTIES
Table 5-66.—Fruits, fresh: Total reported domestic rail, truck, and air shipments, 2018—Continued
Commodity Jan. Feb. Mar. Apr. May Jun. Jul.
Noncitrus: 1,000 cwt
Apples ........................... 5,243 5,297 6,557 5,136 4,899 4,397 3,006 Apples-organic .............. 571 558 702 543 482 348 166 Apricots ......................... .................... .................... .................... .................... 5 31 56 Apricots-organic ............ .................... .................... .................... .................... .................... 2 7 Avocados ...................... 55 151 304 613 655 818 506 Blueberries .................... .................... 1 14 201 295 517 468 Blueberries-organic ....... 7 10 18 35 58 43 65 Cherries ......................... .................... .................... .................... .................... .................... 451 2,141 Cherries-organic ............ .................... .................... .................... .................... 2 70 72 Cranberries ................... .................... .................... .................... .................... .................... .................... ....................Cranberries-organic ...... .................... .................... .................... .................... .................... .................... ....................Grapes .......................... 134 2 .................... .................... 154 465 1,595 Grapes-organic ............. .................... .................... .................... .................... .................... .................... ....................Kiwifruit .......................... 90 94 105 44 .................... .................... ....................Kiwifruit-organic ............. .................... .................... .................... .................... .................... .................... ....................Nectarines ..................... .................... .................... .................... .................... 81 303 313 Peaches ........................ .................... .................... .................... .................... 203 655 868 Peaches-organic ........... .................... .................... .................... .................... .................... .................... 5 Pears ............................. 773 697 763 546 441 387 248 Pears-organic ................ 72 61 33 12 4 3 ....................Persimmons .................. .................... .................... .................... .................... .................... .................... ....................Plums ............................ .................... .................... .................... .................... 1 50 115 Pomegranates ............... .................... .................... .................... .................... .................... .................... ....................Prunes ........................... .................... .................... .................... .................... .................... .................... 1 Raspberries ................... 27 20 15 21 71 151 189 Raspberries-organic ...... 12 9 4 4 12 31 49 Strawberries .................. 727 1,268 1,062 1,917 3,039 2,501 2,075 Strawberries-organic ..... 30 44 37 97 300 286 278
Total .............................. 7,741 8,212 9,614 9,169 10,702 11,509 12,223
Commodity Aug. Sep. Oct. Nov. Dec. Total
Noncitrus: 1,000 cwt
Apples ........................... 3,546 5,151 4,626 4,775 5,509 58,142 Apples-organic .............. 191 523 482 520 637 5,723 Apricots ......................... 4 ................... ................... ................... ................... 96 Apricots-organic ............ ................... ................... ................... ................... ................... 9 Avocados ...................... 359 330 166 41 22 4,020 Blueberries .................... 238 81 ................... ................... ................... 1,815 Blueberries-organic ....... 35 18 2 ................... 1 292 Cherries ......................... 2,795 496 6 ................... ................... 5,889 Cherries-organic ............ 7 ................... ................... ................... ................... 151 Cranberries ................... ................... 19 39 126 35 219 Cranberries-organic ...... ................... ................... 1 1 ................... 2 Grapes .......................... 3,440 3,680 3,745 3,152 1,595 17,959 Grapes-organic ............. 2 ................... ................... ................... ................... 2 Kiwifruit .......................... ................... ................... 27 66 79 505 Kiwifruit-organic ............. ................... ................... ................... 9 ................... 9 Nectarines ..................... 218 184 19 ................... ................... 1,118 Peaches ........................ 835 769 351 32 ................... 3,713 Peaches-organic ........... 31 36 ................... ................... ................... 72 Pears ............................. 508 874 972 1,035 1,263 8,507 Pears-organic ................ 34 98 97 98 96 608 Persimmons .................. ................... ................... 4 12 11 27 Plums ............................ 58 86 16 1 ................... 327 Pomegranates ............... ................... 7 189 144 44 384 Prunes ........................... 16 5 ................... ................... ................... 22 Raspberries ................... 155 155 117 51 24 996 Raspberries-organic ...... 43 38 22 13 12 249 Strawberries .................. 1,830 1,541 1,414 718 449 18,541 Strawberries-organic ..... 272 221 154 68 33 1,820
Total .............................. 14,617 14,312 12,449 10,862 9,810 131,217
AMS, Fruit and Vegetable Programs, Market News Division, (202) 205–9690.

V–35 AGRICULTURAL STATISTICS 2020
Table 5-67.—Fruits, dried: Production (dry basis), California, 2009–2018
Year Apricots Figs 1 Peaches 2 Prunes Grapes 3
Tons
2009 ..................... 1,090 13,300 850 166,000 335,500 2010 ..................... 1,400 12,320 2,010 130,000 394,800 2011 ..................... 1,810 11,560 470 137,000 384,300 2012 ..................... 1,210 10,400 1,230 138,000 345,900 2013 ..................... 1,080 9,300 420 85,000 406,100 2014 ..................... 1,500 9,470 610 108,000 366,200 2015 ..................... 1,050 8,940 880 110,000 388,500 2016 ..................... 1,280 9,260 (NA) 54,000 335,900 2017 ..................... (D) 9,100 (NA) 105,000 271,300 2018 4 ................... (NA) (NA) (NA) (NA) (NA)
(NA) Not available. 1 Standard and substandard. 2 Freestone only. Discontinued in 2015. 3 Raisin and table type. 4 Estimates discontinued in 2018.
NASS, Crops Branch, (202) 720–2127.
Table 5-68.—International Raisins: Production in specified countries, 2016/2017–2018/2019
Country 2016/2017 2017/2018 2018/2019
Metric tons
Turkey ........................................................ 310,000 306,000 280,000 United States ............................................. 304,723 241,402 263,000 China .......................................................... 165,000 180,000 190,000 Iran ............................................................. 170,000 110,000 150,000 South Africa ............................................... 62,300 70,500 73,000 Uzbekistan ................................................. 71,000 65,000 70,000 Chile ........................................................... 53,700 57,000 60,000 Argentina .................................................... 31,000 41,000 42,000 Afghanistan ................................................ 26,000 36,500 38,000 Australia ..................................................... 18,000 20,000 20,000 Other .......................................................... 19,000 22,000 19,000
FAS, Office of Global Analysis, (202) 720-6301. Prepared or estimated on the basis of official USDA production, supply, and distribution statistics from foreign governments.
Table 5-69.—Fruits: Per capita consumption, United States, 2009–2018 1
Year
Fruits used fresh
Canned fruits 4 Juice 5 Frozen fruit 6 Dried fruits 7 Citrus fruit 2 Noncitrus
fruits 3
Pounds Pounds Pounds Gallons Pounds Pounds
2009 ........... 20.7 77.4 13.6 7.1 5.1 2.1 2010 ........... 21.6 80.9 13.1 7.2 5.7 2.3 2011 ........... 22.8 82.4 12.1 6.1 5.3 2.3 2012 ........... 23.5 85.1 11.5 6.4 5.0 2.3 2013 ........... 23.9 87.9 13.0 6.2 5.3 2.4 2014 ........... 23.3 90.7 11.8 5.9 6.5 2.3 2015 ........... 22.7 89.7 12.4 5.8 6.5 2.4 2016 ........... 24.1 91.3 11.7 5.6 5.3 2.4 2017 ........... 23.8 92.9 11.4 5.4 6.1 2.3 2018 ........... 24.0 91.2 10.1 5.2 6.0 1.0
1 Fresh citrus fruits, canned fruit, and fruit juices are on a crop-year basis. Dried fruits are on a pack-year basis. The per capita consumption was obtained by dividing the total consumption by total population. 2 Oranges and temples, tangerines and tangelos, lemons, limes, and grapefruit. 3 Apples, apricots, avocados, bananas, cherries, cranberries, grapes, kiwifruit, mangoes, peaches and nectarines, pears, pineapples, papayas, plums and prunes, and strawberries. 4 Apples, apricots, cherries, olives, peaches, pears, pineapples, and plums and prunes. 5 Orange, grapefruit, lemon, lime, apple, grape, pine-apple, prune, and cranberry. 6 Blackberries, blueberries, raspberries, strawberries, other berries, apples, apricots, cherries, and peaches. 7 Apples, apricots, dates, figs, peaches, pears, prunes, and raisins. Dried data in terms of processed weight.
ERS, Crops Branch, (816) 926–6007.

V–36 FRUITS, TREE NUTS, AND HORTICULTURAL SPECIALTIES
Table 5-70.—Fruit: Exports, 2016–2018
Country 2016 2017 2018
Metric tons
Fruit, processed: Canada ................................................... 81,103 77,039 76,946 China ...................................................... 19,958 43,280 26,182 Netherlands ............................................ 35,738 33,160 22,349 Mexico .................................................... 20,691 26,442 22,223 Korea, South .......................................... 7,398 7,926 7,454 Japan ...................................................... 7,271 6,168 6,450 Australia(*) .............................................. 5,580 4,972 5,351 United Kingdom ...................................... 3,376 4,538 4,670 Hong Kong ............................................. 2,191 2,374 4,140 Poland .................................................... 2,766 3,498 3,461 Taiwan .................................................... 3,790 4,120 3,239 Germany(*) ............................................. 1,302 1,314 2,591 India ........................................................ 2,158 2,629 2,579 Israel(*) ................................................... 4,479 3,869 2,541 Indonesia ................................................ 1,585 1,662 2,347 Malaysia ................................................. 1,929 2,120 2,268 Switzerland(*) ......................................... 682 230 2,265 Russia .................................................... 1,186 1,661 2,071 Thailand .................................................. 3,035 3,040 1,958 Vietnam .................................................. 1,066 1,819 1,634 Singapore ............................................... 1,323 1,954 1,525 New Zealand(*) ...................................... 1,920 1,415 1,308 Colombia ................................................ 1,110 1,073 1,244 Belgium-Luxembourg(*) .......................... 3,149 3,749 1,210 Philippines .............................................. 1,283 1,383 1,157 Turkey .................................................... 1,826 2,228 1,021 Panama .................................................. 795 841 955 France(*) ................................................ 415 1,825 848 Italy(*) ..................................................... 1,264 879 810 Greece .................................................... 898 709 747 Rest of World ......................................... 9,856 8,727 8,007
World Total ............................................. 231,120 256,641 221,553
Fruit, prepared, misc: Canada ................................................... 75,277 77,340 72,441 Mexico .................................................... 8,079 10,638 9,679 Netherlands ............................................ 507 347 8,569 China ...................................................... 7,497 5,832 3,862 Japan ...................................................... 3,347 2,634 3,023 Australia(*) .............................................. 5,958 1,538 1,876 Korea, South .......................................... 9,018 2,916 1,858 Hong Kong ............................................. 3,784 6,258 1,382 Philippines .............................................. 1,056 939 1,242 Saudi Arabia ........................................... 5,999 1,248 1,218 Panama .................................................. 981 1,081 1,005 Dominican Republic ............................... 863 555 1,000 Germany(*) ............................................. 278 251 954 Malaysia ................................................. 880 605 731 Taiwan .................................................... 1,230 614 708 Bahamas, The ........................................ 471 779 679 Thailand .................................................. 1,230 671 674 Singapore ............................................... 795 601 610 Turkey .................................................... 113 36 583 United Arab Emirates ............................. 923 794 578 Trinidad and Tobago .............................. 567 301 568 Israel(*) ................................................... 398 295 472 Costa Rica .............................................. 548 660 465 United Kingdom ...................................... 748 963 414 Netherlands Antilles(*) ........................... 534 238 370 Indonesia ................................................ 643 250 360 Chile ....................................................... 793 626 333 Jordan .................................................... 227 268 314 Vietnam .................................................. 4,081 85 310 France(*) ................................................ 540 1,415 302 Rest of World ......................................... 9,417 6,068 3,885
World Total ............................................. 146,780 126,845 120,463
(*) Denotes a country that is a summarization of its component countries. All zeroes for a data item may show that sta-tistics exist in the other import type. Consumption or General. Users should use cautious interpretation on Quantity re-ports using mixed units of measure. Quantity line items will only include statistics on the units of measure that are equal to, or are able to be converted to, the assigned unit of measure of the grouped commodities.
FAS, Office of Global Analysis, (202) 720-6301. Data Source: Department of Commerce, U.S. Census Bureau, Foreign Trade Statistics.

V–37 AGRICULTURAL STATISTICS 2020
Table 5-71.—International Fruits, fresh: Production in specified countries, 2016/2017-2018/2019
Country Production
2016/2017 2017/2018 2018/2019
Metric tons
Apples: China .................................................. 40,393,000 41,390,000 31,000,000 European Union .................................. 12,722,620 10,013,600 14,008,570 United States ...................................... 5,010,201 5,084,727 5,048,000 Turkey ................................................. 2,900,000 2,750,000 3,000,000 Iran ...................................................... 2,799,200 2,799,200 2,799,200 India .................................................... 2,258,000 1,920,000 2,300,000 Russia ................................................. 1,509,148 1,359,580 1,503,100 Chile .................................................... 1,310,000 1,330,000 1,264,000 Ukraine ............................................... 1,099,200 1,099,200 1,099,200 Brazil ................................................... 1,049,300 1,049,300 1,049,300 South Africa ........................................ 902,130 790,000 840,000 Japan .................................................. 765,000 765,000 765,000 Mexico ................................................ 716,930 714,149 660,000 Argentina ............................................ 560,000 560,000 590,000 New Zealand ...................................... 523,000 575,500 561,000 Belarus ................................................ 509,300 509,300 509,300 Canada ............................................... 408,404 345,568 395,300 Serbia ................................................. 328,400 328,400 328,400 Australia .............................................. 308,300 308,300 308,300 Azerbaijan ........................................... 254,300 254,300 254,300 Kazakhstan ......................................... 188,100 188,100 188,100 Kyrgyzstan .......................................... 135,600 135,600 135,600 Uruguay .............................................. 37,700 37,700 37,700 Guatemala .......................................... 26,500 26,500 26,500 Norway ................................................ 12,400 12,400 12,400 Colombia ............................................. 2,300 2,300 2,300 Taiwan ................................................ 1,483 1,451 1,500
Cherries, sweet and sour: European Union .................................. 734,199 607,288 793,058 Turkey ................................................. 525,000 520,000 590,000 United States ...................................... 455,806 508,087 443,633 China .................................................. 330,000 380,000 340,000 Russia ................................................. 276,500 276,500 276,500 Ukraine ............................................... 219,800 219,800 219,800 Chile .................................................... 116,000 206,741 210,000 Uzbekistan .......................................... 150,000 150,000 150,000 Serbia ................................................. 98,000 98,000 98,000 Syria .................................................... 69,200 69,200 69,200 Azerbaijan ........................................... 44,700 44,700 44,700 Belarus ................................................ 42,800 42,800 42,800 Canada ............................................... 20,400 20,400 20,400 Japan .................................................. 19,800 19,100 18,500 Australia .............................................. 10,000 16,000 18,000 Argentina ............................................ 7,100 7,100 7,100 Kyrgyzstan .......................................... 4,500 4,500 4,500
Peaches & nectarines: China .................................................. 14,200,000 14,300,000 13,500,000 European Union .................................. 3,777,707 4,086,458 3,582,400 United States ...................................... 858,850 768,295 734,000 Turkey ................................................. 510,000 505,000 600,000 Argentina ............................................ 248,100 248,100 248,100 Uzbekistan .......................................... 220,000 226,000 226,000 Brazil ................................................... 192,000 192,000 192,000 South Africa ........................................ 180,000 180,000 180,000 Mexico ................................................ 176,900 176,900 176,900 Chile .................................................... 149,234 159,285 151,000 Japan .................................................. 127,300 124,900 122,000 Australia .............................................. 90,000 92,000 94,000 Russia ................................................. 36,200 36,200 36,200 Canada ............................................... 23,200 23,200 23,200 Taiwan ................................................ 22,430 23,254 23,000 Ukraine ............................................... 18,000 18,000 18,000 Kazakhstan ......................................... 1,400 1,400 1,400 Switzerland ......................................... 200 200 200
See footnote(s) at end of table.

V–38 FRUITS, TREE NUTS, AND HORTICULTURAL SPECIALTIES
Table 5-71.—International Fruits, fresh: Production in specified countries, 2016/2017-2018/2019—Continued
Country Production
2016/2017 2017/2018 2018/2019
Metric tons
Pears, fresh: China .................................................. 15,960,000 16,410,000 13,100,000 European Union .................................. 2,340,171 2,386,396 2,524,958 United States ...................................... 667,570 663,470 666,605 Argentina ............................................ 540,000 580,000 600,000 Turkey ................................................. 440,000 420,000 450,000 South Africa ........................................ 431,535 408,146 410,000 India .................................................... 340,000 280,000 340,000 Japan .................................................. 278,100 278,100 278,100 Chile .................................................... 290,000 262,000 252,000 Korea, South ....................................... 238,014 265,757 214,000 Russia ................................................. 236,482 205,920 211,100 Taiwan ................................................ 140,000 140,000 140,000 Australia .............................................. 105,000 105,000 105,000 Switzerland ......................................... 43,900 43,900 43,900 Belarus ................................................ 30,800 30,800 30,800 Mexico ................................................ 26,952 27,930 27,800 Brazil ................................................... 14,900 14,900 14,900 New Zealand ...................................... 11,876 13,812 12,000 Canada ............................................... 8,285 9,676 8,700
FAS, Office of Global Analysis, (202) 720-6301. Prepared or estimated on the basis of official USDA production, supply, and distribution statistics from foreign governments.
Table 5-72.—All tree nuts: Supply and utilization, United States, 2009/2010–2018/2019
Market year1 Beginning stocks
Marketable production 2 Imports Total
supply Exports Ending stocks
Domestic consumption
Total Per capita Pounds
—Million pounds (shelled)—
2009/2010 .... 542.6 2,113.3 468.9 3,124.8 1,546.4 422.1 1,156.3 3.74 2010/2011 .... 422.1 2,482.2 485.1 3,389.4 1,786.1 407.4 1,195.9 3.85 2011/2012 .... 407.4 2,787.2 449.2 3,643.9 1,977.1 480.2 1,186.6 3.79 2012/2013 .... 480.2 2,762.3 515.6 3,753.1 1,979.6 462.1 1,316.5 4.17 2013/2014 .... 462.1 2,806.7 582.1 3,758.1 2,075.2 505.5 1,270.1 4.00 2014/2015 .... 505.5 2,738.4 666.9 3,910.9 2,025.2 585.2 1,300.5 4.07 2015/2016 .... 585.2 2,665.8 668.1 3,919.1 2,035.2 575.5 1,308.4 4.06 2016/2017 .... 575.5 3,328.2 697.2 4,601.0 2,381.8 647.4 1,571.9 4.85 2017/2018 .... 647.4 3,187.4 738.8 4,573.6 2,395.2 536.1 1,642.3 5.03 2018/2019 .... 536.1 3,468.5 720.2 4,724.8 2,485.6 536.6 1,702.6 5.19
1 Marketing season begins July 1 for hazelnuts and macadamias; August 1 for almonds and walnuts; September 1 for pis-tachios; and October 1 for pecans. 2 Utilized production (NASS data) minus inedibles and noncommercial useage.
ERS, Crops Branch, (816) 926–6007.

V–39 AGRICULTURAL STATISTICS 2020
Table 5-73.—International Nuts, Almonds: Production in specified countries, 2017/2018–2019/2020
Country 2017/2018 2018/2019 2019/2020
Metric tons
United States ............ 1,029,650 1,034,190 997,900 European Union ....... 109,500 123,800 121,000 Australia ................... 76,000 92,000 95,000 China ........................ 43,000 43,000 45,000 Turkey ...................... 15,000 16,000 15,000 Chile ......................... 9,500 11,000 11,500 India .......................... 4,000 4,500 4,500
FAS, Office of Global Analysis, (202) 720-6301. Prepared or estimated on the basis of official USDA production, supply, and distribution statistics from foreign governments.
Table 5-74.—Almonds (shelled basis): Bearing acreage, yield, production, price, and value, California, 2009–2018 1
Year Bearing Acreage Yield per acre 2 Utilized production Price per pound Value
Acres Pounds 1,000 pounds Dollars 1,000 dollars
2009 ............... 750,000 1,960 1,410,000 1.65 2,293,500 2010 ............... 770,000 2,220 1,640,000 1.79 2,903,380 2011 ............... 800,000 2,540 2,030,000 1.99 4,007,860 2012 ............... 820,000 2,310 1,890,000 2.58 4,816,860 2013 ............... 880,000 2,280 2,010,000 3.21 6,384,690 2014 ............... 930,000 2,010 1,870,000 4.00 7,388,000 2015 ............... 950,000 2,000 1,900,000 3.13 5,868,750 2016 ............... 970,000 2,210 2,140,000 2.39 5,052,460 2017 ............... 1,030,000 2,200 2,270,000 2.53 5,603,950 2018 ............... 1,090,000 2,090 2,280,000 2.44 5,468,040
1 Price and value are based on edible portion of the crop only. Production includes inedible quantities of no value as fol-lows (million pounds): 2009-20.0; 2010-18.0; 2011-16.0; 2012-23.0; 2013-21.0; 2014-23.0; 2015-25.0; 2016-26.0; 2017-55.0; 2018-39.0. 2 Yield is based on utilized production.
NASS, Crops Branch, (202) 720–2127.
Table 5-75.—Almonds (shelled basis): Foreign trade, United States, 2009–2018 1
Year beginning October Imports Domestic exports
Metric tons Metric tons
2009 ................................. 776 462,276 2010 ................................. 2,391 527,228 2011 ................................. 5,729 615,275 2012 ................................. 15,653 579,553 2013 ................................. 14,724 581,398 2014 ................................. 10,026 546,116 2015 ................................. 9,501 562,036 2016 ................................. 7,638 640,175 2017 ................................. 10,306 667,221 2018 ................................. 11,637 685,856
1 Imports of unshelled nuts converted to shelled basis at ratio of 1.67 to 1. Exports of unshelled nuts converted to shelled basis at ratio of 1.67 to 1.0.
ERS, Crops Branch, (816) 926–6007.

V–40 FRUITS, TREE NUTS, AND HORTICULTURAL SPECIALTIES
Table 5-76.—Hazelnuts (in-shell basis): Bearing acreage, yield, production, price, and value, Oregon, 2009–2018
Year Bearing Acreage Yield per acre Utilized production Price per ton Value
Acres Tons Tons Dollars 1,000 dollars
2009 ............... 28,700 1.64 47,000 1,690 79,430 2010 ............... 29,000 1.00 28,000 2,410 67,480 2011 ............... 28,500 1.00 38,500 2,330 89,705 2012 ............... 29,000 1.22 35,500 1,830 64,965 2013 ............... 30,000 1.50 45,000 2,680 120,600 2014 ............... 30,000 1.20 36,000 3,600 129,600 2015 ............... 34,000 0.91 31,000 2,800 86,800 2016 ............... 37,000 1.19 44,000 2,700 118,800 2017 ............... 40,000 0.80 32,000 2,300 73,600 2018 ............... 44,000 1.16 51,000 1,620 91,800
NASS, Crops Branch, (202) 720–2127.
Table 5-77.—Hazelnuts (shelled basis): Foreign trade, United States, 2009–2018 1
Year beginning October Imports Domestic exports
Metric tons Metric tons
2009 ................................. 2,533 13,917 2010 ................................. 4,417 7,691 2011 ................................. 3,118 10,031 2012 ................................. 5,392 11,243 2013 ................................. 4,747 14,862 2014 ................................. 1,761 20,309 2015 ................................. 2,748 8,766 2016 ................................. 3,333 11,634 2017 ................................. 5,443 8,850 2018 ................................. 5,646 9,956
1 Imports of unshelled nuts converted to shelled basis at ratio of 2.22 to 1. Exports of unshelled nuts converted to shelled basis at ratio of 2.50 to 1.
ERS, Crops Branch, (816) 926–6007.
Table 5-78.—Macadamia nuts (in-shell basis): Bearing acreage, yield, production, price, and value, Hawaii, 2009–2018
Year Bearing Acreage Yield per acre Utilized production Price per pound Value
Acres Pounds 1,000 pounds Cents 1,000 dollars
2009 ............... 15,000 2,800 42,000 70.0 29,400 2010 ............... 15,000 2,670 40,000 75.0 30,000 2011 ............... 15,000 3,270 49,000 78.0 38,220 2012 ............... 15,000 2,930 44,000 80.0 35,200 2013 ............... 16,000 2,560 41,000 87.0 35,670 2014 ............... 16,000 2,880 46,000 87.0 40,020 2015 ............... 16,000 2,940 47,000 97.0 45,590 2016 ............... 16,500 2,550 42,000 100.0 42,000 2017 ............... 17,000 2,880 49,000 110.0 53,900 2018 ............... 16,900 2,090 35,300 119.0 42,007
NASS, Crops Branch, (202) 720–2127.
Table 5-79.—Pecans (in-shell basis): Production, price per pound, and value, United States, 2009–2018
Year
Improved varieties 1 Native and seedling All pecans
Utilized production
Price per pound Value Utilized
production Price per
pound Value Utilized production
Price per pound Value
1,000 1,000 1,000 1,000 1,000 1,000 pounds Dollars dollars pounds Dollars dollars pounds Dollars dollars
2009 ...... 249,720 1.530 381,550 52,300 0.934 48,838 302,020 1.430 430,388 2010 ...... 232,560 2.490 578,149 61,180 1.580 96,679 293,740 2.300 674,828 2011 ...... 227,030 2.590 587,064 42,670 1.610 68,825 269,700 2.430 655,889 2012 ...... 247,100 1.730 427,473 55,200 0.879 48,518 302,300 1.570 475,991 2013 ...... 220,000 1.900 417,758 46,330 0.920 42,632 266,330 1.730 460,390 2014 ...... 227,410 2.120 482,323 36,740 0.933 34,268 264,150 1.960 516,591 2015 ...... 225,180 2.310 520,529 29,110 1.360 39,687 254,290 2.200 560,216 2016 ...... 249,970 2.660 663,746 18,800 1.760 33,060 268,770 2.590 696,806 2017 ...... 278,600 2.400 667,858 26,250 1.580 41,360 304,850 2.330 709,218 2018 ...... 228,470 1.790 408,807 14,460 1.140 16,524 242,930 1.751 425,331
1 Budded, grafted or topworked varieties. NASS, Crops Branch, (202) 720–2127.

V–41 AGRICULTURAL STATISTICS 2020
Table 5-80.—Pecans (in-shell basis): Production and marketing year average price per pound, by State and United States, 2016–2018
Item and State Utilized production Price per pound
2016 2017 2018 2016 2017 2018
1,000 1,000 1,000 pounds pounds pounds Dollars Dollars Dollars
Improved Varieties 1
Alabama .................... 1,900 1,600 1,490 2.130 2.030 1.500 Arizona ...................... 24,800 28,000 27,900 2.710 2.500 1.870 California ................... 5,770 5,000 3,700 2.540 2.300 2.000 Georgia ...................... 109,000 107,000 70,000 2.500 2.400 1.620 Louisiana ................... 1,500 3,000 2,510 1.950 2.000 1.250 New Mexico ............... 72,000 92,000 91,100 2.960 2.400 1.900 Oklahoma .................. 3,000 3,000 2,970 2.670 2.100 2.250 Texas ......................... 32,000 39,000 28,800 2.540 2.390 1.760
United States ............. 249,970 278,600 228,470 2.66 2.400 1.790
Native and Seedling
Alabama .................... 300 250 110 1.400 1.520 1.119 Louisiana ................... 2,500 5,000 3,520 1.300 1.250 0.800 Oklahoma .................. 9,000 11,000 6,030 1.850 1.630 1.360 Texas ......................... 7,000 10,000 4,800 1.820 1.680 1.120
United States ............. 18,800 26,250 14,460 1.760 1.580 1.140
All Pecans
Alabama .................... 2,200 1,850 1,600 2.030 1.960 1.480 Arizona ...................... 24,800 28,000 27,900 2.710 2.500 1.870 California ................... 5,770 5,000 3,700 2.540 2.300 2.000 Georgia ...................... 109,000 107,000 70,000 2.500 2.400 1.620 Louisiana ................... 4,000 8,000 6,030 1.540 1.530 0.990 New Mexico ............... 72,000 92,000 91,100 2.960 2.400 1.900 Oklahoma .................. 12,000 14,000 9,000 2.060 1.730 1.650 Texas ......................... 39,000 49,000 33,600 2.410 2.250 1.670
United States ............. 268,770 304,850 242,930 2.590 2.330 1.751
1 Budded, grafted or topworked varieties. NASS, Crops Branch, (202) 720–2127.
Table 5-81.—Pecans (shelled basis): Foreign trade, United States, 2009–2018 1
Year beginning October Imports Domestic exports
Metric tons Metric tons
2009 ............................................................... 33,735 30,607 2010 ............................................................... 35,906 25,531 2011 ............................................................... 30,449 31,141 2012 ............................................................... 33,525 37,873 2013 ............................................................... 39,000 33,098 2014 ............................................................... 43,736 40,727 2015 ............................................................... 46,612 35,721 2016 ............................................................... 52,830 42,987 2017 ............................................................... 58,230 47,689 2018 ............................................................... 70,118 41,660
1 Imports of unshelled nuts converted to shelled basis at ratio of 2.50 to 1. Exports of unshelled nuts converted to shelled basis at ratio of 2.50 to 1.
ERS, Crops Branch, (816) 926–6007.

V–42 FRUITS, TREE NUTS, AND HORTICULTURAL SPECIALTIES
Table 5-82.—Pistachios (in-shell basis): Bearing acreage, yield, production, price, and value, California, 2009–2018
Year Bearing Acreage Yield per acre Utilized production Price per pound Value
Acres Pounds 1,000 pounds Dollars 1,000 dollars
2009 .................. 126,000 2,820 355,000 1.67 592,850 2010 .................. 137,000 3,810 522,000 2.00 1,158,840 2011 .................. 153,000 2,900 444,000 2.00 879,120 2012 .................. 182,000 3,030 551,000 2.61 1,438,110 2013 .................. 203,000 2,320 470,000 3.48 1,635,600 2014 .................. 221,000 2,330 514,000 3.57 1,834,980 2015 .................. 233,000 1,160 270,000 3.29 888,300 2016 .................. 239,000 3,750 896,500 1.68 1,506,120 2017 .................. 250,000 2,400 600,300 1.69 1,014,507 2018 .................. 264,000 3,740 987,000 2.65 2,615,550
NASS, Crops Branch, (202) 720–2127.
Table 5-83.—Walnuts, English (in-shell basis): Bearing acreage, yield, production, price, and value, California, 2009–2018
Year Bearing Acreage Yield per acre 1 Utilized production Price per ton Value
Acres Tons Tons Dollars 1,000 dollars
2009 .................. 240,000 1.82 437,000 1,710 747,270 2010 .................. 255,000 1.98 504,000 2,040 1,028,160 2011 .................. 265,000 1.74 461,000 2,900 1,336,900 2012 .................. 270,000 1.84 497,000 3,030 1,505,910 2013 .................. 280,000 1.76 492,000 3,710 1,825,320 2014 .................. 290,000 1.97 571,000 3,340 1,907,140 2015 .................. 300,000 2.02 606,000 1,670 1,012,020 2016 .................. 315,000 2.19 689,000 1,850 1,274,650 2017 .................. 335,000 1.88 630,000 2,490 1,568,700 2018 .................. 350,000 1.93 676,000 1,300 878,800
1Yield is based on utilized production. NASS, Crops Branch, (202) 720–2127.
Table 5-84.—Walnuts (shelled basis): Foreign trade, United States, 2009–2018 1
Year beginning October Imports Domestic exports
Metric tons Metric tons 2009 .................. 1,529 101,865 2010 .................. 186 133,868 2011 .................. 2,442 117,031 2012 .................. 3,957 133,049 2013 .................. 5,266 134,379 2014 .................. 9,780 158,186 2015 .................. 5,319 188,467 2016 .................. 6,495 191,336 2017 .................. 5,618 176,115 2018 .................. 1,334 182,933
1Imports of unshelled nuts converted to shelled basis at ratio of 2.50 to 1. Exports of unshelled nuts converted to shelled basis at ratio of 2.50 to 1.
ERS, Crops Branch, (816) 926–6007.

V–43 AGRICULTURAL STATISTICS 2020
Table 5-85.—Coffee, green: International trade, 2016/2017-2018/2019
Country of origin 2016/2017 2017/2018 2018/2019
1,000 60-Kg bags
Principle exporting countries:
Brazil .......................................................................... 33,081 0,450 39,720 Vietnam ...................................................................... 27,550 7,900 27,200 Colombia .................................................................... 13,755 2,725 13,400 Indonesia ................................................................... 8,174 ,010 6,150 Honduras ................................................................... 7,175 ,225 6,700 India ........................................................................... 6,158 ,148 5,540 Peru ........................................................................... 4,025 ,185 4,260 Ethiopia ...................................................................... 3,853 ,893 3,980 Uganda ...................................................................... 4,600 ,500 4,600 Mexico ....................................................................... 2,865 ,220 3,220 Guatemala ................................................................. 3,330 ,465 3,405 Malaysia ..................................................................... 2,940 ,050 3,100 Nicaragua .................................................................. 2,450 ,520 2,415 European Union ......................................................... 1,905 ,130 2,400 China ......................................................................... 1,829 ,885 1,770 Cote d’Ivoire .............................................................. 990 ,150 1,615 Switzerland ................................................................ 1,150 ,225 1,300 Tanzania .................................................................... 1,030 ,030 1,230 Costa Rica ................................................................. 1,120 ,210 1,110
Principle importing countries:
European Union ......................................................... 46,050 47,430 49,000 United States ............................................................. 26,480 24,790 26,600 Japan ......................................................................... 8,030 7,720 8,500 Philippines ................................................................. 6,420 6,100 6,200 Canada ...................................................................... 4,550 4,750 4,720 Russia ........................................................................ 4,740 4,465 4,450 China ......................................................................... 3,534 2,705 2,750 Korea South ............................................................... 2,725 2,645 2,700 Switzerland ................................................................ 2,600 2,750 2,700 Algeria ........................................................................ 2,205 2,300 2,340 Australia ..................................................................... 1,730 1,875 1,875 Malaysia ..................................................................... 1,510 1,550 1,800 Mexico ....................................................................... 1,565 1,545 1,670 India ........................................................................... 1,386 1,472 1,341 Ukraine ...................................................................... 960 1,095 1,280 Morocco ..................................................................... 660 825 1,020 Indonesia ................................................................... 743 1,751 1,676 Vietnam ...................................................................... 1,000 1,060 1,160 Turkey ........................................................................ 960 875 1,080 Argentina ................................................................... 754 775 780
FAS, Office of Global Analysis, (202) 720-6301. Prepared or estimated on the basis of official USDA production, supply, and distribution statistics from foreign governments. Data Source: Department of Commerce, U.S. Census Bureau, Foreign Trade Statistics.
Table 5-86.—Coffee: Area, yield, production, marketing year average price, and value, Hawaii, 2009/2010–2018/2019 1
Year Area Harvested Yield per acre Utilized production Price per pound Value
Acres Pounds 1,000 pounds Dollars 1,000 dollars
2009/2010 ......... 7,200 1,210 8,700 3.60 31,320 2010/2011 ......... 7,500 1,170 8,800 3.25 33,440 2011/2012 ......... 7,700 990 7,600 4.15 31,540 2012/2013 ......... 7,900 890 7,000 5.90 41,300 2013/2014 ......... 8,200 1,020 8,400 6.20 52,080 2014/2015 ......... 7,800 4,720 36,408 1.72 62,622 2015/2016 ......... 6,900 4,600 30,137 1.55 46,712 2016/2017 ......... 7,000 4,180 28,571 1.71 48,856 2017/2018 ......... 7,200 3,530 24,592 1.78 43,774 2018/2019 ......... 7,100 3,845 26,400 1.90 50,160
1 For 2009/2010 season thru 2013/2014 season, all data in a parchment basis. Beginning with the 2014/2015 season, all data is for a cherry basis.
NASS, Crops Branch, (202) 720–2127.

V–44 FRUITS, TREE NUTS, AND HORTICULTURAL SPECIALTIES
Table 5-87.—Coffee and tea: U.S. Imports, Area/Partners of Origin, 2016-2018
Country 2016 2017 2018
Metric tons
Coffee and coffee products: Brazil ...................................................... 402,269 373,064 380,798 Colombia ................................................ 315,207 346,040 342,045 Vietnam .................................................. 269,684 237,187 213,499 Guatemala .............................................. 60,673 76,914 82,787 Mexico .................................................... 61,805 78,279 81,945 Nicaragua ............................................... 70,810 80,083 72,856 Honduras ................................................ 75,342 85,389 67,616 Peru ........................................................ 66,706 63,870 63,111 Indonesia ................................................ 72,715 74,798 58,141 Canada ................................................... 49,838 50,635 50,900 Costa Rica .............................................. 38,862 29,520 36,201 Germany(*) ............................................. 38,594 37,016 36,043 Ethiopia(*) ............................................... 17,497 26,350 25,472 Uganda ................................................... 8,954 12,075 15,003 El Salvador ............................................. 13,027 16,362 14,869 Papua New Guinea ................................ 14,317 11,721 13,332 Italy(*) ..................................................... 10,563 11,512 11,671 China ...................................................... 10,618 10,830 9,008 Switzerland(*) ......................................... 6,565 6,599 8,044 Kenya ..................................................... 6,435 9,012 6,685 Rwanda .................................................. 4,220 4,197 5,742 Tanzania ................................................. 4,740 4,968 5,600 India ........................................................ 4,150 5,962 5,154 Venezuela .............................................. 0 0 4,274 Spain ...................................................... 1,487 1,709 2,735 Belgium-Luxembourg(*) .......................... 1,373 984 1,904 Malaysia ................................................. 1,498 1,584 1,612 Korea, South .......................................... 1,466 1,306 1,582 Burundi ................................................... 1,430 1,314 1,580 Rest of World ......................................... 19,287 15,791 12,824
World Total ............................................. 1,650,131 1,675,071 1,633,032
Tea, including herbal tea: Argentina ................................................ 54,061 52,918 49,990 Canada ................................................... 54,586 53,532 48,994 China ...................................................... 23,762 20,612 21,186 India ........................................................ 17,265 16,859 14,610 Vietnam .................................................. 6,096 6,897 6,602 Sri Lanka ................................................ 5,635 5,458 6,149 Malawi .................................................... 9,224 7,458 5,671 Germany(*) ............................................. 6,582 4,517 4,939 Nigeria .................................................... 833 1,490 4,668 Indonesia ................................................ 4,084 3,639 3,358 Kenya ..................................................... 5,630 5,779 3,133 Mexico .................................................... 3,892 3,616 3,094 Zimbabwe ............................................... 1,498 1,867 2,439 Taiwan .................................................... 1,631 1,800 2,233 Japan ...................................................... 1,975 1,878 1,990 Chile ....................................................... 2,326 2,101 1,816 Thailand .................................................. 1,116 1,299 1,588 United Kingdom ...................................... 1,335 1,059 1,299 Brazil ...................................................... 1,233 929 734 Korea, South .......................................... 747 433 716 Egypt ...................................................... 580 565 686 Pakistan .................................................. 534 590 674 Poland .................................................... 583 474 627 Ecuador .................................................. 574 620 584 Hong Kong ............................................. 450 610 523 South Africa ............................................ 293 344 471 Ireland .................................................... 336 297 336 Bulgaria .................................................. 260 211 300 Morocco .................................................. 334 182 295 Rest of World ......................................... 4,363 4,053 3,473
World Total ............................................. 211,814 202,089 193,178
(*) Denotes a country that is a summarization of its component countries. All zeroes for a data item may show that sta-tistics exist in the other import type. Consumption or General. Users should use cautious interpretation on Quantity reports using mixed units of measure. Quantity line items will only include statistics on the units of measure that are equal to, or are able to be converted to, the assigned unit of measure of the grouped commodities.
FAS, Office of Global Analysis, (202) 720-6301. Data Source: U.S. Census Bureau Trade Data.

V–45 AGRICULTURAL STATISTICS 2020
Table 5-88.—Specialty mushrooms: Number of growers, total production, volume of sales, price per pound, and value of sales, United States: 2016/2017-2018/2019
Year and variety Growers 1 Total Production 2 All sales
Volume of sales 3 Price per pound 4 Value of sales
Number 1,000 pounds 1,000 pounds Dollars 1,000 dollars 2016/2017
Shiitake .................. 185 11,025 10,806 3.91 42,301 Oyster .................... 128 11,394 11,087 3.12 34,542 Other ...................... 59 5,223 4,869 5.43 26,463
United States ......... 232 27,652 26,762 3.86 103,306
2017/2018
Shiitake .................. 185 10,429 10,112 4.44 44,883 Oyster .................... 116 11,268 10,842 3.13 33,890 Other ...................... 64 5,690 5,050 5.33 26,923
United States ......... 229 27,387 26,004 4.06 105,696
2018/2019 5
Shiitake .................. (NA) 6,987 6,727 3.21 21,563 Oyster .................... (NA) 9,164 8,847 3.09 27,314 Other ...................... (NA) 3,968 3,904 4.59 17,922
United States ......... (NA) 20,119 19,478 3.43 66,799
(NA) Not available. 1 Growers counted only once for United States total if growing more than one specialty type mush-room. Growers growing Agaricus and specialty mushrooms are included. Estimates discontinued in 2018-2019. 2 Total pro-duction includes all fresh market and processing sales plus amount harvested but not sold (shrinkage, cullage, dumped, etc.). 3 Virtually all specialty mushroom sales are for fresh market. 4 Prices for mushrooms are the average prices pro-ducers receive at the point of first sale, commonly referred to as the average price as sold. For example, if in a given State, part of the fresh mushrooms are sold F.O.B. packed by growers, part are sold bulk to brokers or repackers, and some are sold retail at roadside stands, the mushroom average price as sold is a weighted average of the average price for each method of sale. 5 Beginning in 2018-2019, includes California, Florida, Illinois, Maryland, Oklahoma, Pennsylvania, Ten-nessee, and Texas.
NASS, Crops Branch, (202) 720–2127.
Table 5-89.—Agaricus mushrooms: Area, volume of sales, marketing year average price, and value of sales, United States: 2009-2018 1
Year Area in
production Total fillings
Volume of sales Price per pound Value of sales
Total Fresh market Processing
1,000 sq. ft. 1,000 pounds Dollars 1,000 dollars 1,000 dollars 1,000 dollars
2009/2010 129,268 777,064 1.140 884,390 821,472 62,918 2010/2011 134,266 845,951 1.140 964,192 887,839 76,353 2011/2012 139,331 881,857 1.180 1,039,159 969,847 69,312 2012/2013 139,846 869,625 1.190 1,038,541 969,278 69,263 2013/2014 134,685 882,075 1.190 1,049,972 971,521 78,451 2014/2015 143,292 907,191 1.230 1,118,371 1,054,652 63,719 2015/2016 142,147 919,012 1.200 1,098,745 1,035,106 63,639 2016/2017 143,497 906,593 1.240 1,122,821 1,060,281 62,540 2017/2018 140,563 891,231 1.270 1,127,886 1,070,316 57,570 2018/2019 2 119,701 827,013 1.290 1,064,765 1,020,440 44,325
1 Marketing year begins July 1 and ends June 30 the following year. 2 Beginning in 2018-2019, includes California, Flor-ida, Illinois, Maryland, Oklahoma, Pennsylvania, Tennessee, and Texas.
NASS, Crops Branch, (202) 720–2127.

V–46 FRUITS, TREE NUTS, AND HORTICULTURAL SPECIALTIES
Table 5-90.—Cut flowers: Sales and wholesale value for operations with $100,000+ sales, Surveyed States, 2007–2018
Year Quantity sold
Wholesale price
Value of sales at whole-sale 1
Quantity sold
Wholesale price
Value of sales at whole-sale 1
Quantity sold
Wholesale price
Value of sales at whole-sale 1
Alstromeria Carnations, standard Chrysanthemums pompon
1,000 stems
Cents per stem
1,000 dollars
1,000 stems
Cents per stem
1,000 dollars
1,000 bunches
Cents per bunch
1,000 dollars
2007 ... 9,879 20.8 2,057 3,328 18.8 626 18,059 0.76 13,810 2008 ... 10,774 17.9 1,927 3,343 17.0 567 10,058 1.34 13,428 2009 ... 8,800 18.5 1,629 2,837 16.9 480 7,920 1.43 11,298 2010 ... 9,868 16.7 1,650 1,893 16.7 317 8,347 1.40 11,705 2011 ... 8,764 19.1 1,676 1,441 16.2 233 7,823 1.41 11,048 2012 ... 10,964 21.0 2,307 715 23.4 167 9,167 1.43 13,115 2013 ... 10,164 20.7 2,104 624 24.5 153 9,009 1.53 13,816 2014 ... 8,890 19.1 1,702 797 30.6 244 6,677 1.73 11,518 2015 ... 7,747 19.6 1,517 896 30.5 273 7,777 1.48 11,524 2018 ... (NA) (NA) (NA) (NA) (NA) (NA) 6,880 1.52 10,459
Delphinium & Larkspur Gerbera Daisies Gladioli
1,000 stems
Cents per stem
1,000 dollars
1,000 stems
Cents per stem
1,000 dollars
1,000 spikes
Cents per spike
1,000 dollars
2007 ... 32,158 24.4 7,842 117,403 30.6 35,939 85,471 27.0 23,081 2008 ... 31,221 24.0 7,505 120,836 29.8 35,976 76,850 25.9 19,935 2009 ... 22,373 27.1 6,071 106,805 30.9 33,027 94,951 24.1 22,880 2010 ... 27,173 26.5 7,193 107,678 30.4 32,737 89,672 25.4 22,801 2011 ... 19,639 30.5 5,981 113,655 28.5 32,385 60,167 27.1 16,299 2012 ... 19,448 37.4 7,265 107,899 30.6 33,067 60,747 25.3 15,349 2013 ... 16,929 38.6 6,542 98,535 31.0 30,552 59,435 34.1 20,244 2014 ... 17,091 35.3 6,030 105,028 31.4 32,987 61,724 32.7 20,193 2015 ... 12,671 41.0 5,199 106,680 30.4 32,423 60,778 32.3 19,608 2018 ... (NA) (NA) (NA) 90,999 35.1 31,930 61,647 32.7 20,175
Iris Lilies, all Lisianthus
1,000 stems
Cents per stem
1,000 dollars
1,000 stems
Cents per stem
1,000 dollars
1,000 stems
Cents per stem
1,000 dollars
2007 ... 90,890 22.4 20,349 111,185 67.4 74,954 13,956 38.2 5,338 2008 ... 92,404 22.1 20,462 116,797 67.3 78,609 15,180 35.6 5,406 2009 ... 64,114 24.3 15,550 101,339 63.5 64,392 8,689 38.3 3,327 2010 ... 57,576 25.2 14,518 93,373 65.5 61,165 7,650 38.8 2,966 2011 ... 62,414 26.1 16,303 141,337 56.5 79,798 7,502 42.1 3,160 2012 ... 55,025 24.5 13,477 99,743 66.7 66,553 9,846 43.1 4,240 2013 ... 54,635 24.4 13,356 87,094 68.4 59,558 9,216 45.2 4,167 2014 ... 45,682 26.4 12,078 79,432 77.6 61,661 8,484 45.2 3,839 2015 ... 43,787 26.4 11,554 82,551 75.4 62,235 9,010 45.0 4,055 2018 ... 36,466 27.7 10,107 72,435 102.6 74,321 (NA) (NA) (NA)
Orchids, all Roses, all Snapdragons
1,000 blooms
Cents per bloom
1,000 dollars
1,000 stems
Cents per stem
1,000 dollars
1,000 spikes
Cents per spike
1,000 dollars
2007 ... 11,209 99.5 11,150 67,701 41.5 28,110 41,887 29.1 12,202 2008 ... 7,882 98.2 7,737 57,999 38.8 22,481 42,696 27.6 11,790 2009 ... 7,637 185.1 14,133 42,031 42.0 17,662 37,473 27.0 10,118 2010 ... 7,852 99.8 7,834 39,497 42.9 16,950 31,475 27.1 8,524 2011 ... 7,166 83.0 5,949 37,004 48.4 17,912 34,777 25.1 8,744 2012 ... 6,498 90.9 5,909 32,736 49.4 16,184 35,061 29.7 10,396 2013 ... 5,846 163.6 9,564 28,626 56.3 16,105 42,013 25.4 10,652 2014 ... 6,737 245.6 16,546 30,555 56.2 17,178 41,467 24.8 10,274 2015 ... 4,682 170.5 7,983 27,812 61.3 17,039 43,863 29.5 12,933 2018 ... 3,628 169.4 6,146 29,774 64.4 19,168 28,218 26.1 7,368
Tulips Other cut flowers
1,000 stems Cents per stem 1,000 dollars 1,000 dollars
2007 ... 157,992 35.9 56,719 133,017 2008 ... 170,854 37.6 64,285 126,990 2009 ... 150,228 38.1 57,185 103,687 2010 ... 155,667 36.6 56,900 129,466 2011 ... 169,219 35.3 59,788 99,824 2012 ... 161,802 37.2 60,172 171,159 2013 ... 161,926 36.8 59,535 116,509 2014 ... 160,990 35.5 57,198 112,006 2015 ... 167,378 34.6 57,840 130,135 2018 ... 173,247 38.4 66,489 112,778
(NA) Not available. 1 Equivalent wholesale value of all sales. NASS, Crops Branch, (202) 720–2127.

V–47 AGRICULTURAL STATISTICS 2020
Table 5-91.—Cut Cultivated Greens: Sales and wholesale value for operations with $100,000+ sales, Surveyed States, 2007–2018
Year
Leatherleaf Ferns Other cut cultivated greens
Quantity sold Wholesale price Value of sales at wholesale 1 Value of sales at wholesale 1
1,000 bunches Dollars per bunch 1,000 dollars 1,000 dollars
2007 ................. 39,437 1.00 39,543 58,527 2008 ................. 34,761 0.98 33,924 57,824 2009 ................. 31,800 0.94 29,942 43,993 2010 ................. 28,474 1.03 29,312 47,713 2011 ................. 26,277 0.97 25,499 46,537 2012 ................. 32,063 0.99 31,706 43,811 2013 ................. 32,209 1.02 32,779 42,706 2014 ................. 32,385 0.99 32,209 40,974 2015 ................. 33,319 1.02 33,853 46,573 2018 ................. 29,650 1.35 40,115 61,882
1 Equivalent wholesale value of all sales. NASS, Crops Branch, (202) 720–2127.
Table 5-92.—Foliage Plants for Indoor or Patio Use: Sales and Wholesale value for operations with $100,000+ sales, Surveyed States, 2007–2018
Year Foliage, Hanging Baskets Foliage, Pots
Quantity Sold Wholesale price Value of sales at wholesale Value of sales at wholesale
1,000 baskets Dollars per basket 1,000 dollars 1,000 dollars
2007 ..... 14,118 4.66 65,857 589,545 2008 ..... 11,003 4.90 53,949 456,362 2009 ..... 12,072 5.29 63,881 493,148 2010 ..... 14,530 5.39 78,247 507,882 2011 ..... 14,483 5.42 78,438 534,943 2012 ..... 10,323 6.12 63,158 576,778 2013 ..... 11,493 5.92 67,996 544,562 2014 ..... 10,199 6.19 63,103 559,779 2015 ..... 11,556 5.85 67,562 646,127 2018 ..... 13,071 6.26 81,785 571,294
NASS, Crops Branch, (202) 720–2127.

V–48 FRUITS, TREE NUTS, AND HORTICULTURAL SPECIALTIES
Table 5-93.— Potted Flowering Plants for Indoor or Patio Use: Sales and wholesale value for operations with $100,000+ sales, Surveyed States, 2007–2018
Year Quantity sold Wholesale price Value of sales at
wholesale 1 Less than 5 inches 5 inches or more Less than 5 inches 5 inches or more
African violets 2
1,000 pots 1,000 pots Dollars per pot Dollars 1,000 dollars
2007 ............... 4,357 430 1.37 1.95 6,809 2008 ............... 2,946 9 1.35 3.34 3,993 2009 ............... 2,313 38 1.49 3.48 3,580 2010 ............... 2,727 23 1.31 1.88 3,614 2011 ............... 2,582 51 1.25 3.84 3,414 2012 ............... 2,632 27 1.55 2.38 4,150 2013 ............... 2,572 33 1.47 2.53 3,870 2014 ............... 2,595 9 1.55 4.13 4,063 2015 ............... 2,641 8 1.56 3.85 4,161 2018 ............... (NA) (NA) (NA) (NA) (NA)
Florist azaleas 2
1,000 pots 1,000 pots Dollars per pot Dollars per pot 1,000 dollars
2007 ............... 1,514 5,081 2.34 4.90 28,435 2008 ............... 1,095 7,188 2.24 4.65 35,897 2009 ............... 2,345 5,214 2.30 4.92 31,044 2010 ............... 1,348 3,289 2.59 5.67 22,138 2011 ............... 1,266 3,012 2.32 6.01 21,022 2012 ............... 1,129 3,544 2.68 5.28 21,734 2013 ............... 1,109 3,313 2.48 5.05 19,471 2014 ............... 22 4,063 4.25 4.65 18,977 2015 ............... 103 3,587 5.26 4.96 18,343 2018 ............... (NA) (NA) (NA) (NA) (NA)
Florist chrysanthemums
1,000 pots 1,000 pots Dollars per pot Dollars 1,000 dollars
2007 ............... 1,810 11,363 1.65 3.15 38,777 2008 ............... 1,927 9,902 1.57 3.21 34,762 2009 ............... 1,314 6,181 1.90 3.61 24,842 2010 ............... 2,225 4,526 1.82 3.97 22,029 2011 ............... 1,351 5,210 2.43 3.54 21,720 2012 ............... 1,654 4,400 2.00 4.14 21,535 2013 ............... 613 5,343 2.82 3.99 23,045 2014 ............... 1,239 4,673 3.02 3.96 22,238 2015 ............... 457 4,119 2.02 3.83 16,699 2018 ............... 2,185 5,495 1.84 4.55 28,999
Easter lilies
1,000 pots 1,000 pots Dollars per pot Dollars per pot 1,000 dollars
2007 ............... ............................... 6,546 ............................... 4.05 26,512 2008 ............... 31 5,824 4.05 4.33 25,335 2009 ............... 93 6,196 3.16 4.38 27,405 2010 ............... 147 5,891 3.29 4.29 25,764 2011 ............... 99 5,094 2.73 4.35 22,436 2012 ............... 37 5,011 3.48 4.36 21,958 2013 ............... 295 5,901 2.80 4.23 25,758 2014 ............... 785 5,099 3.90 4.59 26,460 2015 ............... 155 5,370 2.54 4.45 24,317 2018 ............... 1,098 4,935 4.58 4.54 27,453
Potted Orchids
1,000 pots 1,000 pots Dollars per pot Dollars per pot 1,000 dollars
2007 ............... 10,661 6,655 6.95 9.89 139,960 2008 ............... 10,689 5,415 7.16 9.23 126,509 2009 ............... 12,503 7,135 7.36 9.70 161,208 2010 ............... 13,395 7,933 7.10 9.71 172,196 2011 ............... 15,415 8,520 6.78 10.19 191,306 2012 ............... 15,915 12,389 7.01 9.62 230,695 2013 ............... 18,934 12,750 7.34 8.83 251,559 2014 ............... 19,085 14,474 7.65 8.80 273,481 2015 ............... 19,393 16,983 7.25 8.70 288,284 2018 ............... 20,546 14,142 7.59 9.71 293,399
See footnote(s) at end of table.

V–49 AGRICULTURAL STATISTICS 2020
Table 5-93.—Potted flowering for indoor or patio use: Sales and wholesale value for operations with $100,000+ sales, Surveyed States, 2007–2018—Continued
Year
Quantity sold Wholesale price Value of sales at
wholesale 1 Less than 5 inches 5 inches or more Less than 5
inches 5 inches or more
Poinsettias
1,000 pots 1,000 pots Dollars per pot Dollars per pot 1,000 dollars
2007 ..................... 7,130 31,901 2.07 4.60 161,409 2008 ..................... 6,373 28,922 2.07 4.82 152,611 2009 ..................... 6,679 28,649 2.13 4.69 148,579 2010 ..................... 7,710 26,942 2.02 4.65 140,841 2011 ..................... 7,470 27,259 1.84 4.60 139,274 2012 ..................... 6,620 27,301 2.12 4.77 144,309 2013 ..................... 6,610 26,797 2.06 4.82 142,805 2014 ..................... 6,338 27,263 2.15 4.77 143,715 2015 ..................... 6,509 25,459 2.14 4.94 139,710 2018 ..................... 8,479 25,720 2.22 5.05 148,760
Potted florist roses
1,000 pots 1,000 pots Dollars per pot Dollars 1,000 dollars
2007 ..................... 6,834 2,364 1.94 5.16 25,425 2008 ..................... 7,252 1,064 2.74 5.34 25,569 2009 ..................... 6,924 1,031 2.57 5.14 23,115 2010 ..................... 5,599 2,167 2.50 5.83 26,669 2011 ..................... 5,183 2,550 2.16 4.87 23,619 2012 ..................... 5,729 2,828 2.18 5.74 28,741 2013 ..................... 5,976 2,750 2.40 6.14 31,214 2014 ..................... 7,751 934 3.26 6.41 31,282 2015 ..................... 6,341 1,784 2.42 5.25 24,696 2018 ..................... 8,353 2,478 1.91 4.88 28,069
Potted spring flowering bulbs
1,000 pots 1,000 pots Dollars per pot Dollars 1,000 dollars
2007 ..................... 10,073 8,624 1.91 3.66 50,861 2008 ..................... 13,317 10,958 1.69 3.56 61,532 2009 ..................... 4,689 11,234 1.74 3.43 46,662 2010 ..................... 9,766 12,382 1.46 3.52 57,903 2011 ..................... 8,162 11,637 1.52 3.54 53,638 2012 ..................... 5,095 11,434 1.74 3.63 50,376 2013 ..................... 4,623 11,013 1.96 3.77 50,614 2014 ..................... 5,018 10,791 1.78 3.86 50,561 2015 ..................... 5,548 16,865 2.19 3.38 69,115 2018 ..................... 6,347 16,502 2.42 3.27 69,376
Other flowering
1,000 pots 1,000 pots Dollars per pot Dollars per pot 1,000 dollars
2007 ..................... 27,176 36,862 2.09 4.51 223,111 2008 ..................... 22,529 31,482 2.10 4.91 201,962 2009 ..................... 19,531 29,173 2.13 4.62 176,570 2010 ..................... 17,162 25,695 2.71 5.00 175,006 2011 ..................... 24,663 21,896 1.88 5.36 163,903 2012 ..................... 22,670 25,625 2.57 5.99 211,766 2013 ..................... 24,868 26,835 2.67 5.87 223,931 2014 ..................... 25,569 32,190 2.70 5.29 239,162 2015 ..................... 23,575 29,889 1.93 5.99 224,335 2018 ..................... 31,310 40,991 2.48 4.95 280,698
(NA) Not available. 1 Equivalent wholesale value of all sales except for potted foliage which is value of sales less cost of plant material purchased from other growers for growing on. 2 Estimates discontinued in 2018.
NASS, Crops Branch, (202) 720–2127.

V–50 FRUITS, TREE NUTS, AND HORTICULTURAL SPECIALTIES
Table 5-94.—Annual Bedding and Garden Hanging Baskets: Sales and wholesale value for operations with $100,000+ sales, Surveyed States, 2007–2018
Year Quantity sold Wholesale price
Value of sales at wholesale 1 Quantity sold Wholesale
price Value of sales at wholesale 1
Begonias Geraniums from vegetative cuttings
1,000 baskets Dollars 1,000 dollars 1,000 baskets Dollars 1,000 dollars
2007 ........................... 1,701 5.76 9,796 3,296 6.87 22,640 2008 ........................... 1,707 5.80 9,899 3,056 7.32 22,366 2009 ........................... 1,531 5.84 8,944 3,564 7.44 26,523 2010 ........................... 1,650 5.96 9,839 3,753 7.10 26,659 2011 ........................... 1,622 5.99 9,723 3,561 7.13 25,390 2012 ........................... 1,823 5.94 10,830 3,280 7.49 24,562 2013 ........................... 2,016 6.33 12,770 3,126 7.39 23,113 2014 ........................... 1,849 6.00 11,089 3,320 7.56 25,089 2015 ........................... 1,960 6.25 12,250 3,310 7.43 24,586 2018 ........................... 1,954 7.38 14,424 4,005 7.63 30,561
Geraniums from seeds 2 Impatiens, Other
1,000 baskets Dollars 1,000 dollars 1,000 baskets Dollars 1,000 dollars
2007 ........................... 316 5.63 1,778 2,597 5.22 13,548 2008 ........................... 267 6.05 1,616 2,375 5.29 12,561 2009 ........................... 455 5.95 2,708 2,098 5.79 12,146 2010 ........................... 286 7.01 2,005 2,534 5.63 14,260 2011 ........................... 337 6.61 2,227 2,385 5.72 13,639 2012 ........................... 475 6.56 3,115 2,479 5.44 13,494 2013 ........................... 415 7.28 3,020 2,065 5.33 11,015 2014 ........................... 460 7.46 3,432 2,021 5.32 10,750 2015 ........................... 438 7.39 3,237 2,098 5.45 11,432 2018 ........................... (NA) (NA) (NA) 2,124 5.44 11,560
New Guinea Impatiens Marigolds
1,000 baskets Dollars 1,000 dollars 1,000 baskets Dollars 1,000 dollars
2007 ........................... 2,987 6.96 20,797 184 6.08 1,118 2008 ........................... 2,668 7.23 19,280 202 6.30 1,272 2009 ........................... 2,556 7.09 18,122 55 6.33 348 2010 ........................... 2,615 7.11 18,581 83 6.01 499 2011 ........................... 2,456 7.14 17,526 77 5.77 444 2012 ........................... 2,380 7.32 17,420 87 4.92 428 2013 ........................... 2,254 7.37 16,613 117 4.38 513 2014 ........................... 2,294 7.31 16,764 137 5.88 805 2015 ........................... 2,388 7.39 17,637 139 5.99 833 2018 ........................... 2,123 7.51 15,936 192 5.10 979
Pansies/Violas Petunias
1,000 baskets Dollars 1,000 dollars 1,000 baskets Dollars 1,000 dollars
2007 ........................... 694 5.02 3,485 4,011 5.99 24,017 2008 ........................... 695 5.20 3,612 3,969 5.98 23,752 2009 ........................... 1,077 5.43 5,848 4,186 6.38 26,711 2010 ........................... 911 5.59 5,091 5,066 6.16 31,225 2011 ........................... 941 5.83 5,483 5,047 6.29 31,767 2012 ........................... 1,096 5.75 6,299 5,028 6.21 31,240 2013 ........................... 1,085 5.62 6,096 4,986 6.11 30,459 2014 ........................... 1,182 5.92 7,002 5,557 6.28 34,906 2015 ........................... 1,111 6.23 6,920 5,294 6.27 33,196 2018 ........................... 1,077 6.51 7,006 6,154 5.97 36,712
Other flowering hanging baskets and foliar
1,000 baskets Dollars 1,000 dollars
2007 ........................... 15,153 6.95 105,330 2008 ........................... 14,718 6.92 101,856 2009 ........................... 14,451 7.36 106,323 2010 ........................... 13,483 7.67 103,399 2011 ........................... 12,759 7.56 96,500 2012 ........................... 14,865 7.33 109,030 2013 ........................... 14,797 7.73 114,409 2014 ........................... 13,259 8.23 109,117 2015 ........................... 15,269 7.67 117,065 2018 ........................... 15,269 8.20 124,587
(NA) Not available. 1 Equivalent wholesale value of all sales. 2 Estimates discontinued in 2018. NASS, Crops Branch, (202) 720–2127.

V–51 AGRICULTURAL STATISTICS 2020
Table 5-95.—Annual bedding garden plants flats: Sales and wholesale value for operations with $100,000+ sales, Surveyed States, 2007–2018
Year Quantity sold Wholesale price
Value of sales at wholesale 1 Quantity sold Wholesale
price Value of sales at wholesale 1
Begonias Geraniums from vegetative cuttings
1,000 flats Dollars 1,000 dollars 1,000 flats Dollars 1,000 dollars
2007 ............... 4,094 8.17 33,444 417 12.32 5,138 2008 ............... 4,360 8.49 36,999 396 12.57 4,979 2009 ............... 4,055 8.75 35,490 353 15.09 5,326 2010 ............... 4,218 8.13 34,313 306 13.12 4,015 2011 ............... 3,983 7.97 31,738 264 14.08 3,716 2012 ............... 3,865 8.56 33,005 237 13.57 3,215 2013 ............... 3,758 8.15 30,640 325 11.65 3,785 2014 ............... 3,970 8.62 34,208 252 14.03 3,535 2015 ............... 3,819 8.33 31,813 248 12.83 3,182 2018 ............... 4,240 8.53 36,182 556 13.72 7,626
Geraniums from seeds 2 Impatients, other
1,000 flats Dollars 1,000 dollars 1,000 flats Dollars 1,000 dollars
2007 ............... 380 11.54 4,387 8,915 8.11 72,320 2008 ............... 384 11.00 4,223 8,547 8.52 72,815 2009 ............... 424 9.23 3,915 7,973 8.67 69,093 2010 ............... 465 10.29 4,784 8,641 8.24 71,160 2011 ............... 332 10.62 3,526 8,353 7.96 66,519 2012 ............... 394 9.81 3,866 6,852 9.08 62,230 2013 ............... 475 7.51 3,565 5,055 8.17 41,300 2014 ............... 372 9.26 3,445 4,775 8.38 40,034 2015 ............... 425 8.07 3,431 4,404 8.78 38,647 2018 ............... (NA) (NA) (NA) 4,896 8.45 41,357
New Guinea Impatiens Marigolds
1,000 flats Dollars 1,000 dollars 1,000 flats Dollars 1,000 dollars
2007 ............... 243 11.09 2,696 3,694 8.39 31,001 2008 ............... 218 11.55 2,518 3,933 8.69 34,190 2009 ............... 290 10.77 3,124 3,976 8.98 35,713 2010 ............... 276 9.69 2,675 4,100 8.89 36,444 2011 ............... 190 10.56 2,006 3,884 8.45 32,807 2012 ............... 226 9.86 2,229 3,436 8.49 29,188 2013 ............... 335 10.01 3,355 3,488 8.24 28,733 2014 ............... 625 9.84 6,148 3,671 8.36 30,706 2015 ............... 368 9.76 3,592 3,587 8.20 29,425 2018 ............... 547 9.93 5,432 3,495 9.24 32,282
Pansies/Violas Petunias
1,000 flats Dollars 1,000 dollars 1,000 flats Dollars 1,000 dollars
2007 ............... 8,047 8.33 67,050 7,023 8.52 59,808 2008 ............... 8,169 8.82 72,036 7,402 8.80 65,129 2009 ............... 7,430 9.15 67,957 7,006 9.32 65,317 2010 ............... 7,538 8.88 66,916 7,448 8.92 66,404 2011 ............... 7,266 8.66 62,936 7,227 8.56 61,891 2012 ............... 7,343 9.02 66,245 6,667 8.64 57,618 2013 ............... 6,369 8.94 56,926 6,581 8.36 55,034 2014 ............... 7,272 8.45 61,441 6,896 9.11 62,822 2015 ............... 6,297 8.91 56,113 6,448 8.76 56,509 2018 ............... 5,269 9.72 51,195 5,751 9.62 55,348
Other flowering and foliar plants Vegetable type plants
1,000 flats Dollars 1,000 dollars 1,000 flats Dollars 1,000 dollars
2007 ............... 21,350 8.70 185,788 4,135 9.39 38,822 2008 ............... 19,441 9.00 175,027 4,545 10.25 46,573 2009 ............... 16,331 9.45 154,342 5,025 10.53 52,911 2010 ............... 17,898 9.40 168,261 4,862 10.20 49,603 2011 ............... 17,836 9.50 169,484 5,102 10.53 53,740 2012 ............... 16,934 9.10 154,089 6,297 9.64 60,714 2013 ............... 16,275 8.71 141,740 4,998 10.18 50,858 2014 ............... 14,788 9.38 138,683 4,861 10.82 52,616 2015 ............... 14,811 8.87 131,358 5,453 10.60 57,808 2018 ............... 14,488 10.00 144,925 7,330 11.73 86,013
(NA) Not available. 1 Equivalent wholesale value of all sales. 2 Estimates discontinued in 2018. NASS, Crops Branch, (202) 720–2127.

V–52 FRUITS, TREE NUTS, AND HORTICULTURAL SPECIALTIES
Table 5-96.—Potted annual bedding and garden plants: Sales and wholesale value for operations with $100,000+ sales, Surveyed States, 2007–2018
Year Quantity sold Wholesale price Value of sales at
wholesale 1 Less than 5 inches 5 inches or more Less than 5 inches 5 inches or more
Begonias
1,000 pots 1,000 pots Dollars Dollars 1,000 dollars
2007 ............... 16,748 3,683 0.84 2.06 21,645 2008 ............... 16,481 4,296 0.91 2.17 24,293 2009 ............... 17,821 3,272 0.86 2.34 22,907 2010 ............... 14,709 3,163 0.92 2.22 20,617 2011 ............... 14,763 3,374 0.91 2.24 20,973 2012 ............... 15,837 3,323 0.91 2.40 22,340 2013 ............... 18,296 4,118 0.94 2.58 27,922 2014 ............... 16,901 3,619 1.02 2.48 26,248 2015 ............... 16,853 4,757 1.05 2.82 31,023 2018 ............... 16,923 5,958 1.03 2.91 34,772
Geraniums from cuttings
1,000 pots 1,000 pots Dollars Dollars 1,000 dollars
2007 ............... 22,785 13,253 1.66 3.35 82,364 2008 ............... 23,094 13,050 1.76 3.35 84,300 2009 ............... 22,985 14,209 1.79 3.18 86,303 2010 ............... 23,339 13,431 1.81 3.54 89,770 2011 ............... 21,156 12,844 1.85 3.57 85,031 2012 ............... 21,563 13,560 1.85 3.38 85,842 2013 ............... 20,429 11,554 1.88 3.62 80,293 2014 ............... 21,093 11,119 1.93 3.70 81,970 2015 ............... 19,821 11,724 1.92 3.66 80,989 2018 ............... 20,587 11,701 1.82 3.77 81,641
Geraniums from seed 2
1,000 pots 1,000 pots Dollars Dollars 1,000 dollars
2007 ............... 28,897 343 0.83 2.86 25,071 2008 ............... 25,114 367 0.87 3.31 23,186 2009 ............... 24,622 495 0.92 2.78 23,923 2010 ............... 18,748 1,248 1.03 4.67 25,097 2011 ............... 23,673 1,648 0.93 5.20 30,680 2012 ............... 16,449 728 0.88 3.42 16,988 2013 ............... 17,825 393 1.12 3.49 21,604 2014 ............... 17,230 340 1.11 4.06 20,552 2015 ............... 13,336 1,119 1.00 3.58 17,297 2018 ............... (NA) (NA) (NA) (NA) (NA)
Other impatiens
1,000 pots 1,000 pots Dollars Dollars 1,000 dollars
2007 ............... 19,575 5,575 0.81 1.69 25,267 2008 ............... 20,606 4,973 0.78 1.91 25,663 2009 ............... 21,923 5,075 0.76 1.87 26,065 2010 ............... 21,955 4,033 0.77 2.43 26,702 2011 ............... 20,480 4,220 0.77 2.25 25,334 2012 ............... 13,941 4,834 0.82 2.11 21,678 2013 ............... 8,825 3,629 0.94 1.90 15,245 2014 ............... 7,115 3,776 0.95 1.88 13,880 2015 ............... 6,754 3,614 1.00 2.25 14,911 2018 ............... 7,786 2,104 1.38 2.78 16,608
New guinea impatiens
1,000 pots 1,000 pots Dollars Dollars 1,000 dollars
2007 ............... 11,885 4,735 1.58 2.83 32,180 2008 ............... 12,630 4,283 1.57 3.18 33,459 2009 ............... 12,439 3,834 1.59 3.25 32,177 2010 ............... 10,919 3,961 1.50 3.28 29,376 2011 ............... 9,794 3,658 1.59 3.44 28,130 2012 ............... 11,640 4,236 1.47 3.27 30,956 2013 ............... 13,325 4,045 1.51 3.46 34,105 2014 ............... 12,971 4,160 1.59 3.39 34,762 2015 ............... 12,864 4,024 1.52 3.63 34,158 2018 ............... 13,989 4,679 1.78 3.20 39,857
See footnote(s) at end of table.

V–53 AGRICULTURAL STATISTICS 2020
Table 5-96.—Potted annual bedding and garden plants: Sales and wholesale value for operations with $100,000+ sales, Surveyed States, 2007–2018—Continued
Year Quantity sold Wholesale price Value of sales at
wholesale 1 Less than 5 inches 5 inches or more Less than 5 inches 5 inches or more
Marigolds
1,000 pots 1,000 pots Dollars Dollars 1,000 dollars
2007 ............... 8,372 2,150 0.68 1.59 9,125 2008 ............... 7,600 1,704 0.72 1.61 8,185 2009 ............... 8,837 1,826 0.78 1.76 10,124 2010 ............... 7,901 2,463 0.76 1.88 10,621 2011 ............... 7,180 2,272 0.81 1.82 9,947 2012 ............... 8,871 1,792 0.79 2.10 10,762 2013 ............... 8,637 1,819 0.80 2.09 10,688 2014 ............... 9,264 1,273 0.97 2.32 11,922 2015 ............... 9,100 1,745 0.97 2.14 12,596 2018 ............... 8,020 2,357 1.09 2.39 14,366
Pansies/violas
1,000 pots 1,000 pots Dollars Dollars 1,000 dollars
2007 ............... 28,021 6,145 0.74 2.13 33,788 2008 ............... 25,980 5,989 0.75 2.09 31,966 2009 ............... 27,054 5,529 0.74 2.06 31,363 2010 ............... 23,394 6,159 0.80 2.02 31,035 2011 ............... 24,573 6,130 0.80 2.12 32,692 2012 ............... 23,416 6,918 0.81 2.19 34,078 2013 ............... 21,953 6,155 0.86 2.19 32,308 2014 ............... 22,813 6,273 0.86 2.17 33,116 2015 ............... 23,029 6,418 0.89 2.17 34,518 2018 ............... 14,732 7,522 1.03 2.33 32,646
Petunias
1,000 pots 1,000 pots Dollars Dollars 1,000 dollars
2007 ............... 18,551 6,935 0.98 2.37 34,558 2008 ............... 16,310 6,796 1.01 2.27 31,852 2009 ............... 18,088 7,527 0.98 2.20 34,301 2010 ............... 19,152 9,142 1.07 2.11 39,732 2011 ............... 18,212 8,843 1.12 2.07 38,629 2012 ............... 20,830 8,651 1.14 2.30 43,546 2013 ............... 18,713 8,251 1.23 2.64 44,844 2014 ............... 17,627 7,763 1.27 2.70 43,273 2015 ............... 17,664 7,815 1.28 2.68 43,536 2018 ............... 16,681 10,173 1.30 2.75 49,646
Other flowering and foliar plants
1,000 pots 1,000 pots Dollars Dollars 1,000 dollars
2007 ............... 117,723 50,605 1.13 3.08 288,890 2008 ............... 108,251 55,789 1.20 2.65 278,250 2009 ............... 93,289 48,271 1.18 3.06 257,709 2010 ............... 104,633 57,937 1.26 3.04 301,479 2011 ............... 108,661 54,133 1.25 2.96 296,030 2012 ............... 127,328 64,961 1.20 3.02 348,961 2013 ............... 111,363 50,025 1.32 3.30 309,160 2014 ............... 98,436 45,668 1.35 3.33 284,313 2015 ............... 106,082 47,534 1.38 3.39 307,799 2018 ............... 115,900 64,616 1.45 3.56 398,531
Vegetable type plants 3
1,000 pots 1,000 pots Dollars Dollars 1,000 dollars
2007 ............... 27,676 3,874 1.01 2.22 36,668 2008 ............... 35,998 7,497 1.06 2.49 56,697 2009 ............... 38,534 12,794 1.07 2.51 73,307 2010 ............... 38,453 14,155 1.12 2.64 80,411 2011 ............... 40,176 7,478 1.29 3.19 75,761 2012 ............... 31,100 12,211 1.22 2.98 74,478 2013 ............... 31,816 10,057 1.24 3.16 71,249 2014 ............... 44,491 10,531 1.47 3.21 99,356 2015 ............... 36,402 8,174 1.33 2.73 70,721 2018 ............... 37,663 7,998 1.43 4.15 87,023
(NA) Not available. 1 Equivalent wholesale value of all sales. 2 Estimates discontinued in 2018. 3 Does not include veg-etable transplants grown for use in commercial vegetable production.
NASS, Crops Branch, (202) 720–2127.

V–54 FRUITS, TREE NUTS, AND HORTICULTURAL SPECIALTIES
Table 5-97.—Potted herbaceous perennial plants: Sales and wholesale value for operations with $100,000+ sales, Surveyed States, 2007–2018
Year Quantity sold Wholesale price Value of sales at
wholesale 1 Less than 5 inches 5 inches or more Less than 5 inches 5 inches or more
Hardy/Garden Chrysanthemums
1,000 pots 1,000 pots Dollars Dollars 1,000 dollars
2007 ............... 9,763 35,148 1.06 2.66 103,831 2008 ............... 9,217 34,689 1.10 2.61 100,868 2009 ............... 8,049 35,833 1.25 2.81 110,747 2010 ............... 11,352 34,531 1.10 2.93 113,620 2011 ............... 11,962 36,634 1.03 2.77 113,747 2012 ............... 13,327 35,792 1.03 3.08 124,097 2013 ............... 15,558 33,176 1.08 2.89 112,552 2014 ............... 14,727 33,907 1.04 3.08 119,888 2015 ............... 9,326 37,885 1.12 2.99 123,677 2018 ............... 15,810 37,243 1.46 3.34 147,494
Year
Quantity sold Wholesale price Value of sales at
wholesale 1 Less than 1 gallon 1-2 gallons 2 gallons or
more Less than 1
gallon 1-2 gallons 2 gallons or more
Hosta
1,000 pots 1,000 pots 1,000 pots Dollars Dollars Dollars 1,000 dollars
2007 ............... 4,374 6,589 271 1.74 3.50 7.69 32,723 2008 ............... 4,451 6,793 173 1.91 3.43 9.10 33,391 2009 ............... 4,279 6,340 582 2.15 3.36 6.47 34,283 2010 ............... 1,448 6,783 337 2.11 3.26 7.54 27,704 2011 ............... 2,112 6,270 281 2.27 3.19 8.53 27,195 2012 ............... 2,365 5,535 363 2.34 3.40 8.04 27,240 2013 ............... 2,511 5,898 382 2.64 3.39 7.98 29,671 2014 ............... 5,362 3,870 398 2.73 3.75 7.78 32,242 2015 ............... 5,195 4,419 419 2.70 3.92 8.35 34,869 2018 ............... 5,128 3,521 162 2.85 4.35 9.11 31,391
Other Herbaceous Perennials
1,000 pots 1,000 pots 1,000 pots Dollars Dollars Dollars 1,000 dollars
2007 ............... 68,640 69,843 6,442 1.71 3.33 6.84 394,407 2008 ............... 65,928 74,574 7,533 1.59 3.43 6.65 410,867 2009 ............... 50,229 80,234 4,975 1.68 3.42 6.92 392,847 2010 ............... 53,613 86,180 6,257 1.63 3.38 7.11 423,266 2011 ............... 56,970 83,944 5,459 1.75 3.35 7.43 421,276 2012 ............... 56,936 65,596 10,001 1.77 3.78 7.33 422,282 2013 ............... 62,721 72,430 6,983 1.90 3.90 8.41 460,375 2014 ............... 62,508 60,111 5,823 2.19 3.90 8.47 420,547 2015 ............... 57,666 62,449 4,271 2.17 4.01 8.75 412,866 2018 ............... 69,491 63,028 14,100 2.05 4.06 6.53 489,931
1 Equivalent wholesale value of all sales. NASS, Crops Branch, (202) 720–2127.

V–55 AGRICULTURAL STATISTICS 2020
Table 5-98.—Floriculture: Number of Producers and Area Used for Production by Type of Cover, operations with $10,000+ sales, 15 Program States: 2015 and 2018
State
Total number of producers Glass greenhouses
Fiberglass and other rigid greenhouses
Film plastic (single/ multi) greenhouses
2015 2018 2015 2018 2015 2018 2015 2018
Number 1,000 square feet
Alaska 1 ............. (NA) 51 (NA) (D) (NA) (D) (D) 253 California .......... 685 850 10,748 10,387 30,042 30,091 30,091 64,726 Colorado 1 ......... (NA) 121 (NA) (D) (NA) (D) (D) 3,854 Connecticut 1 .... (NA) 216 (NA) 2,533 (NA) 1,560 1,560 10,067 Florida ............... 710 680 3,054 3,800 8,159 5,468 5,468 34,499 Hawaii 2 ............. 301 (NA) (D) (NA) (D) (NA) (NA) (NA) Illinois ................ 273 241 2,966 2,695 2,249 1,701 1,701 9,058 Maryland 2 ......... 153 (NA) 1,644 (NA) 1,375 (NA) (NA) (NA) Michigan ........... 556 569 3,458 3,126 3,773 2,926 2,926 41,861 New Jersey ....... 273 303 4,675 4,350 1,031 548 548 13,213 New York .......... 615 585 3,816 3,114 1,223 1,467 1,467 15,156 North Carolina .. 294 257 6,652 7,662 529 265 265 13,486 Ohio .................. 472 481 8,860 9,455 1,767 2,272 2,272 15,337 Oregon .............. 283 259 2,835 2,367 2,691 2,485 2,485 12,054 Pennsylvania .... 727 683 2,585 2,616 3,808 3,613 3,613 16,135 South Carolina 2 72 (NA) (D) (NA) (D) (NA) (NA) (NA) Texas ................ 251 254 1,361 1,221 3,696 4,977 4,977 25,844 Virginia 1 ........... (NA) 190 (NA) 574 (NA) 68 68 12,233 Washington ....... 248 277 2,317 1,860 1,099 894 894 5,771 Wisconsin 1 ....... (NA) 369 (NA) 793 (NA) 1,457 1,457 8,148 Other States 3 ... ................. ................. 27 1,326 1,704 3,647 3,647 .................
Total .................. 5,913 6,386 54,998 57,879 63,146 63,439 63,439 301,695
State
Total greenhouse cover
Shade and temporary cover Total covered area Open ground 4
2015 2018 2015 2018 2015 2018 2015 2018
1,000 square feet Acres
Alaska 1 ............. (NA) 1,063 (NA) - (NA) 1,063 (NA) 54 California .......... 104,779 105,204 37,148 30,386 141,927 135,590 9,399 13,327 Colorado 1 ......... (NA) 8,017 (NA) 188 (NA) 8,205 (NA) 169 Connecticut 1 .... (NA) 14,160 (NA) 211 (NA) 14,371 (NA) 503 Florida ............... 51,673 43,767 289,184 392,386 340,857 436,153 6,853 6,527 Hawaii 2 ............. (D) (NA) (D) (NA) 17,940 (NA) 914 (NA) Illinois ................ 14,604 13,454 664 619 15,268 14,073 4,272 1,179 Maryland 2 ......... 9,274 (NA) 360 (NA) 9,634 (NA) 618 (NA) Michigan ........... 46,278 47,913 711 1,742 46,989 49,655 2,063 2,359 New Jersey ....... 23,236 18,111 493 227 23,729 18,338 4,826 2,890 New York .......... 20,760 19,737 433 377 21,193 20,114 722 943 North Carolina .. 21,640 21,413 1,244 251 22,884 21,664 912 644 Ohio .................. 26,632 27,064 956 538 27,588 27,602 385 431 Oregon .............. 18,861 16,906 2,275 2,408 21,136 19,314 3,903 3,047 Pennsylvania .... 20,959 22,364 262 187 21,221 22,551 778 802 South Carolina 2 (D) (NA) (D) (NA) 5,921 (NA) 396 (NA) Texas ................ 33,109 32,042 6,485 5,694 39,594 37,736 1,215 1,789 Virginia 1 ........... (NA) 12,875 (NA) 430 (NA) 13,305 (NA) 582 Washington ....... 10,118 8,525 917 286 11,035 8,811 2,786 2,132 Wisconsin 1 ....... (NA) 10,398 (NA) 431 (NA) 10,829 (NA) 980 Other States 3 ... 7,425 ................. 16,436 ................. ................. ................. ................. .................
Total .................. 409,348 423,013 357,568 436,361 766,916 859,374 40,042 38,358
(D) Withheld to avoid disclosure of individual operations. (NA) Not available. 1 Estimates began in 2018. 2 Estimates discontinued in 2018. 3 Includes data withheld above. 4 Totals may not add due to rounding.
NASS, Crops Branch, (202) 720-2127.

V–56 FRUITS, TREE NUTS, AND HORTICULTURAL SPECIALTIES
Table 5-99.—Floriculture Crops: Wholesale value of all sales by category, operations with $100,000+ sales: 2015 and 2018
State
Annual bedding/ garden plants
Herbaceous perennial plants
Total bedding/ garden plants 1
2015 2018 2015 2018 2015 2018
1,000 dollars
Alaska 2 ............... (NA) 4,136 (NA) 336 (NA) 4,472 California ............. 193,209 205,623 72,361 126,603 265,570 332,226 Colorado 2 ........... (NA) 61,486 (NA) 23,647 (NA) 85,133 Connecticut 2 ....... (NA) 74,025 (NA) 40,683 (NA) 114,708 Florida ................. 96,402 140,090 37,023 63,539 133,425 203,629 Hawaii 3 ............... 2,199 (NA) 1,587 (NA) 3,786 (NA) Illinois .................. 38,595 40,612 25,619 35,375 64,214 75,987 Maryland 3 ........... 64,704 (NA) 37,527 (NA) 102,231 (NA) Michigan .............. 208,727 224,469 61,939 69,390 270,666 293,859 New Jersey ......... 77,016 71,187 56,641 49,562 133,657 120,749 New York ............ 86,189 72,076 24,608 21,276 110,797 93,352 North Carolina ..... 140,596 84,195 42,873 58,199 183,469 142,394 Ohio ..................... 81,126 69,016 51,844 40,933 132,970 109,949 Oregon ................ 52,586 71,514 30,667 37,857 83,253 109,371 Pennsylvania ....... 67,574 77,783 22,593 31,025 90,167 108,808 South Carolina 3 .. 8,036 (NA) 46,786 (NA) 54,822 (NA) Texas .................. 136,112 98,708 32,118 29,868 168,230 128,576 Virginia 2 .............. (NA) 76,269 (NA) 24,254 (NA) 100,523 Washington ......... 33,511 39,586 27,226 38,449 60,737 78,035 Wisconsin 2 .......... (NA) 46,440 (NA) 16,595 (NA) 63,035 Other States 4 ...... .......................... ........................ ..................... ........................ ........................ ........................
Total .................... 1,286,582 1,457,215 571,412 707,591 1,857,994 2,164,806
State
Potted flowering plants
Foliage plants for indoor or patio use
Cut flowers
2015 2018 2015 2018 2015 2018
1,000 dollars
Alaska 2 ............... (NA) (D) (NA) (D) (NA) 163 California ............. 273,537 299,573 114,599 155,649 293,737 288,356 Colorado 2 ........... (NA) 9,149 (NA) 1,446 (NA) 2,724 Connecticut 2 ....... (NA) 8,460 (NA) (D) (NA) 66 Florida ................. 201,212 151,957 543,447 413,873 2,289 (D) Hawaii 3 ............... 15,079 (NA) 9,612 (NA) 7,014 (NA) Illinois .................. 23,875 25,070 1,121 1,746 1,103 (D) Maryland 3 ........... 7,060 (NA) (D) (NA) 470 (NA) Michigan .............. 31,147 70,435 6,305 8,849 5,312 (D) New Jersey ......... 29,368 50,723 (D) 12,996 14,675 (D) New York ............ 29,537 33,433 (D) 2,266 885 (D) North Carolina ..... 27,545 18,494 (D) 18,078 4,981 (D) Ohio ..................... 68,163 75,458 4,207 7,559 (D) 800 Oregon ................ 14,809 17,186 1,170 4,695 13,350 13,231 Pennsylvania ....... 44,954 47,996 (D) (D) (D) 8,513 South Carolina 3 .. 8,221 (NA) (D) (NA) (D) (NA) Texas .................. 27,165 26,040 (D) 14,010 (D) 3,533 Virginia 2 .............. (NA) 30,130 (NA) 835 (NA) 2,026 Washington ......... 7,988 7,028 (D) 6,486 20,457 21,571 Wisconsin 2 .......... (NA) (D) (NA) (D) (NA) 2,799 Other States 4 ...... .......................... 5,622 33,228 4,591 10,045 31,162
Total .................... 809,660 876,754 713,689 653,079 374,318 374,944
See footnote(s) at end of table.

V–57 AGRICULTURAL STATISTICS 2020
Table 5-99.—Floriculture Crops: Wholesale value of all sales by category, operations with $100,000+ sales: 2015 and 2018–Continued
State
Cut cultivated greens
Propagative floriculture material
Total wholesale value of all plant categories
2015 2018 2015 2018 2015 2018
1,000 dollars
Alaska 2 ............... (NA) ........................ (NA) ........................ (NA) 5,602 California ............. 15,762 21,105 107,076 102,488 1,070,281 1,199,397 Colorado 2 ........... (NA) ........................ (NA) 27,516 (NA) 125,968 Connecticut 2 ....... (NA) ........................ (NA) (D) (NA) 123,667 Florida ................. 61,080 (D) 86,828 90,893 1,028,281 938,886 Hawaii 3 ............... 323 (NA) 1,352 (NA) 37,166 (NA) Illinois .................. .......................... 10 1,359 1,633 91,672 105,372 Maryland 3 ........... .......................... (NA) (D) (NA) 111,163 (NA) Michigan .............. (D) (D) (D) 96,208 398,113 474,977 New Jersey ......... (D) (D) 18,271 21,122 197,001 221,597 New York ............ (D) (D) 16,522 17,712 160,167 148,014 North Carolina ..... .......................... (D) (D) 3,432 234,168 188,269 Ohio ..................... .......................... (D) (D) 3,142 210,102 196,923 Oregon ................ 2,465 3,318 14,292 10,925 129,339 158,726 Pennsylvania ....... (D) (D) (D) 27,864 169,962 195,620 South Carolina 3 .. .......................... (NA) (D) (NA) 63,199 (NA) Texas .................. (D) ........................ (D) 4,925 216,429 177,084 Virginia 2 .............. (NA) (D) (NA) (D) (NA) 140,093 Washington ......... (D) 44 21,920 13,655 112,761 126,819 Wisconsin 2 .......... (NA) (D) (NA) 2,995 (NA) 75,691 Other States 4 ...... 796 77,520 126,097 6,615 ........................ ........................
Total .................... 80,426 101,997 393,717 431,125 4,229,804 4,602,705
- Represents zero. (D) Withheld to avoid disclosure of individual operations.(NA) Not available. 1 Includes Annual Bed-ding Plants and Herbaceous Perennials. 2 Estimates began in 2018. 3 Estimates discontinued in 2018. 4 Includes data withheld above.
NASS, Crops Branch, (202) 720-2127.
Table 5-100.—Nuts, Pecans: Cold storage holdings, end of month, United States, 2017 and 2018
Month
Pecans
Shelled In-shell
2017 2018 2017 2018
1,000 pounds
January ........... 39,821 45,662 195,588 162,210 February .......... 44,708 46,991 203,931 196,988 March .............. 48,213 51,950 182,828 184,869 April ................. 52,640 57,156 158,509 161,330 May ................. 51,084 60,151 133,144 136,556 June ................ 53,941 63,314 106,529 111,349 July .................. 55,313 65,379 85,068 89,383 August ............. 56,911 70,019 63,032 57,796 September ...... 53,112 64,493 34,405 33,667 October ........... 46,475 55,475 23,686 25,476 November ....... 41,564 53,219 43,018 47,970 December ....... 44,036 54,259 95,912 94,823
NASS, Livestock Branch, (202) 720-3570.

V–58 FRUITS, TREE NUTS, AND HORTICULTURAL SPECIALTIES
Table 5-101.—Fruit and orange juice: Cold storage holdings, end of month, United States, 2017 and 2018
Month Apples Apricots Blackberries, IQF Blackberries, pails & tubs
2017 2018 2017 2018 2017 2018 2017 2018
1,000 pounds
January ....... 37,963 34,420 6,506 4,295 18,532 14,018 2,114 1,747 February ...... 36,919 35,915 4,103 3,616 16,980 11,789 1,409 1,502 March .......... 38,679 36,968 3,163 2,974 15,269 10,188 1,513 1,518 April ............. 44,495 35,087 2,848 2,275 14,755 9,329 1,382 1,184 May ............. 40,049 32,441 2,279 1,664 12,268 7,962 1,535 1,133 June ............ 37,418 33,715 11,696 8,301 12,541 8,924 1,488 1,106 July .............. 34,995 30,609 11,048 9,538 21,214 25,723 1,424 1,681 August ......... 34,475 24,822 8,512 8,843 22,190 22,340 1,439 1,320 September ... 29,471 22,366 7,335 8,148 20,717 22,247 1,483 1,344 October ....... 26,836 21,602 6,098 7,549 18,618 21,081 1,607 1,678 November .... 29,408 23,141 5,506 6,640 17,320 18,770 1,661 1,635 December .... 32,007 28,276 4,873 6,458 16,208 17,059 1,724 1,420
Month Blackberries, barrels Blackberries, concentrate Blackberries, total Blueberries
2017 2018 2017 2018 2017 2018 2017 2018
1,000 pounds
January ....... 8,043 4,356 851 1,281 29,540 21,402 241,947 192,354 February ...... 7,904 3,735 690 1,179 26,983 18,205 223,211 162,564 March .......... 6,715 3,210 654 1,266 24,151 16,182 195,417 134,469 April ............. 6,355 2,976 655 1,262 23,147 14,751 184,367 116,387 May ............. 6,590 2,416 563 1,023 20,956 12,534 157,140 96,891 June ............ 7,363 3,519 693 932 22,085 14,481 147,915 99,912 July .............. 13,494 10,207 781 1,103 36,913 38,714 197,723 175,163 August ......... 10,241 8,707 837 1,080 34,707 33,447 276,632 244,902 September ... 8,669 7,665 734 1,038 31,603 32,294 266,423 247,396 October ....... 6,792 6,417 1,007 922 28,024 30,098 256,727 228,308 November .... 6,618 5,900 1,083 764 26,682 27,069 230,843 199,883 December .... 5,326 5,389 1,191 771 24,449 24,639 222,060 182,857
Month Boysenberries Cherries, Tart (RTP) Cherries, Sweet Grapes
2017 2018 2017 2018 2017 2018 2017 2018
1,000 pounds
January ....... 1,499 412 131,911 125,530 20,042 16,935 1,290 2,859 February ...... 1,444 589 121,549 115,381 20,301 14,840 1,166 2,853 March .......... 1,208 437 111,923 108,226 18,044 14,400 1,371 3,015 April ............. 978 430 102,192 98,931 16,530 13,710 1,368 2,525 May ............. 843 347 93,736 88,879 13,998 12,447 2,281 3,055 June ............ 869 835 83,809 74,151 10,511 10,877 2,392 4,464 July .............. 1,224 1,044 155,363 167,724 16,605 16,941 2,790 3,719 August ......... 852 897 166,554 184,463 20,305 22,197 2,764 5,798 September ... 721 868 158,660 169,664 20,977 20,896 3,031 4,831 October ....... 665 933 154,858 156,443 20,736 16,924 3,155 3,785 November .... 768 794 142,281 145,503 19,546 14,646 2,897 4,417 December .... 585 722 134,946 141,203 17,801 15,147 2,977 4,772
Month Peaches Raspberries, Black Red Raspberries, IQF Red Raspberries,
pails & tubs
2017 2018 2017 2018 2017 2018 2017 2018
1,000 pounds
January ....... 74,285 68,986 1,047 1,756 29,657 33,313 6,498 6,428 February ...... 69,924 60,036 960 1,677 27,875 32,545 5,669 6,678 March .......... 64,477 54,899 1,012 1,703 24,868 29,636 5,273 6,369 April ............. 58,878 46,756 1,021 1,423 22,982 27,388 4,799 5,934 May ............. 53,696 40,717 870 1,306 19,910 24,831 4,795 5,671 June ............ 53,066 35,517 911 2,081 16,999 26,870 4,017 5,419 July .............. 62,003 37,622 2,015 2,718 39,775 55,768 8,718 9,483 August ......... 83,564 47,951 1,995 1,992 43,714 53,168 8,662 9,225 September ... 87,901 69,188 1,905 1,796 41,073 47,645 7,167 8,784 October ....... 85,238 69,577 1,584 1,625 35,904 43,591 7,281 8,483 November .... 84,813 64,956 1,590 1,513 36,458 39,721 7,251 7,913 December .... 76,686 62,532 1,498 1,467 34,781 37,341 7,216 7,627
See footnotes(s) at end of table.

V–59 AGRICULTURAL STATISTICS 2020
Table 5-101.—Fruit and orange juice: Cold storage holdings, end of month, United States, 2017 and 2018—Continued
Month
Red Raspberries, barrels
Red Raspberries, concentrate
Red Raspberries, total
Strawberries, IQF & Poly
2017 2018 2017 2018 2017 2018 2017 2018
1,000 pounds
January ....... 21,857 26,466 3,263 1,027 61,275 67,234 116,982 110,933 February ...... 18,119 23,695 3,109 2,037 54,772 64,955 103,960 95,498 March .......... 15,770 19,891 2,984 2,107 48,895 58,003 112,436 95,820 April ............. 13,456 20,758 2,911 2,126 44,148 56,206 119,276 90,021 May ............. 12,400 18,483 2,559 1,912 39,664 50,897 139,991 111,245 June ............ 10,964 14,062 1,838 2,211 33,818 48,562 154,949 141,526 July .............. 32,655 46,228 2,723 1,978 83,871 113,457 180,463 138,909 August ......... 38,161 46,080 2,647 1,896 93,184 110,369 175,380 129,037 September ... 38,007 44,888 1,058 1,882 87,305 103,199 168,268 126,616 October ....... 36,109 41,770 1,361 1,540 80,655 95,384 149,453 108,659 November .... 34,380 38,648 1,293 1,519 79,382 87,801 136,248 90,907 December .... 32,424 38,240 1,193 1,566 75,614 84,774 122,244 86,344
Month
Strawberries, pails & tubs
Strawberries, barrels & drums
Strawberries, juice stock
Strawberries, total
2017 2018 2017 2018 2017 2018 2017 2018
1,000 pounds
January ....... 84,344 83,607 61,185 46,853 27,111 11,626 289,622 253,019 February ...... 83,362 70,208 57,265 36,151 29,560 14,226 274,147 216,083 March .......... 67,296 57,643 50,287 28,576 25,959 13,841 255,978 195,880 April ............. 65,884 56,735 56,192 27,743 24,854 12,480 266,206 186,979 May ............. 78,498 82,692 69,293 43,875 24,462 11,716 312,244 249,528 June ............ 94,329 126,678 82,286 95,690 26,064 13,339 357,628 377,233 July .............. 109,452 122,929 97,989 100,883 23,337 10,475 411,241 373,196 August ......... 121,832 111,697 84,789 98,137 20,914 11,748 402,915 350,619 September ... 108,110 94,959 70,672 95,479 16,492 11,123 363,542 328,177 October ....... 101,259 84,202 66,590 81,553 15,748 11,796 333,050 286,210 November .... 98,398 81,755 60,415 69,646 14,290 10,870 309,351 253,178 December .... 90,885 73,196 54,950 57,780 12,997 10,113 281,076 227,433
Month Other fruit Total frozen fruit Orange juice
2017 2018 2017 2018 2017 2018
1,000 pounds
January ....... 764,821 595,561 1,673,422 1,390,288 503,356 517,105 February ...... 738,926 554,544 1,585,755 1,256,166 506,275 500,973 March .......... 665,196 487,759 1,439,934 1,119,005 517,057 563,125 April ............. 604,047 462,212 1,360,506 1,041,047 542,175 632,626 May ............. 543,809 399,596 1,290,956 992,928 575,365 730,886 June ............ 491,595 404,649 1,262,782 1,117,468 544,443 733,849 July .............. 502,270 395,232 1,530,292 1,379,068 505,491 691,110 August ......... 493,106 361,493 1,633,134 1,417,408 471,509 633,390 September ... 515,569 398,684 1,585,809 1,425,149 495,648 608,983 October ....... 700,422 741,609 1,707,834 1,677,206 493,531 566,387 November .... 709,259 710,973 1,650,332 1,556,323 468,090 528,895 December .... 666,624 654,518 1,547,787 1,449,406 505,077 547,910
NASS, Livestock Branch, (202) 720–3570.

VI–1
CHAPTER VI
STATISTICS OF HAY, SEEDS, AND MINOR FIELD CROPS
Chapter VI deals with hay, pasture, seeds, and various minor field crops.
Table 6-1.—Hay, all: Area, yield, and production, by State and United States, 2017–2019
State Area harvested Yield per harvested acre Production
2017 2018 2019 2017 2018 2019 2017 2018 2019
1,000 1,000 1,000 1,000 1,000 1,000 acres acres acres Tons Tons Tons tons tons tons
Alabama ................. 860 850 700 2.50 2.80 2.50 2,150 2,380 1,750 Alaska 1 ................... (X) 22 22 (X) 1.30 1.30 (X) 29 29 Arizona ................... 325 300 325 7.96 7.82 7.72 2,586 2,346 2,509 Arkansas ................. 1,293 1,203 1,253 2.00 1.80 2.20 2,591 2,168 2,760 California ................ 1,140 980 1,010 5.60 5.80 5.74 6,388 5,682 5,795 Colorado ................. 1,440 1,420 1,460 2.75 2.55 2.78 3,960 3,621 4,052 Connecticut ............. 48 47 47 2.29 2.34 1.72 110 110 81 Delaware ................ 15 13 14 3.20 2.62 2.21 48 34 31 Florida ..................... 300 280 270 2.50 3.10 2.90 750 868 783 Georgia ................... 620 600 560 2.90 2.90 2.75 1,798 1,740 1,540 Idaho ....................... 1,430 1,340 1,300 3.59 3.75 3.93 5,128 5,019 5,111 Illinois ...................... 490 470 420 3.25 2.79 2.71 1,593 1,309 1,140 Indiana .................... 540 510 520 2.76 2.71 2.48 1,492 1,382 1,290 Iowa ........................ 1,060 940 1,020 3.08 3.19 3.05 3,268 2,998 3,116 Kansas .................... 2,470 2,360 2,280 2.22 2.02 2.77 5,472 4,760 6,315 Kentucky ................. 2,125 1,895 1,945 2.43 2.68 2.27 5,170 5,088 4,424 Louisiana ................ 400 380 390 2.60 2.20 2.50 1,040 836 975 Maine ...................... 125 110 110 1.93 1.89 2.15 241 208 236 Maryland ................. 190 195 189 2.68 2.83 2.68 509 552 507 Massachusetts ........ 78 79 51 1.78 1.48 2.25 139 117 115 Michigan ................. 870 810 780 2.29 2.24 2.38 1,989 1,812 1,858 Minnesota ............... 1,360 1,220 1,100 2.79 2.52 2.70 3,797 3,077 2,966 Mississippi .............. 610 590 610 2.40 2.10 2.30 1,464 1,239 1,403 Missouri .................. 3,000 3,070 3,360 2.00 1.76 2.19 5,985 5,408 7,367 Montana .................. 2,500 2,900 3,000 1.90 1.93 2.08 4,740 5,595 6,225 Nebraska ................ 2,510 2,700 2,450 2.37 2.59 2.48 5,955 6,985 6,085 Nevada ................... 385 365 435 3.35 3.17 3.60 1,288 1,158 1,565 New Hampshire ...... 45 39 49 1.80 1.77 1.69 81 69 83 New Jersey ............. 108 114 91 2.22 1.93 2.05 240 220 187 New Mexico ............ 285 250 245 4.00 3.73 3.89 1,140 932 954 New York ................ 1,320 1,220 1,180 2.01 2.25 1.90 2,650 2,744 2,240 North Carolina ........ 657 816 816 2.30 2.71 2.30 1,514 2,210 1,877 North Dakota .......... 2,580 2,670 2,420 1.33 1.66 1.70 3,423 4,419 4,116 Ohio ........................ 960 970 920 2.47 2.43 2.32 2,371 2,356 2,137 Oklahoma ............... 2,930 3,230 3,005 1.92 1.59 1.98 5,638 5,121 5,935 Oregon .................... 1,085 1,000 970 3.05 3.06 3.47 3,304 3,056 3,362 Pennsylvania .......... 1,420 1,190 1,210 2.61 2.30 2.47 3,709 2,739 2,986 Rhode Island .......... 6 6 5 2.00 2.00 1.40 12 12 7 South Carolina ........ 300 270 270 2.60 2.50 2.10 780 675 567 South Dakota .......... 2,950 3,250 3,350 1.56 1.78 2.09 4,603 5,788 7,003 Tennessee .............. 1,665 1,720 1,763 2.26 2.46 2.31 3,767 4,231 4,073 Texas ...................... 4,520 4,740 4,920 2.11 1.77 1.87 9,548 8,374 9,216 Utah ........................ 705 650 680 3.74 3.38 3.85 2,636 2,195 2,618 Vermont .................. 185 170 160 1.97 2.15 1.86 364 366 298 Virginia .................... 1,195 1,140 1,145 2.31 2.23 2.23 2,764 2,540 2,555 Washington ............. 740 760 640 4.02 3.64 3.83 2,973 2,764 2,448 West Virginia .......... 567 535 515 1.78 1.72 1.74 1,009 922 894 Wisconsin ............... 1,270 1,360 1,300 2.77 2.17 2.14 3,522 2,953 2,784 Wyoming ................. 1,100 1,090 1,150 2.28 2.20 2.17 2,508 2,393 2,496
United States 2 ........ 52,777 52,839 52,425 2.43 2.34 2.46 128,207 123,600 128,864
(X) Not applicable. 1 Previously was included in the Alaska table. For 2017 data please refer to the Alaska table. 2 Beginning in 2018, United States total includes data for Alaska.
NASS, Crops Branch, (202) 720–2127.

VI–2 HAY, SEEDS, AND MINOR FIELD CROPS
Table 6-2.—Hay, all: Area, yield, production, and value, United States, 2010–2019
Year Area harvested Yield per acre Production
Marketing year average price per ton received by
farmers
Value of production
1,000 acres Tons 1,000 tons Dollars 1,000 dollars
2010 ........... 59,574 2.43 145,000 114.00 14,606,696 2011 ........... 55,204 2.35 129,880 178.00 18,085,074 2012 ........... 54,653 2.14 117,072 191.00 18,613,183 2013 ........... 57,973 2.33 135,198 176.00 19,845,080 2014 ........... 57,153 2.45 140,119 172.00 19,147,954 2015 ........... 54,529 2.47 134,668 145.00 16,568,121 2016 ........... 53,185 2.52 134,082 129.00 15,477,263 2017 ........... 52,777 2.43 128,207 142.00 16,109,040 2018 ........... 52,839 2.34 123,600 166.00 17,288,215 2019 ........... 52,425 2.46 128,864 165.00 18,160,596
NASS, Crops Branch, (202) 720–2127.
Table 6-3.—Alfalfa and alfalfa mixtures for hay: Area, yield, and production, by State and United States, 2017–2019
State Area harvested Yield per harvested acre Production
2017 2018 2019 2017 2018 2019 2017 2018 2019
1,000 1,000 1,000 1,000 1,000 1,000 acres acres acres Tons Tons Tons tons tons tons
Arizona ................... 285 260 280 8.40 8.30 8.30 2,394 2,158 2,324 Arkansas ................. 3 3 3 3.60 2.50 3.20 11 8 10 California ................ 700 620 580 6.80 6.90 7.10 4,760 4,278 4,118 Colorado ................. 720 730 730 3.70 3.40 3.70 2,664 2,482 2,701 Connecticut ............. 8 7 7 2.30 2.50 1.90 18 18 13 Delaware ................ 5 4 3 3.50 2.90 3.00 18 12 9 Idaho ....................... 1,060 1,050 1,010 4.00 4.20 4.40 4,240 4,410 4,444 Illinois ...................... 230 250 200 4.10 3.30 3.50 943 825 700 Indiana .................... 250 240 220 3.30 3.00 3.00 825 720 660 Iowa ........................ 720 620 700 3.50 3.70 3.40 2,520 2,294 2,380 Kansas .................... 570 610 630 3.60 3.50 4.00 2,052 2,135 2,520 Kentucky ................. 185 145 145 3.30 3.10 3.20 611 450 464 Maine ...................... 10 10 10 2.20 2.30 2.10 22 23 21 Maryland ................. 35 40 34 3.90 4.50 3.50 137 180 119 Massachusetts ........ 8 9 6 2.50 2.10 2.70 20 19 16 Michigan ................. 610 590 550 2.60 2.40 2.50 1,586 1,416 1,375 Minnesota ............... 870 720 730 3.35 2.85 3.10 2,915 2,052 2,263 Missouri .................. 300 270 260 2.40 2.40 2.70 720 648 702 Montana .................. 1,650 1,900 2,100 2.10 2.05 2.15 3,465 3,895 4,515 Nebraska ................ 860 850 950 3.95 4.30 3.80 3,397 3,655 3,610 Nevada ................... 225 185 225 4.30 4.70 4.90 968 870 1,103 New Hampshire ...... 5 4 4 1.80 2.20 1.50 9 9 6 New Jersey ............. 13 9 11 3.10 3.45 3.20 40 31 35 New Mexico ............ 190 160 160 5.00 4.70 4.90 950 752 784 New York ................ 400 300 290 2.60 2.40 2.20 1,040 720 638 North Carolina ........ 7 6 6 2.70 3.90 2.30 19 23 14 North Dakota .......... 1,380 1,470 1,220 1.35 1.70 1.80 1,863 2,499 2,196 Ohio ........................ 350 350 330 3.20 3.10 2.90 1,120 1,085 957 Oklahoma ............... 280 230 205 3.10 2.70 3.00 868 621 615 Oregon .................... 420 420 400 4.70 4.10 4.70 1,974 1,722 1,880 Pennsylvania .......... 430 300 290 3.10 2.90 3.00 1,333 870 870 Rhode Island .......... 1 1 1 2.00 2.00 2.20 2 2 2 South Dakota .......... 1,550 1,750 1,900 1.75 2.15 2.35 2,713 3,763 4,465 Tennessee .............. 15 20 13 3.60 3.30 3.70 54 66 48 Texas ...................... 120 140 120 4.40 5.60 4.80 528 784 576 Utah ........................ 550 500 510 4.20 3.70 4.30 2,310 1,850 2,193 Vermont .................. 30 20 20 1.80 1.80 2.30 54 36 46 Virginia .................... 65 40 45 3.40 3.00 3.00 221 120 135 Washington ............. 390 350 330 5.20 4.50 4.60 2,028 1,575 1,518 West Virginia .......... 17 15 15 2.70 2.50 2.90 46 38 44 Wisconsin ............... 910 820 880 3.00 2.35 2.40 2,730 1,927 2,112 Wyoming ................. 580 590 620 2.80 2.70 2.70 1,624 1,593 1,674
United States .......... 17,007 16,608 16,743 3.28 3.17 3.28 55,812 52,634 54,875
NASS, Crops Branch, (202) 720–2127.

VI–3 AGRICULTURAL STATISTICS 2020
Table 6-4.—Hay, all other: Area, yield, and production, by State and United States, 2017–2019
State Area harvested Yield per harvested acre Production
2017 2018 2019 2017 2018 2019 2017 2018 2019
1,000 1,000 1,000 1,000 1,000 1,000 acres acres acres Tons Tons Tons tons tons tons
Alabama 1 ............... 860 850 700 2.50 2.80 2.50 2,150 2,380 1,750 Alaska 1 2 ................ (X) 22 22 (X) 1.30 1.30 (X) 29 29 Arizona ................... 40 40 45 4.80 4.70 4.10 192 188 185 Arkansas ................. 1,290 1,200 1,250 2.00 1.80 2.20 2,580 2,160 2,750 California ................ 440 360 430 3.70 3.90 3.90 1,628 1,404 1,677 Colorado ................. 720 690 730 1.80 1.65 1.85 1,296 1,139 1,351 Connecticut ............. 40 40 40 2.30 2.30 1.70 92 92 68 Delaware ................ 10 9 11 3.00 2.40 2.00 30 22 22 Florida 1 ................... 300 280 270 2.50 3.10 2.90 750 868 783 Georgia 1 ................. 620 600 560 2.90 2.90 2.75 1,798 1,740 1,540 Idaho ....................... 370 290 290 2.40 2.10 2.30 888 609 667 Illinois ...................... 260 220 220 2.50 2.20 2.00 650 484 440 Indiana .................... 290 270 300 2.30 2.45 2.10 667 662 630 Iowa ........................ 340 320 320 2.20 2.20 2.30 748 704 736 Kansas .................... 1,900 1,750 1,650 1.80 1.50 2.30 3,420 2,625 3,795 Kentucky ................. 1,940 1,750 1,800 2.35 2.65 2.20 4,559 4,638 3,960 Louisiana 1 .............. 400 380 390 2.60 2.20 2.50 1,040 836 975 Maine ...................... 115 100 100 1.90 1.85 2.15 219 185 215 Maryland ................. 155 155 155 2.40 2.40 2.50 372 372 388 Massachusetts ........ 70 70 45 1.70 1.40 2.20 119 98 99 Michigan ................. 260 220 230 1.55 1.80 2.10 403 396 483 Minnesota ............... 490 500 370 1.80 2.05 1.90 882 1,025 703 Mississippi 1 ............ 610 590 610 2.40 2.10 2.30 1,464 1,239 1,403 Missouri .................. 2,700 2,800 3,100 1.95 1.70 2.15 5,265 4,760 6,665 Montana .................. 850 1,000 900 1.50 1.70 1.90 1,275 1,700 1,710 Nebraska ................ 1,650 1,850 1,500 1.55 1.80 1.65 2,558 3,330 2,475 Nevada ................... 160 180 210 2.00 1.60 2.20 320 288 462 New Hampshire ...... 40 35 45 1.80 1.70 1.70 72 60 77 New Jersey ............. 95 105 80 2.10 1.80 1.90 200 189 152 New Mexico ............ 95 90 85 2.00 2.00 2.00 190 180 170 New York ................ 920 920 890 1.75 2.20 1.80 1,610 2,024 1,602 North Carolina ........ 650 810 810 2.30 2.70 2.30 1,495 2,187 1,863 North Dakota .......... 1,200 1,200 1,200 1.30 1.60 1.60 1,560 1,920 1,920 Ohio ........................ 610 620 590 2.05 2.05 2.00 1,251 1,271 1,180 Oklahoma ............... 2,650 3,000 2,800 1.80 1.50 1.90 4,770 4,500 5,320 Oregon .................... 665 580 570 2.00 2.30 2.60 1,330 1,334 1,482 Pennsylvania .......... 990 890 920 2.40 2.10 2.30 2,376 1,869 2,116 Rhode Island .......... 5 5 4 1.90 1.90 1.30 10 10 5 South Carolina 1 ...... 300 270 270 2.60 2.50 2.10 780 675 567 South Dakota .......... 1,400 1,500 1,450 1.35 1.35 1.75 1,890 2,025 2,538 Tennessee .............. 1,650 1,700 1,750 2.25 2.45 2.30 3,713 4,165 4,025 Texas ...................... 4,400 4,600 4,800 2.05 1.65 1.80 9,020 7,590 8,640 Utah ........................ 155 150 170 2.10 2.30 2.50 326 345 425 Vermont .................. 155 150 140 2.00 2.20 1.80 310 330 252 Virginia .................... 1,130 1,100 1,100 2.25 2.20 2.20 2,543 2,420 2,420 Washington ............. 350 410 310 2.70 2.90 3.00 945 1,189 930 West Virginia .......... 550 520 500 1.75 1.70 1.70 963 884 850 Wisconsin ............... 360 540 420 2.20 1.90 1.60 792 1,026 672 Wyoming ................. 520 500 530 1.70 1.60 1.55 884 800 822
United States 2 ........ 35,770 36,231 35,682 2.02 1.96 2.07 72,395 70,966 73,989
(X) Not applicable. 1 Alfalfa and alfalfa mixtures included in all other hay. 2 Beginning in 2018, United States total in-cludes data for Alaska.
NASS, Crops Branch, (202) 720–2127.
Table 6-5.—Hay, all: Stocks on farms, United States, 2010–2019
Crop year Dec. 1 May 1 1
2010 ....................... 101,667 20,931 2011 ....................... 89,723 22,217 2012 ....................... 75,175 21,381 2013 ....................... 89,394 14,156 2014 ....................... 92,172 19,186 2015 ....................... 94,928 24,537 2016 ....................... 95,924 25,155 2017 ....................... 89,422 24,400 2018 ....................... 79,055 15,348 2019 ....................... 84,488 14,906
1 Following year. NASS, Crops Branch, (202) 720–2127.

VI–4 HAY, SEEDS, AND MINOR FIELD CROPS
Table 6-6.—Hay, all: Marketing year average price and value of production, by State and United States, 2017–2019
State Marketing year average price per ton, baled 1 Value of production
2017 2018 2019 2 2017 2018 2019 2
Dollars Dollars Dollars 1,000 dollars 1,000 dollars 1,000 dollars
Alabama .................. 98.00 95.00 86.00 210,700 226,100 150,500 Alaska 3 ................... (NA) 355.00 350.00 (NA) 10,295 10,150 Arizona .................... 172.00 209.00 205.00 445,368 488,622 513,420 Arkansas ................. 100.00 108.00 108.00 257,488 234,816 298,920 California ................. 168.00 191.00 193.00 1,067,060 1,083,312 1,097,417 Colorado .................. 172.00 220.00 232.00 688,824 794,138 934,660 Connecticut ............. 171.00 172.00 167.00 17,568 18,960 13,509 Delaware ................. 153.00 168.00 171.00 7,656 5,650 5,315 Florida ..................... 157.00 153.00 149.00 117,750 132,804 116,667 Georgia ................... 98.00 82.00 84.00 176,204 142,680 129,360 Idaho ....................... 138.00 154.00 157.00 717,832 773,241 799,534 Illinois ...................... 129.00 153.00 159.00 200,243 194,260 178,300 Indiana .................... 157.00 154.00 178.00 237,369 211,026 230,100 Iowa ......................... 111.00 131.00 128.00 367,396 394,170 406,456 Kansas .................... 111.00 153.00 128.00 536,256 635,950 732,893 Kentucky ................. 131.00 159.00 150.00 624,019 770,610 616,200 Louisiana ................. 95.00 102.00 103.00 98,800 85,272 100,425 Maine ...................... 151.00 133.00 164.00 33,395 28,121 38,752 Maryland ................. 150.00 163.00 169.00 76,387 91,092 85,911 Massachusetts ........ 159.00 182.00 166.00 18,696 21,662 19,091 Michigan .................. 145.00 147.00 169.00 296,985 271,980 314,750 Minnesota ................ 103.00 133.00 139.00 398,191 410,294 440,970 Mississippi ............... 90.00 97.00 97.00 131,760 120,183 136,091 Missouri ................... 99.50 121.00 122.00 566,775 631,392 872,477 Montana .................. 141.00 145.00 146.00 665,430 800,860 907,755 Nebraska ................. 91.00 107.00 103.00 526,475 706,705 614,900 Nevada .................... 174.00 174.00 173.00 219,328 202,644 269,359 New Hampshire ...... 153.00 114.00 164.00 10,080 8,103 13,579 New Jersey ............. 127.00 186.00 187.00 31,240 41,032 35,048 New Mexico ............ 178.00 231.00 223.00 201,780 211,832 211,874 New York ................ 148.00 150.00 172.00 446,820 423,976 388,102 North Carolina ......... 117.00 123.00 101.00 177,410 271,897 211,624 North Dakota ........... 99.50 87.00 84.00 315,735 357,969 319,968 Ohio ......................... 138.00 145.00 171.00 339,865 354,888 354,816 Oklahoma ................ 86.00 103.00 109.00 495,308 539,127 644,945 Oregon .................... 170.00 195.00 200.00 560,952 590,414 674,280 Pennsylvania ........... 164.00 182.00 191.00 616,101 502,203 579,498 Rhode Island ........... 143.00 140.00 171.00 1,650 1,684 1,199 South Carolina ........ 141.00 139.00 146.00 109,980 93,825 82,782 South Dakota .......... 108.00 104.00 103.00 487,765 588,941 711,345 Tennessee .............. 116.00 120.00 112.00 438,497 510,353 457,095 Texas ...................... 116.00 143.00 128.00 1,042,668 1,078,326 1,074,816 Utah ......................... 134.00 171.00 182.00 347,356 364,085 461,176 Vermont ................... 137.00 138.00 167.00 48,244 50,412 49,634 Virginia .................... 127.00 139.00 126.00 354,113 347,540 323,185 Washington ............. 172.00 186.00 196.00 515,901 519,277 477,852 West Virginia ........... 120.00 127.00 114.00 120,402 116,446 101,948 Wisconsin ................ 111.00 153.00 189.00 396,066 441,450 524,832 Wyoming ................. 140.00 167.00 175.00 347,152 387,596 427,116
United States 3 ........ 142.00 166.00 165.00 16,109,040 17,288,215 18,160,596
(NA) Not available. 1 Baled hay. 2 Preliminary. 3 Beginning in 2018, United States total includes data for Alaska. NASS, Crops Branch, (202) 720–2127.

VI–5 AGRICULTURAL STATISTICS 2020
Table 6-7.—Hay: Area and production, by type, United States, 2010–2019
Year Area harvested Production
Alfalfa All other hay All hay Alfalfa All other hay All hay
1,000 acres 1,000 acres 1,000 acres 1,000 tons 1,000 tons 1,000 tons 2010 ............... 19,968 39,606 59,574 67,977 77,023 145,000 2011 ............... 19,044 36,160 55,204 64,815 65,065 129,880 2012 ............... 16,795 37,858 54,653 50,600 66,472 117,072 2013 ............... 17,699 40,274 57,973 57,307 77,891 135,198 2014 ............... 18,406 38,747 57,153 61,487 78,632 140,119 2015 ............... 17,810 36,719 54,529 59,060 75,608 134,668 2016 ............... 17,029 36,156 53,185 58,601 75,481 134,082 2017 ............... 17,007 35,770 52,777 55,812 72,395 128,207 2018 ............... 16,608 36,231 52,839 52,634 70,966 123,600 2019 ............... 16,743 35,682 52,425 54,875 73,989 128,864
NASS, Crops Branch, (202) 720–2127.
Table 6-8.—Hay: Supply and disappearance, prices, and number of animal units fed annually, United States, 2009–2018 1
Year beginning
May
Farm carryover
May 1 Production Total supply Disappear-
ance
Roughage- consuming animal units
Supply per animal unit
Disappear-ance per
animal unit
Price received per ton
Million Million Million Million Million tons tons tons tons tons Tons Tons Dollars
2009 2 .... 22.1 146.6 170.0 148.8 70 2.41 2.11 108 2010 ...... 20.9 143.5 166.0 143.7 69 2.39 2.07 114 2011 ...... 22.2 140.3 152.2 130.7 68 2.24 1.92 178 2012 ...... 21.4 126.1 138.7 124.3 68 2.05 1.84 191 2013 ...... 14.2 132.7 149.5 130.0 67 2.24 1.95 176 2014 ...... 19.2 137.0 159.4 134.6 67 2.36 2.00 172 2015 ...... 24.5 134.5 159.3 133.9 69 2.29 1.93 145 2016 ...... 25.1 133.8 160.1 135.5 71 2.26 1.91 129 2017 ...... ................ .................... .................... .................... .................... .................... .................... 142 2018 ...... ................ .................... .................... .................... .................... .................... .................... 164
1 Excludes trade. 2 Beginning in 2009, supply includes imports. ERS, Market and Trade Economics Division, (202) 694-5313.
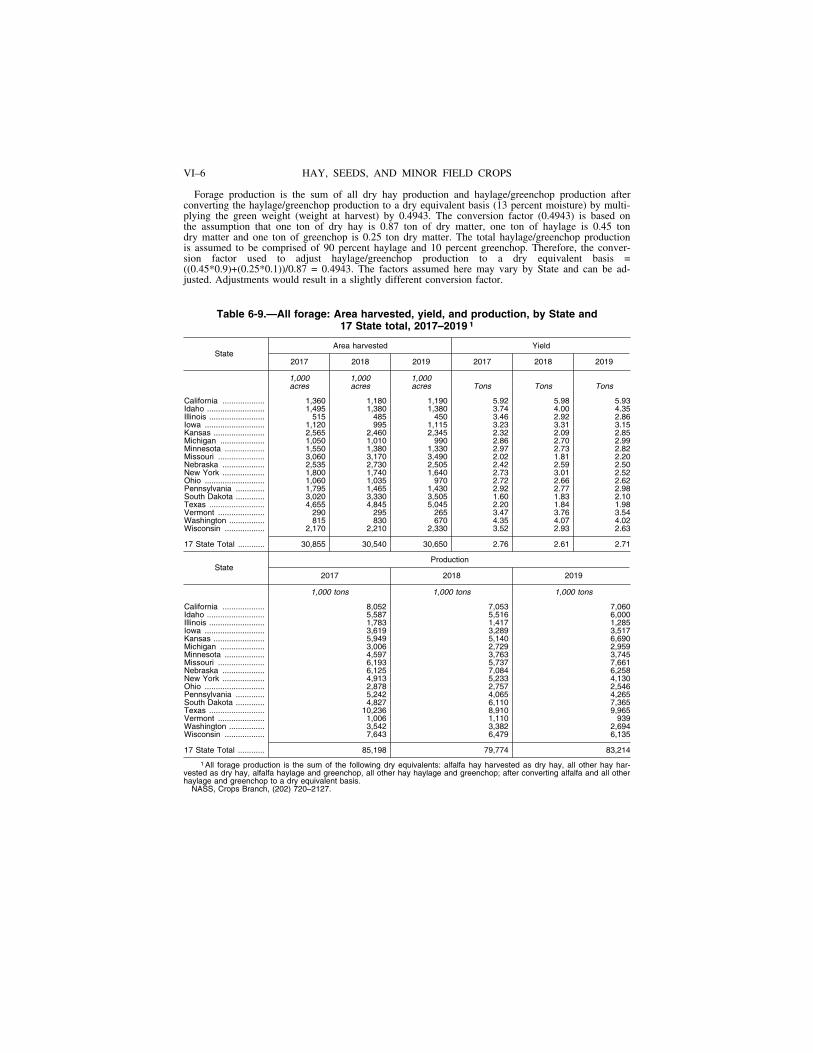
VI–6 HAY, SEEDS, AND MINOR FIELD CROPS
Forage production is the sum of all dry hay production and haylage/greenchop production after converting the haylage/greenchop production to a dry equivalent basis (13 percent moisture) by multi-plying the green weight (weight at harvest) by 0.4943. The conversion factor (0.4943) is based on the assumption that one ton of dry hay is 0.87 ton of dry matter, one ton of haylage is 0.45 ton dry matter and one ton of greenchop is 0.25 ton dry matter. The total haylage/greenchop production is assumed to be comprised of 90 percent haylage and 10 percent greenchop. Therefore, the conver-sion factor used to adjust haylage/greenchop production to a dry equivalent basis = ((0.45*0.9)+(0.25*0.1))/0.87 = 0.4943. The factors assumed here may vary by State and can be ad-justed. Adjustments would result in a slightly different conversion factor.
Table 6-9.—All forage: Area harvested, yield, and production, by State and 17 State total, 2017–2019 1
State Area harvested Yield
2017 2018 2019 2017 2018 2019
1,000 1,000 1,000 acres acres acres Tons Tons Tons
California ................... 1,360 1,180 1,190 5.92 5.98 5.93 Idaho .......................... 1,495 1,380 1,380 3.74 4.00 4.35 Illinois ......................... 515 485 450 3.46 2.92 2.86 Iowa ........................... 1,120 995 1,115 3.23 3.31 3.15 Kansas ....................... 2,565 2,460 2,345 2.32 2.09 2.85 Michigan .................... 1,050 1,010 990 2.86 2.70 2.99 Minnesota .................. 1,550 1,380 1,330 2.97 2.73 2.82 Missouri ..................... 3,060 3,170 3,490 2.02 1.81 2.20 Nebraska ................... 2,535 2,730 2,505 2.42 2.59 2.50 New York ................... 1,800 1,740 1,640 2.73 3.01 2.52 Ohio ........................... 1,060 1,035 970 2.72 2.66 2.62 Pennsylvania ............. 1,795 1,465 1,430 2.92 2.77 2.98 South Dakota ............. 3,020 3,330 3,505 1.60 1.83 2.10 Texas ......................... 4,655 4,845 5,045 2.20 1.84 1.98 Vermont ..................... 290 295 265 3.47 3.76 3.54 Washington ................ 815 830 670 4.35 4.07 4.02 Wisconsin .................. 2,170 2,210 2,330 3.52 2.93 2.63
17 State Total ............ 30,855 30,540 30,650 2.76 2.61 2.71
State Production
2017 2018 2019
1,000 tons 1,000 tons 1,000 tons
California ................... 8,052 7,053 7,060 Idaho .......................... 5,587 5,516 6,000 Illinois ......................... 1,783 1,417 1,285 Iowa ........................... 3,619 3,289 3,517 Kansas ....................... 5,949 5,140 6,690 Michigan .................... 3,006 2,729 2,959 Minnesota .................. 4,597 3,763 3,745 Missouri ..................... 6,193 5,737 7,661 Nebraska ................... 6,125 7,084 6,258 New York ................... 4,913 5,233 4,130 Ohio ........................... 2,878 2,757 2,546 Pennsylvania ............. 5,242 4,065 4,265 South Dakota ............. 4,827 6,110 7,365 Texas ......................... 10,236 8,910 9,965 Vermont ..................... 1,006 1,110 939 Washington ................ 3,542 3,382 2,694 Wisconsin .................. 7,643 6,479 6,135
17 State Total ............ 85,198 79,774 83,214
1 All forage production is the sum of the following dry equivalents: alfalfa hay harvested as dry hay, all other hay har-vested as dry hay, alfalfa haylage and greenchop, all other hay haylage and greenchop; after converting alfalfa and all other haylage and greenchop to a dry equivalent basis.
NASS, Crops Branch, (202) 720–2127.

VI–7 AGRICULTURAL STATISTICS 2020
Table 6-10.—All alfalfa forage: Area harvested, yield, and production, by State and 17 State total, 2017–2019 1
State Area harvested Yield
2017 2018 2019 2017 2018 2019
1,000 1,000 1,000 acres acres acres Tons Tons Tons
California ................... 740 670 610 6.71 6.75 7.06 Idaho .......................... 1,090 1,080 1,060 4.18 4.43 4.86 Illinois ......................... 245 260 220 4.45 3.47 3.68 Iowa ........................... 770 655 765 3.67 3.84 3.52 Kansas ....................... 585 620 645 3.72 3.54 4.05 Michigan .................... 780 780 750 3.23 2.94 3.20 Minnesota .................. 1,040 850 930 3.52 3.13 3.20 Missouri ..................... 310 290 290 2.51 2.68 2.69 Nebraska ................... 870 870 990 3.98 4.26 3.75 New York ................... 700 650 530 3.73 3.95 3.47 Ohio ........................... 410 390 370 3.60 3.66 3.44 Pennsylvania ............. 645 465 380 3.59 3.65 4.37 South Dakota ............. 1,580 1,800 2,000 1.78 2.21 2.34 Texas ......................... 125 145 125 4.47 5.52 4.90 Vermont ..................... 50 45 35 4.24 4.27 4.94 Washington ................ 425 355 350 5.32 4.72 4.63 Wisconsin .................. 1,700 1,590 1,680 3.83 3.29 3.00
17 State Total ............ 12,065 11,515 11,730 3.71 3.64 3.61
State Production
2017 2018 2019
1,000 tons 1,000 tons 1,000 tons
California ................... 4,968 4,523 4,308 Idaho .......................... 4,561 4,788 5,155 Illinois ......................... 1,090 902 810 Iowa ........................... 2,828 2,514 2,690 Kansas ....................... 2,176 2,194 2,613 Michigan .................... 2,523 2,290 2,403 Minnesota .................. 3,665 2,657 2,975 Missouri ..................... 779 778 781 Nebraska ................... 3,463 3,704 3,711 New York ................... 2,611 2,566 1,840 Ohio ........................... 1,476 1,428 1,273 Pennsylvania ............. 2,316 1,698 1,661 South Dakota ............. 2,807 3,985 4,682 Texas ......................... 559 801 613 Vermont ..................... 212 192 173 Washington ................ 2,263 1,676 1,619 Wisconsin .................. 6,519 5,239 5,036
17 State Total ............ 44,816 41,935 42,343
1 All alfalfa forage production is the sum of alfalfa harvested as dry hay; and alfalfa haylage and greenchop production after converting it to a dry equivalent basis.
NASS, Crops Branch, (202) 720–2127.

VI–8 HAY, SEEDS, AND MINOR FIELD CROPS
Table 6-11.—All haylage and greenchop: Area harvested, yield, and production, by State and 17 State total, 2017–2019 1
State Area harvested Yield
2017 2018 2019 2017 2018 2019
1,000 1,000 1,000 acres acres acres Tons Tons Tons
California ................... 265 250 210 12.70 11.10 12.19 Idaho .......................... 100 105 155 9.30 9.57 11.60 Illinois ......................... 53 38 49 7.23 5.74 5.96 Iowa ........................... 100 80 140 7.12 7.36 5.80 Kansas ....................... 135 120 85 7.15 6.42 8.92 Michigan .................... 275 285 290 7.48 6.51 7.68 Minnesota .................. 250 220 265 6.48 6.31 5.95 Missouri ..................... 90 155 190 4.68 4.29 3.13 Nebraska ................... 50 40 75 6.88 5.05 4.67 New York ................... 660 710 610 6.94 7.09 6.27 Ohio ........................... 205 135 125 5.00 6.00 6.62 Pennsylvania ............. 475 410 390 6.53 6.54 6.64 South Dakota ............. 105 120 190 4.32 5.44 3.85 Texas ......................... 199 145 190 7.00 7.48 7.97 Vermont ..................... 180 185 165 7.22 8.14 7.85 Washington ................ 125 119 85 9.20 10.50 5.85 Wisconsin .................. 1,190 1,120 1,290 7.01 6.37 5.26 17 State Total ............ 4,457 4,237 4,504 7.21 6.99 6.44
State Production
2017 2018 2019
T31,000 tons
California ................... 3,365 2,774 2,559 Idaho .......................... 930 1,005 1,798 Illinois ......................... 383 218 292 Iowa ........................... 712 589 812 Kansas ....................... 965 770 758 Michigan .................... 2,057 1,856 2,227 Minnesota .................. 1,620 1,388 1,576 Missouri ..................... 421 665 595 Nebraska ................... 344 202 350 New York ................... 4,578 5,035 3,824 Ohio ........................... 1,026 810 828 Pennsylvania ............. 3,101 2,683 2,588 South Dakota ............. 454 653 731 Texas ......................... 1,393 1,085 1,515 Vermont ..................... 1,300 1,505 1,296 Washington ................ 1,150 1,249 497 Wisconsin .................. 8,337 7,132 6,780
17 State Total ............ 32,136 29,619 29,026
1 Includes all types of forage harvested as haylage or greenchop (green weight). Forage harvested as dry hay and corn and sorghum silage/greenchop are not included.
NASS, Crops Branch, (202) 720–2127.

VI–9 AGRICULTURAL STATISTICS 2020
Table 6-12.—Alfalfa haylage and greenchop: Area harvested, yield, and production, by State and 17 State total, 2017–2019
State Area harvested Yield
2017 2018 2019 2017 2018 2019
1,000 1,000 1,000 acres acres acres Tons Tons Tons
California ................... 70 80 60 6.00 6.20 6.40 Idaho .......................... 65 85 115 10.00 9.00 12.50 Illinois ......................... 33 24 30 9.00 6.50 7.40 Iowa ........................... 80 55 95 7.80 8.10 6.60 Kansas ....................... 25 20 25 10.00 6.00 7.50 Michigan .................... 240 260 260 7.90 6.80 8.00 Minnesota .................. 220 180 225 6.90 6.80 6.40 Missouri ..................... 20 35 40 6.00 7.50 4.00 Nebraska ................... 20 25 50 6.70 4.00 4.10 New York ................... 410 450 320 7.75 8.30 7.60 Ohio ........................... 120 90 90 6.00 7.70 7.10 Pennsylvania ............. 265 250 200 7.50 6.70 8.00 South Dakota ............. 50 75 125 3.80 6.00 3.50 Texas ......................... 9 5 10 7.00 7.00 7.50 Vermont ..................... 40 45 35 8.00 7.00 7.30 Washington ................ 50 24 40 9.50 8.50 5.10 Wisconsin .................. 1,050 1,000 1,020 7.30 6.70 5.80
17 State Total ............ 2,767 2,703 2,740 7.41 7.08 6.68
State Production
2017 2018 2019
1,000 tons 1,000 tons 1,000 tons
California ................... 420 496 384 Idaho .......................... 650 765 1,438 Illinois ......................... 297 156 222 Iowa ........................... 624 446 627 Kansas ....................... 250 120 188 Michigan .................... 1,896 1,768 2,080 Minnesota .................. 1,518 1,224 1,440 Missouri ..................... 120 263 160 Nebraska ................... 134 100 205 New York ................... 3,178 3,735 2,432 Ohio ........................... 720 693 639 Pennsylvania ............. 1,988 1,675 1,600 South Dakota ............. 190 450 438 Texas ......................... 63 35 75 Vermont ..................... 320 315 256 Washington ................ 475 204 204 Wisconsin .................. 7,665 6,700 5,916
17 State Total ............ 20,508 19,145 18,304
NASS, Crops Branch, (202) 720–2127.

VI–10 HAY, SEEDS, AND MINOR FIELD CROPS
Table 6-13.—Beans, dry edible (clean basis): Production, by classes, United States, 2017–2019 1
Class 2017 2018 2019
1,000 cwt 1,000 cwt 1,000 cwt
Navy (pea beans) ...................................... 4,161 4,191 3,029 Great northern ........................................... 1,403 1,188 1,040 Small white ................................................ 171 155 105 Pinto ........................................................... 13,617 8,778 6,769 Red kidney, light ........................................ 899 897 915 Red kidney, dark ........................................ 1,099 1,625 1,489 Pink ............................................................ 332 398 291 Small red .................................................... 438 701 567 Cranberry ................................................... 185 244 161 Black .......................................................... 5,120 5,212 5,069 Large lima .................................................. 255 234 197 Baby lima ................................................... 204 275 278 Blackeye .................................................... 437 528 259 Small chickpeas (Garbanzo) ..................... 1,969 3,346 1,423 Large chickpeas (Garbanzo) ..................... 5,088 9,441 4,814 Chickpeas, all (Garbanzo) ......................... 7,057 12,787 6,237 Other 2 ........................................................ 583 532 642
Total ........................................................... 35,961 37,745 20,811
1 Excludes beans grown for garden seed. 2 Data are included in ″Other″ class to avoid disclosing data for individual op-erations.
NASS, Crops Branch, (202) 720–2127.
Table 6-14.—Beans, dry edible: Area, yield, and production, by State and United States, 2017–2019 1
State Area planted Area harvested
2017 2018 2019 2017 2018 2019
1,000 1,000 1,000 1,000 1,000 1,000 acres acres acres acres acres acres
California ................ 50.0 48.0 27.4 49.7 47.7 27.4 Colorado ................ 58.0 42.0 37.0 54.5 30.5 33.8 Idaho ...................... 180.0 185.0 47.0 178.0 183.0 45.0 Michigan ................ 220.0 195.0 185.0 218.5 193.0 180.0 Minnesota .............. 170.0 185.0 210.0 163.0 178.0 201.0 Montana 2 ............... 275.0 395.0 (NA) 265.0 386.0 (NA) Nebraska ............... 180.0 140.2 120.0 155.0 131.2 97.0 North Dakota ......... 705.0 635.0 615.0 685.0 615.0 550.0 Texas 2 ................... 22.0 20.3 (NA) 20.0 18.3 (NA) Washington ............ 196.0 218.0 25.0 195.0 217.0 25.0 Wyoming ................ 41.0 31.0 21.0 39.0 28.5 17.3
United States ......... 2,097.0 2,094.5 1,287.4 2,022.7 2,028.2 1,176.5
State Yield per acre (clean basis) Production (clean basis)
2017 2018 2019 2017 2018 2019
Pounds Pounds Pounds 1,000 cwt 1,000 cwt 1,000 cwt
California ................ 2,100 2,490 2,660 1,045 1,190 729 Colorado ................ 2,000 2,120 1,840 1,092 647 623 Idaho ...................... 1,610 1,710 2,370 2,873 3,127 1,067 Michigan ................ 2,010 2,400 2,030 4,394 4,635 3,662 Minnesota .............. 2,190 2,360 2,040 3,567 4,200 4,101 Montana 2 ............... 1,000 1,350 (NA) 2,643 5,214 (NA) Nebraska ............... 2,520 2,480 1,940 3,901 3,254 1,883 North Dakota ......... 1,810 1,760 1,400 12,392 10,806 7,691 Texas 2 ................... 1,100 1,150 (NA) 220 210 (NA) Washington ............ 1,490 1,780 2,660 2,901 3,857 665 Wyoming ................ 2,390 2,120 2,250 933 605 390
United States ......... 1,778 1,861 1,769 35,961 37,745 20,811
(NA) Not available. 1 Excludes beans grown for garden seed. Beginning 2019, chickpeas are excluded. 2 Estimates dis-continued in 2019.
NASS, Crops Branch, (202) 720–2127.

VI–11 AGRICULTURAL STATISTICS 2020
Table 6-15.—Beans, dry edible: Area, yield, production, price, and value, United States, 2010–2019 1
Year Area planted Area harvested Yield per acre 2 Production 2
Marketing year average price
per 100 pounds received by
farmers
Value of
production
1,000 acres 1,000 acres Pounds 1,000 cwt. Dollars 1,000 dollars
2010 ........... 1,911.4 1,842.7 1,726 31,801 28.00 899,258 2011 ........... 1,217.9 1,167.9 1,703 19,890 42.10 851,131 2012 ........... 1,742.5 1,690.4 1,889 31,925 38.00 1,235,255 2013 ........... 1,361.8 1,315.0 1,868 24,567 39.10 982,385 2014 ........... 1,703.1 1,648.6 1,754 28,910 32.30 980,622 2015 ........... 1,766.7 1,708.4 1,759 30,057 27.30 866,222 2016 ........... 1,664.0 1,558.1 1,842 28,703 29.20 863,431 2017 ........... 2,097.0 2,022.7 1,778 35,961 26.70 1,006,353 2018 ........... 2,094.5 2,028.2 1,861 37,745 25.40 951,047 2019 ........... 1,287.4 1,176.5 1,769 20,811 29.10 608,870
1 Excludes beans grown for garden seed. 2 Clean basis. NASS, Crops Branch, (202) 720–2127.
Table 6-16.—Beans, dry edible ( (clean basis): Marketing year average price and value of production, by State and United States, 2017–2019
States Marketing year average price per cwt. Value of production
2017 2018 2019 1 2017 2018 2019 1
Dollars Dollars Dollars 1,000 dollars 1,000 dollars 1,000 dollars
California .................... 61.20 69.20 53.30 63,954 82,348 38,856 Colorado .................... 28.90 31.20 33.20 31,559 20,186 20,684 Idaho .......................... 27.80 23.50 22.40 79,869 73,485 23,901 Michigan .................... 29.30 27.60 29.80 128,744 127,926 109,128 Minnesota .................. 27.40 26.70 31.90 97,736 112,140 130,822 Montana 2 ................... 33.80 19.30 (NA) 89,333 100,630 (NA) Nebraska ................... 25.50 (D) 28.50 99,476 (D) 53,666 North Dakota ............. 24.10 22.90 25.70 298,647 247,457 197,659 Texas 2 ....................... 34.60 (D) (NA) 7,612 (D) (NA) Washington ................ 29.10 22.70 35.70 84,419 87,554 23,741 Wyoming .................... 26.80 25.90 26.70 25,004 15,670 10,413
United States ............. 26.70 25.40 29.10 1,006,353 951,047 608,870
(D) Withheld to avoid disclosing data for individual operations. (NA) Not available.1 Preliminary. 2 Estimates discontinued in 2019.
NASS, Crops Branch, (202) 720–2127.

VI–12 HAY, SEEDS, AND MINOR FIELD CROPS
Table 6-17.—Beans, dry edible: Season average price 1 per 100 pounds, 2009–2018
Year beginning September
Lima Garbanzo Blackeye Pinto Great northern Small red Pea bean
(Navy) Black Red kidney
Dollars
2009 .......... 43.98 39.18 45.12 39.45 41.57 43.32 40.37 41.57 43.56 2010 .......... 40.13 49.69 42.47 36.08 41.81 47.74 41.94 41.81 48.25 2011 .......... 57.88 58.42 69.57 62.72 54.75 61.25 58.61 54.75 69.30 2012 .......... 48.14 52.32 54.75 45.54 53.96 53.36 45.57 53.96 63.32 2013 .......... 53.45 40.63 55.19 45.76 (NA) 52.17 55.25 (NA) 68.88 2014 .......... 56.50 38.54 70.00 32.41 48.46 55.10 38.85 48.46 64.84 2015 .......... 58.75 45.20 70.00 33.14 32.47 39.80 32.19 32.47 38.37 2016 .......... 50.49 47.98 56.86 38.34 40.53 38.00 38.72 40.53 45.04 2017 .......... 58.08 63.67 65.62 31.05 33.79 37.25 34.40 33.79 44.67 2018 .......... 58.61 28.50 64.16 28.86 36.47 38.38 33.43 36.47 49.00
(NA) Not available. 1 Free-on-board (f.o.b.) dealer prices as reported by USDA, Bean Market News. ERS, Specialty Crops Branch, (202) 694–5253. Compiled from the Bean Market Summary, Agricultural Marketing Service,
U.S. Department of Agriculture, Greeley, Colorado.
Table 6-18.—Beans, dry edible: United States exports to specified countries, 2017–2019 1
Country 2017 2018 2019
Metric tons
Mexico ........................................................ 102,791 98,855 82,014 Canada ...................................................... 72,101 45,486 49,512 Italy(*) ......................................................... 47,082 38,754 46,174 Dominican Republic ................................... 19,636 22,968 26,592 United Kingdom ......................................... 38,048 28,241 25,371 Saudi Arabia .............................................. 0 0 19,117 Haiti ............................................................ 10,712 7,888 14,138 Yemen(*) .................................................... 0 0 10,797 Japan ......................................................... 6,994 7,637 8,003 Colombia .................................................... 6,348 9,759 7,895 Belgium-Luxembourg(*) ............................. 5,262 3,690 6,041 Turkey ........................................................ 1,162 1,006 6,022 Australia(*) ................................................. 6,382 4,846 5,620 Panama ...................................................... 5,762 5,926 4,944 Spain .......................................................... 4,132 5,034 4,698 Costa Rica ................................................. 7,630 2,476 4,218 El Salvador ................................................ 3,043 3,850 4,077 Germany(*) ................................................ 2,701 4,009 3,900 Jamaica ...................................................... 2,694 3,184 3,242 France(*) .................................................... 5,834 4,394 3,165 Guatemala ................................................. 4,114 5,615 2,994 Korea, South .............................................. 5,877 3,901 2,524 New Zealand(*) .......................................... 838 431 2,032 United Arab Emirates ................................ 1,308 1,965 2,024 Peru ........................................................... 2,650 3,500 1,669 Brazil .......................................................... 2,978 12 1,571 Netherlands ................................................ 4,650 3,195 1,448 Tanzania .................................................... 0 1,157 1,060 Niger .......................................................... 0 0 1,052 French West Indies(*) ................................ 949 1,152 1,047 Rest of World ............................................. 29,233 20,722 16,144
World Total ................................................ 400,908 339,655 369,103
(*) Denotes a country that is a summarization of its component countries. 1 Excluding seed bean exports. FAS, Office of Global Analysis, (202) 720-6301. Data Source: U.S. Census Bureau Trade Data.

VI–13 AGRICULTURAL STATISTICS 2020
Table 6-19.—Chickpeas & lentils, dried: United States exports by class and quantity, 2017–2019 1
Country 2017 2018 2019
Metric tons
Dried chickpeas: Pakistan .............................................. 18,780 14,744 41,075 Canada ............................................... 29,348 15,163 34,498 Spain ................................................... 20,631 19,709 21,915 Portugal .............................................. 2,835 3,206 13,760 India .................................................... 17,130 4,323 6,923 Italy(*) ................................................. 5,863 1,663 5,938 United Arab Emirates ......................... 7,600 1,041 2,891 Colombia ............................................. 1,816 263 2,684 Peru .................................................... 3,317 1,841 1,562 Jordan ................................................. 1,446 1,180 1,549 New Zealand(*) ................................... 667 760 1,538 Sri Lanka ............................................ 2,757 1,122 1,473 Lebanon .............................................. 3,197 1,515 1,402 Israel(*) ............................................... 620 545 1,197 Turkey ................................................. 12,348 1,271 1,094 Algeria ................................................. 6,302 1,688 724 Dominican Republic ............................ 150 432 685 Korea, South ....................................... 766 526 649 Taiwan ................................................ 419 554 486 Japan .................................................. 530 652 397 Costa Rica .......................................... 86 185 305 Netherlands ........................................ 392 162 247 Philippines .......................................... 341 500 232 Malaysia .............................................. 363 111 207 China .................................................. 527 474 173 Indonesia ............................................ 23 45 162 Trinidad and Tobago .......................... 429 163 139 Panama .............................................. 259 17 133 Hong Kong .......................................... 153 159 111 Cyprus ................................................ 60 48 92 Rest of World ...................................... 9,793 3,628 873
World Total ......................................... 148,947 77,689 145,111
Dried lentils: Canada ............................................... 55,795 16,301 77,166 India .................................................... 22,885 8,272 56,679 Spain ................................................... 33,869 22,216 31,571 Mexico ................................................ 23,171 11,698 20,222 Sudan(*) .............................................. 5,988 21,747 16,700 Peru .................................................... 18,431 9,650 11,486 China .................................................. 1,580 6,280 9,661 Colombia ............................................. 31,974 8,967 9,381 Italy(*) ................................................. 5,913 2,862 4,261 Greece ................................................ 3,106 2,427 2,198 Belgium-Luxembourg(*) ...................... 3,108 1,244 1,975 United Arab Emirates ......................... 4,884 414 1,044 Pakistan .............................................. 4,152 1,215 966 Dominican Republic ............................ 992 918 924 Sierra Leone ....................................... 220 0 709 Thailand .............................................. 1,081 1,035 668 Netherlands ........................................ 1,591 515 667 Ecuador .............................................. 1,623 328 566 Leeward-Windward Islands(*) ............. 634 495 543 Portugal .............................................. 230 0 539 French Ind. Ocean Territory(*) ........... 160 83 508 Germany(*) ......................................... 2,255 837 495 French Pacific Islands(*) ..................... 545 524 493 France(*) ............................................. 769 243 482 Algeria ................................................. 1,635 240 476 Burkina Faso ...................................... 400 0 450 Chile .................................................... 359 0 403 Turkey ................................................. 5,166 838 375 Korea, South ....................................... 147 490 314 Laos .................................................... 170 240 240 Rest of World ...................................... 13,219 5,942 2,485
World Total ......................................... 246,048 126,021 254,642
(*) Denotes a country that is a summarization of its component countries. 1 Excluding seed pea exports. FAS, Office of Global Analysis, (202) 720-6301. Data Source: U.S. Census Bureau Trade Data.

VI–14 HAY, SEEDS, AND MINOR FIELD CROPS
Table 6-20.—Peas, dry: United States exports to specified countries, 2017–2019 1
Country 2017 2018 2019
Metric tons
Canada ........................................... 16,909 15,422 63,368 Ethiopia(*) ...................................... 36,511 26,012 22,873 Philippines ...................................... 16,535 16,791 19,686 Peru ................................................ 16,587 17,675 16,467 China .............................................. 58,550 13,550 13,912 India ............................................... 45,857 15,421 13,717 Djibouti ........................................... 22,230 12,523 13,625 Kenya ............................................. 14,591 11,718 10,964 Cameroon ...................................... 5,594 4,360 10,299 South Africa ................................... 12,950 7,295 9,383 Mexico ............................................ 9,155 10,710 7,950 Somalia .......................................... 5,075 6,364 7,762 Tanzania ........................................ 10,233 26,150 6,498 United Arab Emirates ..................... 901 258 4,839 Saudi Arabia .................................. 47 2,657 4,750 Colombia ........................................ 2,630 897 3,906 Congo (Kinshasa) .......................... 0 160 3,365 Belgium-Luxembourg(*) ................. 473 485 3,308 Pakistan ......................................... 1,894 1,340 2,964 Togo ............................................... 1,492 1,994 2,584 Taiwan ............................................ 2,908 2,861 2,338 Turkey ............................................ 3,066 411 1,829 Korea, South .................................. 220 284 1,237 Chile ............................................... 547 577 1,228 Madagascar ................................... 1,472 0 1,132 Thailand ......................................... 904 701 1,105 Vietnam .......................................... 625 935 1,067 Nepal .............................................. 0 0 1,009 Haiti ................................................ 780 311 772 Sudan(*) ......................................... 6,493 2,156 646 Rest of World ................................. 48,244 36,628 6,984
World Total ..................................... 343,472 236,647 261,567
(*) Denotes a country that is a summarization of its component countries. 1 Excluding seed pea exports. FAS, Office of Global Analysis, (202) 720-6301. Data Source: U.S. Census Bureau Trade Data.
Table 6-21.—Hops: Area, yield, production, price, value, and Sept. 1 stocks, United States, 2010–2019
Year Area harvested
Yield per acre Production
Marketing year average price
per pound received by
farmers
Value of production
Stocks Sept. 1
Stocks Mar. 1
1,000 acres Pounds 1,000 pounds Dollars per pound
1,000 dollars 1,000 pounds 1,000 pounds
2010 ......... 31.3 2,093 65,493 3.28 214,589 83,000 102,000 2011 ......... 29.8 2,175 64,782 3.14 203,378 87,000 121,000 2012 ......... 29.7 1,985 58,911 3.17 186,876 96,000 120,000 2013 ......... 35.3 1,962 69,246 3.35 232,308 (NA) 115,000 2014 ......... 38.0 1,868 70,996 3.67 260,627 90,000 121,000 2015 ......... 43.6 1,807 78,846 4.38 345,388 83,000 119,000 2016 ......... 50.9 1,713 87,140 5.72 498,420 85,000 128,000 2017 ......... 54.0 1,956 105,622 5.60 591,375 98,000 140,000 2018 ......... 55.0 1,943 106,907 5.46 583,444 113,000 169,000 2019 ......... 56.5 1,981 112,041 5.68 636,580 ...................... ......................
(NA) Not available. NASS, Crops Branch, (202) 720–2127.

VI–15 AGRICULTURAL STATISTICS 2020
Table 6-22.—Hops: Area, yield, and production, by State and United States, 2017–2019
State Area harvested Yield per acre Production
2017 2018 2019 2017 2018 2019 2017 2018 2019
1,000 1,000 1,000 1,000 1,000 1,000 acres acres acres Pounds Pounds Pounds pounds pounds pounds
Idaho ............... 7,125 8,140 8,358 1,974 1,995 2,034 14,067.3 16,242.8 17,003.1 Oregon ............ 8,216 7,725 7,306 1,518 1,675 1,783 12,470.4 12,936.2 13,023.2 Washington ..... 38,648 39,170 40,880 2,046 1,984 2,006 79,083.8 77,727.7 82,014.9
United States ... 53,989 55,035 56,544 1,956 1,943 1,981 105,621.5 106,906.7 112,041.2
NASS, Crops Branch, (202) 720–2127.
Table 6-23.—Hops: Marketing year average price and value of production, by State and United States, 2017–2019
State Marketing year average price per pound Value of production
2017 2018 2019 1 2017 2018 2019 1
Dollars Dollars Dollars 1,000 dollars 1,000 dollars 1,000 dollars
Idaho ................ 5.00 5.30 5.25 70,337 86,087 89,266 Oregon ............. 5.00 5.40 5.50 62,352 69,855 71,628 Washington ...... 5.80 5.50 5.80 458,686 427,502 475,686
United States ... 5.60 5.46 5.68 591,375 583,444 636,580
1 Preliminary. NASS, Crops Branch, (202) 720–2127.
Table 6-24.—Hops, including extract: United States exports by country of destination, 2017–2019
Country 2017 2018 2019
Metric tons
Belgium-Luxembourg(*) ................. 1,698 2,563 2,528 Canada ........................................... 1,386 1,752 2,430 United Kingdom ............................. 3,392 2,092 2,224 Germany(*) ..................................... 1,284 1,754 1,895 Brazil .............................................. 1,001 1,489 1,765 Australia(*) ..................................... 595 869 836 Mexico ............................................ 822 923 726 China .............................................. 764 1,472 600 Argentina ........................................ 542 593 526 Colombia ........................................ 678 593 450 Japan ............................................. 609 469 432 Vietnam .......................................... 135 270 322 Korea, South .................................. 385 254 227 Peru ................................................ 293 251 225 New Zealand(*) .............................. 88 99 194 Chile ............................................... 44 155 171 Philippines ...................................... 97 190 156 Ecuador .......................................... 64 97 111 India ............................................... 64 124 106 Hong Kong ..................................... 125 125 106 South Africa ................................... 107 113 104 Russia ............................................ 188 98 99 Dominican Republic ....................... 115 96 98 Netherlands .................................... 39 14 94 Ireland ............................................ 64 23 84 Panama .......................................... 55 69 61 Guatemala ...................................... 45 48 51 Cambodia ....................................... 28 23 49 Sweden .......................................... 5 5 38 Thailand ......................................... 22 11 36 Rest of World ................................. 480 493 437
World Total ..................................... 15,215 17,125 17,182
(*) Denotes a country that is a summarization of its component countries. FAS, Office of Global Analysis, (202) 720-6301. Data Source: U.S. Census Bureau Trade Data

VII–1
CHAPTER VII
STATISTICS OF CATTLE, HOGS, AND SHEEP
This chapter contains information about most kinds of farm livestock and livestock products, with the exception of dairy and poultry. The information relates to inventories, production, disposition, prices, and income for farm animals, and to livestock slaughter, meat production, and market statistics for meat animals.
Table 7-1.—All cattle and calves: Inventory, and value, United States, Jan. 1, 2010-2019
Year Inventory Value
Per head Total
Thousands Dollars 1,000 dollars
2010 ............................. 94,081 833 78,335,410 2011 ............................. 92,887 947 87,988,337 2012 ............................. 91,160 1,111 101,252,540 2013 ............................. 90,095 1,139 101,731,742 2014 ............................. 88,243 1,223 107,921,189 2015 ............................. 89,173 1,584 141,250,032 2016 ............................. 91,888 1,410 129,562,080 2017 ............................. 93,625 1,109 103,829,681 2018 ............................. 94,298 1,146 108,065,508 2019 ............................. 94,805 1,031 97,746,846
NASS, Livestock Branch, (202) 720–3570.
Table 7-2.—All cattle and calves: Number by class, United States, Jan. 1, 2010–2019
Year All cattle
and calves 1
Cows and heifers that have calved
500 pounds and over
Calves under 500
pounds Beef cows Milk cows
Heifers
Steers Bulls Beef cow replace-ments
Milk cow replace-ments
Other
Thou- Thou- Thou- Thou- Thou- Thou- Thou- Thou- Thou- sands sands sands sands sands sands sands sands sands
2010 ............ 94,081 31,440 9,087 5,443 4,551 9,784 16,568 2,190 15,019 2011 ............ 92,887 30,913 9,156 5,135 4,577 9,938 16,394 2,165 14,610 2012 ............ 91,160 30,282 9,236 5,281 4,618 9,546 15,957 2,100 14,141 2013 ............ 90,095 29,631 9,221 5,429 4,546 9,281 15,931 2,074 13,983 2014 ............ 88,243 28,956 9,208 5,556 4,539 8,824 15,623 2,038 13,498 2015 ............ 89,173 29,332 9,312 6,086 4,710 8,469 15,630 2,109 13,523 2016 ............ 91,888 30,164 9,312 6,335 4,814 8,753 16,305 2,137 14,067 2017 ............ 93,625 31,171 9,369 6,363 4,754 8,995 16,374 2,244 14,356 2018 ............ 94,298 31,466 9,432 6,108 4,768 9,341 16,528 2,252 14,401 2019 ............ 94,805 31,691 9,353 5,885 4,702 9,624 16,758 2,253 14,540
1Totals may not add due to rounding. NASS, Livestock Branch, (202) 720–3570.

VII–2 STATISTICS OF CATTLE, HOGS, AND SHEEP
Table 7-3.—All cattle and calves: Inventory and value, by State and United States, Jan. 1, 2018–2019
State
Inventory Value
2018 2019 Value per head Total value
2018 2019 2018 2019
Thousands Thousands Dollars Dollars 1,000 dollars 1,000 dollars
Alabama ................. 1,340.0 1,300.0 930 840 1,246,200 1,092,000 Alaska .................... 15.0 16.0 1,280 1,280 19,200 20,480 Arizona ................... 1,020.0 1,020.0 1,100 940 1,122,000 958,800 Arkansas ................ 1,760.0 1,780.0 1,010 890 1,777,600 1,584,200 California ................ 5,200.0 5,150.0 1,230 980 6,396,000 5,047,000 Colorado ................ 2,850.0 2,850.0 1,230 1,100 3,505,500 3,163,500 Connecticut ............ 50.0 47.0 1,210 1,070 60,500 50,290 Delaware ................ 17.0 15.0 1,080 980 18,360 14,700 Florida .................... 1,630.0 1,680.0 1,100 1,000 1,793,000 1,680,000 Georgia .................. 1,060.0 1,070.0 950 950 1,007,000 1,016,500 Hawaii .................... 144.0 142.0 750 700 108,000 99,400 Idaho ...................... 2,420.0 2,500.0 1,250 1,050 3,025,000 2,625,000 Illinois ..................... 1,150.0 1,190.0 1,220 1,020 1,403,000 1,213,800 Indiana ................... 860.0 880.0 1,070 920 920,200 809,600 Iowa ....................... 4,000.0 3,950.0 1,200 1,130 4,800,000 4,463,500 Kansas ................... 6,300.0 6,400.0 1,110 1,070 6,993,000 6,848,000 Kentucky ................ 2,160.0 2,130.0 960 850 2,073,600 1,810,500 Louisiana ............... 820.0 800.0 1,090 950 893,800 760,000 Maine ..................... 81.0 78.0 1,190 980 96,390 76,440 Maryland ................ 193.0 197.0 1,070 930 206,510 183,210 Massachusetts ....... 38.0 37.0 1,130 920 42,940 34,040 Michigan ................ 1,160.0 1,160.0 1,140 950 1,322,400 1,102,000 Minnesota .............. 2,350.0 2,320.0 1,080 940 2,538,000 2,180,800 Mississippi ............. 930.0 900.0 950 860 883,500 774,000 Missouri ................. 4,350.0 4,250.0 1,060 970 4,611,000 4,122,500 Montana ................. 2,550.0 2,500.0 1,350 1,310 3,442,500 3,275,000 Nebraska ............... 6,800.0 6,800.0 1,260 1,210 8,568,000 8,228,000 Nevada .................. 465.0 470.0 1,270 1,180 590,550 554,600 New Hampshire ..... 36.0 33.0 1,160 980 41,760 32,340 New Jersey ............ 29.0 30.0 1,160 1,100 33,640 33,000 New Mexico ........... 1,510.0 1,480.0 1,310 1,010 1,978,100 1,494,800 New York ............... 1,480.0 1,450.0 1,130 990 1,672,400 1,435,500 North Carolina ....... 800.0 800.0 900 730 720,000 584,000 North Dakota ......... 1,860.0 1,830.0 1,450 1,340 2,697,600 2,452,200 Ohio ....................... 1,300.0 1,310.0 1,090 860 1,417,000 1,126,600 Oklahoma .............. 5,100.0 5,300.0 1,100 1,010 5,610,000 5,353,000 Oregon ................... 1,270.0 1,310.0 1,210 1,090 1,536,700 1,427,900 Pennsylvania ......... 1,620.0 1,600.0 1,060 910 1,717,200 1,456,000 Rhode Island ......... 5.0 4.7 1,280 1,180 6,400 5,546 South Carolina ....... 340.0 350.0 960 820 326,400 287,000 South Dakota ......... 4,000.0 4,050.0 1,350 1,240 5,400,000 5,022,000 Tennessee ............. 1,830.0 1,800.0 940 890 1,720,200 1,602,000 Texas ..................... 12,500.0 13,000.0 1,080 990 13,500,000 12,870,000 Utah ....................... 790.0 810.0 1,270 1,150 1,003,300 931,500 Vermont ................. 260.0 255.0 1,270 1,000 330,200 255,000 Virginia ................... 1,480.0 1,440.0 940 860 1,391,200 1,238,400 Washington ............ 1,160.0 1,180.0 1,200 930 1,392,000 1,097,400 West Virginia ......... 395.0 390.0 1,000 870 395,000 339,300 Wisconsin .............. 3,500.0 3,450.0 1,140 950 3,990,000 3,277,500 Wyoming ................ 1,320.0 1,300.0 1,330 1,260 1,755,600 1,638,000
United States ......... 94,298.0 94,804.7 1,146 1,031 108,065,508 97,746,846
NASS, Livestock Branch, (202) 720–3570.

VII–3 AGRICULTURAL STATISTICS 2020
Table 7-4.—Cattle and calves, January 1: Number by class, State and United States, 2018–2019
State
Cows and heifers that have calved Heifers, 500 pounds and over
Beef cows Milk cows Beef cow
replacements Milk cow
replacements Other
2018 2019 2018 2019 2018 2019 2018 2019 2018 2019
1,000 head
Alabama ............ 714.0 705.0 6.0 5.0 125.0 116.0 3.0 2.0 37.0 37.0 Alaska ............... 6.1 6.8 0.3 0.2 1.4 1.4 0.1 0.1 0.5 0.7 Arizona .............. 200.0 215.0 210.0 205.0 36.0 35.0 105.0 115.0 29.0 20.0 Arkansas ........... 924.0 935.0 6.0 5.0 160.0 156.0 4.0 4.0 71.0 75.0 California ........... 670.0 630.0 1,740.0 1,730.0 125.0 115.0 780.0 760.0 175.0 215.0 Colorado ............ 812.0 792.0 168.0 178.0 175.0 170.0 100.0 110.0 550.0 570.0 Connecticut ....... 5.0 4.5 20.0 19.5 2.0 1.5 9.5 9.0 1.5 1.5 Delaware ........... 2.5 2.0 5.0 4.5 0.7 0.6 2.0 1.6 0.4 0.3 Florida ............... 886.0 914.0 124.0 116.0 115.0 130.0 40.0 35.0 30.0 25.0 Georgia ............. 485.0 499.0 85.0 81.0 95.0 90.0 25.0 30.0 25.0 30.0 Hawaii ............... 75.0 75.5 2.0 1.5 12.0 11.5 1.0 1.0 5.0 5.0 Idaho ................. 510.0 506.0 600.0 614.0 120.0 110.0 310.0 340.0 210.0 220.0 Illinois ................ 397.0 405.0 93.0 85.0 70.0 70.0 47.0 45.0 98.0 95.0 Indiana .............. 208.0 204.0 187.0 181.0 50.0 45.0 75.0 80.0 45.0 50.0 Iowa ................... 950.0 930.0 220.0 220.0 165.0 155.0 135.0 125.0 550.0 560.0 Kansas .............. 1,504.0 1,529.0 156.0 161.0 280.0 280.0 140.0 170.0 1,490.0 1,420.0 Kentucky ........... 1,033.0 1,017.0 57.0 53.0 145.0 120.0 45.0 45.0 115.0 130.0 Louisiana ........... 473.0 459.0 12.0 11.0 90.0 83.0 4.0 4.0 20.0 23.0 Maine ................ 10.0 11.0 30.0 29.0 4.0 3.0 15.0 14.0 3.0 3.0 Maryland ........... 46.0 50.0 47.0 44.0 12.0 13.0 28.0 30.0 10.0 8.0 Massachusetts .. 6.5 7.0 11.5 10.5 2.0 2.0 7.0 6.5 1.0 1.0 Michigan ............ 102.0 108.0 428.0 422.0 24.0 25.0 176.0 160.0 30.0 40.0 Minnesota .......... 365.0 370.0 455.0 450.0 100.0 95.0 290.0 255.0 175.0 170.0 Mississippi ......... 501.0 477.0 9.0 8.0 92.0 90.0 7.0 5.0 40.0 40.0 Missouri ............. 2,086.0 2,059.0 84.0 81.0 355.0 335.0 40.0 40.0 205.0 205.0 Montana ............ 1,497.0 1,448.0 13.0 12.0 390.0 380.0 7.0 8.0 223.0 232.0 Nebraska ........... 1,910.0 1,941.0 60.0 59.0 375.0 365.0 15.0 15.0 1,520.0 1,530.0 Nevada .............. 238.0 242.0 32.0 33.0 42.0 42.0 12.0 11.0 30.0 29.0 New Hampshire 4.5 4.0 12.5 12.0 1.5 1.3 7.0 6.5 0.5 0.7 New Jersey ....... 9.0 9.5 6.0 5.5 2.1 2.5 3.2 3.3 1.2 0.7 New Mexico ...... 483.0 480.0 332.0 325.0 105.0 95.0 130.0 125.0 95.0 85.0 New York .......... 105.0 105.0 625.0 625.0 45.0 40.0 350.0 335.0 50.0 45.0 North Carolina ... 370.0 367.0 45.0 43.0 63.0 60.0 17.0 20.0 22.0 20.0 North Dakota ..... 964.0 975.0 16.0 15.0 191.0 197.0 9.0 8.0 240.0 210.0 Ohio ................... 296.0 307.0 264.0 253.0 70.0 70.0 121.0 125.0 59.0 55.0 Oklahoma .......... 2,088.0 2,150.0 42.0 40.0 410.0 400.0 25.0 20.0 510.0 520.0 Oregon .............. 536.0 535.0 124.0 125.0 95.0 110.0 70.0 65.0 100.0 115.0 Pennsylvania ..... 215.0 225.0 525.0 505.0 60.0 65.0 310.0 290.0 60.0 55.0 Rhode Island ..... 1.6 1.4 0.8 0.7 0.5 0.6 0.5 0.5 0.2 0.2 South Carolina .. 174.0 186.0 15.0 14.0 28.0 37.0 6.0 5.0 9.0 8.0 South Dakota .... 1,751.0 1,818.0 119.0 122.0 435.0 385.0 45.0 40.0 500.0 550.0 Tennessee ........ 910.0 914.0 40.0 36.0 135.0 145.0 25.0 25.0 80.0 75.0 Texas ................ 4,520.0 4,655.0 530.0 545.0 800.0 740.0 250.0 260.0 1,470.0 1,690.0 Utah ................... 338.0 340.0 97.0 100.0 70.0 70.0 50.0 50.0 60.0 65.0 Vermont ............. 15.0 14.0 128.0 126.0 5.0 4.5 57.0 55.0 6.0 6.5 Virginia .............. 633.0 631.0 87.0 79.0 100.0 93.0 40.0 37.0 70.0 61.0 Washington ....... 235.0 230.0 275.0 280.0 52.0 57.0 123.0 123.0 115.0 126.0 West Virginia ..... 203.0 198.0 7.0 7.0 37.0 32.0 3.0 3.0 18.0 20.0 Wisconsin .......... 285.0 290.0 1,275.0 1,270.0 80.0 80.0 700.0 680.0 50.0 60.0 Wyoming ........... 714.0 714.0 6.0 6.0 160.0 160.0 4.0 4.0 136.0 126.0
United States .... 31,466.2 31,690.7 9,432.1 9,353.4 6,108.2 5,884.9 4,768.3 4,701.5 9,341.3 9,623.6
See footnote(s) at end of table.

VII–4 STATISTICS OF CATTLE, HOGS, AND SHEEP
Table 7-4.—Cattle and calves, January 1: Number by class, State and United States, 2018–2019—Continued
State Steers, 500 pounds and over Bulls, 500 pounds and over Calves under 500 pounds
2018 2019 2018 2019 2018 2019
Thousands Thousands Thousands Thousands Thousands Thousands
Alabama ................. 40.0 45.0 50.0 45.0 365.0 345.0 Alaska .................... 0.5 0.7 2.4 3.0 3.7 3.1 Arizona ................... 275.0 295.0 20.0 20.0 145.0 115.0 Arkansas ................ 110.0 115.0 60.0 60.0 425.0 430.0 California ................ 620.0 610.0 70.0 60.0 1,020.0 1,030.0 Colorado ................ 810.0 830.0 55.0 55.0 180.0 145.0 Connecticut ............ 2.0 1.5 0.5 0.5 9.5 9.0 Delaware ................ 2.1 2.6 0.3 0.4 4.0 3.0 Florida .................... 20.0 20.0 55.0 60.0 360.0 380.0 Georgia .................. 35.0 37.0 35.0 33.0 275.0 270.0 Hawaii .................... 11.0 10.5 4.0 4.0 34.0 33.0 Idaho ...................... 310.0 320.0 40.0 40.0 320.0 350.0 Illinois ..................... 195.0 245.0 25.0 25.0 225.0 220.0 Indiana ................... 104.0 115.0 16.0 17.0 175.0 188.0 Iowa ....................... 1,390.0 1,390.0 70.0 70.0 520.0 500.0 Kansas ................... 2,020.0 2,060.0 95.0 95.0 615.0 685.0 Kentucky ................ 195.0 225.0 70.0 70.0 500.0 470.0 Louisiana ............... 23.0 27.0 31.0 30.0 167.0 163.0 Maine ..................... 4.0 4.0 1.5 1.5 13.5 12.5 Maryland ................ 17.0 14.0 4.0 5.0 29.0 33.0 Massachusetts ....... 2.0 2.0 1.0 1.0 7.0 7.0 Michigan ................ 180.0 180.0 15.0 15.0 205.0 210.0 Minnesota .............. 475.0 485.0 35.0 35.0 455.0 460.0 Mississippi ............. 48.0 52.0 38.0 38.0 195.0 190.0 Missouri ................. 410.0 395.0 120.0 125.0 1,050.0 1,010.0 Montana ................. 210.0 240.0 105.0 100.0 105.0 80.0 Nebraska ............... 2,480.0 2,380.0 110.0 110.0 330.0 400.0 Nevada .................. 40.0 39.0 15.0 15.0 56.0 59.0 New Hampshire ..... 2.0 1.5 0.5 0.5 7.5 6.5 New Jersey ............ 2.1 2.5 1.0 1.0 4.4 5.0 New Mexico ........... 130.0 130.0 40.0 35.0 195.0 205.0 New York ............... 47.0 47.0 18.0 18.0 240.0 235.0 North Carolina ....... 33.0 35.0 30.0 30.0 220.0 225.0 North Dakota ......... 260.0 255.0 70.0 65.0 110.0 105.0 Ohio ....................... 210.0 215.0 30.0 30.0 250.0 255.0 Oklahoma .............. 990.0 1,050.0 155.0 180.0 880.0 940.0 Oregon ................... 145.0 160.0 40.0 40.0 160.0 160.0 Pennsylvania ......... 130.0 135.0 25.0 25.0 295.0 300.0 Rhode Island ......... 0.5 0.4 0.1 0.1 0.8 0.8 South Carolina ....... 10.0 10.0 16.0 14.0 82.0 76.0 South Dakota ......... 730.0 730.0 110.0 105.0 310.0 300.0 Tennessee ............. 150.0 130.0 60.0 65.0 430.0 410.0 Texas ..................... 2,620.0 2,720.0 340.0 340.0 1,970.0 2,050.0 Utah ....................... 80.0 85.0 25.0 25.0 70.0 75.0 Vermont ................. 4.0 4.0 3.0 3.0 42.0 42.0 Virginia ................... 160.0 155.0 40.0 39.0 350.0 345.0 Washington ............ 200.0 200.0 20.0 20.0 140.0 150.0 West Virginia ......... 41.0 42.0 15.0 14.0 71.0 74.0 Wisconsin .............. 380.0 360.0 30.0 30.0 700.0 680.0 Wyoming ................ 175.0 150.0 40.0 40.0 85.0 100.0
United States ......... 16,528.2 16,757.7 2,252.3 2,253.0 14,401.0 14,539.9
NASS, Livestock Branch, (202) 720–3570.

VII–5 AGRICULTURAL STATISTICS 2020
Table 7-5.—Cows and calf crop: Cows and heifers that have calved, Jan. 1, 2018–2019, and calves born, by State and United States, 2017–2018
State
Cows and heifers that have calved Calves born
Jan. 1 2017 2018
2018 2019
Thousands Thousands Thousands Thousands
Alabama ................................. 720.0 710.0 630.0 620.0 Alaska .................................... 6.4 7.0 4.5 5.0 Arizona ................................... 410.0 420.0 310.0 320.0 Arkansas ................................ 930.0 940.0 790.0 800.0 California ................................ 2,410.0 2,360.0 1,880.0 1,860.0 Colorado ................................ 980.0 970.0 830.0 840.0 Connecticut ............................ 25.0 24.0 17.5 16.5 Delaware ................................ 7.5 6.5 7.0 6.0 Florida .................................... 1,010.0 1,030.0 790.0 820.0 Georgia .................................. 570.0 580.0 480.0 510.0 Hawaii .................................... 77.0 77.0 60.0 60.0 Idaho ...................................... 1,110.0 1,120.0 960.0 960.0 Illinois ..................................... 490.0 490.0 420.0 430.0 Indiana ................................... 395.0 385.0 340.0 350.0 Iowa ....................................... 1,170.0 1,150.0 1,090.0 1,100.0 Kansas ................................... 1,660.0 1,690.0 1,430.0 1,500.0 Kentucky ................................ 1,090.0 1,070.0 990.0 970.0 Louisiana ................................ 485.0 470.0 370.0 360.0 Maine ..................................... 40.0 40.0 30.0 29.0 Maryland ................................ 93.0 94.0 70.0 75.0 Massachusetts ....................... 18.0 17.5 17.0 16.0 Michigan ................................. 530.0 530.0 410.0 420.0 Minnesota .............................. 820.0 820.0 790.0 800.0 Mississippi .............................. 510.0 485.0 400.0 385.0 Missouri .................................. 2,170.0 2,140.0 1,960.0 1,940.0 Montana ................................. 1,510.0 1,460.0 1,480.0 1,440.0 Nebraska ................................ 1,970.0 2,000.0 1,700.0 1,790.0 Nevada ................................... 270.0 275.0 220.0 220.0 New Hampshire ..................... 17.0 16.0 13.5 12.0 New Jersey ............................ 15.0 15.0 9.5 10.0 New Mexico ........................... 815.0 805.0 630.0 620.0 New York ............................... 730.0 730.0 550.0 550.0 North Carolina ........................ 415.0 410.0 365.0 365.0 North Dakota .......................... 980.0 990.0 960.0 940.0 Ohio ....................................... 560.0 560.0 490.0 490.0 Oklahoma ............................... 2,130.0 2,190.0 1,950.0 2,050.0 Oregon ................................... 660.0 660.0 630.0 620.0 Pennsylvania .......................... 740.0 730.0 600.0 610.0 Rhode Island .......................... 2.4 2.1 2.2 2.2 South Carolina ....................... 189.0 200.0 147.0 164.0 South Dakota ......................... 1,870.0 1,940.0 1,840.0 1,880.0 Tennessee ............................. 950.0 950.0 850.0 860.0 Texas ..................................... 5,050.0 5,200.0 4,400.0 4,650.0 Utah ....................................... 435.0 440.0 375.0 385.0 Vermont ................................. 143.0 140.0 105.0 102.0 Virginia ................................... 720.0 710.0 640.0 630.0 Washington ............................ 510.0 510.0 440.0 440.0 West Virginia .......................... 210.0 205.0 195.0 190.0 Wisconsin ............................... 1,560.0 1,560.0 1,430.0 1,420.0 Wyoming ................................ 720.0 720.0 660.0 670.0
United States ......................... 40,898.3 41,044.1 35,758.2 36,312.7
NASS, Livestock Branch, (202) 720–3570.
Table 7-6.—Cattle and calves: All cattle on feed, United States, Jan. 1, 2010–2019 1
Year Inventory
Thousands
2010 ................................................................................................. 13,727.6 2011 ................................................................................................. 14,131.5 2012 ................................................................................................. 14,355.3 2013 ................................................................................................. 13,703.3 2014 ................................................................................................. 12,949.3 2015 ................................................................................................. 13,024.8 2016 ................................................................................................. 13,156.7 2017 ................................................................................................. 13,108.4 2018 ................................................................................................. 14,146.0 2019 ................................................................................................. 14,367.9
1 Cattle and calves on feed are steers and heifers for slaughter market being fed a ration of grain or other concentrates and are expected to produce a carcass that will grade select or better.
NASS, Livestock Branch, (202) 720–3570.

VII–6 STATISTICS OF CATTLE, HOGS, AND SHEEP
Table 7-7.—Cattle and calves: Total number on feed by State and United States, Jan. 1, 2018–2019
State 2018 2019
1,000 head 1,000 head
Arizona ............................ 274.0 297.0 California ......................... 490.0 535.0 Colorado .......................... 1,000.0 1,050.0 Idaho ................................ 265.0 295.0 Illinois ............................... 220.0 250.0 Indiana ............................. 90.0 100.0 Iowa ................................. 1,300.0 1,320.0 Kansas ............................. 2,450.0 2,430.0 Kentucky .......................... 17.0 16.0 Maryland .......................... 9.0 9.0 Michigan .......................... 140.0 150.0 Minnesota ........................ 430.0 410.0 Missouri ........................... 80.0 100.0 Montana ........................... 45.0 40.0 Nebraska ......................... 2,800.0 2,750.0 Nevada ............................ 3.0 4.0 New York ......................... 22.0 22.0 North Dakota ................... 58.0 59.0 Ohio ................................. 140.0 150.0 Oklahoma ........................ 330.0 330.0 Oregon ............................. 90.0 90.0 Pennsylvania ................... 85.0 100.0 South Dakota ................... 470.0 425.0 Texas ............................... 2,650.0 2,750.0 Utah ................................. 20.0 23.0 Virginia ............................. 18.0 15.0 Washington ...................... 215.0 230.0 West Virginia ................... 4.0 4.0 Wisconsin ........................ 280.0 280.0 Wyoming .......................... 70.0 65.0 Other States 1 .................. 81.0 68.9
United States ................... 14,146.0 14,367.9
1 Individual state estimates not available for states not shown, but are included in Other States. NASS, Livestock Branch, (202) 720–3570.
Table 7-8.—Cattle: Average price per 100 pounds, by grades, at Nebraska Direct, Worthing, SD and Louisville, KY, 2010–2019
Year
Nebraska Worthing, SD Louisville, KY
Choice Cows 1 Cows
Steers 2 Heifers 3 Commercial Breaking utility Breaking utility 85-95% Lean
Dollars Dollars Dollars Dollars Dollars Dollars 2010 .................. 95.81 95.41 (NA) 61.49 53.98 41.70 2011 .................. 111.52 111.55 74.25 71.34 67.20 53.92 2012 .................. 123.11 124.18 83.95 78.90 76.55 62.71 2013 .................. 127.13 127.37 84.83 78.52 79.22 71.00 2014 .................. 154.03 154.67 108.79 109.08 105.26 83.56 2015 .................. 148.71 148.09 100.39 104.29 99.14 78.27 2016 .................. 117.74 119.69 82.14 76.40 (NA) (NA) 2017 .................. 121.43 121.92 83.72 71.65 (NA) (NA) 2018 .................. 116.42 117.62 79.15 68.45 (NA) (NA) 2019 .................. 118.47 118.05 84.32 (NA) (NA) (NA)
(NA) Not available. 1 All weights; simple average of price range. 2 1,100 to 1,500 pound weight range; weighted aver-age of price range. 3 1,000 to 1,300 pound weight range; simple average of price range.
AMS, Livestock and Grain Market News, (202) 720–7316.

VII–7 AGRICULTURAL STATISTICS 2020
Table 7-9.—Cattle and calves: Production, disposition, cash receipts, and gross income, United States, 2009-2018
Year Calf crop 1
Death loss Marketings 2
Inshipments 3
Farm slaughter
Cattle Calves Cattle Calves Cattle and calves
1,000 head 1,000 head 1,000 head 1,000 head 1,000 head 1,000 head 1,000 head
2010 ......... 35,740 1,736 2,265 44,658 8,874 20,757 157 2011 ......... 35,357 1,787 2,230 44,875 8,401 20,357 148 2012 ......... 34,469 1,752 2,171 43,578 8,337 20,443 139 2013 ......... 33,630 1,730 2,140 43,453 7,996 19,965 128 2014 ......... 33,522 1,720 2,130 41,243 7,819 20,443 124 2015 ......... 34,087 1,736 2,144 40,487 7,397 20,508 116 2016 ......... 35,063 1,736 2,140 41,756 7,656 20,084 123 2017 ......... 35,758 1,784 2,144 43,644 7,777 20,380 116 2018 ......... 36,313 1,786 2,205 45,031 7,602 20,937 119 2019 ......... 36,060 1,865 2,300 45,040 7,541 20,418 123
Year Production (live weight) 4
Value of production
Cash receipts 5
Value of home
consumption
Gross income 6
Average price per 100 pounds received by farmers
Cattle Calves
1,000 1,000 1,000 1,000 1,000 pounds dollars dollars dollars dollars Dollars Dollars
2010 ......... 41,379,839 36,850,474 51,246,136 405,789 51,651,925 92.20 117.00 2011 ......... 41,483,945 45,059,200 62,321,217 478,871 62,800,088 113.00 142.00 2012 ......... 40,920,479 48,059,904 66,090,126 525,630 66,615,756 121.00 172.00 2013 ......... 40,781,761 48,595,712 67,849,440 509,175 68,358,615 125,00 181.00 2014 ........ 40,268,012 60,141,507 81,076,720 610,833 81,687,553 152.00 261.00 2015 ......... 41,503,073 60,080,918 78,252,807 588,216 78,841,023 147.00 247.00 2016 ......... 42,694,001 48,572,501 63,691,327 472,478 64,163,805 119.00 158.00 2017 ......... 44,197,461 50,398,374 66,936,726 455,988 67,392,714 120.00 168.00 2018 ......... 45,677,452 49,147,588 67,038,059 431,071 67,469,130 116.00 170.00 2019 ......... 44,820,270 48,223,046 66,239,043 436,788 66,675,831 116.00 159.00
1 Calves born during the year. 2 Includes custom slaughter for use on farms where produced and State outshipments, but excludes interfarm sales within the State. 3 Includes cattle shipped in from other States, but excludes cattle for imme-diate slaughter. 4 Adjustments made for changes in inventory and for inshipments. 5 Receipts from marketings and sale of farm slaughter. 6 Cash receipts from sales of cattle, calves, beef, and veal plus value of cattle and calves slaughtered for home consumption.
NASS, Livestock Branch, (202) 720–3570.
Table 7-10.—Cattle: Weighted average weight and price per 100 pounds, Texas- Oklahoma, Kansas, Colorado, Nebraska, Iowa-So. Minnesota Feedlots, 2010–2019 1
Year Steers SE/CH 65-80% Steers SE/CH 35-65%
Price Average Weight Number of Head Price Average Weight Number of Head
Dollars Pounds Dollars Pounds
2010 ... 95.00 1,359 561,173 95.95 1,301 1,329,021 2011 ... 114.45 1,364 518,689 114.92 1,304 1,101,808 2012 ... 122.84 1,402 458,382 123.06 1,312 743,859 2013 ... 126.27 1,408 384,642 126.35 1,338 517,782 2014 ... 154.25 1,410 548,667 152.15 1,339 386,051 2015 ... 147.64 1,432 341,078 149.00 1,366 228,126 2016 ... 120.04 1,429 735,708 121.29 1,369 276,086 2017 ... 122.85 1,454 845,341 123.13 1,313 235,130 2018 ... 117.06 1,401 704,101 119.06 1,312 195,726 2019 ... 117.87 1,390 456,517 115.45 1,322 108,332
Year Heifers SE/CH 65-80% Heifers SE/CH 35-65%
Price Average Weight Number of Head Price Average Weight Number of Head
Dollars Pounds Dollars Pounds
2010 ... 95.41 1,227 562,788 96.22 1,166 1,159,191 2011 ... 114.05 1,222 508,487 114.64 1,167 928,633 2012 ... 123.38 1,255 412,483 123.31 1,173 577,535 2013 ... 126.09 1,266 320,285 126.36 1,198 335,205 2014 ... 154.37 1,279 322,272 152.18 1,204 218,658 2015 ... 148.20 1,289 220,073 147.73 1,235 97,078 2016 ... 120.99 1,288 400,528 121.67 1,231 103,739 2017 ... 122.87 1,251 404,560 123.25 1,194 86,001 2018 ... 117.74 1,247 353,713 118.80 1,206 73,320 2019 ... 116.62 1,248 246,807 114.29 1,207 38,108
1 Sales FOB the feedyard. Estimated net weights after 3-4% shrink. AMS, Livestock and Grain Market News, (202) 720–7316.

VII–8 STATISTICS OF CATTLE, HOGS, AND SHEEP
Table 7-11.—Cattle: Receipts at selected markets, 2010–2019
Year Oklahoma City Fort Collins Tulia 1 South St. Joseph Sioux Falls
Thousands Thousands Thousands Thousands Thousands
2010 ......... 492 63 74 105 153 2011 ......... 468 30 60 94 104 2012 ......... 399 72 43 121 153 2013 ......... 409 46 35 90 156 2014 ......... 382 42 37 86 140 2015 ......... 368 43 21 88 139 2016 ......... 368 51 34 91 179 2017 ......... 369 15 39 98 174 2018 ......... 388 31 26 91 139 2019 ......... 415 32 91 77 203
1 Changed from Amarillo, Texas to Tulia, Texas AMS, Livestock & Grain Market News, (202) 720–7316.
Table 7-12.—Cattle and calves: Number slaughtered, United States, 2010–2019
Year
Cattle slaughter Calf slaughter
Commercial
Farm Total
Commercial
Farm Total Federally inspected Other Total 1 Federally
inspected Other Total 1
1,000 head
2010 ... 33,702 547 34,249 124 34,373 864 14 879 33 912 2011 ... 33,555 532 34,087 119 34,205 839 14 853 30 882 2012 ... 32,426 525 32,951 112 33,062 760 12 772 27 800 2013 ... 31,947 515 32,462 103 32,565 751 11 762 26 788 2014 ... 29,682 486 30,168 98 30,266 558 8 566 26 591 2015 ... 28,296 455 28,752 92 28,844 446 7 453 24 476 2016 ... 30,114 464 30,578 98 30,676 480 8 488 25 513 2017 ... 31,704 485 32,189 91 32,281 503 9 512 25 537 2018 ... 32,518 487 33,005 95 33,100 571 9 580 23 604 2019 ... 33,069 486 33,555 101 33,656 579 8 587 22 609
1 Totals are based on unrounded numbers. NASS, Livestock Branch, (202) 720-3570.
Table 7-13.—Cattle and calves: Number slaughtered under Federal inspection, and average live weight, 2010–2019
Year Cattle Calves
Number slaughtered Average live weight 1 Number slaughtered Average live weight 1
Thousands Pounds Thousands Pounds
2010 ......... 33,702 1,282 864 260 2011 ......... 33,555 1,280 839 260 2012 ......... 32,426 1,305 760 257 2013 ......... 31,947 1,317 751 248 2014 ......... 29,682 1,333 558 281 2015 ......... 28,296 1,364 446 309 2016 ......... 30,114 1,365 480 264 2017 ......... 31,704 1,351 503 248 2018 ......... 32,518 1,352 571 224 2019 ......... 33,069 1,347 579 219
1 Excludes postmortem condemnations. NASS, Livestock Branch, (202) 720-3570.

VII–9 AGRICULTURAL STATISTICS 2020
Table 7-14.—Cattle and calves: Number slaughtered commercially, total and average live weight, by State and United States, 2019 1
State
Cattle Calves
Number slaughtered
Total live weight 2
Average live weight 2
Number slaughtered
Total live weight 2
Average live weight 2
Thousands 1,000 pounds Pounds Thousands 1,000 pounds Pounds
Alabama .................... 5.9 6,168 1,037 (Y) (Y) (Y) Alaska ........................ 0.6 698 1,130 (D) (D) (D) Arizona ...................... 551.3 752,983 1,368 (D) (D) (D) Arkansas .................... 5.3 5,068 957 (Y) (Y) (Y) California ................... 1,531.1 2,002,936 1,317 82.0 8,365 104 Colorado .................... 2,469.3 3,384,389 1,372 (D) (D) (D) Delaware-Maryland ... 37.7 51,736 1,373 (D) (D) (D) Florida ........................ (D) (D) (D) 0.8 310 392 Georgia ...................... (D) (D) (D) 1.3 575 442 Hawaii ........................ 13.4 14,509 1,087 (D) (D) (D) Idaho .......................... 503.5 642,342 1,288 40.3 3,545 89 Illinois ......................... (D) (D) (D) 1.0 379 383 Indiana ....................... 34.2 40,024 1,170 4.5 1,353 300 Iowa ........................... (D) (D) (D) (D) (D) (D) Kansas ....................... 6,436.7 8,642,515 1,343 0.5 202 445 Kentucky .................... 39.1 40,870 1,053 (D) (D) (D) Louisiana ................... 5.5 4,356 788 0.2 69 423 Michigan .................... (D) (D) (D) 1.2 369 302 Minnesota .................. (D) (D) (D) (Y) (Y) (Y) Mississippi ................. 4.4 3,777 863 (D) (D) (D) Missouri ..................... 47.6 55,305 1,161 0.3 119 447 Montana ..................... 21.7 29,198 1,349 (Y) (Y) (Y) Nebraska ................... 7,666.0 10,727,535 1,401 (D) (D) (D) Nevada ...................... 1.4 1,558 1,085 (D) (D) (D) New England 3 ........... 28.4 32,839 1,156 3.2 714 222 New Jersey ................ 41.9 46,537 1,114 22.6 8,568 379 New Mexico ............... 4.9 4,976 1,014 (Y) (Y) (Y) New York ................... 39.6 46,819 1,200 101.1 8,960 89 North Carolina ........... 79.9 98,205 1,234 0.7 213 301 North Dakota ............. 8.8 11,341 1,290 (D) (D) (D) Ohio ........................... 64.5 83,771 1,301 154.7 22,345 145 Oklahoma .................. 31.0 33,006 1,065 0.3 142 429 Oregon ....................... 17.3 19,443 1,124 (D) (D) (D) Pennsylvania ............. 1,124.4 1,357,158 1,211 108.9 46,209 424 South Carolina ........... 228.7 280,833 1,234 (D) (D) (D) South Dakota ............. 496.1 699,472 1,416 (D) (D) (D) Tennessee ................. 16.8 16,532 997 0.2 86 410 Texas ......................... 5,858.5 7,604,107 1,302 2.2 946 423 Utah ........................... 699.0 938,615 1,345 (D) (D) (D) Virginia ....................... 16.0 16,995 1,060 (D) (D) (D) Washington ................ 1,145.6 1,579,384 1,383 5.8 456 78 West Virginia ............. 10.8 10,695 990 (D) (D) (D) Wisconsin .................. 1,379.4 1,894,776 1,382 50.9 23,598 465 Wyoming .................... 5.4 5,947 1,111 (D) (D) (D)
United States ............. 33,555.3 45,011,509 1,344 587.0 128,804 221
(D) Withheld to avoid disclosing data for individual operations. (Y) Less than level of precision shown. 1 Includes slaughter in federally inspected and other slaughter plants; excludes animals slaughtered on farms. Average live weight is based on unrounded numbers. Totals may not add due to rounding. 2 Excludes postmortem condemnations. 3 New England includes Connecticut, Maine, Massachusetts, New Hampshire, Rhode Island, and Vermont.
NASS, Livestock Branch, (202) 720-3570.

VII–10 STATISTICS OF CATTLE, HOGS, AND SHEEP
Table 7-15.—Cattle and calves: Production, disposition, cash receipts, and gross income, by State and United States, 2019
State
Marketings 1
Inship- ments 2
Farm slaugh-
ter 3
Production (live
weight) 4
Value of production
Cash receipts 5
Value of home con-
sump-tion
Gross income 6 Cattle Calves
1,000 head
1,000 head
1,000 head
1,000 head
1,000 pounds
1,000 dollars
1,000 dollars
1,000 dollars
1,000 dollars
Alabama .......... 526.0 52.0 18.0 2.0 592,458 402,396 406,929 2,106 409,035 Alaska .............. 2.7 0.1 0.4 0.4 4,443 4,884 3,424 441 3,865 Arizona ............ 533.5 95.1 337.0 1.4 484,789 543,422 783,923 2,269 786,192 Arkansas .......... 633.0 234.0 115.0 1.0 510,641 360,750 452,034 3,579 455,613 California ......... 2,027.0 311.0 740.0 7.0 2,312,271 2,426,684 3,064,300 10,074 3,074,374 Colorado .......... 2,364.5 102.5 1,709.0 2.0 1,861,346 1,796,196 3,625,741 13,157 3,638,898 Connecticut ...... 7.4 7.5 1.6 0.2 12,223 13,250 17,255 827 12,413 Delaware ......... 4.0 1.8 0.5 0.1 4,808 5,115 7,497 637 5,638 Florida .............. 220.0 565.5 40.0 1.5 430,506 439,933 507,755 2,862 477,872 Georgia ............ 301.0 162.5 17.0 1.5 398,613 311,266 335,319 2,057 303,448 Hawaii .............. 15.6 42.2 .............. 0.2 35,038 41,387 45,781 448 43,200 Idaho ................ 1,165.0 160.0 450.0 3.0 1,259,900 1,405,115 1,725,717 10,120 1,745,760 Illinois ............... 492.0 79.0 135.0 7.0 556,181 660,003 595,677 16,656 834,533 Indiana ............. 323.0 122.0 109.0 5.0 283,810 282,568 353,897 14,816 408,778 Iowa ................. 2,403.0 100.5 1,570.0 2.5 2,075,108 2,536,003 4,074,878 14,583 3,946,525 Kansas ............. 5,344.0 4.0 4,200.0 2.0 4,425,147 4,651,116 8,285,905 15,790 8,406,456 Kentucky .......... 551.0 383.0 73.0 3.0 594,091 648,279 738,867 11,167 703,175 Louisana .......... 131.5 217.5 8.0 1.0 202,545 202,975 234,660 1,612 205,903 Maine ............... 12.7 14.1 3.0 0.2 15,242 16,504 20,514 1,684 18,746 Maryland .......... 60.5 21.0 4.1 0.6 73,049 76,424 68,955 2,838 94,487 Massachusetts 9.0 8.0 0.8 0.3 8,092 8,596 9,482 632 11,379 Michigan .......... 377.0 41.0 70.0 3.0 487,465 486,956 553,716 14,249 562,046 Minnesota ........ 1,366.5 105.5 800.0 4.0 1,395,147 1,422,743 2,063,652 18,475 2,014,746 Mississippi ....... 228.0 110.0 15.0 2.0 245,638 191,007 215,709 3,286 175,272 Missouri ........... 903.0 895.0 115.0 7.0 1,445,831 1,880,552 2,170,559 24,470 1,893,181 Montana ........... 1,290.0 150.5 124.0 3.5 1,115,068 1,254,311 1,365,683 13,010 1,368,143 Nebraska ......... 6,408.0 85.0 4,965.0 2.0 5,586,250 5,424,191 10,583,711 15,871 10,562,966 Nevada ............ 215.0 95.0 110.0 1.0 210,394 232,289 326,304 2,386 322,126 New Hampshire 5.9 6.3 0.6 0.4 7,439 8,272 9,696 948 9,826 New Jersey ...... 7.0 5.1 1.4 0.4 7,334 8,080 5,804 1,654 10,984 New Mexico ..... 892.7 101.2 390.0 1.1 632,851 715,030 919,041 4,337 997,630 New York ......... 202.6 300.4 18.5 3.5 261,505 276,247 344,279 12,798 289,042 North Carolina 208.5 119.5 6.0 1.0 291,217 222,816 247,857 2,822 222,057 North Dakota ... 870.3 103.7 140.0 1.0 794,993 943,461 1,028,871 9,720 993,144 Ohio ................. 475.0 21.0 50.0 6.0 585,650 594,916 575,463 27,365 650,715 Oklahoma ........ 2,332.0 355.0 900.0 3.0 2,117,748 2,578,360 3,308,434 19,133 3,293,410 Oregon ............. 515.0 194.0 140.0 5.0 547,700 625,158 701,269 12,650 749,610 Pennsylvania ... 410.0 210.7 36.0 7.3 513,029 553,687 586,422 20,313 636,223 Rhode Island ... 1.1 1.1 0.2 0.2 1,086 1,174 902 493 1,721 South Carolina 141.0 16.0 4.0 2.0 167,087 115,360 125,693 2,159 124,321 South Dakota ... 1,889.0 500.0 584.0 1.0 1,720,157 2,123,392 2,726,006 10,760 2,739,338 Tennessee ....... 482.0 323.0 30.0 3.0 585,786 476,175 548,804 7,647 495,312 Texas ............... 5,428.0 257.5 1,650.0 4.5 6,181,230 7,256,724 8,624,064 16,041 8,440,074 Utah ................. 376.0 35.5 58.0 1.5 403,998 446,167 449,991 6,405 498,907 Vermont ........... 39.3 61.2 3.4 0.9 55,927 62,520 65,525 2,957 70,574 Virginia ............. 341.5 221.5 12.0 3.0 439,952 347,309 412,529 5,168 349,751 Washington ...... 564.0 6.0 210.0 6.0 658,905 698,751 748,635 13,183 867,111 West Virginia ... 112.5 76.5 20.0 2.0 145,668 157,535 173,634 5,154 165,886 Wisconsin ........ 1,027.0 375.2 163.0 4.8 1,499,119 1,590,916 1,752,726 31,022 1,693,324 Wyoming .......... 786.0 85.5 270.0 0.5 575,768 695,811 942,966 3,963 892,101
United States ... 45,040.3 7,541.2 20,417.5 122.5 44,820,270 48,233,046 67,105,197 431,231 66,675,831
1 Includes custom slaughter for use on farms where produced and State outshipments, but excludes interfarm sales within the State. 2 Includes cattle shipped in from other states, but excludes cattle for immediate slaughter. 3 Excludes custom slaughter for farmers at commercial establishments. 4 Adjustments made for changes in inventory and for inshipments. 5 Includes receipts from marketings and sales of farm-slaughter. 6 Includes cash receipts from sales of cat-tle, calves, beef, and veal plus value of cattle and calves slaughtered for home consumption.
NASS, Livestock Branch, (202) 720–3570.

VII–11 AGRICULTURAL STATISTICS 2020
Table 7-16.—Cattle and calves: Inventory Jan 1, 2018–2019, and number of operations, 2017, by State and United States 1
State January 1 Cattle inventory Operations with cattle 2
2018 2019 2017
1,000 head 1,000 head Number
Alabama .............................. 1,340 .0 1,000 .0 22,046 Alaska ................................. 15 .0 16 .0 118 Arizona ............................... 1,020 .0 1,020 .0 7,057 Arkansas ............................. 1,760 .0 1,780 .0 25,372 California ............................. 5,200 .0 5,150 .0 13,694 Colorado ............................. 2,850 .0 2,850 .0 14,914 Connecticut ......................... 50 .0 47 .0 1,158 Delaware ............................. 17 .0 15 .0 301 Florida ................................. 1,630 .0 1,680 .0 21,469 Georgia ............................... 1,060 .0 1,070 .0 17,387 Hawaii ................................. 144 .0 142 .0 1,218 Idaho ................................... 2,420 .0 2,500 .0 10,076 Illinois .................................. 1,150 .0 1,190 .0 16,269 Indiana ................................ 860 .0 880 .0 17,014 Iowa .................................... 4,000 .0 3,950 .0 25,367 Kansas ................................ 6,300 .0 6,400 .0 26,740 Kentucky ............................. 2,160 .0 2,130 .0 38,657 Louisana ............................. 820 .0 800 .0 13,449 Maine .................................. 81 .0 78 .0 1,756 Maryland ............................. 193 .0 197 .0 3,322 Massachusetts .................... 38 .0 37 .0 1,267 Michigan ............................. 1,160 .0 1,160 .0 12,221 Minnesota ........................... 2,350 .0 2,320 .0 20,969 Mississippi .......................... 930 .0 900 .0 15,980 Missouri .............................. 4,350 .0 4,250 .0 53,497 Montana .............................. 2,550 .0 2,500 .0 11,400 Nebraska ............................ 6,800 .0 6,800 .0 20,430 Nevada ............................... 465 .0 470 .0 1,621 New Hampshire .................. 36 .0 33 .0 903 New Jersey ......................... 29 .0 30 .0 1,246 New Mexico ........................ 1,510 .0 1,480 .0 10,880 New York ............................ 1,480 .0 1,450 .0 12,796 North Carolina .................... 800 .0 800 .0 18,413 North Dakota ...................... 1,860 .0 1,830 .0 8,777 Ohio .................................... 1,300 .0 1,310 .0 25,224 Oklahoma ........................... 5,100 .0 5,300 .0 52,048 Oregon ................................ 1,270 .0 1,310 .0 13,880 Pennsylvania ...................... 1,620 .0 1,600 .0 22,729 Rhode Island ...................... 5 .0 4 .7 214 South Carolina .................... 340 .0 350 .0 7,868 South Dakota ...................... 4,000 .0 4,050 .0 13,928 Tennessee .......................... 1,830 .0 1,800 .0 37,288 Texas .................................. 12,500 .0 13,000 .0 152,882 Utah .................................... 790 .0 810 .0 8,026 Vermont .............................. 260 .0 255 .0 2,317 Virginia ................................ 1,480 .0 1,440 .0 21,880 Washington ......................... 1,160 .0 1,180 .0 11,311 West Virginia ...................... 395 .0 390 .0 11,774 Wisconsin ........................... 3,550 .0 3,450 .0 27,777 Wyoming ............................. 1,320 .0 1,300 .0 5,762
United States ...................... 94,298 .0 94,804 .7 882,692
1 An operation is any place having one or more head of cattle on hand on December 31. 2 State level estimates only available in conjunction with the Census of Agriculture every 5 years.
NASS, Livestock Branch, (202) 720–3570.

VII–12 STATISTICS OF CATTLE, HOGS, AND SHEEP
Table 7-17.—Cattle: Number slaughtered under Federal inspection and percentage distribution, by classes, 2010–2019 1
Year
Number Percentage of total
Steers Heif-ers
Cows
Bulls Steers Heif-ers
Cows
Bulls Dairy cows
Other cows
Total cows
Dairy cows
Other cows
Total cows
Thousands Percent
2010 ... 16,596 10,047 2,807 3,630 6,437 622 49.2 29.8 8.3 10.8 19.1 1.8 2011 ... 16,539 9,726 2,914 3,798 6,712 579 49.3 29.0 8.7 11.3 20.0 1.7 2012 ... 16,160 9,269 3,102 3,344 6,446 551 49.8 28.6 9.6 10.3 19.9 1.7 2013 ... 16,003 9,132 3,125 3,130 6,255 557 50.1 28.6 9.8 9.8 19.6 1.7 2014 ... 15,378 8,377 2,816 2,565 5,380 548 51.8 28.2 9.5 8.6 18.1 1.8 2015 ... 15,331 7,351 2,915 2,236 5,151 462 54.2 26.0 10.3 7.9 18.2 1.6 2016 ... 16,495 7,698 2,886 2,543 5,428 494 54.8 25.6 9.6 8.4 18.0 1.6 2017 ... 16,771 8,611 2,988 2,784 5,773 550 52.9 27.2 9.4 8.8 18.2 1.7 2018 ... 16,637 9,167 3,153 3,024 6,177 538 51.2 28.2 9.7 9.3 19.0 1.7 2019 ... 16,298 9,819 3,224 2,784 6,414 539 49.3 29.7 9.7 8.4 19.4 1.6
1 Totals and percentages based on unrounded data and may not equal sum of classes due to rounding. NASS, Livestock Branch, (202) 720-3570.
Table 7-18.—Cattle and calves: Average dressed weight under Federal inspection, 2010–2019 1
Year Cattle
Calves All cattle Steers Heifers Cows Bulls
Pounds
2010 ........................... 773 835 768 607 875 154 2011 ........................... 773 841 773 596 868 154 2012 ........................... 790 859 792 608 877 152 2013 ........................... 796 863 794 620 880 146 2014 ........................... 808 872 800 627 898 166 2015 ........................... 829 892 818 644 915 183 2016 ........................... 829 891 822 643 901 155 2017 ........................... 817 877 812 642 896 145 2018 ........................... 818 880 817 645 889 130 2019 ........................... 813 878 813 639 878 127
1 Excludes postmortem condemnations. NASS, Livestock Branch, (202) 720-3570.

VII–13 AGRICULTURAL STATISTICS 2020
Table 7-19.—Beef cows: Inventory Jan 1, 2018 and 2019, and number of operations, 2017, by State and United States 1
State January 1 beef cow inventory Operations with beef cows 2
2018 2019 2017
1,000 head 1,000 head Number
Alabama .............................. 714 .0 705 .0 20,004 .0 Alaska ................................. 6 .1 6 .8 92 .0 Arizona ............................... 200 .0 215 .0 5,560 .0 Arkansas ............................. 924 .0 935 .0 23,036 .0 California ............................. 670 .0 630 .0 10,254 .0 Colorado ............................. 812 .0 792 .0 12,407 .0 Connecticut ......................... 5 .0 4 .5 860 .0 Delaware ............................. 2 .5 2 .0 235 .0 Florida ................................. 886 .0 914 .0 18,493 .0 Georgia ............................... 485 .0 499 .0 14,869 .0 Hawaii ................................. 75 .0 75 .5 1,047 .0 Idaho ................................... 510 .0 506 .0 8,149 .0 Illinois .................................. 397 .0 405 .0 13,139 .0 Indiana ................................ 208 .0 204 .0 11,753 .0 Iowa .................................... 950 .0 930 .0 19,171 .0 Kansas ................................ 1,504 .0 1,529 .0 23,682 .0 Kentucky ............................. 1,033 .0 1,017 .0 33,864 .0 Louisana ............................. 473 .0 459 .0 12,051 .0 Maine .................................. 10 .0 11 .0 1,141 .0 Maryland ............................. 46 .0 50 .0 2,486 .0 Massachusetts .................... 6 .5 7 .0 879 .0 Michigan ............................. 102 .0 108 .0 7,445 .0 Minnesota ........................... 365 .0 370 .0 13,339 .0 Mississippi .......................... 501 .0 477 .0 14,752 .0 Missouri .............................. 2,086 .0 2,059 .0 48,122 .0 Montana .............................. 1,497 .0 1,448 .0 10,290 .0 Nebraska ............................ 1,910 .0 1,941 .0 17,707 .0 Nevada ............................... 238 .0 242 .0 1,356 .0 New Hampshire .................. 4 .5 4 .0 602 .0 New Jersey ......................... 9 .0 9 .5 941 .0 New Mexico ........................ 483 .0 480 .0 8,991 .0 New York ............................ 105 .0 105 .0 7,310 .0 North Carolina .................... 370 .0 367 .0 16,407 .0 North Dakota ...................... 964 .0 975 .0 8,245 .0 Ohio .................................... 296 .0 307 .0 17,733 .0 Oklahoma ........................... 2,088 .0 2,150 .0 46,080 .0 Oregon ................................ 536 .0 535 .0 11,548 .0 Pennsylvania ...................... 215 .0 225 .0 13,176 .0 Rhode Island ...................... 1 .6 1 .4 163 .0 South Carolina .................... 174 .0 186 .0 6,917 .0 South Dakota ...................... 1,751 .0 1,818 .0 12,613 .0 Tennessee .......................... 910 .0 914 .0 32,960 .0 Texas .................................. 4,520 .0 4,655 .0 134,250 .0 Utah .................................... 338 .0 340 .0 6,508 .0 Vermont .............................. 15 .0 14 .0 1,399 .0 Virginia ................................ 633 .0 631 .0 18,453 .0 Washington ......................... 235 .0 230 .0 9,295 .0 West Virginia ...................... 203 .0 198 .0 10,336 .0 Wisconsin ........................... 285 .0 290 .0 13,954 .0 Wyoming ............................. 714 .0 714 .0 4,982 .0
United States ...................... 31,466 .2 31,690 .7 729,046 .0
1 An operation is any place having one or more beef cows on hand on December 31. 2 State level estimates only avail-able in conjunction with the Census of Agriculture every 5 years.
NASS, Livestock Branch, (202) 720–3570.

VII–14 STATISTICS OF CATTLE, HOGS, AND SHEEP
Table 7-20.—Hogs and pigs: Inventory and value, Dec. 1, 2018–2019, and number of operations, 2017, by State and United States
State
Inventory Value Operations 1
2018 2019 Value per head Total value
2017 2018 2019 2018 2019
1,000 1,000 Thousands Thousands Dollars Dollars dollars dollars Number
Alabama ........................ 33.0 36.0 112 110 3,696 3,960 1,074 Alaska ............................ 1.9 1.9 221 220 420 418 64 Arizona .......................... 170.0 161.0 115 110 19,550 17,710 521 Arkansas ........................ 130.0 117.0 110 105 14,300 12,285 1,021 California ....................... 101.0 106.0 145 145 14,645 15,370 1,389 Colorado ........................ 750.0 760.0 110 105 82,500 78,750 1,227 Connecticut .................... 3.7 4.0 145 145 537 580 214 Delaware ....................... 6.5 7.0 110 110 715 770 55 Florida ............................ 13.0 10.0 110 112 1,430 1,120 1,810 Georgia .......................... 72.0 62.0 100 100 7,200 6,200 1,091 Hawaii ............................ 9.0 11.0 170 170 1,530 1,870 226 Idaho .............................. 32.0 35.0 110 110 3,520 3,850 606 Illinois ............................. 5,400.0 5,500.0 97 102 523,800 545,700 2,153 Indiana ........................... 4,250.0 4,450.0 97 102 412,250 438,600 2,570 Iowa ............................... 23,600.0 25,100.0 96 102 2,265,600 2,529,600 5,660 Kansas ........................... 2,050.0 2,160.0 100 102 205,000 214,000 943 Kentucky ........................ 285.0 435.0 95 93 27,075 40,455 1,805 Louisiana ....................... 6.0 6.0 112 110 672 660 874 Maine ............................. 4.4 4.6 120 120 528 552 429 Maryland ........................ 19.0 20.0 120 120 2,280 2,400 562 Massachusetts ............... 8.0 8.0 105 105 840 840 337 Michigan ........................ 1,180.0 1,240.0 95 99 112,100 120,780 2,017 Minnesota ...................... 9,100.0 9,500.0 97 102 882,700 938,400 3,225 Mississippi ..................... 190.0 190.0 108 106 20,520 20,140 784 Missouri ......................... 3,650.0 3,400.0 99 103 361,350 334,750 2,687 Montana ......................... 192.0 210.0 113 113 21,696 23,730 452 Nebraska ....................... 3,550.0 3,850.0 100 103 355,000 386,250 1,230 Nevada .......................... 6.0 5.0 121 120 726 600 70 New Hampshire ............. 3.5 3.4 115 115 403 391 281 New Jersey .................... 8.5 7.5 120 120 1,020 900 347 New Mexico ................... 1.3 2.0 115 115 150 230 353 New York ....................... 46.0 53.0 105 105 4,830 5,565 1,739 North Carolina ............... 9,200.0 9,500.0 91 96 837,200 883,200 2,426 North Dakota ................. 145.0 142.0 103 100 14,935 14,200 156 Ohio ............................... 2,550.0 2,950.0 103 104 272,850 291,200 3,484 Oklahoma ...................... 2,200.0 2,280.0 120 116 264,000 263,320 2,264 Oregon ........................... 9.0 11.0 115 115 1,035 1,265 1,177 Pennsylvania ................. 1,310.0 1,330.0 95 100 124,450 131,300 2,777 Rhode Island ................. 1.7 1.6 120 120 204 192 60 South Carolina ............... 210.0 195.0 96 95 20,160 18,525 1,005 South Dakota ................. 1,750.0 2,010.0 100 102 175,000 202,980 571 Tennessee ..................... 225.0 250.0 91 93 20,475 23,250 1,898 Texas ............................. 1,110.0 1,140.0 115 114 127,650 128,820 5,894 Utah ............................... 710.0 960.0 105 105 74,550 100,800 561 Vermont ......................... 3.7 3.6 135 135 500 486 353 Virginia ........................... 345.0 340.0 94 96 32,430 32,640 1,461 Washington .................... 17.0 17.0 115 115 1,955 1,955 1,126 West Virginia ................. 4.0 3.0 112 105 448 315 892 Wisconsin ...................... 320.0 340.0 97 101 31,040 36,865 2,198 Wyoming ........................ 88.0 94.0 105 110 9,240 10,340 320
United States ................. 75,070.2 79,047.6 98 102 7,356,703 7,888,779 66,439
(D) Withheld to avoid disclosing data for individual operations. 1 State level estimates only available in conjunction with the Census of Agriculture every 5 years. An operation is any place having one or more hogs and pigs on hand December 31. Totals may not add due to rounding.
NASS, Livestock Branch, (202) 720–3570.

VII–15 AGRICULTURAL STATISTICS 2020
Table 7-21.—Hogs and pigs: Operations, inventory and value, United States, Dec. 1, 2010–2019
Year Inventory Value
Per head Total
Thousands Dollars 1,000 dollars
2010 ............................. 64,725 106.00 6,880,179 2011 ............................. 66,259 123.00 8,145,169 2012 ............................. 66,224 116.00 7,683,152 2013 ............................. 64,775 138.00 8,920,314 2014 ............................. 67,626 144.00 9,731,521 2015 ............................. 69,019 96.00 6,635,688 2016 ............................. 71,345 92.00 6,578,419 2017 ............................. 73,145 99.00 7,206,965 2018 ............................. 75,070 98.00 7,356,703 2019 ............................. 79,048 102.00 7,888,779
NASS, Livestock Branch, (202) 720–3570.
Table 7-22.—Sows farrowing and pig crop: Number, United States 2010-2019
Year Sows farrowing Pig crop
Dec.-May June-Nov. Dec.-May June-Nov. Total
Thousands Thousands Thousands Thousands Thousands
2010 ................... 5,749 5,824 55,770 57,358 113,128 2011 ................... 5,694 5,846 56,469 58,616 115,085 2012 ................... 5,759 5,810 57,749 58,906 116,655 2013 ................... 5,595 5,670 57,020 58,115 115,135 2014 ................... 5,573 5,975 53,821 60,933 114,754 2015 ................... 5,749 5,949 59,219 62,221 121,441 2016 ................... 5,898 6,098 61,256 64,651 125,907 2017 ................... 6,008 6,209 63,026 66,403 129,429 2018 ................... 6,041 6,377 64,053 68,515 132,568 2019 ................... 6,233 6,540 67,617 72,575 140,192
NASS, Livestock Branch, (202) 720–3570.
Table 7-23.—Hogs and pigs: Number for breeding and market, United States, 2010–2019
Year All hogs and pigs
Kept for breeding
Market hogs by weight groups
Under 50 pounds
50 to 119 pounds
120 to 179 pounds
180 pounds and over Total
June 1
Thousands Thousands Thousands Thousands Thousands Thousands Thousands
2010 ................ 64,650 5,788 19,224 16,832 12,154 10,653 58,862 2011 ................ 65,320 5,803 19,423 17,241 12,254 10,599 59,517 2012 ................ 66,469 5,862 19,746 17,924 12,243 10,694 60,607 2013 ................ 65,188 5,884 19,145 17,068 12,414 10,678 59,304 2014 ................ 61,468 5,855 18,254 15,801 11,471 10,086 55,613 2015 ................ 67,065 5,926 19,365 17,461 12,935 11,379 61,140 2016 ................ 69,281 5,979 20,356 18,198 13,291 11,456 63,302 2017 ................ 71,210 6,109 20,647 18,841 13,696 11,917 65,101 2018 ................ 72,231 6,320 21,081 18,846 13,898 12,085 65,911 2019 ................ 75,725 6,109 22,210 19,693 14,396 13,017 69,316
Dec. 1
Thousands Thousands Thousands Thousands Thousands Thousands Thousands
2010 ................ 64,725 5,778 18,864 16,519 12,183 11,381 58,947 2011 ................ 66,259 5,803 19,447 16,618 12,473 11,918 60,456 2012 ................ 66,224 5,819 19,299 16,752 12,614 11,741 60,405 2013 ................ 64,775 5,757 18,389 16,080 12,576 11,972 59,018 2014 ................ 67,626 5,939 19,746 17,296 13,000 11,646 61,688 2015 ................ 69,019 6,002 20,038 17,262 13,440 12,276 63,017 2016 ................ 71,345 6,110 20,862 18,077 13,711 12,585 65,235 2017 ................ 73,145 6,179 21,407 18,544 13,925 13,089 66,966 2018 ................ 75,020 6,326 21,858 19,369 14,323 13,195 68,745 2019 ................ 79,048 6,471 22,648 20,691 15,321 13,916 72,577
NASS, Livestock Branch, (202) 720–3570.

VII–16 STATISTICS OF CATTLE, HOGS, AND SHEEP
Table 7-24.—Cattle and swine: Production, 2018–2020
Country 2018 2019 2020
1,000 head
Cattle: India .......................... 68,600 69,000 69,400 Brazil ........................ 49,500 50,490 51,500 China ........................ 47,500 48,500 49,500 United States ............ 36,403 36,300 36,200 European Union ....... 28,800 28,350 28,300 Argentina .................. 14,650 14,780 14,900 Australia ................... 9,100 8,700 8,300 Mexico ...................... 7,700 7,900 8,105 Russia ...................... 6,566 6,590 6,650 New Zealand ............ 4,895 4,915 4,875 Canada ..................... 4,292 4,325 4,400 Uruguay .................... 2,750 2,700 2,810 Ukraine ..................... 2,104 2,020 1,950 Egypt ........................ 1,930 1,940 1,940 Belarus ..................... 1,400 1,400 1,400 Japan ........................ 1,224 1,225 1,230 Korea, South ............ 968 991 1,028 Turkey ...................... 3,930 0 0
Swine: China ........................ 685,000 490,000 412,000 European Union ....... 267,000 266,500 270,000 United States ............ 132,568 138,032 142,790 Russia ...................... 49,500 50,915 52,600 Brazil ........................ 40,954 42,500 44,000 Canada ..................... 28,027 28,450 28,900 Mexico ...................... 18,750 19,600 20,200 Korea, South ............ 19,118 19,530 19,415 Japan ........................ 16,690 17,000 17,030 Ukraine ..................... 8,816 8,740 8,750 Belarus ..................... 5,050 4,825 4,725
FAS, Office of Global Analysis, (202) 720-6301. Prepared or estimated on the basis of official USDA production, supply, and distribution statistics from foreign governments.
Table 7-25.—Hogs: Number slaughtered, United States, 2010–2019
Year Commercial
Farm Total Federally inspected Other Total 1
Thousands
2010 ........... 109,315 945 110,260 107 110,367 2011 ........... 109,956 904 110,860 96 110,956 2012 ........... 112,265 898 113,163 83 113,247 2013 ........... 111,248 829 112,077 84 112,161 2014 ........... 106,123 753 106,876 82 106,958 2015 ........... 114,616 810 115,425 87 115,512 2016 ........... 117,388 832 118,220 84 118,304 2017 ........... 120,516 801 121,317 73 121,390 2018 ........... 123,693 739 124,432 76 124,508 2019 ........... 129,211 702 129,913 73 129,989
1 Totals are based on unrounded number. NASS, Livestock Branch, (202) 720-3570.

VII–17 AGRICULTURAL STATISTICS 2020
Table 7-26.—Sows farrowing and pig crop: Number by State and United States, 2018–2019
State
Sows farrowing
December 1–February March–May June–August September–November
2018 2019 2018 2019 2018 2019 2018 2019
Thousands
Colorado ........... 72 78 75 78 79 79 75 76 Illinois ............... 254 270 275 275 265 290 280 285 Indiana ............. 130 125 110 120 125 120 130 125 Iowa .................. 530 530 550 530 575 550 570 540 Kansas ............. 79 86 76 86 87 90 85 92 Michigan ........... 53 56 52 54 57 55 54 56 Minnesota ......... 290 300 305 295 300 300 310 310 Missouri ............ 220 245 240 242 255 260 255 265 Nebraska .......... 180 185 190 200 185 194 195 195 North Carolina .. 445 455 455 460 485 500 475 480 Ohio .................. 91 93 88 98 89 102 99 104 Oklahoma ......... 200 205 205 215 210 230 205 220 Pennsylvania .... 48 55 50 54 51 51 52 57 South Dakota ... 113 119 110 123 117 129 127 138 Texas ............... 55 66 64 66 68 71 67 68 Utah .................. 36 40 34 43 39 44 37 41 Other States 2 ... 181 191 185 194 185 210 189 213
United States 3 2,977 3,099 3,064 3,133 3,172 3,275 3,205 3,265
State
Pig crop
December 1–February March–May June–August September–November
2018 2019 2018 2019 2018 2019 2018 2019
Thousands
Colorado ........... 698 718 720 835 751 845 720 806 Illinois ............... 2,692 2,876 2,943 2,956 2,822 3,176 2,982 3,121 Indiana ............. 1,359 1,275 1,133 1,284 1,313 1,320 1,378 1,313 Iowa .................. 5,830 5,936 6,105 6,069 6,440 6,243 6,384 6,129 Kansas ............. 806 912 768 920 948 981 927 989 Michigan ........... 567 610 567 594 616 611 567 608 Minnesota ......... 3,248 3,480 3,416 3,496 3,345 3,585 3,534 3,674 Missouri ............ 2,233 2,585 2,448 2,577 2,665 2,886 2,703 2,942 Nebraska .......... 2,106 2,137 2,147 2,300 2,091 2,260 2,233 2,282 North Carolina .. 4,406 4,505 4,596 4,830 4,996 5,250 4,821 5,064 Ohio .................. 983 995 968 1,098 970 1,153 1,049 1,186 Oklahoma ......... 2,120 2,183 2,194 2,268 2,237 2,507 2,173 2,387 Pennsylvania .... 509 594 525 599 546 576 572 638 South Dakota ... 1,294 1,410 1,287 1,470 1,299 1,529 1,480 1,656 Texas ............... 545 673 627 693 687 774 697 707 Utah .................. 277 368 258 460 429 484 370 472 Other States 2 ... 1,824 1,906 1,854 2,005 1,864 2,189 1,906 2,231
United States 3 31,497 33,163 32,556 34,454 34,019 36,369 34,496 36,205
1 December preceding year. 2 Individual State estimates not available for the 34 other States. 3 Totals may not add due to rounding.
NASS, Livestock Branch, (202) 720–3570.

VII–18 STATISTICS OF CATTLE, HOGS, AND SHEEP
Table 7-27.—Hogs: Production, disposition, cash receipts, and gross income, United States, 2010–2019
Year Mar-ketings 1
Inship ments 2
Farm slaugh-
ter 3
Production (live
weight) 4
Value of produc-
tion 5
Cash receipts 6
Value of home
consump-tion
Gross income
Average price per
100 pounds received
by farmers
1,000 1,000 1,000 1,000 1,000 1,000 1,000 1,000 head head head pounds dollars dollars dollars dollars Dollars
2010 ............. 144,362 40,004 107 30,284,630 16,012,200 17,898,063 38,306 17,936,369 55.10 2011 ............. 145,420 40,522 96 30,836,171 20,014,277 21,631,894 44,004 21,675,898 66.50 2012 ............. 151,835 44,027 83 32,060,619 20,285,027 22,092,108 40,007 22,132,115 64.20 2013 ............. 154,923 47,864 73 32,524,986 21,611,356 23,706,457 37,428 23,743,885 67.20 2014 ............. 149,097 47,185 82 32,126,235 24,183,766 26,489,394 43,550 26,532,944 77.10 2015 ............. 159,724 50,146 87 34,739,292 18,814,459 20,552,958 31,982 20,584,940 53.50 2016 ............. 165,538 52,954 84 35,898,712 17,363,044 19,037,752 28,797 19,066,549 49.60 2017 ............. 171,320 55,266 73 36,962,875 19,159,248 21,038,034 29,273 21,067,307 53.60 2018 ............. 180,251 61,619 76 38,498,011 18,769,964 20,881,335 27,267 20,908,602 49.90 2019 ............. 187,648 63,297 76 40,509,010 19,826,838 22,015,189 28,146 22,043,335 51.90
1 Includes custom slaughter for use on farms where produced and State outshipments, but excludes interfarm sales within the State. 2 Includes hogs and pigs shipped in from other states but excludes animals for immediate slaugh-ter. 3 Excludes custom slaughter for farmers at commercial establishments. 4 Adjustments made for changes in inventory and for inshipments. 5 Includes allowance for higher average price of State inshipments and outshipments of feeder pigs. 6 Receipts from marketings and sale of farm slaughter.
NASS Livestock Branch, (202) 720–3570.
Table 7-28.—Hogs: Direct receipts at interior markets, 2010–2019
Year
All receipts (live and carcass basis)
National Iowa/ Southern Minnesota 1 Western Region Eastern Region
Thousands Thousands Thousands Thousands
2010 ................ 75,104 40,143 48,413 22,896 2011 ................ 75,514 41,479 49,649 22,643 2012 ................ 75,459 42,343 50,607 22,192 2013 ................ 71,599 40,744 48,202 20,929 2014 ................ 73,182 41,687 49,180 21,341 2015 ................ 78,212 44,997 53,076 22,298 2016 ................ 80,716 26,315 32,247 15,922
Number Number Number Number
2017 ................ 2,912,345 1,607,503 1,763,741 1,145,350 2018 ................ 3,163,846 1,675,816 1,521,595 1,068,483 2019 2 .............. 2,845,278 (NA) (NA) (NA)
(NA) Not available. 1 Iowa / Southern Minnesota is a subset of the Western Region. 2 Due to confidentiality rules, these numbers are now only tracked on a national basis.
AMS, Livestock & Grain Market News, (202) 720–7316.
Table 7-29.—Hogs and corn: Hog-corn price ratio and average price received by farmers for corn, United States, 2010–2019 1 2
Year Hog-corn price ratio 1 Price of corn per bushel 2
Dollars
2010 ................ 14.4 3.83 2011 ................ 11.0 6.02 2012 ................ 9.6 6.67 2013 ................ 11.3 6.15 2014 ................ 18.9 4.11 2015 ................ 14.5 3.70 2016 ................ 14.2 3.48 2017 ................ 15.9 3.36 2018 ................ 14.4 3.47 2019 ................ 13.8 3.75
1 Number of bushels of corn equal in value to buy 100 pounds of live hogs at local markets, based on average prices re-ceived by farmers for hogs and corn. Annual average is a simple average of monthly ratios for the calendar year. 2 Annual average is a simple average of monthly prices for the calendar year.
NASS, Environmental, Economics, and Demographics Branch, (202) 720–6146.

VII–19 AGRICULTURAL STATISTICS 2020
Table 7-30.—Hogs: Production, disposition, cash receipts, and gross income, by State and United States, 2019
State Mar-ketings 1
Inship ments 2
Farm slaugh-
ter 3
Production (live
weight) 4
Value of production 5
Cash receipts 5 6
Value of home
consump-tion
Gross income
1,000 1,000 1,000 1,000 1,000 1,000 1,000 1,000 head head head pounds dollars dollars dollars dollars
Alabama ........... 211.0 43.0 0.5 27,958 16,595 20,170 283 18,369 Alaska .............. 3.2 1.3 0.8 982 539 324 109 615 Arizona ............. 276.5 3.0 1.0 67,654 39,957 36,790 294 40,853 Arkansas .......... 1,040.0 21.0 1.0 65,205 51,980 60,345 392 57,411 California .......... 181.0 144.0 3.0 39,830 18,393 27,453 612 27,191 Colorado .......... 3,208.0 140.0 2.0 293,229 176,024 140,519 302 183,910 Connecticut ...... 5.2 1.2 0.1 1,384 672 397 25 693 Delaware .......... 40.0 1.0 0.1 9,869 5,084 3,808 47 5,058 Florida .............. 31.5 9.0 0.5 3,729 1,994 1,836 150 2,415 Georgia ............ 552.0 202.0 2.0 57,982 30,776 39,986 538 36,827 Hawaii .............. 1.7 0.1 1.6 1,044 613 485 180 478 Idaho ................ 108.1 29.2 1.0 28,333 15,854 16,056 294 17,268 Illinois ............... 12,880.0 1,394.0 3.0 2,196,434 1,184,193 1,209,683 825 1,228,867 Indiana ............. 10,063.0 5,493.0 2.0 2,235,725 1,029,649 1,199,559 839 1,239,617 Iowa ................. 54,732.0 35,800.0 5.0 14,455,917 6,651,649 7,616,470 2,099 7,772,961 Kansas ............. 5,245.0 2,023.0 1.0 1,048,275 485,277 518,816 429 549,481 Kentucky .......... 1,003.0 243.0 4.0 194,995 110,057 114,816 1,208 115,567 Louisiana .......... 6.0 4.0 0.5 919 509 865 71 689 Maine ............... 5.8 1.5 0.1 1,436 686 1,088 58 792 Maryland .......... 48.1 13.5 0.1 9,917 4,839 6,809 38 5,939 Massachusetts 15.0 2.5 0.1 3,236 1,608 1,825 25 1,673 Michigan ........... 2,476.0 198.0 2.0 635,011 325,244 502,505 590 330,083 Minnesota ........ 22,302.0 9,600.0 3.0 4,777,656 2,328,552 2,514,681 1,202 2,724,246 Mississippi ........ 995.0 4.0 4.0 61,289 41,421 59,299 695 41,783 Missouri ............ 12,240.9 1,548.9 2.0 1,656,302 866,479 788,932 1,060 927,228 Montana ........... 668.0 5.0 2.0 120,614 69,822 56,717 476 70,255 Nebraska .......... 8,805.0 604.0 3.0 1,509,174 853,620 813,183 1,352 873,673 Nevada ............. 3.4 2.3 0.1 648 289 181 28 530 New Hampshire 6.2 1.5 0.1 1,656 796 866 73 883 New Jersey ...... 13.4 7.5 0.1 1,027 229 616 76 743 New Mexico ..... 5.9 3.8 0.2 957 464 680 52 614 New York ......... 88.3 54.0 0.5 1,432 2,285 6,851 224 6,374 North Carolina .. 17,968.0 660.0 1.0 4,361,099 2,076,752 2,129,121 626 2,174,162 North Dakota .... 937.6 143.1 0.3 44,904 41,872 56,962 84 60,660 Ohio ................. 4,916.0 1,100.0 6.0 1,331,230 623,182 667,969 2,973 677,872 Oklahoma ......... 9,433.0 725.0 2.0 2,035,654 921,129 938,522 408 976,075 Oregon ............. 7.3 1.0 1.0 2,170 1,849 1,624 283 1,180 Pennsylvania .... 2,402.7 225.0 3.3 642,821 272,183 275,440 787 330,148 Rhode Island .... 2.6 0.1 0.1 638 277 275 22 322 South Carolina 215.0 77.0 1.0 40,077 17,800 17,153 873 24,115 South Dakota ... 6,860.0 1,250.0 2.0 1,153,511 530,360 585,716 1,385 731,300 Tennessee ....... 648.0 170.0 2.0 160,384 72,280 79,520 574 89,496 Texas ............... 3,232.0 685.0 6.0 487,749 225,405 230,092 2,151 244,389 Utah ................. 1,413.8 73.3 0.5 292,364 128,244 123,783 136 166,359 Vermont ........... 6.1 1.0 0.2 1,624 1,057 1,095 91 867 Virginia ............. 451.0 430.0 2.0 109,527 29,561 43,580 647 61,929 Washington ...... 25.9 1.5 1.0 6,706 4,270 3,972 416 4,016 West Virginia .... 6.0 0.4 0.2 1,549 750 795 102 885 Wisconsin ......... 1,158.5 155.0 1.0 218,375 112,135 122,706 683 150,741 Wyoming .......... 704.0 1.0 1.0 108,809 57,287 57,122 307 65,674
United States ... 187,647.7 63,296.7 76.0 40,509,010 19,060,203 21,098,058 21,794 22,043,335
- Represents zero. (D)Withheld to avoid disclosing data for individual operations. 1 Includes custom slaughter for use on farms where produced and State outshipments,but excludes interfarm sales within the State. 2 Includes hogs and pigs shipped in from other states but excludes animals for immediate slaughter. 3 Excludes custom slaughter for farmers at commercial establishments. 4 Adjustments made for changes in inventory and for inshipments. 5 Includes allowance for higher average price of State inshipments and outshipments of feeder pigs. 6 Receipts from marketings and sale of farm- slaughter.
NASS, Livestock Branch, (202) 720–3570.

VII–20 STATISTICS OF CATTLE, HOGS, AND SHEEP
Table 7-31.—Hogs: Number slaughtered commercially, total and average live weight, by State and United States, 2018 1
State Number slaughtered Total live weight 2 Average live weight 2
Thousands 1,000 pounds Pounds
Alabama ....................... 37.9 15,514 410 Alaska ........................... 1.4 377 269 Arizona ......................... (D) (D) (D) Arkansas ....................... 7.2 1,916 266 California ...................... 2,133.4 539,959 253 Colorado ....................... 20.1 4,933 245 Delaware & Maryland ... 19.3 5,022 261 Florida ........................... 59.0 7,369 125 Georgia ......................... 63.6 15,468 243 Hawaii ........................... 4.6 1,135 246 Idaho ............................. 167.6 44,741 267 Illinois ............................ 12,242.9 3,494,184 285 Indiana .......................... 8,573.9 2,373,289 277 Iowa .............................. 35,033.5 9,908,595 283 Kansas .......................... (D) (D) (D) Kentucky ....................... (D) (D) (D) Louisiana ...................... 9.3 1,994 215 Michigan ....................... 2,439.2 711,942 292 Minnesota ..................... 11,846.5 3,246,540 274 Mississippi .................... 37.6 6,109 163 Missouri ........................ 9,049.3 2,612,590 289 Montana ........................ 16.8 4,662 277 Nebraska ...................... 7,873.1 2,216,027 282 Nevada ......................... 1.1 295 267 New England 3 .............. 35.3 9,287 264 New Jersey ................... 102.7 10,222 100 New Mexico .................. 2.6 698 270 New York ...................... 28.2 6,771 240 North Carolina .............. (D) (D) (D) North Dakota ................ 4.0 1,175 292 Ohio .............................. 896.1 253,597 284 Oklahoma ..................... 5,622.0 1,561,561 278 Oregon .......................... 166.3 44,317 267 Pennsylvania ................ 3,351.2 923,584 276 South Carolina .............. 33.9 8,157 241 South Dakota ................ (D) (D) (D) Tennessee .................... 803.8 363,307 453 Texas ............................ 291.4 71,968 247 Utah .............................. 58.4 10,286 177 Virginia .......................... (D) (D) (D) Washington ................... 12.1 3,137 259 West Virginia ................ 8.8 2,513 285 Wisconsin ..................... 732.3 319,256 437 Wyoming ....................... 3.6 964 267
United States 4 .............. 124,435.3 35,232,964 283
(D) Withheld to avoid disclosing data for individual operations. 1 Includes slaughter in federally inspected and other slaughter plants; excludes animals slaughtered on farms. Average live weight is based on unrounded numbers. Totals may not add due to rounding. 2 Excludes postmortem condemnations. 3 Connecticut, Maine, Massachusetts, New Hampshire, Rhode Island, and Vermont. 4 States with no data printed are still included in US total. Data are not printed to avoid dis-closing individual operations.
NASS, Livestock Branch, (202) 720-3570.

VII–21 AGRICULTURAL STATISTICS 2020
Table 7-32.—Hogs: Number slaughtered, average dressed and live weights, Federally inspected, 2010–2019 1
Year
Federally inspected
Barrows and gilts Sows
Head Percent of total Avg. dressed weight 2 Head Percent of total Avg. dressed
weight 2
1,000 Pounds 1,000 Pounds 2010 ........... 105,983 97.0 201 2,966 2.7 305 2011 ........... 106,600 96.9 203 3,027 2.8 305 2012 ........... 108,912 97.0 203 3,009 2.7 306 2013 ........... 107,965 97.0 205 2,932 2.6 304 2014 ........... 102,998 97.1 212 2,788 2.6 305 2015 ........... 111,488 97.3 210 2,852 2.5 309 2016 ........... 114,184 97.3 209 2,885 2.5 310 2017 ........... 117,195 97.2 209 2,952 2.4 308 2018 ........... 120,303 97.3 209 3,015 2.4 305 2019 ........... 125,844 97.3 211 3,015 2.4 305
Year
Boars Total
Head Percent of total Avg. dressed weight 2 Head Avg. dressed
weight 2 Avg. live weight 2
1,000 Pounds 1,000 Pounds Pounds 2009 ........... 419 0.4 199 112,613 203 271 2010 ........... 366 0.3 200 109,315 204 273 2011 ........... 329 0.3 210 109,956 206 275 2012 ........... 344 0.3 208 112,265 206 275 2013 ........... 351 0.3 204 111,248 207 277 2014 ........... 337 0.3 204 106,123 214 285 2015 ........... 276 0.2 207 114,616 213 283 2016 ........... 319 0.3 206 117,388 211 282 2017 ........... 370 0.3 201 120,516 211 283 2018 ........... 376 0.3 192 123,696 212 283
1 All weights calculated using unrounded totals. Totals and percentages based on unrounded data and may not equal sum of classes due to rounding. 2 Excludes postmortem condemnations.
NASS, Livestock Branch, (202) 720-3570.
Table 7-33.—Lard: Supply and disappearance, United States, 2009–2018
Calendar year
Supply Disappearance
Stocks Jan 1 Production Imports Total Domestic Exports Total
Million lbs Million lbs Million lbs Million lbs Million lbs Million lbs Million lbs
2009 ......... 12 860 17 889 788 83 871 2010 ......... 18 840 15 873 776 72 847 2011 ......... 26 852 13 891 794 77 871 2012 ......... 20 871 14 905 830 55 885 2013 ......... 20 867 14 901 820 61 881 2014 ......... 20 857 16 894 822 52 874 2015 ......... 20 902 14 936 881 47 928 2016 ......... 9 932 10 951 901 42 943 2017 ......... 8 959 13 980 935 38 973 2018 ......... 7 987 15 1,008 965 37 1,002
ERS, Market and Trade Economics Division, Field Crops Branch, (202) 694–5300.

VII–22 STATISTICS OF CATTLE, HOGS, AND SHEEP
Table 7-34.—Lard: United States exports by country of destination, 2017–2019
Country 2017 2018 2019
Metric tons
Mexico ........................................................ 15,876 16,173 22,115 Canada ...................................................... 605 264 259 Ireland ........................................................ 97 98 63 Marshall Islands ......................................... 153 118 55 Singapore ................................................... 0 12 10 Micronesia .................................................. 5 4 3 Argentina .................................................... 4 0 0 Brazil .......................................................... 18 1 0 Chile ........................................................... 0 14 0 Dominican Republic ................................... 1 0 0 Guatemala ................................................. 29 0 0 Guyana ...................................................... 0 24 0 Japan ......................................................... 43 0 0 Korea, South .............................................. 346 0 0 Norway(*) ................................................... 0 72 0 Netherlands Antilles(*) ............................... 4 2 0 Philippines .................................................. 0 37 0 Spain .......................................................... 0 5 0 Leeward-Windward Islands(*) .................... 0 3 0
World Total ................................................ 17,181 16,825 22,506
(*) Denotes a country that is a summarization of its component countries. FAS, Office of Global Analysis, (202) 720-6301. Data Source: U.S. Census Bureau Trade Data,as of March 17, 2020.
Table 7-35.—Sheep and lambs: Inventory and value, United States, Jan. 1, 2009–2018
Year Inventory Value
Per head Total
1,000 head Dollars 1,000 dollars
2009 ............................. 5,747 133.00 765,194 2010 ............................. 5,620 135.00 761,115 2011 ............................. 5,470 170.00 929,453 2012 ............................. 5,375 221.00 1,187,730 2013 ............................. 5,360 177.00 951,020 2014 ............................. 5,235 188.00 982,316 2015 ............................. 5,270 214.00 1,127,157 2016 ............................. 5,295 202.00 1,071,467 2017 ............................. 5,270 203.00 1,067,857 2018 ............................. 5,265 204.00 1,071,378
NASS, Livestock Branch, (202) 720–3570.
Table 7-36.—Sheep and lambs: Number by class, United States, Jan. 1, 2009–2018
Year All sheep and lambs
Breeding sheep
Total 1 Replacement lambs 1 year and over
Ewes Rams
1,000 head 1,000 head 1,000 head 1,000 head 1,000 head
2009 ......... 5,747 4,247 647 3,405 196 2010 ......... 5,620 4,185 655 3,335 195 2011 ......... 5,470 4,070 665 3,215 190 2012 ......... 5,375 3,995 660 3,165 170 2013 ......... 5,360 3,985 670 3,135 180 2014 ......... 5,235 3,890 635 3,080 175 2015 ......... 5,270 3,925 650 3,100 175 2016 ......... 5,295 3,940 665 3,100 175 2017 ......... 5,270 3,894 666 3,058 170 2018 ......... 5,265 3,865 662 3,033 170
1 Categories may not add to total due to rounding. NASS, Livestock Branch, (202) 720–3570.

VII–23 AGRICULTURAL STATISTICS 2020
Table 7-37.—Lamb mutton, goat, etc. meat: U.S. imports, 2017–2019
Country 2017 2018 2019
Metric tons
Australia(*) ................................................. 92,426 97,356 100,917 New Zealand(*) .......................................... 28,034 26,010 24,465 Canada ...................................................... 1,103 1,200 1,031 Mexico ........................................................ 169 370 917 Chile ........................................................... 1,038 539 504 Uruguay ..................................................... 14 197 188 Iceland ....................................................... 227 203 1 China .......................................................... 0 26 0 Denmark(*) ................................................. 0 - 0 Mozambique .............................................. 0 19 0 World Total ................................................ 123,010 125,919 128,022
(*) Denotes a country that is a summarization of its component countries. Users should use cautious interpretation on quantity reports using mixed units of measure. Quantity line items will only include statistics on the units of measure that are equal to, or are able to be converted to, the assigned unit of measure of the grouped commodities.
FAS, Office of Global Analysis, (202) 720-6301. Data Source: U.S. Census Bureau Trade Data.
Table 7-38.—Breeding sheep: Number by class, State and United States, Jan. 1, 2017–2018
State
Under one year old One year and over
Replacement lambs Ewes Rams
2017 2018 2017 2018 2017 2018
1,000 head
Arizona ................ 23.0 18.0 68.0 67.0 6.0 5.0 California .............. 45.0 45.0 275.0 260.0 10.0 10.0 Colorado .............. 34.0 33.0 160.0 156.0 6.0 6.0 Idaho .................... 41.0 39.0 138.0 141.0 5.0 5.0 Illinois ................... 8.0 8.0 36.0 36.0 2.0 2.0 Indiana ................. 7.0 8.0 38.0 38.0 4.0 4.0 Iowa ..................... 20.0 19.0 95.0 91.0 5.0 5.0 Kansas ................. 7.0 6.0 36.0 34.0 2.0 2.0 Kentucky .............. 7.0 8.0 33.0 36.0 2.0 2.0 Michigan .............. 14.0 13.0 44.0 41.0 3.0 3.0 Minnesota ............ 14.0 12.0 72.0 74.0 5.0 4.0 Missouri ............... 13.0 14.0 59.0 63.0 3.0 3.0 Montana ............... 35.0 39.0 159.0 150.0 6.0 6.0 Nebraska ............. 10.0 9.0 58.0 55.0 3.0 3.0 Nevada ................ 9.0 9.0 43.0 43.0 2.0 2.0 New England 1 ..... 8.0 8.0 27.0 30.0 2.0 2.0 New Mexico ......... 18.0 16.0 59.0 58.0 5.0 6.0 New York ............. 13.0 13.0 51.0 55.0 3.0 3.0 North Carolina ..... 4.0 3.0 19.0 16.0 2.0 2.0 North Dakota ....... 8.0 8.0 42.0 39.0 2.0 2.0 Ohio ..................... 16.0 16.0 70.0 73.0 6.0 6.0 Oklahoma ............ 7.0 8.0 29.0 31.0 2.0 3.0 Oregon ................. 18.0 20.0 101.0 94.0 5.0 6.0 Pennsylvania ....... 11.0 13.0 59.0 60.0 5.0 5.0 South Dakota ....... 31.0 31.0 146.0 153.0 6.0 6.0 Tennessee ........... 6.0 7.0 29.0 29.0 3.0 2.0 Texas ................... 95.0 100.0 440.0 465.0 35.0 35.0 Utah ..................... 42.0 42.0 205.0 200.0 8.0 8.0 Virginia ................. 9.0 9.0 49.0 45.0 3.0 3.0 Washington .......... 9.0 6.0 28.0 27.0 2.0 2.0 West Virginia ....... 4.0 4.0 23.0 23.0 1.0 1.0 Wisconsin ............ 12.0 12.0 48.0 48.0 3.0 3.0 Wyoming .............. 43.0 43.0 225.0 210.0 7.0 7.0 Other States 2 ...... 25.0 23.0 94.0 92.0 6.0 6.0
United States ....... 666.0 662.0 3,058.0 3,033.0 170.0 170.0
1 New England includes Connecticut, Maine, Massachusetts, New Hampshire, Rhode Island, and Vermont. 2 Individual state estimates not available for states not shown, but are included in Other States.
NASS, Livestock Branch, (202) 720–3570.

VII–24 STATISTICS OF CATTLE, HOGS, AND SHEEP
Table 7-39.—Sheep and lambs: Average price per 100 pounds at San Angelo, 2010–2019 1
Year
Sheep Slaughter lambs choice & prime
Good Utility Cull Wooled Shorn
90-110 lbs 110-130 1bs 90-110 lbs 110-130 1bs
2010 .................. 59.51 59.50 41.12 114.66 115.12 115.18 115.68 2011 .................. 66.22 66.62 41.43 161.09 161.08 161.53 161.24 2012 .................. 64.30 65.80 42.84 113.64 114.01 114.56 114.68 2013 .................. 47.68 49.68 28.21 107.34 107.50 107.44 107.69 2014 .................. 65.66 67.88 43.76 157.08 157.14 157.19 157.30 2015 .................. 79.11 80.63 54.70 143.97 143.97 144.02 144.12 2016 .................. 72.12 75.37 45.63 135.18 135.28 135.24 135.58 2017 .................. 76.86 77.14 47.63 140.98 140.74 141.07 141.01 2018 .................. 65.13 67.16 40.52 126.58 125.48 134.63 133.50 2019 .................. 72.96 74.84 42.64 133.03 133.71 133.03 133.67
1 Simple average of monthly bulk-of-sales prices from data of the livestock reporting service. AMS, Livestock & Grain Market News, (202) 720–7316.
Table 7-40.—Sheep and lambs: Number of breeding and market sheep, by State and United States, Jan. 1, 2017–2018
State Breeding sheep and lambs Market sheep and lambs
2017 2018 2017 2018
1,000 head 1,000 head 1,000 head 1,000 head
Arizona ...................... 97.0 90.0 33.0 35.0 California .................... 330.0 315.0 270.0 255.0 Colorado .................... 200.0 195.0 220.0 250.0 Idaho .......................... 184.0 185.0 66.0 50.0 Illinois ......................... 46.0 46.0 9.0 9.0 Indiana ....................... 49.0 50.0 7.0 7.0 Iowa ........................... 120.0 115.0 55.0 50.0 Kansas ....................... 45.0 42.0 23.0 25.0 Kentucky .................... 42.0 46.0 11.0 12.0 Michigan .................... 61.0 57.0 24.0 23.0 Minnesota .................. 91.0 90.0 39.0 40.0 Missouri ..................... 75.0 80.0 20.0 20.0 Montana ..................... 200.0 195.0 30.0 30.0 Nebraska ................... 71.0 67.0 12.0 13.0 Nevada ...................... 54.0 54.0 9.0 7.0 New England 1 ........... 37.0 40.0 10.0 9.0 New Mexico ............... 82.0 80.0 15.0 16.0 New York ................... 67.0 71.0 13.0 14.0 North Carolina ........... 25.0 21.0 5.0 6.0 North Dakota ............. 52.0 49.0 14.0 21.0 Ohio ........................... 92.0 95.0 25.0 24.0 Oklahoma .................. 38.0 42.0 10.0 12.0 Oregon ....................... 124.0 120.0 46.0 45.0 Pennsylvania ............. 75.0 78.0 18.0 18.0 South Dakota ............. 183.0 190.0 57.0 60.0 Tennessee ................. 38.0 38.0 8.0 8.0 Texas ......................... 570.0 600.0 140.0 150.0 Utah ........................... 255.0 250.0 20.0 25.0 Virginia ....................... 61.0 57.0 19.0 18.0 Washington ................ 39.0 35.0 9.0 10.0 West Virginia ............. 28.0 28.0 6.0 7.0 Wisconsin .................. 63.0 63.0 13.0 12.0 Wyoming .................... 275.0 260.0 85.0 85.0 Other States 2 ............ 125.0 121.0 35.0 34.0
United States ............. 3,984.0 3,865.0 1,376.0 1,400.0
1 New England includes Connecticut, Maine, Massachusetts, New Hampshire, Rhode Island, and Vermont. 2 Includes data for States not published in this table.
NASS, Livestock Branch, (202) 720–3570.

VII–25 AGRICULTURAL STATISTICS 2020
Table 7-41.—Lamb crop: Per 100 ewes 1+, number and percent of previous year, by State and United States, 2016–2017
State
Breeding ewes 1 year & older, Jan. 1
Lambs per 100 ewes, Jan. 1
Lamb crop 1
2017 2018 2017 2018 2017 2018 2018 as % of 2017
1,000 head 1,000 head Number Number 1,000 head 1,000 head Percent
Arizona .............................. 68 67 60 66 41 44 107 California ........................... 275 260 85 90 235 235 100 Colorado ........................... 160 156 116 119 185 185 100 Idaho ................................. 138 141 116 113 160 160 100 Illinois ................................ 36 36 119 114 43 41 95 Indiana .............................. 38 38 121 121 46 46 100 Iowa .................................. 95 91 121 121 115 110 96 Kansas .............................. 36 34 119 129 43 44 102 Kentucky ........................... 33 36 106 103 35 37 106 Michigan ........................... 44 41 111 122 49 50 102 Minnesota ......................... 72 74 125 122 90 90 100 Missouri ............................ 59 63 132 124 78 78 100 Montana ............................ 159 150 119 120 190 180 95 Nebraska .......................... 58 55 121 118 70 65 93 Nevada ............................. 43 43 79 88 34 38 112 New England 2 .................. 27 30 122 117 33 35 106 New Mexico ...................... 59 58 76 83 45 48 107 New York .......................... 51 55 114 104 58 57 98 North Carolina .................. 19 16 95 106 18 17 94 North Dakota .................... 42 39 117 115 49 45 92 Ohio .................................. 70 73 126 121 88 88 100 Oklahoma ......................... 29 31 114 103 33 32 97 Oregon .............................. 101 94 114 120 115 113 98 Pennsylvania .................... 59 60 114 110 67 66 99 South Dakota .................... 146 153 134 131 195 200 103 Tennessee ........................ 29 29 121 114 35 33 94 Texas ................................ 440 465 82 78 360 365 101 Utah .................................. 205 200 112 118 230 235 102 Virginia .............................. 49 45 120 131 59 59 100 Washington ....................... 28 27 107 119 30 32 107 West Virginia .................... 23 23 117 113 27 26 96 Wisconsin ......................... 48 48 119 119 57 57 100 Wyoming ........................... 225 210 104 114 235 240 102 Other States 3 ................... 94 92 87 91 82 84 102
United States .................... 3,058 3,033 106 107 3,230 3,235 100
1 Lamb crop is defined as lambs born in the Eastern States and lambs docked or branded in the Western States. 2 New England includes Connecticut, Maine, Massachusetts, New Hampshire, Rhode Island, and Vermont. 3 Includes data for States not published in this table.
NASS, Livestock Branch, (202) 720–3570.
Table 7-42.—Sheep and lambs: Receipts at selected markets, 2010–2019
Year Sioux Falls, SD Billings, MT San Angelo, TX New Holland,PA
Thousands Thousands Thousands Thousands
2010 ..................... 41 48 143 92 2011 ..................... 38 42 156 94 2012 ..................... 35 53 89 101 2013 ..................... 48 52 110 109 2014 ..................... 52 49 107 107 2015 ..................... 82 63 110 117 2016 ..................... 57 54 129 133 2017 ..................... 62 61 141 123 2018 ..................... 69 52 143 142 2019 ..................... 55 56 160 38
AMS, Livestock & Grain Market News, (202) 720–7316.

VII–26 STATISTICS OF CATTLE, HOGS, AND SHEEP
Table 7-43.—Sheep and lambs: Number slaughtered, United States, 2009–2018
Year
Commercial
Farm Total Federally inspected Other Total 1
Thousands Thousands Thousands Thousands Thousands
2009 ..................... 2,323 193 2,516 95 2,611 2010 ..................... 2,261 196 2,458 95 2,553 2011 ..................... 2,000 164 2,164 93 2,258 2012 ..................... 2,012 171 2,183 93 2,275 2013 ..................... 2,120 199 2,319 94 2,412 2014 ..................... 2,105 205 2,310 95 2,404 2015 ..................... 1,998 225 2,224 95 2,319 2016 ..................... 2,010 228 2,238 95 2,333 2017 ..................... 1,937 241 2,178 96 2,274 2018 ..................... 2,000 265 2,265 92 2,357
1 Totals are based on unrounded numbers. NASS, Livestock Branch, (202) 720–3570.
Table 7-44.—Sheep and lambs: Number slaughtered, average dressed and live weights, percentage distribution, by class, Federally inspected, 2009–2018 1
Year
Federally inspected
Lambs and yearlings Mature sheep Total
Head Percent of total
Avg. dressed weight 2
Head Percent of total
Avg. dressed weight 2
Head Avg.
dressed weight 2
Avg. live weight 2
1,000 Pounds 1,000 Pounds 1,000 Pounds
2009 ............ 2,165 93.2 70 158 6.8 64 2,323 70 139 2010 ............ 2,105 93.1 69 156 6.9 65 2,261 68 137 2011 ............ 1,860 93.0 71 141 7.0 66 2,000 70 141 2012 ............ 1,869 92.9 74 143 7.1 64 2,012 74 147 2013 ............ 1,988 93.7 69 133 6.3 64 2,120 69 137 2014 ............ 1,968 93.5 69 136 6.5 66 2,105 69 137 2015 ............ 1,885 94.3 70 113 5.7 67 1,998 70 139 2016 ............ 1,902 94.6 69 108 5.4 67 2,010 69 137 2017 ............ 1,836 94.8 68 102 5.2 67 1,937 68 136 2018 ............ 1,893 94.7 70 107 5.3 67 2,000 70 139
1 All percents and weights calculated using unrounded totals. 2 Excludes postmortem condemnations. NASS, Livestock Branch, (202) 720–3570.

VII–27 AGRICULTURAL STATISTICS 2020
Table 7-45.—Sheep and lambs: Number slaughtered commercially, total and average live weight, by State and United States, 2018 1
State Number slaughtered Total live weight Average live weight 2
Thousands 1,000 pounds Pounds
Alabama ..................... 0 .8 67 84 Alaska ........................ (Y) (Y) (Y) Arizona ....................... (D) (D) (D) Arkansas .................... 0 .4 41 101 California .................... 321 .4 48,535 151 Colorado .................... 738 .0 124,656 169 Delaware-Maryland .... 46 .0 4,292 93 Florida ........................ 15 .0 853 57 Georgia ...................... 23 .2 1,511 65 Hawaii ........................ 1 .4 177 131 Idaho .......................... 2 .5 349 141 Illinois ......................... 56 .6 5,259 93 Indiana ....................... 46 .4 5,485 118 Iowa ........................... 2 .7 446 166 Kansas ....................... 5 .1 513 100 Kentucky .................... 16 .9 2,115 125 Louisiana ................... 3 .8 224 59 Michigan .................... 215 .5 30,695 142 Minnesota .................. 4 .8 491 102 Mississippi ................. 10 .2 626 61 Missouri ..................... 10 .9 931 86 Montana ..................... 4 .8 672 141 Nebraska ................... 0 .6 86 135 Nevada ...................... 1 .2 173 146 New England 3 ........... 32 .4 3,110 96 New Jersey ................ 153 .9 12,036 78 New Mexico ............... 8 .7 1,274 148 New York ................... 61 .8 6,232 101 North Carolina ........... 14 .3 1,047 73 North Dakota ............. 0 .5 71 138 Ohio ........................... 53 .6 8,282 155 Oklahoma .................. 8 .2 937 115 Oregon ....................... 47 .2 6,782 144 Pennsylvania ............. 88 .0 9,140 104 South Carolina ........... (D) (D) (D) South Dakota ............. 3 .8 562 147 Tennessee ................. 10 .5 713 68 Texas ......................... 145 .4 12,860 88 Utah ........................... 21 .0 2,902 138 Virginia ....................... 9 .7 709 73 Washington ................ 16 .3 2,243 138 West Virginia ............. (D) (D) (D) Wisconsin .................. 38 .1 6,209 163 Wyoming .................... 1 .1 160 140
United States ............. 2,265 .0 306,319 135
(D) Withheld to avoid disclosing data for individual operations. (Y) Less than level of precision shown. 1 Includes slaugh-ter in federally inspected and in other slaughter plants; exludes animals slaughtered on farms. Excludes postmortem con-demnations. 2 Averages are based on unrounded data. 3 New England includes Connecticut, Maine, Massachusetts, New Hampshire, Rhode Island, and Vermont.
NASS, Livestock Branch, (202) 720–3570.

VII–28 STATISTICS OF CATTLE, HOGS, AND SHEEP
Table 7-46.—Sheep and lambs: Inventory Jan 1, 2017–2018, and number of operations, 2017, by State and United States 1
State January 1 Sheep inventory Operations with sheep 2
2017 2018 2017
1,000 head 1,000 head Number
Alabama .............................. ................................................ ................................................ 1,062 Alaska ................................. ................................................ ................................................ 49 Arizona ............................... 130 125 7,509 Arkansas ............................. ................................................ ................................................ 1,053 California ............................. 600 570 3,807 Colorado ............................. 420 445 1,731 Connecticut ......................... ................................................ ................................................ 428 Delaware ............................. ................................................ ................................................ 89 Florida ................................. ................................................ ................................................ 1,666 Georgia ............................... ................................................ ................................................ 1,208 Hawaii ................................. ................................................ ................................................ 548 Idaho ................................... 250 235 1,447 Illinois .................................. 55 55 1,870 Indiana ................................ 56 57 2,316 Iowa .................................... 175 165 2,801 Kansas ................................ 68 67 1,234 Kentucky ............................. 53 58 2,818 Louisiana ............................ ................................................ ................................................ 785 Maine .................................. ................................................ ................................................ 738 Maryland ............................. ................................................ ................................................ 925 Michigan ............................. 85 80 728 Minnesota ........................... 130 130 2,483 Mississippi .......................... ................................................ ................................................ 2,248 Missouri .............................. 95 100 748 Montana .............................. 230 225 3,103 Nebraska ............................ 83 80 1,383 Nevada ............................... 63 61 1,153 New England 3 .................... 47 49 328 New Hampshire .................. ................................................ ................................................ 502 New Jersey ......................... ................................................ ................................................ 1,047 New Mexico ........................ 97 96 4,047 New York ............................ 80 85 2,113 North Carolina .................... 30 27 1,679 North Dakota ...................... 66 70 573 Ohio .................................... 117 119 4,123 Oklahoma ........................... 48 54 2,216 Oregon ................................ 170 165 3,263 Pennsylvania ...................... 93 96 3,749 Rhode Island ...................... ................................................ ................................................ 108 South Carolina .................... ................................................ ................................................ 738 South Dakota ...................... 240 250 1,337 Tennessee .......................... 46 46 2,503 Texas .................................. 710 750 14,672 Utah .................................... 275 275 1,898 Vermont .............................. ................................................ ................................................ 704 Virginia ................................ 80 75 2,646 Washington ......................... 48 45 2,281 West Virginia ...................... 34 35 1,226 Wisconsin ........................... 76 75 2,845 Wyoming ............................. 360 345 859 Other States 4 ..................... 160 155 ................................................
United States ...................... 5,270 5,265 101,387
1 An operation is any place having one or more head of sheep on hand December 31. 2 State level estimates only avail-able in conjunction with the Census of Agriculture every 5 years. 3 New England includes Connecticut, Maine, Massachu-setts, New Hampshire, Rhode Island, and Vermont. 4 Includes data for States not published in this table.
NASS, Livestock Branch, (202) 720–3570.

VII–29 AGRICULTURAL STATISTICS 2020
Table 7-47.—Wool: Number of sheep shorn, weight per fleece, production, average price per pound received by farmers, value of production, exports, imports, total new supply of apparel wool, and imports of carpet wool, United States, 2009–2018
Year Sheep and lambs shorn 1
Weight per fleece
Shorn wool production
Price per pound 2
Value of production 3
Thousands Pounds 1,000 pounds Cents 1,000 dollars
2009 ................ 4,195 7.4 30,860 0.79 24,337 2010 ................ 4,180 7.3 30,360 1.15 35,013 2011 ................ 4,030 7.3 29,280 1.67 48,920 2012 ................ 3,790 7.3 27,630 1.52 41,972 2013 ................ 3,700 7.3 26,990 1.45 39,209 2014 ................ 3,680 7.3 26,680 1.46 38,909 2015 ................ 3,675 7.4 27,015 1.45 39,205 2016 ................ 3,585 7.3 26,050 1.45 37,721 2017 ................ 3,435 7.2 24,810 1.48 36,774 2018 ................ 3,372 7.2 24,400 1.75 42,772
Year Shorn wool production
Raw wool supply (clean)
Domestic production 4 Exports 5
Imports for consumption Total new supply 8 48’s and Finer 6 Not Finer than
46’s 7
1,000 pounds 1,000 pounds 1,000 pounds 1,000 pounds 1,000 pounds
2009 ................ 30,860 16,294 10,207 3,306 6,046 15,439 2010 ................ 30,360 16,035 9,973 3,108 4,928 14,098 2011 ................ 29,280 15,465 9,586 3,791 4,694 14,364 2012 ................ 27,630 14,467 7,741 4,564 4,551 15,841 2013 ................ 26,990 14,251 9,998 3,858 3,746 11,857 2014 ................ 26,680 14,087 7,916 3,917 3,363 13,247 2015 ................ 27,015 14,264 7,847 3,980 3,321 13,718 2016 ................ 26,050 13,754 7,826 3,909 2,178 12,015 2017 ................ 24,810 13,100 11,002 3,396 2,285 7,779 2018 ................ 24,400 12,883 12,250 3,050 2,350 6,033
1 Includes sheep shorn at commercial feeding yards. 2 Price computed by weighting State average prices for all wool sold during the year by sales of shorn wool. 3 Production by States multiplied by annual average price. 4 Conversion fac-tor from grease basis to clean basis are as follows: Shorn wool production—52.8 percent (Stat. Bull. 616) from 1987- 1997. 5 Includes carpet wool exports. 6 Prior to 1989, known as dutiable imports. 7 Prior to 1989, known as duty-free im-ports. In 1994 includes 24,645,306 pounds of imported raw wool not finer than 46’s and 2,182,576 pounds of miscellaneous imported raw wool. 8 Production minus exports plus imports; stocks not taken into consideration.
NASS, Livestock Branch, (202) 720–3570 and ERS, Field Crops Branch, (202) 694–5300. Imports and exports from re-ports of the U.S. Department of Commerce.
Table 7-48.—Wool: Price-support operations, United States, 2010–2019 1
Year
Program price levels per pound Put under loan Acquired by CCC under loan
program 2
Owned by CCC at end of
marketing year Graded wool loan Nongraded loan Quantity Percentage of
production
Dollars Dollars 1,000 pounds Percent 1,000 pounds 1,000 pounds
2010 ......... 1.15 0.40 27.8 0.09 0.0 0.0 2011 ......... 1.15 0.40 0.0 0.00 0.0 0.0 2012 ......... 1.15 0.40 0.0 0.00 0.0 0.0 2013 ......... 1.15 0.40 14.0 0.05 0.0 0.0 2014 ......... 1.15 0.40 11.0 0.04 0.0 0.0 2015 ......... 1.15 0.40 0.0 0.00 0.0 0.0 2016 ......... 1.15 0.40 0.0 0.00 0.0 0.0 2017 ......... 1.15 0.40 10.0 0.04 0.0 0.0 2018 ......... 1.15 0.40 0.0 0.00 0.0 0.0 2019 ......... 1.15 0.40 0.0 0.00 0.0 0.0
1 Nonrecourse Marketing Loan Program authorized by the Food, Conservation, and Energy Act of 2008, as amended, for marketing years 2008-2013, and the Agricultural Act of 2014, as amended, for marketing years 2014-2018. 2 Acquisitions as of September 30, 2020.
FPAC-BC, Commodity Analysis Branch, (202) 720-4284.

VII–30 STATISTICS OF CATTLE, HOGS, AND SHEEP
Table 7-49.—Wool: United States imports of raw wool for mill use, clean yield 1, 2014– 2018
Year Finer-than-58s 2 48s-and-finer 2 Not-finer-than- 46s 3 Grand total 4
Share finer-than- 58s of grand total raw wool imports
1,000 pounds Percent
2015 ..................... 2,895 3,980 3,321 7,301 39.7 2016 ..................... 2,692 3,909 2,178 6,087 44.2 2017 ..................... 2,114 3,396 2,285 5,681 37.2 2018 ..................... 1,996 3,116 2,348 5,463 36.5
1 Wool not advanced in any way or by any process of manufacture beyond washed, scoured, or carbonized condition. Im-ports for consumption include entries for immediate consumption and warehouse withdrawals for consumption. 2 Formerly ’’Dutiable’’. 3 Formerly ’’Duty-free’’. 4 Grand total includes ’’48s-and-finer’’ and ’’Not-finer-than-46s’’.
ERS, Field Crops Branch, (202) 694–5300. Source: U.S. Department of Commerce, U.S. Census Bureau.
Table 7-50.—U.S. raw wool imports by country of origin, clean yield, 2016–2018
Country of origin Not-finer-than 46s 48s-and-finer
2016 2017 2018 2016 2017 2018
1,000 pounds
Australia ................................. 319.5 144.9 32.6 1,446.4 1,362.9 1,681.9 Belgium .................................. 233.0 30.3 -- -- 0.9 -- Canada ................................... -- 35.8 43.6 1,029.1 674.7 176.8 China ...................................... 43.2 -- 167.2 184.1 178.2 125.9 Italy ......................................... 0.0 0.0 0.2 330.1 366.9 98.5 Germany ................................. 70.5 53.0 -- -- 23.2 -- Mexico .................................... 67.2 -- -- 26.5 24.4 59.7 New Zealand .......................... 1,124.7 1,340.8 1,456.7 443.4 339.9 435.8 Pakistan .................................. 43.8 88.7 90.6 -- -- -- South Africa ............................ 38.7 138.7 82.8 77.8 -- 74.6 Spain ...................................... 0.0 65.1 42.3 82.2 246.7 107.3 United Kingdom ...................... 183.7 318.8 270.7 21.6 0.0 0.2 Uruguay .................................. -- -- -- 266.9 178.0 355.0 Other ...................................... 53.5 69.3 160.9 1.0 0.2 0.2
Total ....................................... 2,177.8 2,285.4 2,347.6 3,909.1 3,396.0 3,115.7
(--) No imports. 0.0 = Less than 100 pounds. ERS, Field Crops Branch, (202) 694–5300. Source: U.S. Department of Commerce, U.S. Census Bureau.

VII–31 AGRICULTURAL STATISTICS 2020
Table 7-51.—Wool: Graded territory shorn wool, and Australian offering prices, 2009– 2018 1
Year Graded territory shorn wool, clean 1 Australian offering prices, clean 2
64s staple 2-3/4’’ & up 58s staple 3-1/4’’ & up Grade 64s type 63
U.S. dollars per pound
2009 ........... 2.27 1.73 3.02 2010 ........... 3.27 2.15 4.10 2011 ........... 4.25 4.07 6.30 2012 ........... 2.81 3.46 5.90 2013 ........... 4.23 3.01 5.34 2014 ........... 4.17 3.00 4.89 2015 ........... 3.58 3.04 4.50 2016 ........... 3.94 3.21 4.89 2017 ........... 4.36 3.24 5.50 2018 ........... 6.04 4.43 7.23
2 Refers to wool principally produced in Texas and the Rocky Mountain States. 2 Free on board (f.o.b.) Australian Wool Corporation’s South Carolina warehouse in bond. A duty of 10 cents per pound, clean, should be added to these prices.
ERS, Field Crops Branch, (202) 694–5300. Sources: USDA and International Wool Textile Organization.
Table 7-52.—Wool: Number of sheep shorn, weight per fleece, and production, by State and United States, 2017–2018
State Sheep Weight per fleece Shorn wool production
2017 2018 2017 2018 2017 2018
1,000 head 1,000 head Pounds Pounds 1,000 pounds 1,000 pounds
Arizona ............................. 90.0 83.0 6.8 6.9 610 570 California .......................... 400.0 380.0 6.3 6.3 2,500 2,400 Colorado .......................... 310.0 315.0 6.8 7.0 2,100 2,200 Idaho ................................ 185.0 170.0 8.6 8.8 1,600 1,500 Illinois ............................... 33.0 32.0 6.1 6.3 200 200 Indiana ............................. 38.0 42.0 5.9 6.0 225 250 Iowa ................................. 140.0 140.0 5.6 5.4 780 760 Kansas ............................. 43.0 43.0 6.6 6.4 285 275 Kentucky .......................... 11.0 11.0 6.8 6.8 75 75 Michigan .......................... 59.0 55.0 5.8 5.9 345 325 Minnesota ........................ 112.0 102.0 6.3 6.3 700 640 Missouri ........................... 36.0 40.0 6.1 5.8 220 230 Montana ........................... 195.0 180.0 9.0 8.9 1,750 1,610 Nebraska ......................... 62.0 58.0 7.1 7.1 440 410 Nevada ............................ 46.0 47.0 9.3 9.6 430 450 New England 1 ................. 31.0 27.0 6.8 6.7 210 180 New Mexico ..................... 81.0 82.0 7.6 7.6 615 625 New York ......................... 48.0 46.0 6.3 5.9 300 270 North Carolina ................. 6.0 6.0 5.8 5.5 35 33 North Dakota ................... 61.0 59.0 6.9 6.9 420 410 Ohio ................................. 80.0 79.0 5.8 5.8 460 460 Oklahoma ........................ 18.0 19.0 5.6 5.5 100 105 Oregon ............................. 130.0 130.0 6.4 6.4 830 830 Pennsylvania ................... 47.0 46.0 6.7 6.7 315 310 South Dakota ................... 230.0 230.0 7.6 7.6 1,750 1,750 Tennessee ....................... 10.0 10.0 5.5 5.0 55 50 Texas ............................... 240.0 240.0 7.5 7.3 1,800 1,760 Utah ................................. 245.0 245.0 9.0 9.1 2,200 2,220 Virginia ............................. 23.0 24.0 5.9 6.0 135 145 Washington ...................... 31.0 33.0 8.4 8.0 260 265 West Virginia ................... 18.0 17.0 5.8 5.4 105 92 Wisconsin ........................ 50.0 50.0 6.6 6.6 330 330 Wyoming .......................... 280.0 285.0 8.4 8.4 2,350 2,400 Other States 2 .................. 46.0 46.0 6.1 5.9 280 270
United States ................... 3,435.0 3,372.0 7.2 7.2 24,810 24,400
1 New England includes Connecticut, Maine, Massachusetts, New Hampshire, Rhode Island, and Vermont. 2 Includes data for States not published in this table.
NASS, Livestock Branch, (202) 720–3570.

VII–32 STATISTICS OF CATTLE, HOGS, AND SHEEP
Table 7-53.—Wool: Price and value, by State and United States, 2017–2018
State Price per pound Value 1
2017 2018 2017 2018
Dollars Dollars 1,000 Dollars 1,000 dollars
Arizona ......................... 0.90 1.20 549 684 California ...................... 1.55 2.00 3,875 4,800 Colorado ...................... 1.80 2.10 3,780 4,620 Idaho ............................ 1.70 2.02 2,720 3,030 Illinois ........................... 0.70 0.65 140 130 Indiana ......................... 0.60 0.55 135 138 Iowa ............................. 0.52 0.59 406 448 Kansas ......................... 0.85 0.95 242 261 Kentucky ...................... 0.90 0.80 68 60 Michigan ....................... 0.60 0.65 207 211 Minnesota .................... 0.60 0.67 420 429 Missouri ........................ 0.86 0.60 189 138 Montana ....................... 1.90 2.50 3,325 4,025 Nebraska ...................... 0.79 0.88 348 361 Nevada ......................... 2.00 2.20 860 990 New England 2 ............. 0.90 0.85 189 153 New Mexico ................. 1.60 2.10 984 1,313 New York ..................... 0.90 0.90 270 243 North Carolina .............. 1.10 1.20 39 40 North Dakota ................ 1.09 1.32 458 541 Ohio ............................. 0.50 0.40 230 184 Oklahoma ..................... 0.80 0.70 80 74 Oregon ......................... 1.65 1.65 1,370 1,370 Pennsylvania ................ 0.60 0.60 189 186 South Dakota ............... 1.49 1.83 2,608 3,203 Tennessee ................... 0.90 0.80 50 40 Texas ........................... 1.63 1.80 2,934 3,168 Utah ............................. 1.80 2.00 3,960 4,440 Virginia ......................... 1.45 1.40 196 203 Washington .................. 1.90 2.10 494 557 West Virginia ................ 1.45 1.40 152 129 Wisconsin ..................... 0.65 0.60 215 198 Wyoming ...................... 2.00 2.50 4,700 6,000 Other States 3 .............. 1.40 1.50 392 405
United States ............... 1.48 1.75 36,774 42,772
1 Production multiplied by marketing year average price. United States value is the summation of State values. 2 New England includes Connecticut, Maine, Massachusetts, New Hampshire, Rhode Island, and Vermont. 3 Includes data for States not published in this table.
NASS, Livestock Branch, (202) 720–3570.

VII–33 AGRICULTURAL STATISTICS 2020
Table 7-54.—Mohair: Price-support operations, United States, 2010–2019 1
Year
Program price levels per pound
Put under loan Acquired by CCC under loan program 2
Owned by CCC at end of marketing
year Loan Quantity Percentage of production
Dollars 1,000 pounds Percent 1,000 pounds 1,000 pounds
2010 ..................... 4.20 4.2 0.38 0.0 0.0 2011 ..................... 4.20 0.0 0.0 0.0 0.0 2012 ..................... 4.20 0.0 0.0 0.0 0.0 2013 ..................... 4.20 0.0 0.0 0.0 0.0 2014 ..................... 4.20 0.0 0.0 0.0 0.0 2015 ..................... 4.20 0.0 0.0 0.0 0.0 2016 ..................... 4.20 0.0 0.0 0.0 0.0 2017 ..................... 4.20 0.0 0.0 0.0 0.0 2018 ..................... 4.20 0.0 0.0 0.0 0.0 2019 ..................... 4.20 0.0 0.0 0.0 0.0
1 Nonrecourse Marketing Loan Program authorized by the Food , Conservation, and Energy Act of 2008, as amended, for marketing years 2008-2013, and the Agricultural Act of 2014, as amended, for marketing years 2014-2018. 2 Acquisitions as of September 30, 2020.
FPAC-BC, Commodity Analysis Branch, (202) 720-4284.
Table 7-55.—Mohair: Goats clipped, production, price, and value, by State and United States, 2017–2018
State
Goats clipped Average clip per goat
Production Price per pound Value 1
2017 2018 2017 2018 2017 2018 2017 2018 2017 2018
1,000 1,000 1,000 1,000 Head Head Pounds Pounds pounds pounds Dollars Dollars dollars dollars
Arizona .......... 27,000 28,000 3.9 4.5 105 125 1.20 1.30 126 163 California ....... 2,000 2,000 5.0 5.0 10 10 6.00 6.00 60 60 New Mexico ... 7,000 7,000 4.3 4.3 30 30 1.40 1.60 42 48 Texas ............. 77,000 75,000 6.1 6.2 470 465 6.60 7.20 3,102 3,348 Other States 2 21,000 21,000 6.0 6.0 125 125 2.65 2.75 331 344
United States 134,000 133,000 5.5 5.7 740 755 4.95 5.25 3,661 3,963
1 Production multiplied by marketing year average price. U.S. value is summation of State values. 2 Includes data for States not published in this table.
NASS, Livestock Branch, (202) 720–3570.

VII–34 STATISTICS OF CATTLE, HOGS, AND SHEEP
Table 7-56—Angora goats: Inventory Jan 1, 2017–2018, and number of operations, 2017, by State and United States 1
State January 1 angora goats inventory Operations with angora goats 2
2017 2018 2017
Head Head Number
Alabama ....................... .................................................. .................................................. 202 Alaska .......................... .................................................. .................................................. 6 Arizona ......................... 35,000 30,000 2,185 Arkansas ...................... .................................................. .................................................. 25 California ...................... 3,400 3,500 363 Colorado ...................... .................................................. .................................................. 217 Connecticut .................. .................................................. .................................................. 70 Delaware ...................... .................................................. .................................................. 5 Florida .......................... .................................................. .................................................. 284 Georgia ........................ .................................................. .................................................. 236 Hawaii .......................... .................................................. .................................................. 57 Idaho ............................ .................................................. .................................................. 107 Illinois ........................... .................................................. .................................................. 82 Indiana ......................... .................................................. .................................................. 126 Iowa ............................. .................................................. .................................................. 113 Kansas ......................... .................................................. .................................................. 75 Kentucky ...................... .................................................. .................................................. 266 Louisiana ...................... .................................................. .................................................. 95 Maine ........................... .................................................. .................................................. 49 Maryland ...................... .................................................. .................................................. 114 Massachusetts ............. .................................................. .................................................. 85 Michigan ....................... .................................................. .................................................. 238 Minnesota .................... (NA) (NA) 157 Mississippi .................... .................................................. .................................................. 44 Missouri ........................ (NA) (NA) 192 Montana ....................... .................................................. .................................................. 86 Nebraska ...................... .................................................. .................................................. 61 Nevada ......................... .................................................. .................................................. 17 New Hampshire ........... .................................................. .................................................. 50 New Jersey .................. .................................................. .................................................. 129 New Mexico ................. 10,500 9,500 1,196 New York ..................... .................................................. .................................................. 211 North Carolina .............. .................................................. .................................................. 273 North Dakota ................ .................................................. .................................................. 20 Ohio ............................. .................................................. .................................................. 241 Oklahoma ..................... .................................................. .................................................. 181 Oregon ......................... (NA) (NA) 295 Pennsylvania ................ .................................................. .................................................. 290 Rhode Island ................ .................................................. .................................................. 16 South Carolina ............. .................................................. .................................................. 147 South Dakota ............... .................................................. .................................................. 39 Tennessee ................... .................................................. .................................................. 35 Texas ........................... 80,000 75,000 1,514 Utah ............................. .................................................. .................................................. 272 Vermont ....................... .................................................. .................................................. 65 Virginia ......................... .................................................. .................................................. 201 Washington .................. .................................................. .................................................. 267 West Virginia ................ .................................................. .................................................. 93 Wisconsin ..................... (NA) (NA) 168 Wyoming ...................... .................................................. .................................................. 33
United States ............... 152,000 144,000 11,293
(NA) Not available. 1 An operation is any place having one or more head of angora goats on hand December 31. 2 State level estimates only available in conjunction with the Census of Agriculture every 5 years. 3 New England in-cludes Connecticut, Maine, Massachusetts, New Hampshire, Rhode Island, and Vermont. 4 Includes data for States not published in this table.
NASS, Livestock Branch, (202) 720–3570.

VII–35 AGRICULTURAL STATISTICS 2020
Table 7-57.—Milk goats: Inventory Jan 1, 2017–2018, and number of operations, 2017, by State and United States 1
State January 1 milk goats inventory Operations with milk goats 2
2017 2018 2017
Head Head Number
Alabama ....................... 3,900 3,500 547 Alaska .......................... (NA) .................................................. 39 Arizona ......................... (NA) .................................................. 499 Arkansas ...................... 4,500 4,000 709 California ...................... 41,000 40,000 1,372 Colorado ...................... 9,000 9,000 1,124 Connecticut .................. (NA) (NA) 280 Delaware ...................... (NA) (NA) 34 Florida .......................... 10,000 10,000 1,410 Georgia ........................ 5,000 7,100 809 Hawaii .......................... (NA) .................................................. 93 Idaho ............................ 5,000 8,000 598 Illinois ........................... 9,000 10,000 585 Indiana ......................... 11,000 11,000 1,120 Iowa ............................. 30,500 31,000 753 Kansas ......................... 4,700 4,400 525 Kentucky ...................... 5,500 6,000 1,078 Louisiana ...................... (NA) (NA) 368 Maine ........................... (NA) (NA) 395 Maryland ...................... (NA) (NA) 343 Massachusetts ............. (NA) (NA) 335 Michigan ....................... 12,500 11,000 1,246 Minnesota .................... 12,000 14,000 698 Mississippi .................... (NA) (NA) 431 Missouri ........................ 11,000 12,000 1,382 Montana ....................... (NA) (NA) 400 Nebraska ...................... 3,700 3,500 419 Nevada ......................... (NA) (NA) 104 New England 3 ............. 14,200 17,000 ..................................................New Hampshire ........... (NA) (NA) 231 New Jersey .................. (NA) (NA) 286 New Mexico ................. (NA) (NA) 564 New York ..................... 13,700 13,000 1,033 North Carolina .............. 6,400 7,000 849 North Dakota ................ (NA) (NA) 164 Ohio ............................. 10,000 12,000 1,504 Oklahoma ..................... 6,000 7,000 1,142 Oregon ......................... 12,600 14,000 1,216 Pennsylvania ................ 15,000 15,000 1,240 Rhode Island ................ (NA) (NA) 59 South Carolina ............. 3,000 3,500 479 South Dakota ............... (NA) (NA) 235 Tennessee ................... 7,000 7,500 981 Texas ........................... 26,000 29,000 3,630 Utah ............................. (NA) (NA) 397 Vermont ....................... (NA) (NA) 270 Virginia ......................... 6,000 5,500 867 Washington .................. 7,500 7,000 982 West Virginia ................ (NA) (NA) 523 Wisconsin ..................... 56,000 67,000 1,029 Wyoming ...................... (NA) (NA) 305 Other States 4 ............... 33,300 31,000 ..................................................
United States ............... 395,000 420,000 35,682
(NA) Not available. 1 An operation is any place having one or more head of angora goats on hand December 31. 2 State level estimates only available in conjunction with the Census of Agriculture every 5 years. 3 New England in-cludes Connecticut, Maine, Massachusetts, New Hampshire, Rhode Island, and Vermont. 4 Includes data for States not published in this table.
NASS, Livestock Branch, (202) 720–3570.

VII–36 STATISTICS OF CATTLE, HOGS, AND SHEEP
Table 7-58.—Meat and other goats: Inventory Jan 1, 2017–2018, and number of operations, 2017, by State and United States 1
State January 1 meat and other goats inventory Operations with Meat goats 2
2017 2018 2017
Head Head Number
Alabama ....................... 45,000 47,000 1,549 Alaska .......................... (NA) (NA) 18 Arizona ......................... 30,000 30,000 390 Arkansas ...................... 34,000 31,000 1,111 California ...................... 87,000 85,000 1,343 Colorado ...................... 25,000 23,000 1,008 Connecticut .................. (NA) (NA) 123 Delaware ...................... (NA) (NA) 44 Florida .......................... 44,000 45,000 1,526 Georgia ........................ 57,000 60,000 1,893 Hawaii .......................... (NA) (NA) 194 Idaho ............................ (NA) (NA) 585 Illinois ........................... 24,000 25,000 867 Indiana ......................... 33,000 36,000 1,154 Iowa ............................. 35,000 40,000 1,183 Kansas ......................... 46,000 41,000 1,093 Kentucky ...................... 56,000 57,000 1,768 Louisiana ...................... 18,000 15,000 504 Maine ........................... (NA) (NA) 82 Maryland ...................... (NA) (NA) 362 Massachusetts ............. (NA) (NA) 141 Michigan ....................... (NA) (NA) 691 Minnesota .................... 22,000 24,000 758 Mississippi .................... 20,000 20,000 837 Missouri ........................ 75,000 70,000 1,724 Montana ....................... (NA) (NA) 256 Nebraska ...................... (NA) (NA) 657 Nevada ......................... (NA) (NA) 126 New Hampshire ........... (NA) (NA) 83 New Jersey .................. (NA) (NA) 361 New Mexico ................. (NA) (NA) 535 New York ..................... 17,000 16,000 592 North Carolina .............. 50,000 47,000 1,658 North Dakota ................ (NA) (NA) 117 Ohio ............................. 42,000 44,000 1,942 Oklahoma ..................... 92,000 82,000 2,477 Oregon ......................... 27,000 29,000 1,048 Pennsylvania ................ 37,000 38,000 1,351 Rhode Island ................ (NA) (NA) 18 South Carolina ............. 32,000 34,000 1,216 South Dakota ............... (NA) (NA) 282 Tennessee ................... 100,000 96,000 2,875 Texas ........................... 760,000 765,000 12,511 Utah ............................. (NA) (NA) 385 Vermont ....................... (NA) (NA) 63 Virginia ......................... 45,000 41,000 1,356 Washington .................. 18,000 19,000 723 West Virginia ................ 21,000 21,000 809 Wisconsin ..................... (NA) (NA) 582 Wyoming ...................... (NA) (NA) 256 Other States 4 ............... 188,000 194,000 ..................................................
United States ............... 2,080,000 2,075,000 53,227
(NA) Not available. 1 An operation is any place having one or more head of angora goats on hand December 31. 2 State level estimates only available in conjunction with the Census of Agriculture every 5 years. 3 New England in-cludes Connecticut, Maine, Massachusetts, New Hampshire, Rhode Island, and Vermont. 4 Includes data for States not published in this table.
NASS, Livestock Branch, (202) 720–3570.

VII–37 AGRICULTURAL STATISTICS 2020
Table 7-59.—All goats: Number of operations, 2017, by State and United States 1
State 2017 2
Number
Alabama ................................................................................. 3,279 Alaska ..................................................................................... 73 Arizona ................................................................................... 4,721 Arkansas ................................................................................ 2,488 California ................................................................................ 3,938 Colorado ................................................................................. 2,803 Connecticut ............................................................................ 592 Delware .................................................................................. 121 Florida .................................................................................... 4,366 Georgia ................................................................................... 4,063 Hawaii ..................................................................................... 609 Idaho ...................................................................................... 1,556 Illinios ..................................................................................... 2,028 Indiana .................................................................................... 2,833 Iowa ........................................................................................ 2,400 Kansas ................................................................................... 2,010 Kentucky ................................................................................. 4,330 Louisiana ................................................................................ 1,501 Maine ...................................................................................... 583 Maryland ................................................................................. 1,085 Massachusetts ....................................................................... 719 Michigan ................................................................................. 2,614 Minnesota ............................................................................... 1,996 Mississippi .............................................................................. 2,048 Missouri .................................................................................. 4,132 Montana ................................................................................. 908 Nebraska ................................................................................ 1,341 Nevada ................................................................................... 339 New Hampshire ...................................................................... 427 New Jersey ............................................................................ 969 New Mexico ............................................................................ 2,770 New York ................................................................................ 2,192 North Carolina ........................................................................ 4,084 North Dakota .......................................................................... 335 Ohio ........................................................................................ 4,841 Oklahoma ............................................................................... 5,398 Oregon ................................................................................... 3,289 Pennsylvania .......................................................................... 3,749 Rhode Island .......................................................................... 102 South Carolina ....................................................................... 2,905 South Dakota ......................................................................... 721 Tennessee .............................................................................. 5,802 Texas ...................................................................................... 26,143 Utah ........................................................................................ 1,392 Vermont .................................................................................. 480 Virginia ................................................................................... 3,449 Washington ............................................................................ 2,609 West Virginia .......................................................................... 2,040 Wisconsin ............................................................................... 2,586 Wyoming ................................................................................ 683
United States .......................................................................... 136,442
1 An operation is any place having one or more head of goats on hand December 31. 2 State level estimates only avail-able in conjunction with the Census of Agriculture every 5 years. 3 New England includes Connecticut, Maine, Massachu-setts, New Hampshire, Rhode Island, and Vermont.
NASS, Livestock Branch, (202) 720–3570.

VII–38 STATISTICS OF CATTLE, HOGS, AND SHEEP
Table 7-60.—Red meat: Production, by class of slaughter, United States, 2009–2018
Year Commercial
Farm Total Federally inspected Total
Beef
Million pounds
2009 ............................... 25,598 25,966 90 26,056 2010 ............................... 25,954 26,305 84 26,389 2011 ............................... 25,854 26,195 75 26,270 2012 ............................... 25,573 25,913 76 25,989 2013 ............................... 25,385 25,720 70 25,790 2014 ............................... 23,932 24,249 66 24,315 2015 ............................... 23,395 23,698 63 23,760 2016 ............................... 24,908 25,221 67 25,288 2017 ............................... 25,856 26,188 63 26,251 2018 ............................... 26,536 26,873 66 26,939
Pork, excluding lard
Million pounds
2009 ............................... 22,827 22,999 21 23,020 2010 ............................... 22,275 22,437 19 22,456 2011 ............................... 22,599 22,758 17 22,775 2012 ............................... 23,090 23,253 15 23,268 2013 ............................... 23,040 23,187 16 23,203 2014 ............................... 22,710 22,843 15 22,858 2015 ............................... 24.355 24,501 16 24,517 2016 ............................... 24,789 24,941 16 24,957 2017 ............................... 25,437 25,584 14 25,598 2018 ............................... 26,178 26,315 14 26,330
Veal
Million pounds
2009 ............................... 135 138 8 147 2010 ............................... 131 134 8 143 2011 ............................... 126 130 7 136 2012 ............................... 115 118 7 125 2013 ............................... 109 111 6 117 2014 ............................... 92 94 6 100 2015 ............................... 81 83 5 88 2016 ............................... 74 76 6 81 2017 ............................... 73 74 6 80 2018 ............................... 74 76 5 80
Lamb and Mutton
Million pounds
2009 ............................... 162 171 5 175 2010 ............................... 154 164 5 168 2011 ............................... 141 149 5 153 2012 ............................... 148 156 5 161 2013 ............................... 146 156 5 161 2014 ............................... 145 156 5 161 2015 ............................... 139 151 5 156 2016 ............................... 138 150 5 155 2017 ............................... 132 145 5 150 2018 ............................... 140 153 5 158
All meat, excluding lard
Million pounds
2009 ............................... 48,721 49,274 124 49,398 2010 ............................... 48,514 49,039 116 49,155 2011 ............................... 48,721 49,232 103 49,335 2012 ............................... 48,925 49,440 103 49,543 2013 ............................... 48,679 49,174 97 49,271 2014 ............................... 46,879 47,342 91 47,433 2015 ............................... 47,970 48,432 89 48,520 2016 ............................... 49,909 50,388 93 50,481 2017 ............................... 51,497 51,992 88 52,079 2018 ............................... 52,927 53,417 90 53,507
NASS, Livestock Branch, (202) 720–3570.

VII–39 AGRICULTURAL STATISTICS 2020
Table 7-61.—Meat: United States exports and imports into the United States, carcass weight equivalent, 2010–2019 1
Year
Exports Imports
Beef and veal
Lamb and mutton Pork 2 All meat Beef & veal Lamb and
mutton Pork 2 All meat
Million pounds
2010 ............ 2,300 16 4,223 6,539 2,298 166 859 3,323 2011 ............ 2,785 19 5,196 8,000 2,057 162 803 3,022 2012 ............ 2,452 11 5,379 7,842 2,220 154 802 3,175 2013 ............ 2,588 7 4,986 7,582 2,250 173 880 3,302 2014 ............ 2,574 7 5,092 7,672 2,947 195 1,011 4,153 2015 ............ 2,267 4 5,010 7,282 3,368 214 1,116 4,698 2016 ............ 2,557 5 5,239 7,801 3,012 216 1,091 4,319 2017 ............ 2,859 6 5,632 8,497 2,993 252 1,116 4,361 2018 ............ 3,160 6 5,877 9,042 2,998 273 1,042 4,313 2019 ............ 3,026 6 6,321 9,353 3,058 272 945 4,275
1 Carcass weight equivalent of all meat, including the meat content of minor meats and of mixed products. Shipments to U.S. Territories are included in domestic consumption. 2 The pork series has been revised to a dressed weight equivalent rather than ‘‘Pork, excluding lard.’’
ERS, Market and Trade Economics Division, Animal Products and Cost of Production Branch, (202) 694–5409. Data on imports and commercial exports are computed from records of the U.S. Department of Commerce, those on exports by the U.S. Department of Agriculture are separately estimated from deliveries and stocks.
Table 7-62.—International Meat: Production, 2017–2019
Country 2017 2018 2019
1,000 metric tons
Beef and veal: United States .......................................... 11,943 12,257 12,383 Brazil ...................................................... 9,550 9,900 10,200 European Union ..................................... 7,869 8,003 7,928 China ...................................................... 6,346 6,440 6,670 India ........................................................ 4,230 4,240 4,305 Argentina ................................................ 2,840 3,050 3,125 Australia ................................................. 2,149 2,306 2,432 Mexico .................................................... 1,925 1,980 2,030 Pakistan .................................................. 1,780 1,800 1,820 Russia .................................................... 1,325 1,357 1,369 Canada ................................................... 1,201 1,265 1,340 South Africa ............................................ 1,046 1,027 1,019 Colombia ................................................ 758 773 770 New Zealand .......................................... 654 672 713 Uruguay .................................................. 594 596 562
Swine: China ...................................................... 54,518 54,040 42,550 European Union ..................................... 23,660 24,082 23,960 United States .......................................... 11,611 11,943 12,543 Brazil ...................................................... 3,725 3,763 3,975 Russia .................................................... 2,959 3,155 3,321 Vietnam .................................................. 2,741 2,811 2,380 Canada ................................................... 1,958 1,955 2,020 Philippines .............................................. 1,563 1,601 1,585 Mexico .................................................... 1,267 1,321 1,408 Korea, South .......................................... 1,280 1,329 1,364 Japan ...................................................... 1,272 1,284 1,279 Taiwan .................................................... 811 829 820 Ukraine ................................................... 769 732 745 Argentina ................................................ 565 621 630 Chile ....................................................... 489 534 530
FAS, Office of Global Analysis, (202) 720-6301. Data Source: USDA FAS PSD Online.

VII–40 STATISTICS OF CATTLE, HOGS, AND SHEEP
Table 7-63.—Meat: U.S. exports, 2017–2019
Country 2017 2018 2019
Metric tons
Beef & veal, prep/pres: Canada ............................................... 25,390 25,666 23,987 Hong Kong .......................................... 5,629 1,958 5,408 Mexico ................................................ 1,002 905 1,726 Korea, South ....................................... 266 686 442 Guatemala .......................................... 101 143 210 Dominican Republic ............................ 189 86 186 Philippines .......................................... 37 176 146 Trinidad and Tobago .......................... 30 67 116 Malaysia .............................................. 9 99 96 Chile .................................................... 109 168 89 Japan .................................................. 16 42 87 Panama .............................................. 148 218 68 Bahamas, The .................................... 51 43 61 Micronesia .......................................... 57 39 60 Australia(*) .......................................... 580 105 53 Netherlands Antilles(*) ........................ 25 20 52 Leeward-Windward Islands(*) ............. 40 31 43 Bermuda ............................................. 19 23 40 Jamaica .............................................. 25 68 38 Albania ................................................ 0 0 36 Germany(*) ......................................... 22 29 32 El Salvador ......................................... 10 21 31 United Arab Emirates ......................... 46 24 28 Costa Rica .......................................... 37 60 27 Netherlands ........................................ 8 37 24 Colombia ............................................. 24 4 22 Ireland ................................................. 0 0 18 Cayman Islands .................................. 9 18 17 Belize .................................................. 8 2 15 China .................................................. 3 12 15 Rest of World ...................................... 430 372 178
World Total ......................................... 34,318 31,118 33,347
Beef & veal, fr/ch/fz: Japan .................................................. 258,194 278,801 248,111 Korea, South ....................................... 170,248 224,729 241,830 Mexico ................................................ 131,964 141,591 134,336 Hong Kong .......................................... 110,657 101,518 73,024 Canada ............................................... 81,488 78,225 67,804 Taiwan ................................................ 44,421 59,740 63,509 Philippines .......................................... 9,306 12,043 13,813 Vietnam ............................................... 9,874 12,142 12,225 Indonesia ............................................ 6,403 7,411 10,904 China .................................................. 2,957 7,189 10,492 Netherlands ........................................ 12,692 10,771 9,927 Chile .................................................... 10,548 9,227 9,408 Dominican Republic ............................ 5,868 5,979 6,203 United Arab Emirates ......................... 5,703 5,638 5,617 Guatemala .......................................... 4,857 4,965 5,099 Italy(*) ................................................. 5,216 4,811 3,899 Colombia ............................................. 2,301 3,262 3,865 Singapore ........................................... 3,035 2,943 3,431 Bahamas, The .................................... 2,935 3,187 3,291 Netherlands Antilles(*) ........................ 2,765 2,512 2,767 Kuwait ................................................. 2,711 2,715 2,541 Costa Rica .......................................... 1,774 2,320 2,443 Germany(*) ......................................... 2,821 2,963 2,173 Panama .............................................. 1,170 1,346 1,947 Jamaica .............................................. 1,662 2,235 1,817 Peru .................................................... 1,450 1,360 1,613 Israel(*) ............................................... 401 908 1,589 Saudi Arabia ....................................... 144 1,222 1,539 Thailand .............................................. 637 961 1,499 Cayman Islands .................................. 1,449 1,563 1,456 Rest of World ...................................... 17,398 17,849 15,268
World Total ......................................... 913,046 1,012,122 963,438
See footnote(s) at end of table.

VII–41 AGRICULTURAL STATISTICS 2020
Table 7-63.—Meat: U.S. exports, 2017–2019—Continued
Country 2017 2018 2019
Metric tons
Pork, fr/ch/fz: Mexico ................................................ 621,597 621,631 552,583 China .................................................. 127,452 104,991 378,025 Japan .................................................. 365,131 366,626 343,828 Korea, South ....................................... 157,945 220,401 188,954 Canada ............................................... 105,128 105,434 119,208 Australia(*) .......................................... 61,956 72,014 97,716 Colombia ............................................. 63,097 91,718 94,942 Chile .................................................... 23,291 26,610 32,421 Honduras ............................................ 27,041 28,940 31,556 Dominican Republic ............................ 27,934 38,087 30,189 Philippines .......................................... 19,121 20,631 21,741 Hong Kong .......................................... 43,570 18,197 15,390 Guatemala .......................................... 13,026 14,191 15,286 Taiwan ................................................ 9,537 13,091 12,200 Panama .............................................. 7,060 9,510 12,038 New Zealand(*) ................................... 5,105 6,143 8,299 Nicaragua ........................................... 5,140 6,419 7,475 El Salvador ......................................... 4,842 6,784 7,034 Costa Rica .......................................... 3,811 4,691 6,191 Peru .................................................... 3,843 5,499 4,962 Bahamas, The .................................... 4,855 4,023 4,059 Singapore ........................................... 3,841 2,601 3,720 Vietnam ............................................... 2,821 5,496 3,566 Trinidad and Tobago .......................... 2,130 1,964 2,494 Leeward-Windward Islands(*) ............. 1,585 1,826 2,192 Netherlands Antilles(*) ........................ 1,259 1,227 1,535 Albania ................................................ 900 852 1,214 United Kingdom .................................. 944 1,087 923 French Pacific Islands(*) ..................... 145 318 634 Ecuador .............................................. 623 835 561 Rest of World ...................................... 6,828 6,050 6,394
World Total ......................................... 1,721,555 1,807,884 2,007,327
Pork, hams/shldrs,cured: Canada ............................................... 18,459 17,705 16,563 Panama .............................................. 2,231 2,437 2,788 Mexico ................................................ 3,339 1,387 1,435 Albania ................................................ 197 587 965 Belize .................................................. 550 734 782 Netherlands Antilles(*) ........................ 486 529 509 Trinidad and Tobago .......................... 593 620 457 Bahamas, The .................................... 278 397 422 Colombia ............................................. 440 538 402 Korea, South ....................................... 203 123 303 Australia(*) .......................................... 2,339 863 262 Hong Kong .......................................... 28 299 262 Barbados ............................................ 181 160 217 Guatemala .......................................... 47 63 176 Leeward-Windward Islands(*) ............. 161 138 167 Dominican Republic ............................ 19 60 134 Thailand .............................................. 0 0 100 Italy(*) ................................................. 0 52 88 Philippines .......................................... 228 95 66 El Salvador ......................................... 0 51 65 Japan .................................................. 540 118 63 Honduras ............................................ 22 63 59 Costa Rica .......................................... 47 14 47 Haiti ..................................................... 26 32 46 United Kingdom .................................. 0 0 40 New Zealand(*) ................................... 1 10 24 Turks and Caicos Islands ................... 6 11 17 Netherlands ........................................ 17 16 14 Guyana ............................................... 5 4 13 Singapore ........................................... 30 0 9 Rest of World ...................................... 572 676 38
World Total ......................................... 31,044 27,780 26,530
See footnote(s) at end of table.

VII–42 STATISTICS OF CATTLE, HOGS, AND SHEEP
Table 7-63.—Meat: U.S. exports, 2017–2019—Continued
Country 2017 2018 2019
Metric tons
Pork, bacon, cured: Mexico ................................................ 14,912 12,283 13,289 Canada ............................................... 8,794 7,399 5,870 Korea, South ....................................... 2,617 3,195 3,848 Japan .................................................. 3,148 3,316 3,554 Australia(*) .......................................... 1,186 1,853 1,447 New Zealand(*) ................................... 1,246 777 1,304 French Pacific Islands(*) ..................... 369 1,152 1,247 Dominican Republic ............................ 711 823 643 Hong Kong .......................................... 602 387 474 Chile .................................................... 486 345 413 Bahamas, The .................................... 183 368 402 Guatemala .......................................... 503 344 401 Samoa ................................................ 102 444 393 Colombia ............................................. 364 421 343 Costa Rica .......................................... 490 298 292 Panama .............................................. 340 160 289 Netherlands Antilles(*) ........................ 89 134 232 Singapore ........................................... 274 281 232 El Salvador ......................................... 120 125 174 Cayman Islands .................................. 136 101 162 Leeward-Windward Islands(*) ............. 128 101 155 Honduras ............................................ 156 107 154 Bermuda ............................................. 126 102 137 United Arab Emirates ......................... 91 35 101 Malaysia .............................................. 7 0 76 Philippines .......................................... 26 42 72 Turks and Caicos Islands ................... 50 49 61 Taiwan ................................................ 24 0 47 Guyana ............................................... 34 30 37 Trinidad and Tobago .......................... 55 83 34 Rest of World ...................................... 344 156 73
World Total ......................................... 37,710 34,908 35,954
Pork, prep/pres, nt/cn: Canada ............................................... 56,686 56,827 55,307 Mexico ................................................ 17,305 11,787 10,622 Japan .................................................. 4,131 5,899 6,648 Peru .................................................... 52 101 1,681 Korea, South ....................................... 875 1,092 1,429 Colombia ............................................. 883 685 736 Chile .................................................... 213 620 635 Australia(*) .......................................... 99 67 631 Panama .............................................. 223 306 509 Philippines .......................................... 918 423 495 Dominican Republic ............................ 91 136 267 Micronesia .......................................... 273 227 252 Costa Rica .......................................... 95 164 226 Hong Kong .......................................... 327 289 172 El Salvador ......................................... 126 79 115 Guatemala .......................................... 82 78 86 Marshall Islands .................................. 43 47 84 Netherlands Antilles(*) ........................ 99 57 68 Honduras ............................................ 109 62 49 Bahamas, The .................................... 53 60 47 Trinidad and Tobago .......................... 73 19 39 Taiwan ................................................ 33 45 38 Leeward-Windward Islands(*) ............. 45 44 31 Singapore ........................................... 166 10 31 United Arab Emirates ......................... 1 0 28 New Zealand(*) ................................... 0 12 27 Nicaragua ........................................... 25 11 16 Netherlands ........................................ 1 7 14 Iceland ................................................ 0 4 12 Barbados ............................................ 16 25 12 Rest of World ...................................... 75 63 64
World Total ......................................... 83,116 79,247 80,371
See footnote(s) at end of table.

VII–43 AGRICULTURAL STATISTICS 2020
Table 7-63.—Meat: U.S. exports, 2017–2019—Continued
Country 2017 2018 2019
Metric tons
Pork, prep/pres, canned: Philippines .......................................... 6,566 8,854 6,220 Japan .................................................. 9,572 6,234 5,364 Australia(*) .......................................... 4,225 3,896 3,764 Panama .............................................. 1,699 1,573 1,889 Korea, South ....................................... 1,966 1,998 1,711 Hong Kong .......................................... 2,058 1,476 1,580 Dominican Republic ............................ 1,373 2,639 1,578 Colombia ............................................. 385 521 572 Costa Rica .......................................... 116 325 524 Singapore ........................................... 361 408 442 New Zealand(*) ................................... 578 644 360 Mexico ................................................ 365 501 302 Chile .................................................... 59 111 227 Netherlands Antilles(*) ........................ 170 179 214 Vietnam ............................................... 109 127 175 Taiwan ................................................ 85 81 171 El Salvador ......................................... 99 98 171 Guatemala .......................................... 700 147 161 United Arab Emirates ......................... 124 89 124 Trinidad and Tobago .......................... 145 94 103 Honduras ............................................ 112 80 88 Indonesia ............................................ 14 41 82 French Pacific Islands(*) ..................... 51 45 75 Canada ............................................... 311 15 62 Nicaragua ........................................... 46 52 57 Jamaica .............................................. 46 48 46 Malaysia .............................................. 27 40 43 Haiti ..................................................... 13 33 37 Bahamas, The .................................... 33 18 37 Belize .................................................. 32 19 32 Rest of World ...................................... 272 103 90
World Total ......................................... 31,709 30,489 26,302
Lamb & mutton; fr/ch/fz: Mexico ................................................ 877 684 765 Bahamas, The .................................... 142 219 178 United Arab Emirates ......................... 96 361 142 Trinidad and Tobago .......................... 60 72 123 Dominican Republic ............................ 25 74 104 Canada ............................................... 224 132 101 Netherlands Antilles(*) ........................ 155 83 90 El Salvador ......................................... 0 1 84 Italy(*) ................................................. 18 14 65 Bermuda ............................................. 99 67 65 Leeward-Windward Islands(*) ............. 81 108 60 Panama .............................................. 49 13 58 Barbados ............................................ 25 41 39 Jamaica .............................................. 52 95 39 Guatemala .......................................... 48 23 34 Turks and Caicos Islands ................... 26 58 32 Spain ................................................... 10 19 31 Netherlands ........................................ 30 23 28 Philippines .......................................... 13 19 25 Egypt ................................................... 0 0 25 Costa Rica .......................................... 29 43 23 Japan .................................................. 41 69 20 Taiwan ................................................ 37 30 20 Bahrain ............................................... 0 0 18 Micronesia .......................................... 0 16 12 Singapore ........................................... 31 31 12 Saudi Arabia ....................................... 0 0 12 Guyana ............................................... 12 7 12 Denmark(*) ......................................... 4 2 11 Equatorial Guinea ............................... 0 0 10 Rest of World ...................................... 251 97 57
World Total ......................................... 2,434 2,403 2,294
See footnote(s) at end of table.

VII–44 STATISTICS OF CATTLE, HOGS, AND SHEEP
Table 7-63.—Meat: U.S. exports, 2017–2019—Continued
Country 2017 2018 2019
Metric tons
Sausages & bologna: Canada ............................................... 42,906 42,895 43,346 Japan .................................................. 21,927 23,444 24,090 Mexico ................................................ 10,767 10,437 9,991 Korea, South ....................................... 6,311 5,910 6,267 Philippines .......................................... 1,912 3,980 3,481 Hong Kong .......................................... 1,875 1,506 1,759 Belize .................................................. 1,093 1,134 1,646 Guatemala .......................................... 869 1,021 1,483 United Kingdom .................................. 678 589 746 Chile .................................................... 297 528 716 Taiwan ................................................ 329 275 658 Dominican Republic ............................ 300 609 621 Panama .............................................. 734 721 556 Colombia ............................................. 243 393 547 Netherlands Antilles(*) ........................ 304 427 472 Bahamas, The .................................... 461 413 463 Singapore ........................................... 599 337 452 Australia(*) .......................................... 251 114 448 El Salvador ......................................... 142 405 389 Honduras ............................................ 101 209 369 Costa Rica .......................................... 325 385 291 Peru .................................................... 121 210 239 Marshall Islands .................................. 248 246 215 Leeward-Windward Islands(*) ............. 125 76 166 Samoa ................................................ 250 290 128 Bermuda ............................................. 114 113 128 Micronesia .......................................... 113 140 117 Nicaragua ........................................... 31 102 114 United Arab Emirates ......................... 70 108 91 Trinidad and Tobago .......................... 107 76 91 Rest of World ...................................... 1,044 1,016 898
World Total ......................................... 94,645 98,109 100,978
Other meat products, prp/ps: Canada ............................................... 3,532 2,876 2,401 Mexico ................................................ 1,737 1,962 2,138 Philippines .......................................... 523 432 587 Guatemala .......................................... 152 152 461 Panama .............................................. 135 372 286 Korea, South ....................................... 26 79 265 Colombia ............................................. 61 137 179 Cayman Islands .................................. 6 3 173 Japan .................................................. 171 144 144 Australia(*) .......................................... 76 103 117 Taiwan ................................................ 15 76 92 Leeward-Windward Islands(*) ............. 30 37 72 Ecuador .............................................. 36 103 68 Jamaica .............................................. 52 21 63 Suriname ............................................ 1 0 54 Trinidad and Tobago .......................... 8 59 44 Thailand .............................................. 50 44 43 Indonesia ............................................ 23 0 33 New Zealand(*) ................................... 31 20 31 Kuwait ................................................. 11 37 29 Belize .................................................. 17 32 26 Honduras ............................................ 59 19 25 Hong Kong .......................................... 32 85 23 Nicaragua ........................................... 28 18 22 Chile .................................................... 4 3 22 Netherlands Antilles(*) ........................ 10 39 19 United Arab Emirates ......................... 0 0 19 Bahamas, The .................................... 88 30 19 Haiti ..................................................... 27 6 18 Bahrain ............................................... 0 2 12 Rest of World ...................................... 402 234 48
World Total ......................................... 7,342 7,124 7,532
See footnote(s) at end of table.

VII–45 AGRICULTURAL STATISTICS 2020
Table 7-63.—Meat: U.S. exports, 2017–2019—Continued
Country 2017 2018 2019
Metric tons
Variety meats, beef: Mexico ................................................ 104,881 96,596 100,645 Egypt ................................................... 70,562 61,623 63,449 Japan .................................................. 49,234 51,602 62,949 Hong Kong .......................................... 14,449 19,271 14,149 Korea, South ....................................... 13,631 14,141 13,487 Indonesia ............................................ 7,322 6,700 12,689 South Africa ........................................ 11,391 12,448 11,219 Canada ............................................... 8,674 10,144 8,040 Peru .................................................... 6,212 6,481 5,886 Philippines .......................................... 3,598 5,721 4,485 Jamaica .............................................. 3,325 4,326 4,153 Angola ................................................. 2,996 3,303 3,550 Colombia ............................................. 2,771 2,911 2,837 Gabon ................................................. 2,746 1,986 2,276 Chile .................................................... 1,804 1,776 1,881 Dominican Republic ............................ 285 782 1,649 Trinidad and Tobago .......................... 927 759 894 Honduras ............................................ 1,121 991 753 Mozambique ....................................... 713 355 723 Ecuador .............................................. 620 990 713 Cote d’Ivoire ....................................... 2,232 1,661 690 Guatemala .......................................... 349 686 575 Nicaragua ........................................... 18 273 534 Libya ................................................... 76 134 511 Costa Rica .......................................... 424 776 482 Vietnam ............................................... 225 420 480 El Salvador ......................................... 439 680 456 Guinea ................................................ 196 141 357 Panama .............................................. 183 148 263 Turkey ................................................. 0 0 237 Rest of World ...................................... 3,808 2,048 1,530
World Total ......................................... 315,212 309,871 322,538
Variety meats, pork: China .................................................. 147,615 80,974 155,421 Mexico ................................................ 128,423 112,758 112,792 Hong Kong .......................................... 139,741 111,637 72,751 Canada ............................................... 18,587 17,522 16,466 Philippines .......................................... 11,374 17,298 10,927 Japan .................................................. 11,039 13,968 10,353 Vietnam ............................................... 0 9,343 10,045 Korea, South ....................................... 7,266 12,297 8,556 Chile .................................................... 3,386 2,752 8,531 Guatemala .......................................... 2,090 3,056 4,393 Taiwan ................................................ 3,352 4,822 3,610 Colombia ............................................. 3,740 2,033 2,757 Panama .............................................. 1,358 2,343 2,065 Dominican Republic ............................ 532 902 1,541 Honduras ............................................ 423 1,341 1,447 Trinidad and Tobago .......................... 656 1,221 1,095 Leeward-Windward Islands(*) ............. 657 432 512 Australia(*) .......................................... 23 297 423 Costa Rica .......................................... 194 361 404 El Salvador ......................................... 250 283 325 Haiti ..................................................... 664 538 324 Peru .................................................... 559 242 322 Singapore ........................................... 458 289 218 Italy(*) ................................................. 0 0 176 Bermuda ............................................. 0 0 160 Nicaragua ........................................... 21 102 137 Albania ................................................ 0 27 119 South Africa ........................................ 689 487 113 Turks and Caicos Islands ................... 141 43 84 Bahamas, The .................................... 62 135 75 Rest of World ...................................... 1,027 574 389
World Total ......................................... 484,324 398,074 426,531
See footnote(s) at end of table.

VII–46 STATISTICS OF CATTLE, HOGS, AND SHEEP
Table 7-63.—Meat: U.S. exports, 2017–2019—Continued
Country 2017 2018 2019
Metric tons
Other meat products, fr/ch/fz: Leeward-Windward Islands(*) ............. 74 72 153 Vietnam ............................................... 0 21 99 Mexico ................................................ 15 75 59 Italy(*) ................................................. 0 1 30 Jamaica .............................................. 0 0 28 Venezuela ........................................... 0 0 28 Korea, South ....................................... 0 5 17 Trinidad and Tobago .......................... 0 0 12 Panama .............................................. 0 0 12 Cayman Islands .................................. 21 2 11 Dominican Republic ............................ 0 0 10 Bermuda ............................................. 1 3 8 United Arab Emirates ......................... 17 0 8 Bahamas, The .................................... 0 3 2 Saudi Arabia ....................................... 0 0 2 Singapore ........................................... 12 1 1 Netherlands Antilles(*) ........................ 1 1 1 Turks and Caicos Islands ................... 4 5 1 Netherlands ........................................ 0 11 1 Estonia ................................................ 0 0 1 Denmark(*) ......................................... 0 0 1 Spain ................................................... 0 0 0 Australia(*) .......................................... 0 28 0 Barbados ............................................ 34 26 0 Canada ............................................... 32 0 0 China .................................................. 18 0 0 Costa Rica .......................................... 3 0 0 Ireland ................................................. 36 0 0 El Salvador ......................................... 0 19 0 France(*) ............................................. 0 3 0 Rest of World ...................................... 144 7 0
World Total ......................................... 410 281 484
(*)Denotes a country that is a summarization of its component countries. Users should use cautious interpretation on quantity reports using mixed units of measure. Quantity line items will only include statistics on the units of measure that are equal to, or are able to be converted to, the assigned unit of measure of the grouped commodities.
FAS, Office of Global Analysis, (202) 720-6301. Data Source: U.S. Census Bureau Trade Data, as of March 17, 2020.

VII–47 AGRICULTURAL STATISTICS 2020
Table 7-64.—Meat, beef, veal, and swine: International trade, imports and exports, 2018–2020
Country 2018 2019 2020
1,000 metric tons
Principle exporters, beef and veal: Brazil ...................................................... 2,082 2,356 2,580 India ........................................................ 1,556 1,600 1,700 United States .......................................... 1,434 1,372 1,499 Australia ................................................. 1,662 1,825 1,470 Argentina ................................................ 507 765 840 New Zealand .......................................... 633 649 642 Canada ................................................... 502 560 610 Uruguay .................................................. 466 470 468 Mexico .................................................... 310 355 390 European Union ..................................... 352 370 360 Paraguay ................................................ 365 320 350 Belarus ................................................... 220 195 195 Nicaragua ............................................... 158 160 160 Pakistan .................................................. 66 70 75 Ukraine ................................................... 60 57 52
Principle importers, beef and veal: China ...................................................... 1,467 2,300 2,900 United States .......................................... 1,360 1,388 1,306 Japan ...................................................... 862 870 890 Korea, South .......................................... 582 610 625 Russia .................................................... 495 440 430 Chile ....................................................... 317 380 395 European Union ..................................... 373 357 355 Hong Kong ............................................. 541 350 350 Egypt ...................................................... 300 310 320 Canada ................................................... 245 215 215 Mexico .................................................... 202 200 205 Taiwan .................................................... 176 190 200 Malaysia ................................................. 215 210 195 Israel ....................................................... 132 145 155 Saudi Arabia ........................................... 134 140 145
Principle exporters, swine: European Union ..................................... 2,933 3,650 3,900 United States .......................................... 2,665 2,856 3,221 Canada ................................................... 1,331 1,330 1,400 Brazil ...................................................... 730 860 1,000 Chile ....................................................... 200 240 270 Mexico .................................................... 178 215 250 China ...................................................... 203 130 100 Russia .................................................... 45 60 80 Australia ................................................. 47 40 42 Serbia ..................................................... 14 18 20 South Africa ............................................ 17 17 17 Argentina ................................................ 8 11 12 Belarus ................................................... 14 12 10 Vietnam .................................................. 35 15 10 Norway ................................................... 5 6 5
Principle importers, swine: China ...................................................... 1,561 2,600 3,700 Japan ...................................................... 1,481 1,510 1,490 Mexico .................................................... 1,188 1,200 1,235 Korea, South .......................................... 753 685 695 United States .......................................... 473 434 401 Hong Kong ............................................. 423 335 300 Philippines .............................................. 287 240 300 Canada ................................................... 233 250 260 Australia ................................................. 216 260 240 Colombia ................................................ 129 155 175 Chile ....................................................... 98 130 150 Singapore ............................................... 125 123 124 Taiwan .................................................... 109 107 105 Russia .................................................... 87 130 80 Vietnam .................................................. 20 50 75
FAS, Office of Global Analysis, (202) 720-6301. Prepared or estimated on the basis of official USDA production, supply, and distribution statistics from foreign governments.

VII–48 STATISTICS OF CATTLE, HOGS, AND SHEEP
Table 7-65.—Meats: Production and consumption, United States, 2010–2019 1
Year
Beef Veal Lamb and mutton
Production
Consumption Produc-
tion
Consumption Produc-
tion
Consumption
Total Per capita Total Per
capita Total Per capita
Million Million Million Million Million Million pounds pounds Pounds pounds pounds Pounds pounds pounds Pounds
2010 ...... 26,412 26,390 85.2 145 150 0.5 168 318 1.0 2011 ...... 26,281 25,538 81.8 136 137 0.4 153 295 0.8 2012 ...... 25,989 25,748 81.9 125 123 0.4 161 299 1.0 2013 ...... 25,790 25,476 80.5 117 119 0.4 161 324 1.0 2014 ...... 24,316 24,682 77.4 100 98 0.3 161 340 1.1 2015 ...... 23,760 24,769 77.2 88 88 0.3 155 357 1.1 2016 ...... 25,288 25,669 79.4 81 73 0.2 155 381 1.2 2017 ...... 26,250 26,492 81.5 80 78 0.2 150 396 1.2 2018 ...... 26,942 26,767 81.9 80 89 0.3 158 415 1.3 2019 ...... 27,221 27,272 83.0 79 81 0.2 153 422 1.3
Year
Pork All meats
Production
Consumption
Production
Consumption
Total Per capita Total Per
capita
Million Million Million Million pounds pounds Pounds pounds pounds Pounds
2010 ...... 22,456 19,076 61.6 49,181 45,934 148 2011 ...... 22,775 18,382 58.9 49,232 44,351 142 2012 ...... 23,268 18,607 59.2 49,543 44,778 142 2013 ...... 23,203 19,104 60.4 49,271 45,022 142 2014 ...... 22,858 18,836 59.1 47,435 43,955 138 2015 ...... 24,517 20,592 64.6 48,520 45,806 143 2016 ...... 24,957 20,892 64.6 50,388 47,015 145 2017 ...... 25,598 21,034 64.7 51,991 48,000 148 2018 ...... 26,330 21,490 65.7 53,417 48,758 149 2019 ...... 27,652 22,188 67.5 55,015 49,966 152
1 Carcass weight equivalent or dressed weight. Beginning 1977, pork production was no longer reported as ‘‘pork, exclud-ing lard.’’ This series has been revised to reflect pork production in prior years on a dressed weight basis that is comparable with the method used to report beef, veal, and lamb and mutton. Edible offals are excluded. Shipments to the U.S. terri-tories are included in domestic consumption.
ERS, Animal Products and Cost of Production Branch, (202) 694–5409.
Table 7-66.—Hides, packer: Average price per piece, Central U.S., 2010–2019
Year
Steers Heifers
Heavy native Heavy Texas Butt branded Colorado branded Heavy native Branded
Dollars Dollars Dollars Dollars Dollars Dollars
2010 ....................... 71.93 72.30 70.77 67.31 63.44 67.57 2011 ....................... 82.17 81.70 80.77 76.42 74.39 71.17 2012 ....................... 84.53 84.23 84.28 79.83 71.77 70.19 2013 ....................... 98.73 95.74 98.56 94.38 84.68 82.90 2014 ....................... 110.98 106.37 108.95 103.05 93.45 89.68 2015 ....................... 84.29 77.13 82.57 75.98 65.00 59.76 2016 ....................... 73.88 68.02 72.37 60.11 58.39 53.00 2017 ....................... 67.05 59.13 65.21 (NA) 51.77 42.76 2018 ....................... 68.19 39.29 50.98 39.36 38.17 33.72 2019 ....................... 24.57 36.96 28.61 21.94 16.00 16.46
(NA) Not available. AMS, Livestock & Grain Market News, (202) 720–7316.

VII–49 AGRICULTURAL STATISTICS 2020
Table 7-67.—Hides and skins: United States imports by country of origin, 2017–2019
Country of origin 2017 2018 2019
Number
Furskins: Canada ............................................... 1,994,609 915,358 1,169,297 Ukraine ............................................... 184,949 207,500 358,000 Czech Republic .................................. 62,050 0 230,000 Uruguay .............................................. 42,840 46,379 52,745 Finland ................................................ 48,652 64,193 47,243 Spain ................................................... 16,269 0 25,121 Poland ................................................. 24,357 16,251 14,077 Belgium-Luxembourg(*) ...................... 121,399 200,362 8,889 Denmark(*) ......................................... 9,477 6,493 7,415 Latvia .................................................. 708 1,524 2,139 Netherlands ........................................ 19,429 2,741 955 Lithuania ............................................. 842 532 891 Greece ................................................ 113,477 891 718 China .................................................. 12,250 752 364 Romania ............................................. 1,241 3,913 210 Ireland ................................................. 0 0 111 Italy(*) ................................................. 810 477 111 Hong Kong .......................................... 6,887 8 54 France(*) ............................................. 56 1,742 47 Thailand .............................................. 0 0 40 Mexico ................................................ 13,088 12,163 30 United Arab Emirates ......................... 788 715 23 Turkey ................................................. 0 0 11 Moldova .............................................. 0 0 2 South Africa ........................................ 4 4 1 Albania ................................................ 190 0 0 Armenia .............................................. 107 25 0 Argentina ............................................ 40 0 0 Bosnia and Herzegovina .................... 1,572 0 0 Bulgaria ............................................... 10 12 0 Rest of World ...................................... 114,288 26,017 0
World Total ......................................... 2,790,389 1,508,052 1,918,494
Pieces
Hides and skins: Canada ............................................... 625,09 653,668 347,052 United Kingdom .................................. 445,751 426,434 342,439 Belgium-Luxembourg(*) ...................... 203,691 196,535 118,831 Mexico ................................................ 16,644 9,235 31,822 Brazil ................................................... 18,484 19,641 14,560 Australia(*) .......................................... 5,200 3,429 8,080 Thailand .............................................. 5,746 4,747 7,923 Italy(*) ................................................. 10,209 10,563 6,920 Papua New Guinea ............................ 0 0 6,024 Turkey ................................................. 4 32 5,778 Cote d’Ivoire ....................................... 2,658 2,139 4,411 New Zealand(*) ................................... 4,076 16,504 3,855 Argentina ............................................ 15,731 15,211 2,719 France(*) ............................................. 115 6,549 2,669 Colombia ............................................. 27,056 13,694 2,016 Dominican Republic ............................ 1,311 0 1,326 Senegal ............................................... 200 401 770 Japan .................................................. 0 27 695 Guinea ................................................ 177 350 650 Zimbabwe ........................................... 343 4 628 Netherlands ........................................ 0 120 626 Denmark(*) ......................................... 0 32 614 India .................................................... 311 411 557 Spain ................................................... 515 13,096 375 Singapore ........................................... 6 21 300 Austria ................................................. 0 0 262 China .................................................. 209 4,939 211 South Africa ........................................ 124 41 108 Indonesia ............................................ 211 364 101 Poland ................................................. 0 1 26 Rest of World ...................................... 65,857 6,273 83
World Total ......................................... 1,449,725 1,404,461 912,431
(*) Denotes a country that is a summarization of its component countries. FAS, Office of Global Analysis, (202) 720–6301. Data as of March 17, 2020.

VII–50 STATISTICS OF CATTLE, HOGS, AND SHEEP
Table 7-68.—Hides: U.S. trade exports, 2017–2019
Country 2017 2018 2019
Pieces
Bovine hides, whole: China ....................................... 10,539,888 8,882,126 8,802,149 Korea, South ........................... 2,540,183 2,473,837 2,679,460 Mexico ..................................... 1,540,934 1,669,958 2,022,979 Thailand .................................. 880,929 1,496,653 921,491 Taiwan .................................... 556,770 374,302 387,391 Japan ...................................... 151,841 175,111 181,501 Brazil ....................................... 34,355 159,598 163,587 Indonesia ................................ 228,318 192,279 96,343 Netherlands ............................. 33,036 64,156 71,727 Vietnam ................................... 50,745 30,249 62,831 Italy(*) ...................................... 191,691 183,274 60,211 India ........................................ 19,200 45,512 43,868 Turkey ..................................... 100,643 114,151 42,311 Cambodia ................................ 0 0 23,730 Ethiopia(*) ............................... 0 633 21,189 Hong Kong .............................. 29,274 11,744 14,005 Bosnia and Herzegovina ........ 83,510 55,347 11,208 Slovenia .................................. 4,959 77,747 10,186 Egypt ....................................... 0 0 9,325 Germany(*) ............................. 10,277 3,110 4,178 Belgium-Luxembourg(*) .......... 66,007 2,675 3,560 Austria ..................................... 960 1,539 3,456 Israel(*) ................................... 0 1,211 3,213 Colombia ................................. 2,557 0 3,166 Spain ....................................... 8,796 16,837 2,399 Philippines ............................... 0 1,680 1,760 Portugal ................................... 0 0 920 Bahamas, The ........................ 0 0 708 Ecuador ................................... 0 0 365 Haiti ......................................... 0 900 349 Rest of World .......................... 20,184 12,600 531
World Total ............................. 17,095,057 16,047,229 15,650,097
Other cattle hides: Mexico ..................................... 1,582,984 1,573,810 363,402 Spain ....................................... 1,920 38,133 36,036 Japan ...................................... 42,221 33,131 35,151 Thailand .................................. 54,389 65,130 29,731 Hong Kong .............................. 12,893 12,465 20,748 China ....................................... 43,804 36,094 19,656 Korea, South ........................... 31,119 9,210 10,721 Vietnam ................................... 25,697 7,459 3,541 Italy(*) ...................................... 0 630 3,199 Austria ..................................... 0 247 1,669 Cambodia ................................ 0 0 1,070 Sweden ................................... 188 734 1,039 United Kingdom ...................... 0 7,396 963 Portugal ................................... 0 0 944 India ........................................ 981 1,077 935 Taiwan .................................... 0 7,210 567 Philippines ............................... 0 0 116 Bangladesh ............................. 420 199 0 Brazil ....................................... 7,173 26 0 Dominican Republic ................ 2,750 167 0 Germany(*) ............................. 16,404 4,327 0 Greece .................................... 523 0 0 Indonesia ................................ 171 64 0 Netherlands ............................. 28,554 1,120 0
World Total ............................. 1,852,191 1,798,629 529,488
See footnote(s) at end of table.

VII–51 AGRICULTURAL STATISTICS 2020
Table 7-68.—Hides: U.S. trade exports, 2017–2019—Continued
Country 2017 2018 2019
Pieces
Horse hides, whole: China ...................................................... 201,061 98,244 25,616 Korea, South .......................................... 50,596 69,395 23,746 Netherlands ............................................ 0 0 2,675 Canada ................................................... 10,936 8,965 1,762 Togo ....................................................... 0 24 349 Mexico .................................................... 154,247 21,326 88 Nigeria .................................................... 60 351 82 Indonesia ................................................ 2,720 9,852 31 Australia(*) .............................................. 25 0 0 Bermuda ................................................. 97 0 0 Costa Rica .............................................. 135 0 0 Ireland .................................................... 0 333 0 Germany(*) ............................................. 0 1 0 Hong Kong ............................................. 44,146 0 0 Honduras ................................................ 0 1,757 0 Israel(*) ................................................... 0 3,507 0 Italy(*) ..................................................... 3,600 0 0 Liberia ..................................................... 0 112 0 New Zealand(*) ...................................... 0 2,000 0 Sweden .................................................. 0 223 0 Thailand .................................................. 19,523 0 0 Taiwan .................................................... 12,667 14,608 0 United Kingdom ...................................... 1,520 0 0 Vietnam .................................................. 7,830 5,418 0
World Total ............................................. 509,163 263,116 54,349
Calf skins, whole: China ...................................................... 1,371,637 1,685,359 1,496,510 Mexico .................................................... 273,229 393,267 329,255 Korea, South .......................................... 319,216 690,135 316,701 Italy(*) ..................................................... 171,269 114,591 217,430 Thailand .................................................. 201,429 125,508 186,439 Netherlands ............................................ 0 0 42,678 Indonesia ................................................ 3,897 0 31,248 Costa Rica .............................................. 73,001 75,133 28,894 Israel(*) ................................................... 61,728 46,744 27,109 India ........................................................ 58,427 32,319 25,739 Cambodia ............................................... 0 0 19,810 Vietnam .................................................. 5,733 5,092 15,844 Spain ...................................................... 0 0 12,724 Hong Kong ............................................. 9,052 8,481 12,000 Colombia ................................................ 0 0 3,849 Japan ...................................................... 22,043 7,902 2,726 Germany(*) ............................................. 7,797 20,765 1,926 Turkey .................................................... 27,175 13,892 1,800 Brazil ...................................................... 0 4,628 1,600 Dominican Republic ............................... 0 0 1,530 Belgium-Luxembourg(*) .......................... 0 0 1,360 Ghana ..................................................... 0 424 1,129 Guatemala .............................................. 0 0 558 Sri Lanka ................................................ 0 0 174 Nigeria .................................................... 0 0 119 Kuwait ..................................................... 0 85 56 France(*) ................................................ 1,078 150 11 Australia(*) .............................................. 145 0 0 Austria .................................................... 53 0 0 Bahamas, The ........................................ 0 96 0 Rest of World ......................................... 21,444 21,080 0
World Total ............................................. 2,628,353 3,245,651 2,779,219
Sheep & lamb skins: China ...................................................... 818,429 635,279 483,942 Turkey .................................................... 56,760 116,840 55,153 Russia .................................................... 19,200 55,860 22,650 Brazil ...................................................... 15,392 13,109 19,515 Mexico .................................................... 32,089 18,615 18,331 Germany(*) ............................................. 9,125 11,683 8,000 Spain ...................................................... 0 2,685 3,990 Canada ................................................... 3,015 2,987 3,929 Poland .................................................... 3,667 28,310 2,473 Pakistan .................................................. 0 748 243 Bolivia ..................................................... 0 0 120 Colombia ................................................ 90 0 0 Italy(*) ..................................................... 500 0 0 Korea, South .......................................... 2,155 0 0 Netherlands Antilles(*) ........................... 667 0 0 United Kingdom ...................................... 137 2,800 0
World Total ............................................. 961,226 888,916 618,346
See footnote(s) at end of table.

VII–52 STATISTICS OF CATTLE, HOGS, AND SHEEP
Table 7-68.—Hides: U.S. trade exports, 2017–2019—Continued
Country 2017 2018 2019
Pieces
Other hides & skins: Mexico .................................................... 1,867,504 1,643,008 1,140,446 China ...................................................... 2,042,535 1,437,489 675,774 Thailand .................................................. 1,651,170 1,285,795 508,765 Vietnam .................................................. 161,765 52,284 302,451 Korea, South .......................................... 901,190 500,102 287,340 France(*) ................................................ 111,452 195,816 183,271 United Kingdom ...................................... 91,000 106,135 103,746 Singapore ............................................... 113,034 105,229 103,713 Germany(*) ............................................. 44,920 66,123 91,136 Italy(*) ..................................................... 174,131 156,409 75,557 Taiwan .................................................... 1,381,408 396,557 70,056 Indonesia ................................................ 0 35,479 22,919 Portugal .................................................. 0 2,985 10,606 Canada ................................................... 47,778 17,397 8,212 Spain ...................................................... 7,578 0 5,419 India ........................................................ 3,435 0 4,124 Malaysia ................................................. 7,594 5,973 1,885 Japan ...................................................... 32,371 12,864 1,739 Philippines .............................................. 0 0 826 Brazil ...................................................... 51,668 17,374 647 Djibouti ................................................... 0 127 550 Pakistan .................................................. 1,200 2,449 453 Cambodia ............................................... 83,899 189,891 242 Guatemala .............................................. 0 0 200 Bosnia and Herzegovina ........................ 0 160 126 Australia(*) .............................................. 0 0 0 Barbados ................................................ 0 395 0 Belgium-Luxembourg(*) .......................... 1,000 515 0 Bangladesh ............................................ 972 0 0 Sri Lanka ................................................ 340 0 0 Rest of World ......................................... 33,018 41,435 0
World Total ............................................. 8,810,962 6,271,991 3,600,203
Number
Other furskins: Canada ................................................... 491,395 853,684 872,982 China ...................................................... 566,762 427,458 374,809 Hong Kong ............................................. 95,216 154,208 132,831 Cambodia ............................................... 10,552 19,878 125,363 Pakistan .................................................. 15,860 15,900 53,063 Portugal .................................................. 10,028 45,015 42,789 Belgium-Luxembourg(*) .......................... 0 41,077 9,687 Germany(*) ............................................. 7,247 24,168 3,730 Thailand .................................................. 0 0 3,156 Italy(*) ..................................................... 1,905 23,707 2,891 Greece .................................................... 3,663 1,625 2,005 Vietnam .................................................. 0 3,449 1,362 Turkey .................................................... 0 416 1,200 Lithuania ................................................. 0 0 1,005 Mexico .................................................... 511 0 768 France(*) ................................................ 13,604 3,697 767 Finland .................................................... 0 500 600 Chile ....................................................... 0 0 4 Argentina ................................................ 270 0 0 Costa Rica .............................................. 128 0 0 Dominican Republic ............................... 850 0 0 Haiti ........................................................ 0 0 0 Indonesia ................................................ 0 685 0 India ........................................................ 6,084 0 0 Japan ...................................................... 396 0 0 Korea, South .......................................... 6,768 0 0 Latvia ...................................................... 0 0 0 Spain ...................................................... 0 259 0 Switzerland(*) ......................................... 0 200 0 United Kingdom ...................................... 0 157 0 Rest of World ......................................... 1,095 0 0
World Total ............................................. 1,232,334 1,616,083 1,629,012
(*) Denotes a country that is a summarization of its component countries. FAS, Office of Global Analysis, (202) 720-6301. Data Source: U.S. Census Bureau Trade Data, as of March 17, 2020.

VII–53 AGRICULTURAL STATISTICS 2020
Table 7-69.—Mink: Farms, pelts produced, average price, and value, United States, 2009–2018
Year Mink farms Pelts produced Average marketing price Value of mink pelts
Number Number Dollars Dollars
2009 ............... 278 2,866,700 65.10 186,622,170 2010 ............... 265 2,840,200 81.90 232,612,380 2011 ............... 268 3,091,470 94.30 291,525,621 2012 1 ............. (NA) (NA) (NA) (NA) 2013 ............... (NA) 3,544,610 56.30 199,561,543 2014 ............... (NA) 3,741,150 57.70 215,864,355 2015 ............... (NA) 3,682,960 32.00 117,854,720 2016 ............... (NA) 3,454,410 34.70 119,868,027 2017 ............... (NA) 3,305,440 36.30 119,987,472 2018 ............... ........................................ ........................................ ........................................ ........................................
(NA) Not available. 1 Due to sequestration the Mink report was suspended. NASS, Livestock Branch, (202) 720–3570.
Table 7-70.—Mink pelts: Pelts produced by color class, selected States, and United States, 2017
State Black Demi/Wild Pastel Sapphire Blue Iris Mahogany
Number Number Number Number Number Number
Idaho ....................... 94,000 (D) 14,000 11,500 (D) 165,000 Illinois ...................... 51,000 - - (D) - (D) Iowa ......................... 44,000 - (D) 2,900 (D) 36,000 Michigan .................. 59,000 - 500 200 (D) 1,200 Minnesota ................ (D) (D) (D) (D) (D) 37,000 Montana .................. (D) (D) - - - - Ohio ......................... (D) (D) - (D) - (D) Oregon .................... 210,000 - - (D) 44,000 (D) Pennsylvania ........... 33,000 (D) 5,500 11,500 (D0 (D) Utah ......................... 280,000 24,000 33,000 45,000 1,900 285,000 Washington ............. 27,000 - - - (D) (D) Wisconsin ................ 690,000 (D) 33,000 39,000 116,000 49,000 Other States 1 .......... 151,150 86,010 11,810 88,800 40,730 56,200
United States ........... 1,639,150 110,010 97,810 198,900 184,120 629,400
State Pearl Lavender Violet White Other Total 2
Number Number Number Number Number Number
Idaho ....................... - (D) (D) (D) (D) 313,500 Illinois ...................... (D) - - (D) - 81,100 Iowa ......................... - - - (D) - 88,210 Michigan .................. - 3,500 (D) 7,500 - 77,700 Minnesota ................ - - (D) 31,000 (D) 180,580 Montana .................. - - - - - (D) Ohio ......................... (D) (D) (D) (D) - (D) Oregon .................... - (D) (D) - - 283,670 Pennsylvania ........... (D) (D) (D) (D) (D) 68,130 Utah ......................... (D) (D) (D) (D) (D) 734,260 Washington ............. - - - - - 44,000 Wisconsin ................ - 20,000 (D) 151,000 (D) 1,091,180 Other States 1 .......... 115,510 10,630 42,730 52,730 11,450 343,110
United States ........... 115,510 34,130 42,730 242,230 11,450 3,305,440
- Represents zero. (D) Withheld to avoid disclosing data for individual operations. 1 Other States include New Hamp-shire, New Jersey, New York, North Carolina, South Dakota, and some pelts from the above listed States that were not pub-lished to avoid disclosing individual operations. 2 Published color classes may not add to the State total to avoid disclosing individual operations.
NASS, Livestock Branch, (202) 720–3570.

VII–54 STATISTICS OF CATTLE, HOGS, AND SHEEP
Table 7-71.—Livestock: Inventory and value, United States, Jan. 1, 2016–2018
Class of livestock and poultry
Inventory Value
2016 2017 2018 Per head 1 Total
2016 2017 2018 2016 2017 2018
1,000 1,000 1,000 1,000 1,000 1,000 Dollars Dollars Dollars Dollars Dollars Dollars
Angora goats 2 ..... 150 152 144 117 130 124 14,757 16,827 14,584 Cattle ................... 91,888 93,624 94,298 1,410 1,109 1,146 129,562,080 103,829,681 108,065,508 Chickens 3 ............ 500,608 514,838 527,573 4.23 4.20 4.33 2,115,245 2,162,545 2,284,164 Hogs 3 .................. 71,345 73,145 74,915 92 99 98 6,578,419 7,206,965 7,298,943 Sheep and lambs 5,295 5,270 5,265 202 203 204 1,071,467 1,067,857 1,071,378
1 Based on reporters’ estimates of average price per head in their localities. 2 Four-State total for angora goats (Arizona, California, New Mexico, Texas). 3 Dec. 1 of preceding year.
NASS, Livestock Branch, (202) 720–3570.
Table 7-72.—Livestock: Market year for specified commodities
Cattle market year average price received: United States marketing years 2009–2018 1
Year Cows 2 Steers and heifers Calves Beef cattle 3 Milks cows 4
Dollars Dollars Dollars Dollars Dollars
2009 ............ 44.80 85.40 105.00 80.30 1,390.00 2010 ............ 54.80 97.70 117.00 92.20 1,330.00 2011 ............ 71.20 117.00 142.00 113.00 1,420.00 2012 ............ 81.70 123.00 172.00 121.00 1,430.00 2013 ............ 82.30 126.00 181.00 125.00 1,380.00 2014 ............ 107.00 153.00 261.00 152.00 1,830.00 2015 ............ 103.00 148.00 247.00 147.00 1,990.00 2016 ............ 74.30 121.00 158.00 119.00 1,760.00 2017 ............ 69.10 122.00 168.00 120.00 1,620.00 2018 ............ 62.60 117.00 170.00 115.00 1,360.00
Hog market year average price received: United States marketing years 2008–2017 5
Year Barrows and gilts Sows All Hogs
Dollars Dollars Dollars
2008 .......................... 47.90 29.20 47.00 2009 .......................... 42.00 36.10 41.60 2010 .......................... 54.40 48.70 54.10 2011 .......................... 65.70 57.50 65.30 2012 .......................... 64.60 51.30 64.20 2013 .......................... 67.30 62.90 67.20 2014 .......................... 76.50 77.70 76.50 2015 .......................... 55.70 44.90 55.30 2016 .......................... 53.50 44.50 53.10 2017 .......................... 50.50 41.30 50.20
1 Market year for cattle January 1-December 31 for United States and all States. 2 Cows includes beef cows and cull dairy cows sold for slaughter. 3 All beef includes steer and heifers combined and cows. 4 Milk cow prices are calendar year average. 5 Market year for hogs December 1-November 30 for United States and all States.
NASS, Livestock Branch, (202) 720–3570.

VII–55 AGRICULTURAL STATISTICS 2020
Table 7-74.—Frozen meat: Cold storage holdings, end of month, United States, 2017–2018
Month Boneless beef Beef bone-in Total beef
2017 2018 2017 2018 2017 2018
1,000 pounds
January ....... 499,000 458,749 39,215 42,995 538,215 501,744 February ...... 463,934 416,438 38,514 42,901 502,448 459,339 March .......... 422,572 426,232 41,429 37,725 464,001 463,957 April ............. 415,592 435,196 42,826 35,964 458,418 471,160 May ............. 376,699 426,089 34,799 38,565 411,498 464,654 June ............ 383,658 407,131 31,668 41,454 415,326 448,585 July .............. 398,071 444,089 33,765 40,159 431,836 484,248 August ......... 438,094 457,392 38,473 43,923 476,567 501,315 September ... 454,439 458,904 41,576 48,262 496,015 507,166 October ....... 462,093 468,424 44,948 47,150 507,041 515,574 November .... 443,927 473,863 41,260 40,835 485,187 514,698 December .... 445,881 462,072 42,176 33,552 488,057 495,624
Month Picnics Bellies Butts
2017 2018 2017 2018 2017 2018
1,000 pounds
January ....... 8,993 7,074 13,995 43,810 23,243 25,477 February ...... 8,437 8,644 16,153 49,012 22,052 22,503 March .......... 8,783 11,314 20,570 59,202 21,925 20,629 April ............. 7,210 10,094 33,536 64,563 21,264 20,904 May ............. 7,741 10,110 31,589 61,234 19,862 15,313 June ............ 7,698 7,268 22,291 53,279 15,057 15,734 July .............. 6,648 8,157 17,602 38,556 14,502 13,218 August ......... 8,176 8,874 19,213 34,805 16,308 11,498 September ... 8,745 8,375 20,897 30,354 17,247 13,282 October ....... 8,055 7,879 32,268 26,690 21,249 17,014 November .... 6,866 6,644 35,164 36,859 25,799 17,623 December .... 5,982 6,832 39,620 42,251 23,883 16,749
Month
Hams
Bone-in Boneless Total
2017 2018 2017 2018 2017 2018
1,000 pounds
January ....... 34,094 35,572 61,271 82,835 95,365 118,407 February ...... 50,874 36,932 74,293 85,811 125,167 122,743 March .......... 28,850 24,234 61,343 72,105 90,193 96,339 April ............. 36,689 23,694 76,126 88,451 112,815 112,145 May ............. 51,222 41,898 92,419 97,397 143,641 139,295 June ............ 74,248 54,794 104,063 93,863 178,311 148,657 July .............. 87,178 71,184 107,790 96,379 194,968 167,563 August ......... 91,736 91,764 112,151 112,999 203,887 204,763 September ... 99,301 93,281 132,733 121,347 232,034 214,628 October ....... 79,733 76,417 115,594 99,692 195,327 176,109 November .... 27,715 37,122 70,509 59,253 98,224 96,375 December .... 15,458 15,714 65,624 57,404 81,082 73,118
Month
Loins
Bone-in Boneless Total
2017 2018 2017 2018 2017 2018
1,000 pounds
January ....... 14,212 14,276 25,493 26,497 39,705 40,773 February ...... 13,911 14,638 24,244 24,102 38,155 38,740 March .......... 13,753 13,081 22,608 26,472 36,361 39,553 April ............. 16,365 12,958 26,507 26,872 42,872 39,830 May ............. 15,502 12,205 24,855 24,314 40,357 36,519 June ............ 13,168 9,889 26,729 22,060 39,897 31,949 July .............. 9,826 7,261 24,052 19,353 33,878 26,614 August ......... 10,180 9,810 22,461 20,765 32,641 30,575 September ... 12,129 11,130 22,162 22,633 34,291 33,763 October ....... 10,971 9,790 25,956 24,426 36,927 34,216 November .... 9,007 10,279 27,433 23,644 36,440 33,923 December .... 9,684 11,221 25,445 22,871 35,129 34,092
See footnote(s) at end of table.

VII–56 STATISTICS OF CATTLE, HOGS, AND SHEEP
Table 7-74.—Frozen meat: Cold storage holdings, end of month, United States, 2017–2018—Continued
Month Ribs Trimmings Other frozen pork
2017 2018 2017 2018 2017 2018
1,000 pounds
January ....... 128,029 114,366 34,281 48,602 85,023 104,544 February ...... 139,525 131,600 37,339 51,186 86,028 97,215 March .......... 140,639 143,957 40,087 56,318 83,593 93,548 April ............. 136,875 143,717 40,613 57,490 88,858 90,657 May ............. 114,460 119,286 37,308 56,969 91,386 92,610 June ............ 85,993 88,871 32,781 45,132 90,064 85,049 July .............. 77,182 84,171 29,858 40,372 91,725 86,046 August ......... 74,341 77,803 34,811 42,253 99,330 86,905 September ... 88,032 83,403 34,643 38,499 99,095 81,592 October ....... 94,859 101,369 33,185 42,156 94,458 79,323 November .... 100,218 108,324 37,484 43,033 93,602 81,265 December .... 104,264 124,310 43,080 48,441 86,880 78,855
Month Variety meats Unclassified pork Total pork
2017 2018 2017 2018 2017 2018
1,000 pounds
January ....... 52,415 30,735 43,166 46,926 524,215 580,714 February ...... 50,908 33,161 44,091 55,009 567,855 609,813 March .......... 54,430 35,875 48,882 54,278 545,463 611,013 April ............. 54,471 36,544 51,810 58,778 590,324 634,722 May ............. 49,848 34,681 52,024 57,708 588,216 623,725 June ............ 39,419 34,438 47,499 51,502 559,010 561,879 July .............. 40,879 34,439 47,612 52,893 554,854 552,029 August ......... 37,736 34,307 49,255 49,730 575,698 581,513 September ... 37,231 37,030 46,348 48,477 618,563 589,403 October ....... 35,495 36,193 46,551 49,968 598,374 570,917 November .... 28,709 36,001 39,818 47,621 502,324 507,668 December .... 27,965 34,009 42,162 46,630 490,047 505,287
Month Veal Lamb & mutton Total red meat
2017 2018 2017 2018 2017 2018
1,000 pounds
January ....... 18,535 19,912 20,361 26,790 1,101,326 1,129,160 February ...... 16,950 21,158 25,694 28,280 1,112,947 1,118,590 March .......... 16,104 20,780 25,792 28,615 1,051,360 1,124,365 April ............. 15,383 20,033 28,603 33,992 1,092,728 1,159,907 May ............. 12,870 18,206 29,859 35,591 1,042,443 1,142,176 June ............ 12,297 14,954 26,177 38,678 1,012,810 1,064,096 July .............. 16,329 18,096 26,770 42,129 1,029,789 1,096,502 August ......... 15,311 14,179 32,383 39,386 1,099,959 1,136,393 September ... 13,669 13,736 31,415 40,466 1,159,662 1,150,771 October ....... 12,344 9,842 31,594 39,321 1,149,353 1,135,654 November .... 15,799 9,106 28,977 37,859 1,032,287 1,069,331 December .... 16,373 8,238 26,714 36,454 1,021,191 1,045,603
NASS, Livestock Branch, (202) 720–3570.

VIII–1
CHAPTER VIII
DAIRY AND POULTRY STATISTICS
Dairy statistics in this chapter include series relating to many phases of production, movement, prices, stocks, and consumption of milk and its products. Two series of number of milk cows on farms are included in this publication. One series is an inventory number of a specific classification estimated as one of the major groups making up the total cattle population on January 1. The other series identified as ‘‘milk cows’’ is an annual average number of milk cows during the year (exclud-ing any not yet fresh) and is used in estimating milk production.
In comparing the several series of milk prices, it is important to note that prices received by farm-ers for all whole milk sold are for milk or milkfat content as actually sold, while certain prices paid by dealers for milk for fluid purposes or for specified manufacturing purposes may be quoted on a 3.5 percent butterfat basis, or for some types of manufacturing milk on the test of the milk used for that particular purpose.
Poultry and poultry products statistics include inventory numbers of chickens by classes; the pro-duction, disposition, cash receipts, and gross income from chickens and eggs; poultry and egg re-ceipts at principal markets; commercial broiler production; turkey production, disposition, and gross income; poultry and eggs under Federal inspection; and the National Poultry Improvement Plan. Esti-mates relating to inventories, production, and income exclude poultry and eggs produced on places not classified as farms.
Table 8-1.—Milk cows and heifers: Number that have calved and heifers 500 pounds and over kept for milk cow replacements, United States, Jan. 1, 2010–2019
Year Milk cows and heifers that have calved Heifers 500 pounds and over kept for milk cow replacements
Thousands Thousands
2010 ....................... 9,087 4,551 2011 ....................... 9,156 4,577 2012 ....................... 9,236 4,618 2013 ....................... 9,221 4,546 2014 ....................... 9,209 4,539 2015 ....................... 9,312 4,710 2016 ....................... 9,312 4,814 2017 ....................... 9,369 4,754 2018 ....................... 9,432 4,768 2019 ....................... 9,353 4,702
NASS, Livestock Branch, (202) 720–3570.

VIII–2 DAIRY AND POULTRY STATISTICS
Table 8-2.—Milk cows and heifers: Number that have calved and heifers 500 pounds and over kept for milk cow replacements, by State and United States, Jan. 1, 2018 and 2019
State
Milk cows and heifers that have calved
Heifers 500 pounds and over kept for milk cow replacements
2018 2019 2018 2019
Thousands Thousands Thousands Thousands
Alabama ................................. 6 .0 5 .0 3 .0 2 .0 Alaska .................................... 0 .3 0 .2 0 .1 0 .1 Arizona ................................... 210 .0 205 .0 105 .0 115 .0 Arkansas ................................ 6 .0 5 .0 4 .0 4 .0 California ................................ 1,740 .0 1,730 .0 780 .0 760 .0 Colorado ................................ 168 .0 178 .0 100 .0 110 .0 Connecticut ............................ 20 .0 19 .5 9 .5 9 .0 Delaware ................................ 5 .0 4 .5 2 .0 1 .6 Florida .................................... 124 .0 116 .0 40 .0 35 .0 Georgia .................................. 85 .0 81 .0 25 .0 30 .0 Hawaii .................................... 2 .0 1 .5 1 .0 1 .0 Idaho ...................................... 600 .0 614 .0 310 .0 340 .0 Illinois ..................................... 93 .0 85 .0 47 .0 45 .0 Indiana ................................... 187 .0 181 .0 75 .0 80 .0 Iowa ....................................... 220 .0 220 .0 135 .0 125 .0 Kansas ................................... 156 .0 161 .0 140 .0 170 .0 Kentucky ................................ 57 .0 53 .0 45 .0 45 .0 Louisiana ................................ 12 .0 11 .0 4 .0 4 .0 Maine ..................................... 30 .0 29 .0 15 .0 14 .0 Maryland ................................ 47 .0 44 .0 28 .0 30 .0 Massachusetts ....................... 11 .5 10 .5 7 .0 6 .5 Michigan ................................. 428 .0 422 .0 176 .0 160 .0 Minnesota .............................. 455 .0 450 .0 290 .0 255 .0 Mississippi .............................. 9 .0 8 .0 7 .0 5 .0 Missouri .................................. 84 .0 81 .0 40 .0 40 .0 Montana ................................. 13 .0 12 .0 7 .0 8 .0 Nebraska ................................ 60 .0 59 .0 15 .0 15 .0 Nevada ................................... 32 .0 33 .0 12 .0 11 .0 New Hampshire ..................... 12 .5 12 .0 7 .0 6 .5 New Jersey ............................ 6 .0 5 .5 3 .2 3 .3 New Mexico ........................... 332 .0 325 .0 130 .0 125 .0 New York ............................... 625 .0 625 .0 350 .0 335 .0 North Carolina ........................ 45 .0 43 .0 17 .0 20 .0 North Dakota .......................... 16 .0 15 .0 9 .0 8 .0 Ohio ....................................... 264 .0 253 .0 121 .0 125 .0 Oklahoma ............................... 42 .0 40 .0 25 .0 20 .0 Oregon ................................... 124 .0 125 .0 70 .0 65 .0 Pennsylvania .......................... 525 .0 505 .0 310 .0 290 .0 Rhode Island .......................... 0 .8 0 .7 0 .5 0 .5 South Carolina ....................... 15 .0 14 .0 6 .0 5 .0 South Dakota ......................... 119 .0 122 .0 45 .0 40 .0 Tennessee ............................. 40 .0 36 .0 25 .0 25 .0 Texas ..................................... 530 .0 545 .0 250 .0 260 .0 Utah ....................................... 97 .0 100 .0 50 .0 50 .0 Vermont ................................. 128 .0 126 .0 57 .0 55 .0 Virginia ................................... 87 .0 79 .0 40 .0 37 .0 Washington ............................ 275 .0 280 .0 123 .0 123 .0 West Virginia .......................... 7 .0 7 .0 3 .0 3 .0 Wisconsin ............................... 1,275 .0 1,270 .0 700 .0 680 .0 Wyoming ................................ 6 .0 6 .0 4 .0 4 .0
United States ......................... 9,432 .1 9,353 .4 4,768 .3 4,701 .5
NASS, Livestock Branch, (202) 720–3570.

VIII–3 AGRICULTURAL STATISTICS 2020
Table 8-3.—Milk and milkfat production: Number of milk cows, production per cow, and total quantity produced, by State and United States, 2017 1
State Number of milk cows 2
Production of milk and milkfat 3
Per milk cow All milk percent of fat
Total
Milk Milkfat Milk Milkfat
Million Million Thousands Pounds Pounds Percent pounds pounds
Alabama ............ 6.0 15,000 579 3.86 90.0 3.5 Alaska ............... 0.3 9,667 379 3.92 2.9 0.1 Arizona .............. 208.0 24,197 876 3.62 5,033.0 182.2 Arkansas ........... 6.0 13,333 496 3.72 80.0 3.0 California ........... 1,749.0 22,755 876 3.85 39,798.0 1,532.2 Colorado ............ 162.0 25,858 954 3.69 4,189.0 154.6 Connecticut ....... 19.0 22,105 871 3.94 420.0 16.5 Delaware ........... 5.0 18,560 716 3.86 92.8 3.6 Florida ............... 124.0 20,129 743 3.69 2,496.0 92.1 Georgia ............. 84.0 21,905 795 3.63 1,840.0 66.8 Hawaii ............... 2.3 16,913 560 3.31 38.9 1.3 Idaho ................. 600.0 24,388 954 3.91 14,633.0 572.2 Illinois ................ 93.0 20,742 796 3.84 1,929.0 74.1 Indiana .............. 187.0 22,754 851 3.74 4,255.0 159.1 Iowa ................... 218.0 23,757 919 3.87 5,179.0 200.4 Kansas .............. 152.0 23,020 866 3.76 3,499.0 131.6 Kentucky ........... 56.0 18,607 700 3.76 1,042.0 39.2 Louisiana ........... 12.0 13,417 521 3.88 161.0 6.2 Maine ................ 30.0 21,000 809 3.85 630.0 24.3 Maryland ........... 48.0 19,917 761 3.82 956.0 36.5 Massachusetts .. 12.0 17,583 695 3.95 211.0 8.3 Michigan ............ 427.0 26,302 978 3.72 11,231.0 417.8 Minnesota .......... 458.0 21,544 838 3.89 9,867.0 383.8 Mississippi ......... 9.0 15,222 585 3.84 137.0 5.3 Missouri ............. 85.0 14,600 574 3.93 1,241.0 48.8 Montana ............ 13.0 22,154 831 3.75 288.0 10.8 Nebraska ........... 60.0 24,067 924 3.84 1,444.0 55.4 Nevada .............. 32.0 22,156 866 3.91 709.0 27.7 New Hampshire 13.0 21,000 817 3.89 273.0 10.6 New Jersey ....... 6.0 19,833 758 3.82 119.0 4.5 New Mexico ...... 329.0 24,960 909 3.64 8,212.0 298.9 New York .......... 624.0 23,925 921 3.85 14,929.0 574.8 North Carolina ... 45.0 21,156 793 3.75 952.0 35.7 North Dakota ..... 16.0 21,563 826 3.83 345.0 13.2 Ohio ................... 264.0 21,284 822 3.86 5,619.0 216.9 Oklahoma .......... 40.0 18,200 684 3.76 728.0 27.4 Oregon .............. 124.0 20,395 816 4.00 2,529.0 101.2 Pennsylvania ..... 525.0 20,749 795 3.83 10,893.0 417.2 Rhode Island ..... 0.8 16,250 644 3.96 13.0 0.5 South Carolina .. 15.0 16,533 637 3.85 248.0 9.5 South Dakota .... 117.0 22,376 913 4.08 2,618.0 106.8 Tennessee ........ 40.0 17,325 651 3.76 693.0 26.1 Texas ................ 515.0 23,406 946 4.04 12,054.0 487.0 Utah ................... 96.0 23,073 877 3.80 2,215.0 84.2 Vermont ............. 129.0 21,155 819 3.87 2,729.0 105.6 Virginia .............. 87.0 19,954 748 3.75 1,736.0 65.1 Washington ....... 274.0 23,836 953 4.00 6,531.0 261.2 West Virginia ..... 8.0 15,875 602 3.79 127.0 4.8 Wisconsin .......... 1,278.0 23,735 907 3.82 30,333.0 1,158.7 Wyoming ........... 6.0 23,033 838 3.64 138.2 5.0
United States .... 9,406.0 22,914 880 3.84 215,527.0 8,272.3
1 May not add due to rounding. 2 Average number during year, excluding heifers not yet fresh. 3 Excludes milk sucked by calves.
NASS, Livestock Branch, (202) 720–3570.

VIII–4 DAIRY AND POULTRY STATISTICS
Table 8-4.—Milk and milkfat production: Number of milk cows, production per cow, and total quantity produced, by State and United States, 2018 1
State Number of milk cows 2
Production of milk and milkfat 3
Per milk cow All milk percent of fat
Total
Milk Milkfat Milk Milkfat
Million Million Thousands Pounds Pounds Percent pounds pounds
Alabama ............ 5.0 14,600 566 3.88 73.0 2.8 Alaska ............... 0.3 9,333 367 3.93 2.8 0.1 Arizona .............. 208.0 23,933 876 3.66 4,978.0 182.2 Arkansas ........... 6.0 12,333 467 3.79 74.0 2.8 California ........... 1,734.0 23,306 909 3.90 40,413.0 1,576.1 Colorado ............ 176.0 25,892 968 3.74 4,557.0 170.4 Connecticut ....... 19.0 22,474 890 3.96 427.0 16.9 Delaware ........... 4.8 19,063 732 3.84 91.5 3.5 Florida ............... 120.0 19,842 730 3.68 2,381.0 87.6 Georgia ............. 82.0 21,537 784 3.64 1,766.0 64.3 Hawaii ............... 2.0 17,000 588 3.46 34.0 1.2 Idaho ................. 609.0 24,875 985 3.96 15,149.0 599.9 Illinois ................ 90.0 20,867 812 3.89 1,878.0 73.1 Indiana .............. 184.0 22,614 855 3.78 4,161.0 157.3 Iowa ................... 220.0 23,945 943 3.94 5,268.0 207.6 Kansas .............. 159.0 23,321 900 3.86 3,708.0 143.1 Kentucky ........... 55.0 18,345 695 3.79 1,009.0 38.2 Louisiana ........... 11.0 13,818 558 4.04 152.0 6.1 Maine ................ 30.0 20,600 797 3.87 618.0 23.9 Maryland ........... 45.0 20,556 785 3.82 925.0 35.3 Massachusetts .. 11.0 18,364 731 3.98 202.0 8.0 Michigan ............ 424.0 26,340 1,006 3.82 11,168.0 426.6 Minnesota .......... 453.0 21,784 867 3.98 9,868.0 392.7 Mississippi ......... 9.0 14,333 579 4.04 129.0 5.2 Missouri ............. 83.0 14,386 573 3.98 1,194.0 47.5 Montana ............ 12.0 22,833 868 3.80 274.0 10.4 Nebraska ........... 60.0 24,000 926 3.86 1,440.0 55.6 Nevada .............. 32.0 22,938 906 3.95 734.0 29.0 New Hampshire 12.0 20,750 811 3.91 249.0 9.7 New Jersey ....... 6.0 18,333 697 3.80 110.0 4.2 New Mexico ...... 330.0 25,106 929 3.70 8,285.0 306.5 New York .......... 623.0 23,888 922 3.86 14,882.0 574.4 North Carolina ... 44.0 21,295 803 3.77 937.0 35.3 North Dakota ..... 15.0 22,267 875 3.93 334.0 13.1 Ohio ................... 259.0 21,359 831 3.89 5,532.0 215.2 Oklahoma .......... 40.0 18,125 692 3.82 725.0 27.7 Oregon .............. 123.0 20,577 835 4.06 2,531.0 102.8 Pennsylvania ..... 519.0 20,549 783 3.81 10,665.0 406.3 Rhode Island ..... 0.7 16,714 674 4.03 11.7 0.5 South Carolina .. 14.0 17,286 666 3.85 242.0 9.3 South Dakota .... 121.0 22,355 932 4.17 2,705.0 112.8 Tennessee ........ 37.0 17,135 649 3.79 634.0 24.0 Texas ................ 537.0 23,933 984 4.11 12,852.0 528.2 Utah ................... 100.0 23,220 899 3.87 2,322.0 89.9 Vermont ............. 127.0 21,102 823 3.90 2,680.0 104.5 Virginia .............. 83.0 19,699 745 3.78 1,635.0 61.8 Washington ....... 277.0 24,318 987 4.06 6,736.0 273.5 West Virginia ..... 7.0 15,857 606 3.82 111.0 4.2 Wisconsin .......... 1,274.0 24,002 934 3.89 30,579.0 1,189.5 Wyoming ........... 6.0 23,700 863 3.64 142.2 5.2
United States .... 9,399.0 23,149 900 3.89 217,575.0 8,466.0
1 May not add due to rounding. 2 Average number during year, excluding heifers not yet fresh. 3 Excludes milk sucked by calves.
NASS, Livestock Branch, (202) 720–3570.

VIII–5 AGRICULTURAL STATISTICS 2020
Table 8-5.—Milk: Quantities used and marketed by producers, by State and United States, 2017 1
State
Milk used where produced Milk marketed by producers
Fed to calves 2 Used for milk cream & butter Total Total quantity 3 Fluid grade 4
Million Million Million Million pounds pounds pounds pounds Percent
Alabama ........................... 0 .7 0 .3 1 .0 89 .0 100 Alaska .............................. 0 .2 0 .2 0 .4 2 .5 100 Arizona ............................. 13 .0 1 .0 14 .0 5,019 .0 100 Arkansas .......................... 1 .7 0 .3 2 .0 78 .0 100 California .......................... 26 .0 4 .0 30 .0 39,768 .0 97 Colorado .......................... 21 .0 1 .0 22 .0 4,167 .0 100 Connecticut ...................... 2 .5 0 .5 3 .0 417 .0 100 Delaware .......................... 0 .9 0 .1 1 .0 91 .8 100 Florida .............................. 5 .0 1 .0 6 .0 2,490 .0 100 Georgia ............................ 7 .0 1 .0 8 .0 1,832 .0 100 Hawaii .............................. 0 .1 0 .1 0 .2 38 .7 100 Idaho ................................ 31 .0 1 .0 32 .0 14,601 .0 100 Illinois ............................... 10 .0 2 .0 12 .0 1,917 .0 98 Indiana ............................. 23 .0 4 .0 27 .0 4,228 .0 100 Iowa ................................. 15 .0 1 .0 16 .0 5,163 .0 100 Kansas ............................. 13 .0 1 .0 14 .0 3,485 .0 100 Kentucky .......................... 6 .0 1 .0 7 .0 1,035 .0 100 Louisiana ......................... 2 .0 1 .0 3 .0 158 .0 100 Maine ............................... 3 .0 1 .0 4 .0 626 .0 100 Maryland .......................... 7 .0 1 .0 8 .0 948 .0 100 Massachusetts ................. 1 .5 0 .5 2 .0 209 .0 100 Michigan .......................... 33 .0 2 .0 35 .0 11,196 .0 100 Minnesota ........................ 95 .0 4 .0 99 .0 9,768 .0 99 Mississippi ....................... 1 .0 1 .0 2 .0 135 .0 100 Missouri ........................... 17 .0 4 .0 21 .0 1,220 .0 97 Montana ........................... 3 .0 2 .0 5 .0 283 .0 100 Nebraska ......................... 5 .5 0 .5 6 .0 1,438 .0 100 Nevada ............................ 5 .0 1 .0 6 .0 703 .0 100 New Hampshire ............... 1 .5 0 .5 2 .0 271 .0 100 New Jersey ...................... 1 .5 0 .5 2 .0 117 .0 100 New Mexico ..................... 42 .0 3 .0 45 .0 8,167 .0 100 New York ......................... 55 .0 2 .0 57 .0 14,872 .0 100 North Carolina ................. 5 .0 1 .0 6 .0 946 .0 100 North Dakota ................... 4 .5 0 .5 5 .0 340 .0 98 Ohio ................................. 24 .0 5 .0 29 .0 5,590 .0 97 Oklahoma ........................ 6 .0 1 .0 7 .0 721 .0 100 Oregon ............................. 20 .0 1 .0 21 .0 2,508 .0 100 Pennsylvania ................... 61 .0 14 .0 75 .0 10,818 .0 100 Rhode Island ................... 0 .1 - 0 .1 12 .9 100 South Carolina ................. 2 .0 1 .0 3 .0 245 .0 100 South Dakota ................... 7 .0 1 .0 8 .0 2,610 .0 100 Tennessee ....................... 4 .0 1 .0 5 .0 688 .0 100 Texas ............................... 25 .0 1 .0 26 .0 12,028 .0 100 Utah ................................. 12 .0 1 .0 13 .0 2,202 .0 100 Vermont ........................... 14 .0 2 .0 16 .0 2,713 .0 100 Virginia ............................. 8 .0 2 .0 10 .0 1,726 .0 100 Washington ...................... 17 .0 1 .0 18 .0 6,513 .0 100 West Virginia ................... 2 .0 1 .0 3 .0 124 .0 100 Wisconsin ........................ 239 .0 14 .0 253 .0 30,080 .0 99 Wyoming .......................... 1 .3 0 .2 1 .5 136 .7 100
United States ................... 901 .0 91 .0 992 .0 214,535 .0 99
- Represents zero. 1 May not add due to rounding. 2 Excludes milk sucked by calves. 3 Milk sold to plants and dealers as whole milk and equivalent amounts of milk for cream. Includes milk produced by dealers’ own herds and milk sold di-rectly to consumers. Also includes milk produced by institutional herds. 4 Percentage of milk sold that is eligible for fluid use (Grade A in most States). Includes fluid grade milk used in manufacturing dairy products.
NASS, Livestock Branch, (202) 720–3570.

VIII–6 DAIRY AND POULTRY STATISTICS
Table 8-6.—Milk: Quantities used and marketed by producers, by State and United States, 2018 1
State
Milk used where produced Milk marketed by producers
Fed to calves 2 Used for milk cream & butter Total Total quantity 3 Fluid grade 4
Million Million Million Million pounds pounds pounds pounds Percent
Alabama ........................... 0 .7 0 .3 1 .0 72 .0 100 Alaska .............................. 0 .2 0 .3 0 .5 2 .3 100 Arizona ............................. 14 .0 1 .0 15 .0 4,963 .0 100 Arkansas .......................... 1 .7 0 .3 2 .0 72 .0 100 California .......................... 26 .0 4 .0 30 .0 40,383 .0 97 Colorado .......................... 21 .0 1 .0 22 .0 4,535 .0 100 Connecticut ...................... 2 .5 0 .5 3 .0 424 .0 100 Delaware .......................... 0 .9 0 .1 1 .0 90 .5 100 Florida .............................. 5 .0 1 .0 6 .0 2,375 .0 100 Georgia ............................ 7 .0 1 .0 8 .0 1,758 .0 100 Hawaii .............................. 0 .1 0 .1 0 .2 33 .8 100 Idaho ................................ 33 .0 1 .0 34 .0 15,115 .0 100 Illinois ............................... 10 .0 2 .0 12 .0 1,866 .0 98 Indiana ............................. 23 .0 4 .0 27 .0 4,134 .0 100 Iowa ................................. 16 .0 1 .0 17 .0 5,251 .0 100 Kansas ............................. 14 .0 1 .0 15 .0 3,693 .0 100 Kentucky .......................... 6 .0 1 .0 7 .0 1,002 .0 100 Louisiana ......................... 2 .0 1 .0 3 .0 149 .0 100 Maine ............................... 3 .0 1 .0 4 .0 614 .0 100 Maryland .......................... 7 .0 1 .0 8 .0 917 .0 100 Massachusetts ................. 1 .5 0 .5 2 .0 200 .0 100 Michigan .......................... 34 .0 2 .0 36 .0 11,132 .0 100 Minnesota ........................ 95 .0 4 .0 99 .0 9,769 .0 99 Mississippi ....................... 1 .0 1 .0 2 .0 127 .0 100 Missouri ........................... 17 .0 4 .0 21 .0 1,173 .0 97 Montana ........................... 2 .0 2 .0 4 .0 270 .0 100 Nebraska ......................... 6 .5 0 .5 7 .0 1,433 .0 100 Nevada ............................ 5 .0 1 .0 6 .0 728 .0 100 New Hampshire ............... 1 .5 0 .5 2 .0 247 .0 100 New Jersey ...................... 1 .5 0 .5 2 .0 108 .0 100 New Mexico ..................... 60 .0 3 .0 63 .0 8,222 .0 100 New York ......................... 55 .0 2 .0 57 .0 14,825 .0 100 North Carolina ................. 5 .0 1 .0 6 .0 931 .0 100 North Dakota ................... 3 .5 0 .5 4 .0 330 .0 98 Ohio ................................. 24 .0 5 .0 29 .0 5,503 .0 97 Oklahoma ........................ 6 .0 1 .0 7 .0 718 .0 100 Oregon ............................. 20 .0 1 .0 21 .0 2,510 .0 100 Pennsylvania ................... 58 .0 12 .0 70 .0 10,595 .0 100 Rhode Island ................... 0 .1 - 0 .1 11 .6 100 South Carolina ................. 2 .0 1 .0 3 .0 239 .0 100 South Dakota ................... 7 .0 1 .0 8 .0 2,697 .0 100 Tennessee ....................... 4 .0 1 .0 5 .0 629 .0 100 Texas ............................... 27 .0 1 .0 28 .0 12,824 .0 100 Utah ................................. 13 .0 1 .0 14 .0 2,308 .0 100 Vermont ........................... 14 .0 2 .0 16 .0 2,664 .0 100 Virginia ............................. 8 .0 2 .0 10 .0 1,625 .0 100 Washington ...................... 17 .0 1 .0 18 .0 6,718 .0 100 West Virginia ................... 1 .0 1 .0 2 .0 109 .0 100 Wisconsin ........................ 245 .0 14 .0 259 .0 30,320 .0 99 Wyoming .......................... 1 .3 0 .2 1 .5 140 .7 100
United States ................... 929 .0 89 .0 1,018 .0 216,556 .0 99
- Represents zero. 1 May not add due to rounding. 2 Excludes milk sucked by calves. 3 Milk sold to plants and dealers as whole milk and equivalent amounts of milk for cream. Includes milk produced by dealers’ own herds and milk sold di-rectly to consumers. Also includes milk produced by institutional herds. 4 Percentage of milk sold that is eligible for fluid use (Grade A in most States). Includes fluid grade milk used in manufacturing dairy products.
NASS, Livestock Branch, (202) 720–3570.

VIII–7 AGRICULTURAL STATISTICS 2020
Table 8-7.—Milk and cream: Marketings and income, by State and United States, 2017 1
State Milk utilized
All milk Average returns
per cwt 2
Returns per lb milkfat
Cash receipts from marketings
Million pounds Dollars Dollars 1,000 dollars
Alabama ........... 89.0 18.60 4.82 16,554 Alaska ............... 2.5 22.00 5.61 550 Arizona ............. 5,019.0 16.70 4.61 838,173 Arkansas ........... 78.0 18.70 5.03 14,586 California .......... 39,768.0 16.50 4.29 6,561,720 Colorado ........... 4,167.0 18.10 4.91 754,227 Connecticut ....... 417.0 18.60 4.72 77,562 Delaware .......... 91.8 17.60 4.56 16,157 Florida ............... 2,490.0 21.50 5.83 535,350 Georgia ............. 1,832.0 19.00 5.23 348,080 Hawaii ............... 38.7 28.60 8.64 11,068 Idaho ................. 14,601.0 17.20 4.40 2,511,372 Illinois ................ 1,917.0 18.30 4.77 350,811 Indiana .............. 4,228.0 17.70 4.73 748,356 Iowa .................. 5,163.0 18.10 4.68 934,503 Kansas .............. 3,485.0 16.90 4.49 588,965 Kentucky ........... 1,035.0 18.90 5.03 195,615 Louisiana .......... 158.0 18.70 4.82 29,546 Maine ................ 626.0 19.50 5.06 122,070 Maryland ........... 948.0 17.80 4.66 168,744 Massachusetts .. 209.0 18.80 4.76 39,292 Michigan ........... 11,196.0 16.40 4.41 1,836,144 Minnesota ......... 9,768.0 17.80 4.58 1,738,704 Mississippi ........ 135.0 18.90 4.92 25,515 Missouri ............ 1,220.0 18.70 4.76 228,140 Montana ............ 283.0 17.50 4.67 49,525 Nebraska .......... 1,438.0 18.20 4.74 261,716 Nevada ............. 703.0 17.90 4.58 125,837 New Hampshire 271.0 18.50 4.76 50,135 New Jersey ....... 117.0 18.30 4.79 21,411 New Mexico ...... 8,167.0 16.30 4.48 1,331,221 New York .......... 14,872.0 18.20 4.73 2,706,704 North Carolina .. 946.0 18.80 5.01 177,848 North Dakota .... 340.0 17.60 4.60 59,840 Ohio .................. 5,590.0 18.40 4.77 1,028,560 Oklahoma ......... 721.0 19.20 5.11 138,432 Oregon .............. 2,508.0 19.80 4.95 496,584 Pennsylvania .... 10,818.0 18.60 4.86 2,012,148 Rhode Island .... 12.9 18.50 4.67 2,387 South Carolina .. 245.0 19.10 4.96 46,795 South Dakota .... 2,610.0 18.80 4.61 490,680 Tennessee ........ 688.0 18.90 5.03 130,032 Texas ................ 12,028.0 18.40 4.55 2,213,152 Utah .................. 2,202.0 17.70 4.66 389,754 Vermont ............ 2,713.0 18.60 4.81 504,618 Virginia .............. 1,726.0 19.40 5.17 334,844 Washington ....... 6,513.0 18.20 4.55 1,185,366 West Virginia .... 124.0 18.00 4.75 22,320 Wisconsin ......... 30,080.0 18.10 4.74 5,444,480 Wyoming ........... 136.7 17.90 4.92 24,469
United States .... 214,535.0 17.69 4.61 37,940,662
1 May not add due to rounding. 2 Cash receipts divided by milk or milkfat in combined marketings. NASS, Livestock Branch, (202) 720–3570.

VIII–8 DAIRY AND POULTRY STATISTICS
Table 8-8.—Milk and cream: Marketings and income, by State and United States, 2018 1
State Milk utilized
All milk Average returns
per cwt 2
Returns per lb milkfat
Cash receipts from marketings
Million pounds Dollars Dollars 1,000 dollars
Alabama ........... 72.0 16.60 4.28 11,952 Alaska ............... 2.3 22.00 5.60 506 Arizona ............. 4,963.0 15.50 4.23 769,265 Arkansas ........... 72.0 17.00 4.49 12,240 California .......... 40,383.0 15.78 4.05 6,372,437 Colorado ........... 4,535.0 16.70 4.47 757,345 Connecticut ....... 424.0 17.10 4.32 72,504 Delaware .......... 90.5 16.10 4.19 14,571 Florida ............... 2,375.0 19.90 5.41 472,625 Georgia ............. 1,758.0 17.10 4.70 300,618 Hawaii ............... 33.8 28.00 8.09 9,464 Idaho ................. 15,115.0 15.70 3.96 2,373,055 Illinois ................ 1,866.0 16.50 4.24 307,890 Indiana .............. 4,134.0 15.70 4.15 649,038 Iowa .................. 5,251.0 16.50 4.19 866,415 Kansas .............. 3,693.0 15.30 3.96 565,029 Kentucky ........... 1,002.0 17.50 4.62 175,350 Louisiana .......... 149.0 17.20 4.26 25,628 Maine ................ 614.0 18.10 4.68 111,134 Maryland ........... 917.0 16.20 4.24 148,554 Massachusetts .. 200.0 17.40 4.37 34,800 Michigan ........... 11,132.0 14.90 3.90 1,658,668 Minnesota ......... 9,769.0 16.50 4.15 1,611,885 Mississippi ........ 127.0 17.10 4.23 21,717 Missouri ............ 1,173.0 16.90 4.25 198,237 Montana ............ 270.0 16.00 4.21 43,200 Nebraska .......... 1,433.0 16.20 4.20 232,146 Nevada ............. 728.0 16.40 4.15 119,392 New Hampshire 247.0 17.00 4.35 41,990 New Jersey ....... 108.0 16.20 4.26 17,496 New Mexico ...... 8,222.0 14.70 3.97 1,208,634 New York .......... 14,825.0 16.70 4.33 2,475,775 North Carolina .. 931.0 17.30 4.59 161,063 North Dakota .... 330.0 16.20 4.12 53,460 Ohio .................. 5,503.0 16.40 4.22 902,492 Oklahoma ......... 718.0 17.80 4.66 127,804 Oregon .............. 2,510.0 18.70 4.61 469,370 Pennsylvania .... 10,595.0 16.80 4.41 1,779,960 Rhode Island .... 11.6 17.20 4.27 1,995 South Carolina .. 239.0 17.40 4.52 41,586 South Dakota .... 2,697.0 17.30 4.15 466,581 Tennessee ........ 629.0 17.40 4.59 109,446 Texas ................ 12,824.0 16.90 4.11 2,167,256 Utah .................. 2,308.0 16.10 4.16 371,588 Vermont ............ 2,664.0 17.10 4.38 455,544 Virginia .............. 1,625.0 17.50 4.63 284,375 Washington ....... 6,718.0 16.80 4.14 1,128,624 West Virginia .... 109.0 16.40 4.29 17,876 Wisconsin ......... 30,320.0 16.50 4.24 5,002,800 Wyoming ........... 140.7 16.30 4.48 22,934
United States .... 216,556.0 16.28 4.19 35,244,314
1 May not add due to rounding. 2 Cash receipts divided by milk or milkfat in combined marketings. NASS, Livestock Branch, (202) 720–3570.

VIII–9 AGRICULTURAL STATISTICS 2020
Table 8-9.—Milk production: Value, by State and United States, 2017 1
State
Used for milk, cream, & butter by producers Gross
producer income 3
Value of milk produced 2 4 Milk
utilized Value 2
Million pounds 1,000 dollars 1,000 dollars 1,000 dollars
Alabama .......................... 0.3 56 16,610 16,740 Alaska .............................. 0.2 44 594 638 Arizona ............................ 1.0 167 838,340 840,511 Arkansas .......................... 0.3 56 14,642 14,960 California ......................... 4.0 660 6,562,380 6,566,670 Colorado .......................... 1.0 181 754,408 758,209 Connecticut ...................... 0.5 93 77,655 78,120 Delaware ......................... 0.1 18 16,175 16,333 Florida .............................. 1.0 215 535,565 536,640 Georgia ............................ 1.0 190 348,270 349,600 Hawaii .............................. 0.1 29 11,097 11,125 Idaho ................................ 1.0 172 2,511,544 2,516,876 Illinois ............................... 2.0 366 351,177 353,007 Indiana ............................. 4.0 708 749,064 753,135 Iowa ................................. 1.0 181 934,684 937,399 Kansas ............................. 1.0 169 589,134 591,331 Kentucky .......................... 1.0 189 195,804 196,938 Louisiana ......................... 1.0 187 29,733 30,107 Maine ............................... 1.0 195 122,265 122,850 Maryland .......................... 1.0 178 168,922 170,168 Massachusetts ................. 0.5 94 39,386 39,668 Michigan .......................... 2.0 328 1,836,472 1,841,884 Minnesota ........................ 4.0 712 1,739,416 1,756,326 Mississippi ....................... 1.0 189 25,704 25,893 Missouri ........................... 4.0 748 228,888 232,067 Montana ........................... 2.0 350 49,875 50,400 Nebraska ......................... 0.5 91 261,807 262,808 Nevada ............................ 1.0 179 126,016 126,911 New Hampshire ............... 0.5 93 50,228 50,505 New Jersey ...................... 0.5 92 21,503 21,777 New Mexico ..................... 3.0 489 1,331,710 1,338,556 New York ......................... 2.0 364 2,707,068 2,717,078 North Carolina ................. 1.0 188 178,036 178,976 North Dakota ................... 0.5 88 59,928 60,720 Ohio ................................. 5.0 920 1,029,480 1,033,896 Oklahoma ........................ 1.0 192 138,624 139,776 Oregon ............................. 1.0 198 496,782 500,742 Pennsylvania ................... 14.0 2,604 2,014,752 2,026,098 Rhode Island ................... - - 2,387 2,405 South Carolina ................. 1.0 191 46,986 47,368 South Dakota ................... 1.0 188 490,868 492,184 Tennessee ....................... 1.0 189 130,221 130,977 Texas ............................... 1.0 184 2,213,336 2,217,936 Utah ................................. 1.0 177 389,931 392,055 Vermont ........................... 2.0 372 504,990 507,594 Virginia ............................. 2.0 388 335,232 336,784 Washington ...................... 1.0 182 1,185,548 1,188,642 West Virginia ................... 1.0 180 22,500 22,860 Wisconsin ........................ 14.0 2,534 5,447,014 5,490,273 Wyoming .......................... 0.2 36 24,505 24,738
United States ................... 91.0 16,594 37,957,256 38,119,254
- Represents zero. 1 May not add due to rounding. 2 Value at average returns per 100 pounds of milk in combined mar-ketings of milk and cream. 3 Cash receipts from marketings of milk and cream plus value of milk used for home consump-tion. 4 Includes value of milk fed to calves.
NASS, Livestock Branch, (202) 720–3570.

VIII–10 DAIRY AND POULTRY STATISTICS
Table 8-10.—Milk production: Value, by State and United States, 2018 1
State
Used for milk, cream, & butter by producers Gross
producer income 3
Value of milk produced 2 4 Milk
utilized Value 2
Million pounds 1,000 Dollars 1,000 Dollars 1,000 Dollars
Alabama .......................... 0.3 50 12,002 12,118 Alaska .............................. 0.3 66 572 616 Arizona ............................ 1.0 155 769,420 771,590 Arkansas .......................... 0.3 51 12,291 12,580 California ......................... 4.0 631 6,373,068 6,377,171 Colorado .......................... 1.0 167 757,512 761,019 Connecticut ...................... 0.5 86 72,590 73,017 Delaware ......................... 0.1 16 14,587 14,732 Florida .............................. 1.0 199 472,824 473,819 Georgia ............................ 1.0 171 300,789 301,986 Hawaii .............................. 0.1 28 9,492 9,520 Idaho ................................ 1.0 157 2,373,212 2,378,393 Illinois ............................... 2.0 330 308,220 309,870 Indiana ............................. 4.0 628 649,666 653,277 Iowa ................................. 1.0 165 866,580 869,220 Kansas ............................. 1.0 153 565,182 567,324 Kentucky .......................... 1.0 175 175,525 176,575 Louisiana ......................... 1.0 172 25,800 26,144 Maine ............................... 1.0 181 111,315 111,858 Maryland .......................... 1.0 162 148,716 149,850 Massachusetts ................. 0.5 87 34,887 35,148 Michigan .......................... 2.0 298 1,658,966 1,664,032 Minnesota ........................ 4.0 660 1,612,545 1,628,220 Mississippi ....................... 1.0 171 21,888 22,059 Missouri ........................... 4.0 676 198,913 201,786 Montana ........................... 2.0 320 43,520 43,840 Nebraska ......................... 0.5 81 232,227 233,280 Nevada ............................ 1.0 164 119,556 120,376 New Hampshire ............... 0.5 85 42,075 42,330 New Jersey ...................... 0.5 81 17,577 17,820 New Mexico ..................... 3.0 441 1,209,075 1,217,895 New York ......................... 2.0 334 2,476,109 2,485,294 North Carolina ................. 1.0 173 161,236 162,101 North Dakota ................... 0.5 81 53,541 54,108 Ohio ................................. 5.0 820 903,312 907,248 Oklahoma ........................ 1.0 178 127,982 129,050 Oregon ............................. 1.0 187 469,557 473,297 Pennsylvania ................... 12.0 2,016 1,781,976 1,791,720 Rhode Island ................... - - 1,995 2,012 South Carolina ................. 1.0 174 41,760 42,108 South Dakota ................... 1.0 173 466,754 467,965 Tennessee ....................... 1.0 174 109,620 110,316 Texas ............................... 1.0 169 2,167,425 2,171,988 Utah ................................. 1.0 161 371,749 373,842 Vermont ........................... 2.0 342 455,886 458,280 Virginia ............................. 2.0 350 284,725 286,125 Washington ...................... 1.0 168 1,128,792 1,131,648 West Virginia ................... 1.0 164 18,040 18,204 Wisconsin ........................ 14.0 2,310 5,005,110 5,045,535 Wyoming .......................... 0.2 33 22,967 23,179
United States ................... 89.0 14,814 35,259,128 35,411,485
- Represents zero. 1 May not add due to rounding. 2 Value at average returns per 100 pounds of milk in combined mar-ketings of milk and cream. 3 Cash receipts from marketings of milk and cream plus value of milk used for home consump-tion. 4 Includes value of milk fed to calves.
NASS, Livestock Branch, (202) 720–3570.

VIII–11 AGRICULTURAL STATISTICS 2020
Table 8-11.—Milk cows, milk, and fat in cream: Average prices received by farmers, United States, 2009–2018
Year Milk cows, per head 1
Milk per 100 pounds 2
Eligible for fluid market 3 Of manufacturing grade All milk wholesale
Price per 100 lb. Fat test Price per
100 lb. Fat test Price per 100 lb. Fat test
Dollars Dollars Percent Dollars Percent Dollars Percent 2009 ..................... 1,390.00 12.94 3.67 12.03 4.00 12.93 3.67 2010 ..................... 1,330.00 16.37 3.65 14.56 4.00 16.35 3.66 2011 ..................... 1,420.00 (NA) (NA) (NA) (NA) 20.24 3.71 2012 ..................... 1,430.00 (NA) (NA) (NA) (NA) 18.56 3.72 2013 ..................... 1,380.00 (NA) (NA) (NA) (NA) 20.11 3.76 2014 ..................... 1,830.00 (NA) (NA) (NA) (NA) 24.07 3.74 2015 ..................... 1,990.00 (NA) (NA) (NA) (NA) 17.21 3.75 2016 ..................... 1,760.00 (NA) (NA) (NA) (NA) 16.34 3.79 2017 ..................... 1,620.00 (NA) (NA) (NA) (NA) 17.69 3.84 2018 ..................... 1,360.00 (NA) (NA) (NA) (NA) 16.28 3.89
(NA) Not available. 1 Simple average of quarterly prices, by States, weighted by the number of milk cows on farms Jan. 1 of the current year. 2 Average price at average fat test for all milk sold at wholesale to plants and dealers, based on re-ports from milk-market administrators, cooperative milk-market associations, whole-milk distributors, and milk-products man-ufacturing plants, f.o.b. plant or receiving station (whichever is the customary place for determining prices) before hauling costs are deducted and including all premiums. 3 Includes fluid milk surplus diverted to manufacturing.
NASS, Livestock Branch, (202) 720–3570.
Table 8-12—Milk-feed price ratios: All milk price; Dairy feed price, 16% protein; Milk- feed price ratios, United States, annual 2009–2018
Year All milk price Dairy feed price 16% protein 1 Milk-feed price ratio 2
Dollars/cwt Dollars/ton Pounds
2009 ............................. 12.93 293 1.78 2010 ............................. 16.35 274 2.26 2011 ............................. 20.24 369 1.90 2012 ............................. 18.56 442 1.52 2013 ............................. 20.11 481 1.75 2014 ............................. 24.07 502 2.54 2015 ............................. 17.21 (NA) 2.14 2016 ............................. 16.34 (NA) 2.26 2017 ............................. 17.69 (NA) 2.42 2018 ............................. 16.28 (NA) 2.05
1 Commercially prepared 16%protein dairy ration price collected from March annual Prices Paid Survery. Discontinued beginning 2015. 2 Annual ratios based on average of monthly ratios. Pounds of 16% protein mixed dairy feed equal in value to one pound of whole milk. Feed price component (16% protein) calculated using U.S. price received for corn (51 lbs), soybeans (8 lb), and alfalfa hay (41 lbs).
NASS, Environmental, Economics, and Demographics Branch, (202) 720–6146.
Table 8-13.—Fluid beverage milk: Total sales and per capita consumption, United States, 2009–2018
Year Consumption
Total Per capita
Million pounds Pounds
2009 ..................... 54,850 179 2010 ..................... 55,003 178 2011 ..................... 54,296 174 2012 ..................... 53,443 170 2013 ..................... 52,286 165 2014 ..................... 50,773 159 2015 ..................... 50,041 156 2016 ..................... 49,713 154 2017 ..................... 48,650 149 2018 ..................... 47,672 146
ERS, Animal Products and Cost of Production Branch, (202) 694–5171.

VIII–12 DAIRY AND POULTRY STATISTICS
Table 8-14.—Federal milk order markets 1: Measures of growth, 2013–2019 2
Year Population of Federal milk
marketing areas
Number of handlers 3
Number of producers 4
Receipts of producer milk
Producer milk used in Class I
Percentage of producer milk
used in Class I
Million Million Thousands Number Number pounds pounds Percent
2013 ......... 251,201 225 40,043 132,100 42,742 32.4 2014 ......... 255,184 223 39,146 129,420 41,420 32.0 2015 ......... 256,526 214 36,112 126,126 41,206 32.7 2016 ......... 258,172 216 34,689 133,846 41,140 30.7 2017 ......... 262,240 217 32,981 135,502 40,642 30.0 2018 ......... 302,089 233 32,061 141,684 40,945 28.9 2019 ......... 303,067 230 29,474 156,510 43,882 28.0
Year
Prices at 3.5 percent butterfat content per
hundredweight 5
Receipts as percentage of milk sold to plants and
dealers
Daily deliveries of milk per producer
Gross value of receipts of producer milk 6
Class I Blend Fluid grade All milk Per producer All producer
Dollars Dollars Percent Percent Pounds Dollars 1,000 dollars
2013 ......... 21.80 19.44 67 66 9,039 641,295 25,682,588 2014 ......... 26.14 23.54 63 63 9,074 793,728 30,472,016 2015 ......... 19.21 16.70 61 61 9,559 583,173 21,063,042 2016 ......... 17.70 15.38 64 64 10,557 593,364 20,585,571 2017 ......... 19.31 16.96 64 63 11,244 696,651 22,981,139 2018 ......... 17.70 15.51 66 65 12,449 685,389 21,974,258 2019 ......... 19.74 17.35 33 72 14,507 921,305 27,154,539
1 The California Federal Milk Marketing Order became effective on November 1, 2018. 2 Over this period, handler se-lected periodically not to pool substantial volumes of milk that normally would have been pooled under Federal or-ders. This decision resulted from disadvantageous blend/class price relationships and qualification circumstances. This fact should be kept in mind if year-to-year comparisons are made using the various ″producer deliveries″ measures of growth. 3 End of year. 4 Average for year. 5 Prices are weighted averages. 6 Based on blend (uniform) price adjusted for butterfat content, and in later years, other milk components of producer milk.
AMS, Dairy Programs, (202) 720–7461.
Table 8-15.—Milk production: Marketings, income and value, United States, 2009–2018
Year
Combined marketings of milk and cream Used for milk, cream, and butter on farms
where produced Gross farm income from
dairy products 3
Farm value of all milk
produced 2 4 Milk utilized
Average returns 1 Cash
receipts from marketings Milk
utilized Value 2 Per 100 pounds
milk
Per pound milkfat
Million 1,000 Million 1,000 1,000 1,000 pounds Dollars Dollars dollars pounds dollars dollars dollars
2009 ....... 188,189 12.93 3.52 24,321,032 112 15,224 24,336,256 24,455,900 2010 ....... 191,897 16.35 4.47 31,372,346 107 18,269 31,390,615 31,535,575 2011 ....... 195,290 20.24 5.46 39,531,306 98 20,561 39,551,867 39,730,346 2012 ....... 199,687 18.56 4.99 37,064,731 98 18,779 37,083,510 37,247,542 2013 ....... 200,283 20.11 5.35 40,282,881 100 20,629 40,303,510 40,482,699 2014 ....... 205,083 24.07 6.44 49,351,199 92 22,699 49,373,898 49,588,283 2015 ....... 207,536 17.21 4.59 35,716,849 91 16,291 35,733,140 35,888,595 2016 ....... 211,457 16.34 4.31 34,546,316 94 15,784 34,562,100 34,712,099 2017 ....... 214,535 17.69 4.61 37,940,662 91 16,594 37,957,256 38,119,254 2018 ....... 216,556 16.28 4.19 35,244,314 89 14,814 35,259,128 35,411,485
1 Cash receipts divided by milk or milkfat represented in combined marketings. 2 Valued at average returns per 100 pounds of milk in combined marketings of milk and cream. 3 Cash receipts from marketings of milk and cream plus value of milk used for home consumption. 4 Includes value of milk fed to calves.
NASS, Livestock Branch, (202) 720–3570.

VIII–13 AGRICULTURAL STATISTICS 2020
Table 8-16.—Official Dairy Herd Information test plans: Numbers of herds and cows and milk, fat, and protein production, United States, 2010–2019
Year Herds Cows Cows per herd
Average production Cows with protein
information
Average protein
production
Average protein
production Milk Fat Fat
Number Number Number Pounds Percent Pounds Percent Percent Pounds
2010 ... 15,067 3,746,177 248.6 22,765 3.66 836 98 3.09 706 2011 ... 14,490 3,800,410 262.3 22,961 3.71 855 98 3.11 714 2012 ... 13,894 3,762,925 270.8 23,328 3.72 871 98 3.12 728 2013 ... 13,329 3,712,080 278.5 23,695 3.77 894 98 3.13 742 2014 ... 13,043 3,829,273 293.6 24,101 3.76 907 98 3.14 757 2015 ... 12,440 3,822,370 307.3 24,403 3.75 917 98 3.13 764 2016 ... 11,745 3,836,074 326.6 24,651 3.79 934 98 3.13 773 2017 ... 10,932 3,809,695 348.5 24,776 3.84 951 99 3.16 783 2018 ... 9,787 3,715,872 379.7 24,660 3.87 956 99 3.16 781 2019 ... 8,710 3,636,877 417.6 24,787 3.91 970 100 3.18 789
Council on Dairy Cattle Breeding, (240) 334–4164, https://www.uscdcb.com.
Table 8-17.—Milk and milkfat production: Number of producing cows, production per cow, and total quantity produced, United States, 2009–2018
Year Number of milk cows 1
Production of milk and milkfat 2
Per milk cow Percentage of fat in all milk
produced
Total
Milk Milkfat Milk Milkfat
Million Million Thousands Pounds Pounds Percent pounds pounds
2009 ...... 9,202 20,561 755 3.67 189,202 6,944 2010 ...... 9,123 21,142 774 3.66 192,877 7,054 2011 ...... 9,199 21,334 791 3.71 196,255 7,284 2012 ...... 9,237 21,722 808 3.72 200,642 7,463 2013 ...... 9,224 21,819 820 3.76 201,260 7,558 2014 ...... 9,261 22,249 832 3.74 206,048 7,698 2015 ...... 9,320 22,372 839 3.75 208,508 7,810 2016 ...... 9,334 22,761 863 3.79 212,451 8,054 2017 ...... 9,406 22,914 880 3.84 215,527 8,272 2018 ...... 9,399 23,149 900 3.89 217,575 8,466
1 Average number during year, excluding heifers not yet fresh. 2 Excludes milk sucked by calves. NASS, Livestock Branch, (202) 720–3570.
Table 8-18.—Milk: Quantities used and marketed by farmers, United States, 2009–2018
Year
Milk used on farms where produced Milk marketed by producers
Fed to calves 1 Consumed as fluid milk or cream Total Total 2 Fluid grade 3
Million Million Million Million pounds pounds pounds pounds Percent
2009 ............... 901 112 1,013 188,189 98 2010 ............... 873 107 980 191,897 98 2011 ............... 867 98 965 195,290 99 2012 ............... 858 98 956 199,687 99 2013 ............... 877 100 977 200,283 99 2014 ............... 874 92 966 205,083 99 2015 ............... 880 91 971 207,536 99 2016 ............... 900 94 994 211,457 99 2017 ............... 901 91 992 214,535 99 2018 ............... 929 89 1,018 216,556 99
1 Excludes milk sucked by calves. 2 Milk sold to plants and dealers as whole milk and equivalent amounts of milk for cream. Includes milk produced by dealers’ own herds and small amounts sold directly to consumers. Also includes milk produced by institutional herds. 3 Percentage of milk sold that is eligible for fluid use (Grade A in most States). Includes fluid-grade milk used in manufacturing dairy products.
NASS, Livestock Branch, (202) 720–3570.

VIII–14 DAIRY AND POULTRY STATISTICS
Table 8-19.—Milk markets under Federal order program: Whole milk and fat-reduced milk products sold for fluid consumption within defined marketing areas, 2017–2019 1
Federal milk order marketing area
Whole milk products 2 Fat-reduced milk products 3 Total fluid milk products
Quantity Butterfat content Quantity Butterfat
content Quantity Butterfat content
Million pounds Percent Million pounds Percent Million pounds Percent
2017
Northeast ....................................... 3,249 3.27 4,782 1.18 8,031 2.03 Appalachian ................................... 1,157 3.29 2,005 1.34 3,162 2.05 Florida ............................................ 1,152 3.23 1,579 1.31 2,731 2.12 Southeast ....................................... 1,692 3.30 2,651 1.33 4,343 2.10 Upper Midwest ............................... 698 3.29 2,864 1.23 3,562 1.64 Central ........................................... 1,164 3.30 2,918 1.30 4,082 1.87 Mideast .......................................... 1,468 3.30 3,787 1.35 5,255 1.89 Pacific Northwest ........................... 596 3.33 1,307 1.36 1,903 1.98 Southwest ...................................... 1,735 3.32 2,650 1.33 4,385 2.12 Arizona ........................................... 346 3.29 671 1.31 1,017 1.99
Combined areas ............................ 13,256 3.29 25,214 1.29 38,471 1.98
2018
Northeast ....................................... 3,306 3.28 4,539 1.21 7,846 2.08 Appalachian ................................... 1,206 3.29 1,960 1.36 3,166 2.10 Florida ............................................ 1,161 3.19 1,515 1.36 2,676 2.15 Southeast ....................................... 1,704 3.31 2,517 1.36 4,221 2.15 Upper Midwest ............................... 712 3.29 2,715 1.25 3,427 1.67 Central ........................................... 1,197 3.30 2,773 1.34 3,970 1.93 Mideast .......................................... 1,514 3.30 3,685 1.37 5,209 1.94 California 4 ..................................... 334 3.38 556 1.44 890 2.17 Pacific Northwest ........................... 613 3.32 1,229 1.37 1,842 2.02 Southwest ...................................... 1,775 3.28 2,528 1.35 4,303 2.15 Arizona ........................................... 363 3.29 657 1.33 1,020 2.03
Combined areas ............................ 13,886 3.29 24,673 1.32 38,568 2.03
2019
Northeast ....................................... 3,313 3.28 4,070 1.22 7,382 2.15 Appalachian ................................... 1,220 3.30 1,785 1.37 3,005 2.16 Florida ............................................ 1,170 3.24 1,392 1.37 2,562 2.22 Southeast ....................................... 1,707 3.32 2,255 1.38 3,962 2.22 Upper Midwest ............................... 733 3.30 2,460 1.27 3,194 1.73 Central ........................................... 1,215 3.26 2,499 1.36 3,714 1.98 Mideast .......................................... 1,579 3.31 3,467 1.41 5,046 2.01 California 4 ..................................... 2,001 3.44 3,067 1.42 5,069 2.22 Pacific Northwest ........................... 613 3.32 1,077 1.38 1,690 2.08 Southwest ...................................... 1,787 3.30 2,392 1.36 4,179 2.19 Arizona ........................................... 360 3.31 596 1.37 956 2.10
Combined areas ............................ 15,699 3.31 25,060 1.35 40,759 2.10
1 In-area sales include total sales in each of the areas by handlers regulated under the respective order, by handlers regu-lated under other orders, by partially regulated handlers, by exempt handlers, and by producer-handlers. Sales routes of handlers may extend outside defined marketing areas; therefore, some handlers’ in-area sales are partially esti-mated. 2 Plain, organic, flavored, and miscellaneous whole milk products, and eggnog. 3 Plain, fortified, organic, and fla-vored reduced fat milk (2%), low fat milk (1%), and fat-free milk (skim), and miscellaneous fat-reduced milk products, and buttermilk. 4 The California Federal Milk Order became effective November 1, 2018.
AMS, Dairy Programs, (202) 720–7461.

VIII–15 AGRICULTURAL STATISTICS 2020
Table 8-20.—Milk markets under Federal order program: Uniform and Class I milk prices at 3.5 percent fat test, number of producers, producer milk receipts, producer milk used in Class I, Class I percentage, daily milk deliveries per producer, average fat test of producer milk receipts, by markets, 2017–2019
Federal milk order marketing area
Class I $ / cwt 1
Uniform $ / cwt 1 2
Average number
of producers
Receipts of
producer milk
Producer milk used in Class I
Class I utilization
Daily milk deliveries
per producer
Average fat test of producer
milk
Million Million Dollars Dollars Number pounds pounds Percent Pounds Percent
2017
Northeast 3 ................. 19.71 17.43 11,170 27,397 8,799 32.1 6,722 3.85 Appalachian 4 ............. 19.87 18.79 1,990 5,801 4,002 69.0 8,002 3.76 Florida 5 ...................... 21.87 20.92 143 2,602 2,169 83.3 49,877 3.69 Southeast 6 ................ 20.27 19.13 1,672 5,451 3,767 69.1 8,936 3.74 Upper Midwest 7 8 ...... 18.26 16.28 9,431 32,312 3,244 10.0 9,345 3.84 Central 8 9 .................. 18.46 16.35 2,565 15,879 4,839 30.5 16,967 3.82 Mideast 8 10 ................ 18.46 16.56 4,968 20,241 6,430 31.8 11,160 3.78 Pacific Northwest 8 11 18.36 16.18 467 7,661 1,891 24.7 44,854 3.99 Southwest 8 12 ............ 19.46 17.16 486 13,092 4,217 32.2 73,541 3.86 Arizona 13 ................... 18.81 16.39 89 5,065 1,284 25.4 155,410 3.62
All markets combined 19.31 16.96 32,981 135,502 40,642 30.0 11,244 3.82
2018
Northeast 3 ................. 18.10 16.09 10,574 27,109 8,701 32.1 7,026 3.86 Appalachian 4 ............. 18.25 17.29 1,704 5,735 3,984 69.5 9,243 3.79 Florida 5 ...................... 20.24 19.37 143 2,565 2,144 83.6 49,152 3.68 Southeast 6 ................ 18.64 17.71 1,672 5,204 3,705 71.2 8,541 3.80 Upper Midwest 7 8 ...... 16.63 14.75 8,883 33,323 2,990 9.0 10,263 3.92 Central 8 9 .................. 16.85 14.87 2,433 16,613 4,792 28.8 18,722 3.89 Mideast 8 10 ................ 16.86 15.21 4,513 19,603 6,374 32.5 11,905 3.84 California 11 ................ 17.39 15.18 1,081 4,117 927 22.5 62,481 4.01 Pacific Northwest 12 ... 16.76 14.86 495 8,558 1,851 21.6 47,288 4.07 Southwest 8 13 ............ 17.86 15.77 482 13,727 4,221 30.8 77,613 3.94 Arizona 14 ................... 17.19 15.09 81 5,133 1,265 24.6 173,295 3.66
All markets combined 17.70 15.51 32,061 141,687 40,954 28.9 12,449 3.88
2019
Northeast 3 ................. 20.23 18.11 9,760 26,752 8,283 31.0 7,510 3.89 Appalachian 4 ............. 20.38 19.38 1,552 5,327 3,746 70.3 9,414 3.80 Florida 5 ...................... 22.35 21.39 125 2,510 2,091 83.3 55,174 3.66 Southeast 6 ................ 20.76 19.75 1,540 4,903 3,438 70.1 8,733 3.80 Upper Midwest 7 8 ...... 18.79 16.70 7,981 32,310 2,720 8.4 10,961 3.93 Central 8 9 .................. 18.96 16.70 2,370 15,260 4,605 30.2 17,595 3.92 Mideast 8 10 ................ 18.99 17.20 4,164 18,942 6,560 34.6 12,456 3.86 California 11 ................ 19.08 16.79 993 24,272 5,321 21.9 66,953 3.86 Pacific Northwest 12 ... 18.88 16.74 458 8,496 1,728 20.3 50,847 4.08 Southwest 8 13 ............ 19.97 17.40 457 12,900 4,147 32.2 77,184 3.99 Arizona 14 ................... 19.35 17.23 74 4,840 1,241 25.6 177,338 3.74
All markets combined 19.74 17.35 29,474 156,510 43,882 28.0 14,507 3.90
1 Prices are for milk of 3.5 percent butterfat content and for the principal pricing point of the market. See footnotes 3- 13. 2 For those orders that use the component pricing system for paying producers (orders 1, 30, 32, 33, 124,and 126), the figures are the statistical uniform price (the sum of the producer price differential and the Class III price). For those orders that use the skim milk/butterfat pricing system for paying producers (orders 5, 6, 7, and 131), the figures are the uniform price (the sum of the uniform butterfat price times 3.5 and the uniform skim milk price times 0.965). 3 Suffolk Co. (Boston), MA. 4 Mecklenburg Co. (Charlotte), NC. 5 Hillsborough Co. (Tampa), FL. 5 Fulton Co. (Atlanta), GA. 7 Cook Co. (Chi-cago), IL. 8 Due to the disadvantageous intraorder class and uniform price relationships in some months in these markets, handlers elected not to pool milk that normally would have been pooled under these orders. 9 Jackson Co. (Kansas City), MO. 10 Cuyahoga Co. (Cleveland), OH. 11 The California Federal Milk Marketing Order became effective on November 1, 2018. 12 King Co. (Seattle), WA. 13 Dallas Co. (Dallas), TX. 14 Maricopa Co. (Phoenix), AZ.
AMS, Dairy Programs, (202) 720–7461.

VIII–16 DAIRY AND POULTRY STATISTICS
Table 8-21.—Dairy products: Quantities manufactured, United States, 2014–2018
Product 2014 2015 2016 2017 2018
1,000 pounds
Butter ....................................................... 1,855,315 1,849,519 1,839,399 1,847,473 1,891,007
Cheese: American types ....................................... 4,588,023 4,694,471 4,768,888 5,072,129 5,253,833
Cheddar ............................................... 3,317,038 3,393,111 3,434,498 3,721,468 3,802,508 Other American ................................... 1,270,985 1,301,360 1,334,390 1,350,661 1,451,325
Blue and Gorgonzola .............................. 92,845 94,489 90,872 91,316 94,648 Brick ........................................................ 2,942 3,449 2,845 2,424 2,276 Cream and Neufchatel ............................ 851,713 876,286 908,972 918,071 914,824 Feta ......................................................... 105,622 112,424 126,849 122,470 129,823 Gouda ..................................................... 55,911 58,364 58,601 65,400 65,252 Hispanic .................................................. 249,579 254,291 264,941 286,521 311,916
Italian types ............................................. 4,950,235 5,081,826 5,304,355 5,395,248 5,556,850 Mozzarella ........................................... 3,924,925 3,988,936 4,117,746 4,167,492 4,351,361 Parmesan ............................................ 301,848 339,003 407,319 450,640 424,491 Provolone ............................................ 361,088 379,316 401,589 393,792 397,786 Ricotta ................................................. 245,284 243,464 252,231 245,912 249,461 Romano ............................................... 45,021 55,034 52,448 58,302 58,058 Other Italian types ............................... 72,069 76,073 73,022 79,110 75,693
Muenster cheese .................................... 163,650 177,540 181,354 189,167 191,269 Swiss cheese .......................................... 297,802 312,015 311,977 316,654 332,303 All other types ......................................... 153,783 166,240 161,889 180,562 171,593
Total cheese 1 ......................................... 11,512,105 11,831,395 12,181,543 12,639,962 13,024,587
Cottage cheese: Curd 2 ................................................... 381,146 400,634 406,428 390,409 402,362 Creamed 3 ............................................ 303,113 317,531 329,444 330,484 352,785 Lowfat 4 ................................................ 364,614 363,004 367,815 344,421 342,084
Sour cream ............................................. 1,302,900 1,325,629 1,374,059 1,387,149 1,403,411 Yogurt plain & flavored ........................... 4,756,562 4,645,594 4,458,399 4,478,204 4,388,088
Bulk condensed milk: Skim, sweetened ................................. 43,593 52,935 77,158 90,157 120,873 Skim, unsweetened ............................. 1,661,446 1,672,557 1,651,169 1,570,819 1,468,374 Whole, sweetened ............................... 88,607 99,867 116,563 142,602 144,659 Whole, unsweetened ........................... 65,596 173,701 97,204 62,259 66,023
Condensed or evaporated buttermilk ..... 109,044 105,676 105,968 113,035 109,612
Canned milk: Evaporated and condensed whole 5 ... 315,290 452,780 456,695 379,193 412,599 Evaporated skim .................................. 27,856 43,940 16,897 9,156 15,144
Dry milk products: Dry buttermilk, total ................................. 111,097 98,364 109,641 112,904 118,075 Dry skim milk animal ............................... 11,303 9,953 9,287 11,862 14,071 Dry whole milk ........................................ 103,122 108,522 98,174 122,397 143,654 Milk protein concentrate, total ................. 126,017 157,309 125,685 139,047 145,632 Nonfat dry milk, human ........................... 1,764,632 1,822,348 1,752,634 1,835,277 1,773,540 Skim milk powder, total 6 ........................ 543,504 446,324 559,175 529,633 566,504
Dry whey, total ........................................ 869,701 977,568 955,141 1,035,414 999,356
1,000 gallons
Ice cream, regular, total .......................... 865,753 896,688 906,680 871,157 840,028 Ice cream, lowfat, total 7 ......................... 411,701 438,991 435,868 461,414 451,103 Ice cream, nonfat, total ........................... 18,303 13,575 12,438 11,427 11,266 Sherbet, total ........................................... 48,353 44,743 44,262 42,975 40,206 Frozen yogurt, total ................................. 66,456 74,229 66,814 62,911 50,277
1 Excluding cottage cheese. 2 Mostly used for processing into creamed or lowfat cottage cheese. 3 Fat content 4 per-cent or more. 4 Fat content less than 4 percent. 5 Combined to avoid disclosing individual plant operations. 6 Includes protein standardized and blends. 7 Includes freezer-made milkshake.
NASS, Livestock Branch, (202) 720–3570.

VIII–17 AGRICULTURAL STATISTICS 2020
Table 8-22.—Dairy Products: Factory production of specified items, by State and United States, 2017–2018
State Butter Total American cheese 1 Total cheese 2
2017 2018 2017 2018 2017 2018
1,000 pounds 1,000 pounds 1,000 pounds 1,000 pounds 1,000 pounds 1,000 pounds
California .............. 534,378 578,624 632,677 630,164 2,513,336 2,543,368 Idaho .................... ........................ ........................ 605,555 625,427 958,687 991,239 Illinois ................... ........................ ........................ ........................ ........................ 82,389 82,288 Iowa ..................... ........................ ........................ 155,111 182,094 256,737 296,396 Minnesota ............ ........................ ........................ 589,516 622,884 712,988 740,601 New Jersey .......... ........................ ........................ ........................ ........................ 57,727 59,087 New Mexico ......... ........................ ........................ ........................ ........................ 766,804 895,779 New York ............. 27,581 24,688 132,273 139,560 829,410 802,331 Ohio ..................... ........................ ........................ ........................ ........................ 222,044 239,267 Oregon ................. ........................ ........................ 205,733 208,767 206,679 209,829 Pennsylvania ....... 92,329 86,062 ........................ ........................ 411,552 433,750 South Dakota ....... ........................ ........................ ........................ ........................ 282,304 293,455 Vermont ............... ........................ ........................ ........................ ........................ 142,941 146,953 Wisconsin ............ ........................ ........................ 1,016,702 1,025,766 3,376,769 3,422,895 Other States 3 ...... 1,193,185 1,201,633 1,734,562 1,819,161 1,819,595 1,867,349
United States ....... 1,847,473 1,891,007 5,072,129 5,253,833 12,639,962 13,024,587
State Ice cream, regular (hard) Nonfat dry milk for human food
2017 2018 2017 2018
1,000 Gallons 1,000 Gallons 1,000 Pounds 1,000 Pounds
California .............. 73,643 66,328 562,017 587,059 Connecticut .......... 12,206 12,614 ...................................... ......................................Missouri ............... 32,404 37,350 ...................................... ......................................New Jersey .......... 1,390 1,183 ...................................... ......................................New York ............. 38,422 29,547 ...................................... ......................................Ohio ..................... 26,122 27,984 ...................................... ......................................Oregon ................. 12,104 14,380 ...................................... ......................................Pennsylvania ....... 41,064 37,595 183,766 181,158 Tennessee ........... 25,711 22,704 ...................................... ......................................Utah ..................... 26,283 29,667 ...................................... ......................................Wisconsin ............ 19,211 9,798 ...................................... ......................................Other States 3 ...... 422,602 429,382 1,089,494 1,005,323
United States ....... 731,162 718,532 1,835,277 1,773,540
1 Includes Cheddar, Colby, washed curd, stirred curd, Monterey, and Jack. 2 Excluding cottage cheese. 3 States not shown when fewer than 3 plants reported or individual plant operations could be disclosed.
NASS, Livestock Branch, (202) 720–3570.
Table 8-23.—Dairy products: Average price per pound for specified products, 2014–2018
Item and market 2014 2015 2016 2017 2018
Dollars Dollars Dollars Dollars Dollars Butter, Chicago Mercantile Exchange, Grade AA:
High 1 .......................................................................................... 3 .0600 3.1350 2.3675 2.7375 2.4175 Low 1 .......................................................................................... 1 .5325 1.5400 1.7550 2.0625 2.0675
Butter, Agricultural Marketing Service, Grade AA: 2 2 .1361 2.0670 2.0777 2.3303 2.2572 Cheese, Cheddar, Chicago Mercantile Exchange, Barrels:
High 1 ...................................................................................... 2 .4900 1.7550 1.8800 1.7600 1.6675 Low 1 ....................................................................................... 1 .4200 1.4100 1.2700 1.3375 1.2345
Cheese, Cheddar, Chicago Mercantile Exchange, 40-lb blocks: High 1 ...................................................................................... 2 .4500 1.8000 1.9425 1.8500 1.6905 Low 1 ....................................................................................... 1 .5200 1.4000 1.2700 1.3600 1.3540
Cheese, Cheddar, Agricultural Marketing Service, Barrels: 3 2 .1376 1.6241 1.5961 1.5860 1.4659 Cheese, Cheddar, Agricultural Marketing Service, 40-lb blocks: 3 2 .1439 1.6389 1.5897 1.6513 1.5825 Nonfat dry milk, Agricultural Marketing Service:
Low/medium heat 2 .................................................................... 1 .7682 0.9016 0.8292 0.8666 0.7945 Dry whey, Agricultural Marketing Service:
Edible nonhygroscopic 2 ............................................................. 0 .6538 0.3804 0.2875 0.4437 0.3422
1 Figures are the high and low prices for any trading day during the year. 2 Simple average of the product prices from the Class and Component Prices Announcement. 3 Simple average of the block and barrel prices used in the calculation of the cheese price on the Class and Component Prices Announement. Historical data are available at: https://www.ams.usda.gov/ rules-regulations/mmr/dmr.
AMS, Dairy Programs, (202) 720–4392.

VIII–18 DAIRY AND POULTRY STATISTICS
Table 8-24.—Dairy products: Manufacturers’ stocks, end of month, United States, 2017–2018 1
Month
Evaporated and condensed whole milk 2
Dry whole milk Nonfat dry milk, human
2017 2018 2017 2018 2017 2018
1,000 1,000 1,000 1,000 1,000 1,000 pounds pounds pounds pounds pounds pounds
January ............... 43,940 51,472 18,034 33,232 227,052 300,828 February ............. 55,613 48,558 21,660 37,328 263,021 296,991 March ................. 50,777 49,050 22,284 46,035 246,484 297,296 April .................... 63,792 53,147 23,060 47,243 267,375 273,346 May ..................... 69,730 73,770 22,961 59,625 280,078 270,489 June .................... 76,890 73,123 21,224 56,604 297,773 303,301 July ..................... 79,138 79,064 21,864 51,876 295,906 317,447 August ................ 82,905 88,565 15,948 42,387 312,929 280,494 September .......... 75,947 79,977 20,608 32,589 320,765 261,646 October ............... 61,202 64,953 22,070 18,733 316,826 252,648 November ........... 41,983 43,053 27,878 17,559 316,969 289,199 December ........... 37,191 42,112 31,007 15,573 320,046 276,527
1 Stocks held by manufacturers at all points and in transit. 2 Combined to avoid disclosing individual plant operations. NASS, Livestock Branch, (202) 720–3570.
Table 8-25.—Dairy products: Total disappearance, and total and per capita consumption, United States, 2009–2018 1
Year
Butter Cheese 2 Condensed and evaporated milk 3
Total dis-appear-
ance
Consumption Total dis-appear-
ance
Consumption
Total dis-appear-
ance
Consumption
Total Per capita Total Per
capita Total Per capita
Million Million Million Million Million Million pounds pounds Pounds pounds pounds Pounds pounds pounds Pounds
2009 ............ 1,574 1,522 5.0 10,248 9,917 32.3 771 704 2.3 2010 ............ 1,623 1,521 4.9 10,605 10,136 32.7 718 610 2.0 2011 ............ 1,795 1,676 5.4 10,893 10,300 33.0 711 600 1.9 2012 ............ 1,829 1,730 5.5 11,123 10,461 33.3 715 629 2.0 2013 ............ 1,915 1,732 5.5 11,364 10,580 33.4 722 597 1.9 2014 ............ 1,887 1,753 5.5 11,784 10,887 34.2 537 451 1.4 2015 ............ 1,841 1,800 5.6 12,049 11,268 35.1 782 701 2.2 2016 ............ 1,881 1,843 5.7 12,492 11,776 36.4 741 662 2.0 2017 ............ 1,903 1,853 5.7 12,861 12,018 36.9 662 570 1.8 2018 ............ 1,959 1,898 5.8 13,265 12,407 37.9 700 618 1.9
Year
Reg hard ice cream (product weight)
Dry whole milk Nonfat dry milk (human food)
Total dis-appear-
ance
Consumption Total dis-appear-
ance
Consumption Total dis-appear-
ance
Consumption
Total Per capita
Total Per capita Total Per
capita
Million Million Million Million Million Million pounds pounds Pounds pounds pounds Pounds pounds pounds Pounds
2009 ............ 4,030 3,994 13.1 97 78 0.3 1,789 1,227 4.0 2010 ............ 3,851 3,808 12.4 86 64 0.2 1,864 998 3.2 2011 ............ 3,762 3,712 12.0 85 67 0.2 1,926 942 3.0 2012 ............ 3,765 3,705 12.0 80 53 0.2 2,132 1,137 3.6 2013 ............ 3,722 3,640 11.8 87 51 0.2 2,159 918 2.9 2014 ............ 3,607 3,523 11.3 103 63 0.2 2,209 997 3.1 2015 ............ 3,647 3,571 11.3 140 107 0.3 2,306 1,051 3.3 2016 ............ 3,676 3,602 11.3 129 87 0.3 2,292 961 3.0 2017 ............ 3,441 3,365 10.5 151 109 0.3 2,272 902 2.8 2018 ............ 3,384 3,298 10.4 175 115 0.4 2,386 794 2.4
1 Total disappearance is based on production, imports, and change in stocks during the year. Production statistics for these commodities appear in other tables in this chapter. The total apparent consumption was obtained by subtracting ending stocks, shipments, and exports, from the total supply. The per capita consumption for each year was obtained by dividing the total apparent consumption by the number of persons. 2 Includes all kinds of cheese except cottage cheese. 3 The evaporated milk is unskimmed, unsweetened, case goods. The condensed milk is unsweetened, unskimmed, bulk goods; and sweetened condensed milk, unskimmed, case and bulk goods.
ERS, Animal Products and Cost of Production Branch, (202) 694–5171.

VIII–19 AGRICULTURAL STATISTICS 2020
Table 8-26.—Dairy products: December 31 stocks, United States, 2009–2018
Year Butter 1 2 Cheese 1 3 Condensed and evaporated milk Dry whole milk
Nonfat dry milk for human
consumption 1
Million pounds Million pounds Million pounds Million pounds Million pounds
2009 ............... 133 967 45 7 132 2010 ............... 82 1,048 52 8 145 2011 ............... 107 992 37 7 165 2012 ............... 153 1,023 38 7 183 2013 ............... 112 1,009 37 8 135 2014 ............... 105 1,018 32 23 240 2015 ............... 155 1,146 43 11 204 2016 ............... 166 1,198 42 13 226 2017 ............... 169 1,280 37 31 320 2018 ............... 179 1,345 42 16 277
1 Includes Government holdings. 2 Includes anhydrous milkfat and butter oil. 3 Excludes cottage cheese. ERS, Animal Products and Cost of Production Branch, (202) 694–5171.
Table 8-27.—International dairy: Butter production, 2018–2020
Country 2018 2019 2020
1,000 metric tons
India ........................................................... 5,600 5,850 6,100 European Union ......................................... 2,345 2,425 2,410 United States ............................................. 858 861 885 New Zealand .............................................. 530 530 525 Russia ........................................................ 256 254 255 Mexico ........................................................ 228 231 233 Canada ...................................................... 116 112 115 Belarus ....................................................... 115 110 105 China .......................................................... 99 102 104 Ukraine ....................................................... 106 103 90 Brazil .......................................................... 85 86 87 Japan ......................................................... 60 61 62 Australia ..................................................... 93 65 60 Argentina .................................................... 33 30 32
FAS, Office of Global Analysis, (202) 720-6301. Prepared or estimated on the basis of official USDA production, supply, and distribution statistics from foreign governments.
Table 8-28.—International dairy: Cheese production, 2018–2020
Country 2018 2019 2020
1,000 metric tons
European Union ......................................... 10,160 10,275 10,350 United States ............................................. 5,908 5,950 6,100 Russia ........................................................ 970 970 970 Brazil .......................................................... 760 780 795 Canada ...................................................... 510 519 525 Argentina .................................................... 444 439 455 Mexico ........................................................ 419 436 454 Australia ..................................................... 367 370 375 New Zealand .............................................. 355 360 365 Belarus ....................................................... 275 300 325 China .......................................................... 272 281 287 Ukraine ....................................................... 192 195 197 Japan ......................................................... 45 45 46 Korea, South .............................................. 37 40 43 Philippines .................................................. 2 2 2
FAS, Office of Global Analysis, (202) 720-6301. Prepared or estimated on the basis of official USDA production, supply, and distribution statistics from foreign governments.

VIII–20 DAIRY AND POULTRY STATISTICS
Table 8-29.—Dairy products: United States imports by country of origin, 2017–2019
Commodity and country of origin 2017 2018 2019
Metric tons
Licensed cheese items 1: Netherlands ........................................ 6,459 6,500 6,905 United Kingdom .................................. 3,981 5,409 5,269 Ireland ................................................. 1,920 2,366 3,193 Australia(*) .......................................... 1,326 1,711 1,815 Denmark(*) ......................................... 1,702 1,940 1,783 New Zealand(*) ................................... 4,701 1,459 1,707 Germany(*) ......................................... 1,141 1,387 1,366 Canada ............................................... 946 1,243 787 Jamaica .............................................. 474 498 450 Italy(*) ................................................. 279 408 397 France(*) ............................................. 306 307 288 Dominican Republic ............................ 197 193 183 Bahrain ............................................... 148 138 157 Finland ................................................ 115 185 137 India .................................................... 140 115 75 Spain ................................................... 26 62 45 Poland ................................................. 43 39 43 Estonia ................................................ 17 85 25 Lithuania ............................................. 27 33 22 Philippines .......................................... 11 7 20 Belgium-Luxembourg(*) ...................... 6 1 13 Greece ................................................ 3 9 12 Chile .................................................... 0 1 9 Mexico ................................................ 0 0 3 Croatia ................................................ 2 1 3 Portugal .............................................. 3 3 2 Japan .................................................. 1 1 1 Switzerland(*) ...................................... 0 0 1 Austria ................................................. 1 0 0 Egypt ................................................... 0 1 0 Rest of World ...................................... 0 42 0
World Total ......................................... 23,971 24,143 24,712
Licensed cheese items 2: France(*) ............................................. 18,330 20,168 21,441 Italy(*) ................................................. 18,599 19,749 18,589 Switzerland(*) ...................................... 8,152 9,130 8,740 Netherlands ........................................ 8,034 7,380 7,827 Germany(*) ......................................... 7,718 7,787 6,793 Norway(*) ............................................ 4,736 5,969 6,328 Spain ................................................... 6,458 6,506 6,074 Denmark(*) ......................................... 5,126 6,327 5,194 Nicaragua ........................................... 2,118 1,964 5,008 Ireland ................................................. 4,331 4,146 4,922 Canada ............................................... 5,945 5,583 4,171 Finland ................................................ 4,078 4,395 3,861 Mexico ................................................ 3,387 3,386 3,308 New Zealand(*) ................................... 3,498 2,804 2,368 Lithuania ............................................. 454 461 2,145 Poland ................................................. 1,534 1,913 2,041 Australia(*) .......................................... 1,792 1,647 1,716 United Kingdom .................................. 1,033 1,273 1,233 Austria ................................................. 973 1,365 887 Uruguay .............................................. 782 749 802 Belgium-Luxembourg(*) ...................... 616 741 643 Greece ................................................ 466 621 588 Egypt ................................................... 440 465 571 Israel(*) ............................................... 428 522 540 Rest of World ...................................... 671 526 490 Uruguay .............................................. 312 371 472 Belgium-Luxembourg(*) ...................... 442 298 409 Greece ................................................ 76 171 377 Egypt ................................................... 261 351 370 Israel(*) ............................................... 2,701 40 329 Rest of World ...................................... 3,323 2,014 2,183
World Total ......................................... 116,813 118,822 120,419
See footnote(s) at end of table.

VIII–21 AGRICULTURAL STATISTICS 2020
Table 8-29.—Dairy products: United States imports by country of origin, 2017–2019—Continued
Commodity and country of origin 2017 2018 2019
Metric tons
Non-licensed cheese: Italy(*) ................................................. 17,428 11,948 15,392 Spain ................................................... 5,318 5,776 6,013 Greece ................................................ 3,405 3,611 4,004 France(*) ............................................. 3,151 3,942 3,199 Bulgaria ............................................... 2,583 2,814 2,558 Israel(*) ............................................... 553 584 617 Cyprus ................................................ 461 516 467 United Kingdom .................................. 693 385 433 Romania ............................................. 486 301 366 Norway(*) ............................................ 428 383 364 Turkey ................................................. 190 397 345 Netherlands ........................................ 197 160 211 Mexico ................................................ 2 0 180 El Salvador ......................................... 207 357 90 Switzerland(*) ...................................... 14 214 82 Albania ................................................ 0 0 81 Jordan ................................................. 13 114 66 Portugal .............................................. 28 26 25 Armenia .............................................. 0 15 23 Croatia ................................................ 4 20 23 Georgia ............................................... 16 34 23 Hungary .............................................. 11 10 19 Republic of North Macedonia ............. 140 11 18 Egypt ................................................... 27 77 14 Bosnia and Herzegovina .................... 5 6 9 Germany(*) ......................................... 2,379 4 8 Austria ................................................. 2 6 6 Brazil ................................................... 0 1 2 Kuwait ................................................. 0 0 1 Poland ................................................. 2 1 1 Rest of World ...................................... 3,876 1,536 4
World Total ......................................... 41,617 33,246 34,641
Casein: New Zealand(*) ................................... 30,658 23,161 22,933 Ireland ................................................. 7,468 7,456 10,703 Netherlands ........................................ 10,664 8,149 6,965 France(*) ............................................. 2,890 4,306 5,339 Poland ................................................. 3,888 2,442 4,053 Denmark(*) ......................................... 3,886 3,701 3,293 Argentina ............................................ 2,298 3,568 2,180 India .................................................... 1,506 2,249 2,136 Germany(*) ......................................... 2,295 1,482 1,700 Australia(*) .......................................... 0 0 1,466 Uganda ............................................... 1,020 476 353 Ukraine ............................................... 0 0 20 Belgium-Luxembourg(*) ...................... 0 54 15 Switzerland(*) ...................................... 0 24 15 Italy(*) ................................................. 4 4 0 Sweden ............................................... 0 0 0 Japan .................................................. 0 0 - Canada ............................................... 6 0 0 Mexico ................................................ 1 2 0 United Kingdom .................................. 0 19 0
World Total ......................................... 66,584 57,092 61,172
See footnote(s) at end of table.

VIII–22 DAIRY AND POULTRY STATISTICS
Table 8-29.—Dairy products: United States imports by country of origin, 2017–2019—Continued
Commodity and country of origin 2017 2018 2019
Metric tons
Non-licensed dairy, misc.: Canada ............................................... 10,194 10,246 16,334 Chile .................................................... 12,832 14,280 14,189 Peru .................................................... 11,560 11,973 7,441 Mexico ................................................ 5,625 8,541 6,066 New Zealand(*) ................................... 9,628 5,677 4,981 France(*) ............................................. 2,502 3,245 4,524 Denmark(*) ......................................... 2,559 2,104 2,046 Norway(*) ............................................ 1,907 1,238 1,929 Ireland ................................................. 153 1,300 1,593 Netherlands ........................................ 1,127 965 1,510 Italy(*) ................................................. 565 1,845 1,312 United Kingdom .................................. 430 244 1,138 Germany(*) ......................................... 890 973 1,069 Brazil ................................................... 3,722 496 655 Ukraine ............................................... 568 431 448 Colombia ............................................. 220 202 336 Israel(*) ............................................... 611 215 318 Iceland ................................................ 0 145 316 Malaysia .............................................. 65 83 256 Belgium-Luxembourg(*) ...................... 178 196 227 Australia(*) .......................................... 956 87 214 Argentina ............................................ 252 98 156 Russia ................................................. 69 95 137 China .................................................. 0 - 94 Poland ................................................. 152 112 75 Lithuania ............................................. 40 48 73 India .................................................... 119 72 67 Turkey ................................................. 74 64 61 Greece ................................................ 23 80 50 Yemen(*) ............................................. 0 18 18 Rest of World ...................................... 196 154 57
World Total ......................................... 67,215 65,222 67,688
Misc. Dairy Quota: Canada ............................................... 181,210 186,239 197,536 New Zealand(*) ................................... 49,953 38,842 43,433 Mexico ................................................ 21,020 20,344 21,316 Italy(*) ................................................. 14,654 13,429 14,096 Nicaragua ........................................... 7,250 11,464 12,391 Korea, South ....................................... 10,454 10,030 11,434 Germany(*) ......................................... 3,297 5,305 9,108 Guatemala .......................................... 5,094 6,417 5,720 France(*) ............................................. 4,493 6,238 5,521 Ireland ................................................. 2,192 5,184 5,356 Belgium-Luxembourg(*) ...................... 6,416 4,920 5,149 Netherlands ........................................ 304 2,691 3,221 Thailand .............................................. 1,450 3,082 2,772 India .................................................... 1,878 2,385 2,560 Austria ................................................. 1,889 1,844 1,766 Australia(*) .......................................... 3,453 2,740 1,368 South Africa ........................................ 1,411 1,263 1,192 Taiwan ................................................ 675 945 1,182 Malaysia .............................................. 1,278 1,129 1,126 Singapore ........................................... 626 742 849 Denmark(*) ......................................... 148 780 844 Israel(*) ............................................... 1,480 831 775 Russia ................................................. 114 202 768 Uruguay .............................................. 565 399 706 Japan .................................................. 397 515 636 Hungary .............................................. 306 2,094 552 Lithuania ............................................. 465 590 504 Switzerland(*) ...................................... 332 755 477 Brazil ................................................... 201 365 466 Philippines .......................................... 270 181 432 Rest of World ...................................... 11,053 4,419 4,928
World Total ......................................... 334,328 336,363 358,181
See footnote(s) at end of table.

VIII–23 AGRICULTURAL STATISTICS 2020
Table 8-29.—Dairy products: United States imports by country of origin, 2017–2019—Continued
Commodity and country of origin 2017 2018 2019
Metric tons
Licensed dairy, misc : Mexico ................................................ 28,056 21,884 45,746 Canada ............................................... 28,364 29,326 28,027 Germany(*) ......................................... 3,930 2,127 3,630 Chile .................................................... 9,211 6,753 2,423 Netherlands ........................................ 16,802 2,242 1,716 Belgium-Luxembourg(*) ...................... 655 742 1,063 Denmark(*) ......................................... 1,018 864 1,003 Ireland ................................................. 2,242 2,690 940 New Zealand(*) ................................... 2,051 1,129 928 Australia(*) .......................................... 365 270 754 Honduras ............................................ 344 351 477 Peru .................................................... 313 306 468 Italy(*) ................................................. 204 570 467 Korea, South ....................................... 245 662 356 France(*) ............................................. 205 426 345 Colombia ............................................. 164 174 193 Brazil ................................................... 129 185 188 Argentina ............................................ 69 142 135 Portugal .............................................. 29 192 130 Malaysia .............................................. 0 0 102 Singapore ........................................... 104 33 76 Switzerland(*) ...................................... 11 16 72 India .................................................... 40 452 64 Costa Rica .......................................... 30 71 32 Poland ................................................. 36 11 30 Greece ................................................ 62 29 23 United Kingdom .................................. 76 46 19 Africa, not elsewhere specified(*) ....... 0 2 16 Venezuela ........................................... 0 3 14 United Arab Emirates ......................... 224 122 8 Rest of World ...................................... 130 811 27
World Total ......................................... 95,110 76,632 89,472
Lactose: Germany(*) ......................................... 2,165 1,853 1,394 Canada ............................................... 503 203 1,035 Netherlands ........................................ 1,045 421 735 New Zealand(*) ................................... 86 127 177 India .................................................... 2 0 80 China .................................................. 34 24 11 Australia(*) .......................................... 16 0 7 Belarus ................................................ 5 3 5 Ukraine ............................................... 4 0 5 Japan .................................................. 1 1 1 Belgium-Luxembourg(*) ...................... 0 3 0 Switzerland(*) ...................................... 8 1 0 Argentina ............................................ 0 5 0 Bosnia and Herzegovina .................... 0 3 0 Ireland ................................................. - 0 0 France(*) ............................................. 0 45 0 Italy(*) ................................................. 1 11 0 Lithuania ............................................. 0 2 0 Poland ................................................. 5 0 0 Russia ................................................. 12 0 0 South Africa ........................................ 0 1 0 Singapore ........................................... 0 3 0 Taiwan ................................................ 1 0 0 United Kingdom .................................. 0 0 0
World Total ......................................... 3,887 2,704 3,450
(*) Denotes a country that is a summarization of its component countries. Note: All zeroes for a data item may show that statistics exist in the other import type. Consumption or General. Users should use cautious interpretation on quantity re-ports using mixed units of measure. Quantity line items will only include statistics on the units of measure that are equal to, or are able to be converted to the assigned unit of measure of the grouped commodities.
FAS, Office of Global Analysis, (202) 720-6301. Data Source: U.S. Census Bureau Trade Data.

VIII–24 DAIRY AND POULTRY STATISTICS
Table 8-30.—Dairy products: United States exports by area/partners of destination, 2017–2019
Commodity and destination 2017 2018 2019
Metric tons
Condensed & evap milk: Oceania .............................................. 111 174 104 Micronesia .......................................... 9 16 28 Australia(*) .......................................... 22 101 26 Marshall Islands .................................. 35 34 23 Palau ................................................... 19 21 21 French Pacific Islands(*) ..................... 3 2 3 Other Pacific Islands, NEC(*) ............. 10 0 3 New Zealand(*) ................................... 14 1 0
Non-fat dry milk: Oceania .............................................. 2,878 8,287 6,722 New Zealand(*) ................................... 600 7,998 6,119 Australia(*) .......................................... 2,277 287 604 Samoa ................................................ 1 0 0 Other Pacific Islands, NEC(*) ............. 0 1 0
Dry whole milk & cream: Oceania .............................................. 453 1,286 677 New Zealand(*) ................................... 0 577 489 Australia(*) .......................................... 435 708 175 Micronesia .......................................... 3 2 7 Palau ................................................... 11 0 6 Marshall Islands .................................. 3 0 1 Other Pacific Islands, NEC(*) ............. 1 0 0
Whey: Oceania .............................................. 29,213 24,761 36,797 New Zealand(*) ................................... 23,057 20,579 30,364 Australia(*) .......................................... 6,155 4,182 6,419 French Pacific Islands(*) ..................... 1 0 14
Casein: Oceania .............................................. 298 432 416 Australia(*) .......................................... 298 432 416 New Zealand(*) ................................... 0 0 0
Ice cream: Oceania .............................................. 5,732 7,680 6,334 Australia(*) .......................................... 5,150 7,024 5,622 Micronesia .......................................... 322 257 308 New Zealand(*) ................................... 0 113 176 Marshall Islands .................................. 161 130 120 Palau ................................................... 76 38 52 Other Pacific Islands, NEC(*) ............. 6 116 48 British Pacific Islands(*) ...................... 0 0 7 French Pacific Islands(*) ..................... 18 3 1 Samoa ................................................ 0 0 1
Cheese and curd: Oceania .............................................. 32,546 27,263 24,268 Australia(*) .......................................... 30,145 24,648 21,157 New Zealand(*) ................................... 2,325 2,434 2,988 French Pacific Islands(*) ..................... 52 141 90 Micronesia .......................................... 10 22 16 Samoa ................................................ 12 11 9 Marshall Islands .................................. 2 5 6 Palau ................................................... 1 1 2 Other Pacific Islands, NEC(*) ............. 0 0 1
Liters
Fluid milk and cream: Oceania .............................................. 287,237 254,182 261,916 Micronesia .......................................... 108,232 124,384 136,819 French Pacific Islands(*) ..................... 11,111 22,905 59,531 Marshall Islands .................................. 21,777 23,616 38,227 Australia(*) .......................................... 64,165 14,473 16,608 Palau ................................................... 45,435 49,793 6,507 New Zealand(*) ................................... 8,268 8,655 4,224 Other Pacific Islands, NEC(*) ............. 28,249 10,356 0
(*) Denotes a country that is a summarization of its component countries. Note: Users should use cautious interpretation on quantity reports using mixed units of measure. Quantity line items will only include statistics on the units of measure that are equal to, or are able to be converted to, the assigned unit of measure of the grouped commodities.
FAS, Office of Global Analysis, (202) 720-6301. Data Source: U.S. Census Bureau Trade Data, as of March 17, 2020.

VIII–25 AGRICULTURAL STATISTICS 2020
Table 8-31.—Chickens: Layers, pullets, and other chickens, by State and United States, December 1, 2017 and 2018
State Total layers Total pullets Other Chickens
2017 2018 2017 2018 2017 2018
Thousands Thousands Thousands Thousands Thousands Thousands
Alabama ..................... 9,348 9,962 5,792 6,342 973 1,071 Arkansas .................... 14,175 14,690 8,372 8,596 1,009 1,060 California .................... 14,582 15,021 3,237 4,025 54 54 Colorado .................... 4,635 5,141 1,254 1,124 36 55 Florida ........................ 7,383 7,352 2,087 1,618 20 25 Georgia ...................... 20,134 20,222 8,822 9,644 1,101 894 Illinois ......................... 5,635 6,476 433 365 22 19 Indiana ....................... 34,082 34,631 9,202 9,693 72 49 Iowa ........................... 56,337 58,188 13,243 14,313 107 78 Kentucky .................... 5,644 5,942 2,541 2,418 214 216 Louisiana ................... 2,014 2,078 735 637 75 99 Maryland .................... 2,858 2,831 1,400 1,260 9 8 Massachusetts ........... 140 154 9 30 - - Michigan .................... 14,737 16,149 3,655 3,476 4 4 Minnesota .................. 10,458 11,174 3,427 2,974 33 37 Mississippi ................. 5,684 5,536 3,531 3,651 501 508 Missouri ..................... 10,509 12,537 4,527 5,600 191 199 Montana ..................... 942 1,000 244 236 - - Nebraska ................... 7,670 8,453 1,814 1,711 52 28 New York ................... 5,626 5,628 1,095 996 6 11 North Carolina ........... 15,294 13,434 7,319 7,399 894 851 Ohio ........................... 35,542 32,967 8,395 10,632 51 1 Oklahoma .................. 2,951 3,105 1,103 1,192 232 179 Oregon ....................... 2,404 2,279 553 725 - - Pennsylvania ............. 29,391 28,758 4,737 5,161 165 182 South Carolina ........... 4,055 4,263 1,399 1,334 156 125 South Dakota ............. 2,682 2,665 882 777 - - Tennessee ................. 1,872 1,658 915 1,019 170 147 Texas ......................... 22,549 22,747 6,559 6,533 404 349 Utah ........................... 5,036 4,713 1,178 1,139 - - Vermont ..................... 202 190 20 6 - 2 Virginia ....................... 2,675 2,735 1,011 1,283 151 165 Washington ................ 6,770 6,772 1,721 1,339 - - West Virginia ............. 1,251 1,207 770 632 99 93 Wisconsin .................. 7,383 7,284 1,679 1,509 22 25 Other States 1 ............ 18,156 18,928 3,512 4,746 36 34
United States ............. 390,806 396,870 117,173 124,135 6,859 6,568
- Represents zero. 1 Alaska, Arizona, Connecticut, Delaware, Hawaii, Idaho, Kansas, Maine, New Hampshire, New Jer-sey, New Mexico, Nevada, North Dakota, Rhode Island, and Wyoming combined to avoid disclosing individual operations.
NASS, Livestock Branch, (202) 720–3570.
Table 8-32.—Chickens: Inventory number and value, United States, Dec. 1, 2009–2018 1
Year Total layers Total pullets Other chickens All chickens Value per head Total value
Thousands Thousands Thousands Thousands Dollars 1,000 dollars
2009 ........... 342,058 104,069 8,487 454,614 3.32 1,510,038 2010 ........... 342,782 107,025 7,390 457,197 3.58 1,637,016 2011 ........... 343,283 104,159 6,922 454,364 3.79 1,721,671 2012 ........... 354,977 105,140 6,827 466,944 4.04 1,885,904 2013 ........... 367,356 108,919 6,853 483,128 4.15 2,007,374 2014 ........... 374,880 108,044 6,403 489,327 4.13 2,020,748 2015 ........... 356,312 120,007 7,211 483,530 4.38 2,115,982 2016 ........... 380,610 113,239 6,759 500,608 4.23 2,115,245 2017 ........... 390,806 117,173 6,859 514,838 4.20 2,162,545 2018 ........... 396,870 124,135 6,568 527,573 4.33 2,284,164
1 Excludes commercial broilers. NASS Livestock Branch, (202) 720-3570.

VIII–26 DAIRY AND POULTRY STATISTICS
Table 8-33.—Chicken inventory: Number, value per head, and total value, by State and United States, December 1, 2017 and 2018 1
State Number Value per bird Total value
2017 2018 2017 2018 2017 2018
1,000 Head 1,000 Head Dollars Dollars 1,000 Dollars 1,000 Dollars
Alabama ..................... 16,113 17,375 7.40 9.20 119,236 159,850 Arkansas .................... 23,556 24,346 7.90 8.50 186,092 206,941 California .................... 17,873 19,100 3.70 3.80 66,130 72,580 Colorado .................... 5,925 6,320 2.50 2.40 14,813 15,168 Florida ........................ 9,490 8,995 2.30 2.70 21,827 24,287 Georgia ...................... 30,057 30,760 6.20 6.60 186,353 203,016 Illinois ......................... 6,090 6,860 2.70 2.60 16,443 17,836 Indiana ....................... 43,356 44,373 1.90 2.30 82,376 102,058 Iowa ........................... 69,687 72,579 2.30 2.40 160,280 174,190 Kentucky .................... 8,399 8,576 4.80 5.00 40,315 42,880 Louisiana ................... 2,824 2,814 5.20 5.50 14,685 15,477 Maryland .................... 4,267 4,099 4.00 3.90 17,068 15,986 Massachusetts ........... 149 184 7.50 9.50 1,118 1,748 Michigan .................... 18,396 19,629 2.20 2.60 40,471 51,035 Minnesota .................. 13,918 14,185 2.30 2.30 32,011 32,626 Mississippi ................. 9,716 9,695 8.80 8.60 85,501 83,377 Missouri ..................... 15,227 18,336 4.10 4.20 62,431 77,011 Montana ..................... 1,186 1,236 5.70 8.60 6,760 10,630 Nebraska ................... 9,536 10,192 3.70 4.10 35,283 41,787 New York ................... 6,727 6,635 2.40 2.90 16,145 19,242 North Carolina ........... 23,507 21,684 7.70 8.70 181,004 188,651 Ohio ........................... 43,988 43,600 4.40 3.80 193,547 165,680 Oklahoma .................. 4,286 4,476 7.00 7.50 30,002 33,570 Oregon ....................... 2,957 3,004 5.00 4.90 14,785 14,720 Pennsylvania ............. 34,293 34,101 4.20 3.60 144,031 122,764 South Carolina ........... 5,610 5,722 4.70 5.00 26,367 28,610 South Dakota ............. 3,564 3,442 3.50 3.50 12,474 12,047 Tennessee ................. 2,957 2,824 9.40 9.10 27,796 25,698 Texas ......................... 29,512 29,629 4.40 4.80 129,853 142,219 Utah ........................... 6,214 5,852 2.20 2.30 13,671 13,460 Vermont ..................... 222 198 8.60 7.20 1,909 1,426 Virginia ....................... 3,837 4,183 7.30 6.50 28,010 27,190 Washington ................ 8,491 8,111 3.90 4.20 33,115 34,066 West Virginia ............. 2,120 1,932 7.50 7.90 15,900 15,263 Wisconsin .................. 9,084 8,818 2.40 2.50 21,802 22,045 Other States 2 ............ 21,704 23,708 3.82 2.91 82,941 69,030
United States ............. 514,838 527,573 4.20 4.33 2,162,545 2,284,164
Totals may not add due to rounding. 1 Excludes commercial broilers. 2 Alaska, Arizona, Connecticut, Delaware, Hawaii, Idaho, Kansas, Maine, New Hampshire, New Jersey, New Mexico, Nevada, North Dakota, Rhode Island and Wyoming com-bined to avoid disclosing data for individual operations.
NASS, Livestock Branch, (202) 720-3570.
Table 8-34.—Mature chickens: Lost, sold for slaughter, price, and value, United States, 2009–2018 1
Year Number Pounds (live weight)
sold 3 Price per pound live
weight 3 Lost 2 Sold 3
1,000 head 1,000 head 1,000 pounds 1,000 dollars
2009 ............ 99,596 176,266 910,333 65,381 2010 ............ 108,356 173,404 903,750 73,099 2011 ............ 106,361 182,153 943,142 81,110 2012 ............ 103,758 179,162 901,411 79,208 2013 ............ 102,105 186,486 940,635 89,497 2014 ............ 106,166 192,334 970,852 96,840 2015 ............ 132,625 198,648 1,010,070 104,828 2016 ............ 106,166 207,923 1,060,677 87,949 2017 ............ 125,941 189,841 1,001,685 46,999 2018 ............ 136,698 189,603 1,019,695 49,365
1 Annual estimates cover the period December 1 previous year through November 30. Excludes broilers. 2 Includes rendered, died, destroyed, composted, or disappeared for any reason (excluding sold for slaughter) during the 12-month pe-riod.
NASS, Livestock Branch, (202) 720–3570.

VIII–27 AGRICULTURAL STATISTICS 2020
Table 8-35.—Chickens: Lost, sold for slaughter, and value of sales, by State and United States, 2017 and 2018 1
State Number lost 2 Number sold Pounds sold Value of sales
2017 2018 2017 2018 2017 2018 2017 2018
1,000 head 1,000 pounds 1,000 dollars
Alabama .................. 3,195.9 3,476.2 11,002.1 11,650.7 87,466.7 92,856.1 6,472.5 7,057.1 Arkansas ................. 3,474.2 3,513.9 16,212.7 15,524.2 121,595.3 115,034.3 8,633.3 8,282.5 California ................. 5,978.1 7,143.7 3,013.3 2,671.1 11,058.8 9,909.8 132.7 109.0 Colorado .................. 2,313.7 2,240.8 1,553.0 1,286.7 7,873.7 6,973.9 338.6 341.7 Florida ..................... 5,378.0 5,022.6 380.5 401.7 2,891.8 3,000.7 214.0 216.1 Georgia .................... 6,131.3 6,425.8 15,484.6 17,214.4 108,701.9 118,262.9 7,283.0 7,805.4 Illinois ...................... 1,221.4 1,487.4 1,911.5 2,505.2 7,301.9 9,519.8 109.5 123.8 Indiana ..................... 14,310.9 13,820.0 11,245.3 12,441.1 39,246.1 44,041.5 196.2 220.2 Iowa ......................... 28,024.3 31,854.6 6,376.6 9,608.6 22,063.0 33,534.0 110.3 100.6 Kentucky .................. 992.6 1,085.1 4,506.6 5,181.5 26,138.3 30,260.0 1,437.6 1,664.3 Louisiana ................. 315.0 403.5 1,879.4 1,930.1 11,953.0 12,410.5 729.1 769.5 Maryland .................. 280.0 809.6 1,525.3 508.1 5,613.1 2,118.8 67.4 50.9 Massachusetts ........ 9.2 89.2 75.4 0.2 254.1 0.7 (Z) (Z) Michigan .................. 1,069.5 3,959.0 9,756.2 5,674.0 32,976.0 19,518.6 33.0 19.5 Minnesota ................ 3,902.3 4,729.9 4,058.2 3,571.8 15,705.2 15,394.5 267.0 431.0 Mississippi ............... 1,399.8 1,406.8 5,525.2 5,812.7 40,555.0 43,072.1 2,798.3 3,058.1 Missouri ................... 3,209.7 2,418.0 8,703.9 6,790.5 41,865.8 34,971.1 1,632.8 1,573.7 Montana .................. 322.6 629.9 52.3 5.1 176.3 17.5 (Z) (Z) Nebraska ................. 791.9 1,272.1 5,814.8 4,035.2 19,886.6 14,042.5 59.7 28.1 New York ................. 509.2 586.4 3,903.2 4,532.3 13,192.8 15,681.8 13.2 15.7 North Carolina ......... 4,056.5 4,059.9 14,993.5 17,210.5 103,305.2 112,900.9 6,818.1 7,112.8 Ohio ......................... 10,930.4 11,193.0 12,950.4 12,662.9 46,491.9 46,219.6 371.9 416.0 Oklahoma ................ 736.2 775.1 2,562.1 2,251.2 20,112.5 18,144.7 1,488.3 1,397.1 Oregon .................... 1,625.6 1,710.8 14.1 14.9 47.5 51.3 (Z) (Z) Pennsylvania ........... 2,781.9 2,855.3 11,201.6 11,911.9 41,670.0 45,146.1 541.7 632.0 South Carolina ........ 1,961.7 1,993.0 1,916.2 2,269.1 12,608.6 15,611.4 807.0 1,046.0 South Dakota .......... 904.6 1,091.5 1,072.3 140.3 3,613.7 481.2 3.6 0.5 Tennessee ............... 521.1 467.9 1,802.3 1,917.2 14,076.0 14,800.8 1,041.6 1,095.3 Texas ....................... 4,156.5 3,686.8 14,270.9 14,350.6 69,784.7 72,470.5 2,861.2 3,116.2 Utah ......................... 1,598.2 1,127.0 2,648.0 2,271.9 8,923.8 7,815.3 8.9 7.8 Vermont ................... 19.2 25.2 103.2 142.2 390.1 594.4 5.9 14.3 Virginia .................... 1,536.5 1,326.4 2,116.9 2,092.1 17,041.0 16,841.4 1,278.1 1,279.9 Washington ............. 4,852.1 5,113.0 33.3 36.3 112.2 129.6 (Z) (Z) West Virginia ........... 286.7 276.3 1,690.7 1,740.5 13,153.6 13,680.3 973.4 1,026.0 Wisconsin ................ 1,093.4 2,951.1 2,540.6 2,157.1 9,781.3 9,340.2 166.3 261.5 Other States 3 .......... 6,050.5 5,670.9 6,944.5 7,088.7 24,057.8 24,845.7 104.2 90.9
United States ........... 125,940.7 136,697.7 189,840.7 189,602.6 1,001,685.3 1,019,694.5 46,999.0 49,364.4
(Z) Less than half of the unit shown. 1 Annual estimates cover the period December 1 previous year through November 30. Exclude broilers. Totals may not add due to rounding. 2 Includes rendered, died, destroyed, composted, or dis-appeared for any reason except sold during the 12-month period. 3 Alaska, Arizona, Connecticut, Delaware, Hawaii, Idaho, Kansas, Maine, Nevada, New Hampshire, New Jersey, New Mexico, North Dakota, Rhode Island, and Wyoming combined to avoid disclosing data for individual operations.
NASS, Livestock Branch, (202) 720–3570.
Table 8-36.—Chickens: Production, commercial storage, exports, and consumption, United States, 2010–2019
Year
Production Commercial storage at
beginning of year
Exports Commercial storage at
end of year
Consumption
Commercial broilers
Other chickens Total 1 Total 1 2 Per capita
Million pounds Pounds
2010 ......... 36,515 504 37,018 618 6,840 777 30,130 97 2011 ......... 36,804 521 37,325 777 7,069 592 30,549 98 2012 ......... 36,643 516 37,159 592 7,363 652 29,850 95 2013 ......... 37,425 523 37,948 652 7,453 675 30,597 97 2014 ......... 38,153 521 38,673 675 7,406 683 31,378 98 2015 ......... 39,620 522 40,142 683 6,465 840 33,652 105 2016 ......... 40,261 548 40,809 840 6,803 786 34,194 106 2017 ......... 41,217 535 41,751 786 6,916 861 34,890 107 2018 ......... 42,145 539 42,684 861 7,153 850 35,683 109 2019 ......... 43,435 528 43,963 850 7,190 942 36,814 112
1 Totals may not add due to rounding. 2 Shipments to territories now included in total consumption. ERS Markets and Trade Economics Division, Animal Products and Cost of Production Branch, (202) 694–5308. Data as
of March 13, 2020.

VIII–28 DAIRY AND POULTRY STATISTICS
Table 8-37.—Broilers: Production and value, United States, 2009–2018 1 2 3
Year Number produced Pounds produced Value of production
1,000 head 1,000 pounds 1,000 dollars
2009 ............................. 8,550,200 47,752,300 21,822,804 2010 ............................. 8,623,600 49,152,600 23,691,553 2011 ............................. 8,607,600 50,082,400 22,987,822 2012 ............................. 8,463,000 49,655,600 24,827,800 2013 ............................. 8,533,800 50,678,200 30,761,669 2014 ............................. 8,545,000 51,378,700 32,728,234 2015 ............................. 8,688,700 53,376,200 28,716,398 2016 ............................. 8,776,700 54,259,100 25,935,852 2017 ............................. 8,913,800 55,573,900 30,232,203 2018 ............................. 9,037,100 56,791,100 31,746,230
1 December 1, previous year through November 30, current year. 2 Broiler production including other domestic meat-type strains. 3 Excludes States producing less than 500,000 broilers.
NASS, Livestock Branch, (202) 720–3570.
Table 8-38.—Broilers: Production and value, States and United States, 2017 and 2018 1
State
2017 2018
Number produced
Pounds produced
Value of production
Number produced
Pounds produced
Value of production
1,000 1,000 1,000 1,000 1,000 1,000 head pounds dollars head pounds dollars
Alabama ............... 1,095,400 6,134,200 3,337,005 1,123,700 6,180,400 3,454,844 Arkansas .............. 1,059,000 6,989,400 3,802,234 1,092,000 7,316,400 4,089,868 Delaware .............. 259,800 1,870,600 1,017,606 263,600 1,924,300 1,075,684 Florida .................. 65,200 371,600 202,150 65,400 385,900 215,718 Georgia ................ 1,363,400 8,044,100 4,375,990 1,361,400 8,168,400 4,566,136 Kentucky .............. 295,800 1,893,100 1,029,846 303,300 1,971,500 1,102,069 Maryland .............. 306,700 1,840,200 1,001,069 289,400 1,736,400 970,648 Minnesota ............ 59,700 358,200 194,861 59,100 360,500 201,520 Mississippi ........... 741,100 4,743,000 2,580,192 747,800 4,711,100 2,633,505 Missouri ............... 291,100 1,426,400 775,962 293,100 1,465,500 819,215 North Carolina ..... 830,800 6,563,300 3,570,435 873,600 6,901,400 3,857,883 Ohio ..................... 99,300 526,300 286,307 107,900 561,100 313,655 Oklahoma ............ 204,500 1,370,200 745,389 196,800 1,318,600 737,097 Pennsylvania ....... 185,200 1,037,100 564,182 200,100 1,140,600 637,595 South Carolina ..... 243,100 1,798,900 978,602 237,800 1,807,300 1,010,281 Tennessee ........... 171,500 909,000 494,496 177,300 939,700 525,292 Texas ................... 651,200 4,102,600 2,231,814 653,500 4,247,800 2,374,520 Virginia ................. 277,400 1,608,900 875,242 278,900 1,673,400 935,431 West Virginia ....... 86,100 335,800 182,675 83,300 316,500 176,924 Wisconsin ............ 53,800 226,000 122,944 55,800 228,800 127,899 Other States 2 ...... 573,700 3,425,000 1,863,202 573,300 3,435,500 1,920,446
United States ....... 8,913,800 55,573,900 30,232,203 9,037,100 56,791,100 31,746,230
1 Annual estimates cover the period December 1 previous year through November 30. Broiler production including other domestic meat-type strains. Excludes States producing less than 500,000 broilers. 2 Includes State estimates not shown and States whithheld to avoid disclosing data for individual operations.
NASS, Livestock Branch, (202) 720–3570.

VIII–29 AGRICULTURAL STATISTICS 2020
Table 8-39.—Poultry: Slaughtered under Federal inspection, by class, United States, 2016–2018
Class Number slaughtered Total live weight
2016 2017 2018 2016 2017 2018
Thousands Thousands Thousands Thousands Thousands Thousands
Young chickens ............... 8,768,399 8,916,083 9,034,504 54,036,929 55,314,913 56,541,518 Mature chickens .............. 140,587 134,619 126,406 848,287 822,578 816,199
Total chickens ................. 8,908,986 9,050,702 9,160,910 54,885,216 56,137,491 57,357,717
Young turkeys ................. 241,418 240,014 235,198 7,412,058 7,420,122 7,310,114 Old turkeys ...................... 1,837 1,666 1,662 51,966 48,973 48,981
Total turkeys .................... 243,255 241,680 236,860 7,464,024 7,469,095 7,359,095
Ducks ............................... 27,268 26,628 27,647 186,715 184,338 192,980 Other poultry 1 ................. (NA) (NA) (NA) 4,054 4,211 3,872
Total poultry ..................... (NA) (NA) (NA) 62,540,009 63,795,135 64,913,664
Class
Pounds condemned
Ante-mortem (live weight) Post-mortem (Carcass and parts)
2016 2017 2018 2016 2017 2018
Thousands Thousands Thousands Thousands Thousands Thousands
Young chickens ............... 124,994 124,241 130,452 356,808 342,149 322,994 Mature chickens .............. 10,156 9,563 8,167 30,365 25,923 20,727
Total chickens .............. 135,150 133,804 138,619 387,173 368,072 343,721
Young turkeys ................. 18,680 18,798 19,090 86,939 84,726 82,278 Old turkeys ...................... 662 543 494 1,900 2,025 1,944
Total turkeys .................... 19,342 19,341 19,584 88,839 86,751 84,222
Ducks ............................... 528 592 797 3,633 3,531 3,667 Other poultry 2 ................. 4 5 5 28 40 35
Total poultry ..................... 155,024 153,742 159,005 479,673 458,394 431,645
Class Pounds certified (ready-to-cook)
2016 2017 2018
Thousands Thousands Thousands
Young chickens ............... 40,696,114 41,662,394 42,600,735 Mature chickens .............. 548,567 535,291 539,362
Total chickens ................. 41,244,681 42,197,685 43,140,097
Young turkeys ................. 5,942,076 5,943,827 5,841,082 Old turkeys ...................... 39,025 36,750 37,009
Total turkeys .................... 5,981,101 5,980,577 5,878,091
Ducks ............................... 135,821 134,313 140,936 Other poultry 2 ................. 2,655 2,727 2,563
Total poultry ..................... 47,364,258 48,315,302 49,161,687
(NA) Not available. 1 Includes geese, guineas, ostriches, emus, rheas, and squab. 2 Includes geese, guineas, and squab.
NASS, Livestock Branch, (202) 720–3570.

VIII–30 DAIRY AND POULTRY STATISTICS
Table 8-40.—Poultry: Feed-price ratios, United States, 2009–2018
Year Ratios 1
Egg-feed Broiler-feed Turkey-feed
Pounds Pounds Pounds
2009 ........................... 7.2 4.1 5.0 2010 ........................... 7.5 4.5 6.2 2011 ........................... 6.0 3.1 4.9 2012 ........................... 5.4 3.1 4.7 2013 ........................... 6.5 3.7 4.6 2014 ........................... 10.2 5.0 6.3 2015 ........................... 17.1 5.0 8.5 2016 ........................... 5.9 4.7 9.2 2017 ........................... 7.7 5.4 7.2 2018 ........................... 11.3 5.6 5.5
1 Number of pounds of poultry feed equivalent in value at local market prices to 1 dozen market eggs, or 1 pound of broil-er or 1 pound of turkey live weight. Simple average of monthly feed-price ratios. Egg feed= corn (75 lbs) and soybeans (25 lbs); broiler feed= corn (58 lbs); soybeans (42 lbs); turkey feed= corn (51 lbs), soybeans (28 lbs), and wheat (21 lbs). Monthly equivalent prices of commercial prepared feeds are based on current U.S. prices received for corn, soy-beans, and wheat.
NASS, Environmental, Economics, and Demographics Branch, (202) 720–6146.
Table 8-41.—Turkeys: Production, commercial storage, exports, and consumption, United States, 2010–2019
Year Production
Commercial storage at beginning
of year
Exports Commercial
storage at end of year
Consumption
Total 1 2 Per capita
Million pounds Pounds
2010 ....................... 5,570 262 581 192 5,084 16 2011 ....................... 5,715 192 703 211 5,013 16 2012 ....................... 5,889 211 797 296 5,028 16 2013 ....................... 5,729 296 741 237 5,068 16 2014 ....................... 5,756 237 775 193 5,052 16 2015 ....................... 5,627 193 529 201 5,135 16 2016 ....................... 5,981 201 569 279 5,384 17 2017 ....................... 5,981 279 622 310 5,352 16 2018 ....................... 5,878 310 611 303 5,293 16 2019 ....................... 5,818 303 639 233 5,261 16
1 Totals may not add due to rounding. 2 Shipments to territories now included in consumption. ERS Markets and Trade Economics Division, Animal Products and Cost of Production Branch, (202) 694–5409. Data as
of March 13, 2020.
Table 8-42.—Turkeys: Production and value, United States, 2009–2018
Year Number raised Pounds
(live weight) produced
Value of production 1
1,000 head 1,000 pounds 1,000 dollars
2009 ........................... 247,359 7,149,314 3,573,324 2010 ........................... 244,188 7,108,222 4,372,438 2011 ........................... 248,500 7,313,205 4,987,608 2012 ........................... 253,500 7,561,905 5,452,135 2013 ........................... 240,000 7,277,536 4,839,562 2014 ........................... 237,500 7,217,006 5,304,501 2015 ........................... 233,100 7,038,136 5,707,928 2016 ........................... 244,000 7,486,978 6,184,247 2017 ........................... 245,200 7,554,397 4,873,677 2018 ........................... 244,750 7,598,289 3,875,131
NASS, Livestock Branch, (202) 720–3570.

VIII–31 AGRICULTURAL STATISTICS 2020
Table 8-43.—Turkeys: Production and value, by State and United States, 2017–2018 1
State
2017 2018
Number raised
Pounds produced
Value of production
Number raised
Pounds produced
Value of production
1,000 head 1,000 pounds 1,000 dollars 1,000 head 1,000 pounds 1,000 dollars
Arkansas ................. 29,500 587,050 379,234 31,500 595,350 303,629 California ................. 11,500 319,700 206,526 11,000 317,900 162,129 Indiana .................... 20,000 792,000 511,632 20,000 768,000 391,680 Iowa ........................ 12,000 484,800 313,181 11,900 477,190 243,367 Michigan ................. 5,100 206,040 133,102 5,300 222,070 113,256 Minnesota ............... 42,000 1,058,400 683,726 42,000 1,113,000 567,630 Missouri .................. 18,500 614,200 396,773 19,000 640,300 326,553 North Carolina ........ 32,500 1,144,000 739,024 32,500 1,196,000 609,960 Ohio ........................ 6,700 280,730 181,352 6,700 282,070 143,856 Pennsylvania .......... 7,500 204,750 132,269 7,000 195,300 99,603 South Dakota .......... 4,100 176,300 113,890 4,250 179,350 91,469 Utah ........................ 5,200 134,160 86,667 (D) (D) (D) Virginia .................... 16,800 458,640 296,281 16,800 462,000 235,620 West Virginia .......... 3,700 111,000 71,706 3,100 96,410 49,169 Other States 2 ......... 30,100 972,621 628,314 33,700 1,053,349 537,210
United States .......... 245,200 7,544,391 4,873,677 244,750 7,598,289 3,875,131
(D) Withheld to avoid disclosing data for individual operations. 1 Based on turkeys placed September 1 through August 31. Excludes young turkeys lost. 2 Includes State estimates not shown and States withheld to avoid disclosing data for in-dividual operations.
NASS, Livestock Branch, (202) 720–3570.
Table 8-44.—Turkeys: Net poults placements, United States, Monthly, 2017–2018 1
Month Total all breeds Percent of
Previous Year 2017 2018
Thousands Thousands Percent
January .................. 23,046 22,642 98 February ................. 22,078 21,340 97 March ..................... 23,636 22,793 96 April ........................ 22,237 22,335 100 May ........................ 22,639 22,168 98 June ....................... 23,950 22,597 94 July ......................... 23,987 25,652 107 August .................... 24,321 23,362 96 September ............. 20,670 20,512 99 October .................. 22,030 22,377 102 November .............. 21,399 21,108 99 December .............. 20,766 19,915 96
Total ....................... 270,759 266,801 99
1 Includes imports and excludes exports. NASS, Livestock Branch, (202) 720–3570.

VIII–32 DAIRY AND POULTRY STATISTICS
Table 8-45.—Turkeys: Poults hatched by commercial hatcheries, United States by Month, 2017–2018
Month 2017 2018 Percent of Previous Year
Thousands Thousands Percent January ............ 25,412 24,406 96 February ........... 23,679 22,654 96 March ............... 25,812 24,180 94 April .................. 23,278 23,482 101 May .................. 24,169 23,503 97 June ................. 25,125 23,337 93 July ................... 24,691 25,730 104 August .............. 24,868 23,888 96 September ........ 23,530 22,443 95 October ............ 24,393 24,295 100 November ......... 24,532 29,089 119 December ......... 22,272 23,176 104
Total ................. 291,761 290,183 99
NASS, Livestock Branch, (202) 720–3570.
Table 8-46.—Eggs: Supply, distribution, and per capita consumption, United States, 2010–2019 1
Year Total egg production
Storage at beginning of
the year 1 Imports 2 Exports 2
Storage at end of the
year 2
Eggs used for
hatching
Consumption
Total 3 Per capita
Million dozen Number
2010 ............ 7,656 93 22 295 98 982 6,396 248 2011 ............ 7,715 98 21 305 120 950 6,459 248 2012 ............ 7,884 120 19 336 85 941 6,660 254 2013 ............ 8,233 85 17 425 63 964 6,884 261 2014 ............ 8,509 63 35 414 76 981 7,136 269 2015 ............ 8,144 76 132 342 74 996 6,941 259 2016 ............ 8,668 74 130 304 142 1,010 7,415 275 2017 ............ 8,947 142 34 355 88 1,035 7,646 282 2018 ............ 9,205 88 18 333 79 1,058 7,841 287 2019 ............ 9,447 79 15 334 109 1,079 8,019 292
1 Calendar years. 2 Shell eggs and the approximate shell-egg equivalent of egg product. 3 Shipments to territories now included in total consumption.
ERS Markets and Trade Economics Division, Animal Products and Cost of Production Branch, (202) 694–5409. Data as of March 13, 2020.
Table 8-47.—Eggs, shell: Average price per dozen on consumer Grade A cartoned white eggs to volume buyers, store-door delivery, New York, 2010–2019
Year Large
Cents 2010 ....................................................................................... 106.29 2011 ....................................................................................... 115.31 2012 ....................................................................................... 117.46 2013 ....................................................................................... 124.69 2014 ....................................................................................... 142.33 2015 ....................................................................................... 181.74 2016 ....................................................................................... 85.70 2017 ....................................................................................... 100.96 2018 ....................................................................................... 137.58 2019 ....................................................................................... 94.00
AMS, Livestock, Poultry and Seed Programs, Livestock, Poultry and Grain Market News Division, (515) 284-4460.

VIII–33 AGRICULTURAL STATISTICS 2020
Table 8-48.—Total layers and egg production: Annual average number of layers, eggs per layer, and total production, by State and United States, 2017–2018 1
State Average number of layers Eggs per layer 2 Total egg production
2017 2018 2017 2018 2017 2018
Thousands Thousands Number Number Millions Millions
Alabama ..................... 9,112 9,556 227 223 2,072.3 2,133.3 Arkansas .................... 14,147 14,668 243 241 3,431.0 3,534.7 California .................... 13,202 14,542 285 295 3,759.6 4,294.6 Colorado .................... 4,642 4,866 305 305 1,414.5 1,482.9 Florida ........................ 7,587 7,340 276 273 2,095.7 2,005.4 Georgia ...................... 19,565 19,607 256 248 5,010.6 4,871.1 Illinois ......................... 5,088 6,004 295 294 1,500.4 1,764.1 Indiana ....................... 33,553 33,794 294 286 9,869.7 9,658.6 Iowa ........................... 55,867 57,614 289 282 16,155.2 16,273.8 Kentucky .................... 5,190 5,690 262 252 1,360.5 1,434.4 Louisiana ................... 1,984 2,004 242 258 480.8 517.5 Maryland .................... 2,852 2,689 295 290 840.1 780.6 Massachusetts ........... 124 142 324 304 40.2 43.1 Michigan .................... 14,272 15,387 296 296 4,225.5 4,548.1 Minnesota .................. 10,462 10,812 294 290 3,070.7 3,131.8 Mississippi ................. 5,587 5,673 249 250 1,392.8 1,418.6 Missouri ..................... 10,764 11,937 292 291 3,146.3 3,473.9 Montana ..................... 523 900 294 325 153.8 292.5 Nebraska ................... 8,167 7,829 305 305 2,489.1 2,388.8 New York ................... 5,660 5,553 303 298 1,717.8 1,656.5 North Carolina ........... 15,295 14,573 259 254 3,956.2 3,705.4 Ohio ........................... 33,773 32,848 289 285 9,754.6 9,364.9 Oklahoma .................. 2,931 3,051 236 228 691.8 697.1 Oregon ....................... 2,369 2,382 314 307 744.6 732.4 Pennsylvania ............. 28,232 28,477 295 296 8,337.3 8,423.1 South Carolina ........... 3,922 4,331 272 267 1,068.3 1,156.2 South Dakota ............. 2,701 2,603 290 307 784.3 797.9 Tennessee ................. 1,642 1,798 229 216 376.6 388.8 Texas ......................... 21,781 22,563 267 271 5,820.3 6,108.5 Utah ........................... 5,153 4,793 294 293 1,512.9 1,403.4 Vermont ..................... 158 201 292 307 46.1 61.7 Virginia ....................... 2,698 2,676 265 268 716.0 716.7 Washington ................ 6,994 6,959 301 302 2,103.7 2,102.1 West Virginia ............. 1,244 1,284 221 230 274.7 295.9 Wisconsin .................. 6,428 7,271 289 286 1,860.1 2,077.8 Other States 3 ........... 17,506 18,894 284 289 4,967.5 5,455.9
United States ............. 381,175 391,311 281 279 107,241.6 109,192.1
1 Annual estimates cover the period December 1 previous year through November 30. Totals may not add due to round-ing. 2 Total egg production divided by average number of layers on hand. 3 Alaska, Arizona, Connecticut, Delaware, Ha-waii, Idaho, Kansas, Maine, New Hampshire, New Jersey, New Mexico, Nevada, North Dakota, Rhode Island, and Wyoming combined to avoid disclosing data for individual operations.
NASS, Livestock Branch, (202) 720–3570.
Table 8-49.—Eggs: Broken under Federal inspection, United States, 2017–2018
Item Quantity
2017 2018
1,000 dozen 1,000 dozen
Shell eggs broken .............................................................. 2,307,023 2,399,762
1,000 pounds 1,000 pounds Edible product from shell eggs broken
Whole .......................................................................... 1,837,087 1,911,501 White ........................................................................... 771,207 788,037 Yolk ............................................................................. 383,655 390,716
Total ............................................................................ 2,991,949 3,090,254
Inedible product from shell eggs broken 239,584 260,875
NASS, Livestock Branch, (202) 720–3570.

VIII–34 DAIRY AND POULTRY STATISTICS
Table 8-50.—Eggs: Number, rate of lay, production, and value, United States, 2009–2018 1
Year Layers average number Eggs per layer 2 Total egg
production Value of
production
Thousands Number Millions 1,000 dollars
2009 ............ 338,846 268 90,737 6,191,040 2010 ............ 341,505 269 91,811 6,553,087 2011 ............ 340,598 271 92,450 7,355,873 2012 ............ 394,844 274 94,364 7,929,104 2013 ............ 358,313 275 98,481 8,745,404 2014 ............ 368,193 277 101,816 10,342,687 2015 ............ 356,370 276 98,291 13,762,519 2016 ............ 369,949 279 103,202 6,591,359 2017 ............ 381,175 281 107,242 7,635,001 2018 ............ 391,311 279 109,192 10,586,262
1 Annual estimates cover the period December 1 previous year through November 30. 2 Total egg production divided by average number of layers on hand.
NASS, Livestock Branch, (202) 720–3570.
Table 8-51.—Total Eggs: Production and value by State and United States, 2017–2018 1
State Eggs produced Value of production
2017 2018 2017 2018
Millions Millions 1,000 dollars 1,000 dollars Alabama ............... 2,072.3 2,133.3 349,437 382,196 Arkansas .............. 3,431.0 3,534.7 482,651 527,651 California .............. 3,759.6 4,294.6 267,690 503,663 Colorado .............. 1,414.5 1,482.9 77,227 113,657 Florida .................. 2,095.7 2,005.4 112,225 154,784 Georgia ................ 5,010.6 4,871.1 587,500 656,656 Illinois ................... 1,500.4 1,764.1 87,784 147,870 Indiana ................. 9,869.7 9,658.6 543,793 796,467 Iowa ..................... 16,155.2 16,273.8 868,838 1,327,106 Kentucky .............. 1,360.5 1,434.4 122,051 158,458 Louisiana ............. 480.8 517.5 53,102 63,196 Maryland .............. 840.1 780.6 45,389 60,686 Massachusetts ..... 40.2 43.1 2,023 3,194 Michigan .............. 4,225.5 4,548.1 220,431 364,078 Minnesota ............ 3,070.7 3,131.8 171,173 262,646 Mississippi ........... 1,392.8 1,418.6 211,051 230,685 Missouri ............... 3,146.3 3,473.9 207,485 297,684 Montana ............... 153.8 292.5 11,192 33,674 Nebraska ............. 2,489.1 2,388.8 130,912 198,202 New York ............. 1,717.8 1,656.5 90,433 127,359 North Carolina ..... 3,956.2 3,705.4 461,195 509,017 Ohio ..................... 9,754.6 9,364.9 524,196 762,538 Oklahoma ............ 691.8 697.1 80,090 92,177 Oregon ................. 744.6 732.4 50,436 85,136 Pennsylvania ....... 8,337.3 8,423.1 482,082 673,940 South Carolina ..... 1,068.3 1,156.2 92,746 118,383 South Dakota ....... 784.3 797.9 40,556 63,795 Tennessee ........... 376.6 388.8 68,552 70,558 Texas ................... 5,820.3 6,108.5 395,521 546,249 Utah ..................... 1,512.9 1,403.4 102,395 163,332 Vermont ............... 46.1 61.7 2,787 5,218 Virginia ................. 716.0 716.7 91,300 100,668 Washington .......... 2,103.7 2,102.1 141,321 240,515 West Virginia ....... 274.7 295.9 50,249 54,681 Wisconsin ............ 1,860.1 2,077.8 108,619 176,103 Other States 2 ...... 4,967.5 5,455.9 300,569 514,040
United States ....... 107,241.6 109,192.1 7,635,001 10,586,262
Totals may not add due to rounding. 1 Annual estimates cover the period December 1 previous year through November 30. Includes hatching and market (table) eggs. 2 Alaska, Arizona, Connecticut, Delaware, Hawaii, Idaho, Kansas, Maine, Nevada, New Hampshire, New Jersey, New Mexico, North Dakota, Rhode Island, and Wyoming combined to avoid dis-closing individual operations.
NASS, Livestock Branch, (202) 720–3570.

VIII–35 AGRICULTURAL STATISTICS 2020
Table 8-52.—Poultry and poultry products: Cold storage holdings, end of month, United States, 2017– 2018
Month
Frozen eggs
Whites Yolks Whole & mixed Unclassified
2017 2018 2017 2018 2017 2018 2017 2018
1,000 pounds
January ....... 4,364 4,028 1,025 689 13,170 13,136 18,354 13,188 February ...... 5,200 4,917 1,039 677 13,177 12,782 21,655 13,932 March .......... 5,707 3,155 828 629 13,416 11,341 21,960 13,050 April ............. 4,628 2,479 920 715 12,296 12,596 23,332 11,973 May ............. 3,530 3,296 914 688 13,109 13,000 21,480 13,252 June ............ 4,773 3,207 1,340 1,031 14,034 12,837 21,565 13,630 July .............. 5,244 3,220 1,228 1,095 14,592 13,169 19,129 12,307 August ......... 4,651 2,734 675 799 13,290 14,498 16,550 13,959 September ... 4,685 2,521 1,200 1,157 13,174 11,231 14,875 14,026 October ....... 4,138 2,308 672 704 12,884 13,721 15,234 13,534 November .... 4,597 2,503 733 485 11,217 13,974 11,364 12,641 December .... 4,760 2,688 642 814 11,734 13,869 13,026 12,005
Month
Frozen eggs, total Frozen chicken
2017 2018 Broilers (Whole) Hens Breast and breast meat
2017 2018 2017 2018 2017 2018
1,000 pounds
January ....... 36,913 31,041 17,357 12,841 7,918 4,735 191,811 200,238 February ...... 41,071 32,308 16,274 14,010 6,490 4,305 191,083 201,580 March .......... 41,911 28,175 16,783 15,641 4,926 3,869 178,702 184,218 April ............. 41,176 27,763 21,761 14,436 4,629 3,923 186,900 182,862 May ............. 39,033 30,236 20,662 14,402 6,090 3,808 184,393 186,418 June ............ 41,712 30,705 22,744 15,370 7,846 3,907 182,935 181,547 July .............. 40,193 29,791 22,807 16,379 8,799 6,310 172,907 170,472 August ......... 35,166 31,990 22,154 20,407 8,538 5,270 169,854 173,958 September ... 33,934 28,935 22,269 21,073 6,567 6,150 170,582 177,388 October ....... 32,928 30,267 20,281 17,073 6,065 4,545 175,209 184,127 November .... 27,911 29,603 16,350 17,119 4,562 4,223 184,012 186,937 December .... 30,162 29,376 11,990 17,712 4,613 5,615 188,070 188,311
Month
Frozen chicken
Drumsticks Leg quarters Legs Thigh and thigh quarters
2017 2018 2017 2018 2017 2018 2017 2018
1,000 pounds
January ....... 16,621 25,873 109,647 88,635 12,620 15,918 8,473 7,030 February ...... 18,146 26,997 112,677 81,742 17,379 15,490 12,162 8,492 March .......... 16,672 27,613 113,069 86,768 21,830 14,423 9,916 8,853 April ............. 19,942 29,793 116,017 89,943 24,220 13,176 8,502 8,575 May ............. 21,240 31,983 119,333 87,863 23,665 15,390 8,106 9,627 June ............ 20,500 36,304 131,323 85,540 21,861 17,291 8,362 10,214 July .............. 25,124 36,503 125,073 81,554 18,937 15,527 7,186 9,182 August ......... 24,359 37,194 114,455 97,914 17,842 19,163 9,177 12,812 September ... 22,835 40,085 128,744 104,410 18,386 18,012 9,101 11,892 October ....... 21,869 38,655 120,762 90,698 20,317 16,693 8,225 11,576 November .... 24,930 38,884 113,777 70,030 18,843 17,217 9,046 13,449 December .... 31,185 37,552 104,563 61,435 13,220 11,749 10,274 12,572
Month
Frozen chicken
Thigh meat Wings Paws and feet Other
2017 2018 2017 2018 2017 2018 2017 2018
1,000 pounds
January ........ 26,635 26,054 71,783 64,627 18,650 28,853 293,562 402,530 February ...... 24,497 26,396 71,523 70,655 15,328 32,100 300,314 418,109 March .......... 21,697 24,368 64,942 68,347 17,795 26,899 298,341 410,474 April ............. 18,937 24,544 61,818 71,639 22,781 25,402 310,387 403,241 May .............. 15,936 23,611 56,609 79,955 21,337 30,233 307,465 391,898 June ............. 15,170 21,872 60,502 81,488 19,136 36,553 315,086 397,898 July .............. 16,597 23,595 60,238 88,979 21,353 33,573 319,099 395,575 August ......... 15,861 21,861 63,417 97,436 20,841 33,837 315,555 406,395 September ... 17,285 22,721 66,850 104,951 22,784 28,189 332,687 423,132 October ........ 21,082 22,435 70,364 97,318 24,602 27,422 385,432 429,754 November .... 23,241 25,906 76,187 98,708 26,569 26,216 399,085 430,447 December .... 26,122 24,145 74,113 86,813 26,665 31,460 396,407 404,262
See end of table.

VIII–36 DAIRY AND POULTRY STATISTICS
Table 8-52.—Poultry and poultry products: Cold storage holdings, end of month, United States, 2017–2018—Continued
Month
Total chicken Frozen turkey
2017 2018 Toms Hens Total whole
2017 2018 2017 2018 2017 2018
1,000 pounds
January ....... 775,077 877,334 57,392 84,346 67,075 74,187 124,467 158,533 February ...... 785,873 899,876 71,510 97,875 83,670 90,466 155,180 188,341 March .......... 764,673 871,473 79,721 106,625 101,494 112,223 181,215 218,848 April ............. 795,894 867,534 101,509 125,408 115,587 123,467 217,096 248,875 May ............. 784,836 875,188 130,431 149,736 141,572 134,593 272,003 284,329 June ............ 805,465 887,984 146,273 160,846 161,610 145,418 307,883 306,264 July .............. 798,120 877,649 171,608 181,480 174,669 147,906 346,277 329,386 August ......... 782,053 926,247 175,578 192,601 173,123 155,216 348,701 347,817 September ... 818,090 958,003 181,048 192,267 151,266 138,460 332,314 330,727 October ....... 874,208 940,296 154,342 150,034 103,223 101,861 257,565 251,895 November .... 896,602 929,136 61,513 51,307 47,543 41,267 109,056 92,574 December .... 887,222 881,626 61,288 49,213 48,356 53,181 109,644 102,394
Month
Frozen turkey
Breasts Legs Mechanically deboned meat Other
2017 2018 2017 2018 2017 2018 2017 2018
1,000 pounds
January ........ 73,909 85,313 17,522 11,588 6,252 6,546 32,038 31,208 February ...... 87,836 101,384 16,497 11,069 5,825 6,607 30,166 31,787 March .......... 97,176 100,335 15,289 11,744 6,479 5,983 33,736 32,596 April ............. 105,780 102,215 12,257 11,231 7,290 7,497 32,206 29,018 May .............. 106,663 104,830 12,492 12,325 8,512 7,831 29,679 30,241 June ............. 105,260 99,023 10,463 14,972 8,438 9,466 29,246 33,116 July .............. 103,097 99,010 10,518 14,039 6,428 10,182 27,784 34,366 August ......... 101,706 90,558 10,393 14,710 6,559 9,155 31,039 30,738 September ... 92,471 79,241 7,311 13,077 6,501 7,857 32,976 29,151 October ........ 71,492 66,522 9,344 11,641 6,189 8,003 33,077 24,755 November .... 64,000 72,068 11,958 12,465 5,943 7,673 28,675 25,294 December .... 73,195 77,143 13,076 14,117 6,302 8,118 31,140 30,586
Month
Frozen turkey Ducks Total frozen poultry
Unclassified Total turkey 2017 2018 2017 2018
2017 2018 2017 2018
1,000 pounds
January ........ 85,305 82,000 339,493 375,188 4,492 2,802 1,119,062 1,255,324 February ...... 82,866 88,430 378,370 427,618 5,329 2,697 1,169,572 1,330,191 March .......... 94,857 93,479 428,752 462,985 5,325 3,623 1,198,750 1,338,081 April ............. 96,855 95,008 471,484 493,844 3,872 3,645 1,271,250 1,365,023 May .............. 100,555 96,470 529,904 536,026 3,365 3,850 1,318,105 1,415,064 June ............. 103,833 99,017 565,123 561,858 3,307 3,625 1,373,895 1,453,467 July .............. 101,519 107,944 595,623 594,927 3,903 4,285 1.397,646 1,476,861 August ......... 101,615 113,381 600,013 606,359 3,868 3,974 1,385,934 1,536,580 September ... 98,390 104,693 569,963 564,746 3,682 3,563 1,391,735 1,526,312 October ........ 83,189 82,243 460,856 445,059 3,651 3,402 1,338,715 1,388,757 November .... 68,904 64,092 288,536 274,166 2,877 2,949 1,188,015 1,206,251 December .... 76,268 70,405 309,625 302,763 2,373 2,942 1,199,220 1,187,331
NASS, Livestock Branch, (202) 720–3570.

VIII–37 AGRICULTURAL STATISTICS 2020
Table 8-53.—Dairy products: Cold storage holdings, end of month, United States, 2017–2018
Month Butter American cheese
2017 2018 2017 2018
1,000 pounds
January ...................... 221,556 226,694 722,449 741,772 February .................... 269,857 265,756 744,640 762,770 March ......................... 272,500 273,955 772,702 766,628 April ........................... 292,284 307,325 804,645 780,256 May ............................ 313,593 338,492 816,266 804,075 June ........................... 310,158 336,625 810,234 800,379 July ............................ 307,359 318,325 831,538 823,342 August ....................... 280,194 290,851 800,994 787,435 September ................. 255,839 282,379 780,466 803,750 October ...................... 217,918 231,223 740,404 811,593 November .................. 159,258 154,366 733,378 798,970 December .................. 168,787 179,333 746,846 800,336
Month Swiss cheese Other
2017 2018 2017 2018
1,000 pounds
January ...................... 23,930 28,733 445,787 508,132 February .................... 26,999 27,884 454,818 527,077 March ......................... 26,053 29,080 463,489 529,020 April ........................... 26,962 29,193 471,721 535,831 May ............................ 26,242 31,424 466,421 549,441 June ........................... 25,495 31,312 480,969 556,947 July ............................ 27,009 32,189 510,959 557,449 August ....................... 26,831 31,211 505,726 541,843 September ................. 25,408 30,848 502,198 545,105 October ...................... 24,277 30,775 503,269 532,781 November .................. 24,933 29,866 500,319 523,903 December .................. 26,367 29,775 507,271 514,683
Month Total natural cheese
2017 2018
1,000 pounds
January ...................... 1,192,166 1,278,637 February .................... 1,226,457 1,317,731 March ......................... 1,262,244 1,324,728 April ........................... 1,303,328 1,345,280 May ............................ 1,308,929 1,384,940 June ........................... 1,316,698 1,388,638 July ............................ 1,369,506 1,412,980 August ....................... 1,333,551 1,360,489 September ................. 1,308,072 1,379,703 October ...................... 1,267,950 1,375,149 November .................. 1,258,630 1,352,739 December .................. 1,280,484 1,344,794
NASS, Livestock Branch, (202) 720–3570.

IX–1
CHAPTER IX
FARM RESOURCES, INCOME, AND EXPENSES
The statistics in this chapter deal with farms, farm resources, farm income, and expenses. Many of the series are estimates developed in connection with economic research activities of the Depart-ment.
Table 9-1.—Economic trends: Data relating to agriculture, United States, 2009–2018
Year
Prices paid by farmers 1
Prices received by
farmers 1
Farm income 2
Total including
interest, taxes, and wage rates
(PPITW)
Production items
Gross farm income 3
Production expenses
Net farm income
Index numbers Index numbers Index numbers Billion Billion Billion 2011=100 2011=100 2011=100 dollars dollars dollars
2009 ............... 86.4 84.8 80.6 336.6 274.4 62.2 2010 ............... 89.0 87.7 86.8 356.5 279.4 77.1 2011 ............... 100.0 100.0 100.0 420.4 306.9 113.6 2012 ............... 104.8 105.4 105.0 449.8 353.4 96.4 2013 ............... 106.7 107.4 107.0 484.1 360.4 123.7 2014 ............... 113.1 114.1 107.9 483.3 391.0 92.2 2015 ............... 111.6 112.0 99.2 440.8 359.2 81.6 2016 ............... 105.7 104.7 90.6 412.3 350.0 62.3 2017 ............... 106.3 104.5 93.3 425.4 350.4 75.1 2018 ............... 108.7 106.4 90.9 427.6 343.8 83.8
Year National income 4
Personal income 4
Industrial production 5
Consumer prices all items 6
Producer prices consumer foods 6
Index numbers Index numbers Index numbers Billion dollars Billion dollars 2012=100 1982–84=100 1982=100
2009 ............... 12,027.2 12,059.1 89.2 214.6 175.5 2010 ............... 12,735.8 12,551.6 94.1 218.1 182.4 2011 ............... 13,357.7 13,326.8 97.1 224.9 193.9 2012 ............... 14,094.7 14,010.1 100.0 229.6 199.1 2013 ............... 14,494.7 14,181.1 102.0 233.0 203.5 2014 ............... 15,245.5 14,991.8 105.2 236.7 212.5 2015 ............... 15,783.0 15,719.5 104.1 237.0 209.7 2016 ............... 16,058.9 16,125.1 102.1 240.0 204.6 2017 ............... 16,756.1 16,830.9 104.4 245.1 207.2 2018 ............... 17,529.4 17,569.5 108.6 251.1 207.4
1 U.S. Department of Agriculture - NASS. 2 U.S. Department of Agriculture - ERS. 3 Includes cash receipts from farm marketings, government payments, nonmoney income (gross rental value of dwelling and value of home consumption), other income (machine hire custom work and recreational income), and value of change in farm inventories. 4Department of Commerce, Bureau of Economic Analysis. 5 Major Industry groups Federal Reserve Board. 6 U.S. Department of Labor, Bureau of Labor Statistics retrieved from FRED, Federal Reserve Bank of St. Louis.
ERS, Farm Economy Branch, (202) 694–5476. E-mail contact is Dipak Subedi at [email protected].
Table 9-2.—Farms: Number, land in farms, and average size of farm, United States, 2010–2019
Year Farms 1 Land in farms Average size farm
Number 1,000 acres Acres
2010 ........................................................... 2,149,520 915,660 426 2011 ........................................................... 2,131,240 914,420 429 2012 ........................................................... 2,109,810 914,600 433 2013 ........................................................... 2,100,350 911,720 434 2014 ........................................................... 2,082,440 908,920 436 2015 ........................................................... 2,063,890 905,790 439 2016 ........................................................... 2,055,340 902,680 439 2017 ........................................................... 2,042,000 900,370 441 2018 ........................................................... 2,029,200 899,500 443 2019 ........................................................... 2,023,400 897,400 444
1 A farm is any establishment from which $1,000 or more of agricultural products were produced and sold or normally would have been sold during the year.
NASS, Environmental, Economics, and Demographics Branch, (202) 720–6146.

IX–2 FARM RESOURCES, INCOME, AND EXPENSES
Table 9-3.—Farms: Percent of farms and land in farms, and average size, by economic sales class, United States, 2018–2019
Economic sales class
Percent of total Average size farm
Farms Land in farms 2018 2019
2018 2019 2018 2019
Percent Percent Percent Percent Acres Acres
$ 1,000 - $ 9,999 ................ 51.0 51.1 9.4 9.4 81 81 $ 10,000 - $ 99,999 ............ 30.5 30.4 20.8 20.8 302 304 $100,000 - $249,999 .......... 6.7 6.7 14.8 14.7 987 976 $250,000 - $499,999 .......... 4.4 4.4 14.3 14.3 1,450 1,448 $500,000 - $999,999 .......... 3.6 3.5 15.4 15.4 1,925 1,940 $1,000,000 or more ............ 3.9 3.9 25.3 25.4 2,897 2,910
Total 1 .................................. 100.0 100.0 100.0 100.0 443 444
1 May not add due to rounding. NASS, Environmental, Economics, and Demographics Branch, (202) 720–6146.
Table 9-4.—Land in farms: Classification by tenure of operator, United States, 1935–2012
Year Land in farms Tenure of operator
Full owners Part owners Managers All tenants
Acres Percent Percent Percent Percent
1935 1 ................................................ 1,054,515,111 37.1 25.2 5.8 31.9 1940 ................................................... 1,065,113,774 35.9 28.2 6.5 29.4 1945 1 ................................................ 1,141,615,364 36.1 32.5 9.3 22.0 1950 ................................................... 1,161,419,720 36.1 36.4 9.2 18.3 1954 1 ................................................ 1,158,191,511 34.2 40.7 8.6 16.5 1959 ................................................... 1,123,507,574 31.0 44.0 9.8 14.8 1964 ................................................... 1,110,187,000 28.7 48.0 10.2 13.1 1969 ................................................... 1,062,892,501 35.3 51.8 ...................... 13.0 1974 ................................................... 1,017,030,357 35.3 52.6 ...................... 12.0 1978 ................................................... 1,014,777,234 32.7 55.3 ...................... 12.0 1982 ................................................... 986,796,579 34.7 53.8 ...................... 11.5 1987 ................................................... 964,470,625 32.9 53.9 ...................... 13.2 1992 ................................................... 945,531,506 31.3 55.7 ...................... 13.0 1997 ................................................... 931,795,255 33.9 54.5 ...................... 11.6 2002 2 ................................................ 938,279,056 38.0 52.8 ...................... 9.2 2007 2 ................................................ 922,095,843 37.3 53.8 ...................... 8.9 2012 2 ................................................ 914,527,657 36.8 53.7 ...................... 9.5
1 Excludes Alaska and Hawaii. 2 The 2002 Census of Agriculture introduced new methodology to account for all farms in the United States. All 2002 published census items were reweighted for undercoverage. Strictly speaking, data for 2002 and subsequent years are not fully comparable with data from earlier years.
ERS, Resource and Rural Economics Division, (202) 694–5572. Data from the Census of Agriculture, National Agricul-tural Statistics Service.

IX–3 AGRICULTURAL STATISTICS 2019
Table 9-5.—Number of farms and land in farms by economic sales class by State and United States, 2018–2019
State
Economic Sales Class: $1,000-$9,999
Number of Farms Land in Farms
2018 2019 2018 2019
Number Number 1,000 Acres 1,000 Acres
Alabama .................................. 22,600 21,800 2,100 1,900 Alaska ..................................... 540 590 80 80 Arizona .................................... 14,300 14,200 4,800 4,800 Arkansas ................................. 20,700 20,500 1,800 1,750 California ................................. 26,400 27,200 1,400 1,300 Colorado .................................. 21,900 22,000 2,100 2,200 Connecticut ............................. 3,650 3,650 130 130 Delaware ................................. 820 820 20 20 Florida ..................................... 29,000 28,900 1,300 1,300 Georgia ................................... 23,300 23,200 2,300 2,300 Hawaii ..................................... 4,250 4,250 70 70 Idaho ....................................... 13,500 13,300 700 650 Illinois ...................................... 27,900 27,700 1,200 1,200 Indiana .................................... 25,800 26,100 900 1,000 Iowa ......................................... 25,400 25,000 900 900 Kansas .................................... 21,800 21,300 2,000 1,900 Kentucky ................................. 44,300 44,000 3,100 3,000 Louisiana ................................. 15,300 15,400 1,100 1,100 Maine ...................................... 4,800 4,800 390 390 Maryland ................................. 6,700 6,700 260 260 Massachusetts ........................ 4,500 4,500 190 190 Michigan .................................. 24,000 24,500 1,200 1,250 Minnesota ................................ 25,400 24,900 1,600 1,600 Mississippi ............................... 19,700 19,600 2,300 2,200 Missouri ................................... 44,400 44,500 3,300 3,200 Montana .................................. 11,600 11,400 1,900 2,000 Nebraska ................................. 11,500 11,300 800 800 Nevada .................................... 1,700 1,700 500 520 New Hampshire ...................... 2,750 2,750 170 170 New Jersey ............................. 6,400 6,400 160 160 New Mexico ............................ 16,800 17,000 5,100 5,000 New York ................................ 15,400 15,500 1,100 1,100 North Carolina ......................... 26,100 25,900 1,500 1,400 North Dakota ........................... 7,200 7,400 1,100 1,200 Ohio ......................................... 40,400 41,400 1,600 1,900 Oklahoma ................................ 39,800 40,300 4,100 4,200 Oregon .................................... 23,400 23,500 1,000 1,100 Pennsylvania ........................... 25,000 24,900 1,300 1,300 Rhode Island ........................... 630 630 20 20 South Carolina ........................ 16,500 16,400 1,600 1,500 South Dakota .......................... 7,200 7,000 900 1,000 Tennessee .............................. 43,800 43,600 2,700 2,700 Texas ...................................... 156,500 156,500 15,600 15,200 Utah ......................................... 11,000 10,800 600 600 Vermont ................................... 3,750 3,750 280 280 Virginia .................................... 24,100 24,100 1,700 1,700 Washington ............................. 21,800 21,700 800 800 West Virginia ........................... 17,000 16,600 1,600 1,500 Wisconsin ................................ 28,800 29,000 1,800 1,900 Wyoming ................................. 5,600 5,600 1,200 1,200
United States .......................... 1,035,690 1,034,540 84,370 83,940
See footnote(s) at end of table.

IX–4 FARM RESOURCES, INCOME, AND EXPENSES
Table 9-5.—Number of farms and land in farms by economic sales class by State and United States, 2018–2019—Continued
State
Economic Sales Class: $10,000-$99,999
Number of Farms Land in Farms
2018 2019 2018 2019
Number Number 1,000 Acres 1,000 Acres
Alabama .................................. 12,500 12,500 3,200 3,200 Alaska ..................................... 360 360 450 450 Arizona .................................... 3,550 3,450 5,300 5,200 Arkansas ................................. 14,700 14,500 3,700 3,700 California ................................. 22,500 22,600 4,000 4,300 Colorado .................................. 11,200 10,800 7,100 7,000 Connecticut ............................. 1,400 1,400 100 100 Delaware ................................. 510 510 50 50 Florida ..................................... 13,500 13,500 2,100 2,100 Georgia ................................... 11,500 11,500 2,700 2,700 Hawaii ..................................... 2,500 2,500 200 200 Idaho ....................................... 6,500 6,500 1,800 1,800 Illinois ...................................... 20,200 20,000 2,600 2,500 Indiana .................................... 16,600 16,100 1,800 1,700 Iowa ......................................... 26,200 25,800 3,700 3,600 Kansas .................................... 21,300 21,500 7,100 7,200 Kentucky ................................. 24,200 24,200 4,400 4,500 Louisiana ................................. 8,800 8,700 1,900 1,900 Maine ...................................... 2,050 2,050 350 350 Maryland ................................. 3,300 3,300 390 390 Massachusetts ........................ 1,950 1,950 160 160 Michigan .................................. 14,400 14,000 1,700 1,600 Minnesota ................................ 20,400 20,500 3,600 3,600 Mississippi ............................... 10,700 10,600 3,000 3,000 Missouri ................................... 37,200 37,300 8,600 8,600 Montana .................................. 8,000 8,100 10,400 10,300 Nebraska ................................. 14,500 14,300 5,000 4,900 Nevada .................................... 970 980 500 530 New Hampshire ...................... 1,100 1,100 170 170 New Jersey ............................. 2,350 2,350 170 170 New Mexico ............................ 6,100 6,000 10,400 10,200 New York ................................ 11,400 11,500 1,800 1,800 North Carolina ......................... 12,700 12,700 1,800 1,800 North Dakota ........................... 7,400 7,300 4,000 4,100 Ohio ......................................... 23,000 22,000 2,700 2,900 Oklahoma ................................ 29,000 28,500 11,400 11,400 Oregon .................................... 9,000 8,900 3,000 2,900 Pennsylvania ........................... 16,700 16,700 2,200 2,200 Rhode Island ........................... 340 340 20 20 South Carolina ........................ 5,900 6,000 1,300 1,400 South Dakota .......................... 9,300 9,400 4,600 4,500 Tennessee .............................. 21,700 21,600 3,900 3,800 Texas ...................................... 72,800 72,800 38,300 39,000 Utah ......................................... 5,100 5,000 1,900 1,900 Vermont ................................... 1,950 1,950 310 310 Virginia .................................... 14,000 13,900 2,800 2,800 Washington ............................. 8,300 8,300 1,800 1,700 West Virginia ........................... 5,600 5,500 1,400 1,400 Wisconsin ................................ 20,100 20,200 2,900 2,900 Wyoming ................................. 3,700 3,800 4,000 4,100
United States .......................... 619,030 615,340 186,770 187,100
See footnote(s) at end of table.
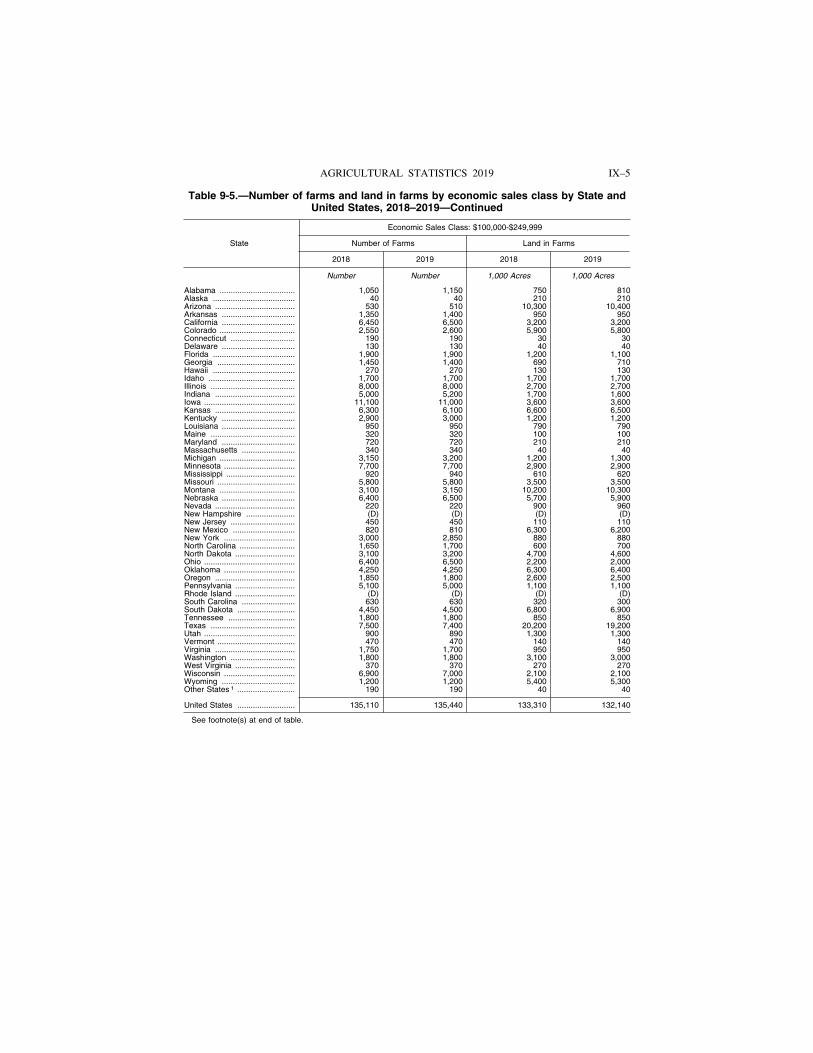
IX–5 AGRICULTURAL STATISTICS 2019
Table 9-5.—Number of farms and land in farms by economic sales class by State and United States, 2018–2019—Continued
State
Economic Sales Class: $100,000-$249,999
Number of Farms Land in Farms
2018 2019 2018 2019
Number Number 1,000 Acres 1,000 Acres
Alabama .................................. 1,050 1,150 750 810 Alaska ..................................... 40 40 210 210 Arizona .................................... 530 510 10,300 10,400 Arkansas ................................. 1,350 1,400 950 950 California ................................. 6,450 6,500 3,200 3,200 Colorado .................................. 2,550 2,600 5,900 5,800 Connecticut ............................. 190 190 30 30 Delaware ................................. 130 130 40 40 Florida ..................................... 1,900 1,900 1,200 1,100 Georgia ................................... 1,450 1,400 690 710 Hawaii ..................................... 270 270 130 130 Idaho ....................................... 1,700 1,700 1,700 1,700 Illinois ...................................... 8,000 8,000 2,700 2,700 Indiana .................................... 5,000 5,200 1,700 1,600 Iowa ......................................... 11,100 11,000 3,600 3,600 Kansas .................................... 6,300 6,100 6,600 6,500 Kentucky ................................. 2,900 3,000 1,200 1,200 Louisiana ................................. 950 950 790 790 Maine ...................................... 320 320 100 100 Maryland ................................. 720 720 210 210 Massachusetts ........................ 340 340 40 40 Michigan .................................. 3,150 3,200 1,200 1,300 Minnesota ................................ 7,700 7,700 2,900 2,900 Mississippi ............................... 920 940 610 620 Missouri ................................... 5,800 5,800 3,500 3,500 Montana .................................. 3,100 3,150 10,200 10,300 Nebraska ................................. 6,400 6,500 5,700 5,900 Nevada .................................... 220 220 900 960 New Hampshire ...................... (D) (D) (D) (D) New Jersey ............................. 450 450 110 110 New Mexico ............................ 820 810 6,300 6,200 New York ................................ 3,000 2,850 880 880 North Carolina ......................... 1,650 1,700 600 700 North Dakota ........................... 3,100 3,200 4,700 4,600 Ohio ......................................... 6,400 6,500 2,200 2,000 Oklahoma ................................ 4,250 4,250 6,300 6,400 Oregon .................................... 1,850 1,800 2,600 2,500 Pennsylvania ........................... 5,100 5,000 1,100 1,100 Rhode Island ........................... (D) (D) (D) (D) South Carolina ........................ 630 630 320 300 South Dakota .......................... 4,450 4,500 6,800 6,900 Tennessee .............................. 1,800 1,800 850 850 Texas ...................................... 7,500 7,400 20,200 19,200 Utah ......................................... 900 890 1,300 1,300 Vermont ................................... 470 470 140 140 Virginia .................................... 1,750 1,700 950 950 Washington ............................. 1,800 1,800 3,100 3,000 West Virginia ........................... 370 370 270 270 Wisconsin ................................ 6,900 7,000 2,100 2,100 Wyoming ................................. 1,200 1,200 5,400 5,300 Other States 1 .......................... 190 190 40 40
United States .......................... 135,110 135,440 133,310 132,140
See footnote(s) at end of table.
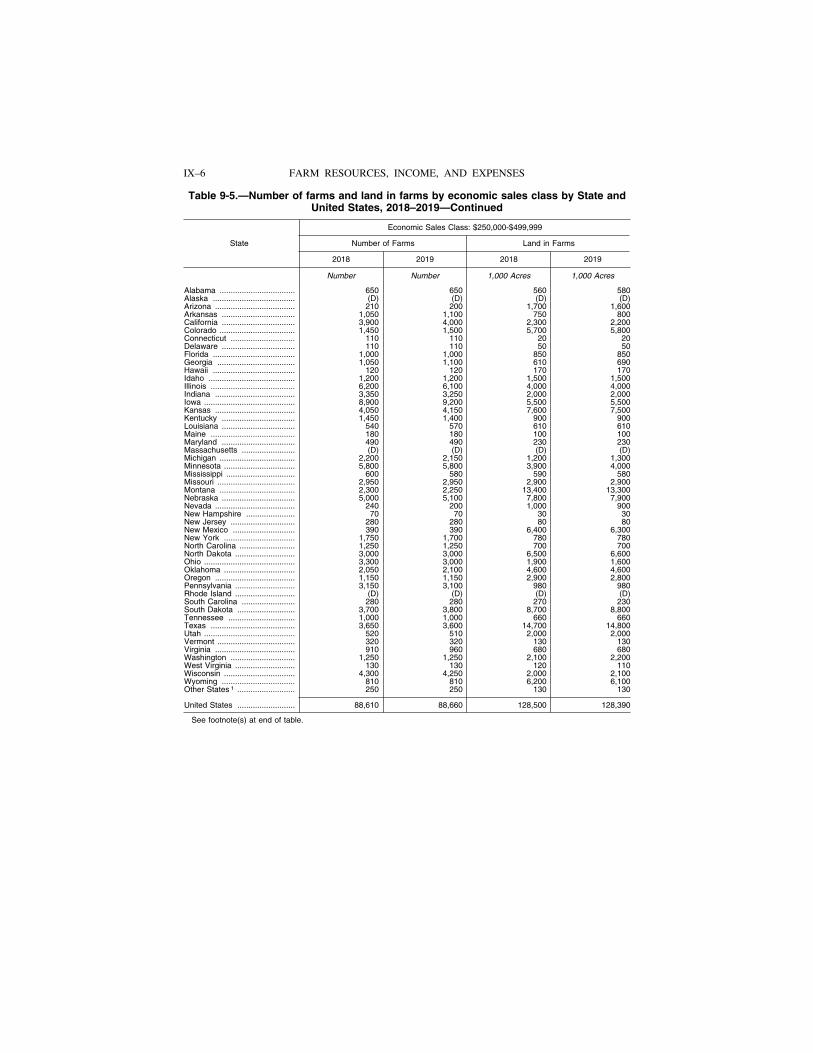
IX–6 FARM RESOURCES, INCOME, AND EXPENSES
Table 9-5.—Number of farms and land in farms by economic sales class by State and United States, 2018–2019—Continued
State
Economic Sales Class: $250,000-$499,999
Number of Farms Land in Farms
2018 2019 2018 2019
Number Number 1,000 Acres 1,000 Acres
Alabama .................................. 650 650 560 580 Alaska ..................................... (D) (D) (D) (D) Arizona .................................... 210 200 1,700 1,600 Arkansas ................................. 1,050 1,100 750 800 California ................................. 3,900 4,000 2,300 2,200 Colorado .................................. 1,450 1,500 5,700 5,800 Connecticut ............................. 110 110 20 20 Delaware ................................. 110 110 50 50 Florida ..................................... 1,000 1,000 850 850 Georgia ................................... 1,050 1,100 610 690 Hawaii ..................................... 120 120 170 170 Idaho ....................................... 1,200 1,200 1,500 1,500 Illinois ...................................... 6,200 6,100 4,000 4,000 Indiana .................................... 3,350 3,250 2,000 2,000 Iowa ......................................... 8,900 9,200 5,500 5,500 Kansas .................................... 4,050 4,150 7,600 7,500 Kentucky ................................. 1,450 1,400 900 900 Louisiana ................................. 540 570 610 610 Maine ...................................... 180 180 100 100 Maryland ................................. 490 490 230 230 Massachusetts ........................ (D) (D) (D) (D) Michigan .................................. 2,200 2,150 1,200 1,300 Minnesota ................................ 5,800 5,800 3,900 4,000 Mississippi ............................... 600 580 590 580 Missouri ................................... 2,950 2,950 2,900 2,900 Montana .................................. 2,300 2,250 13,400 13,300 Nebraska ................................. 5,000 5,100 7,800 7,900 Nevada .................................... 240 200 1,000 900 New Hampshire ...................... 70 70 30 30 New Jersey ............................. 280 280 80 80 New Mexico ............................ 390 390 6,400 6,300 New York ................................ 1,750 1,700 780 780 North Carolina ......................... 1,250 1,250 700 700 North Dakota ........................... 3,000 3,000 6,500 6,600 Ohio ......................................... 3,300 3,000 1,900 1,600 Oklahoma ................................ 2,050 2,100 4,600 4,600 Oregon .................................... 1,150 1,150 2,900 2,800 Pennsylvania ........................... 3,150 3,100 980 980 Rhode Island ........................... (D) (D) (D) (D) South Carolina ........................ 280 280 270 230 South Dakota .......................... 3,700 3,800 8,700 8,800 Tennessee .............................. 1,000 1,000 660 660 Texas ...................................... 3,650 3,600 14,700 14,800 Utah ......................................... 520 510 2,000 2,000 Vermont ................................... 320 320 130 130 Virginia .................................... 910 960 680 680 Washington ............................. 1,250 1,250 2,100 2,200 West Virginia ........................... 130 130 120 110 Wisconsin ................................ 4,300 4,250 2,000 2,100 Wyoming ................................. 810 810 6,200 6,100 Other States 1 .......................... 250 250 130 130
United States .......................... 88,610 88,660 128,500 128,390
See footnote(s) at end of table.

IX–7 AGRICULTURAL STATISTICS 2019
Table 9-5.—Number of farms and land in farms by economic sales class by State and United States, 2018–2019—Continued
State
Economic Sales Class: $500,000-$999,999
Number of Farms Land in Farms
2018 2019 2018 2019
Number Number 1,000 Acres 1,000 Acres
Alabama .................................. 1,200 1,100 690 660 Alaska ..................................... 30 30 20 20 Arizona .................................... 200 220 1,000 1,000 Arkansas ................................. 1,350 1,400 1,200 1,200 California ................................. 3,550 3,200 2,200 2,300 Colorado .................................. 900 920 4,500 4,700 Connecticut ............................. 70 70 20 20 Delaware ................................. 260 260 110 110 Florida ..................................... 900 900 650 650 Georgia ................................... 1,800 1,850 1,400 1,400 Hawaii ..................................... 70 70 210 210 Idaho ....................................... 800 800 1,800 1,750 Illinois ...................................... 5,300 5,200 6,100 6,000 Indiana .................................... 2,450 2,500 2,800 2,700 Iowa ......................................... 8,000 7,900 7,800 7,800 Kansas .................................... 3,000 2,900 9,200 9,200 Kentucky ................................. 1,000 1,000 900 900 Louisiana ................................. 710 730 1,050 1,050 Maine ...................................... 110 110 70 70 Maryland ................................. 520 520 330 330 Massachusetts ........................ 140 140 30 30 Michigan .................................. 1,550 1,500 1,500 1,400 Minnesota ................................ 4,800 4,800 5,100 5,100 Mississippi ............................... 880 880 900 900 Missouri ................................... 2,400 2,400 3,700 3,700 Montana .................................. 1,300 1,250 12,200 12,100 Nebraska ................................. 4,400 4,300 9,400 9,200 Nevada .................................... 140 110 700 640 New Hampshire ...................... 30 30 10 10 New Jersey ............................. 200 200 90 90 New Mexico ............................ 260 260 6,300 6,200 New York ................................ 930 930 640 640 North Carolina ......................... 1,450 1,450 900 900 North Dakota ........................... 2,800 2,700 9,100 8,800 Ohio ......................................... 2,550 2,650 2,300 2,200 Oklahoma ................................ 1,150 1,100 3,600 3,600 Oregon .................................... 850 870 2,800 2,800 Pennsylvania ........................... 1,700 1,650 750 750 Rhode Island ........................... 20 20 10 10 South Carolina ........................ 410 380 400 400 South Dakota .......................... 2,700 2,600 8,900 8,800 Tennessee .............................. 830 830 890 890 Texas ...................................... 3,000 3,100 14,500 14,800 Utah ......................................... 310 320 1,000 1,000 Vermont ................................... 140 140 80 80 Virginia .................................... 830 850 670 670 Washington ............................. 1,100 1,100 2,300 2,300 West Virginia ........................... 150 150 100 110 Wisconsin ................................ 2,550 2,400 1,900 1,800 Wyoming ................................. 390 380 6,100 6,100
United States .......................... 72,180 71,170 138,920 138,090
See footnote(s) at end of table.

IX–8 FARM RESOURCES, INCOME, AND EXPENSES
Table 9-5.—Number of farms and land in farms by economic sales class by State and United States, 2018–2019—Continued
State
Economic Sales Class: $1,000,000 or more
Number of Farms Land in Farms
2018 2019 2018 2019
Number Number 1,000 Acres 1,000 Acres
Alabama .................................. 1,700 1,600 1,200 1,150 Alaska ..................................... (D) (D) (D) (D) Arizona .................................... 410 420 3,100 3,200 Arkansas ................................. 3,350 3,400 5,500 5,600 California ................................. 6,600 6,400 11,200 11,000 Colorado .................................. 900 880 6,500 6,300 Connecticut ............................. 80 80 80 80 Delaware ................................. 470 470 260 260 Florida ..................................... 1,200 1,200 3,600 3,700 Georgia ................................... 2,500 2,450 2,400 2,400 Hawaii ..................................... 90 90 320 320 Idaho ....................................... 1,100 1,100 4,100 4,100 Illinois ...................................... 4,400 4,400 10,400 10,600 Indiana .................................... 2,900 2,850 5,800 5,900 Iowa ......................................... 6,400 6,400 9,100 9,200 Kansas .................................... 2,450 2,550 13,300 13,400 Kentucky ................................. 1,250 1,200 2,400 2,400 Louisiana ................................. 1,100 1,050 2,550 2,550 Maine ...................................... 140 140 290 290 Maryland ................................. 670 670 580 580 Massachusetts ........................ (D) (D) (D) (D) Michigan .................................. 1,700 1,650 3,000 2,950 Minnesota ................................ 4,400 4,300 8,400 8,300 Mississippi ............................... 1,900 1,900 3,000 3,100 Missouri ................................... 2,250 2,250 5,700 5,700 Montana .................................. 600 650 9,900 10,000 Nebraska ................................. 4,100 4,200 16,300 16,200 Nevada .................................... 130 140 2,500 2,550 New Hampshire ...................... (D) (D) (D) (D) New Jersey ............................. 220 220 140 140 New Mexico ............................ 330 340 6,000 6,100 New York ................................ 920 920 1,700 1,700 North Carolina ......................... 3,250 3,200 2,900 2,900 North Dakota ........................... 2,600 2,500 13,900 14,000 Ohio ......................................... 2,150 2,250 3,200 3,000 Oklahoma ................................ 1,050 1,050 4,200 4,200 Oregon .................................... 950 980 3,700 3,700 Pennsylvania ........................... 1,350 1,350 970 970 Rhode Island ........................... (D) (D) (D) (D) South Carolina ........................ 880 910 910 970 South Dakota .......................... 2,250 2,300 13,300 13,200 Tennessee .............................. 870 870 1,900 1,900 Texas ...................................... 3,550 3,600 23,700 23,500 Utah ......................................... 270 280 3,900 3,900 Vermont ................................... 170 170 260 260 Virginia .................................... 910 890 1,000 1,000 Washington ............................. 1,450 1,450 4,600 4,600 West Virginia ........................... 150 150 110 110 Wisconsin ................................ 2,150 2,050 3,600 3,500 Wyoming ................................. 200 210 6,100 6,200 Other States 1 .......................... 120 120 60 60
United States .......................... 78,580 78,250 227,630 227,740
(D) Withheld to avoid disclosing data for individual operations. 1 Includes data withheld above. NASS, Environmental, Economics, and Demographics Branch, (202) 720–6146.

IX–9 AGRICULTURAL STATISTICS 2019
Table 9-6.—Number of farms and land in farms by State and United States, 2018–2019
State Number of Farms 1 Land in farms Average farm size
2018 2019 2018 2019 2018 2019
Number Number 1,000 acres 1,000 acres Acres Acres
Alabama ............... 39,700 38,800 8,500 8,300 214 214 Alaska .................. 1,000 1,050 850 850 850 810 Arizona ................ 19,200 19,000 26,200 26,200 1,365 1,379 Arkansas .............. 42,500 42,300 13,900 14,000 327 331 California .............. 69,400 69,900 24,300 24,300 350 348 Colorado .............. 38,900 38,700 31,800 31,800 817 822 Connecticut .......... 5,500 5,500 380 380 69 69 Delaware .............. 2,300 2,300 530 530 230 230 Florida .................. 47,500 47,400 9,700 9,700 204 205 Georgia ................ 41,600 41,500 10,100 10,200 243 246 Hawaii .................. 7,300 7,300 1,100 1,100 151 151 Idaho .................... 24,800 24,600 11,600 11,500 468 467 Illinois ................... 72,000 71,400 27,000 27,000 375 378 Indiana ................. 56,100 56,000 15,000 14,900 267 266 Iowa ..................... 86,000 85,300 30,600 30,600 356 359 Kansas ................. 58,900 58,500 45,800 45,700 778 781 Kentucky .............. 75,100 74,800 12,900 12,900 172 172 Louisiana ............. 27,400 27,400 8,000 8,000 292 292 Maine ................... 7,600 7,600 1,300 1,300 171 171 Maryland .............. 12,400 12,400 2,000 2,000 161 161 Massachusetts ..... 7,200 7,200 500 500 69 69 Michigan .............. 47,000 47,000 9,800 9,800 209 209 Minnesota ............ 68,500 68,000 25,500 25,500 372 375 Mississippi ........... 34,700 34,500 10,400 10,400 300 301 Missouri ............... 95,000 95,200 27,700 27,600 292 290 Montana ............... 26,900 26,800 58,000 58,000 2,156 2,164 Nebraska ............. 45,900 45,700 45,000 44,900 980 982 Nevada ................ 3,400 3,350 6,100 6,100 1,794 1,821 New Hampshire ... 4,100 4,100 430 430 105 105 New Jersey .......... 9,900 9,900 750 750 76 76 New Mexico ......... 24,700 24,800 40,500 40,000 1,640 1,613 New York ............. 33,400 33,400 6,900 6,900 207 207 North Carolina ..... 46,400 46,200 8,400 8,400 181 182 North Dakota ....... 26,100 26,100 39,300 39,300 1,506 1,506 Ohio ..................... 77,800 77,800 13,900 13,600 179 175 Oklahoma ............ 77,300 77,300 34,200 34,400 442 445 Oregon ................. 37,200 37,200 16,000 15,800 430 425 Pennsylvania ....... 53,000 52,700 7,300 7,300 138 139 Rhode Island ....... 1,100 1,100 60 60 55 55 South Carolina ..... 24,600 24,600 4,800 4,800 195 195 South Dakota ....... 29,600 29,600 43,200 43,200 1,459 1,459 Tennessee ........... 70,000 69,700 10,900 10,800 156 155 Texas ................... 247,000 247,000 127,000 126,500 514 512 Utah ..................... 18,100 17,800 10,700 10,700 591 601 Vermont ............... 6,800 6,800 1,200 1,200 176 176 Virginia ................. 42,500 42,400 7,800 7,800 184 184 Washington .......... 35,700 35,600 14,700 14,600 412 410 West Virginia ....... 23,400 22,900 3,600 3,500 154 153 Wisconsin ............ 64,800 64,900 14,300 14,300 221 220 Wyoming .............. 11,900 12,000 29,000 29,000 2,437 2,417
United States ....... 2,029,200 2,023,400 899,500 897,400 443 444
1 A farm is any establishment from which $1,000 or more of agricultural products were produced and sold or would nor-mally have been sold during the year.
NASS, Environmental, Economics, and Demographics Branch, (202) 720–6146.

IX–10 FARM RESOURCES, INCOME, AND EXPENSES
Table 9-7.—Farms: Classification by tenure of operator, United States, 1940–2017
Year Farms Tenure of operator
Full owners Part owners Managers All tenants
Number Percent Percent Percent Percent
1940 ..................... 6,102,417 50.6 10.1 0.6 38.8 1945 1 ................... 5,859,169 56.4 11.3 0.7 31.7 1950 ..................... 5,388,437 57.4 15.3 0.4 26.9 1954 1 ................... 4,783,021 57.4 18.2 0.4 24.0 1959 ..................... 3,710,503 57.1 21.9 0.6 20.5 1964 ..................... 3,157,857 57.6 24.8 0.6 17.1 1969 ..................... 2,730,250 62.5 24.6 .............................. 12.9 1974 ..................... 2,314,013 61.5 27.2 .............................. 11.3 1978 ..................... 2,257,775 57.5 30.2 .............................. 12.3 1982 ..................... 2,240,976 59.2 29.3 .............................. 11.6 1987 ..................... 2,087,759 59.3 29.2 .............................. 11.5 1992 ..................... 1,925,300 57.7 31.0 .............................. 11.3 1997 ..................... 1,911,859 60.0 30.0 .............................. 10.0 2002 2 ................... 2,128,982 67.1 25.9 .............................. 7.0 2007 2 ................... 2,204,792 69.0 24.6 .............................. 6.4 2012 2 ................... 2,109,303 67.7 25.3 .............................. 7.0 2017 .................... 2,042,220 69.0 24.1 .............................. 6.9
1 Excludes Alaska and Hawaii. 2 The 2002 Census of Agriculture introduced new methodology to account for all farms in the United States. All 2002 published census items were reweighted for undercoverage. Strictly speaking, data for 2002 and subsequent years are not fully comparable with data from earlier years.
NASS, Environmental, Economics, and Demographics Branch, (202) 720-6146.
Table 9-8.—Farmland Rented: Classification by tenants and part owners, United States, 1920–2017
Year Land in farms Land rented by tenure of operator 1 Percentage of
land rented Tenants Part owners Total
Million acres Million acres Million acres Million acres Percent
1920 ..................... 958.7 3265.0 454.7 319.7 33.3 1925 ..................... 924.3 264.9 96.3 361.2 39.1 1930 ..................... 990.1 307.3 125.2 432.5 43.7 1935 ..................... 1,054.5 336.8 134.3 471.1 44.7 1940 ..................... 1,065.1 313.2 155.9 469.1 44.0 1945 ..................... 1,141.6 251.6 178.9 430.5 37.7 1950 ..................... 1,161.4 212.2 196.2 408.4 35.2 1954 ..................... 1,158.2 192.6 212.3 404.9 35.0 1959 ..................... 1,123.0 166.8 234.1 400.9 35.7 1964 ..................... 1,110.2 144.9 248.1 5393.0 35.4 1969 ..................... 1,063.3 137.6 241.8 379.4 35.7 1974 ..................... 1,017.0 122.3 258.4 380.7 37.4 1978 ..................... 1,029.7 124.1 282.2 406.2 39.4 1982 ..................... 986.2 113.6 269.9 383.5 38.9 1987 ..................... 964.5 126.9 275.4 402.3 41.7 1992 ..................... 945.5 122.7 282.2 404.9 42.8 1997 ..................... 931.8 108.1 270.0 378.1 40.6 2002 6 ................... 938.3 86.5 266.8 353.3 37.7 2007 6 ................... 922.1 81.8 269.0 350.8 38.0 2012 6 ................... 914.5 87.0 268.1 355.1 38.8 2017 ..................... 900.2 86.9 274.2 361.1 39.4
1 Columns 3, 4, and 5 refer only to land rented from others and operated, so subleased land is not included. Acres of land rented are comparable in the same year, but definitions change over time. Basic sources are 1969 Census of Agri-culture, table 5, p.14; 1974 Census of Agriculture, table 3, pp.1-6; 1978 Census of Agriculture, vol. 1, part 51, table 5, pp. 124-127; 1982 Census of Agriculture, vol. 1, part 51, table 48, p. 49; 1987 Census of Agriculture vol. 1 part 51, table 48, p. 49; 1992 Census of Agriculture vol. 1, part 51, table 46, p. 53; 1997 Census of Agriculture, vol. 1, part 51, chapter 1, table 46, p. 57; 2002 Census of Agriculture, vol. 1, part 51, chapter 1, table 61, p. 214; 2007 Census of Agriculture, vol. 1, part 51, chapter 1, table 65, p. 262; 2012 Census of Agriculture, vol. 1, part 51, table 70, p. 231; and earlier census volumes as noted. 2Assumes land leased by part-owners is the difference between the average size of full-owner and part-owner farms. Acreage leased by part-owners is this difference times the number of part-owners. 1910 Census of Agriculture, chapter 11, table 1 and 3, pp.97-99. 31920 Census of Agriculture, vol. VI, part 1, table 5, p. 19. 4Assumes same propor-tion of owner and part-owner as in 1910. 5 1964 Census of Agriculture, vol. II, chapter 8, p.757. 6 The 2002 Census of Agriculture introduced new methodology to account for all farms in the United States. All 2002 published census items were reweighted for undercoverage. Strictly speaking, data for 2002 and subsequent years are not fully comparable with data from earlier years.
NASS, Environmental, Economics, and Demographics Branch, (202) 720-6146.

IX–11 AGRICULTURAL STATISTICS 2019
Table 9-9.—Land: Utilization, by State and United States, 2012
State
Cropland Grassland
pasture Forest land Used for crops Idle Used only for
pasture
1,000 acres 1,000 acres 1,000 acres 1,000 acres 1,000 acres
Alabama .............. 2,231 415 161 2,892 22,800 Alaska .................. 31 45 4 696 91,817 Arizona ................ 908 142 84 43,580 13,000 Arkansas .............. 7,466 585 184 4,127 18,544 California ............. 8,316 780 481 26,667 16,991 Colorado .............. 8,013 2,218 437 31,734 15,138 Connecticut .......... 104 9 9 22 1,346 Delaware ............. 420 11 7 18 331 Florida .................. 2,122 452 260 5,100 15,827 Georgia ................ 3,799 457 129 1,680 24,352 Hawaii .................. 161 189 22 770 1,299 Idaho .................... 4,790 789 221 18,391 16,771 Illinois ................... 22,672 1,175 88 1,728 4,772 Indiana ................. 12,216 414 80 1,656 4,748 Iowa ..................... 24,750 1,738 225 2,879 2,968 Kansas ................. 25,545 2,598 449 17,781 2,402 Kentucky .............. 5,400 641 328 4,742 11,886 Louisiana ............. 3,497 869 218 2,275 14,645 Maine ................... 328 55 8 159 17,191 Maryland .............. 1,254 108 15 447 2,329 Massachusetts ..... 130 14 5 79 2,088 Michigan .............. 7,192 483 91 1,982 19,262 Minnesota ............ 20,394 1,887 171 3,568 15,929 Mississippi ........... 4,372 638 163 2,715 19,495 Missouri ............... 13,455 1,591 580 9,792 15,085 Montana ............... 12,522 3,181 902 47,629 18,429 Nebraska ............. 20,442 1,090 326 23,677 1,470 Nevada ................ 478 42 57 52,329 5,417 New Hampshire ... 73 18 2 116 4,341 New Jersey .......... 403 29 16 78 1,116 New Mexico ......... 1,183 534 231 54,344 13,278 New York ............. 3,816 318 113 2,397 15,920 North Carolina ..... 4,085 294 95 1,579 18,078 North Dakota ....... 24,081 2,718 322 13,336 517 Ohio ..................... 10,190 530 109 2,144 7,864 Oklahoma ............ 9,155 1,123 1,011 19,756 7,656 Oregon ................. 3,522 834 308 23,863 24,116 Pennsylvania ....... 3,952 446 119 1,287 16,242 Rhode Island ....... 19 4 2 7 290 South Carolina ..... 1,540 308 55 976 13,025 South Dakota ....... 17,624 1,203 528 24,972 1,789 Tennessee ........... 4,479 374 408 3,424 13,500 Texas ................... 21,598 4,773 2,844 104,603 14,357 Utah ..................... 1,090 246 140 32,774 9,810 Vermont ............... 379 19 15 305 4,476 Virginia ................. 2,636 205 148 2,794 15,385 Washington .......... 5,558 1,856 125 7,314 18,081 West Virginia ....... 685 42 54 1,351 11,780 Wisconsin ............ 9,301 607 164 2,864 16,727 Wyoming .............. 1,523 207 256 46,086 7,002
United States 1 ..... 339,900 39,306 12,769 655,486 631,682
1 Distributions may not sum to totals due to rounding. NASS, Environmental, Economics, and Demographics Branch, (202) 720–6146. See notes to Table 9-11 for definitions
and data sources. Estimates developed for years coinciding with a Census of Agriculture.

IX–12 FARM RESOURCES, INCOME, AND EXPENSES
Table 9-10.—Land in farms: Irrigated land, by State and United States, 1982–2012 1
State 1982 1987 1992 1997 2002 2007 2012
1,000 1,000 1,000 1,000 1,000 1,000 1,000 acres acres acres acres acres acres acres
Alabama .............................. 66 84 82 80 109 113 113 Alaska .................................. 1 2 2 3 3 4 2 Arizona ................................ 1,098 914 956 1,075 932 876 881 Arkansas .............................. 2,022 2,406 2,702 3,785 4,150 4,461 4,804 California ............................. 8,461 7,596 7,571 8,887 8,709 8,016 7,862 Colorado .............................. 3,201 3,014 3,170 3,374 2,591 2,868 2,517 Connecticut .......................... 7 7 6 8 10 10 9 Delaware ............................. 44 61 62 75 97 105 127 Florida .................................. 1,585 1,623 1,783 1,874 1,815 1,552 1,493 Georgia ................................ 575 640 725 773 871 1,018 1,125 Hawaii .................................. 146 149 134 77 69 59 82 Idaho .................................... 3,450 3,219 3,260 3,544 3,289 3,300 3,365 Illinois ................................... 166 208 328 352 391 474 522 Indiana ................................. 132 170 241 256 313 397 437 Iowa ..................................... 91 92 116 133 142 190 172 Kansas ................................. 2,675 2,463 2,680 2,696 2,678 2,763 2,881 Kentucky .............................. 23 38 28 60 37 59 74 Louisiana ............................. 694 647 898 961 939 954 1,093 Maine ................................... 6 6 10 22 20 21 31 Maryland .............................. 39 51 57 69 81 93 105 Massachusetts ..................... 17 20 20 27 24 23 23 Michigan .............................. 286 315 366 407 456 500 592 Minnesota ............................ 315 354 370 403 455 506 524 Mississippi ........................... 431 637 883 1,110 1,176 1,369 1,652 Missouri ............................... 403 535 709 921 1,033 1,200 1,181 Montana ............................... 2,023 1,997 1,978 2,102 1,976 2,013 1,903 Nebraska ............................. 6,039 5,682 6,312 7,066 7,625 8,559 8,297 Nevada ................................ 830 779 556 764 747 691 688 New Hampshire ................... 1 3 2 3 2 2 3 New Jersey .......................... 83 91 80 94 97 95 88 New Mexico ......................... 807 718 738 852 845 830 680 New York ............................. 52 51 47 74 75 68 60 North Carolina ..................... 81 138 113 156 264 232 175 North Dakota ....................... 163 168 187 183 203 236 218 Ohio ..................................... 28 32 29 35 41 38 47 Oklahoma ............................ 492 478 512 509 518 535 480 Oregon ................................. 1,808 1,648 1,622 1,963 1,908 1,845 1,630 Pennsylvania ....................... 18 30 23 40 43 38 39 Rhode Island ....................... 2 4 3 3 4 4 4 South Carolina ..................... 81 81 76 89 96 132 159 South Dakota ....................... 376 362 371 367 401 374 379 Tennessee ........................... 18 38 37 47 61 81 146 Texas ................................... 5,576 4,271 4,912 5,764 5,075 5,010 4,489 Utah ..................................... 1,082 1,161 1,143 1,218 1,091 1,134 1,104 Vermont ............................... 1 2 2 3 2 2 4 Virginia ................................. 43 79 62 86 99 82 69 Washington .......................... 1,638 1,519 1,641 1,787 1,823 1,736 1,634 West Virginia ....................... 1 3 3 4 2 2 2 Wisconsin ............................ 259 285 331 358 386 377 422 Wyoming .............................. 1,565 1,518 1,465 1,750 1,542 1,551 1,436
United States ....................... 49,003 46,386 49,404 56,289 55,316 56,599 55,822
Puerto Rico .......................... 42 36 46 35 43 40 52 Virgin Islands ....................... (3) (3) (3) (3) (2) (2) (3)
Total ..................................... 49,002 46,386 49,404 55,058 55,360 56,639 55,874
1 Distributions may not sum to totals due to rounding. 2 Less than 500 acres. 3 Not available. NASS, Environmental, Economics, and Demographics Branch, (202) 720–6146. 1982-1992 data from the Census of Agri-
culture, U.S. Department of Commerce. Beginning in 1997 from the Census of Agriculture, U.S. Department of Agri-culture. Estimates developed for years coinciding with a Census of Agriculture.

IX–13 AGRICULTURAL STATISTICS 2019
Table 9-11.—Land utilization, United States, selected years, 1987–2012
Major land uses 1987 1992 1997 2002 2007 2012
Million Million Million Million Million Million acres acres acres acres acres acres
Cropland used for crops 1 .................. 331 338 349 340 335 340 Idle cropland ...................................... 68 56 39 40 37 39 Cropland used for pasture 2 ............... 65 67 68 62 36 13 Grassland pasture 3 ........................... 591 591 580 587 614 655 Forest land 4 ....................................... 648 648 641 651 671 632 Special uses 5 .................................... 279 281 286 297 313 316 Urban areas 6 ..................................... 57 59 66 60 61 70 Other land 7 ....................................... 227 224 236 228 197 196
Total land area 8 ............................... 2,265 2,263 2,263 2,264 2,264 2,260
1 Cropland harvested, crop failure, and cultivated summer fallow. 2 The 2007 and 2012 estimates declined due to a change in the methodology for determining cropland used for pasture. 3 Grassland and other nonforest pasture and range. 4 Excludes reserved and other forest land duplicated in parks and special uses of land. Includes forested grazing land. 5 Includes rural transportation areas, Federal and State areas used primarily for recreation and wildlife purposes, mili-tary areas, farmsteads, and farm roads and lanes. 6 The 2002 urban acreage estimate is not directly comparable to esti-mates in prior years due to a change in the definition of urban areas in the 2000 Census of Population and Housing. The apparent change in ‘‘urban’’ acreage between 1997 and 2002 reflects a definitional change, rather than a decline in acre-age. 7 Miscellaneous areas such as marshes, open swamps, bare rock areas, deserts, and other uses not inventoried. 8 Remeasurement and increases in reservoirs account for changes in total land areas.
NASS, Environmental, Economics, and Demographics Branch, (202) 720–6146. Estimates developed for years coinciding with a Census of Agriculture.

IX–14 FARM RESOURCES, INCOME, AND EXPENSES
Table 9-12.—Farm real estate: Value of farmland and buildings, Region, State, and United States, 2016–2019 1
Region and State Total value of land and buildings
2016 2017 2018 2019
Million dollars Million dollars Million dollars Million dollars
Northeast: Connecticut .............................. 4,641 4,598 4,674 4,636 Delaware .................................. 4,311 4,373 4,457 4,744 Maine ....................................... 2,873 3,081 3,081 3,133 Maryland .................................. 14,940 15,240 15,720 16,120 Massachusetts ......................... 5,350 5,292 5,450 5,550 New Hampshire ....................... 1,982 2,090 2,107 2,141 New Jersey .............................. 9,709 9,782 10,125 10,125 New York ................................. 21,770 21,804 22,287 22,425 Pennsylvania ............................ 42,486 44,019 45,625 47,231 Rhode Island ............................ 876 894 912 936 Vermont ................................... 4,080 4,164 4,248 4,356
Lake States: Michigan ................................... 48,020 48,412 48,608 48,608 Minnesota ................................ 122,624 124,185 123,675 123,420 Wisconsin ................................. 65,088 69,641 70,070 70,785
Corn Belt: Illinois ....................................... 197,100 193,320 196,560 196,560 Indiana ..................................... 101,767 98,700 98,700 98,042 Iowa ......................................... 225,522 224,910 222,462 220,014 Missouri .................................... 89,838 86,736 93,626 93,840 Ohio ......................................... 83,580 84,140 86,180 85,544
Northern Plains: Kansas ..................................... 87,478 86,562 84,730 89,572 Nebraska .................................. 130,050 126,900 123,750 127,965 North Dakota ............................ 68,775 68,382 67,203 68,382 South Dakota ........................... 94,827 90,720 89,424 89,424
Appalachian: Kentucky .................................. 46,020 47,840 48,633 49,278 North Carolina .......................... 38,675 38,472 38,976 39,312 Tennessee ............................... 41,093 41,856 42,728 43,092 Virginia ..................................... 35,313 35,802 36,036 36,270 West Virginia ............................ 9,432 9,768 9,540 9,380
Southeast: Alabama ................................... 24,252 25,026 25,330 25,730 Florida ...................................... 52,896 56,842 57,230 57,715 Georgia .................................... 34,100 35,600 35,451 35,394 South Carolina ......................... 15,264 15,228 15,888 16,320
Delta States: Arkansas .................................. 41,700 43,229 43,924 46,480 Louisiana .................................. 22,960 23,680 24,320 24,960 Mississippi ................................ 27,195 27,664 28,496 29,120
Southern Plains: Oklahoma ................................. 57,967 59,850 61,560 64,328 Texas ....................................... 234,600 243,840 260,350 268,180
Mountain: Arizona 2 ................................... 24,929 26,058 26,493 26,608 Colorado .................................. 47,550 48,972 49,608 49,926 Idaho ........................................ 30,044 31,941 33,292 34,500 Montana ................................... 52,443 53,278 53,128 53,070 Nevada 2 .................................. 5,829 5,722 5,722 5,722 New Mexico 2 ........................... 20,586 20,977 21,100 20,982 Utah 2 ....................................... 15,512 15,983 16,290 17,019 Wyoming .................................. 20,481 20,648 21,054 21,460
Pacific: California .................................. 200,384 219,765 227,205 243,000 Oregon ..................................... 35,840 37,760 38,880 39,500 Washington .............................. 39,396 40,572 41,748 41,172
United States 3 ............................. 2,602,148 2,644,318 2,686,656 2,732,071
1 Total value of land and buildings is derived by multiplying average value per acre of farm real estate by the land in farms. 2 Value of all land and buildings adjusted to include American Indian reservation land value. 3 Excludes Alaska and Hawaii.
NASS, Environmental, Economics, and Demographics Branch, (202) 720–6146.

IX–15 AGRICULTURAL STATISTICS 2019
Table 9-13.—Farm real estate: Average value per acre - Region, State, and United States, 2016–2019
Region and State 2016 2017 2018 2019
Dollars Dollars Dollars Dollars
Northeast: 5,270 5,380 5,550 5,690 Connecticut ........... 11,900 12,100 12,300 12,200 Delaware ............... 8,290 8,250 8,410 8,950 Maine .................... 2,210 2,370 2,370 2,410 Maryland ............... 7,470 7,620 7,860 8,060 Massachusetts ...... 10,700 10,800 10,900 11,100 New Hampshire .... 4,610 4,860 4,900 4,980 New Jersey ........... 13,300 13,400 13,500 13,500 New York .............. 3,110 3,160 3,230 3,250 Pennsylvania ........ 5,820 6,030 6,250 6,470 Rhode Island ........ 14,600 14,900 15,200 15,600 Vermont ................ 3,400 3,470 3,540 3,630
Lake: 4,730 4,880 4,890 4,900 Michigan ................. 4,900 4,940 4,960 4,960 Minnesota ............... 4,790 4,870 4,850 4,840 Wisconsin ............... 4,520 4,870 4,900 4,950
Corn Belt: 6,100 5,990 6,110 6,100 Illinois ..................... 7,300 7,160 7,280 7,280 Indiana ................... 6,830 6,580 6,580 6,580 Iowa ....................... 7,370 7,350 7,270 7,190 Missouri .................. 3,220 3,120 3,380 3,400 Ohio ....................... 5,970 6,010 6,200 6,290
Northern Plains: 2,200 2,150 2,110 2,170 Kansas ................... 1,910 1,890 1,850 1,960 Nebraska ................ 2,890 2,820 2,750 2,850 North Dakota .......... 1,750 1,740 1,710 1,740 South Dakota ......... 2,190 2,100 2,070 2,070
Appalachian: 3,880 3,970 4,030 4,080 Kentucky ................ 3,540 3,680 3,770 3,820 North Carolina ........ 4,550 4,580 4,640 4,680 Tennessee ............. 3,770 3,840 3,920 3,990 Virginia ................... 4,470 4,590 4,620 4,650 West Virginia .......... 2,620 2,640 2,650 2,680
Southeast: 3,830 3,990 4,050 4,090 Alabama ................. 2,820 2,910 2,980 3,100 Florida .................... 5,510 5,860 5,900 5,950 Georgia .................. 3,410 3,560 3,510 3,470 South Carolina ....... 3,180 3,240 3,310 3,400
Delta: 2,830 2,920 3,000 3,100 Arkansas ................ 3,000 3,110 3,160 3,320 Louisiana ................ 2,870 2,960 3,040 3,120 Mississippi .............. 2,590 2,660 2,740 2,800
Southern Plains: 1,810 1,880 2,000 2,070 Oklahoma ............... 1,690 1,750 1,800 1,870 Texas ..................... 1,840 1,920 2,050 2,120
Mountain: 1,140 1,170 1,200 1,220 Arizona 1 ................. 3,570 3,770 3,780 3,800 Colorado ................ 1,500 1,540 1,560 1,570 Idaho ...................... 2,590 2,730 2,870 3,000 Montana ................. 898 917 916 915 Nevada 1 ................. 1,040 1,020 1,020 1,020 New Mexico 1 ......... 540 558 565 570 Utah 1 ..................... 2,160 2,230 2,310 2,420 Wyoming ................ 699 712 726 740
Pacific: 4,960 5,440 5,610 5,900 California ................ 8,080 8,970 9,350 10,000 Oregon ................... 2,240 2,360 2,430 2,500 Washington ............ 2,680 2,760 2,840 2,820
United States 2 ........... 2,990 3,030 3,100 3,160
1 Excludes American Indian Reservation Land. 2 Excludes Alaska and Hawaii. NASS, Environmental, Economics, and Demographics Branch, (202) 720–6146.

IX–16 FARM RESOURCES, INCOME, AND EXPENSES
Table 9-14.—Land values, cropland and pasture average value per acre: Region, State, and United States, 2016–2019
Region and State Cropland
2016 2017 2018 2019
Dollars Dollars Dollars Dollars
Northeast: 5,650 5,700 5,940 6,040 Delaware ......................................... 8,090 7,960 8,120 8,600 Maryland ......................................... 6,910 7,050 7,280 7,370 New Jersey ..................................... 13,500 13,600 13,700 13,700 New York ........................................ 2,690 2,740 2,800 2,810 Pennsylvania .................................. 6,450 6,470 6,890 7,030 Other States 1 ................................. 7,290 7,630 7,650 7,900
Lake: 4,750 4,840 4,810 4,760 Michigan ......................................... 4,590 4,580 4,510 4,500 Minnesota ....................................... 4,840 4,920 4,950 4,810 Wisconsin ....................................... 4,660 4,870 4,740 4,850
Corn Belt: 6,500 6,380 6,370 6,360 Illinois .............................................. 7,350 7,210 7,280 7,300 Indiana ............................................ 6,690 6,300 6,210 6,210 Iowa ................................................ 7,510 7,440 7,290 7,260 Missouri .......................................... 3,570 3,560 3,490 3,490 Ohio ................................................ 6,070 6,150 6,320 6,400
Northern Plains: 2,900 2,760 2,740 2,790 Kansas ............................................ 2,080 2,010 2,060 2,160 Nebraska ........................................ 4,750 4,430 4,380 4,390 North Dakota .................................. 1,910 1,890 1,870 1,920 South Dakota .................................. 3,430 3,200 3,120 3,130
Appalachian: 3,980 4,070 4,140 4,190 Kentucky ......................................... 3,980 4,140 4,250 4,300 North Carolina ................................ 4,060 4,090 4,130 4,180 Tennessee ...................................... 3,670 3,730 3,830 3,910 Virginia ............................................ 4,610 4,730 4,760 4,720 West Virginia .................................. 3,220 3,250 3,250 3,280
Southeast: 4,030 4,060 4,160 4,120 Alabama .......................................... 3,080 3,170 3,300 3,430 Florida ............................................. 6,860 6,940 7,040 7,190 Georgia ........................................... 3,420 3,430 3,430 3,210 South Carolina ................................ 2,610 2,700 2,790 2,830
Delta: 2,690 2,770 2,840 2,920 Arkansas ......................................... 2,660 2,730 2,780 2,850 Louisiana ........................................ 2,590 2,700 2,790 2,880 Mississippi ...................................... 2,810 2,900 3,000 3,080
Southern Plains: 1,700 1,780 1,820 1,860 Oklahoma ....................................... 1,530 1,590 1,630 1,670 Texas .............................................. 1,770 1,850 1,890 1,930
Mountain: 1,820 1,860 1,910 1,980 Arizona 2 ......................................... 7,800 7,720 7,610 7,600 Colorado ......................................... 2,020 2,070 2,100 2,160 Idaho ............................................... 3,420 3,570 3,740 3,930 Montana .......................................... 1,010 1,010 1,020 1,040 Nevada 2 ......................................... (D) (D) (D) (D) New Mexico 2 .................................. 1,500 1,560 1,580 1,550 Utah 2 .............................................. 3,530 3,690 3,830 3,970 Wyoming ......................................... 1,450 1,460 1,490 1,520
Pacific: 6,350 6,650 6,830 7,190 California ......................................... 11,160 11,630 12,170 12,830 Oregon ............................................ 2,780 2,920 3,000 3,080 Washington ..................................... 2,590 2,660 2,630 2,630
United States 3 ....................................... 4,040 4,030 4,050 4,100
See footnote(s) at end of table.

IX–17 AGRICULTURAL STATISTICS 2019
Table 9-14.—Land values, cropland and pasture average value per acre: Region, State, and United States, 2016–2019—Continued
Region, State, and land type
Irrigated and Non-Irrigated Cropland
2016 2017 2018 2019
Dollars Dollars Dollars Dollars Corn Belt:
Missouri all cropland .............. 3,570 3,560 3,490 3,490 Irrigated ........................... 4,830 4,940 4,770 4,770 Non-irrigated ................... 3,470 3,450 3,380 3,350
Northern Plains: Kansas all cropland ............... 2,080 2,010 2,060 2,160
Irrigated ........................... 3,050 2,910 2,980 3,320 Non-irrigated ................... 1,970 1,910 1,960 2,050
Nebraska all cropland ............. 4,750 4,430 4,380 4,390 Irrigated ........................... 6,430 6,010 5,930 5,850 Non-irrigated ................... 3,720 3,450 3,430 3,490
South Dakota all cropland ....... 3,430 3,200 3,120 3,130 Irrigated ........................... (D) (D) (D) (D) Non-irrigated ................... 3,410 3,180 3,100 3,100
Southeast: Florida all cropland ................ 6,860 6,940 7,040 7,190
Irrigated ........................... 7,750 7,860 7,980 8,160 Non-irrigated ................... 6,020 6,070 6,160 6,280
Georgia all cropland ............... 3,420 3,430 3,430 3,210 Irrigated ........................... 4,010 4,080 4,560 4,030 Non-irrigated ................... 3,210 3,190 3,020 2,870
Delta: Arkansas all cropland ............ 2,660 2,730 2,780 2,850
Irrigated ........................... 3,150 3,230 3,290 3,340 Non-irrigated ................... 1,920 1,960 1,990 2,060
Louisiana all cropland ............ 2,590 2,700 2,790 2,880 Irrigated ........................... 2,520 2,660 2,750 2,820 Non-irrigated ................... 2,620 2,710 2,810 2,900
Mississippi all cropland .......... 2,810 2,900 3,000 3,080 Irrigated ........................... 3,300 3,440 3,580 3,620 Non-irrigated ................... 2,580 2,640 2,720 2,770
Southern Plains: Oklahoma all cropland ........... 1,530 1,590 1,630 1,670
Irrigated ........................... (D) (D) (D) (D) Non-irrigated ................... 1,520 1,580 1,610 1,650
Texas all cropland .................. 1,770 1,850 1,890 1,930 Irrigated ........................... 1,920 2,020 2,160 2,230 Non-irrigated ................... 1,750 1,820 1,840 1,880
Mountain: Arizona all cropland 2 ............. 7,800 7,720 7,610 7,600
Irrigated ........................... 7,800 7,720 7,610 7,600 Colorado all cropland .............. 2,020 2,070 2,100 2,160
Irrigated ........................... 4,860 4,950 5,050 5,100 Non-irrigated ................... 1,320 1,360 1,370 1,370
Idaho all cropland .................... 3,420 3,570 3,740 3,930 Irrigated ........................... 5,180 5,410 5,690 6,020 Non-irrigated ................... 1,470 1,530 1,590 1,650
Montana all cropland ............. 1,010 1,010 1,020 1,040 Irrigated ........................... 2,970 2,970 2,990 3,010 Non-irrigated ................... 818 827 836 835
Nevada all cropland 2 .............. (D) (D) (D) (D) Irrigated ........................... (D) (D) (D) (D)
New Mexico all cropland 2 ....... 1,500 1,560 1,580 1,550 Irrigated ........................... 4,080 4,140 4,190 4,200 Non-irrigated ................... 405 463 469 475
Utah all cropland 2 ................... 3,530 3,690 3,830 3,970 Irrigated ........................... 5,660 5,930 6,160 6,360 Non-irrigated ................... 1,240 1,270 1,320 1,400
Wyoming all cropland .............. 1,450 1,460 1,490 1,520 Irrigated ........................... 2,330 2,340 2,390 2,430 Non-irrigated ................... 816 820 836 840
Pacific: California all cropland ............. 11,160 11,630 12,170 12,830
Irrigated ........................... 13,200 13,700 14,300 15,100 Non-irrigated ................... 4,400 4,740 5,090 5,400
Oregon all cropland ................. 2,780 2,920 3,000 3,080 Irrigated ........................... 4,730 4,950 5,180 5,290 Non-irrigated ................... 2,060 2,170 2,200 2,220
Washington all cropland .......... 2,590 2,660 2,630 2,630 Irrigated ........................... 7,760 8,000 7,930 7,690 Non-irrigated ................... 1,250 1,270 1,260 1,260
See footnote(s) at end of table.

IX–18 FARM RESOURCES, INCOME, AND EXPENSES
Table 9-14.—Land values, cropland and pasture average value per acre: Region, State, and United States, 2016–2019-Continued
Region and State Pasture
2016 2017 2018 2019
Dollars Dollars Dollars Dollars Northeast: 3,550 3,640 3,770 3,870
Maryland ......................................... 6,450 6,580 (D) (D) New Jersey ..................................... 13,000 13,100 13,300 13,400 New York ........................................ 1,460 1,480 1,560 1,530 Pennsylvania .................................. 2,860 3,020 3,140 3,290 Other States 1 ................................. 6,040 6,160 6,410 6,530
Lake: 2,020 2,050 2,080 2,080 Michigan ......................................... 2,650 2,620 2,600 2,590 Minnesota ....................................... 1,680 1,740 1,750 1,700 Wisconsin ....................................... 2,190 2,200 2,260 2,310
Corn Belt: 2,330 2,260 2,320 2,330 Illinois .............................................. 3,350 3,240 3,200 3,170 Indiana ............................................ 2,480 2,430 2,430 2,450 Iowa ................................................ 3,190 2,850 2,790 2,720 Missouri .......................................... 1,830 1,830 1,920 1,980 Ohio ................................................ 3,250 3,240 3,370 3,350
Northern Plains: 1,000 1,020 1,040 1,090 Kansas ............................................ 1,310 1,310 1,320 1,390 Nebraska ........................................ 891 904 975 1,050 North Dakota .................................. 794 804 776 820 South Dakota .................................. 993 1,020 1,040 1,050
Appalachian: 3,440 3,500 3,530 3,540 Kentucky ......................................... 2,880 2,970 3,000 3,030 North Carolina ................................ 4,810 4,840 4,830 4,810 Tennessee ...................................... 3,610 3,670 3,870 3,860 Virginia ............................................ 4,090 4,150 4,050 4,020 West Virginia .................................. 2,060 2,100 2,090 2,120
Southeast: 4,000 4,030 4,180 4,180 Alabama ........................................ 2,280 2,360 2,470 2,590 Florida ............................................ 5,200 5,240 5,380 5,360 Georgia .......................................... 3,540 3,570 3,660 3,730 South Carolina ............................... 3,120 3,180 3,260 3,240
Delta: 2,420 2,480 2,550 2,620 Arkansas ......................................... 2,410 2,460 2,530 2,610 Louisiana ........................................ 2,570 2,660 2,750 2,830 Mississippi ...................................... 2,300 2,350 2,410 2,430
Southern Plains: 1,480 1,490 1,540 1,620 Oklahoma ....................................... 1,380 1,350 1,380 1,460 Texas .............................................. 1,500 1,520 1,570 1,660
Mountain: 636 647 667 683 Arizona 2 ......................................... (D) (D) (D) (D) Colorado ......................................... 803 818 835 845 Idaho ............................................... 1,350 1,420 1,490 1,560 Montana .......................................... 649 658 667 680 Nevada 2 ......................................... (D) (D) (D) (D) New Mexico 2 .................................. 363 379 394 417 Utah 2 .............................................. 1,100 1,130 1,160 1,240 Wyoming ......................................... 540 550 561 575
Pacific: 1,660 1,680 1,680 1,750 California ......................................... 2,760 2,780 2,810 3,010 Oregon ............................................ 692 715 728 750 Washington ..................................... 790 782 766 766
United States 3 ....................................... 1,320 1,330 1,370 1,400
(D) Withheld to avoid disclosing data for individual operations. 1 Includes: Connecticut, Delaware, Maine, Maryland (be-ginning in 2018), Massachusetts, New Hampshire, Rhode Island, and Vermont. 2 Excludes American Indian Reservation land. 3 Excludes Alaska and Hawaii.
NASS, Environmental, Economics, and Demographics Branch, (202) 720–6146.

IX–19 AGRICULTURAL STATISTICS 2019
Table 9-15.—Cash rents, cropland and pasture: By State, 2018–2019
State
2018 2019
Cropland Irrigated cropland
Non-irrigated cropland Pasture Cropland Irrigated
cropland Non-irrigated
cropland Pasture
Dollars
Alabama .............. 61.50 111.00 59.00 22.00 63.50 125.00 60.00 22.00 Arizona ................ 253.00 253.00 ..................... ................ 249.00 249.00 ..................... 2.00 Arkansas .............. 111.00 136.00 49.00 18.00 105.00 131.00 49.00 19.00 California ............. 340.00 528.00 ..................... 13.00 423.00 543.00 35.00 13.00 Colorado .............. 74.50 144.00 ..................... ................ 79.50 151.00 29.00 6.10 Connecticut .......... ................ ................ ..................... ................ ................ ................ 60.00 ................Delaware ............. 112.00 ................ ..................... ................ 119.00 161.00 97.00 ................Florida .................. 115.00 232.00 53.00 17.00 110.00 216.00 58.00 15.50 Georgia ................ 116.00 190.00 65.00 27.00 126.00 208.00 67.00 30.00 Hawaii .................. ................ ................ ..................... ................ 271.00 375.00 180.00 16.00 Idaho .................... 160.00 216.00 56.00 11.00 159.00 216.00 56.00 11.00 Illinois ................... 223.00 240.00 223.00 39.00 224.00 241.00 224.00 41.00 Indiana ................. 198.00 244.00 196.00 ................ 194.00 238.00 193.00 43.00 Iowa ..................... 231.00 ................ 231.00 54.00 230.00 235.00 230.00 59.00 Kansas ................. 66.50 131.00 58.00 19.50 64.50 128.00 57.00 19.00 Kentucky .............. 149.00 ................ 148.00 ................ 151.00 220.00 150.00 27.00 Louisiana ............. 89.00 104.00 73.00 18.00 94.50 111.00 75.00 20.00 Maine ................... ................ ................ ..................... ................ ................ ................ 62.00 ................Maryland .............. 113.00 ................ 106.00 ................ 109.00 196.00 100.00 44.00 Massachusetts ..... ................ ................ ..................... ................ 88.50 240.00 71.00 ................Michigan .............. 123.00 232.00 115.00 ................ 127.00 220.00 120.00 30.00 Minnesota ............ 167.00 192.00 166.00 31.00 164.00 205.00 163.00 28.00 Mississippi ........... 120.00 143.00 84.00 19.00 123.00 148.00 87.00 20.00 Missouri ............... 132.00 180.00 125.00 33.00 130.00 186.00 122.00 32.00 Montana ............... 32.00 ................ 26.50 6.30 32.50 82.00 27.00 6.60 Nebraska ............. 195.00 238.00 150.00 22.50 191.00 237.00 144.00 24.50 Nevada ................ ................ ................ ..................... ................ 164.00 164.00 ..................... 10.00 New Hampshire ... ................ ................ ..................... ................ 44.00 ................ 40.00 ................New Jersey .......... 77.50 ................ ..................... ................ 82.00 139.00 65.00 45.00 New Mexico ......... ................ ................ ..................... ................ 80.50 136.00 17.50 2.80 New York ............. 63.00 ................ 62.00 ................ 66.00 145.00 65.00 26.00 North Carolina ..... 87.00 110.00 86.00 28.00 90.50 105.00 90.00 26.00 North Dakota ....... 65.00 163.00 64.00 17.00 70.00 164.00 69.00 17.50 Ohio ..................... 152.00 ................ 152.00 ................ 155.00 199.00 155.00 28.00 Oklahoma ............ 34.00 72.00 32.00 13.50 34.50 78.00 32.00 13.50 Oregon ................. 159.00 215.00 93.00 12.00 152.00 215.00 95.00 11.00 Pennsylvania ....... 80.50 ................ 80.00 ................ 94.00 173.00 93.00 27.00 South Carolina ..... 48.50 90.00 44.00 ................ 47.00 94.00 42.00 18.00 South Dakota ....... 119.00 189.00 117.00 23.00 119.00 194.00 117.00 26.00 Tennessee ........... 98.00 165.00 95.00 20.00 103.00 180.00 99.00 21.00 Texas ................... 42.50 91.00 30.00 6.70 42.50 92.00 30.00 6.80 Utah ..................... 64.00 92.00 ..................... ................ 75.50 108.00 24.00 4.30 Vermont ............... ................ ................ ..................... ................ 51.00 ................ 50.00 29.00 Virginia ................. 63.00 100.00 61.00 21.00 59.00 100.00 57.00 21.00 Washington .......... 203.00 358.00 75.00 ................ 201.00 360.00 75.00 8.00 West Virginia ....... 45.00 ................ 45.00 ................ 43.00 ................ 43.00 14.00 Wisconsin ............ 140.00 238.00 134.00 40.00 142.00 237.00 137.00 40.00 Wyoming .............. ................ ................ ..................... ................ 57.50 81.00 16.00 4.40
NASS, Environmental, Economics, and Demographics Branch, (202) 720–6146.

IX–20 FARM RESOURCES, INCOME, AND EXPENSES
Table 9-16.—Farm assets and claims: Comparative balance sheet of the farming sector, excluding operator households, United States, Dec. 31, 2014–2018
Item 2014 2015 2016 2017 2018
Billion dollars Billion dollars Billion dollars Billion dollars Billion dollars Assets
Physical assets: Real estate ..................................... 2,364.5 2,364.3 2,400.3 2,471.9 2,519.0
Non-real estate: Livestock and poultry 1 ................... 127.8 118.2 109.0 107.1 97.1 Machinery and motor vehicles 2 .... 245.7 239.5 255.4 272.3 271.0 Crops 3 ........................................... 61.7 52.5 55.7 56.8 59.7 Purchased inputs ........................... 20.1 16.4 14.9 15.8 16.1 Financial ......................................... 102.8 80.2 70.8 72.9 65.4
Total ............................................... 2,930.6 2,878.6 2,913.4 3,005.0 3,026.7
Debt
Liabilities: Real estate ..................................... 196.8 208.8 226.0 236.2 245.7 Non-real estate .............................. 148.4 148.0 148.2 154.2 156.3
Total Debt 4 .................................... 345.2 356.7 374.2 390.4 402.0
Equity ................................................. 2,585.4 2,521.9 2,539.2 2,614.6 2,624.7
Percent Percent Percent Percent Percent Ratio:
Debt/equity ..................................... 13.4 14.1 14.7 14.9 15.3 Debt/assets .................................... 11.8 12.4 12.8 13.0 13.3
Note: Data as of February 5, 2020. 1 The U.S. total exceeds the sum of the states because NASS does not release state data for some minor producing states due to disclosure issues. Horses and mules are excluded. 2 Includes only farm share value for trucks and autos. 3 All non-CCC crops held on farms plus the value above loan rate for crops held under CCC. 4 Excludes debt for nonfarm purposes.
ERS, Farm Income [email protected]. http://www.ers.usda.gov/data-products/farm-income-and-wealth-statistics.aspx.

IX–21 AGRICULTURAL STATISTICS 2019
Table 9-17.—Farm labor: Number of workers on farms and average wage rates, United States, 2009–2018
Year Hired workers 1 Wage rate 2
Thousands Dollars Per Hour
2009 Jan .............................................................. 603 10.93 Apr .............................................................. 694 10.86 July ............................................................. 892 10.66 Oct .............................................................. 829 10.93 Annual average .......................................... 754.5 10.83
2010 Jan .............................................................. 612 11.08 Apr .............................................................. 746 10.82 July ............................................................. 885 10.79 Oct .............................................................. 827 11.13 Annual average .......................................... 767.5 10.95
2011 Jan .............................................................. 603 11.30 Apr .............................................................. (3) (3) July ............................................................. 834 10.93 Oct .............................................................. 828 11.15 Annual average .......................................... 748.8 11.07
2012 Jan .............................................................. 575 11.52 Apr .............................................................. 748 11.41 July ............................................................. 906 11.36 Oct .............................................................. 876 11.75 Annual average .......................................... 776.3 11.51
2013 Jan .............................................................. 596 12.02 Apr .............................................................. 736 11.89 July ............................................................. 906 11.68 Oct .............................................................. 871 11.96 Annual average .......................................... 777.3 11.87
2014 Jan .............................................................. 540 12.23 Apr .............................................................. 690 12.01 July ............................................................. 838 11.96 Oct .............................................................. 782 12.12 Annual average .......................................... 712.5 12.07
2015 Jan .............................................................. 549 12.53 Apr .............................................................. 687 12.28 July ............................................................. 872 12.47 Oct .............................................................. 841 12.82 Annual average .......................................... 737.3 12.54
2016 Jan .............................................................. 582 12.83 Apr .............................................................. 703 12.75 July ............................................................. 840 13.02 Oct .............................................................. 798 13.25 Annual average .......................................... 730.8 12.98
2017 Jan .............................................................. 533 13.43 Apr .............................................................. 673 13.23 July ............................................................. 879 13.23 Oct .............................................................. 840 13.42 Annual average .......................................... 731.3 13.32
2018 Jan .............................................................. 534 14.08 Apr .............................................................. 648 13.72 July ............................................................. 843 14.28 Oct .............................................................. 784 14.47 Annual average .......................................... 702.3 14.17
1 Includes all workers, other than agricultural service workers, who were paid for at least one hour of agricultural work on a farm or ranch during the survey week. 2 Applies to hired workers only (excludes pay for agricultural service work-ers). 3 The Agricultural (Farm) Labor Survey was not conducted for this quarter.
NASS, Economic, Environmental and Demographics Branch, (202) 720–6146.

IX–22 FARM RESOURCES, INCOME, AND EXPENSES
Table 9-18.—Farm labor: Number of hired workers on farms and average wage rates, by regions and United States, 2018 1
Region 2
Workers on farms Farm wage rates
Hired
Type of worker
Field Livestock Field and livestock All hired workers 3
Dollars Dollars Dollars Dollars Thousands per hour per hour per hour per hour
January 7–13, 2018 Northeast I ................. 28 14.00 13.12 13.45 14.70 Northeast II ................ 27 13.57 12.88 13.25 14.19 Appalachian I ............. 19 12.49 11.57 12.15 13.30 Appalachian II ............ 17 11.68 11.53 11.60 12.89 Southeast .................. 20 10.74 11.33 10.95 11.86 Florida ........................ 37 10.80 10.80 10.80 11.64 Lake ........................... 35 12.18 12.35 12.30 13.06 Cornbelt I ................... 31 13.09 13.20 13.15 14.29 Cornbelt II .................. 16 13.37 13.08 13.20 13.85 Delta .......................... 19 12.35 10.83 11.50 12.23 Northern Plains .......... 25 14.76 13.47 14.05 14.82 Southern Plains ......... 40 11.68 12.48 12.05 12.65 Mountain I .................. 17 13.18 13.14 13.15 14.54 Mountain II ................. 13 12.16 13.93 13.40 14.57 Mountain III ................ 17 12.04 12.33 12.15 13.31 Pacific ........................ 37 14.06 14.23 14.10 15.31 California ................... 129 13.55 14.40 13.73 15.61 Hawaii ........................ 7 14.35 15.40 14.52 16.20
United States ............. 534 12.84 12.89 12.86 14.08
April 8–14, 2018 Northeast I ................. 35 13.44 13.03 13.25 14.46 Northeast II ................ 33 13.37 12.68 13.10 13.89 Appalachian I ............. 24 11.87 11.80 11.85 12.69 Appalachian II ............ 18 11.56 11.64 11.60 12.69 Southeast .................. 30 10.35 11.03 10.55 11.23 Florida ........................ 38 11.20 12.20 11.25 11.89 Lake ........................... 43 12.28 12.41 12.35 13.02 Cornbelt I ................... 42 12.49 13.20 12.75 13.71 Cornbelt II .................. 21 12.74 13.43 13.05 13.64 Delta .......................... 32 11.30 10.91 11.15 11.62 Northern Plains .......... 32 14.52 13.47 14.00 14.70 Southern Plains ......... 44 11.40 12.13 11.75 12.26 Mountain I .................. 26 13.16 13.02 13.10 13.84 Mountain II ................. 15 12.08 13.59 13.05 14.13 Mountain III ................ 16 11.77 12.09 11.90 13.13 Pacific ........................ 53 14.16 14.10 14.15 14.97 California ................... 140 13.45 14.15 13.58 15.10 Hawaii ........................ 6 14.55 15.70 14.77 16.71
United States ............. 648 12.72 12.78 12.74 13.72
See footnote(s) at end of table.

IX–23 AGRICULTURAL STATISTICS 2019
Table 9-18.—Farm labor: Number of hired workers on farms and average wage rates, by regions and United States, 2018 1—Continued
Region 2
Workers on farms Type of worker
Hired Field Livestock Field and livestock All hired workers 3
Dollars Dollars Dollars Dollars Thousands per hour per hour per hour per hour
July 8–14, 2018 Northeast I ................. 34 13.14 12.92 13.05 13.74 Northeast II ................ 42 12.57 12.83 12.65 13.45 Appalachian I ............. 40 12.17 12.54 12.25 12.73 Appalachian II ............ 31 11.52 11.77 11.60 12.33 Southeast .................. 27 11.75 10.85 11.50 12.32 Florida ........................ 30 11.40 11.40 11.40 12.49 Lake ........................... 70 13.76 14.05 13.90 14.49 Cornbelt I ................... 45 13.20 13.36 13.25 14.29 Cornbelt II .................. 24 13.48 12.62 13.15 13.84 Delta .......................... 31 11.33 11.67 11.40 11.85 Northern Plains .......... 42 15.12 13.80 14.40 15.14 Southern Plains ......... 57 12.33 12.28 12.30 13.12 Mountain I .................. 27 13.53 14.23 13.85 14.34 Mountain II ................. 21 13.15 13.01 13.10 13.79 Mountain III ................ 18 11.30 12.67 11.95 12.49 Pacific ........................ 120 15.39 14.40 15.30 15.69 California ................... 178 14.10 14.15 14.11 15.43 Hawaii ........................ 6 14.35 17.00 14.82 16.58
United States ............. 843 13.58 13.22 13.48 14.28
October 7–13, 2018 Northeast I ................. 36 13.58 12.81 13.30 13.95 Northeast II ................ 35 13.77 13.70 13.75 14.45 Appalachian I ............. 37 12.52 12.68 12.55 13.07 Appalachian II ............ 30 11.63 11.84 11.70 12.39 Southeast .................. 27 11.92 10.82 11.60 12.48 Florida ........................ 31 11.60 11.60 11.60 12.63 Lake ........................... 66 14.81 14.39 14.60 15.14 Cornbelt I ................... 45 13.93 13.47 13.80 14.76 Cornbelt II .................. 23 13.94 13.65 13.85 14.53 Delta .......................... 28 11.32 11.46 11.35 11.83 Northern Plains .......... 40 15.93 13.55 14.80 15.49 Southern Plains ......... 53 12.67 12.73 12.70 13.53 Mountain I .................. 31 13.05 14.11 13.55 13.95 Mountain II ................. 20 12.91 13.26 13.05 13.87 Mountain III ................ 19 11.45 12.67 12.00 12.53 Pacific ........................ 90 15.62 14.58 15.50 16.02 California ................... 167 14.10 14.25 14.12 15.50 Hawaii ........................ 6 14.55 16.20 14.82 16.26
United States ............. 784 13.74 13.38 13.64 14.47
1 Includes all workers, other than agricultural service workers, who were paid for at least one hour of agricultural work on a farm or ranch during the survey week. 2 Multi-state regions consist of the following: Northeast I: Connecticut, Maine, Mas-sachusetts, New Hampshire, New York, Rhode Island, Vermont; Northeast II: Delaware, Maryland, New Jersey, Pennsyl-vania; Appalachian I: North Carolina, Virginia; Appalachian II: Kentucky, Tennessee, West Virginia; Southeast: Alabama, Georgia, South Carolina; Lake: Michigan, Minnesota, Wisconsin; Cornbelt I: Illinois, Indiana, Ohio; Cornbelt II: Iowa, Mis-souri; Delta: Arkansas, Louisiana, Mississippi; Northern Plains: Kansas, Nebraska, North Dakota, South Dakota; Southern Plains: Oklahoma, Texas; Mountain I: Idaho, Montana, Wyoming; Mountain II: Colorado, Nevada, Utah; Mountain III: Ari-zona, New Mexico; Pacific: Oregon, Washington. 3 Includes field workers, livestock workers, supervisors, and others, ex-cluding agricultural service workers.
NASS, Economic, Environmental and Demographics Branch, (202) 720–6146.

IX–24 FARM RESOURCES, INCOME, AND EXPENSES
Table 9-19.—Hired farmworkers: Number of Workers and Median Weekly Earnings, 2017–2019
Characteristics Workers 1 Median Weekly Earnings 2
2017 2018 2019 2017 2018 2019
Thousands Thousands Thousands Dollars Dollars Dollars
All workers ..................................... 964 950 965 500 540 560 15–19 years old ......................... 69 78 66 300 300 175 20–24 years old ......................... 104 108 91 442 459 500 25–34 years old ......................... 216 191 215 560 576 560 35–44 years old ......................... 199 204 229 520 576 560 45–54 years old ......................... 192 169 157 550 570 576 55 years old and older ............... 185 201 207 600 550 560 Male ........................................... 776 744 744 554 577 576 Female ....................................... 189 206 220 430 440 480 White 3 ........................................ 456 426 426 600 597 600 Black and other races 3 .............. 50 55 47 * * * Hispanic ..................................... 459 469 492 480 528 540 Schooling completed
Less than 5th grade ............... 51 68 70 464 460 520 5th-8th grade .......................... 175 165 157 461 492 500 9th-12th grade (no diploma) .. 165 183 151 450 480 480 High school diploma ............... 318 300 346 560 600 580 Beyond high school ................ 255 235 241 650 600 673
Full-time (35 or more hours per week) 4 .................................... 836 798 819 574 580 585
Part-time (less than 35 hours per week) 4 ............................. 126 148 142 240 220 200
* Insufficient number of reports to publish data. 1 Represents annual average number of persons 15 years old and over in the civilian noninstitutional population who were employed as hired farm managers, supervisors, or laborers. Employment estimates based on 12 monthly Current Population Survey microdata files. Earnings estimates based on 12 monthly Cur-rent Population Survey Outgoing Rotation Group microdata files. 2 ″Median weekly earnings″ is the earnings value that di-vides farmworkers into two equal-sized groups, one group having earnings above the median and the other group having earnings below the median. ″Earnings″ refers to the weekly earnings the farmworker usually earns at a farmwork job, be-fore deductions, and includes any overtime pay or commissions. 3 Excludes persons of Hispanic origin. 4 The sum of full- time and part-time workers will not equal the total because usual hours worked varies for some individuals.
ERS, Rural Economy Branch, (202) 694–5416.
Table 9-20.—Crops: Area, United States, 2009–2018
Year
Principal crops Commercial vegetables,
harvested area
Fruits and nuts, bearing area 4 Area harvested Area planted
total 3 Feed grains 1 Food grains 2 Total 3
1,000 acres 1,000 acres 1,000 acres 1,000 acres 1,000 acres 1,000 acres
2009 ......... 89,446 53,195 301.172 319,022 2,946.6 4,050.5 2010 ......... 89,984 50,768 303,619 315,414 2,827.2 4,091.5 2011 ......... 90,940 48,543 292,652 314,343 2,682.0 4,132.6 2012 ......... 96,639 51,687 306,855 324,304 2,762.0 4,113.1 2013 ......... 98,095 48,073 303,764 324,937 2,681.2 4,306.1 2014 ......... 93,079 49,576 308,368 326,673 2,669.6 4,375.9 2015 ......... 93,037 50,267 304,814 319,047 2,637.1 4,398.3 2016 ......... 96,455 47,356 305,826 318,977 2,636.2 4,770.4 2017 ......... 90,543 40,229 301,779 318,340 2,572.5 4,818.5 2018 ......... 89,648 42,800 300,566 319,579 2,498.1 4,056.1
1 Corn for grain, oats, barley, and sorghum for grain. 2 Wheat, rye, and rice. 3 Crops included in area planted and area harvested are corn, sorghum, oats, barley, winter wheat, rye, durum wheat, other spring wheat, rice, soybeans, peanuts, sunflower, cotton, dry edible beans, potatoes, canola, proso millet, and sugarbeets. Harvested acreage for all hay, tobacco, and sugarcane are used in computing total area planted. 4 Includes the following fruits and nuts: Citrus fruits—oranges, tangerines, Temples, grapefruit, lemons and tangelos; area is for the year of harvest; deciduous fruits—commercial apples, peaches, pears, grapes, cherries, plums, prunes, apricots, bananas, nectarines, figs, kiwifruit, olives, avocados, papayas, dates, berries, guavas, cranberries, pineapples (discontinued as of 2007 crop) and strawberries; nuts—almonds, hazelnuts, macadamias, pistachios, and walnuts.
NASS, Crops Branch, (202) 720–2127.

IX–25 AGRICULTURAL STATISTICS 2019
Table 9-21.—Crops: Area harvested and yield, United States, 2018–2019
Crop Area harvested Yield per acre
2018 2019 Unit 2018 2019
1,000 acres 1,000 acres
Grains and hay:
Barley ....................................................... 1,982 2,221 Bushels .... 77.5 73.0 Corn for grain .......................................... 81,740 81,337 Bushels .... 176.4 167.5 Corn for silage ......................................... 6,113 6,615 Tons ......... 19.9 20.2 Hay, all ..................................................... 52,839 52,425 Tons ......... 2.34 2.46
Alfalfa ................................................... 16,608 16,743 Tons ......... 3.17 3.28 All other ................................................ 36,231 35,682 Tons ......... 1.96 2.07
Oats ......................................................... 865 828 Bushels .... 64.9 64.3 Proso millet .............................................. 403 465 Bushels .... 29.7 35.7 Rice .......................................................... 2,915 2,477 Pounds .... 7,692 7,473 Rye .......................................................... 273 310 Bushels .... 30.9 34.3 Sorghum for grain .................................... 5,061 4,675 Bushels .... 72.1 73.0 Sorghum for silage .................................. 264 339 Tons ......... 12.6 11.9 Wheat, all ................................................. 39,612 37,394 Bushels .... 47.6 51.7
Winter ................................................... 24,742 24,592 Bushels .... 47.9 53.6 Durum .................................................. 1,974 1,177 Bushels .... 39.5 45.8 Other spring ......................................... 12,896 11,625 Bushels .... 48.3 48.3
Oilseeds:
Canola ..................................................... 1,942.5 1,909.0 Pounds .... 1,861 1,781 Cottonseed .............................................. ........................ ........................ Tons ......... ........................ ........................Flaxseed .................................................. 198.0 284.0 Bushels .... 22.6 19.8 Mustard Seed .......................................... 97.8 90.0 Pounds .... 749 706 Peanuts .................................................... 1,373.5 1,389.7 Pounds .... 4,001 3,934 Rapeseed ................................................ 5.4 10.4 Pounds .... 1,524 2,160 Safflower .................................................. 156.4 151.5 Pounds .... 1,512 1,273 Soybeans for beans ................................ 87,594 74,939 Bushels .... 50.6 47.4 Sunflower ................................................. 1,217.4 1,253.5 Pounds .... 1,731 1,560
Cotton, tobacco and sugar crops:
Cotton, all ................................................ 9,990.8 11,612.5 Pounds .... 882 823 Pima ..................................................... 248.8 223.5 Pounds .... 1,545 1,472 Upland .................................................. 9,742.0 11,389.0 Pounds .... 865 810
Sugarbeets .............................................. 1,096.4 980.1 Tons ......... 30.4 29.2 Sugarcane ............................................... 899.7 913.2 Tons ......... 38.4 35.0 Tobacco ................................................... 291.4 227.1 Pounds .... 1,830 2,060
Dry beans, peas and lentils 1:
Austrian winter peas ................................ 10.9 (NA) Cwt .......... 1,138 (NA) Dry edible beans 2 ................................... 2,016.0 1,174.3 Cwt .......... 1,860 1,768
Chickpeas, all ....................................... 846.5 404.5 Cwt .......... 1,511 1,547 Large .................................................... 623.9 313.2 Cwt .......... 1,513 1,553 Small .................................................... 222.6 91.3 Cwt .......... 1,503 1,524
Lentils ...................................................... 718.0 425.0 Cwt .......... 1,171 1,250 Peas, Dry edible 2 .................................... 807.9 1,046.0 Cwt .......... 1,972 2,123 Peas, Wrinkled seed ............................... ........................ ........................ Cwt .......... ........................ ........................
Potatoes and miscellaneous:
Hops ........................................................ 55.0 56.5 Pounds .... 1,943 1,981 Maple Syrup ............................................ ........................ ........................ Pounds .... ........................ ........................Mushrooms .............................................. ........................ ........................ Pounds .... ........................ ........................Peppermint oil .......................................... 58.5 52.4 Pounds .... 92 104 Potatoes, all ............................................. 1,014.8 937.3 Cwt .......... 443 453
Spring ................................................... 51.8 ........................ Cwt .......... 343 ........................Summer ................................................ 56.4 ........................ Cwt .......... 315 ........................Fall ....................................................... 906.6 ........................ Cwt .......... 457 ........................
Spearmint oil ............................................ 20.8 18.3 Pounds .... 124 131 Sweet potatoes ........................................ 144.4 ........................ Cwt .......... 190 ........................Taro (Hawaii) ........................................... 0.3 ........................ Pounds .... 9,630 ........................
(NA) Not available. 1 Beginning in 2019, Austrian winter peas and wrinkled seed peas are included in dry edible peas. 2 Yield in pounds.
NASS, Crops Branch, (202) 720–2127.

IX–26 FARM RESOURCES, INCOME, AND EXPENSES
Table 9-22.—Crops: Production and value, United States, 2018–2019
Crop Production Value of production
Unit 2018 2019 2018 2019
Thousands Thousands 1,000 dollars 1,000 dollars
Grains and hay:
Barley ............................................... Bushels .... 153,527 172,499 697,598 761,152 Corn for grain .................................. Bushels .... 14,340 13,620 52,102 52,911 Corn for silage ................................. Bushels .... 121,564 133,522 .......................... ..........................Hay, all ............................................. Tons ......... 123,600 128,864 17,288 18,161
Alfalfa ........................................ Tons ......... 52,634 54,875 8,583,806 9,184,257 All other .................................... Tons ......... 70,966 73,989 8,704,409 8,976,339
Oats ................................................. Bushels .... 56,130 53,258 167,640 162,711 Proso millet ...................................... Bushels .... 11,595 16,608 60,566 82,907 Rice .................................................. Cwt .......... 223,833 185,104 2,903,041 2,459,035 Rye .................................................. Bushels .... 8,432 10,622 52,870 64,863 Sorghum for grain ............................ Bushels .... 364,986 341,460 1,180,847 1,151,709 Sorghum for silage .......................... Bushels .... 3,326 4,019 .......................... ..........................Wheat, all ......................................... Bushels .... 1,885,156 1,932,017 9,661,916 8,882,766
Winter ....................................... Bushels .... 1,183,939 1,316,963 5,985,308 5,999,460 Durum ....................................... Bushels .... 77,985 53,959 412,749 257,103 Other Spring ............................. Bushels .... 623,232 561,095 3,263,859 2,626,203
Oilseeds:
Canola ............................................. Pounds .... 3,615,440 3,400,865 568,622 494,295 Cottonseed ...................................... Tons ......... 5,631 5,945 878,254 1,021,832 Flaxseed .......................................... Bushels .... 4,466 5,625 43,533 56,062 Mustard Seed .................................. Pounds .... 73,297 63,580 20,974 16,748 Peanuts ............................................ Pounds .... 5,495,935 5,466,487 1,169,953 1,129,584 Rapeseed ........................................ Pounds .... 8,230 22,464 1,526 4,509 Safflower .......................................... Pounds .... 236,270 192,900 47,976 38,361 Soybeans for beans ........................ Bushels .... 4,428,150 3,551,908 36,819,008 31,202,680 Sunflower ......................................... Pounds .... 2,107,045 1,956,035 370,446 358,408
Cotton, tobacco and sugar crops:
Cotton, all ........................................ Bales ........ 18,367 19,912 6,375,167 6,012,662 Upland ...................................... Bales ........ 17,566 19,227 5,931,451 5,631,849 American Pima ......................... Bales ........ 801 685 443,716 380,813
Sugarbeets ...................................... Tons ......... 33,282 28,650 1,177,992 1,099,574 Sugarcane ....................................... Tons ......... 32,934 30,287 1,100,218 1,144,859 Tobacco ........................................... Pounds .... 533,241 467,956 1,093,418 946,252
Dry Beans, peas and lentils 1:
Austrian winter peas ........................ Cwt .......... 124 (NA) 1,830 (NA) Dry edible beans 2 ........................... Cwt .......... 37,745 20,756 951,047 608,870
Chickpeas, all ........................... Cwt .......... 12,787 6,256 281,451 117,056 Large ................................. Cwt .......... 9,441 4,865 209,744 93,037 Small ................................. Cwt .......... 3,346 1,391 71,677 24,019
Lentils .............................................. Cwt .......... 8,408 5,311 131,739 78,799 Peas, dry edible 2 ............................ Cwt .......... 15,929 22,210 163,963 212,328 Peas, wrinkled seed ........................ Cwt .......... 389 (NA) 13,564 (NA)
Potatoes and miscellaneous:
Hops ................................................ Pounds .... 106,906.7 112,041.2 583,444 636,580 Maple Syrup .................................... Gallons .... 4,199 4,180 141,825 129,479 Mushrooms ...................................... Pounds .... 917,235 .......................... 1,131,564 ..........................Peppermint oil .................................. Pounds .... 5,377 5,452 106,489 105,439 Potatoes, all ..................................... Cwt .......... 450,020 424,419 4,006,340 ..........................
Spring ....................................... Cwt .......... 17,757 .......................... 282,093 ..........................Summer .................................... Cwt .......... 17,764 .......................... 207,518 ..........................Fall ............................................ Cwt .......... 414,499 .......................... 3,516,729 ..........................
Spearmint oil .................................... Pounds .... 2,571 2,400 43,178 40,765 Sweet potatoes ................................ Cwt .......... 27,378 31,972 634,228 588,125 Taro (Hawaii) 3 ................................. Pounds .... 2,985 (NA) 1,970 ..........................
(NA) Not available. 1 Beginning in 2019, Austrian winter peas and wrinkled seed peas are included in dry edible peas. 2 Yield in pounds. 3 Estimates discontinued in 2019.
NASS, Crops Branch, (202) 720–2127.

IX–27 AGRICULTURAL STATISTICS 2019
Table 9-23.—Fruits and nuts: Bearing acreage and yield, United States, 2017–2018
Crop Bearing acreage Yield per acre
2017 2018 Unit 2017 2018
Acres Acres
Noncitrus fruits:
Apples, Commerical ............................................... 328,200 291,200 Tons 17.60 17.61 Apricots .................................................................. 11,300 10,600 Tons 4.04 3.73 Avocados ............................................................... 58,140 53,640 Tons 3.23 3.46 Bananas (Hawaii) 1 2 .............................................. 950 .................... Tons 3.50 ....................Blackberries Cultivated (Oregon) 1 2 ...................... 6,300 .................... Tons 3.19 ....................Blueberries Cultivated 1 .......................................... 83,900 89,200 Tons 3.06 3.15 Blueberries Wild (Maine) 1 ..................................... 17,000 18,800 Tons 1.99 1.34 Boysenberries (Oregon) 1 2 .................................... 330 .................... Tons 3.03 ....................Cherries, Sweet ..................................................... 92,500 85,000 Tons 4.73 4.05 Cherries, Tart ......................................................... 35,300 35,200 Tons 3.68 4.24 Coffee (Hawaii) ...................................................... 7,200 7,100 Tons 1.77 1.92 Cranberries ............................................................ 39,900 39,300 Tons 10.46 11.36 Dates ...................................................................... 13,400 13,100 Tons 3.23 3.13 Figs (California) 2 ................................................... 6,700 .................... Tons 4.66 ....................Grapes ................................................................... 997,800 937,000 Tons 7.40 8.11 Kiwifruit (California) ................................................ 3,600 3,900 Tons 9.33 9.70 Nectarines .............................................................. 17,000 14,000 Tons 8.34 8.60 Olives (California) .................................................. 40,000 37,500 Tons 4.81 1.43 Papayas (Hawaii) 1 ................................................. 1,100 800 Tons 11.64 6.50 Peaches ................................................................. 91,950 74,500 Tons 7.62 8.74 Pears ...................................................................... 46,200 46,300 Tons 16.00 17.40 Plums (California) .................................................. 15,000 14,000 Tons 7.86 7.16 Prunes (California) ................................................. 45,000 44,000 Tons 7.22 6.36 Raspberries 1 ........................................................ 19,960 16,900 Tons 5.65 6.47 Strawberries 1 ......................................................... 53,200 49,220 Tons 25.57 29.03
Tree nuts:
Almonds (California) 3 ............................................ 1,030,000 1,090,000 Tons 1.79 1.69 Hazelnuts (Oregon) 3 ............................................. 40,000 44,000 Tons 0.80 1.16 Macadamia (Hawaii) 3 ............................................ 17,000 16,900 Tons 1.44 1.04 Pecans 3 ................................................................. 404,800 409,900 Tons 0.38 0.30 Pistachios (California) 3 .......................................... 250,000 264,000 Tons 1.20 1.87 Walnuts (California) 3 ............................................. 335,000 350,000 Tons 1.88 1.93
Citrus fruits:
Grapefruit 4 ............................................................. 59,600 54,800 Boxes 285 228 Lemons 4 ................................................................ 54,300 54,300 Boxes 406 409 Oranges 4 ............................................................... 527,500 517,500 Boxes 225 176 Tangerines and Mandarins 4 .................................. 68,400 71,300 Boxes 372 280
1 Harvested acreage. For 2017, yield based on utilized production. For 2018, yield based on total produc-tion. 2 Estimates discontinued in 2018. 3 Yield based on utilized production on an in-shell basis. 4 Crop year begins with bloom in one year and ends with completion of harvest the following year. Citrus production is for the the year of harvest.
NASS, Crops Branch, (202) 720–2127.

IX–28 FARM RESOURCES, INCOME, AND EXPENSES
Table 9-24.—Fruits and nuts: Production and value, United States, 2017–2018
Crop Total production Value of utilized production
2017 2018 2017 2018
1,000 tons 1 1,000 tons 1 1,000 dollars 1,000 dollars
Noncitrus fruits:
Apples, Commerical ....................... 5,776.9 5,128.5 3,601,447 3,013,713 Apricots ........................................... 45.7 39.6 44,556 48,465 Avocados ........................................ 187.7 185.8 392,012 400,354 Bananas (Hawaii) 2 ......................... 3.3 .............................. 6,028 ..............................Blackberries Cultivated (Oregon)) 2 20.1 .............................. 31,115 ..............................Blueberries Cultivated .................... 259.3 281.2 815,908 797,295 Blueberries Wild (Maine) ................ 33.9 25.2 17,561 23,155 Boysenberries (Oregon)) 2 .............. 1.0 .............................. 1,693 ..............................Cherries, Sweet .............................. 437.6 344.4 891,652 637,700 Cherries, Tart .................................. 129.8 149.2 56,868 56,635 Coffee ............................................. 12.7 13.7 43,774 50,160 Cranberries ..................................... 419.7 446.3 252,088 222,440 Dates .............................................. 43.3 41.1 150,959 152,175 Figs (California)) 2 ........................... 31.2 .............................. 28,568 ..............................Grapes ............................................ 7,383.9 7,596.0 6,507,849 6,615,121 Kiwifruit (California) ........................ 33.6 37.8 34,860 32,886 Nectarines ....................................... 141.9 120.5 128,255 104,626 Olives (California) ........................... 192.3 53.6 186,649 40,523 Papayas (Hawaii) ........................... 12.8 5.2 9,400 5,702 Peaches .......................................... 700.8 651.5 599,862 511,226 Pears .............................................. 737.5 805.5 519,290 428,940 Plums (California) ........................... 117.9 100.0 114,897 92,570 Prunes (California) .......................... 325.5 279.6 207,900 194,832 Raspberries .................................... 113.4 109.4 493,945 367,001 Strawberries 3 ................................. 1,360.4 1,428.9 2,895,813 2,670,523
Tree Nuts:
Almonds, shelled (California) 4 ....... 1,892.5 1,872.5 5,603,950 5,468,040 Hazelnuts, in-shell (Oregon) 5 ........ (NA) (NA) 73,600 91,800 Macadamia, in-shell (Hawaii) 5 ....... (NA) (NA) 53,900 42,007 Pecans, in-shell 5 ............................ (NA) (NA) 709,218 425,331 Pistachios, in-shell (California) 5 ..... (NA) (NA) 1,014,507 2,615,550 Walnuts, in-shell (California) 5 ........ (NA) (NA) 1,568,700 878,800
Citrus fruits 3:
Grapefruit ........................................ 698 509 256,917 207,970 Lemons ........................................... 882 888 763,446 715,761 Oranges .......................................... 5,088 3,875 1,943,678 1,830,445 Tangerines and mandarins ............. 1,029 804 568,084 575,976
(NA) Not available. 1 Tons refers to the 2,000 lb. short Tons. 2 Estimates discontinued in 2018. 3 Value of production is packinghouse-door equivalent. 4 Value is based on the edible portion of the crop only. 5 Only utilized production esti-mated.
NASS, Crops Branch, (202) 720–2127.

IX–29 AGRICULTURAL STATISTICS 2019
Table 9-25.—Vegetables, commercial: Area harvested and yield, United States, 2017–2018
Crop Total area harvested Total yield per harvested acre
2017 2018 Unit 2017 2018
Acres Acres Artichokes .................... 7,200 6,900 Cwt 130.0 145.0 Asparagus ................... 26,300 21,700 Cwt 32.0 36.0 Beans, lima .................. 24,100 23,750 Cwt 27.8 28.7 Beans, snap ................ 212,100 221,500 Cwt 85.2 79.4 Broccoli ........................ 128,600 113,900 Cwt 158.5 151.7 Cabbage ...................... 60,600 54,200 Cwt 393.2 359.9 Cantaloupes ................ 63,250 60,700 Cwt 243.4 240.6 Carrots ......................... 75,900 79,800 Cwt 408.4 413.8 Cauliflower ................... 45,800 43,900 Cwt 198.1 211.5 Celery .......................... 31,800 30,200 Cwt 505.9 589.4 Corn, sweet ................. 464,600 473,100 Cwt 162.9 154.9 Cucumbers .................. 117,200 110,900 Cwt 161.4 139.3 Garlic ........................... 33,000 32,800 Cwt 155.0 175.0 Honeydews .................. 11,600 14,900 Cwt 290.0 310.0 Lettuce
Head ........................ 140,700 120,300 Cwt 351.1 337.2 Leaf .......................... 67,200 69,300 Cwt 203.5 162.7 Romaine ................... 117,400 99,600 Cwt 309.3 293.5
Onions ......................... 151,500 130,200 Cwt 543.8 556.1 Pea, green ................... 134,200 131,100 Cwt 44.8 38.7 Peppers, bell ............... 42,200 39,700 Cwt 341.0 324.8 Peppers, chile .............. 16,000 14,200 Cwt 208.5 187.7 Pumpkins ..................... 72,300 65,900 Cwt 220.2 228.5 Spinach ........................ 64,730 61,450 Cwt 125.0 138.0 Squash ........................ 45,900 44,800 Cwt 174.5 165.0 Tomatoes ..................... 310,500 321,900 Cwt 791.2 863.8 Watermelons ............... 107,800 111,400 Cwt 378.3 350.5
NASS, Crops Branch, (202) 720–2127.

IX–30 FARM RESOURCES, INCOME, AND EXPENSES
Table 9-26.—Vegetables, commercial: Production and value, United States, 2017–2018
Crop Total production Total value of utilized production
Unit 2017 2018 2017 2018
Thousands Thousands 1,000 dollars 1,000 dollars Artichokes .......................................... Cwt 936.0 1,000.5 65,520 63,032 Asparagus .......................................... Cwt 841.1 781.8 100,672 87,584 Beans, lima ........................................ Cwt 671.0 681.7 19,493 21,622 Beans, snap ....................................... Cwt 18,076.3 17,595.2 349,445 363,506 Broccoli .............................................. Cwt 20,384.0 17,273.0 925,716 738,527 Cabbage ............................................. Cwt 23,826.0 19,507.5 431,307 409,446 Cantaloupes ....................................... Cwt 15,394.8 14,607.0 295,975 331,542 Carrots ............................................... Cwt 31,001.0 33,018.0 696,129 731,504 Cauliflower ......................................... Cwt 9,074.5 9,286.0 415,737 425,350 Celery ................................................. Cwt 16,089.0 17,799.0 322,047 444,013 Corn, sweet ........................................ Cwt 75,674.4 73,279.7 892,179 858,862 Cucumbers ......................................... Cwt 18,912.8 15,450.4 392,013 332,867 Garlic .................................................. Cwt 5,115.0 5,740.0 390,021 452,599 Honeydews ........................................ Cwt 3,364.0 4,619.0 94,192 90,532 Lettuce
Head ............................................... Cwt 49,395.5 40,561.0 1,774,522 1,219,857 Leaf ................................................. Cwt 13,675.0 11,277.0 833,077 585,299 Romaine ......................................... Cwt 36,308.0 29,233.0 1,628,136 901,186
Onions ................................................ Cwt 82,389.0 72,409.0 1,042,090 817,496 Pea, green ......................................... Cwt 6,012.4 5,071.0 85,475 64,901 Peppers, bell ...................................... Cwt 14,390.0 12,895.0 625,577 533,307 Peppers, chile .................................... Cwt 3,336.0 2,665.0 113,562 94,767 Pumpkins ........................................... Cwt 15,919.6 15,058.4 196,541 190,162 Spinach .............................................. Cwt 8,090.6 8,480.5 470,860 422,879 Squash ............................................... Cwt 8,009.1 7,392.5 235,613 192,922 Tomatoes ........................................... Cwt 245,654.5 278,071.0 1,677,960 1,856,280 Watermelons ...................................... Cwt 40,781.5 39,045.0 594,033 656,655
NASS, Crops Branch, (202) 720–2127.
Table 9-27.—Livestock and livestock products: Production and value, United States, 2016–2018
Product Production 1 Value of production
2016 2017 2018 2016 2017 2018
Millions Millions Millions 1,000 dollars 1,000 dollars 1,000 dollars
Eggs .............................. 103,202 107,242 109,192 6,591,359 7,635,359 10,586,262
1,000 pounds 1,000 pounds 1,000 pounds 1,000 dollars 1,000 dollars 1,000 dollars
Cattle and calves .......... 42,694,001 44,197,461 46,318,583 48,572,501 50,398,374 49,844,530 Hogs .............................. 35,898,712 36,962,875 38,829,022 17,363,044 19,159,248 19,060,203 Broilers 2 ........................ 54,259,100 55,573,900 56,791,100 25,935,852 30,232,203 31,746,230 Mature chickens ............ 1,060,677 1,001,386 1,019,695 87,949 46,999 49,364 Turkeys 3 ....................... 7,486,978 7,544,391 7,598,289 6,184,247 4,873,677 3,875,131 Milk ................................ 212,451,000 215,527,000 217,575,000 34,712,099 38,119,254 35,411,485
Catfish 3 4 ....................... 320,174 342,241 358,604 385,985 379,713 360,401 Trout 3 4 .......................... 60,933 55,709 49,772 113,904 120,302 110,554 Honey ............................ 162,246 148,980 152,348 343,962 334,166 333,482 Wool (shorn) .................. 25,795 24,810 24,00 37,423 36,774 42,772 Mohair ........................... 800 740 755 3,650 3,661 3,963
1 For cattle, sheep, and hogs, the quantity of net production is the live weight actually produced during the year, adjust-ments having been made for animals shipped in and changes in inventory. Estimates for broilers and eggs cover the 12- month period Dec. 1, previous year through Nov. 30. 2 Young chickens of meat–type strains raised for meat produc-tion. 3 Live weight. 4 Value of fish sold, excludes eggs.
NASS, Livestock Branch, (202) 720–3570.

IX–31 AGRICULTURAL STATISTICS 2019
Table 9-28.—Farm product prices: Marketing year average prices received by farmers; Parity prices, United States, 2017–2018
Commodity Unit
Marketing year average price 1
Parity price 2
2017 2018 2017 2018
Dollars Dollars Dollars Dollars
Basic commodities: Cotton:
Upland ......................................................................... pound 0.686 0.703 1.93 2 Extra long staple(American Pima) .............................. pound 1.39 1.15 3.83 3.99
Wheat ................................................................................. bushel 4.72 5.16 17.7 17.6 Rice .................................................................................... cwt 12.9 12.3 39.5 39.9 Corn .................................................................................... bushel 3.36 3.61 13 13.2 Peanuts .............................................................................. pound 0.229 0.215 0.663 0.675 Tobacco:
Flue-cured, types (class 1) ......................................... pound 2.004 1.933 5.21 5.46 Types 21 ..................................................................... pound (NA) (NA) (NA) (NA) Burley, type 31 ............................................................ pound 1.935 1.96 5.13 5.34 Maryland, type 32 3 ..................................................... pound 1.8 1.8 4.9 5.05 Dark air-cured, types 35–36 ....................................... pound (NA) (NA) (NA) (NA) Sun-cured, type 37 ...................................................... pound (NA) (NA) (NA) (NA) Pa., seedleaf, type 41 ................................................. pound 2.36 2.14 5.5 5.78 Cigar binder type 51 ................................................... pound (NA) (NA) (NA) (NA) Puerto Rican filler, type 46 ......................................... pound (NA) (NA) (NA) (NA) Cigar wrapper, type 61 ............................................... pound (NA) (NA) (NA) (NA)
Designated nonbasic commodities: All milk, sold to plants ........................................................ cwt 17.69 16.28 51.9 52.2 Honey, all ........................................................................... pound 2.200 2.166 4.72 5.14 Wool and mohair:
Wool 4 .......................................................................... pound 1.48 1.75 3.63 3.87 Mohair 5 ....................................................................... pound 4.95 5.25 11.4 11.9
Other nonbasic commodities: Field crops and miscellaneous:
Austrian winter peas ................................................... cwt 12.7 16.4 (NA) (NA) Barley .......................................................................... bushel 4.47 4.62 14.3 14.9 Beans, dry edible ........................................................ cwt 26.7 25.4 93.3 96 Cottonseed .................................................................. ton 142 155 591 593 Crude pine gum .......................................................... barrel (NA) (NA) 400 408 Flaxseed ...................................................................... bushel 9.53 (NA) 33.1 33.8 Hay, all, baled ............................................................. ton 142 166 424 431 Hops ............................................................................ pound 5.6 5.46 10.6 11.6 Lentils .......................................................................... cwt 25.9 17.7 73.5 77.8 Oats ............................................................................. bushel 2.59 2.66 8.41 8.57 Peas, dry edible .......................................................... cwt 11.8 10.5 54.5 55.5 Peppermint oil ............................................................. pounds 18.3 19.8 58.8 60.8 Popcorn, shelled basis ................................................ cwt (NA) (NA) 52.1 53.1 Potatoes ...................................................................... cwt 9.17 8.9 24.6 (NA) Rye .............................................................................. bushel 4.7 6.27 18.2 18.5 Sorghum grain ............................................................. cwt 5.75 5.82 22.2 22.3 Soybeans .................................................................... bushel 9.33 8.48 31.4 32.6 Spearmint oil ............................................................... pound 16.2 16.8 49 50.8 Sweet potatoes ........................................................... cwt 18.4 23.2 59.3 60.5
Fruits: Citrus (equiv. on-tree): 6
Grapefruit .................................................................... box 12.48 14.24 19.2 21.7 Lemons ........................................................................ box 28.5 26.03 50.4 54.9 Oranges ....................................................................... box 13.32 16.86 25.4 26.7 Tangerines .................................................................. box 18.76 25.39 51.6 53.7
Deciduous and other: Apples:
For fresh consumption 7 .............................................. pound 0.407 0.394 0.98 1.03 For processing 8 .......................................................... ton 248 206 545 575
Apricots: For fresh consumption 9 .............................................. ton 1,400 1,540 3400 3,400 Dried, California (dried basis) 8 ................................... ton (D) (D) 7630 8,750 For processing (excl dried) 8 ....................................... ton (NA) (NA) 1160 1,230
Avocados 9 .......................................................................... ton 2,110 2,190 5100 5,370
See footnote(s) at end of table.

IX–32 FARM RESOURCES, INCOME, AND EXPENSES
Table 9-28.—Farm product prices: Marketing year average prices received by farmers; Parity prices, United States, 2017–2018—Continued
Commodity Unit
Marketing year average price 1
Parity price 2
2017 2018 2017 2018
Dollars Dollars Dollars Dollars
Deciduous and other—Continued Berries for processing:
Blackberries (Oregon) ................................................. pound 0.692 ................ 17.90 18.20 Boysenberries (Oregon) .............................................. pound 0.835 ................ 2.54 2.58 Gooseberries ............................................................... pound ................ ................ 1.07 1.09 Loganberries (Oregon) ................................................ pound ................ ................ 1.73 1.76 Raspberries, black (California, Oregon & Wash-
ington) ...................................................................... pound ................ ................ 3.05 3.11 Raspberries, red (California, Oregon & Washington) pound ................ ................ 2.42 2.47
Cherries: Sweet .......................................................................... ton 2,060 1,860 5,930 6,250 Tart .............................................................................. pound 0.224 0.196 0.922 0.939
Cranberries 10 ..................................................................... barrel 30.20 25.10 121 119 Dates 9 ................................................................................ ton 3,510 3,800 4,260 4,230 Grapes:
For all sales ................................................................. ton 881 871 ................ ................Raisin varieties dried, California (dried basis) 8 .......... ton 1,840 ................ 4,090 4,110 Wine dried grapes ....................................................... ton 928 ................ 1,860 2,010
Kiwi ..................................................................................... ton 1,050 870 2,780 3,050 Nectarines
For fresh consumption 17 ............................................. ton 943 (D) 1,830 1,970 For processing 18 ......................................................... ton 144 (D) 121 124
Olives (California): 11 For all sales ................................................................. ton 974 766 ................ ................Crushed for oil ............................................................. ton 810 566 1,690 1,800 For all sales (excl crushed) ......................................... ton ................ ................ 2,520 2,610 For canning ................................................................. ton 1,320 1,270 2,790 2,910
Papayas .............................................................................. pound 0.422 0.554 1.15 1.20 Peaches:
For all sales ................................................................. ton 864 801 ................ ................For fresh consumption 7 .............................................. ton 1,350 1,250 2,490 2,660 Dried, California (dried basis) 8 ................................... ton (NA) ................ 1,320 1,280
For processing California (excl dried): Clingstone 11 ................................................................ ton 474 480 980 1,060 Freestone 8 .................................................................. ton 393 410 798 869
Pears: For all sales ................................................................. ton 710 536 ................ ................For fresh consumption 7 .............................................. ton 875 610 1,670 1,770 For processing (excl dried) 8 ....................................... ton 384 367 ................ ................
Plums (California): For all sales 9 .............................................................. ton 1,000 935 ................ ................For fresh consumption 17 ............................................. ton (D) (D) 1,840 1,910 For processing 18 ......................................................... ton (D) (D) ................ ................Prunes, dried (California) 8 .......................................... ton 1,980 ................ 4,520 4,700
Prunes and plums (excl California): For fresh consumption 12 ............................................. ton ................ ................ 1,760 1,800 For processing (excl dried) 8 ....................................... ton ................ ................ 686 699
Strawberries: For fresh consumption 13 ............................................. cwt 125 106 253 282 For processing 8 .......................................................... cwt 37.20 43.60 101 106
Sugar crops: Sugarbeets .................................................................. ton 41.2 35.5 150 150 Sugarcane for sugar ................................................... ton 31 33.4 99.70 102
Tree nuts: 14 Almonds ...................................................................... pound 2.53 2.44 6.60 6.93 Hazelnuts .................................................................... ton 2,300 1,800 6,250 6,840 Macadamia .................................................................. pound 1.10 1.19 ................ ................Pecans, all ................................................................... pound 2.33 1.75 4.98 (NA) Pistachios .................................................................... pound 1.69 2.65 6.63 6.93 Walnuts ....................................................................... ton 2,490 1,300 6,680 6,870
See footnote(s) at end of table.

IX–33 AGRICULTURAL STATISTICS 2019
Table 9-28.—Farm product prices: Marketing year average prices received by farmers; Parity prices, United States, 2017–2018—Continued
Commodity Unit
Marketing year average price 1
Parity price 2
2017 2018 2017 2018
Dollars Dollars Dollars Dollars
Vegetables for fresh market: 13 Artichokes, California ......................................................... cwt 70 63 131 134 Asparagus .......................................................................... cwt 132 122 323 335 Beans, snap ....................................................................... cwt 57.1 59.8 130 132 Broccoli ............................................................................... cwt 46 43.1 111 115 Cabbage ............................................................................. cwt 19.8 22.9 39.8 40.5 Cantaloupes ....................................................................... cwt 19.2 22.7 61.4 62.5 Carrots 15 ............................................................................ cwt 30.2 27.3 78.7 81.9 Cauliflower 15 ...................................................................... cwt 46.8 46.1 130 135 Celery 15 .............................................................................. cwt 20.5 25.9 58.8 58.1 Cucumbers ......................................................................... cwt 29.4 28.6 65.7 66.9 Eggplant ............................................................................. cwt (NA) (NA) 69.4 70.7 Escarole/Endive .................................................................. cwt (NA) (NA) 89.3 91 Garlic .................................................................................. cwt 184 190 84.4 86 Green peppers 15 ................................................................ cwt 48.7 44.3 104 106 Honeydew melons .............................................................. cwt 28 19.6 55.6 59.3 Lettuce ................................................................................ cwt 35.9 30.1 66.3 71.3 Onions 15 ............................................................................. cwt 14.4 13.5 39.8 41.4 Spinach ............................................................................... cwt 68.8 59 114 116 Sweet corn ......................................................................... cwt 29.2 29.3 76.3 79.8 Tomatoes ............................................................................ cwt 36.8 41.5 116 119 Watermelons ...................................................................... cwt 14.8 16.9 24.4 24.8
Vegetables for processing: 8 Asparagus .......................................................................... ton 1570 1,580 42100 4,340 Beets .................................................................................. ton (NA) (NA) 224 229 Cabbage ............................................................................. ton 202 123 173 176 Cucumbers ......................................................................... ton 352 352 (NA) (NA) Green peas ......................................................................... ton 250 251 977 989 Lima beans ......................................................................... ton 561 625 19300 1,970 Snap beans ........................................................................ ton 188 182 645 660 Spinach ............................................................................... ton 196 197 418 426 Sweet corn ......................................................................... ton 78.5 79.7 305 311 Tomatoes ............................................................................ ton 82.7 81.5 235 243
Livestock and livestock products: All beef cattle ...................................................................... cwt 120 115 320 335
Cows ........................................................................... cwt 69.1 62.6 (NA) (NA) Steers and heifers ....................................................... cwt 122 117 (NA) (NA)
Calves ................................................................................. cwt 168 170 464 484 Chickens:
Broilers, live 18 ............................................................. pound 0.545 0.567 1.44 1.5 All Eggs .............................................................................. dozen 0.863 1.15 2.94 2.96 Hogs ................................................................................... cwt 53.1 50.2 161 166 Milk cows 16 ........................................................................ head 1,620 1,360 (NA) (NA) Turkeys, live ....................................................................... pound 0.645 0.51 187 194
(NA) Not available. 1 Unless otherwise noted, these prices are for marketing year average or calendar year average computed by weighing State prices by quantities sold, or by production for those commodities for which the production is sold. 2 Parity prices are for January of the year shown as published in the January issue of Agricultural Prices. 3 Previous year. 4 Average local market price for wool sold excluding incentive payment. 5 Average local market price for mohair sold excluding incentive payment. 6 Crop year begins with bloom in one year and ends with completion of harvest the fol-lowing year. Prices refer to the year harvest begins. 7 Equivalent packinghouse-door returns for California, Oregon (pears only), Washington, and New York (apples only), and prices as sold for other States. 8 Equivalent returns at processing plant-door. 9 Equivalent returns at packinghouse-door. 10 Weighted average of co-op and independent sales. Co-op prices represent pool proceeds excluding returns from non-cranberry products and before deductions for capital stock and other retains. 11 Equivalent per unit returns for bulk fruit at first delivery point. 12 Average price as sold. 13 FOB shipping point when available. Weighted average of prices at points of first sale. 14 Prices are in-shell basis except almonds which are shelled basis. 15 Includes some processing. 16 Simple average of States weighted by estimated Jan. 1 head for U.S. average. 17 Prices for fresh and processing breakdown no longer published to avoid disclosure of individual oper-ations. 18 Live weight equivalent price.
NASS, Environmental, Economics, and Demographics Branch (202) 720–6146.

IX–34 FARM RESOURCES, INCOME, AND EXPENSES
Table 9-29.—Producer prices: Index numbers, by groups of commodities, United States, 2010–2019
[1982=100]
Year Total finished goods Consumer foods
Personal consumption
goods 1
Total intermediate
materials
Unprocessed Goods for
intermediate demand 2
2010 ......... 179.8 182.4 189.1 183.4 212.2 2011 ......... 190.7 193.9 203.3 199.8 249.4 2012 ......... 194.3 199.1 207.5 200.7 241.4 2013 ......... 196.7 203.5 210.3 200.8 246.7 2014 ......... 200.4 212.5 214.7 201.9 249.3 2015 ......... 193.9 209.7 204.4 188.0 189.1 2016 ......... 191.9 204.6 201.3 182.2 173.4 2017 ......... 198.0 207.2 209.2 190.7 190.8 2018 ......... 204.1 207.4 216.8 200.9 200.1 2019 ......... 205.7 211.6 217.5 198.1 185.9
ERS, Food Marketing Branch, (202) 694–5349. Compiled from reports of the U.S. Department of Labor.
Table 9-30.—Prices received by farmers: Index numbers by groups of commodities and parity ratio, United States, 2008–2018 1
[1910–14=100]
Year Food grain Feed grain Cotton Tobacco Oilseed Fruit
& tree nut 2
Vegetable &
melon Other crop
2008 ......... 820 1,010 515 1,409 1,107 1,038 1,076 604 2009 ......... 590 579 416 1,569 971 977 1,153 609 2010 ......... 560 587 601 1,557 944 1,031 1,161 622 2011 ......... 758 902 745 1,497 1,225 1,162 1,224 645 2012 ......... 779 1,010 673 1,576 1,356 1,339 1,040 649 2013 3 ...... 759 943 651 1,760 1,343 1,311 1,330 645
Year
Potato &
dry edible bean
Crop Production
Meat animal Dairy
Poultry &
egg
Livestock Production
Agricultural Production
Parity ratio 4
2009 ......... 761 747 1,075 790 390 857 832 35 2010 ......... 708 690 1,256 1,000 427 1,002 850 35 2011 ......... 867 872 1,540 1,239 422 1,161 1,032 38 2012 ......... 846 933 1,633 1,140 459 1,190 1,083 38 2013 ......... 901 922 1,669 1,230 515 1,260 1,104 38 2014 ......... (3) 805 (3) (3) (3) 1,495 1,113 37 2015 ......... (3) 759 (3) (3) (3) 1,317 1,024 34 2016 ......... (3) 752 (3) (3) (3) 1,096 935 32 2017 ......... (3) 752 (3) (3) (3) 1,160 963 33 2018 ......... (3) 609 (3) (3) (3) 1,095 938 32
1 These indexes are computed using the price estimates of averages for all classes and grades for individual commodities being sold in local farm markets. In computing the group indexes, prices of individual commodities have been compared with 2011 weighted average prices. The resulting ratios are seasonally weighted by average quantities sold for the most recent 5–year period. For example, 2013 indexes use quantities sold for the period 2007–11. Then, the 2011 indexes are used to adjust the 1910–14 base period. 2 Fresh market for noncitrus, and fresh market and processing for citrus. 3 Data series discontinued after 2013. 4 Ratio of Index of Prices Received to the Index of Prices Paid by Farmers for Commodities and Services, Interest, Taxes, and Farm Wage Rates.
NASS, Environmental, Economics, and Demographics Branch, (202) 720–6146.

IX–35 AGRICULTURAL STATISTICS 2019
Table 9-31.—Prices received by farmers: Index numbers by groups of commodities and ratio, United States, 2009–2018 1
(2011=100)
Year Food grain Feed grain Cotton 2 Tobacco 2 Oilseed Fruit
& tree nut 3
Vegetable &
melon Other crop
2009 ......... 78.5 65.1 55.9 99.7 83.5 83.9 102.8 94.1 2010 ......... 74.4 66.0 80.6 98.9 81.2 88.5 103.5 95.9 2011 ......... 100.0 100.0 .................. .................. 100.0 100.0 100.0 100.0 2012 ......... 103.8 110.8 .................. .................. 111.9 112.4 91.9 102.7 2013 ......... 101.5 102.4 .................. .................. 111.6 119.1 103.8 100.5 2014 ......... 90.4 69.1 .................. .................. 98.8 136.3 103.3 94.7 2015 ......... 75.5 62.7 .................. .................. 76.0 138.6 108.8 84.3 2016 ......... 62.1 58.6 .................. .................. 75.0 138.8 103.9 79.1 2017 ......... 65.5 56.5 .................. .................. 75.1 133.8 113.6 81.5 2018 ......... 74.8 58.3 .................. .................. 73.5 132.4 107.3 88.5
Year
Potato 4 &
dry edible bean 5
Crop Production
Meat animal
Dairy product
Poultry &
egg
Livestock Production
Agricultural Production
Parity ratio 6
2009 ......... 88.3 85.7 73.8 63.7 93 69.9 80.6 92 2010 ......... 82.1 87.0 85.7 80.7 101.6 81.6 86.8 96 2011 ......... .................. 100.0 100 100.0 100 100 100 100 2012 ......... .................. 107.0 102.5 92.1 109 103.9 105 100 2013 ......... .................. 105.7 108.5 99.8 123.3 106.8 107 100 2014 ......... .................. 92.3 128.7 119.2 133.1 131.1 107.9 96 2015 ......... .................. 87.0 113.4 85.2 127.8 119.8 99.2 90 2016 ......... .................. 86.2 94.4 81.1 100.4 97.9 90.6 85 2017 ......... .................. 86.8 99.9 87.8 107.5 100.5 93.3 87 2018 ......... .................. 86.8 94.3 80.9 116.3 95.8 90.9 83
1 These indexes are computed using the price estimates of averages for all classes and grades for individual commodities being sold in local farm markets. In computing the group indexes, prices of individual commodities have been compared with 2011 weighted average prices. The resulting ratios are seasonally weighted by average quantities sold for the most recent previous 5–year period. For example, 2013 indexes use quantities sold for the period 2007–11. 2 Included in Other crop index group beginning in 2010. 3 Fresh market for noncitrus, and fresh market and processing for citrus. 4 Included in Vegetable and melon index group beginning 2010. 5 Included in Food grain index group beginning 2010. 6 Ratio of Index of Prices Received (2011=100) to Index of Prices Paid by Farmers for Commodities & Services, Interest, Taxes, and Wage Rates (2007–11=100).
NASS, Environmental, Economics, and Demographics Branch, (202) 720–6146.
Table 9-32.—Prices paid by farmers: Index numbers, by groups of commodities, United States, 2009–2018
(2011=100)
Production indexes 1
Year Production
all commodities
Feed Livestock
& Poultry
Seeds Fertilizer Agricultural chemicals Fuels
Supplies &
Repairs
Autos &
trucks
2010 ......... 87.7 79.7 86.0 93.4 76.8 99.5 78.3 96.1 97.3 2011 ......... 100.0 100.0 100.0 100.0 100.0 100.0 100.0 100.0 100.0 2012 ......... 105.4 115.3 106.6 105.5 101.4 105.4 99.3 102.9 101.9 2013 ......... 107.4 117.5 108.3 110.2 96.7 108.5 98.4 103.8 103.4 2014 ......... 114.1 114.9 153.6 113.5 94.5 109.5 97.9 105.7 104.4 2015 ......... 112.0 106.1 147.1 124.6 87.2 106.5 63.5 105.8 105.5 2016 ......... 104.7 101.4 105.2 121.4 71.8 107.7 55.6 106.0 106.0 2017 ......... 104.5 94.8 107.0 119.9 66.2 104.0 63.2 107.9 106.0 2018 ......... 106.4 99.9 105.8 118.5 66.7 100.7 71.1 111.6 105.5 2019 ......... 84.8 82.5 74.6 90.1 83.8 102.5 63.1 94.3 94.9
Production indexes 1 - continued
Interest Taxes Wage rates
Produc-tion,
interest, taxes,
& wage rates
Family living
Commod-ities,
interest, taxes,
& wage rates 2
Year Farm machinery
Building materials
Farm services Rent
2009 ......... 91.2 95.4 95.3 89.6 94.2 91.9 97.9 86.4 95.4 87.3 2010 ......... 94.3 96.6 98.1 92.6 91.6 95.9 98.9 89.0 96.9 90.0 2011 ......... 100.0 100.0 100.0 100.0 100.0 100 0 100.0 100.0 100.0 100.0 2012 ......... 105.3 102.6 101.8 101.7 99.3 101.0 102.9 104.8 102.1 104.4 2013 ......... 108.1 104.6 105.5 105.6 93.3 103.4 106.3 106.7 103.6 106.3 2014 ......... 112.0 106.9 109.1 114.2 93.1 116.3 108.0 113.1 105.3 112.0 2015 ......... 114.6 107.4 113.7 130.3 98.4 109.9 111.9 111.6 105.4 110.7 2016 ......... 115.4 107.6 115.6 123.8 103.9 114.7 115.9 105.8 106.7 105.9 2017 ......... 117.7 110.4 112.4 123.8 111.9 116.3 119.1 106.3 109.0 106.6 2018 ......... 120.0 116.1 114.5 119.5 117.6 117.1 126.3 108.7 111.7 109.1
1 Annual price index computed using annual weights. Base period (2011=100) are now being published to one decimal digit. 2 Family Living component included.
NASS, Environmental, Economics, and Demographics Branch, (202) 720–6146.

IX–36 FARM RESOURCES, INCOME, AND EXPENSES
Table 9-33.—Prices paid by farmers: Index numbers, by groups of commodities, United States, 2009–2018 1
[1910–14=100]
Year Family living
Production indexes
Production all
commodities Feed
Livestock &
poultry Seed Fertilizer Agricultural
chemicals Fuels Supplies
& repairs
2009 ......... 2,038 1,766 909 1,472 2,960 1,009 921 1,765 1,113 2010 ......... 2,071 1,825 879 1,698 3,070 925 893 2,191 1,134 2011 ......... 2,136 2,082 1,102 1,974 3,286 1,204 898 2,797 1,180 2012 ......... 2,181 2,193 1,270 2,104 3,468 1,221 946 2,779 1,214 2013 ......... 2,213 2,237 1,295 2,137 3,622 1,164 974 2,752 1,225 2014 ......... 2,249 2,376 1,266 3,032 3,729 1,138 983 2,739 1,247 2015 ......... 2,252 2,331 1,168 2,904 4,096 1,050 957 1,775 1,248 2016 ......... 2,280 2,179 1,118 2,076 3,990 864 967 1,556 1,251 2017 ......... 2,328 2,175 1,045 2,113 3,940 797 934 1,768 1,272 2018 ......... 2,385 2,214 1,100 2,089 3,893 803 904 1,988 1,316
Year
Production indexes—Continued
Interest Taxes Wage rates
Produc-tion,
interest, taxes,
& wage rates
Commod-ities,
interest, taxes,
& wage rates 2
Autos &
trucks
Farm machinery
Building materials
Farm services
& rent
2009 ...... 2,917 5,575 2,218 1,976 3,436 5,453 7,007 2,435 2,364 2010 ...... 2,992 5,762 2,248 2,036 3,339 5,694 7,079 2,509 2,434 2011 ...... 3,074 6,111 2,326 2,123 3,646 5,935 7,161 2,820 2,706 2012 ...... 3,131 6,432 2,387 2,162 3,620 5,993 7,366 2,954 2,824 2013 ...... 3,179 6,609 2,434 2,241 3,402 6,137 7,607 3,010 2,877 2014 ...... 3,209 6,845 2,486 2,360 3,394 6,904 7,731 3,190 3,031 2015 ...... 3,243 7,003 2,497 2,554 3,587 6,520 8,015 3,146 2.996 2016 ...... 3,259 7,051 2,504 2,524 3,789 6,808 8,295 2,983 2,866 2017 ...... 3,259 7,190 2,569 2,486 4,082 6,904 8,529 2,996 2,885 2018 ...... 3,242 7,329 2,700 2,474 4,288 6,952 9,047 3,066 2,954
1 Based on Consumer Price Index-Urban of Bureau of Labor Statistics. 2 The index known as the Parity Index is the Index of Prices Paid by Farmers for Commodities and Services, Interest, Taxes, and Wage Rates expressed on the 1910– 14=100 base.
NASS, Environmental, Economics, and Demographics Branch, (202) 720–6146.
Table 9-34.—Grazing fees: Rates for cattle by selected States and regions, 2017–2018
State
Monthly lease rates for private non-irrigated grazing land 1
Animal unit 2 Cow-calf Per head
2017 2018 2017 2018 2017 2018
Dollars Dollars Dollars Dollars Dollars Dollars per month per month per month per month per month per month
Arizona .......... 9.50 10.00 (S) (S) (S) (S) California ....... 20.60 22.40 28.00 29.00 19.50 21.00 Colorado ........ 19.00 19.50 23.00 23.00 18.00 18.50 Idaho .............. 18.00 18.00 22.00 22.50 18.50 19.00 Kansas ........... 21.00 21.00 27.00 27.00 24.50 22.00 Montana ......... 24.50 24.50 27.00 26.00 24.00 24.50 Nebraska ....... 39.80 46.00 45.00 52.00 39.00 35.00 Nevada .......... 9.90 9.50 18.10 (S) 15.50 15.20 New Mexico ... 15.50 16.00 (S) (S) 16.00 16.50 North Dakota 19.00 24.50 23.00 32.00 19.00 19.00 Oklahoma ...... 12.50 12.50 (S) (S) 11.50 13.00 Oregon ........... 16.50 17.50 19.50 21.00 19.50 21.50 South Dakota 31.50 31.50 39.00 40.50 35.00 34.00 Texas ............. 12.50 12.50 (S) (S) 11.50 14.50 Utah ............... 16.50 17.00 20.00 19.00 18.50 18.50 Washington .... 14.00 14.50 16.50 16.50 16.00 16.00 Wyoming ........ 21.50 22.00 23.50 24.00 22.00 23.00
17-State 3 ....... 20.20 21.30 23.70 25.20 20.60 21.00 16-State 4 ....... 22.60 24.00 26.40 28.40 23.40 23.00 11-State 5 ....... 19.30 19.70 22.80 22.80 19.80 20.50 9-State 6 ........ 20.50 21.70 23.80 25.70 20.70 21.00
(S) Insufficient number of reports to establish an estimate. 1 The average rates are estimates (rates over $10.00 are rounded to the nearest dime) based on survey indications of monthly lease rates for private, non-irrigated grazing land from the January Cattle Survey. 2 Includes animal unit plus cow-calf rates. Cow-calf rate converted to animal unit (AUM) using (1 aum=cow-calf *0.833). 3 Seventeen Western States: All States listed. 4 Sixteen Western States: All States, except Texas. 5 Eleven Western States: Arizona, California, Colorado, Idaho, Montana, Nevada , New Mexico, Oregon, Utah, Washington and Wyoming. 6 Nine Great Plains States: Colorado, Kansas, Nebraska, New Mexico, North Dakota, Okla-homa, South Dakota, Texas and Wyoming.
NASS, Environmental, Economics, and Demographics Branch, (202) 720–6146.

IX–37 AGRICULTURAL STATISTICS 2019
Table 9-35.—Agricultural commodities: Support prices per unit, United States, 2015–2019 1
Commodity Unit 2015 2016 2017 2018 2019
Dollars Dollars Dollars Dollars Dollars Basic commodities:
Corn: Target/reference price ............... Bushel 3 .70 3 .70 3 .70 3 .70 3 .70 Loan rate ................................... do 1 .95 1 .95 1 .95 1 .95 2 .20
Cotton: American upland:
Loan rate ............................ do 52 .00 52 .00 49 .49 52 .00 52 .00 Extra-long staple:
Loan rate ............................ do 79 .77 79 .77 79 .77 79 .77 95 .00 Peanuts:
Target/reference price ............... Short tons 535 .00 535 .00 535 .00 535 .00 535 .00 Loan rate ................................... do 355 .00 355 .00 355 .00 355 .00 355 .00
Rice: Target/reference price 2 ............. Cwt 14 .00 14 .00 14 .00 14 .00 14 .00 Loan rate ................................... do 6 .50 6 .50 6 .50 6 .50 7 .00
Wheat: Target/reference price ............... Bushel 5 .50 5 .50 5 .50 5 .50 5 .50 Loan rate ................................... do 2 .94 2 .94 2 .94 2 .94 3 .38
Barley: Target/reference price ............... Bushel 4 .95 4 .95 4 .95 4 .95 4 .95 Loan rate ................................... do 1 .95 1 .95 1 .95 1 .95 2 .50
Sorghum grain: Target/reference price ............... Cwt 7 .05 7 .05 7 .05 7 .05 7 .05 Loan rate ................................... do 3 .48 3 .48 3 .48 3 .48 2 .20
Oats: Target/reference price ............... Bushel 2 .40 2 .40 2 .40 2 .40 2 .40 Loan rate ................................... do 1 .39 1 .39 1 .39 1 .39 2 .00
Other oilseeds: 3 Target/reference price ............... Cwt 20 .15 20 .15 20 .15 20 .15 20 .15 Loan rate ................................... do 10 .09 10 .09 10 .09 10 .09 10 .09
Soybeans: Target/reference price ............... Bushel 8 .40 8 .40 8 .40 8 .40 8 .40 Loan rate ................................... do 5 .00 5 .00 5 .00 5 .00 6 .20
Dry Peas: Target/reference price ............... Cwt 11 .00 11 .00 11 .00 11 .00 11 .00 Loan rate ................................... do 5 .40 5 .40 5 .40 5 .40 6 .15
Small chick peas: Target/reference price ............... Cwt 19 .04 19 .04 19 .04 19 .04 19 .04 Loan rate ................................... do 7 .43 7 .43 7 .43 7 .43 10 .00
Large chick peas: Target/reference price ............... Cwt 21 .54 21 .54 21 .54 21 .54 21 .54 Loan rate ................................... do 11 .28 11 .28 11 .28 11 .28 14 .00
Lentils: Target/reference price ............... do 19 .97 19 .97 19 .97 19 .97 19 .97 Loan rate ................................... do 11 .28 11 .28 11 .28 11 .28 13 .00
Sugar, raw cane: Loan rate ................................... Pound 0 .188 0 .188 0 .188 0 .188 0 .1975
Sugar, refined beet: Loan rate ................................... do 0 .241 0 .241 0 .241 0 .241 0 .2538
Honey, extracted: Loan rate ................................... Pound 0 .69 0 .69 0 .69 0 .69 0 .69
Mohair: Loan rate ................................... do 4 .20 4 .20 4 .20 4 .20 4 .20
Wool, graded: Loan rate ................................... Pound 1 .15 1 .15 1 .15 1 .15 1 .15
Wool, nongraded: Loan rate ................................... Pound 0 .40 0 .40 0 .40 0 .40 0 .40
1 National averages during the marketing years for the individual crops. 2 Target and reference price shown is for long grain and medium (including short) grain rice. The reference price for temporate japonica rice is $16.10 per Cwt beginning with crop year 2014 and $17.30 per Cwt beginning with crop year 2019. The loan rate for temperate japonica is the same as for other types of rice, at 7.00 per Cwt. 3 Other oilseeds are flaxseed, sunflower seed (oil and other types), safflower, rapeseed, canola, mustard seed, crambe, and sesame seed.
FPAC-BC, Commodity Analysis Branch.

IX–38 FARM RESOURCES, INCOME, AND EXPENSES
Table 9-36.—Farm income: Cash receipts by commodity groups and selected commodities, United States, 2014–2018 1
Commodity 2014 2015 2016 2017 2018
Thousand dollars
All commodities ....................... 423,970,804 377,431,136 358,481,892 370,427,404 372,741,074
Animals and products .............. 212,290,239 189,515,589 162,730,663 175,559,718 176,529,725 Cattle and calves ................. 81,076,720 78,252,807 63,691,327 66,936,726 67,105,197 Hogs ..................................... 26,489,394 20,552,958 19,037,752 21,038,034 21,098,058 Sheep and lambs ................. (NA) (NA) (NA) (NA) (NA) Dairy products ...................... 49,351,199 35,716,849 34,546,316 37,940,662 35,244,314 Broilers ................................. 32,728,234 28,716,398 25,935,852 30,232,203 31,746,230 Farm chickens ...................... 96,840 104,828 87,949 46,999 49,364 Chicken eggs ....................... 10,342,687 13,762,519 6,591,359 7,635,001 10,586,262 Turkeys ................................ 5,304,501 5,707,928 6,184,247 4,873,677 3,875,131 Miscellaneous animals and
products ............................ 6,900,663 6,701,302 6,655,861 6,856,416 6,825,169
Crops ....................................... 211,680,565 187,915,547 195,751,229 194,867,686 196,211,349 Food grains .......................... 16,058,149 12,296,220 11,288,344 11,201,209 12,149,091 Feed crops ........................... 65,888,944 56,930,107 55,443,315 53,920,441 57,687,345 Cotton ................................... 7,111,320 4,756,100 5,496,889 7,573,587 7,821,649 Tobacco ............................... 1,728,991 1,606,619 1,337,542 1,378,695 1,246,889 Oil crops ............................... 42,624,290 35,518,959 44,042,747 41,094,011 39,609,416 Vegetables ........................... 18,951,858 20,358,992 19,542,550 20,494,457 18,539,199 Fruits/nuts ............................ 32,248,510 28,447,492 29,698,085 30,588,949 29,030,320 All other crops ...................... 27,068,502 28,001,057 28,901,756 28,616,339 30,127,440
Data as of February 5, 2020. (NA) Not available 1 USDA estimates and publishes individual cash receipt values only for major commodities and major producing States. The U.S. receipts for individual commodities, computed as the sum of the reported States, may understate the value of sales for some commodities, with the balance included in the appropriate cat-egory labeled ‘‘other‘‘ or ‘‘miscellaneous‘‘. The degree of underestimation in some of the minor commodities can be sub-stantial.
ERS, Farm Income Team, (202) 694–5344. [email protected]. http://www.ers.usda.gov/data-products/ farm-income-and-wealth-statistics.aspx.
Table 9-37.—Farm income: United States, 2014–2018
Item 2014 2015 2016 2017 2018
Thousand dollars
Total gross farm income .......... 483,287,883 440,793,623 412,252,228 425,410,799 427,588,978 Value of production ................. 473,521,038 429,989,137 399,272,552 413,879,188 413,919,968 Crops ....................................... 206,311,808 184,329,250 189,302,127 187,926,642 188,574,697 Livestock and product ............. 214,340,139 194,143,948 165,429,595 176,896,045 177,519,121 Services and forestry ............... 52,869,092 51,515,939 44,540,830 49,056,501 47,826,150 Direct government payments .. 9,766,845 10,804,486 12,979,677 11,531,611 13,669,010 Total production expenses 1 .... 391,049,856 359,207,751 349,989,196 350,350,914 343,812,385 Net farm income ...................... 92,238,027 81,585,872 62,263,032 75,059,885 83,776,593 Gross cash income .................. 470,303,009 422,611,802 399,352,723 413,164,535 415,534,849 Cash expenses ........................ 338,997,507 315,828,783 303,783,582 311,891,580 311,309,474 Net cash income ...................... 131,305,503 106,783,019 95,569,141 101,272,955 104,225,375
Data as of February 5, 2020. 1 Includes expenses associated with operator dwellings. ERS, Farm Income Team, (202) 694–5344. [email protected]. http://www.ers.usda.gov/data-products/
farm-income-and-wealth-statistics.aspx.

IX–39 AGRICULTURAL STATISTICS 2019
Table 9-38.—Expenses: Farm production expenses, United States, 2015–2018
Item 2015 2016 2017 2018
Thousand dollars
Total production expenses 1 .................. 359,207,751 349,989,196 350,350,914 343,812,385
Feed purchased ..................................... 58,538,814 55,636,890 54,538,086 53,837,596 Livestock and poultry purchased ........... 30,277,335 22,060,469 27,413,658 29,069,564 Seed purchased ..................................... 21,323,225 21,823,770 22,515,616 21,915,200 Fertilizer and lime .................................. 25,544,606 23,541,108 22,032,717 23,234,502 Pesticides ............................................... 14,629,651 15,230,869 15,716,091 15,415,784 Fuel and oil ............................................ 13,166,472 12,155,180 12,761,072 13,187,914 Electricity ................................................ 5,722,547 5,585,083 5,805,753 6,052,989 Other 2 .................................................... 66,511,167 65,592,758 67,236,565 67,274,025 Interest 1 ................................................. 16,382,490 17,337,685 18,567,706 20,637,498 Contract and hired labor expenses ....... 32,102,649 34,425,216 36,266,282 34,148,554 Net rent to landlords 3 ............................ 20,078,115 19,470,908 17,640,729 15,466,212 Capital consumption 1 ............................ 41,413,697 44,498,283 36,382,881 30,015,271 Property taxes 1 ..................................... 13,516,985 12,630,978 13,473,759 13,557,276
1 Includes expenses associated with operator dwellings. 2 Includes repair and maintenance, machine hire and custom work, marketing, storage and transportation, insurance premiums, and miscellaneous other expenses. 3 Data includes land-lord capital consumption.
ERS, Farm Income Team, (202) 694-5344. [email protected]. http://www.ers.usda.gov/data-products/farm- income-and-wealth-statistics.aspx. Data as of February 5, 2020.
Table 9-39.—Principal farm operator household finances, United States, 2016–2019
Item 2016 2017 2018 2019 1
Number of family farms ......................... 2,027,269 1,989,574 1,979,368 1,979,368
Income, median dollars per household
Farm income .......................................... (940) (1,035) (1,735) (1,383) Off-farm income ..................................... 66,468 67,500 65,841 67,314
Earned income ............................... 40,000 43,225 37,500 38,537 Unearned income ........................... 24,962 19,000 20,404 20,778
Household income ................................. 76,250 74,707 72,481 76,810 U.S. household income 2 ....................... 59,039 61,372 63,179 (NA)
Income, average dollars per household
Farm income .......................................... 24,731 21,842 18,425 24,700 Off-farm income ..................................... 93,187 89,747 93,786 96,012
Earned income ............................... 65,680 61,359 65,596 67,119 Unearned income ........................... 27,506 28,387 28,190 28,892
Household income ................................. 117,918 111,589 112,210 120,712 U.S. household income 2 ....................... 83,143 86,220 90,021 (NA)
(NA) Not available. 1Forecast. 2 Estimates of U.S. Household Income are produced by the U.S. Census Bureau, Current Population Reports, p60-263, Income and Poverty in the United States: 2018 (and earlier editions).
ERS, Farm Economy Branch, [email protected]. Source: USDA, Economic Research Service and National Ag-ricultural Statistics Service, 2016-2018 Agricultural Resource Management Survey. Data as of February 5, 2020.

X–1
CHAPTER X
INSURANCE, CREDIT, AND COOPERATIVES
The statistics in this chapter deal with insurance, agricultural credit and farm cooperatives. Some of the series were developed in connection with research activities of the Department, while others, such as data from agricultural credit agencies, are primarily records of operations.
Table 10-1.—Crop losses: Average percentage of indemnities attributed to specific hazards, by crops, 1948–2019
Crop Year
Drought heat (ex-
cess)
Hail
Precip. (excess
poor drain-age)
Frost freeze, (other cold
damage)
Flood
Cyclone, tornado,
wind, hot wind
In-sects
Dis-ease
De-cline
in price
Other
Percent
Adj. gross revenue ............. 2004-2014 9 10 9 22 0 2 0 0 48 0
Adj. gross revenue-lite ....... 2004-2014 8 10 10 31 1 1 0 1 39 0
Alfalfa seed ........... 2002-2019 35 8 18 17 0 15 6 0 0 0 All other
citrus trees ........ 2001-2018 0 0 4 9 0 25 0 0 0 63 All other
grapefruit ........... 2003-2009 0 0 0 11 0 89 0 0 0 0 Almonds ................ 1981-2019 8 3 49 35 0 4 0 0 0 0 Annual Forage ...... 2014-2019 0 0 0 0 0 0 0 0 0 0 Apiculture .............. 2009-2019 0 0 0 0 0 0 0 0 0 0 Apples ................... 1963-2019 7 28 6 55 0 2 0 0 0 1 Avocado trees ....... 1996-2018 0 0 6 1 0 94 0 0 0 0 Avocados .............. 1998-2019 52 0 1 24 0 16 0 0 1 6 Banana ................. 2012-2013 100 0 0 0 0 0 0 0 0 0 Barley .................... 1956-2019 41 16 31 5 0 2 2 2 0 0 Blueberries ............ 1995-2019 5 4 11 70 0 4 1 1 0 4 Buckwheat ............ 2010-2019 38 30 21 9 0 2 0 0 0 0 Burley tobacco ...... 1997-2019 37 3 46 2 6 2 0 3 0 1 Cabbage ............... 1999-2019 21 1 40 24 1 5 3 3 0 2 Camelina ............... 2012-2015 100 0 0 0 0 0 0 0 0 0 Canning beans ..... 1988-1997 44 5 26 13 0 3 1 6 0 1 Canning peaches .. 1986-1987 4 0 92 0 0 0 0 0 0 4 Canola .................. 1995-2019 22 9 53 11 0 3 1 1 1 0 Carambola trees ... 2001-2018 0 0 17 0 0 83 0 0 0 0 Cherries ................ 1963-2019 14 3 38 33 0 2 0 0 8 0 Chile peppers ....... 2001-2016 1 26 11 19 6 22 9 5 0 1 Cigar:
binder tobacco .. 1997-2019 11 18 26 3 0 2 0 39 0 1 filler tobacco ...... 1998-2019 88 0 9 0 0 0 0 3 0 0 wrapper tobacco 1997-2018 0 0 44 1 0 0 0 56 0 0
Citrus .................... 1952-1997 2 1 1 94 0 2 0 0 0 0 Citrus I .................. 1998-2012 0 0 0 6 0 94 0 0 0 0 Citrus II ................. 2000-2013 0 0 0 25 0 74 0 0 0 0 Citrus III ................ 2005-2013 0 0 0 12 0 88 0 0 0 0 Citrus IV ................ 1998-2011 0 6 0 6 0 88 0 0 0 0 Citrus V ................. 1999-2013 0 4 0 35 0 61 0 0 0 0 Citrus VI ................ 2005-2006 0 0 0 0 0 100 0 0 0 0 Citrus VII ............... 1998-2013 0 3 0 14 0 83 0 0 0 0 Citrus VIII .............. 2009-2012 0 13 0 87 0 0 0 0 0 0 Citrus tree ............. 1990-1997 0 0 0 100 0 0 0 0 0 0 Citrus trees ........... 1984-1986 0 0 0 100 0 0 0 0 0 0 Citrus trees I ......... 2008-2010 0 0 66 0 0 34 0 0 0 0 Citrus trees II ........ 2008-2010 0 0 100 0 0 0 0 0 0 0 Citrus trees III ....... 2010 0 0 100 0 0 0 0 0 0 0 Citrus trees IV ....... 2004-2010 0 0 100 0 0 0 0 0 0 0 Citrus trees V ........ 2010 0 0 100 0 0 0 0 0 0 0 Clams .................... 2001-2019 0 0 0 26 0 8 0 2 0 64 Clary sage ............ 2016-2019 5 1 75 3 0 16 0 0 0 0 Coffee ................... 2009-2019 45 0 13 0 0 17 4 0 0 21 Corn ...................... 1948-2019 47 5 30 3 2 2 0 1 9 0 Cotton ................... 1948-2019 53 12 14 4 1 13 1 0 2 0 Cotton
ex long staple .... 1984-2019 81 3 5 7 1 2 1 0 0 0 Crambe ................. 1999-2003 31 8 35 10 0 11 0 5 0 0 Cranberries ........... 1984-2019 14 16 19 39 2 2 3 1 0 5 Cucumbers ........... 2014-2019 11 2 79 4 0 4 0 1 0 0 Cultivated wild rice 1999-2019 42 10 8 8 1 15 1 1 0 14 Dark air tobacco ... 1997-2019 14 2 71 0 2 3 0 6 0 2 Dry beans ............. 1948-2019 16 20 45 13 0 2 0 2 1 0 Dry peas ............... 1963-2019 45 23 23 4 0 1 0 1 3 0
See note(s) at end of table.

X–2 INSURANCE, CREDIT, AND COOPERATIVES
Table 10-1.—Crop losses: Average percentage of indemnities attributed to specific hazards, by crops, 1948–2019—Continued
Crop Year
Drought heat (ex-
cess)
Hail
Precip. (excess
poor drain-age)
Frost freeze, (other cold
damage)
Flood
Cyclone, tornado,
wind, hot wind
In-sects
Dis-ease
De-cline
in price
Other
Percent
Early & midseason oranges ............. 1998-2017 0 7 23 37 0 32 0 0 0 0
Figs ....................... 1988-2019 22 0 41 35 0 2 0 0 0 0 Fire cured
tobacco .............. 1997-2019 14 6 58 2 5 5 0 4 0 6 Flax ....................... 1948-2019 38 8 43 8 0 2 1 1 0 0 Flue cured
tobacco .............. 1997-2019 30 4 30 2 0 20 0 13 0 0 Forage production 1979-2019 67 2 7 22 0 0 1 0 0 0 Forage seeding ..... 1978-2019 26 0 20 51 1 2 0 0 0 0 Fresh:
Apricots ............. 1997-2019 8 11 26 52 0 3 0 0 0 0 Freestone
peaches ......... 1997-2019 13 18 20 46 0 2 0 0 0 0 Market beans .... 2001-2019 3 0 68 13 0 9 0 7 0 0 Market sweet
corn ................ 1985-2019 12 2 34 27 0 17 3 1 0 2 Market tomatoes 1984-2019 7 4 47 27 0 8 1 5 0 0 Nectarines ......... 1997-2019 7 27 23 42 0 1 0 0 0 0 Plum .................. 1990-1997 1 32 41 25 0 0 0 0 0 0
Grain sorghum ...... 1959-2019 74 3 11 4 1 4 1 0 2 0 Grapefruit .............. 1997-2019 6 1 4 10 0 79 0 0 0 0 Grapefruit trees ..... 2001-2018 0 0 7 5 0 14 0 0 0 74 Grapes .................. 1967-2019 21 5 15 53 0 2 0 0 0 4 Grass Seed ........... 2012-2019 54 2 42 2 0 0 0 0 0 0 Green peas ........... 1962-2019 44 4 39 9 0 2 0 1 0 0 Hybrid corn seed .. 1983-2019 57 5 21 2 2 11 0 1 0 0 Hybrid seed rice ... 2016-2019 76 0 24 0 0 0 0 0 0 0 Hybrid sorghum
seed .................. 1988-2019 25 20 8 18 0 28 0 0 0 0 Hybrid sweet corn
seed .................. 2018-2019 64 0 0 33 0 3 0 0 0 0 Income protection
corn ................... 1996-1996 3 0 93 3 0 0 0 0 0 0 Income protection
cotton ................ 1996-1996 96 0 4 0 0 0 0 0 0 0 Income protection
wheat ................. 1996-1996 9 0 90 0 1 0 0 0 0 0 Late oranges ......... 1998-2017 0 11 24 24 0 41 0 0 0 0 Lemon trees .......... 2005-2018 0 0 0 0 0 100 0 0 0 0 Lemons ................. 1997-2019 17 2 2 75 0 4 0 0 0 0 Lime trees ............. 1998-2005 0 0 0 0 0 0 0 0 0 100 Macadamia nuts ... 1996-2019 63 0 7 7 0 10 5 0 0 7 Macadamia trees .. 2005-2012 0 0 0 0 0 82 0 0 0 18 Mandarins ............. 1997-2014 17 2 1 77 0 4 0 0 0 0 Mandarins/
tangerines ......... 2015-2019 54 2 5 30 0 9 0 0 0 0 Mango trees .......... 1997-2018 0 0 8 2 0 90 0 0 0 0 Maryland tobacco 1997-2019 68 9 6 4 0 6 0 7 0 0 Millet ..................... 1996-2019 64 20 12 2 0 1 0 0 0 0 Minneola tangelos 1998-2014 11 0 5 80 0 3 0 0 0 0 Mint ....................... 2001-2019 35 4 24 31 1 2 1 2 0 0 Mustard ................. 1999-2019 50 20 21 6 0 3 1 0 0 0 Navel oranges ...... 1998-2014 19 2 2 76 0 1 0 0 1 0 Nursery (container) 1987-1999 9 1 18 19 11 21 8 14 0 0 Nursery (fg&c) ...... 2001-2019 1 6 4 12 4 70 3 1 0 0 Oats ...................... 1956-2019 56 10 25 5 0 2 1 1 0 0 Olives .................... 2012-2019 23 2 11 58 0 5 0 0 0 0 Onions .................. 1988-2019 21 7 45 10 1 2 0 13 0 0 Orange trees ......... 1996-2018 0 0 6 5 0 31 0 0 0 58 Oranges ................ 1958-2019 16 1 3 18 0 63 0 0 0 0 Orlando tangelos .. 1998-2012 0 0 0 100 0 0 0 0 0 0 Papaya .................. 2007-2018 0 0 16 0 0 10 4 45 0 25 Papaya tree .......... 2014-2018 0 0 20 3 0 24 0 22 0 31 Pastures/Range-
land forage ........ 2007-2019 0 0 0 0 0 0 0 0 0 0 Peaches ................ 1957-2019 2 12 2 79 0 0 0 0 0 4 Peanuts ................. 1962-2019 66 1 20 3 0 4 0 5 0 1 Pears .................... 1989-2019 18 22 12 44 0 2 0 1 0 0 Pecans .................. 1998-2019 19 5 14 21 0 37 0 1 2 0 Peppers ................ 1984-2019 1 4 62 20 0 11 0 2 0 0 Pistachios ............. 2012-2019 78 1 15 5 0 2 0 0 0 0 Plums .................... 1998-2019 14 23 19 41 0 3 0 0 0 0 Popcorn ................ 1984-2019 38 20 26 6 2 3 0 1 3 0 Potatoes ................ 1962-2019 24 5 42 16 1 2 0 10 0 0
See note(s) at end of table.

X–3 AGRICULTURAL STATISTICS 2020
Table 10-1.—Crop losses: Average percentage of indemnities attributed to specific hazards, by crops, 1948–2019—Continued
Crop Year
Drought heat (ex-
cess)
Hail
Precip. (excess
poor drain-age)
Frost freeze, (other cold
damage)
Flood
Cyclone, tornado,
wind, hot wind
In-sects
Dis-ease
De-cline
in price
Other
Percent
Prevented planting endorse ............. 1990-1994 31 0 11 5 53 0 0 0 0 0
Prevented planting 1982-1985 0 0 97 0 3 0 0 0 0 0 Prevented planting
endorse ............. 1986 0 0 24 0 76 0 0 0 0 0 Processing:
Apricots ............. 1997-2019 11 5 35 45 0 4 0 0 0 0 Beans ................ 1998-2019 43 7 41 5 0 2 0 2 0 0 Cling peaches ... 1997-2019 19 13 32 34 0 2 0 0 0 0 Cucumbers ........ 2001-2005 34 3 49 3 0 1 2 6 0 0 Freestone .......... 1998-2019 19 6 30 45 0 1 0 0 0 0
Prunes .................. 1986-2019 38 2 32 19 0 8 0 0 0 0 Pumpkins .............. 2009-2019 10 0 57 32 0 0 0 1 1 0 Raisins .................. 1961-2018 0 0 100 0 0 0 0 0 0 0 Rangeland ............ 1999-2008 0 0 0 0 0 0 0 0 0 100 Raspberry and
blackberry .......... 2002-2006 10 0 0 62 0 28 0 0 0 0 Revenue coverage
corn ................... 1996-1996 5 35 47 4 7 1 0 0 0 0 Revenue coverage
soybeans ........... 1996-1996 7 22 51 5 12 0 0 2 0 0 Rice ....................... 1960-2019 22 0 60 3 4 6 0 2 3 0 Rio red & star ruby 1998-2017 0 5 31 33 0 30 0 0 0 0 Ruby red grapefruit 1998-2017 0 12 36 17 0 35 0 0 0 0 Rye ....................... 1980-2019 34 13 33 17 0 1 0 0 0 0 Safflower ............... 1964-2019 54 5 18 13 0 7 2 2 0 0 Sesame ................. 2011-2019 53 2 36 3 1 5 0 0 0 1 Silage sorghum ..... 2005-2019 75 7 2 3 0 12 0 0 0 0 Soybeans .............. 1955-2019 40 6 37 4 3 1 0 0 8 0 Special citrus ........ 1992-1994 7 13 0 80 0 0 0 0 0 0 Stonefruit .............. 1988-1996 3 12 59 19 0 2 0 0 0 4 Strawberries .......... 2001-2015 22 1 33 24 0 0 3 17 0 0 Sugar beets .......... 1965-2019 10 4 49 25 1 5 1 6 0 0 Sugarcane ............ 1967-2019 26 0 17 37 1 8 3 8 0 1 Sunflowers ............ 1976-2019 25 8 49 8 0 3 1 3 1 2 Sweet corn ............ 1978-2019 47 2 29 16 0 4 0 1 0 1 Sweet oranges ...... 1998-2014 20 0 5 72 0 4 0 0 0 0 Sweet potatoes ..... 2011-2019 1 0 99 0 0 0 0 0 0 0 Sweet potatoes ..... 1998-2009 36 0 45 0 0 15 3 0 0 0 Table grapes ......... 1984-2019 41 7 28 22 0 1 0 1 0 0 Tangelos ............... 1997-2019 31 2 8 34 0 26 0 0 0 0 Tangors ................. 2014-2019 0 0 0 1 0 99 0 0 0 0 Tobacco ................ 1948-1996 32 10 32 2 1 11 0 11 0 1 Tomatoes .............. 1963-2019 34 6 38 9 1 1 3 8 0 0 Triticale ................. 2018-2019 24 15 5 53 0 3 0 0 0 0 Tung Nuts ............. 1965-1970 0 0 0 100 0 0 0 0 0 0 Valencia oranges .. 1998-2014 18 2 2 74 0 3 0 0 0 0 Walnuts ................. 1984-2019 27 6 33 28 1 4 0 0 0 0 Watermelons ......... 1999-1999 22 2 11 5 0 7 0 48 0 6 Wheat ................... 1948-2019 43 12 23 13 0 3 0 2 3 0 Whole Farm Rev-
enue Protection 2015-2019 19 7 18 13 1 5 0 1 33 0 Winter squash ....... 1999-2005 35 4 54 1 5 0 0 0 0 2
GRP crops do not have any specific cause of loss. RMA, Requirements, Analysis and Validation Branch, (816) 926–7910.

X–4 INSURANCE, CREDIT, AND COOPERATIVES
Table 10-2.—Crop insurance programs: Coverage, amount of premiums and indemnities, by crops, United States, 2017–2019
Commodity and year
Coverage
Amount of premium
Indemnities
County programs
Insured units
Area insured
Maximum insured
production Number Area in-
demnified Amount
1,000 1,000 1,000 1,000 1,000 Number Number acres dollars dollars acres dollars
Alfalfa seed: 2017 ................. 32 711 52 76,116 5,126 312 18 17,394 2018 ................. 35 659 43 54,257 3,969 273 12 8,672 2019 ................. 35 399 25 33,697 2,124 17 2 469
All other citrus trees: 2017 ................. 28 292 0 36,871 523 1 0 2 2018 ................. 28 231 0 36,047 488 45 0 1,871 2019 ................. 28 228 0 36,777 498 0 0 0
All other grapefruit: 2017 ................. 3 0 0 0 0 0 0 0
Almonds: 2017 ................. 32 6,424 757 2,577,514 95,471 623 44 36,404 2018 ................. 32 6,729 787 2,132,999 64,965 1,049 76 51,712 2019 ................. 32 7,252 837 2,148,677 61,947 658 36 20,406
Annual Forage: 2017 ................. 744 2,968 481 134,131 33,843 1,455 0 41,000 2018 ................. 744 3,963 646 151,485 37,106 2,899 0 65,037 2019 ................. 744 4,545 679 171,425 42,594 2,207 0 28,907
Apiculture: 2017 ................. 2,059 9,901 0 115,519 25,870 5,673 0 29,928 2018 ................. 3,069 7,706 0 166,403 35,815 4,187 0 30,628 2019 ................. 3,069 9,986 0 223,377 49,371 3,650 0 20,761
Apples: 2017 ................. 600 7,093 225 1,277,810 119,894 1,754 32 92,521 2018 ................. 600 7,434 229 1,402,830 123,343 1,446 23 75,356 2019 ................. 612 7,566 230 1,432,848 113,771 708 8 26,919
Avocado trees: 2017 ................. 1 153 0 30,708 1,111 0 0 0 2018 ................. 1 129 0 24,734 806 113 0 7,877 2019 ................. 1 116 0 29,526 1,042 0 0 0
Avocados: 2017 ................. 7 1,012 34 82,984 5,550 338 1 13,104 2018 ................. 16 1,026 33 80,362 5,092 179 4 5,064 2019 ................. 16 974 34 87,208 5,692 373 11 20,560
Banana tree: 2017 ................. 4 0 0 0 0 0 0 0 2018 ................. 4 2 0 508 14 0 0 0 2019 ................. 4 2 0 537 15 0 0 0
Bananas: 2017 ................. 4 2 0 764 4 0 0 0 2018 ................. 4 4 0 1,867 41 0 0 0 2019 ................. 4 4 0 1,870 41 0 0 0
Barley: 2017 ................. 5,379 13,262 1,679 314,923 39,464 3,876 416 29,921 2018 ................. 5,379 12,029 1,586 295,185 36,160 2,175 237 20,102 2019 ................. 5,391 12,790 1,780 319,382 39,136 2,080 221 17,339
Blueberries: 2017 ................. 169 1,287 67 222,476 13,781 619 18 40,308 2018 ................. 171 1,372 69 247,212 16,455 536 17 35,283 2019 ................. 171 1,557 70 289,466 22,169 370 10 21,187
Buckwheat: 2017 ................. 32 86 9 1,399 262 10 1 77 2018 ................. 33 120 10 1,748 298 37 3 297 2019 ................. 33 121 11 1,813 317 13 1 73
Burley tobacco: 2017 ................. 497 5,810 69 179,551 35,347 3,555 49 78,449 2018 ................. 497 4,370 51 132,360 23,121 2,651 35 54,792 2019 ................. 497 3,724 42 113,355 25,071 545 6 10,955
Cabbage: 2017 ................. 31 341 15 32,068 2,210 62 2 1,797 2018 ................. 31 314 13 31,065 2,165 80 2 2,468 2019 ................. 31 342 13 33,590 2,498 44 1 1,481
Camelina: 2017 ................. 52 2 0 16 3 0 0 0 2018 ................. 52 0 0 0 0 0 0 0 2019 ................. 52 0 0 0 0 0 0 0
Canola: 2017 ................. 1,005 13,780 1,990 400,010 80,867 5,034 684 58,027 2018 ................. 1,005 12,304 1,891 421,000 84,009 2,486 320 28,481 2019 ................. 1,011 12,996 1,976 426,045 76,034 2,732 389 42,719
See footnote(s) at end of table.

X–5 AGRICULTURAL STATISTICS 2020
Table 10-2.—Crop insurance programs: Coverage, amount of premiums and indemnities, by crops, United States, 2017–2019—Continued
Commodity and year
Coverage
Amount of premium
Indemnities
County pro-
grams
Insured units
Area insured
Maximum insured
production Number Area in-
demnified Amount
1,000 1,000 1,000 1,000 1,000 Number Number acres dollars dollars acres dollars
Carambola trees: 2017 ................ 2 10 0 1,834 65 0 0 0 2018 ................ 2 9 0 2,772 101 5 0 87 2019 ................ 2 10 0 3,232 113 0 0 0
Cattle: 2017 ................ 20 38 0 17,432 683 3 0 11 2018 ................ 20 9 0 964 42 5 0 32 2019 ................ 20 17 0 1,314 42 4 0 24
Cherries: 2017 ................ 64 3,428 84 487,051 56,097 970 22 43,691 2018 ................ 64 3,521 85 495,677 61,345 1,178 31 59,074 2019 ................ 64 3,531 86 505,657 66,393 1,253 29 82,508
Chile Peppers: 2017 ................ 3 17 2 739 29 0 0 0 2018 ................ 3 11 1 457 14 0 0 0 2019 ................ 3 9 1 354 11 0 0 0
Cigar binder tobacco: 2017 ................ 21 355 3 19,093 5,213 82 1 2,634 2018 ................ 21 389 3 25,294 7,162 70 0 1,923 2019 ................ 21 413 4 29,753 8,815 13 0 450
Cigar filler tobacco: 2017 ................ 3 11 0 291 5 0 0 0 2018 ................ 3 11 0 331 5 1 0 4 2019 ................ 3 46 0 484 13 12 0 38
Cigar wrapper tobacco: 2017 ................ 5 10 0 1,393 179 4 0 306 2018 ................ 5 13 0 1,387 175 3 0 24 2019 ................ 5 13 0 1,350 181 6 0 0
Clams: 2017 ................ 9 66 0 14,062 367 0 0 0 2018 ................ 9 61 0 17,652 485 23 0 1,589 2019 ................ 9 116 0 17,936 476 6 0 231
Clary sage: 2017 ................ 4 199 22 15,356 1,671 77 7 1,670 2018 ................ 4 154 13 8,172 883 26 1 216 2019 ................ 4 59 6 4,178 421 28 3 377
Coffee: 2017 ................ 4 105 4 16,815 413 24 0 129 2018 ................ 4 125 4 19,699 430 40 1 1,048 2019 ................ 4 118 4 19,783 398 3 0 25
Coffee tree: 2017 ................ 4 67 0 20,944 85 0 0 0 2018 ................ 4 79 0 23,621 98 0 0 0 2019 ................ 4 72 0 34,942 159 0 0 0
Corn: 2017 ................ 17,232 677,695 78,907 39,436,068 3,454,064 137,707 12,531 1,267,248 2018 ................ 18,722 655,986 78,153 40,324,052 3,161,033 109,356 11,744 1,370,558 2019 ................ 18,728 718,627 86,914 43,646,616 3,746,041 193,371 18,658 3,601,555
Cotton: 2017 ................ 5,922 153,430 11,740 4,954,984 935,615 42,954 6,487 651,346 2018 ................ 5,938 169,337 13,182 5,719,055 1,137,383 88,632 15,735 1,629,098 2019 ................ 5,938 142,332 13,096 5,473,628 956,110 33,018 6,363 777,437
Cotton exlong staple: 2017 ................ 58 1,228 253 298,072 21,070 261 50 16,093 2018 ................ 58 1,048 247 208,039 15,424 209 51 22,056 2019 ................ 58 1,050 221 185,511 13,607 263 45 14,710
Cranberries: 2017 ................ 30 642 32 111,701 3,236 86 3 3,432 2018 ................ 30 606 31 102,716 2,682 49 1 1,929 2019 ................ 30 597 31 133,213 3,282 65 3 3,991
Cucumbers: 2017 ................ 72 405 27 18,755 1,588 81 4 1,226 2018 ................ 72 334 25 17,155 1,379 91 5 1,920 2019 ................ 72 395 26 18,757 1,609 40 3 633
Cultivated wild rice: 2017 ................ 22 102 25 24,906 1,301 8 1 359 2018 ................ 22 81 22 14,196 811 9 1 175 2019 ................ 22 68 20 13,431 687 7 2 527
See footnote(s) at end of table.

X–6 INSURANCE, CREDIT, AND COOPERATIVES
Table 10-2.—Crop insurance programs: Coverage, amount of premiums and indemnities, by crops, United States, 2017–2019—Continued
Commodity and year
Coverage
Amount of premium
Indemnities
County pro-
grams
Insured units
Area in- sured
Maximum insured
production Number Area in-
demnified Amount
1,000 1,000 1,000 1,000 1,000 Number Number acres dollars dollars acres dollars
Dairy cattle: 2017 ................ 48 1,080 0 303,454 6,533 461 0 4,951 2018 ................ 48 1,370 0 319,088 6,131 609 0 5,409 2019 ................ 48 734 0 128,607 2,149 125 0 2,339
Dark air tobacco: 2017 ................ 59 973 6 27,357 1,315 155 1 2,652 2018 ................ 59 1,094 9 38,553 1,861 265 4 9,802 2019 ................ 59 1,104 9 41,972 2,533 134 2 5,759
Dry beans: 2017 ................ 938 14,302 1,345 526,639 74,036 3,138 248 42,090 2018 ................ 940 11,274 1,083 419,456 56,548 1,965 178 32,438 2019 ................ 982 11,598 1,192 435,467 64,260 3,512 332 65,990
Dry Peas: 2016 ................ 725 16,381 2,400 444,950 75,608 2,829 399 37,907 2017 ................ 725 16,752 2,593 480,369 85,658 8,961 1,447 128,614 2018 ................ 725 14,172 2,258 443,844 78,944 4,045 721 75,559
Early and Midseason oranges: 2016 ................ 3 181 4 3,590 143 28 0 96 2017 ................ 3 175 4 3,750 148 31 0 143
Fed cattle: 2016 ................ 37 236 0 32,643 1,315 126 0 1,106 2017 ................ 37 221 0 23,053 993 20 0 74 2018 ................ 37 128 0 13,328 473 23 0 57
Feeder cattle: 2016 ................ 38 1,852 0 159,594 6,154 1,345 0 8,685 2017 ................ 38 2,559 0 173,357 7,853 449 0 1,791 2018 ................ 38 1,385 0 110,163 4,036 596 0 2,260
Figs: 2016 ................ 4 56 4 7,081 265 2 0 110 2017 ................ 4 70 5 8,220 254 2 0 130 2018 ................ 4 60 4 8,241 225 2 0 133
Fired cured tobacco: 2016 ................ 63 1,315 12 67,518 3,345 627 6 18,237 2017 ................ 63 1,474 15 87,470 5,065 253 3 7,890 2018 ................ 63 1,519 16 88,939 5,262 205 3 6,833
Flax: 2016 ................ 265 3,432 339 38,247 5,462 438 41 2,207 2017 ................ 265 2,658 261 31,799 4,720 1,460 145 7,852 2018 ................ 265 1,713 177 23,938 3,974 378 36 2,265
Flue cured tobacco: 2016 ................ 291 11,750 210 666,273 56,540 4,465 86 131,728 2017 ................ 291 11,475 206 638,033 61,882 3,492 66 95,645 2018 ................ 291 11,686 205 657,775 69,268 5,319 119 215,500
Forage production: 2016 ................ 1,404 17,893 2,447 446,137 38,824 4,923 846 36,320 2017 ................ 1,404 15,935 2,222 277,277 25,828 6,969 1,112 44,962 2018 ................ 1,404 14,905 2,108 261,146 25,916 1,838 174 9,668
Forage seeding: 2016 ................ 589 3,743 167 28,623 3,871 1,515 62 6,876 2017 ................ 590 3,068 151 25,507 3,238 1,065 52 5,181 2018 ................ 590 3,556 176 31,942 3,779 100 8 842
Fresh apricots: 2016 ................ 29 136 3 10,645 1,395 13 0 369 2017 ................ 29 130 3 12,292 1,654 43 1 1,899 2018 ................ 29 125 3 11,484 1,378 38 1 1,620
Fresh freestone peaches: 2016 ................ 25 709 17 58,519 1,484 47 0 445 2017 ................ 25 695 19 68,755 1,625 96 1 1,521 2018 ................ 25 713 19 79,585 2,152 76 1 1,200
Fresh market beans: 2016 ................ 15 27 4 2,192 193 16 2 538 2017 ................ 15 26 5 3,441 378 4 1 151 2018 ................ 15 26 6 4,117 494 10 3 440
Fresh market sweet corn: 2016 ................ 230 688 48 48,107 3,513 108 4 2,513 2017 ................ 230 622 49 45,647 3,374 86 4 2,988 2018 ................ 230 609 47 45,411 3,236 119 4 2,582
Fresh market tomatoes: 2016 ................ 57 521 33 122,698 13,060 173 5 12,273 2017 ................ 57 455 31 120,434 12,636 151 4 12,711 2018 ................ 59 408 29 103,266 10,490 184 4 15,134
See footnote(s) at end of table.

X–7 AGRICULTURAL STATISTICS 2020
Table 10-2.—Crop insurance programs: Coverage, amount of premiums and indemnities, by crops, United States, 2017–2019—Continued
Commodity and year
Coverage
Amount of premium
Indemnities
County pro-
grams
Insured units
Area insured
Maximum insured
production Number Area in-
demnified Amount
1,000 1,000 1,000 1,000 1,000 Number Number acres dollars dollars acres dollars
Fresh nectarines: 2017 ................. 24 705 15 58,196 3,322 132 2 2,015 2018 ................. 24 686 14 59,278 3,498 116 2 3,026 2019 ................. 24 702 14 66,307 3,783 84 1 1,429
Grain sorghum: 2017 ................. 7,074 54,432 4,141 679,196 150,570 9,965 812 49,723 2018 ................. 7,077 54,688 4,191 713,915 151,795 14,442 1,332 87,503 2019 ................. 7,077 52,552 4,076 713,655 155,099 9,659 790 53,996
Grapefruit: 2017 ................. 53 668 37 54,735 2,383 147 0 5,219 2018 ................. 56 897 45 68,091 4,798 363 28 26,315 2019 ................. 56 895 44 74,058 6,628 97 3 1,713
Grapefruit trees: 2017 ................. 31 1,019 0 163,430 3,972 0 0 0 2018 ................. 31 960 0 166,336 4,207 47 0 3,573 2019 ................. 31 913 0 190,360 4,830 0 0 0
Grapes: 2017 ................. 200 16,695 573 1,507,208 49,831 2,179 49 43,833 2018 ................. 226 16,890 558 1,571,585 51,202 1,201 23 25,148 2019 ................. 226 17,354 560 1,722,760 55,872 1,035 20 33,937
Grass seed: 2017 ................. 20 106 29 7,134 620 12 1 208 2018 ................. 20 96 32 8,862 628 14 4 460 2019 ................. 20 113 44 12,403 845 4 0 130
Green peas: 2017 ................. 321 1,624 117 56,858 6,490 402 31 7,723 2018 ................. 321 1,570 118 55,071 6,642 729 51 10,406 2019 ................. 303 1,699 122 55,922 7,395 625 42 8,841
Hybrid corn seed: 2017 ................. 462 5,769 382 300,169 17,751 243 15 2,601 2018 ................. 462 4,615 310 245,526 13,245 226 18 2,810 2019 ................. 462 5,029 331 258,157 13,745 141 9 2,840
Hybrid seed rice: 2017 ................. 50 160 17 18,125 1,486 11 3 59 2018 ................. 50 246 19 26,058 2,335 83 10 5,591 2019 ................. 50 338 26 33,126 2,690 19 2 459
Hybrid sorghum seed: 2017 ................. 52 346 25 9,057 804 46 3 684 2018 ................. 52 437 32 13,870 1,258 52 3 687 2019 ................. 52 444 35 15,211 1,377 37 4 500
Hybrid sweet corn seed: 2017 ................. 15 0 0 0 0 0 0 0 2018 ................. 16 122 2 2,510 233 19 0 137 2019 ................. 16 127 3 4,572 389 1 0 68
Lamb: 2017 ................. 28 88 0 18,223 842 79 0 3,347 2018 ................. 28 282 0 50,139 1,430 267 0 5,582 2019 ................. 28 85 0 9,740 235 7 0 31
Late oranges: 2017 ................. 3 62 1 1,102 125 4 0 27
Lemon trees: 2017 ................. 2 0 0 0 0 0 0 0 2018 ................. 3 8 0 1,297 29 3 0 410 2019 ................. 3 15 0 3,854 95 0 0 0
Lemons: 2017 ................. 34 859 44 153,560 9,540 22 1 1,881 2018 ................. 34 861 43 161,178 11,541 45 3 2,176 2019 ................. 34 874 44 196,247 11,724 23 0 666
Lime trees: 2017 ................. 5 5 0 927 17 0 0 0 2018 ................. 5 4 0 985 16 0 0 0 2019 ................. 5 5 0 1,026 14 0 0 0
Macadamia nuts: 2017 ................. 3 39 12 17,289 220 8 0 818 2018 ................. 3 54 12 18,035 244 0 0 0 2019 ................. 3 51 11 20,716 385 29 4 1,715
Macadamia trees: 2017 ................. 3 50 12 51,874 298 0 0 0 2018 ................. 3 53 12 52,808 308 0 0 0 2019 ................. 4 162 982 67,031 347 0 0 0
Mandarins/ Tangerines: 2017 ................. 53 989 48 265,366 23,135 55 0 4,109 2018 ................. 53 1,044 50 302,843 24,517 184 7 11,093 2019 ................. 53 1,137 52 319,870 24,250 52 2 6,022
See footnote(s) at end of table.

X–8 INSURANCE, CREDIT, AND COOPERATIVES
Table 10-2.—Crop insurance programs: Coverage, amount of premiums and indemnities, by crops, United States, 2017–2019—Continued
Commodity and year
Coverage
Amount of premium
Indemnities
County programs
Insured units
Area in-sured
Maximum insured
production Number Area in-
demnified Amount
1,000 1,000 1,000 1,000 1,000 Number Number acres dollars dollars acres dollars
Mango trees: 2017 ................. 1 20 0 837 33 0 0 0 2018 ................. 1 20 0 876 32 14 0 217 2019 ................. 1 17 0 858 32 0 0 0
Maryland tobacco: 2017 ................. 6 0 0 0 0 0 0 0 2018 ................. 6 0 0 0 0 0 0 0 2019 ................. 6 1 0 20 1 1 0 19
Milk: 2019 ................. 50 9,373 0 5,872,319 95,073 278 0 5,513
Millet: 2017 ................. 138 4,266 348 20,277 4,876 1,171 96 3,114 2018 ................. 138 4,019 329 21,884 5,499 1,217 103 3,766 2019 ................. 138 4,477 394 27,488 6,026 954 89 3,264
Mint: 2017 ................. 48 270 19 16,947 856 67 3 1,211 2018 ................. 48 246 17 15,953 747 65 3 662 2019 ................. 48 222 17 14,607 765 52 2 550
Mustard: 2017 ................. 75 318 63 6,083 1,683 154 26 1,418 2018 ................. 75 309 48 5,704 1,529 90 10 793 2019 ................. 75 308 54 6,870 1,539 88 20 1,518
Nursery (FG&C): 2017 ................. 2,799 2,420 0 1,259,008 23,755 27 0 2,537 2018 ................. 2,799 2,468 0 1,402,807 26,316 547 0 97,245 2019 ................. 2,799 2,539 0 1,553,851 31,388 26 0 3,193
Oats: 2017 ................. 2,805 8,500 436 42,135 7,554 3,390 194 12,899 2018 ................. 2,805 7,764 400 39,856 6,730 1,507 70 4,304 2019 ................. 2,805 7,955 430 45,016 7,700 2,064 93 6,230
Olives: 2017 ................. 13 429 24 36,379 3,627 16 1 516 2018 ................. 17 379 23 36,689 3,535 271 14 17,084 2019 ................. 17 369 23 45,858 4,510 26 1 828
Onions: 2017 ................. 176 1,708 101 218,824 39,813 688 24 32,301 2018 ................. 178 1,935 104 237,697 44,901 849 27 41,677 2019 ................. 178 1,428 86 209,519 25,834 270 9 15,347
Orange trees: 2017 ................. 31 2,332 0 1,078,270 12,255 0 0 0 2018 ................. 62 1,994 0 1,122,148 11,910 214 0 26,655 2019 ................. 31 2,085 0 1,271,216 13,337 0 0 0
Oranges: 2017 ................. 63 6,082 438 639,287 29,346 237 0 3,446 2018 ................. 66 6,385 415 581,035 26,795 1,818 182 76,788 2019 ................. 66 6,995 442 689,178 31,666 279 8 6,197
Oysters: 2017 ................. 9 0 0 0 0 0 0 0 2018 ................. 9 0 0 0 0 0 0 0 2019 ................. 9 0 0 0 0 0 0 0
Papaya: 2017 ................. 4 36 0 1,340 32 1 0 41 2018 ................. 4 19 0 859 22 8 0 187 2019 ................. 4 2 0 229 10 0 0 0
Papaya tree: 2017 ................. 4 15 0 403 5 3 0 40 2018 ................. 4 8 0 347 4 2 0 63 2019 ................. 4 4 0 238 2 0 0 0
Pasture/Range-land/Forage: 2017 ................. 3,069 140,701 74,936 1,744,753 380,381 64,227 0 341,241 2018 ................. 3,069 159,751 98,289 2,378,024 520,182 64,869 0 500,039 2019 ................. 3,069 181,901 140,389 2,625,886 581,814 55,378 0 292,255
Peaches: 2017 ................. 383 1,406 31 81,985 22,494 748 20 44,018 2018 ................. 383 1,411 32 82,433 24,273 426 12 18,629 2019 ................. 390 1,461 31 94,552 29,183 416 9 15,842
Peanuts: 2017 ................. 2,139 27,993 1,645 859,863 71,577 4,989 256 60,384 2018 ................. 2,139 22,605 1,302 643,672 55,079 4,786 241 56,550 2019 ................. 2,139 23,055 1,327 706,008 60,100 5,070 253 65,761
Pears: 2017 ................. 29 1,944 33 177,840 4,216 235 4 5,813 2018 ................. 29 1,960 33 194,705 4,299 128 4 6,406 2019 ................. 29 1,982 33 199,901 4,344 228 2 5,960
Pecan trees: 2018 ................. 233 18 0 5,204 25 0 0 0 2019 ................. 233 21 0 7,430 27 0 0 0
Pecans: 2017 ................. 138 1,823 163 286,170 16,313 191 15 6,104 2018 ................. 139 1,897 166 315,144 17,246 1,086 89 79,137 2019 ................. 139 1,929 169 320,243 17,573 259 15 13,479
See footnote(s) at end of table.

X–9 AGRICULTURAL STATISTICS 2020
Table 10-2.—Crop insurance programs: Coverage, amount of premiums and indemnities, by crops, United States, 2017–2019—Continued
Commodity and year
Coverage
Amount of premium
Indemnities
County pro-
grams
Insured units
Area in-sured
Maximum insured
production Number Area in-
demnified Amount
1,000 1,000 1,000 1,000 1,000 Number Number acres dollars dollars acres dollars
Peppers: 2017 ................ 13 127 6 26,651 3,643 52 2 8,024 2018 ................ 13 123 5 19,960 2,834 50 2 6,810 2019 ................ 13 106 4 17,431 2,928 31 1 4,698
Pistachios: 2017 ................ 24 806 146 377,099 20,628 138 26 13,404 2018 ................ 24 930 168 559,132 43,018 20 2 1,587 2019 ................ 24 970 177 549,767 45,798 144 23 28,816
Plums: 2017 ................ 23 663 13 39,746 3,898 128 2 2,144 2018 ................ 23 615 12 40,769 3,960 97 1 1,662 2019 ................ 23 577 12 41,287 3,876 75 1 1,790
Popcorn: 2017 ................ 3,297 1,963 200 124,903 8,763 366 34 3,894 2018 ................ 3,297 1,853 189 116,536 7,412 149 16 2,596 2019 ................ 3,300 1,837 197 121,011 8,431 360 32 10,001
Potatoes: 2017 ................ 531 5,101 725 1,089,700 80,957 503 34 30,120 2018 ................ 531 5,070 739 1,123,089 85,521 1,032 73 71,894 2019 ................ 531 5,351 754 1,206,255 83,877 671 49 47,873
Processing apricots: 2017 ................ 13 61 3 6,946 1,055 15 0 1,003 2018 ................ 13 53 3 5,895 840 25 1 1,513 2019 ................ 13 41 2 4,373 569 3 0 29
Processing beans: 2017 ................ 258 1,394 88 47,272 4,533 240 11 3,655 2018 ................ 258 1,371 89 43,703 4,583 401 22 5,196 2019 ................ 258 1,447 89 45,345 4,824 290 16 3,326
Processing cling peaches: 2017 ................ 10 835 14 59,892 2,344 75 1 1,370 2018 ................ 10 784 13 51,741 1,905 115 2 1,790 2019 ................ 10 735 11 45,875 1,756 46 1 728
Processing freestone: 2017 ................ 8 97 2 11,516 277 7 0 293 2018 ................ 8 91 2 10,280 289 10 0 356 2019 ................ 8 89 2 8,990 282 1 0 16
Prunes: 2017 ................ 28 722 40 109,723 23,759 123 7 7,561 2018 ................ 28 686 39 94,170 21,272 262 14 17,073 2019 ................ 28 640 37 85,507 20,381 115 6 8,010
Pumpkins: 2017 ................ 22 201 10 6,675 462 68 4 1,291 2018 ................ 22 138 6 3,874 281 8 0 83 2019 ................ 22 165 8 5,269 449 63 2 1,003
Raisins: 2017 ................ 7 1,828 0 96,395 3,061 662 0 3,158 2018 ................ 7 1,805 0 175,544 5,334 122 0 513 2019 ................ 7 236 0 17,356 294 0 0 0
Rice: 2017 ................ 999 18,623 2,385 1,261,043 75,293 4,909 646 182,093 2018 ................ 1,089 21,318 2,550 1,664,522 87,492 3,689 472 82,653 2019 ................ 1,089 20,709 2,814 1,564,345 97,722 6,688 994 268,039
Rio Red & Star Ruby: 2017 ................ 3 313 12 16,686 2,319 43 0 609
Ruby red grapefruit: 2017 ................ 3 39 1 433 49 9 0 34
Rye: 2017 ................ 89 406 36 2,948 511 150 12 730 2018 ................ 89 483 35 3,446 616 209 13 686 2019 ................ 97 672 54 6,837 1,217 238 13 1,176
Safflower: 2017 ................ 164 594 108 10,710 1,731 173 25 1,622 2018 ................ 164 556 102 11,314 1,715 105 16 711 2019 ................ 164 584 86 7,820 1,359 167 23 1,519
See footnote(s) at end of table.

X–10 INSURANCE, CREDIT, AND COOPERATIVES
Table 10-2.—Crop insurance programs: Coverage, amount of premiums and indemnities, by crops, United States, 2017–2019—Continued
Commodity and year
Coverage
Amount of premium
Indemnities
County pro-
grams
Insured units
Area in-sured
Maximum insured
production Number Area in-
demnified Amount
1,000 1,000 1,000 1,000 1,000 Number Number acres dollars dollars acres dollars
Sesame: 2017 ................ 102 322 21 1,865 614 154 8 471 2018 ................ 102 710 58 6,215 1,830 345 25 2,121 2019 ................ 138 866 70 8,247 2,458 269 19 1,494
Silage Sorghum: 2017 ................ 194 542 47 11,055 1,321 51 3 395 2018 ................ 194 626 58 14,577 1,741 102 11 1,403 2019 ................ 194 796 73 17,557 2,196 124 14 1,423
Soybeans: 2017 ................ 14,265 700,986 79,882 28,412,875 2,556,484 125,741 11,206 766,516 2018 ................ 15,790 671,493 78,853 28,884,196 2,244,330 161,487 16,650 1,286,277 2019 ................ 15,818 647,449 71,399 24,603,865 1,880,887 180,844 15,893 1,737,081
Strawberries: 2017 ................ 7 5 0 4,883 89 0 0 0 2018 ................ 7 3 0 4,345 206 0 0 0 2019 ................ 7 3 0 1,718 63 0 0 0
Sugar beets: 2017 ................ 239 13,145 992 848,993 46,781 773 47 9,196 2018 ................ 239 13,001 982 944,362 49,201 2,124 158 47,690 2019 ................ 243 13,154 1,011 983,182 53,701 3,294 249 151,656
Sugarcane: 2017 ................ 62 4,739 767 320,763 5,861 117 5 921 2018 ................ 62 4,831 789 357,470 6,717 165 8 1,671 2019 ................ 62 4,835 801 348,538 6,152 29 3 495
Sunflowers: 2017 ................ 1,794 6,843 1,221 245,512 47,067 1,771 249 27,654 2018 ................ 1,806 5,786 1,146 216,862 42,885 1,425 249 22,148 2019 ................ 1,806 6,286 1,275 241,243 44,208 1,595 239 29,090
Sweet corn: 2017 ................ 332 2,388 199 90,157 4,397 231 16 4,340 2018 ................ 332 2,345 198 86,002 4,225 412 28 5,383 2019 ................ 326 2,477 200 90,760 4,439 358 25 5,181
Sweet potatoes: 2017 ................ 9 22 7 8,268 983 2 1 385 2018 ................ 9 20 7 6,334 638 3 0 978 2019 ................ 9 19 9 10,699 1,380 1 1 405
Swine: 2017 ................ 85 190 0 22,732 1,144 41 0 296 2018 ................ 85 126 0 18,649 767 63 0 1,430 2019 ................ 85 85 0 16,273 920 46 0 1,205
Table grapes: 2017 ................ 10 1,177 77 326,189 9,269 234 6 16,190 2018 ................ 10 1,212 77 360,317 11,310 197 6 17,811 2019 ................ 10 1,206 77 362,398 11,178 104 3 9,458
Tangelos: 2017 ................ 49 382 8 20,811 1,586 36 0 626 2018 ................ 49 344 7 20,638 1,404 78 1 820 2019 ................ 49 336 7 21,721 1,368 12 0 502
Tangerine trees: 2017 ................ 3 12 0 411 16 0 0 0 2018 ................ 3 13 0 381 14 0 0 0 2019 ................ 3 12 0 658 20 0 0 0
Tangors: 2017 ................ 29 185 4 9,690 491 8 0 248 2018 ................ 29 138 3 7,139 357 105 3 4,919 2019 ................ 29 133 3 5,168 268 1 0 11
Tomatoes: 2017 ................ 148 2,656 232 490,700 11,418 216 16 9,439 2018 ................ 148 2,694 240 512,868 10,854 102 8 4,165 2019 ................ 148 2,500 228 525,788 10,999 121 13 12,457
Triticale: 2018 ................ 116 196 23 2,702 309 49 3 157 2019 ................ 135 285 30 3,529 361 54 5 348
Walnuts: 2017 ................ 52 1,835 158 249,534 5,985 182 8 3,973 2018 ................ 52 1,884 169 303,864 6,036 113 4 3,045 2019 ................ 52 1,963 180 222,496 4,045 112 6 2,390
Wheat: 2017 ................ 15,522 344,489 37,247 5,892,115 893,223 85,034 10,664 752,014 2018 ................ 15,672 337,418 38,712 6,906,618 997,826 86,841 9,159 573,754 2019 ................ 15,738 327,592 38,692 7,218,143 1,108,877 94,725 10,860 874,655
Whole Farm Revenue Protection: 2017 ................ 3,140 2,729 0 2,829,150 142,167 831 0 159,610 2018 ................ 3,140 2,492 0 2,671,630 137,063 613 0 125,007 2019 ................ 3,140 2,118 0 2,319,039 132,695 80 0 2,659
RMA, Requirements, Analysis and Validation Branch, (816) 926–7910.

X–11 AGRICULTURAL STATISTICS 2020
Table 10-3.—Farm real estate debt: Amount outstanding by lender, United States, Dec. 31, 2009–2018 1
Year Farm Credit System Farm Service Agency Farmer Mac Commercial banks 1
Billion dollars Billion dollars Billion dollars Billion dollars
2009 ............... 69.1 2.6 2.1 44.2 2010 ............... 72.5 3.5 3.6 51.2 2011 ............... 75.3 3.3 3.8 52.9 2012 ............... 80.3 3.7 3.8 64.6 2013 ............... 85.3 3.7 4.5 68.9 2014 ............... 88.8 4.3 4.7 73.3 2015 ............... 96.7 4.9 4.8 79.2 2016 ............... 103.7 5.9 5.5 84.4 2017 ............... 107.2 6.0 6.2 88.4 2018 ............... 113.0 6.6 6.5 92.8
Year Individuals and others 1 Life insurance companies Storage facility loans Total farm
mortgage debt
Billion dollars Billion dollars Billion dollars Billion dollars
2009 ............... 14.2 13.3 0.5 146.0 2010 ............... 10.2 12.4 0.6 154.1 2011 ............... 18.1 13.0 0.7 167.2 2012 ............... 8.7 11.5 0.7 173.4 2013 ............... 10.1 12.0 0.7 185.2 2014 ............... 12.5 12.4 0.8 196.8 2015 ............... 10.0 12.5 0.8 208.8 2016 ............... 12.5 13.2 0.7 226.0 2017 ............... 12.6 15.0 0.8 236.2 2018 ............... 9.9 15.9 0.8 245.7
Data as of February 5, 2020. 1 Beginning with 2012 estimates, farm sector debt held by savings associations is reported with the commercial bank lend-
er group instead of the individuals and others grouping. ERS, Farm Farm Income Team, (202) 694–5586. [email protected]. http://www.ers.usda.gov/data-prod-
ucts/farm-income-and-wealth-statistics.aspx.
Table 10-4.—Nonreal estate farm debt: Amount outstanding, by lender, United States, Dec. 31, 2009–2018
Year Commericial banks 1 Farm Credit System
Farm Service Agency
Individuals and others 1
Total nonreal estate
debt
Billion dollars Billion dollars Billion dollars Billion dollars Billion dollars 2009 ............ 57.2 39.0 3.3 22.9 122.4 2010 ............ 56.2 39.2 3.6 25.8 124.9 2011 ............ 59.2 41.1 3.5 23.5 127.3 2012 ............ 59.9 42.7 3.4 18.2 124.2 2013 ............ 63.7 44.0 2.8 19.6 130.2 2014 ............ 70.7 47.9 3.6 26.2 148.4 2015 ............ 73.2 48.3 3.7 22.8 148.0 2016 ............ 73.2 49.4 3.8 21.8 148.2 2017 ............ 73.3 51.1 4.0 25.8 154.2 2018 ............ 74.9 53.4 3.9 24.2 156.3
Data as of February 5, 2020. 1 Beginning with 2012 estimates, farm sector debt held by savings associations is reported with the commercial bank lend-
er group instead of the individuals and others grouping. ERS, Farm Farm Income Team, (202) 694–5586. [email protected]. http://www.ers.usda.gov/data-prod-
ucts/farm-income-and-wealth-statistics.aspx.

X–12 INSURANCE, CREDIT, AND COOPERATIVES
Table 10-5.—Farm Service Agency: Credit assistance made to individuals, entities, and associations for farming purposes, and amount outstanding, United States and Terri-tories, 2010–2019 1
Year
Direct loans and loan guarantees
Farm ownership Soil and water Recreation
Obligations (initial and
subsequent) Loans made Outstanding
Jan. 1 Outstanding Jan. 1
Outstanding Jan. 1
Number 1,000 dollars 1,000 dollars 1,000 dollars 1,000 dollars
2010 ............ 8,837 2,313,902 10,875,039 10,364 4,632 2011 ............ 8,516 2,498,626 11,872,786 8,053 208 2012 ............ 7,088 2,029,778 12,498,221 6,585 191 2013 ............ 6,086 1,946,988 12,842,052 5,483 133 2014 ............ 10,106 3,012,450 13,768,000 4,617 102 2015 ............ 9,970 3,050,383 14,985,868 4,082 79 2016 ............ 10,712 3,489,028 16,560,650 3,579 64 2017 ............ 10,405 3,322,717 18,195,830 2,864 46 2018 ............ 10,667 3,264,634 19,753,319 2,333 45 2019 ............ 10,607 3,528,293 21,505,224 1,912 19
Year
Direct loans and loan guarantees
Operating Emergency
Obligations (initial and
subsequent) Loans made Outstanding
Jan. 1 New borrowers Loans made Outstanding
Jan. 1
Number 1,000 dollars 1,000 dollars Number 1,000 dollars 1,000 dollars
2010 ............ 27,337 2,934,097 7,047,105 340 35,598 661,950 2011 ............ 23,411 2,285,131 6,953,778 176 32,610 578,846 2012 ............ 24,667 2,103,112 6,594,239 309 31,436 537,640 2013 ............ 23,667 1,960,150 6,254,820 382 33,387 479,869 2014 ............ 26,862 2,201,420 6,214,490 177 18,106 428,304 2015 ............ 27,523 2,617,000 6,352,898 124 13,383 385,951 2016 ............ 28,562 2,832,984 6,778,399 376 42,725 379,094 2017 ............ 27,888 2,650,932 7,135,916 124 15,131 343,455 2018 ............ 23,935 2,198,126 7,119,181 96 12,713 313,088 2019 ............ 21,635 2,199,657 7,380,820 103 13,170 284,989
Year
Loans to associations Economic opportunity
individual loans
Economic emergency
loans Indian tribe land acquisition
Grazing association
Irrigation, drainage, and soil
conservation
Outstanding Jan. 1 Outstanding Jan. 1 Outstanding Jan. 1
Outstanding Jan. 1
Outstanding Jan. 1
1,000 dollars
2010 ............ 34,306 2,232 707 6 100,515 2011 ............ 29,539 1,848 605 6 85,915 2012 ............ 25,112 1,618 511 6 76,843 2013 ............ 24,246 1,014 468 6 65,040 2014 ............ 19,825 798 284 6 57,053 2015 ............ 15,590 673 227 6 49,517 2016 ............ 11,619 408 181 5 42,545 2017 ............ 10,461 365 152 4 39,216 2018 ............ 9,227 326 121 4 33,651 2019 ............ 7,450 256 91 0 29,180
1 Includes loans made directly by FSA and those guaranteed by the Agency. Amounts of loans made represent new obli-gations (initial and subsequent) for the fiscal year displayed. Amounts outstanding are less principal repayments for loans made directly by the Agency.
FSA, Loan Making Division, (202) 720–3889.

X–13 AGRICULTURAL STATISTICS 2020
Table 10-6.—Loans to farmers’ cooperative organizations: Outstanding amounts held by the agricultural credit bank classified by type of loan, United States, Jan. 1, 2010-2019
Year Operating capital loans Facility loans
1,000 dollars 1,000 dollars
2010 ........................... 10,743,647 33,430,718 2011 ........................... 10,871,732 35,413,410 2012 ........................... 32,789,008 39,191,450 2013 ........................... 32,449,687 41,153,688 2014 ........................... 32,171,519 48,210,977 2015 ........................... 35,316,639 53,723,941 2016 ........................... 39,243,137 56,015,144 2017 ........................... 35,681,814 63,583,691 2018 ........................... 39,317,966 65,175,889 2019 ........................... 33,662,950 75,191,303
FCA, Office of Information Technology, (703) 883–4260.
Table 10-7.—Farmers’ marketing, farm supply, and related service cooperatives: Number, memberships, and business volume, United States, 2010–2019
Year 1
Cooperatives 2 Estimated memberships 4
Marketing Farm supply
Related service 3 Total Marketing Farm
supply Related service 3 Total
Number 1,000 members
2010 ............... 1,215 974 125 2,314 737 1,463 35 2,234 2011 ............... 1,222 935 128 2,285 846 1,398 36 2,279 2012 ............... 1,200 916 120 2,236 652 1,426 37 2,115 2013 ............... 1,195 871 120 2,186 655 1,284 37 1,977 2014 ............... 1,114 876 116 2,106 627 1,333 35 1,996 2015 ............... 1,079 874 94 2,047 591 1,296 34 1,921 2016 ............... 1,040 827 86 1,953 584 1,280 37 1,901 2017 ............... 1,010 777 84 1,871 604 1,251 35 1,890 2018 ............... 961 760 85 1,806 594 1,262 33 1,889 2019 ............... 931 759 89 1,779 677 1,184 38 1,900
Year 1
Marketing volume Farm supply volume
Service Receipts 7
Total marketing and farm supply volume and service
receipts Gross 5 Net 6 Gross 5 Net 6
Gross 5 Net 6
Billion dollars
2010 ............... 103.031 95.756 63.842 47.118 4.930 171.803 147.805 2011 ............... 128.041 121.784 80.898 57.322 4.453 213.391 187.100 2012 ............... 140.900 133.200 92.200 64.700 4.700 237.800 202.600 2013 ............... 144.615 135.810 95.933 67.175 5.572 246.120 208.557 2014 ............... 147.731 138.340 92.624 65.638 6.315 246.670 210.293 2015 ............... 124.892 115.409 81.709 59.023 5.458 212.059 179.890 2016 ............... 114.587 108.603 71.048 51.589 5.440 191.075 165.632 2017 ............... 119.807 112.754 71.754 51.516 5.579 197.141 169.849 2018 ............... 126.333 118.962 71.728 53.634 5.753 203.814 178.349 2019 ............... 124.916 119.497 71.041 53.220 7.090 203.047 179.807
1 Reports of cooperatives are included for their fiscal year ending in calendar year. 2 Includes independent local coopera-tives, centralized cooperatives, federations of cooperatives, and cooperatives with mixed organizational struc-tures. Cooperatives are classified according to their major activity. If, for example, more than 50 percent of a coopera-tive’s business is derived from marketing activities, it is included as a marketing cooperative. 3 Includes cooperatives whose major activity is providing services related to marketing and farm supply activities. 4 Includes members (those enti-tled to vote for directors) but does not include nonvoting patrons. (Some duplication exists because some farmers belong to more than one cooperative.) 5 Estimated gross business includes all business reported between cooperatives, such as the wholesale business of farm supply cooperatives with other cooperatives or terminal market sales for local coopera-tives. 6 Estimated net business represents the value at the first level at which cooperatives transact business for farmers, adjusted for duplication resulting from intercooperative business. 7 Services related to marketing or purchasing but not in-cluded in the volumes reported for those activities, plus other operating and non-operating income and losses and extraor-dinary items.
Rural Development, Cooperative Services Branch, (202) 720-7395.

X–14 INSURANCE, CREDIT, AND COOPERATIVES
Table 10-8.—Farmers’ cooperatives: Business volume of marketing, farm supply, and related service cooperatives, United States, 2018–2019
Item Gross business Net business 1
2018 2019 2018 2019
Billion dollars
Products marketed:
Beans and peas (dry edible) ................. 0.225 0.232 0.218 0.224 Cotton and cotton products ................... 3.549 2.954 3.420 2.866 Dairy products ........................................ 40.835 43.559 37.887 42.396 Fish ........................................................ 0.239 0.232 0.239 0.232 Fruits and vegetables ............................ 9.391 8.095 7.531 6.721 Grain and oilseeds 2 .............................. 51.318 49.704 50.211 48.444 Livestock and livestock products ........... 3.990 3.835 3.990 3.835 Nuts ........................................................ 1.725 1.672 1.725 1.672 Poultry products ..................................... 1.796 0.943 1.796 0.943 Rice ........................................................ 1.694 1.713 1.694 1.713 Sugar products ...................................... 5.941 6.055 4.964 4.875 Tobacco ................................................. 0.340 0.316 0.340 0.316 Wool and mohair ................................... 0.012 0.012 0.012 0.012 Other products 3 ..................................... 5.276 5.594 4.933 5.247
Total farm products ................................ 126.333 124.916 118.962 119.497
Supplies purchased:
Crop protectants .................................... 8.941 8.119 6.208 5.599 Feed ....................................................... 11.859 11.759 9.905 9.932 Fertilizer ................................................. 13.367 13.632 10.438 10.714 Petroleum ............................................... 26.886 26.885 19.037 18.905 Seed ....................................................... 5.861 5.576 3.689 3.443 Other supplies 4 ..................................... 4.814 5.070 4.356 4.627
Total farm supplies ................................ 71.728 71.041 53.634 53.220
Receipts for services: 5
Trucking, cotton ginning, storage, grinding, locker plants, miscellaneous 5.440 7.090 5.440 7.090
Total business ........................................ 203.501 203.047 178.035 179.807
1 Represents value at the first level at which cooperatives transact business for farmers; adjusted for inter-cooperative business. 2 Excludes oilseed meal and oil. Oilseed meal is included in feed sales while oil sales are included in other products sales. 3 Includes coffee, forest products, hay, hops, seed marketed for growers, nursery stock, other farm prod-ucts not separately classified, and sales of farm products not received directly from member-patrons. Also includes manu-factured food products and resale items marketed by cooperatives. 4 Includes automotive supplies, building material, chicks, containers, farm machinery and equipment, hardware, meats and groceries, and other supplies not separately classi-fied. 5 Trucking, cotton ginning, storage, grinding, locker plants, and/or miscellaneous services related to marketing or pur-chasing but not included in the volume reported for those activities, plus other operating and non-operating income and losses and extraordinary items.
Rural Development, Cooperative Services Branch, (202) 720–7395.

X–15 AGRICULTURAL STATISTICS 2020
Table 10-9.—Farmers’ cooperatives: Number of cooperatives, memberships, and busi-ness volume of marketing, farm supply, and related service cooperatives, by State, United States and Foreign, 2018–2019
State
Cooperatives headquartered in State Memberships in State 1 Net business 2
2018 2019 2018 2019 2018 2019
Number Number Number Number Million dollars Million dollars
Alabama ............. 43 46 24,873 25,337 1,018.76 1,013.75 Arkansas ............ 27 28 38,173 38,245 2,274.61 2,281.82 California ............ 101 100 34,963 37,068 13,692.10 13,895.45 Colorado ............. 25 25 18,702 19,771 2,526.49 2,724.75 Florida ................ 23 22 21,082 21,229 2,364.74 2,263.83 Georgia ............... 9 9 13,784 13,229 1,155.42 1,047.59 Hawaii ................. 9 8 488 370 17.66 20.97 Idaho .................. 20 17 13,449 12,996 2,303.20 2,365.99 Illinois ................. 89 85 109,333 103,970 11,129.04 11,064.73 Indiana ................ 26 25 49,953 45,939 3,891.75 4,241.68 Iowa .................... 73 73 99,594 102,510 18,315.75 17,211.97 Kansas ............... 75 78 104,930 106,894 6,869.97 7,300.06 Kentucky ............. 20 21 161,973 161,425 1,403.25 1,421.89 Louisiana ............ 25 26 7,731 7,197 1,320.14 1,408.04 Maine .................. 21 20 5,574 5,429 277.22 294.13 Maryland ............. 11 11 35,614 35,691 431.34 430.08 Massachusetts ... 7 6 4,959 5,108 342.86 348.36 Michigan ............. 33 34 42,817 44,223 4,645.24 5,446.39 Minnesota ........... 160 157 125,853 134,226 16,172.06 16,874.28 Mississippi .......... 38 39 42,886 44,512 1,351.86 1,358.83 Missouri .............. 50 50 93,482 94,789 4,972.42 4,699.04 Montana ............. 42 42 18,768 18,542 1,408.91 1,437.63 Nebraska ............ 38 39 60,174 69,826 8,318.59 7,776.52 New Jersey ........ 11 11 1,715 1,770 313.13 314.29 New York ............ 42 41 10,284 10,450 3,930.56 4,393.65 North Carolina .... 11 11 21,887 21,955 778.95 778.95 North Dakota ...... 120 119 67,092 69,755 6,732.53 6,674.53 Ohio .................... 33 34 39,060 40,573 4,808.19 4,779.95 Oklahoma ........... 47 45 42,154 42,155 1,993.07 1,625.07 Oregon ............... 24 24 29,422 30,150 3,596.39 3,136.84 Pennsylvania ...... 24 20 12,471 12,376 3,107.33 2,994.28 South Dakota ..... 63 61 55,687 57,193 5,108.20 4,869.19 Tennessee .......... 57 56 66,935 66,252 1,318.92 1,427.37 Texas .................. 157 151 75,180 74,403 5,865.18 6,057.12 Utah .................... 10 10 9,299 8,589 737.35 791.20 Virginia ............... 42 41 116,081 111,179 1,736.94 1,698.42 Washington ........ 50 46 25,569 27,060 7,367.93 7,495.80 West Virginia ...... 9 9 58,231 58,537 102.15 103.33 Wisconsin ........... 100 99 102,182 92,096 8,765.69 9,419.76 Wyoming ............ 7 6 4,765 4,150 437.99 435.45 Other States 3 ..... 34 34 21,172 21,884 4,251.96 4,954.91
United States ...... 1,806 1,779 1,888,340 1,899,056 167,155.87 168,877.88
Foreign 4 ............. ........................ ........................ 561 569 11,193.54 10,929.11
Total ................... 1,806 1,779 1,888,901 1,899,625 178,349.40 179,807.00
1 Actual memberships in State. 2 Represents value at the first level at which cooperatives transact business for farmers; adjusted for inter-cooperative business. Totals may not add due to rounding. 3 Dollar volume or membership is not shown to avoid disclosing operations of individual cooperatives. 4 Sales outside the United States and sales of certain products not received directly from member-patrons.
Rural Development, Cooperative Services Branch, (202) 720–7395.

XI–1
CHAPTER XI
STABILIZATION AND PRICE-SUPPORT PROGRAMS
The statistics in this chapter relate to activities of the Commodity Credit Corporation (CCC), loan and inventory acquisition and disposition programs, the CCC and Farm Service Agency payment pro-grams, and marketing agreements and order programs for fruits and vegetables. Statistics for Federal Milk Marketing Order programs are contained in chapter VIII.
Table 11-1.—Commodity Credit Corporation: Price-supported commodities owned as of September 2019 1 (Inventory quantity)
Year Corn Meal Sorghum and products
Milk and products
Rice and products
Peanut and products Cotton
Million pounds Million bushels Million pounds Million cwt Million pounds Million pounds/ bales
2010 0 (3) 7 (3) 0 0 2011 0 (3) 0 (2) 0 0 2012 0 0 0 0 0 0 2013 0 (3) 0 (3) 0 0 2014 0 0 0 (3) 4 0 2015 0 0 0 0 168 0 2016 0 0 0 0 0 0 2017 8 0 0 (3) 55 0 2018 2 (3) 0 0 133 0 2019 1 0 0 (3) 26 (2)
Year Beans, dry edible
Dry whole peas Wheat Blended Foods Vegetable Oil
Products Value of all
commodities owned
Million bushels Million cwt Million bushels Million pounds Million pounds Million dollars 2010 (4) 0 (2) 16 5 48 2011 (2) 0 0 16 33 53 2012 0 0 0 2 12 14 2013 0 0 0 25 23 71 2014 0 0 0 18 32 40 2015 0 2 2 13 23 55 2016 0 0 0 27 10 24 2017 0 0 0 0 21 35 2018 0 0 0 12 15 45 2019 (2) (3) 0 14 4 23
Cotton and Dry whole peas were added to the table. This table represents the total value of all commodities owned by CCC, including price-supported commodities not shown and commodities acquired under programs other than price-support programs, less reserve for losses on inventory.1 Commodities with data consistently zero for 2010-2019 are not list-ed. 2 Less than 50,000 units. 3 Less than 500,000 units. 4 Less than 500 units.
FPAC, Business Center, Budget Division, Program Budget Branch, CCC Program Section, (202) 720-4697.
Table 11-2.—Commodity Credit Corporation: Loans pledged, by quantity and face amount, United States and Territories, by crop year 2018–2019 1
Commodity 2 Unit 3 2018 2019
Quantity pledged Face amount Quantity pledged Face amount
1,000 1,000 dollars 1,000 1,000 dollars
Barley ....................................... 1,000 bushels 1,711 3,196 2,001 4,709 Canola Seed ............................. 1,000 cwt ........ 464 4,666 208 2,103 Chickpeas ................................. 1,000 cwt ........ 109 1,183 747 8,325 Corn .......................................... 1,000 bushels 78,890 152,614 66,091 130,973 Cotton, ELS & Upland .............. 1,000 bales ..... 260 67,888 393 105,291 Dry Whole Peas ....................... 1,000 cwt ........ 277 1,478 578 3,413 Flaxseed ................................... 1,000 cwt ........ 19 196 1 13 Grain sorghum .......................... 1,000 bushels 469 928 702 1,494 Honey ....................................... 1,000 pounds .. 3,711 2,561 4,517 3,117 Lentil Dry .................................. 1,000 cwt ........ 242 2,702 460 5,355 Mustard Seed ........................... 1,000 cwt ........ 26 269 .............................. ......................Oats .......................................... 1,000 bushels 273 365 452 876 Peanuts .................................... 1,000 pounds .. 538,966 95,856 470,553 83,563 Rice .......................................... 1,000 bushels 2,064 13,470 2,381 15,773 Safflower Seed ......................... 1,000 cwt ........ .............................. ...................... 4 34 Seed cotton, ELS & Upland ..... 1,000 pounds .. 6 1,892 .............................. ......................Soybeans .................................. 1,000 bushels 7,272 36,013 16,609 81,810 Sunflower Seed ........................ 1,000 cwt ........ 85 843 37 378 Sunflower Seed (non-oil) .......... 1,000 cwt ........ 18 183 2 18 Wheat ....................................... 1,000 bushels 28,113 85,570 35,251 119,227
1 Includes loans pledged directly by Commodity Credit Corporation. 2 Commodities with no pledges for 2018 and 2019 were removed. 3 Includes Upland & ELS Bales and CFLS Pounds.
FPAC, Business Center, Budget Division, Program Budget Branch, CCC Program Section, (202) 720-4697.

XI–2 STABILIZATION AND PRICE-SUPPORT PROGRAMS
Table 11-3.—Commodity Credit Corporation: Loan transactions for fiscal year 2019, by commodities 1
Commodity Unit 5
Loans out-
standing Oct. 1, 2018 2
New loans made
Loan repayments
Collateral acquired in settle-ment 3
Loans written off
and trans-
ferred to accounts receiv-able 4
Loans outstanding Sept. 30, 2019
Value
Quantity collateral remaining pledged
1,000 dollars
Basic commodities:
Corn ............................. Bushel .... 152,614 1,752,104 (1,768,021) ................ (5,723) 66,091 130,973 Cotton
(Upland and ELS) .... Bale ....... 69,779 2,286,948 (2,115,069) (123,454) (12,912) 394 105,291 Peanuts ....................... Pound .... 95,856 933,790 (824,355) (34,560) (87,168) 470,553 83,563 Rice ............................. Cwt ........ 13,470 230,708 (228,228) ................ (178) 2,381 15,773 Seed cotton ................. Pound .... ................ 31,611 (31,512) ................ (99) .............. ................Wheat .......................... Bushel .... 85,570 220,863 (187,170) ................ (36) 35,251 119,227
Total 6 .......................... ................ 417,289 5,456,024 (5,154,355) (158,014) (106,116) 574,670 454,827
Designated nonbasic commodities
Barley .......................... Bushel .... 3,196 11,599 (10,086) ................ ................ 2,001 4,709 Canola seed ................ Cwt ........ 4,666 14,626 (17,190) ................ ................ 208 2,103 FlaxSeed ..................... Cwt ........ 196 381 (564) ................ ................ 1 13 Honey .......................... Pound .... 2,561 5,619 (5,063) ................ ................ 4,517 3,117 Mustard seed .............. Cwt ........ 269 340 (609) ................ ................ .............. ................Oats ............................. Bushel .... 365 1,125 (600) ................ (14) 452 876 Raw sugar, cane ......... Pound .... ................ 348,916 (348,916) ................ ................ .............. ................Raw sugar beet ........... Pound .... ................ 233,832 (233,832) ................ ................ .............. ................Refined sugar beet ...... Pound .... ................ 442,296 (441,347) ................ (949) .............. ................Safflower seed ............ Cwt ........ ................ 34 .................... ................ ................ 4 34 Sorghum ...................... Bushel .... 928 4,824 (4,258) ................ ................ 702 1,494 Sunflower seed (oil) .... Cwt ........ 843 5,264 (5,729) ................ ................ 37 378 Sunflower seed,
non oil ...................... Cwt ........ 183 687 (852) ................ ................ 2 18
Total 5 .......................... ................ 13,207 1,069,543 (1,069,046) ................ (963) 7,924 12,742
Other nonbasic commodities:
Chickpeas .................... Pound .... 1,183 14,894 (7,752) ................ ................ 747 8,325 Lentils .......................... Pound .... 2,702 11,188 (8,534) ................ ................ 460 5,355 Peas, dry whole .......... Pound .... 1,478 6,303 (4,369) ................ ................ 578 3,413 Soybeans .................... Bushel .... 36,013 1,082,992 (1,032,718) ................ (4,477) 16,609 81,810
Total 5 .......................... ................ 41,376 1,115,377 (1,053,373) ................ (4,477) 18,394 98,903
Grand total 5 ................ 471,872 7,640,944 (7,276,774) (158,014) (111,556) 600,988 566,472
1 Loans made directly by Commodity Credit Corporation. 2 Book value of outstanding loans; includes face amounts and any charges paid. 3 Includes Commodity Certificate Exchanges. 4 Includes transfers to accounts receivable. 5 Totals do not include allowance for losses.
Commodities with no loan activity from October 1, 2018 to September 30, 2019 were eliminated. FPAC, Business Center, Budget Division, Program Budget Branch, CCC Program Section, (202) 720-4697.

XI–3 AGRICULTURAL STATISTICS 2020
Table 11-4.—Commodity Credit Corporation: Selected inventory transactions, programs and commodities, as of September 30, 2019
Program and commodity
Quantity
Unit Inventory
Oct. 1, 2018
Purchases
Collateral acquired
from loans
Other addition
deduction
Sales and other dis-positions 1
Inventory Sept. 30,
2019
Thousands
Feed grains: Corn products ....................... Pound 2,172 63,114 0 0 (64,759) 527 Grain sorghum ..................... Bushel 396 9,797 0 0 (10,193) 0
Food grains, cotton and tobacco: Wheat ................................... Bushel 5 13,319 0 0 (13,324) 0 Wheat flour ........................... Pound 0 (4) 0 0 4 0 Rice, milled ........................... Cwt .... 0 1,679 0 0 (1,525) 154 Upland cotton ....................... Bale 2 0 0 42,481 0 (42,462) 20
Oils and oilseeds: Peanut butter ........................ Pound 0 0 0 2,649 (2,649) 0 Peanuts ................................ Pound 132,952 0 194,167 (243,370) (57,603) 26,146 Soybean products ................ Pound 0 88,183 0 0 (88,183) 0 Dry edible beans .................. Cwt .... 0 433 0 ................ (400) 34 Blended foods ...................... Pound 12,119 95,497 0 0 (94,109) 13,508
Dry whole peas and lentils .......... Cwt .... 248 2,083 0 0 (2,233) 98 Sugar cane and beet ................... Pound 240 0 0 0 (240) 0 Vegetable oil products ................. Pound 14,828 335,234 0 0 (346,515) 3,547 Other ............................................ ............ 0 2,337 0 0 (2,337) 0
Total inventory operations ............ 162,960 611,672 236,648 (240,721) (726,528) 44,034
Program and commodity
Value
Unit Inventory
Oct. 1, 2018
Purchases
Collateral acquired
from loans
Other addition
deduction
Sales and other
disposi-tions 1
Inventory Sept. 30,
2019
1,000 dollars
Feed grains: Corn products ....................... Pound 542 12,049 0 (121) (12,364) 106 Grain sorghum ..................... Bushel 2,877 50,405 0 (899) (52,384) 0
Food grains, cotton and tobacco: Wheat ................................... Bushel 14 137,161 0 0 (137,175) 0 Wheat flour ........................... Pound 0 (1) 0 0 1 0 Rice, milled ........................... Cwt .... 0 37,191 0 0 (33,977) 3,215 Upland cotton ....................... Bale 2 0 0 122,065 236 (117,784) 4,517
Oils and oilseeds: Peanut butter ........................ Pound 0 0 0 3,304 (3,304) 0 Peanuts ................................ Pound 24,039 0 34,560 (43,484) (10,401) 4,713 Soybean products ................ Pound 0 15,625 0 0 (15,625) 0 Dry edible beans .................. Cwt .... 0 17,072 0 0 (15,631) 1,441 Blended foods ...................... Pound 4,166 42,613 0 679 (42,970) 4,487
Dry whole peas and lentils .......... Cwt .... 5,476 41,616 0 (637) (44,307) 2,148 Sugar, cane and beet .................. Pound 0 0 0 0 0 0 Vegetable oil products ................. Pound 8,463 142,054 0 (426) (147,851) 2,240 Other ............................................ ............ 471 801,235 0 0 (800,773) 933
Total inventory operations ............ 46,048 1,297,020 156,625 (41,348) (1,434,545) 23,800
1 Includes sales, commodity donations, transfers to other government agencies and inventory adjustment. 2 Includes Up-land Bales and CFLS Pounds.
Selected inventory transactions, programs and commodities without activity from October 1, 2018 to September 30, 2019 were eliminated.
FPAC, Business Center, Budget Division, Program Budget Branch, CCC Program Section, (202) 720-4697.

XI–4 STABILIZATION AND PRICE-SUPPORT PROGRAMS
Table 11-5.—Commodity Credit Corporation: Cost value of export and domestic commodity dispositions, by type of disposition, fiscal year 2019
(In Thousands)
Commodity 1
Domestic
Dollar sales (Costs)
Transfers to other
Government agencies
Donations 2
Inventory adjustments
and other recoveries (domestic)
Total domestic
Feed grains: Corn products ......................................... 0 0 0 0 0 Grain sorghum ........................................ 0 0 0 0 0
Food grains, cotton and tobacco: Wheat ..................................................... 0 0 0 0 0 Wheat flour ............................................. 0 0 0 0 0 Rice, milled ............................................. 0 0 0 0 0 Cotton, extra long staple & upland ........ 0 0 0 117,784 117,784
Oils and oilseeds: Peanuts .................................................. 0 0 0 10,401 10,401 Peanut butter .......................................... 0 0 3,304 0 3,304 Soya flour ............................................... 0 0 0 (2) (2) Soybeans & Soybean products .............. 0 0 0 0 0
Grains and seeds: Lentils dry ............................................... 0 0 0 0 0 Dry edible beans .................................... 0 0 0 0 0 Vegetable oil products ............................ 0 0 0 0 0 Other (miscellaneous,tallow & TMP-
Food Distribution) ............................... 0 0 0 796,157 796,157
Total ............................................................... 0 0 3,304 924,340 927,644
Commodity 1
Export Total export and
domestic Dollar sales (Costs)
Public law 480 (Costs) Donations 1 Total export
Feed grains: Corn products ......................................... 0 0 12,364 12,364 12,364 Grain sorghum ........................................ 0 0 52,384 52,384 52,384
Food grains, cotton and tobacco: Wheat ..................................................... 0 15,044 122,117 137,175 137,175 Wheat flour ............................................. 0 0 (1) (1) (1) Rice, milled ............................................. 0 19,743 14,234 33,977 33,977 Cotton, extra long staple & upland ........ 0 0 0 0 117,784
Oils and oilseeds: Peanuts .................................................. 0 0 0 0 10,401 Peanut butter .......................................... 0 0 0 0 3,304 Soya flour ............................................... 0 0 42,973 42,970 42,968 Soybeans & Soybean products .............. 0 15,625 0 15,625 15,625
Grains and seeds: Lentils dry ............................................... 0 0 8,069 8,069 8,069 Dry edible beans .................................... 0 0 15,631 15,631 15,631 Peas, dried whole ................................... .................... 0 36,238 36,238 36,238 Vegetable oil products ............................ 0 47,691 100,160 147,852 147,852 Other (miscellaneous, tallow & TMP-
Food Distribution) ............................... 0 1,123 3,494 4,616 800,773
Total ............................................................... 0 99,227 407,662 506,900 1,434,544
1 Commodities without any activity were removed from the table. 2 Includes donations under section 202,407,416, Section 210, P.L. 85-540, miscellaneous donations under various other authorizations.
FPAC, Business Center, Budget Division, Program Budget Branch, CCC Program Section, (202) 720-4697.

XI–5 AGRICULTURAL STATISTICS 2020
Table 11-6.—Commodity Credit Corporation: Investment in price-support operations, March 31 and June 30, 2008–2019 1
Year Month
Inventory investment
Loan investment
Total investment
Million dollars Million dollars Million dollars
2008: March ............... 168 5,926 6,094 June ................. 11 3,335 3,346
2009: March ............... 174 4,647 4,821 June ................. 209 2,215 2,424
2010: March ............... 119 4,054 4,173 June ................. 70 1,996 2,066
2011: March ............... 41 3,259 3,300 June ................. 66 1,588 1,654
2012: March ............... 63 2,740 2,803 June ................. 27 1,260 1,287
2013: March ............... 28 2,981 3,009 June ................. 43 1,664 1,707
2014: March ............... 188 2,094 2,282 June ................. 94 890 984
2015: March ............... 32 2,734 2,766 June ................. 41 1,572 1,613
2016: March ............... 25 3,934 3,959 June ................. 23 1,956 1,979
2017: March ............... 11 4,142 4,153 June ................. 24 2,095 2,119
2018: March ............... 7 4,192 4,199 June ................. 13 2,291 2,304
2019: March ............... 57 4,828 4,885 June ................. 51 2,826 2,877
1 Reflects total CCC loans and inventories investment. FPAC, Business Center, Budget Division, Program Budget Branch, CCC Program Section, (202) 720-4697.

XI–6 STABILIZATION AND PRICE-SUPPORT PROGRAMS
Table 11-7.—Commodity Credit Corporation: Loans made in fiscal year 2019 as of September 30, by State and Territories 1
State or Territory Barley Corn Cotton- bales
Dry whole peas Flaxseed
1,000 dollars
Alabama ............................................. ........................ 1,573 24,143 ........................ ........................Alaska ................................................ 6 ........................ ........................ ........................ ........................Arizona ............................................... ........................ 1,854 ........................ ........................ ........................Arkansas ............................................ ........................ 12,109 155,902 ........................ ........................California ............................................ ........................ ........................ 496,048 ........................ ........................Colorado ............................................ 160 17,958 ........................ ........................ ........................Connecticut ........................................ ........................ ........................ ........................ ........................ ........................Delaware ............................................ ........................ 603 ........................ ........................ ........................Florida ................................................ ........................ ........................ ........................ ........................ ........................Georgia .............................................. ........................ 7,473 5,670 ........................ ........................Hawaii ................................................ ........................ ........................ ........................ ........................ ........................Idaho .................................................. 2,823 384 ........................ 620 ........................Illinois ................................................. ........................ 136,940 76 ........................ ........................Indiana ............................................... ........................ 147,402 ........................ ........................ ........................Iowa ................................................... ........................ 359,405 ........................ ........................ ........................Kansas City Commodity .................... ........................ ........................ ........................ ........................ ........................Kansas ............................................... ........................ 22,601 ........................ ........................ ........................Kentucky ............................................ 50 40,004 ........................ ........................ ........................Louisiana ........................................... ........................ 4,729 19,620 ........................ ........................Maine ................................................. 327 60 ........................ ........................ ........................Maryland ............................................ ........................ 7,425 ........................ ........................ ........................Massachusetts ................................... ........................ 15 ........................ ........................ ........................Michigan ............................................ ........................ 54,438 ........................ ........................ ........................Minnesota .......................................... 1,012 372,489 ........................ 30 17 Mississippi ......................................... ........................ 12,004 571,146 ........................ ........................Missouri ............................................. ........................ 45,644 6,906 ........................ ........................Montana ............................................. 3,742 ........................ ........................ 20,387 212 Nebraska ........................................... ........................ 146,310 ........................ 419 ........................Nevada .............................................. ........................ ........................ ........................ ........................ ........................New Hampshire ................................. ........................ 21 ........................ ........................ ........................New Jersey ........................................ ........................ 559 ........................ ........................ ........................New Mexico ....................................... ........................ 1,100 ........................ ........................ ........................New York ........................................... ........................ 30,115 ........................ ........................ ........................North Carolina ................................... 23 3,281 38,827 ........................ ........................North Dakota ..................................... 3,086 50,991 ........................ 7,509 152 Ohio ................................................... ........................ 76,141 ........................ ........................ ........................Oklahoma .......................................... ........................ 1,137 128 ........................ ........................Oregon ............................................... ........................ ........................ ........................ ........................ ........................Pennsylvania ..................................... ........................ 10,708 ........................ ........................ ........................Rhode Island ..................................... ........................ ........................ ........................ ........................ ........................South Carolina ................................... ........................ 3,596 ........................ ........................ ........................South Dakota ..................................... 62 90,795 ........................ 239 ........................Tennessee ......................................... ........................ 10,407 215,194 ........................ ........................Texas ................................................. ........................ 12,327 753,236 ........................ ........................Utah ................................................... 45 45 ........................ ........................ ........................Vermont ............................................. ........................ ........................ ........................ ........................ ........................Virginia ............................................... 24 5,215 49 ........................ ........................Washington ........................................ 61 515 ........................ 3,180 ........................West Virginia ..................................... ........................ 1,349 ........................ ........................ ........................Wisconsin .......................................... ........................ 61,503 ........................ ........................ ........................Wyoming ............................................ 180 880 ........................ ........................ ........................
Total ................................................... 11,601 1,752,105 2,286,945 32,384 381
See footnote(s) at end of table.

XI–7 AGRICULTURAL STATISTICS 2020
Table 11-7.—Commodity Credit Corporation: Loans made in fiscal year 2019 as of September 30, by State and Territories 1—Continued
State or Territory Honey Oats Oilseeds Peanuts Rice Seed Cotton
1,000 dollars
Alabama ........................................ .................... .................... .................... 6,462 .................... ....................Alaska ............................................ .................... .................... .................... .................... .................... ....................Arizona .......................................... .................... .................... .................... .................... .................... 568 Arkansas ........................................ 56 .................... .................... .................... 96,765 69 California ....................................... 457 .................... .................... .................... 88,391 ....................Colorado ........................................ 4 .................... 108 .................... .................... ....................Connecticut .................................... .................... .................... .................... .................... .................... ....................Delaware ....................................... .................... .................... .................... .................... .................... ....................Florida ............................................ 48 .................... .................... 24,349 .................... ....................Georgia .......................................... .................... .................... .................... 745,593 .................... ....................Hawaii ............................................ .................... .................... .................... .................... .................... ....................Idaho .............................................. 364 .................... 602 .................... .................... ....................Illinois ............................................. .................... 29 .................... .................... .................... ....................Indiana ........................................... .................... .................... .................... .................... .................... ....................Iowa ............................................... 103 6 .................... .................... .................... ....................Kansas City Commodity ................ .................... .................... .................... .................... .................... ....................Kansas ........................................... .................... 56 .................... .................... .................... 8,698 Kentucky ........................................ .................... .................... .................... .................... .................... ....................Louisiana ....................................... 53 .................... .................... .................... 5,716 ....................Maine ............................................. .................... 98 .................... .................... .................... ....................Maryland ........................................ .................... .................... .................... .................... .................... ....................Massachusetts ............................... .................... .................... .................... .................... .................... ....................Michigan ........................................ .................... 33 .................... .................... .................... ....................Minnesota ...................................... 713 68 1,029 .................... .................... ....................Mississippi ..................................... .................... .................... .................... 3,376 16,582 2,077 Missouri ......................................... .................... .................... .................... .................... 10,157 3,928 Montana ......................................... 758 75 1,174 .................... .................... ....................Nebraska ....................................... 65 24 .................... .................... .................... ....................Nevada .......................................... .................... .................... .................... .................... .................... ....................New Hampshire ............................. .................... .................... .................... .................... .................... ....................New Jersey .................................... .................... .................... .................... .................... .................... ....................New Mexico ................................... .................... .................... .................... 1,623 .................... ....................New York ....................................... 22 3 .................... .................... .................... ....................North Carolina ............................... .................... .................... .................... 35,395 .................... ....................North Dakota ................................. 96 169 14,062 .................... .................... ....................Ohio ............................................... .................... .................... .................... .................... .................... ....................Oklahoma ...................................... .................... .................... .................... 1,080 .................... 8,111 Oregon ........................................... 88 .................... .................... .................... .................... ....................Pennsylvania ................................. .................... 60 .................... .................... .................... ....................Rhode Island ................................. .................... .................... .................... .................... .................... ....................South Carolina ............................... .................... 18 .................... 2,217 .................... ....................South Dakota ................................. 1,605 459 3,976 .................... .................... ....................Tennessee ..................................... 15 .................... .................... .................... 896 ....................Texas ............................................. 981 14 .................... 46,307 12,201 8,158 Utah ............................................... 33 .................... .................... .................... .................... ....................Vermont ......................................... .................... .................... .................... .................... .................... ....................Virginia ........................................... .................... .................... .................... 67,387 .................... ....................Washington .................................... 108 .................... .................... .................... .................... ....................West Virginia ................................. .................... .................... .................... .................... .................... ....................Wisconsin ...................................... 50 11 .................... .................... .................... ....................Wyoming ........................................ .................... .................... .................... .................... .................... ....................
Total ............................................... 5,619 1,123 20,951 933,789 230,708 31,609
See footnote(s) at end of table.

XI–8 STABILIZATION AND PRICE-SUPPORT PROGRAMS
Table 11-7.—Commodity Credit Corporation: Loans made in fiscal year 2019 as of September 30, by State and Territories 1—Continued
State or Territory Sorghum Soybeans Sugar Wheat
1,000 dollars
Alabama ................................................. .............................. 689 .............................. 49 Alaska .................................................... .............................. .............................. .............................. ..............................Arizona ................................................... .............................. .............................. .............................. ..............................Arkansas ................................................ .............................. 25,952 .............................. ..............................California ................................................ .............................. .............................. .............................. ..............................Colorado ................................................ 171 84 126,168 6,161 Connecticut ............................................ .............................. .............................. .............................. ..............................Delaware ................................................ .............................. 304 .............................. ..............................Florida .................................................... .............................. .............................. 95,002 ..............................Georgia .................................................. .............................. 232 .............................. 57 Hawaii .................................................... .............................. .............................. .............................. ..............................Idaho ...................................................... .............................. .............................. 310,925 6,117 Illinois ..................................................... .............................. 76,279 .............................. 490 Indiana ................................................... .............................. 116,369 .............................. 114 Iowa ....................................................... .............................. 184,417 .............................. ..............................Kansas City Commodity ........................ .............................. .............................. .............................. ..............................Kansas ................................................... 1,419 14,047 .............................. 7,840 Kentucky ................................................ .............................. 29,953 .............................. 2,765 Louisiana ................................................ .............................. 3,551 253,914 ..............................Maine ..................................................... .............................. .............................. .............................. ..............................Maryland ................................................ .............................. 3,420 .............................. 903 Massachusetts ....................................... .............................. .............................. .............................. ..............................Michigan ................................................. .............................. 40,002 83,279 1,476 Minnesota .............................................. .............................. 190,475 138,909 30,599 Mississippi .............................................. .............................. 25,634 .............................. ..............................Missouri .................................................. 376 50,721 .............................. 1,115 Montana ................................................. .............................. .............................. .............................. 50,930 Nebraska ................................................ 199 48,227 .............................. 1,630 Nevada ................................................... .............................. .............................. .............................. ..............................New Hampshire ..................................... .............................. .............................. .............................. ..............................New Jersey ............................................ .............................. 399 .............................. 32 New Mexico ........................................... .............................. .............................. .............................. 676 New York ............................................... .............................. 12,019 .............................. 1,349 North Carolina ........................................ .............................. 3,318 .............................. 63 North Dakota .......................................... .............................. 48,803 .............................. 71,769 Ohio ....................................................... .............................. 88,693 .............................. 195 Oklahoma ............................................... 249 878 .............................. 4,798 Oregon ................................................... .............................. .............................. .............................. 3,962 Pennsylvania .......................................... .............................. 5,788 .............................. 649 Rhode Island .......................................... .............................. .............................. .............................. ..............................South Carolina ....................................... .............................. 1,197 .............................. 42 South Dakota ......................................... 1,044 68,246 .............................. 12,113 Tennessee ............................................. .............................. 10,316 .............................. 62 Texas ..................................................... 1,367 .............................. .............................. 631 Utah ....................................................... .............................. .............................. .............................. 795 Vermont ................................................. .............................. .............................. .............................. ..............................Virginia ................................................... .............................. 4,517 .............................. 166 Washington ............................................ .............................. .............................. .............................. 12,247 West Virginia .......................................... .............................. 1,450 .............................. ..............................Wisconsin ............................................... .............................. 27,012 .............................. 228 Wyoming ................................................ .............................. .............................. 16,848 843
Total ....................................................... 4,825 1,082,992 1,025,045 220,866
1 Loans made directly by Commodity Credit Corporation. As much as possible, loans have been distributed according to the location of producers receiving the loans. Direct loans to cooperative associations for the benefit of members have been distributed according to the location of the association.
FPAC, Business Center, Budget Division, Program Budget Branch, CCC Program Section, (202) 720-4697.

XI–9 AGRICULTURAL STATISTICS 2020
Table 11-8.—Farm Service Agency programs: Payments to producers, by program and commodity, United States, calendar year 2018–2019 1
Program and commodity 2018 2019
1,000 dollars 1,000 dollars Additional risk coverage ........................................................... 1,116,830 712,051 Auto conservation reserve program (CRP)-cost shares .......... 90,391 54,708 Biomass crop assistance ......................................................... 392 283 Cotton ginning cost share ........................................................ 215,831 100 Cotton transition program ........................................................ 12 1 CRP annual rental .................................................................... 1,816,927 1,796,319 CRP incentives ......................................................................... 44,661 21,730 CRP transition incentive ........................................................... 3,964 3,906 Dairy indemnity ........................................................................ 91 4,141 Direct and counter cyclical program ........................................ 164 29 Emergency Assistance program .............................................. 64,889 39,211 Emergency conservation program ........................................... 65,008 27,822 Emergency forest restoration ................................................... 2,354 1,478 Grasslands reserve program ................................................... 1,993 2,055 Geographic disadvantaged program 2 ..................................... 9,755 7,829 Livestock forage program ........................................................ 460,377 166,362 Livestock indemnity program ................................................... 38,299 63,366 Loan deficiency ........................................................................ 23 6,729 Margin protection-Dairy ............................................................ 253,615 15,105 Milk income loss II ................................................................... 1 1 Noninsured assistance program .............................................. 176,955 145,560 Pima cotton trust fund program ............................................... 14,814 0 Price loss coverage .................................................................. 2,075,956 1,959,025 Tree assistance program ......................................................... 43,514 (12,277) Trade mitigation programs ....................................................... 5,096,102 15,335,595 Upland cotton assistance ......................................................... 11,258 14,403 Wool manufacturers trust fund ................................................. 27,942 (2)
Grand Total .............................................................................. 11,632,118 20,365,530
1 Programs with no payment activity in CY2018 and CY2019 were eliminated. 2 Geographic Disadvantaged Program, $1,870, was added to CY2018 since it was not included previously.
FPAC, Business Center, Budget Division, Program Budget Branch, CCC Program Section, (202) 720-4697.

XI–10 STABILIZATION AND PRICE-SUPPORT PROGRAMS
Table 11-9.—Farm Service Agency programs: Payments received, by States, calendar year 2018–2019 1
State 2 Payments
2018 2019
1,000 dollars 1,000 dollars Alabama ............................................ 80,429 201,733 Alaska ................................................ 668 806 Arizona .............................................. 31,898 75,775 Arkansas ............................................ 487,565 862,715 California ........................................... 165,820 277,831 Colorado ............................................ 184,745 229,389 Connecticut ........................................ 2,157 1,420 Delaware ........................................... 6,619 28,224 District of Columbia ........................... 492 32,998 Florida ................................................ 61,318 71,877 Georgia .............................................. 218,521 502,953 Hawaii ................................................ 7,888 5,369 Idaho .................................................. 136,985 137,290 Illinois ................................................. 1,001,352 1,635,341 Indiana ............................................... 473,037 806,481 Iowa ................................................... 1,126,699 1,976,908 Kansas ............................................... 725,996 1,338,962 Kentucky ............................................ 138,711 300,094 Louisiana ........................................... 211,632 319,776 Maine ................................................. 4,946 2,915 Maryland ............................................ 26,566 94,521 Massachusetts ................................... 3,144 7,700 Michigan ............................................ 209,462 316,651 Minnesota .......................................... 734,829 1,175,432 Mississippi ......................................... 262,839 482,918 Missouri ............................................. 519,580 1,001,744 Montana ............................................. 288,699 268,341 Nebraska ........................................... 610,895 1,027,961 Nevada .............................................. 3,904 6,849 New Hampshire ................................. 1,621 974 New Jersey ........................................ 5,192 15,538 New Mexico ....................................... 74,241 89,466 New York ........................................... 64,557 75,096 North Carolina ................................... 86,801 321,014 North Dakota ..................................... 648,477 947,515 Ohio ................................................... 421,416 635,538 Oklahoma .......................................... 268,081 361,741 Oregon ............................................... 74,157 92,057 Pennsylvania ..................................... 65,184 118,353 Rhode Island ..................................... 394 296 South Carolina ................................... 30,429 97,331 South Dakota ..................................... 693,308 698,320 Tennessee ......................................... 107,568 288,942 Texas ................................................. 737,820 1,637,917 Utah ................................................... 36,165 30,671 Vermont ............................................. 11,189 6,045 Virginia ............................................... 49,121 112,464 Washington ........................................ 159,642 184,782 West Virginia ..................................... 2,872 6,322 Wisconsin .......................................... 252,092 373,876 Wyoming ............................................ 19,136 22,758 KCCO ................................................ 83,252 1,053,496 Puerto Rico ........................................ 11,369 3,866 Virgin Islands ..................................... 389 46 Guam ................................................. 154 53 North Mariana Islands Nat ................ 33 48 American Samoa ............................... 64 28
Total 3 ................................................ 11,632,120 20,365,527
1 Only for programs listed on Table 11-8. 2 Geographic Disadvantaged Program, $1,870, was added to CY2018 since it was not included previously. 3 Immaterial rounding differences of ($.02) and $.03 are due to presenting information by pro-grams on Table 11-8 and by State on Table 11-9. This addition affected the totals for Alaska, Hawaii, North Dakota, KCCO, Puerto Rico, Virgin Island, Guam, North Mariana Islands and American Samoa.
FPAC, Business Center, Budget Division, Program Budget Branch, CCC Program Section, (202) 720-4697.

XI–11 AGRICULTURAL STATISTICS 2020
Table 11-10.—Value of marketing order commodities, 2018-19 season 1
Commodity Crop Value Number of producers
1,000 dollars Number Citrus fruits
Oranges, grapefruit, tangerines, and tangelos (FL) ................................... 121,070 500
Oranges and grapefruit (TX) .......................... 89,797 170
Deciduous fruits
Olives (CA) ..................................................... 40,523 800 Desert grapes (CA) 2 ...................................... ............................................................ 38 Kiwifruit (CA) .................................................. 55,566 140 Avocados (FL) ................................................ 15,278 400 Apricots (WA) ................................................. 9,414 315 Cherries, sweet (WA) ..................................... 407,360 1,450 Pears (OR and WA) 3 .................................... 351,596 2,327 Cherries, tart (7 States) 4 ............................... 56,635 400 Cranberries (10 States) 5 ............................... 245,762 1,100
Dried fruits
Dates (CA) ..................................................... 86,109 70 Plums (CA) ..................................................... 194,832 800 Raisins (CA) ................................................... 661,063 2,600
Vegetables 6
Tomatoes (FL) ............................................... 328,468 75 Onions (ID-Eastern OR) ................................ 105,613 250 Onions (South TX) ......................................... 39,695 60 Onions (Vidalia, GA) ...................................... 90,013 62 Onions (Walla Walla, WA and OR) ............... 1,855 30 Potatoes (CO) ................................................ 144,913 166 Potatoes (ID-Eastern OR) .............................. 260,125 450 Potatoes (WA) ................................................ 82,731 267
Nuts and Spearmint Oil
Almonds (CA) ................................................. 5,602,500 6,800 Pecans (15 States) 7 ...................................... 421,531 2,500 Pistashios (CA, AZ and NM) 8 ....................... 2,615,550 1,236 Walnuts (CA) .................................................. 916,650 5,000 Hazelnuts (OR and WA) 9 .............................. 91,800 800 Spearmint oil
(WA, ID, OR, parts of UT and NV) 10 ..... 34,675 133
Subtotal .......................................................... 13,071,124 28,939
Apples (export act) 11 ..................................... 2,954,219 25,591 Grapes (export act) 12 .................................... 1,271,435 25,892 Peanuts(Nationwide standards) 13 ................. 1,169,953 6,182
Grand total 14 .................................................. 18,466,731 86,604
1 Programs under the oversight authority of the Marketing Order and Agreement Division, Specialty Crops Program, Agri-cultural Marketing Service.
2 California Desert Grape crop value data is not available. 3 Includes fresh and processed pears. 4 The marketing order regulates the handling of tart cherries in the states of Michigan, Utah, Wisconsin, Washington, New
York, Pennsylvania, and Oregon. The crop value shown is for the sum of the values for 5 states, excluding Pennsylvania and Oregon, for which NASS does not publish data.
5 The marketing order regulates the handling of cranberries in Wisconsin, Massachusetts, Oregon, New Jersey, Wash-ington, Rhode Island, Connecticut, Michigan, Minnesota, Oregon, and Long Island in New York. The crop value shown is the sum of crop values for the first 4 states listed and excludes the other six states for which NASS does not publish crop value data.
6 Sources: For tomatoes, Florida Tomato Committee, 2019 Annual Report. For the four onion marketing orders, NASS an-nual prices for dry onions in Idaho, Texas, Georgia, and Washington, respectively, were multiplied by shipment quantity data from the market order committees. For two of the three potato marketing orders (Colorado and Idaho-Eastern Oregon), NASS annual prices for fresh potato utilization for Colorado and Idaho, respectively, were multiplied by shipment quantity data from the marketing order committees. The Washington potato marketing order crop value is based on the state season average grower price for all potatoes (fresh and processed utilization combined), since NASS does not publish a price for Washington fresh potato utilization.
7 The crop value shown is the sum of values for eight states for which NASS pecan crop data is published: New Mexico, Georgia, Texas, Arizona, Oklahoma, California, Louisiana, Alabama.
8 NASS publishes pistachio crop value only for California. 9 NASS publishes hazelnut crop value only for Oregon. 10 The spearmint crop value shown is the sum of values for Washington, Idaho, and Oregon, and excludes the minor level
of production in Nevada and Utah, which is not published by NASS. 11 Value of U.S. utilized apple production, fresh and processed combined. 12 Value of utilized production of California table-type grapes. 13 Value of U.S. production of peanuts. The Farm Security and Rural Investment Act of 2002 terminated the Peanut Ad-
ministrative Committee (which locally administered Marketing Agreement No. 146). As a result, the marketing agreement was terminated and new quality standards were established for domestic and imported peanuts, administered by the Peanut Standards Board.
14 The number of producers is likely overstated to a moderate extent, since some producers may grow more than one of the commodities listed in this table.
AMS, Specialty Crops Programs, Promotion and Economics Division, (202) 720–9915.

XII–1
CHAPTER XII
AGRICULTURAL CONSERVATION AND FORESTRY STATISTICS
Statistics in this chapter concern conservation of various natural resources, particularly soil, water, timber, wetlands, wildlife, and improvement of water quality. Forestry statistics include area of pri-vate and public-owned forest land, timber production, imports and exports, pulpwood consumption and paper and board production, area burned over by forest fires, livestock grazing, and recreational use of national forest lands.
Conservation Practices on Active CRP Contracts, September 2019
Practice code Practice Acres
CP1 ................ Introduced grasses and legumes .................................................................. 3,157,028 CP2 ................ Native grasses ............................................................................................... 5,308,305 CP3 ................ Tree planting .................................................................................................. 670,717 CP4 ................ Wildlife habitat with woody vegetation .......................................................... 1,472,170 CP5 ................ Field windbreaks ............................................................................................ 63,164 CP6 ................ Diversions ...................................................................................................... 4 CP7 ................ Erosion control structures .............................................................................. 8 CP8 ................ Grass waterways ........................................................................................... 121,083 CP9 ................ Shallow water areas for wildlife ..................................................................... 26,467 CP10 .............. Existing grasses and legumes1 .................................................................... 2,353,928 CP11 .............. Existing trees ................................................................................................. 170,280 CP12 .............. Wildlife food plots .......................................................................................... 33,248 CP15 .............. Contour grass strips ...................................................................................... 59,188 CP16 .............. Shelterbelts .................................................................................................... 21,285 CP17 .............. Living snow fences ........................................................................................ 4,508 CP18 .............. Salinity reducing vegetation ........................................................................... 181,252 CP21 .............. Filter strips (grass) ......................................................................................... 716,815 CP22 .............. Riparian buffers (trees) .................................................................................. 617,179 CP23 .............. Wetland restoration ........................................................................................ 1,244,049 CP24 .............. Cross wind trap strips .................................................................................... 58 CP25 .............. Rare and declining habitat ............................................................................. 1,185,314 CP26 .............. Sediment retention ......................................................................................... 40 CP27 .............. Farmable wetland pilot (wetland) .................................................................. 98,113 CP28 .............. Farmable wetland pilot (upland) .................................................................... 217,308 CP29 .............. Wildlife habitat buffer (marginal pasture) ...................................................... 92,650 CP30 .............. Wetland buffer (marginal pasture) ................................................................. 35,741 CP31 .............. Bottomland hardwood .................................................................................... 160,049 CP32 .............. Hardwood trees ............................................................................................. 1 CP33 .............. Upland bird habitat buffers ............................................................................ 221,431 CP34 .............. Flood control structure ................................................................................... 69 CP36 .............. Longleaf pine ................................................................................................. 159,255 CP37 .............. Duck nesting habitat ...................................................................................... 450,312 CP38 .............. State acres for wildlife enhancement ............................................................ 1,981,161 CP39 .............. FWP--Constucted wetlands ........................................................................... 489 CP40 .............. FWP--Aquaculture wetlands .......................................................................... 16,711 CP41 .............. FWP--Flooded praire wetlands ...................................................................... 63,073 CP42 .............. Pollinator Habitat2 ......................................................................................... 505,566 CP87 .............. Grasslands-Native grass ............................................................................... 80,579 CP88 .............. Grasslands-Introduced grass ......................................................................... 836,716
Total ............................................................................................................... 22,325,377
1 Includes both introduced grasses and legumes and native grasses. 2 Does not include about 40,000 acres from Signup 39 before CP42 was implemented.
FSA, Conservation and Environmental Programs Division, (202) 690-1612.

XII–2 AGRICULTURAL CONSERVATION AND FORESTRY STATISTICS
CRP enrollment by sign up and initial contract year 1, as of September 2019
Sign up Before 2011 2011 2012 2013 2014 2015
26 ............... 41,999 .......................... .......................... .......................... .......................... ..........................28 ............... 75,299 .......................... .......................... .......................... .......................... ..........................29 ............... 261,405 .......................... .......................... .......................... .......................... ..........................30 ............... 232,408 .......................... .......................... .......................... .......................... ..........................31 ............... 207,346 .......................... .......................... .......................... .......................... ..........................32 ............... 1,332,375 232,765 .......................... .......................... .......................... ..........................33 ............... 179,678 .......................... .......................... .......................... .......................... ..........................35 ............... 221,624 .......................... .......................... .......................... .......................... ..........................36 ............... 269,913 .......................... .......................... .......................... .......................... ..........................37 ............... 437,450 .......................... .......................... 69 .......................... ..........................38 ............... 211,545 376,960 .......................... .......................... .......................... ..........................39 ............... .......................... 3,625,346 .......................... .......................... .......................... ..........................40 ............... .......................... 169,231 304,394 .......................... .......................... ..........................41 ............... .......................... .......................... 2,460,237 .......................... .......................... ..........................42 ............... .......................... .......................... 114,484 481,202 .......................... ..........................43 ............... .......................... .......................... .......................... 3,408,222 .......................... ..........................44 ............... .......................... .......................... .......................... 22,808 497,144 ..........................45 ............... .......................... .......................... .......................... .......................... 1,523,621 ..........................46 ............... .......................... .......................... .......................... .......................... 3,221 515,169 47 ............... .......................... .......................... .......................... .......................... .......................... 171,859 48 ............... .......................... .......................... .......................... .......................... .......................... ..........................49 ............... .......................... .......................... .......................... .......................... .......................... ..........................50 ............... .......................... .......................... .......................... .......................... .......................... ..........................51 ............... .......................... .......................... .......................... .......................... .......................... ..........................52 ............... .......................... .......................... .......................... .......................... .......................... ..........................All ............... 3,71,041 4,404,303 2,879,115 3,912,300 2,023,986 687,028
Sign up 2016 2017 2018 2019 Total
26 ............... ................................ ................................ ................................ ................................ 41,999 28 ............... ................................ ................................ ................................ ................................ 75,299 29 ............... ................................ ................................ ................................ ................................ 261,405 30 ............... ................................ ................................ ................................ ................................ 232,408 31 ............... ................................ ................................ ................................ ................................ 207,346 32 ............... ................................ ................................ ................................ ................................ 1,565,140 33 ............... ................................ ................................ ................................ ................................ 179,678 35 ............... ................................ ................................ ................................ ................................ 221,624 36 ............... ................................ ................................ ................................ ................................ 269,913 37 ............... ................................ ................................ ................................ ................................ 437,518 38 ............... ................................ ................................ ................................ ................................ 588,505 39 ............... ................................ ................................ ................................ ................................ 3,625,346 40 ............... ................................ ................................ ................................ ................................ 473,626 41 ............... ................................ ................................ ................................ ................................ 2,460,237 42 ............... ................................ ................................ ................................ ................................ 595,686 43 ............... ................................ ................................ ................................ ................................ 3,408,222 44 ............... ................................ ................................ ................................ ................................ 519,951 45 ............... ................................ ................................ ................................ ................................ 1,523,621 46 ............... ................................ ................................ ................................ ................................ 518,390 47 ............... 689,463 ................................ ................................ ................................ 861,322 48 ............... 511,630 812,501 7,403 ................................ 1,331,534 49 ............... ................................ 384,461 ................................ ................................ 384,461 50 ............... ................................ 30,833 1,297,213 1,016 1,329,062 51 ............... ................................ ................................ 11,019 281,080 292,099 52 ............... ................................ ................................ ................................ 434 434 200 ............. 464 87,908 448,580 40 536,992 201 ............. ................................ ................................ ................................ 383,558 383,558 All ............... 1,201,557 1,315,704 1,764,215 666,127 22,325,377
1 For CRP, contract year is the same as fiscal year, which begins Ocer 1. General Signup Numbers: 1-13, 15, 16, 18, 20, 26, 29, 33, 39, 41, 43, 459. Continuous Sign-up Numbers: 14, 17, 19, 21-
25, 27, 28, 30, 31, 35-38, 40, 42, 44, 46, 47, 48, 50, Grasslands Signup Number: 200. FSA, Conservation and Environmental Programs Division, (202) 690-1612.

XII–3 AGRICULTURAL STATISTICS 2020
Table 12-1.—Conservation Reserve Program (CRP): Enrollment by practice, under contract, September 2019
(CP1 and CP2)
State
CP1 Establishment of permanent introduced grasses and legumes
CP2 Establishment of permanent native grasses
Total acres treated
Total cost share
Avg cost share per
acre treated 1
Total acres treated
Total cost share
Avg cost share per
acre treated 1
Alabama ......................... 13,863 727,739 67.69 2,816 146,574 88.14 Alaska ............................ 1,100 0 ...................... ........................ 0 ......................Arkansas ........................ 3,769 150,055 61.48 3,153 255,877 101.71 California ........................ 19,659 748,616 156.26 157 2,100 300.00 Colorado ........................ 66,712 3,065,157 64.69 838,186 47,533,518 70.39 Delaware ........................ 31 11,105 358.23 23 16,310 700.00 Florida ............................ 28 0 ...................... 108 3,718 143.00 Georgia .......................... 803 69,876 114.21 47 10,962 812.00 Hawaii ............................ ........................ 0 ...................... ........................ 0 ......................Idaho .............................. 202,381 13,379,637 78.41 40,652 2,586,011 81.00 Illinois ............................. 182,777 8,545,423 61.92 43,202 6,281,955 198.21 Indiana ........................... 17,172 916,726 72.85 11,842 1,491,913 178.75 Iowa ............................... 230,226 7,352,062 41.65 126,002 18,013,567 218.92 Kansas ........................... 12,164 371,324 42.96 630,031 24,948,861 44.94 Kentucky ........................ 31,551 2,839,304 122.66 19,859 1,691,694 128.04 Louisiana ....................... 599 75,107 147.01 1,140 142,567 186.41 Maine ............................. 2,229 419,335 199.99 ........................ 0 ......................Maryland ........................ 6,702 584,703 164.51 1,893 223,307 226.76 Massachusetts ............... ........................ 0 ...................... ........................ 0 ......................Michigan ........................ 14,798 1,359,871 123.78 8,278 1,264,473 195.69 Minnesota ...................... 63,508 2,100,222 45.09 41,903 1,746,665 78.32 Mississippi ..................... 21,756 169,068 89.61 2,178 43,101 109.40 Missouri ......................... 429,071 18,322,183 82.37 126,038 11,338,994 158.94 Montana ......................... 382,816 5,664,584 27.08 226,141 3,494,928 33.76 Nebraska ....................... 29,554 1,557,301 70.09 241,110 15,060,891 76.68 Nevada .......................... 130 12,810 98.39 ........................ 0 ......................New Jersey .................... ........................ 0 ...................... 40 0 ......................New Mexico ................... 52,423 4,116,452 92.59 264,440 23,440,110 115.22 New York ....................... 4,989 1,148,645 270.72 373 76,595 294.23 North Carolina ............... 937 35,607 64.72 94 7,590 126.69 North Dakota ................. 129,466 5,208,293 49.00 13,296 949,362 89.23 Ohio ............................... 11,412 542,495 87.71 45,456 2,884,682 113.28 Oklahoma ...................... 114,410 5,120,419 60.33 290,602 14,823,509 68.31 Oregon ........................... 200,695 13,014,823 72.89 59,392 5,043,263 94.88 Pennsylvania ................. 69,518 6,577,229 146.14 24,633 2,622,255 181.33 South Carolina ............... 574 18,132 145.79 182 0 ......................South Dakota ................. 47,425 1,095,566 34.86 63,650 2,886,085 71.09 Tennessee ..................... 31,612 1,264,267 96.78 20,500 1,816,199 166.71 Texas ............................. 272,022 15,181,070 88.11 1,617,861 261,887,673 201.63 Utah ............................... 70,812 2,123,996 42.51 13,760 966,379 73.69 Vermont ......................... 7 0 ...................... ........................ 0 ......................Virginia ........................... 2,014 283,804 242.16 726 143,654 326.54 Washington .................... 263,084 13,389,590 63.30 502,985 33,300,930 93.15 West Virginia ................. 160 17,778 337.15 ........................ 0 ......................Wisconsin ...................... 54,309 3,986,378 93.81 22,419 2,381,405 170.56 Wyoming ........................ 97,754 1,636,834 28.13 3,136 83,701 48.28
United States ................. 3,157,028 143,203,583 66.13 5,308,305 489,611,379 120.42
1 Not including acres which receive no cost share. Total acres treated may not add due to rounding. FSA, Conservation and Environmental Programs Division, (202) 690-1612.

XII–4 AGRICULTURAL CONSERVATION AND FORESTRY STATISTICS
Table 12-2.—Conservation Reserve Program (CRP): Enrollment by practice, under contract, September 2019
(CP3 and CP4)
State
CP3 Tree planting CP4 Permanent wildlife habitat
Total acres treated
Total cost share
Avg cost share per
acre treated 1
Total acres treated
Total cost share
Avg cost share per
acre treated 1
Alabama ......................... 97,158 8,298,216 110.41 4,378 839,066 330.73 Alaska ............................ 0 0 ...................... 0 0 ......................Arkansas ........................ 28,952 2,050,423 107.74 1,663 90,233 70.97 California ........................ 14 0 ...................... 9,651 1,028 250.12 Colorado ........................ 14 0 ...................... 281,654 16,294,208 88.66 Delaware ........................ 2,120 643,674 335.32 554 152,488 371.22 Florida ............................ 13,708 611,605 158.68 330 0 ......................Georgia .......................... 54,564 5,790,762 135.64 1,358 241,242 234.47 Hawaii ............................ 13 55,854 4,168.21 0 0 ......................Idaho .............................. 5,277 435,214 90.29 58,991 2,030,200 49.10 Illinois ............................. 32,899 7,656,378 311.02 80,727 22,946,709 462.74 Indiana ........................... 12,032 2,550,320 340.19 6,185 546,839 187.92 Iowa ............................... 16,813 4,084,624 316.81 106,996 2,619,306 144.43 Kansas ........................... 312 29,133 186.93 321,479 15,524,830 57.25 Kentucky ........................ 3,016 658,153 278.07 243 23,200 105.15 Louisiana ....................... 36,352 2,377,857 101.84 32,354 2,267,511 104.88 Maine ............................. 90 84,326 938.00 38 0 ......................Maryland ........................ 978 181,604 529.46 1,229 78,493 179.54 Massachusetts ............... 0 0 ...................... 0 0 ......................Michigan ........................ 4,520 612,974 197.86 7,806 273,894 116.39 Minnesota ...................... 20,337 1,601,888 120.85 115,783 1,225,071 85.01 Mississippi ..................... 224,477 3,604,599 108.33 2,262 155,844 821.62 Missouri ......................... 12,964 1,061,813 202.82 2,185 157,100 159.67 Montana ......................... 31 0 ...................... 11,175 554,464 293.74 Nebraska ....................... 520 30,263 185.44 36,855 1,412,498 63.07 Nevada .......................... 0 0 ...................... 0 0 ......................New Jersey .................... 0 0 ...................... 0 0 ......................New Mexico ................... 0 0 ...................... 140 16,800 120.00 New York ....................... 457 380,129 962.42 439 257,229 766.68 North Carolina ............... 20,906 3,768,847 229.08 637 347,358 700.81 North Dakota ................. 418 33,298 179.18 200,305 12,250,080 78.30 Ohio ............................... 6,406 1,447,887 429.72 9,061 259,484 94.10 Oklahoma ...................... 37 0 ...................... 756 30,492 99.25 Oregon ........................... 1,353 165,728 381.56 8,415 885,094 158.36 Pennsylvania ................. 373 236,316 963.77 4,036 894,803 328.88 South Carolina ............... 18,919 605,289 71.30 595 55,411 226.49 South Dakota ................. 21 946 220.00 36,322 1,135,065 58.58 Tennessee ..................... 23,151 1,576,439 164.94 2,246 45,211 146.09 Texas ............................. 1,199 49,708 95.48 13,310 329,993 97.20 Utah ............................... 0 0 ...................... 13 0 ......................Vermont ......................... 0 0 ...................... 0 0 ......................Virginia ........................... 5,574 378,483 94.01 223 23,965 118.70 Washington .................... 2,412 164,864 73.63 107,464 7,190,271 111.62 West Virginia ................. 16 4,102 431.79 0 0 ......................Wisconsin ...................... 22,310 3,627,471 328.43 3,071 206,535 190.76 Wyoming ........................ 2 0 ...................... 1,223 41,451 81.81
United States ................. 670,717 54,859,187 165.84 1,472,170 91,403,464 102.13
1 Not including acres which receive no cost share. Total acres treated may not add due to rounding. FSA, Conservation and Environmental Programs Division, (202) 690-1612.

XII–5 AGRICULTURAL STATISTICS 2020
Table 12-3.—Conservation Reserve Program (CRP): Enrollment by practice, under contract, September 2019
(CP5, CP6, and CP7)
State
CP5 Establishment of field windbreaks CP6 Diversions
CP7 Erosion control structures
Total acres
treated
Total cost
share
Avg cost share
per acre treated 1
Total acres
treated
Total cost
share
Avg cost share
per acre treated 1
Total acres
treated
Total cost
share
Avg cost share per acre
treated 1
Alabama .................. 0 0 ................ ............ 0 .............. ............ 0 ................Alaska ...................... 0 0 ................ ............ 0 .............. ............ 0 ................Arkansas ................. 0 0 ................ ............ 0 .............. ............ 0 ................California ................. 0 0 ................ ............ 0 .............. ............ 0 ................Colorado .................. 906 439,785 768.99 ............ 0 .............. ............ 0 ................Delaware ................. 0 0 ................ ............ 0 .............. ............ 0 ................Florida ..................... 0 0 ................ ............ 0 .............. ............ 0 ................Georgia .................... 0 0 ................ ............ 0 .............. ............ 0 ................Hawaii ...................... 0 0 ................ ............ 0 .............. ............ 0 ................Idaho ....................... 55 81,853 2,041.73 ............ 0 .............. ............ 0 ................Illinois ...................... 1,908 339,124 259.64 3 0 .............. 4 0 ................Indiana ..................... 1,202 178,224 235.30 ............ 0 .............. 0 0 ................Iowa ......................... 5,579 970,988 304.58 ............ 0 .............. 1 0 ................Kansas .................... 1,054 285,102 483.06 ............ 0 .............. ............ 0 ................Kentucky .................. 0 0 ................ ............ 0 .............. ............ 0 ................Louisiana ................. 0 0 ................ ............ 0 .............. ............ 0 ................Maine ....................... 0 0 ................ ............ 0 .............. ............ 0 ................Maryland .................. 0 0 ................ ............ 0 .............. ............ 0 ................Massachusetts ........ 0 0 ................ ............ 0 .............. ............ 0 ................Michigan .................. 1,694 344,221 269.40 1 0 .............. ............ 0 ................Minnesota ................ 5,343 843,703 228.34 ............ 0 .............. 0 0 ................Mississippi ............... 0 0 ................ ............ 0 .............. ............ 0 ................Missouri ................... 31 2,327 323.19 ............ 0 .............. 1 0 ................Montana .................. 53 10,115 511.38 ............ 0 .............. ............ 0 ................Nebraska ................. 20,592 5,299,859 634.85 ............ 0 .............. ............ 0 ................Nevada .................... 0 0 ................ ............ 0 .............. ............ 0 ................New Jersey ............. 2 16,537 6,695.14 ............ 0 .............. ............ 0 ................New Mexico ............. 0 0 ................ ............ 0 .............. ............ 0 ................New York ................. 0 0 ................ ............ 0 .............. ............ 0 ................North Carolina ......... 8 161 84.74 ............ 0 .............. ............ 0 ................North Dakota ........... 2,706 1,314,948 717.93 ............ 0 .............. ............ 0 ................Ohio ......................... 3,164 600,463 381.06 ............ 0 .............. ............ 0 ................Oklahoma ................ 31 0 ................ ............ 0 .............. ............ 0 ................Oregon .................... 0 0 ................ ............ 0 .............. ............ 0 ................Pennsylvania ........... 0 0 ................ ............ 0 .............. ............ 0 ................South Carolina ........ 11 115 42.71 ............ 0 .............. ............ 0 ................South Dakota .......... 18,627 7,436,516 630.09 ............ 0 .............. ............ 0 ................Tennessee ............... 0 0 ................ ............ 0 .............. ............ 0 ................Texas ....................... 0 0 ................ ............ 0 .............. ............ 0 ................Utah ......................... 0 0 ................ ............ 0 .............. ............ 0 ................Vermont ................... 0 0 ................ ............ 0 .............. ............ 0 ................Virginia .................... 0 500 1,250.00 ............ 0 .............. ............ 0 ................Washington ............. 6 0 ................ ............ 0 .............. ............ 0 ................West Virginia ........... 0 0 ................ ............ 0 .............. ............ 0 ................Wisconsin ................ 88 14,400 514.84 ............ 0 .............. 1 0 ................Wyoming ................. 104 1,986 139.98 ............ 0 .............. ............ 0 ................
United States ........... 63,164 18,180,928 518.55 4 ............ .............. 8 ............ ................
1 Not including acres which receive no cost share. Total acres treated may not add due to rounding. FSA, Conservation and Environmental Programs Division, (202) 690-1612.

XII–6 AGRICULTURAL CONSERVATION AND FORESTRY STATISTICS
Table 12-4.—Conservation Reserve Program (CRP): Enrollment by practice, under contract, September 2019
(CP8 and CP9)
State
CP8 Grass waterways CP9 Shallow water areas for wildlife
Total acres treated
Total cost share
Avg cost share per acre treated 1
Total acres treated
Total cost share
Avg cost share per acre treated 1
Alabama ................. 0 0 ........................ 107 30,233 700.00 Alaska .................... 0 0 ........................ ........................ 0 ........................Arkansas ................ 5 66 12.74 466 4,520 57.10 California ................ 0 0 ........................ ........................ 0 ........................Colorado ................ 468 6,687 189.65 12 0 ........................Delaware ................ 1 0 ........................ 202 233,472 1,725.59 Florida .................... 0 0 ........................ ........................ 0 ........................Georgia .................. 23 4,265 947.78 13 14,424 1,109.54 Hawaii .................... 0 0 ........................ ........................ 0 ........................Idaho ...................... 0 0 ........................ 23 224 70.00 Illinois ..................... 30,961 24,028,568 1,387.41 4,102 1,539,973 821.10 Indiana ................... 18,084 37,798,209 5,150.67 864 179,191 937.49 Iowa ....................... 35,517 12,301,680 595.93 10,146 741,722 167.08 Kansas ................... 7,301 2,373,462 549.04 884 235,285 655.99 Kentucky ................ 5,029 7,287,877 1,999.87 1,751 607,557 1,458.20 Louisiana ............... 2 0 ........................ 476 65,580 342.74 Maine ..................... 45 250,347 7,988.11 ........................ 0 ........................Maryland ................ 220 553,355 6,450.10 1,017 971,070 2,820.58 Massachusetts ....... 0 0 ........................ ........................ 0 ........................Michigan ................ 423 547,555 3,360.68 1,195 398,098 555.81 Minnesota .............. 3,178 530,426 444.88 159 1,799 56.95 Mississippi ............. 52 0 ........................ 469 62,858 2,104.39 Missouri ................. 1,803 1,031,369 1,480.73 1,692 28,515 285.46 Montana ................. 58 270 40.30 11 0 ........................Nebraska ............... 1,128 329,270 530.35 147 36,997 574.58 Nevada .................. 0 0 ........................ ........................ 0 ........................New Jersey ............ 162 1,651,843 11,847.96 ........................ 0 ........................New Mexico ........... 0 0 ........................ ........................ 0 ........................New York ............... 37 47,389 2,163.87 3 3,462 1,018.24 North Carolina ....... 200 255,006 1,659.98 167 40,583 366.93 North Dakota ......... 81 12,985 362.00 ........................ 0 ........................Ohio ....................... 11,472 23,302,687 6,301.21 473 143,879 1,111.98 Oklahoma .............. 133 297 23.17 53 1,685 168.50 Oregon ................... 16 54 100.00 ........................ 0 ........................Pennsylvania ......... 200 266,442 2,529.60 31 6,200 984.13 South Carolina ....... 15 510 1,020.00 34 41,000 2,113.40 South Dakota ......... 1,388 261,165 324.50 41 0 ........................Tennessee ............. 164 148,667 2,119.88 57 10,660 640.24 Texas ..................... 1,160 796,914 1,202.60 83 6,806 680.60 Utah ....................... 6 0 ........................ ........................ 0 ........................Vermont ................. 15 12,315 1,021.15 ........................ 0 ........................Virginia ................... 83 340,173 4,767.00 52 119,189 3,144.83 Washington ............ 335 1,912 47.28 50 0 ........................West Virginia ......... 0 0 ........................ ........................ 0 ........................Wisconsin .............. 1,313 990,678 2,678.96 1,688 525,949 1,165.77 Wyoming ................ 0 0 ........................ ........................ 0 ........................
United States ......... 121,083 115,132,444 1,847.79 26,467 6,050,932 615.71
1 Not including acres which receive no cost share. Total acres treated may not add due to rounding. FSA, Conservation and Environmental Programs Division, (202) 690-1612.

XII–7 AGRICULTURAL STATISTICS 2020
Table 12-5.—Conservation Reserve Program (CRP): Enrollment by practice, under contract, September 2019
(CP10, CP11, and CP12)
State
CP10 Vegetative-cover-grass- already established
CP11 Vegetative-cover-trees- already established CP12 Wildlife food plots
Total acres treated
Total cost share
Avg cost share
per acre treated 1
Total acres
treated
Total cost share
Avg cost share
per acre treated 1
Total acres
treated
Total cost
share
Avg cost share
per acre treated 1
Alabama .......... 9,806 566,605 80.87 26,138 2,018,213 129.57 758 0 ..............Alaska ............. 1,414 0 .............. ................ 0 .............. .............. 0 ..............Arkansas ......... 3,774 78,450 148.75 7,487 89,297 200.38 292 0 ..............California ......... 8,851 0 .............. ................ 0 .............. 1 0 ..............Colorado .......... 450,400 4,770,261 32.65 11 0 .............. 110 0 ..............Delaware ......... .................... 0 .............. ................ 0 .............. 3 0 ..............Florida ............. 133 0 .............. 6,051 12,500 690.61 19 0 ..............Georgia ........... 694 24,000 568.72 12,149 383,241 146.69 102 0 ..............Hawaii ............. .................... 0 .............. ................ 0 .............. .............. 0 ..............Idaho ............... 52,190 22,063 11.50 291 0 .............. 71 0 ..............Illinois .............. 26,023 15,485 55.73 3,647 3,194 48.32 3,631 0 ..............Indiana ............ 4,338 4,282 13.52 1,430 0 .............. 311 30 50.00 Iowa ................. 52,144 1,364,208 112.97 1,324 99,572 549.45 4,006 0 ..............Kansas ............ 76,198 77,585 10.26 54 0 .............. 2,931 12 ..............Kentucky .......... 2,723 4,358 33.25 272 536 43.23 462 0 ..............Louisiana ......... 369 0 .............. 5,134 0 .............. 479 0 ..............Maine ............... 823 0 .............. 212 0 .............. .............. 0 ..............Maryland .......... 336 0 .............. 114 0 .............. 28 0 ..............Massachusetts .................... 0 .............. ................ 0 .............. .............. 0 ..............Michigan .......... 4,121 9,757 92.75 1,346 21,343 67.28 578 0 ..............Minnesota ........ 38,710 21,078 52.45 4,423 113,014 388.58 3,400 263 43.75 Mississippi ....... 9,254 0 .............. 67,718 445,158 389.97 1,676 0 ..............Missouri ........... 43,823 88,363 65.58 1,043 39,151 588.73 2,784 0 ..............Montana .......... 170,900 35,515 19.09 131 0 .............. 715 0 ..............Nebraska ......... 57,588 441,716 32.90 290 32,019 1,351.01 424 50 ..............Nevada ............ .................... 0 .............. ................ 0 .............. .............. 0 ..............New Jersey ..... 14 0 .............. ................ 0 .............. .............. 0 ..............New Mexico ..... 12,240 4,382 9.68 ................ 0 .............. 196 0 ..............New York ........ 3,555 152,349 107.42 147 9,360 248.28 33 0 ..............North Carolina 452 0 .............. 6,788 1,359,364 399.83 10 0 ..............North Dakota ... 121,649 1,384,791 19.71 102 61 45.19 1,787 0 ..............Ohio ................. 4,085 9,222 39.66 790 0 .............. 331 0 ..............Oklahoma ........ 169,527 487,199 10.19 84 0 .............. 666 0 ..............Oregon ............ 57,599 7,740,499 327.97 281 151,417 1,202.10 99 0 ..............Pennsylvania ... 4,597 265,094 135.20 21 0 .............. 736 142 106.77 South Carolina 898 0 .............. 10,356 96,362 48.96 85 0 ..............South Dakota .. 67,206 16,437 16.68 60 0 .............. 2,263 500 100.00 Tennessee ...... 10,928 621 17.91 5,212 3,444 59.38 252 0 ..............Texas ............... 626,801 11,262,662 112.23 1,142 0 .............. 2,378 1,880 100.00 Utah ................. 74,361 5,454 3.00 ................ 0 .............. 8 0 ..............Vermont ........... .................... 0 .............. ................ 0 .............. .............. 0 ..............Virginia ............ 568 56,629 422.26 1,615 79,937 246.11 20 0 ..............Washington ..... 96,132 114,542 23.36 423 3,923 55.01 713 80 ..............West Virginia ... .................... 0 .............. ................ 0 .............. .............. 0 ..............Wisconsin ........ 17,085 151,666 83.73 3,981 70,358 408.04 869 0 ..............Wyoming ......... 71,618 0 .............. 12 0 .............. 18 0 ..............
United States ... 2,353,928 29,175,270 65.00 170,280 5,031,464 186.97 33,248 2,815 88.70
1 Not including acres which receive no cost share. Total acres treated may not add due to rounding. FSA, Conservation and Environmental Programs Division, (202) 690-1612.

XII–8 AGRICULTURAL CONSERVATION AND FORESTRY STATISTICS
Table 12-6.—Conservation Reserve Program (CRP): Enrollment by practice, under contract, September 2019
(CP15, CP16, and CP17)
State
CP15 Contour grass strips CP16 Shelter belts CP17 Living snow fences
Total acres
treated
Total cost share
Avg cost share
per acre treated 1
Total acres
treated
Total cost share
Avg cost share
per acre treated 1
Total acres
treated
Total cost share
Avg cost share
per acre treated 1
Alabama ................ 0 0 .............. 0 0 .............. 0 0 ..............Alaska .................... 0 0 .............. 0 0 .............. 0 0 ..............Arkansas ............... 0 0 .............. 0 0 .............. 0 0 ..............California ............... 0 0 .............. 0 0 .............. 0 0 ..............Colorado ................ 9 0 .............. 2,166 1,271,744 693.66 23 9,084 925.05 Delaware ............... 0 0 .............. 0 0 .............. 0 0 ..............Florida ................... 0 0 .............. 0 0 .............. 0 0 ..............Georgia .................. 0 0 .............. 0 0 .............. 0 0 ..............Hawaii .................... 0 0 .............. 0 0 .............. 0 0 ..............Idaho ..................... 180 1,007 10.58 18 14,551 1,549.63 0 0 ..............Illinois .................... 844 21,088 59.80 96 9,515 292.59 41 3,491 170.130 Indiana ................... 20 170 113.33 19 3,057 285.70 0 48 266.67 Iowa ....................... 11,202 526,961 143.99 1,792 943,105 785.74 672 125,998 255.57 Kansas .................. 2,690 88,386 69.82 492 132,585 459.73 35 12,644 630.00 Kentucky ................ 30 0 .............. 0 0 .............. 0 0 ..............Louisiana ............... 0 0 .............. 0 0 .............. 0 0 ..............Maine ..................... 0 0 .............. 0 0 .............. 0 0 ..............Maryland ................ 1 0 .............. 0 0 .............. 0 0 ..............Massachusetts ...... 0 0 .............. 0 0 .............. 0 0 ..............Michigan ................ 2 0 .............. 25 1,986 198.80 11 0 ..............Minnesota .............. 739 16,682 56.65 2,874 539,787 258.06 2,410 366,745 202.00 Mississippi ............. 40 0 .............. 0 0 .............. 0 0 ..............Missouri ................. 735 9,054 83.31 48 24,328 859.65 0 0 ..............Montana ................ 0 0 .............. 103 16,097 825.49 188 9,022 405.30 Nebraska ............... 277 4,763 47.44 1,033 269,121 410.49 89 3,617 291.46 Nevada .................. 0 0 .............. 0 0 .............. 0 0 ..............New Jersey ........... 1 4,391 7,841.07 0 0 .............. 0 0 ..............New Mexico ........... 0 0 .............. 0 0 .............. 0 0 ..............New York ............... 0 0 .............. 0 0 .............. 0 0 ..............North Carolina ....... 0 0 .............. 5 0 .............. 0 0 ..............North Dakota ......... 1 0 .............. 2,917 1,780,325 765.20 472 243,695 667.20 Ohio ....................... 14 0 .............. 67 11,514 290.75 0 0 ..............Oklahoma .............. 0 0 .............. 21 0 .............. 0 0 ..............Oregon .................. 0 0 .............. 0 0 .............. 0 0 ..............Pennsylvania ......... 44 1,492 78.65 0 0 .............. 0 0 ..............South Carolina ...... 0 0 .............. 0 0 .............. 0 0 ..............South Dakota ........ 25 111 30.25 9,597 4,103,060 674.34 556 227,728 643.83 Tennessee ............. 20 0 .............. 0 0 .............. 0 0 ..............Texas ..................... 71 0 .............. 0 0 .............. 0 0 ..............Utah ....................... 18 0 .............. 0 0 .............. 0 0 ..............Vermont ................. 0 0 .............. 0 0 .............. 0 0 ..............Virginia .................. 2 286 130.00 0 0 .............. 0 0 ..............Washington ........... 41,679 110,992 46.91 8 1,750 5,833.33 0 0 ..............West Virginia ......... 0 0 .............. 0 0 .............. 0 0 ..............Wisconsin .............. 484 7,568 205.15 3 842 701.67 10 616 150.30 Wyoming ............... 0 0 .............. 2 0 .............. 0 0 ..............
United States ......... 59,188 792,951 95.46 21,285 9,123,367 623.52 4,508 1,002,689 321.69
1 Not including acres which receive no cost share. Total acres treated may not add due to rounding. FSA, Conservation and Environmental Programs Division, (202) 690-1612.

XII–9 AGRICULTURAL STATISTICS 2020
Table 12-7.—Conservation Reserve Program (CRP): Enrollment by practice, under contract, September 2019
(CP18 and CP21)
State
CP18 Salt tolerant grasses CP21 Alternative perennials
Total acres treated
Total cost share
Avg cost share per
acre treated 1
Total acres treated
Total cost share
Avg cost share per
acre treated 1
Alabama ............................. 0 0 ...................... 230 10,105 218.25 Alaska ................................ 0 0 ...................... 0 0 ......................Arkansas ............................ 0 0 ...................... 4,540 339,518 227.64 California ............................ 0 0 ...................... 0 0 ......................Colorado ............................ 7 0 ...................... 97 10,325 398.96 Delaware ............................ 0 0 ...................... 497 131,930 351.21 Florida ................................ 0 0 ...................... 0 0 ......................Georgia .............................. 0 0 ...................... 308 25 10.87 Hawaii ................................ 0 0 ...................... 0 0 ......................Idaho .................................. 0 0 ...................... 615 49,449 90.97 Illinois ................................. 4 261 104.40 100,765 7,274,242 118.57 Indiana ............................... 0 0 ...................... 43,721 2,144,531 126.50 Iowa ................................... 0 0 ...................... 185,578 14,875,995 149.10 Kansas ............................... 562 0 ...................... 19,559 972,195 88.46 Kentucky ............................ 0 0 ...................... 16,041 738,722 101.32 Louisiana ........................... 0 0 ...................... 307 3,984 99.01 Maine ................................. 0 0 ...................... 57 0 ......................Maryland ............................ 0 0 ...................... 22,444 1,319,777 159.65 Massachusetts ................... 0 0 ...................... 20 14,274 714.77 Michigan ............................ 0 0 ...................... 22,681 2,193,851 130.16 Minnesota .......................... 4,355 186,013 59.75 110,523 5,797,455 88.43 Mississippi ......................... 0 0 ...................... 4,533 110,385 105.80 Missouri ............................. 0 0 ...................... 22,647 453,491 114.75 Montana ............................. 63,854 133,644 30.16 174 2,331 23.59 Nebraska ........................... 449 3,588 42.57 13,665 693,169 72.17 Nevada .............................. 0 0 ...................... 0 0 ......................New Jersey ........................ 0 0 ...................... 317 50,597 217.43 New Mexico ....................... 0 0 ...................... 0 0 ......................New York ........................... 0 0 ...................... 316 110,455 415.67 North Carolina ................... 0 0 ...................... 785 166,919 512.18 North Dakota ..................... 93,173 1,392,640 41.48 7,055 220,936 48.45 Ohio ................................... 0 0 ...................... 67,932 2,634,815 91.50 Oklahoma .......................... 1,514 10,961 78.01 471 38 3.52 Oregon ............................... 0 0 ...................... 1,456 103,321 239.00 Pennsylvania ..................... 0 0 ...................... 711 26,143 132.98 South Carolina ................... 0 0 ...................... 1,031 19,113 133.54 South Dakota ..................... 16,897 564,407 41.23 9,467 273,166 42.10 Tennessee ......................... 0 0 ...................... 4,220 319,442 218.69 Texas ................................. 436 20 0.13 556 36,000 160.46 Utah ................................... 0 0 ...................... 0 0 ......................Vermont ............................. 0 0 ...................... 123 23,956 217.31 Virginia ............................... 0 0 ...................... 2,416 145,492 124.87 Washington ........................ 0 0 ...................... 32,404 1,184,609 82.04 West Virginia ..................... 0 0 ...................... 577 197,278 885.85 Wisconsin .......................... 0 0 ...................... 17,976 1,383,955 159.31 Wyoming ............................ 0 0 ...................... 0 0 ......................
United States ..................... 181,252 2,291,534 41.52 716,815 44,031,988 118.35
1 Not including acres which receive no cost share. Total acres treated may not add due to rounding. FSA, Conservation and Environmental Programs Division, (202) 690-1612.

XII–10 AGRICULTURAL CONSERVATION AND FORESTRY STATISTICS
Table 12-8.—Conservation Reserve Program (CRP): Enrollment by practice, under contract, September 2019
(CP22 and CP23)
State
CP22 Riparian buffer CP23 Wetland restoration
Total acres treated
Total cost share
Avg cost share per acre treated 1
Total acres treated
Total cost share
Avg cost share per acre treated 1
Alabama ................. 23,095 1,641,914 185.66 5 0 ........................Alaska .................... 50 0 ........................ 0 0 ........................Arkansas ................ 53,342 2,119,927 111.02 66,364 15,068,268 532.47 California ................ 576 266,400 576.36 572 0 ........................Colorado ................ 429 171,836 1,008.90 1,472 68,183 86.98 Delaware ................ 57 8,125 273.57 192 230,544 1,651.22 Florida .................... 64 0 ........................ 0 0 ........................Georgia .................. 566 146,111 703.78 403 0 ........................Hawaii .................... 1,248 3,820,840 4,800.05 0 0 ........................Idaho ...................... 2,916 247,240 244.81 401 2,125 83.99 Illinois ..................... 95,106 14,660,211 212.01 44,690 7,726,575 210.60 Indiana ................... 4,729 524,778 250.74 11,910 1,478,243 214.50 Iowa ....................... 40,874 7,689,384 320.62 133,104 19,979,513 194.41 Kansas ................... 2,311 100,966 178.09 9,822 597,435 99.96 Kentucky ................ 15,326 3,511,550 302.27 220 75,113 1,264.95 Louisiana ............... 3,717 189,122 138.93 137,637 7,341,961 192.92 Maine ..................... 30 38,163 8,875.12 0 0 ........................Maryland ................ 10,196 2,214,231 812.85 2,153 1,158,729 1,319.36 Massachusetts ....... 0 0 ........................ 0 0 ........................Michigan ................ 1,399 427,775 446.16 18,327 3,201,036 223.43 Minnesota .............. 24,337 2,076,123 151.05 345,009 28,002,708 101.87 Mississippi ............. 156,268 2,824,887 81.58 21,350 884,848 184.90 Missouri ................. 20,259 1,057,093 296.99 21,059 2,629,322 268.34 Montana ................. 2,229 89,279 136.02 1,827 744 8.01 Nebraska ............... 1,345 265,377 431.06 13,008 715,447 99.34 Nevada .................. 0 0 ........................ 0 0 ........................New Jersey ............ 265 231,946 963.43 0 0 ........................New Mexico ........... 1,694 485,455 454.29 0 0 ........................New York ............... 7,019 5,489,707 1,499.78 60 4,616 1,394.56 North Carolina ....... 6,367 669,667 179.42 842 122,078 219.95 North Dakota ......... 238 116,408 717.99 196,362 1,821,549 45.60 Ohio ....................... 6,590 878,875 400.96 12,726 5,763,135 931.69 Oklahoma .............. 1,027 286,109 495.08 1,825 83,439 60.93 Oregon ................... 31,186 15,552,083 825.95 268 120,166 776.42 Pennsylvania ......... 19,075 14,181,685 1,337.05 649 368,426 981.11 South Carolina ....... 8,821 146,305 51.60 172 0 ........................South Dakota ......... 4,277 1,146,044 566.92 187,125 3,909,643 35.095 Tennessee ............. 4,551 528,443 431.35 673 31,976 106.26 Texas ..................... 13,390 1,604,445 258.72 8,860 95,837 52.877 Utah ....................... 26 0 ........................ 0 0 ........................Vermont ................. 2,267 2,651,935 1,565.28 0 0 ........................Virginia ................... 17,536 14,464,214 1,658.10 141 14,895 450.00 Washington ............ 18,776 6,562,370 965.54 62 4,636 111.44 West Virginia ......... 4,918 4,988,056 1,179.51 0 0 ........................Wisconsin .............. 6,637 842,512 556.19 4,761 414,666 357.89 Wyoming ................ 1,922 458,683 420.19 0 0 ........................
United States ......... 617,179 115,376,273 421.58 1,244,049 101,915,855 146.64
1 Not including acres which receive no cost share. Total acres treated may not add due to rounding. FSA, Conservation and Environmental Programs Division, (202) 690-1612.

XII–11 AGRICULTURAL STATISTICS 2020
Table 12-9.—Conservation Reserve Program (CRP): Enrollment by practice, under contract, September 2019
(CP25, CP26, and CP27)
State
CP25 Rare and declining habitat CP26 Sediment retention CP27 Farmable wetland pilot
(wetland)
Total acres treated
Total cost share
Avg cost share
per acre treated 1
Total acres treat-
ed
Total cost
share
Avg cost share
per acre treated 1
Total acres
treated
Total cost share
Avg cost share
per acre treated 1
Alabama .......... 393 17,622 142.46 .......... 0 .............. .............. 0 ..............Alaska ............. .................... 0 .............. .......... 0 .............. .............. 0 ..............Arkansas ......... .................... 0 .............. .......... 0 .............. .............. 0 ..............California ......... .................... 0 .............. .......... 0 .............. .............. 0 ..............Colorado .......... 1,604 28,812 65.28 .......... 0 .............. 2 0 ..............Delaware ......... .................... 0 .............. .......... 0 .............. .............. 0 ..............Florida ............. .................... 0 .............. .......... 0 .............. .............. 0 ..............Georgia ........... .................... 0 .............. .......... 0 .............. .............. 0 ..............Hawaii ............. .................... 0 .............. .......... 0 .............. .............. 0 ..............Idaho ............... 79 4,120 100.00 .......... 0 .............. 4 606 173.14 Illinois .............. 543 180,583 392.06 .......... 0 .............. 663 149,991 244.48 Indiana ............ 1,961 347,801 183.99 .......... 0 .............. 302 378,092 1,970.67 Iowa ................. 140,601 29,935,876 263.95 .......... 0 .............. 26,932 3,404,380 179.20 Kansas ............ 596,427 30,049,124 61.21 .......... 0 .............. 800 8,071 78.31 Kentucky .......... 32,089 6,276,111 210.60 .......... 0 .............. .............. 0 ..............Louisiana ......... .................... 0 .............. .......... 0 .............. 335 0 ..............Maine ............... .................... 0 .............. .......... 0 .............. .............. 0 ..............Maryland .......... 596 145,883 252.70 .......... 0 .............. .............. 0 ..............Massachusetts .................... 0 .............. .......... 0 .............. .............. 0 ..............Michigan .......... 35 462 65.00 40 117,708 3,372.73 22 995 199.00 Minnesota ........ 84,060 6,859,021 98.93 .......... 0 .............. 12,955 1,107,871 118.82 Mississippi ....... .................... 0 .............. .......... 0 .............. 40 5,109 129.34 Missouri ........... 22,297 2,556,724 182.29 .......... 0 .............. 2 0 ..............Montana .......... 57,886 1,868,715 51.92 .......... 0 .............. 175 240 27.59 Nebraska ......... 147,376 9,283,939 92.51 .......... 0 .............. 1,373 45,536 87.83 Nevada ............ .................... 0 .............. .......... 0 .............. .............. 0 ..............New Jersey ..... .................... 0 .............. .......... 0 .............. .............. 0 ..............New Mexico ..... .................... 0 .............. .......... 0 .............. .............. 0 ..............New York ........ .................... 0 .............. .......... 0 .............. .............. 0 ..............North Carolina .................... 0 .............. .......... 0 .............. .............. 0 ..............North Dakota ... 10,315 722,501 74.13 .......... 0 .............. 26,405 1,026,362 60.55 Ohio ................. 4,055 1,020,575 409.76 .......... 0 .............. 88 377,774 5,261.48 Oklahoma ........ 16,736 1,071,949 72.69 .......... 0 .............. 9 7,316 2,090.29 Oregon ............ 41,733 1,583,892 110.24 .......... 0 .............. .............. 0 ..............Pennsylvania ... .................... 0 .............. .......... 0 .............. .............. 0 ..............South Carolina .................... 0 .............. .......... 0 .............. .............. 0 ..............South Dakota .. 13,267 898,518 95.16 .......... 0 .............. 27,952 613,396 46.11 Tennessee ...... .................... 0 .............. .......... 0 .............. .............. 0 ..............Texas ............... .................... 0 .............. .......... 0 .............. .............. 0 ..............Utah ................. .................... 0 .............. .......... 0 .............. .............. 0 ..............Vermont ........... .................... 0 .............. .......... 0 .............. .............. 0 ..............Virginia ............ .................... 0 .............. .......... 0 .............. .............. 0 ..............Washington ..... 1,162 62,911 128.02 .......... 0 .............. 2 0 ..............West Virginia ... .................... 0 .............. .......... 0 .............. .............. 0 ..............Wisconsin ........ 11,417 2,030,802 218.14 .......... 0 .............. 55 603 118.24 Wyoming ......... 685 40,517 60.00 .......... 0 .............. .............. 0 ..............
United States ... 1,185,314 94,986,458 103.40 40 117,708 3,372.73 98,113 7,126,343 118.50
1 Not including acres which receive no cost share. Total acres treated may not add due to rounding. FSA, Conservation and Environmental Programs Division, (202) 690-1612.

XII–12 AGRICULTURAL CONSERVATION AND FORESTRY STATISTICS
Table 12-10.—Conservation Reserve Program (CRP): Enrollment by practice, under contract, September 2019
(CP28, CP29, and CP30)
State
CP28 Farmable wetland pilot (buffer)
CP29 Wildlife habitat buffer (marginal pastureland)
CP30 Wetland buffer (marginal pastureland)
Total acres
treated
Total cost share
Avg cost share
per acre treated 1
Total acres
treated
Total cost share
Avg cost share per
acre treated 1
Total acres
treated
Total cost share
Avg cost share
per acre treated 1
Alabama ........ 0 0 .............. 374 1,400 250.00 .............. 0 ..............Alaska ............ .............. 0 .............. ................ 0 ................ 140 12,252 2,005.24 Arkansas ....... 0 0 .............. 268 126,723 919.61 2,706 26,865 107.59 California ....... .............. 0 .............. ................ 0 ................ .............. 0 ..............Colorado ........ 4 0 .............. 58 0 ................ 32 0 ..............Delaware ....... .............. 0 .............. ................ 0 ................ .............. 0 ..............Florida ........... .............. 0 .............. ................ 0 ................ .............. 0 ..............Georgia .......... .............. 0 .............. 26 0 ................ .............. 0 ..............Hawaii ............ .............. 0 .............. ................ 0 ................ .............. 0 ..............Idaho ............. 2 62 31.00 194 46,728 768.43 142 15,406 137.31 Illinois ............ 1,128 187,737 179.26 246 36,587 307.74 33 4,143 134.12 Indiana ........... 558 51,555 129.88 56 21,965 480.63 41 7,366 180.54 Iowa ............... 65,063 7,251,713 158.71 6,245 1,259,714 339.09 1,537 179,455 223.91 Kansas .......... 1,555 45,161 47.84 4 224 56.00 .............. 0 ..............Kentucky ........ .............. 0 .............. 49,408 7,625,012 166.91 .............. 0 ..............Louisiana ....... 0 0 .............. ................ 0 ................ 176 0 ..............Maine ............. .............. 0 .............. 5 18,088 36,176.00 11 33,012 2,895.79 Maryland ........ .............. 0 .............. 1,054 208,240 354.66 154 5,630 499.56 Massachusetts .............. 0 .............. ................ 0 ................ .............. 0 ..............Michigan ........ 47 3,149 185.02 4 0 ................ 300 280,626 1,113.90 Minnesota ...... 26,974 2,120,552 107.24 230 11,055 98.43 5,000 240,467 116.47 Mississippi ..... 157 20,462 130.17 40 3,266 85.01 37 746 78.53 Missouri ......... 8 0 .............. 1,114 227,152 500.68 1,614 288,725 461.76 Montana ........ 134 149 27.59 ................ 0 ................ .............. 0 ..............Nebraska ....... 1,845 67,808 72.46 1,051 107,765 199.17 291 18,611 276.29 Nevada .......... .............. 0 .............. ................ 0 ................ .............. 0 ..............New Jersey ... .............. 0 .............. ................ 0 ................ .............. 0 ..............New Mexico ... .............. 0 .............. ................ 0 ................ .............. 0 ..............New York ....... .............. 0 .............. 1,998 1,082,908 1,037.43 1,171 950,223 1,006.44 North Carolina 0 0 .............. 27 41,592 8,318.40 .............. 0 ..............North Dakota 60,423 2,763,118 75.52 35 0 ................ .............. 0 ..............Ohio ............... 208 16,258 100.05 2,951 185,541 145.43 127 151,075 3,417.99 Oklahoma ...... 21 465 62.84 ................ 0 ................ .............. 0 ..............Oregon .......... .............. 0 .............. 15,841 2,245,064 562.81 540 799,528 1,481.54 Pennsylvania .............. 0 .............. 1,138 296,111 523.54 417 113,085 542.89 South Carolina .............. 0 .............. 35 19,137 694.63 61 7,189 116.99 South Dakota 59,107 2,508,835 59.21 4,269 199,985 97.94 20,642 240,483 43.32 Tennessee ..... .............. 0 .............. 74 6,761 535.34 .............. 0 ..............Texas ............. .............. 0 .............. 1,674 124,797 99.90 2 2,973 1,351.36 Utah ............... .............. 0 .............. ................ 0 ................ .............. 0 ..............Vermont ......... .............. 0 .............. ................ 0 ................ 1 1,612 2,302.86 Virginia .......... .............. 0 .............. 733 1,093,764 1,861.09 .............. 0 ..............Washington ... 8 0 .............. 695 31,340 519.73 543 669,128 1,309.40 West Virginia .............. 0 .............. ................ 0 ................ .............. 0 ..............Wisconsin ...... 67 796 118.81 1,149 161,369 234.26 22 13,446 619.63 Wyoming ....... .............. 0 .............. 1,314 173,350 432.08 .............. 0 ..............
United States 217,308 15,037,820 101.53 92,650 15,355,639 242.00 35,741 4,062,046 333.84
1 Not including acres which receive no cost share. Total acres treated may not add due to rounding. FSA, Conservation and Environmental Programs Division, (202) 690-1612.

XII–13 AGRICULTURAL STATISTICS 2020
Table 12-11.—Conservation Reserve Program (CRP): Enrollment by practice, under contract, September 2019
(CP31, CP32, and CP33)
State
CP31 Bottomland hardwood CP32 Hardwood trees CP33 Upland bird habitat buffers
Total acres
treated
Total cost share
Avg cost share
per acre treated 1
Total acres
treated
Total cost
share
Avg cost share
per acre treated 1
Total acres
treated
Total cost share
Avg cost share
per acre treated 1
Alabama ............ 1,206 88,081 122.64 .............. 0 .............. 681 65,527 130.75 Alaska ................ ................ 0 .............. .............. 0 .............. ................ 0 ..............Arkansas ........... 19,446 814,459 121.52 .............. 0 .............. 3,390 87,443 126.98 California ........... ................ 0 .............. .............. 0 .............. ................ 0 ..............Colorado ............ ................ 0 .............. .............. 0 .............. 1,434 70,329 95.75 Delaware ........... ................ 0 .............. .............. 0 .............. ................ 0 ..............Florida ............... ................ 0 .............. .............. 0 .............. ................ 0 ..............Georgia .............. ................ 0 .............. .............. 0 .............. 393 22,057 126.00 Hawaii ................ ................ 0 .............. .............. 0 .............. ................ 0 ..............Idaho ................. ................ 0 .............. .............. 0 .............. ................ 0 ..............Illinois ................ 6,240 1,184,922 233.59 .............. 0 .............. 59,801 6,479,795 123.57 Indiana ............... 9,382 1,976,975 246.67 .............. 0 .............. 9,660 651,385 107.74 Iowa ................... 3,947 951,187 318.92 .............. 0 .............. 24,200 3,922,324 239.87 Kansas .............. 216 31,663 223.97 .............. 0 .............. 25,592 1,143,921 76.03 Kentucky ............ 651 173,220 281.12 .............. 9 .............. 5,605 653,030 149.75 Louisiana ........... 51,364 2,767,813 99.06 .............. 0 .............. 134 8,478 97.56 Maine ................. ................ 0 .............. .............. 0 .............. ................ 0 ..............Maryland ............ ................ 0 .............. .............. 0 .............. 415 38,587 140.83 Massachusetts .. ................ 0 .............. .............. 0 .............. ................ 0 ..............Michigan ............ ................ 0 .............. .............. 0 .............. 571 69,660 146.70 Minnesota .......... 798 35,868 133.79 .............. 0 .............. 495 26,644 92.10 Mississippi ......... 61,153 1,210,382 98.08 .............. 0 .............. 1,304 26,232 264.09 Missouri ............. 2,030 112,948 184.33 .............. 0 .............. 24,385 1,563,423 109.87 Montana ............ ................ 0 .............. .............. 0 .............. 404 30,974 82.00 Nebraska ........... 9 4,794 542.92 .............. 0 .............. 9,315 418,737 94.91 Nevada .............. ................ 0 .............. .............. 0 .............. ................ 0 ..............New Jersey ....... ................ 0 .............. .............. 0 .............. ................ 0 ..............New Mexico ....... ................ 0 .............. .............. 0 .............. ................ 0 ..............New York ........... 2 2,000 869.57 .............. 0 .............. ................ 0 ..............North Carolina ... 57 1,978 139.30 .............. 0 .............. 3,311 113,691 125.50 North Dakota ..... ................ 0 .............. .............. 0 .............. ................ 0 ..............Ohio ................... 109 24,427 336.00 .............. 0 .............. 10,291 648,591 131.82 Oklahoma .......... 443 70,970 169.46 .............. 0 .............. 368 976 61.00 Oregon .............. ................ 0 .............. .............. 0 .............. ................ 0 ..............Pennsylvania ..... ................ 0 .............. .............. 0 .............. 292 25,869 158.76 South Carolina .. ................ 0 .............. .............. 0 .............. 1,124 11,271 56.44 South Dakota .... ................ 0 .............. .............. 0 .............. 1,447 76,582 69.35 Tennessee ......... 2,616 185,702 126.31 .............. 0 .............. 3,421 230,468 91.68 Texas ................. 381 2,925 65.73 .............. 0 .............. 30,800 1,153,553 123.81 Utah ................... ................ 0 .............. .............. 0 .............. ................ 0 ..............Vermont ............. ................ 0 .............. .............. 0 .............. ................ 0 ..............Virginia .............. ................ 0 .............. .............. 0 .............. 836 52,804 141.12 Washington ....... ................ 0 .............. .............. 0 .............. 1,553 39,395 110.52 West Virginia ..... ................ 0 .............. .............. 0 .............. ................ 0 ..............Wisconsin .......... ................ 0 .............. 1 0 .............. 208 5,869 170.66 Wyoming ........... ................ 0 .............. .............. 0 .............. ................ 0 ..............
United States ..... 160,049 9,640,313 142.94 1 ............ .............. 221,431 17,637,615 129.22
1 Not including acres which receive no cost share. Total acres treated may not add due to rounding. FSA, Conservation and Environmental Programs Division, (202) 690-1612.

XII–14 AGRICULTURAL CONSERVATION AND FORESTRY STATISTICS
Table 12-12.—Conservation Reserve Program (CRP): Enrollment by practice, under contract, September 2019
(CP34, CP36, and CP37)
State
CP34 Flood control structure CP36 Longleaf pine CP37 Duck nesting habitat
Total acres
treated
Total cost
share
Avg cost share
per acre treated 1
Total acres
treated
Total cost share
Avg cost share
per acre treated 1
Total acres
treated
Total cost share
Avg cost share
per acre treated 1
Alabama ............ ............ 0 .............. 13,749 2,752,896 228.91 ................ 0 ..............Alaska ................ ............ 0 .............. ................ 0 .............. ................ 0 ..............Arkansas ........... ............ 0 .............. ................ 0 .............. ................ 0 ..............California ........... ............ 0 .............. ................ 0 .............. ................ 0 ..............Colorado ............ ............ 0 .............. ................ 0 .............. ................ 0 ..............Delaware ........... ............ 0 .............. ................ 0 .............. ................ 0 ..............Florida ............... ............ 0 .............. 2,354 766,268 349.37 ................ 0 ..............Georgia .............. ............ 0 .............. 121,098 22,609,126 297.92 ................ 0 ..............Hawaii ................ ............ 0 .............. ................ 0 .............. ................ 0 ..............Idaho ................. ............ 0 .............. ................ 0 .............. ................ 0 ..............Illinois ................ ............ 0 .............. ................ 0 .............. ................ 0 ..............Indiana ............... ............ 0 .............. ................ 0 .............. ................ 0 ..............Iowa ................... ............ 0 .............. ................ 0 .............. 2,441 202,038 123.83 Kansas .............. ............ 0 .............. ................ 0 .............. ................ 0 ..............Kentucky ............ ............ 0 .............. ................ 0 .............. ................ 0 ..............Louisiana ........... ............ 0 .............. 34 3,560 105.01 ................ 0 ..............Maine ................. ............ 0 .............. ................ 0 .............. ................ 0 ..............Maryland ............ ............ 0 .............. ................ 0 .............. ................ 0 ..............Massachusetts .. ............ 0 .............. ................ 0 .............. ................ 0 ..............Michigan ............ ............ 0 .............. ................ 0 .............. ................ 0 ..............Minnesota .......... 69 5,617 112.90 ................ 0 .............. 24,028 1,965,905 92.38 Mississippi ......... ............ 0 .............. 147 5,621 142.30 ................ 0 ..............Missouri ............. ............ 0 .............. ................ 0 .............. ................ 0 ..............Montana ............ ............ 0 .............. ................ 0 .............. 3,394 20,229 16.39 Nebraska ........... ............ 0 .............. ................ 0 .............. ................ 0 ..............Nevada .............. ............ 0 .............. ................ 0 .............. ................ 0 ..............New Jersey ....... ............ 0 .............. ................ 0 .............. ................ 0 ..............New Mexico ....... ............ 0 .............. ................ 0 .............. ................ 0 ..............New York ........... ............ 0 .............. ................ 0 .............. ................ 0 ..............North Carolina ... ............ 0 .............. 7,325 1,226,074 270.61 ................ 0 ..............North Dakota ..... ............ 0 .............. ................ 0 .............. 188,594 6,304,196 49.68 Ohio ................... ............ 0 .............. ................ 0 .............. ................ 0 ..............Oklahoma .......... ............ 0 .............. ................ 0 .............. ................ 0 ..............Oregon .............. ............ 0 .............. ................ 0 .............. ................ 0 ..............Pennsylvania ..... ............ 0 .............. ................ 0 .............. ................ 0 ..............South Carolina .. ............ 0 .............. 14,169 1,485,470 144.00 ................ 0 ..............South Dakota .... ............ 0 .............. ................ 0 .............. 231,855 7,395,357 41.57 Tennessee ......... ............ 0 .............. ................ 0 .............. ................ 0 ..............Texas ................. ............ 0 .............. ................ 0 .............. ................ 0 ..............Utah ................... ............ 0 .............. ................ 0 .............. ................ 0 ..............Vermont ............. ............ 0 .............. ................ 0 .............. ................ 0 ..............Virginia .............. ............ 0 .............. 378 42,172 122.84 ................ 0 ..............Washington ....... ............ 0 .............. ................ 0 .............. ................ 0 ..............West Virginia ..... ............ 0 .............. ................ 0 .............. ................ 0 ..............Wisconsin .......... ............ 0 .............. ................ 0 .............. ................ 0 ..............Wyoming ........... ............ 0 .............. ................ 0 .............. ................ 0 ..............
United States ..... 69 5,617 112.90 159,255 28,891,187 274.18 450,312 15,887,724 48.30
1 Not including acres which receive no cost share. Total acres treated may not add due to rounding. FSA, Conservation and Environmental Programs Division, (202) 690-1612.

XII–15 AGRICULTURAL STATISTICS 2020
Table 12-13.—Conservation Reserve Program (CRP): Enrollment by practice, under contract, September 2019
(CP38, CP39, and CP40)
State
CP38 State acres for wildlife enhancement CP39 Constructed wetlands CP40 Aquaculture wetlands
Total acres
treated
Total cost share
Avg cost share
per acre treated 1
Total acres
treated
Total cost
share
Avg cost share per
acre treated 1
Total acres
treated
Total cost share
Avg cost share
per acre treated 1
Alabama .......... 2,114 126,966 116.01 0 0 ................ 14 504 36.52 Alaska .............. ................ 0 .............. 0 0 ................ 0 0 ..............Arkansas ......... 18,585 1,008,913 155.26 0 0 ................ 2,012 517,991 293.64 California ......... ................ 0 .............. 0 0 ................ 0 0 ..............Colorado .......... 73,121 3,956,024 81.25 0 0 ................ 0 0 ..............Delaware ......... ................ 0 .............. 0 0 ................ 0 0 ..............Florida ............. ................ 0 .............. 0 0 ................ 0 0 ..............Georgia ............ 15,804 1,010,174 126.63 0 0 ................ 0 0 ..............Hawaii .............. ................ 0 .............. 0 0 ................ 0 0 ..............Idaho ............... 145,740 10,557,754 78.18 0 0 ................ 0 0 ..............Illinois .............. 27,398 4,268,487 207.62 30 0 ................ 0 0 ..............Indiana ............. 57,476 6,337,791 132.39 0 0 ................ 0 0 ..............Iowa ................. 288,933 42,170,420 159.53 263 60,060 280.27 0 0 ..............Kansas ............ 204,027 8,153,305 63.59 7 830 350.21 0 0 ..............Kentucky .......... 15,355 1,365,495 177.85 0 0 ................ 0 0 ..............Louisiana ......... 477 33,668 92.75 1 138 156.82 3,220 559,700 173.79 Maine ............... 2,099 368,072 417.21 0 0 ................ 0 0 ..............Maryland .......... ................ 0 .............. 0 0 ................ 0 0 ..............Massachusetts ................ 0 .............. 0 0 ................ 0 0 ..............Michigan .......... 19,530 4,226,316 280.82 0 0 ................ 0 0 ..............Minnesota ........ 98,506 7,869,876 97.39 89 32,044 358.11 0 0 ..............Mississippi ....... 11,847 1,683,120 305.88 0 0 ................ 11,182 1,300,930 158.67 Missouri ........... 56,949 5,862,955 196.51 0 0 ................ 222 0 ..............Montana .......... 88,093 4,829,742 97.67 0 0 ................ 0 0 ..............Nebraska ......... 129,155 8,396,087 80.15 0 0 ................ 0 0 ..............Nevada ............ ................ 0 .............. 0 0 0 0 ................New Jersey ..... 979 148,196 189.13 0 0 ................ 0 0 ..............New Mexico ..... 2,600 0 .............. 0 0 ................ 0 0 ..............New York ......... 2,279 328,881 215.85 0 0 ................ 0 0 ..............North Carolina 875 103,413 212.24 0 0 ................ 58 692 197.71 North Dakota ... 158,613 4,225,643 46.78 0 0 ................ 0 0 ..............Ohio ................. 37,202 3,129,045 155.46 84 54,829 2,383.89 0 0 ..............Oklahoma ........ 8,319 2,647,326 573.36 0 0 ................ 0 0 ..............Oregon ............ 5,450 304,550 63.21 0 0 ................ 0 0 ..............Pennsylvania ... ................ 0 .............. 0 0 ................ 0 0 ..............South Carolina 1,066 176,990 227.65 0 0 ................ 0 0 ..............South Dakota .. 164,544 5,090,484 46.93 14 0 ................ 3 0 ..............Tennessee ....... 9,968 1,204,328 144.98 0 0 ................ 0 0 ..............Texas ............... 178,067 14,250,046 102.32 0 0 ................ 0 0 ..............Utah ................. ................ 0 .............. 0 0 ................ 0 0 ..............Vermont ........... ................ 0 .............. 0 0 ................ 0 0 ..............Virginia ............ 510 48,548 114.23 0 0 ................ 0 0 ..............Washington ..... 112,365 14,582,732 165.87 0 0 ................ 0 0 ..............West Virginia ... ................ 0 .............. 0 0 ................ 0 0 ..............Wisconsin ........ 31,959 4,080,676 179.73 0 0 ................ 0 0 ..............Wyoming ......... 9,831 850,961 87.95 0 0 ................ 0 0 ..............
United States ... 1,979,835 163,396,986 112.31 489 147,901 448.16 16,711 2,379,817 180.28
1 Not including acres which receive no cost share. Total acres treated may not add due to rounding. FSA, Conservation and Environmental Programs Division, (202) 690-1612.

XII–16 AGRICULTURAL CONSERVATION AND FORESTRY STATISTICS
Table 12-14.—Conservation Reserve Program (CRP): Enrollment by practice, under contract, September 2019
(CP41 and CP42)
State
CP41 Flooded prairie wetlands CP42 Pollinator Habitat 1
Total acres treated
Total cost share
Avg cost share per acre treated 1
Total acres treated
Total cost share
Avg cost share per acre treated 2
Alabama ................. 0 0 ........................ 85 10,259 122.73 Alaska .................... 0 0 ........................ 0 0 ........................Arkansas ................ 0 0 ........................ 50 6,553 412.14 California ................ 0 0 ........................ 1,819 0 ........................Colorado ................ 0 0 ........................ 19,046 2,295,663 152.02 Delaware ................ 0 0 ........................ 4 2,800 700.00 Florida .................... 0 0 ........................ 0 0 ........................Georgia .................. 0 0 ........................ 27 3,847 167.48 Hawaii .................... 0 0 ........................ 0 0 ........................Idaho ...................... 0 0 ........................ 7,830 658,264 101.40 Illinois ..................... 0 0 ........................ 105,702 45,233,686 433.40 Indiana ................... 0 0 ........................ 5,244 802,537 162.85 Iowa ....................... 125 21,879 196.91 219,435 112,321,932 520.62 Kansas ................... 0 0 ........................ 5,533 226,826 68.78 Kentucky ................ 0 0 ........................ 4,715 1,223,038 266.90 Louisiana ............... 0 0 ........................ 22 1,850 82.42 Maine ..................... 0 0 ........................ 0 0 ........................Maryland ................ 0 0 ........................ 32 2,889 300.00 Massachusetts ....... 0 0 ........................ 0 0 ........................Michigan ................ 0 0 ........................ 5,487 874,254 163.93 Minnesota .............. 1,052 72,521 80.59 14,495 3,935,145 279.41 Mississippi ............. 0 0 ........................ 0 0 ........................Missouri ................. 0 0 ........................ 45,055 6,002,455 222.44 Montana ................. 0 0 ........................ 5,492 234,469 56.97 Nebraska ............... 0 0 ........................ 28,172 1,940,360 82.37 Nevada .................. 0 0 ........................ 16 2,795 173.61 New Jersey ............ 0 0 ........................ 14 63,891 4,656.78 New Mexico ........... 0 0 ........................ 857 83,328 120.00 New York ............... 0 0 ........................ 44 21,152 530.38 North Carolina ....... 0 0 ........................ 20 5,145 643.13 North Dakota ......... 48,175 1,394,833 40.09 4,635 797,319 180.46 Ohio ....................... 0 0 ........................ 3,305 235,721 117.86 Oklahoma .............. 0 0 ........................ 146 7,967 107.11 Oregon ................... 0 0 ........................ 353 15,304 94.87 Pennsylvania ......... 0 0 ........................ 8 1,371 285.03 South Carolina ....... 0 0 ........................ 0 0 ........................South Dakota ......... 13,720 568,939 47.07 4,438 735,424 174.61 Tennessee ............. 0 0 ........................ 4,988 669,949 164.48 Texas ..................... 0 0 ........................ 11,993 946,285 130.43 Utah ....................... 0 0 ........................ 743 62,006 83.48 Vermont ................. 0 0 ........................ 0 0 ........................Virginia ................... 0 0 ........................ 196 28,764 359.64 Washington ............ 0 0 ........................ 3,096 300,202 117.44 West Virginia ......... 0 0 ........................ 0 0 ........................Wisconsin .............. 0 0 ........................ 2,236 648,036 398.21 Wyoming ................ 0 0 ........................ 230 43,386 188.40
United States ......... 63,073 2,058,172 42.98 505,566 180,444,870 394.89
1 Not including acres which receive no cost share. Total acres treated may not add due to rounding. FSA, Conservation and Environmental Programs Division, (202) 690-1612.

XII–17 AGRICULTURAL STATISTICS 2020
Table 12-15.—Conservation Reserve Program (CRP): Enrollment by practice, under contract, September 2019
(CP87 and CP88)
State
CP87 Grasslands-Native Grass CP88 Grasslands-Introduced grass
Total acres treated
Total cost share
Avg cost share per acre treated 2
Total acres treated
Total cost share
Avg cost share per acre treat-
ed 1
Alabama ............................ 2,035 0 ........................ 166 482,528 2,904.35 Alaska ................................ ........................ 0 ........................ .................... 0 ....................Arkansas ............................ ........................ 0 ........................ 60 0 ....................California ............................ 847 0 ........................ 588 0 ....................Colorado ............................ 1,401 16,368 100.00 81,153 506,386 46.81 Delaware ............................ ........................ 0 ........................ .................... 0 ....................Florida ................................ 378 0 ........................ .................... 0 ....................Georgia .............................. 1,350 2,624 17.01 .................... 0 ....................Hawaii ................................ ........................ 0 ........................ .................... 0 ....................Idaho .................................. ........................ 0 ........................ 23,784 861,429 49.28 Illinois ................................. 450 0 ........................ 3 0 ....................Indiana ............................... 54 0 ........................ 47 0 ....................Iowa ................................... 2,256 0 ........................ 793 0 ....................Kansas ............................... 607 261 25.02 24,206 13,818 25.00 Kentucky ............................ 3,376 0 ........................ 51 0 ....................Louisiana ........................... 1,217 0 ........................ 165 0 ....................Maine ................................. ........................ 0 ........................ .................... 0 ....................Maryland ............................ 894 11,899 46.53 35 0 ....................Massachusetts ................... ........................ 0 ........................ .................... 0 ....................Michigan ............................ 6,360 70,255 255.56 .................... 0 ....................Minnesota .......................... 752 0 ........................ 1,781 0 ....................Mississippi ......................... 420 0 ........................ 156 0 ....................Missouri ............................. 1,171 0 ........................ 784 0 ....................Montana ............................. 4,773 0 ........................ 43,114 33,648 14.04 Nebraska ........................... 21,164 7,426 43.87 310,770 648,942 61.51 Nevada .............................. ........................ 0 ........................ .................... 0 ....................New Jersey ........................ 154 0 ........................ .................... 0 ....................New Mexico ....................... 1,944 0 ........................ 93,196 804,034 70.35 New York ........................... 1,607 230,331 472.65 2 0 ....................North Carolina ................... 538 0 ........................ 7 0 ....................North Dakota ..................... 2,966 0 ........................ 22,894 14,088 30.29 Ohio ................................... 4,069 13,627 152.55 61 0 ....................Oklahoma .......................... 1,577 0 ........................ 33,347 8,629 27.57 Oregon ............................... 1,145 0 ........................ 15,930 0 ....................Pennsylvania ..................... 425 29,178 850.17 110 301 15.00 South Carolina ................... 101 7,708 76.26 .................... 0 ....................South Dakota ..................... 6,440 13,555 143.11 128,732 517,821 37.62 Tennessee ......................... 2,279 5,609 67.96 1,022 0 ....................Texas ................................. 1,731 27,359 88.72 27,885 564,081 124.23 Utah ................................... 85 0 ........................ 797 0 ....................Vermont ............................. ........................ 0 ........................ .................... 0 ....................Virginia ............................... 987 20,272 111.85 80 0 ....................Washington ........................ 276 0 ........................ 4,850 0 ....................West Virginia ..................... 2,140 16,682 51.07 .................... 0 ....................Wisconsin .......................... 821 0 ........................ 23 0 ....................Wyoming ............................ 1,789 0 ........................ 20,125 0 ....................
United States ..................... 80,579 473,154 173.07 836,716 4,455,705 61.46
1 Not including acres which receive no cost share. Total acres treated may not add due to rounding. FSA, Conservation and Environmental Programs Division, (202) 690-1612.

XII–18 AGRICULTURAL CONSERVATION AND FORESTRY STATISTICS
Table 12-16.—Emergency Conservation Program: Assistance, fiscal years 2010–2019 1
Year Emergency Conservation Program
1,000 dollars 2010 ................................................................................. 76,735 2011 ................................................................................. 32,262 2012 ................................................................................. 56,114 2013 ................................................................................. 41,206 2014 ................................................................................. 22,548 2015 ................................................................................. 24,001 2016 ................................................................................. 26,017 2017 ................................................................................. 56,353 2018 ................................................................................. 94,038 2019 ................................................................................. 71,852
1 Totals are from unrounded data. FSA, Conservation and Environmental Protection Division, (202) 690-1612.
Table 12-17.—Conservation Reserve Program (CRP): Enrollment by State, September 2019
State 1 Number of contracts
Number of farms Acres Annual rent
($1,000) Avg Payments 2
($/acre)
Alabama ................................. 4,851 3,635 199,170 9,148 45.93 Alaska .................................... 14 13 2,704 103 38.09 Arkansas ................................ 5,259 3,051 220,324 17,170 77.93 California ................................ 172 129 42,735 2,253 52.71 Colorado ................................ 9,919 5,355 1,820,532 63,068 34.64 Connecticut ............................ * * * * * Delaware ................................ 323 191 3,684 523 141.89 Florida .................................... 561 467 23,173 1,121 48.39 Georgia .................................. 6,356 4,403 209,729 13,443 64.10 Hawaii .................................... 27 18 1,261 61 48.59 Idaho ...................................... 3,590 2,041 541,835 28,481 52.56 Illinois ..................................... 76,531 42,768 853,668 167,270 195.94 Indiana ................................... 33,276 18,756 218,638 40,663 185.99 Iowa ....................................... 107,327 54,040 1,744,748 387,369 222.02 Kansas ................................... 34,812 20,498 1,946,905 85,868 44.10 Kentucky ................................ 12,326 6,482 207,775 32,870 158.20 Louisiana ............................... 4,464 2,921 275,713 25,073 90.94 Maine ..................................... 243 170 5,641 265 47.03 Maryland ................................ 4,834 2,773 50,493 10,895 215.77 Massachusetts ....................... 6 3 20 3 153.65 Michigan ................................ 9,381 5,508 120,929 15,827 130.88 Minnesota .............................. 55,355 29,157 1,058,276 133,995 126.62 Mississippi ............................. 14,565 9,617 598,515 44,682 74.66 Missouri ................................. 26,714 16,112 841,875 100,395 119.25 Montana ................................. 6,265 2,857 1,063,871 32,565 30.61 Nebraska ............................... 20,100 11,874 1,068,595 71,645 67.05 Nevada .................................. * * * * * New Hampshire ..................... * * * * * New Jersey ............................ 337 203 1,947 174 89.48 New Mexico ........................... 1,688 1,086 429,730 13,595 31.64 New York ............................... 1,574 1,135 24,533 2,279 92.90 North Carolina ....................... 3,459 2,477 50,417 3,659 72.58 North Dakota ......................... 20,826 10,890 1,293,082 67,215 51.98 Ohio ....................................... 35,223 19,546 242,527 42,545 175.42 Oklahoma .............................. 5,475 3,826 642,121 21,265 33.12 Oregon ................................... 3,687 2,053 441,752 28,033 63.46 Pennsylvania ......................... 7,785 5,204 127,015 16,573 130.48 Puerto Rico ............................ 5 5 515 27 51.55 Rhode Island ......................... * * * * * South Carolina ....................... 2,734 1,592 58,251 2,362 40.55 South Dakota ......................... 29,252 13,597 1,141,377 101,455 88.89 Tennessee ............................. 5,258 3,569 127,955 12,276 95.94 Texas ..................................... 18,895 13,665 2,811,809 103,526 36.82 Utah ....................................... 793 514 160,627 5,483 34.13 Vermont ................................. 370 271 2,413 276 114.34 Virginia ................................... 3,744 2,898 34,691 2,353 67.84 Washington ............................ 10,901 5,052 1,191,082 71,449 59.99 West Virginia ......................... 502 414 7,811 503 64.43 Wisconsin .............................. 13,765 8,778 204,964 30,530 148.95 Wyoming ................................ 768 490 209,765 5,139 24.50
United States ......................... 604,317 340,109 22,325,377 1,815,477 81.32
*Data withheld to avoid disclosure of individual operations. 1 State in which land is administered. 2 Payments made Oc-tober, 2019.
FSA, Conservation and Environmental Programs Division, (202) 690-1612.

XII–19 AGRICULTURAL STATISTICS 2020
Table 12-18.—Forest land: Total forest land and area and ownership of timberland, by regions, Jan. 1, 2017
Region Total forest land 1
Timberland 2
All own-erships
Federal State, county,
and municipal
Private
Total National forest Other Total Private
corporate
Private non-
corporate 3
1,000 1,000 1,000 1,000 1,000 1,000 1,000 1,000 1,000 acres acres acres acres acres acres acres acres acres
Northeast ............... 84,727 78,539 2,852 2,355 498 10,103 65,586 22,090 43,496 North Central ......... 91,062 86,355 8,495 7,792 704 15,549 62,310 8,106 54,204
North .................. 175,789 164,894 11,348 10,146 1,202 15,650 127,896 30,196 97,700
Southeast .............. 89,692 85,754 7,016 5,061 1,955 5,618 73,119 27,283 45,836 South Central ........ 155,821 122,338 9,380 7,197 2,183 3,942 109,016 36,220 72,795
South ................. 245,513 208,092 16,397 12,258 4,138 9,561 182,135 63,504 118,632
Great Plains .......... 6,797 6,084 1,217 1,051 166 265 4,602 202 4,400 Intermountain ........ 123,844 63,569 45,894 43,154 2,740 2,927 14,748 4,890 9,858
Rocky Mountains 130,641 69,654 47,111 44,206 2,905 3,193 19,350 5,091 14,259
Alaska .................... 128,735 12,996 4,874 3,848 1,025 4,810 3,313 2,827 486 Pacific Northwest .. 51,827 41,462 19,200 16,802 2,397 3,637 18,625 10,903 7,722 Pacific Southwest 4 32,986 17,326 9,249 8,877 372 245 7,833 4,634 3,198
Pacific Coast ...... 213,549 71,784 33,323 29,527 3,795 8,691 29,771 18,364 11,406
All regions ............. 765,493 514,425 108,178 96,138 12,040 47,095 359,152 117,155 241,997
Source: Forest Resources of the United States 2017 (a periodic compilation of the USDA Forest Service’s continuous for-est inventory, the next edition of which is due in 2022). Data may not add to totals because of rounding. 1 Forest land is land at least 10 percent stocked by forest trees of any size, including land that formerly had such tree cover and that will be naturally or artificially regenerated. Forest land includes transition zones, such as areas between heavily forested and non-forested lands that are at least 10 percent stocked with forest trees, and forest areas. The minimum area for classification of forest land is 1 acre. Roadside, streamside, and shelterbelt strips of timber must have a crown width at least 120 feet wide to qualify as forest land. Unimproved roads and trails, streams, and clearings in forest areas are classified as forest if less than 120 feet in width. 2 Timberland is forest land that is producing or is capable of producing crops of industrial wood and that is not withdrawn from timber utilization by statute or administrative regulation. Areas qualifying as timberland have the capability of producing more than 20 cubic feet per acre per year of industrial wood. Currently inaccessible and inoperable areas are included. 3 Includes Indian lands. 4 Includes Hawaii.
Prepared by Forest Service Research and Development, Washington Office, IMAR Staff.

XII–20 AGRICULTURAL CONSERVATION AND FORESTRY STATISTICS
Table 12-19.—Timber volume: Net volume of growing stock on timberland, by softwoods and hardwoods, and regions, 2017
Region Growing stock 1
All species Softwoods Hardwoods
Million cubic feet
Northeast ................... 152,780 37,108 115,672 North Central ............. 117,261 23,494 93,768
North ................... 270,041 60,601 209,440
Southeast .................. 142,603 67,540 75,063 South Central ............ 176,485 73,767 102,717
South .................. 319,088 141,307 177,781
Great Plains ............... 4,487 1,885 2,601 Intermountain ............. 125,518 117,217 8,301
Rocky Mountains 130,005 119,102 10,903
Alaska ........................ 37,140 33,761 3,379 Pacific Northwest ....... 159,238 146,480 12,758 Pacific Southwest 2 .... 69,726 59,273 10,452
Pacific Coast ...... 266,104 239,515 26,589
All regions .................. 985,238 560,526 424,712
Source: Forest Resources of the United States 2017 (a periodic compilation of the USDA Forest Service’s continuous for-est inventory, the next edition of which is due in 2022). Data may not add to totals because of rounding. 1 Live trees of commercial species meeting specified standards of quality or vigor. Cull trees are excluded. Includes only trees 5.0-inches diameter or larger at 41⁄2 feet above ground. 2 Includes Hawaii.
Prepared by Forest Service Research and Development, Washington Office, IMAR Staff.

XII–21 AGRICULTURAL STATISTICS 2020
Table 12-20.—Total volume of roundwood harvested in the United States, by sources and category, 2016
Category
All sources Growing stock 1 Other sources 2
All species
Soft- woods
Hard-woods
All species
Soft- woods
Hard-woods
All species
Soft- woods
Hard-woods
Million cubic feet
Roundwood products: Sawlogs ................... 5,521 4,075 1,446 5,334 3,959 1,374 187 115 72 Pulpwood ................. 5,368 3,640 1,728 4,772 3,280 1,493 596 360 235 Veneer logs ............. 660 590 69 648 582 65 12 8 4 Other products 3 ....... 728 575 153 563 423 141 165 153 12 Fuelwood ................. 1,695 599 1,096 332 149 183 1,363 450 913
Total ............................ 13,972 9,480 4,493 11,650 8,393 3,257 2,323 1,086 1,236
Logging residue4 ......... 3,758 1,942 1,815 1,126 451 676 2,631 1,492 1,139 Other removals 5 ......... 510 134 376 274 67 207 236 67 169
Total ............................ 4,268 2,076 2,191 1,400 518 883 2,867 1,559 1,308
Source: Forest Resources of the United States 2017 (a periodic compilation of the USDA Forest Service’s continuous for-est inventory, the next edition of which is due in 2022). Data may not add to totals because of rounding. 1 Includes live trees of commercial species meeting specified standards of quality or vigor. Cull trees are excluded. Includes only trees 5.0- inches diameter or larger at 41⁄2 feet above ground. 2 Includes salvable dead trees, rough and rotten trees, trees of non-commercial species, trees less than 5.0-inches diameter at 41⁄2 feet above ground, tops, and roundwood harvested from nonforest land (for example, fence rows). 3 Includes poles, pilings, posts, and miscellaneous products. 4 Net of wet rot or limbs. 5 Unutilized wood volume from cut or otherwise killed growing stock, from nongrowing stock sources on timberland (for example, precommercial thinnings), or from timberland clearing. Does not include volume removed from inventory through reclassification of timberland to reserved timberland.
Prepared by Forest Service Research and Development, Washington Office, IMAR Staff.
Table 12-21.—Net annual growth, removals, and mortality of growing stock on timberland in the United States, 2016
Region
Growth 1 Removals 2 Mortality 3
All species
Soft- woods
Hard-woods
All species
Soft- woods
Hard-woods
All species
Soft- woods
Hard-woods
Million cubic feet
Northeast ..................... 3,264 917 2,347 1,176 377 799 1,242 336 906 North Central ............... 2,668 629 2,039 1,315 277 1,038 1,379 231 1,147
North ........................ 5,932 1,546 4,386 2,491 654 1,837 2,621 567 2,053
Southeast .................... 6,393 4,285 2,108 3,527 2,736 790 1,085 528 557 South Central .............. 7,371 4,983 2,388 4,333 2,911 1,422 1,845 630 1,215
South ....................... 13,764 9,268 4,496 7,859 5,647 2,212 2,930 1,158 1,772
Great Plains ................ 57 (2) 59 34 29 6 82 43 39 Intermountain .............. 242 192 50 370 367 3 2,487 2,354 133
Rocky Mountain ....... 299 189 109 404 396 9 2,570 2,397 173
Alaska .......................... 254 133 121 39 39 - 302 275 27 Pacific Northwest ........ 3,707 3,423 284 1,891 1,811 81 1,201 1,030 171 Pacific Southwest 4 ...... 1,054 909 145 355 355 - 574 472 102
Pacific Coast ............ 5,015 4,465 550 2,286 2,204 82 2,078 1,777 300
All regions ................... 25,009 15,468 9,542 13,041 8,901 4,140 10,198 5,900 4,299
Source: Forest Resources of the United States 2017 (a periodic compilation of the USDA Forest Service’s continuous for-est inventory, the next edition of which is due in 2022). Data may not add to totals because of rounding. 1 The net increase in the volume of trees during a specified year. Components include the increment in net volume of trees at the beginning of the specific year surviving to its end, plus the net volume of trees reaching the minimum size class during the year, minus the volume of trees that died during the year, and minus the net volume of trees that became cull trees during the year. 2 The net volume of trees removed from the inventory during a specified year by harvesting, cultural operations such as timber stand improvement, or land clearing. 3 The volume of sound wood in trees that died from natural causes during a specified year. 4 Includes Hawaii.
Prepared by Forest Service Research and Development, Washington Office, IMAR Staff.
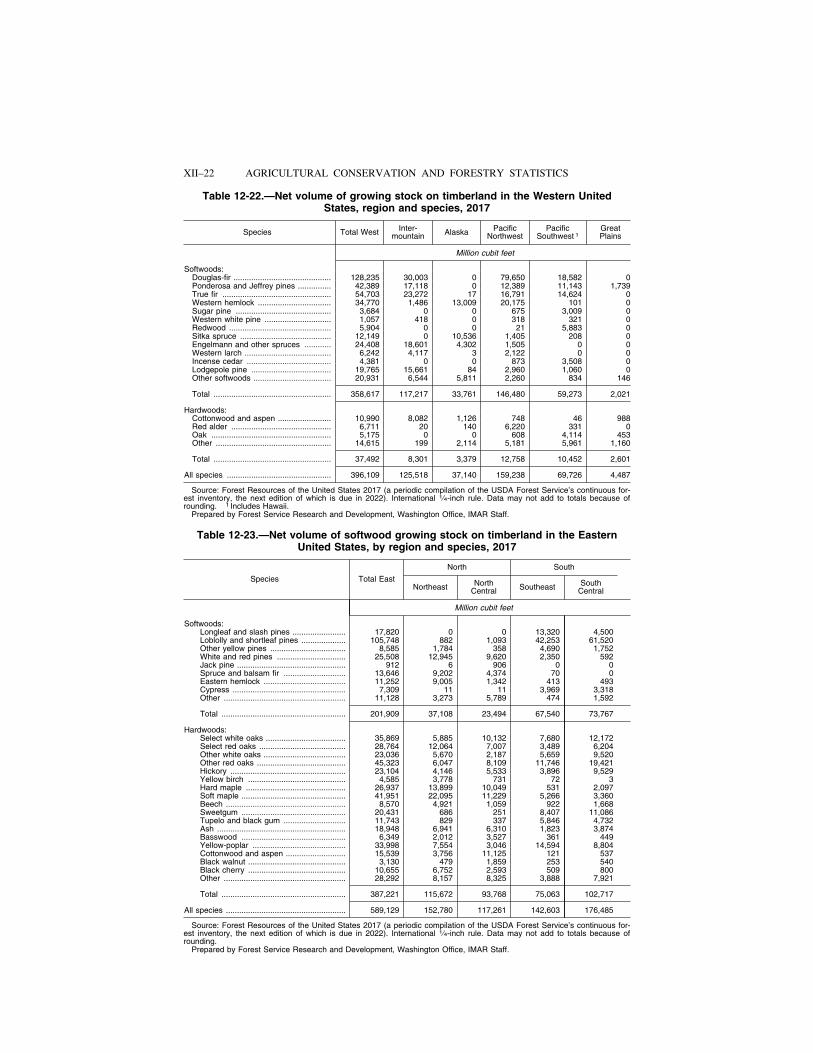
XII–22 AGRICULTURAL CONSERVATION AND FORESTRY STATISTICS
Table 12-22.—Net volume of growing stock on timberland in the Western United States, region and species, 2017
Species Total West Inter-mountain Alaska Pacific
Northwest Pacific
Southwest 1 Great Plains
Million cubit feet
Softwoods: Douglas-fir ............................................ 128,235 30,003 0 79,650 18,582 0 Ponderosa and Jeffrey pines ............... 42,389 17,118 0 12,389 11,143 1,739 True fir ................................................. 54,703 23,272 17 16,791 14,624 0 Western hemlock ................................. 34,770 1,486 13,009 20,175 101 0 Sugar pine ........................................... 3,684 0 0 675 3,009 0 Western white pine .............................. 1,057 418 0 318 321 0 Redwood .............................................. 5,904 0 0 21 5,883 0 Sitka spruce ......................................... 12,149 0 10,536 1,405 208 0 Engelmann and other spruces ............ 24,408 18,601 4,302 1,505 0 0 Western larch ....................................... 6,242 4,117 3 2,122 0 0 Incense cedar ...................................... 4,381 0 0 873 3,508 0 Lodgepole pine .................................... 19,765 15,661 84 2,960 1,060 0 Other softwoods ................................... 20,931 6,544 5,811 2,260 834 146
Total ..................................................... 358,617 117,217 33,761 146,480 59,273 2,021
Hardwoods: Cottonwood and aspen ........................ 10,990 8,082 1,126 748 46 988 Red alder ............................................. 6,711 20 140 6,220 331 0 Oak ...................................................... 5,175 0 0 608 4,114 453 Other .................................................... 14,615 199 2,114 5,181 5,961 1,160
Total ..................................................... 37,492 8,301 3,379 12,758 10,452 2,601
All species ............................................... 396,109 125,518 37,140 159,238 69,726 4,487
Source: Forest Resources of the United States 2017 (a periodic compilation of the USDA Forest Service’s continuous for-est inventory, the next edition of which is due in 2022). International 1⁄4-inch rule. Data may not add to totals because of rounding. 1 Includes Hawaii.
Prepared by Forest Service Research and Development, Washington Office, IMAR Staff.
Table 12-23.—Net volume of softwood growing stock on timberland in the Eastern United States, by region and species, 2017
Species Total East
North South
Northeast North Central Southeast South
Central
Million cubit feet
Softwoods: Longleaf and slash pines ........................ 17,820 0 0 13,320 4,500 Loblolly and shortleaf pines .................... 105,748 882 1,093 42,253 61,520 Other yellow pines .................................. 8,585 1,784 358 4,690 1,752 White and red pines ............................... 25,508 12,945 9,620 2,350 592 Jack pine ................................................. 912 6 906 0 0 Spruce and balsam fir ............................ 13,646 9,202 4,374 70 0 Eastern hemlock ..................................... 11,252 9,005 1,342 413 493 Cypress ................................................... 7,309 11 11 3,969 3,318 Other ....................................................... 11,128 3,273 5,789 474 1,592
Total ........................................................ 201,909 37,108 23,494 67,540 73,767
Hardwoods: Select white oaks .................................... 35,869 5,885 10,132 7,680 12,172 Select red oaks ....................................... 28,764 12,064 7,007 3,489 6,204 Other white oaks ..................................... 23,036 5,670 2,187 5,659 9,520 Other red oaks ........................................ 45,323 6,047 8,109 11,746 19,421 Hickory .................................................... 23,104 4,146 5,533 3,896 9,529 Yellow birch ............................................ 4,585 3,778 731 72 3 Hard maple ............................................. 26,937 13,899 10,049 531 2,097 Soft maple ............................................... 41,951 22,095 11,229 5,266 3,360 Beech ...................................................... 8,570 4,921 1,059 922 1,668 Sweetgum ............................................... 20,431 686 251 8,407 11,086 Tupelo and black gum ............................ 11,743 829 337 5,846 4,732 Ash .......................................................... 18,948 6,941 6,310 1,823 3,874 Basswood ............................................... 6,349 2,012 3,527 361 449 Yellow-poplar .......................................... 33,998 7,554 3,046 14,594 8,804 Cottonwood and aspen ........................... 15,539 3,756 11,125 121 537 Black walnut ............................................ 3,130 479 1,859 253 540 Black cherry ............................................ 10,655 6,752 2,593 509 800 Other ....................................................... 28,292 8,157 8,325 3,888 7,921
Total ........................................................ 387,221 115,672 93,768 75,063 102,717
All species ...................................................... 589,129 152,780 117,261 142,603 176,485
Source: Forest Resources of the United States 2017 (a periodic compilation of the USDA Forest Service’s continuous for-est inventory, the next edition of which is due in 2022). International 1⁄4-inch rule. Data may not add to totals because of rounding.
Prepared by Forest Service Research and Development, Washington Office, IMAR Staff.

XII–23 AGRICULTURAL STATISTICS 2020
Table 12-24.— National Forest System: National Forest System lands and other lands in States and Territories, as of September 30, 2019
State or other area Gross acreage National Forest System acreage 1 Other acreage 2
1,000 acres
USA Total ...................................... 234,023 192,994 41,029 Alabama ......................................... 1,290 671 620 Alaska ............................................ 23,932 22,139 1,793 Arizona ........................................... 11,813 11,179 633 Arkansas ........................................ 3,549 2,593 955 California ........................................ 24,288 20,811 3,477 Colorado ........................................ 15,960 14,487 1,472 Connecticut .................................... 0 .02 0 .02 0 Florida ............................................ 1,423 1,203 220 Georgia .......................................... 1,796 868 929 Idaho .............................................. 21,714 20,449 1,266 Illinois ............................................. 958 305 653 Indiana ........................................... 647 204 443 Kansas ........................................... 109 109 0 Kentucky ........................................ 2,205 818 1,387 Louisiana ........................................ 1,032 609 423 Maine ............................................. 94 54 41 Michigan ......................................... 4,887 2,876 2,011 Minnesota ...................................... 5,488 2,845 2,642 Mississippi ...................................... 2,374 1,191 1,183 Missouri .......................................... 3,093 1,508 1,585 Montana ......................................... 19,190 17,195 1,994 Nebraska ........................................ 562 351 211 Nevada ........................................... 6,288 5,761 528 New Hampshire ............................. 851 754 97 New Mexico ................................... 10,249 9,225 1,024 New York ....................................... 17 16 0 North Carolina ................................ 3,027 1,257 1,770 North Dakota .................................. 1,103 1,103 0 Ohio ............................................... 856 244 612 Oklahoma ....................................... 759 400 359 Oregon ........................................... 17,654 15,698 1,956 Pennsylvania .................................. 741 514 227 South Carolina ............................... 1,381 635 746 South Dakota ................................. 2,436 2,007 429 Tennessee ..................................... 1,291 723 568 Texas ............................................. 2,002 757 1,245 Utah ............................................... 9,205 8,192 1,013 Vermont ......................................... 837 411 426 Virginia ........................................... 3,254 1,669 1,586 Washington .................................... 11,990 9,336 2,654 West Virginia .................................. 1,893 1,047 846 Wisconsin ....................................... 2,003 1,525 478 Wyoming ........................................ 9,726 9,226 500 Puerto Rico .................................... 56 29 27 Virgin Islands ................................. 0 .14 0 .14 0
Source: Land Areas of the National Forest System 2019 (https://www.fs.fed.us/land/staff/lar-index.shtml). 1 National Forest System acreage.—A nationally significant system of Federally owned units of forest, range, and related
land consisting of national forests, purchase units, national grasslands, land utilization project areas, experimental forest areas, experimental range areas, designated experimental areas, other land areas; water areas, and interests in lands that are administered by USDA Forest Service or designated for administration through the Forest Service.
National forests.—Units formally established and permanently set aside and reserved for national forest purposes. Purchase units.—Units designated by the Secretary of Agriculture or previously approved by the National Forest Reserva-
tion Commission for purposes of Weeks Law Acquisition. National grasslands.—Units designated by the Secretary of Agriculture and permanently held by the Department of Agri-
culture under Title III of the Bankhead-Jones Farm Tenant Act. Land utilization projects.—Units designated by the Secretary of Agriculture for conservation and utilization under Title III of
the Bankhead-Jones Farm Tenant Act. Research and experimental areas.—Units reserved and dedicated by the Secretary of Agriculture for forest or range re-
search and experimentation. Other areas.—Units administered by the Forest Service that are not included in the above groups. 2 Other acreage.—Lands within the unit boundaries in private, State, county, and municipal ownership and Federal lands
over which the Forest Service has no jurisdiction. Areas of such lands which have been offered to the United States and have been approved for acquisition and subsequent Forest Service administration, but to which title had not yet been ac-cepted by the United States.
Prepared by Forest Service Research and Development, Washington Office, IMAR Staff.

XII–24 AGRICULTURAL CONSERVATION AND FORESTRY STATISTICS
Table 12-25.—Forest products cut on National Forest System lands: Volume and value of timber cut and value of all products, United States, fiscal years 2010–2019
Year Timber cut 1 Value of non-covertible
products 3
Total value including
free-use timber Volume Value 2
Million bd. ft. 1,000 dollars 4 1,000 dollars 4, 5 1,000 dollars 4
2010 ............... 2,138 72,174 3,263 104,809 2011 ............... 2,440 105,869 2,603 131,904 2012 ............... 2,500 112,943 2,748 140,428 2013 ............... 2,408 114,878 2,850 143,383 2014 ............... 2,437 122,794 2,618 148,979 2015 ............... 2,543 129,186 3,346 162,651 2016 ............... 2,537 162,444 2,962 165,406 2017 ............... 2,596 175,847 2,906 178,753 2018 ............... 2,797 185,285 3,480 188,765 2019 ............... 2,556 164,208 2,547 166,755
Source: USDA Forest Service, Forest Products Cut and Sold from the National Forests. (https://www.fs.fed.us/ forestmanagement/products/cut-sold/index.shtml). 1 Commercial and cost sales and land exchanges. 2 Includes collec-tions for forest restoration or improvement under the Knutson-Vandenberg Act, 1930. 3 Includes materials not measurable in board feet, such as Christmas trees, tanbark, turpentine, seedlings, Spanish moss, etc. 4 Nominal dollars not adjusted for inflation. 5 2010-2015 revised in 2019.
Prepared by Forest Service Research and Development, Washington Office, IMAR Staff.
Table 12-26.—Lumber: Production, United States, 2010–2019
Year Total Softwoods Hardwoods 1
Million bd. ft.
2010 ..................... 30,461 24,802 5,659 2011 ..................... 33,304 26,754 6,550 2012 ..................... 34,791 28,256 6,535 2013 ..................... 37,321 29,982 7,339 2014 ..................... 39,810 31,490 8,320 2015 2 .................. 42,085 32,028 9,538 2016 2 .................. 42,085 32,535 9,550 2017 ..................... 43,538 33,888 9,650 2018 ..................... 44,508 34,908 9,600 2019 ..................... 45,423 35,919 9,504
Source: Howard, James L.; Liang, Shaobo, 2019. U.S. timber production, trade, consumption, and price statistics, 1965- 2017. USDA Forest Service Research Paper FPL-RP-701. 1 In-house estimate. 2 Revised in 2019.
Prepared by Forest Service Research and Development, Washington Office, IMAR Staff.

XII–25 AGRICULTURAL STATISTICS 2020
Table 12-27.—Timber products: Production, imports, exports, and consumption, United States, 2009–2018
Year
Industrial roundwood used for—
Lumber Plywood and veneer Pulpwood chip
Other in-dustrial
products, produc-tion and
consump-tion 1
Pro-duction Imports Exports
Con-sump-
tion
Produc-tion Imports Exports
Con-sump-
tion Imports Exports
Million cu. ft., roundwood equivalent
2009 4,576 1,347 288 5,636 616 146 34 728 9 196 294 2010 4,569 1,422 341 5,650 655 137 55 736 9 235 294 2011 5,005 1,403 387 6,022 651 139 52 738 9 235 294 2012 5,219 1,480 374 6,324 679 139 57 761 9 235 294 2013 5,607 1,675 406 6,911 703 147 55 796 9 234 294 2014 5,995 1,869 406 7,458 693 187 46 834 9 234 294 2015 6,065 2,100 371 7,793 683 222 38 867 9 235 294 2016 6,143 2,426 527 8,042 703 263 43 923 6 262 732 2017 6,338 2,328 580 8,086 729 274 47 967 2 280 822 2018 6,467 2,953 694 8,726 716 361 44 1,033 2 290 912
Year
Industrial roundwood used for—
Pulpwood-based products Logs Total
Produc-tion Imports 2 Exports 2 Consump-
tion Imports Exports Produc-
tion Imports Exports Consump-tion
Million cu. ft.
2009 4,733 902 785 4,849 17 322 10,737 2,421 1,625 11,532 2010 4,779 911 832 4,857 20 407 10,938 2,498 1,870 11,566 2011 4,748 887 899 4,736 19 485 11,418 2,457 2,058 11,817 2012 5,805 883 875 5,815 28 432 12,663 2,539 1,972 13,231 2013 5,959 942 1,073 5,827 26 463 13,260 2,799 2,231 13,862 2014 6,562 1,205 1,340 6,427 22 444 14,222 3,292 2,470 15,044 2015 6,569 1,172 1,348 6,392 22 279 14,124 3,524 2,272 15,376 2016 5,099 896 995 5,000 24 390 13,329 3,615 2,216 14,727 2017 5,081 875 1,013 4,943 32 393 13,643 3,511 2,315 14,851 2018 5,228 916 1,051 5,093 26 378 13,991 4,258 2,457 15,792
Year Fuelwood production and consumption Production, all products Consumption, all products
Million cu. ft.
2009 1,400 12,137 12,932 2010 1,380 12,318 12,946 2011 1,366 12,784 13,183 2012 1,440 14,103 14,671 2013 1,520 14,780 15,382 2014 1,566 15,788 16,610 2015 1,566 15,690 16,942 2016 2,195 15,524 16,922 2017 2,273 15,917 17,124 2018 2,528 16,519 18,320
Source: Howard, James L.; Liang, Shaobo, 2019. U.S. timber production, trade, consumption, and price statistics, 1965- 2017. 1 Includes cooperage logs, poles and piling, fence posts, hewn ties, round mine timbers, excelsior bolts, chemical wood, shingle bolts, and miscellaneous items. 2 Includes both pulpwood and the pulpwood equivalent of wood pulp, paper, and board.
Prepared by Forest Service Research and Development, Washington Office, IMAR Staff.

XII–26 AGRICULTURAL CONSERVATION AND FORESTRY STATISTICS
Table 12-28.—Timber products: Producer price indexes, selected products, United States, 2010–2019
[2009=100]
Year Lumber Softwood plywood Woodpulp Paper Paperboard
2010 ...... 112.0 114.7 123.8 101.4 108.5 2011 ...... 111.5 108.1 129.7 106.5 111.2 2012 ...... 115.4 127.2 123.8 106.7 110.0 2013 ...... 133.0 137.7 120.3 106.2 117.6 2014 ...... 143.8 142.7 122.3 107.3 120.0 2015 ...... 133.4 136.4 120.9 105.7 117.3 2016 ...... 133.9 122.8 115.6 103.3 108.8 2017 ...... 145.4 136.6 107.5 103.8 124.3 2018 ...... 155.4 159.7 143.7 110.0 132.0 2019 ...... 140.8 129.6 115.8 111.7 129.4
Source: Federal Reserve Bank of St. Louis Economic Data Service (https://fred.stlouisfed.org/). Prepared by Forest Service Research and Development, Washington Office, IMAR Staff.
Table 12-29.—Timber products: Pulpwood consumption, woodpulp production, and paper and board production and consumption, United States, 2010–2019
Year Pulpwood consumption 1
Woodpulp production 2
Paper and board 3
Production Consumption or new supply 4
Per capita consumption
1,000 cords 5 1,000 tons 1,000 tons 1,000 tons Pounds 2010 ...... 80,307 55,343 82,968 85,331 551 2011 ...... 80,040 55,125 81,519 82,858 531 2012 ...... 81,422 55,475 80,916 82,321 524 2013 ...... 91,251 54,466 80,478 78,603 497 2014 ...... 92,186 53,367 79,488 78,046 490 2015 ...... 93,141 *52,646 79,024 77,444 481 2016 ...... 92,004 *52,701 78,342 76,002 484 2017 ...... 90,873 *52,485 78,445 76,625 470 2018 ...... 90,281 *51,840 78,114 *75,862 *465 2019 ...... 87,632 50,699 78,114 73,096 446
Source: 2009-2016--Howard, James L.; Liang, Shaobo. 2019. U.S. timber production, trade, consumption, and price statis-tics, 1965-2017. USDA Forest Service Research Paper FPL-RP-701. 2017-2019--In house estimate. All series compiled from U.S. Department of Commerce and American Forest and Paper Association.
*Revised in 2020. 1 Includes changes in stocks. 2 Excludes defibrated and exploded woodpulp used for hard pressed board, dissolving and special Alpha, and wood pulp used for construction paper & board. 3 Excludes hardboard. Includes wet machine board and construction grades. 4 Production plus imports and minus exports (excludes products); changes in inventories not taken into account. 5 One cord equals 128 cubic feet.
Prepared by Forest Service Research and Development, Washington Office, IMAR Staff.
Table 12-30.—Lumber and competing engineered wood products: Production by type of product, 2010–2019
Year Laminated veneer lumber Wood glulam
Structural Panels Lumber
Oriented strandboard
Softwood Plywood Hardwood 1 Softwood
Million Million Million Million Billion Billion cubic feet board feet square feet
(3/8-in. basis) square feet
(3/8-in. basis) board feet board feet
2010 ....... 37 176 10,299 9,131 5.7 24.8 2011 ....... 38 184 10,039 8,980 6.6 26.8 2012 ....... 46 204 11,038 9,181 6.5 28.3 2013 ....... 54 230 12,492 9,346 7.3 30.0 2014 ....... 60 233 13,008 8,985 8.3 31.5 2015 ....... 61 252 13,283 8,751 8.3 32.0 2016 ....... 65 257 13,922 8,809 9.6 32.5 2017 ....... 73 271 14,609 9,026 9.7 33.8 2018 ....... 71 281 15,129 8,869 9.6 34.9 2019 2 ..... 71 281 15,181 8,679 9.5 35.9
Sources: APA-The Engineered Wood Association; US Department of Commerce, Bureau of the Census; American Forest and Paper Association; Luppold and Dempsey. Hardwood Market Report: 2008-present.
1 2016 data revised in 2020. 2 Preliminary estimates. Prepared by Forest Service Research and Development, Washington Office, IMAR Staff.

XIII–1
CHAPTER XIII
CONSUMPTION AND FAMILY LIVING
The statistics in this chapter deal with the consumption of food by both rural and urban people, retail price levels, and other aspects of family living of farm people. Data presented here on quan-tities of food available for consumption are based on material presented in the earlier commodity chapters, but they are shown here at the retail level, a form that is more useful for an analysis of the demand situation faced by the producer. Data on quantities of farm-produced food consumed di-rectly by farm households are presented in the commodity chapters. Its value and the rental value of the farm home are given in the section on farm income.
Table 13-1.—Population estimates for the United States, Jan. 1 and July 1, 2011-2019
Year Jan. 1 July 1
2011 ....................... 309,335,215 310,362,359 2012 ....................... 311,584,613 312,634,059 2013 ....................... 313,844,886 314,815,159 2014 ....................... 316,078,106 317,160,490 2015 ....................... 318,474,252 319,546,159 2016 ....................... 320,808,676 321,868,857 2017 ....................... 323,032,791 323,956,506 2018 ....................... 325,032,134 325,980,513 2019 ....................... 327,044,416 327,971,597
Note: The monthly estimates beginning with August 1, 2018 are short-term projections. Monthly Population Estimates for the United States: April 1, 2010 to December 1, 2019. Source: U.S. Census Bureau,
Population Division. Release Date: December 2018. ERS, Rural Economy Branch (202) 694–5435.
Table 13-2.—Consumers’ prices: Index number of prices paid for goods and services, United States, 2010–2019 1
[1982–84=100]
Year Food
Nonfood items
All items Apparel and upkeep
Housing Transportation Medical
care Total Rent
2010 ................... 219.6 119.5 216.3 258.8 193.4 388.4 218.1 2011 ................... 227.8 122.1 219.1 262.2 212.4 400.3 224.9 2012 ................... 233.8 126.3 222.7 267.8 217.3 414.9 229.6 2013 ................... 237.0 127.4 227.4 274.0 217.4 425.1 233.0 2014 ................... 242.7 127.5 233.2 281.8 215.9 435.3 236.7 2015 ................... 247.2 125.9 238.1 290.4 199.1 446.8 237.0 2016 ................... 247.9 126.0 244.0 300.3 194.9 463.7 240.0 2017 ................... 250.1 125.6 251.2 310.3 201.6 475.3 245.1 2018 ................... 253.6 125.7 258.5 320.7 210.7 484.7 251.1 2019 ................... 258.3 124.0 265.9 331.6 210.1 498.4 255.7
1 Reflects retail prices of goods and services usually bought by average families in urban areas of the United States. This index is the official index released monthly by the U.S. Department of Labor. Data are for all urban consumers.
ERS, Food Markets Branch, (202) 694–5349. Compiled from data of the U.S. Department of Labor.

XIII–2 CONSUMPTION AND FAMILY LIVING
Table 13-3.—Consumption: Per capita consumption of major food commodities, United States, 2012–2016 1
Commodity 2012 2013 2014 2015 2016
Pounds Pounds Pounds Pounds Pounds
Red meats 2 ............................................................................... 98.0 98.0 95.0 98.6 100.5 Beef ........................................................................................ 54.5 53.6 51.5 51.4 52.9 Veal ........................................................................................ 0.3 0.3 0.2 0.2 0.2 Lamb and mutton ................................................................... 0.6 0.7 0.7 0.7 0.8 Pork ........................................................................................ 42.6 43.5 42.6 46.3 46.6
Fish ............................................................................................ 14.3 14.5 15.5 14.9 16.1 Canned ................................................................................... 3.7 3.3 3.7 3.3 3.7 Fresh and frozen .................................................................... 10.4 10.9 11.5 11.3 12.0 Cured ..................................................................................... 0.3 0.3 0.3 0.3 0.3
Poultry ........................................................................................ 69.3 70.3 71.3 75.2 76.3 Chicken .................................................................................. 56.7 57.7 58.8 62.6 63.2 Turkey .................................................................................... 12.6 12.6 12.5 12.6 13.1
Eggs ........................................................................................... 32.7 33.2 34.2 33.0 35.0 Dairy products 3
Total dairy products ............................................................... 615.1 607.3 616.0 630.1 645.7 Fluid milk and cream ............................................................. 188.6 184.6 178.6 174.7 172.0
Plain and flavored whole milk ............................................ 46.5 46.2 45.9 47.6 49.8 Plain reduced fat and light milk (2%, 1%, and 0.5%) ........ 84.7 82.6 79.8 76.8 74.2 Plain fat free milk (skim) .................................................... 24.8 22.6 20.0 17.7 15.6 Flavored lower fat free milk ................................................ 12.5 12.3 12.0 12.1 12.3 Buttermilk ............................................................................ 1.5 1.6 1.5 1.6 1.6 Eggnog ............................................................................... 0.4 0.4 0.4 0.4 0.4 Yogurt (excl. frozen) ........................................................... 14.0 15.0 14.9 14.4 13.8 Sour cream and dip ............................................................ 4.1 4.1 4.1 4.1 4.3
Cheese (excluding cottage) 4 ................................................. 33.3 33.4 34.2 35.1 36.4 American ............................................................................ 13.3 13.4 13.7 14.0 14.4
Cheddar .......................................................................... 9.6 9.6 9.8 10.2 10.4 Italian .................................................................................. 13.8 13.8 14.2 14.5 15.2
Mozzarella ....................................................................... 10.7 10.7 11.2 11.3 11.7 Cottage cheese ...................................................................... 2.3 2.1 2.1 2.1 2.1 Condensed and evaporated milk ........................................... 7.3 7.2 6.8 7.7 7.4 Ice cream ............................................................................... 13.2 13.0 12.5 12.9 12.9 Butter ...................................................................................... 5.5 5.5 5.5 5.6 5.7
Fruits and vegetables 5 .............................................................. 636.0 636.6 636.6 631.9 651.7 Fruits ...................................................................................... 244.6 254.6 250.1 252.7 256.4
Fresh .................................................................................. 131.8 136.3 136.3 136.1 142.3 Citrus ............................................................................... 23.5 23.9 23.3 22.7 24.0 Noncitrus ......................................................................... 108.3 112.4 113.1 113.4 118.3
Processing .......................................................................... 112.8 118.2 113.8 116.6 114.1 Citrus ............................................................................... 52.6 55.1 52.6 52.7 51.9 Noncitrus ......................................................................... 60.2 63.1 61.2 63.8 62.2
Vegetables ............................................................................. 391.4 382.1 386.5 379.2 395.3 Fresh .................................................................................. 188.7 184.6 186.4 186.4 199.5 Processing .......................................................................... 202.7 197.5 200.1 192.9 195.8
Flour and cereal products ......................................................... 174.1 174.7 174.4 172.9 171.9 Wheat flour 6 .......................................................................... 134.3 135.0 134.7 133.0 131.7 Corn products ........................................................................ 33.9 33.9 34.0 34.0 34.2 Oat products .......................................................................... 4.7 4.5 4.5 4.6 4.6 Barley and rye products ......................................................... 1.1 1.2 1.2 1.3 1.4 Caloric sweeteners (dry weight basis) ................................... 129.3 128.2 129.1 129.1 128.1 Sugar (refined) ....................................................................... 66.6 68.0 68.4 69.1 69.7 Corn sweeteners 7 .................................................................. 61.0 58.4 58.5 57.8 56.5 Honey and edible syrups ....................................................... 1.8 1.9 2.1 2.1 1.9
Others Coffee (green bean equivalent) ............................................. 9.7 9.9 10.0 10.2 NA Cocoa (chocolate liquor equivalent) 8 .................................... 4.2 4.2 4.1 4.3 NA Tea (dry leaf equivalent) ........................................................ 0.9 0.9 0.9 0.9 NA Peanuts (shelled) ................................................................... 6.7 6.9 7.0 7.4 7.2 Tree nuts (shelled) ................................................................. 4.2 4.0 4.1 4.1 4.9
1 Quantity in pounds, retail weight unless otherwise shown. Totals may not add due to rounding. 2 Boneless, trimmed weight equivalent. 3 Total dairy products reported on a milk-equivalent, milkfat basis. All other dairy categories reported on a product weight basis. 4 Natural equivalent of cheese and cheese products. 5 Farm weight. 6 White, whole wheat, sem-olina, and durum flour. 7 High fructose, glucose, and dextrose. 8 Chocolate liquor is what remains after cocoa beans have been roasted and hulled; it is sometimes called ground or bitter chocolate.
ERS, Food Economics Division, (202) 694-5400. Historical consumption and supply-disappearance data for food may be found at https://www.ers.usda.gov/data-products/food-availability-per-capita-data-system.

XIII–3 AGRICULTURAL STATISTICS 2020
Table 13-4.—USDA Food plans: Cost of food at home at four levels, U.S. average, December 2019 1
Age-gender groups
Weekly cost 2 Monthly cost 2
Thrifty plan
Low-cost plan
Moderate- cost plan
Liberal plan
Thrifty plan
Low-cost plan
Moderate- cost plan
Liberal plan
Dollars Dollars Dollars Dollars Dollars Dollars Dollars Dollars Individuals: 3
Child: 1 year ............................. 21.80 29.40 33.40 40.50 94.70 127.30 144.60 175.70 2-3 years ........................ 23.90 30.90 37.00 45.00 103.60 133.70 160.40 195.10 4-5 years ........................ 25.20 31.70 39.60 47.90 109.30 137.20 171.40 207.40 6-8 years ........................ 32.00 44.60 53.90 63.50 138.70 193.10 233.60 275.10 9-11 years ...................... 36.30 47.80 62.50 72.80 157.10 207.30 271.00 315.30
Male: 12-13 years .................... 38.80 55.20 69.00 81.20 168.10 239.00 298.80 351.90 14-18 years .................... 40.00 56.00 70.90 81.90 173.20 242.50 307.10 354.90 19-50 years .................... 42.90 55.50 69.60 85.20 185.90 240.60 301.50 369.10 51-70 years .................... 39.10 52.50 65.50 79.10 169.40 227.70 283.70 342.90 71+ years ....................... 39.30 51.50 64.30 79.20 170.20 223.30 278.50 343.00
Female: 12-13 years .................... 38.60 47.40 57.60 70.30 167.20 205.50 249.60 304.70 14-18 years .................... 38.00 47.40 56.70 70.20 164.90 205.30 245.60 304.20 19-50 years .................... 38.10 48.20 59.10 75.70 165.10 208.80 256.10 328.00 51-70 years .................... 37.80 47.00 58.50 70.70 163.60 203.60 253.40 306.50 71+ years ....................... 36.90 46.30 57.80 69.70 160.10 200.60 250.40 301.90
Families: Family of 2 (Male and Female) 4
19-50 years .................... 89.10 114.10 141.50 177.00 386.10 494.40 613.30 766.80 51-70 years .................... 84.50 109.50 136.30 164.80 366.30 474.30 590.80 714.30
Family of 4: Couple (Male and Female), 19-50 years and children—
2-3 and 4-5 years .......... 130.10 166.30 205.30 253.80 563.90 720.40 889.40 1,099.60 6-8 and 9-11 years ........ 149.30 196.10 245.10 297.10 646.80 849.80 1,062.10 1,287.50
1 The Food Plans represent a nutritious diet at four different cost levels. The nutritional bases of the Food Plans are the 1997-2005 Dietary Reference Intakes, 2005 Dietary Guidelines for Americans, and 2005 MyPyramid food intake rec-ommendations. In addition to cost, differences among plans are in specific foods and quantities of foods. Another basis of the Food Plans is that all meals and snacks are prepared at home. For specific foods and quantities of foods in the Food Plans, see Thrifty Food Plan, 2006 (2007) and The Low-Cost, Moderate-Cost, and Liberal Food Plans, 2007 (2007). All four Food Plans are based on 2001-02 data and updated to current dollars by using the Consumer Price Index for specific food items.
2 All costs are rounded to nearest 10 cents. 3 The costs given are for individuals in 4–person families. For individuals in other size families, the following adjustments
are suggested: 1 person-add 20 percent; 2 person-add 10 percent; 3 person-add 5 percent; 4 person-no adjustment; 5- or 6- person–subtract 5 percent; 7- (or more) person-subtract 10 percent. To calculate overall household food costs, (1) adjust food costs for each person in household and then (2) sum these adjusted food costs.
4 Ten percent added for family size adjustment. Food and Nutrition Service, Center for Nutrition Policy and Promotion, (703) 305–7600. This file and the referenced Food
Plans may be accessed at https://www.fns.usda.gov/cnpp/usda-food-plans-cost-food-reports-monthly-reports.

XIII–4 CONSUMPTION AND FAMILY LIVING
Table 13-5.—Food and Nutrition Service program benefits: Cash payments made under the National School Lunch, School Breakfast, Child and Adult Care, Summer Food and Special Milk Programs and the value of food benefits provided under the SNAP, WIC, Commodity Distribution and The Emergency Feeding Food Assistance Programs, fiscal year 2019 1
State/Territory
Child Nutrition Program (cash payments only) 2 Special Supple-mental Food (WIC)
SNAP (formerly
Food Stamp
Program) 4
Emer-gency food
assist-ance
(TEFAP)
Com-modity
distribu-tion 3
Total 4 Child and Adult Care Food
Summer Food
Special Milk
National School Lunch
School Breakfast
1,000 dollars
Alabama ......... 56,169 8,534 23 214,638 79,599 65,412 1,084,563 10,381 24,822 1,544,141 Alaska ............ 8,868 1,372 0 38,061 13,090 11,519 187,357 958 3,808 265,034 Amer. Samoa 4 0 0 0 0 0 4,588 0 0 0 4,588 Arizona ........... 49,479 3,154 43 275,940 94,481 68,824 1,210,430 12,600 38,091 1,753,042 Arkansas ........ 50,411 3,108 0 136,045 55,619 37,571 480,473 6,890 17,449 787,564 California ........ 445,135 18,903 281 1,511,917 523,067 524,633 6,332,718 65,288 199,424 9,621,366 Colorado ........ 25,073 4,427 199 133,410 48,214 37,816 668,611 6,857 17,023 941,630 Connecticut .... 17,248 4,146 98 105,335 32,726 24,981 614,968 5,210 10,556 815,268 Delaware ........ 17,213 1,994 16 36,215 13,982 7,289 196,899 2,157 7,159 282,923 District of
Columbia .... 10,025 2,017 2 28,446 11,693 6,362 188,433 1,407 3,294 251,679 Florida ............ 275,203 37,357 14 895,124 281,088 235,464 5,763,763 33,621 94,622 7,616,257 Georgia .......... 111,871 13,816 29 529,911 195,953 103,556 2,336,788 16,985 52,118 3,361,028 Guam ............. 458 0 0 8,781 3,258 6,067 106,449 337 35 125,384 Hawaii ............ 6,302 594 0 46,003 10,849 17,507 469,434 1,314 2,481 554,485 Idaho .............. 7,693 3,704 68 53,053 18,476 13,334 199,514 2,630 8,368 306,841 Illinois ............. 137,943 11,834 1,843 465,650 145,542 122,293 2,777,949 23,883 51,998 3,738,935 Indiana ........... 55,385 7,839 118 269,034 82,086 58,130 867,533 11,295 39,071 1,390,491 Iowa ............... 25,079 3,860 61 110,968 27,599 22,738 446,260 4,459 15,679 656,703 Kansas ........... 28,307 4,284 55 106,106 31,698 22,032 293,540 4,048 14,968 505,037 Kentucky ........ 41,876 9,127 18 232,259 95,413 46,085 853,987 8,040 30,615 1,317,420 Louisiana ........ 87,481 7,311 0 249,066 89,640 63,153 1,297,322 10,470 38,492 1,842,935 Maine ............. 8,803 2,266 12 33,863 12,783 9,205 218,218 2,303 6,742 294,196 Maryland ........ 50,419 9,015 263 178,763 69,287 60,309 910,099 6,771 24,080 1,309,004 Massachusetts 61,383 7,258 162 198,670 65,838 49,103 1,159,119 9,073 27,268 1,577,874 Michigan ......... 66,437 10,222 189 311,190 115,102 94,028 1,894,037 17,223 53,189 2,561,618 Minnesota ...... 61,527 9,783 706 168,385 53,671 53,687 544,420 6,455 27,849 926,485 Mississippi ...... 45,888 7,261 4 170,248 63,861 52,239 679,723 6,338 23,749 1,049,310 Missouri .......... 53,835 13,515 428 212,151 79,070 47,697 1,061,334 10,287 34,492 1,512,809 Montana ......... 10,316 2,101 6 28,992 10,432 6,966 158,390 1,525 8,258 226,986 Nebraska ........ 28,553 2,685 56 75,709 19,848 17,487 229,206 2,342 14,230 390,117 Nevada ........... 12,153 1,760 45 103,538 40,361 26,357 614,242 5,771 13,228 817,454 New
Hampshire .. 4,624 910 145 21,594 5,440 4,601 101,470 1,530 5,054 145,369 New Jersey .... 81,397 11,683 254 262,359 94,775 94,730 1,012,654 15,104 34,614 1,607,570 New Mexico ... 31,249 5,115 0 101,740 43,961 21,086 638,422 4,731 15,940 862,245 New York ....... 228,288 55,304 532 780,949 253,988 265,486 4,526,971 33,888 73,864 6,219,270 North
Carolina ...... 93,476 12,384 103 376,307 134,776 112,992 1,870,952 17,474 48,333 2,666,797 North Dakota .. 8,725 923 22 21,861 5,986 6,707 75,391 1,029 10,248 130,892 Northern
Marianas 4 .. 0 0 0 0 0 1,164 0 0 0 1,164 Ohio ............... 89,366 11,939 373 365,742 126,136 77,957 2,078,237 19,519 46,181 2,815,450 Oklahoma ....... 59,598 4,363 21 180,185 64,053 39,836 832,653 6,601 45,209 1,232,520 Oregon ........... 32,473 5,001 83 116,417 39,990 37,084 937,799 7,455 15,246 1,191,550 Pennsylvania .. 118,880 12,422 269 400,460 125,440 116,512 2,592,184 20,372 65,100 3,451,639 Puerto Rico 4 .. 19,558 6,621 0 110,809 25,885 121,030 0 9,410 15,280 308,594 Rhode Island .. 8,796 1,356 37 30,642 10,072 9,979 0 1,600 4,417 66,900 South
Carolina ...... 35,138 7,833 6 210,630 81,158 49,018 943,922 8,632 20,286 1,356,625 South Dakota 7,600 1,511 17 29,497 7,763 8,666 131,113 988 10,198 197,353 Tennessee ..... 64,484 9,154 18 284,612 113,758 60,847 1,424,891 10,515 30,967 1,999,246 Texas ............. 398,515 27,630 12 1,518,148 597,506 238,069 5,525,177 44,055 179,761 8,528,871 Utah ............... 26,410 545 39 101,112 22,811 22,498 258,536 3,178 16,107 451,237 Vermont ......... 5,789 1,207 26 16,022 6,651 6,202 106,782 1,113 2,940 146,732 Virginia ........... 48,603 9,798 101 254,641 95,123 42,115 1,051,801 10,753 25,426 1,538,363 Virgin Islands 655 280 0 2,296 300 2,473 86,936 335 600 93,875 Washington .... 46,069 5,377 212 199,785 57,388 69,292 1,268,735 12,112 27,942 1,686,912 West Virginia .. 15,523 1,617 11 81,167 42,364 16,685 440,299 4,102 10,848 612,616 Wisconsin ....... 35,791 8,389 842 171,279 53,871 41,990 816,882 7,740 31,533 1,168,318 Wyoming ........ 4,327 801 22 14,863 4,155 3,502 40,676 1,073 2,815 72,234 DoD 5 .............. 0 0 0 6,146 16 0 0 0 1,997 8,160
Total 4 ............. 3,321,867 415,410 7,885 12,586,736 4,397,694 3,386,954 60,608,261 540,227 1,644,069 86,909,103
1 Excludes all administrative and program evaluation costs. 2 Excludes totals for Food Safety Education and Team Nutri-tion. 3 Includes distribution of bonus and entitlement commodities to the National School Lunch, Child and Adult Care, Summer Food Service, Charitable Institutions, Summer Camps, Food Distribution on Indian Reservations, Nutrition Services Incentive Program (NSIP, formerly Nutrition Program for the Elderly), Commodity Supplemental Food, and Disaster Feeding Programs. Also includes cash-in-lieu of commodities for the National School Lunch and the Child and Adult Care Food pro-grams (NSIP cash grants were transferred to the Agency on Aging, DHHS, in FY 2003). 4 Excludes Nutrition Assistance grants for Puerto Rico, Northern Marianas, and American Samoa. 5 Dept. of Defense represents food service to children of armed forces personnel in overseas schools.
FNS, Budget Division/Program Reports, Analysis and Monitoring Branch (703) 305–2165.

XIII–5 AGRICULTURAL STATISTICS 2020
Table 13-6.—Food and Nutrition Service Programs: Persons participating, fiscal years 2010–2019
Fiscal year
National School Lunch Program 1
School Breakfast Program 1
Child and Adult Care Program 2
Summer Food Service 3 WIC Program 4
Thousands Thousands Thousands Thousands Thousands
2010 ........... 31,753 11,669 3,411 2,304 9,175 2011 ........... 31,842 12,175 3,431 2,278 8,961 2012 ........... 31,653 12,868 3,571 2,348 8,908 2013 ........... 30,683 13,203 3,681 2,428 8,663 2014 ........... 30,460 13,636 3,897 2,663 8,258 2015 ........... 30,496 14,049 4,181 2,570 8,024 2016 ........... 30,361 14,564 4,407 2,569 7,696 2017 ........... 29,992 14,658 4,530 2,646 7,286 2018 ........... 29,624 14,681 4,629 2,689 6,870 2019 ........... 29,519 14,730 4,706 2,679 6,400
1 Average monthly participation (excluding summer months). 2 Average daily attendance (data reported quar-terly). 3 Average daily attendance for peak month (July). 4 Average monthly participation. WIC is an abbreviation for the Special Supplemental Food Program for Women, Infants and Children.
FNS, Budget Division/Program Reports, Analysis and Monitoring Branch, (703) 305–2165.
Table 13-7.—Food and Nutrition Service Programs: Federal costs of the National School Lunch, School Breakfast, Child Care Food, Summer Food Service, WIC, Spe-cial Milk, and Food Distribution Programs, fiscal years 2010–2019 1
Fiscal year 2
Child Nutrition
WIC 6 Special Milk
Food Distribution Programs 7
Cash payments Cost of food distribution programs 5 School
Lunch School
Breakfast Child &
Adult Care 3 Summer Food 4
1,000 1,000 1,000 1,000 1,000 1,000 1,000 1,000 dollars dollars dollars dollars dollars dollars dollars dollars
2010 .......... 9,751,742 2,859,231 2,397,545 314,794 1,223,249 6,689,911 11,926 895,761 2011 .......... 10,105,029 3,034,159 2,471,494 327,232 1,298,925 7,180,750 12,296 829,719 2012 .......... 10,414,295 3,276,989 2,589,619 350,378 1,278,804 6,801,320 12,295 755,894 2013 .......... 11,057,635 3,513,985 2,720,122 375,781 1,288,858 6,501,668 10,721 997,936 2014 .......... 11,356,023 3,685,352 2,848,901 409,418 1,437,493 6,356,356 10,495 938,923 2015 .......... 11,695,742 3,891,787 3,008,620 427,797 1,457,385 6,239,931 10,515 839,975 2016 .......... 12,258,568 4,211,848 3,216,683 417,789 1,466,849 6,020,420 9,061 977,274 2017 .......... 12,250,693 4,252,279 3,239,578 423,756 1,545,880 5,695,963 8,284 991,625 2018 .......... 12,579,977 4,396,483 3,321,813 415,949 1,401,743 5,445,183 7,888 995,869 2019 .......... 12,833,585 4,526,623 3,424,292 416,200 1,484,499 5,184,189 7,376 1,157,153
1 See table 13-8 for Special Nutrition Assistance Program costs. 2 October 1–September 30. 3 Includes sponsor admin-istrative, audit, and startup costs. 4 Includes sponsor administrative, State administrative and health clinic costs. 5 Includes entitlement commodities, bonus commodities, and cash-in-lieu for the National School Lunch, School Breakfast, Child and Adult Care Food, and Summer Food Service Programs. 6 Includes food costs, administrative costs, program evaluation funds, special grants, and Farmer’s Market projects for the Special Supplemental Food Program for Women, Infants and Children. 7 Includes entitlement and bonus commodities, cash-in-lieu of commodities, and administra-tive costs of the following programs: Food Distribution to Indian Reservations, Nutrition Services Incentive Program (formerly Nutrition Program for the Elderly), Commodity Supplemental Food, Charitable Institutions, Summer Camps, Emergency Food Assistance Program (TEFAP), Disaster Feeding, Bureau of Federal Prisons, Veteran Affairs Administration, and the Food Stamp Program Elderly Pilot Project.
FNS, Budget Division/Program Reports, Analysis and Monitoring Branch, (703) 305–2165.
Table 13-8.—SNAP: Participation and federal costs, fiscal years 2010–2019
Fiscal year 1 Average monthly participation 2 Recipient
benefits Total cost 3 Average monthly benefit
Persons Housholds Per person Per household
1,000 1,000 1,000 dollars 1,000 dollars Dollars Dollars
2010 ..................... 40,302 18,618 64,702,165 68,283,468 133.79 289.60 2011 ..................... 44,709 21,072 71,810,924 75,686,540 133.85 283.99 2012 ..................... 46,609 22,330 74,619,345 78,411,096 133.41 278.48 2013 ..................... 47,636 23,052 76,066,319 79,859,028 133.07 274.98 2014 ..................... 46,664 22,744 69,998,836 74,060,327 125.01 256.47 2015 ..................... 45,767 22,522 69,645,138 73,946,652 126.81 257.69 2016 ..................... 44,220 21,778 66,539,269 70,913,549 125.40 254.61 2017 ..................... 42,228 20,901 63,711,051 68,174,548 125.73 254.02 2018 ..................... 39,431 19,566 58,996,500 63,524,579 124.68 251.27 2019 ..................... 34,474 17,374 53,761,254 58,277,365 129.96 257.86
SNAP is the Special Nutrition Assistance Program, formerly known as the Food Stamp Program. 1 October 1 to Sep-tember 30. 2 Participation data are 12-month averages. 3 Total cost includes matching funds for state administrative ex-penses (e.g., certification of households, quality control, anti-fraud activities; employment and training); and for other Federal costs (e.g., benefit redemption processing; computer support; electronic benefit transfer systems; retailer redemption and monitoring; certification of SSI recipients; nutrition education and program information).
FNS, Budget Division/Program Reports, Analysis and Monitoring Branch, (703) 305–2165.

XIV–1
CHAPTER XIV
STATISTICS OF FERTILIZERS AND PESTICIDES
This chapter contains statistics on percentages of crop acres treated by various types of fertilizers and pesticides. Nitrogen, phosphate, potash, and sulfur are the most common fertilizers; herbicides, insecticides, fungicides, and other chemicals are the main categories of pesticides. Other chemicals include soil fumigants, vine killers, and desiccants. The tables show data for field crops for 2010- 2019, fruits for 2019, and vegetables for 2018. NASS collects data for field crops on an annual basis. The surveyed States are generally the major producing States for each crop shown in the tables and represent 65-95 percent of the U.S. planted acres, depending on the selected crop.
Application data for specific pesticide active ingredients and additional fertilizer data are available in the series of NASS ‘‘Agricultural Chemical Usage’’ reports and data sets.
Table 14-1.—Field crops: Fertilizer, and percent of area receiving applications, all States surveyed, 2010–2019 1
Crop Nitrogen Phosphate Potash Sulfur
Percent Percent Percent Percent
2010: Corn ................................ 97 78 61 15 Cotton, Upland ................ 90 62 52 42 Potatoes, Fall .................. 99 96 90 73
2011: Barley .............................. 86 68 28 30 Sorghum ......................... 81 54 9 16
2012: Soybeans ........................ 27 37 37 7 Wheat, Durum ................. 98 89 12 12 Wheat, Other Spring ....... 97 87 27 20 Wheat, Winter ................. 85 55 13 19
2013: Rice ................................. 97 75 54 23 Peanuts ........................... 40 42 42 17
2014: Corn ................................ 97 80 65 29 Potatoes, Fall .................. 99 97 90 79
2015: Cotton ............................. 78 56 42 30 Oats ................................ 76 62 40 24 Soybeans ........................ 28 39 38 8 Wheat, Spring (Excl
Durum) ........................ 97 89 40 30 Wheat, Spring Durum ..... 98 95 32 31 Wheat, Winter ................. 88 60 16 22
2016: Corn ................................ 97 79 65 33 Potatoes, Fall .................. 98 92 90 76
2017: Cotton ............................. 78 59 45 38 Soybeans ........................ 31 41 42 9 Wheat, Durum ................. 98 91 28 36 Wheat, Other Spring ....... 96 89 34 38 Wheat, Winter ................. 83 58 15 25
2018: Corn ................................ 98 79 63 32 Peanuts ........................... 32 32 33 12 Soybeans ........................ 29 42 43 10
2019: Barley .............................. 86 72 26 48 Sorghum ......................... 89 58 10 21 Wheat, Spring (Excl
Durum) ........................ 97 89 31 32 Wheat, Spring Durum ..... 98 84 11 24 Wheat, Winter ................. 88 63 15 27
1 Refers to percent of planted acres receiving one or more applications of a specific fertilizer ingredient. See tables 14-2 through 14-21 for surveyed States.
Note: See planted acreage estimates in tables 1-56 for barley, 1-36 for corn, 2-2 for upland and all cotton, 1-48 for oats, 3-16 for peanuts, 1-27 for rice, 1-65 for sorghum, 3-32 for soybeans and 1-8 for wheat.
NASS, Environmental, Economics, and Demographics Branch, (202) 720–6146.

XIV–2 STATISTICS OF FERTILIZERS AND PESTICIDES
Table 14-2.—Barley: Pesticide usage, 2011 and 2019 1
State and Year
Percent treated and amount applied
Herbicide Insecticide Fungicide Other Chemicals
Area applied
Pounds applied
Area applied
Pounds applied
Area applied
Pounds applied
Area applied
Pounds applied
Percent Thousands Percent Thousands Percent Thousands Percent Thousands
Arizona: 2011 .............. 37 16 * * ................. ................. ................. .................2019 .............. * * * * ................. ................. ................. .................
California: 2011 .............. 39 48 * * ................. ................. ................. .................2019 .............. 21 7 * * ................. ................. ................. .................
Colorado: 2011 .............. 96 36 22 1 25 2 ................. .................2019 .............. 90 23 * * * * ................. .................
Idaho: 2011 .............. 91 302 11 1 18 11 14 27 2019 .............. 89 326 6 2 11 7 9 6
Minnesota: 2011 .............. 58 19 10 2 32 3 ................. .................2019 .............. 89 24 34 1 68 11 ................. .................
Montana: 2011 .............. 92 1,065 * * 26 16 * * 2019 .............. 84 949 * * 3 5 * *
North Dakota: 2011 .............. 95 236 6 4 48 26 ................. .................2019 .............. 94 304 * * 63 52 * *
Oregon: 2011 .............. 74 21 * * 31 1 * * 2019 .............. 70 33 * * * * * *
Pennsylvania: 2011 .............. 39 7 * * 3 ** ................. .................2019 .............. 61 7 * * 6 ** ................. .................
South Dakota: 2019 .............. * * ................. ................. ................. ................. ................. .................
Virginia: 2011 .............. 59 29 20 ** 15 1 * * 2019 .............. 71 17 * * 18 1 ................. .................
Washington: 2011 .............. 93 111 ................. ................. 19 2 ................. .................2019 .............. 96 68 * * 10 1 ................. .................
Wisconsin: 2011 .............. 25 4 ................. ................. ................. ................. ................. .................2019 .............. 17 2 * * ................. ................. * *
Wyoming: 2011 .............. 76 32 * * 13 1 ................. .................2019 .............. 68 30 22 ** 16 1 ................. .................
*Insufficient number of reports to publish data. **Amount applied is less than 500 lbs. 1 Data not available for all States for all years.
Note: Planted acres are in table 1-56. NASS, Environmental, Economics, and Demographics Branch, (202) 720–6146.

XIV–3 AGRICULTURAL STATISTICS 2020
Table 14-3.—Barley: Fertilizer usage, 2011 and 2019 1
State
Percent treated and amount applied
Nitrogen Phosphate Potash Sulfur
Area applied
Pounds applied
Area applied
Pounds applied
Area applied
Pounds applied
Area applied
Pounds applied
Percent Millions Percent Millions Percent Millions Percent Millions
Arizona 2011 ........... 97 8.2 39 1.5 * * 21 0.3 2019 ........... 96 1.6 34 0.5 .................. .................. * *
California: 2011 ........... 41 2.6 * * .................. .................. 14 0.2 2019 ........... 38 1.5 23 0.4 * * * *
Colorado: 2011 ........... 82 7.2 40 1.5 28 0.6 36 0.4 2019 ........... 89 5.0 81 3.3 * * * *
Idaho: 2011 ........... 93 44.2 66 10.0 37 4.9 65 9.6 2019 ........... 93 42.2 57 12.2 21 4.9 69 6.6
Minnesota: 2011 ........... 60 3.3 56 1.3 44 1.0 11 0.1 2019 ........... 89 5.5 77 2.2 78 2.0 43 0.3
Montana: 2011 ........... 90 29.1 83 16.6 37 3.6 16 1.2 2019 ........... 84 33.0 79 18.2 32 3.5 55 4.3
North Dakota: 2011 ........... 96 28.3 92 11.1 16 1.0 4 0.1 2019 ........... 92 42.0 85 18.8 20 1.5 29 1.7
Oregon: 2011 ........... 77 1.6 26 0.1 * * 36 0.1 2019 ........... 100 2.7 6 0.6 * * 60 0.2
Pennsylvania: 2011 ........... 64 1.9 32 0.8 32 0.8 10 0.1 2019 ........... 72 1.2 16 0.3 16 0.2 28 0.1
South Dakota: 2019 ........... 63 1.8 60 0.8 .................. .................. * *
Virginia: 2011 ........... 77 4.9 39 1.7 35 1.7 24 0.3 2019 ........... 56 1.0 19 0.2 18 0.4 15 0.1
Washington: 2011 ........... 91 9.0 59 1.1 9 0.2 90 1.6 2019 ........... 94 6.4 81 1.2 20 0.3 82 1.2
Wisconsin: 2011 ........... 34 0.2 * * 34 1.0 14 0.1 2019 ........... 23 0.3 15 0.1 23 0.5 8 **
Wyoming: 2011 ........... 73 5.2 55 1.8 30 0.8 18 0.4 2019 ........... 93 6.2 79 2.0 58 1.5 20 0.2
*Insufficient number of reports to publish data. **Area applied is less than 0.5 percent. 1 Data not available for all States for all years.
Note: Planted acres are in table 1-56. NASS, Environmental, Economics, and Demographics Branch, (202) 720–6146.

XIV–4 STATISTICS OF FERTILIZERS AND PESTICIDES
Table 14-4.—Corn: Pesticide usage, 2014–2018 1 2
State
Percent treated and amount applied
Herbicide Insecticide 2 Fungicide 2 Other Chemicals
Area applied
Pounds applied
Area applied
Pounds applied
Area applied
Pounds applied
Area applied
Pounds applied
Percent Thousands Percent Thousands Percent Thousands Percent Thousands
Colorado: 2016 .............. 85 3,819 23 94 (D) (D) (D) (D) 2018 .............. 93 2,978 11 69 6 46 (D) (D)
Georgia: 2016 .............. 98 1,417 22 38 31 30 ................. .................2018 .............. ................. ................. ................. ................. ................. ................. ................. .................
Illinois: 2014 .............. 98 26,870 23 237 21 321 (D) (D) 2016 .............. 99 32,524 18 146 19 256 (D) (D) 2018 .............. 97 31,289 20 149 31 604 (D) (D)
Indiana: 2014 .............. 100 14,609 9 45 12 80 (D) (D) 2016 .............. 99 14,689 17 78 16 144 (D) (D) 2018 .............. 98 14,345 12 25 28 1,481 (D) (D)
Iowa: 2014 .............. 95 30,240 13 122 19 296 (D) (D) 2016 .............. 97 35,858 10 280 22 438 (D) (D) 2018 .............. 95 32,371 18 274 32 706 (D) (D)
Kansas: 2014 .............. 97 11,432 10 244 3 13 ................. .................2016 .............. 98 18,892 6 500 (D) (D) (D) (D) 2018 .............. 98 16,373 5 175 5 39 ................. .................
Kentucky: 2014 .............. 94 4,102 29 15 11 19 (D) (D) 2016 .............. 95 6,263 30 26 26 49 (D) (D) 2018 .............. 97 4,787 20 22 16 82 (D) (D)
Michigan: 2014 .............. 98 5,710 4 5 12 36 ................. .................2016 .............. 93 4,845 6 21 (D) (D) (D) (D) 2018 .............. 98 4,999 8 13 5 71 4 7
Minnesota: 2014 .............. 98 13,596 2 26 (D) (D) (D) (D) 2016 .............. 97 16,461 7 43 3 32 ................. .................2018 .............. 99 15,885 8 50 4 63 (D) (D)
Missouri: 2014 .............. 98 8,517 24 43 14 61 ................. .................2016 .............. 92 10,121 12 16 (D) (D) ................. .................2018 .............. 92 11,451 19 102 12 70 (D) (D)
Nebraska: 2014 .............. 95 21,320 16 213 10 118 (D) (D) 2016 .............. 95 27,905 15 186 10 142 (D) (D) 2018 .............. 99 30,070 16 618 20 309 (D) (D)
New York: 2016 .............. 98 2,370 (D) (D) ................. ................. (D) (D) 2018 .............. 93 2,279 5 4 ................. ................. (D) (D)
North Carolina: 2016 .............. 95 3,447 5 3 (D) (D) (D) (D) 2018 .............. 96 3,082 16 15 13 53 (D) (D)
North Dakota: 2014 .............. 97 4,489 (D) (D) 4 16 ................. .................2016 .............. 100 6,242 (D) (D) (D) (D) ................. .................2018 .............. 99 5,481 (D) (D) (D) (D) (D) (D)
Ohio: 2014 .............. 99 9,231 13 64 9 81 (D) (D) 2016 .............. 98 9,025 17 45 13 39 (D) (D) 2018 .............. 100 10,650 19 32 12 124 6 336
Pennsylvania: 2014 .............. 97 4,080 20 46 4 6 4 2 2016 .............. 96 4,446 23 12 9 17 (D) (D) 2018 .............. 92 3,840 23 10 9 12 (D) (D)
South Dakota: 2014 .............. 98 10,803 (D) (D) 9 47 ................. .................2016 .............. 99 13,157 (D) (D) (D) (D) ................. .................2018 .............. 99 13,471 (D) (D) (D) (D) (D) (D)
Texas: 2014 .............. 89 4,338 14 528 23 27 (D) (D) 2016 .............. 84 5,992 13 364 26 40 ................. .................2018 .............. 92 4,027 16 492 13 61 5 48
Wisconsin: 2014 .............. 90 6,952 8 22 (D) (D) (D) (D) 2016 .............. 98 8,572 12 24 5 6 ................. .................2018 .............. 97 7,344 8 21 6 30 (D) (D)
(D) Withheld to avoid disclosing data for individual operations. 1 Data not available for all States for all years. 2 Amount applied excludes Bt (bacillus thuringiensis) and other biologicals.
Note: Planted acres are in table 1-36. NASS, Environmental, Economics, and Demographics Branch, (202) 720–6146.

XIV–5 AGRICULTURAL STATISTICS 2020
Table 14-5.—Corn: Fertilizer usage, 2014–2018 1
State and Year
Percent treated and amount applied
Nitrogen Phosphate Potash Sulfur
Area applied
Pounds applied
Area applied
Pounds applied
Area applied
Pounds applied
Area applied
Pounds applied
Percent Millions Percent Millions Percent Millions Percent Millions Colorado:
2016 .............. 96 149.8 66 31.3 13 2.9 38 8.4 2018 .............. 92 206.5 77 51.7 32 16.3 47 12.8
Georgia: 2016 .............. 97 74.2 84 23.4 88 46.8 43 4.0 2018 .............. ................. ................. ................. ................. ................. ................. ................. .................
Illinois: 2014 .............. 99 1,918.3 85 938.4 81 1,066.9 8 17.5 2016 .............. 98 1,908.8 86 892.7 81 1,036.9 15 43.1 2018 .............. 98 1,851.6 87 1,042.6 77 1,139.2 20 40.0
Indiana: 2014 .............. 96 877.7 81 351.1 79 530.5 22 16.0 2016 .............. 98 895.1 78 321.4 85 517.6 30 21.1 2018 .............. 100 842.0 91 310.9 80 455.0 43 38.2
Iowa: 2014 .............. 96 1,842.2 64 600.5 63 705.3 18 40.2 2016 .............. 98 2,036.1 67 701.1 70 938.8 21 45.3 2018 .............. 97 1,784.3 71 698.2 70 823.4 22 51.0
Kansas: 2014 .............. 98 549.6 87 148.5 35 60.5 29 10.1 2016 .............. 99 721.2 88 165.1 48 61.3 33 10.6 2018 .............. 100 798.2 75 246.2 39 117.5 31 21.3
Kentucky: 2014 .............. 98 214.1 88 109.0 87 119.0 14 4.5 2016 .............. 96 249.7 82 97.0 87 121.4 23 9.6 2018 .............. 98 195.0 90 106.9 88 128.1 19 5.3
Michigan: 2014 .............. 98 338.7 84 89.2 82 192.6 25 7.4 2016 .............. 94 276.0 80 83.9 71 141.2 35 11.6 2018 .............. 97 322.4 79 86.1 71 156.4 29 7.5
Minnesota: 2014 .............. 94 1,091.8 86 491.4 80 570.2 51 72.5 2016 .............. 96 1,126.0 86 442.8 75 495.2 43 63.8 2018 .............. 96 1,041.9 79 462.6 72 517.2 37 56.1
Missouri: 2014 .............. 98 603.3 81 191.1 83 228.0 32 16.2 2016 .............. 97 590.7 69 173.0 74 213.9 40 20.1 2018 .............. 98 577.9 83 208.4 82 226.8 27 16.7
Nebraska: 2014 .............. 99 1,359.9 77 329.9 29 100.8 42 71.6 2016 .............. 100 1,400.1 79 314.6 35 65.3 41 68.6 2018 .............. 99 1,569.9 73 361.8 25 75.3 38 74.7
New York: 2016 .............. 98 77.6 70 25.2 60 31.7 24 4.0 2018 .............. 97 103.0 79 30.9 69 46.6 16 2.2
North Carolina: 2016 .............. 91 127.7 63 32.6 68 62.8 35 7.5 2018 .............. 94 125.7 74 39.4 76 63.2 26 10.1
North Dakota: 2014 .............. 99 349.7 88 132.1 44 34.7 43 12.3 2016 .............. 97 446.5 92 195.4 59 63.6 56 32.4 2018 .............. 97 444.3 88 165.7 62 66.1 40 20.3
Ohio: 2014 .............. 98 558.8 85 228.9 80 282.2 15 5.1 2016 .............. 99 585.4 87 225.6 79 302.4 31 22.9 2018 .............. 99 604.7 81 225.5 68 258.1 26 12.8
Pennsylvania: 2014 .............. 96 137.7 67 39.7 66 40.5 35 5.6 2016 .............. 91 124.4 41 23.8 46 30.4 47 11.2 2018 .............. 94 155.6 55 30.7 48 34.6 34 7.3
South Dakota: 2014 .............. 97 684.8 83 216.4 50 113.2 35 24.0 2016 .............. 99 715.9 87 249.9 52 136.1 44 36.2 2018 .............. 99 657.0 88 258.1 60 147.0 44 52.0
Texas: 2014 .............. 95 310.5 77 77.9 37 19.2 43 10.7 2016 .............. 87 313.3 60 59.5 22 12.7 36 11.4 2018 .............. 97 301.8 73 68.1 40 23.0 41 10.2
Wisconsin: 2014 .............. 98 407.6 85 127.9 88 222.2 49 31.7 2016 .............. 96 427.2 78 103.8 84 217.3 55 36.0 2018 .............. 97 426.2 80 116.6 79 232.2 38 29.9
1 Data not available for all States for all years. Note: Planted acres are in table 1-36. NASS, Environmental, Economics, and Demographics Branch, (202) 720–6146.

XIV–6 STATISTICS OF FERTILIZERS AND PESTICIDES
Table 14-6.—Cotton, Upland: Pesticide usage, 2017–2019 1
State and Year
Percent treated and amount applied
Herbicide Insecticide 2 Fungicide Other Chemicals
Area applied
Pounds applied
Area applied
Pounds applied
Area applied
Pounds applied
Area applied
Pounds applied
Percent Thousands Percent Thousands Percent Thousands Percent Thousands
Alabama: 2017 ........... 99 1,422 66 120 (D) (D) 100 919 2019 ........... 100 1,900 78 166 .................. .................. 97 954
Arizona: 2019 ........... 91 329 63 41 .................. .................. 91 82
Arkansas: 2017 ........... 86 1,681 94 786 6 7 100 1,400 2019 ........... 98 2,210 98 1,057 8 15 100 1,895
California: 2019 ........... 99 609 96 226 (D) (D) 85 620
Georgia: 2017 ........... 99 4,409 71 348 1 9 99 3,185 2019 ........... 100 4,445 73 486 8 31 91 2,574
Louisiana: 2019 ........... 99 1,297 97 496 (D) (D) 100 592
Mississippi: 2017 ........... 99 3,017 93 1,271 (D) (D) 96 1,675 2019 ........... 100 3,116 89 1,321 (D) (D) 96 1,438
Missouri: 2017 ........... 100 1,037 92 382 18 9 100 730 2019 ........... 100 1,126 90 485 (D) (D) 100 1,205
North Carolina:
2017 ........... 98 1,378 81 140 (D) (D) 91 699 2019 ........... 100 2,002 95 343 (D) (D) 99 896
Oklahoma: 2017 ........... 59 765 38 112 .................. .................. 15 173 2019 ........... 90 2,501 48 247 (D) (D) 71 767
South Carolina:
2019 ........... 94 1,153 87 86 (D) (D) 91 716 Tennessee:
2017 ........... 98 1,266 96 429 (D) (D) 100 739 2019 ........... 98 1,711 100 385 (D) (D) 97 786
Texas: 2017 ........... 90 14,554 23 881 .................. .................. 58 4,366 2019 ........... 88 21,076 32 2,412 (D) (D) 41 3,744
(D) Withheld to avoid disclosing data for individual operations. 1 Data not available for all States for all years. 2Amount applied excludes Bt (bacillus thuringiensis) and other biologicals.
Note: Planted acres are in table 2-2. NASS, Environmental, Economics, and Demographics Branch, (202) 720–6146.

XIV–7 AGRICULTURAL STATISTICS 2020
Table 14-7.—Cotton, Upland: Fertilizer usage, 2017–2019 1
State and Year
Percent treated and amount applied
Nitrogen Phosphate Potash Sulfur
Area applied
Pounds applied
Area applied
Pounds applied
Area applied
Pounds applied
Area applied
Pounds applied
Percent Millions Percent Millions Percent Millions Percent Millions Alabama:
2017 ........... 93 42.0 72 19.5 81 29.3 38 2.6 2019 ........... 98 57.0 78 23.9 96 46.2 48 5.0
Arizona: 2019 ........... 96 23.3 28 2.3 (D) (D) (D) (D)
Arkansas: 2017 ........... 97 69.2 74 17.5 79 35.3 53 4.8 2019 ........... 99 89.9 83 28.1 94 53.3 36 5.4
California: 2019 ........... 95 31.5 26 2.0 (D) (D) (D) (D)
Georgia: 2017 ........... 100 143.5 81 58.0 91 103.7 63 14.3 2019 ........... 98 140.0 88 71.2 93 125.1 41 10.9
Louisiana: 2019 ........... 94 23.9 70 11.6 69 18.9 61 2.3
Mississippi: 2017 ........... 99 72.4 47 15.2 60 34.6 37 3.7 2019 ........... 97 82.7 43 18.9 73 54.1 36 3.4
Missouri: 2017 ........... 98 33.3 87 12.4 96 20.5 62 3.3 2019 ........... 100 41.6 91 15.8 86 26.1 41 1.8
North Carolina:
2017 ........... 96 30.6 67 12.4 87 32.0 56 6.6 2019 ........... 97 45.3 52 13.3 89 43.7 41 7.7
Oklahoma: 2017 ........... 54 31.8 44 11.4 19 4.8 7 0.3 2019 ........... 63 47.5 58 14.8 29 3.6 11 0.9
South Carolina:
2019 ........... 92 28.3 59 8.5 88 30.9 45 2.6 Tennessee:
2017 ........... 100 35.0 99 19.0 95 29.9 82 3.3 2019 ........... 100 40.7 94 21.2 100 38.4 84 4.5
Texas: 2017 ........... 68 363.7 52 133.2 25 35.1 31 26.0 2019 ........... 79 316.8 54 113.4 22 17.7 42 27.8
(D) Withheld to avoid disclosing data for individual operations. 1 Data not available for all States for all years. Note: Planted acres are in table 2-3. NASS, Environmental, Economics, and Demographics Branch, (202) 720–6146.

XIV–8 STATISTICS OF FERTILIZERS AND PESTICIDES
Table 14-8.—Peanuts: Pesticide usage, 2013 and 2018 1
State and Year
Percent treated and amount applied
Herbicide Insecticide Fungicide Other Chemicals
Area applied
Pounds applied
Area applied
Pounds applied
Area applied
Pounds applied
Area applied
Pounds applied
Percent Thousands Percent Thousands Percent Thousands Percent Thousands
Alabama: 2013 ........... 99 219 32 33 95 632 * * 2018 ........... 99 312 37 13 95 469 .................. 1
Florida: 2013 ........... 93 237 59 28 100 670 * * 2018 ........... 96 250 47 34 94 471 (D) (D)
Georgia: 2013 ........... 100 853 48 177 97 1,692 * * 2018 ........... 98 1,187 40 78 98 2,738 5 2
North Carolina:
2013 ........... 99 190 71 54 87 144 * * 2018 ........... 97 299 58 38 92 173 27 18
South Carolina:
2013 ........... 96 150 60 33 81 261 .................. ..................2018 ........... 95 232 34 13 80 221 (D) (D)
Texas: 2013 ........... 65 93 11 2 33 42 .................. ..................2018 ........... 73 123 4 1 38 38 (D) (D)
* Insufficient number of reports to publish data. (D) Withheld to avoid disclosing data for individual operations. 1 Data not available for all States for all years.
Note: Planted acres are in table 3-16. NASS, Environmental, Economics, and Demographics Branch, (202) 720–6146.
Table 14-9.—Peanuts: Fertilizer usage, 2013 and 2018 1
State and Year
Percent treated and amount applied
Nitrogen Phosphate Potash Sulfur
Area applied
Pounds applied
Area applied
Pounds applied
Area applied
Pounds applied
Area applied
Pounds applied
Percent Millions Percent Millions Percent Millions Percent Millions
Alabama: 2013 ........... 48 1.5 54 3.0 57 5.2 19 0.6 2018 ........... 41 1.5 41 3.0 41 3.9 8 0.2
Florida: 2013 ........... 81 2.2 86 4.9 93 11.7 36 1.3 2018 ........... 40 1.6 36 2.5 40 7.0 (D) (D)
Georgia: 2013 ........... 27 2.1 31 6.5 26 6.5 * * 2018 ........... 22 2.6 26 6.8 26 10.4 7 0.8
North Carolina:
2013 ........... 21 0.5 22 0.7 51 4.1 23 0.5 2018 ........... (D) (D) (D) (D) 56 5.4 14 0.2
South Carolina:
2013 ........... 13 0.5 14 0.4 22 1.5 * * 2018 ........... (D) (D) (D) (D) 10 0.9 (D) (D)
Texas: 2013 ........... 57 5.3 47 2.4 34 1.4 37 0.7 2018 ........... 74 7.1 66 3.3 48 2.5 43 0.8
* Insufficient number of reports to publish data. (D) Withheld to avoid disclosing data for individual operations. 1 Data not available for all States for all years.
Note: Planted acres are in table 3-16. NASS, Environmental, Economics, and Demographics Branch, (202) 720–6146.

XIV–9 AGRICULTURAL STATISTICS 2020
Table 14-10.—Oats: Pesticide usage, 2005 and 2015 1
State and Year
Percent treated and amount applied
Herbicide Insecticide Fungicide
Area applied
Pounds applied
Area applied
Pounds applied
Area applied
Pounds applied
Percent Thousands Percent Thousands Percent Thousands
California: 2005 ........... 36 59 ......................... ......................... ......................... .........................
Idaho: 2005 ........... 26 17 ......................... ......................... ......................... .........................
Illinois: 2005 ........... 7 1 ......................... ......................... ......................... .........................2015 ........... (D) (D) ......................... ......................... (D) (D)
Iowa: 2005 ........... 3 2 ......................... ......................... ......................... .........................2015 ........... (D) (D) ......................... ......................... (D) (D)
Kansas: 2005 ........... 27 13 ......................... ......................... ......................... .........................2015 ........... 41 28 ......................... ......................... (D) (D)
Michigan: 2005 ........... 61 26 ......................... ......................... ......................... .........................2015 ........... 66 33 (D) (D) (D) (D)
Minnesota: 2005 ........... 21 26 ......................... ......................... ......................... .........................2015 ........... 43 66 (D) (D) 13 4
Montana: 2005 ........... 34 18 ......................... ......................... ......................... .........................
Nebraska: 2005 ........... 7 4 ......................... ......................... ......................... .........................2015 ........... 35 21 ......................... ......................... (D) (D)
New York: 2005 ........... 51 23 ......................... ......................... ......................... .........................2015 ........... 63 26 (D) (D) (D) (D)
North Dakota: 2005 ........... 54 167 ......................... ......................... ......................... .........................2015 ........... 82 186 (D) (D) 9 2
Ohio: 2015 ........... 59 22 ......................... ......................... ......................... .........................
Pennsylvania: 2005 ........... 58 46 ......................... ......................... ......................... .........................2015 ........... 60 43 (D) (D) ......................... .........................
South Dakota: 2005 ........... 37 52 ......................... ......................... ......................... .........................2015 ........... 81 130 (D) (D) 21 9
Texas: 2005 ........... 26 80 18 35 ......................... .........................2015 ........... 45 95 14 28 9 10
Wisconsin: 2005 ........... 18 25 ......................... ......................... ......................... .........................2015 ........... 30 37 (D) (D) 6 2
(D) Withheld to avoid disclosing data for individual operations. 1 Data not available for all States for all years. Note: Planted acres are in table 1-48. NASS, Environmental, Economics, and Demographics Branch, (202) 720–6146.

XIV–10 STATISTICS OF FERTILIZERS AND PESTICIDES
Table 14-11.—Oats: Fertilizer usage, 2005 and 2015 1
State and Year
Percent treated and amount applied
Nitrogen Phosphate Potash Sulfur
Area applied
Pounds applied
Area applied
Pounds applied
Area applied
Pounds applied
Area applied
Pounds applied
Percent Millions Percent Millions Percent Millions Percent Millions
California: 2005 .......... 26 4.4 .................. .................. .................. .................. .................. ..................
Idaho: 2005 .......... 42 1.6 22 1.4 5 0.1 12 0.2
Illinois: 2005 .......... 15 0.4 12 0.4 26 1.7 .................. ..................2015 .......... 28 0.4 20 0.5 28 0.9 (D) (D)
Iowa: 2005 .......... 31 1.8 30 2.5 40 6.9 .................. ..................2015 .......... 27 1.4 26 2.1 28 2.7 11 0.3
Kansas: 2005 .......... 84 4.4 39 1.4 17 0.8 .................. ..................2015 .......... 87 4.5 33 0.9 12 0.3 (D) (D)
Michigan: 2005 .......... 82 2.6 72 2.8 77 3.4 .................. ..................2015 .......... 81 2.0 75 1.7 78 2.0 6 (Z)
Minnesota: 2005 .......... 28 4.2 22 2.4 28 5.9 5 0.2 2015 .......... 60 8.3 50 3.6 53 6.7 21 0.7
Montana: 2005 .......... 53 2.0 35 1.0 14 0.4 9 0.1
Nebraska: 2005 .......... 68 4.5 24 1.3 7 0.1 5 ..................2015 .......... 77 5.1 65 2.6 36 0.8 29 0.4
New York: 2005 .......... 75 1.9 72 2.7 72 2.8 .................. ..................2015 .......... 66 1.3 63 1.7 62 1.8 (D) (D)
North Dakota:
2005 .......... 71 15.8 49 5.7 9 0.7 5 0.1 2015 .......... 88 12.1 70 7.2 27 0.9 22 0.6
Ohio: 2015 .......... 70 1.3 69 2.2 66 2.7 (D) (D)
Pennsylvania: 2005 .......... 90 4.5 81 4.9 82 5.1 2 0.1 2015 .......... 81 2.2 76 2.9 75 2.7 (D) (D)
South Dakota:
2005 .......... 64 11.8 46 5.6 17 1.7 .................. ..................2015 .......... 91 22.1 74 9.2 20 1.1 17 0.7
Texas: 2005 .......... 79 45.4 56 12.7 39 4.9 25 1.7 2015 .......... 97 27.8 82 12.1 39 3.2 51 3.0
Wisconsin: 2005 .......... 23 2.1 24 3.9 35 15.1 8 0.4 2015 .......... 51 3.9 36 2.9 45 8.4 21 1.0
(D) Withheld to avoid disclosing data for individual operations. (Z) Less than half the rounding unit. 1 Data not available for all States for all years.
Note: Planted acres are in table 1-48. NASS, Environmental, Economics, and Demographics Branch, (202) 720–6146.

XIV–11 AGRICULTURAL STATISTICS 2020
Table 14-12.—Potatoes, Fall: Pesticide usage, 2010–2016 1
State and Year
Percent treated and amount applied
Herbicide Insecticide 2 Fungicide Other Chemicals
Area applied
Pounds applied
Area applied
Pounds applied
Area applied
Pounds applied
Area applied
Pounds applied
Percent Thousands Percent Thousands Percent Thousands Percent Thousands
Colorado: 2010 .............. 92 173 93 108 98 191 74 5,156 2014 .............. 78 83 50 37 96 120 74 5,696 2016 .............. 73 73 77 8 74 87 (D) (D)
Idaho: 2010 .............. 98 829 67 190 93 983 63 36,080 2014 .............. 89 717 89 287 95 1,618 57 36,437 2016 .............. 92 662 65 81 99 846 49 23,552
Maine: 2010 .............. 93 36 91 8 100 373 73 30 2014 .............. 97 30 84 9 90 329 78 37 2016 .............. 90 46 93 5 99 402 22 31
Michigan: 2010 .............. 90 70 90 18 96 298 67 46 2014 .............. 99 86 96 32 99 442 73 35 2016 .............. 99 118 100 24 99 511 ................. .................
Minnesota: 2010 .............. 90 44 99 9 100 586 48 3,099 2014 .............. 91 34 93 13 91 612 52 4,067 2016 .............. 90 90 94 7 98 879 (D) (D)
North Dakota: 2010 .............. 89 71 85 13 96 874 60 6,872 2014 .............. 90 71 89 10 99 801 30 1,653 2016 .............. 98 103 96 33 100 1,943 (D) (D)
Washington: 2010 .............. 98 376 97 392 99 1,197 80 16,901 2014 .............. 92 566 98 489 99 1,109 87 16,635 2016 .............. 100 662 98 205 98 1,472 56 14,517
Wisconsin: 2010 .............. 82 73 91 12 96 866 92 2,742 2014 .............. 95 96 99 16 100 987 96 4,913 2016 .............. 99 120 84 39 100 825 48 4,502
(D) Withheld to avoid disclosing data for individual operations. 1 Data not available for all States for all years. 2 Amount applied excludes Bt (bacillus thuringiensis) and other biologicals.
NASS, Environmental, Economics, and Demographics Branch, (202) 720–6146.

XIV–12 STATISTICS OF FERTILIZERS AND PESTICIDES
Table 14-13.—Potatoes, Fall: Fertilizer usage, 2010–2016 1
State and Year
Percent treated and amount applied
Nitrogen Phosphate Potash Sulfur
Area applied
Pounds applied
Area applied
Pounds applied
Area applied
Pounds applied
Area applied
Pounds applied
Percent Millions Percent Millions Percent Millions Percent Millions
Colorado: 2010 .............. 97 10.0 92 10.4 66 3.9 93 5.2 2014 .............. 94 9.2 93 7.2 70 1.6 94 2.6 2016 .............. 93 7.8 93 9.1 86 6.3 92 2.3
Idaho: 2010 .............. 100 75.0 96 53.2 91 35.9 81 30.0 2014 .............. 99 78.1 98 47.5 85 36.3 90 23.6 2016 .............. 100 88.3 94 62.5 94 43.3 83 29.3
Maine: 2010 .............. 99 8.8 99 8.2 95 10.2 (D) (D) 2014 .............. 98 8.3 98 7.1 98 8.7 12 0.1 2016 .............. 98 8.5 96 7.0 98 10.4 5 (Z)
Michigan: 2010 .............. 100 8.6 98 3.5 100 8.6 (D) (D) 2014 .............. 100 7.9 99 3.8 100 9.6 52 1.7 2016 .............. 100 8.8 99 2.8 99 10.0 87 2.2
Minnesota: 2010 .............. 98 9.2 100 4.6 100 14.6 80 1.3 2014 .............. 100 6.2 88 2.8 80 5.9 66 0.9 2016 .............. 99 6.7 98 3.0 91 5.7 73 1.7
North Dakota: 2010 .............. 100 15.1 89 7.9 84 14.3 44 1.3 2014 .............. 100 12.3 97 8.9 100 8.7 79 1.7 2016 .............. 100 16.0 99 8.8 81 14.0 52 1.3
Washington: 2010 .............. 100 32.6 99 24.9 94 36.0 90 9.7 2014 .............. 100 29.2 100 20.1 97 18.2 82 7.2 2016 .............. 95 30.6 75 19.0 81 18.3 80 8.1
Wisconsin: 2010 .............. 100 16.5 100 5.3 93 17.7 91 3.9 2014 .............. 100 15.0 96 5.4 99 20.8 89 4.2 2016 .............. 100 15.5 100 5.9 98 20.5 90 4.5
(D) Withheld to avoid disclosing data for individual operations. (Z) Less than half of rounding unit for data item shown (see data item definition for rounding unit). 1 Data not available for all States for all years.
NASS, Environmental, Economics, and Demographics Branch, (202) 720–6146.

XIV–13 AGRICULTURAL STATISTICS 2020
Table 14-14.—Rice: Pesticide usage, 2006 and 2013 1
State and Year
Percent treated and amount applied
Herbicide Insecticide Fungicide Other Chemicals
Area applied
Pounds applied
Area applied
Pounds applied
Area applied
Pounds applied
Area applied
Pounds applied
Percent Thousands Percent Thousands Percent Thousands Percent Thousands
Arkansas: 2006 .......... 95 3,054 10 14 37 109 5 269 2013 .......... 97 2,646 30 10 45 103 5 251
California: 2006 .......... 93 2,500 14 2 50 738 .................. ..................2013 .......... 96 2,986 28 6 45 553 * *
Louisiana: 2006 .......... 96 475 42 49 46 30 .................. ..................2013 .......... 99 680 17 13 73 82 * *
Mississippi: 2006 .......... 100 502 55 14 46 16 3 36 2013 .......... 100 364 51 2 35 9 6 37
Missouri: 2006 .......... 100 454 .................. .................. 25 12 .................. ..................2013 .......... 100 512 18 1 55 22 20 159
Texas: 2006 .......... 97 496 77 83 55 21 .................. ..................2013 .......... 88 263 35 3 35 11 * *
* Insufficient number of reports to publish data. 1 Data not available for all States for all years.Note: Planted acres are in table 1-27. NASS, Environmental, Economics, and Demographics Branch, (202) 720–6146.
Table 14-15.—Rice: Fertilizer usage, 2006 and 2013 1
State and Year
Percent treated and amount applied
Nitrogen Phosphate Potash Sulfur
Area applied
Pounds applied
Area applied
Pounds applied
Area applied
Pounds applied
Area applied
Pounds applied
Percent Millions Percent Millions Percent Millions Percent Millions
Arkansas: 2006 .......... 97 281.2 68 54.7 60 64.9 9 6.0 2013 .......... 96 195.8 76 53.2 56 51.3 14 2.1
California: 2006 .......... 94 61.4 75 18.2 40 7.2 31 4.0 2013 .......... 98 83.9 81 21.2 38 7.2 41 4.4
Louisiana: 2006 .......... 99 52.8 78 14.6 75 16.2 4 0.3 2013 .......... 100 63.9 87 16.0 79 23.0 14 1.3
Mississippi: 2006 .......... 99 35.8 29 2.5 4 0.5 42 1.5 2013 .......... 100 23.3 13 0.8 * * 50 1.2
Missouri: 2006 .......... 100 45.2 47 5.5 42 5.7 29 0.7 2013 .......... 100 32.7 56 4.7 * * 29 0.6
Texas: 2006 .......... 97 29.2 92 5.8 89 6.0 30 0.6 2013 .......... 90 22.3 82 5.5 79 5.4 11 0.1
* Insufficient number of reports to publish data. 1 Data not available for all States for all years. Note: Planted acres are in table 1-27. NASS, Environmental, Economics, and Demographics Branch, (202) 720–6146.

XIV–14 STATISTICS OF FERTILIZERS AND PESTICIDES
Table 14-16.—Sorghum: Pesticide usage, 2011 and 2019 1
State and Year
Percent treated and amount applied
Herbicide Insecticide Fungicide Other chemicals
Area applied
Pounds applied
Area applied
Pounds applied
Area applied
Pounds applied
Area applied
Pounds applied
Percent Thousands Percent Thousands Percent Thousands Percent Thousands
Colorado: 2011 ..... 75 285 .................. .................. .................. .................. .................. ..................2019 ..... 96 1,129 .................. .................. .................. .................. .................. ..................
Kansas: 2011 ..... 96 9,411 4 3 .................. .................. .................. ..................2019 ..... 94 9,471 (D) (D) .................. .................. (D) (D)
Missouri: 2019 ..... .................. .................. (D) (D) (D) (D) .................. ..................
Nebraska: 2011 ..... 84 362 (D) (D) .................. .................. .................. ..................2019 ..... 100 760 (D) (D) (D) (D) .................. ..................
New Mex-ico: 2019 ..... .................. .................. (D) (D) .................. .................. .................. ..................
Oklahoma: 2011 ..... 74 505 (D) (D) .................. .................. .................. ..................2019 ..... 87 539 (D) (D) (D) (D) .................. ..................
South Dakota:
2011 ..... 89 289 (D) (D) .................. .................. .................. ..................2019 ..... 100 786 (D) (D) .................. .................. .................. ..................
Texas: 2011 ..... 72 1,901 10 9 (D) (D) .................. ..................2019 ..... 78 2,891 27 192 (D) (D) (D) (D)
(D) Withheld to avoid disclosing data for individual operations. 1 Data not available for all States for all years. Note: Planted acres are in table 1-65. NASS, Environmental, Economics, and Demographics Branch, (202) 720–6146.
Table 14-17.—Sorghum: Fertilizer usage, 2011 and 2019 1
State
Percent treated and amount applied
Nitrogen Phosphate Potash Sulfur
Area applied
Pounds applied
Area applied
Pounds applied
Area applied
Pounds applied
Area applied
Pounds applied
Percent Millions Percent Millions Percent Millions Percent Millions
Colorado: 2011 ........... 75 7.4 41 1.5 (D) (D) (D) (D) 2019 ........... 57 7.9 (D) (D) .................. .................. 20 0.7
Kansas: 2011 ........... 83 135.7 51 32.8 8 2.9 9 1.5 2019 ........... 97 198.9 65 34.4 (D) (D) 19 1.9
Missouri: 2019 ........... .................. .................. .................. .................. .................. .................. (D) (D)
Nebraska: 2011 ........... 88 11.0 41 1.9 15 0.2 22 0.4 2019 ........... 94 16.2 58 5.0 191 0.2 45 0.6
New Mexico: 2019 ........... (D) (D) (D) (D) .................. .................. (D) (D)
Oklahoma: 2011 ........... 81 11.9 58 3.8 13 0.2 13 0.3 2019 ........... 85 14.9 67 7.3 5 0.1 (D) (D)
South Dakota:
2011 ........... 88 8.9 45 1.9 (D) (D) (D) (D) 2019 ........... (D) (D) 77 5.0 (D) (D) (D) (D)
Texas: 2011 ........... 77 94.1 63 27.2 11 3.7 29 5.1 2019 ........... 83 99.0 50 23.2 22 6.2 25 3.5
(D) Withheld to avoid disclosing data for individual operations. 1 Data not available for all States for all years. Note: Planted acres are in table 1-65. NASS, Environmental, Economics, and Demographics Branch, (202) 720–6146.

XIV–15 AGRICULTURAL STATISTICS 2020
Table 14-18.—Soybeans: Pesticide usage, 2017 and 2018 1
State and Year
Percent treated and amount applied
Herbicide Insecticide 2 Fungicide Other Chemicals 2
Area applied
Pounds applied
Area applied
Pounds applied
Area applied
Pounds applied
Area applied
Pounds applied
Percent Thousands Percent Thousands Percent Thousands Percent Thousands
Arkansas: 2017 ........ 97 7,898 33 350 13 76 (D) (D) 2018 ........ 95 9,729 26 244 17 328 .................. ..................
Illinois: 2017 ........ 95 20,547 19 98 22 399 5 22 2018 ........ 98 23,531 16 98 24 643 (D) (D)
Indiana: 2017 ........ 98 14,058 15 48 16 209 6 7 2018 ........ 97 12,624 16 28 18 172 6 1
Iowa: 2017 ........ 95 19,887 19 221 17 280 (D) (D) 2018 ........ 100 21,526 19 283 19 357 (D) (D)
Kansas: 2017 ........ 93 9,362 15 87 4 22 (D) (D) 2018 ........ 100 12,629 19 165 11 109 (D) (D)
Kentucky: 2017 ........ 97 3,759 33 87 21 55 5 2 2018 ........ 95 4,826 18 11 12 32 7 1
Louisiana: 2015 ........ 97 4,186 63 .................. 43 107 (D) (D) 2018 ........ 96 4,296 59 512 46 659 3 (Z)
Michigan: 2017 ........ 98 3,986 5 9 7 24 (D) (D) 2018 ........ 99 4,026 6 59 (D) (D) 3 (Z)
Minnesota: 2017 ........ 94 12,240 38 577 13 203 (D) (D) 2018 ........ 99 12,060 30 637 21 299 .................. ..................
Mississippi: 2017 ........ 100 8,596 50 493 40 135 14 498 2018 ........ 100 8,582 26 85 35 291 8 163
Missouri: 2017 ........ 92 10,982 21 222 12 102 3 (Z) 2018 ........ 97 12,082 17 93 6 201 (D) (D)
Nebraska: 2017 ........ 98 11,089 6 189 9 105 (D) (D) 2018 ........ 99 12,978 8 18 13 244 .................. ..................
North Carolina
2017 ........ 97 3,264 38 77 18 52 (D) (D) 2018 ........ 97 4,726 23 27 14 33 (D) (D)
North Dakota
2017 ........ 94 11,454 13 241 6 82 (D) (D) 2018 ........ 99 10,056 (D) (D) (D) (D) (D) (D)
Ohio: 2017 ........ 96 9,448 11 20 18 126 4 6 2018 ........ 100 9,726 8 12 11 123 (D) (D)
South Dakota
2017 ........ 98 11,515 (D) (D) 3 18 (D) (D) 2018 ........ 99 11,044 .................. .................. (D) (D) (D) (D)
Tennessee: 2015 ........ 100 4,427 22 14 15 40 (D) (D) 2018 ........ 100 4,790 15 11 14 37 (D) (D)
Virginia: 2015 ........ 96 1,224 37 25 16 19 (D) (D) 2018 ........ 100 1,124 27 12 24 33 (D) (D)
Wisconsin: 2017 ........ 96 3,058 (D) (D) 14 47 (D) (D) 2018 ........ 98 3,705 (D) (D) 14 49 .................. ..................
(D) Withheld to avoid disclosing data for individual operations. (Z) Less than the rounding unit. 1 Data not available for all States for all years. 2 Amount applied excludes Bt (bacillus thuringiensis) and other biologicals.
Note: Planted acres are in table 3-32. NASS, Environmental, Economics, and Demographics Branch, (202) 720–6146.

XIV–16 STATISTICS OF FERTILIZERS AND PESTICIDES
Table 14-19.—Soybeans: Fertilizer usage, 2017 and 2018 1
State and Year
Percent treated and amount applied
Nitrogen Phosphate Potash Sulfur
Area applied
Pounds applied
Area applied
Pounds applied
Area applied
Pounds applied
Area applied
Pounds applied
Percent Millions Percent Millions Percent Millions Percent Millions
Arkansas: 2017 ........ 13 18.9 51 106.7 59 205.0 2 2.6 2018 ........ 7 8.1 51 113.3 56 155.0 7 4.0
Illinois: 2017 ........ 25 63.8 36 279.8 53 713.6 5 7.4 2018 ........ 25 60.0 43 350.6 61 733.9 5 9.7
Indiana: 2017 ........ 31 57.3 39 144.2 62 417.2 6 8.4 2018 ........ 28 32.0 33 111.1 50 309.5 10 2.9
Iowa: 2017 ........ 13 14.4 23 145.0 34 357.1 6 8.1 2018 ........ 13 17.2 21 125.9 32 276.3 8 16.3
Kansas: 2017 ........ 49 40.6 54 118.0 26 65.4 14 4.7 2018 ........ 29 22.8 38 76.9 18 48.7 10 4.7
Kentucky: 2017 ........ 28 13.7 68 94.4 70 130.2 7 2.5 2018 ........ 32 21.3 74 109.9 85 186.7 5 3.0
Louisiana: 2015 ........ (D) (D) 29 22.0 29 27.9 7 1.8 2018 ........ 10 4.3 41 31.1 51 51.8 10 2.0
Michigan: 2017 ........ 48 15.9 49 49.2 74 141.0 11 1.8 2018 ........ 50 16.9 48 45.7 77 155.6 18 8.9
Minnesota: 2017 ........ 26 35.2 28 95.0 34 161.0 6 5.1 2018 ........ 29 32.8 35 124.9 36 191.4 11 11.5
Mississippi: 2017 ........ 4 0.7 17 20.6 38 66.6 4 1.6 2018 ........ 6 2.6 31 43.8 44 99.9 6 1.8
Missouri: 2017 ........ 20 32.4 46 143.9 55 272.0 11 7.4 2018 ........ 11 11.6 33 89.1 44 193.0 6 2.9
Nebraska: 2017 ........ 43 34.4 46 128.1 16 28.1 19 14.2 2018 ........ 36 29.5 43 154.2 18 53.1 17 11.0
North Carolina
2017 ........ 54 20.3 46 30.1 72 95.5 15 4.2 2018 ........ 46 17.5 45 28.4 70 83.8 9 3.1
North Dakota
2017 ........ 45 48.7 50 167.4 11 19.2 12 13.4 2018 ........ 55 39.1 62 145.7 18 20.4 12 6.6
Ohio: 2017 ........ 32 25.2 30 72.0 61 329.5 8 15.9 2018 ........ 33 22.8 37 107.5 57 295.1 4 1.4
South Dakota
2017 ........ 40 22.4 56 124.1 26 50.3 4 5.7 2018 ........ 42 28.9 55 141.4 28 53.1 13 5.6
Tennessee: 2015 ........ 48 22.1 66 78.1 70 116.5 17 2.9 2018 ........ 65 26.7 76 89.3 72 107.4 21 3.1
Virginia: 2015 ........ 58 9.2 64 19.6 79 40.6 25 2.0 2018 ........ 53 6.3 56 15.4 65 34.7 27 1.1
Wisconsin: 2017 ........ 59 24.3 56 52.5 80 156.0 31 9.1 2018 ........ 37 15.9 50 70.0 74 171.9 29 11.7
(D) Withheld to avoid disclosing data for individual operations. 1 Data not available for all States for all years. Note: Planted acres are in table 3-32. NASS, Environmental, Economics, and Demographics Branch, (202) 720–6146.

XIV–17 AGRICULTURAL STATISTICS 2020
Table 14-20.—Wheat: Pesticide usage, 2017 and 2019 1
State and Year
Percent treated and amount applied
Herbicide Insecticide Fungicide 2 Other Chemicals 2
Area applied
Pounds applied
Area applied
Pounds applied
Area applied
Pounds applied
Area applied
Pounds applied
Percent Thousands Percent Thousands Percent Thousands Percent Thousands Winter
Colorado: 2017 .......... 83 3,230 (D) (D) 24 63 (D) (D) 2019 .......... 79 2,910 (D) (D) 30 65 (D) (D)
Idaho: 2017 .......... 95 496 15 20 60 79 (D) (D) 2019 .......... 96 506 (D) (D) 17 52 (D) (D)
Illinois: 2017 .......... 59 39 33 5 46 61 (D) (D) 2019 .......... 54 32 46 8 65 87 11 6
Kansas: 2017 .......... 69 4,917 (D) (D) 21 250 ................ ...................2019 .......... 72 3,486 (D) (D) 14 121 (D) (D)
Michigan: 2017 .......... 66 80 40 4 67 67 11 5 2019 .......... 79 123 34 4 62 88 19 9
Missouri: 2017 .......... 62 133 33 12 44 54 (D) (D) 2019 .......... 54 64 24 4 39 33 ................ ...................
Montana: 2017 .......... 96 4,105 ................ ................... 21 47 ................ ...................2019 .......... 99 3,703 (D) (D) 20 39 (D) (D)
Nebraska: 2017 .......... 69 1,424 (D) (D) 31 45 ................ ...................2019 .......... 75 917 (D) (D) 36 77 (D) (D)
North Dakota: 2017 .......... 81 53 (D) (D) 25 2 ................ ...................2019 .......... 80 33 ................ ................... (D) (D) ................ ...................
Ohio: 2017 .......... 41 44 17 4 29 28 ................ ...................2019 .......... 26 34 16 2 39 32 (D) (D)
Oklahoma: 2017 .......... 37 1,534 (D) (D) 6 52 ................ ...................2019 .......... 36 899 8 60 10 64 (D) (D)
Oregon: 2017 .......... 98 1,525 (D) (D) 39 53 (D) (D) 2019 .......... 100 1,106 (D) (D) 55 64 (D) (D)
South Dakota: 2017 .......... 60 542 (D) (D) 25 22 ................ ...................2019 .......... 60 409 (D) (D) (D) (D) ................ ...................
Texas: 2017 .......... 23 607 6 109 17 91 ................ ...................2019 .......... 48 1,924 13 173 8 27 ................ ...................
Washington: 2017 .......... 99 1,885 (D) (D) 67 222 (D) (D) 2019 .......... 95 1,326 (D) (D) 48 183 ................ ...................
Durum Arizona:
2017 .......... 72 14 ................ ................... (D) (D) (D) (D) 2019 .......... 84 5 ................ ................... ................ ................... ................ ...................
California: 2019 .......... 77 23 (D) (D) ................ ................... (D) (D)
Idaho: 2017 .......... 96 11 (D) (D) (D) (D) ................ ...................
Montana: 2017 .......... 87 944 ................ ................... 11 7 (D) (D) 2019 .......... 98 710 (D) (D) 16 11 ................ ...................
North Dakota: 2017 .......... 100 1,358 (D) (D) 55 77 (D) (D) 2019 .......... 96 613 (D) (D) 53 59 (D) (D)
Other Spring Idaho:
2017 .......... 93 211 16 2 45 27 (D) (D) 2019 .......... 100 310 9 1 23 12 (D) (D)
Minnesota: 2017 .......... 96 538 37 16 86 199 ................ ...................2019 .......... 99 537 29 8 79 226 ................ ...................
Montana: 2017 .......... 94 3,603 ................ ................... 7 27 ................ ...................2019 .......... 98 3,971 (D) (D) 5 10 (D) (D)
North Dakota: 2017 .......... 99 4,467 12 48 57 416 ................ ...................2019 .......... 95 4,595 7 20 58 631 (D) (D)
South Dakota: 2017 .......... 89 613 13 3 28 22 ................ ...................2019 .......... 97 317 10 2 57 92 ................ ...................
Washington: 2019 .......... 100 441 (D) (D) 42 29 ................ ...................
(D) Withheld to avoid disclosing data for individual operations. 1 Data not available for all States for all years. 2 Amount applied excludes biologicals.
Note: Planted acres are in table 1-8.NASS, Environmental, Economics, and Demographics Branch, (202) 720–6146.

XIV–18 STATISTICS OF FERTILIZERS AND PESTICIDES
Table 14-21.—Wheat: Fertilizer usage, 2017 and 2019 1
State and Year
Percent treated and amount applied
Nitrogen Phosphate Potash Sulfur 2
Area applied
Pounds applied
Area applied
Pounds applied
Area applied
Pounds applied
Area applied
Pounds applied
Percent Millions Percent Millions Percent Millions Percent Millions Winter Wheat
Colorado: 2017 .......... 63 50.2 39 19.6 (D) (D) 22 2.4 2019 .......... 85 63.7 67 31.6 (D) (D) 14 1.0
Idaho: 2017 .......... 92 88.2 80 17.6 37 7.2 76 15.3 2019 .......... 99 71.4 19 7.4 (D) (D) 15 5.7
Illinois: 2017 .......... 92 52.5 86 35.0 70 40.1 14 2.3 2019 .......... 94 63.9 88 41.5 78 56.3 20 3.5
Kansas: 2017 .......... 85 466.0 62 137.5 (D) (D) 18 10.9 2019 .......... 99 528.9 81 152.9 6 8.7 25 17.0
Michigan: 2017 .......... 92 47.1 62 13.4 80 23.4 46 4.5 2019 .......... 96 57.6 81 23.8 78 28.9 53 4.7
Missouri: 2017 .......... 98 65.4 66 27.2 65 30.6 29 3.2 2019 .......... 84 49.9 75 26.2 75 33.0 29 2.9
Montana: 2017 .......... 95 133.4 94 57.1 42 11.6 43 6.7 2019 .......... 98 128.1 96 56.0 28 7.0 35 5.1
Nebraska: 2017 .......... 79 46.8 50 18.0 14 1.7 25 2.3 2019 .......... 88 65.0 68 23.1 12 2.5 42 4.0
North Dakota: 2017 .......... 87 5 70 2.0 (D) (D) (D) (D) 2019 .......... 94 6.4 78 2.2 60 1.2 (D) (D)
Ohio: 2017 .......... 97 45.6 81 21.7 82 28.2 39 3.6 2019 .......... 89 39.1 72 24.4 65 21.2 46 4.6
Oklahoma: 2017 .......... 92 294.5 53 63.6 12 11.6 (D) (D) 2019 .......... 93 277.0 63 75.3 13 9.6 8 1.2
Oregon: 2017 .......... 96 39.2 39 3.8 9 0.8 36 3.2 2019 .......... 100 55.9 21 6.6 (D) (D) 29 5.3
South Dakota: 2017 .......... 86 51.0 76 31.3 22 3.9 15 1.6 2019 .......... 60 38.4 30 8.4 (D) (D) (D) (D)
Texas: 2017 .......... 65 166.8 42 45.5 5 5.7 22 6.0 2019 .......... 57 164.9 34 35.9 6 10.9 26 13.2
Washington: 2017 .......... 97 138.3 59 13.1 10 1.4 66 13.5 2019 .......... 100 124.3 46 16.1 (D) (D) 75 15.2
Durum Arizona:
2017 .......... 98 21.4 (D) (D) (D) (D) (D) (D) 2019 .......... 88 6.1 (D) (D) (D) (D) (D) (D)
California: 2017 .......... ................. .................. ................. .................. (D) (D) (D) (D) 2019 .......... 94 3.8 ................. .................. (D) (D) (D) (D)
Idaho: 2017 .......... 96 3.1 (D) (D) (D) (D) 91 0.4
Montana: 2017 .......... 97 64.0 92 23.7 31 4.0 42 3.9 2019 .......... 97 35.0 84 11.7 14 0.9 22 0.9
North Dakota: 2017 .......... 100 108.2 95 38.3 29 3.8 33 3.4 2019 .......... 100 63.8 (D) (D) 10 0.8 28 1.6
Other Spring Idaho:
2017 .......... 94 51.5 55 11.7 21 3.4 61 8.2 2019 .......... 95 70.4 74 16.0 47 7.9 50 4.7
Minnesota: 2017 .......... 98 134.3 96 52.3 59 25.2 31 4.0 2019 .......... 100 170.8 91 55.9 66 23.8 40 4.2
Montana: 2017 .......... 92 145.2 90 68.9 31 8.6 43 9.4 2019 .......... 96 153.7 90 71.3 22 11.5 34 6.5
North Dakota: 2017 .......... 99 566.5 92 201.2 32 29.2 34 18.1 2019 .......... 96 747.5 89 262.9 25 43.2 24 16.5
South Dakota: 2017 .......... 92 87.1 81 33.6 32 7.4 46 5.7 2019 .......... 99 59.5 91 24.0 43 7.8 20 1.0
Note: Planted acres are in table 1-8. (D) Withheld to avoid disclosing data for individual operations. 1 Data not available for all States for all years. NASS, Environmental, Economics, and Demographics Branch, (202) 720–6146.

XIV–19 AGRICULTURAL STATISTICS 2020
Table 14-22.—Fruits, Pesticides: Percent of bearing acres receiving applications, for surveyed States, 2019 1
Crop Herbicide Insecticide Fungicide Other
Percent
Apples ................................. 36 88 85 86 Apricots ............................... 35 58 67 37 Avocados ............................ 58 44 4 47 Blueberries ......................... 63 91 91 47 Cherries, Sweet .................. 43 85 85 80 Cherries, Tart ..................... 46 94 97 80 Dates .................................. 9 (D) (D) (D) Grapefruit ............................ 70 90 86 88 Grapes, All .......................... 51 55 84 46 Grapes, Juice ..................... 81 (D) 38 31 Grapes, Raisin .................... 51 71 95 52 Grapes, Table ..................... 31 65 96 66 Grapes, Wine ..................... 54 51 80 41 Kiwifruit ............................... 53 24 36 53 Lemons ............................... 61 82 56 79 Nectarines .......................... 52 80 79 73 Olives .................................. 41 28 57 18 Oranges .............................. 69 92 81 87 Peaches .............................. 54 86 88 67 Pears .................................. 35 89 90 93 Plums .................................. 46 65 53 66 Prunes ................................ 53 56 70 39 Raspberries ........................ 51 91 86 48 Strawberries ....................... 19 92 93 53 Tangerines .......................... 54 77 55 67
(D) Withheld to avoid disclosing data for individual operations. 1 Refers to acres receiving one or more applications of a specific agricultural chemical.
NASS, Environmental, Economics, and Demographics Branch, (202) 720–6146.
Table 14-23.—Fruit, Fertilizers: Percent of acres receiving applications, for surveyed States, 2019 1
Crop Nitrogen Phosphate Potash Sulfur
Percent
Apples ................................. 62 38 56 34 Apricots ............................... 87 55 14 (D) Avocados ............................ 77 54 67 28 Blueberries ......................... 84 79 83 37 Cherries, Sweet .................. 81 66 68 25 Cherries, Tart ..................... 79 33 63 19 Dates .................................. 37 (D) (D) (D) Grapefruit ............................ 72 46 55 31 Grapes, All .......................... 73 27 62 (D) Grapes, Juice ..................... 48 33 46 14 Grapes, Raisin .................... 43 10 25 (D) Grapes, Table ..................... 42 30 50 38 Grapes, Wine ..................... 82 29 69 (D) Kiwifruit ............................... 66 44 60 38 Lemons ............................... 80 57 66 44 Nectarines .......................... 30 49 49 (D) Olives .................................. 71 22 57 (D) Oranges .............................. 39 64 74 38 Peaches .............................. 59 42 54 20 Pears .................................. 63 54 48 33 Plums .................................. 30 41 42 7 Prunes ................................ 54 21 37 14 Raspberries ........................ 79 67 68 39 Strawberries ....................... 95 49 58 (D) Tangerines .......................... 82 81 85 74
(D) Withheld to avoid disclosing data for individual operations. 1 Refers to acres receiving one or more applications of a specific agricultural chemical.
NASS, Environmental, Economics, and Demographics Branch, (202) 720–6146.

XIV–20 STATISTICS OF FERTILIZERS AND PESTICIDES
Table 14-24.—Vegetables, Pesticides: Percent of acres receiving applications, for surveyed States, 2018 1
Crop Herbicide Insecticide Fungicide Other
Percent
Asparagus .......................... 65 64 39 (D) Beans, Snap ....................... 79 59 56 1 Broccoli ............................... 43 77 55 2 Cabbage ............................. (D) (D) (D (D) Carrots ................................ 34 23 51 17 Cauliflower .......................... 53 77 11 (D) Celery ................................. 50 79 69 4 Cucumbers, Fresh .............. 39 67 83 2 Garlic .................................. 77 47 77 (D) Lettuce, Excl head .............. 33 63 54 (D) Lettuce, Head ..................... 44 73 68 (D) Melons, Cantaloupe ........... (D) 76 (D) 13 Melons, Honeydew ............. 35 98 93 (D) Melons, Watermelon .......... 52 73 77 9 Onions, Dry ........................ (D) (D) (D) (D) Peas, Green ....................... 88 28 (D) ...................................Peppers, Bell ...................... (D) (D) (D) (D) Pumpkins ............................ (D) (D) (D) (D) Spinach ............................... (D) 68 83 (D) Squash ............................... 37 79 68 5 Sweet Corn ......................... (D) (D) (D) (D) Tomatoes, in the open ....... (D) 81 82 (D)
(D) Withheld to avoid disclosing data for individual operations. 1 Refers to acres receiving one or more applications of a specific agricultural chemical.
NASS, Environmental, Economics, and Demographics Branch, (202) 720–6146.
Table 14-25.—Vegetables, Fertilizers: Percent of acres receiving applications, for surveyed States, 2018 1
Crop Nitrogen Phosphate Potash Sulfur
Percent
Asparagus .......................... 80 30 60 22 Beans, Snap ....................... 88 82 84 57 Broccoli ............................... 88 80 22 60 Cabbage ............................. (D) (D) (D) (D) Carrots ................................ 83 64 46 30 Cauliflower .......................... 97 80 54 18 Celery ................................. 100 70 68 74 Cucumbers ......................... 99 93 92 63 Garlic .................................. 92 46 3 (D) Lettuce, excluding Head ..... 98 89 (D) (D) Lettuce, Head ..................... 88 85 (D) (D) Melons, Cantatoupe ........... 99 89 (D) (D) Melons, Honeydew ............. 95 89 (D) (D) Melons, Watermelon .......... 86 82 62 6 Onions, dry ......................... (D) (D) (D) (D) Peas, Green ....................... 71 29 34 47 Peppers, Bell ...................... (D) (D) (D) (D) Pumpkins ............................ (D) (D) (D) (D) Spinach ............................... 94 94 (D) (D) Squash ............................... 89 82 85 24 Sweet Corn ......................... (D) (D) (D) (D) Tomatoes, in the open ....... 99 73 49 (D)
(D) Withheld to avoid disclosing data for individual operations. 1 Refers to acres receiving one or more applications of a specific agricultural chemical.
NASS, Environmental, Economics, and Demographics Branch, (202) 720–6146.

XV–1
CHAPTER XV
MISCELLANEOUS AGRICULTURAL STATISTICS
This chapter contains miscellaneous data which do not fit into the preceding chapters. Included here are summary tables on foreign trade in agricultural products; statistics on fishery products; tables on refrigerated warehouses; and statistics on crops in Alaska.
Foreign Agricultural Trade Statistics
Agricultural products, sometimes referred to as food and fiber products, cover a broad range of goods from unprocessed bulk commodities like soybeans, feed corn and wheat to highly-processed, high-value foods and beverages like sausages, bakery goods, ice cream, or beer sold in retail stores and restaurants. All of the products found in Chapters 1-24 (except for fishery products in Chapter 3) of the U.S. Harmonized Tariff Schedule are considered agricultural products. These products gen-erally fall into the following categories: grains, animal feeds, and grain products (like bread and pasta); oilseeds and oilseed products (like canola oil); livestock, poultry and dairy products including live animals, meats, eggs, and feathers; horticultural products including all fresh and processed fruits, vegetables, tree nuts, as well as nursery products and beer and wine; unmanufactured tobacco; and tropical products like sugar, cocoa, and coffee. Certain other products are considered ‘‘agricultural,’’ the most significant of which are essential oils (Chapter 33), protein isolates and modified starches (Chapter 35), raw rubber (Chapter 40), raw animal hides and skins (Chapter 41), and wool and cotton (Chapters 51-52). Manufactured products derived from plants or animals, but which are not consid-ered ‘‘agricultural’’ by USDA’s definition are cotton yarn, textiles and clothing; leather and leather articles of apparel; and cigarettes and spirits. The World Trade Organization’s definition of agricul-tural products varies in that it includes some products like spirits and tobacco products.
U.S. foreign agricultural trade statistics are based on documents filed by exporters and importers and compiled by the Bureau of the Census. Puerto Rico is a Customs district within the U.S. Cus-toms territory, and its trade with foreign countries is included in U.S. export and import statistics. U.S. export and import statistics include merchandise trade between the U.S. Virgin Islands and for-eign countries even though the Virgin Islands of the United States are not officially a part of the U.S. Customs territory.
The export value, the value at the port of exportation, is based on the selling price and includes inland freight, insurance, and other charges to the port. The country of destination is the country of ultimate destination or where the commodities are consumed or further processed.
Agricultural products, like manufactured goods, are often transhipped from the one country to an-other. Shippers are asked to identify the ultimate destination of a shipment. However, transhipment points are often recorded as the ultimate destination even though the actual point of consumption may be in a neighboring state. Thus, exports to countries which act as transhipment points are gen-erally overstated, while exports to neighboring countries are often understated. Major world transhipment points include the Netherlands, Hong Kong, and Singapore. In such cases, exports to the Netherlands are over reported, but under reported for Germany, Belgium and the United King-dom. Exports to Hong Kong are overstated, but under reported to China, and exports to Singapore are overstated, but understated to Malaysia and Indonesia.
Imports for consumption are a combination of entries for immediate consumption and withdrawals from bonded warehouses for consumption. The import value, defined generally as the market value in the foreign country, excludes import duties, ocean freight, and marine insurance. The country of origin is defined as the country where the commodities were grown or processed. Where the country of origin is not known, the imports are credited to the country of shipment.

XV–2 MISCELLANEOUS AGRICULTURAL STATISTICS
Table 15-1.—Foreign trade: Value of total agricultural exports and imports, United States, fiscal years 2010–2019
Fiscal year
Oct. 1- Sep. 30
U.S. total domestic exports U.S. total imports for consumption, customs value Surplus
agricultural exports over agricultural
imports
Total merchandise
exports
Agricultural exports 1
Agricultural exports
share of total exports
Total merchandise
imports
Agricultural imports
Agricultural imports share of
total imports
Million Million Million Million Million dollars dollars Percent dollars dollars Percent dollars
2010 ...... 1,077,045 108,529 10 1,832,595 78,963 4 29,566 2011 ...... 1,268,437 137,465 11 2,128,266 94,511 4 42,955 2012 ...... 1,343,129 135,907 10 2,248,129 103,371 5 32,536 2013 ...... 1,360,350 141,139 10 2,235,764 103,871 5 37,269 2014 ...... 1,398,923 152,326 11 2,304,072 109,258 5 43,068 2015 ...... 1,327,349 139,757 11 2,267,135 113,633 5 26,124 2016 ...... 1,222,350 129,597 11 2,160,641 114,439 5 15,158 2017 ...... 1,283,329 140,215 11 2,273,403 120,964 5 19,251 2018 ...... 1,402,288 143,414 10 2,506,195 128,678 5 14,736 2019 ...... 1,396,075 135,470 10 2,538,445 130,945 5 4,525
1 Includes food exported for relief or charity by individuals and private agencies. ERS, Market and Trade Economics Division, (202) 694–5257.
Table 15-2.—Foreign trade: Value and quantity of bulk commodity exports, United States, fiscal years 2010–2019 1
Fiscal year Wheat, unmilled Rice, milled Feed grains 2 Oilseeds 3 Tobacco
unmanufactured Cotton and
linters Bulk
commodities
Value
Million dollars
2010 ......... 5,840 2,296 9,806 17,951 1,223 4,836 41,951 2011 ......... 11,504 2,117 13,969 21,571 1,116 8,982 59,260 2012 ......... 8,376 1,963 11,719 21,101 1,051 6,551 50,761 2013 ......... 10,126 2,212 6,198 22,456 1,193 5,649 47,834 2014 ......... 8,260 2,002 12,480 25,758 1,114 4,614 54,228 2015 ......... 5,914 2,036 11,057 23,175 1,250 4,146 47,578 2016 ......... 5,136 1,834 10,768 21,923 1,042 3,451 44,154 2017 ......... 6,198 1,714 10,798 25,313 1,029 5,866 50,917 2018 ......... 5,086 1,636 12,238 23,175 1,093 6,624 49,852 2019 ......... 6,233 1,826 9,484 18,515 755 6,076 42,889
Quantity
1,000 metric tons
2010 ......... 25,698 4,260 53,849 42,499 185 2,746 129,236 2011 ......... 34,583 3,920 49,170 41,365 174 3,113 132,325 2012 ......... 26,969 3,578 40,024 39,247 167 2,731 112,716 2013 ......... 31,110 3,848 20,460 35,862 165 2,921 94,366 2014 ......... 27,091 3,355 56,630 46,050 152 2,202 135,480 2015 ......... 21,398 3,971 56,316 51,212 177 2,535 135,610 2016 ......... 22,538 3,789 59,075 55,146 156 2,202 142,904 2017 ......... 28,078 3,986 61,708 60,755 150 3,298 157,976 2018 ......... 21,155 3,052 68,475 57,924 155 3,661 154,422 2019 ......... 26,567 3,599 51,651 49,120 105 3,433 134,475
1 Fiscal years, Oct. 1–Sept. 30. 1 Corn, barley, sorghum, rye, and oats. 3 Soybeans, peanuts, rapeseed, cottonseed, sunflowerseed, safflowerseed, and others.
ERS, Market and Trade Economics Division, (202) 694–5257.

XV–3 AGRICULTURAL STATISTICS 2020
Table 15-3.—Agricultural exports: Value to top 50 countries of destination, United States, fiscal years 2017–2019 1
Country 2017 2018 2019
Million dollars
Canada ...................................................... 20,444.0 20,701.0 20,997.3 Mexico ........................................................ 18,605.9 18,869.4 18,996.7 EU27+UK ................................................... 11,552.5 12,707.6 12,615.2 Japan ......................................................... 11,856.7 12,655.0 12,146.7 China .......................................................... 21,838.8 16,262.9 10,115.9 South Korea ............................................... 6,851.2 7,958.9 7,819.6 Taiwan ....................................................... 3,399.7 3,812.2 3,611.4 Vietnam ...................................................... 2,559.2 3,895.2 3,596.3 Hong Kong ................................................. 4,043.3 4,198.3 3,512.5 Indonesia ................................................... 2,968.4 3,091.5 2,888.8 Philippines .................................................. 2,627.4 2,836.1 2,868.8 Colombia .................................................... 2,554.2 2,750.1 2,664.5 Thailand ..................................................... 1,781.7 2,143.6 1,884.6 India ........................................................... 1,504.3 1,579.3 1,782.3 Egypt .......................................................... 772.0 1,703.0 1,473.2 Australia ..................................................... 1,368.7 1,425.8 1,443.9 Saudi Arabia .............................................. 1,588.0 1,330.0 1,318.0 Guatemala ................................................. 1,081.8 1,202.5 1,307.2 Dominican Republic ................................... 1,231.6 1,272.2 1,295.4 Turkey ........................................................ 1,711.5 1,706.5 1,180.7 Malaysia ..................................................... 903.1 959.6 1,147.7 United Arab Emirates ................................ 1,071.5 1,033.2 1,115.7 Pakistan ..................................................... 834.0 1,433.4 1,082.1 Peru ........................................................... 1,187.8 1,325.4 1,021.3 Chile ........................................................... 912.3 942.7 1,013.1 Singapore ................................................... 824.0 792.1 955.4 Bangladesh ................................................ 892.4 858.6 935.8 Argentina .................................................... 174.2 350.5 765.4 Costa Rica ................................................. 691.4 723.3 733.2 Panama ...................................................... 661.7 668.1 716.9 Honduras ................................................... 597.7 679.0 694.6 Israel .......................................................... 527.7 665.9 622.1 Brazil .......................................................... 725.7 584.1 582.4 El Salvador ................................................ 487.1 503.5 567.7 Nigeria ........................................................ 500.5 326.5 551.0 New Zealand .............................................. 379.7 463.3 534.6 Ecuador ...................................................... 271.4 343.7 460.7 Switzerland ................................................ 454.1 386.2 406.5 Jamaica ...................................................... 376.8 393.6 397.7 Haiti ............................................................ 390.2 394.2 384.4 South Africa ............................................... 360.6 323.8 361.7 Trinidad and Tobago ................................. 331.4 341.7 346.2 Iraq ............................................................. 106.8 335.2 303.4 Morocco ..................................................... 485.2 587.6 275.0 Cuba .......................................................... 266.1 230.0 270.7 The Bahamas ............................................ 254.0 261.6 262.3 Nicaragua ................................................... 218.5 214.1 240.2 Kuwait ........................................................ 222.1 237.1 238.9 Netherlands Antilles ................................... 219.7 219.9 224.7 Jordan ........................................................ 282.8 208.0 219.7 Other Countries ......................................... 4,264.0 4,527.2 4,519.3
World Total 2 .............................................. 140,215.4 143,414.3 135,469.5
1 Fiscal years Oct. 1–Sept. 30. 2 Totals may not add due to rounding. ERS, Market and Trade Economics Divison, (202) 694–5257.

XV–4 MISCELLANEOUS AGRICULTURAL STATISTICS
Table 15-4.—Foreign trade in agricultural products: Value of exports by principal commodity groups, United States, fiscal years 2016–2019 1
Commodity 2016 2017 2018 2019
1,000 dollars 1,000 dollars 1,000 dollars 1,000 dollars
Total Merchandise Exports ............................ 1,427,982,211 1,427,401,788 1,410,626,357 1,419,857,072 Nonagricultural U.S. Exports (Na) ................. 1,298,385,211 1,287,186,788 1,267,212,357 1,284,387,072 Total Agricultural exports ............................... 129,597,000 140,215,000 143,414,000 135,470,000 Animals and animal products ........................ 24,915,038 28,269,536 29,939,818 29,561,343
Animals, live ........................................... 457,572 542,795 643,031 642,476 Cattle ............................................... 67,762 158,462 274,713 236,937 Horses,mules,burros-live ................. 372,184 361,631 342,864 388,276 Swine, live ....................................... 13,709 18,930 21,672 14,516 Sheep, live ...................................... 2,280 2,551 2,424 1,518 Other live Animals ........................... 1,637 1,221 1,358 1,230
Red meat and products .......................... 12,265,093 14,155,005 15,328,372 15,390,245 Beef and Veal ................................. 5,196,925 6,173,070 7,342,105 7,283,838
Beef and Veal, fresh/frozen ..... 4,966,796 5,960,005 7,128,147 7,082,067 Beef prep/pres ......................... 230,129 213,065 213,958 201,771
Horsemeat, fresh/frozen .................. 204 806 52 25 Lamb and Goat, fr/frozen ................ 11,525 14,851 14,401 14,398 Pork ................................................. 4,737,457 5,227,433 5,440,608 5,516,852
Pork, fresh/frozen ..................... 3,992,969 4,477,735 4,681,686 4,774,617 Pork, prep/pres ........................ 744,488 749,698 758,922 742,235
Variety meats .................................. 1,660,265 1,884,164 1,731,062 1,674,419 Beef variety meats ................... 897,749 896,036 878,777 956,960 Pork variety meats ................... 689,246 905,847 757,189 604,853 Other variety meats ................. 73,270 82,281 95,096 112,605 Other meats, fresh/frozen ........ 658,718 854,681 800,144 900,714
Poultry and products .............................. 4,551,342 4,908,080 5,253,058 5,136,394 Poultry, live ...................................... 165,604 196,218 216,294 281,246
Baby chicks .............................. 148,859 179,075 199,965 264,571 Other live poultry ...................... 16,745 17,143 16,329 16,675
Poultry meats .................................. 3,595,801 3,845,509 4,097,399 3,988,541 Chickens, fresh/frozen ............. 2,587,149 2,788,146 3,006,205 2,962,248 Turkeys, fresh/frozen ............... 437,249 429,313 411,995 477,315 Other poultry, fresh/frozen ....... 4,944 6,246 4,160 4,597 Poultry meats, prep .................. 566,458 621,804 675,039 544,381
Poultry, misc .................................... 235,963 313,388 342,756 283,923 Eggs ................................................ 553,973 552,965 596,610 582,684
Dairy products ........................................ 4,622,845 5,403,069 5,653,344 5,743,420 Evaporated/condensed milk ............ 35,198 34,029 36,169 31,741 Nonfat dry milk ................................ 1,184,268 1,372,886 1,450,475 1,562,918 Butter and milkfat ............................ 48,924 103,698 144,731 97,360 Cheese ............................................ 1,173,091 1,415,408 1,475,577 1,488,204 Whey,fluid/dried ............................... 548,497 695,162 669,284 632,879 Other dairy products ....................... 1,632,866 1,781,886 1,877,108 1,930,318
Fats, oils, and greases ........................... 489,611 606,058 585,151 633,131 Lard ................................................. 55,835 97,809 89,440 55,430 Tallow, inedible ............................... 206,771 256,221 216,773 206,860 Other animal fats ............................. 227,005 252,028 278,938 370,841
Hides and skins ...................................... 1,887,730 1,931,099 1,580,560 1,108,071 Bovine hides, whole ........................ 1,018,548 1,128,521 884,918 635,347 Other cattle hides ............................ 12,945 18,177 17,377 13,138 Calf skins, whole ............................. 47,385 102,640 127,187 65,453 Horse hides, whole ......................... 80,186 23,742 12,703 3,312 Sheep and lamb skins .................... 14,100 15,106 12,977 5,944 Other hides and Skin ...................... 421,596 428,034 373,222 267,023 Furskins ........................................... 292,969 214,880 152,175 117,855
Mink pelts ................................. 272,258 199,224 136,433 99,989 Other furskins ........................... 20,712 15,656 15,741 17,866
Wool and mohair .................................... 18,459 23,191 27,089 18,262 Sausage casings .................................... 245,525 277,883 397,712 413,083 Bull semen .............................................. 160,576 162,648 187,376 204,169 Miscellaneous animal products .............. 216,285 259,708 284,125 272,092
Grains and feeds ........................................... 29,800,241 30,507,690 31,455,366 30,189,075 Wheat,unmilled ....................................... 5,136,021 6,197,654 5,086,206 6,233,349 Wheat flour ............................................. 171,611 161,392 126,867 152,450 Other wheat products ............................. 153,565 135,736 147,170 154,064 Rice-paddy, milled ................................. 1,834,482 1,714,013 1,636,179 1,826,348 Feed grains and products ...................... 11,224,817 11,284,328 12,730,294 9,980,880
Feed grain ....................................... 10,767,971 10,798,005 12,238,048 9,483,652 Barley ....................................... 40,168 31,233 28,462 29,944 Corn ......................................... 9,124,474 9,683,360 11,267,677 8,995,926 Grain sorghum ......................... 1,590,054 1,071,130 931,433 447,888 Oats .......................................... 7,248 8,817 6,703 5,453 Rye ........................................... 6,027 3,465 3,772 4,441
Feed grain products ........................ 456,846 486,322 492,246 497,229
See footnote(s) at end of table.

XV–5 AGRICULTURAL STATISTICS 2020
Table 15-4.—Foreign trade in agricultural products: Value of exports by principal commodity groups, United States, fiscal years 2016–2019 1—Continued
Commodity 2016 2017 2018 2019
1,000 dollars 1,000 dollars 1,000 dollars 1,000 dollars Grains and feeds--Continued
Popcorn .................................................................. 95,115 120,465 114,481 108,538 Blended food products ........................................... 50,173 53,526 48,644 58,921 Other grain products ............................................... 3,670,714 3,636,125 3,694,067 3,848,457 Feeds and fodders ................................................. 7,463,743 7,204,451 7,871,458 7,826,068
Corn by-products ............................................. 624,823 625,418 689,629 613,705 Alfalfa meal and cubes .................................... 73,599 65,790 51,828 41,649 Beef pulp ......................................................... 97,747 94,493 108,913 95,146 Citrus pulp pellets ............................................ 1,056 26 171 649 Other feeds and fodders ................................. 6,666,518 6,418,724 7,020,916 7,074,919
Fruit and prep ................................................................ 6,138,011 6,307,658 6,394,412 5,945,527 Fruits, fresh ............................................................. 4,491,929 4,676,914 4,721,795 4,333,844
Citrus fruits ...................................................... 983,861 1,016,248 971,950 851,023 Grapefruit ................................................. 106,136 94,411 61,519 69,161 Lemons and limes .................................... 180,093 187,091 179,081 166,040 Oranges and tangerines .......................... 679,606 723,164 711,014 593,263 Other citrus ............................................... 18,026 11,582 20,335 22,559
Noncitrus Fruits ............................................... 3,508,068 3,660,666 3,749,846 3,482,821 Apples ...................................................... 894,191 958,313 1,079,704 866,106 Berries ...................................................... 677,923 673,549 707,141 699,652 Cherries .................................................... 476,419 643,770 518,453 493,936 Grapes ...................................................... 765,229 748,231 769,626 784,394 Melons, ..................................................... 153,556 159,605 160,001 136,461 Peaches ................................................... 140,184 118,491 125,311 129,860 Pears ........................................................ 176,004 144,820 153,922 168,276 Plums ....................................................... 59,080 59,358 60,312 53,853 Other noncitrus ......................................... 165,481 154,528 175,376 150,283
Fruits, dried ............................................................. 577,168 544,301 529,393 467,384 Raisin ............................................................... 321,685 304,912 296,012 264,451 Prunes ............................................................. 165,000 142,980 145,288 128,715 Other dried fruits ............................................. 90,483 96,409 88,093 74,218
Fruits, canned ......................................................... 605,718 641,843 683,241 661,165 Fruits, frozen ........................................................... 135,414 122,974 128,448 134,263 Other fruits, prep .................................................... 327,782 321,626 331,535 348,871
Fruits, juices ................................................................... 1,096,074 984,370 910,098 821,094 Apple juice .............................................................. 46,510 49,840 57,847 51,852 Grape juice ............................................................. 68,295 69,481 77,132 65,653 Grapefruit juice ....................................................... 36,797 36,307 39,811 30,073 Orange juice ........................................................... 382,748 339,569 252,361 221,844 Other fruit juices ..................................................... 561,724 489,173 482,947 451,672
Wine ............................................................................... 1,528,841 1,416,818 1,459,096 1,326,576 Nuts and prep ................................................................ 8,235,776 8,760,134 9,431,264 9,635,246
Almonds .................................................................. 4,647,338 4,199,529 4,584,942 4,749,005 Filberts .................................................................... 74,184 94,898 85,562 90,393 Peanuts ................................................................... 595,969 549,844 578,167 540,757 Pistachios ............................................................... 775,538 1,514,356 1,532,628 2,181,500 Walnuts ................................................................... 1,250,986 1,371,122 1,516,684 1,152,906 Pecans .................................................................... 465,097 617,955 688,822 472,933 Other nuts ............................................................... 426,664 412,430 444,459 447,752
Vegetables and prep ..................................................... 7,148,372 7,328,379 7,014,224 7,160,559 Vegetables fresh ..................................................... 2,480,008 2,505,050 2,549,031 2,705,787
Aspargus ......................................................... 48,250 62,297 81,688 78,540 Broccoli ............................................................ 117,248 103,280 102,709 98,018 Carrots ............................................................. 111,240 110,804 111,203 109,581 Cabbage .......................................................... 48,456 59,473 76,006 84,407 Celery .............................................................. 96,764 87,452 79,716 119,225 Cauliflower ....................................................... 135,060 147,424 158,826 161,420 Corn sweet ...................................................... 46,765 49,819 49,762 44,149 Cucumbers ...................................................... 14,493 15,871 13,409 16,688 Garlic ............................................................... 14,949 17,064 14,526 14,018 Lettuce ............................................................. 488,803 499,952 480,983 518,966 Mushrooms ...................................................... 26,848 25,313 34,588 39,156 Onions and shallots ......................................... 196,622 170,173 185,070 243,554 Peppers ........................................................... 79,938 77,494 76,595 84,519 Potatoes .......................................................... 202,462 232,420 233,197 252,740 Tomatoes ......................................................... 122,977 113,004 110,721 114,172 Other fresh vegetables .................................... 729,133 733,211 740,030 726,633
See footnote(s) at end of table.

XV–6 MISCELLANEOUS AGRICULTURAL STATISTICS
Table 15-4.—Foreign trade in agricultural products: Value of exports by principal commodity groups, United States, fiscal years 2016–2019 1—Continued
Commodity 2016 2017 2018 2019
1,000 dollars 1,000 dollars 1,000 dollars 1,000 dollars
Vegetables and prep--Continued Vegetables, frozen .................................. 1,482,153 1,534,695 1,515,472 1,549,597
Corn, sweet ..................................... 107,487 113,027 107,473 104,392 Potatoes .......................................... 1,137,484 1,165,600 1,166,940 1,218,771 Other frozen vegetables .................. 237,182 256,068 241,059 226,433
Vegetables, canned ................................ 633,919 587,393 546,558 533,012 Pulses ..................................................... 776,779 869,549 620,087 615,291
Dried Beans ..................................... 298,078 312,475 307,206 288,712 Dried Peas ....................................... 255,952 189,915 118,899 110,925 Dried Lentils .................................... 173,308 256,208 93,798 120,351 Dried chickpeas ............................... 49,441 110,952 100,184 95,304
Other vegetables, prep/pres ................... 1,775,513 1,831,692 1,783,076 1,756,872 Oilseeds and products ................................... 29,192,243 32,460,021 31,197,490 25,608,461
Oilcake and meal .................................... 4,225,951 3,933,033 4,998,037 4,457,068 Bran and residues ........................... 12,558 13,443 23,488 26,733 Corn oilcake and meal .................... 3,033 928 666 726 Soybean meal ................................. 4,155,007 3,873,278 4,933,693 4,392,407 Other oilcake and meal ................... 55,354 45,385 40,189 37,203
Oilseeds .................................................. 21,922,530 25,312,750 23,174,724 18,514,702 Rapeseed ........................................ 106,103 98,775 99,409 120,687 Safflower seeds ............................... 981 826 658 1,045 Soybeans ......................................... 20,426,101 23,808,967 21,688,843 16,996,612 Sunflowerseeds ............................... 101,451 78,666 72,975 62,724 Peanuts, oilstock ............................. 213,436 128,468 119,082 109,766 Other oilseeds ................................. 82,948 141,310 126,429 100,589 Protein substances .......................... 991,510 1,055,738 1,067,327 1,123,280
Vegetable oils ......................................... 3,043,762 3,214,238 3,024,729 2,636,691 Soybean oil ...................................... 842,844 953,402 896,256 676,486 Cottonseed oil ................................. 21,495 32,402 40,470 31,614 Sunflower oil .................................... 51,519 42,165 47,232 67,164 Corn oil ............................................ 430,201 469,927 289,143 212,613 Peanut oil ........................................ 11,611 11,974 11,547 8,828 Rapeseed oil ................................... 94,427 110,214 96,362 83,778 Safflower oil ..................................... 26,555 17,632 16,569 14,418 Other vegetable oils/waxes ............. 1,565,109 1,576,521 1,627,149 1,541,789
Tobacco, unmfg ............................................. 1,042,410 1,028,510 1,093,423 754,574 Tobacco, light air .................................... 160,616 144,913 126,818 127,995 Tobacco, flue .......................................... 671,652 651,849 753,509 424,761 Other tobacco, unmfg ............................. 210,142 231,748 213,096 201,818
Cotton, excluding linters ................................ 3,443,196 5,849,567 6,609,963 6,069,606 Cotton linters .................................................. 7,475 16,604 13,916 6,577 Essential oils .................................................. 1,834,209 1,969,901 2,109,209 2,155,531 Seeds, field and garden ................................ 1,572,761 1,698,435 1,809,101 1,855,830 Sugar and tropical products .......................... 5,034,548 4,927,713 5,050,073 4,883,652
Sugar and related products .................... 1,734,404 1,680,134 1,790,203 1,651,656 Sugar, cane or beet ........................ 73,142 65,737 110,215 45,109 Related sugar products ................... 1,661,263 1,614,397 1,679,988 1,606,547
Coffee ..................................................... 937,513 865,479 875,950 875,092 Cocoa ..................................................... 235,822 208,762 188,476 182,628 Chocolate and prep ................................ 1,511,799 1,558,390 1,565,361 1,582,761 Tea, including herbal .............................. 381,918 363,421 371,115 362,107 Spices ..................................................... 184,499 189,334 198,006 193,393 Rubber, crude ......................................... 45,130 56,934 54,740 31,379 Fibers, excluding cotton ......................... 3,463 5,259 6,222 4,636
Other hort products ........................................ 6,276,107 6,389,997 6,606,411 7,263,532 Hops, including extract ........................... 243,674 275,051 339,993 378,929 Starches, not wheat/corn ........................ 135,604 132,609 138,844 144,033 Yeasts ..................................................... 92,762 103,112 104,468 100,937 Misc hort products .................................. 5,804,067 5,879,225 6,023,106 6,639,633
Nursery & greenhouse ................................... 401,839 417,315 439,295 438,862 Beverages, excluding juice ............................ 1,930,038 1,882,792 1,881,144 1,793,461
1 Fiscal years, Oct. 1–Sept. 30. Totals may not add due to rounding. ERS, Market and Trade Economics Division, (202) 694–5257. Compiled from reports of the U.S. Department of Commerce.

XV–7 AGRICULTURAL STATISTICS 2020
Table 15-5.—Foreign trade in agricultural products: Value of imports by principal groups, United States, fiscal years 2016–2019 1
Product 2016 2017 2018 2019
1,000 dollars 1,000 dollars 1,000 dollars 1,000 dollars
Total merchandise imports 2,177,103,456 2,288,033,279 2,499,691,523 2,532,820,540 Non-agricultural U.S. imports 2,062,664,456 2,167,069,279 2,371,013,523 2,401,875,540 Total agricultural imports 114,439,000 120,964,000 128,678,000 130,945,000
Animals & prods. .................................................... 16,594,053 15,778,997 16,539,892 17,105,618 Animals - live, excluding poultry ..................... 2,634,280 2,495,026 2,563,143 2,714,394
Cattle and calves ..................................... 1,688,912 1,487,359 1,564,249 1,749,673 Horses, mules, burros .............................. 548,516 629,370 627,365 594,314 Swine ........................................................ 334,417 323,244 313,365 310,585 Sheep, Live .............................................. 1,224 498 281 491 Other live animals .................................... 61,212 54,555 57,883 59,331
Red meat & products ...................................... 8,239,788 8,164,540 8,697,188 8,920,077 Beef & veal ............................................... 5,371,892 5,114,995 5,584,110 5,790,777
Beef & veal - fresh or frozen ............ 4,997,263 4,741,504 5,147,596 5,309,413 Beef & veal - prep. or pres. .............. 374,629 373,490 436,513 481,363
Pork .......................................................... 1,658,024 1,705,340 1,644,300 1,499,146 Pork - fr. or froz. ............................... 1,335,915 1,375,854 1,287,052 1,101,118 Pork - prep. or pres. ......................... 322,109 329,486 357,248 398,028
Mutton, goat & lamb ................................. 775,142 924,135 989,037 1,089,420 Horsemeat - fr. or froz. ............................ 1,875 1,872 2,161 2,200 Variety meats - fr. or froz. ........................ 300,613 260,150 292,845 354,887 Other meats - fr. or froz. .......................... 45,336 54,502 64,743 65,661 Other meats & prods. ............................... 86,906 103,547 119,992 117,986
Poultry and prods. ........................................... 863,321 742,801 777,094 809,823 Poultry - live ............................................. 50,020 49,383 43,571 42,971 Poultry meat ............................................. 527,524 470,456 511,912 513,302 Eggs ......................................................... 169,880 83,937 65,077 79,926 Poultry, misc. ............................................ 115,897 139,026 156,535 173,625
Dairy products ................................................. 3,395,862 2,939,582 2,958,006 3,117,193 Milk & cream, fresh or dried .................... 105,049 105,885 125,388 124,081 Butter & butterfat mixtures ....................... 185,582 185,665 282,931 380,630 Cheese ..................................................... 1,274,575 1,167,399 1,279,347 1,345,586 Casein & mixtures .................................... 529,484 513,472 437,491 424,203 Other dairy prods. .................................... 1,301,171 967,160 832,848 842,693
Fats, oils, & greases ....................................... 183,266 221,047 216,482 293,755 Hides & skins .................................................. 177,594 101,926 58,432 44,154
Sheep & lamb skins ................................. 357 443 554 375 Other hides & skins .................................. 41,474 31,714 26,750 15,194 Furskins .................................................... 135,763 69,768 31,128 28,584
Wool - unmfg. .................................................. 17,726 15,283 14,872 17,223 Apparel grade wool .................................. 8,904 6,970 8,604 10,360 Carpet grade wool .................................... 8,822 8,312 6,268 6,863
Sausage casings ............................................. 182,695 193,893 205,042 91,416 Bull semen ....................................................... 43,400 42,404 37,287 35,446 Misc. animal prods .......................................... 855,872 862,324 1,012,166 1,061,983 Silk, raw ........................................................... 249 171 180 154
Grains & feeds ........................................................ 11,075,221 11,714,644 13,360,868 13,976,050 Wheat, ex. seed .............................................. 511,095 590,408 830,545 483,128 Corn, unmilled ................................................. 371,116 298,698 191,980 175,477 Oats, unmilled ................................................. 318,305 314,107 318,819 312,927 Barley, unmilled ............................................... 100,797 53,789 39,266 31,713 Rice ................................................................. 666,836 638,352 857,185 970,571 Biscuits & wafers ............................................. 3,823,489 4,260,520 4,752,985 5,258,279 Pasta & noodles .............................................. 593,509 565,327 579,635 596,133 Other grains & preps. ...................................... 3,002,326 3,262,538 3,719,637 4,038,802 Feeds & fodders, excluding oilcake ................ 1,687,748 1,730,905 2,070,816 2,109,020
Fruits & preps. ........................................................ 14,870,410 16,218,914 17,049,053 17,929,435 Fruits - fr. or froz. ............................................ 12,058,808 13,356,022 13,837,119 14,774,616
Apples, fresh ............................................ 264,706 237,266 201,279 211,171 Avocados .................................................. 1,717,897 2,605,107 2,431,484 2,693,030 Berries, excl. strawberries ........................ 1,986,251 2,065,450 2,367,284 2,841,018 Bananas & plantains - fresh or frozen ..... 2,271,361 2,296,646 2,415,952 2,425,164 Citrus, fresh .............................................. 955,802 1,060,013 1,276,777 1,253,876 Grapes, fresh ........................................... 1,449,269 1,618,416 1,574,652 1,615,883 Kiwifruit, fresh ........................................... 127,963 121,492 137,271 129,835 Mangoes ................................................... 545,951 544,045 531,911 562,518 Melons ...................................................... 691,252 664,403 686,521 679,591 Peaches ................................................... 76,867 69,564 72,513 67,765 Pears ........................................................ 111,125 116,337 131,800 117,204 Pineapples - fr. or froz. ............................ 663,304 682,451 678,408 653,966 Plums ....................................................... 53,915 43,707 46,530 43,066 Strawberries - fr. or froz. .......................... 725,167 800,018 800,798 1,002,682 Other fruits - fr. or froz. ............................ 417,980 431,107 483,942 477,847
Fruits - prep. or pres. ...................................... 2,811,602 2,862,892 3,211,934 3,154,819 Bananas & plantains - prep. or pres. ....... 143,414 147,902 169,265 168,765 Pineapples - canned or prep. .................. 389,838 355,656 285,608 275,220 Other fruits - prep. or pres. ...................... 2,278,350 2,359,334 2,757,061 2,710,834
See footnote(s) at end of table.

XV–8 MISCELLANEOUS AGRICULTURAL STATISTICS
Table 15-5.—Foreign trade in agricultural products: Value of imports by principal groups, United States, fiscal years 2016–2019 1—Continued
Product 2016 2017 2018 2019
1,000 dollars 1,000 dollars 1,000 dollars 1,000 dollars
Fruit juices .............................................................. 1,760,525 1,937,797 2,169,101 2,192,542 Apple juice ....................................................... 476,474 438,970 466,608 468,591 Grape juice ...................................................... 73,353 64,472 74,796 82,643 Grapefruit juice ................................................ 1,293 4,777 14,985 27,627 Lemon juice ..................................................... 114,142 122,661 123,017 113,109 Lime juice ........................................................ 30,173 33,404 31,678 29,038 Orange juice .................................................... 556,712 774,656 932,206 786,953 Pineapple juice ................................................ 118,602 110,346 65,011 59,891 Other fruit juice ................................................ 389,776 388,511 460,800 624,690
Nuts & preps ........................................................... 2,724,812 3,328,514 3,495,030 3,279,495 Brazil nuts ........................................................ 72,546 72,164 52,713 42,559 Cashew nuts .................................................... 1,234,762 1,688,328 1,682,998 1,344,366 Chestnuts ........................................................ 15,386 13,069 12,855 10,790 Coconut meat .................................................. 220,925 237,845 260,888 222,111 Filberts ............................................................. 34,799 41,382 46,484 48,756 Macadamia nuts .............................................. 140,624 146,812 183,488 258,117 Pecans ............................................................. 484,073 634,622 673,506 750,953 Pistachio nuts .................................................. 10,803 12,490 15,385 15,167 Other nuts ........................................................ 510,894 481,802 566,713 586,676
Vegetables & preps. ............................................... 13,159,109 13,276,028 14,310,805 14,970,887 Vegetables, fresh ............................................ 8,009,144 7,697,210 8,362,234 8,909,062
Tomatoes ................................................. 2,221,247 2,074,235 2,389,574 2,290,915 Asparagus ................................................ 609,777 696,162 623,357 698,110 Beans ....................................................... 121,866 116,219 142,839 144,701 Cabbage ................................................... 47,584 40,715 48,171 75,285 Carrots ...................................................... 94,992 85,766 119,131 111,440 Cauliflower & broccoli, fresh .................... 267,797 294,325 286,323 342,627 Celery, ...................................................... 26,576 35,409 30,149 65,944 Cucumbers ............................................... 704,241 657,350 740,890 815,986 Eggplant ................................................... 68,154 60,366 64,131 67,282 Endive ...................................................... 3,978 3,843 4,073 4,976 Garlic ........................................................ 205,356 223,076 166,354 155,577 Lettuce ...................................................... 276,595 280,764 275,231 350,093 Okra .......................................................... 25,721 29,511 40,617 43,934 Onions ...................................................... 469,759 412,694 440,544 438,233 Peas ......................................................... 74,879 73,099 87,917 76,331 Peppers .................................................... 1,451,384 1,305,923 1,460,992 1,673,748 Potatoes ................................................... 186,601 214,670 229,433 198,462 Radishes .................................................. 21,181 23,436 34,521 28,060 Squash ..................................................... 383,247 324,765 365,447 373,030 Other fresh vegetables ............................. 748,209 744,880 812,540 954,329
Vegetables - prep. or pres. ............................. 3,030,523 3,312,934 3,435,521 3,507,678 Bamboo shoots, preserved ...................... 26,263 27,520 24,890 24,697 Cucumbers, preserved ............................. 57,176 58,068 63,991 61,757 Garlic, dried .............................................. 73,450 113,801 61,118 30,674 Olives - prep. or pres. .............................. 415,202 424,214 451,788 485,664 Mushrooms, canned ................................. 109,120 106,592 106,288 107,763 Mushrooms, dried .................................... 28,285 28,487 31,930 25,903 Onions, preserved .................................... 48,921 52,457 54,781 61,320 Artichokes - prep. ..................................... 138,255 159,755 144,717 136,927 Asparagus- prep. ...................................... 20,962 19,137 16,265 13,117 Tomatoes, incl. paste & sauce ................ 204,822 211,682 231,258 245,933 Waterchestnuts ........................................ 21,440 28,136 31,620 22,871 Peppers & pimentos, prep. ...................... 110,100 98,398 112,113 85,103 Veg Starches, excluding wheat & corn .... 171,854 174,291 216,435 229,452 Soups & sauces ....................................... 464,535 493,133 529,448 589,076 Other vegetables - prep. or pres. ............ 1,140,140 1,317,264 1,358,878 1,387,420
Vegetables, frozen .......................................... 1,867,923 1,999,431 2,230,941 2,306,262 Tomatoes ................................................. 7,109 6,680 7,919 10,363 Asparagus ................................................ 16,021 14,847 16,967 14,879 Beans ....................................................... 69,359 75,322 75,364 70,817 Carrots ...................................................... 7,796 10,193 9,567 8,338 Cauliflower & broccoli .............................. 356,639 356,391 399,808 422,818 Okra .......................................................... 16,494 12,757 15,975 12,852 Peas ......................................................... 40,940 39,411 44,503 54,080 Potatoes ................................................... 772,005 844,154 937,181 953,136 Other frozen vegetables ........................... 581,562 639,677 723,656 758,981
Pulses .............................................................. 251,519 266,453 282,109 247,885 Dried peas ................................................ 44,483 44,534 63,257 46,822 Dried beans .............................................. 143,998 145,849 129,266 128,430 Dried lentils .............................................. 28,149 33,538 36,037 35,019 Dried chickpeas ........................................ 34,889 42,531 53,550 37,614
Sugar & related prods. ........................................... 4,469,243 4,612,790 4,743,534 4,529,220 Sugar - cane & beet ........................................ 1,652,713 1,692,323 1,703,807 1,469,245 Molasses ......................................................... 161,512 118,625 140,918 146,024 Confectionery prods. ....................................... 1,727,605 1,764,973 1,891,008 1,918,303 Other sugar & related prods. .......................... 927,413 1,036,869 1,007,801 995,648
See footnote(s) at end of table.

XV–9 AGRICULTURAL STATISTICS 2020
Table 15-5.—Foreign trade in agricultural products: Value of imports by principal groups, United States, fiscal years 2016–2019 1—Continued
Product 2016 2017 2018 2019
1,000 dollars 1,000 dollars 1,000 dollars 1,000 dollars
Cocoa & products ................................................... 4,939,220 5,243,686 4,630,500 4,934,897 Coffee & products ................................................... 5,934,064 6,617,179 6,086,250 6,163,421 Tea .......................................................................... 750,078 718,611 703,749 727,971 Spices & herbs ....................................................... 1,859,806 1,979,025 2,044,202 1,981,417
Pepper ............................................................. 991,728 788,970 639,041 607,083 Other spices & herbs ...................................... 868,078 1,190,055 1,405,161 1,374,334
Drugs, crude & natural ........................................... 1,792,016 1,826,458 1,993,616 1,968,408 Essential oils ........................................................... 2,627,381 3,056,600 3,176,003 2,997,727 Fibers, excl. cotton ................................................. 127,817 126,249 122,501 136,156 Rubber & gums ...................................................... 1,306,736 1,700,050 1,583,821 1,513,865 Tobacco - unmfg. ................................................... 793,605 673,127 661,243 672,243
Tobacco - filler ................................................. 763,423 650,975 643,234 640,239 Tobacco - scrap .............................................. 10,770 8,104 7,543 10,701 Other tobacco .................................................. 19,412 14,048 10,466 21,303
Beverages, ex. fruit juice ........................................ 13,958,618 5 14,386,991 15,816,195 16,371,913 Wine ................................................................ 5,526,951 5,965,998 6,312,581 6,430,661 Malt beverages ................................................ 4,831,814 4,988,000 5,368,737 5,548,108 Other beverages .............................................. 3,599,853 3,432,993 4,134,877 4,393,144
Oilseeds & products ............................................... 826,295 823,299 860,675 738,299 Oilseeds & oilnuts ........................................... 826,295 823,298 860,675 738,300
Flaxseed ................................................... 68,941 64,319 80,859 86,685 Rapeseed ................................................. 186,040 239,698 262,597 201,357 Soybeans ................................................. 361,252 331,919 325,567 224,338 Sunflower seeds ....................................... 45,170 47,145 58,645 71,056 Other oilseeds & oilnuts ........................... 164,892 140,217 133,007 154,864
Oils & waxes - vegetable ................................ 6,154,477 7,072,533 7,213,267 6,411,556 Castor oil ......................................................... 69,675 80,424 94,989 93,986 Coconut oil ...................................................... 774,366 880,867 753,511 588,115 Cottonseed oil ................................................. 2,508 30 40 35 Olive oil ............................................................ 1,323,409 1,387,740 1,491,105 1,362,684 Palm oil ............................................................ 828,848 1,024,315 1,103,296 930,837 Palm kernel oil ................................................. 351,795 477,117 447,027 284,145 Peanut oil ........................................................ 29,633 37,847 33,114 21,397 Rapeseed oil ................................................... 1,516,558 1,795,063 1,690,628 1,574,250 Soybean oil ...................................................... 99,425 118,829 120,632 136,497 Sesame oil ....................................................... 76,695 83,187 91,067 95,435 Other vegetable oils ........................................ 1,081,566 1,187,113 1,387,858 1,324,176 Oilcake & meal ................................................ 1,252,360 1,153,467 1,314,220 1,397,552
Cotton, excl. linters ................................................. 11,226 3,422 2,803 1,158 Cotton, linters ......................................................... 1,868 4 1,105 269 Seeds - field & garden ........................................... 1,003,105 1,020,561 1,074,994 979,217 Cut flowers .............................................................. 1,103,005 1,170,801 1,228,519 1,306,724 Nursery stock, bulbs, etc. ....................................... 719,339 761,010 821,155 897,890 Other hort products ................................................ 3,202,738 3,878,187 6,507,369 7,660,967
Hops, including extract .................................... 58,478 60,811 71,692 72,973 Starches, ex wheat/corn .................................. 127,563 133,901 141,229 140,937 Yeasts .............................................................. 300,568 307,041 339,760 346,186 Misc horticultural products .............................. 2,716,129 3,376,434 5,954,688 7,100,871
1 Fiscal years, Oct. 1–Sept. 30. ERS, Market and Trade Economics Division, (202) 694–5257. Compiled from reports of the U.S. Department of Com-
merce.

XV–10 MISCELLANEOUS AGRICULTURAL STATISTICS
Table 15-6.—Agricultural exports: Value of U.S. exports to the top market, Canada, by commodity, fiscal years 2017–2019 1
Commodity Value
2017 2018 2019
1,000 dollars 1,000 dollars 1,000 dollars
Total agricultural exports ....................................... 20,444,018 20,701,022 20,997,341 Animals and animal products ................................ 3,521,050 3,556,417 3,396,708
Animals Live, ex. Poultry ................................ 118,319 219,700 222,476 Cattle, live ................................................ 75,336 171,803 175,721 Horses, live .............................................. 40,717 46,012 43,886 Swine, live ............................................... 1,676 1,262 2,443 Sheep, live ............................................... 29 34 13
Other live animals ........................................... 562 589 414 Red meat and products ........................... 1,853,003 1,798,750 1,705,840
Beef and veal ................................... 772,534 748,139 649,459 Beef and Veal, fresh or frozen ......... 604,536 574,381 497,476 Beef, prep or pres ............................ 167,998 173,759 151,983
Lamb, goat, fresh or frozen ..................... 2,009 924 823 Pork .................................................. 774,217 741,233 762,367 Pork-fresh or frozen ......................... 385,612 343,782 369,272
Pork-prep or pres .................................... 388,604 397,451 393,094 Variety meats, Ed Offals .................. 36,415 37,284 35,908 Beef variety meats ........................... 15,788 19,477 14,380 Pork variety meats ........................... 18,149 16,034 18,980
Other variety meats ................................. 2,478 1,773 2,548 Other meats-fr or froz ..................................... 267,829 271,169 257,284
Poultry and poultry products ................... 619,161 612,590 538,925 Poultry-Live ....................................... 58,019 63,556 63,471 Baby chicks ...................................... 48,178 55,716 55,278
Other live poultry ..................................... 9,841 7,839 8,193 Poultry meats ................................... 469,024 427,453 366,489 Chickens, fresh or frozen ................. 301,494 278,670 238,547 Turkeys, fresh or frozen ................... 13,936 7,942 7,884 Other poultry, fresh or frozen ........... 2,141 1,159 747
Poultry meats, prep or pres. .................... 151,453 139,681 119,310 Poultry misc. ............................................ 580 1,791 4,862
Eggs ................................................................ 91,538 119,790 104,103 Dairy prods .............................................. 735,613 690,724 721,965 Evap and condensed milk ....................... 973 952 1,242 Nonfat dry milk ........................................ 13,852 14,583 12,200 Butter and Milkfat .................................... 64,164 62,642 46,126 Cheese .................................................... 67,460 54,993 54,115 Whey, fluid or dried ................................. 77,200 50,387 50,726
Other dairy products ....................................... 511,964 507,166 557,556 Fats, oils and greases ............................. 58,478 65,580 53,157 Lard .......................................................... 963 436 342
Tallow, inedible ............................................... 16,372 19,386 22,877 Other animal fats ..................................... 41,143 45,758 29,938 Hides and skins include furs ................... 72,425 94,748 69,937 Bovine hides, whole ................................ 916 - - Calf skins, whole ..................................... 89 - - Horse hides whole ................................... 200 126 31 Sheep and lamb skins ............................. 118 117 133 Other hides and skins, ex. furs ............... 4,531 2,042 1,372
Furskins ............................................ 66,572 92,463 68,400 Mink pelts ......................................... 59,275 85,112 60,916
Other furskins ................................................. 7,297 7,352 7,484 Wool and Mohair ............................................ 180 136 142 Sausage casings ............................................ 7,826 9,028 16,689 Bull semen ...................................................... 8,747 9,642 8,476
Misc animal products-other .................................... 47,298 55,519 59,101 Grains and feeds ............................................ 3,706,872 3,947,684 4,250,047 Wheat, unmilled .............................................. 18,898 19,755 28,622 Wheat flour ..................................................... 54,658 35,620 33,520 Other wheat products ..................................... 66,394 80,034 85,346 Rice-paddy,milled parb ................................... 147,904 164,642 191,046
Feed grains and products ....................... 235,837 362,021 484,961 Feed grains ...................................... 128,366 275,578 406,106 ........................................................... 16,886 9,917 6,288 Corn .................................................. 106,920 262,669 397,288 Grain sorghums ................................ 1,122 1,118 905
Oats ................................................................ 3,297 1,754 1,518 Rye .................................................................. 140 120 107 Feed grain products ........................................ 107,471 86,443 78,855 Other grain prods ........................................... 2,039,040 2,085,880 2,170,594 Feeds and fodders, ex. oilcakes .................... 1,036,670 1,113,289 1,177,103
Corn by-products ..................................... 39,164 49,952 36,336 Alfalfa meal and cubes ............................ 716 721 231 Beet pulp ................................................. 6,099 5,998 6,906 Other feeds and fodder ........................... 990,691 1,056,617 1,133,629
See footnote(s) at end of table.

XV–11 AGRICULTURAL STATISTICS 2020
Table 15-6.—Agricultural exports: Value of U.S. exports to the top market, Canada, by commodity, fiscal years 2017–2019 1—Continued
Commodity Value
2017 2018 2019
1,000 dollars 1,000 dollars 1,000 dollars
Fruits and prep. excluding juice ............................ 2,061,354 2,048,514 1,984,441 Fruits, fresh ..................................................... 1,577,670 1,542,893 1,468,075
Citrus fruits .............................................. 231,301 228,024 198,053 Grapefruit .......................................... 19,812 16,379 15,492 Lemons and limes ............................ 54,745 52,180 45,270 Oranges and tangerines ................... 156,474 159,062 136,834 Other citrus fruits .............................. 270 402 457
Noncitrus fruits ......................................... 1,346,369 1,314,869 1,270,022 Apple ................................................ 168,027 163,733 157,992 Berries .............................................. 506,409 518,982 513,635 Cherries ............................................ 136,890 118,502 120,774 Grapes .............................................. 213,514 205,789 190,014 Melons .............................................. 131,858 124,946 110,903 Peaches ............................................ 65,315 60,767 61,028 Pears ................................................ 46,811 45,781 44,446 Plums ................................................ 21,672 20,570 19,116 Other noncitrus ................................. 55,872 55,800 52,113
Fruits, dried ..................................................... 65,457 66,832 67,319 Raisins ..................................................... 33,856 30,478 30,675 Prunes ..................................................... 12,479 12,997 11,513 Other dried fruits ...................................... 19,122 23,357 25,131
Fruits-canned, excluding juice ........................ 226,846 238,548 224,372 Fruits-frozen, excluding juice .......................... 53,818 51,224 62,933 Other fruits, prep. or pres ............................... 137,563 149,017 161,742
Fruit juices, including frozen .................................. 386,070 374,536 339,086 Apple juice ...................................................... 18,105 19,267 17,930 Grape juice ..................................................... 26,045 28,387 25,092 Grapefruit juice ............................................... 6,837 8,063 9,576 Orange juice ................................................... 193,390 173,817 155,499 Other fruit juices ............................................. 141,693 145,002 130,989
Wine ....................................................................... 395,769 427,823 405,505 Nuts and prep ........................................................ 860,085 894,622 926,053
Almonds .......................................................... 257,811 266,920 282,858 Filberts ............................................................ 21,590 11,201 44,831 Peanuts, shelled or prep ................................ 170,668 168,724 169,863 Pistachios ........................................................ 77,738 92,091 103,109 Walnuts ........................................................... 72,491 98,696 74,352 Pecans ............................................................ 81,695 71,404 63,192 Other nuts ....................................................... 178,092 185,586 187,848
Vegetables and prep ............................................. 3,158,525 3,064,511 3,198,944 Vegetables, fresh ............................................ 1,852,596 1,843,346 2,017,741
Asparagus ................................................ 9,232 10,782 10,268 Broccoli .................................................... 67,791 74,152 78,284 Carrots ..................................................... 97,198 97,799 97,934 Cabbage .................................................. 56,802 70,706 81,148 Celery ...................................................... 67,483 61,038 103,699 Cauliflower ............................................... 123,159 131,332 140,130 Corn, sweet ............................................. 46,476 44,291 41,881 Cucumbers .............................................. 15,698 13,337 16,630 Garlic ....................................................... 11,231 9,693 10,219 Lettuce ..................................................... 428,991 412,552 448,759 Mushrooms .............................................. 19,510 29,374 33,841 Onion and Shallots .................................. 103,944 109,519 136,943 Peppers ................................................... 74,233 73,214 80,404 Potatoes ................................................... 102,399 96,419 114,053 Tomatoes ................................................. 103,030 103,317 107,775 Other fresh vegetables ............................ 525,417 505,820 515,775
Vegetables, frozen .......................................... 191,681 192,001 195,550 Corn, sweet ............................................. 14,534 10,044 7,975 Potatoes ................................................... 76,050 72,486 75,979 Other frozen vegetables .......................... 101,097 109,471 111,596
Vegetables, canned ........................................ 172,755 164,340 160,671 Pulses ............................................................. 138,886 79,824 104,829
Dried beans ............................................. 52,725 38,120 38,414 Dried peas ............................................... 7,659 3,383 21,930 Dried lentils .............................................. 56,979 14,587 26,222
Dried chick peas ............................................. 21,524 23,734 18,262 Other vegetables, prep or pres ...................... 781,083 761,266 701,891
See footnote(s) at end of table.

XV–12 MISCELLANEOUS AGRICULTURAL STATISTICS
Table 15-6.—Agricultural exports: Value of U.S. exports to the top market, Canada, by commodity, fiscal years 2017–2019 1—Continued
Commodity Value
2017 2018 2019
1,000 dollars 1,000 dollars 1,000 dollars
Oilseeds and products ........................................... 1,286,945 1,327,118 1,437,675 Oilcake and meal ............................................ 306,201 360,766 339,350
Bran and residues ................................... 4,683 4,482 2,863 Soybean meal .......................................... 294,600 350,413 331,131 Other oilcake and meal ........................... 6,918 5,870 5,356
Oilseeds .......................................................... 434,487 443,826 610,404 Rapeseed ................................................ 86,245 85,257 105,761 Safflower seeds ....................................... 694 577 876 Soybeans ................................................. 133,680 162,911 304,724 Sunflowerseeds ....................................... 16,205 16,031 17,704 Peanuts, including oilstock ...................... 7,069 7,558 8,621 Other oilseeds ......................................... 14,323 11,549 11,555 Protein substances .................................. 176,271 159,943 161,163
Vegetable oils ................................................. 546,257 522,526 487,921 Soybean oil .............................................. 25,193 23,756 24,551 Cottonseed oil .......................................... 5,832 6,845 5,863 Sunflower oil ............................................ 26,747 27,329 27,845 Corn oil .................................................... 14,596 12,971 11,414 Peanut oil ................................................ 4,313 5,168 4,103 Rapeseed oil ............................................ 38,758 19,124 21,122 Safflower oil ............................................. 2,558 2,209 1,982 Other Vegetable oils and Waxes ............ 428,258 425,125 391,041
Tobacco-unmanufactured ...................................... 7,256 15,920 6,522 Cotton, excluding linters ........................................ 635 683 619 Cotton linters .......................................................... 33 29 26 Essential oils .......................................................... 434,192 446,512 437,528 Seeds-field and garden ......................................... 329,534 335,894 355,579 Sugar and tropical products .................................. 2,020,813 1,987,685 1,888,585
Sugar and related products ............................ 546,820 541,957 506,078 Sugar, cane or beet ................................. 6,706 7,211 9,546 Related sugar product ............................. 540,114 534,746 496,531
Coffee ............................................................. 529,885 540,086 498,730 Cocoa ............................................................. 131,133 121,892 116,108 Chocolate and prep ........................................ 619,875 598,634 580,902 Tea, including herbal ...................................... 124,209 124,874 127,831 Spices ............................................................. 62,803 53,625 55,834 Rubber, crude ................................................. 6,088 6,617 3,102
Fibers, excluding cotton ......................................... 906 1,113 727 Other hort products ................................................ 1,360,181 1,387,525 1,492,875
Hops, including extract ................................... 24,270 31,794 38,638 Starches, not wheat/corn ................................ 80,045 80,061 82,103 Yeasts ............................................................. 38,790 39,487 37,719 Misc hort products .......................................... 1,217,076 1,236,183 1,334,415
Nursery and greenhouse ....................................... 204,844 218,892 221,379 Beverages, excluding juice .................................... 837,950 775,718 752,164
1 Fiscal years Oct. 1–Sept. 30. ERS, Market and Trade Economics Division, (202) 694–5257.

XV–13 AGRICULTURAL STATISTICS 2020
Table 15-7.—Agricultural imports for consumption: Value of Top 50 countries of origin, United States, fiscal years 2017–2019 1
Country 2017 2018 2019
1,000 dollars
Mexico ........................................................ 24,070,256 25,657,093 27,869,944 EU27+UK ................................................... 21,359,059 23,699,510 24,678,802 Canada ...................................................... 21,958,461 22,961,211 23,390,158 China .......................................................... 4,472,800 4,770,143 4,054,120 Australia ..................................................... 3,093,993 3,264,828 3,419,887 Brazil .......................................................... 3,320,430 3,380,010 3,325,414 Singapore ................................................... 81,690 2,182,709 3,126,375 Indonesia ................................................... 3,586,724 3,472,153 2,983,532 Chile ........................................................... 2,989,725 3,039,228 2,874,354 Thailand ..................................................... 2,387,364 2,636,682 2,826,619 Colombia .................................................... 2,590,605 2,565,535 2,699,872 India ........................................................... 2,526,629 2,660,230 2,680,949 Peru ........................................................... 1,976,529 2,168,652 2,438,736 New Zealand .............................................. 2,585,348 2,586,537 2,368,045 Guatemala ................................................. 2,096,941 2,132,753 2,129,079 Vietnam ...................................................... 2,400,214 2,382,429 2,030,625 Costa Rica ................................................. 1,606,185 1,638,421 1,516,039 Switzerland ................................................ 1,269,705 1,318,617 1,363,222 Argentina .................................................... 1,366,579 1,415,104 1,356,260 Ecuador ...................................................... 1,055,404 1,034,472 1,116,640 Malaysia ..................................................... 964,687 997,937 1,026,316 Turkey ........................................................ 887,777 983,489 974,822 Philippines .................................................. 1,260,625 1,164,344 958,695 Honduras ................................................... 817,919 737,655 814,612 Japan ......................................................... 650,136 696,358 764,064 Cote d’Ivoire ............................................... 1,185,412 852,707 751,703 South Korea ............................................... 542,453 606,149 680,557 Nicaragua ................................................... 630,915 661,630 672,043 Madagascar ............................................... 384,417 524,349 477,475 Dominican Republic ................................... 405,283 514,750 467,272 Taiwan ....................................................... 360,331 390,637 441,630 South Africa ............................................... 283,631 341,398 402,431 Israel .......................................................... 370,139 383,441 400,688 Uruguay ..................................................... 339,510 302,034 338,387 Ghana ........................................................ 290,304 201,474 279,892 El Salvador ................................................ 225,381 218,729 228,130 Morocco ..................................................... 156,091 192,482 210,526 Sri Lanka .................................................... 190,158 198,549 189,093 Ukraine ....................................................... 104,397 93,634 156,736 Ethiopia ...................................................... 161,470 175,469 155,223 Kenya ......................................................... 162,929 151,624 136,561 Egypt .......................................................... 112,226 132,616 133,582 Jamaica ...................................................... 120,588 132,573 129,385 Pakistan ..................................................... 105,239 123,591 128,438 Tunisia ....................................................... 86,298 204,381 125,592 Paraguay .................................................... 97,494 70,926 108,350 Norway ....................................................... 91,141 100,368 105,741 Bolivia ........................................................ 111,017 91,753 98,287 Hong Kong ................................................. 96,243 98,278 92,744 Malawi ........................................................ 88,690 47,638 71,909 Other countries .......................................... 1,001,399 1,153,189 1,075,340
Total U.S. Agricultural Imports 2 ................ 119,078,941 127,510,469 130,844,896
1 Fiscal years Oct. 1–Sept. 30. 2 Totals may not add due to rounding. ERS, Market and Trade Economics Division, (202) 694–5257. Compiled from reports of the U.S. Department of Com-
merce.

XV–14 MISCELLANEOUS AGRICULTURAL STATISTICS
Table 15-8.—European Union: Value of agricultural imports by origin, 2010–2019
Year 1 United States EU countries Other countries Total
Million dollars
2010 ............... 10,822 329,477 113,650 453,950 2011 ............... 12,760 389,811 138,954 541,525 2012 ............... 12,049 374,067 131,836 517,952 2013 ............... 14,768 406,306 133,729 554,802 2014 ............... 15,361 405,760 136,580 557,700 2015 ............... 14,456 353,918 122,328 490,702 2016 ............... 13,672 360,318 121,664 495,654 2017 ............... 13,757 400,005 129,610 543,372 2018 ............... 16,044 420,372 133,274 569,689 2019 ............... 10,311 427,510 84,888 522,709
1 Data on calendar year basis. Users should use cautious interpretation on reports that include summarized reporter groupings. These groupings will only include the members that have reported data for any particular year.
ERS, Market and Trade Economics Division, (202) 694–5257. Data Source: United National Commodity Trade Statistics, United Nations Statistics Division.
Table 15-9.—Fisheries: U.S. Commercial landings and value of principal species: 2017 and 2018 1
Species Landings
2017 2018
Thousand pounds Thousand pounds Fish:
Cod, Atlantic ........................................... 1,857 2,152 Flounder .................................................. 544,866 525,070 Haddock .................................................. 12,101 14,455 Halibut ..................................................... 26,466 21,929 Herring, sea ............................................ 179,920 145,792 Jack mackerel ......................................... 1,043 239 Menhaden ............................................... 1,413,104 1,581,578 Ocean perch, Atlantic ............................. 11,387 9,902 Walleye (Alaska) Pollock ........................ 3,388,620 3,363,901 Salmon, Pacific ....................................... 1,008,198 575,972 Tuna ........................................................ 54,904 51,684 Whiting (silver hake) ............................... 11,800 11,393
Shellfish: Clams (meats) ........................................ 84,883 85,670 Crabs ...................................................... 274,578 289,021 Lobsters, American ................................. 132,973 146,176 Oysters (meats) ...................................... 31,805 30,304 Scallops (meats) ..................................... 51,733 58,382 Shrimp ..................................................... 283,272 289,178
Value
Thousand dollars Thousand dollars Fish:
Cod, Atlantic ........................................... 4,444 4,777 Flounder .................................................. 141,228 153,235 Haddock .................................................. 11,947 13,354 Halibut ..................................................... 125,785 89,318 Herring, sea ............................................ 36,396 32,605 Jack mackerel ......................................... 49 27 Menhaden ............................................... 125,495 161,088 Ocean perch, Atlantic ............................. 6,307 5,036 Walleye (Alaska) Pollock ........................ 419,425 456,510 Salmon, Pacific ....................................... 687,770 598,067 Tuna ........................................................ 154,392 149,053 Whiting (silver hake) ............................... 9,009 9,630
Shellfish: Clams (meats) ........................................ 210,755 244,107 Crabs ...................................................... 610,3377 644,912 Lobsters, American ................................. 552,057 624,228 Oysters (meats) ...................................... 236,418 258,748 Scallops (meats) ..................................... 511,945 540,583 Shrimp ..................................................... 530,977 496,114
1 Landings are reported in round (live) weight for all items except univalve and bivalve mollusks such as clams, oysters, and scallops, which are reported in weight of meats (excluding the shell). Landings for Mississippi River drainage are not available.
Totals may not add due to rounding. Data do not include landings by U.S.-flag vessels at Puerto Rico or other ports out-side the 50 States. Data do not include aquaculture products, except oysters and clams.
U.S. Department of Commerce, NOAA, NMFS, Fisheries Statistics Division, (301) 427–8103.

XV–15 AGRICULTURAL STATISTICS 2020
Table 15-10.—Fresh and frozen fishery products: Production and value, 2017 and 2018
Product Production
2017 2018
Thousand pounds Thousand pounds Fish fillets ....................................................... 795,146 745,394
Cod ............................................................. 72,488 62,365 Flounder ..................................................... 11,888 9,792 Haddock ..................................................... 11,233 8,068 Ocean perch, Atlantic ................................. 1,166 1,847 Rockfish ...................................................... 2,874 3,198 Pollock, Atlantic .......................................... 9,931 789 Pollock, Alaska ........................................... 455,341 441,590 Other ........................................................... 241,458 217,745
Value
Thousand dollars Thousand dollars Fish fillets ....................................................... 2,146,555 2,157,359
Cod ............................................................. 318,348 332,436 Flounder ..................................................... 49,941 43,785 Haddock ..................................................... 52,912 42,255 Ocean perch, Atlantic ................................. 3,526 7,851 Rockfish ...................................................... 8,587 9,187 Pollock, Atlantic .......................................... 15,898 2,759 Pollock, Alaska ........................................... 582,604 608,493 Other ........................................................... 1,114,739 1,110,593
U.S. Department of Commerce, NOAA, NMFS, Fisheries Statistics Division, (301) 427–8103.
Table 15-11.—Canned fishery products: Production and value, 2017 and 2018
Product Production
2017 1 2018
Thousand pounds Thousand pounds Tuna 2 ............................................................. 333,913 346,407 Salmon ........................................................... 133,878 65,585 Clam products 3 .............................................. 63,191 64,293 Crab meat and specialties ............................. 153 81 Other Shellfish ............................................... 28,826 20,372
Total 4 ............................................................. 855,551 665,148
Value
Thousand dollars Thousand dollars Tuna 2 ............................................................. 677,721 775,900 Salmon ........................................................... 309,593 185,676 Clam products 3 .............................................. 106,075 107,054 Crab meat and specialties ............................. 607 314 Other Shellfish ............................................... 20,480 19,992
Total 4 ............................................................. 1,341,712 1,219,000
1 Revised based on additional data. 2 Flakes included with chunk. 3 ″Cut out″ or ″drained″ weight of can contents are given for whole or minced clams, and net contents for other clam products. 4 Includes Sardines (Maine), Shrimp, Oysters, and other products not shown separately.
U.S. Dept. of Commerce, NOAA, NMFS, Fisheries Statistics Division, (301) 427–8103.

XV–16 MISCELLANEOUS AGRICULTURAL STATISTICS
Table 15-12.—Fisheries: Fishermen and craft, 1977, and catch, 2017–2018 by area
Area
1977 1 2017 3 2018 3
Fishermen Fishing vessels
Fishing boats 2
Total catch Value Total
catch Value
Million Million Million Million 1,000 Number 1,000 pounds dollars pounds dollars
New England States .................... 31.7 929 15.4 556 1,266 572 1,394 Middle Atlantic States .................. 17.3 573 11.3 620 508 628 473 South Atlantic States ................... 11.6 1,463 6.7 122 223 109 179 Gulf States ................................... 29.3 5,328 11.0 1,386 856 1,541 887 Pacific Coast States .................... 54.0 7,643 15.4 7,182 2,435 6,487 2,500 Great Lakes States ..................... 1.2 217 0.5 13 17 13 18 Hawaii .......................................... 2.7 101 1.3 37 116 35 119
United States ............................... 182.1 17,545 89.2 9,916 5,421 9,385 5,571
1 Exclusive of duplication among regions. Computation of area amounts will not equal U.S. total. Mississippi River data in-cluded with total. 2 Refers to craft having capacity of less than 5 net tons. 3 Great Lakes data are one year behind the heading years. Note: Table may not add due to rounding.
U.S. Department of Commerce, NOAA, NMFS, Fisheries Statistics Division, (301) 427–8103.
Table 15-13.—Fisheries: U.S. Commercial landings of fish and shellfish, 2009–2018
Year For human food For industrial purposes 2 Total
Quantity Value Quantity Value Quantity Value
Million pounds Million dollars Million pounds Million dollars Million pounds Million dollars
2009 ........... 6,198 3,733 1,833 158 8,031 3,891 2010 ........... 6,526 4,356 1,705 164 8,231 4,520 2011 ........... 7,909 5,108 1,949 181 9,858 5,289 2012 ........... 7,477 4,923 2,157 180 9,634 5,103 2013 ........... 8,043 5,268 1,827 198 9,870 5,466 2014 ........... 7,828 5,256 1,658 192 9,486 5,448 2015 ........... 7,750 4,972 1,968 231 9,718 5,203 2016 ........... 7,484 5,007 2,088 305 9,572 5,312 2017 ........... 8,228 5,187 1,688 234 9,916 5,421 2018 ........... 7,500 5,322 1,885 249 9,385 5,571
1 Live weight. 2 Meals, oil, fish solubles, homogenized condensed fish, shell products, bait, and animal food. U.S. Department of Commerce, NOAA, NMFS Fisheries Statistics Division, (301) 427–8103.
Table 15-14.—Fisheries: Disposition of domestic catch, 2017–2018 1
Disposition 2017 2018
Million pounds Million pounds
Fresh and frozen ............................................ 8,091 7,443 Canned ........................................................... 289 180 Cured ............................................................. 136 139 Reduced to meal, oil, etc ............................... 1,400 1,623
Total ............................................................... 9,916 9,385
1 Live weight catch. In addition to whole fish, a large portion of waste derived from canning, filleting, and dressing fish and shellfish is utilized in production of fish meal and oil in each year shown.
U.S. Department of Commerce, NOAA, NMFS, Fisheries Statistics Division, (301) 427–8103.

XV–17 AGRICULTURAL STATISTICS 2020
Table 15-15.—Fishery products: Supply, 1 2017–2018 2
Item 2017 2018
Million pounds
For human food ............................................. 19,805 19,478 Finfish ......................................................... 14,422 13,941 Shellfish 3 .................................................... 5,383 5,538
For industrial use ........................................... 2,461 2,625 Domestic catch .............................................. 9,916 9,385
Percent of total ....................................... 45 42 For human food .......................................... 8,228 7,500
Finfish ..................................................... 7,121 6,409 Shellfish 3 ................................................ 1,107 1,091
For industrial use ........................................ 1,688 1,886 Imports 4 ......................................................... 12,350 12,718
Percent of total ....................................... 55 58 For human food .......................................... 11,577 11,979
Finfish ..................................................... 8,074 8,271 Shellfish 3 ................................................ 4,276 4,447
For industrial use 5 ..................................... 773 739
Total ............................................................... 22,266 22,103
1 Supply totals are the domestic catch and imports without accounting for exports taken out. 2 Live weight, except per-cent. May not add due to rounding. 3 For univalve and bivalves mollusks (conchs, clams, oysters, scallops, etc.), the weight of meats, excluding the shell is reported. 4 Excluding imports of edible fishery products consumed in Puerto Rico; includes landings of tuna caught by foreign vessels in American Samoa. 5 Fish meal and sea herring.
U.S. Department of Commerce, NOAA, NMFS, Fisheries Statistics Division, (301) 427–8103.
Table 15-16.—Processed fishery products: Production and value, 2017–2018 1
Item Production Value
2017 2018 2017 2018
Thousand pounds Thousand pounds Thousand dollars Thousand dollars
Fresh and frozen:.Fillets .............................................. 795,146 745,394 2,146,555 2,157,359 Steaks ............................................. 5,269 5,344 30,909 32,042
Fish sticks .............................................. 55,245 55,087 85,085 93,248 Fish portions .......................................... 100,135 73,620 177,179 139,313 Breaded shrimp ..................................... 84,235 84,391 344,274 338,958 Canned products 2 ................................. 855,551 665,148 1,341,712 1,219,000
Fish and shellfish ............................ 560,321 497,056 1,116,793 1,090,983 Animal feed ..................................... 295,230 168,092 224,919 128,017
Industrial products ................................. (X) (X) 679,740 753,578 Meal and scrap ............................... 568,882 630,256 379,806 418,073 Marine animal oil ............................ 112,253 154,777 108,175 114,771 Other ............................................... (X) (X) 191,759 220,734
(X) Not applicable. 1 Includes cured fish. 2 Includes salmon eggs for baits. U.S. Department of Commerce, NOAA, NMFS, Fisheries Statistics Division, (301) 427–8103.

XV–18 MISCELLANEOUS AGRICULTURAL STATISTICS
Table 15-17.—Selected fishery products: Imports and exports, 2017–2018 1
Product Quantity
2017 2018
Thousand pounds Thousand pounds
Imports
Edible ............................................................. 5,919,333 6,086,590
Fresh and frozen .................................... 5,001,948 5,125,531 Salmon 2 .......................................... 299,253 306,437 Tuna 2 .............................................. 257,944 188,924 Groundfish fillets, blocks 3 ............... 298,908 300,639 Other fillets and steaks .................... 1,315,789 1,413,517 Scallops (meats) .............................. 39,438 44,775 Lobster, American and spiny ........... 111,471 108,690 Shrimp and prawn ........................... 1,460,711 1,528,745
Canned ................................................... 723,205 778,726 Sardines, in oil ................................. 42,577 34,786 Sardines and herring, not in oil ....... 43,695 43,761 Tuna ................................................. 311,414 345,326 Oysters ............................................ 12,164 15,250
Pickled or salted ..................................... 63,082 61,538 Cod, haddock, hake, pollock, cusk 12,758 12,877
Nonedible meal and scrap ............................. 138,056 131,983
Exports
Canned salmon .............................................. 63,380 55,150 Fish oil, nonedible .......................................... 139,036 140,597
Product Value
2017 2018
Thousand dollars Thousand dollars
Imports
Edible ............................................................. 21,519,015 22,438,476
Fresh and frozen .................................... 18,959,483 19,502,541 Salmon 2 .......................................... 1,072,424 1,173,173 Tuna ................................................. 653,261 618,903 Groundfish fillets, blocks 3 ............... 720,659 808,018 Other fillets and steaks .................... 4,747,576 5,262,319 Scallops (meats) .............................. 258,427 237,208 Lobster, American and spiny ........... 1,039,585 1,162,162 Shrimp and prawn ........................... 6,511,108 6,197,363
Canned ................................................... 1,961,002 2,349,728 Sardines, in oil ................................. 79,040 84,788 Sardines and herring, not in oil ....... 61,283 63,318 Tuna ................................................. 631,774 765,982 Oysters ............................................ 34,211 43,447
Pickled or salted ..................................... 110,103 110,047 Cod, haddock, hake, pollock, cusk 33,590 35,460
Nonedible meal and scrap ............................. 111,918 106,220
Exports
Canned salmon .............................................. 159,750 166,556 Fish oil, nonedible .......................................... 146,279 154,218
1 Includes Puerto Rico. 2 Excludes fillets. 3 Includes cod, cusk, haddock, hake, pollock, ocean perch, and whiting. U.S. Dept. of Commerce, NOAA, NMFS, Fisheries Statistics Division (301) 427–8103.

XV–19 AGRICULTURAL STATISTICS 2020
Table 15-18.—Fishery products: Imports and exports, 2009–2018 1
Year
Imports 2 Exports
Total value Edible products Non-edible,
value Total value Edible products Non-edible,
value Quantity Value Quantity Value
Million dollars
Million pounds
Million dollars
Million dollars
Million dollars
Million pounds
Million dollars
Million dollars
2009 23,554 5,161 13,124 10,430 19,636 2,546 3,980 15,656 2010 27,352 5,447 14,811 12,542 22,386 2,733 4,389 17,997 2011 30,943 5,349 16,618 14,326 26,218 3,267 5,447 20,771 2012 31,107 5,384 16,690 14,417 27,384 3,254 5,470 21,914 2013 33,156 5,415 18,006 15,150 29,113 3,324 5,584 23,529 2014 35,915 5,567 20,264 15,650 29,978 3,402 5,754 24,225 2015 34,400 5,736 18,791 15,609 28,396 3,141 5,567 22,829 2016 35,875 5,827 19,486 16,389 27,989 2,931 5,384 22,605 2017 38,372 5,920 21,520 16,853 28,973 3,200 5,730 23,243 2018 40,304 6,087 22,438 17,865 28,755 2,938 5,590 23,165
1 Includes Puerto Rico. 2 Includes landings of tuna by foreign vessels in American Samoa. U.S. Department of Commerce, NOAA, NMFS, Fisheries Statistics Division, (301) 427–8103.
Table 15-19.—Fish trips: Estimated number of fishing trips taken by marine recreational fishermen by subregion and year, Atlantic, Gulf, and Pacific Coasts, 2017–2018
Subregion 2017 2018
Thousands Thousands Atlantic and Gulf:
North Atlantic .............................................. 16,751 15,103 Mid-Atlantic ................................................. 46,004 39,029 South Atlantic 1 ........................................... 76,870 75,100 Gulf ............................................................. 58,633 55,755
Total 198,258 184,987
Pacific: 2 Southern California ..................................... 2,350 1,411 Northern California ..................................... 1,054 615 Oregon ........................................................ 187 210 Washington ................................................. 146 127 Hawaii ......................................................... 1,280 3,420 Alaska ......................................................... 545 539
Total 5,562 6,322
1 Does not include trips from headboats (party boats) in the South Atlantic or Gulf of Mexico. 2 Pacific state estimates do not include salmon data collected by recreational surveys.
Note: Recreational estimates have been revised back through 1981 (as of November 2019). Any data previously provided (for past reports) are no longer appropriate or valid.
U.S. Department of Commerce, NOAA, NMFS, Fisheries Statistics Division, (301) 427–8103.

XV–20 MISCELLANEOUS AGRICULTURAL STATISTICS
Table 15-20.—Fish harvested 1 by marine recreational anglers by subregion, area, and mode, Atlantic, Gulf Coasts, and Pacific Coasts, 2017–2018
Subregion 2017 2018
Thousands Thousands Atlantic and Gulf 2:
North Atlantic .............................................. 33,338 27,101 Mid-Atlantic ................................................. 76,606 45,848 South Atlantic 2 ........................................... 114,242 104,252 Gulf ............................................................. 167,340 145,541
Total ............................................................ 391,526 322,742
Pacific: 3 Southern California ..................................... 4,426 3,905 Northern California ..................................... 3,175 2,234 Oregon ........................................................ 646 539 Washington ................................................. 421 398 Hawaii ......................................................... 3,012 10,360 Alaska ......................................................... 1,395 1,208
Total ............................................................ 13,075 18,644
Area 2017 2018
Thousands Thousands Atlantic and Gulf: 2 4
Inland .......................................................... 204,628 181,527 State Territorial Sea 5 ................................. 141,141 106,204 Federal Exclusive Economic Zone 6 .......... 37,152 28,948
Total ............................................................ 391,526 322,742
Pacific: 3 Inland .......................................................... 1,851 2,727 State Territorial Sea 5 ................................. 8,399 12,653 Federal Exclusive Economic Zone 6 .......... 1,430 2,056
Total ............................................................ 11,680 17,436
Mode 2017 2018
Thousands Thousands Atlantic and Gulf: 2
Shore .......................................................... 188,523 160,879 Party/charter ............................................... 12,604 10,378 Private/rental .............................................. 190,399 151,485
Total ............................................................ 391,526 322,742
Pacific: 3 Shore .......................................................... 5,678 9,740 Party/charter ............................................... 3,412 3,578 Private/rental .............................................. 2,590 4,118
Total ............................................................ 11,680 17,436
1 ‘‘Harvested’’ includes dead discards and fish used for bait but does not include fish released alive; totals may not match due to rounding. 2 Does not include trips from headboats (party boats) in the South Atlantic or Gulf of Mexico. 3 Does not include recreational catch from Alaska. Pacific state estimates do not include salmon data collected by recreational sur-veys. 4 Includes fish harvested from an undetermined area. 5 Open Ocean extending 0 to 3 miles from shore, except West Florida (10 miles). 5 Open ocean extending to 200 miles offshore from the outer edge of the State Territorial Seas.
Note: Recreational estimates have been revised back through 1981 (as of November 2019). Any data previously provided (for past reports) are no longer appropriate or valid.
U.S. Department of Commerce, NOAA, NMFS, Fisheries Statistics Division, (301) 427–8103.

XV–21 AGRICULTURAL STATISTICS 2020
Table 15-21.—U.S. Recreational Harvest 1 by species group and year, 2017–2018 2
Species group 2017 2018
Thousands Thousands Atlantic Cod .................................................... 229 28 Atlantic Croaker ............................................. 14,308 11,997 Atlantic Mackerel ............................................ 17,745 9,495 Black Drum .................................................... 2,433 2,001 Black Sea Bass .............................................. 7,467 4,826 Blue Runner ................................................... 15,787 7,837 Conger Eels ................................................... 5 3 Crevalle Jack ................................................. 2,438 1,711 Cunner ........................................................... 116 130 Epinephelus Groupers ................................... 317 362 Florida Pompano ............................................ 2,404 1,506 Freshwater Catfishes ..................................... 1,968 2,220 Gray Snapper ................................................. 6,590 5,771 Greater Amberjack ......................................... 122 116 Gulf Flounder ................................................. 452 381 King Mackerel ................................................ 1,201 1,204 Kingfishes ....................................................... 22,626 18,472 Lane Snapper ................................................ 1,524 1,289 Little Tunny/Atlantic Bonito ............................ 849 803 Moray Eels ..................................................... - - Mycteroperca Groupers ................................. 391 397 Pigfish ............................................................ 1,525 1,455 Pinfishes ......................................................... 12,345 13,143 Pollock ............................................................ 606 386 Red Drum ....................................................... 4,350 3,909 Red Hake ....................................................... 158 191 Red Porgy ...................................................... 492 436 Red Snapper .................................................. 3,107 2,864 Saltwater Catfishes ........................................ 908 1,655 Sand Seatrout ................................................ 10,105 5,567 Scup ............................................................... 13,823 14,544 Sheepshead ................................................... 6,130 4,942 Silver Perch .................................................... 2,355 480 Skates/Rays ................................................... 204 388 Southern Flounder ......................................... 1,169 1,291 Spanish Mackerel .......................................... 8,147 7,211 Spot ................................................................ 23,637 12,831 Spotted Seatrout ............................................ 11,041 9,427 Striped Bass ................................................... 3,008 2,455 Striped Mullet ................................................. 6,026 7,069 Summer Flounder .......................................... 3,233 2,428 Tautog ............................................................ 2,073 1,072 Vermilion Snapper ......................................... 2,314 2,702 Weakfish ........................................................ 296 132 White Grunt .................................................... 3,634 3,551 White Perch ................................................... 6,818 3,794 Winter Flounder ............................................. 327 158 Yellowtail Snapper ......................................... 1,548 1,695 Other Barracudas ........................................... 272 325 Other Bluefish ................................................ 14,166 10,436 Other Cods/Hakes ......................................... 1,828 1,005 Other Dolphins ............................................... 2,491 2,935 Other Drum .................................................... 909 488 Other Eels ...................................................... 74 151 Other Flounders ............................................. 840 310 Other Grunts .................................................. 2,065 3,918 Other Herrings ............................................... 85,085 66,612 Other Jacks .................................................... 3,438 8,606 Other Mullets .................................................. 23,253 21,883 Other Porgies ................................................. 574 501 Other Puffers .................................................. 876 897 Other Sculpins ............................................... 2 8 Other Sea Basses .......................................... 388 863 Other Searobins ............................................. 926 759 Other Sharks .................................................. 383 357 Other Snappers .............................................. 435 285 Other Temperate Basses ............................... - 1 Other Toadfishes ........................................... 133 18 Other Triggerfishes/Filefishes ........................ 875 624 Other Tunas/Mackerels .................................. 1,249 1,018 Other Wrasses ............................................... 231 89 Other fishes .................................................... 22,682 24,328
Total 3 ............................................................. 391,526 322,742
- Represents zero. 1 ‘‘Harvested’’ includes dead discards and fish used for bait but does not include fish released alive. 2 Data do not include headboats (party boats) in the South Atlantic and the Gulf of Mexico. 3 Totals may not add due to rounding.
Note: Recreational estimates have been revised back through 1981 (as of November 2019). Any data previously provided (for past reports) are no longer appropriate or valid.
U.S. Department of Commerce, NOAA, NMFS, Fisheries Statistics Division (301) 427–8103.

XV–22 MISCELLANEOUS AGRICULTURAL STATISTICS
Table 15-22.—Fish harvested 1 by marine recreational anglers by species group and year, Pacific coast, 2017–2018 2
Species group 2017 2018
Thousands Thousands
Albacore ......................................................... 1 6 Barred Sand Bass .......................................... 41 50 Barred Surfperch ............................................ 451 10 Bigeye Scad ................................................... 1,064 3,639 Bigeye Trevally .............................................. ............................................................ 1 Bigscale Soldierfish ........................................ 74 481 Black Perch .................................................... 21 2 Black Rockfish ............................................... 698 579 Blackspot Sergeant ........................................ 11 89 Blacktail Snapper ........................................... 9 57 Blue Rockfish ................................................. 482 471 Bluefin Trevally .............................................. 77 117 Bluestripe Snapper ........................................ 79 94 Bocaccio ......................................................... 137 158 Brown Rockfish .............................................. 123 150 Cabezon ......................................................... 26 22 California Corbina .......................................... 16 7 California Halibut ............................................ 36 46 California Sheephead .................................... 39 34 Canary Rockfish ............................................. 146 125 Chilipepper Rockfish ...................................... 13 9 Chub Mackerel ............................................... 1,419 1,188 Conger Eels ................................................... 1 ............................................................Convict Tang .................................................. 58 273 Copper Rockfish ............................................ 237 195 Giant Trevally ................................................. 11 39 Goldring Surgeonfish ..................................... 78 230 Gopher Rockfish ............................................ 114 95 Greater Amberjack ......................................... 4 12 Green Jobfish ................................................. 19 38 Greenspotted Rockfish .................................. 38 33 Halfmoon ........................................................ 13 14 Hawaiian Flagtail ............................................ 94 206 Hawaiian Hogfish ........................................... 8 2 Highfin Rudderfish ......................................... 2 7 Island Jack ..................................................... 19 26 Jacksmelt ....................................................... 512 186 Kawakawa ...................................................... 8 33 Kelp Bass ....................................................... 99 93 Kelp Greenling ............................................... 23 11 Lingcod ........................................................... 312 276 Mackerel Scad ............................................... 108 404 Manybar Goatfish ........................................... 14 57 Moray Eels ..................................................... 5 10 Northern Anchovy .......................................... 215 212 Olive Rockfish ................................................ 61 75 Opaleye .......................................................... 43 16 Pacific Barracuda ........................................... 10 19 Pacific Bonito ................................................. 96 86 Pacific Cod ..................................................... 20 15 Pacific Hake ................................................... - - Pacific Herring ................................................ 67 56 Pacific Tomcod .............................................. - - Pile Perch ....................................................... 10 1 Pink Snapper ................................................. 10 56 Queenfish ....................................................... 17 17 Quillback Rockfish ......................................... 18 22 Razorfishes .................................................... 44 115 Redtail Surfperch ........................................... 148 - Rock Sole ....................................................... - 2 Sanddabs ....................................................... 259 252 Shiner Perch .................................................. 15 24 Silver Surfperch ............................................. 57 7 Skates/Rays ................................................... 9 1 Skipjack Tuna ................................................ 114 213 Smallmouth Bonefish ..................................... 19 45
See footnote(s) at end of table.

XV–23 AGRICULTURAL STATISTICS 2020
Table 15-22.—Fish harvested 1 by marine recreational anglers by species group and year, Pacific coast, 2017–2018 2—Continued
Species group 2017 2018
Thousands Thousands
Spiny Dogfish ................................................. - - Spotted Sand Bass ........................................ 3 1 Squirrel Fishes ............................................... ............................................................ 2 Starry Flounder .............................................. 1 - Striped Bass ................................................... 27 30 Striped Mullet ................................................. 14 72 Striped Seaperch ........................................... 36 3 Surf Smelt ...................................................... - ............................................................Unicornfishes ................................................. 3 16 Wahoo ............................................................ 32 127 Walleye Surfperch .......................................... 56 24 White Croaker ................................................ 59 47 White Seaperch ............................................. 6 3 Whitemouth Trevally ...................................... - - Whitesaddle Goatfish ..................................... 2 12 Whitetip Soldierfish ........................................ ............................................................ ............................................................Widow Rockfish ............................................. 15 46 Yellowfin Tuna ............................................... 82 216 Yellowstripe Goatfish ..................................... 380 1,651 Yellowtail ........................................................ 61 15 Yellowtail Rockfish ......................................... 176 180 Other Anchovies ............................................ ............................................................ - Other Barracudas ........................................... 2 14 Other Cods/Hakes ......................................... - - Other Damselfishes ....................................... 10 28 Other Dolphins ............................................... 47 216 Other Drum .................................................... 59 25 Other Flounders ............................................. 385 386 Other Goatfishes ............................................ 25 317 Other Greenlings ............................................ - - Other Groupers .............................................. 3 18 Other Herrings ............................................... 156 108 Other Jacks .................................................... 45 66 Other Mullets .................................................. 21 163 Other Rockfishes ........................................... 1,429 1,424 Other Sablefishes .......................................... 23 26 Other Scorpionfishes ..................................... 180 220 Other Sculpins ............................................... 2 1 Other Sea Basses .......................................... - - Other Sea Chubs ........................................... 26 96 Other Sharks .................................................. 8 7 Other Silversides ............................................ 69 82 Other Smelts .................................................. 9 10 Other Snappers .............................................. 9 91 Other Soldierfishes ........................................ 3 279 Other Sturgeons ............................................. - - Other Surfperches .......................................... 68 10 Other Surgeonfishes ...................................... 27 201 Other Tunas/Mackerels .................................. 47 58 Other Wrasses ............................................... 26 56 Other fishes .................................................... 1,471 1,488
Total 3 ............................................................. 13,075 18,644
- Represents zero. 1 ‘‘Harvested’’ includes dead discards and fish used for bait but does not include fish released alive. 2 Pacific estimates do not include salmon data collected by state recreational surveys. 3 Totals may not add exactly due to rounding.
Note: Recreational estimates have been revised back through 1981 (as of November 2019). Any data previously provided (for past reports) are no longer appropriate or valid.
U.S. Department of Commerce, NOAA, NMFS, Fisheries Statistics Division, (301) 427–8103.

XV–24 MISCELLANEOUS AGRICULTURAL STATISTICS
Table 15-23.—Catfish water surface acres used for production and total sales - States and United States: 2018–2020
State
Acres intended for utilization during January 1-June 30
Acres taken out of production during
Jul 1-Dec 31 prev. year Foodsize Fingerlings Broodfish
Currently under or scheduled for:
Renovation New construction
Acres Acres Acres Acres Acres Acres
2019 Alabama ............. 16,500 110 (D) 300 (D) 350 Arkansas ............ 3,000 910 235 440 (D) 550 California ............ 910 (D) 35 90 - (D) Mississippi .......... 27,100 4,900 1,300 (D) 660 540 North Carolina .... 1,200 (D) (D) (D) - (D) Texas ................. 1,700 55 50 80 (D) 195 Other States 1 ..... 1,220 1,010 210 4,575 120 255
United States ..... 51,630 6,985 1,830 5,485 780 1,890
2020 Alabama ............. 15,600 250 25 25 115 690 Arkansas ............ 2,700 770 (D) (D) - 230 California ............ (D) (D) 35 35 (D) (D) Mississippi .......... 26,700 4,200 1,400 1,400 (D) 700 North Carolina .... (D) (D) (D) (D) (D) (D) Texas ................. 1,700 (D) 35 35 - (D) Other States 1 ..... 2,650 1,200 285 285 265 880
United States ..... 49,350 6,420 1,780 1,780 380 2,500
- Represents zero. (D) Withheld to avoid disclosing data for individual operations. 1 Other States include State esti-mates not shown and States suppressed due to disclosure.
NASS, Livestock Branch, (202) 720–3570.
Table 15-24.—Catfish water surface acres used for production total sales - States and United States: 2018–2020
State
Water surface acres used for production during Jan 1 - July 30 Total sales
2019 2020 2018 2019
Acres Acres 1,000 dollars 1,000 dollars
Alabama ......................... 16,800 15,900 91,128 97,714 Arkansas ........................ 4,300 4,000 21,624 21,671 California ........................ 1,100 (D) 9,109 (D) Mississippi ...................... 35,700 35,300 207,543 226,194 North Carolina ................ 1,300 (D) 2,932 (D) Texas ............................. 1,900 1,800 20,889 17,969 Other States 1 ................ 2,220 4,245 7,176 15,600
United States ................. 63,320 61,245 360,401 379,148
(D) Withheld to avoid disclosing data for individual operations. 1 Other States include State estimates not shown and States suppressed due to disclosure.
NASS, Livestock Branch, (202) 720–3570.

XV–25 AGRICULTURAL STATISTICS 2020
Table 15-25.—Catfish: Sales by size category, by State and United States, 2018–2019
Size category and State
Number of fish Live weight Sales
2018 2019 2018 2019 Total Average price per
pound
2018 2019 2018 2019
1,000 1,000 1,000 1,000 1,000 1,000 pounds pounds dollars dollars Dollars Dollars
Foodsize: Alabama .............. 63,600 60,300 104,600 102,500 91,002 97,375 0.87 0.95 Arkansas ............. 10,900 10,700 18,300 18,600 18,666 19,716 1.02 1.06 California ............. 1,600 1,210 2,850 2,400 9,063 7,632 3.18 3.18 Mississippi ........... 121,000 113,000 192,000 203,500 188,160 213,675 0.98 1.05 North Carolina ..... 1,400 (D) 2,500 (D) 2,900 (D) 1.16 (D) Texas .................. 8,520 (D) 20,200 (D) 20,806 (D) 1.03 (D) Other States 1 ..... 1,780 11,235 3,151 20,990 4,409 23,650 1.40 1.13
United States ...... 208,800 196,445 343,601 347,990 335,006 362,048 0.97 1.04
Stockers: Alabama .............. (D) (D) (D) (D) (D) (D) (D) (D) Arkansas ............. (D) (D) (D) (D) (D) (D) (D) (D) California ............. (D) (D) (D) (D) (D) (D) (D) (D) Mississippi ........... (D) (D) (D) (D) (D) (D) (D) (D) North Carolina ..... (D) - (D) - (D) - (D) - Texas .................. (D) (D) (D) (D) (D) (D) (D) (D) Other States 1 ..... 65,465 22,450 6,553 2,819 7,727 5,181 1.18 1.84
United States ...... 65,465 22,450 6,553 2,819 7,727 5,181 1.18 1.84
Fingerlings and fry: Alabama .............. (D) 310 (D) 9 (D) 68 (D) 7.60 Arkansas ............. 12,400 (D) 472 (D) 939 (D) 1.99 (D) California ............. 190 (D) 5 (D) 42 (D) 8.30 (D) Mississippi ........... 168,000 146,000 5,950 3,850 14,340 8,971 2.41 2.33 North Carolina ..... (D) (D) (D) (D) (D) (D) (D) (D) Texas .................. (D) (D) (D) (D) (D) (D) (D) (D) Other States 1 ..... 9,865 23,240 315 794 956 2,464 3.03 3.10
United States ...... 190,455 169,550 6,742 4,653 16,277 11,503 2.41 2.47
Broodfish: Alabama .............. (D) (D) (D) (D) (D) (D) (D) (D) Arkansas ............. (D) (D) (D) (D) (D) (D) (D) (D) California ............. (D) - (D) - (D) - (D) - Mississippi ........... (D) (D) (D) (D) (D) (D) (D) (D) North Carolina ..... (D) (D) (D) (D) (D) (D) (D) (D) Texas .................. - (D) - (D) - (D) - (D) Other States 1 ..... 410 75 1,708 296 1,391 416 0.81 1.41
United States ...... 410 75 1,708 296 1,391 416 0.81 1.41
- Represents zero. (D) Withheld to avoid disclosing data for individual operations. 1 Other States include State esti-mates not shown and States suppressed due to disclosure.
NASS, Livestock Branch, (202) 720–0585.

XV–26 MISCELLANEOUS AGRICULTURAL STATISTICS
Table 15-26.—Trout: Value of fish sold and distributed, by State (excluding eggs), and United States (including and excluding eggs), 2018–2019
State Total value of fish sold Total value of distributed fish
2018 2019 2018 2019
1,000 dollars 1,000 dollars 1,000 dollars 1,000 dollars
Arkansas ........................ - - 3,479 2,550 California ........................ (D) (D) 8,278 9,434 Colorado ........................ 2,978 2,085 6,427 6,452 Georgia .......................... (D) (D) 1,213 (D) Idaho .............................. 40,290 37,416 (D) (D) Michigan ......................... 1,558 1,636 2,565 3,658 Missouri .......................... (D) (D) 4,252 3,738 New York ....................... 736 714 5,553 4,760 North Carolina ................ 8,790 7,627 1,973 1,940 Oregon ........................... (D) (D) (D) (D) Pennsylvania .................. 6,685 6,457 14,823 14,588 Utah ............................... 997 1,629 7,961 7,857 Virginia ........................... 1,733 1,483 1,983 2,266 Washington .................... (D) (D) (D) 19,269 West Virginia .................. 1,005 1,116 2,663 2,916 Wisconsin ....................... 1,493 1,525 1,514 (D) Other States 1 ................ 35,029 33,884 65,939 56,878
United States Value excluding eggs 101,294 95,572 128,623 136,306 Value including eggs .. 111,879 105,631 (NA) (NA)
- Represents zero. (D) Withheld to avoid disclosing data for individual operations. (NA) Not available. 1 Other States include State estimates not listed and States supressed due to disclosure.
NASS, Livestock Branch, (202) 720–3570.
Table 15-27.—Trout: Egg Sales, United States, 2014–2019
Year Number of Eggs Average Price per 1,000 Eggs Total Sales 1
1,000 Dollars 1,000 dollars
2014 ......... 427,125 20.50 8,774 2015 ......... 431,475 20.20 8,706 2016 ......... 422,904 21.10 8,921 2017 ......... 442,145 21.00 8,844 2018 ......... 461,947 22.90 10,585 2019 ......... 441,404 22.80 10,059
1 Due to rounding, total number of eggs multiplied by average price per 1,000 eggs may not exactly equal total sales. NASS, Livestock Branch, (202) 720-3570.

XV–27 AGRICULTURAL STATISTICS 2020
Table 15-28.—Trout: Sales by size category, States and United States, 2018 and 2019
Size category and State
Number of fish Live weight Sales
2018 2019 Total 1 Total 2 Average price per
pound
2018 2019 2018 2019 2018 2019
1,000 1,000 pounds 1,000 dollars Dollars
12 inch or longer: Arkansas ................. - - - - - - - - California ................. (D) (D) (D) (D) (D) (D) (D) (D) Colorado .................. 430 (D) 591 (D) 2,695 (D) 4.56 (D) Georgia ................... (D) (D) (D) (D) (D) (D) (D) (D) Idaho ....................... 22,200 19,900 27,000 25,000 39,960 37,250 1.48 1.49 Michigan .................. (D) (D) (D) (D) (D) (D) (D) (D) Missouri ................... (D) (D) (D) (D) (D) (D) (D) (D) New York ................ (D) (D) (D) (D) (D) (D) (D) (D) North Carolina ......... 3,640 (D) 4,000 (D) 7,600 (D) 1.90 (D) Oregon .................... (D) (D) (D) (D) (D) (D) (D) (D) Pennsylvania ........... 1,210 1,090 1,200 1,200 5,136 5,280 4.28 4.40 Utah ......................... 200 260 192 288 939 1,336 4.89 4.64 Virginia .................... 460 440 512 540 1,577 1,453 3.08 2.69 Washington ............. (D) (D) (D) (D) (D) (D) (D) (D) West Virginia ........... 450 400 435 410 1,005 1,074 2.31 2.62 Wisconsin ................ 370 340 357 314 1,339 1,410 3.75 4.49 Other States 3 .......... 6,975 9,960 13,261 16,006 31,508 38,039 2.38 2.38
United States ........... 35,935 32,390 47,548 43,758 91,759 85,842 1.93 1.96
6 inch-12 inch: Arkansas ................. - - - - - - - - California ................. (D) (D) (D) (D) (D) (D) (D) (D) Colorado .................. (D) (D) (D) (D) (D) (D) (D) (D) Georgia ................... 60 (D) 22 (D) 45 (D) 2.05 (D) Idaho ....................... (D) (D) (D) (D) (D) (D) (D) (D) Michigan .................. 50 80 30 40 156 252 5.20 6.30 Missouri ................... (D) (D) (D) (D) (D) (D) (D) (D) New York ................ 75 65 34 27 214 154 6.30 5.70 North Carolina ......... (D) (D) (D) (D) (D) (D) (D) (D) Oregon .................... (D) (D) (D) (D) (D) (D) (D) (D) Pennsylvania ........... 580 420 339 206 1,454 1,092 4.29 5.30 Utah ......................... (D) (D) (D) (D) (D) (D) (D) (D) Virginia .................... (D) 20 (D) 12 (D) 30 (D) 2.53 Washington ............. (D) 3,800 (D) 600 (D) 2,226 (D) 3.71 West Virginia ........... (D) (D) (D) (D) (D) (D) (D) (D) Wisconsin ................ (D) 95 (D) 26 (D) 111 (D) 4.28 Other States 3 .......... 7,285 4,615 1,765 1,268 6,283 4,554 3.56 3.59
United States ........... 8,050 9,095 2,190 2,179 8,152 8,419 3.72 3.86
Size category and State
Number of fish Live weight Sales
2018 2019 Total 1 Total 2 Average price per
1,000 fish
2018 2019 2018 2019 2018 2019
1,000 1,000 pounds 1,000 dollars Dollars
1 inch-6 inch: Arkansas ................. - - - - - - - - California ................. (D) (D) (D) (D) (D) (D) (D) (D) Colorado .................. (D) (D) (D) (D) (D) (D) (D) (D) Georgia ................... (D) - (D) - (D) - (D) - Idaho ....................... (D) (D) (D) (D) (D) (D) (D) (D) Michigan .................. (D) (D) (D) (D) (D) (D) (D) (D) Missouri ................... (D) (D) (D) (D) (D) (D) (D) (D) New York ................ (D) (D) (D) (D) (D) (D) (D) (D) North Carolina ......... (D) (D) (D) (D) (D) (D) (D) (D) Oregon .................... (D) (D) (D) (D) (D) (D) (D) (D) Pennsylvania ........... 210 280 5 7 95 85 452 304 Utah ......................... (D) (D) (D) (D) (D) (D) (D) (D) Virginia .................... (D) - (D) - (D) - (D) - Washington ............. (D) (D) (D) (D) (D) (D) (D) (D) West Virginia ........... (D) (D) (D) (D) (D) (D) (D) (D) Wisconsin ................ (D) 40 (D) 1 (D) 4 (D) 111 Other States 3 .......... 6,505 5,421 149 159 1,288 1,222 198 225
United States ........... 6,715 5,741 154 167 1,383 1,311 206 228
- Represents zero. (D) Withheld to avoid disclosing data for individual operations. 1 Due to rounding, total number of fish multiplied by the average pounds per unit may not exactly equal total live weight. 2 Due to rounding, total number or live weight multiplied by average value per unit may not exactly equal total sales. 3 Other States include State estimates not listed and States supressed due to disclosure.
NASS, Livestock Branch, (202) 720-3570.

XV–28 MISCELLANEOUS AGRICULTURAL STATISTICS
Table 15-29.—General storages: Gross and usable cooler and freezer space, by State and United States, October 1, 2019 1
State Cooler Freezer Total
Gross Usable Gross Usable Gross Usable
1,000 Cubic Feet
Alabama ................. 613 551 32,808 28,340 33,421 28,892 Alaska .................... (D) (D) (D) (D) (D) (D) Arizona ................... (D) (D) (D) (D) 4,103 3,487 Arkansas ................ 4,374 3,780 77,216 69,879 81,590 73,659 California ................ 70,357 53,929 318,953 265,346 389,310 319,275 Colorado .. ............. (D) (D) (D) (D) (D) (D) Connecticut ............ (D) (D) (D) (D) (D) (D) Delaware ................ (D) 3,241 (D) 15,151 25,033 18,392 Florida .................... 104,771 80,282 147,105 124,800 251,876 205,081 Georgia .................. 33,301 26,860 155,753 132,150 189,054 159,010 Hawaii .................... - - - - - - Idaho ...................... 7,006 5,830 58,358 48,570 65,365 54,400 Illinois ..................... 32,521 26,740 158,329 126,798 190,849 153,538 Indiana ................... (D) (D) (D) (D) 93,964 74,824 Iowa ....................... 12,146 9,504 58,526 49,986 70,673 59,490 Kansas ................... (D) (D) (D) (D) 41,639 33,042 Kentucky ................ 1,529 (D) 22,512 (D) 24,041 22,127 Louisiana ............... (D) (D) (D) (D) (D) (D) Maine ..................... (D) (D) (D) (D) 7,211 5,638 Maryland ................ (D) (D) (D) (D) (D) (D) Massachusetts ....... 9,494 7,201 49,977 41,296 59,471 48,497 Michigan ................ 6,912 5,632 82,258 67,135 89,170 72,767 Minnesota .............. 22,219 14,657 73,827 59,231 96,047 73,888 Mississippi ............. (D) (D) (D) (D) 13,556 11,386 Missouri ................. 27,330 22,249 63,978 55,135 91,308 77,385 Montana ................. (D) (D) (D) (D) (D) (D) Nebraska ............... 4,325 2,770 43,595 35,195 47,920 37,966 Nevada .................. (D) (D) (D) (D) (D) (D) New Hampshire ..... - - - - - - New Jersey ............ 49,632 38,109 87,698 72,773 137,331 110,882 New Mexico ........... (D) (D) (D) (D) 11,873 8,730 New York ............... 19,074 16,041 42,099 37,939 61,173 53,980 North Carolina ....... 4,453 3,376 58,511 46,693 62,964 50,069 North Dakota ......... (D) (D) (D) (D) 10,325 7,800 Ohio ....................... 6,700 6,179 47,264 39,003 53,963 45,182 Oklahoma .............. 716 (D) 8,824 (D) 9,540 7,330 Oregon ................... 6,102 3,968 134,530 107,026 140,633 110,994 Pennsylvania ......... 48,955 36,683 184,744 158,816 233,699 195,499 Rhode Island ......... - - - - - - South Carolina ....... (D) (D) (D) (D) 26,362 17,990 South Dakota ......... (D) (D) (D) (D) 11,627 6,279 Tennessee ............. (D) (D) (D) (D) 60,742 52,432 Texas ..................... 65,021 52,975 177,175 144,807 242,196 197,782 Utah ....................... 12,126 10,636 32,590 26,121 44,715 36,757 Vermont ................. (D) (D) (D) (D) 4,818 3,219 Virginia ................... 13,079 11,442 64,545 53,597 77,624 65,039 Washington ............ 13,085 10,914 268,557 210,979 281,642 221,893 West Virginia ......... (D) (D) (D) (D) (D) (D) Wisconsin .............. 113,286 83,501 133,879 115,974 247,166 199,475 Wyoming ................ - - - - - -
United States ......... 758,826 583,333 2,886,664 2,384,326 3,645,495 2,967,658
- Represents zero. (D) Withheld to avoid disclosing data for individual operations. 1 Totals may not add due to rounding. NASS, Livestock Branch, (202) 720–4751.
Table 15-30.—Refrigerated warehouses: Gross refrigerated space by type of warehouse, United States, biennially, October 2011–2019 1 2
Type 2011 2013 2015 2017 2019
1,000 Cubic Feet
General: Public .......................................... 3,028,243 3,076,959 3,138,463 2,834,824 2,683,640 Private and Semiprivate ............. 931,117 978,426 1,030,460 767,331 961,851
Total ............................................ 3,959,354 4,055,385 4,168,921 3,602,154 3,645,495
1 Warehouse space is defined as all space artificially cooled to temperatures of 50 degrees F. or less, in which food com-modities are normally held for 30 days or longer. 2 Totals may not add due to rounding.
NASS, Livestock Branch, (202) 720–4751.

XV–29 AGRICULTURAL STATISTICS 2020
Table 15-31.—Alaska crops: Acreage harvested, volume harvested, and value of production, 2010–2019
Year Oats for grain 1 Barley for grain All hay Potatoes 2
Acreage harvested
Acres Acres Acres Acres 2010 ..................... 800 4,200 20,000 750 2011 ..................... 1,000 4,800 19,000 720 2012 ..................... 900 4,300 22,000 650 2013 ..................... 400 3,300 20,000 620 2014 ..................... 1,000 5,100 18,000 620 2015 ..................... 1,000 4,300 18,000 540 2016 ..................... 1,200 4,700 22,000 530 2017 ..................... 900 5,200 21,000 540 2018 ..................... (NA) 4,000 22,000 500 2019 ..................... (NA) 5,000 22,000 (NA)
Volume harvested
Bushels Bushels Tons Cwt. 2010 ..................... 48,000 185,000 24,000 150,000 2011 ..................... 80,000 175,000 22,000 134,000 2012 ..................... 59,000 207,000 27,000 140,000 2013 ..................... 15,000 110,000 15,000 130,000 2014 ..................... 57,000 217,000 25,000 155,000 2015 ..................... 47,000 146,000 20,000 140,000 2016 ..................... 74,000 230,000 30,000 147,000 2017 ..................... 66,000 239,000 25,000 120,000 2018 ..................... (NA) 172,000 29,000 140,000 2019 ..................... (NA) 190,000 29,000 (NA)
Value of production
Dollars Dollars Dollars Dollars 2010 ..................... 161,000 814,000 7,320,000 3,570,000 2011 ..................... 276,000 788,000 6,600,000 3,176,000 2012 ..................... 212,000 1,107,000 8,505,000 3,864,000 2013 ..................... 56,000 594,000 5,925,000 3,055,000 2014 ..................... 211,000 1,183,000 9,625,000 3,395,000 2015 ..................... 179,000 796,000 7,400,000 2,884,000 2016 ..................... 274,000 1,208,000 10,200,000 3,308,000 2017 ..................... 241,000 1,255,000 9,000,000 3,446,000 2018 ..................... (NA) 894,000 10,295,000 3,276,000 2019 ..................... (NA) 988,000 10,150,000 (NA)
(NA) Not available. 1 Alaska removed from the National Oats Program in 2018. 2 Alaska removed from the National Po-tato Program in 2019.
NASS, Crops Branch, (202) 720–2127.

XV–30 MISCELLANEOUS AGRICULTURAL STATISTICS
Table 15-32.—Crop ranking: Major field crops, rank by production, major States, 2019
Rank State Corn, grain State Soybeans State All wheat
1,000 bushels 1,000 bushels 1,000 bushels 1 .... IA 2,583,900 IL 532,440 KS 338,000 2 .... IL 1,846,200 IA 501,600 ND 320,760 3 .... NE 1,785,420 MN 297,880 MT 219,265 4 .... MN 1,254,250 NE 283,140 WA 142,735 5 .... IN 814,580 IN 273,360 OK 110,000 6 .... KS 800,660 MO 230,460 ID 98,755 7 .... SD 557,280 OH 209,230 CO 98,000 8 .... MO 463,450 KS 186,335 MN 79,800 9 .... WI 443,220 ND 170,100 TX 69,700
10 .... OH 421,480 SD 146,200 SD 66,055 US 13,619,928 US 3,552,241 US 1,920,139
Rank State Winter wheat State Durum wheat State Other spring wheat
1,000 bushels 1,000 bushels 1,000 bushels 1 .... KS 338,000 ND 25,500 ND 291,550 2 .... WA 119,000 MT 22,145 MT 102,120 3 .... OK 110,000 AZ 3,432 MN 79,800 4 .... CO 98,000 CA 2,244 ID 39,160 5 .... MT 95,000 ID 435 SD 26,015 6 .... TX 69,700 ........................................ WA 23,735 7 .... ID 59,160 ........................................ ........................................8 .... NE 55,290 ........................................ ........................................9 .... OR 49,640 ........................................ ........................................
10 .... SD 40,040 ........................................ ........................................US 1,304,003 US 53,756 US 562,380
Rank State Sorghum, grain State Barley State Oats
1,000 bushels 1,000 bushels 1,000 bushels 1 .... KS 204,000 ID 54,080 ND 9,890 2 .... TX 85,400 MT 43,660 WI 6,480 3 .... SD 14,000 ND 32,040 MN 6,200 4 .... OK 13,260 CO 7,176 SD 6,150 5 .... CO 12,710 WY 7,062 IA 4,002 6 .... NE 12,090 WA 5,880 PA 2,650 7 .... ............................................ MN 3,685 NY 2,340 8 .... ............................................ CA 2,838 TX 2,000 9 .... ............................................ OR 2,418 ME 1,444
10 .... ............................................ AZ 1,764 MI 1,425 US 341,460 US 169,566 US 53,148
Rank State All cotton State Peanuts State Rice
1,000 bales 1,000 pounds 1,000 cwt. 1 .... TX 6,337 GA 2,752,200 AR 84,257 2 .... GA 2,740 FL 589,000 CA 41,933 3 .... MS 1,621 AL 522,600 LA 26,408 4 .... AR 1,506 TX 488,000 MO 12,747 5 .... NC 1,040 NC 448,800 TX 11,028 6 .... AL 1,028 SC 235,600 MS 8,302 7 .... TN 960 AR 171,600 8 .... MO 915 VA 111,600 9 .... CA 821 MS 76,000
10 .... OK 659 OK 56,000 US 19,913 US 5,466,487 US 184,675
Rank State All hay, baled State Alfalfa hay, baled State Other hay, baled
1,000 tons 1,000 tons 1,000 tons 1 .... TX 9,216 MT 4,515 TX 8,640 2 .... MO 7,367 SD 4,465 MO 6,665 3 .... SD 7,003 ID 4,444 OK 5,320 4 .... KS 6,315 CA 4,118 TN 4,025 5 .... MT 6,225 NE 3,610 KY 3,960 6 .... NE 6,085 CO 2,701 KS 3,795 7 .... OK 5,935 KS 2,520 AR 2,750 8 .... CA 5,795 IA 2,380 SD 2,538 9 .... ID 5,111 AZ 2,324 NE 2,475
10 .... KY 4,424 MN 2,263 VA 2,420 US 128,864 US 54,875 US 73,989
Rank State All tobacco State Dry edible beans State Potatoes
1,000 pounds 1,000 cwt. 1,000 cwt. 1 .... NC 234,700 ND 7,691 ID 130,900 2 .... KY 123,390 MN 4,101 WA 104,960 3 .... TN 30,490 MI 3,662 WI 28,700 4 .... VA 30,406 NE 1,883 OR 25,311 5 .... GA 18,900 ID 1,067 MI 20,370 6 .... SC 15,770 CA 729 CO 19,666 7 .... PA 14,300 WA 665 ND 19,430 8 .... ............................................ CO 623 MN 17,845 9 .... ............................................ WY 390 CA 16,842
10 .... ............................................ ........................................ ME 16,738 US 467,956 US 20,811 US 424,419
NASS, Crops Branch, (202) 720–2127.

XV–31 AGRICULTURAL STATISTICS 2020
Table 15-33.—U.S. crop progress: 2019 crop and 5-year average [In percent]
Week-end-ing date
Winter wheat
Planted Emerged Headed Harvested
2018 Avg 2018 Avg 2019 Avg 2019 Avg
2018: Sep 9 ...... 5 5 Sep 16 .... 13 14 Sep 23 .... 28 26 Sep 30 .... 43 40 14 14 Oct 7 ....... 57 54 30 28 Oct 14 ..... 65 67 44 41 Oct 21 ..... 72 77 53 55 Oct 28 ..... 78 85 63 67 Nov 4 ...... 84 90 70 77 Nov 11 .... 89 94 77 83 Nov 18 .... 93 97 81 88 Nov 25 .... 95 99 86 92
2019: Apr 7 ....... ................... ................. ................... ................. 3 4 Apr 14 ..... ................... ................. ................... ................. 6 9 Apr 21 ..... ................... ................. ................... ................. 9 18 Apr 28 ..... ................... ................. ................... ................. 19 29 May 5 ..... ................... ................. ................... ................. 29 41 May 12 ... ................... ................. ................... ................. 42 54 May 19 ... ................... ................. ................... ................. 54 66 May 26 ... ................... ................. ................... ................. 66 76 Jun 2 ...... ................... ................. ................... ................. 76 84 Jun 9 ...... ................... ................. ................... ................. 83 91 4 10 Jun 16 .... ................... ................. ................... ................. 89 95 8 20 Jun 23 .... ................... ................. ................... ................. 94 99 15 34 Jun 30 .... ................... ................. ................... ................. 97 100 30 48 Jul 7 ........ ................... ................. ................... ................. ................... ................. 47 61 Jul 14 ...... ................... ................. ................... ................. ................... ................. 57 71 Jul 21 ...... ................... ................. ................... ................. ................... ................. 69 79 Jul 28 ...... ................... ................. ................... ................. ................... ................. 75 86 Aug 4 ...... ................... ................. ................... ................. ................... ................. 82 92 Aug 11 .... ................... ................. ................... ................. ................... ................. 89 96 Aug 18 .... ................... ................. ................... ................. ................... ................. 93 98 Aug 25 .... ................... ................. ................... ................. ................... ................. 96 99
Week-end-ing date
Spring wheat
Planted Emerged Headed Harvested
2019 Avg 2019 Avg 2019 Avg 2019 Avg
2019: Apr 7 ....... 1 5 Apr 14 ..... 2 13 Apr 21 ..... 5 22 Apr 28 ..... 13 33 May 5 ..... 22 49 4 19 May 12 ... 45 67 10 34 May 19 ... 70 80 26 51 May 26 ... 84 91 47 69 Jun 2 ...... 93 96 69 84 Jun 9 ...... 97 99 85 93 Jun 16 .... .................. .................. 95 97 2 12 Jun 23 .... .................. .................. .................. .................. 7 29 Jun 30 .... .................. .................. .................. .................. 25 52 Jul 7 ........ .................. .................. .................. .................. 56 73 Jul 14 ...... .................. .................. .................. .................. 78 87 Jul 21 ...... .................. .................. .................. .................. 92 94 Jul 28 ...... .................. .................. .................. .................. 97 98 Aug 4 ...... .................. .................. .................. .................. .................. .................. 2 14 Aug 11 .... .................. .................. .................. .................. .................. .................. 8 30 Aug 18 .... .................. .................. .................. .................. .................. .................. 16 49 Aug 25 .... .................. .................. .................. .................. .................. .................. 38 65 Sep 1 ...... .................. .................. .................. .................. .................. .................. 55 78 Sep 8 ...... .................. .................. .................. .................. .................. .................. 71 87 Sep 15 .... .................. .................. .................. .................. .................. .................. 76 93 Sep 22 .... .................. .................. .................. .................. .................. .................. 87 97 Sep 29 .... .................. .................. .................. .................. .................. .................. 90 99 Oct 6 ....... .................. .................. .................. .................. .................. .................. 91 99 Oct 13 ..... .................. .................. .................. .................. .................. .................. 94 100 Oct 20 ..... .................. .................. .................. .................. .................. .................. 96 100
See footnote(s) at end of table.

XV–32 MISCELLANEOUS AGRICULTURAL STATISTICS
Table 15-33.—U.S. crop progress: 2019 crop and 5-year average—Continued [In percent]
Week-ending date
Rice
Planted Emerged Headed Harvested
2019 Avg 2019 Avg 2019 Avg 2019 Avg
2019: Mar 31 ....... 12 12 2 3 Apr 7 .......... 19 21 7 8 Apr 14 ........ 26 35 13 15 Apr 21 ........ 31 47 18 25 Apr 28 ........ 38 57 27 37 May 5 ......... 48 69 35 50 May 12 ....... 55 82 42 63 May 19 ....... 73 90 52 75 May 26 ....... 84 96 63 83 Jun 2 .......... 91 98 76 91 Jun 9 .......... 96 99 87 96 Jun 16 ........ .................. .................. 94 99 Jun 23 ........ .................. .................. 97 100 5 8 Jun 30 ........ .................. .................. .................. .................. 10 15 Jul 7 ........... .................. .................. .................. .................. 16 22 Jul 14 ......... .................. .................. .................. .................. 24 31 Jul 21 ......... .................. .................. .................. .................. 31 43 Jul 28 ......... .................. .................. .................. .................. 42 57 Aug 4 ......... .................. .................. .................. .................. 60 73 Aug 11 ....... .................. .................. .................. .................. 76 85 7 9 Aug 18 ....... .................. .................. .................. .................. 88 93 10 13 Aug 25 ....... .................. .................. .................. .................. 96 97 15 18 Sep 1 ......... .................. .................. .................. .................. .................. .................. 21 27 Sep 8 ......... .................. .................. .................. .................. .................. .................. 30 37 Sep 15 ....... .................. .................. .................. .................. .................. .................. 46 48 Sep 22 ....... .................. .................. .................. .................. .................. .................. 58 61 Sep 29 ....... .................. .................. .................. .................. .................. .................. 68 71 Oct 6 .......... .................. .................. .................. .................. .................. .................. 76 80 Oct 13 ........ .................. .................. .................. .................. .................. .................. 87 88 Oct 20 ........ .................. .................. .................. .................. .................. .................. 93 94 Oct 27 ........ .................. .................. .................. .................. .................. .................. 97 98
Week-ending date
Corn
Planted Emerged Silking Dough Dented Mature Harvested
2019 Avg 2019 Avg 2019 Avg 2019 Avg 2019 Avg 2019 Avg 2019 Avg
2019: Apr 7 ....... 2 2 Apr 14 ..... 3 5 Apr 21 ..... 6 12 Apr 28 ..... 15 27 3 5 May 5 ...... 23 46 6 13 May 12 .... 30 66 10 29 May 19 .... 49 80 19 49 May 26 .... 58 90 32 69 Jun 2 ....... 67 96 46 84 Jun 9 ....... 83 99 62 93 Jun 16 ..... 92 100 79 97 Jun 23 ..... 96 100 89 99 Jun 30 ..... ........ ........ 94 100 Jul 7 ........ ........ ........ 98 100 8 22 Jul 14 ...... ........ ........ ........ ........ 17 42 Jul 21 ...... ........ ........ ........ ........ 35 66 5 10 Jul 28 ...... ........ ........ ........ ........ 58 83 13 23 Aug 4 ....... ........ ........ ........ ........ 78 93 23 42 Aug 11 ..... ........ ........ ........ ........ 90 97 39 61 7 16 Aug 18 ..... ........ ........ ........ ........ 95 99 55 76 15 30 Aug 25 ..... ........ ........ ........ ........ ........ ........ 71 87 27 46 Sep 1 ....... ........ ........ ........ ........ ........ ........ 81 93 41 63 6 13 Sep 8 ....... ........ ........ ........ ........ ........ ........ 89 97 55 77 11 24 Sep 15 ..... ........ ........ ........ ........ ........ ........ 93 98 68 87 18 39 4 7 Sep 22 ..... ........ ........ ........ ........ ........ ........ 96 100 79 94 29 57 7 11 Sep 29 ..... ........ ........ ........ ........ ........ ........ ........ ........ 88 98 43 73 11 19 Oct 6 ....... ........ ........ ........ ........ ........ ........ ........ ........ 93 99 58 85 15 27 Oct 13 ..... ........ ........ ........ ........ ........ ........ ........ ........ 96 100 73 92 22 36 Oct 20 ..... ........ ........ ........ ........ ........ ........ ........ ........ ........ ........ 86 97 30 47 Oct 27 ..... ........ ........ ........ ........ ........ ........ ........ ........ ........ ........ 93 99 41 61 Nov 3 ....... ........ ........ ........ ........ ........ ........ ........ ........ ........ ........ 96 100 52 75 Nov 10 ..... ........ ........ ........ ........ ........ ........ ........ ........ ........ ........ ........ ........ 66 85 Nov 17 ..... ........ ........ ........ ........ ........ ........ ........ ........ ........ ........ ........ ........ 76 92 Nov 24 ..... ........ ........ ........ ........ ........ ........ ........ ........ ........ ........ ........ ........ 84 96 Dec 1 ....... ........ ........ ........ ........ ........ ........ ........ ........ ........ ........ ........ ........ 89 98 Dec 8 ....... ........ ........ ........ ........ ........ ........ ........ ........ ........ ........ ........ ........ 92 100
See footnote(s) at end of table.

XV–33 AGRICULTURAL STATISTICS 2020
Table 15-33.—U.S. crop progress: 2019 crop and 5-year average—Continued [In percent]
Week-ending date
Sorghum
Planted Headed Coloring Mature Harvested
2019 Avg 2019 Avg 2019 Avg 2019 Avg 2019 Avg
2019: Mar 31 ....... 13 9 Apr 7 .......... 14 14 Apr 14 ........ 16 19 Apr 21 ........ 17 22 Apr 28 ........ 20 25 May 5 ......... 22 29 May 12 ....... 24 33 May 19 ....... 26 38 May 26 ....... 28 44 Jun 2 .......... 35 53 Jun 9 .......... 49 68 14 12 Jun 16 ........ 69 81 15 16 Jun 23 ........ 84 91 17 20 Jun 30 ........ 94 96 20 23 Jul 7 ........... 97 99 22 26 13 16 Jul 14 ......... ............ ............ 24 31 14 19 Jul 21 ......... ............ ............ 27 40 16 22 Jul 28 ......... ............ ............ 33 50 21 25 Aug 4 ......... ............ ............ 45 62 23 30 Aug 11 ....... ............ ............ 61 74 26 35 19 23 Aug 18 ....... ............ ............ 75 83 31 43 21 26 Aug 25 ....... ............ ............ 86 90 41 52 22 30 20 20 Sep 1 ......... ............ ............ 92 95 52 64 24 33 21 22 Sep 8 ......... ............ ............ 97 98 65 74 27 37 22 24 Sep 15 ....... ............ ............ .............. .............. 79 84 34 44 24 27 Sep 22 ....... ............ ............ .............. .............. 90 90 42 53 26 31 Sep 29 ....... ............ ............ .............. .............. 95 95 54 63 30 35 Oct 6 .......... ............ ............ .............. .............. .............. .............. 65 73 33 40 Oct 13 ........ ............ ............ .............. .............. .............. .............. 81 82 40 46 Oct 20 ........ ............ ............ .............. .............. .............. .............. 92 89 49 53 Oct 27 ........ ............ ............ .............. .............. .............. .............. 96 94 65 62 Nov 3 ......... ............ ............ .............. .............. .............. .............. .............. .............. 78 72 Nov 10 ....... ............ ............ .............. .............. .............. .............. .............. .............. 88 80 Nov 17 ....... ............ ............ .............. .............. .............. .............. .............. .............. 93 87 Nov 24 ....... ............ ............ .............. .............. .............. .............. .............. .............. 97 92
Week-ending date
Soybeans
Planted Emerged Blooming Setting Pods Dropping Leaves Harvested
2019 Avg 2019 Avg 2019 Avg 2019 Avg 2019 Avg 2019 Avg
2019: Apr 21 ...... 1 2 Apr 28 ...... 3 6 May 5 ....... 6 14 May 12 ..... 9 29 May 19 ..... 19 47 5 17 May 26 ..... 29 66 11 35 Jun 2 ........ 39 79 19 56 Jun 9 ........ 60 88 34 73 Jun 16 ...... 77 93 55 84 Jun 23 ...... 85 97 71 91 Jun 30 ...... 92 99 83 95 Jul 7 ......... 96 99 90 98 10 32 Jul 14 ....... ........... .......... 95 99 22 49 Jul 21 ....... ........... .......... ........... .......... 40 66 7 28 Jul 28 ....... ........... .......... ........... .......... 57 79 21 45 Aug 4 ....... ........... .......... ........... .......... 72 87 37 63 Aug 11 ..... ........... .......... ........... .......... 82 93 54 76 Aug 18 ..... ........... .......... ........... .......... 90 96 68 85 Aug 25 ..... ........... .......... ........... .......... 94 99 79 91 Sep 1 ....... ........... .......... ........... .......... 96 100 86 96 Sep 8 ....... ........... .......... ........... .......... ........... .......... 92 99 Sep 15 ..... ........... .......... ........... .......... ........... .......... 95 100 15 38 Sep 22 ..... ........... .......... ........... .......... ........... .......... ........... .......... 34 59 Sep 29 ..... ........... .......... ........... .......... ........... .......... ........... .......... 55 76 7 20 Oct 6 ........ ........... .......... ........... .......... ........... .......... ........... .......... 72 87 14 34 Oct 13 ...... ........... .......... ........... .......... ........... .......... ........... .......... 85 93 26 49 Oct 20 ...... ........... .......... ........... .......... ........... .......... ........... .......... 94 97 46 64 Oct 27 ...... ........... .......... ........... .......... ........... .......... ........... .......... 97 99 62 78 Nov 3 ....... ........... .......... ........... .......... ........... .......... ........... .......... ........... .......... 75 87 Nov 10 ..... ........... .......... ........... .......... ........... .......... ........... .......... ........... .......... 85 92 Nov 17 ..... ........... .......... ........... .......... ........... .......... ........... .......... ........... .......... 91 95 Nov 24 ..... ........... .......... ........... .......... ........... .......... ........... .......... ........... .......... 94 97 Dec 1 ....... ........... .......... ........... .......... ........... .......... ........... .......... ........... .......... 96 99
See footnote(s) at end of table.

XV–34 MISCELLANEOUS AGRICULTURAL STATISTICS
Table 15-33.—U.S. crop progress: 2019 crop and 5-year average—Continued [In percent]
Week-ending date
Cotton, Upland
Planted Squaring Setting Bolls Bolls Opening Harvested
2019 Avg 2019 Avg 2019 Avg 2019 Avg 2019 Avg
2019: Mar 31 ..... 4 3 Apr 7 ........ 6 5 Apr 14 ...... 7 7 Apr 21 ...... 9 9 Apr 28 ...... 11 13 May 5 ....... 18 19 May 12 ..... 26 32 May 19 ..... 44 45 May 26 ..... 57 58 Jun 2 ........ 71 72 8 7 Jun 9 ........ 75 87 11 11 Jun 16 ...... 89 94 19 18 Jun 23 ...... 96 98 30 28 3 5 Jun 30 ...... .............. ............. 37 39 7 9 Jul 7 ......... .............. ............. 47 54 13 16 Jul 14 ....... .............. ............. 60 69 20 25 Jul 21 ....... .............. ............. 78 80 33 37 Jul 28 ....... .............. ............. 86 87 45 48 Aug 4 ....... .............. ............. 95 93 59 61 Aug 11 ..... .............. ............. .............. ............. 77 76 20 10 Aug 18 ..... .............. ............. .............. ............. 85 85 24 13 Aug 25 ..... .............. ............. .............. ............. 90 91 28 19 Sep 1 ....... .............. ............. .............. ............. 97 96 36 27 Sep 8 ....... .............. ............. .............. ............. .............. ............. 43 37 7 6 Sep 15 ..... .............. ............. .............. ............. .............. ............. 54 47 9 8 Sep 22 ..... .............. ............. .............. ............. .............. ............. 64 57 11 11 Sep 29 ..... .............. ............. .............. ............. .............. ............. 77 67 16 14 Oct 6 ........ .............. ............. .............. ............. .............. ............. 83 75 25 20 Oct 13 ...... .............. ............. .............. ............. .............. ............. 87 83 32 27 Oct 20 ...... .............. ............. .............. ............. .............. ............. 93 89 40 35 Oct 27 ...... .............. ............. .............. ............. .............. ............. 95 93 46 43 Nov 3 ....... .............. ............. .............. ............. .............. ............. .............. ............. 53 51 Nov 10 ..... .............. ............. .............. ............. .............. ............. .............. ............. 62 59 Nov 17 ..... .............. ............. .............. ............. .............. ............. .............. ............. 68 66 Nov 24 ..... .............. ............. .............. ............. .............. ............. .............. ............. 78 74 Dec 1 ....... .............. ............. .............. ............. .............. ............. .............. ............. 83 81 Dec 8 ....... .............. ............. .............. ............. .............. ............. .............. ............. 89 .............
Week-ending date
Barley Oats
Planted Emerged Headed Harvested Planted Emerged Headed Harvested
2019 Avg 2019 Avg 2019 Avg 2019 Avg 2019 Avg 2019 Avg 2019 Avg 2019 Avg
2019: Mar 31 ..... ........ ...... ........ ...... ........ ...... ........ ...... 25 25 25 23 Apr 7 ....... 2 9 ........ ...... ........ ...... ........ ...... 27 32 25 26 Apr 14 ..... 8 19 ........ ...... ........ ...... ........ ...... 30 40 26 28 Apr 21 ..... 17 29 2 7 ........ ...... ........ ...... 36 51 27 33 Apr 28 ..... 28 41 6 15 ........ ...... ........ ...... 43 61 31 41 May 5 ...... 37 56 12 27 ........ ...... ........ ...... 50 72 36 51 May 12 .... 59 72 25 42 ........ ...... ........ ...... 62 83 43 64 May 19 .... 76 84 39 57 ........ ...... ........ ...... 77 90 53 76 May 26 .... 87 93 54 74 ........ ...... ........ ...... 85 96 65 86 Jun 2 ....... 94 97 73 85 ........ ...... ........ ...... 91 98 77 93 23 33 Jun 9 ....... 97 99 86 92 ........ ...... ........ ...... 96 99 87 97 28 41 Jun 16 ..... ........ ...... 92 96 2 12 ........ ...... ........ ...... 94 99 33 54 Jun 23 ..... ........ ...... 97 99 9 30 ........ ...... ........ ...... 97 100 43 68 Jun 30 ..... ........ ...... ........ ...... 31 52 ........ ...... ........ ...... ........ ...... 58 81 Jul 7 ........ ........ ...... ........ ...... 55 75 ........ ...... ........ ...... ........ ...... 74 90 Jul 14 ...... ........ ...... ........ ...... 75 89 ........ ...... ........ ...... ........ ...... 87 95 Jul 21 ...... ........ ...... ........ ...... 90 95 ........ ...... ........ ...... ........ ...... 94 98 12 22 Jul 28 ...... ........ ...... ........ ...... 96 98 ........ ...... ........ ...... ........ ...... 97 100 21 35 Aug 4 ....... ........ ...... ........ ...... ........ ...... 3 18 ........ ...... ........ ...... ........ ...... 32 49 Aug 11 ..... ........ ...... ........ ...... ........ ...... 15 39 ........ ...... ........ ...... ........ ...... 48 64 Aug 18 ..... ........ ...... ........ ...... ........ ...... 31 59 ........ ...... ........ ...... ........ ...... 60 78 Aug 25 ..... ........ ...... ........ ...... ........ ...... 54 74 ........ ...... ........ ...... ........ ...... 75 86 Sep 1 ....... ........ ...... ........ ...... ........ ...... 72 83 ........ ...... ........ ...... ........ ...... 84 91 Sep 8 ....... ........ ...... ........ ...... ........ ...... 82 92 ........ ...... ........ ...... ........ ...... 89 95 Sep 15 ..... ........ ...... ........ ...... ........ ...... 87 96 ........ ...... ........ ...... ........ ...... 92 97 Sep 22 ..... ........ ...... ........ ...... ........ ...... 92 99 ........ ...... ........ ...... ........ ...... 96 99 Sep 29 ..... ........ ...... ........ ...... ........ ...... 96 100
See footnote(s) at end of table.

XV–35 AGRICULTURAL STATISTICS 2020
Table 15-33.—U.S. crop progress: 2019 crop and 5-year average—Continued [In percent]
Week-ending date
Sugarbeets Sunflower
Planted Harvested Planted Harvested
2019 Avg 2019 Avg 2019 Avg 2019 Avg
2019: Apr 7 .......... 3 3 Apr 14 ........ 8 16 Apr 21 ........ 14 34 Apr 28 ........ 25 48 May 5 ......... 31 67 May 12 ....... 63 80 May 19 ....... 90 89 .................. .................. 3 12 May 26 ....... 94 97 .................. .................. 9 27 Jun 2 .......... 97 100 .................. .................. 19 44 Jun 9 .......... .................. .................. .................. .................. 42 65 Jun 16 ........ .................. .................. .................. .................. 68 80 Jun 23 ........ .................. .................. .................. .................. 85 89 Jun 30 ........ .................. .................. .................. .................. 95 95 Sep 15 ....... .................. .................. 8 9 .................. ..................Sep 22 ....... .................. .................. 11 13 .................. ..................Sep 29 ....... .................. .................. 16 20 .................. ..................Oct 6 .......... .................. .................. 19 40 .................. .................. 1 5 Oct 13 ........ .................. .................. 30 60 .................. .................. 5 13 Oct 20 ........ .................. .................. 42 73 .................. .................. 9 27 Oct 27 ........ .................. .................. 58 84 .................. .................. 17 45 Nov 3 ......... .................. .................. 70 91 .................. .................. 31 62 Nov 10 ....... .................. .................. 96 96 .................. .................. 44 75 Nov 17 ....... .................. .................. .................. .................. .................. .................. 47 83 Nov 24 ....... .................. .................. .................. .................. .................. .................. 56 89 Dec 1 ......... .................. .................. .................. .................. .................. .................. 65 94 Dec 8 ......... .................. .................. .................. .................. .................. .................. 73 ..................
Week-ending date
Peanuts
Planted Pegging Harvested
2019 Avg 2019 Avg 2019 Avg
2019: Apr 21 ................ 2 3 Apr 28 ................ 8 8 May 5 ................. 22 19 May 12 ............... 40 36 May 19 ............... 63 55 May 26 ............... 79 72 Jun 2 .................. 86 85 Jun 9 .................. 91 93 Jun 16 ................ 94 97 16 10 Jun 23 ................ 97 99 34 24 Jun 30 ................ ........................ ........................ 47 38 Jul 7 ................... ........................ ........................ 58 53 Jul 14 ................. ........................ ........................ 67 66 Jul 21 ................. ........................ ........................ 78 77 Jul 28 ................. ........................ ........................ 84 85 Aug 4 .................. ........................ ........................ 92 91 Aug 11 ................ ........................ ........................ 96 95 Sep 15 ................ ........................ ........................ ........................ ........................ 5 5 Sep 22 ................ ........................ ........................ ........................ ........................ 14 10 Sep 29 ................ ........................ ........................ ........................ ........................ 26 19 Oct 6 .................. ........................ ........................ ........................ ........................ 41 30 Oct 13 ................ ........................ ........................ ........................ ........................ 55 42 Oct 20 ................ ........................ ........................ ........................ ........................ 67 55 Oct 27 ................ ........................ ........................ ........................ ........................ 77 67 Nov 3 .................. ........................ ........................ ........................ ........................ 84 78 Nov 10 ................ ........................ ........................ ........................ ........................ 89 85 Nov 17 ................ ........................ ........................ ........................ ........................ 93 90 Nov 24 ................ ........................ ........................ ........................ ........................ 96 94
NASS, Crops Branch, (202) 720–2127.

APPENDIX–1
Appendix I
Telephone Contact List
Appreciation is expressed to the following agencies for their help in this publication. The informa-tion offices are listed to provide help to those users who require additional information about specific tables in this publication.
Agricultural Marketing Service: USDA/AMS Room 2619 South Bldg. Washington, DC 20250 202–720–8998
Agricultural Research Service: USDA/ARS 5601 Sunnyside Ave Bldg 1, Rm 2251 Beltsville, MD 20705–5128 301–504–1636
Animal and Plant Health Inspection Service: USDA/APHIS 4700 River Rd Riverdale, MD 20737 301–851–4100
Center for Nutrition Policy and Promotion: USDA/CNPP 3101 Park Center Drive Alexandria, VA 22302 703–305–7600
Economic Research Service: USDA/ERS 355 E Street, S.W. Washington, DC 20024-3221 202–694–5050
Farm Credit Administration: FCA 1501 Farm Credit Dr. McLean, VA 22102 703–883–4056
Farm Service Agency: USDA/FSA Room 4078 South Bldg. Washington, DC 20250 202–720–7163
Food and Nutrition Service: USDA/FNS 3101 Park Center Drive, Room 914 Alexandria, VA 22302 703–305–2062
Foreign Agricultural Service: USDA/FAS Room 5076 South Bldg. Washington, DC 20250 202–720–7115
Forest Service: USDA/FS 2nd Floor Central Wing, Yates Bldg. Washington, DC 20250 202–205–8333
National Agricultural Statistics Service: USDA/NASS Room 5038 South Bldg. Washington, DC 20250 202–720–3878
National Marine Fisheries Service: USDC/NOAA/NMFS 1315 East/West Highway, SSMC III - Room 12405 Silver Spring, MD 20910–3282 301–427–8103
Natural Resources Conservation Service: USDA/NRCS Room 6121 South Bldg. Washington, DC 20250 202–720–2182
Risk Management Agency: USDA/RMA Room 403 Kansas City, MO 64133-4675 816–926–1805
Rural Business-Cooperatives Service: USDA/RECD/RBS Room 4801 South Bldg. Washington, DC 20250 202–720–1019
Rural Utilities Service: USDA/RD/RUS Stop 1510, Room 5135 1400 Independence Avenue, SW Washington, DC 20250 202–720–9540

INDEX–1
INDEX Page
Agricultural commodity support prices.............................IX–37-38 Agricultural conservation program
See Conservation, Soil conservation, and water conservation.
Agricultural loans, See Loans. Agricultural production:
Index numbers ............................................IX–19, 27, 28, 33–35 Agricultural productivity................................IX–19, 22, 24, 26, 28 Agricultural exports: value......................................XV–2–6, 10–12 Agricultural imports: value .................................XV–2, 7–9, 13–14
See also Commodities, agricultural. Alaska crop statistics .............................................................XV–31
See also under specific commodities. Alfalfa:
Forage: area, yield, and production ......................................VI–7 Haylage and greenchop: area, yield, and production...........VI–9 Meal:
Disappearance for feed ......................................................I–41 Average price per ton-bulk ................................................I–45
Mixtures: area, yield, and production...................................VI–2 Almonds:
Bearing acreage........................................................V–42, IX–23 Imports and exports ..............................................................V–42 Price per pound.....................................................................V–42 Production.................................................................V–42, IX–24 Value.........................................................................V–42, IX–24 Yield .........................................................................V–42, IX–23
Animal proteins, disappearance for feed...................................I–41 Feed concentrates ...................................................................I–42
Animal units fed on farms.........................................................I–42 Animal units fed:
Grain consumption .................................................................I–43 Roughage consumption ..........................................................I–43 Grain and roughage consumption..........................................I–43
Apples: Area ............................................................................V–1, IX–23 Area, specified countries..................................................V–4, 32 Cold-storage stocks...............................................................V–61 Foreign trade: exports, imports ..............................................V–8 Price ........................................................................................V–3 Production, specified countries ........................................V–4, 32 Production, US .......................................................V–2–5, IX–24 Shipments..............................................................................V–39 Storages ..............................................................................XV–29 Utilization:
Fresh, canned, dried, frozen, juice, cider .......................V–4-5 Value...........................................................................V–3, IX–24 Yield ....................................................................................IX–23
Apricots: Area.........................................................................................V–1 Bearing acreage ...................................................................IX–23 Cold storage ..........................................................................V–61 Dried:
Exports ................................................................................V–7 Production .........................................................................V–40
Foreign trade, exports: Fresh, canned, dried............................................................V–9
Price, marketing year average ................................................V–8 Production ..........................................................V–2, 8–9, IX–24 Shipments..............................................................................V–39 Utilization................................................................................V–7 Value...........................................................................V–8, IX–24 Yield ....................................................................................IX–23
Artichokes: Area harvested ..........................................................IV–3, IX–29 Price .....................................................................................IX–33 Production .................................................................IV–3, IX–30 Shipments ............................................................................IV–35 Value .........................................................................IV–3, IX–30 Yield..........................................................................IV–3, IX–29
Asparagus: Area .......................................................................IV–3–4, IX–29 Cold storage.........................................................................IV–40 Per capita utilization:
Canning............................................................................IV–39 Fresh ................................................................................IV–38 Freezing ...........................................................................IV–39
Price.......................................................................IV–3–4, IX–33 Production .............................................................IV–3–4, IX–30 Shipments ............................................................................IV–35 Value .....................................................................IV–6–7, IX–26 Yield..........................................................................IV–3, IX–29
Avocados: Bearing acreage ...................................................................IX–23 Foreign trade, imports ..........................................................V–10 Price, marketing year average ..............................................V–10 Production ............................................................V–2, 10, IX–24 Shipments..............................................................................V–39 Value ..................................................................V–10, 35, IX–24 Yield ....................................................................................IX–23
Page Bananas:
Area harvested ......................................................................V–11 Bearing acreage ...................................................................IX–23 Prices.....................................................................................V–11 Production ............................................................V–2, 11, IX–24 Value.........................................................................V–11, IX–24 Yield .........................................................................V–11, IX–23
Barley: Area............................................................................I–35, IX–21 Consumption...........................................................................I–39 Crop progress.....................................................................XV–34 Crop ranking ......................................................................XV–30 Disappearance.........................................................................I–35 Exports....................................................................................I–35 Feed concentrates ...................................................................I–45 Fertilizer usage ...............................................................XIV–1, 3 Imports....................................................................................I–35 Prices:
Marketing year average ...............................................I–35, 37 Support operations..............................................................I–37
Pesticide usage....................................................................XIV–2 Production ............................................................I–32–34, IX–22 Stocks on and off farms.........................................................I–35 Supply.....................................................................................I–35 Trade, international ................................................................I–38 Value .......................................................................I–35,7, IX–22 Yield...........................................................................I–35, IX–21
Barrows and gilts, slaughtered ..............................................VII–21 Beans:
Dry edible: Area ...............................................................VI–10–11, IX–21 Crop ranking ..................................................................XV–34 Exports.............................................................................VI–12 Prices..........................................................................VI–11–12 Production .....................................................VI–10–11, IX–22 Value ...................................................................VI–11, IX–22 Yield..............................................................VI–10–11, IX–21
Fresh, shipments..................................................................IV–35 Lima:
Area .......................................................................IV–7, IX–25 Cold storage.....................................................................IV–40 Consumption....................................................................IV–35 Price ...................................................................................IV–7 Processing .............................................................IV–7, IX–26 Production........................................................................IX–26 Value................................................................................IX–26 Yield ................................................................................IX–25
Snap, fresh market and processing: Area .......................................................................IV–5, IX–29 Per capita availability:
Canning........................................................................IV–39 Freezing .......................................................................IV–39 Fresh ............................................................................IV–38
Prices................................................................................IX–33 Production .............................................................IV–5, IX–30 Value .....................................................................IV–5, IX–30 Yield ................................................................................IX–29
Beef: Cold storage holdings ..................................................VII–57–58 Consumption ......................................................................VII–49 Feed consumed per head and unit .........................................I–43 Production ....................................................................VII–40, 49
Beef and veal: Exports.............................................................VII–40, 41, 45, 46 Imports................................................................................VII–46 Production, specified countries..........................................VII–40 See also Meats, and Veal.
Berries: Acreage.......................................................................V–1, IX–23 Cold storage ....................................................................V–56–57 Frozen pack...........................................................................V–35 Production...................................................................V–2, IX–24 Value....................................................................................IX–24 Yield ....................................................................................IX–23
Blackberries: Cold Storage .........................................................................V–56 Frozen pack...........................................................................V–35
Blackstrap molasses: Average price per ton, bulk ...................................................I–45
Blueberries: Cold Storage .........................................................................V–56 Frozen pack...........................................................................V–35 Shipments..............................................................................V–34
Boars, slaughtered..................................................................VII–21 Boysenberries:
Cold Storage .........................................................................V–57 Frozen pack...........................................................................V–35
Breakfast Program ..................................................................XIII–8 Brewers’ dried grains:
Average price per ton, bulk ...................................................I–45 Broccoli:
Area ...........................................................................IV–6, IX–29 Cold Storage ........................................................................IV–40

INDEXINDEX–2 Page
Broccoli—Continued Per capita utilization:
Freezing ...........................................................................IV–39 Fresh ................................................................................IV–38
Prices ...................................................................................IX–33 Production .................................................................IV–6, IX–30 Shipments ............................................................................IV–35 Value .........................................................................IV–6, IX–30 Yield..........................................................................IV–6, IX–29
Broilers: Production...................................................................VIII–30, 31 Feed consumed per head and unit .........................................I–42 Feed-price ratio.................................................................VIII–31 International trade.............................................................VIII–30 Value...........................................................................VIII–30, 31
Brussels sprouts: Cold storage holdings.................................IV–39 Buildings, farm, value of ..........................................................IX–8 Bulls:
Addressed weight under Federal inspection .....................VII–12 Number, Jan. 1.................................................................VII–1, 4 Slaughtered under Federal inspection ...............................VII–11
Butter: Consumption.........................................................III–30, VIII–18 Cold-storage holdings.......................................................VIII–41 Manufactured ....................................................................VIII–16 Production .........................................................................VIII–17 Production in specified countries .....................................VIII–19 Disappearance ...................................................................VIII–18 Exports ..............................................................................VIII–24 Imports ..............................................................................VIII–22 Price per pound.................................................................VIII–17 Stocks on hand, Dec. 31 ..................................................VIII–19
Cabbage: Area .......................................................................IV–7, IX–29 Per capita utilization........................................................IV–38 Price.......................................................................IV–7, IX–33 Production .............................................................IV–7, IX–30
Shipments ............................................................................IV–35 Value .........................................................................IV–7, IX–30 Yield........................................................................IV–10, IX–29
Cacao butter. See Cocoa butter. Caloric sweeteners:
Per capita consumption.........................................................II–17 Canola:
Area and yield .....................................................................IX–21 Canola oil: wholesale price per pound ...................................III–30 Canola oilseed: Production and value ....................................IX–22 Cantaloupes:
Area ...........................................................................IV–8, IX–29 Price............................................................................IV–8 IX–33 Production .................................................................IV–8, IX–30 Shipments ............................................................................IV–37 Value .........................................................................IV–8, IX–30 Yield..........................................................................IV–8, IX–29 See also Melons.
Carrots: fresh market, processing Area ...........................................................................IV–9, IX–29 Cold storage.........................................................................IV–40 Per capita utilization:
Canning............................................................................IV–39 Freezing ...........................................................................IV–39 Fresh ................................................................................IV–38
Price .......................................................................................IV–9 Production .................................................................IV–9, IX–30 Shipments ............................................................................IV–35 Value .........................................................................IV–9, IX–30 Yield ....................................................................................IX–29
Casein: Imports ..............................................................................VIII–23
Cash rents: Rents, cropland, and pasture ...............................................IX–14
Castor oil, wholesale price per pound ....................................III–31 Catfish:
Farm-raised ........................................................................XV–24 Operations ..........................................................................XV–25 Production ..........................................................................XV–25 Sales ...................................................................................XV–26
Cattle and calves: Average dressed weight...............................................VII–11, 12 Calves born ..........................................................................VII–5 Carcasses condemned ........................................................VII–55
Page Cattle and calves—Continued
Hides: Exports............................................................................VII–51 Imports............................................................................VII–50 Price per pound ..............................................................VII–49
Income............................................................................VII–7, 10 Inventory .......................................................VII–1, 2, 11–12, 55 Number, by class .........................................................VII–1, 3–4 On feed.............................................................................VII–5–6 Operations......................................................VII–1–2, 11–12, 54 Prices..........................................................................VII–6–7, 56 Production ...........................................................VII–6, 7, 10, 16 Receipts ................................................................................VII–8 Skins ...............................................................................VII–8–11 Slaughtered...............................................................VII–8–11, 55 Value....................................................................VII–1–2, 10, 55
Cauliflower: Area .........................................................................IV–10, IX–29 Per capita utilization:
Freezing ...........................................................................IV–39 Fresh ................................................................................IV–38
Cold storage.........................................................................IV–40 Prices ...................................................................................IV–10 Production ...............................................................IV–10, IX–30 Shipments ............................................................................IV–35 Value .......................................................................IV–10, IX–30 Yield........................................................................IV–10, IX–29
Celery: Area .........................................................................IV–11, IX–29 Per capita availability..........................................................IV–38 Prices ...................................................................................IV–11 Production ...............................................................IV–11, IX–30 Shipments ............................................................................IV–35 Value .......................................................................IV–11, IX–30 Yield........................................................................IV–11, IX–29
Cheese: Cold-storage holdings.......................................................VIII–41 Consumption .....................................................................VIII–18 Disappearance ...................................................................VIII–18 Exports ..............................................................................VIII–25 Foreign production............................................................VIII–19 Imports.........................................................................VIII–20-21 Manufactured ....................................................................VIII–16 Price per pound.................................................................VIII–17 Production .........................................................................VIII–17 Stocks on hand, Dec. 31 ............................................VIII–18, 19
Cherries: Foreign trade: exports, imports ............................................V–11 Fresh sweet and sour:
Area and production in specified countries .....................V–32 Cherries, organic:
Shipments ............................................................................IX–39 Cherries, sweet:
Bearing acreage ...................................................................IX–23 Juice: cold storage holdings .................................................V–61 Price .................................................................................V–12-13 Production ...................................................................V–2, 12-15 Shipments..............................................................................V–39 Utilization ........................................................................V–12-15 Value.........................................................................V–12, IX–24 Yield ....................................................................................IX–23
Cherries, tart: Bearing acreage ...................................................................IX–23 Juice: cold storage holdings .................................................V–61 Price .................................................................................V–12-13 Production ...................................................................V–2, 12-15 Value .....................................................................................V–12 Shipments..............................................................................V–39 Utilization ........................................................................V–12-15 Yield ....................................................................................IX–23
Chickens: Broiler production and value............................................VIII–30 Cold storage stocks .....................................................VIII–37-38 Consumption .....................................................................VIII–29 Exports ..............................................................................VIII–29 Feed consumed per head and unit .........................................I–43 Layers, pullets, and other chickens..................................VIII–27 Lost ..............................................................................VIII–28-29 Inventory......................................................................VIII–27-28 Price ..................................................................................VIII–29 Production .........................................................................VIII–29 Slaughtered........................................................................VIII–31 Sold for slaughter .............................................................VIII–29 Value ...............................................................VIII–27-29, IX–28 See also Chicks and Poultry.
Chickpeas: Exports.................................................................................VI–13
Child Feeding Programs...................................................XIII–8–10 Citrus fruits:
Bearing Area ..............................................................V–1, IX–23 Consumption .........................................................................V–41 Crop insurance, coverage, premiums, indemnities ................X–5

INDEX INDEX–3 Page
Citrus fruits—Continued Fresh fruits:
Exports ..............................................................................V–19 Foreign trade.....................................................................V–16
Price, marketing year average.........................................V–16-17 Production.......................................................V–2, 16-17, IX–24 Quantity processed................................................................V–16 Shipments..............................................................................V–39 Value.........................................................................V–16, IX–24 Yield ....................................................................................IX–23
Citrus fruits, international: Area and production in specified countries....................V–18-19
Citrus juices: concentrated, pack .............................................V–20 See also Grapefruits, Lemons, Limes,Oranges,
Tangerines. Coconut oil:
Price, wholesale per pound .................................................III–27 Coffee:
Hawaii and Puerto Rico: Area ......................................................................V–46, IX–21 Imports.........................................................................V–46-47 Price per pound.................................................................V–46 Production.............................................................V–46, IX–22 Value.....................................................................V–46, IX–22 Yield .....................................................................V–46, IX–21
International trade: Exports and imports .............................V–46 Cold-storage stocks:
Dairy products ..................................................................VIII–40 Fruits ................................................................................V–59-60 Meats.............................................................................VII–55-56 Orange juice..........................................................................V–60 Pecans ...................................................................................V–58 Potato products .................................................................VIII–41 Poultry products ..........................................................VIII–39-40 Vegetables ......................................................................IV–40-41
Commercial feeds: Disappearance for feed ..........................................................I–40 See also Agricultural products.
Commodity Credit Corporation: Cost value of domestic commodities....................................XI–6 Cost value of export commodities........................................XI–7 Inventory transactions .......................................................XI–4–5 Loan programs.......................................................................XI–2 Loan transactions...................................................................XI–3 Loans made in fiscal year 2011......................................XI–9–11 Price support:
Commodities owned..........................................................XI–1 Commodities under loan ...................................................XI–2 Operations, investments in................................................XI–8
Price support operations................................................IX–39–40 Conservation Reserve Program (CRP)..............................XII–1–17 Consumers’ prices, index numbers for goods, services ........XIII–1 Consumption per capita:
Barley......................................................................................I–35 Beans, snap: canned ............................................................IV–39 Beef .......................................................................VII–49, XIII–2 Butter ....................................................................III–29, VIII–16 Cheese..................................................................VIII–16, XIII–2 Chickens............................................................................VIII–32 Citrus fruits ...........................................................................V–36 Coffee and cocoa ................................................................XIII–2 Corn ............................................................................I–35, IV-36 Eggs.....................................................................................XIII–2 Fats and oils.........................................................................III–29 Fish......................................................................................XIII–2 Flour and cereal products ...................................................XIII–2 Fruit juices, canned...............................................................V–36 Fruits ........................................................................V–36, XIII–2 Grains......................................................................................I–35 Ice cream .............................................................VIII–16, XIII–2 Lamb and mutton..................................................VII–49, XIII–2 Lard ........................................................................III–29, VII–49 Major food commodities ....................................................XIII–2 Margarine.............................................................................III–29 Meats .....................................................................VII–49, XIII–2 Melons .................................................................................IV–35 Milk......................................................................VIII–20 XIII–2, Minerals ......................................................................XIII–1, 4–5 Nutrients..............................................................................XIII–3 Oat products ...........................................................................I–31 Paper...................................................................................XII–29 Paperboard..........................................................................XII–29 Peas ......................................................................................IV–36 Pork .......................................................................VII–49, XIII–2 Potatoes................................................................................IV–35 Poultry.................................................................................XIII–2 Rice.........................................................................................I–35 Rye ...................................................................................I–13, 35 Shortening ............................................................................III–29 Sugar ...................................................................................XIII–2
Page Consumption per capita—Continued
Tomatoes: Canned .............................................................................IV–36 Fresh ................................................................................IV–35
Turkeys..............................................................................VIII–38 Veal .......................................................................VII–49, XIII–2 Vegetables...........................................................................XIII–2
Canned .............................................................................IV–39 Commercially produced ..................................................IV–37 Fresh ...................................................................IV–38, XIII–2 Processing .......................................................................XIII–2
Wheat flour: non-milled product ...........................................I–38 Conversion factors, weights, and measures..............................iv–ix Corn, for grain:
Area ................................................................I–23-24, 28, IX–25 Commodity Credit Corporation programs ........................XI–1-6 Crop insurance ........................................................................X–7 Crop progress.....................................................................XV–34 Crop ranking ......................................................................XV–32 Disappearance.........................................................................I–26 Exports....................................................................................I–30 Feed grains .............................................................................I–47 Fertilizer usage ...................................................................XIV–5 Food availability.....................................................................I–39 Imports .............................................................................I–26, 28 International trade ..................................................................I–29 Pesticide usage....................................................................XIV–4 Prices, market .................................................I–23, 27,43, IX–31 Production ................................................I–23, 24, 26-28, IX–26 Products, consumption ...........................................................I–35 Silage................................................................................I–23, 27 Stocks on and off farms.........................................................I–26 Supply.....................................................................................I–23 Support operations..................................................................I–30 Support prices......................................................................IX–37 Trade.......................................................................................I–29 Value ..........................................................................I–28, IX–26 Yield ................................................................I–23,%, 27, IX–25
Corn, Sweet: Area .........................................................................IV–12, IX–29
Per capita availability: Canning........................................................................IV–39 Freezing .......................................................................IV–39 Fresh ............................................................................IV–38
Production..........................................................IV–12-13, IX–30 Shipments ............................................................................IV–35 Value..................................................................IV–12-13, IX–30 Yield ....................................................................................IV–30
Corn Oil: Used in margarine ...............................................................III–28 Wholesale price per pound..................................................III–31
Corn Syrup: Per capita civilian consumption.............................................I–35 Trade, international ................................................................I–26
Corn-hog price ratios .............................................................VII–18 Cotton:
Area ...............................................................II–1,2, III–1, IX–25 Commodity Credit Corporation programs ...............II–3, XI–1-6 Crop insurance ........................................................................X–5 Crop losses..............................................................................X–1 Crop progress.....................................................................XV–34 Crop ranking ......................................................................XV–30 Exports .................................................................................II–4-7 Farm income, cash receipts.................................................IX–38 Imports ....................................................................................II–7 International area, yield, and production ...............................II–3 Marketing year average prices...................................II–1, IX–31 Production ..............................................................II–1, 2, IX–26 Supply .....................................................................................II–4 Support operations ..................................................................II–3 Support prices......................................................................IX–37 Trade, international .................................................................II–8 Value...........................................................................II–1, IX–22 Yield .......................................................................II–1, 2, IX–25
Cottonseed: Area............................................................................III–1, IX-25 Crushings ...............................................................................III–2 Exports ...................................................................................III–3 Farm disposition ....................................................................III–1 International:
Meal ...................................................................................III–2 Oil ......................................................................................III–4 Oilseed ...............................................................................III–4
Marketing year average price............................................III–1–2 Production.........................................................III–1, 2, 4, IX–26 Sales to oil mills....................................................................III–1 Seed:
For planting........................................................................III–1 Value .....................................................................III–1–2, IX–26 Yield ....................................................................................IX–25
Cowhides: Exports................................................................................VII–51 Prices ..................................................................................VII–50

INDEXINDEX–4 Page
Cows, beef: Feed consumed.......................................................................I–43 Numbers, by class .......................................................VII–1, 3, 4 Operations ....................................................................VII–12–13 Inventory ......................................................................VII–12, 13 Prices ....................................................................................VII–7
Cows, milk: Feed consumed.......................................................................I–43 Kept for milk-cow replacement .....................................VIII–1–2 Numbers ...............................................................VII–3-4, 11, 13 Milk production ..............................................................VIII–3–4 That have calved.............................................................VIII–1–2 Slaughter, Federally Inspected...........................................VII–11 See also Cattle.
Cranberries: Area harvested.................................................................V–21-22 Bearing acreage ...................................................................IX–23 Price, season average per barrel .....................................V–21-22 Production.......................................................V–2, 21-22, IX–24 Utilization..............................................................................V–21 Value ...................................................................V–21, 34 IX–24 Yield....................................................................V–21-22, IX–23
Crop insurance programs ......................................................X–3-10 Crop loan programs, Commodity Credit
Corporation............................................................XI–1–8, 11–13 Crop losses ..............................................................................X–1-2 Cropland:
Area ...............................................................................IX–20, 21 Cash rents ............................................................................IX–14 Land values....................................................................IX–10–13
Crop progress, 5-year average.........................................XV–33–36 Crop ranking, major field crops, by production ...................XV–32 Crops principal:
Production, index numbers .............................................IX–19 See also specific crops.
Cucumbers: Area .........................................................................IV–14, IX–29 Per capita availability:
Canning............................................................................IV–39 Fresh ................................................................................IV–38
Prices ..............................................................................IV–14-15 Production ...............................................................IV–14, IX–30 Shipments ............................................................................IV–35 Value..................................................................IV–14-15, IX–30
Dairy products: Cold storage holdings.......................................................VIII–39 Consumption .....................................................................VIII–18 Disappearance ...................................................................VIII–18 Exports.........................................................................VIII–23-26 Factory production of specified items .............................VIII–17 Gross farm income ...........................................................VIII–12 Herd information test plans..............................................VIII–13 Imports.........................................................................VIII–20-22 Price per pound for specified products............................VIII–17 Quantities manufactured...................................................VIII–16 Stocks, manufacturers.......................................................VIII–18 Stocks on hand, Dec. 31 ..................................................VIII–19
Dates: Bearing acreage........................................................V–21, IX–23 Foreign trade: Imports ..........................................................V–21 Price ......................................................................................V–21 Production ............................................................V–2, 21, IX–24 Value.........................................................................V–21, IX–24 Yield .........................................................................V–21, IX–23
Distillers’ dried grains: Average price per ton bulk .................I–45 Ducks, cold storage ..............................................................VIII–38 Economic trends ........................................................................IX–1 Eggplant, shipments ................................................................IV–35 Eggs:
Cold-storage holdings.......................................................VIII–39 Consumption, distribution, and supply ............................VIII–36 Egg-feed ratio ...................................................................VIII–31 Layers, average number ..............................................VIII–37-38 Used for hatching .............................................................VIII–38 Price per dozen...........................................................VIII–36, 38 Production....................................................................VIII–37-38 Broken under Federal inspection .....................................VIII–37 Value of production..........................................................VIII–38
Emergency Conservation Program ........................................XII–16 Employment, farm:
Number of workers .......................................................IX–13–15 Endive, shipments ...................................................................IV–35 Escarole, shipments .................................................................IV–35 Expenses, farm production......................................................IX–42 European Union:
value of agricultural imports .............................................XV–14 Ewes:
Number...............................................................................VII–25
Page Farm(s):
Balance sheet .......................................................................IX–15 Buildings, value.....................................................................IX–8 Economic sales class.........................................................IX–2, 3 Economic trends ....................................................................IX–1 Equipment/machinery .............................................IX–15, 27, 34
Expenses, farm production..............................................IX–40 Grazing fees.........................................................................IX–41 Income .................................................................................IX–40 Income, cash receipts ..........................................................IX–39 Income, farm and off-farm .................................................IX–41 Input, index numbers ....................................................IX–26, 27 Labor .......................................................................IX–16–18, 20 Land:
Area.....................................................................IX–2, 3, 5, 20 Irrigated..............................................................................IX–7 Rented ................................................................................IX–7 Utilization......................................................................IX–6, 9 Value..........................................................................IX–11–13
Loans, outstanding..........................................................X–11–12 Nonreal estate debt ...............................................................X–11 Number..............................................................................IX–2, 5 Output, index numbers..................................................IX–19, 28 Prices received by farmers ............................................IX–31-32 Prices paid by farmers ...................................................IX–32-36 Producer prices: index numbers..........................................IX–31 Product prices.................................................................IX–28-30 Real estate debt.....................................................................X–11 Value ....................................................................IX–9-10, 11–13 Tenure of operator.............................................................IX–3–4
Farmers’ Cooperatives: Associations type, number, and membership ......................X–15 Business volume ...................................................................X–14 Loans:
Facility ..............................................................................X–18 Operating capitol ..............................................................X–18
Marketing, farm supply, and related service .......................X–13 See also Farm, operators.
Farm Service Agency: Payments to producers by program and commodity .........XI–12 Loans to individuals and associations for farming
purposes ........................................................................X–12 Payment received ................................................................XI–13
Feed: Prices paid by farmers ........................................................IX–35
Feed concentrates: Fed to livestock and poultry ..................................................I–41 Quantity fed per animal unit..................................................I–42 Total fed .................................................................................I–42
Feed grains: Average price and selected markets ......................................I–43 Quantity consumed by livestock and poultry .................I–41, 42
Feedstuffs: Commercial, disappearance ...................................................I–41 Prices, market .........................................................................I–44
Fertilizer: See under specific commodities. Figs:
Area harvested ......................................................................V–18 Bearing acreage ...................................................................IX–23 Dried: exports and imports...................................................V–22 Price ......................................................................................V–22 Production......................................................V–2, 22, 40, IX–24 Value.........................................................................V–22, IX–24 Yield ....................................................................................IX–23
Filberts nuts: International area and production ........................................V–37
Fish: Consumption per capita......................................................XIII–5 Harvested......................................................................XV–21–24 Trips ...................................................................................XV–20
Fisheries: Disposition of domestic catch ...........................................XV–17 Fishermen and craft ...........................................................XV–16 Landings of principal species............................................XV–14 Quantity and value of domestic catch ..............................XV–16 Value of principal species .................................................XV–14
Fishery products: Canned, production and value...........................................XV–15 Fresh and frozen: production and value ...........................XV–15 Exports and imports.....................................................XV–19–20 Processed products: production and value........................XV–18 Sales, inventory..................................................................XV–24 Supply ................................................................................XV–17
Fish meal: Average price per ton bulk ....................................................I–45 Disappearance for feed ..........................................................I–41

INDEX INDEX–5 Page
Flaxseed: Area ...........................................................................III–5, IX–18 Crop insurance ........................................................................X–7 Crushed for linseed oil ..........................................................III–7 Exports...............................................................................III–6, 7 Harvested ...............................................................................III–5 Imports...............................................................................III–6, 7 Marketing year average price................................................III–5 Production .............................................................III–5, 6, IX–19 Stocks.....................................................................................III–6 Supply and disappearance .....................................................III–6 Support operations.................................................................III–6 Used for seed.........................................................................III–5 Value .........................................................................III–5, IX–19 Yield ..........................................................................III–5, IX–18 See also Linseed.
Flaxseed and linseed oil and meal: Average price, Minneapolis ..................................................III–7
Flour. See under specific kinds. Flowers, cut: sales and wholesale value ..................................V–49 Food:
Consumer prices: goods and services ................................XIII–1 Consumption, of major food commodities ........................XIII–2 Costs, for families and individuals ....................................XIII–3 Distributions to States ........................................................XIII–4 Eaten from civilian food supplies ......................................XIII–1 Food and Nutrition Service Programs ...........................XIII–4, 5 Plans, food cost at home ....................................................XIII–3 Price components: farm-originated products......................IX–29 Special Nutrition Assistance Program ...............................XIII–5
Food grain prices, market ..........................................................I–23 Foreign trade:
Exports value ...............................................................XV–2, 4–6 Imports value ...............................................................XV–2, 7–9 Value and quantity of bulk exports ....................................XV–2 See Agricultural exports, Agricultural imports; also
under specific crops. Forestry:
Forest land: area and ownership........................................XII–20 National Forest System:
Forest products cut on ...................................................XII–25 Lands and other acreage ................................................XII–24 Livestock on...................................................................XII–26 Payments, United States and Puerto Rico.....................XII–26 Receipts: U.S. and Puerto Rico .....................................XII–25
Tree planting: acres seeded, plantings ..............................XII–19 See also Timber, Lumber.
French fries: Cold storage...................................................................IV–37–38
Fruit and orange juice: Cold storage holdings......................................................V–59-60 See under specific kinds.
Fruits: Area.........................................................................................V–1 Bearing arcreage..................................................................IX–23 Consumption, per capita.......................................................V–40 Citrus ...........................................................................V–2, 16-20 Deciduous fruits .................................................................V–1, 5 Dried:
Production (dry basis), California ....................................V–39 Exports:
Fresh ................................................................................V–6-7 Prepared, misc...................................................................V–29 Processed...........................................................................V–29
Fertilizers: Percent of acres receiving applications.........XIV–20 Frozen:
Cold storage holdings..................................................V–61-63 International:
Production in specified countries .....................................V–32 Marketing agreements and orders...................................XI–14
Noncitrus: Production, utilization, and value ....................................V–38
Pesticides: percent of acres receiving applications .........XIV–20 Production, total......................................................................V–2 Shipments, fresh ...................................................................V–39 See also under specific kinds.
Garlic: Area .........................................................................IV–15, IX–29 Per capita availability..........................................................IV–37 Production ...............................................................IV–15, IX–30 Value .......................................................................IV–15, IX–30 Yield........................................................................IV–15, IX–29
Ginger root: Area harvested ......................................................................V–23 Price per pound.....................................................................V–23 Production .............................................................................V–23 Value .....................................................................................V–23 Yield......................................................................................V–23
Gluten: Average price per ton of feed, bulk ......................................I–45 Disappearance for feed ..........................................................I–40
Page Goats:
Angora: inventory........................................................VII–35, 55 Clipped, production, price and value ................................VII–34 Meat and other goats: inventory........................................VII–37 Milk goats: inventory.........................................................VII–36 Operations, all goats ..........................................................VII–38 Slaughtered under Federal inspection ...............................VII–54
Grains and grain products: Civilian consumption, per capita ...........................................I–35 Crops: area...........................................................................IX–20 Feed: see Feed, grains Food grains: price, selected markets and grades ..................I–21 Supply and disappearance........................................................I–1 See also under specific kinds.
Grapefruit: Area......................................................................................IX–23 Exports ..................................................................................V–20 Foreign production................................................................V–18 Imports ..................................................................................V–20 Juice, frozen concentrated, pack ..........................................V–20 Prices, marketing year average .......................................V–16-17 Processed, quantity ...............................................................V–16 Production ......................................................V–2, 16–17, IX–24 Shipments..............................................................................V–34 Value.........................................................................V–16, IX–24 Yield ....................................................................................IX–23 See also Citrus fruits.
Grapes: Bearing acreage ...................................................................IX–23 Cold storage ..........................................................................V–61 Crushed for wine ..................................................................V–24 Dried, production (raisins) ...................................................V–24 Exports ..................................................................................V–25 Imports ..................................................................................V–25 Prices.....................................................................................V–23 Production.................................................V–2, 23-24, 35, IX–24 Shipments..............................................................................V–39 Utilization ........................................................................V–23-24 Value.........................................................................V–23, IX–24 Yield .........................................................................V–23, IX–23
Grazing: Fees ......................................................................................IX–43 On national forests .............................................................XII–26 Number of stock and receipts............................................XII–26
Green beans: cold storage .......................................................IV–40 Guavas:
Area harvested..........................................................V–25, IX–23 Price per pound.....................................................................V–25 Production ............................................................V–2, 25, IX–24 Value.........................................................................V–25, IX–24 Yield .........................................................................V–25, IX–23
Hardwood, production ...........................................................XII–28 See also under specific commodities.
Hay: Area...................................................................VI–1–3, 5, IX–21 Crop ranking ......................................................................XV–34 Forage, all: area, yield, and production................................VI–6 Forage, all-alfalfa: area, yield, and production ....................VI–7 Haylage and greenchop, all:
Area harvested, yield, and production..............................VI–9 Haylage and greenchop, alfalfa:
Area harvested, yield, and production..............................VI–8 Prices.............................................................................VI–2, 4, 5 Production .............................................................VI–1–4, IX–22 Seeds ......................................................................................VI–9 Stock on farms ......................................................................VI–3 Supply and disappearance.....................................................VI–5 Value.....................................................................VI–2, 4, IX–22 Yield......................................................................VI–1–3, IX–21
Hazelnuts: Bearing acreage........................................................V–43, IX–23 Exports ..................................................................................V–43 Imports ..................................................................................V–43 Price ......................................................................................V–43 Production.................................................................V–43, IX–24 Value.........................................................................V–43, IX–24 Yield .........................................................................V–43, IX–23
Heifers: Average dressed weight, Federally inspected ...................VII–12 Milk cow replacements ..................................VII–1, 3, VIII–1, 2 Number:
By class........................................................................VII–1, 3 Slaughter.........................................................................VII–11 That have calved ........................................VII–1, 3, VIII–1, 2
Hens: Feed consumed per head and unit .........................................I–43
Hides and skins: Average price, Central US.................................................VII–47 Exports ..........................................................................VII–49-50 Imports................................................................................VII–48 Mink pelts produced ..........................................................VII–51
High protein feeds: Disappearance for feed ..........................................................I–41

INDEXINDEX–6 Page
Hired farm workers: Number of workers .............................................................IX–17 Median weekly earnings .....................................................IX–17
Hogs and Pigs: Disposition....................................................................VII–18–19 Feed consumed per head and unit .........................................I–43 Income from, cash and gross.......................................VII–18–19 Marketings ..............................................................VII–15, 18-19
Breeding, numbers for ...................................................VII–15 Inventory ..................................................................VII–14, 21
Operations ....................................................................VII–14, 21 Prices, farm ............................................................VII–18, 55–56 Production ....................................................................VII–18–19 Receipts:
At interior markets .........................................................VII–18 At public stockyards ......................................................VII–18
Inshipments ..................................................................VII–18–19 Skins, pieces.......................................................................VII–51 Slaughtered ......................................................VII–16, 20–21, 54 Value......................................................................VII–14, 18, 19
Hog-corn price ratio...............................................................VII–18 See also Pig crop and Sows.
Hominy feed: Average price per ton, bulk ...................................................I–45
Honey: Exports ..................................................................................II–14 Imports ..................................................................................II–14 Number of colonies, yield, production, and stocks.......II–15, 16 Price and value ...............................................................II–15, 16
Honeydews: Area .........................................................................IV–16, IX–29 Production ...............................................................IV–16, IX–30 Shipments ............................................................................IV–35 Value .......................................................................IV–16, IX–30 Yield ....................................................................................IX–29
Hops: Area ....................................................................VI–14,15, IX–21 Exports.................................................................................VI–16 Prices, farm..........................................................................VI–14 Production ...............................................................VI–15, IX–22 Stocks on hand ....................................................................VI–14 Value .......................................................................VI–15, IX–22 Yield........................................................................VI–15, IX–21
Ice cream: Consumption .....................................................................VIII–20 Disappearance ...................................................................VIII–20 Exports ..............................................................................VIII–28 Production .........................................................................VIII–18 Quantities manufactured...................................................VIII–17
Imports: Agricultural products. See Agricultural products, imports. See also under specific commodities.
Income, farm : By commodity group ..........................................................IX–41 Farm operator households...................................................IX–43 Personal .................................................................................IX–1 Total gross farm income .....................................................IX–42 See also under specific commodities.
Index numbers: Agricultural Productivity.....................................................IX–28 Farm:
Employment...............................................................IX–13–15 Food consumption ......................................................XIII–6–7 Input.................................................................................IX–27 Labor................................................................................IX–27 Production........................................................................IX–25 Real estate values per acre................................................IX–9
Industrial production .............................................................IX–1 Parity ratio ...........................................................................IX–33 Prices:
Consumers’.........................................................IX–1, XIII–10 Paid by farmers.....................................................IX–1, 34, 35 Producer.......................................................................IX–1, 31 Received by farmers .............................................IX–1, 27–34
Tobacco: Industrial production .................................................................IX–1 Insurance, crop:
Coverage ...........................................................................X–4–10 International oilseed:
Peanut...................................................................................III–12 Soybean .........................................................................III–17, 21 Sunflower........................................................................III–25-26
International meal: Peanut...................................................................................III–12
International trade: Barley......................................................................................I–34 Corn ........................................................................................I–26 Cotton ....................................................................................II–10 Oats.........................................................................................I–31 Rice.........................................................................................I–20 Rye..........................................................................................I–13 Sorghum .................................................................................I–39 Soybeans, meal ....................................................................III–20 Wheat........................................................................................I–9
Irrigated land .............................................................................IX–7
Page K–Early Citrus:
Production .............................................................................V–12 Value .....................................................................................V–12 Quantity processed................................................................V–12
Kiwifruit: Area harvested ......................................................................V–11 Bearing acreage ...................................................................IX–23 Price, marketing year average ..............................................V–11 Production ............................................................V–2, 11, IX–24 Shipments..............................................................................V–39 Value.........................................................................V–11, IX–24 Yield .........................................................................V–11, IX–23
Labor, farm: Number of workers .......................................................IX–16–18 See also Employment, farm and Workers, farm.
Lactose: Imports ...................................................................VIII–22 Lamb and mutton:
Cold-storage holdings ........................................................VII–54 Consumption ......................................................................VII–47 Exports .........................................................................VII–39, 43 Imports................................................................................VII–39
Lamb(s): Breeding ........................................................................VII–23-25 Cash receipts ................................................................VII–26–27 Crop..............................................................................VII–25, 26 Inshipments ..................................................................VII–26–27 Marketings....................................................................VII–26–27 Number, Jan. 1, by classes and State..........................VII–28–29 Production..............................................................VII–26, 27, 49 Prices:
Market ......................................................................VII–24, 27 Skin:
Exports......................................................................VII–51–52 Imports............................................................................VII–50
Slaughter: Farm..........................................................................VII–27–29 Under Federal inspection.........................................VII–28, 29
See also Livestock and Sheep and lambs. Land utilization: ....................................................................IX–6, 8 Lard:
Consumption ......................................................................VII–50 Exports..........................................................................VII–21–22 Production ....................................................................VII–21, 49 Stocks .................................................................................VII–21 Supply and disappearance..................................................VII–21
Lemons: Area ..........................................................................V–14, IX–23 Exports ..................................................................................V–16 Imports ..................................................................................V–16 Prices...............................................................................V–12–13 Processed, quantity ...............................................................V–12 Production ......................................................V–2, 12–13, IX–24 Production, foreign ...............................................................V–14 Shipments..............................................................................V–34 Value.........................................................................V–12, IX–24 Yield ....................................................................................IX–23 See also Citrus fruits.
Lentils: Exports.................................................................................VI–13 Support prices......................................................................IX–39
Lespedeza seed: Average price paid ................................................................VI–9
Lettuce, head: Area .........................................................................IV–16, IX–29 Per capita availability..........................................................IV–37 Price .....................................................................................IV–16 Production ...............................................................IV–16, IX–30 Value .......................................................................IV–16, IX–30 Yield........................................................................IV–16, IX–29
Lettuce, iceberg: Shipments ....................................................IV–35 Lettuce, leaf:
Area .........................................................................IV–17, IX–29 Per capita availability..........................................................IV–37 Production ...............................................................IV–17, IX–30 Shipments ............................................................................IV–35 Value .......................................................................IV–17, IX–30 Yield........................................................................IV–17, IX–29
Lettuce, Romaine: Area .........................................................................IV–17, IX–29 Per capita availability..........................................................IV–37 Production ...............................................................IV–17, IX–30 Shipments ............................................................................IV–35 Value .......................................................................IV–17, IX–30 Yield........................................................................IV–17, IX–29
Limes: Exports ..................................................................................V–16 Imports ..................................................................................V–16 Prices...............................................................................V–12–13 Processed quantity ................................................................V–12 Production ............................................................V–2, 12, IX–24 Shipments..............................................................................V–34 Value.........................................................................V–12, IX–24 Yield ....................................................................................IX–23

INDEX INDEX–7 Page
Limes—Continued See also Citrus fruits.
Linseed: Cake and meal:
Disappearance for feed ......................................................I–44 Exports ...............................................................................III–7 Imports ...............................................................................III–7 Average price per ton bulk ................................................I–48 Production ..........................................................................III–7
Oil: Exports ...............................................................................III–7 Prices, market ....................................................................III–7 Production ..........................................................................III–7 Stocks, June 1....................................................................III–7
Linters. See Cotton, linters. Livestock:
Cash receipts........................................................................IX–41 Farm income........................................................................IX–42 Grazed on national forests, and receipts ...........................XII–26 Grazing fees.........................................................................IX–43 Inventory ............................................................................VII–52 Prices ...............................................................VII–52, IX–32, 35 Production and value...........................................................IX–27 Value................................................................VII–52, IX–25, 54 See also specific kinds.
Loans and debt outstanding: Loans to associations............................................................X–12 Loans to individuals .............................................................X–12 Farm real estate ....................................................................X–11 Non-real estate ......................................................................X–11 See Commodity Credit Corporation. See also under
specific type of commodity. Loganberries:
Frozen commercial pack ......................................................V–35 Lumber:
Producer price indexes.......................................................XII–29 Production ....................................................................XII–28, 30
Macadamia nuts: Bearing acreage........................................................V–42, IX–23 Price per pound.....................................................................V–42 Production.................................................................V–42, IX–24 Value.........................................................................V–42, IX–24 Yield .........................................................................V–42, IX–23
Machinery, farm ....................................................IX–15, 27, 34-37 See also Farm, equipment.
Marketing: Agreements and orders:
Fruits, vegetables, and tree nuts .....................................XI–14 Milk.................................................................................VIII–8–9 Number, membership and volume.................................X–13, 14 Year average prices rec’d by farmers ...........................IX–30-32
Meals. See under specific kinds. Measures:
Equivalent weights ................................................................v–vii Tables, explanation.....................................................................iv
Meat meal: Average price per ton bulk ....................................................I–45
Meat(s): Consumption ......................................................................VII–49 Exports...............................................VII–39-46, 51–52, VIII–27 Frozen: cold storage holdings ......................................VII–57-58 Imports ..........................................................VII–39, 47, VIII–27 International meat production............................................VII–39 Production and consumption .............................................VII–48 Red meat: production.........................................................VII–38 Trade, international.......................................VII–47, VIII–34, 38
Melons: Exports ....................................................................................V–5 Shipments ............................................................................IV–35 Per capita utilization............................................................IV–36 See Cantaloups, Honeydews and Watermelons
Milk: Condensed:
Consumption .................................................................VIII–18 Disappearance ...............................................................VIII–18 Exports ..........................................................................VIII–23 Manufactured ................................................................VIII–16 Stocks, manufacturers’ .................................................VIII–18
Consumption, per capita...................................................VIII–18 Disappearance for feed ..........................................................I–41 Dry nonfat:
Consumption .................................................................VIII–18 Disappearance ...............................................................VIII–18 Exports ..........................................................................VIII–23 Factory Production .................................................VIII–16, 17 Manufacturers’ stocks...................................................VIII–18 Price per pound.............................................................VIII–17 Stocks on hand, Dec. 31 ..............................................VIII–19
Dry whole milk: Average price per pound ..............................................VIII–17 Consumption .................................................................VIII–18 Disappearance ...............................................................VIII–18 Exports ..........................................................................VIII–24 Manufacturers’stocks ....................................................VIII–18 Stocks on hand, Dec. 31 ..............................................VIII–19
Page Milk—Continued
Evaporated: Consumption .................................................................VIII–18 Disappearance ...............................................................VIII–18 Exports ..........................................................................VIII–23 Manufacturers’ stocks...................................................VIII–18
Fluid milk and cream: Consumption .................................................................VIII–11 Exports ..........................................................................VIII–26
Marketed by producers .......................................................VIII–6 Marketings and income.............................................VIII–7-8, 12 Markets under federal order marketings .............VIII–12, 14, 15 Milk feed-price ratios .......................................................VIII–11 Prices: Average received by farmers ...............................VIII–11 Production........................................................VIII–3-4, 9-10, 13 Quantities used and marketed by farmers .........VIII–5-6, 13, 16 Support prices................................................................IX–39–40 Value..............................................................................VIII–9-10
Milk cows ...............................................................VIII–1-4, 11, 13 Milkfat:
Exports ..............................................................................VIII–24 Percentage in milk ....................................................VIII–3-4, 13 Production per cow.........................................................VIII–3–5
Mill products, disappearance .....................................................I–41 Millet, international:
Area, yield and production ....................................................I–48 Mink pelts, number produced................................................VII–55 Mint oil: production, value, price per lb. ...............................III–26 Mixed grains, international:
Area, yield and production ....................................................I–40 Mohair:
Price....................................................................................VII–34 Price-support operations ....................................................VII–34 Production ..........................................................................VII–34 Value ..................................................................................VII–34 See Goats.
Mules. See Horses and mules. Mushrooms, agaricus:
Area.......................................................................................V–48 Price per pound.....................................................................V–48 Sales volume.........................................................................V–48 Value of sales .......................................................................V–48
Mushrooms, specialty Growers, number of..............................................................V–48 Price per pound.....................................................................V–48 Production .............................................................................V–48 Sales volume.........................................................................V–48
Mustard seed: Area......................................................................................IX–21 Production............................................................................IX–22 Value....................................................................................IX–22 Yield ....................................................................................IX–21
Mutton. See Lamb and mutton and Meats. National agricultural economic data .........................................IX–1 National forests:
Acreage ........................................................................XII–19, 24 Acres seeded ......................................................................XII–19 Ownership ..........................................................................XII–20 Payments to States and Puerto Rico .................................XII–26 Receipts, U.S. and Puerto Rico .........................................XII–25 Stock grazed on..................................................................XII–26 Timber cut ..........................................................................XII–25
Nectarines: Area and Acreage.....................................................V–28, IX–23 International area and production ........................................V–33 Production ............................................................V–2, 25, IX–24 Shipments..............................................................................V–39 Utilization..............................................................................V–25 Value.........................................................................V–25, IX–24 Yield ....................................................................................IX–23
Non-real estate farm debt .........................................................X–12 Nutrients contributed by food groups ................................XIII–4–5 Nuts/Tree Nuts:
Area and production in specified countries .........................V–41 Bearing acreage ...................................................................IX–23 Cold storage holdings...........................................................V–62 Production............................................................................IX–24 Supply and utilization...........................................................V–40 Value....................................................................................IX–24 Yield ....................................................................................IX–23
Oats: Area............................................................................I–31, IX–21 Consumption, civilian ............................................................I–39 Crop progress.....................................................................XV–34 Crop ranking ......................................................................XV–30 Exports....................................................................................I–31 Feed concentrates ...................................................................I–45 Fertilizer usage .............................................................XIV–1, 10 Imports....................................................................................I–31 International............................................................................I–34 Pesticide usage....................................................................XIV–9

INDEXINDEX–8 Page
Oats—Continued Prices:
Marketing year average ...............................................I–31, 33 Production............................................................I–31, 32, IX–22 Stocks on and off farms.........................................................I–31 Supply and disappearance......................................................I–28 Support operations..................................................................I–29 Trade.......................................................................................I–34 Value....................................................................I–31, 33, IX–22 Yield ....................................................................I–31, 32, IX–21
Oil products, consumption ......................................................III–29 Oils:
Wholesale, price per pound.............................................III–27 See also Fats, Shortening, and under specific kinds.
Oilseed cake and meal: Disappearance.........................................................................I–41
Oilseed meal: Quantity for feeding ...........................................I–42 See also under specific kinds.
Oilseeds: Area harvested and yield ....................................................IX–21 Production and value...........................................................IX–22
Okra: Cold storage.........................................................................IV–40
Olive oil: Imports ..................................................................................V–26 Production in specified countries........................................III–27
Olives: Bearing acreage ...................................................................IX–23 Imports ..................................................................................V–26 Price, marketing year average ..............................................V–26 Production ............................................................V–2, 26, IX–24 Utilization .......................................................................V–22, 34 Value.........................................................................V–26, IX–24 Yield ....................................................................................IX–23
Onion rings: Cold storage.........................................................................IV–40
Onions: Area .........................................................................IV–18, IX–29 Cold storage holdings..........................................................IV–40 Per capita availability..........................................................IV–37 Price ...................................................................IV–18-19, IX–33 Production..........................................................IV–18-19, IX–30 Shipments ............................................................................IV–36 Value..................................................................IV–18-19, IX–30 Shipments ............................................................................IV–35
Orange juice: Concentrated pack ................................................................V–16 Frozen, cold-storage stocks ............................................V–56–57
Oranges: Area......................................................................................IX–20 Exports ..................................................................................V–16 Imports ..................................................................................V–16 Prices...............................................................................V–12–13 Processed, quantity ...............................................................V–12 Production ......................................................V–2, 12–13, IX–24 Production, foreign ...............................................................V–14 Shipments..............................................................................V–34 Value.........................................................................V–12, IX–24 Yield ....................................................................................IX–23 See also Citrus fruits.
Orchardgrass: Average price paid ................................................................VI–9
Palm oil, wholesale price ........................................................III–27 Papayas:
Area harvested ......................................................................V–33 Bearing acreage ...................................................................IX–23 Price per pound.....................................................................V–33 Production ............................................................V–2, 33, IX–24 Utilization..............................................................................V–33 Value.........................................................................V–33, IX–24 Yield ....................................................................................IX–23
Paper and paperboard: Production and consumption .............................................XII–29
Parity prices.......................................................................IX–30–32 Parity ratio ...............................................................................IX–33 Parsley shipments ....................................................................IV–35 Pasture:
Feed consumed by type of feed.............................................I–43 Land value ...........................................................................IX–13 Cash rents ............................................................................IX–14
Peaches: Bearing acreage ...................................................................IX–23 Cold storage ..........................................................................V–57 Exports ..................................................................................V–27 International production........................................................V–32 Prices................................................................................V–27-28 Production.................................................V–2, 27-28, 39, IX–24 Shipments..............................................................................V–39 Utilization ........................................................................V–27-28 Value.........................................................................V–27, IX–24 Yield ....................................................................................IX–23
Peanut cake and meal: Production ..............................................................................III–9 Quantity for feeding.........................................................I–41–42 Stocks.....................................................................................III–9
Page Peanut oil:
Exports................................................................................III–8-9 Imports................................................................................III–8-9 Production and stocks ........................................................III–8-9
Peanuts: Area planted, harvested ......................................III–8, 11, IX–18 Cleaned (roasting stock)........................................................III–9 Cold storage ..........................................................................V–63 Crop progress.....................................................................XV–36 Crop ranking ......................................................................XV–32 Crushed...............................................................................III–8-9 Disappearance..........................................................I-41, III–9-10 Disposition .............................................................................III–9 Exports ...............................................................................III–8–9 Fertilizer Usage ..................................................................XIV–7 Imports................................................................................III–8-9 International meal ................................................................III–12 International oilseed ............................................................III–12 Market year average price ..............................................III–8, 11 Milled.....................................................................................III–8 Pesticide usage....................................................................XIV–7 Production ...........................................................III–8, 11, IX–19 Shelled .............................................................................III–9, 10 Stocks ...........................................................................III–8-9, 12 Supply.................................................................................III–8-9 Support operations...............................................................III–11 Value ...................................................................III–8, 11, IX–19 Yield....................................................................III–8, 11, IX–18
Pears: Area ............................................................................V–1, IX–20 Juice: cold storage holdings .................................................V–56 Dried .....................................................................................V–35 Exports ..................................................................................V–26 Imports ..................................................................................V–26 Prices.....................................................................................V–26 Production.......................................................V–2, 31-33, IX–24 Production by country ..........................................................V–32 Shipments..............................................................................V–34 Utilization .......................................................................V–26, 29 Value ..................................................................V–26, 34, IX–24 Yield ....................................................................................IX–23
Peas, dry: Exports ...................................................................VI–14 Peas, green:
Area .........................................................................IV–19, IX–29 Cold storage.........................................................................IV–41 Per capita utilization............................................................IV–39 Prices ..............................................................................IV–19-20 Production..........................................................IV–19-20, IX–30 Shipments ............................................................................IV–36 Value ..............................................................................IV–19-20 Yield ....................................................................................IX–29
Pecans: Cold storage holdings...........................................................V–63 Exports ..................................................................................V–44 Imports ..................................................................................V–44 Price per pound ..............................................................V–43, 44 Production ..........................................................V–43, 44, IX–24 Value.........................................................................V–43, IX–24
Peppermint oil: Area, yield, production, and value......................................III–26 Price per pound....................................................................III–26 Production and value...........................................................IX–22
Peppers, bell: Area .........................................................................IV–20, IX–29 Per capita availability..........................................................IV–38 Price................................................................................IV–20-21 Production..........................................................IV–20-21, IX–30 Shipments ............................................................................IV–36 Value..................................................................IV–20-21, IX–30 Yield ....................................................................................IX–29
Peppers, chili: Area .........................................................................IV–21, IX–29 Price .....................................................................................IV–21 Production ...............................................................IV–21, IX–30 Value .......................................................................IV–21, IX–30 Yield ....................................................................................IX–29
Persimmons: Shipments..............................................................................V–34
Pesticides: Percent of acres receiving applications .......................XIV–1–21
Pickles: Canning, per capita utilization ..................................IV–36 Pig crop ..................................................................................VII–17
See also Hogs and Pigs. Pineapples:
Area.......................................................................................V–30 Price ......................................................................................V–30 Production ...............................................................................V–2 Utilization..............................................................................V–30 Value .....................................................................................V–30
Pistachios: Bearing acreage........................................................V–45, IX–23 Price per pound.....................................................................V–45 Production.................................................................V–45, IX–24 Value.........................................................................V–45, IX–24 Yield .........................................................................V–45, IX–23

INDEX INDEX–9 Page
Plants: Floriculture: Growing area by type of cover.......................V–58 Floriculture: Wholesale value by category ..........................V–59 Sales and wholesale:
Annual bedding and garden: Hanging baskets............................................................V–53 Plant flats ......................................................................V–54 Potted .......................................................................V–55-56
Cut Cultivated Greens ......................................................V–50 Cut Flowers.......................................................................V–49 Foliage for indoor or patio use ........................................V–50 Potted flowering for indoor or patio use....................V–51-52 Potted herbaceous perennial .............................................V–57
Plums: Bearing acreage ...................................................................IX–23 Price, marketing year average.........................................V–34-35 Production.......................................................V–2, 34-35, IX–24 Quantity.................................................................................V–35 Shipments..............................................................................V–38 Utilization .......................................................................V–33, 34 Value.........................................................................V–34, IX–24 Yield ....................................................................................IX–23
Pomegrantes: Shipments..............................................................................V–34
Population eating from civilian food supplies.......................XIII–1 Pork:
Cold-storage holdings ..................................................VII–57–58 Consumption ......................................................................VII–49 Exports .............................................................VII–40, 42–44, 46 Imports................................................................................VII–40 Production ..........................................................................VII–49 See also Hogs and Pigs and Swine
Potatoes: Area .........................................................................IV–22, IX–25 Cold storage.........................................................................IV–41 Crop ranking ......................................................................XV–30 Exports.................................................................................IV–27 Fertiziler usage .................................................................XIV–12 Foreign trade........................................................................IV–27 Imports.................................................................................IV–27 Pesticide usage..................................................................XIV–11 Prices, received by farmers ..........................................IX–30, 33 Production...................................................IV–22–24, 27, IX–19 Shipments ............................................................................IV–36 Stocks ............................................................................IV–23, 25 Trade, foreign ......................................................................IV–27 Utilization ............................................................................IV–26 Value .......................................................................IV–22, IX–22 Yield........................................................................IV–22, IX–25
Poultry: Cold-storage holdings..................................................VIII–39-40 Consumption per capita......................................................XIII–6 Feed consumed.......................................................................I–42 Feed-price ratios ...............................................................VIII–31 Slaughtered under Federal inspection ..............................VIII–33 See also Chickens, Chicks, and Turkeys.
Prices: See specific commodity, also Farms Proso millet:
Area.......................................................................I–81-82, IX–26 Price .....................................................................I–81, 83, IX–27 Production.............................................................I–81-82, IX–27 Value....................................................................I–81, 83, IX–27 Yield .....................................................................I–81-82, IX–26
Protein feeds (animal): Disappearance.........................................................................I–41 Quantity for feeding...............................................................I–42
Prunes: Bearing acreage ...................................................................IX–23 Exports ..................................................................................V–36 Imports ..................................................................................V–36 Price, marketing year average.........................................V–34-35 Production.......................................................V–2, 34-35, IX–24 Shipments..............................................................................V–38 Utilization ........................................................................V–33-34 Value.........................................................................V–34, IX–24 Yield ....................................................................................IX–23
Pullets, number, Dec. 1 ........................................................VIII–27 Pulpwood:
Consumption ................................................................XII–28, 29 Exports, imports .................................................................XII–28
Pumpkins: Area .........................................................................IV–28, IX–29 Price.........................................................................IV–29, IX–30 Production ..........................................................IV–28,29, IX–30 Value.................................................................IV–28, 29, IX–30 Yield........................................................................IV–15, IX–29
Purees, noncitrus: Frozen commercial pack ......................................................V–35
Radishes: Shipments ............................................................................IV–35
Raisins: Exports ..................................................................................V–25 Imports ..................................................................................V–25
Page Rams:
Number, Jan 1....................................................................VII–23 Rapeseed:
Area..................................................................................IX–21 Production........................................................................IX–22 Value................................................................................IX–22 Yield ................................................................................IX–21
Raspberries: Bearing acreage and yield...................................................IX–23 Cold storage ..........................................................................V–62 Production and value...........................................................IX–24 Shipments..............................................................................V–39
Real estate, farm: Loans.....................................................................................X–12 Outstanding debt...................................................................X–11 Value:
By States..........................................................................IX–10 Farmland and buildings.....................................................IX–8 Per acre ............................................................................IX–10
Refrigerated warehouse space ...............................................XV–29 General storages: cooler and freezer space.......................XV–30
Rice: Area ...............................................................I–16, 18, 23, IX–18 By length of grain:
Area ..............................................................................I–16, 18 Production ....................................................................I–16, 18 Stocks.................................................................I–16-17, 19-20 Yield .............................................................................I–16, 18
Consumption...........................................................................I–38 Crop progress.....................................................................XV–34 Crop ranking ......................................................................XV–32 Disappearance.........................................................................I–17 Exports ........................................................................I–17, 21-22 Fertiziler usage .................................................................XIV–11 Imports .............................................................................I–17, 22 Milled, by grain length...............................................I–17, 19-22 Millfeeds, disappearance........................................................I–43 Pesticide usage..................................................................XIV–11 Prices:
Farm....................................................................................I–16 Market ..........................................................................I–19, 23 Support operations..............................................................I–21
Production .....................................................I–16, 18, 22, IX–22 Stocks....................................................................I–16–17, 19-20 Supply.....................................................................................I–17 Trade, international ................................................................I–22 Value....................................................................I–16, 19, IX–22 Yield ..............................................................I–16, 18, 22, IX–21
Rye: Area......................................................................I–13–14, IX–21
Consumption, civilian ............................................................I–39 Disappearance.........................................................................I–13 Exports .............................................................................I–12, 15 Feed concentrates ...................................................................I–44 Flour, consumption per capita ...............................................I–39 Imports ..............................................................................I–13-15 Prices:
Farm..............................................................................I–13–14 Market.................................................................................I–23
Production ............................................................I–13–15, IX–19 Supply.....................................................................................I–13 Trade, international ................................................................I–15 Value ....................................................................I–13–14, IX–22 Yield.....................................................................I–13–14, IX–21
Safflower: Area......................................................................................IX–21 Production............................................................................IX–22 Value....................................................................................IX–22 Yield ....................................................................................IX–21
Safflower oil: Price per pound, wholesale .................................................III–31
School lunch and breakfast programs ..............................XIII–8-10 Seeds:
Bought, cost to farm operators ...........................................IX–42 Field: Average prices, paid by farmers ................................VI–9 See also under specific kinds.
Sheep: Feed consumed per head and unit .........................................I–43 Inshipments ........................................................................VII–26 Marketings ...................................................................VII–26, 27 Number, Jan. 1...................................................................VII–29 Prices............................................................................VII–26, 27 Slaughtered:
Farm................................................................................VII–27 Federally inspected............................................VII–28, 29, 54
See also Sheep and lambs and Livestock. Sheep and lambs:
Breeding .................................................................VII–23–25, 29 Inventory ......................................................................VII–22, 54 Inshipments ........................................................................VII–26 Carcasses condemned ........................................................VII–54 Disposition..........................................................................VII–26 Income................................................................................VII–26

INDEXINDEX–10 Page
Sheep and lambs—Continued Number:
By classes, States......................................................VII–23 29 Shorn for wool.........................................................VII–30, 33
Operations ....................................................................VII–22, 29 Prices............................................................................VII–26, 57 Production ..........................................................................VII–26 Receipts at selected markets..............................................VII–26 Skins:
Exports............................................................................VII–51 Imports............................................................................VII–50
Slaughtered...................................................................VII–27, 28 Value ............................................................................VII–22, 54 See also Lambs, Livestock, and Sheep.
Skins: Exports..........................................................................VII–51–52 Imports................................................................................VII–50 Mink pelts produced ..........................................................VII–53
Snuff ..........................................................................................II–27 Softwoods.............................................................XII–21-23, 29, 30 Soil, conservation:
Flood prevention and protection........................................XII–18 Sorghum:
Area................................................................I–36–37, 39, IX–21 Crop progress.....................................................................XV–34 Crop ranking ......................................................................XV–32 Feed concentrates ...................................................................I–42 Fertilizer usage .................................................................XIV–12 Grain:
Disappearance.....................................................................I–36 Exports .........................................................................I–36, 39 Prices, farm.........................................................................I–36 Prices, market...............................................................I–38, 43 Stocks on and off farms.....................................................I–36 Silage ............................................................................I–36–37 Support operations..............................................................I–38
Pesticide usage..................................................................XIV–11 Production ............................................................I–36–37, IX–22 Seed, prices paid by farmers.................................................VI–9 Supply.....................................................................................I–36 Trade, international ................................................................I–39 Value ..........................................................................I–36, IX–22 Yield ..............................................................I–36, 37, 39, IX–21
Southern greens: Cold storage.........................................................................IV–40
Sows: Farrowing .....................................................................VII–15, 17 Slaughtered.........................................................................VII–21 See also Hogs and Pigs.
Soybean cake and meal: Exports...........................................................................III–15, 18 Production and stocks..........................................................III–15
Soybean meal: Average price at specified markets.....................................III–13 International trade................................................................III–19
Soybean oil: Exports...........................................................................III–18, 21 International production ......................................................III–19 International trade................................................................III–20 Prices:
Market ..............................................................................III–13 Wholesale, per pound......................................................III–27
Production......................................................................III–15, 20 Stocks...................................................................................III–15
Soybean oilseed, international: Area and production in specified countries........................III–17
Soybeans: Area planted, harvested ....................................III–13, 15, IX–21 Crop insurance ......................................................................X–10 Crop progress.....................................................................XV–35 Crop ranking ......................................................................XV–32 Crushed ................................................................................III–16 Disappearance for feed ..........................................................I–41 Exports...........................................................................III–17, 21 Fertilizer usage ...........................................................XIV–14–15 International trade................................................................III–22 Pesticide usage............................................................XIV–12–13 Prices:
Farm and Market.......................................................III–13, 16 Production ..........................................................III–13-15, IX–22 Stocks on and off farms ......................................................III–13 Supply and disappearance ...................................................III–14 Support operations...............................................................III–14 Value .................................................................III–13, 16, IX–22 Yield..................................................................III–13, 15, IX–21
Spearmint oil: Area, yield, production, and value......................................III–26 Price .....................................................................................III–26 Production and value...........................................................IX–22
Special Milk Program.......................................................XIII–9–10
Page Spinach:
Area .........................................................................IV–30, IX–29 Cold storage.........................................................................IV–41 Per capita availability..........................................................IV–38 Price.........................................................................IV–30, IX–33 Production ...............................................................IV–30, IX–30 Shipments ............................................................................IV–36 Value .......................................................................IV–30, IX–30 Yield ....................................................................................IX–29
Squash: Area .........................................................................IV–31, IX–29 Cold storage.........................................................................IV–41 Per capita availability..........................................................IV–38 Price.........................................................................IV–30, IX–33 Production ...............................................................IV–31, IX–30 Shipments ............................................................................IV–36 Value .......................................................................IV–30, IX–30 Yield ....................................................................................IX–29
Steers: Average dressed weight .....................................................VII–12 Weighted, price per pound ..................................................VII–7 Number, Jan. 1.................................................................VII–1, 4 Slaughtered under Federal inspection ...............................VII–11
Strawberries: Area harvested..........................................................V–37, IX–23 Juice: cold storage holdings .................................................V–62 Production.......................................................V–2, 36-37, IX–24 Shipments..............................................................................V–38 Value ...................................................................V–36-37, IX–24 Yield .........................................................................V–37, IX–23
Sudangrass seed: Average price paid ................................................................VI–9
Sugar (raw and refined): Price at specified markets.....................................................II–12
Sugar, (raw value): Exports ..................................................................................II–12 Imports ..................................................................................II–12 Production .............................................................................II–12 Stocks ....................................................................................II–12
Sugar, cane (raw value): Stocks, receipts, and meltings ..............................................II–11
Sugar, cane and beet: Domestic marketings, by source of supply..........................II–11
Sugar, cane and beet (refined): Stocks, production, and food use deliveries ........................II–12
Sugar, centrifugal: International trade .................................................................II–13
Sugarbeets: Area.............................................................................II–9, IX–25 Marketing year average prices...................................II–9, IX–32 Production...................................................................II–9, IX–26 Value...........................................................................II–9, IX–26 Yield ...........................................................................II–9, IX–25
Sugarcane for sugar and seed: Area .....................................................................II–10-11, IX–25 Cane production ....................................................................II–11 Marketing year average price ..................................II–11, IX–32 Price per ton..........................................................................II–11 Production ...........................................................II–10-11, IX–26 Value.........................................................................II–10, IX–26 Yield per acre......................................................II–10-11, IX–25
Sunflower: Area ...................................................................III–22–23, IX–21 Price .....................................................................................III–22 Price for oil, wholesale .......................................................III–27 Production ............................................................................III–22 Seed, average price paid .......................................................VI–9 Value .......................................................................III–22, IX–22 Yield...................................................................III–22-23, IX–25
Sunflower oilseed: Area and production in specified countries........................III–24 Meal, quantity for feeding .....................................................I–41 Production............................................................................IX–26
Sunflowerseed: Exports .................................................................................III–24 Oil exports ...........................................................................III–25
Support prices of Agricultural commodities ..........................IX–37 Sweet potatoes:
Area .........................................................................IV–32, IX–25 Consumption........................................................................IV–36 Price.........................................................................IV–32, IX–31 Production ...............................................................IV–32, IX–26 Shipments ............................................................................IV–36 Value .......................................................................IV–32, IX–26 Yield........................................................................IV–32, IX–25
Syrup, corn: Consumption, civilian, per capita ..........................................I–35
Swine: Exports, imports .................................................................VII–48 Foreign production.......................................................VII–16, 41 International trade ..............................................................VII–48
Tall fescue seed: Average price paid ................................................................VI–9
Tallow oil: wholesale price .....................................................III–27

INDEX INDEX–11 Page
Tangelos: Area.......................................................................................V–23 Quantity processed................................................................V–12 Prices...............................................................................V–12–13 Production.........................................................V–2,12–13 IX–24 Shipments..............................................................................V–34 Value.........................................................................V–12, IX–24 Yield ....................................................................................IX–23
Tangerines: Area......................................................................................IX–23 Concentrate, annual pack .....................................................V–16 Exports ..................................................................................V–16 Imports ..................................................................................V–16 Juice, pack ......................................................................V–16, 35 Quantity processed................................................................V–12 Prices...............................................................................V–12–13 Production ......................................................V–2, 12–13, IX–24 Production, specified countries ............................................V–14 Value...................................................................V–12–13, IX–24 Yield ....................................................................................IX–23
Tankage and meat meal: Disappearance for feed ..........................................................I–40
Taro: Area......................................................................................IX–25 Production............................................................................IX–26 Value....................................................................................IX–26 Yield ....................................................................................IX–25
Tea: Imports..............................................................................V–48 Temples:
Quantity processed................................................................V–12 Price ......................................................................................V–12 Production.........................................................................V–2, 12 Shipments..............................................................................V–34 Value.................................................................................V–2, 12
Timber: Cut ......................................................................................XII–25 Exports, imports .................................................................XII–28 Prices ..................................................................................XII–27 Products .................................................................XII–25, 29, 30 Production ....................................................................XII–28, 29 Receipts, U.S. and Puerto Rico .........................................XII–25 Removals and growth ........................................................XII–22 Volume.........................................................................XII–21, 23
Tobacco: Area...........................................................................II–17, IX–25 Crop ranking ......................................................................XV–30 Exports ...........................................................................XV–6, 12 Imports .................................................................................XV–9 Marketing year average price ...............................................II–17 Production.................................................................II–17, IX–26 Value.........................................................................II–17, IX–26 Yield ......................................................................................II–17
Tomatoes/Tomato products: Area .........................................................................IV–33, IX–29 Per capita availability, canning...........................................IV–39 Per capita availability, fresh ...............................................IV–38 Prices ...................................................................................IV–33 Production ...............................................................IV–33, IX–29 Shipments ............................................................................IV–36 Value .......................................................................IV–33, IX–30 Yield ....................................................................................IX–29
Trade, foreign: Value of total agricultural exports and imports..................XV–2 Value of exports ..................................................XV–2–6, 10–12 Value of imports..................................................XV–7–9, 13–14
Trade, international: See International Trade. Tree planting:
Acres seeded and acres of tree plantings..........................XII–19 Trout:
Egg sales ............................................................................XV–27 Operations selling/distributing fish/eggs ...........................XV–27 Sales by size category .......................................................XV–28 Value ..................................................................................XV–27
Truck crops. See Vegetable crops. Tung oil:
Wholesale price per pound..................................................III–31 Turkeys:
Cold storage ......................................................................VIII–38 Commercial storage ..........................................................VIII–32 Consumption, per capita...................................................VIII–32 Exports ..............................................................................VIII–32 Feed-price ratio.................................................................VIII–32 Net poult placements ........................................................VIII–33 Poults hatched...................................................................VIII–34 Production...................................................................VIII–32, 33 Raised, feed consumed per head and unit.............................I–42 Slaughtered........................................................................VIII–33 Value .................................................................................VIII–32
Turnip greens: Frozen pack .........................................................................IV–36
Utilization of farm commodities: See individual items. Veal:
Cold storage .......................................................................VII–58 Consumption ......................................................................VII–49 Production ....................................................................VII–41, 49
Page Veal—Continued
See also Beef, Beef and Veal, and Meats. Vegetables:
Area ...........................................................................IV–2, IX–25 Canning: Per capita utilization............................................IV–38 Commercially produced: Per capita utilization ..................IV–39 Fertilizers: Applications for .............................................XIV–20 Fresh: Per capita utilization ................................................IV–37 Freezing: Per capita utilization ...........................................IV–39 Frozen: Cold storage holdings.......................................IV–40-41 Harvested, commercial .......................................IV–2, IX–24, 29 Marketing agreements and orders.......................................XI–13 Pesticides: applications for...............................................XIV–20 Principal: area, production, value .........................................IV–2 Production, commercial ............................................IV–2, IX–30 Shipments .......................................................................IV–35-37 Value, commercial ....................................................IV–2, IX–30 Yield, commercial ...............................................................IX–29 See also under specific kinds.
Wages, farm .......................................................................IX–16-18 Walnuts, English:
Bearing acreage........................................................V–45, IX–23 Exports ..................................................................................V–45 Imports ..................................................................................V–45 Price per ton..........................................................................V–45 Production.................................................................V–45, IX–24 Value.........................................................................V–45, IX–24 Yield .........................................................................V–45, IX–23
Warehouse space, refrigerated.........................................XV–29–30 Water conservation. See Conservation. Watermelon:
Area .........................................................................IV–34, IX–29 Price.........................................................................IV–34, IX–33 Production ...............................................................IV–34, IX–30 Shipments ............................................................................IV–37 Value .......................................................................IV–34, IX–30 Yield ....................................................................................IX–29
Watershed protection and flood protection projects ...............................................................................XII–18
Weights: Equivalent measures..............................................................v–vii Tables, explanation.....................................................................iv
Wheat: Area..................................................................I–1–2, 5–8, IX–21 Commodity Credit Corporation price support......................XI–1 Consumption...........................................................................I–39 Crop insurance ......................................................................X–11 Crop progress.....................................................................XV–33 Crop ranking ......................................................................XV–32 Disappearance.......................................................................I–4–5 Exports .........................................................................I–5, 11–12 Feed concentrate.....................................................................I–44 Fertilizer usage ...........................................................XIV–18–19 Flour:
Consumption, civilian, per capita ......................................I–38 Exports, destination............................................................I–12
Imports .........................................................................I–5, 10–11 International......................................................................I–10–11 Pesticide usage............................................................XIV–16–17 Prices:
Farm .............................................................................I–1–2, 9 Market.................................................................................I–23 Support operations................................................................I–9
Production........................................................I–1–2, 5–8, IX–22 Stocks:
On and off farms..................................................................I–3 Supply ...............................................................................I–1, 4-5 Value ....................................................................I–1-2, 7, IX–22 Yield ................................................................I–1–2, 5–8, IX–21
Wheat bran, average price per ton bulk ....................................I–47 Wheat, millrun, average price per ton bulk ..............................I–47 Wheat, middlings, average price per ton bulk ..........................I–47 Wheat, millfeeds, disappearance for feed .................................I–43 Whey: Mixed exports ...........................................................VIII–23 Wood-pulp production ...........................................................XII–29 Wool:
Consumption .................................................................VII–30-31 Exports................................................................................VII–29 Imports ..........................................................................VII–29-31 Prices......................................................................VII–29, 31, 33 Price-support operations ....................................................VII–29 Sheep shorn..................................................................VII–30, 32 Value and weight per fleece..............................................VII–29
Workers, farm .............................................................IX–16–18, 20