Embed Size (px)
Citation preview

11-Feb-15
Amount Totals Depreciation Notes
$00 20.00 years0 7.00 years0 7.00 years0 5.00 years0 5.00 years0 5.00 years
0
00000000000
0
$0
Amount Totals Loan Rate Term in Months Monthly Payments0.00% 00.00% 0
0.00% 0 9.00% 84.00 $0.000.00% 0 9.00% 240.00 $0.00
0.00% $0 $0.00
Corp Projected Growth BPlan, Inc.Required Start-Up Funds
Required Start-Up FundsFixed Assets
Real EstateBuildingsLeasehold ImprovementsEquipmentFurniture and FixturesVehiclesOther Fixed Assets
Total Fixed Assets
Operating CapitalPre-Opening Salaries and WagesPrepaid Insurance PremiumsBeginning InventoryLegal and Accounting FeesRent DepositsUtility DepositsSuppliesAdvertising and PromotionsLicensesOther Initial Start-Up CostsWorking Capital (Cash On Hand)
Total Operating Capital
Total Required Funds
Sources of FundingOwner's Cash InjectionOutside InvestorsAdditional Loans or Debt
Commercial LoanCommercial Mortgage
Total Sources of Funding
11-Feb-15
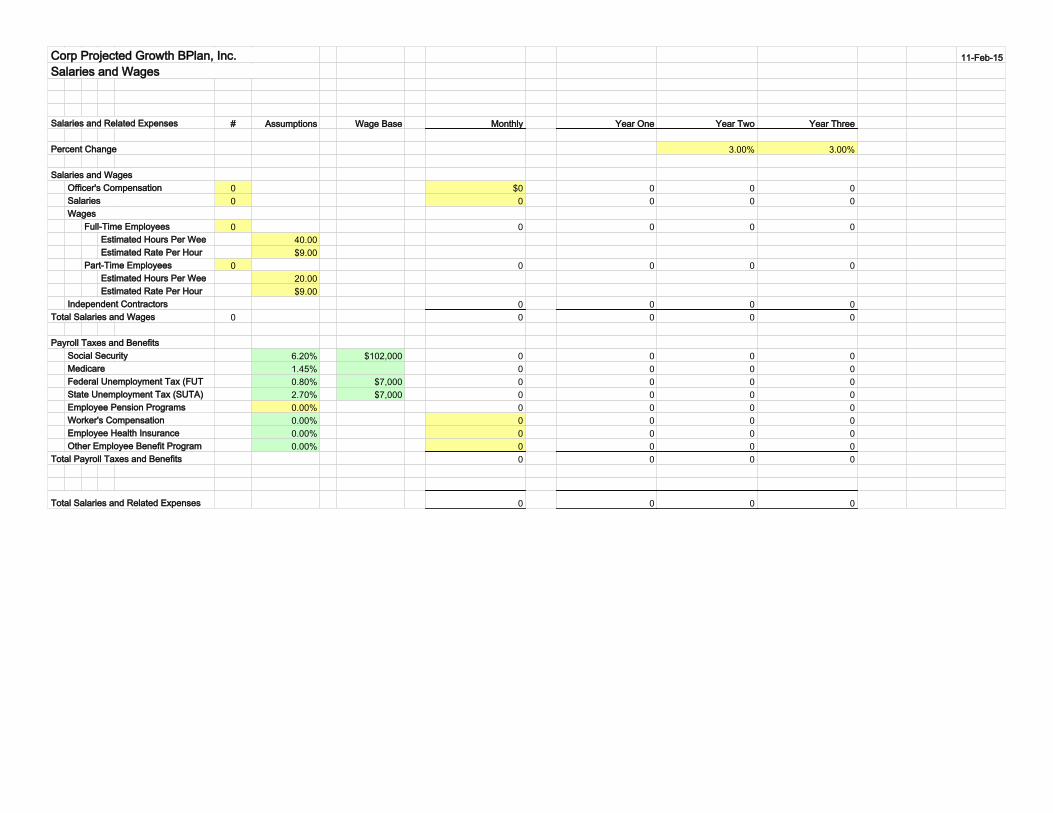
# Assumptions Wage Base Monthly Year One Year Two Year Three
3.00% 3.00%
0 $0 0 0 00 0 0 0 0
0 0 0 0 040.00$9.00
0 0 0 0 020.00$9.00
0 0 0 00 0 0 0 0
6.20% $102,000 0 0 0 01.45% 0 0 0 00.80% $7,000 0 0 0 02.70% $7,000 0 0 0 00.00% 0 0 0 00.00% 0 0 0 00.00% 0 0 0 00.00% 0 0 0 0
0 0 0 0
0 0 0 0
Corp Projected Growth BPlan, Inc.Salaries and Wages
Salaries and Related Expenses
Percent Change
Salaries and WagesOfficer's CompensationSalariesWages
Full-Time EmployeesEstimated Hours Per WeeEstimated Rate Per Hour
Part-Time EmployeesEstimated Hours Per WeeEstimated Rate Per Hour
Independent ContractorsTotal Salaries and Wages
Payroll Taxes and BenefitsSocial SecurityMedicareFederal Unemployment Tax (FUTState Unemployment Tax (SUTA)Employee Pension ProgramsWorker's CompensationEmployee Health InsuranceOther Employee Benefit Program
Total Payroll Taxes and Benefits
Total Salaries and Related Expenses

11-Feb-15
Monthly Year One Year Two Year Three Notes
3.00% 3.00%
$0 0 0 00 0 0 00 0 0 00 0 0 00 0 0 00 0 0 00 0 0 00 0 0 00 0 0 00 0 0 00 0 0 00 0 0 00 0 0 00 0 0 00 0 0 00 0 0 00 0 0 00 0 0 00 0 0 00 0 0 00 0 0 0
0 0 0 0
0 0 0 00 0 0 00 0 0 00 0 0 0
0 0 0 0
Corp Projected Growth BPlan, Inc.Fixed Operating Expenses
Fixed Operating Expenses
Percent Change
ExpensesAdvertisingCar and Truck ExpensesCommissions and FeesContract LaborCredit Card and Bank ChargesCustomer Discounts and RefundsDues and SubscriptionsEntertainmentInsurance (Liability and Property)InternetLegal and Professional FeesOffice ExpensesPostage and DeliveryRent (on business property)Rent of Vehicles and EquipmentRepairs and MaintenanceSuppliesTelephone and CommunicationsTravelUtilities
Total Expenses
Other ExpensesDepreciationInterest
Commercial LoanCommercial MortgageLine of Credit
Total Other Expenses
Total Fixed Operating Expenses
11-Feb-15
Assumptions % Month 1 Month 2 Month 3 Month 4 Month 5 Month 6 Month 7 Month 8 Month 9 Month 10 Month 11 Month 12 Totals
$0.00 100.00%$0.00 0.00%$0.00 0.00%
0.00% 0.00% 0.00% 0.00% 0.00% 0.00% 0.00% 0.00% 0.00% 0.00% 0.00% 0.00% 0.00%0 0 0 0 0 0 0 0 0 0 0 0 0
10.00% 0 0 0 0 0 0 0 0 0 0 0 0 010.00% 0 0 0 0 0 0 0 0 0 0 0 0 050.00%
$00000 0.00%
$0.000
$0.00 100.00%$0.00 0.00%$0.00 0.00%
0.00% 0.00% 0.00% 0.00% 0.00% 0.00% 0.00% 0.00% 0.00% 0.00% 0.00% 0.00% 0.00%0 0 0 0 0 0 0 0 0 0 0 0 0
10.00% 0 0 0 0 0 0 0 0 0 0 0 0 010.00% 0 0 0 0 0 0 0 0 0 0 0 0 016.67%
$00000 0.00%
$0.000
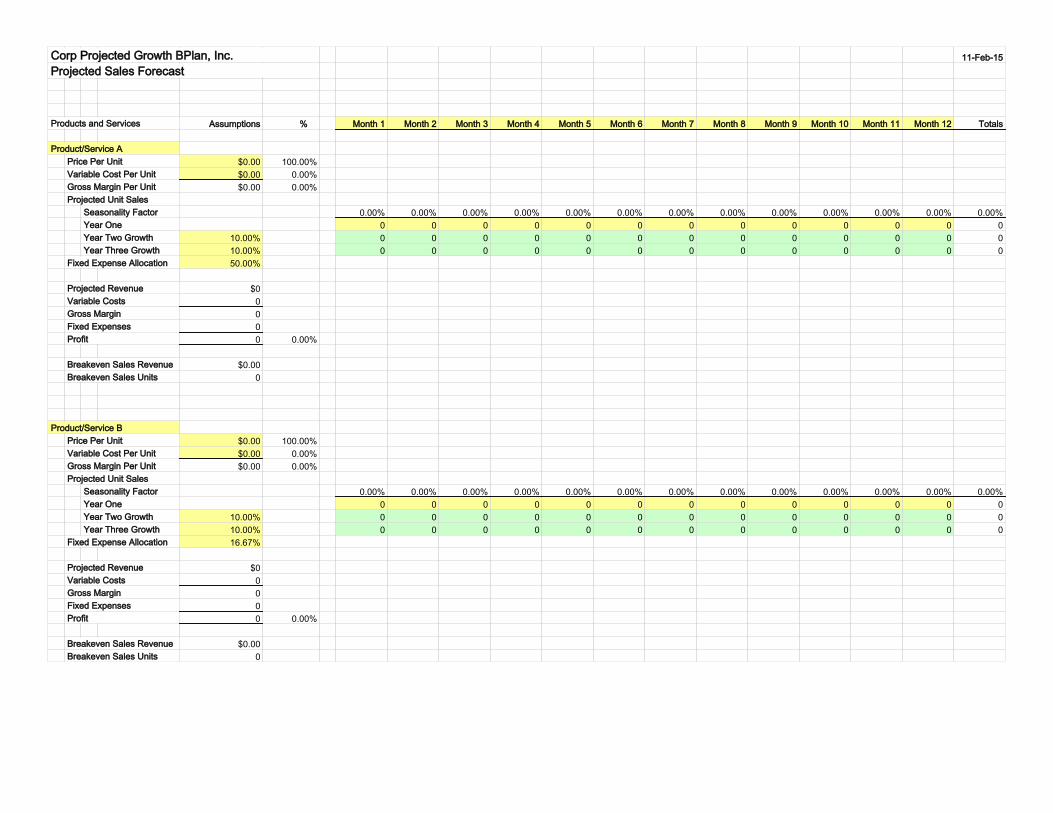
Corp Projected Growth BPlan, Inc.Projected Sales Forecast
Products and Services
Product/Service APrice Per UnitVariable Cost Per UnitGross Margin Per UnitProjected Unit Sales
Seasonality FactorYear OneYear Two GrowthYear Three Growth
Fixed Expense Allocation
Projected RevenueVariable CostsGross MarginFixed ExpensesProfit
Breakeven Sales RevenueBreakeven Sales Units
Product/Service BPrice Per UnitVariable Cost Per UnitGross Margin Per UnitProjected Unit Sales
Seasonality FactorYear OneYear Two GrowthYear Three Growth
Fixed Expense Allocation
Projected RevenueVariable CostsGross MarginFixed ExpensesProfit
Breakeven Sales RevenueBreakeven Sales Units
11-Feb-15
Assumptions % Month 1 Month 2 Month 3 Month 4 Month 5 Month 6 Month 7 Month 8 Month 9 Month 10 Month 11 Month 12 Totals
$0.00 100.00%$0.00 0.00%$0.00 0.00%
0.00% 0.00% 0.00% 0.00% 0.00% 0.00% 0.00% 0.00% 0.00% 0.00% 0.00% 0.00% 0.00%0 0 0 0 0 0 0 0 0 0 0 0 0
10.00% 0 0 0 0 0 0 0 0 0 0 0 0 010.00% 0 0 0 0 0 0 0 0 0 0 0 0 016.67%
$00000 0.00%
$0.000
$0.00 100.00%$0.00 0.00%$0.00 0.00%
0.00% 0.00% 0.00% 0.00% 0.00% 0.00% 0.00% 0.00% 0.00% 0.00% 0.00% 0.00% 0.00%0 0 0 0 0 0 0 0 0 0 0 0 0
10.00% 0 0 0 0 0 0 0 0 0 0 0 0 010.00% 0 0 0 0 0 0 0 0 0 0 0 0 016.67%
$00000 0.00%
$0.000
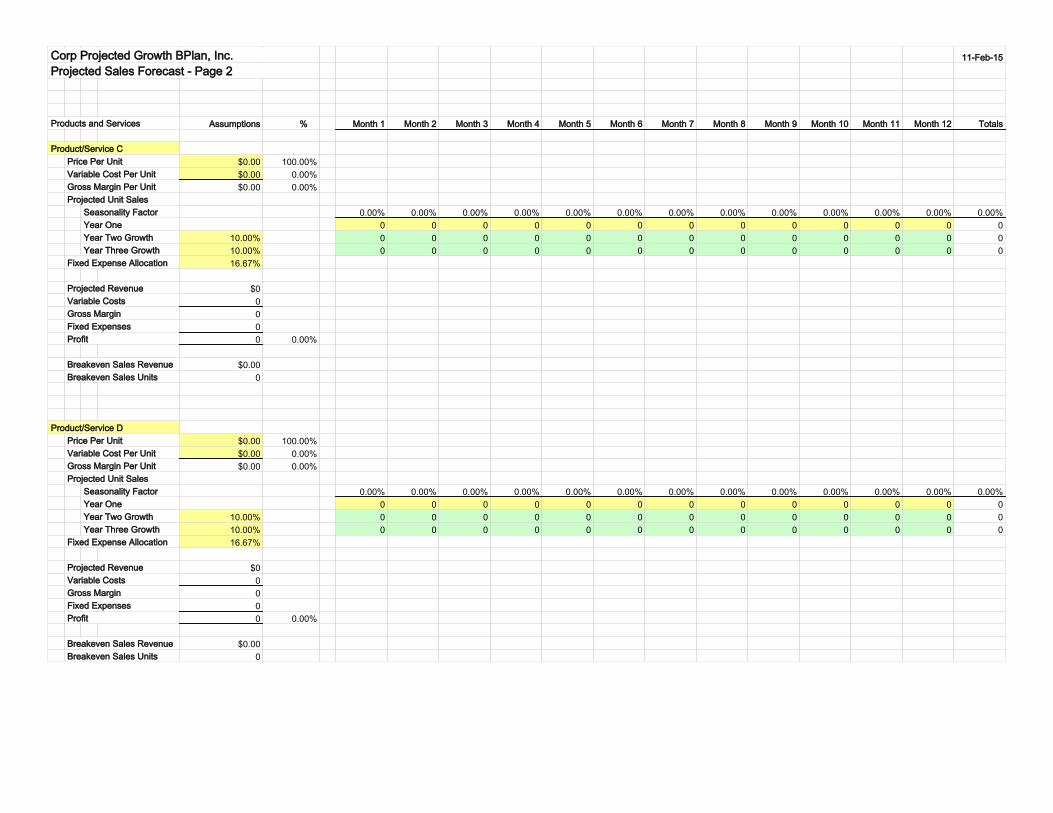
Corp Projected Growth BPlan, Inc.Projected Sales Forecast - Page 2
Products and Services
Product/Service CPrice Per UnitVariable Cost Per UnitGross Margin Per UnitProjected Unit Sales
Seasonality FactorYear OneYear Two GrowthYear Three Growth
Fixed Expense Allocation
Projected RevenueVariable CostsGross MarginFixed ExpensesProfit
Breakeven Sales RevenueBreakeven Sales Units
Product/Service DPrice Per UnitVariable Cost Per UnitGross Margin Per UnitProjected Unit Sales
Seasonality FactorYear OneYear Two GrowthYear Three Growth
Fixed Expense Allocation
Projected RevenueVariable CostsGross MarginFixed ExpensesProfit
Breakeven Sales RevenueBreakeven Sales Units

11-Feb-15
100.00%0.00%0.00%
100.00%
100.00%0.00%0.00%
100.00%
$0.009.00%
0.00%0 00 0
3.00 0
Corp Projected Growth BPlan, Inc.Cash Receipts and Disbursements
Accounts Receivable CollectionsPercent of Collections
0 to 30 days31 to 60 daysMore than 60 days
Total Collections Percentage
Accounts Payable DisbursementsNumber of Days to Pay Suppliers
0 to 30 days31 to 60 daysMore than 60 days
Total Disbursements Percentage
Line of Credit AssumptionsDesired Minimum Cash BalanceLine of Credit Interest Rate
Income Tax AssumptionsEffective Income Tax Rate
Amortization of Start-Up ExpensesAmortization Period in Years

12/31/12 %
000000
00000000
0
0
00000
Corp Projected Growth BPlan, Inc.Balance Sheet (Prior EOY)
AssetsCurrent Assets
CashAccounts ReceivableInventoryPrepaid ExpensesOther Current
Total Current Assets
Fixed AssetsReal EstateBuildingsLeasehold ImprovementsEquipmentFurniture and FixturesVehiclesOther Fixed Assets
Total Fixed Assets
Less: Accumulated Depreciation
Total Assets
Liabilities and Owner's EquityLiabilities
Accounts PayableNotes PayableMortgage PayableLine of Credit Balance
Total Liabilities
Owner's Equity
0000
0
Statement Balances
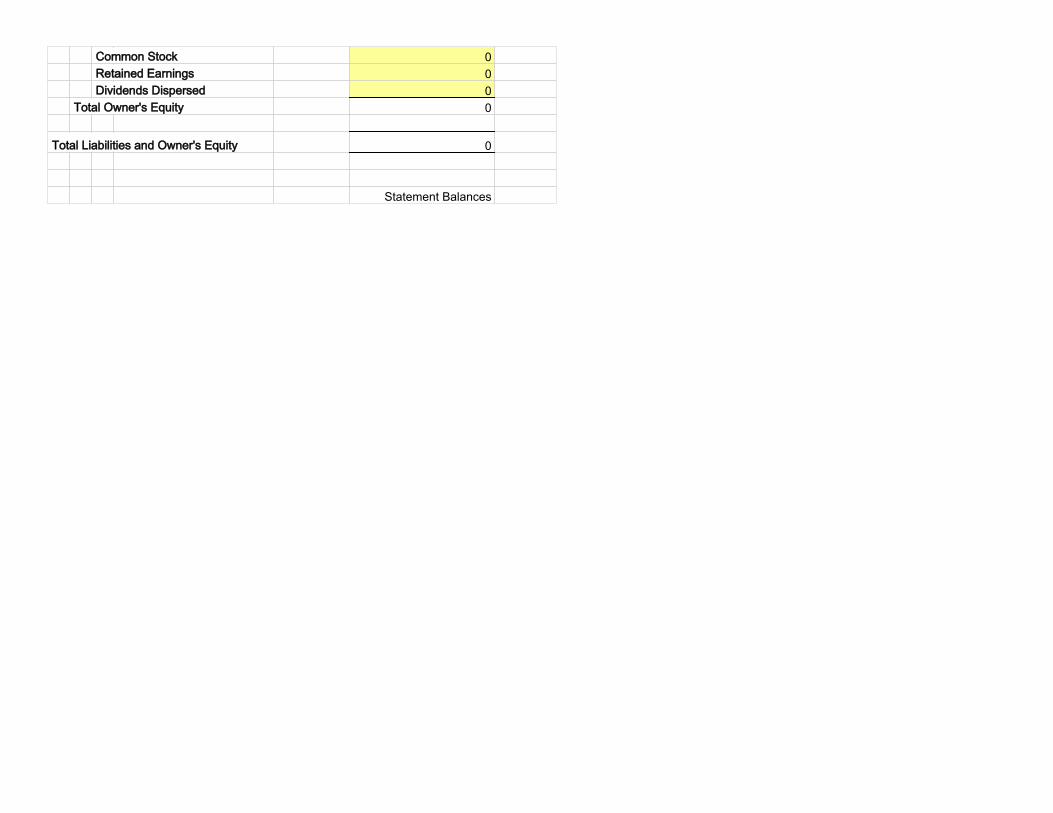
Common StockRetained EarningsDividends Dispersed
Total Owner's Equity
Total Liabilities and Owner's Equity

Month 1 Month 2 Month 3 Month 4 Month 5 Month 6 Month 7 Month 8 Month 9 Month 10 Month 11 Month 12 Totals
0 0 0 0 0 0 0 0 0 0 0 0 00 0 0 0 0 0 0 0 0 0 0 0 0
00
0 0 0 0 0 0 0 0 0 0 0 0 0
0 0 0 0 0 0 0 0 0 0 0 0 00 0 0 0 0 0 0 0 0 0 0 0 0
00
0 0 0 0 0 0 0 0 0 0 0 0 0
0 0 0 0 0 0 0 0 0 0 0 0 0
0 0 0 0 0 0 0 0 0 0 0 0 00 0 0 0 0 0 0 0 0 0 0 0 00 0 0 0 0 0 0 0 0 0 0 0 00 0 0 0 0 0 0 0 0 0 0 0 00 0 0 0 0 0 0 0 0 0 0 0 00 0 0 0 0 0 0 0 0 0 0 0 00 0 0 0 0 0 0 0 0 0 0 0 0
0 0 0 0 0 0 0 0 0 0 0 0 00 0 0 0 0 0 0 0 0 0 0 0 00 0 0 0 0 0 0 0 0 0 0 0 00 0 0 0 0 0 0 0 0 0 0 0 00 0 0 0 0 0 0 0 0 0 0 0 00 0 0 0 0 0 0 0 0 0 0 0 00 0 0 0 0 0 0 0 0 0 0 0 00 0 0 0 0 0 0 0 0 0 0 0 00 0 0 0 0 0 0 0 0 0 0 0 00 0 0 0 0 0 0 0 0 0 0 0 00 0 0 0 0 0 0 0 0 0 0 0 00 0 0 0 0 0 0 0 0 0 0 0 00 0 0 0 0 0 0 0 0 0 0 0 00 0 0 0 0 0 0 0 0 0 0 0 00 0 0 0 0 0 0 0 0 0 0 0 00 0 0 0 0 0 0 0 0 0 0 0 00 0 0 0 0 0 0 0 0 0 0 0 00 0 0 0 0 0 0 0 0 0 0 0 00 0 0 0 0 0 0 0 0 0 0 0 00 0 0 0 0 0 0 0 0 0 0 0 00 0 0 0 0 0 0 0 0 0 0 0 0
Corp Projected Growth BPlan, Inc.Projected Income Statement - Year One
IncomeProduct/Service AProduct/Service B
Total Income
Cost of SalesProduct/Service AProduct/Service B
Total Cost of Sales
Gross Margin
Salaries and WagesOfficer's CompensationSalariesFull-Time EmployeesPart-Time EmployeesIndependent ContractorsPayroll Taxes and Benefits
Total Salary and Wages
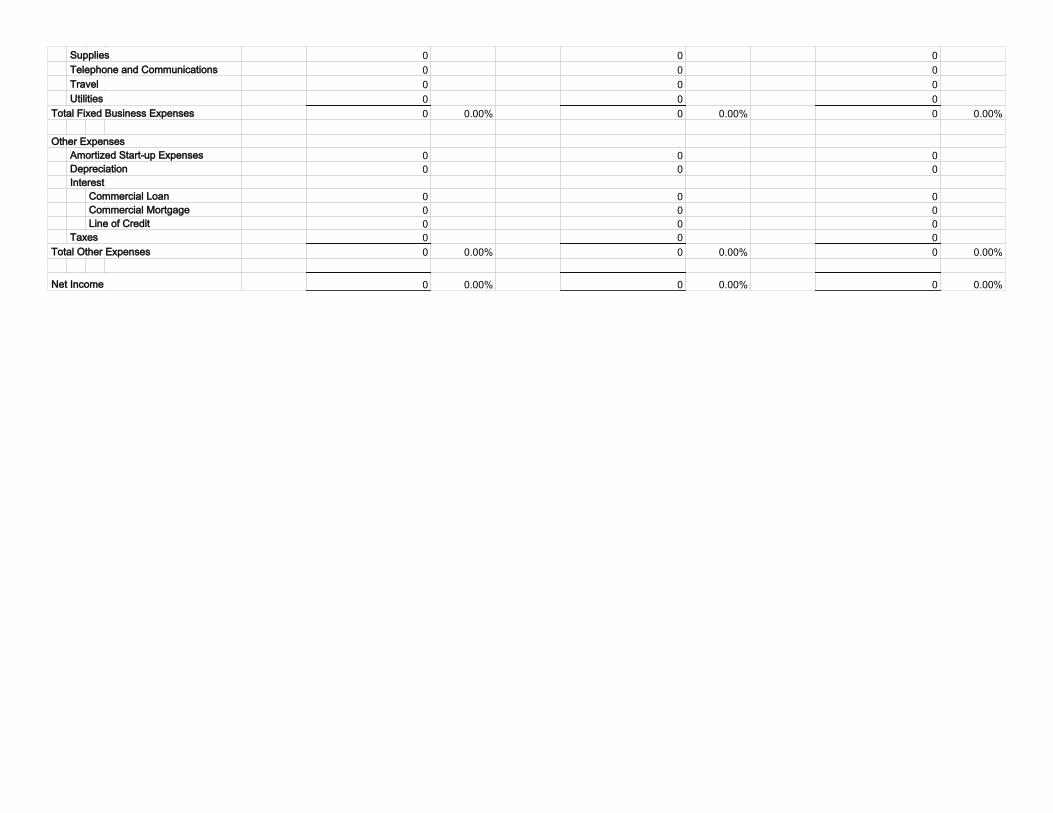
Fixed Business ExpensesAdvertisingCar and Truck ExpensesCommissions and FeesContract LaborCredit Card and Bank ChargesCustomer Discounts and RefundsDues and SubscriptionsEntertainmentInsurance (Liability and Property)InternetLegal and Professional FeesOffice ExpensesPostage and DeliveryRent (on business property)Rent of Vehicles and EquipmentRepairs and MaintenanceSuppliesTelephone and CommunicationsTravelUtilities
Total Fixed Business Expenses

0 0 0 0 0 0 0 0 0 0 0 0 00 0 0 0 0 0 0 0 0 0 0 0 0
0 0 0 0 0 0 0 0 0 0 0 0 00 0 0 0 0 0 0 0 0 0 0 0 00 0 0 0 0 0 0 0 0 0 0 0 00 0 0 0 0 0 0 0 0 0 0 0 00 0 0 0 0 0 0 0 0 0 0 0 0
0 0 0 0 0 0 0 0 0 0 0 0 0
0 0 0 0 0 0 0 0 0 0 0 00 0 0 0 0 0 0 0 0 0 0 0
Other ExpensesAmortized Start-up ExpensesDepreciationInterest
Commercial LoanCommercial MortgageLine of Credit
TaxesTotal Other Expenses
Net Income

Month 1 Month 2 Month 3 Month 4 Month 5 Month 6 Month 7 Month 8 Month 9 Month 10 Month 11 Month 12 Totals
0 0 0 0 0 0 0 0 0 0 0 0
0 0 0 0 0 0 0 0 0 0 0 0 00 0 0 0 0 0 0 0 0 0 0 0 00 0 0 0 0 0 0 0 0 0 0 0 0
0 0 0 0 0 0 0 0 0 0 0 0 00 0 0 0 0 0 0 0 0 0 0 0 00 0 0 0 0 0 0 0 0 0 0 0 0
0 0 0 0 0 0 0 0 0 0 0 0 00 0 0 0 0 0 0 0 0 0 0 0 00 0 0 0 0 0 0 0 0 0 0 0 0
00 0 0 0 0 0 0 0 0 0 0 0 00 0 0 0 0 0 0 0 0 0 0 0 00 0 0 0 0 0 0 0 0 0 0 0 00 0 0 0 0 0 0 0 0 0 0 0 00 0 0 0 0 0 0 0 0 0 0 0 0
0 0 0 0 0 0 0 0 0 0 0 0 0
0 0 0 0 0 0 0 0 0 0 0 0
0 0 0 0 0 0 0 0 0 0 0 0 0
0 0 0 0 0 0 0 0 0 0 0 0
0 0 0 0 0 0 0 0 0 0 0 0
Corp Projected Growth BPlan, Inc.Projected Cash Flow Statement - Year One
Beginning Cash Balance
Cash InflowsIncome from SalesAccounts Receivable
Total Cash Inflows
Cash OutflowsInvesting Activities
New Capital PurchasesInventory PurchasesCost of Sales
Operating ActivitiesSalaries and WagesFixed Business ExpensesTaxes
Financing ActivitiesLoan PaymentsLine of Credit InterestLine of Credit RepaymentsDividends Paid
Total Cash Outflows
Cash Flow
Operating Cash Balance
Line of Credit Drawdowns
Ending Cash Balance
Line of Credit Balance

Base Period End of Year One
0 00 00 00 00 00 0
0 00 00 00 00 00 00 00 0
0 0
0 0
0 00 00 00 00 0
Corp Projected Growth BPlan, Inc.Balance Sheet - Year One
AssetsCurrent Assets
CashAccounts ReceivableInventoryPrepaid ExpensesOther Current
Total Current Assets
Fixed AssetsReal EstateBuildingsLeasehold ImprovementsEquipmentFurniture and FixturesVehiclesOther Fixed Assets
Total Fixed Assets
Less: Accumulated Depreciation
Total Assets
Liabilities and Owner's EquityLiabilities
Accounts PayableNotes PayableMortgage PayableLine of Credit Balance
Total Liabilities
Owner's Equity

0 00 00 00 0
0 0
Statement Balances Statement Balances
Common StockRetained EarningsDividends Dispersed
Total Owner's Equity
Total Liabilities and Owner's Equity

Year One % Year Two % Year Three %
0 0 00 0 00 0 00 0 00 100.00% 0 100.00% 0 100.00%
0 0 00 0 00 0 00 0 00 0.00% 0 0.00% 0 0.00%
0 0.00% 0 0.00% 0 0.00%
0 0 00 0 00 0 00 0 00 0 00 0 00 0.00% 0 0.00% 0 0.00%
0 0 00 0 00 0 00 0 00 0 00 0 00 0 00 0 00 0 00 0 00 0 00 0 00 0 00 0 00 0 00 0 0
Corp Projected Growth BPlan, Inc.Year End Summary
IncomeProduct/Service AProduct/Service B
Total Income
Cost of SalesProduct/Service AProduct/Service B
Total Cost of Sales
Gross Margin
Salaries and WagesOfficer's CompensationSalariesFull-Time EmployeesPart-Time EmployeesIndependent ContractorsPayroll Taxes and Benefits
Total Salary and Wages
Fixed Business ExpensesAdvertisingCar and Truck ExpensesCommissions and FeesContract LaborCredit Card and Bank ChargesCustomer Discounts and RefundsDues and SubscriptionsEntertainmentInsurance (Liability and Property)InternetLegal and Professional FeesOffice ExpensesPostage and DeliveryRent (on business property)Rent of Vehicles and EquipmentRepairs and Maintenance
0 0 00 0 00 0 00 0 00 0.00% 0 0.00% 0 0.00%
0 0 00 0 0
0 0 00 0 00 0 00 0 00 0.00% 0 0.00% 0 0.00%
0 0.00% 0 0.00% 0 0.00%
SuppliesTelephone and CommunicationsTravelUtilities
Total Fixed Business Expenses
Other ExpensesAmortized Start-up ExpensesDepreciationInterest
Commercial LoanCommercial MortgageLine of Credit
TaxesTotal Other Expenses
Net Income
Month 1 Month 2 Month 3 Month 4 Month 5 Month 6 Month 7 Month 8 Month 9 Month 10 Month 11 Month 12 Totals
0 0 0 0 0 0 0 0 0 0 0 0 00 0 0 0 0 0 0 0 0 0 0 0 0
00
0 0 0 0 0 0 0 0 0 0 0 0 0
0 0 0 0 0 0 0 0 0 0 0 0 00 0 0 0 0 0 0 0 0 0 0 0 0
00
0 0 0 0 0 0 0 0 0 0 0 0 0
0 0 0 0 0 0 0 0 0 0 0 0 0
0 0 0 0 0 0 0 0 0 0 0 0 00 0 0 0 0 0 0 0 0 0 0 0 00 0 0 0 0 0 0 0 0 0 0 0 00 0 0 0 0 0 0 0 0 0 0 0 00 0 0 0 0 0 0 0 0 0 0 0 00 0 0 0 0 0 0 0 0 0 0 0 00 0 0 0 0 0 0 0 0 0 0 0 0
0 0 0 0 0 0 0 0 0 0 0 0 00 0 0 0 0 0 0 0 0 0 0 0 00 0 0 0 0 0 0 0 0 0 0 0 00 0 0 0 0 0 0 0 0 0 0 0 00 0 0 0 0 0 0 0 0 0 0 0 00 0 0 0 0 0 0 0 0 0 0 0 00 0 0 0 0 0 0 0 0 0 0 0 00 0 0 0 0 0 0 0 0 0 0 0 00 0 0 0 0 0 0 0 0 0 0 0 00 0 0 0 0 0 0 0 0 0 0 0 00 0 0 0 0 0 0 0 0 0 0 0 00 0 0 0 0 0 0 0 0 0 0 0 00 0 0 0 0 0 0 0 0 0 0 0 00 0 0 0 0 0 0 0 0 0 0 0 00 0 0 0 0 0 0 0 0 0 0 0 00 0 0 0 0 0 0 0 0 0 0 0 00 0 0 0 0 0 0 0 0 0 0 0 00 0 0 0 0 0 0 0 0 0 0 0 00 0 0 0 0 0 0 0 0 0 0 0 00 0 0 0 0 0 0 0 0 0 0 0 00 0 0 0 0 0 0 0 0 0 0 0 0
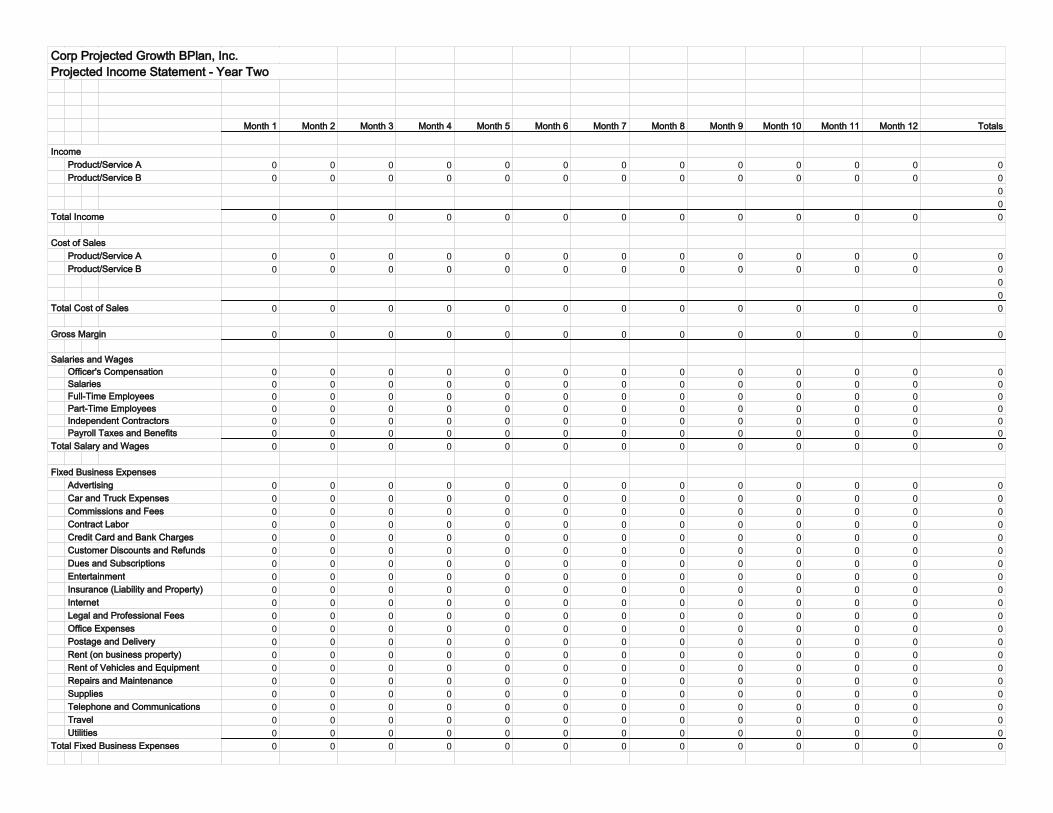
Corp Projected Growth BPlan, Inc.Projected Income Statement - Year Two
IncomeProduct/Service AProduct/Service B
Total Income
Cost of SalesProduct/Service AProduct/Service B
Total Cost of Sales
Gross Margin
Salaries and WagesOfficer's CompensationSalariesFull-Time EmployeesPart-Time EmployeesIndependent ContractorsPayroll Taxes and Benefits
Total Salary and Wages
Fixed Business ExpensesAdvertisingCar and Truck ExpensesCommissions and FeesContract LaborCredit Card and Bank ChargesCustomer Discounts and RefundsDues and SubscriptionsEntertainmentInsurance (Liability and Property)InternetLegal and Professional FeesOffice ExpensesPostage and DeliveryRent (on business property)Rent of Vehicles and EquipmentRepairs and MaintenanceSuppliesTelephone and CommunicationsTravelUtilities
Total Fixed Business Expenses

0 0 0 0 0 0 0 0 0 0 0 0 00 0 0 0 0 0 0 0 0 0 0 0 0
0 0 0 0 0 0 0 0 0 0 0 0 00 0 0 0 0 0 0 0 0 0 0 0 00 0 0 0 0 0 0 0 0 0 0 0 00 0 0 0 0 0 0 0 0 0 0 0 00 0 0 0 0 0 0 0 0 0 0 0 0
0 0 0 0 0 0 0 0 0 0 0 0 0
0 0 0 0 0 0 0 0 0 0 0 00 0 0 0 0 0 0 0 0 0 0 0
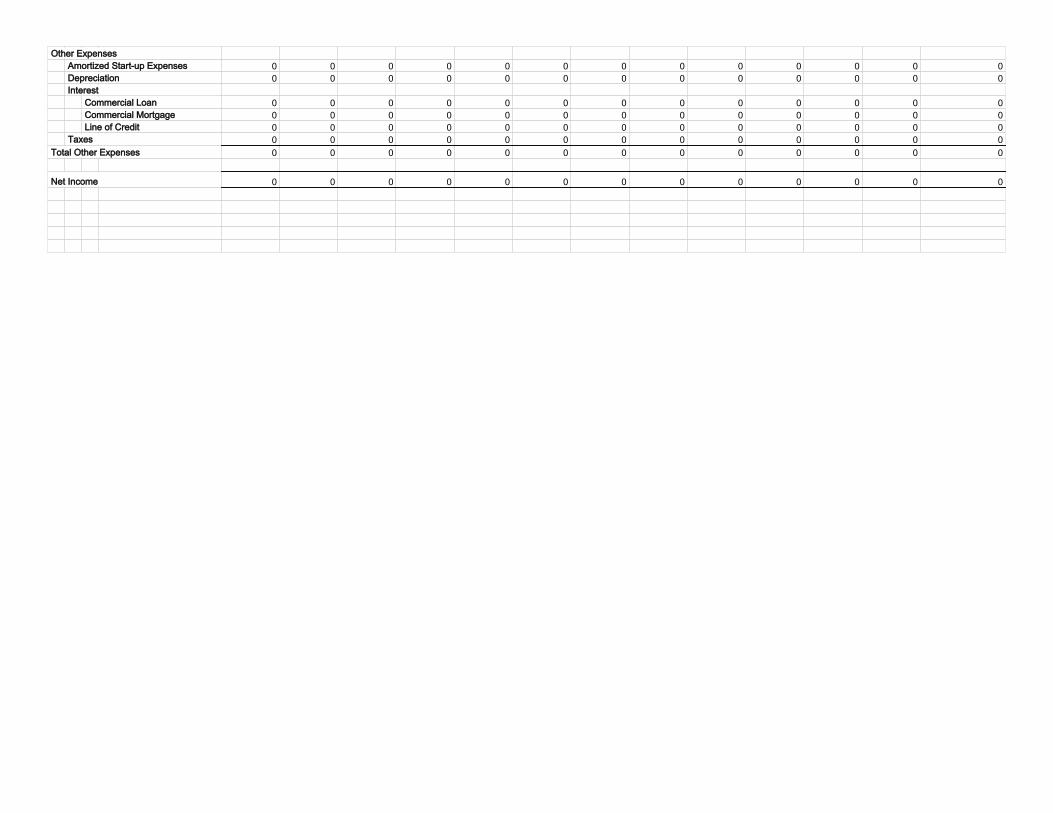
Other ExpensesAmortized Start-up ExpensesDepreciationInterest
Commercial LoanCommercial MortgageLine of Credit
TaxesTotal Other Expenses
Net Income

Month 1 Month 2 Month 3 Month 4 Month 5 Month 6 Month 7 Month 8 Month 9 Month 10 Month 11 Month 12 Totals
0 0 0 0 0 0 0 0 0 0 0 0
0 0 0 0 0 0 0 0 0 0 0 0 00 0 0 0 0 0 0 0 0 0 0 0 00 0 0 0 0 0 0 0 0 0 0 0 0
0 0 0 0 0 0 0 0 0 0 0 0 00 0 0 0 0 0 0 0 0 0 0 0 00 0 0 0 0 0 0 0 0 0 0 0 0
0 0 0 0 0 0 0 0 0 0 0 0 00 0 0 0 0 0 0 0 0 0 0 0 00 0 0 0 0 0 0 0 0 0 0 0 0
00 0 0 0 0 0 0 0 0 0 0 0 00 0 0 0 0 0 0 0 0 0 0 0 00 0 0 0 0 0 0 0 0 0 0 0 00 0 0 0 0 0 0 0 0 0 0 0 00 0 0 0 0 0 0 0 0 0 0 0 0
0 0 0 0 0 0 0 0 0 0 0 0 0
0 0 0 0 0 0 0 0 0 0 0 0
0 0 0 0 0 0 0 0 0 0 0 0 0
0 0 0 0 0 0 0 0 0 0 0 0
0 0 0 0 0 0 0 0 0 0 0 0
Corp Projected Growth BPlan, Inc.Projected Cash Flow Statement - Year Two
Beginning Cash Balance
Cash InflowsIncome from SalesAccounts Receivable
Total Cash Inflows
Cash OutflowsInvesting Activities
New Capital PurchasesInventory PurchasesCost of Sales
Operating ActivitiesSalaries and WagesFixed Business ExpensesTaxes
Financing ActivitiesLoan PaymentsLine of Credit InterestLine of Credit RepaymentsDividends Paid
Total Cash Outflows
Cash Flow
Operating Cash Balance
Line of Credit Drawdowns
Ending Cash Balance
Line of Credit Balance

End of Year One End of Year Two
0 00 00 00 00 00 0
0 00 00 00 00 00 00 00 0
0 0
0 0
0 00 00 00 00 0
Corp Projected Growth BPlan, Inc.Balance Sheet - Year Two
AssetsCurrent Assets
CashAccounts ReceivableInventoryPrepaid ExpensesOther Current
Total Current Assets
Fixed AssetsReal EstateBuildingsLeasehold ImprovementsEquipmentFurniture and FixturesVehiclesOther Fixed Assets
Total Fixed Assets
Less: Accumulated Depreciation
Total Assets
Liabilities and Owner's EquityLiabilities
Accounts PayableNotes PayableMortgage PayableLine of Credit Balance
Total Liabilities
Owner's Equity
0 00 00 00 0
0 0
Statement Balances Statement Balances
Common StockRetained EarningsDividends Dispersed
Total Owner's Equity
Total Liabilities and Owner's Equity

Month 1 Month 2 Month 3 Month 4 Month 5 Month 6 Month 7 Month 8 Month 9 Month 10 Month 11 Month 12 Totals
0 0 0 0 0 0 0 0 0 0 0 0 00 0 0 0 0 0 0 0 0 0 0 0 0
00
0 0 0 0 0 0 0 0 0 0 0 0 0
0 0 0 0 0 0 0 0 0 0 0 0 00 0 0 0 0 0 0 0 0 0 0 0 0
00
0 0 0 0 0 0 0 0 0 0 0 0 0
0 0 0 0 0 0 0 0 0 0 0 0 0
0 0 0 0 0 0 0 0 0 0 0 0 00 0 0 0 0 0 0 0 0 0 0 0 00 0 0 0 0 0 0 0 0 0 0 0 00 0 0 0 0 0 0 0 0 0 0 0 00 0 0 0 0 0 0 0 0 0 0 0 00 0 0 0 0 0 0 0 0 0 0 0 00 0 0 0 0 0 0 0 0 0 0 0 0
0 0 0 0 0 0 0 0 0 0 0 0 00 0 0 0 0 0 0 0 0 0 0 0 00 0 0 0 0 0 0 0 0 0 0 0 00 0 0 0 0 0 0 0 0 0 0 0 00 0 0 0 0 0 0 0 0 0 0 0 00 0 0 0 0 0 0 0 0 0 0 0 00 0 0 0 0 0 0 0 0 0 0 0 00 0 0 0 0 0 0 0 0 0 0 0 00 0 0 0 0 0 0 0 0 0 0 0 00 0 0 0 0 0 0 0 0 0 0 0 00 0 0 0 0 0 0 0 0 0 0 0 00 0 0 0 0 0 0 0 0 0 0 0 00 0 0 0 0 0 0 0 0 0 0 0 00 0 0 0 0 0 0 0 0 0 0 0 00 0 0 0 0 0 0 0 0 0 0 0 00 0 0 0 0 0 0 0 0 0 0 0 00 0 0 0 0 0 0 0 0 0 0 0 00 0 0 0 0 0 0 0 0 0 0 0 00 0 0 0 0 0 0 0 0 0 0 0 00 0 0 0 0 0 0 0 0 0 0 0 00 0 0 0 0 0 0 0 0 0 0 0 0
Corp Projected Growth BPlan, Inc.Projected Income Statement - Year Three
IncomeProduct/Service AProduct/Service B
Total Income
Cost of SalesProduct/Service AProduct/Service B
Total Cost of Sales
Gross Margin
Salaries and WagesOfficer's CompensationSalariesFull-Time EmployeesPart-Time EmployeesIndependent ContractorsPayroll Taxes and Benefits
Total Salary and Wages
Fixed Business ExpensesAdvertisingCar and Truck ExpensesCommissions and FeesContract LaborCredit Card and Bank ChargesCustomer Discounts and RefundsDues and SubscriptionsEntertainmentInsurance (Liability and Property)InternetLegal and Professional FeesOffice ExpensesPostage and DeliveryRent (on business property)Rent of Vehicles and EquipmentRepairs and MaintenanceSuppliesTelephone and CommunicationsTravelUtilities
Total Fixed Business Expenses
0 0 0 0 0 0 0 0 0 0 0 0 00 0 0 0 0 0 0 0 0 0 0 0 0
0 0 0 0 0 0 0 0 0 0 0 0 00 0 0 0 0 0 0 0 0 0 0 0 00 0 0 0 0 0 0 0 0 0 0 0 00 0 0 0 0 0 0 0 0 0 0 0 00 0 0 0 0 0 0 0 0 0 0 0 0
0 0 0 0 0 0 0 0 0 0 0 0 0
0 0 0 0 0 0 0 0 0 0 0 00 0 0 0 0 0 0 0 0 0 0 0
Other ExpensesAmortized Start-up ExpensesDepreciationInterest
Commercial LoanCommercial MortgageLine of Credit
TaxesTotal Other Expenses
Net Income

Month 1 Month 2 Month 3 Month 4 Month 5 Month 6 Month 7 Month 8 Month 9 Month 10 Month 11 Month 12 Totals
0 0 0 0 0 0 0 0 0 0 0 0
0 0 0 0 0 0 0 0 0 0 0 0 00 0 0 0 0 0 0 0 0 0 0 0 00 0 0 0 0 0 0 0 0 0 0 0 0
0 0 0 0 0 0 0 0 0 0 0 0 00 0 0 0 0 0 0 0 0 0 0 0 00 0 0 0 0 0 0 0 0 0 0 0 0
0 0 0 0 0 0 0 0 0 0 0 0 00 0 0 0 0 0 0 0 0 0 0 0 00 0 0 0 0 0 0 0 0 0 0 0 0
00 0 0 0 0 0 0 0 0 0 0 0 00 0 0 0 0 0 0 0 0 0 0 0 00 0 0 0 0 0 0 0 0 0 0 0 00 0 0 0 0 0 0 0 0 0 0 0 00 0 0 0 0 0 0 0 0 0 0 0 0
0 0 0 0 0 0 0 0 0 0 0 0 0
0 0 0 0 0 0 0 0 0 0 0 0
0 0 0 0 0 0 0 0 0 0 0 0 0
0 0 0 0 0 0 0 0 0 0 0 0
0 0 0 0 0 0 0 0 0 0 0 0
Corp Projected Growth BPlan, Inc.Projected Cash Flow Statement - Year Three
Beginning Cash Balance
Cash InflowsIncome from SalesAccounts Receivable
Total Cash Inflows
Cash OutflowsInvesting Activities
New Capital PurchasesInventory PurchasesCost of Sales
Operating ActivitiesSalaries and WagesFixed Business ExpensesTaxes
Financing ActivitiesLoan PaymentsLine of Credit InterestLine of Credit RepaymentsDividends Paid
Total Cash Outflows
Cash Flow
Operating Cash Balance
Line of Credit Drawdowns
Ending Cash Balance
Line of Credit Balance

End of Year Two End of Year Three
0 00 00 00 00 00 0
0 00 00 00 00 00 00 00 0
0 0
0 0
0 00 00 00 00 0
Corp Projected Growth BPlan, Inc.Balance Sheet - Year Three
AssetsCurrent Assets
CashAccounts ReceivableInventoryPrepaid ExpensesOther Current
Total Current Assets
Fixed AssetsReal EstateBuildingsLeasehold ImprovementsEquipmentFurniture and FixturesVehiclesOther Fixed Assets
Total Fixed Assets
Less: Accumulated Depreciation
Total Assets
Liabilities and Owner's EquityLiabilities
Accounts PayableNotes PayableMortgage PayableLine of Credit Balance
Total Liabilities
Owner's Equity

0 00 00 00 0
0 0
Statement Balances Statement Balances
Common StockRetained EarningsDividends Dispersed
Total Owner's Equity
Total Liabilities and Owner's Equity
Year One Year Two Year Three
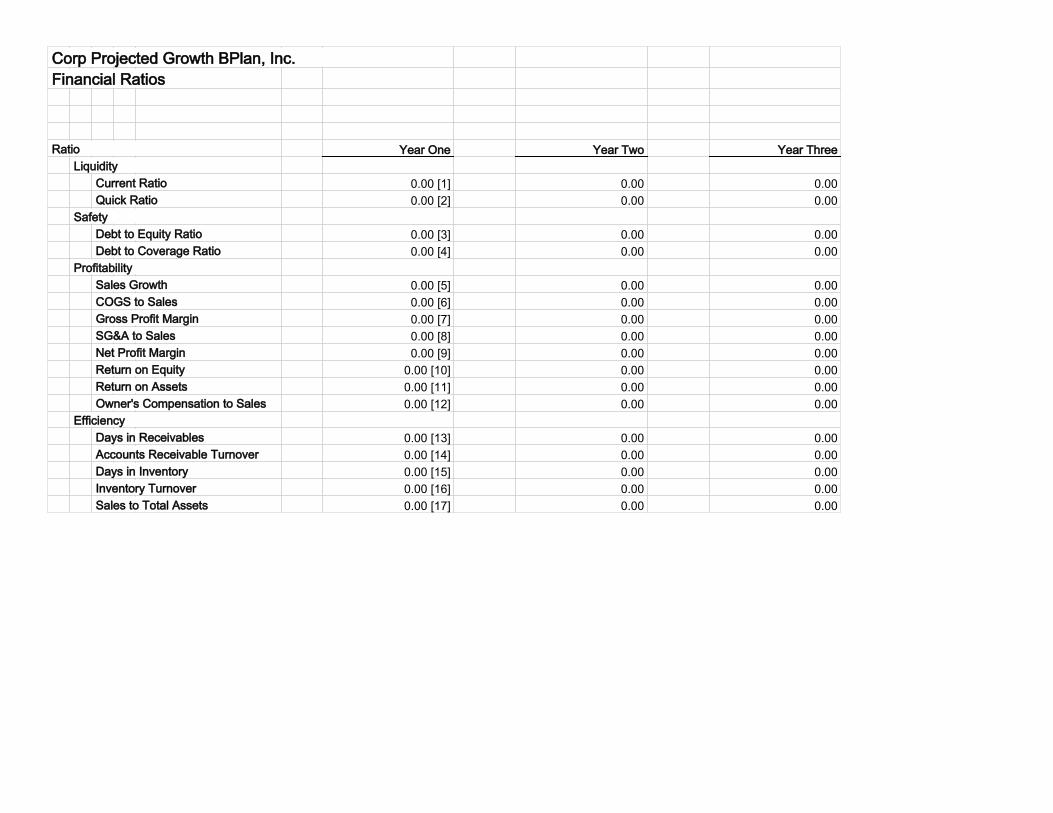
0.00 [1] 0.00 0.000.00 [2] 0.00 0.00
0.00 [3] 0.00 0.000.00 [4] 0.00 0.00
0.00 [5] 0.00 0.000.00 [6] 0.00 0.000.00 [7] 0.00 0.000.00 [8] 0.00 0.000.00 [9] 0.00 0.00
0.00 [10] 0.00 0.000.00 [11] 0.00 0.000.00 [12] 0.00 0.00
0.00 [13] 0.00 0.000.00 [14] 0.00 0.000.00 [15] 0.00 0.000.00 [16] 0.00 0.000.00 [17] 0.00 0.00
Corp Projected Growth BPlan, Inc.Financial Ratios
RatioLiquidity
Current RatioQuick Ratio
SafetyDebt to Equity RatioDebt to Coverage Ratio
ProfitabilitySales GrowthCOGS to SalesGross Profit MarginSG&A to SalesNet Profit MarginReturn on EquityReturn on AssetsOwner's Compensation to Sales
EfficiencyDays in ReceivablesAccounts Receivable TurnoverDays in InventoryInventory TurnoverSales to Total Assets

Dollars Percent$0 100.00%
0 0.00%0 0.00%
000
00.00%
$0
to do ? variable costs
Corp Projected Growth BPlan, Inc.Breakeven Analysis
Breakeven AnalysisAnnual Sales RevenueCost of SalesGross Margin
Salaries and WagesFixed Operating ExpensesTotal Fixed Business Expenses
Breakeven Sales Calculation
Breakeven Sales in Dollars

Assumptions yrs Month 1 Month 2 Month 3 Month 4 Month 5 Month 6 Month 7 Month 8 Month 9 Month 10 Month 11 Month 12 Totals
$09.00%84.00 7$0.00
0 0 0 0 0 0 0 0 0 0 0 0 00 0 0 0 0 0 0 0 0 0 0 0 00 0 0 0 0 0 0 0 0 0 0 0
0 0 0 0 0 0 0 0 0 0 0 0 00 0 0 0 0 0 0 0 0 0 0 0 00 0 0 0 0 0 0 0 0 0 0 0
0 0 0 0 0 0 0 0 0 0 0 0 00 0 0 0 0 0 0 0 0 0 0 0 00 0 0 0 0 0 0 0 0 0 0 0
$0.009.00%240.00
$0.00
0 0 0 0 0 0 0 0 0 0 0 0 00 0 0 0 0 0 0 0 0 0 0 0 00 0 0 0 0 0 0 0 0 0 0 0
0 0 0 0 0 0 0 0 0 0 0 0 00 0 0 0 0 0 0 0 0 0 0 0 00 0 0 0 0 0 0 0 0 0 0 0
0 0 0 0 0 0 0 0 0 0 0 0 00 0 0 0 0 0 0 0 0 0 0 0 00 0 0 0 0 0 0 0 0 0 0 0
Corp Projected Growth BPlan, Inc.Amortization Schedule
Loan Type
Commercial LoanPrincipal AmountInterest RateLoan Term in MonthsMonthly Payment Amoun
Year OneInterestPrincipalLoan Balance
Year TwoInterestPrincipalLoan Balance
Year ThreeInterestPrincipalLoan Balance
Commercial MortgagePrincipal AmountInterest RateLoan Term in MonthsMonthly Payment Amoun
Year OneInterestPrincipalLoan Balance
Year TwoInterestPrincipalLoan Balance
Year ThreeInterestPrincipalLoan Balance
Value
0.00%0.00%
9.00%84
9.00%240.00
0.00%
0.00%$0
0.00%0.00%
$00.00%
$0$0
0.00%
00
0.00%
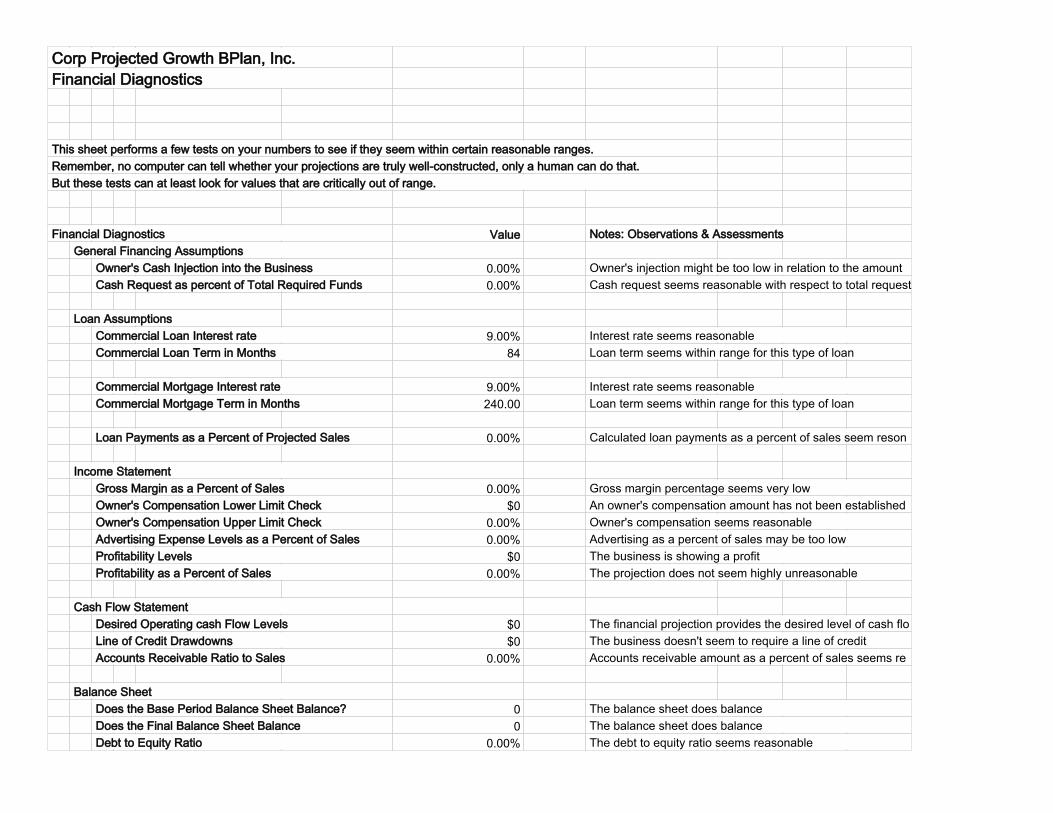
Corp Projected Growth BPlan, Inc.Financial Diagnostics
This sheet performs a few tests on your numbers to see if they seem within certain reasonable ranges.Remember, no computer can tell whether your projections are truly well-constructed, only a human can do that.But these tests can at least look for values that are critically out of range.
Financial Diagnostics Notes: Observations & AssessmentsGeneral Financing Assumptions
Owner's Cash Injection into the Business Owner's injection might be too low in relation to the amountCash Request as percent of Total Required Funds Cash request seems reasonable with respect to total request
Loan AssumptionsCommercial Loan Interest rate Interest rate seems reasonableCommercial Loan Term in Months Loan term seems within range for this type of loan
Commercial Mortgage Interest rate Interest rate seems reasonableCommercial Mortgage Term in Months Loan term seems within range for this type of loan
Loan Payments as a Percent of Projected Sales Calculated loan payments as a percent of sales seem reson
Income StatementGross Margin as a Percent of Sales Gross margin percentage seems very lowOwner's Compensation Lower Limit Check An owner's compensation amount has not been establishedOwner's Compensation Upper Limit Check Owner's compensation seems reasonableAdvertising Expense Levels as a Percent of Sales Advertising as a percent of sales may be too lowProfitability Levels The business is showing a profitProfitability as a Percent of Sales The projection does not seem highly unreasonable
Cash Flow StatementDesired Operating cash Flow Levels The financial projection provides the desired level of cash floLine of Credit Drawdowns The business doesn't seem to require a line of creditAccounts Receivable Ratio to Sales Accounts receivable amount as a percent of sales seems re
Balance SheetDoes the Base Period Balance Sheet Balance? The balance sheet does balanceDoes the Final Balance Sheet Balance The balance sheet does balanceDebt to Equity Ratio The debt to equity ratio seems reasonable

$0Breakeven Analysis
Breakeven Levels The sales projection is less than the break-even amount

[1] An indication of a company's ability to meet short-term debt obligations.
[2] The ratio between all assets quickly convertible into cash and current liabilities. Measures a company's liquidity. Alsocalled acid-test ratio.
[3] This ratio expresses the relationship between capital contributed by creditors and that contributed by owners.
[4] This ratio indicates how well your cash flow covers debt and the capability of the business to take on additional debt.
[5] This ratio calculates the percentage of increase (or decrease) in sales between the current year and the previous year.
[6] The percentage of sales used to pay for the COGS (expenses which directly vary with sales) is expressed in this ratio.
[7] This ratio indicates how much profit is earned on your products without consideration of indirect costs, selling andadministration costs.
[8] This ratio measures the percentage of selling, general and administrative costs to your amount of sales.
[9] Net profit margin shows how much profit comes from every dollar of sales.
[10] Return on equity determines the rate of return on your investment in the business. As an owner or shareholder this is oneof the most important ratios as it shows the hard fact about the business - are you making enough of a profit to compensateyou for the risk of being in business?
[11] This ratio measures how effectively assets are used to generate a return.
[12] This ratio measures the owner's compensation as a percentage of sales.
[13] Days in receivable calculates the average number of days it takes to collect your account receivable (number of days ofsales in receivables).
[14] This ratio tells you the number of times accounts receivable turnover during the year.
[15] This ratio shows the average number of days it will take to sell your inventory.
[16] This ratio calculates the number of times inventory is turned over (or sold) during the year.
[17] This ratio indicates how efficiently your business generates sales on every dollar of assets.