Embed Size (px)
Citation preview

Working with Natural Processes – Evidence Directory i
Working with Natural Processes – Evidence Directory
SC150005

Working with Natural Processes – Evidence Directory ii
We are the Environment Agency. We protect and improve the environment.
Acting to reduce the impacts of a changing climate on people and wildlife is at the heart of everything we do.
We reduce the risks to people, properties and businesses from flooding and coastal erosion.
We protect and improve the quality of water, making sure there is enough for people, businesses, agriculture and the environment. Our work helps to ensure people can enjoy the water environment through angling and navigation.
We look after land quality, promote sustainable land management and help protect and enhance wildlife habitats. And we work closely with businesses to help them comply with environmental regulations.
We can’t do this alone. We work with government, local councils, businesses, civil society groups and communities to make our environment a better place for people and wildlife.
Published by: Environment Agency, Horizon House, Deanery Road, Bristol, BS1 5AH http://www.gov.uk/government/organisations/environment-agency © Environment Agency – February 2018 All rights reserved. This document may be reproduced with prior permission of the Environment Agency. Email: [email protected] Further copies of this report are available from our publications catalogue: http://www.gov.uk/government/publications or our National Customer Contact Centre: T: 03708 506506 Email: [email protected]
Author(s): Lydia Burgess-Gamble, Rachelle Ngai, Mark Wilkinson, Tom Nisbet, Nigel Pontee, Robert Harvey, Kate Kipling, Stephen Addy, Steve Rose, Steve Maslen, Helen Jay, Alex Nicholson, Trevor Page, Jennine Jonczyk and Paul Quinn Dissemination status: Publicly available Keywords: Flood and Coastal Erosion Risk Management, Working with Natural Processes, Natural Flood Management Research contractor: JBA Consulting – Lead contractor. Sub-contractors: CH2M Hill, Forest Research, James Hutton Institute, Lancaster University and Newcastle University. Environment Agency’s Project Manager: Lydia Burgess-Gamble Theme Manager: Jacqui Cotton – Policy Strategy and Investment Collaborator(s): Defra, English Severn and Wye RFCC, Forest Research, HR Wallingford, Natural England, Natural Resources Wales, River Restoration Centre, SEPA, Woodland Trust Project number: SC150005

Working with Natural Processes – Evidence Directory iii
Evidence at the Environment Agency Scientific research and analysis underpins everything the Environment Agency does. It helps us to understand and manage the environment effectively. Our own experts work with leading scientific organisations, universities and other parts of the Defra group to bring the best knowledge to bear on the environmental problems that we face now and in the future. Our scientific work is published as summaries and reports, freely available to all.
This report is the result of research commissioned by the Environment Agency’s FCRM Directorate and funded by the Joint Flood and Coastal Erosion Risk Management Research and Development Programme. The programme is a joint collaboration between the Environment Agency, Defra, Natural Resources Wales and the Welsh Government. It conducts, manages and promotes flood and coastal erosion risk management research and development.
You can find out more about our current science programmes at https://www.gov.uk/government/organisations/environment-agency/about/research.
If you have any comments or questions about this report or the Environment Agency’s other scientific work, please contact [email protected].
Professor Doug Wilson Director, Research, Analysis and Evaluation
Working with Natural Processes – Evidence Directory iv
Executive summary Working with Natural Processes (WWNP) aims to protect, restore and emulate the natural functions of catchments, floodplains, rivers and the coast. Considerable research has been undertaken on this topic, but it has been disparate and never synthesised into one location. This report presents the evidence base setting out the current state of the scientific evidence underpinning WWNP. Its purpose is to give flood risk management practitioners and other responsible bodies easy access to information which explains ‘what we know’ and ‘what we don’t know’ about the effectiveness of a range of different measures from a flood risk and ecosystem services perspective.
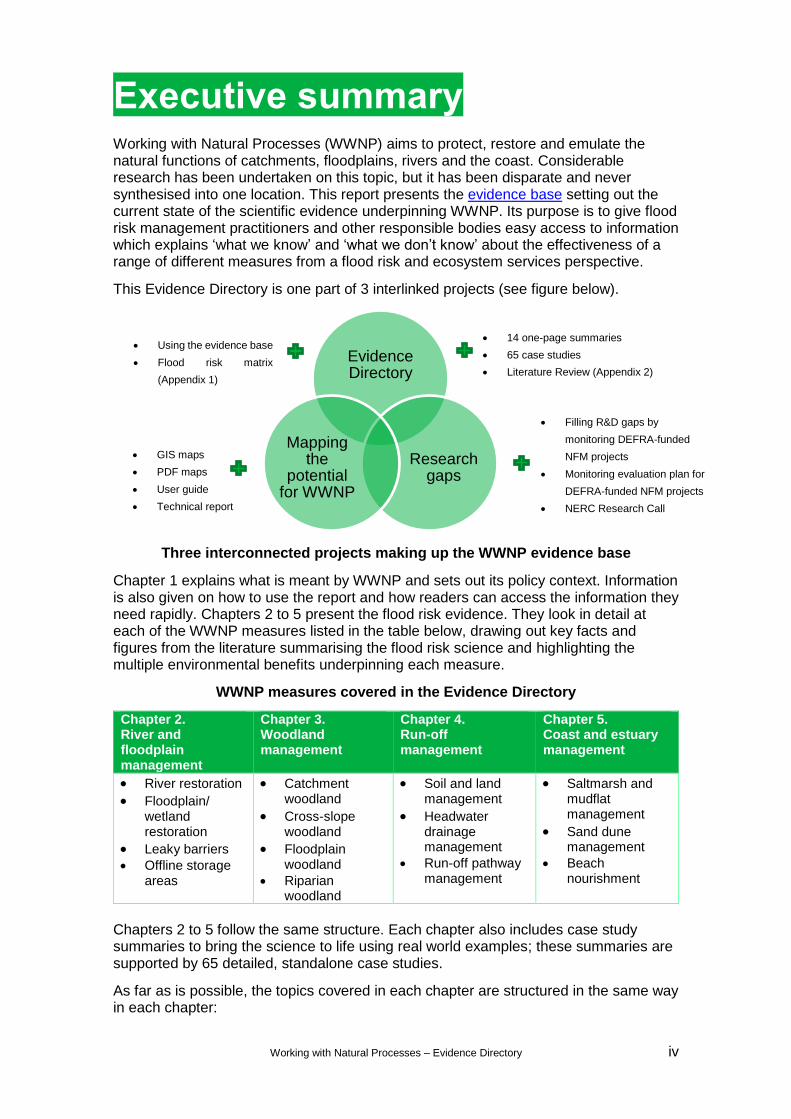
This Evidence Directory is one part of 3 interlinked projects (see figure below).
Three interconnected projects making up the WWNP evidence base
Chapter 1 explains what is meant by WWNP and sets out its policy context. Information is also given on how to use the report and how readers can access the information they need rapidly. Chapters 2 to 5 present the flood risk evidence. They look in detail at each of the WWNP measures listed in the table below, drawing out key facts and figures from the literature summarising the flood risk science and highlighting the multiple environmental benefits underpinning each measure.
WWNP measures covered in the Evidence Directory
Chapter 2. River and floodplain management
Chapter 3. Woodland management
Chapter 4. Run-off management
Chapter 5. Coast and estuary management
River restoration
Floodplain/ wetland restoration
Leaky barriers Offline storage
areas
Catchment woodland
Cross-slope woodland
Floodplain woodland
Riparian woodland
Soil and land management
Headwater drainage management
Run-off pathway management
Saltmarsh and mudflat management
Sand dune management
Beach nourishment
Chapters 2 to 5 follow the same structure. Each chapter also includes case study summaries to bring the science to life using real world examples; these summaries are supported by 65 detailed, standalone case studies.
As far as is possible, the topics covered in each chapter are structured in the same way in each chapter:
Evidence Directory
Research gaps
Mapping the
potential for WWNP
GIS maps
PDF maps
User guide
Technical report
Literature Review
14 one-page summaries
65 case studies
Literature Review (Appendix 2)
Filling R&D gaps by
monitoring DEFRA-funded
NFM projects
Monitoring evaluation plan for
DEFRA-funded NFM projects
NERC Research Call
Using the evidence base
Flood risk matrix
(Appendix 1)

Working with Natural Processes – Evidence Directory v
1. Introduce the measure and explain how it reduces flood risk
2. Set out the flood risk evidence
3. Define the multiple benefits achieved by each measures
Each of these chapters ends with:
a summary of ‘what we know’ and ‘what we don’t know’
a list of links to sources of further reading
These chapters are supported by a detailed Literature Review (Appendix 2).
We have written a supplementary guide which sits alongside the Evidence Directory and the Maps, and explains how you can use this evidence base to help make the case for WWNP. It also includes guidance on implementing these sorts of measures in areas at risk of groundwater flooding.
Chapter 6 reiterates the main research gaps that cut across the 4 flood risk evidence chapters and provides some guidance on how to monitor WWNP projects.
Working with Natural Processes – Evidence Directory vi
Acknowledgements We would like to thank SEPA (Heather Forbes) and the Woodland Trust (Christine Reid) for contributing financially to this project.
We are also very grateful to our Project Board and Project Steering Group – from Defra, English Severn and Wye RFCC, Forest Research, HR Wallingford, Natural England, Natural Resources Wales, the Rivers Restoration Centre, SEPA and the Woodland Trust – who have reviewed and commented on drafts of this Evidence Directory.
A big thank you to our external peer reviewers – Angela Gurnell (Queen Mary College, London), Gareth Old and Mike Acreman (CEH), Joseph Holden (Leeds University) and Nigel Pontee (CH2M Hill) – who have all provided invaluable comments and suggested improvements to this document.
A big thank you to internal colleagues from the Environment Agency’s Fisheries, Biodiversity and Geomorphology teams - who have helped us to develop the ecosystem services descriptions and associated benefits wheels included here.
Many people from a wide range of organisations have taken time to contribute case studies and to review and input to the content of this document. We are extremely grateful for your input and we are extremely pleased to be able to showcase your projects.
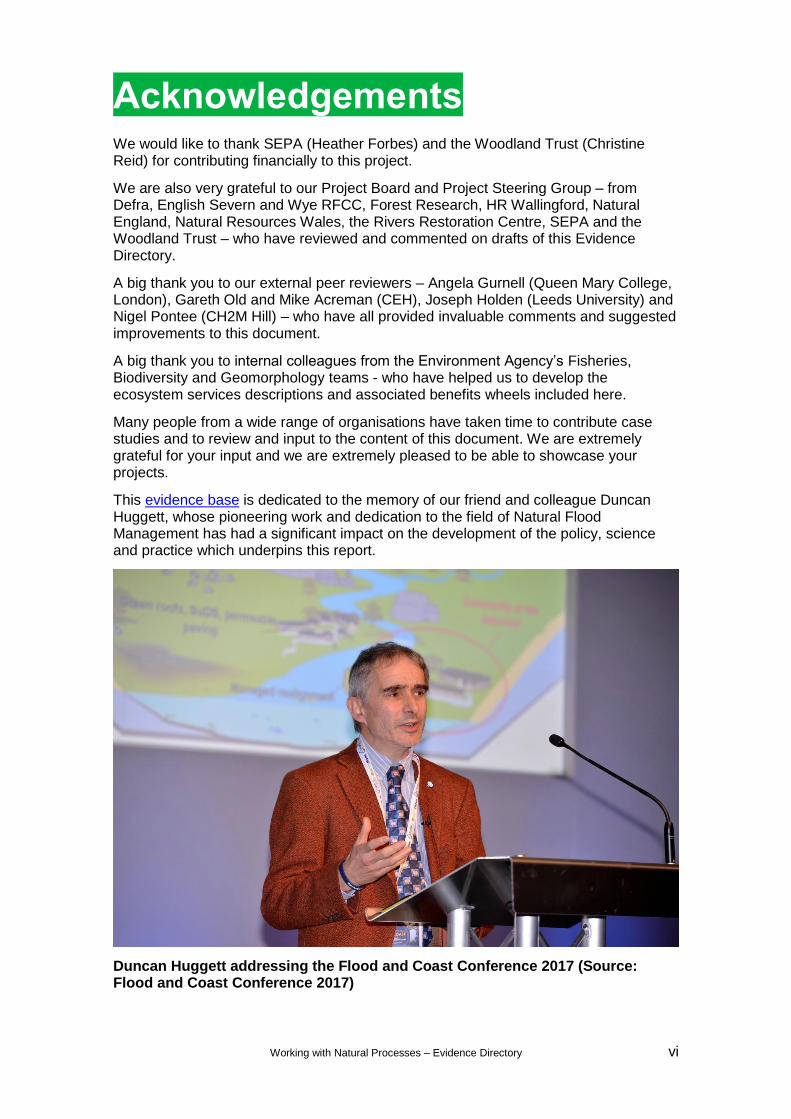
This evidence base is dedicated to the memory of our friend and colleague Duncan Huggett, whose pioneering work and dedication to the field of Natural Flood Management has had a significant impact on the development of the policy, science and practice which underpins this report.
Duncan Huggett addressing the Flood and Coast Conference 2017 (Source: Flood and Coast Conference 2017)

Working with Natural Processes – Evidence Directory vii
Contents
Chapter 1. Evidence Directory – introduction and user guide 1
1 Evidence Directory – introduction and user guide 2
1.1 Introduction 2
1.2 What is Working with Natural Processes? 4
1.3 Using this report 7
1.4 Further reading 13
Chapter 2. River and floodplain management 14
2 River and floodplain management 15
2.1 Introduction 15
2.2 River restoration 16
2.3 Floodplain and floodplain wetland restoration 24
2.4 Leaky/woody barriers 35
2.5 Offline storage areas 47
2.6 Headline flood risk messages 56
2.7 Potential funding mechanisms 58
2.8 Further reading 58
Chapter 3. Woodland management 60
3 Woodland management 61
3.1 Introduction 61
3.2 Catchment woodland 62
3.3 Cross-slope woodland 72
3.4 Floodplain woodland 79
3.5 Riparian woodland 87
3.6 Headline flood risk messages 95
3.7 Potential funding mechanisms 98
3.8 Further reading 98
Chapter 4. Run-off management 99
4 Run-off management 100
4.1 Introduction 100
4.2 Soil and land management 101
4.3 Headwater drainage management 112
4.4 Run-off pathway management 124
4.5 Headline flood risk messages 136
4.6 Potential funding mechanisms 140
4.7 Further reading 140

Working with Natural Processes – Evidence Directory viii
Chapter 5. Coast and estuary management 142
5 Coast and estuary management 143
5.1 Introduction 143
5.2 Saltmarsh and mudflat management and restoration 147
5.3 Sand dune management and restoration 176
5.4 Beach nourishment 195
5.5 Headline flood risk messages 215
5.6 Potential funding mechanisms 218
5.7 Further reading 219
Chapter 6. Research gaps and monitoring 220
6 Research gaps and monitoring 221
6.1 Introduction 221
6.2 Extent of monitoring needed 224
6.3 Monitoring techniques 230
6.4 Examples of monitoring 234
6.5 Evaluating monitoring data 242
6.6 Further reading 242
References 243
Bibliography 286
List of abbreviations 289
Glossary of terms 290
Appendix. 1 List of case studies 290
List of tables and figures
Table 1.1 Legislative policy drivers 4 Table 1.2 WWNP measures covered in the Evidence Directory 8 Table 1.3 Topics covered in flood risk evidence sections 9 Table 1.4 Meaning of common terms used in the Evidence Directory 10 Table 2.1 River restoration monetary value estimates of contribution of different types of NFM to flood risk
reduction 23 Table 2.2 Floodplain restoration monetary value estimates of contribution of different types of NFM to flood risk
reduction 31 Table 2.3 Leaky barrier monetary value estimates of contribution of different types of NFM to flood risk
reduction 46 Table 2.4 Offline storage area monetary value estimates of contribution of different types of NFM to flood risk
reduction 54 Table 2.5 Examples of potential funding mechanisms for river and floodplain management measures 58 Table 3.1 Catchment woodland monetary value estimates of contribution of different types of NFM to flood risk
reduction 71 Table 3.2 Floodplain woodland monetary value estimates of contribution of different types of NFM to flood risk
reduction 86 Table 3.3 Riparian woodland monetary value estimates of contribution of different types of NFM to flood risk
reduction 94 Table 3.4 Examples of potential funding mechanisms for woodland management measures 98 Table 4.1 Headwater drainage management monetary value estimates of contribution of different types of NFM to
flood risk reduction 122 Table 4.2 Run-off pathway management monetary value estimates of contribution of different types of NFM to
flood risk reduction 135 Table 4.3 Examples of potential funding mechanisms for run-off management measures 140

Working with Natural Processes – Evidence Directory ix
Table 5.1 Saltmarsh and mudflat management techniques 154 Table 5.2 Four approaches to dune management 182 Table 5.3 Four approaches to beach nourishment 200 Table 5.4 Examples of potential funding mechanisms for coatsl measures 218 Table 6.1 Research gaps summary 221 Table 6.2 Basic hydrological monitoring instruments with estimated costs 232 Table 6.3 Environmental processes that can affect data quality 233
Figure 1.1 Working with Natural Processes – from source to sea 3 Figure 1.2 Alternative terms used to mean WWNP/NFM 4 Figure 1.3 The FCRM continuum (adapted from Environment Agency 2012a) 6 Figure 1.4 Three interconnected projects making up the WWNP evidence base 7 Figure 1.5 Approach used to help define confidence in evidence based on level of consensus around science and
amount of evidence 10 Figure 2.1 Examples of conventional river channel modifications 16 Figure 4.1 Soil and land management measures covered in this section 101 Figure 4.2 Headwater management measures covered in this section 113 Figure 4.3 Run-off management measures covered in this section 125 Figure 5.1 Coastal management planning hierarchy 144 Figure 5.2 Location of main saltmarsh systems in (a) England and (b) the UK 151 Figure 5.3 Regulated tidal exchange scheme at Goosemoor: (a) sluice structure facing into the estuary and (b)
culvert and stop logs inside the site 160 Figure 5.4 Flood control areas in the Scheldt estuary, Netherlands: (a) original design of flood control area; and (b)
revised design of flood control area 163 Figure 5.5 Location of the main coastal dune systems in England and Wales 180 Figure 5.6 Beach response to natural forcing 198 Figure 6.1 Planning your monitoring 223 Figure 6.2a Decision tree to help select right level of monitoring when adopting a ‘detailed’ experimental design 225 Figure 6.2b Decision tree to help select right level of monitoring when aopting a ‘lighter touch’ experimental design 226 Figure 6.3 Monitoring, scale and WWNP 229 Figure 6.4 Subcatchment hydrograph contributions to total catchment flow 230 Figure 6.5 Catchment experimental monitoring set-up 235 Figure 6.6 Belford catchment monitoring network and location of WWNP measures 237 Figure 6.7 Cluster of run-off attenuation features in the Belford catchment 237 Figure 6.8 Monitoring network within the Holnicote catchment 239 Figure 6.9 Spatial modelling informed by empirical evidence outlining the volume of water stored before and after
bunds were constructed 239 Figure 6.10 Outputs from hydraulic model in the Holnicote catchment using empirical evidence from the 23–24
December 2013 event 240 Figure 6.11 Left: Hodder catchment with main subcatchments. Right: schematic representation of the Hodder
catchment, including an overview of the hydrometric monitoring scheme 241
Working with Natural Processes – Evidence Directory 1
Chapter 1. Evidence Directory – introduction and user guide
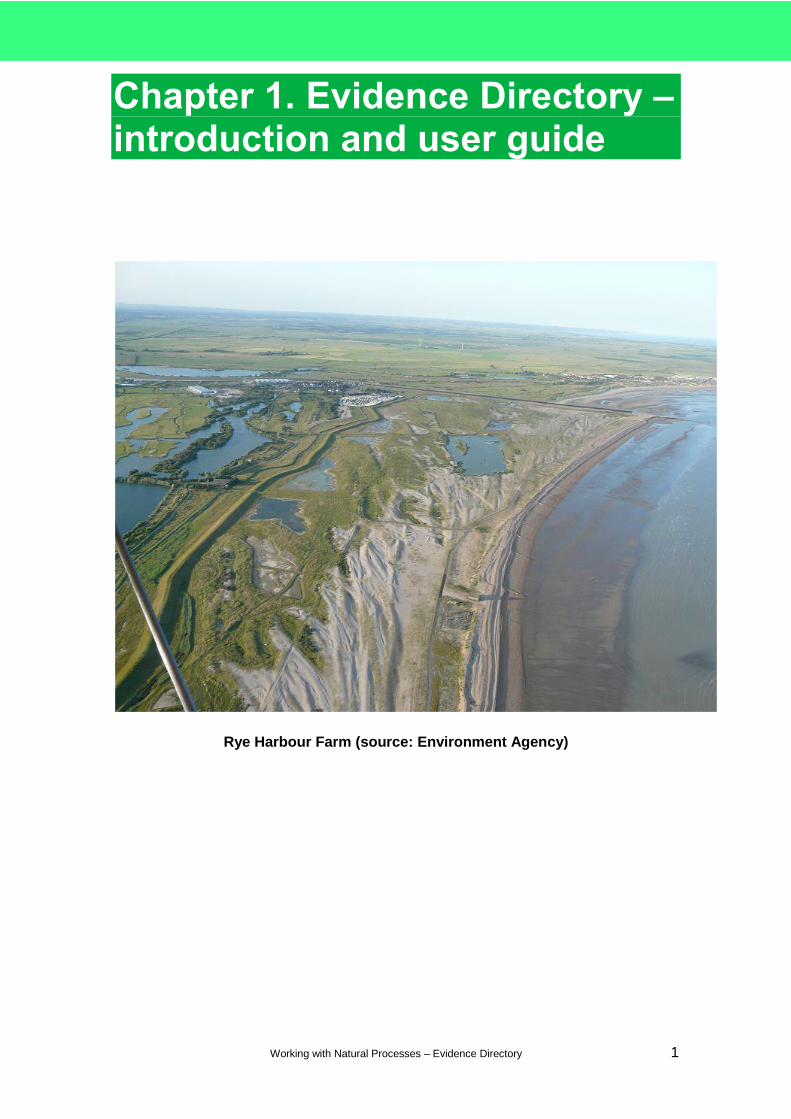
Rye Harbour Farm (source: Environment Agency)

Working with Natural Processes – Evidence Directory 2
1 Evidence Directory – introduction and user guide
1.1 Introduction
Working with Natural Processes (WWNP) is a form of flood risk management that can be implemented on hill slopes, rivers, floodplains, estuaries and coasts. Considerable research has already been conducted on this topic, but it has been disparate and never synthesised into one location.
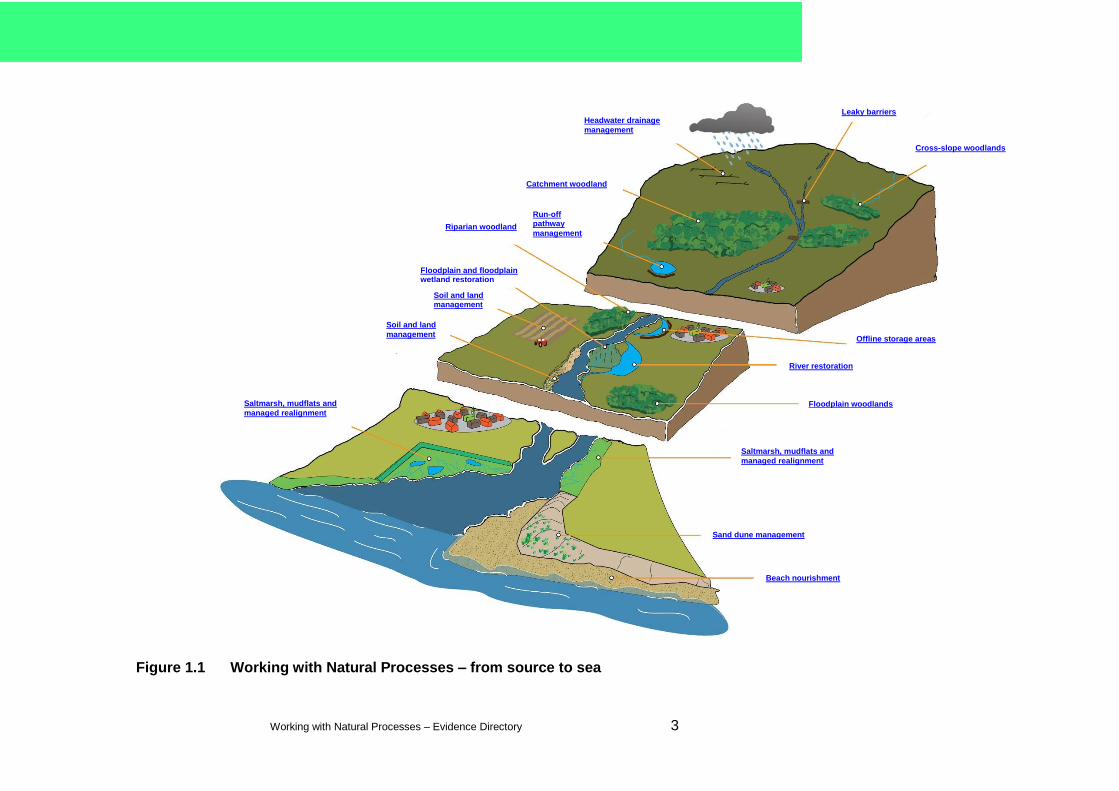
This report presents the evidence base for WWNP, setting out the current state of the scientific evidence underpinning it. Its purpose is to help flood risk management practitioners and other responsible bodies access information which explains ‘what we know’ and ‘what we don’t know’ about the effectiveness of a range of different measures (Figure 1.1) from a flood risk and ecosystem services perspective.
This chapter explains:
what WWNP is
its policy context
how to use this report and associated case studies
how to access the information you need quickly
Chapters 2 to 5 look in detail at each of the measures covered in Figure 1.1, delving into them in detail, drawing out key facts and figures from the literature and case studies, and presenting them in summary format. These chapters have the same structure and summarise the flood risk science and multiple environmental benefits underpinning each measure. Clicking on a topic of interest in Figure 1.1 will take you to the relevant section of this report.
Throughout each chapter, case study summary boxes are provided to bring the science to life using real world examples; these summaries are supported by 65 detailed case studies (see list in Appendix 1). At the end of each chapter, there is a summary of ‘what we know’ about each measure and ‘what we don’t know’ – the research gaps and practical questions which still need to be resolved. The lists of links to suggested further reading provided at the end of each chapter draw out some of the important literature of use by practitioners.1 In addition to the reference list and the bibliography at the end of this report, a detailed Literature Review is also provided in Appendix 2.
Chapter 6 reiterates the main research gaps that cut across all 4 chapters and provides some guidance on how to monitor WWNP projects. We have also written a separate guide which explains how you can use this evidence base to help make the case for WWNP. This report is one component of 3 interlinked projects (see Section 1.3), which together provide the current evidence behind WWNP and which were identified as high priority projects in the WWNP research and development framework.
1 Citations are given for those links with entries in the References section at the end of this
report. Full detasils of the other links are given in the Bibliography section.
Working with Natural Processes – Evidence Directory 3
Figure 1.1 Working with Natural Processes – from source to sea
Beach nourishment
Sand dune management
Offline storage areas
River restoration
Floodplain woodlands Saltmarsh, mudflats and
managed realignment
Saltmarsh, mudflats and
managed realignment
Cross-slope woodlands
Leaky barriers
Floodplain and floodplain wetland restoration
Riparian woodland
Soil and land management
Soil and land
management
Run-off pathway
management
Catchment woodland
Headwater drainage
management
Working with Natural Processes – Evidence Directory 4
1.2 What is Working with Natural Processes?
1.2.1 Introduction
WWNP aims to protect, restore and emulate the natural functions of catchments, floodplains, rivers and the coast (Environment Agency 2012a). It takes many different forms (Figure 1.1) and can be applied in urban and rural areas, and on rivers, estuaries and coasts.
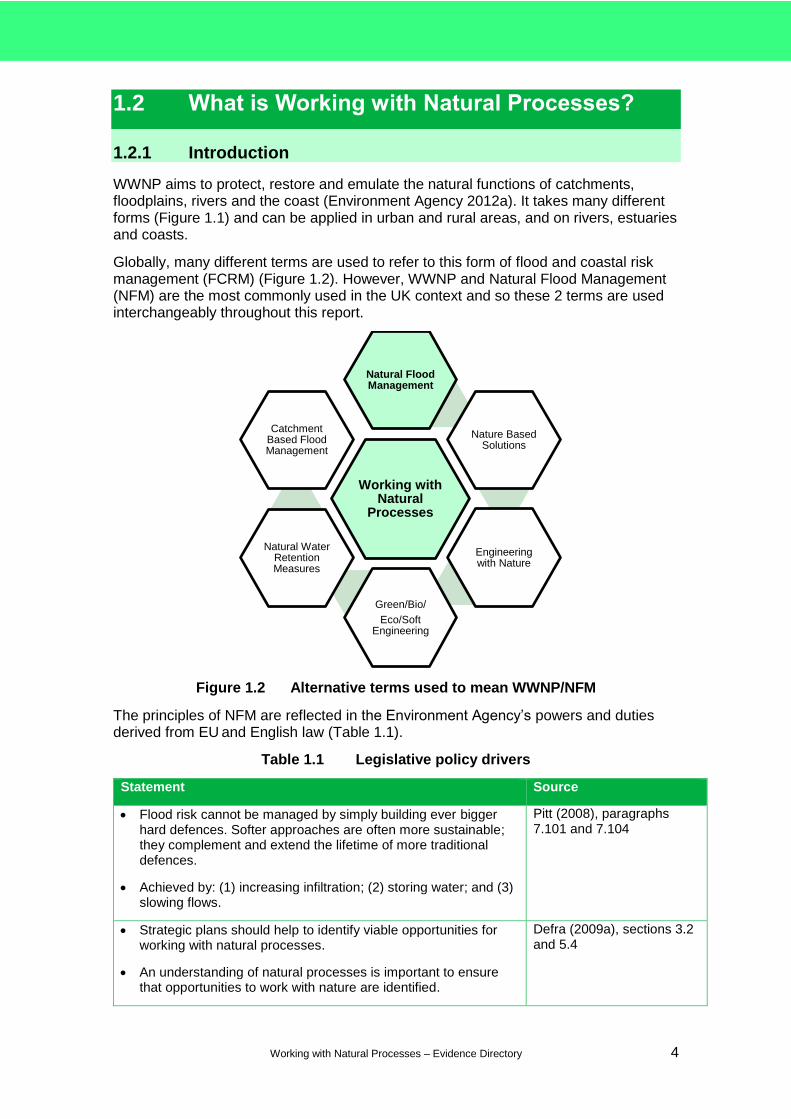
Globally, many different terms are used to refer to this form of flood and coastal risk management (FCRM) (Figure 1.2). However, WWNP and Natural Flood Management (NFM) are the most commonly used in the UK context and so these 2 terms are used interchangeably throughout this report.
Figure 1.2 Alternative terms used to mean WWNP/NFM
The principles of NFM are reflected in the Environment Agency’s powers and duties derived from EU and English law (Table 1.1).
Table 1.1 Legislative policy drivers
Statement Source
Flood risk cannot be managed by simply building ever bigger hard defences. Softer approaches are often more sustainable; they complement and extend the lifetime of more traditional defences.
Achieved by: (1) increasing infiltration; (2) storing water; and (3) slowing flows.
Pitt (2008), paragraphs 7.101 and 7.104
Strategic plans should help to identify viable opportunities for working with natural processes.
An understanding of natural processes is important to ensure that opportunities to work with nature are identified.
Defra (2009a), sections 3.2 and 5.4
Working with Natural
Processes
Natural Flood Management
Nature Based Solutions
Engineering with Nature
Green/Bio/
Eco/SoftEngineering
Natural Water Retention Measures
Catchment Based Flood Management
Working with Natural Processes – Evidence Directory 5
Statement Source
Working with Natural Processes:
should not be seen as an ‘environmental option’
can deliver flood risk management, environmental and socioeconomic benefits
produce solutions that are more flexible and more resilient
can help reduce the costs of options
Environment Agency (2010a), Sections 6.3.2 and 6.3.3
FCRM authorities should work with natural processes where possible and enhance the environment.
Defences that work with natural processes generally are more sustainable.
NFM measures are often more resilient to extreme events and provide better value for money.
Defra and Environment Agency (2011), Section 3.2
Natural water retention measures:
are multifunctional measures that aim to protect water resources using natural means and processes
provide multiple benefits, including flood risk reduction
help to achieve the goals of key EU policies such as Water Framework Directive, the Floods Directive and the Habitats Directive
WG PoM (2014), Section 1
Source: adapted from Environment Agency internal NFM position statement
1.2.2 What does it include
A wide range of techniques can be used to reduce flood risk by slowing and attenuating flow while achieving other benefits. For example, restoring peat moorlands, remeandering rivers, targeted woodland planting and improving floodplain connectivity all help to reduce the flood risk to communities downstream. These techniques can be used in combination with more traditional hard engineering options.
Other NFM measures include (Figure 1.1):
restoring functioning floodplains
restoring rivers and removing redundant in-channel structures
installing or retaining large woody material in river channels
land and soil management measures
restoring moorland and woodland in the headwaters
creating rural and urban sustainable drainage schemes
restoration and management of sand dunes, saltmarshes and mudflats
managed realignment
beach nourishment

Working with Natural Processes – Evidence Directory 6
The effectiveness of NFM measures is site-specific and depends on many factors, including the location and scale at which they are used. It may not always be possible to guarantee that NFM measures alone will deliver a specified standard of defence. Consequently, flood risk management measures are normally chosen from a continuum of options ranging from traditional forms of engineering through to more natural systems, with a wide range of responses in between (Figure 1.3). As illustrated in Figure 1.3, different types of measures can work more or less with river and coastal processes to reduce flood and coastal erosion risk. Where an individual measure is situated on this spectrum will depend to a certain degree on how it has been designed and constructed. For example, a well-executed floodplain restoration project can fully restore natural processes (left hand of the spectrum), reducing flood risk and improving the environment. A floodplain restoration project that has been designed solely to capture floodwaters during high flows, however, may be located further right on the spectrum. Designing WWNP measures that seek to restore as well as emulate natural processes usually provides greater benefits to people and the environment.
Rivers that meander and slow water
Floodplains that slow and store water
Leaky barriers which slow and store water
Soils which store and slow water
Hillslope that captures and stores run-off
Pond that holds water and traps silt
Woodlands that slow and store water
Saltmarshes and mudflats that store floodwaters and buffer wave energy
Sand dunes that buffer wave energy and preserve defences
Beach nourishment which preserves defences
Green engineered erosion protection atops bank erosion
Hard defences which stop coastline/river banks moving
Figure 1.3 The FCRM continuum (adapted from Environment Agency 2012a)
Hard engineering
Soft engineering
Significant natural
restoration
Assisted natural
recovery
Natural Recovery
Protecting and restoring natural processes
Emulating and managing natural processes

Working with Natural Processes – Evidence Directory 7
This approach will help achieve more sustainable flood risk management schemes, often with significant additional environmental and social benefits. It can be used in conjunction with traditionally constructed hard defences to increase the resilience of communities to extreme flooding. NFM may be the only or most suitable option for small communities where a more traditional scheme may not be financially viable.
Using the right combination of measures in the right places can help to slow flood peaks and reduce the depth and duration of flooding. It also achieves other benefits at the same time. These include:
reducing soil erosion and sedimentation of lakes and rivers
increasing carbon capture and storage
improving water quality
reconnecting rivers with species-rich floodplain wetlands
enhancing recreation opportunities
creating new habitat to help restore biological diversity
A better environment can improve human health and well-being, and make a significant contribution to the local economy. WWNP is, and should be, an integral part of the sustainable management and reduction of flood risk. Sometimes it will be the whole solution and sometimes it may have a smaller role.
1.3 Using this report
1.3.1 Introduction
This Evidence Directory summarises the scientific evidence base that underpins WWNP. It is one part of 3 interlinked projects (Figure 1.4).
Figure 1.4 Three interconnected projects making up the WWNP evidence base
Evidence Directory
The Evidence Directory (this document) summarises what is known about the effectiveness of different measures (Figure 1.3) from a flood risk management and ecosystem services perspective. It is underpinned by a detailed Literature Review (Appendix 2) and linked to real world examples through 65 standalone case studies. In
Evidence Directory
Research gaps
Mapping the
potential for WWNP
14 Evidence one-page summaries
65 case studies
Literature Review (Appendix 2)
Filling R&D gaps by
monitoring Defra-funded NFM
projects
Monitoring evaluation plan for
Defra-funded NFM projects
NERC Research Call
GIS maps
PDF maps
User guide
Technical report
Literature Review
Using the evidence base
Flood risk matrix
(Appendix 1)

Working with Natural Processes – Evidence Directory 8
addition, 14 one-page summaries of each of the measures covered in this report – have been produced.
The Evidence Directory is intended to be a useful resource to help you think about which FCRM measures may potentially work best in your catchment.
Mapping the potential for WWNP
These maps are intended to be used alongside the Evidence Directory to help practitioners think about the types of measure that may work in a catchment and the best places in which to locate them. It is a useful tool to help start conversations with key partners. The maps are provided in spatial data and PDF format, and are supported by a user guide and a detailed technical guide.
Using the evidence base to make the case for NFM
We have written a supplementary guide which sits alongside the Evidence Directory and the Maps, and explains how you can use this evidence base to help make the case for WWNP. It also includes guidance on implementing these sorts of measures in areas at risk of groundwater flooding.
Research gaps
Each chapter in the Evidence Directory identifies the research gaps that need to be addressed to help move this form of FCRM into the mainstream. The Environment Agency has worked with the Natural Environment Research Council (NERC) to develop a Research Call to help address some of these gaps and with many of the Principal Investigators to inform their proposals. NERC has announced it will spend £3.4m across three projects in the Upper Thames, Cumbria and the Peak District.
The list of research gaps has also been shared with Defra-funded NFM projects so that these can address research gaps through long-term monitoring. As part of this project, an evaluation plan is being developed to capture the outcomes of this monitoring so the outcomes of the research can be shared across the WWNP community.
1.3.2 What does the report cover?
Which measures are covered?
This report looks in detail at the 14 measures indicated in Figure 1.1. They are covered in each chapter in the order shown in Table 1.2.
Table 1.2 WWNP measures covered in the Evidence Directory
Chapter 2. River and floodplain management
Chapter 3. Woodland management
Chapter 4. Run-off management
Chapter 5. Coast and estuary management
River restoration
Floodplain/ wetland restoration
Leaky barriers Offline storage
areas
Catchment woodland
Cross-slope woodland
Floodplain woodland
Riparian woodland
Soil and land management
Headwater drainage management
Run-off pathway management
Saltmarsh and mudflat management
Sand dune management
Beach nourishment

Working with Natural Processes – Evidence Directory 9
While it is recognised that there are many other forms of WWNP, this report focuses on the measures it is believed have the greatest potential to reduce flood and coastal erosion risk. It is also recognised that covering measures separately in each chapter is slightly artificial as most WWNP schemes include a wide range of measures implemented together.
Which topics are covered?
The flood risk evidence chapters cover the topics listed in Table 1.3.
Table 1.3 Topics covered in flood risk evidence sections
Chapters 2, 3 and 4* Chapter 5
Effect on flood flows, peaks and storage
Effect on sedimentation and geomorphology
Effect at different catchment scales
Effect in different watercourse typologies
Design life and effectiveness
Maintenance requirements
Flood and coastal erosion risk evidence
Distribution in England and Wales
Relevant physical processes
Management approach
Maintenance
Notes: Not all the topics listed are always covered in Chapter 4 due to a lack of available
evidence.
As far as is possible the measures described in these chapters are presented using the same structure.
1. Introduce the measure and explain how it reduces flood risk
2. Set out the flood risk evidence
3. Define the multiple benefits achieved by each measure
Each chapter ends with:
a summary of ‘what we know’ and ‘what we don’t know’
a list of links2 to sources of further reading
These chapters are supported by a detailed Literature Review (Appendix 2). Chapter 6 reiterates the main research gaps that cut across the flood risk evidence chapters and provides some guidance on how to monitor WWNP projects.
Scientific confidence levels
For each topic, the level of confidence in the science that underpins the individual measures is defined using the approach shown in Figure 1.5. This is the same approach developed through the LWEC score cards,3 which attaches a confidence level (high, medium or low) based on the potential effectiveness of each measure at reducing flood risk. This confidence level, assigned by scientific experts, reflects both the degree of agreement of scientific studies and the amount of information available.
2 All links were accessed in August 2017. 3 http://www.nerc.ac.uk/research/partnerships/ride/lwec/report-cards/water/
Working with Natural Processes – Evidence Directory 10
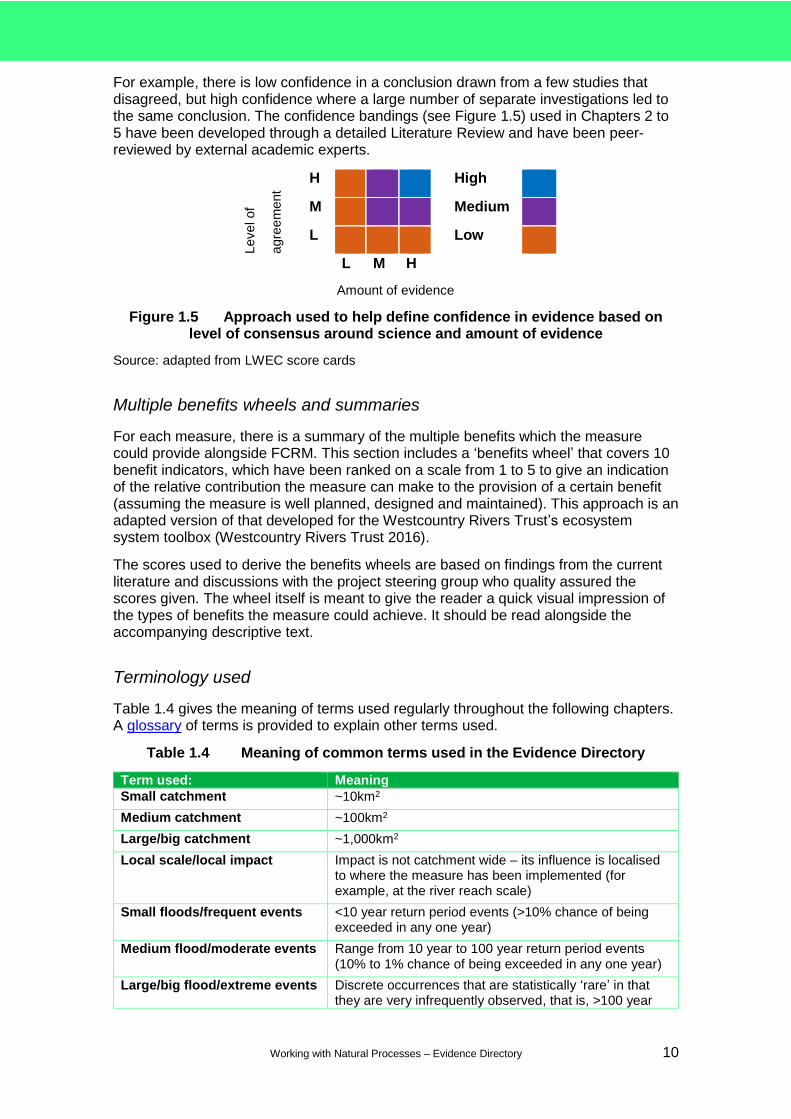
For example, there is low confidence in a conclusion drawn from a few studies that disagreed, but high confidence where a large number of separate investigations led to the same conclusion. The confidence bandings (see Figure 1.5) used in Chapters 2 to 5 have been developed through a detailed Literature Review and have been peer-reviewed by external academic experts.
Level of
agre
em
ent
H High
M Medium
L Low
L M H
Amount of evidence
Figure 1.5 Approach used to help define confidence in evidence based on level of consensus around science and amount of evidence
Source: adapted from LWEC score cards
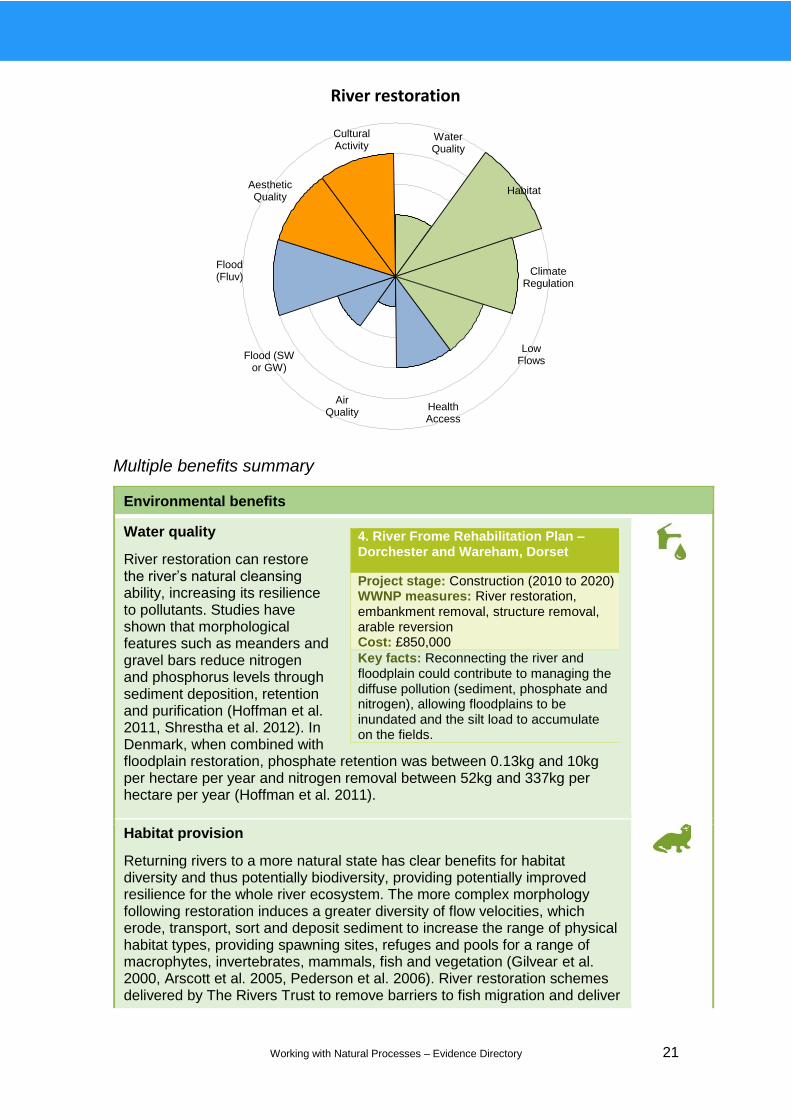
Multiple benefits wheels and summaries
For each measure, there is a summary of the multiple benefits which the measure could provide alongside FCRM. This section includes a ‘benefits wheel’ that covers 10 benefit indicators, which have been ranked on a scale from 1 to 5 to give an indication of the relative contribution the measure can make to the provision of a certain benefit (assuming the measure is well planned, designed and maintained). This approach is an adapted version of that developed for the Westcountry Rivers Trust’s ecosystem system toolbox (Westcountry Rivers Trust 2016).
The scores used to derive the benefits wheels are based on findings from the current literature and discussions with the project steering group who quality assured the scores given. The wheel itself is meant to give the reader a quick visual impression of the types of benefits the measure could achieve. It should be read alongside the accompanying descriptive text.
Terminology used
Table 1.4 gives the meaning of terms used regularly throughout the following chapters. A glossary of terms is provided to explain other terms used.
Table 1.4 Meaning of common terms used in the Evidence Directory
Term used: Meaning
Small catchment ~10km2
Medium catchment ~100km2
Large/big catchment ~1,000km2
Local scale/local impact Impact is not catchment wide – its influence is localised to where the measure has been implemented (for example, at the river reach scale)
Small floods/frequent events <10 year return period events (>10% chance of being exceeded in any one year)
Medium flood/moderate events Range from 10 year to 100 year return period events (10% to 1% chance of being exceeded in any one year)
Large/big flood/extreme events Discrete occurrences that are statistically ‘rare’ in that they are very infrequently observed, that is, >100 year

Working with Natural Processes – Evidence Directory 11
Term used: Meaning
return period events (<1% chance of being exceeded in any one year)
Monitoring
Chapter 6 summarises the main research gaps identified in this report and draws on past examples to provide guidance on how to monitor WWNP projects.
1.3.3 How do I access the information I need?
Although this report is long, it isn’t intended to be read from cover to cover.
The measures
To access the information you need, decide which measure(s) you are interested in. Go to Figure 1.1, click on the one you are interested in and it will take you to the right chapter. If you’d like more technical detail, go to the Literature Review (Appendix 2).
The case studies
65 case study examples are summarised throughout the report using case study vignettes. Each of these summaries is underpinned by a stand alone case study which contains greater technical detail.
Important! You can find these case studies on the webpage where you accessed this report. We have created four zip files in which we have batched the case studies according to which chapters they fall into:
Rivers and floodplains
Woodlands
Runoff from hills
Coasts and estuaries
Please note that many of the case studies cover multiple types of WWNP measure, this means they are applicable across multiple chapters.
You can also go to Appendix 1 to see a full list of all 65 case studies.
1.3.4 Caveats
The science of NFM is still evolving and developing, as such many of the measures covered in this directory have yet to be fully tested during extreme flood events. This means that we are still learning how to design and construct them.
As with all FCRM schemes it is incumbent on those who design and construct them to ensure that they are robust and do not pose a public safety risk to downstream communities.
Throughout this document we have used the following annotation ‘Important!’ to alert the reader to circumstances where a particular measure could increase flood risk, cause a blockage, synchronise peaks or create a backwater effect.

Working with Natural Processes – Evidence Directory 12
We have also highlighted specific measures where extra caution is needed in their design if there is limited evidence of how they perform in extreme events.
1.3.5 Key principles check list
Before embarking on a WWNP project, here are some important principles to consider.
Think about timescales – it’s a marathon not a sprint
Different measures will take different timescales to be effective.
Nothing lasts forever, some measures will need to be maintained and adapted over time.
Achieve multiple environmental benefits
Adopt an ecosystem-based system. Make sure your flood risk management work achieves multiple benefits and is fully integrated with the sustainable management of land and water, taking account of the full range of benefits obtained from natural systems (Including those it’s not yet possible to quantify).
Choose the right tool(s) for the job
Ensure NFM is a key part of a portfolio of measures used to manage flood risk.
Think what was there in the first place – this will help you select the ‘right’ suite of measures and install them in the ‘right’ place to maximise their benefits.
Realise that sometimes the best solution is no solution (for example, natural recovery and assisted natural recovery can be used to restore rivers, floodplains and coasts).
Take a catchment-based approach
Plan and implement NFM measures at a catchment scale to tackle problems at source and fully realise opportunities.
Think ‘the whole is greater than the sum of its parts’ – a catchment-wide network of interconnected measures has greater benefit than a small number of disparate features.
Think of WWNP as an ‘adaptive buffer’ – a means of making your catchment and your flood risk scheme adaptable and more resilient to the impacts of climate change.
Think ‘source to sea’ – there is always a ‘downstream’ below the location of your project.
Integrate catchment management plans to achieve joint objectives and multiple long-term benefits to society.
Work with others
Engage with stakeholders and seek out experts to establish common ownership of problems and solutions, building active partnerships to help implement actions that will achieve shared objectives.
Learn through doing
Monitor the effectiveness of NFM measures so that the ability to design and implement measures that work can be improved while also filling research gaps.
Working with Natural Processes – Evidence Directory 13
Share the learning (good, bad and ugly) with the wider WWNP community so that all can learn from each other’s successes and mistakes.
1.4 Further reading
Building with Nature design guideline (online guidance from the Ecoshape consortium*)
Greater working with natural processes in flood and coastal erosion risk management (report by Environment Agency led working group*)
High Water Common Ground (film about NFM by independent film maker Andy Clark)
Healthy Catchments – managing water for flood risk and the Water Framework Directive (online case studies from the European Centre for River Restoration*)
Land use management effects on flood flows and sediment – guidance on prediction (McIntyre and Thorne 2013)
Natural Flood Management Measures – a practical guide for farmers (report by Yorkshire Dales National Park)
Oxford Martin Restatement 4 – Natural flood management (Oxford Martin School working paper*)
SEPA’s Natural Flood Management Handbook (SEPA 2015)
Sustaining nature's services: adopting an ecosystem approach (Scottish Natural Heritage report*)
Parliamentary Office for Science and Technology briefing on natural flood management (POST Note. 2014*)
Working with natural processes to manage flood and coastal erosion risk (report by Environment Agency led working group*)
Working with natural processes to reduce flood risk: R&D framework (outputs of Defra and Environment Agency FCRM project SC130004*)
* See Bibliography for further details.
Working with Natural Processes – Evidence Directory 14
Chapter 2. River and floodplain management
2.1 Introduction
2.5 Offline storage areas
2.2 River restoration
2.3 Floodplain and floodplain wetland restoration
2.4 Leaky barriers
2.1 Introduction

Working with Natural Processes – Evidence Directory 15
2 River and floodplain management
2.1 Introduction
This chapter summarises the evidence around the effectiveness of the following river and floodplain management measures in reducing flood risk:
River restoration
River floodplain and floodplain wetland restoration
Leaky/woody barriers
Offline storage areas
Restoring the natural processes and features within rivers and floodplains can provide a wide range of benefits for the environment and people. From an FCRM perspective, these types of measures can increase the hydraulic roughness and morphological complexity of rivers and floodplains, which in turn slows floodwaters and reconnects rivers to floodplains to store water. Of all the measures covered in this chapter, offline storage areas are seen to be the most engineered, involving the construction of flow control structures and other grey infrastructure to enable their full operation.
These different types of river and floodplain WWNP measures reduce flood risk by:
slowing flows in-channel – through restoring in-channel features (increasing length of river channel) and obstructing flow through the introduction of leaky barriers
storing water on floodplains – by increasing lateral connectivity between the river and floodplain
encouraging infiltration and soil water storage – the roots of floodplain wetland vegetation help water to be delivered to the soil, encouraging infiltration and water storage
River restoration
Reinstatementof natural physical
processes and features in a
river
Floodplain restoration
Restoration of the
hydrological connection
between rivers and floodplains
Leaky/woody barriers
Pieces of wood installed in
channel, river corridor or
floodplain to manage water
Offline storage areas
Areas of floodplain adapted to
retain water in a managed
way
Working with Natural Processes – Evidence Directory 16
2.2 River restoration
2.2.1 Introduction
Key case studies (click here):
River Avon
Dorset Frome
Mayes Brook
New Forest
Brackenhurst
What is river restoration?
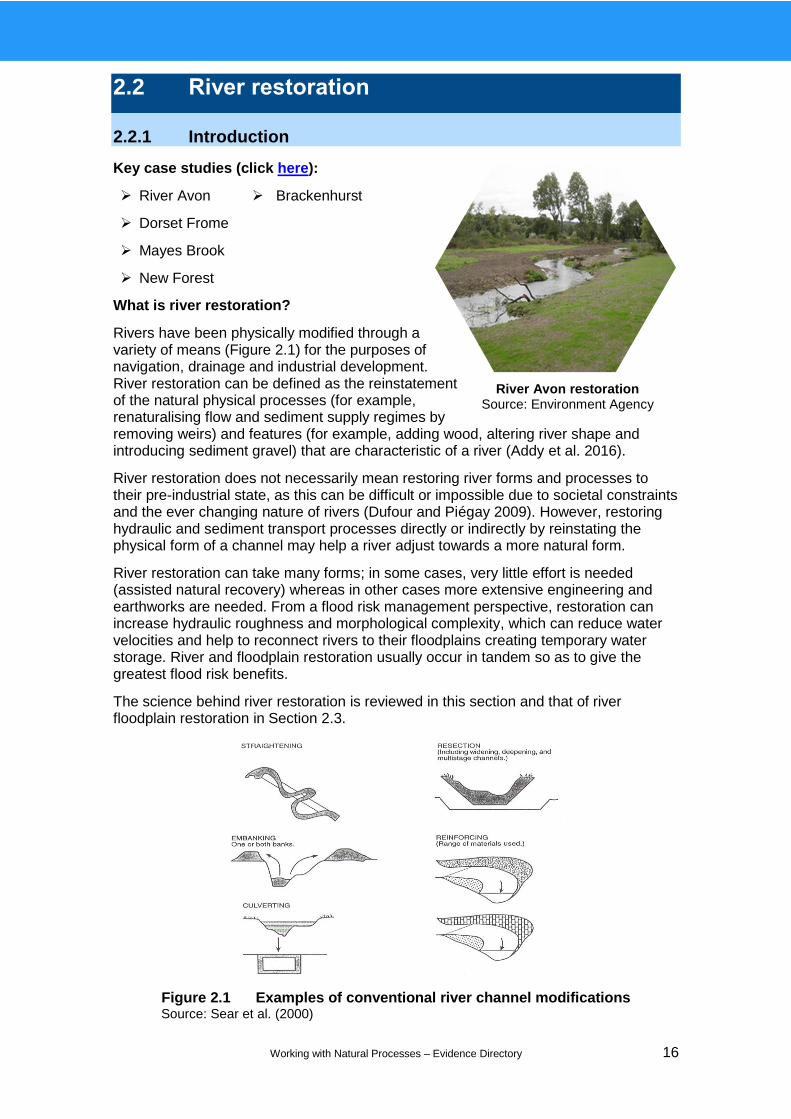
Rivers have been physically modified through a variety of means (Figure 2.1) for the purposes of navigation, drainage and industrial development. River restoration can be defined as the reinstatement of the natural physical processes (for example, renaturalising flow and sediment supply regimes by removing weirs) and features (for example, adding wood, altering river shape and introducing sediment gravel) that are characteristic of a river (Addy et al. 2016).
River restoration does not necessarily mean restoring river forms and processes to their pre-industrial state, as this can be difficult or impossible due to societal constraints and the ever changing nature of rivers (Dufour and Piégay 2009). However, restoring hydraulic and sediment transport processes directly or indirectly by reinstating the physical form of a channel may help a river adjust towards a more natural form.
River restoration can take many forms; in some cases, very little effort is needed (assisted natural recovery) whereas in other cases more extensive engineering and earthworks are needed. From a flood risk management perspective, restoration can increase hydraulic roughness and morphological complexity, which can reduce water velocities and help to reconnect rivers to their floodplains creating temporary water storage. River and floodplain restoration usually occur in tandem so as to give the greatest flood risk benefits.
The science behind river restoration is reviewed in this section and that of river floodplain restoration in Section 2.3.
Figure 2.1 Examples of conventional river channel modifications Source: Sear et al. (2000)
River Avon restoration Source: Environment Agency
Working with Natural Processes – Evidence Directory 17
2.2.2 Flood risk evidence
This section sets out what we know and what we don’t know in terms of the effectiveness of this measure from an FCRM perspective and the scientific confidence in what we know.
Summary of the literature
River restoration can slow flood flows through the reintroduction of features such as meanders, which increase the length of the river by making it more sinuous. This in turn can encourage the reconnection of rivers with their floodplains and enable the storage of floodwaters on floodplains.
Restoring natural features and processes in river channels may help them:
o attenuate high flows, reducing flood peaks at low return periods and flow velocities
o create in-channel features that temporarily store and slow the flow of water by increasing hydraulic roughness (Buffington and Montgomery 1999, Gurnell 2014, Old et al. 2014, Solari et al. 2016)
o adjust naturally by removing lateral constraints, allowing them to accommodate sediment and flow regimes under climate change (Raven et al. 2009)
o trap and stabilise fine sediment by encouraging the development of in-channel and riparian vegetation communities (Grabowski and Gurnell 2016)
However, it can be difficult to establish the standard of flood protection provided by river restoration schemes.
Sear et al. (1995, 2003, 2008, 2009 and 2010) provide guidance on how to consider geomorphological processes into river engineering and management.
Observed evidence
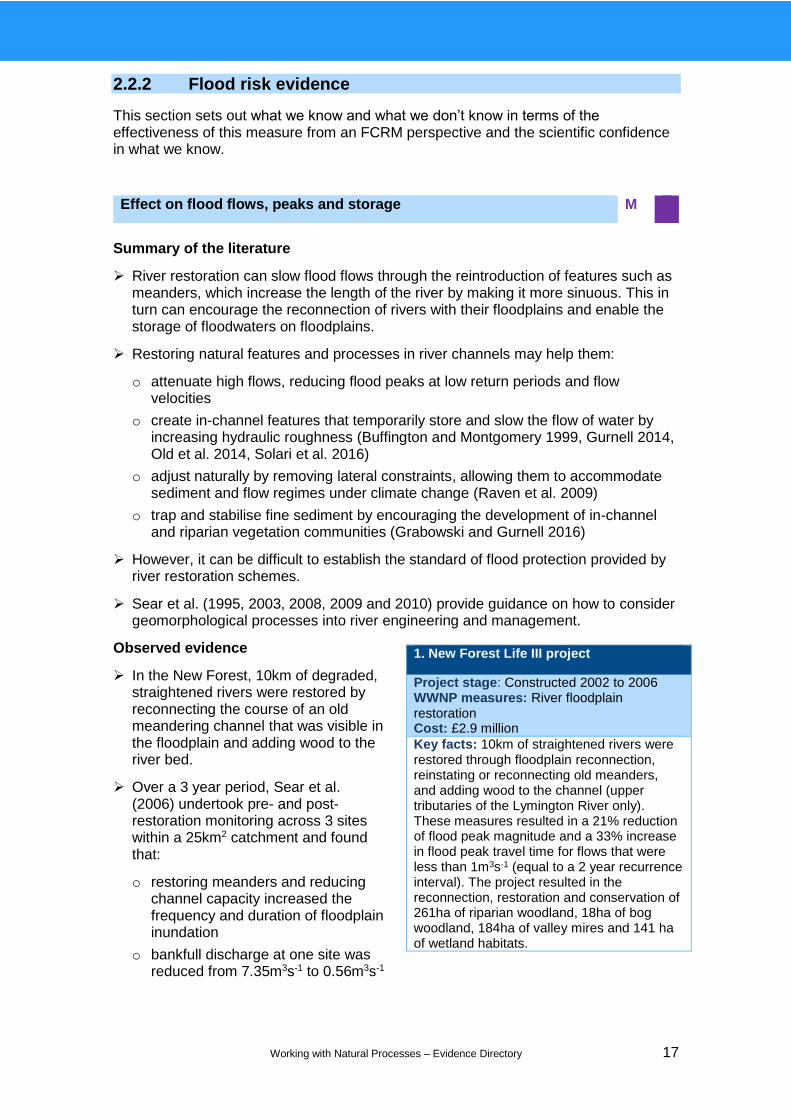
In the New Forest, 10km of degraded, straightened rivers were restored by reconnecting the course of an old meandering channel that was visible in the floodplain and adding wood to the river bed.
Over a 3 year period, Sear et al. (2006) undertook pre- and post-restoration monitoring across 3 sites within a 25km2 catchment and found that:
o restoring meanders and reducing channel capacity increased the frequency and duration of floodplain inundation
o bankfull discharge at one site was reduced from 7.35m3s-1 to 0.56m3s-1
Effect on flood flows, peaks and storage M
1. New Forest Life III project
Project stage: Constructed 2002 to 2006 WWNP measures: River floodplain restoration Cost: £2.9 million
Key facts: 10km of straightened rivers were restored through floodplain reconnection, reinstating or reconnecting old meanders, and adding wood to the channel (upper tributaries of the Lymington River only). These measures resulted in a 21% reduction of flood peak magnitude and a 33% increase in flood peak travel time for flows that were less than 1m3s-1 (equal to a 2 year recurrence interval). The project resulted in the reconnection, restoration and conservation of 261ha of riparian woodland, 18ha of bog woodland, 184ha of valley mires and 141 ha of wetland habitats.
Working with Natural Processes – Evidence Directory 18
o the combined effect of river restoration and woody barriers resulted in a 21% reduction in flood peak magnitude and a 33% increase in flood peak travel time for flows that were less than 1 m3s-1
Modelled evidence
For a 1km reach with restored meanders, flood peaks for 2–50 year recurrence interval flows were reduced by less than 1% (Sholtes and Doyle 2011).
Another reach scale study showed that restoration of natural channel morphology reduced water velocities for a 1 in a 100 year flood by 41% compared with a channelised river (Keesstra et al. 2012).
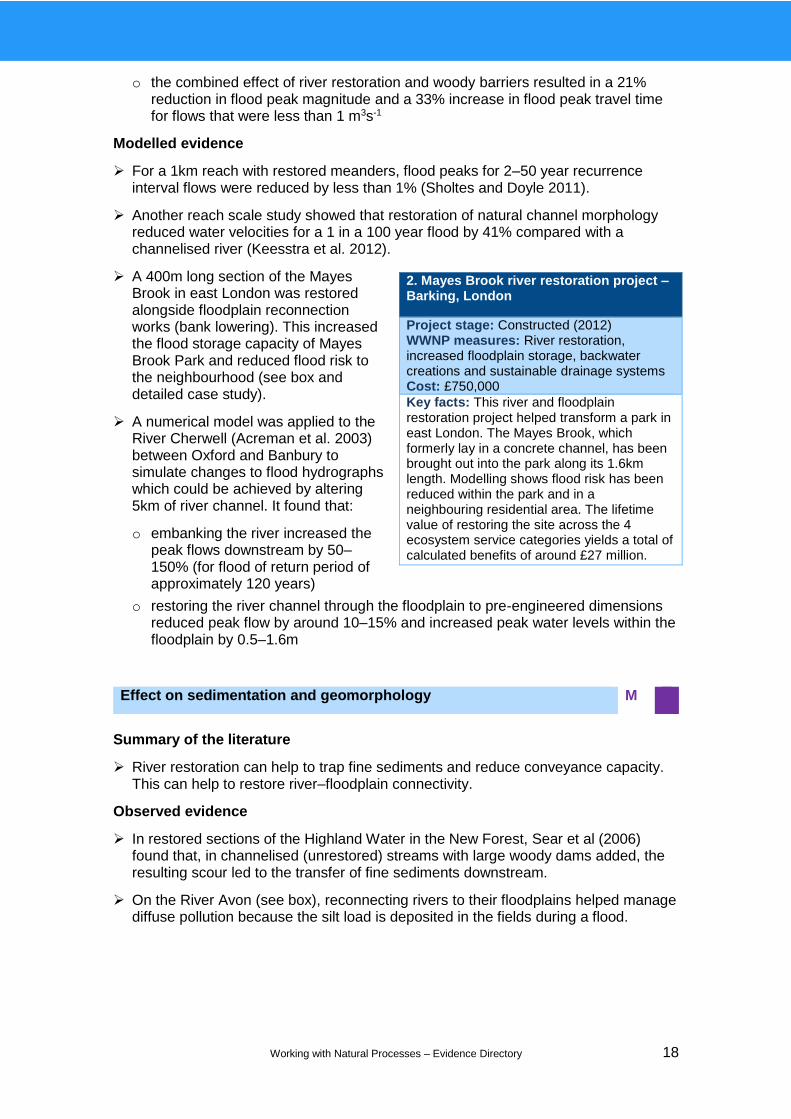
A 400m long section of the Mayes Brook in east London was restored alongside floodplain reconnection works (bank lowering). This increased the flood storage capacity of Mayes Brook Park and reduced flood risk to the neighbourhood (see box and detailed case study).
A numerical model was applied to the River Cherwell (Acreman et al. 2003) between Oxford and Banbury to simulate changes to flood hydrographs which could be achieved by altering 5km of river channel. It found that:
o embanking the river increased the peak flows downstream by 50–150% (for flood of return period of approximately 120 years)
o restoring the river channel through the floodplain to pre-engineered dimensions reduced peak flow by around 10–15% and increased peak water levels within the floodplain by 0.5–1.6m
Summary of the literature
River restoration can help to trap fine sediments and reduce conveyance capacity. This can help to restore river–floodplain connectivity.
Observed evidence
In restored sections of the Highland Water in the New Forest, Sear et al (2006) found that, in channelised (unrestored) streams with large woody dams added, the resulting scour led to the transfer of fine sediments downstream.
On the River Avon (see box), reconnecting rivers to their floodplains helped manage diffuse pollution because the silt load is deposited in the fields during a flood.
Effect on sedimentation and geomorphology M
2. Mayes Brook river restoration project – Barking, London
Project stage: Constructed (2012) WWNP measures: River restoration, increased floodplain storage, backwater creations and sustainable drainage systems Cost: £750,000
Key facts: This river and floodplain restoration project helped transform a park in east London. The Mayes Brook, which formerly lay in a concrete channel, has been brought out into the park along its 1.6km length. Modelling shows flood risk has been reduced within the park and in a neighbouring residential area. The lifetime value of restoring the site across the 4 ecosystem service categories yields a total of calculated benefits of around £27 million.

Working with Natural Processes – Evidence Directory 19
Modelled evidence
A series of riffle bedforms were restored on a lowland gravel-bed river in Norfolk. Using a one-dimensional model, Sear and Newson (2004) found that water surface elevation was not increased significantly (0.05m on average) over the pre-restoration channel conditions.
On a lowland river in Nottighamshire, Downs and Thorne (2000) modelled the effects of channel reprofiling, deflector installation and riparian planting on channel conveyance capacity, finding a 10% reduction in conveyance at bankfull flow levels.
Summary of the literature
The effect of river restoration on FCRM depends on the length of the river restored relative to the size of the catchment in which it is undertaken (Sholtes and Doyle 2011).
Modelled evidence
Restoring meanders and flow resistance on headwater channels in a 400km2
catchment led to an average reduction of peak flows of 14% (Liu et al. 2004).
Restoring reaches as long as 5–10km can provide tangible attenuation of peak flows (Sholtes and Doyle 2011).
In a 17km2 catchment, restoring meanders within a 1km reach of a river reduced flood peaks by less than 1% for 2–50 year recurrence interval flows (Sholtes and Doyle 2011).
Summary of the literature
To be successful, the river restoration measures selected should be suitable for the river type and natural processes that occur there (Beechie et al. 2010).
Restoring a river to a morphology that is not in keeping with the naturally occurring processes and expected morphology will create an unsustainable river system not suited to the natural controls of the reach (Kondolf 2006).
Effect at different catchment scales M
Effect in different watercourse typologies H
3. River Avon restoration – Wiltshire and
Hampshire
Project stage: Construction (2011 to 2017) WWNP measures: River restoration, embankment removal/lowering, structure removal, aquatic plant management, arable reversion Cost: £4.3 million
Key facts: 50km of improved chalk river habitat, including improved fish and eel passage, and 10ha of wetland habitat to be created by 2017. Reconnecting the river and floodplain could contribute to managing the diffuse pollution (sediment, phosphate and nitrogen), allowing floodplains to be inundated and the silt load to accumulate on the fields.

Working with Natural Processes – Evidence Directory 20
Summary of the literature
Rivers adjust their morphology following restoration actions in response to adjustments in fluvial and vegetation colonisation processes. The pace at which this occurs will vary depending on the flow regime, channel boundary conditions and sediment supply.
This means there can be a delay before the river channel adjusts to bring about full floodplain connectivity.
However, depending on the river type and degree of artificial constraint, restoration actions can be designed to bring about immediate improvement of floodplain connectivity (for example, lowering artificial flood embankments).
Restored rivers do not have a finite lifespan. If restored in a way that is suited to the natural form and functioning of the river under the current flow and sediment supply regimes, they should be self-sustaining.
Summary of the literature
Sear et al. (1995) identified that understanding geomorphological processes is vital when making decisions about sediment-related river maintenance as it can help identify the cause and solution by taking a fluvial audit approach.
Restored rivers should be more self-sustaining and reduce the need for maintenance if restored to natural form within a natural surrounding environment.
By accepting natural river processes and forms in restored rivers, maintenance costs can be reduced compared with channelised rivers that require regular maintenance.
In the case of the Mayes Brook restoration project, a study showed that post restoration the need for maintenance could be reduced by approximately 50%, leading to annual savings of £5,000.
Adaptive management approaches can be used to adapt the restoration and mitigate against unexpected consequences of the river restoration, thus enabling project objectives to be met more (Downs and Kondolf 2002).
Management plans and maintenance measures should be designed to be case-specific so that they are fit for purpose.
2.2.3 Multiple benefits
The benefits wheel shows that river restoration projects provide an increased range of multiple benefits.
Design life and effectiveness M
Maintenance requirements M
Working with Natural Processes – Evidence Directory 21
Multiple benefits summary
Environmental benefits
Water quality
River restoration can restore the river’s natural cleansing ability, increasing its resilience to pollutants. Studies have shown that morphological features such as meanders and gravel bars reduce nitrogen and phosphorus levels through sediment deposition, retention and purification (Hoffman et al. 2011, Shrestha et al. 2012). In Denmark, when combined with floodplain restoration, phosphate retention was between 0.13kg and 10kg per hectare per year and nitrogen removal between 52kg and 337kg per hectare per year (Hoffman et al. 2011).
Habitat provision
Returning rivers to a more natural state has clear benefits for habitat diversity and thus potentially biodiversity, providing potentially improved resilience for the whole river ecosystem. The more complex morphology following restoration induces a greater diversity of flow velocities, which erode, transport, sort and deposit sediment to increase the range of physical habitat types, providing spawning sites, refuges and pools for a range of macrophytes, invertebrates, mammals, fish and vegetation (Gilvear et al. 2000, Arscott et al. 2005, Pederson et al. 2006). River restoration schemes delivered by The Rivers Trust to remove barriers to fish migration and deliver
River restoration
Water Quality
Habitat
Climate Regulation
Low Flows
Flood (Fluv)
Flood (SW or GW)
Air Quality
Health Access
Cultural Activity
Aesthetic Quality
4. River Frome Rehabilitation Plan – Dorchester and Wareham, Dorset
Project stage: Construction (2010 to 2020) WWNP measures: River restoration, embankment removal, structure removal, arable reversion Cost: £850,000
Key facts: Reconnecting the river and floodplain could contribute to managing the diffuse pollution (sediment, phosphate and nitrogen), allowing floodplains to be inundated and the silt load to accumulate on the fields.

Working with Natural Processes – Evidence Directory 22
Environmental benefits
a range of in‐stream habitat enhancement outcomes have been estimated to have cost–benefit ratios of between 25:1 and 43:1 (The Rivers Trust 2013).
Climate regulation
Restoring more natural river morphology can help to make habitat for fish and invertebrates more resilient to impacts of climate change, particularly if the restoration extents to riparian areas. Evidence demonstrates that assisted natural recovery creates ecological resilience by providing flowing water refugia under low flow conditions, increasing hydraulic habitat diversity and connectivity (Environment Agency 2016) and also increasing shade.
Low flows
River restoration often incorporates consideration of low flows within the design work, the opposite to previous traditional flood risk management schemes, where the focus is on extreme and infrequent bankfull capacity. River restoration tends to sustain low flows, particularly when subsurface hydrological connectivity with the floodplain is reinstated. Restoring natural hydrological connectivity and water-retaining features (for example, scoured and naturally dammed pools) allows water to be retained within the channel even in drought conditions. Dunbar et al. (2010) show that macroinvertebrate communities in rivers with high River Habitat Survey modification scores alter more in response to flow change than natural rivers.
Social benefits
Health access
Evidence is based on the assumption that improving the river landscape will encourage more visitors, who will gain physical and mental health benefits associated with green space. Studies show that visitor numbers increase substantially when river restoration creates opportunities for recreation and relaxation, particularly in urban areas (Åberg and Tapsell 2013, Addy et al. 2016). River restoration also creates further opportunities for activities such as angling, which have proven physical and mental health benefits (Brown et al. 2012). However, access to rivers may be restricted when rivers cross private land.
Air quality
There is little available evidence on the benefits of river restoration to air quality. However, when combined with revegetation it can provide a sink for carbon and other pollutants.
Surface water or groundwater flood
Measures that improve river bed and bank permeability can restore connectivity between groundwater and surface water, enabling storm water infiltration (Kurth and Schirmer 2014). Increasing the morphological complexity of the river channel (for example, remeandering) increases flow storage (Sholtes and Doyle 2011).
Working with Natural Processes – Evidence Directory 23
Social benefits
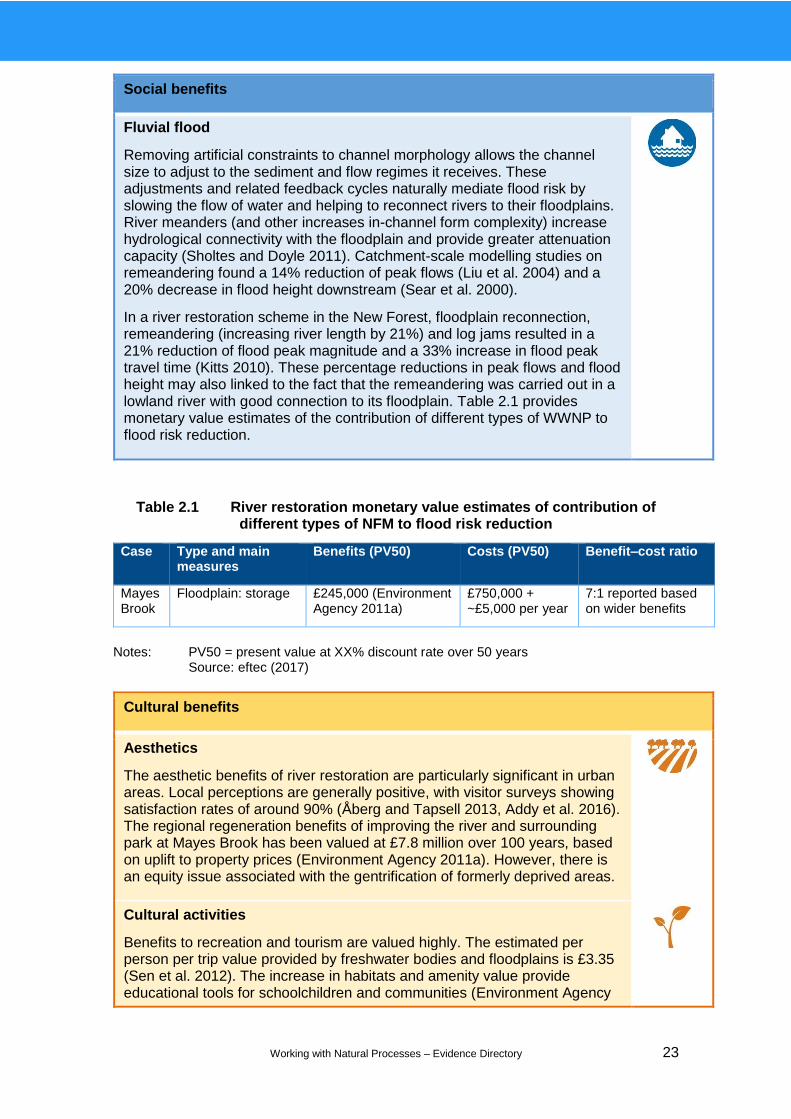
Fluvial flood
Removing artificial constraints to channel morphology allows the channel size to adjust to the sediment and flow regimes it receives. These adjustments and related feedback cycles naturally mediate flood risk by slowing the flow of water and helping to reconnect rivers to their floodplains. River meanders (and other increases in-channel form complexity) increase hydrological connectivity with the floodplain and provide greater attenuation capacity (Sholtes and Doyle 2011). Catchment-scale modelling studies on remeandering found a 14% reduction of peak flows (Liu et al. 2004) and a 20% decrease in flood height downstream (Sear et al. 2000).
In a river restoration scheme in the New Forest, floodplain reconnection, remeandering (increasing river length by 21%) and log jams resulted in a 21% reduction of flood peak magnitude and a 33% increase in flood peak travel time (Kitts 2010). These percentage reductions in peak flows and flood height may also linked to the fact that the remeandering was carried out in a lowland river with good connection to its floodplain. Table 2.1 provides monetary value estimates of the contribution of different types of WWNP to flood risk reduction.
Table 2.1 River restoration monetary value estimates of contribution of different types of NFM to flood risk reduction
Case Type and main measures
Benefits (PV50) Costs (PV50) Benefit–cost ratio
Mayes Brook
Floodplain: storage £245,000 (Environment Agency 2011a)
£750,000 + ~£5,000 per year
7:1 reported based on wider benefits
Notes: PV50 = present value at XX% discount rate over 50 years
Source: eftec (2017)
Cultural benefits
Aesthetics
The aesthetic benefits of river restoration are particularly significant in urban areas. Local perceptions are generally positive, with visitor surveys showing satisfaction rates of around 90% (Åberg and Tapsell 2013, Addy et al. 2016). The regional regeneration benefits of improving the river and surrounding park at Mayes Brook has been valued at £7.8 million over 100 years, based on uplift to property prices (Environment Agency 2011a). However, there is an equity issue associated with the gentrification of formerly deprived areas.
Cultural activities
Benefits to recreation and tourism are valued highly. The estimated per person per trip value provided by freshwater bodies and floodplains is £3.35 (Sen et al. 2012). The increase in habitats and amenity value provide educational tools for schoolchildren and communities (Environment Agency
Working with Natural Processes – Evidence Directory 24
Cultural benefits
2011a). Reversing canalisation has a positive effect on salmon and trout populations (Barlaup et al. 2008, Millidine et al. 2012). The annual value of inland fisheries for England and Wales was estimated at £350 million in 2009 (Environment Agency 2009a).
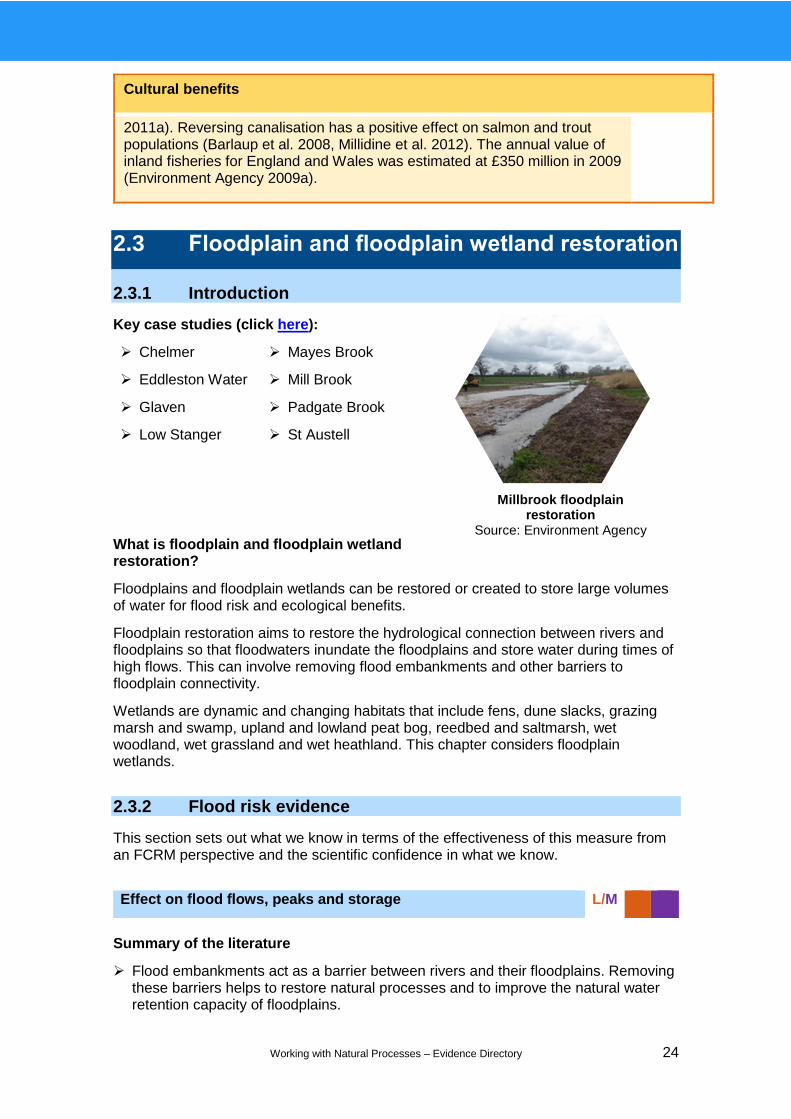
2.3 Floodplain and floodplain wetland restoration
2.3.1 Introduction
Key case studies (click here):
Chelmer
Eddleston Water
Glaven
Low Stanger
Mayes Brook
Mill Brook
Padgate Brook
St Austell
What is floodplain and floodplain wetland restoration?
Floodplains and floodplain wetlands can be restored or created to store large volumes of water for flood risk and ecological benefits.
Floodplain restoration aims to restore the hydrological connection between rivers and floodplains so that floodwaters inundate the floodplains and store water during times of high flows. This can involve removing flood embankments and other barriers to floodplain connectivity.
Wetlands are dynamic and changing habitats that include fens, dune slacks, grazing marsh and swamp, upland and lowland peat bog, reedbed and saltmarsh, wet woodland, wet grassland and wet heathland. This chapter considers floodplain wetlands.
2.3.2 Flood risk evidence
This section sets out what we know in terms of the effectiveness of this measure from an FCRM perspective and the scientific confidence in what we know.
Summary of the literature
Flood embankments act as a barrier between rivers and their floodplains. Removing these barriers helps to restore natural processes and to improve the natural water retention capacity of floodplains.
Effect on flood flows, peaks and storage L/M
Millbrook floodplain restoration
Source: Environment Agency
Working with Natural Processes – Evidence Directory 25
Generally, restoring floodplain wetlands may reduce or delay flood peaks (Acreman et al. 2003) and may attenuate high frequency, low return period floods (Ogawa and Male 1986, Hillman 1998, Walton et al. 1996, Ferrari et al. 1999, Hardy et al. 2000, Acreman et al. 2003, Acreman and Holden 2013). Important! As with most WWNP measures, there is also the potential that they could increase flooding downstream (for example, peak synchronisation) (Bullock and Acreman 2003).
Acreman and Holden (2013) concluded that in general:
o floodplain wetlands slow flood wave speed and store large quantities of water, primarily on the surface, which flow back into the river later, evaporate or recharge groundwater
o floodplains with rough vegetation (for example, trees and shrubs) have high friction and slow flood wave speed’
The FCRM benefits of floodplain restoration are site-specific and difficult to predict.
It can be difficult to predict the effect of floodplain reconnection on reducing flood peaks without conducting a site-specific hydraulic modelling study (Jacobs 2011, SEPA and Forestry Commission 2012) which should assess the potential impacts on peak synchronisation.
Some wetlands can generate floods particularly peatlands and headwater river margins (Acreman and Holden 2013).
Observed evidence
In North Carolina, USA, a river and floodplain restoration project used a ‘pond and plug’4 method to restore the river channel and floodplain wetlands (3.6km of river and 230ha of mountain meadow) found (Hammersmark et al. 2008):
o increased groundwater levels and volume of subsurface storage
o increases in the amount of times the floodplain was inundated and associated decrease in magnitude of the flood peak
o decreased annual run-off and duration of base flows
Modelled evidence
Modelling showed that restoring a floodplain in the Thur River catchment (France) did not reduce peak flows significantly due to the deep nature of the channel. This highlighted the importance of getting water onto the floodplain through complementary channel restoration (Kreis et al. 2005).
A number of modelling studies report the positive flood risk effects of floodplain wetland restoration.
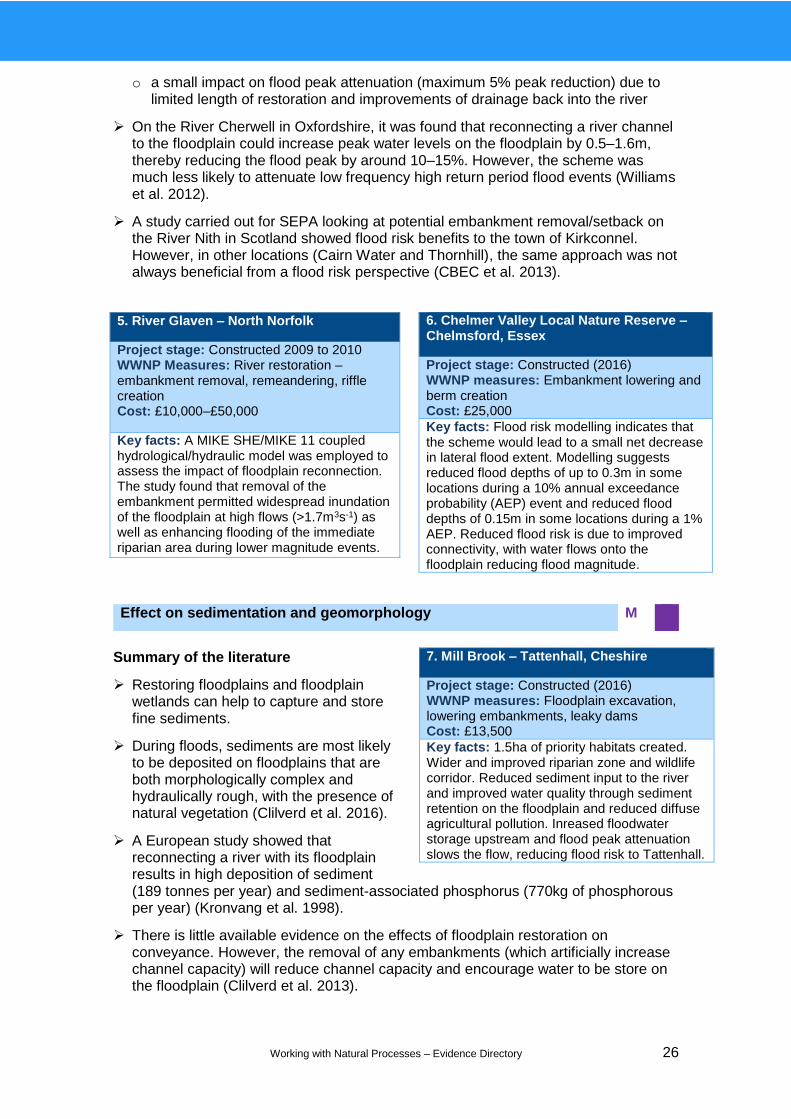
On the River Glaven in Norfolk, Clilverd et al. (2013, 2015) found – through a combination of observed and modelled data – positive impacts associated with the removal of a flood embankments leading to:
o floodplain inundation at high flows (>1.7m3s-1)
o reductions in the channel capacity by approximately 60% (leading to overbank flooding)
o higher groundwater levels and greater subsurface storage
4 ‘Pond and plug’ involves excavating borrow material, usually from portions of the degraded channel, to construct ‘plugs’ that fill the channel to historic meadow floodplain elevation. The excavated sites, or borrow pits, fill with water from the stream and groundwater resulting in ‘ponds’.
Working with Natural Processes – Evidence Directory 26
o a small impact on flood peak attenuation (maximum 5% peak reduction) due to limited length of restoration and improvements of drainage back into the river
On the River Cherwell in Oxfordshire, it was found that reconnecting a river channel to the floodplain could increase peak water levels on the floodplain by 0.5–1.6m, thereby reducing the flood peak by around 10–15%. However, the scheme was much less likely to attenuate low frequency high return period flood events (Williams et al. 2012).
A study carried out for SEPA looking at potential embankment removal/setback on the River Nith in Scotland showed flood risk benefits to the town of Kirkconnel. However, in other locations (Cairn Water and Thornhill), the same approach was not always beneficial from a flood risk perspective (CBEC et al. 2013).
Summary of the literature
Restoring floodplains and floodplain wetlands can help to capture and store fine sediments.
During floods, sediments are most likely to be deposited on floodplains that are both morphologically complex and hydraulically rough, with the presence of natural vegetation (Clilverd et al. 2016).
A European study showed that reconnecting a river with its floodplain results in high deposition of sediment (189 tonnes per year) and sediment-associated phosphorus (770kg of phosphorous per year) (Kronvang et al. 1998).
There is little available evidence on the effects of floodplain restoration on conveyance. However, the removal of any embankments (which artificially increase channel capacity) will reduce channel capacity and encourage water to be store on the floodplain (Clilverd et al. 2013).
Effect on sedimentation and geomorphology M
7. Mill Brook – Tattenhall, Cheshire
Project stage: Constructed (2016) WWNP measures: Floodplain excavation, lowering embankments, leaky dams Cost: £13,500
Key facts: 1.5ha of priority habitats created. Wider and improved riparian zone and wildlife corridor. Reduced sediment input to the river and improved water quality through sediment retention on the floodplain and reduced diffuse agricultural pollution. Inreased floodwater storage upstream and flood peak attenuation slows the flow, reducing flood risk to Tattenhall.
6. Chelmer Valley Local Nature Reserve – Chelmsford, Essex
Project stage: Constructed (2016) WWNP measures: Embankment lowering and berm creation Cost: £25,000
Key facts: Flood risk modelling indicates that the scheme would lead to a small net decrease in lateral flood extent. Modelling suggests reduced flood depths of up to 0.3m in some locations during a 10% annual exceedance probability (AEP) event and reduced flood depths of 0.15m in some locations during a 1% AEP. Reduced flood risk is due to improved connectivity, with water flows onto the floodplain reducing flood magnitude.
5. River Glaven – North Norfolk
Project stage: Constructed 2009 to 2010 WWNP Measures: River restoration – embankment removal, remeandering, riffle creation Cost: £10,000–£50,000
Key facts: A MIKE SHE/MIKE 11 coupled hydrological/hydraulic model was employed to assess the impact of floodplain reconnection. The study found that removal of the embankment permitted widespread inundation of the floodplain at high flows (>1.7m3s-1) as well as enhancing flooding of the immediate riparian area during lower magnitude events.

Working with Natural Processes – Evidence Directory 27
Summary of the literature
The extent of flood risk benefit is dependent on the scale of the works relative to the size of the catchment and watercourse typology.
There is evidence that floodplain and wetland restoration can reduce flood risk at different catchment scales, but it is too limited to be conclusive.
Modelled evidence
In the Glaven catchment in north Norfolk, which is approximately 30km2, Clilverd et al. (2016) showed a moderate but positive increase in floodplain water storage as a result of floodplain restoration.
On the Cherwell, a 910km2 tributary of the River Thames, Acreman et al. (2003) modelled the impact of flood embankment removal and found that downstream flood peaks were predicted to be reduced by 10–15% due to the increase in floodplain water storage (increase in peak water levels of 0.5–1.6m).
Kreis et al (2005) undertook a modelling study of the River Thur in north-east France, which drains a 260km2 mountainous catchment. Their study found that renaturalising the channel and floodplain did not reduce the flood peak.
Summary of the literature
The FCRM benefits of floodplain and floodplain wetland restoration will vary between watercourse types because the morphology of a river can influence the peak flow attenuation benefits of floodplain restoration.
Acreman et al. (2003) suggest floodplain reconnection of deep river channels could lead to a reduction in peak flow of 0–15% (based on the Cherwell case study).
Modelled evidence
On the Glaven, Clilverd et al. (2016) showed a moderate but positive hydrological response to restoration on a small lowland river in an area of Norfolk with chalk geology.
On the Thur in north-east France, Kreis et al (2005) found renaturalising the channel and floodplain did not reduce the flood peak due to the deep nature of the channel.
Effect at different catchment scales L/M
Effect in different watercourse typologies L
Design life and effectiveness L
8. St Austell Bay Resilient Regeneration Project, Cornwall
Project stage: Feasibility phase (2017) WWNP measures: Floodplain connection, hill slope run-off interception (tree and hedgerow planting), potential storage in disused quarries, in town options (for example, green infrastructure, SUDS) Cost: To be confirmed
Key facts: The project aims to provide property and business flood protection through:
7km of river restoration
330ha of habitat creation
creation of 400 Olympic swimming pools’ worth of water storage
regeneration of community through landscape scale restoration

Working with Natural Processes – Evidence Directory 28
Summary of the literature
The rate at which a river and floodplain become reconnected varies between different river types and the types of restoration undertaken. In some cases the effect is immediate and in others the river needs time to adjust morphologically before it is able to attenuate peak flows.
On the Glaven, Clilverd et al. (2013) found that a rapid change in floodplain connectivity was possible following removal of flood embankments which lowered the water height needed to cause overbank flow and floodplain water storage.
Restored floodplains and their wetlands do not have a finite lifespan. If restored appropriately they should be self-sustaining.
Summary of the literature
Blackwell and Maltby (2016) stated that maintenance costs are generally 0.5–1.5% of the investment cost.
Restored floodplains and their wetlands should be self-sustaining and require limited maintenance (see Padgate Brook example below).
Management may be needed to hold back natural succession in restored wetlands.
The frequency and types of maintenance measures necessary will depend on the type of restoration work undertaken.
Management plans should be designed to be case-specific so they are fit for purpose.
Adaptive management approaches can be used to monitor responses to restoration actions enabling you to implement mitigation actions if needed (Downs and Kondolf 2002).
Maintenance requirements H
9. Eddleston Water – Scottish Borders, Scotland
Project stage: Constructed (2016) – now monitoring WWNP measures: Wide range of NFM measures across catchment Cost: £1.4 million
Key facts: The project is collecting data from a detailed monitoring network to gather evidence of the effectiveness of NFM and habitat restoration measures. Modelling indicates that floodplain roughness could be the most effective means of flood management, with peak flows reduced by up to 23% when combined with the enhanced storage and infiltration.
10. Padgate Brook River Restoration –
Warrington, Cheshire
Project stage: Constructed (2016) WWNP measures: Setting back flood embankment along the left bank. Reconnecting floodplain. River restoration Cost: £250,000 (5% on NFM, remainder on traditional engineering)
Key facts: The scheme has reduced the risk of flooding to over 200 properties. Significantly reduced maintenance requirements obtained through creation of a self-cleansing channel and using a wildflower mix on the setback embankment. Restored 500m of the watercourse and 5ha of reedbed. Created a sustainable FCERM system.

Working with Natural Processes – Evidence Directory 29
2.3.3 Multiple benefits
Unlike the other sections in this chapter, this section has multiple benefits wheels and summaries for both floodplains and wetlands.
Multiple benefits of floodplain restoration
Multiple benefits summary
Environmental benefits
Water quality
Water quality benefits from the deposition of sediment and pollutants. Greater connectivity between the floodplain and the river reduces nitrogen and phosphorous levels (Acreman et al. 2007, Evans et al. 2007). One study has shown that reconnecting rivers with floodplains results in high deposition of sediment (189 tonnes per year) and sediment-associated phosphorus (770kg per year) (Kronvang et al. 1998). Downstream effects include sediment reduction, a change in channel structure and a decline in nutrients. Restored floodplains can become a source of phosphorous pollution during flood events (Knowles et al. 2012, Surridge et al. 2012).
Habitat provision
Overall there is a significant benefit for biodiversity. Projects like the Low Stanger floodplain project aim to restore lost habitat as well as providing a
River floodplain restoration
Water Quality
Habitat
Climate Regulation
Low Flows
Flood (Fluv)
Flood (SW or GW)
Air QualityHealth Access
Cultural Activity
Aesthetic Quality

Working with Natural Processes – Evidence Directory 30
Environmental benefits
flood risk function. Floodplains provide: a habitat for waders, wildfowl and fish; a food source for mammals; and maintain invertebrate, arthropod and macrophyte communities (Biggs et al. 2004, Arscott et al. 2005, Pederson et al. 2006). Lower turbidity allows more light for growth and visibility for feeding. However, a few species, such as snipe, do not benefit from floodplain restoration (Smart et al. 2008).
The balance of nutrients and wet/dry periods is complex and has an impact on biodiversity in different ways. Full river reconnection is likely to offer maximum benefits, providing a range of habitat wetland features and continuity for migration.
Climate regulation
Floodplains can act as a carbon sink by protecting carbon-storing soil. They can rapidly accumulate carbon during the initial 100 years of floodplain soil formation, with rates exceeding 100g per m2 per year (= 1 tonne of carbon per hectare per year) (Zehetner et al. 2009). Applying this value to one hectare of created floodplain yields a total carbon sequestration rate of 1 tonne of carbon per year, equating to an annual value (@ £52 per tonne) of £52 (Environment Agency 2009c).This is particularly significant in peatland areas, such as the Norfolk Broads, where the soil stores 38.8 million tonnes of carbon.
The value of creating an extra 50ha of floodplain there is estimated at £1 million over 100 years (Tinch et al. 2012). However, the benefits to climate regulation are difficult to value.
Low flows
Overflow of water onto a floodplain can enhance groundwater recharge (Brunet et al. 2003, Palmer et al. 2009). Low flows are regulated by infiltration over time from the floodplain back into the river, this can only happen if underlain by permeable soils (Acreman et al. 2003).
Social benefits
Health access
There is no evidence specifically related to floodplain restoration, but increased opportunities for recreation are likely to create physical and mental health benefits (e.g. Angling has proven health benefits (Brown et al. 2012)).
11. Low Stanger Floodplain Reconnection
Project – Lorton, Cumbria
Project stage: Constructed (2015) WWNP measures: Flood embankment breaches to provide floodplain storage. Hedges and coppice on floodplain to further slow the flood flow Cost: £4,000
Key facts: At Low Stanger farm, the existing flood embankment was breached along 4 sections to increase flood storage when the River Cocker is flowing out of channel. The breach survived Storm Desmond intact and provided 5ha of additional flood storage.
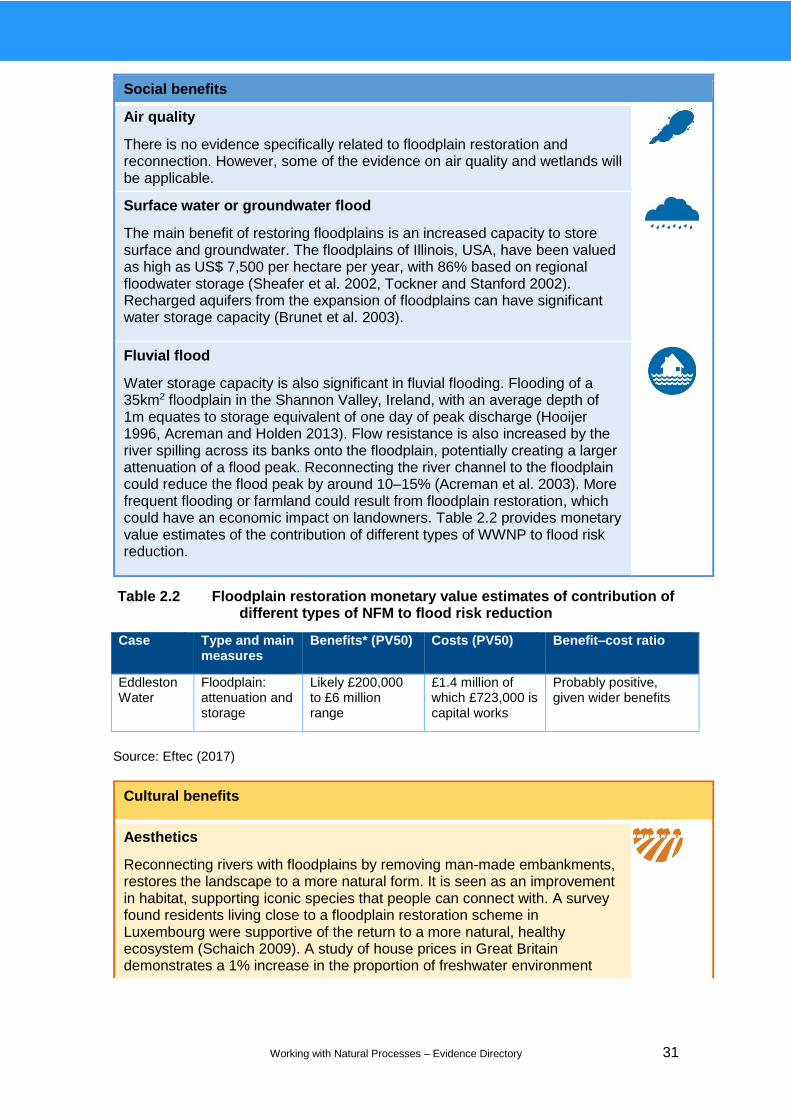
Working with Natural Processes – Evidence Directory 31
Social benefits
Air quality
There is no evidence specifically related to floodplain restoration and reconnection. However, some of the evidence on air quality and wetlands will be applicable.
Surface water or groundwater flood
The main benefit of restoring floodplains is an increased capacity to store surface and groundwater. The floodplains of Illinois, USA, have been valued as high as US$ 7,500 per hectare per year, with 86% based on regional floodwater storage (Sheafer et al. 2002, Tockner and Stanford 2002). Recharged aquifers from the expansion of floodplains can have significant water storage capacity (Brunet et al. 2003).
Fluvial flood
Water storage capacity is also significant in fluvial flooding. Flooding of a 35km2 floodplain in the Shannon Valley, Ireland, with an average depth of 1m equates to storage equivalent of one day of peak discharge (Hooijer 1996, Acreman and Holden 2013). Flow resistance is also increased by the river spilling across its banks onto the floodplain, potentially creating a larger attenuation of a flood peak. Reconnecting the river channel to the floodplain could reduce the flood peak by around 10–15% (Acreman et al. 2003). More frequent flooding or farmland could result from floodplain restoration, which could have an economic impact on landowners. Table 2.2 provides monetary value estimates of the contribution of different types of WWNP to flood risk reduction.
Table 2.2 Floodplain restoration monetary value estimates of contribution of different types of NFM to flood risk reduction
Case Type and main measures
Benefits* (PV50) Costs (PV50) Benefit–cost ratio
Eddleston Water
Floodplain: attenuation and storage
Likely £200,000 to £6 million range
£1.4 million of which £723,000 is capital works
Probably positive, given wider benefits
Source: Eftec (2017)
Cultural benefits
Aesthetics
Reconnecting rivers with floodplains by removing man-made embankments, restores the landscape to a more natural form. It is seen as an improvement in habitat, supporting iconic species that people can connect with. A survey found residents living close to a floodplain restoration scheme in Luxembourg were supportive of the return to a more natural, healthy ecosystem (Schaich 2009). A study of house prices in Great Britain demonstrates a 1% increase in the proportion of freshwater environment
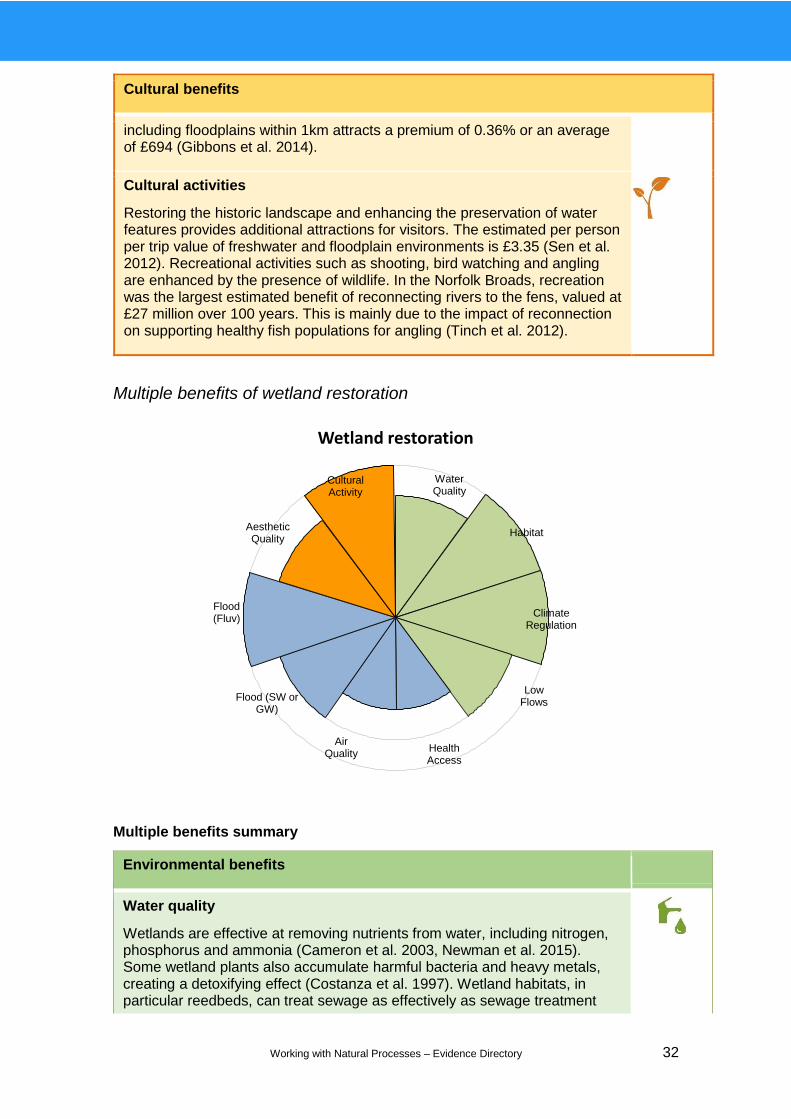
Working with Natural Processes – Evidence Directory 32
Cultural benefits
including floodplains within 1km attracts a premium of 0.36% or an average of £694 (Gibbons et al. 2014).
Cultural activities
Restoring the historic landscape and enhancing the preservation of water features provides additional attractions for visitors. The estimated per person per trip value of freshwater and floodplain environments is £3.35 (Sen et al. 2012). Recreational activities such as shooting, bird watching and angling are enhanced by the presence of wildlife. In the Norfolk Broads, recreation was the largest estimated benefit of reconnecting rivers to the fens, valued at £27 million over 100 years. This is mainly due to the impact of reconnection on supporting healthy fish populations for angling (Tinch et al. 2012).
Multiple benefits of wetland restoration
Multiple benefits summary
Environmental benefits
Water quality
Wetlands are effective at removing nutrients from water, including nitrogen, phosphorus and ammonia (Cameron et al. 2003, Newman et al. 2015). Some wetland plants also accumulate harmful bacteria and heavy metals, creating a detoxifying effect (Costanza et al. 1997). Wetland habitats, in particular reedbeds, can treat sewage as effectively as sewage treatment
Wetland restoration
Water Quality
Habitat
Climate Regulation
Low Flows
Flood (Fluv)
Flood (SW or GW)
Air Quality
Health Access
Cultural Activity
Aesthetic Quality

Working with Natural Processes – Evidence Directory 33
Environmental benefits
works. However, wetlands created on former agricultural land may release phosphorus and nitrogen, creating downstream pollution (Ardón et al. 2010). Freshwater wetlands have been valued at £1,300 per hectare per year (2008 prices) for their provision of water quality improvement, recreation, biodiversity and aesthetic amenity (eftec 2010); £292 per hectare per year is derived from water quality improvements (Morris and Camino 2011).
Habitat provision
Wetlands encompass a number of Natural Environment and Rural Communities Act (NERC Act) priority habitats including grazing marsh, fen, reedbed and lowland raised bog. Over 3,500 species of invertebrates, 150 aquatic plants, 22 duck and 39 wader species occur in UK wetlands, while all the UK’s 7 native amphibians depend on wetlands for breeding (Merritt 1994). Studies have found that 75% of restored wetlands are used by migrating birds (O’Neal et al. 2008). Managed wetlands are potentially most beneficial as a diverse range of habitats can be created and maintained (Bruland and Richardson 2005, Armitage et al. 2007). The marginal value of increased biodiversity is £304 per hectare per year (Morris and Camino 2011).
Climate regulation
Wetlands play a significant role in carbon capture and storage. It is estimated that wetlands may act as carbon sinks for as much as 40% of global terrestrial carbon (Costanza et al. 1997). A restored wetland can sequester 2,700kg carbon per hectare per year (Badiou et al. 2011). However, wetlands can also emit methane, a more potent greenhouse gas.
Low flows
Wetlands create flow stabilisation and can enhance groundwater storage. However, wetlands often overlie impermeable rocks or soils, meaning that there may be little net recharge of the aquifer. They can cause water shortages downstream due to higher evaporation and reduced flows (Bullock and Acreman 2003).
Social benefits
Health access
Physical and mental health benefits have been demonstrated in case studies of wetland restoration. In a visitor survey at RSPB Reserve Old Moor in the Dearne Valley, south Yorkshire, 87% said they felt better because of their visit, while 50% had increased their physical activity as a result of regular visits (Environment Agency 2006). Wetlands also have a role in removing harmful pollutants from drinking and bathing water.
Air quality
Healthy wetland systems are a net source of oxygen production, with oxygen production exceeding consumption. For example, a shallow water wetland
Working with Natural Processes – Evidence Directory 34
Social benefits
had a gross production of 8g of oxygen per m2 per day and a community respiration of 6g of oxygen per m2 per day, leaving a net oxygen production of 2g per m2 per day (Odum 1971). They generally have a positive effect on regulating greenhouse gases.
Surface water or groundwater flood
Evidence suggests that floodplain wetlands may reduce the frequency and magnitude of flood events, and increase the lag time of flood events. The benefits are significant for surface water flooding, with wetlands having a more minor role in soil water storage (Acreman et al. 2011).
Fluvial flood
Floodplain wetlands slow flood wave speed, and store large quantities of water that flow back into the river later, evaporate or recharge groundwater (Acreman and Holden 2013). A review of 28 studies found that, on average, wetlands reduce the frequency and magnitude of floods and increase flood return intervals (Kadykalo and Findlay 2016). The marginal value of extra wetland provision for flood control and storm buffering is £407 per hectare per year (Morris and Camino 2011).
Cultural benefits
Aesthetics
Wetlands are generally considered desirable landscapes by the public. The Lake District is England’s largest national park and covers 229,200ha. In 2007, 8.3 million visitors came to enjoy the spectacular landscape and rich cultural heritage in a peaceful setting (Maltby and Ormerod 2011). The estimated per person per trip value is £6.88 for wetlands (Sen et al. 2012), while the marginal value of extra provision on aesthetics and amenity is £227 per hectare per year (Morris and Camino 2011). The aesthetic value of wetlands is particularly significant in urban areas. The creation of the London Wetland Centre increased the value of adjacent, overlooking property significantly (Maltby and Ormerod 2011). A study of house prices in Great Britain demonstrates that a 1% increase in the area of freshwater including wetlands within 1km attracts a premium of 0.36% or £694 (Gibbons et al. 2014).
Cultural activities
Wetlands have high cultural value. Woodward and Wui (2001) estimated the value per hectare of wetland for recreational fishing at £1,161, for bird watching at £3,944, and £244 for bird hunting. Non-consumptive recreation has been valued at £82 per hectare per year (Morris and Camino 2011). Many ancient communities favoured residing by water bodies and so these sites are rich in archaeology and history. Recently excavated from a peat-infilled, former post-glacial lake, the Starr Carr house at Pickering, north Yorkshire, has been dated at 8,500 BP and is the oldest known dwelling in the UK (Maltby and Ormerod 2011). Wetlands act to preserve archaeological remains from erosion and decay (van de Noort et al. 2002). Reed, sedge,
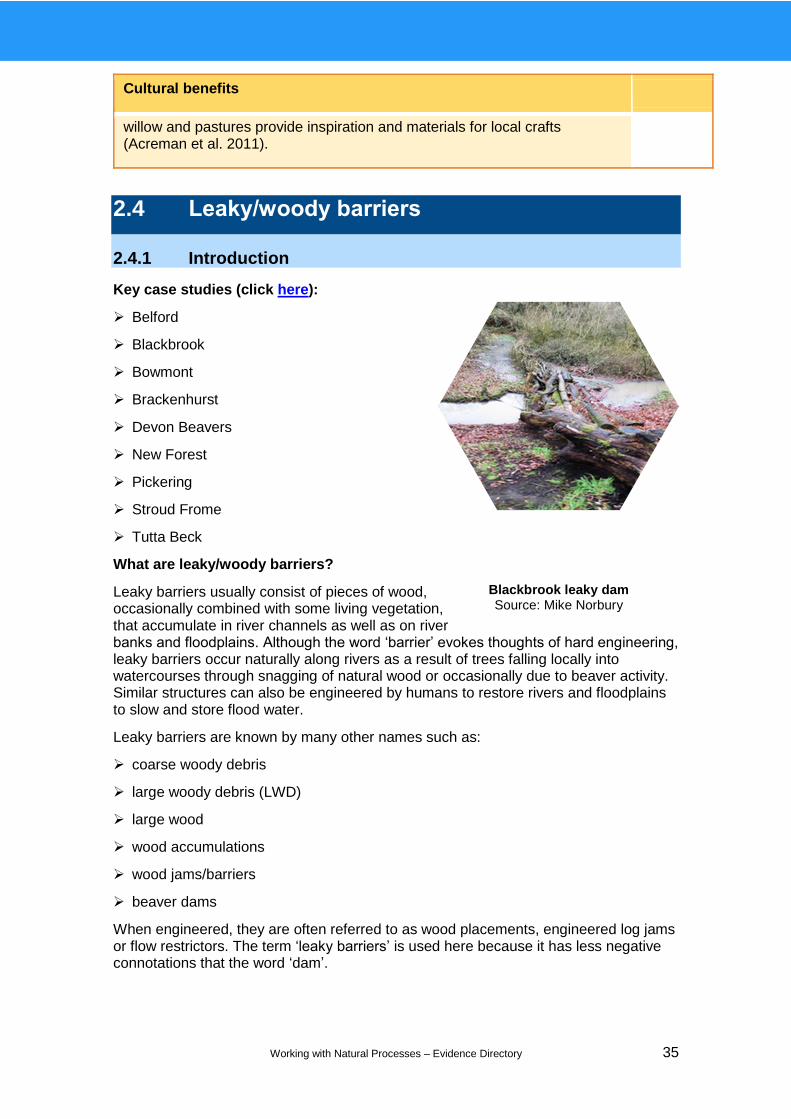
Working with Natural Processes – Evidence Directory 35
Cultural benefits
willow and pastures provide inspiration and materials for local crafts (Acreman et al. 2011).
2.4 Leaky/woody barriers
2.4.1 Introduction
Key case studies (click here):
Belford
Blackbrook
Bowmont
Brackenhurst
Devon Beavers
New Forest
Pickering
Stroud Frome
Tutta Beck
What are leaky/woody barriers?
Leaky barriers usually consist of pieces of wood, occasionally combined with some living vegetation, that accumulate in river channels as well as on river banks and floodplains. Although the word ‘barrier’ evokes thoughts of hard engineering, leaky barriers occur naturally along rivers as a result of trees falling locally into watercourses through snagging of natural wood or occasionally due to beaver activity. Similar structures can also be engineered by humans to restore rivers and floodplains to slow and store flood water.
Leaky barriers are known by many other names such as:
coarse woody debris
large woody debris (LWD)
large wood
wood accumulations
wood jams/barriers
beaver dams
When engineered, they are often referred to as wood placements, engineered log jams or flow restrictors. The term ‘leaky barriers’ is used here because it has less negative connotations that the word ‘dam’.
Blackbrook leaky dam Source: Mike Norbury
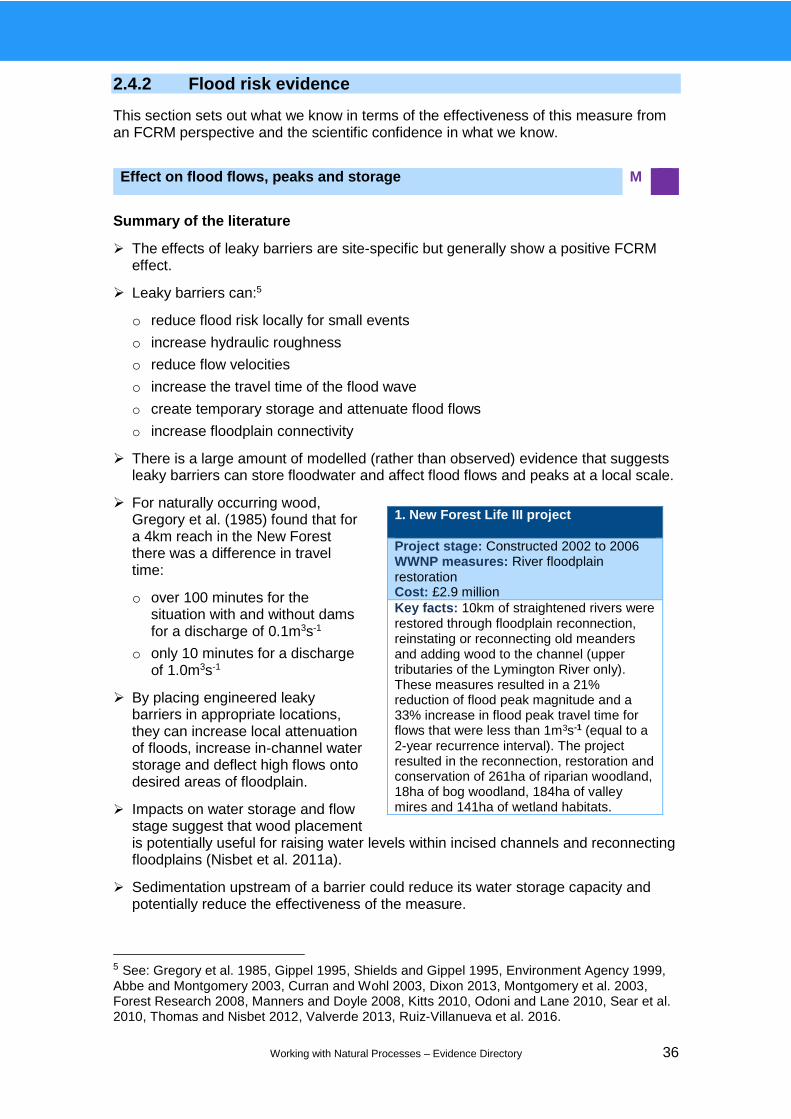
Working with Natural Processes – Evidence Directory 36
2.4.2 Flood risk evidence
This section sets out what we know in terms of the effectiveness of this measure from an FCRM perspective and the scientific confidence in what we know.
Summary of the literature
The effects of leaky barriers are site-specific but generally show a positive FCRM effect.
Leaky barriers can:5
o reduce flood risk locally for small events
o increase hydraulic roughness
o reduce flow velocities
o increase the travel time of the flood wave
o create temporary storage and attenuate flood flows
o increase floodplain connectivity
There is a large amount of modelled (rather than observed) evidence that suggests leaky barriers can store floodwater and affect flood flows and peaks at a local scale.
For naturally occurring wood, Gregory et al. (1985) found that for a 4km reach in the New Forest there was a difference in travel time:
o over 100 minutes for the situation with and without dams for a discharge of 0.1m3s-1
o only 10 minutes for a discharge of 1.0m3s-1
By placing engineered leaky barriers in appropriate locations, they can increase local attenuation of floods, increase in-channel water storage and deflect high flows onto desired areas of floodplain.
Impacts on water storage and flow stage suggest that wood placement is potentially useful for raising water levels within incised channels and reconnecting floodplains (Nisbet et al. 2011a).
Sedimentation upstream of a barrier could reduce its water storage capacity and potentially reduce the effectiveness of the measure.
5 See: Gregory et al. 1985, Gippel 1995, Shields and Gippel 1995, Environment Agency 1999, Abbe and Montgomery 2003, Curran and Wohl 2003, Dixon 2013, Montgomery et al. 2003, Forest Research 2008, Manners and Doyle 2008, Kitts 2010, Odoni and Lane 2010, Sear et al. 2010, Thomas and Nisbet 2012, Valverde 2013, Ruiz-Villanueva et al. 2016.
Effect on flood flows, peaks and storage M
1. New Forest Life III project
Project stage: Constructed 2002 to 2006 WWNP measures: River floodplain restoration Cost: £2.9 million
Key facts: 10km of straightened rivers were restored through floodplain reconnection, reinstating or reconnecting old meanders and adding wood to the channel (upper tributaries of the Lymington River only). These measures resulted in a 21% reduction of flood peak magnitude and a 33% increase in flood peak travel time for flows that were less than 1m3s-1 (equal to a 2-year recurrence interval). The project resulted in the reconnection, restoration and conservation of 261ha of riparian woodland, 18ha of bog woodland, 184ha of valley mires and 141ha of wetland habitats.
Working with Natural Processes – Evidence Directory 37
Important! There is a shortage of evidence addressing the potential of leaky barriers to synchronise flood peaks.
They can also have a negative flood risk impact should they wash out or decompose, as the woody material can be transported elsewhere in the catchment potentially causing a blockage.
With regards to beaver dams it has been found that:
o they are more watertight than wood barriers
o they not only attenuate channel flows but they also modify the hydrology of the riparian zone, driving seepage into the banks, bed and riparian zone and releasing water during dry periods (Giriat et al. 2016)
o there is a risk that large beaver ponds that fail may increase downstream flooding (Butler and Malanson 2005), although this risk is often reduced by beavers constructing ponds and meadows downstream (Gurnell et al. 2009)
Observed evidence
One empirically driven study (Wenzel et al. 2014), which used an artificial flood wave for a 3.5 year return period event, showed a:
o significant delay of the flood wave propagation over the local reach as a result of increased channel roughness
o a small decrease in peak discharge (2.2%)
Modelled evidence
There are more modelling studies than empirical studies assessing measure performance.
When modelling log jams alone, Dixon (2013) found a variable response with less clear spatial trends than for forest restoration. He also noted issues with the synchronisation of flood peaks when draining from different tributaries. This study also found that naturally occurring log jams accounted for 65% of flow resistance in forested river channels; this rose to 75–98% where the log jam was inducing a distinct step in the water profile.
Modelling studies at the reach scale have generally shown that:
o wood placement measures can slow the flood wave locally and delay the timing of a flood peak (Kitts 2010, Thomas and Nisbet 2012, Dixon 2013)
o wood placement measures slow the progression of flood waves, though they do not necessarily reduce peak magnitude (Thomas and Nisbet 2012), possibly due to water moving onto the floodplain and flowing back into the stream below the wood placement measure
In the Pickering catchment, Nisbet et al. (2011a) reviewed the benefits of leaky barriers and showed these measures can delay the travel time of the flood peak.
A modelling study by Odoni and Lane (2010) found that the installation of 100 leaky barriers could reduce the magnitude of a flood event by 7.5% (from 29.5m3s-1 to 27.3m3s-1).
In the New Forest, Kitts (2010) found large wood accumulations in small wooded catchments (~12km2) can alter the timing of a small flood peak by up to 33%.
In Wales, the Robinwood study (Forest Research 2008) found that:
o leaky barriers can slow the flow and also attenuate floods

Working with Natural Processes – Evidence Directory 38
o in a 1 in 100 year flood, leaky barriers delayed the flood peak by a few minutes
o if the flood becomes too large and the features become submerged, the effects become less pronounced
In modelling, leaky barriers are represented by changing the Manning’s n value. This value is different for a naturally occurring leaky barrier compared with an engineered barrier.
o Environment Agency (1999) noted that natural, less rigidly secure wood lifts with stage, leading to a lower n value (for a particular reach) than might be anticipated and a strongly varying n value as stage increases.
o The difference in Manning’s n between channels that have LWD and those which do not converges with increasing discharge (Environment Agency 1999).
Thomas and Nisbet (2012) used a ‘channel blockage function’ rather than increasing roughness. With a 70% blockage factor applied, they found that 15 leaky barriers could increase the travel time of a flood wave by 2–3 minutes (over a 0.5km reach).
Summary of the literature
Generally, leaky barriers can:6
o trap fine sediment
o create areas of sediment scour and deposition
o encourage sediment sorting
o help create pool, riffle and bar formation
6 See: Bilby 1984, Cherry and Beschta 1989, Gregory et al. 1994, Montgomery et al. 1995, Abbe and Montgomery 1996, Gurnell and Sweet 1998, Buffington et al. 2002, Bennett et al. 2008, Addy and Wilkinson 2016.
Effect on sedimentation and geomorphology H
12. Pickering – north Yorkshire
Project stage: Constructed (2009) WWNP measures: Flood storage bund, timber bunds, wood dams, drain blocking, woodland planting, erosion control, soil aeration and farm-yard and road/track works Cost: £4 million (£2.7 million engineered food storage area, the rest on WWNP measures and other project costs)
Key facts: The scheme as a whole (all measures) reduces the risk of flooding in Pickering from a 25% chance in any year to a less than 4% chance. Analysis of flow measurements from the Boxing Day 2015 storm event concluded the scheme prevented flooding to a small number of properties in the town. It is estimated that the measures reduced the flood peak by 15–20%, with around half of the reduction due to the upstream land management measures (such as leaky dams) and half due to the large flood storage bund.
13. Stroud Rural SuDS Project: community engagement in NFM – Gloucestershire
Project stage: Construction/delivery (2014 to 2020) WWNP measures: Large woody dams, earth bunds, retention pools Cost: £430,000 (£315,000 project officer and £115,000 capital project costs); average cost/structure to date: £1,670.
Key facts: The project has worked with 16 land managers and put in place 257 NFM measures. 52.5km2 (21%) of the Frome catchment now drains through NFM structures. Initial gauge data from the rain event on 9 March 2016 and observed evidence at various structures have shown that the underlying limestone geology of the catchment has enabled large volumes of surface water to infiltrate to groundwater, reducing total surface flows and subsequent flood risk.

Working with Natural Processes – Evidence Directory 39
In relation to sediment management and geomorphic response, in-stream woody material can lead to:
o reduced sediment transport (Jeffries et al. 2003, Dixon, 2013)
o formation of more natural channel features (Kail et al. 2007)
o increases in pool (and associated bar and riffle) formation (Gregory et al. 1994)
In the New Forest, a recent survey of floodplain formation and morphology along the Highland Water demonstrated how wood accumulations are also a major influence on side channel formation. Complex channel networks and floodplain morphologies developed quite rapidly after the establishment of major in-channel wood jams (Sear et al. 2010).
In the Bowmont catchment, engineered log jams have been installed to trap coarse sediment on channel bars to mitigate coarse sediment problems. During one flood event, 16 structures induced geomorphic responses, although only 4 of the 33 structures induced significant deposition (> +0.3m), highlighting the importance of wood structure design and placement considerations (Addy and Wilkinson 2016).
Similar results can be seen for beaver dams.
In a study site in Poland, beaver ponds have experienced sedimentation rates of 14cm per year (Giriat et al. 2016).
At the same study site between 2004 and 2011, 1,710.1 m3 of sediment was deposited behind the beaver dams studied, with an average sediment thickness of 25.1 cm (Giriat et al. 2016).
On a study site in Devon on a headwater stream, beaver ponds have induced a reduction in suspended sediment, nitrogen and phosphate concentrations. When combined with the attenuated flows, this has resulted in lower diffuse pollutant loads downstream (Brazier et al. 2016, Puttock et al. 2017).
Beaver dam failure can also result in sediment moving downstream, though this can be mitigated by the next beaver dam.
14. Bowmont leaky dams – Scottish Borders
Project stage: Partially constructed (2012) WWNP measures: A total of 78 leaky barrier structures – engineered log jams; flow restrictors in gullys and bank protection measures; 1–2% of full catchment area planted in floodplain areas and steep valleys. Cost: ~£100,000
Key facts: Over the 4-year period of monitoring, 78 leaky barrier structures have been installed to capture and stabilise sediment and attenuate flows. 53ha of native riparian and floodplain forest have been planted. During one flood event, 16 structures induced geomorphic responses, but only 4 of the 33 structures induced significant deposition (> +0.3m)
15. Devon Beaver Project – headwater stream, north Devon
Project stage: Underway (2016 onwards) WWNP measures: Reintroduction of native species. Woody material dams, earth dams, habitat restoration and creation Cost: Not available
Key facts: Since their introduction into an enclosed site, the beavers have:
constructed 13 dams holding up to 1m litres of additional water within ponds
influenced an area of 1.8ha, equating to 56 litres of surface water storage per m²
meant that, during storm events, on average, peak flows are 30% lower leaving the site
increased the lag time between peak flow entering and leaving the site
reduced peak flow even in saturated conditions
resulted in significant and constant base flow from the site
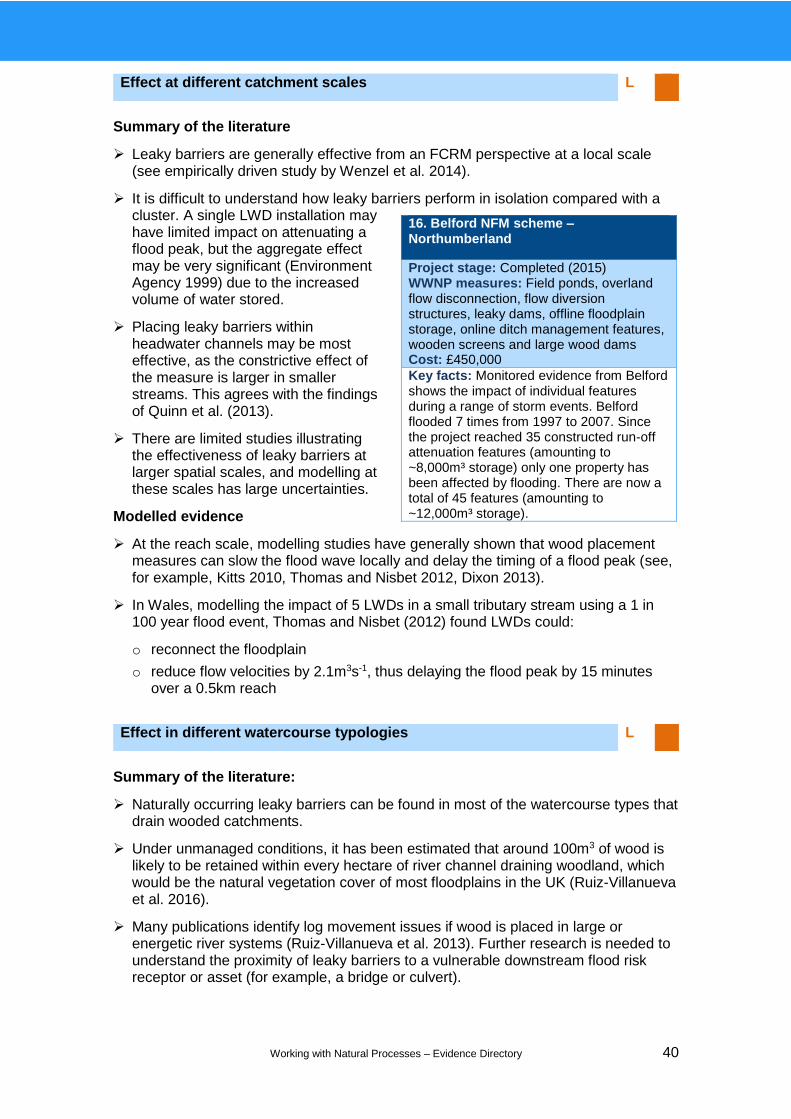
Working with Natural Processes – Evidence Directory 40
Summary of the literature
Leaky barriers are generally effective from an FCRM perspective at a local scale (see empirically driven study by Wenzel et al. 2014).
It is difficult to understand how leaky barriers perform in isolation compared with a cluster. A single LWD installation may have limited impact on attenuating a flood peak, but the aggregate effect may be very significant (Environment Agency 1999) due to the increased volume of water stored.
Placing leaky barriers within headwater channels may be most effective, as the constrictive effect of the measure is larger in smaller streams. This agrees with the findings of Quinn et al. (2013).
There are limited studies illustrating the effectiveness of leaky barriers at larger spatial scales, and modelling at these scales has large uncertainties.
Modelled evidence
At the reach scale, modelling studies have generally shown that wood placement measures can slow the flood wave locally and delay the timing of a flood peak (see, for example, Kitts 2010, Thomas and Nisbet 2012, Dixon 2013).
In Wales, modelling the impact of 5 LWDs in a small tributary stream using a 1 in 100 year flood event, Thomas and Nisbet (2012) found LWDs could:
o reconnect the floodplain
o reduce flow velocities by 2.1m3s-1, thus delaying the flood peak by 15 minutes over a 0.5km reach
Summary of the literature:
Naturally occurring leaky barriers can be found in most of the watercourse types that drain wooded catchments.
Under unmanaged conditions, it has been estimated that around 100m3 of wood is likely to be retained within every hectare of river channel draining woodland, which would be the natural vegetation cover of most floodplains in the UK (Ruiz-Villanueva et al. 2016).
Many publications identify log movement issues if wood is placed in large or energetic river systems (Ruiz-Villanueva et al. 2013). Further research is needed to understand the proximity of leaky barriers to a vulnerable downstream flood risk receptor or asset (for example, a bridge or culvert).
Effect at different catchment scales L
Effect in different watercourse typologies L
16. Belford NFM scheme – Northumberland
Project stage: Completed (2015) WWNP measures: Field ponds, overland flow disconnection, flow diversion structures, leaky dams, offline floodplain storage, online ditch management features, wooden screens and large wood dams Cost: £450,000
Key facts: Monitored evidence from Belford shows the impact of individual features during a range of storm events. Belford flooded 7 times from 1997 to 2007. Since the project reached 35 constructed run-off attenuation features (amounting to ~8,000m³ storage) only one property has been affected by flooding. There are now a total of 45 features (amounting to ~12,000m³ storage).
Working with Natural Processes – Evidence Directory 41
Ideally, leaky barriers should not be located immediately upstream of constrictive structures.
Beavers cannot build dams where the flow rate of a channel is too great. This is why beaver dams are more commonly found on smaller channels less than 6m wide (Gaywood 2015).
During a study of a 5.9km length of the main Highland Water in the New Forest, Gurnell and Sweet (1998) observed a maximum spacing of 6.9 wood accumulations per 100m of channel. They also found that:
o the spacing of these wood accumulations varied with channel width, typically occurring every 6 to 9 channel widths
o the lowest frequencies of wood accumulations occurred in a straightened reach draining a coniferous plantation, illustrating the impact of wood management and a simplified channel morphology on wood retention
The findings of Gaywood and Sweet (1998) illustrate the importance of the ratio of wood piece length (dependent on tree size) to the width of the river channel, with spacing being one of many properties of wood accumulations that changes progressively as channel size increases.
Important! There is limited evidence of how these measures perform during extreme flood events. A great deal of caution is needed when installing leaky barriers to ensure they do not become detached, cause a downstream blockage with consequent impacts on public safety.
Summary of the literature
There is a High level of confidence in the understanding of how long it takes woody barriers to become effective, because their effect is instantaneous
There is little information available on how long engineered or naturally leak barriers last (decomposition rate).
There is Med confidence when it comes to understanding how long naturally formed leaky barriers take to become effective.
o Natural wood accumulations and beaver dams take time to establish. The former generally take the longest to establish. The time taken varies from catchment to catchment and from storm to storm.
o Natural leaky barriers develop and are sustained by wood released from riparian woodland. If woodland planting is required to sustain wood delivery, the trees will take time to establish. In the meantime, soft engineered approaches such as brash barrier placements (see, for example, Wilkinson et al. 2010a) can be used to rapidly increase floodplain roughness while the trees and other vegetation establish and mature, and can be combined with artificial wood placement within the river channel.
There is a Low level of knowledge about the design life of woody barriers.
o Wood will decay naturally. The rate of decay, however, depends on the type of wood, the size of wood, how often the wood is wet and the temperature (Lofroth 1998).
o Dixon (2013) noted that information on decay rates for wood in rivers is sparse.
Design life and effectiveness L/M/H

Working with Natural Processes – Evidence Directory 42
o In channels bordered by mature woodland, however, decayed wood is continuously replaced by undecayed wood, so that many wood jams tend to persist in the same location (see, for example, Gurnell and Sweet 1998).
Engineered log jams
Wood placements are often secured to prevent their movement. However, this makes them quite rigid and unlike naturally occurring wood jams.
Less secured engineered placements have a greater risk of failing, which could have negative downstream impacts if culverts or bridges are blocked.
There is little guidance on how to design engineered leaky barriers from an FCRM perspective.
There are no detailed observed studies assessing the decomposition of wood within jams over time.
Engineered leaky barrier should be implemented alongside riparian planting, so that the riparian planting will provide new wood as the leaky barrier rots. In the Blackbrook case study, for example, the in-channel woody barrier is supported by a living willow spilling fence which helps hold the barrier in place and traps sediment.
Engineered leaky barriers may be more secure but provide fewer multiple benefits than naturally occurring log jams; they may also obstruct fish passage and create adverse effects on geomorphology.
Naturally occurring log jams
Naturally occurring wood and beaver dams could move during a flood event. However, naturally wooded channels tend to be irregular and so prevent wood moving long distances. The riparian woodland also provides a source of new wood to contribute to wood jam (re)construction.
Large floods can shorten the lifespan of leaky barriers, with some measures being washed out by extreme events and thus shortening the life span of natural and engineered structures (Addy and Wilkinson 2016).
The installation of leaky barriers (as outlined by Dodd et al. 2016) in a river channel usually has an immediate effect on the attenuation of flood flows, unlike riparian planting, which takes time to establish.
Summary of the literature
Leaky barriers may need maintenance if there is insufficient natural wood supply, or if sedimentation occurs upstream of the barrier.
Naturally occurring wood in rivers can have a number of benefits and in most cases should be left in the channel.
Engineered leaky barriers – and to an extent naturally occurring wood in rivers – can be complex to manage because:
o the wood will decay in the long term
o wood structures may induce sediment erosion and deposition, and so engineered leaky barriers need to be placed where these processes will not create problems
o they could have an impact on migratory fish (see Dodd et al. 2016)
Leaky barriers should be inspected frequently and after flood events (Quinn et al. 2013, Dodd et al. 2016) to check for:
Maintenance requirements M

Working with Natural Processes – Evidence Directory 43
o destabilising settlement of the wood, often associated with scouring
o accumulation of wood sufficient to cause blockages
It is possible that scour and deposition cycles will become balanced in time. Remediation will be required if scouring becomes excessive. Scouring rates are dependent on the structure design, the stability of the banks and the stability of the river bed, and so will vary from site to site.
In the case of beaver dams, water retention may deteriorate rapidly once the dams are abandoned by beavers. In Poland, dams that were not maintained by beavers showed a decreased retention of water from 15,000m3 to 7,000m3 over a 3–5 year period (Grygoruk and Nowak 2014).
2.4.3 Multiple benefits
The benefits wheel shows that woody barriers can have a range of benefits – most notably water quality, habitat and climate regulation benefits. This benefits wheel is a combination of engineered and natural barriers, and is averaged across both to give an indication of likely potential benefits.
Multiple benefits of leaky barriers
Leaky barriers
Water Quality
Habitat
Climate Regulation
Low Flows
Flood (Fluv)
Flood (SW or GW)
Air Quality Health
Access
Cultural Activity
Aesthetic Quality
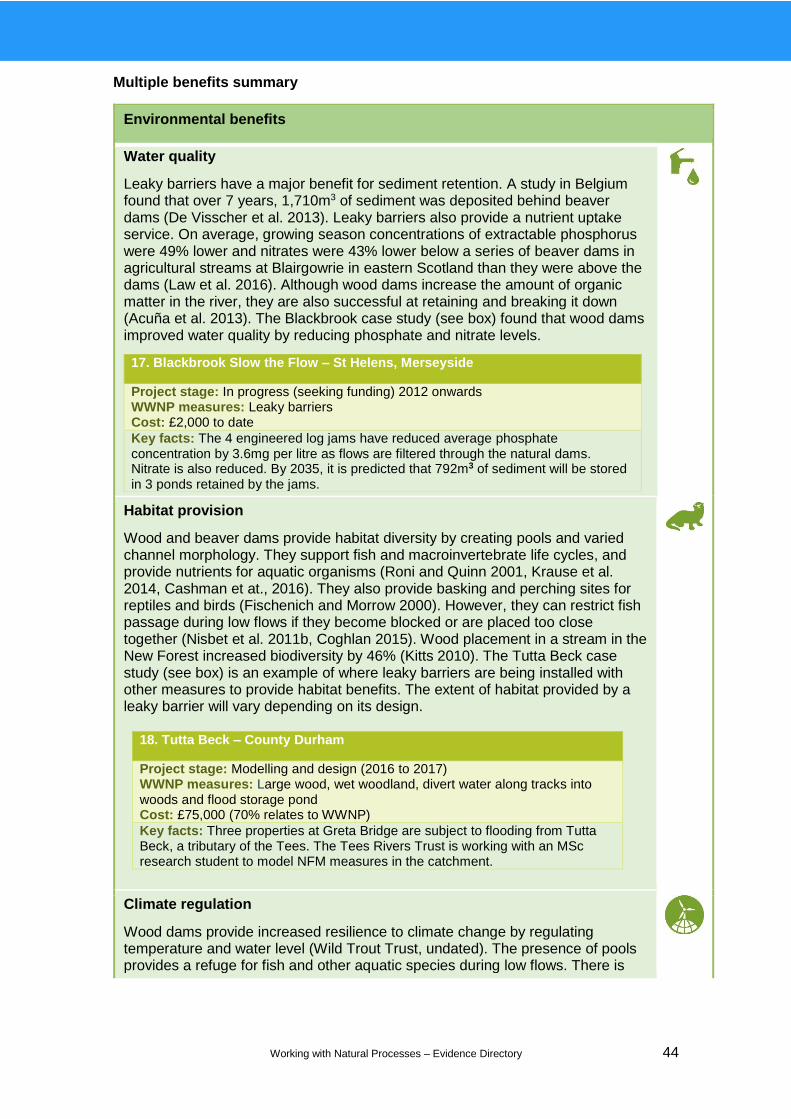
Working with Natural Processes – Evidence Directory 44
Multiple benefits summary
Environmental benefits
Water quality
Leaky barriers have a major benefit for sediment retention. A study in Belgium found that over 7 years, 1,710m3 of sediment was deposited behind beaver dams (De Visscher et al. 2013). Leaky barriers also provide a nutrient uptake service. On average, growing season concentrations of extractable phosphorus were 49% lower and nitrates were 43% lower below a series of beaver dams in agricultural streams at Blairgowrie in eastern Scotland than they were above the dams (Law et al. 2016). Although wood dams increase the amount of organic matter in the river, they are also successful at retaining and breaking it down (Acuña et al. 2013). The Blackbrook case study (see box) found that wood dams improved water quality by reducing phosphate and nitrate levels.
17. Blackbrook Slow the Flow – St Helens, Merseyside
Project stage: In progress (seeking funding) 2012 onwards WWNP measures: Leaky barriers Cost: £2,000 to date
Key facts: The 4 engineered log jams have reduced average phosphate concentration by 3.6mg per litre as flows are filtered through the natural dams. Nitrate is also reduced. By 2035, it is predicted that 792m3 of sediment will be stored in 3 ponds retained by the jams.
Habitat provision
Wood and beaver dams provide habitat diversity by creating pools and varied channel morphology. They support fish and macroinvertebrate life cycles, and provide nutrients for aquatic organisms (Roni and Quinn 2001, Krause et al. 2014, Cashman et at., 2016). They also provide basking and perching sites for reptiles and birds (Fischenich and Morrow 2000). However, they can restrict fish passage during low flows if they become blocked or are placed too close together (Nisbet et al. 2011b, Coghlan 2015). Wood placement in a stream in the New Forest increased biodiversity by 46% (Kitts 2010). The Tutta Beck case study (see box) is an example of where leaky barriers are being installed with other measures to provide habitat benefits. The extent of habitat provided by a leaky barrier will vary depending on its design.
Climate regulation
Wood dams provide increased resilience to climate change by regulating temperature and water level (Wild Trout Trust, undated). The presence of pools provides a refuge for fish and other aquatic species during low flows. There is
18. Tutta Beck – County Durham
Project stage: Modelling and design (2016 to 2017) WWNP measures: Large wood, wet woodland, divert water along tracks into woods and flood storage pond Cost: £75,000 (70% relates to WWNP)
Key facts: Three properties at Greta Bridge are subject to flooding from Tutta Beck, a tributary of the Tees. The Tees Rivers Trust is working with an MSc research student to model NFM measures in the catchment.
Working with Natural Processes – Evidence Directory 45
Environmental benefits
evidence that submerged wood creates a carbon sink whereby carbon decays very slowly, even under rising temperatures (Guyette et al., 2002).
Low flows
Large wood can divert low and high flows, providing respite for organisms from flooding and drought events. Woody barriers induce water ponding upstream, and scouring of the bed and banks both around the barrier and downstream of it, creating pools which store water and can regulate low flows during dry periods (Booth et al. 1997, Gurnell 2013).
Social benefits
Health access
There is little evidence that wood barriers provide health or access benefits. They potentially increase the sound of the river, which has been found to have a therapeutic effect (Research Box 2009). If wood breaks free from its anchors, it may become a safety hazard (Fischenich and Morrow 2000).
Air quality
Wood barriers have the potential to improve air quality through their long-term carbon sequestration function. However, beaver activity increases the emissions of the greenhouse gas, methane (Whitfield et al. 2015).
Surface water or groundwater flood
Wood barriers create additional water storage capacity, which can capture overland flow. Upstream of Pickering, 104 barriers provide a total of ~1,020m3 of potential flood storage (Nisbet et al. 2015). Beaver dams similarly generate space for holding water. The introduction of beavers into the Boldventure site in Devon has created 33 litres of surface water storage per m2 of land (Puttock et al. 2017). However, if beaver dams are not maintained there is a risk of loss in water retention (Grygoruk and Nowak 2014). Also when a flood arrives, that storage may already be filled and could act as a source area for run-off.
Fluvial flood
Leaky barriers slow channel flow by creating hydraulic roughness (Hygelund and Manga 2003). They can also help to increase floodplain connectivity and create in-channel water storage areas, contributing towards run-off attenuation (Shields and Gippel 1995, Sear et al. 2010). Modelling studies show that placing wood in river channels can slow flood waves and delay the flood peak (Kitts 2010, Thomas and Nisbet 2012, Dixon et al. 2016). However, benefits are usually localised and confined to small or medium rainfall events. Large wood barriers can have a greater effect on flood flow than planting woodland vegetation alone, although both measures are complementary (Nisbet et al. 2011a). Table 2.3 provides monetary value

Working with Natural Processes – Evidence Directory 46
Social benefits
estimates of the contribution of different types of WWNP to flood risk reduction.
Table 2.3 Leaky barrier monetary value estimates of contribution of different types of NFM to flood risk reduction
Case Type and main measures
Benefits* (PV50)
Costs (PV50)
Benefit–cost ratio
Cost per m3?
Benefit per m3?
Pickering Woodland: planting, attenuation and storage
~£5 million ~£4 million (£3.4 million for NFM)
1.25:1 on FRM only, strongly positive with wider benefits
Range: £5 for moorland measures; £20–£23 for dams and woodland; £1,450 farm measures
Estimate of £28 per m3
for 120,000m3
Stroud Frome
Floodplain: attenuation and storage
£1.7 million or higher
£430,000 to date
4:1 or better
Not applicable
Not applicable
Blackbrook Floodplain: attenuation and storage
£4,500 pro rata to date
£2,000 to date (4× dams)
2:1 £1.25 per m3 for dams installed £43 per m3 for wetland
~£1.50–£1.80 per m3 if full; 300,000m3
can be installed
Notes: FRM = flood risk management
Source: Eftec (2017)
Cultural benefits
Aesthetics
Visually wood barriers may be perceived as ‘scruffy’ and, in river restoration projects, are often the first thing to be removed by the public in an aim to make the landscape look ‘manicured’ (Booth et al. 1997). It may therefore be necessary to educate people on the ‘naturalness’ of wood as part of the river landscape.
Cultural activities
One study valued the ecosystem services provided by wood placement projects at €1·08 to €1·81 per meter per year, with the largest economic value for recreational opportunities (Acuña et al. 2013). This was based on a large increase in the number of fish available for angling. Increased
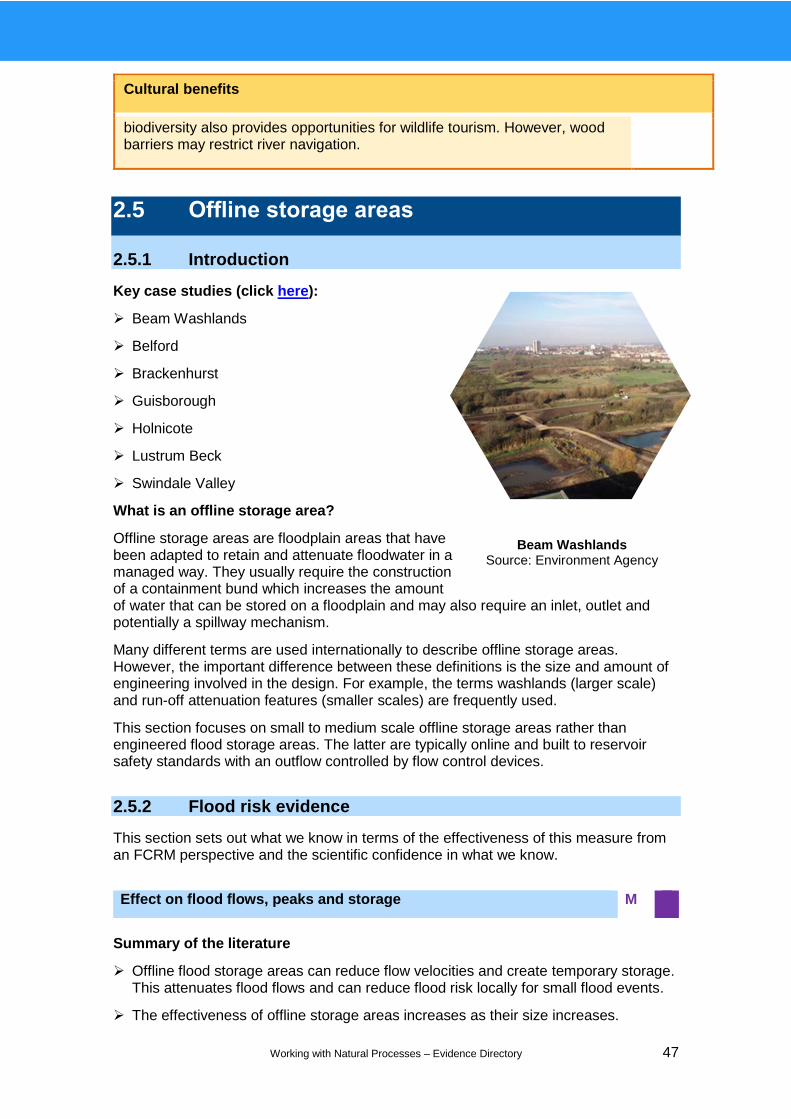
Working with Natural Processes – Evidence Directory 47
Cultural benefits
biodiversity also provides opportunities for wildlife tourism. However, wood barriers may restrict river navigation.
2.5 Offline storage areas
2.5.1 Introduction
Key case studies (click here):
Beam Washlands
Belford
Brackenhurst
Guisborough
Holnicote
Lustrum Beck
Swindale Valley
What is an offline storage area?
Offline storage areas are floodplain areas that have been adapted to retain and attenuate floodwater in a managed way. They usually require the construction of a containment bund which increases the amount of water that can be stored on a floodplain and may also require an inlet, outlet and potentially a spillway mechanism.
Many different terms are used internationally to describe offline storage areas. However, the important difference between these definitions is the size and amount of engineering involved in the design. For example, the terms washlands (larger scale) and run-off attenuation features (smaller scales) are frequently used.
This section focuses on small to medium scale offline storage areas rather than engineered flood storage areas. The latter are typically online and built to reservoir safety standards with an outflow controlled by flow control devices.
2.5.2 Flood risk evidence
This section sets out what we know in terms of the effectiveness of this measure from an FCRM perspective and the scientific confidence in what we know.
Summary of the literature
Offline flood storage areas can reduce flow velocities and create temporary storage. This attenuates flood flows and can reduce flood risk locally for small flood events.
The effectiveness of offline storage areas increases as their size increases.
Effect on flood flows, peaks and storage M
Beam Washlands Source: Environment Agency
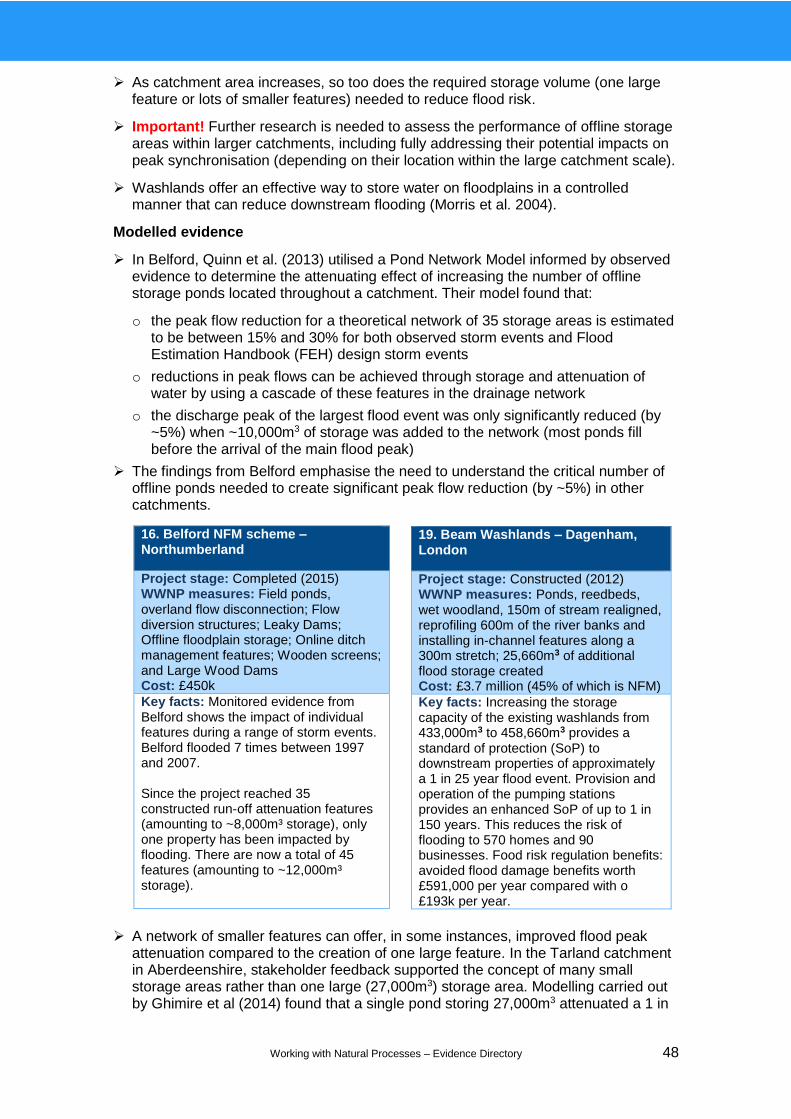
Working with Natural Processes – Evidence Directory 48
As catchment area increases, so too does the required storage volume (one large feature or lots of smaller features) needed to reduce flood risk.
Important! Further research is needed to assess the performance of offline storage areas within larger catchments, including fully addressing their potential impacts on peak synchronisation (depending on their location within the large catchment scale).
Washlands offer an effective way to store water on floodplains in a controlled manner that can reduce downstream flooding (Morris et al. 2004).
Modelled evidence
In Belford, Quinn et al. (2013) utilised a Pond Network Model informed by observed evidence to determine the attenuating effect of increasing the number of offline storage ponds located throughout a catchment. Their model found that:
o the peak flow reduction for a theoretical network of 35 storage areas is estimated to be between 15% and 30% for both observed storm events and Flood Estimation Handbook (FEH) design storm events
o reductions in peak flows can be achieved through storage and attenuation of water by using a cascade of these features in the drainage network
o the discharge peak of the largest flood event was only significantly reduced (by ~5%) when ~10,000m3 of storage was added to the network (most ponds fill before the arrival of the main flood peak)
The findings from Belford emphasise the need to understand the critical number of offline ponds needed to create significant peak flow reduction (by ~5%) in other catchments.
A network of smaller features can offer, in some instances, improved flood peak attenuation compared to the creation of one large feature. In the Tarland catchment in Aberdeenshire, stakeholder feedback supported the concept of many small storage areas rather than one large (27,000m3) storage area. Modelling carried out by Ghimire et al (2014) found that a single pond storing 27,000m3 attenuated a 1 in
16. Belford NFM scheme – Northumberland
Project stage: Completed (2015) WWNP measures: Field ponds, overland flow disconnection; Flow diversion structures; Leaky Dams; Offline floodplain storage; Online ditch management features; Wooden screens; and Large Wood Dams Cost: £450k
Key facts: Monitored evidence from Belford shows the impact of individual features during a range of storm events. Belford flooded 7 times between 1997 and 2007. Since the project reached 35 constructed run-off attenuation features (amounting to ~8,000m³ storage), only one property has been impacted by flooding. There are now a total of 45 features (amounting to ~12,000m³ storage).
19. Beam Washlands – Dagenham, London
Project stage: Constructed (2012) WWNP measures: Ponds, reedbeds, wet woodland, 150m of stream realigned, reprofiling 600m of the river banks and installing in-channel features along a 300m stretch; 25,660m3 of additional flood storage created Cost: £3.7 million (45% of which is NFM)
Key facts: Increasing the storage capacity of the existing washlands from 433,000m3 to 458,660m3 provides a standard of protection (SoP) to downstream properties of approximately a 1 in 25 year flood event. Provision and operation of the pumping stations provides an enhanced SoP of up to 1 in 150 years. This reduces the risk of flooding to 570 homes and 90 businesses. Food risk regulation benefits: avoided flood damage benefits worth £591,000 per year compared with o £193k per year.

Working with Natural Processes – Evidence Directory 49
2 year event (Qmed) by ~9% (for a catchment area of 25km2). Several smaller ponds (ranging from 1,500m3 to 4,000m3) were incorporated into the modelling framework at opportunistic sites to give a total storage of 23,000m3). The Qmed event was attenuated by ~5% by these smaller ponds, which is comparable to the large offline storage area scenario. If these smaller areas were made slightly larger (4,000–6,000m3), giving a total storage of 48,000m3, then the Qmed event could be attenuated by ~12%.
Future research to look at the flood impacts and benefits of different WWNP measures for larger events would be useful to understand when storage areas are likely to be filled before the peak and during a sequence of events if they cannot drain quickly enough.
On the Holnicote project (see box), 5 floodplain offline storage ponds were created in the Aller catchment on the Natural Trust’s Holnicote Estate by constructing earth bunds with piped outlets. This project stores 25,000m3 of additional floodwater on the floodplain (above the natural flood storage volume that is available). Use of a 1D–2D hydraulic model to assess the attenuation effect of these ponds found that:
o using data from the 23–24 December 2013 flood event, there was a decrease in peak flow from 14.4m3s-1 to 13.1m3s-1 – a 10% reduction in the flood peak for a catchment area of ~15km2 (National Trust 2015)
o the reduction may be larger for floods with a smaller return period (for example, a 1 in 5 year event could see a 25% reduction)
Summary of the literature:
Offline storage areas may trap sediment during flood flows
Offline storage areas have the ability to improve water quality by capturing sediments and cycling nutrients and pollutants (Morris et al. 2004).
Depending on the land use and land/soil management in the upstream catchment, ponds can also fill up quickly with sediment.
o The rate of sedimentation depends on the frequency of inundation and the concentrations of suspended sediments in the floodwater.
o This sediment needs to be periodically removed in order to maintain the storage capacity of the pond (Barber and Quinn 2012, Wilkinson et al. 2014).
Effect on sedimentation and geomorphology M
20. Holnicote: From Source to Sea – West Somerset
Project Stage: Constructed 2009-2015 WWNP Measures: Drainage management along 19,250m of upland features, 41 natural wood dams, 5 storage bunds, 5 ha of new woodland, 5 fields of arable reversion. Wet woodland pond restoration/excavation. Cost: £1.22m (£280k of which was for WWNP measures)
Key facts: During an extreme rainfall event on an already saturated catchment in late December 2013, NFM measures reduced the flood peak by 10%. With a combined insurance value of £30 million, none of the 98 properties at risk were affected by flooding during this or any subsequent flood events. Capital costs of constructing the offline storage bunds on the floodplain upstream of the vulnerable properties were £163k.
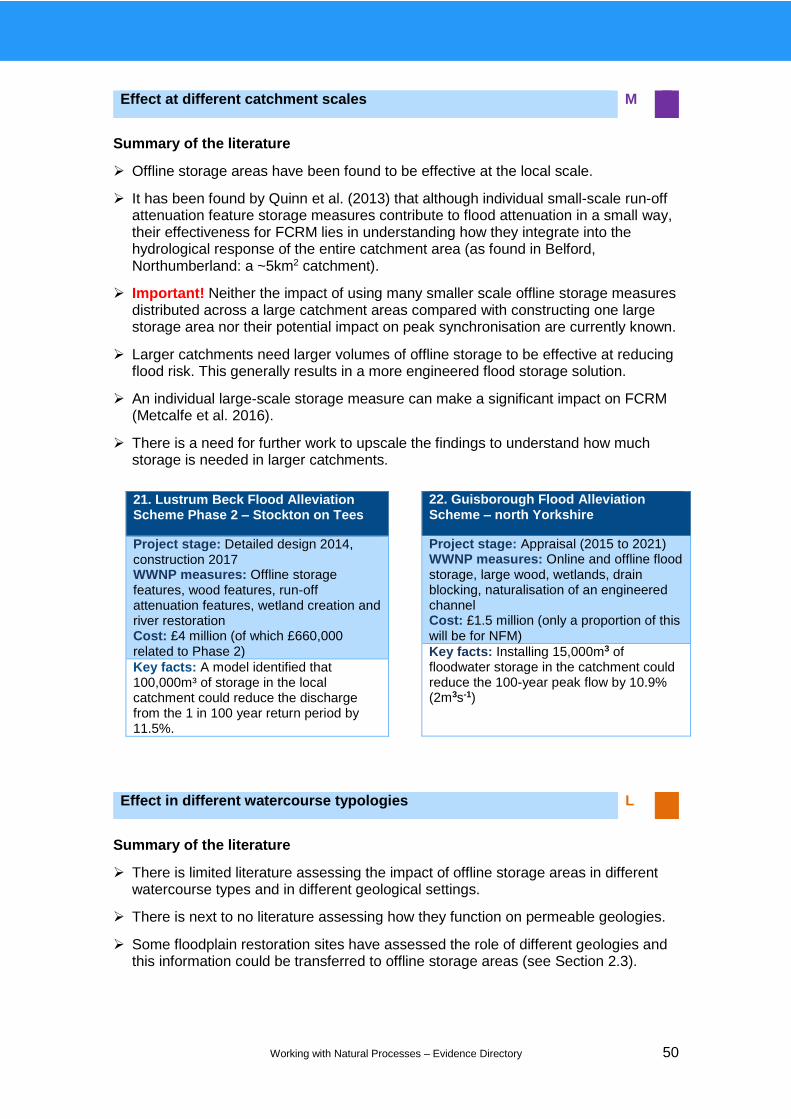
Working with Natural Processes – Evidence Directory 50
Summary of the literature
Offline storage areas have been found to be effective at the local scale.
It has been found by Quinn et al. (2013) that although individual small-scale run-off attenuation feature storage measures contribute to flood attenuation in a small way, their effectiveness for FCRM lies in understanding how they integrate into the hydrological response of the entire catchment area (as found in Belford, Northumberland: a ~5km2 catchment).
Important! Neither the impact of using many smaller scale offline storage measures distributed across a large catchment areas compared with constructing one large storage area nor their potential impact on peak synchronisation are currently known.
Larger catchments need larger volumes of offline storage to be effective at reducing flood risk. This generally results in a more engineered flood storage solution.
An individual large-scale storage measure can make a significant impact on FCRM (Metcalfe et al. 2016).
There is a need for further work to upscale the findings to understand how much storage is needed in larger catchments.
Summary of the literature
There is limited literature assessing the impact of offline storage areas in different watercourse types and in different geological settings.
There is next to no literature assessing how they function on permeable geologies.
Some floodplain restoration sites have assessed the role of different geologies and this information could be transferred to offline storage areas (see Section 2.3).
Effect at different catchment scales M
Effect in different watercourse typologies L
21. Lustrum Beck Flood Alleviation Scheme Phase 2 – Stockton on Tees
Project stage: Detailed design 2014, construction 2017 WWNP measures: Offline storage features, wood features, run-off attenuation features, wetland creation and river restoration Cost: £4 million (of which £660,000 related to Phase 2)
Key facts: A model identified that 100,000m³ of storage in the local catchment could reduce the discharge from the 1 in 100 year return period by 11.5%.
22. Guisborough Flood Alleviation Scheme – north Yorkshire
Project stage: Appraisal (2015 to 2021) WWNP measures: Online and offline flood storage, large wood, wetlands, drain blocking, naturalisation of an engineered channel Cost: £1.5 million (only a proportion of this will be for NFM)
Key facts: Installing 15,000m3 of floodwater storage in the catchment could reduce the 100-year peak flow by 10.9% (2m3s-1)

Working with Natural Processes – Evidence Directory 51
Important! There is limited evidence of how these measures perform during extreme flood events. A great deal of caution is needed when designing them to ensure that any associated infrastructure (e.g. containment bunds, inlets, outlets and spillways) are robustly designed and do not impact public safety.
Summary of the literature
As this is a more engineered measure, if designed correctly the measure can work straightaway and needs no lead in time to be effective.
Offline storage areas raise water levels on floodplains and require engineering to ensure they are safe. They should therefore last for the design life required for the engineering design.
Like any flood defence asset, maintenance is required to ensure longevity.
If maintenance is carried out, then the measure should have a long life span.
A greater amount of maintenance is required following flood events.
Summary of the literature
Offline storage areas may require maintenance, the amount of which depends on how they are designed.
Smaller scale storage areas that do not flood frequently will require less maintenance than a larger scale storage area which floods more often.
Where an offline storage area is located on farmland, it is important recognise that arable crops are more susceptible to damage from waterlogging than grasslands.
If the washland or offline storage ponds are on more favourable agricultural areas, it may be necessary to manage soil water to ensure crops are able to grow on the site after the floodwaters have receded and enable access over any raised banks
Access for maintenance plant may be needed.
2.5.3 Multiple benefits
Limited literature was available on the wider benefits of offline storage areas, so the benefits summary below therefore draws mainly on literature related to washlands.
Design life and effectiveness H
Maintenance requirements M
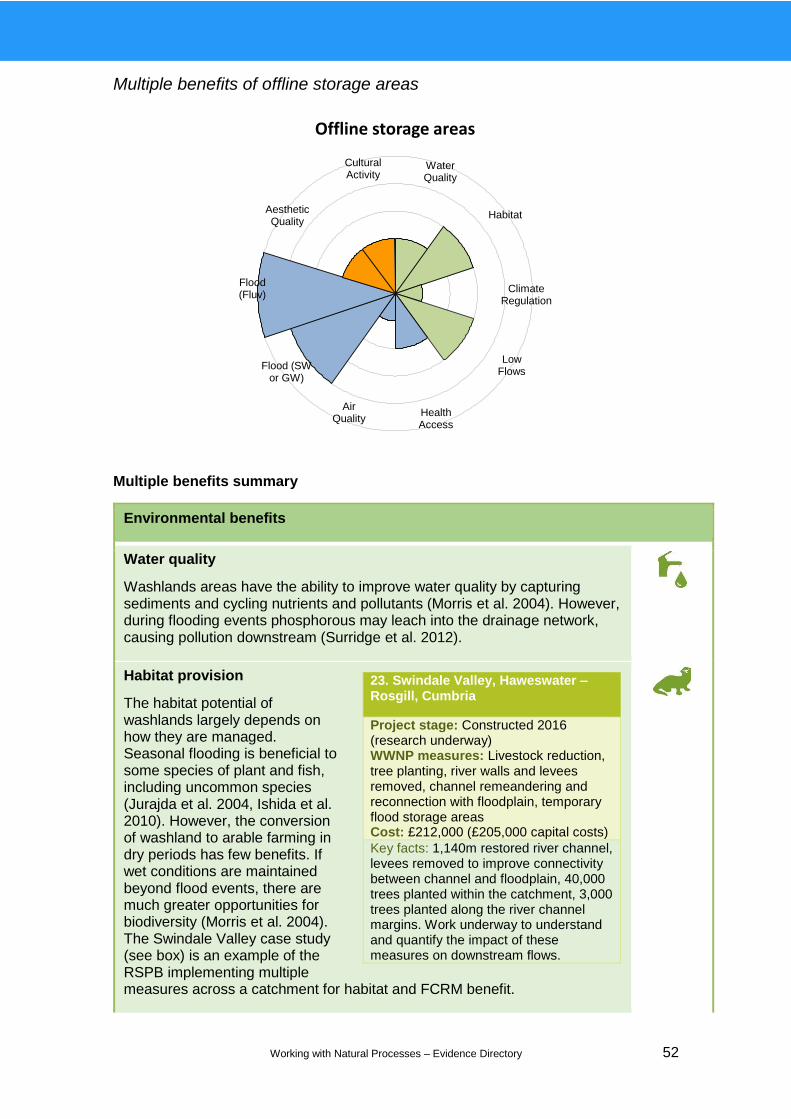
Working with Natural Processes – Evidence Directory 52
Multiple benefits of offline storage areas
Multiple benefits summary
Environmental benefits
Water quality
Washlands areas have the ability to improve water quality by capturing sediments and cycling nutrients and pollutants (Morris et al. 2004). However, during flooding events phosphorous may leach into the drainage network, causing pollution downstream (Surridge et al. 2012).
Habitat provision
The habitat potential of washlands largely depends on how they are managed. Seasonal flooding is beneficial to some species of plant and fish, including uncommon species (Jurajda et al. 2004, Ishida et al. 2010). However, the conversion of washland to arable farming in dry periods has few benefits. If wet conditions are maintained beyond flood events, there are much greater opportunities for biodiversity (Morris et al. 2004). The Swindale Valley case study (see box) is an example of the RSPB implementing multiple measures across a catchment for habitat and FCRM benefit.
Offline storage areas
Water Quality
Habitat
Climate Regulation
Low Flows
Flood (Fluv)
Flood (SW or GW)
Air Quality
Health Access
Cultural Activity
Aesthetic Quality
23. Swindale Valley, Haweswater – Rosgill, Cumbria
Project stage: Constructed 2016 (research underway) WWNP measures: Livestock reduction, tree planting, river walls and levees removed, channel remeandering and reconnection with floodplain, temporary flood storage areas Cost: £212,000 (£205,000 capital costs)
Key facts: 1,140m restored river channel, levees removed to improve connectivity between channel and floodplain, 40,000 trees planted within the catchment, 3,000 trees planted along the river channel margins. Work underway to understand and quantify the impact of these measures on downstream flows.

Working with Natural Processes – Evidence Directory 53
Environmental benefits
Climate regulation
There is little evidence on climate regulation and washlands. However, floodplains generally help store carbon and offset climate change (Samaritani et al. 2001).
Low flows
Washlands reduce the outflow of flooding events and therefore enhance the long-term supply of water. They can recharge aquifers during flooding episodes, with water retained at subsurface levels during summer low flow periods (Brunet et al. 2003).
Social benefits
Health access
Washlands are most likely to benefit public health if they are designed as accessible areas for recreation. This is particularly significant if they form part of green infrastructure in urban areas. Beam Parklands, designed around a washlands in London, was projected to deliver significant community physical and mental health benefits from the availability of green space promoting exercise and well-being (eftec 2015).
Air quality
There is little evidence that washlands improve air quality, although their ability to store carbon will contribute to cleaner air.
Surface water or groundwater flood
Washlands reduce flood risk predominantly due to their large surface water storage capacity. A 120,000m3 storage pond created in the Pickering catchment aims to reduce to risk of flooding from 4% to 25% in any one year (Nisbet et al. 2011a). In urban areas, washlands allow infiltration of stormwater run-off from impermeable surfaces (Freeborn et al. 2012).
Fluvial flood
Washlands have proved successful in managing fluvial flood risk. The construction of a 25,000m3 floodplain storage system at Holnicote in Somerset reduced peak flow by 10% during a severe storm in an already saturated catchment, also delaying the timing of the flood peak (National Trust 2015). Catchment-scale modelling has shown that washlands may need to be combined with other WWNP measures to mitigate the impact of large flooding events (Ghimire et al. 2014). Table 2.4 provides monetary value estimates of the contribution of different types of WWNP to flood risk reduction.

Working with Natural Processes – Evidence Directory 54
Table 2.4 Offline storage area monetary value estimates of contribution of different types of NFM to flood risk reduction
Case Type and main measures
Benefits* (PV50)
Costs (PV50)
Benefit–cost ratio
Cost per m3?
Benefit per m3?
Beam Washlands
Floodplain: storage
£65 million NFM £80 million total
£3.7 million NFM £8.2 million total
From 1:1 to 17:1
Cost of NFM only is £8 per m3 in total, or £148 per m3 for marginal improvement
£140–£175 per m3 for entire storage
Guisborough Mixed: attenuation and storage
£5.6 million in PV50 (SOC gives £6.8 million PV100)
£1.5 million
4:1 (CS gives 3:1)
£100–£133 £373 based on benefit estimate from SOC; £227 based on benefit–cost ratio in CS
Holnicote Floodplain: attenuation and storage
£2 million to £8 million range
£1.2 million to date (£280,000 directly NFM)
In 1.5:1 to 7:1 range
£8 per m3 for flood storage bunds and dams
£105–£385 per m3
Lustrum Beck
Mixed: storage
£500,000 just for NFM change (£6.5 million overall)
£4 million of which £660,000 NFM
Below 1:1 but likely over with wider benefits
£6.60 £5.50–£20 (depending on breakdown between conventional and NFM)
Notes: CS = Case Study; SOC = Strategic Outline Case
Source: Eftec (2017)
Cultural benefits
Aesthetics
Sensitive design of washlands can create landscape improvements. The landscape value of maintaining higher water levels was estimated in 1999 at £175 per hectare per year (Hickman et al. 2001). The amenity value of Beam Parklands, based on a projected 3% uplift of property values, was £26 million over 99 years (eftec 2015). In rural areas, seasonal flooding of washlands will partially alter the landscape, while agricultural land is likely to remain unchanged for the rest of the year.
Cultural activities
Well-managed washlands can generate tourism and recreational benefits, creating buy in from local communities. Non-market valuations of urban washlands demonstrate that the recreation services they provide are highly

Working with Natural Processes – Evidence Directory 55
Cultural benefits
valued (Boyer and Polasky 2004). Washlands can provide facilities for wildlife watching and physical activity. Seasonal flooding also has a positive effect on fish stocks in recreational fisheries, benefitting the angling industry (Jurajda et al. 2004).
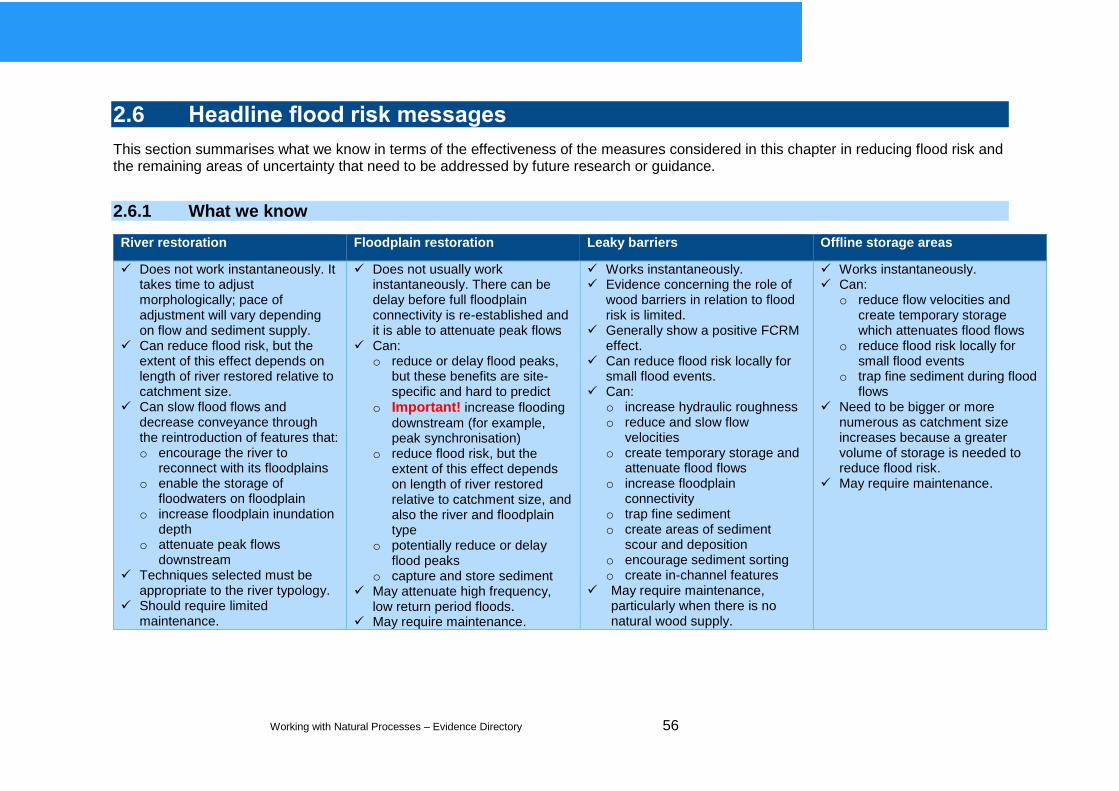
Working with Natural Processes – Evidence Directory 56
2.6 Headline flood risk messages
This section summarises what we know in terms of the effectiveness of the measures considered in this chapter in reducing flood risk and the remaining areas of uncertainty that need to be addressed by future research or guidance.
2.6.1 What we know
River restoration Floodplain restoration Leaky barriers Offline storage areas
Does not work instantaneously. It takes time to adjust morphologically; pace of adjustment will vary depending on flow and sediment supply.
Can reduce flood risk, but the extent of this effect depends on length of river restored relative to catchment size.
Can slow flood flows and decrease conveyance through the reintroduction of features that: o encourage the river to
reconnect with its floodplains o enable the storage of
floodwaters on floodplain o increase floodplain inundation
depth o attenuate peak flows
downstream Techniques selected must be
appropriate to the river typology. Should require limited
maintenance.
Does not usually work instantaneously. There can be delay before full floodplain connectivity is re-established and it is able to attenuate peak flows
Can: o reduce or delay flood peaks,
but these benefits are site-specific and hard to predict
o Important! increase flooding
downstream (for example, peak synchronisation)
o reduce flood risk, but the extent of this effect depends on length of river restored relative to catchment size, and also the river and floodplain type
o potentially reduce or delay flood peaks
o capture and store sediment May attenuate high frequency,
low return period floods. May require maintenance.
Works instantaneously. Evidence concerning the role of
wood barriers in relation to flood risk is limited.
Generally show a positive FCRM effect.
Can reduce flood risk locally for small flood events.
Can: o increase hydraulic roughness o reduce and slow flow
velocities o create temporary storage and
attenuate flood flows o increase floodplain
connectivity o trap fine sediment o create areas of sediment
scour and deposition o encourage sediment sorting o create in-channel features
May require maintenance, particularly when there is no natural wood supply.
Works instantaneously. Can:
o reduce flow velocities and create temporary storage which attenuates flood flows
o reduce flood risk locally for small flood events
o trap fine sediment during flood flows
Need to be bigger or more numerous as catchment size increases because a greater volume of storage is needed to reduce flood risk.
May require maintenance.
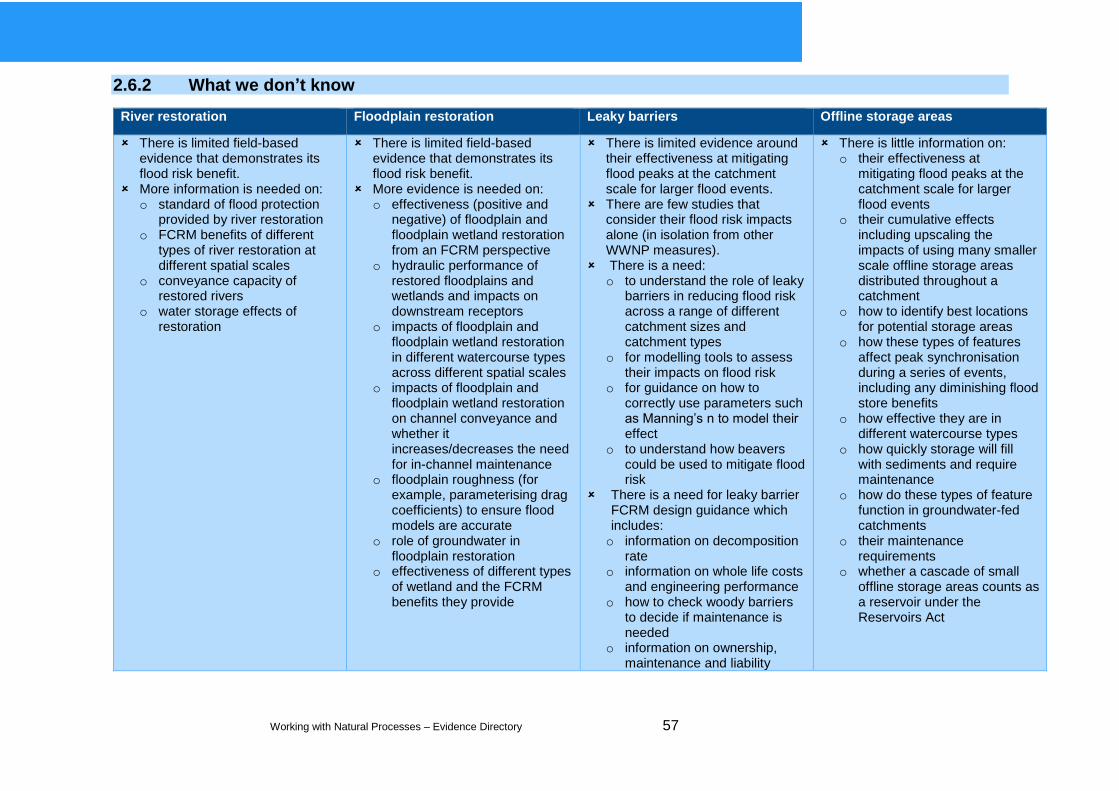
Working with Natural Processes – Evidence Directory 57
2.6.2 What we don’t know
River restoration Floodplain restoration Leaky barriers Offline storage areas
There is limited field-based evidence that demonstrates its flood risk benefit.
More information is needed on: o standard of flood protection
provided by river restoration o FCRM benefits of different
types of river restoration at different spatial scales
o conveyance capacity of restored rivers
o water storage effects of restoration
There is limited field-based evidence that demonstrates its flood risk benefit.
More evidence is needed on: o effectiveness (positive and
negative) of floodplain and floodplain wetland restoration from an FCRM perspective
o hydraulic performance of restored floodplains and wetlands and impacts on downstream receptors
o impacts of floodplain and floodplain wetland restoration in different watercourse types across different spatial scales
o impacts of floodplain and floodplain wetland restoration on channel conveyance and whether it increases/decreases the need for in-channel maintenance
o floodplain roughness (for example, parameterising drag coefficients) to ensure flood models are accurate
o role of groundwater in floodplain restoration
o effectiveness of different types of wetland and the FCRM benefits they provide
There is limited evidence around their effectiveness at mitigating flood peaks at the catchment scale for larger flood events.
There are few studies that consider their flood risk impacts alone (in isolation from other WWNP measures).
There is a need: o to understand the role of leaky
barriers in reducing flood risk across a range of different catchment sizes and catchment types
o for modelling tools to assess their impacts on flood risk
o for guidance on how to correctly use parameters such as Manning’s n to model their effect
o to understand how beavers could be used to mitigate flood risk
There is a need for leaky barrier FCRM design guidance which includes: o information on decomposition
rate o information on whole life costs
and engineering performance o how to check woody barriers
to decide if maintenance is needed
o information on ownership, maintenance and liability
There is little information on: o their effectiveness at
mitigating flood peaks at the catchment scale for larger flood events
o their cumulative effects including upscaling the impacts of using many smaller scale offline storage areas distributed throughout a catchment
o how to identify best locations for potential storage areas
o how these types of features affect peak synchronisation during a series of events, including any diminishing flood store benefits
o how effective they are in different watercourse types
o how quickly storage will fill with sediments and require maintenance
o how do these types of feature function in groundwater-fed catchments
o their maintenance requirements
o whether a cascade of small offline storage areas counts as a reservoir under the Reservoirs Act

Working with Natural Processes – Evidence Directory 58
2.7 Potential funding mechanisms
Funding for river and floodplain management measures will vary depending on the main driver of the project. Table 2.5 lists some potential funding mechanisms.
Table 2.5 Examples of potential funding mechanisms for river and floodplain management measures
England Wales Scotland
Countryside Stewardship
Flood Defence Grant in Aid
Landfill tax credits
Local Levy
Private funding
Water Framework Directive funding
Glastir Advanced (Welsh Government)
Glastir Woodland Creation (Welsh Government)
Heritage Lottery Fund
Horizon 2020
LIFE
Sustainable Management Scheme (Welsh Government Rural Development Programme)
Scottish Rural Development Programme Agri-environment and climate scheme
SEPA Water Environment Fund
Notes: The information given is accurate as of the date of publication of this report.
2.8 Further reading
Aquatic and riparian plant management: controls for vegetation in watercourses (guidance from Defra and Environment Agency FCRM project SC120008*)
How to model and map catchment processes (outputs from Defra and Environment Agency FCRM project SC1200015*)
Channel management handbook (Environment Agency guidance*)
Conceptual design guidelines: application of engineered log jams (SEPA engineering guidance*)
Fish live in trees too. River rehabilitation and large woody debris (Staffordshire Wildlife Trust report*)
Floodplain meadows. Beauty and utility: a technical handbook (Floodplain Meadows Partnership. report*)
Fluvial Design Guide (online Environment Agency guidance*)
Guidebook of applied fluival geomorphology (Sear et al. 2003)
Green approaches in river engineering – supporting implementation of Green Infrastructure (HR Wallingford report for NERC*)
Healthy Catchments – managing water for flood risk and the Water Framework Directive (online case studies from the European Centre for River Restoration*)
Manual of River Restoration Techniques (RRC 2016)

Working with Natural Processes – Evidence Directory 59
Natural flood management guidance: woody dams, deflectors and diverters (Woodland Trust report*)
SEPA’s Natural Flood Management Handbook (SEPA 2015)
Practical River Restoration Appraisal Guidance for Monitoring Options (PRAGMO) (RRC 2011)
River restoration and biodiversity (Addy et al. 2016)
Rivers by design – rethinking development and river restoration (RESTORE report*)
Stroud RSudS project film (video produced for Stroud District Council*)
The Robinwood Robinflood report: Evaluation of large woody debris in watercourses (Forest Research report for the INTEREG IIIc Robinwood Project*)
* See Bibliography for further details
Working with Natural Processes – Evidence Directory 60
Chapter 3. Woodland management
3.1 Introduction
3.5 Floodplain woodland
3.2 Catchment woodland
3.3 Cross-slope woodland
3.4 Riparian woodland
3.1 Introduction

Working with Natural Processes – Evidence Directory 61
3 Woodland management
3.1 Introduction
This chapter summarises the evidence around the effectiveness of the following woodland management measures in reducing flood risk:
Catchment woodland
Cross-slope woodland
Floodplain woodland
Riparian woodland
The term ‘woodland’ is used to describe land predominantly covered in trees (with a canopy cover of at least 20%), whether in large tracts (generally called forests) or smaller areas known by a variety of terms (including woods, copses, spinneys or shelterbelts). The terms woodland and forest are used interchangeably throughout this chapter. Unlike the other types of measures covered in Chapters 2 to 5, the different types of woodland presented here do not fall on a spectrum whereby some are greener than others. The main difference throughout this chapter is the scale of the woodland and its location type, as illustrated below.
These different types of woodland WWNP measure reduce flood risk by:
intercepting overland flow – by obstructing overland flow paths and physically slowing the rate at which water is delivered to rivers through increased hydraulic roughness
encouraging infiltration and soil water storage – tree roots enable water to be delivered to the soil, which encourages infiltration and the storage of water within the soil.
Catchment woodland
Total area of all woodland
within a catchment
Cross-slope woodland
Smaller belts of woodland across hill
slopes
Floodplain woodland
Land within the fluvial
floodplain
Subject to a regular flooding
Riparian woodland
Land adjoining a river channel
Usually narrow (for example, <5m on either
side of watercourses)

Working with Natural Processes – Evidence Directory 62
3.2 Catchment woodland
3.2.1 Introduction
Key case studies (click here):
Brackenhurst
Coalburn
Torne
What is catchment woodland?
Catchment woodland is defined as the total area of all woodland within a catchment. It combines general woodland cover of all types and species, including plantations, plus specific forms where present, such as cross-slope, riparian and floodplain woodland.
Catchment woodland is likely to affect:
the generation and conveyance of flood flows by the water use by trees
the related effects on snow accumulation and melting
soil infiltration beneath woodland
the hydraulic roughness exerted by woodland
the impact of woodland on soil erosion and sediment delivery
3.2.2 Flood risk evidence
This section sets out what we know in terms of the effectiveness of this measure from an FCRM perspective and the scientific confidence in what we know.
Summary of the literature
There is strong process understanding of the different ways that catchment woodland can affect flood generation processes.
o The canopies of catchment woodland can typically intercept/evaporate more water than grass at a rate of 200–400 mm per year (Bosch and Hewlett 1982) or 1–8 mm per day (Calder et al. 2003), resulting in drier soils and less run-off contributing to flood flows.
o Soil porosity has been found to be 15–55% greater under forest (Harrold et al. 1962, Wahren et al. 2012), resulting in higher soil infiltration rates (67 times; Marshall et al. 2014) and higher saturated hydraulic conductivities (2–140 times; Chandler and Chappell 2008, Alvarenga et al. 2011).
o Longstanding but simplistic measures of surface/hydraulic roughness (Manning’s n) that are available for catchment woodland and grassland (Chow 1959) indicate that the former maybe 5 times higher.
Effect on flood flows, peaks and storage M/H
Highland water, New Forest Source: Simon Dixon
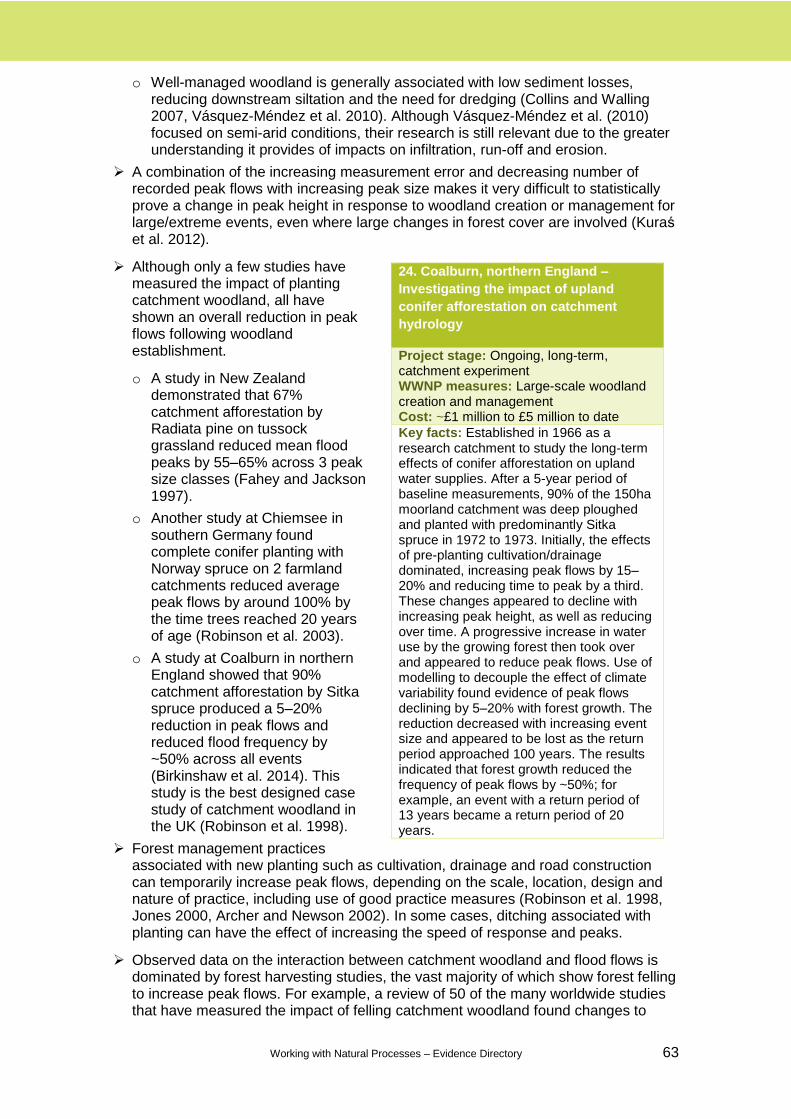
Working with Natural Processes – Evidence Directory 63
o Well-managed woodland is generally associated with low sediment losses, reducing downstream siltation and the need for dredging (Collins and Walling 2007, Vásquez-Méndez et al. 2010). Although Vásquez-Méndez et al. (2010) focused on semi-arid conditions, their research is still relevant due to the greater understanding it provides of impacts on infiltration, run-off and erosion.
A combination of the increasing measurement error and decreasing number of recorded peak flows with increasing peak size makes it very difficult to statistically prove a change in peak height in response to woodland creation or management for large/extreme events, even where large changes in forest cover are involved (Kuraś et al. 2012).
Although only a few studies have measured the impact of planting catchment woodland, all have shown an overall reduction in peak flows following woodland establishment.
o A study in New Zealand demonstrated that 67% catchment afforestation by Radiata pine on tussock grassland reduced mean flood peaks by 55–65% across 3 peak size classes (Fahey and Jackson 1997).
o Another study at Chiemsee in southern Germany found complete conifer planting with Norway spruce on 2 farmland catchments reduced average peak flows by around 100% by the time trees reached 20 years of age (Robinson et al. 2003).
o A study at Coalburn in northern England showed that 90% catchment afforestation by Sitka spruce produced a 5–20% reduction in peak flows and reduced flood frequency by ~50% across all events (Birkinshaw et al. 2014). This study is the best designed case study of catchment woodland in the UK (Robinson et al. 1998).
Forest management practices associated with new planting such as cultivation, drainage and road construction can temporarily increase peak flows, depending on the scale, location, design and nature of practice, including use of good practice measures (Robinson et al. 1998, Jones 2000, Archer and Newson 2002). In some cases, ditching associated with planting can have the effect of increasing the speed of response and peaks.
Observed data on the interaction between catchment woodland and flood flows is dominated by forest harvesting studies, the vast majority of which show forest felling to increase peak flows. For example, a review of 50 of the many worldwide studies that have measured the impact of felling catchment woodland found changes to
24. Coalburn, northern England –
Investigating the impact of upland
conifer afforestation on catchment
hydrology
Project stage: Ongoing, long-term, catchment experiment WWNP measures: Large-scale woodland creation and management Cost: ~£1 million to £5 million to date
Key facts: Established in 1966 as a research catchment to study the long-term effects of conifer afforestation on upland water supplies. After a 5-year period of baseline measurements, 90% of the 150ha moorland catchment was deep ploughed and planted with predominantly Sitka spruce in 1972 to 1973. Initially, the effects of pre-planting cultivation/drainage dominated, increasing peak flows by 15–20% and reducing time to peak by a third. These changes appeared to decline with increasing peak height, as well as reducing over time. A progressive increase in water use by the growing forest then took over and appeared to reduce peak flows. Use of modelling to decouple the effect of climate variability found evidence of peak flows declining by 5–20% with forest growth. The reduction decreased with increasing event size and appeared to be lost as the return period approached 100 years. The results indicated that forest growth reduced the frequency of peak flows by ~50%; for example, an event with a return period of 13 years became a return period of 20 years.

Working with Natural Processes – Evidence Directory 64
peak flows; floods measured by individual studies as ranging from 1% to 67% annual exceedance probability (AEP) changed to ranging from 0 to +170% in 49 of them (Guillemette et al. 2005). However, the results of felling studies can be affected by how the felling was carried out.
The effects of forest felling and planting on peak flows appear to be greatest for small and medium flood peaks, declining in percentage terms with increasing flood size (Beschta et al. 2000, Jones 2000, Birkinshaw et al. 2011). However, there are significant statistical problems with identifying changes to relatively rare, high flood peaks, including difficulties with accounting for possible changes in return interval between pre and post period (Alila et al. 2009, Kuraś et al. 2012).
It is very difficult to detect changes to peak flows when the extent of forest felling or planting is <15–20% of a catchment (Bosch and Hewlett 1982, Cornish 1993, Stednick 1996). Consequently, it is also very difficult to detect the response of stream flow to forest felling or planting in large catchments (>100km2).
The overall effects of planting or felling conifer forest on peak flows tend to be greater than those for broadleaves (Anderson et al. 1976). Effects on peak flows tend to be less in the winter dormant season, especially for broadleaves.
Modelling studies provide a range of results, but the vast majority predict that catchment scale woodland can reduce peak flows. Values for the predicted effects of woodland creation show reductions of between 3% and 70% (Cognard-Plancq et al. 2001, Bulygina et al. 2009, McIntyre et al. 2012), while felling is predicted to increase peak flows by 10–45% (Rongrong and Guishan 2007, Wahren et al. 2012).
Regional-scale studies have struggled to identify a forest effect on flood flows, in a large part due to the inherent problems associated with catchment comparison studies. More recent efforts have focused on evaluating relationships between forest cover and a number of hydrological indicators. A Europe-wide assessment by the European Environment Agency (EEA 2015) of the water retention potential (a significant factor with respect to flooding) of forest cover across 287 sub-basins found:
o water retention to be 25% higher in water basins with 30% cover and 50% higher in those with 70% cover compared with basins with 10% cover
o water retention was typically 25% greater in summer than in winter
o basins with conifer forests generally retained 10% more water than those with broadleaved or mixed forests
A more recent, modelling-based study of the potential contribution of catchment woodland to flood protection was carried out at Southwell in Nottinghamshire. Results predict that an 18% increase in catchment woodland cover could protect 9 properties from flooding during a 4% AEP event and 14 properties for a 2% AEP event.
25. Brackenhurst – Southwell, Nottingham
Project stage: Constructed (2016) WWNP measures: Simulated woodland creation, woody dams, corner of field bunds, stream restoration and online storage Cost: £100,000 (£11,000 to construct WWNP measures)
Key facts: An existing 1D–2D linked ISIS TUFLOW model was adapted to predict the impact of a number of woodland creation scenarios on the standard of flood protection for the town of Southwell in Nottinghamshire. Southwell is subject to repeated flooding in both summer and winter periods, affecting between 45 and 112 properties. The planting of conifer woodland over 18% of the upstream catchment was predicted to remove 9 properties from flooding by a 4% AEP event and 14 properties from a 2% AEP flood.

Working with Natural Processes – Evidence Directory 65
Summary of the literature
Well-managed catchment woodland is generally associated with much lower sediment losses compared with other land use activities (Liu et al. 2005, Collins and Walling 2007, Vásquez-Méndez et al. 2010), benefitting downstream conveyance of channel flows through reduced siltation.
o This reflects the ability of a tree cover to protect soils, slopes and river banks from disturbance, as well as improving soil structure and increasing soil strength through organic matter inputs, tree rooting, soil drying and reduced surface run-off (Benito et al. 2003, Nisbet et al. 2011a).
o Consequently, woodland forms the preferred land cover for catchment protection in many parts of the world.
In contrast, poorly managed woodland can diminish or reverse this protective function. This is particularly associated with cultivation, drainage, road construction and harvesting practices, which can increase soil erosion and sedimentation (Birkinshaw et al. 2011, Nisbet et al. 2011a).
The application of good practice guidelines ensures that sediment losses from forestry are minimised.
Summary of the literature:
Process understanding and modelling suggest that there is no catchment size/area threshold for catchment woodland to reduce flood flows, although the effect is likely to decline with the increasing importance of river channel processes downstream in larger catchments. The main issues with larger catchments are:
o the tendency for the proportion of forest cover and therefore its contribution to decline
o the greater the chance that other changes to land use and/or management in the wider catchment will act to ‘swamp’ or offset the forest effect
o the increasing scope for tributary synchronisation and desynchronisation effects to moderate downstream impacts (Important!)
In general, the larger is the extent of woodland cover in a catchment, the greater the expected impact on flood flows. This simply reflects the footprint of the woodland at the catchment scale and thus the relative contribution of the different woodland processes.
The evidence for catchment woodland reducing flood flows is greatest for small catchments (<10km2), which have been the focus of nearly all catchment woodland planting and felling studies (see, for example, Guillemette et al. 2005, Birkinshaw et al. 2014) (High confidence).
There have been very few studies of the effects of catchment woodland in medium sized catchments (10–100 km2), reflecting the increasing difficulty of measuring flows, controlling land use change and ensuring watertight conditions as catchment size increases. However, modelling studies predict that catchment woodland can reduce flood flows at this scale (see for example, McIntyre et al. 2012, Thomas and Nisbet 2016) (Medium confidence).
Effect on sedimentation and geomorphology H
Effect at different catchment scales L/M/H
Working with Natural Processes – Evidence Directory 66
Very few measured or modelling studies have examined the impact of forestry in very large catchments (>1,000km2). Those that have display less consistent findings, largely due to the problem of separating the effects of background changes, including trends in annual rainfall (Ranzi et al. 2002, Zhang et al. 2012) (Low confidence).
The placement of woodland within catchments and catchment geometry/structure has a role to play by influencing the relative timing of the woodland contribution to peak flow response. Important! This has potential to be positive or negative by desynchronising or synchronising flows respectively from different parts of a catchment, particularly involving tributary contributions. In general, the more rapid the response of an individual tributary (compared with neighbouring tributaries) or the closer the location to the community or asset at risk of flooding, the greater the scope for woodland planting to synchronise and thereby increase catchment flows, depending on the extent of the associated woodland water use and soil storage effects (Odoni and Lane 2010).
Summary of the literature
The effect of catchment woodland on flood flows in different watercourse typologies is largely driven by the related effect of catchment size, as detailed above.
Soil type and depth influence the soil water storage capacity and availability of water to sustain woodland water use during dry periods, and therefore the size of the woodland effect. Soil type also determines soil vulnerability to damage, and thus the relative size and significance of the soil infiltration benefit.
Geology exerts a strong control over run-off pathways and the ability of catchment woodland to affect these. The more porous the geology, the less scope for woodland processes to affect rapid surface run-off, particularly by enhanced infiltration and hydraulic roughness.
Summary of the literature
Catchment woodland is a long-term measure, whose benefits can last into perpetuity. Woodland creation therefore represents a secure measure, with woodland removal subject to a legal felling licence (which will normally include a condition to replant the area) and if on any significant scale, an Environmental Impact Assessment.
The different woodland processes that contribute to the ability of catchment woodland to reduce flood flows vary in the time it takes to become effective.
The woodland water use effect increases with tree growth after planting and becomes largely established by the stage of ‘canopy closure’ at around 15–20 years (Calder 1990, Calder et al. 2003, Nisbet 2005). This process is quicker for conifers compared to broadleaves.
Improvements in soil infiltration can be quick to establish (within around 1 year; Marshall et al. 2014), partly due to the cessation of agricultural pressures on the soil and partly to soil disturbance accompanying tree planting plus rapid root growth.
Effect in different watercourse typologies L/M
Design life and effectiveness H

Working with Natural Processes – Evidence Directory 67
Enhancement of soil porosity and related changes at depth will take longer to develop, depending on soil condition and degree of compaction.
Surface/hydraulic roughness generally evolves over time, initially dominated by the growth of ground vegetation and shrubs (5–10 years), and followed by the establishment of trees (10+ years) and in the longer term (decades) by increasing inputs of deadwood. The time frame can be shortened by the planting of faster growing tree species, including short rotation coppice, and by intervening to add/enhance deadwood and constructing large woody structures within or along water channels and pathways.
Reductions in soil erosion and sediment delivery can occur quickly in response to the cessation of agricultural activities. River bank protection takes longer to develop and is dependent on the growth of riverside trees.
Timber harvesting within productive woodland represents a temporary reduction or loss of the above flow reduction benefits (for 10–15 years), but the effect of this can be minimised at the catchment scale by phasing felling operations (limiting felling to <20% of catchment area) and by rapid restocking (Bosch and Hewlett 1982, Cornish 1993, Stednick 1996).
Short rotation coppice and short rotation forestry can be a short- to medium-term measure whose benefits are quicker to establish, but last only 4–20 years for an individual rotation/cycle. As with conventional woodland management, the effect of harvesting such woodland can be controlled by phasing operations at the catchment scale and repeating the coppice cycle of forest rotation.
Summary of the literature
Maintenance work includes:
o replacing trees that have failed to establish
o protecting trees from pests and disease
o making repairs to infrastructure such as fences and gates
o eventually restocking harvested trees
Most woodland planting, natural regeneration and some management operations that are not part of the public forest estate receive a degree of funding under the Rural Development Programme.
The payment of grants is conditional on achieving satisfactory establishment of the woodland and meeting the requirements of the UK Forestry Standard. This includes legal and good forestry practice requirements for each of 7 elements of sustainable forest management – biodiversity, climate change, historic environment, landscape, people, soil and water. These elements are covered by separate sets of guidelines that provide more details on how woodland owners, managers and practitioners can comply with the requirements (Forestry Commission 2011).
3.2.3 Multiple benefits
The benefits wheel shows that catchment woodland planting is beneficial across all the ecosystem service categories.
Maintenance requirements H
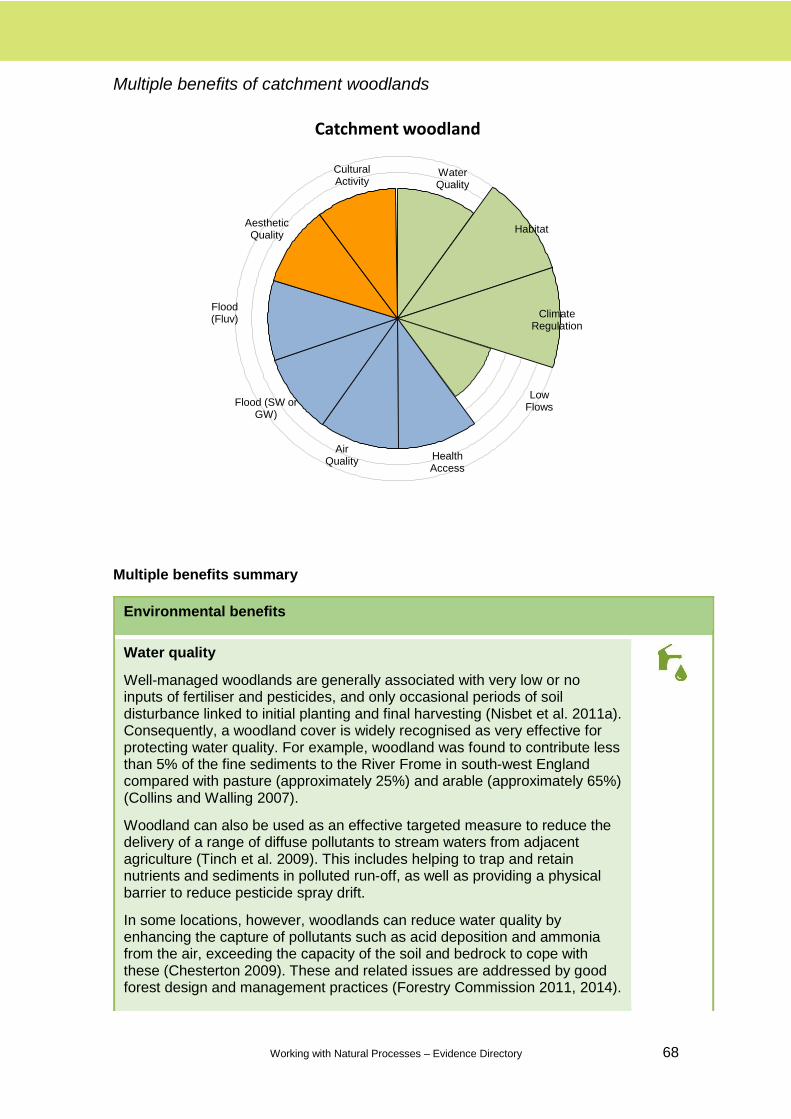
Working with Natural Processes – Evidence Directory 68
Multiple benefits of catchment woodlands
Multiple benefits summary
Environmental benefits
Water quality
Well-managed woodlands are generally associated with very low or no inputs of fertiliser and pesticides, and only occasional periods of soil disturbance linked to initial planting and final harvesting (Nisbet et al. 2011a). Consequently, a woodland cover is widely recognised as very effective for protecting water quality. For example, woodland was found to contribute less than 5% of the fine sediments to the River Frome in south-west England compared with pasture (approximately 25%) and arable (approximately 65%) (Collins and Walling 2007).
Woodland can also be used as an effective targeted measure to reduce the delivery of a range of diffuse pollutants to stream waters from adjacent agriculture (Tinch et al. 2009). This includes helping to trap and retain nutrients and sediments in polluted run-off, as well as providing a physical barrier to reduce pesticide spray drift.
In some locations, however, woodlands can reduce water quality by enhancing the capture of pollutants such as acid deposition and ammonia from the air, exceeding the capacity of the soil and bedrock to cope with these (Chesterton 2009). These and related issues are addressed by good forest design and management practices (Forestry Commission 2011, 2014).
Catchment woodland
Water Quality
Habitat
Climate Regulation
Low Flows
Flood (Fluv)
Flood (SW or GW)
Air Quality
Health Access
Cultural Activity
Aesthetic Quality

Working with Natural Processes – Evidence Directory 69
Environmental benefits
Habitat provision
Planted woodlands provide habitats that benefit biodiversity, with a quarter of all NERC Act priority species associated with trees and woods (Quine 2011). In one study the marginal benefits of woodland were estimated to be 35p per household per year for enhanced biodiversity in 12,000ha (1%) of commercial Sitka spruce forest, 84p per household per year for a 12,000ha increase in Lowland New Broadleaved Native forest, and £1.13 per household per year for a similar increase in Ancient Semi-natural Woodland (Willis et al. 2003). Diversity of woodland structure and species is especially beneficial for biodiversity (Rollinson 2003). Woodlands are particularly valuable in urban areas, where they increase numbers of birds and other species (Croci et al. 2008, Evans et al. 2009). The greater the connectivity within and between catchment woodlands, the greater the benefit for plants and animals as they have the potential to act as wildlife corridors. The iWAIT case study (see box) is a good example of a multiobjective project which provides benefits to the environment and people.
Climate regulation
Woodlands provide a significant carbon regulation service. The total carbon stock in UK forests (including soils) is around 800 million tonnes (Mt) of carbon (2,900Mt of carbon dioxide equivalent, CO2e) and is estimated to be a further 80Mt of carbon in timber and wood products. At peak growth, coniferous forest can sequester around 24 tonnes of CO2 per hectare per year, with a net long-term average of around 14 tonnes of CO2 per hectare per year. Rates of around 15 tonnes of CO2 per hectare per year have been measured in oak forest at peak growth, with a net long-term average likely to be around 7 tonnes of CO2 per hectare per year (Quine 2011). Carbon regulation services have been valued at £6.67 per tonne of carbon
sequestrated (Willis et al. 2003). Trees can cool cities by between 2C and
8C (Doick and Hutchings 2013).
Low flows
Woodlands provide flow regulation, increasing soil infiltration and slowing down water movement to watercourses. Evapotranspiration and low soil compaction levels reduce direct run-off and soil erosion (Edmondson et al. 2011). However, the potentially greater use of water by woodland compared
26. Torne. Inspiring Water Action in the Torne (iWAIT) – Trent River Basin, Doncaster, south Yorkshire
Project stage: In progress (2016 to 2017) WWNP measures: Woodland planting, flood storage and 3 SUDS in schools Cost: £131.5,000
Key facts: Targeting NFM techniques and providing additional flood storage in the upstream part of the catchment will help attenuate flood flows from rainfall events. This will reduce flood risk to property and agricultural land within the catchment is reduced by making more space for water. It will also reduce the financial and carbon costs of pumping water from the Torne catchment into the River Trent. Using desktop analysis –including reviewing LiDAR (light detection and ranging) data, the project aims to achieve a minimum of 46.5ha of wet woodland recreation or restoration that delivers over 4,000m3 of additional flood storage capacity.

Working with Natural Processes – Evidence Directory 70
Environmental benefits
with short vegetation can generate greater soil moisture deficits in summer and reduce groundwater recharge (Calder et al. 2003, Nisbet 2005). One large tree can intercept/evaporate 1,432 gallons (5.42m3) of water in the course of a year (Peper et al. 2007). Large-scale planting of conifer woodland poses the greatest risk, especially within dry lowland areas (Nisbet et al. 2011b).
Social benefits
Health access
Evidence suggests that woodland can have significant health benefits. Studies have shown that the presence of trees reduces health inequalities and mortality, and increase physical activity and general health (de Vries et al. 2003, Mitchell and Popham 2008, de Jong et al. 2012, Donovan et al. 2013). A study of woodland visitors in Scotland showed that 82% agreed it reduces stress and anxiety (Edwards et al. 2009). The planting of a substantial 100ha forest at 10 minutes’ driving distance results in an average individual welfare gain of £3.02 per year, although this reduces to £0.32 when the woodland is a 20 minute drive away (Bateman and Day 2014). However, only 55% of the population has access to woods larger than 20ha within 4km of their home (Quine 2011).
Air quality
Afforestation improves air quality through pollutant ‘scrubbing’ and carbon sequestration (Chesterton 2009). One large tree can absorb 150kg of carbon dioxide a year (Fleming 2016). Trees can create huge improvements to urban air quality, filtering airborne pollutants including fine particulates (McDonald et al. 2007). A study in the West Midlands suggests that doubling tree cover across the region would reduce the concentration of fine particulate particles (PM10) by 25%. This could prevent 140 air pollution related premature deaths in the region every year (Stewart et al. 2003). Woodland air pollution health benefits have been valued at £124,998 for each death avoided by 1 year due to PM10 and sulphur dioxide absorbed by trees, and £602 for an 11-day hospital stay avoided due to reduced respiratory illness (Willis et al. 2003). In Lisbon, the annual value per tree was US$5.20 for air pollution reduction (Soares et al. 2011).
Surface water or groundwater flood
Surface run-off may be reduced by trees intercepting run-off, reducing recharge rates and improving infiltration. The interception loss as a proportion of daily rainfall is up to 7mm per day for conifers and 1–2mm per day for broadleaves, depending on season. These values equate to a potential reduction of 10–20m3 per hectare of flood run-off for planting broadleaved woodland on grassland and up to 70m3 per hectare for conifers (Calder 2003). In one UK study, pine had a quarter of the recharge and run-off rate of grassland, while oak woodland had half the rate of grassland (Calder et al. 2003). Woodland improves soil porosity, increasing the infiltration rates of surface water.
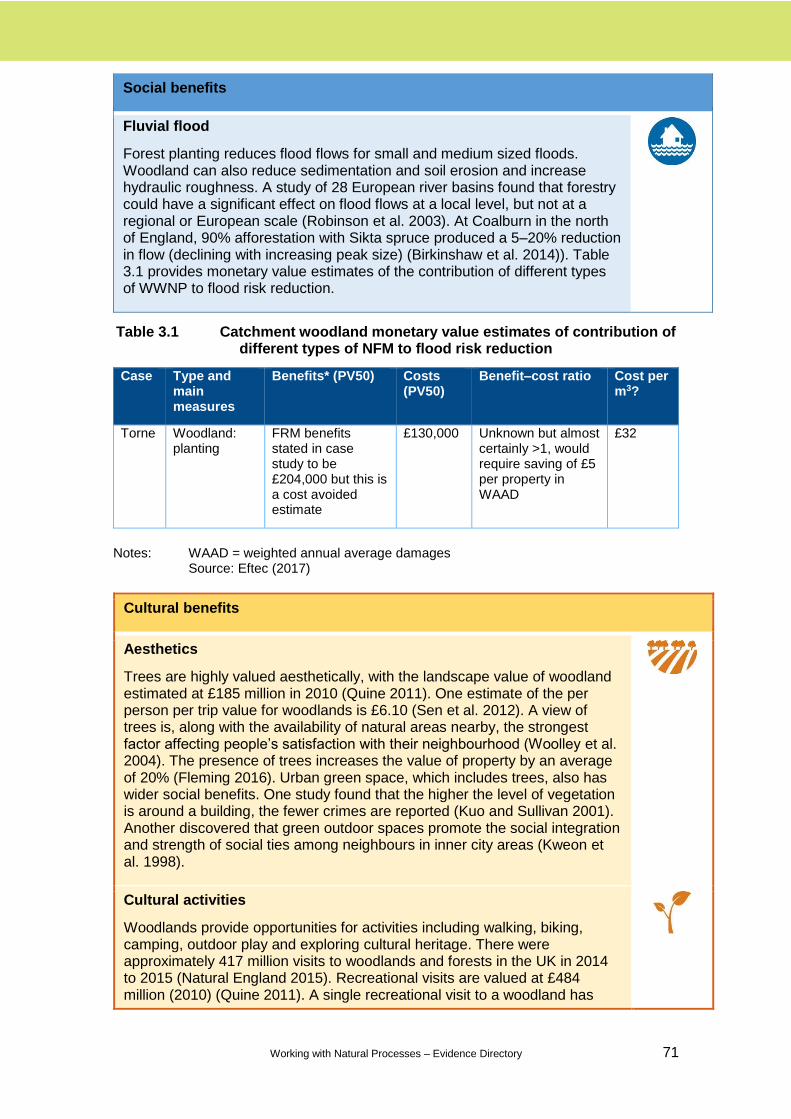
Working with Natural Processes – Evidence Directory 71
Social benefits
Fluvial flood
Forest planting reduces flood flows for small and medium sized floods. Woodland can also reduce sedimentation and soil erosion and increase hydraulic roughness. A study of 28 European river basins found that forestry could have a significant effect on flood flows at a local level, but not at a regional or European scale (Robinson et al. 2003). At Coalburn in the north of England, 90% afforestation with Sikta spruce produced a 5–20% reduction in flow (declining with increasing peak size) (Birkinshaw et al. 2014)). Table 3.1 provides monetary value estimates of the contribution of different types of WWNP to flood risk reduction.
Table 3.1 Catchment woodland monetary value estimates of contribution of different types of NFM to flood risk reduction
Case Type and main measures
Benefits* (PV50) Costs (PV50)
Benefit–cost ratio Cost per m3?
Torne Woodland: planting
FRM benefits stated in case study to be £204,000 but this is a cost avoided estimate
£130,000 Unknown but almost certainly >1, would require saving of £5 per property in WAAD
£32
Notes: WAAD = weighted annual average damages
Source: Eftec (2017)
Cultural benefits
Aesthetics
Trees are highly valued aesthetically, with the landscape value of woodland estimated at £185 million in 2010 (Quine 2011). One estimate of the per person per trip value for woodlands is £6.10 (Sen et al. 2012). A view of trees is, along with the availability of natural areas nearby, the strongest factor affecting people’s satisfaction with their neighbourhood (Woolley et al. 2004). The presence of trees increases the value of property by an average of 20% (Fleming 2016). Urban green space, which includes trees, also has wider social benefits. One study found that the higher the level of vegetation is around a building, the fewer crimes are reported (Kuo and Sullivan 2001). Another discovered that green outdoor spaces promote the social integration and strength of social ties among neighbours in inner city areas (Kweon et al. 1998).
Cultural activities
Woodlands provide opportunities for activities including walking, biking, camping, outdoor play and exploring cultural heritage. There were approximately 417 million visits to woodlands and forests in the UK in 2014 to 2015 (Natural England 2015). Recreational visits are valued at £484 million (2010) (Quine 2011). A single recreational visit to a woodland has
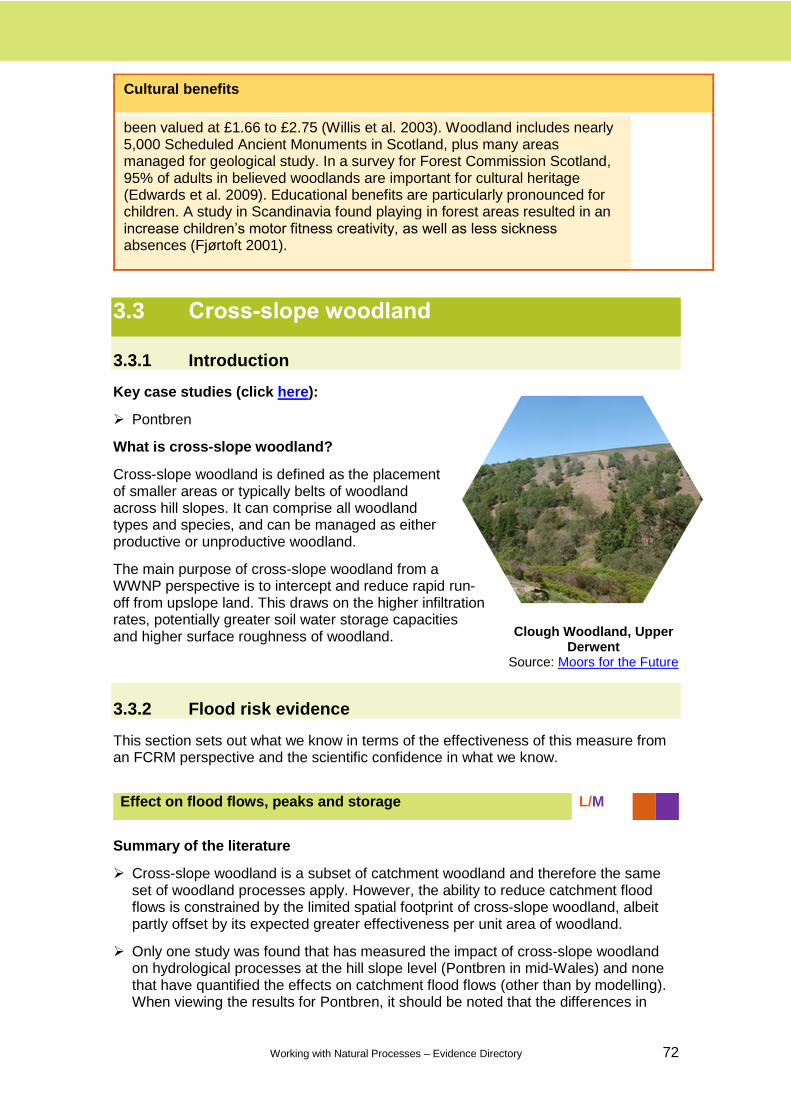
Working with Natural Processes – Evidence Directory 72
Cultural benefits
been valued at £1.66 to £2.75 (Willis et al. 2003). Woodland includes nearly 5,000 Scheduled Ancient Monuments in Scotland, plus many areas managed for geological study. In a survey for Forest Commission Scotland, 95% of adults in believed woodlands are important for cultural heritage (Edwards et al. 2009). Educational benefits are particularly pronounced for children. A study in Scandinavia found playing in forest areas resulted in an increase children’s motor fitness creativity, as well as less sickness absences (Fjørtoft 2001).
3.3 Cross-slope woodland
3.3.1 Introduction
Key case studies (click here):
Pontbren
What is cross-slope woodland?
Cross-slope woodland is defined as the placement of smaller areas or typically belts of woodland across hill slopes. It can comprise all woodland types and species, and can be managed as either productive or unproductive woodland.
The main purpose of cross-slope woodland from a WWNP perspective is to intercept and reduce rapid run-off from upslope land. This draws on the higher infiltration rates, potentially greater soil water storage capacities and higher surface roughness of woodland.
3.3.2 Flood risk evidence
This section sets out what we know in terms of the effectiveness of this measure from an FCRM perspective and the scientific confidence in what we know.
Summary of the literature
Cross-slope woodland is a subset of catchment woodland and therefore the same set of woodland processes apply. However, the ability to reduce catchment flood flows is constrained by the limited spatial footprint of cross-slope woodland, albeit partly offset by its expected greater effectiveness per unit area of woodland.
Only one study was found that has measured the impact of cross-slope woodland on hydrological processes at the hill slope level (Pontbren in mid-Wales) and none that have quantified the effects on catchment flood flows (other than by modelling). When viewing the results for Pontbren, it should be noted that the differences in
Effect on flood flows, peaks and storage L/M
Clough Woodland, Upper Derwent
Source: Moors for the Future
Working with Natural Processes – Evidence Directory 73
winter rainfalls between years could potentially have had as much an effect as the mitigation measures.
The Pontbren study (see box) found soil infiltration rates to be 67 times higher within woodland plots and shelterbelts planted on improved grassland compared with grazed pasture, which reduced run-off volumes by an average of 78% compared to the control (Marshall et al. 2014). This was partly explained by the removal of the grazing pressure on the soil, which reduced run-off volumes by 48%, and partly by the action of tree rooting and growth (responsible for the remaining 30% decrease).
Soil hydraulic conductivity values were also found to be higher beneath the woodland (2.4 times), associated with a greater proportion of larger soil pores and flow pathways provided by tree roots (Solloway 2012).
A modelling study drawing on the process measurements at Pontbren predicted that planting woodland strips across 7% of the 12km2 headwater catchment could reduce a severe flood event (0.5% AEP) by an average of 5% (95% confidence intervals of 2% and 11%) (McIntyre et al. 2012).
Other modelling studies have simulated the effect of targeted woodland planting within catchments but not involving cross-slope woodland. Planting of conifer woodland on mineral soils extending over 29% of the 25km2 subcatchment of the River Hodder in northern England was predicted to reduce peak flows by an average of 7% (95% confidence intervals of 3% and 13%), compared with a 4% reduction (95% confidence intervals of 0% and 9%) with the planting of broadleaved woodland (Ballard 2011). Woodland planting on steep slopes occupying between 19% and 37% of the River Tone catchment in south-west England was predicted to have little effect on the largest peak flow event in January 2002 (varying from a 1% increase to a 2% reduction in flow) but reduced the largest event in May 2002 by between 5% and 21% (Park et al. 2009, McIntyre and Thorne 2013).
Cross-slope planting (and sheep exclusion) will help reduce run-off in many events. However, in a sequence of events, unless the water can drain away between events it will result in reduced soil water deficits and possibly wetter downslope conditions prior to the next event. So if a large event comes after a period of wetting there may be little reduction.
27. Pontbren, Wales – Investigating the impacts of upland land use management on flood risk
Project stage: Catchment study carried out between 2005 and 2008 WWNP measures: Sheep removal, tree planting in hill slope plots, tree shelterbelts Cost: not available
Key facts: The aim of this research project was to improve the understanding of how changes in upland land management impact on flood risk at the catchment scale. Experimental plots were established to measure the effects of sheep grazing and tree planting on soil structure and the generation of flood runoff. Data from these plots were used to derive parameter values and uncertainty bounds for a multiscale modelling methodology. The model was applied to the headwater catchment to predict the impact of alternative land use practices on flood flows. Results showed that land management can have a major effect on run-off processes, providing scope for targeted measures to reduce flood risk in low permeability, upland landscapes at local scales.

Working with Natural Processes – Evidence Directory 74
Summary of the literature
Cross-slope woodland could be very effective at removing sediment and other diffuse pollutants in surface or near-surface run-off from upslope land, thereby improving water quality and potentially contributing to a reduction in flood risk through reduced sediment delivery to watercourses (Nisbet et al. 2011a). This is mainly based on the soil infiltration and surface roughness benefits, which would be greatest where cross-slope woodland is targeted to protect sediment sources or to intercept sediment/run-off pathways.
Modelling of different land management scenarios under a future climate at Pontbren found sediment yields to be highly variable, depending on the timing and magnitude of individual sediment transport events. Despite uncertainty in the predictions, the results suggested that strategic low footprint woodland planting could be used to desensitise the sediment transfer systems from anticipated changes in climate (McIntyre et al. 2012).
Summary of the literature
By their nature, cross-slope woodlands cover smaller areas of catchments than the other measures included in this chapter. There is therefore low to medium confidence in the ability of cross-slope woodland to reduce small to moderate flood flows in small catchments (<10km2). This is based on process understanding and the measured data from the hill slope studies at Pontbren (McIntyre et al. 2012, Marshall et al. 2014).
The level of confidence in this more spatially restricted form of woodland sharply declines with increasing catchment size. Modelling suggests reductions in winter flood peaks are likely to be <10% for targeted woodland planting involving <30% catchment cover, while summer floods could perhaps be reduced by up to 20% (McIntyre and Thorne 2013). These magnitudes of reduction, especially for winter events, lie within the margin of measurement error and are very difficult to validate.
There is low confidence in the ability of cross-slope and other targeted forms of woodland creation to reduce large flood peaks in large catchments (based on the lack of observed data and expected limited woodland footprint).
The size of flood reduction achievable with planting cross-slope woodland will depend on the nature of the existing land use and standard of management practices employed. The more extensive the soil damage in terms of compaction and sealing, the greater is the likely reduction in peak flows following planting. This factor will increase the margin of uncertainty, especially in larger catchments.
The effect of cross-slope woodlands may vary due to errors of measurement and uncertainties associated with modelling across larger catchment scales.
Summary of the literature
The effect of cross-slope woodland on flood flows in different watercourse typologies is largely driven by the related effect of catchment size, as described above.
Effect on sedimentation and geomorphology M
Effect at different catchment scales L/M
Effect in different watercourse typologies M
Working with Natural Processes – Evidence Directory 75
Soil type and depth influence the soil water storage capacity and availability of water to sustain woodland water use during dry periods, and thereby the size of the woodland effect. Soil type also determines soil vulnerability to damage and thus the relative size and significance of the soil infiltration and sediment benefit.
Geology exerts a strong control over run-off pathways and the ability of cross-slope woodland to affect these. The more porous the geology, the less scope for woodland processes to affect surface run-off, particularly by enhanced infiltration and hydraulic roughness.
Summary of the literature
Cross-slope woodland is a long-term measure, whose benefits can last in perpetuity.
Areas managed as productive woodland would be subject to regular thinning and could either be maintained as continuous cover, or felled and replanted on a longer term rotation. If felled, there would be a temporary reduction in the water use effect lasting for around 10–15 years until the woodland regrew to canopy closure.
Cross-slope woodland could also be managed as short rotation coppice or short rotation forestry, achieving faster establishment and potentially increased effectiveness but subject to more frequent harvesting and regrowth/replanting on a 4–20 year cycle or rotation. The temporary reduction in water use benefit could be managed by phasing the felling and regrowth of consecutive areas or belts of cross-slope woodland down a hill slope or within a wider catchment.
The different woodland processes that contribute to the ability of cross-slope woodland to reduce flood flows vary in the time it takes to become effective.
The woodland water use effect increases with tree growth after planting and becomes largely established by the stage of ‘canopy closure’ at around 15–20 years (Calder 1990, Nisbet 2005). This is quicker for conifers than for broadleaves.
Improvements in soil infiltration can be quick to establish (within around one year) (Marshall et al. 2014), partly due to the cessation of agricultural pressures on the soil and partly to soil disturbance accompanying tree planting plus rapid root growth. Enhancement of soil porosity and related changes at depth will take longer to develop, depending on soil condition and degree of compaction.
Surface/hydraulic roughness generally evolves over time, initially dominated by the growth of ground vegetation and shrubs (5–10 years), followed by the establishment of trees (10+ years), and in the longer term (decades), by increasing inputs of deadwood. The time frame can be shortened by the planting of faster growing tree species, including short rotation coppice, and by intervening to add/enhance deadwood and constructing large woody structures within or along water channels and pathways.
Reductions in soil erosion and sediment delivery can occur quickly in response to the cessation of agricultural activities.
Design life and effectiveness H
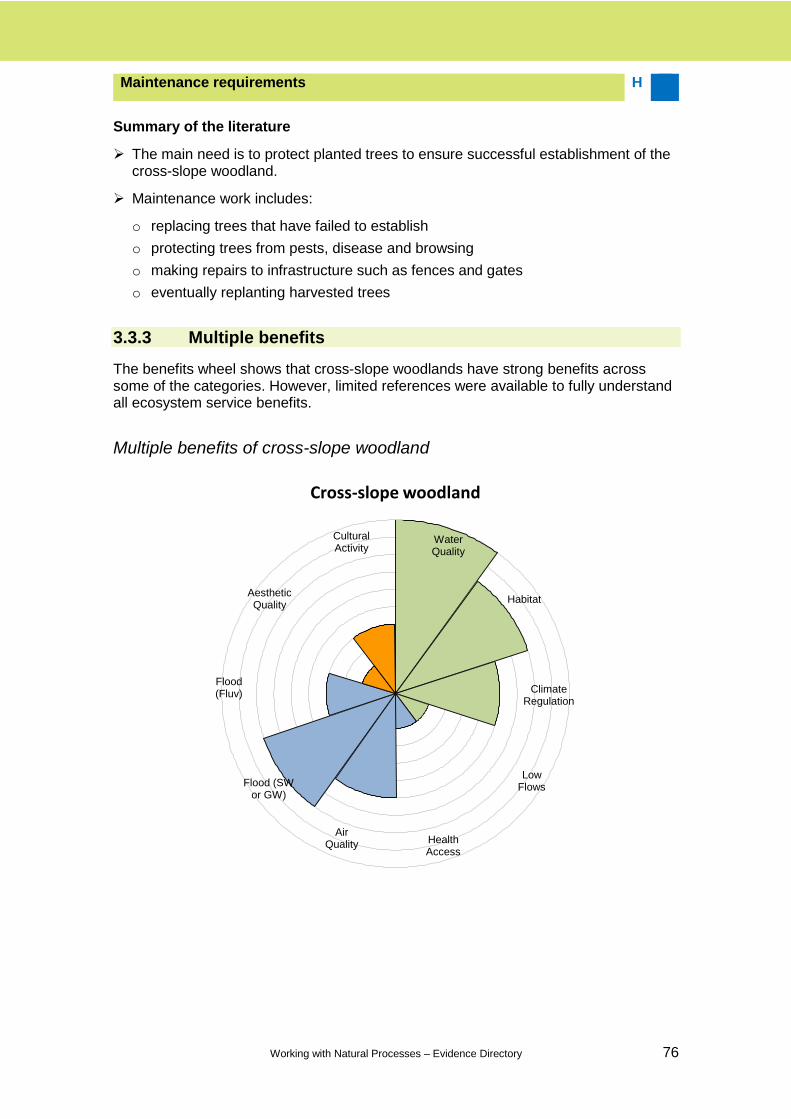
Working with Natural Processes – Evidence Directory 76
Summary of the literature
The main need is to protect planted trees to ensure successful establishment of the cross-slope woodland.
Maintenance work includes:
o replacing trees that have failed to establish
o protecting trees from pests, disease and browsing
o making repairs to infrastructure such as fences and gates
o eventually replanting harvested trees
3.3.3 Multiple benefits
The benefits wheel shows that cross-slope woodlands have strong benefits across some of the categories. However, limited references were available to fully understand all ecosystem service benefits.
Multiple benefits of cross-slope woodland
Cross-slope woodland
Water Quality
Habitat
Climate Regulation
Low Flows
Flood (Fluv)
Flood (SW or GW)
Air Quality Health
Access
Cultural Activity
Aesthetic Quality
Maintenance requirements H
Working with Natural Processes – Evidence Directory 77
Multiple benefits summary
Environmental benefits
Water quality
Cross-slope woodland is beneficial for water quality as it reduces sediment and nutrient loading from upslope land (Nisbet et al. 2011a). For example, a study in Poland found that concentrations of nitrate in groundwater within shelterbelts adjacent to cultivated fields were reduced by 76–98% of the input (Ryszkowski and Kędziora 2007). Tree cover can also offer protection from soil erosion and slope failure.
Habitat provision
Specialist habitats can be formed in the microclimates of cross-slope woodland. They support a range of insects and plants, and provide an important feeding and nesting habitat for birds. Ghyll woodlands found in the valleys of south-east England are species-rich and support distinctive assemblages of plants (Burnside et al. 2006). Cross-slope woodlands can also be very effective at creating habitat connectivity within agricultural dominated landscapes.
Climate regulation
Cross-slope woodlands have a cooling effect on the local climate, though their impact is limited by their small footprint. In addition, trees have an important role in carbon sequestration and provide shelter from wind (depending on orientation to prevailing wind direction).
Low flows
There is little evidence related to cross-slope woodland and low flows. However, woodlands generally help to regulate flow by enabling greater infiltration. Their effect will be limited by their small footprint, but individual cross-slope woodlands could be particularly effective at intercepting surface run-off from upslope by aiding soil infiltration and drainage to depth (depending on soil type and geology). The large edge effect will enhance local evaporation, which will reduce water yield and potentially low flows, depending on balance with infiltration benefit.
Social benefits
Health access
There is limited evidence on the health benefits of cross-slope woodland. If designed for public use, it could have similar positive impacts on physical and mental health as wider catchment woodland. However, it may be less accessible if trees are planted on forestry or agricultural land.
Air quality
Woodland planting helps to prevent windblown soil erosion, improving local air quality. There is evidence to suggest that atmospheric deposition of pollutants such as nitrogen oxides, ammonia and sulphur dioxide is greater
Working with Natural Processes – Evidence Directory 78
Social benefits
to woodland compared with shorter vegetation (Nisbet et al. 2011b). The use of shelterbelts can be a highly effective measure, achieving reductions in agricultural spray drift of between 60% and 90% (Ucar and Hall 2001, Lazzaro et al. 2008). The scavenging capability of woodland is dependent on species type and the level of canopy closure. The main limiting factor with cross-slope woodlands is their relative footprint; their greatest benefit is likely to be their ability to remove ammonia and suspended sediment/particulates (also pesticide spray drift), especially close to local pollutant sources.
Surface water or groundwater flood
The ability of cross-slope woodland to intercept water and increase infiltration helps to reduce the risk of flooding. Infiltration rates at Pontbren in mid-Wales were up to 67 times higher with woodland than for grazed pasture, reducing run-off volumes by an average of 78%. Of this, 48% was due to the removal of grazing pressure on the soil, with the remaining 30% attributed to the action of tree rooting and growth (Marshall et al. 2014). These figures are relative to the scale of cross-slope woodland planted and so may not be directly transferable to all sites.
Fluvial flood
Cross-slope woodland can slow the flow of water into the river through increasing infiltration, water use and hydraulic roughness. However, the effects on catchment level flooding are difficult to measure due to their localised nature. Modelling has predicted that woodland shelterbelts at Pontbren could reduce peak flow by 5% in an extreme rainfall event, with a 36% reduction if full woodland cover was introduced (Wheater et al. 2008). The effects are greater for frequent events. Modelling studies have shown that planting cross-slope woodland could be beneficial for reducing flood peaks in other small catchments.
Cultural benefits
Aesthetics
The aesthetic value of cross-slope woodland is influenced by the nature of the existing landscape and its current uses. While visitors to the Yorkshire Dales expressed a preference for the existing landscape over any form of land use change (Willis and Garrod 1993), the restoration of scrub and trees was strongly preferred in the more monotonous landscape of the southern uplands (Bullock and Kay 1997).
Cultural activities
The value of cross-slope woodland for cultural activities depends on its location, history and management. It can provide opportunities for niche activities such as deer stalking and pheasant shooting. Woodlands also attract walkers, cyclists, wildlife tourists and those seeking cultural heritage. General valuations of the cultural services provided by woodlands may be applicable to cross-slope woodland.

Working with Natural Processes – Evidence Directory 79
3.4 Floodplain woodland
3.4.1 Introduction
Key case studies (click here):
Cary
Great Triley Wood
Sussex Flow Initiative
What is floodplain woodland?
Floodplain woodland is defined as all woodland lying within the fluvial floodplain that is subject to an intermittent, regular planned or natural flooding regime. It typically comprises broadleaved woodland and can range from productive woodland on drier, intermittently flooded, areas to unmanaged, native wet woodland in wetter areas. The degree of benefit provided by this range of types can vary depending on the woodland.
The main role of floodplain woodland from an NFM perspective is to slow down and hold back flood flows within the floodplain, as well as to enhance sediment deposition and thereby reduce downstream siltation. This draws on the higher hydraulic roughness presented by floodplain woodland in the form of trees, shrubs and deadwood, as well as the potential additional floodwater storage provided by associated multiple water channels and backwater pools.
3.4.2 Flood risk evidence
This section sets out what we know in terms of the effectiveness of this measure from an FCRM perspective and the scientific confidence in what we know.
Summary of the literature
The tendency for floodplain width to increase down river systems means that the scope for floodplain woodland to have an impact on flood flows is usually greatest in middle and lower river reaches, and thus for medium to large catchments.
Floodplain woodland affects both floodplain and channel hydraulic roughness by the physical presence of the trees, undergrowth and deadwood, as well as by the influence of these on diverting floodplain flows and driving the formation of multiple channels and backwater pools.
There is a lack of catchment studies measuring the impact of floodplain woodland on flood peaks, reflecting the difficulties in planting a sufficient area of woodland to isolate its effect at the catchment level. As a result, modelled data provide the main source of evidence at the catchment level.
Effect on flood flows, peaks and storage L/M
River Chelmer Source: Chelmsford City Council
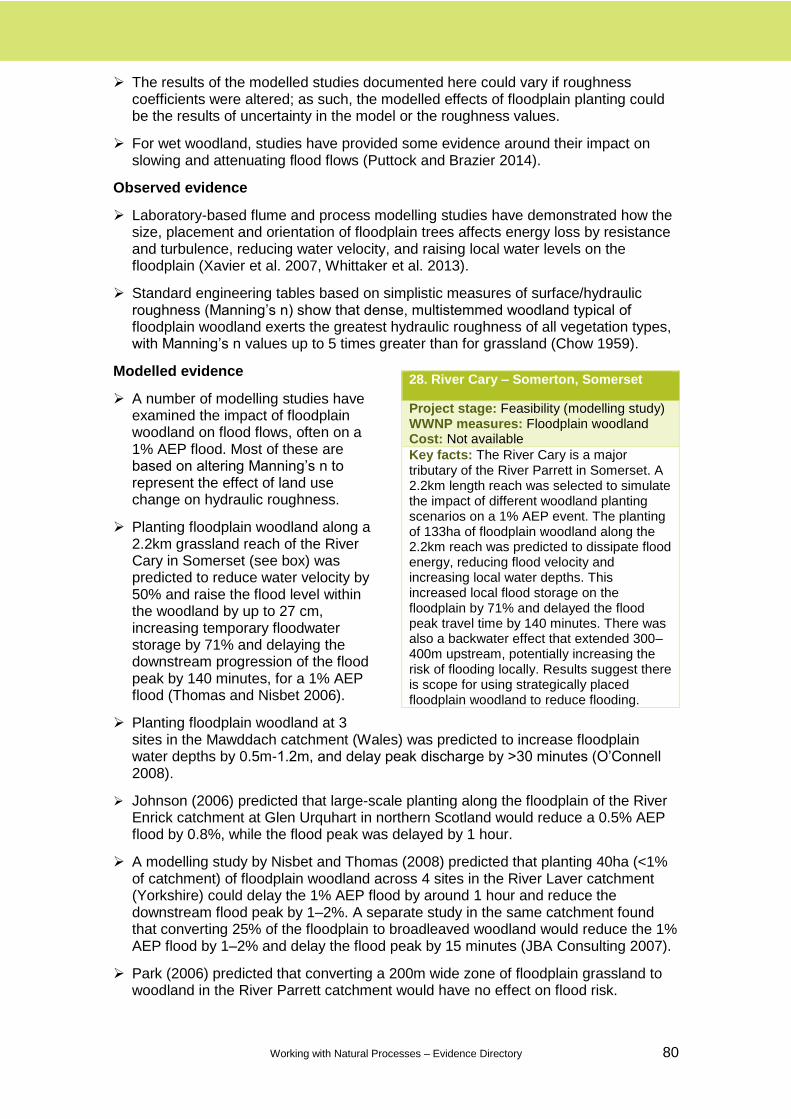
Working with Natural Processes – Evidence Directory 80
The results of the modelled studies documented here could vary if roughness coefficients were altered; as such, the modelled effects of floodplain planting could be the results of uncertainty in the model or the roughness values.
For wet woodland, studies have provided some evidence around their impact on slowing and attenuating flood flows (Puttock and Brazier 2014).
Observed evidence
Laboratory-based flume and process modelling studies have demonstrated how the size, placement and orientation of floodplain trees affects energy loss by resistance and turbulence, reducing water velocity, and raising local water levels on the floodplain (Xavier et al. 2007, Whittaker et al. 2013).
Standard engineering tables based on simplistic measures of surface/hydraulic roughness (Manning’s n) show that dense, multistemmed woodland typical of floodplain woodland exerts the greatest hydraulic roughness of all vegetation types, with Manning’s n values up to 5 times greater than for grassland (Chow 1959).
Modelled evidence
A number of modelling studies have examined the impact of floodplain woodland on flood flows, often on a 1% AEP flood. Most of these are based on altering Manning’s n to represent the effect of land use change on hydraulic roughness.
Planting floodplain woodland along a 2.2km grassland reach of the River Cary in Somerset (see box) was predicted to reduce water velocity by 50% and raise the flood level within the woodland by up to 27 cm, increasing temporary floodwater storage by 71% and delaying the downstream progression of the flood peak by 140 minutes, for a 1% AEP flood (Thomas and Nisbet 2006).
Planting floodplain woodland at 3 sites in the Mawddach catchment (Wales) was predicted to increase floodplain water depths by 0.5m-1.2m, and delay peak discharge by >30 minutes (O’Connell 2008).
Johnson (2006) predicted that large-scale planting along the floodplain of the River Enrick catchment at Glen Urquhart in northern Scotland would reduce a 0.5% AEP flood by 0.8%, while the flood peak was delayed by 1 hour.
A modelling study by Nisbet and Thomas (2008) predicted that planting 40ha (<1% of catchment) of floodplain woodland across 4 sites in the River Laver catchment (Yorkshire) could delay the 1% AEP flood by around 1 hour and reduce the downstream flood peak by 1–2%. A separate study in the same catchment found that converting 25% of the floodplain to broadleaved woodland would reduce the 1% AEP flood by 1–2% and delay the flood peak by 15 minutes (JBA Consulting 2007).
Park (2006) predicted that converting a 200m wide zone of floodplain grassland to woodland in the River Parrett catchment would have no effect on flood risk.
28. River Cary – Somerton, Somerset
Project stage: Feasibility (modelling study) WWNP measures: Floodplain woodland Cost: Not available
Key facts: The River Cary is a major tributary of the River Parrett in Somerset. A 2.2km length reach was selected to simulate the impact of different woodland planting scenarios on a 1% AEP event. The planting of 133ha of floodplain woodland along the 2.2km reach was predicted to dissipate flood energy, reducing flood velocity and increasing local water depths. This increased local flood storage on the floodplain by 71% and delayed the flood peak travel time by 140 minutes. There was also a backwater effect that extended 300–400m upstream, potentially increasing the risk of flooding locally. Results suggest there is scope for using strategically placed floodplain woodland to reduce flooding.
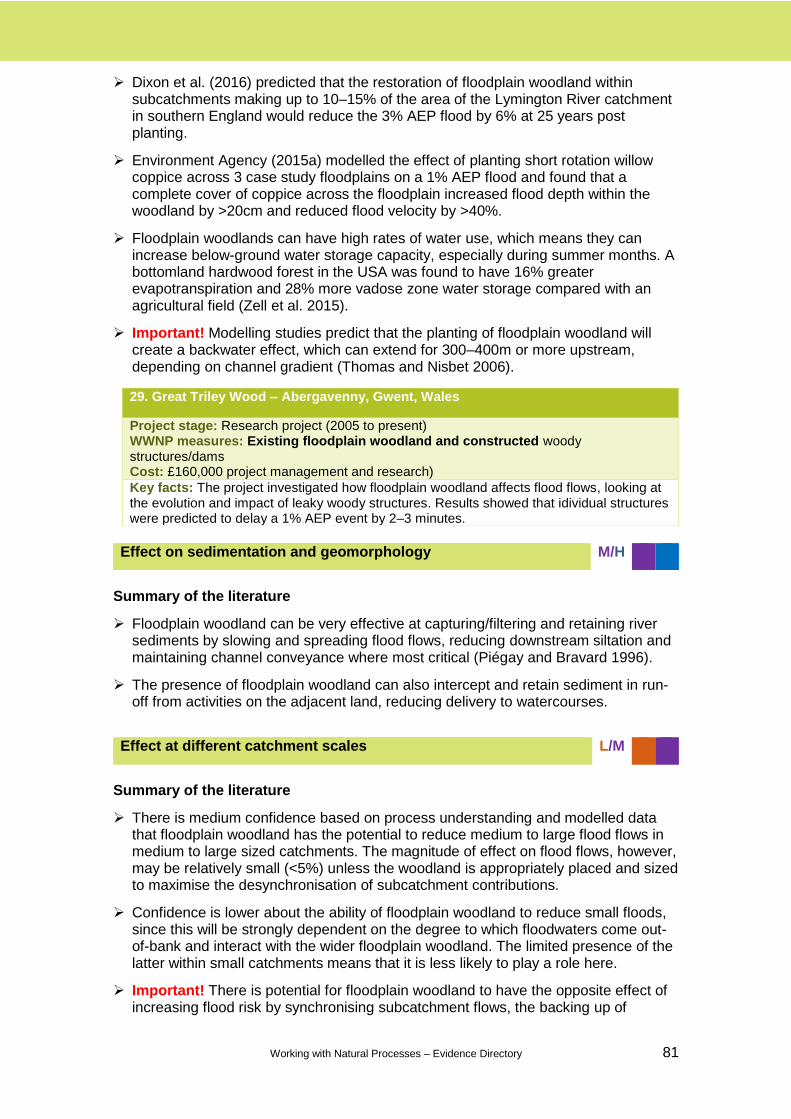
Working with Natural Processes – Evidence Directory 81
Dixon et al. (2016) predicted that the restoration of floodplain woodland within subcatchments making up to 10–15% of the area of the Lymington River catchment in southern England would reduce the 3% AEP flood by 6% at 25 years post planting.
Environment Agency (2015a) modelled the effect of planting short rotation willow coppice across 3 case study floodplains on a 1% AEP flood and found that a complete cover of coppice across the floodplain increased flood depth within the woodland by >20cm and reduced flood velocity by >40%.
Floodplain woodlands can have high rates of water use, which means they can increase below-ground water storage capacity, especially during summer months. A bottomland hardwood forest in the USA was found to have 16% greater evapotranspiration and 28% more vadose zone water storage compared with an agricultural field (Zell et al. 2015).
Important! Modelling studies predict that the planting of floodplain woodland will create a backwater effect, which can extend for 300–400m or more upstream, depending on channel gradient (Thomas and Nisbet 2006).
Summary of the literature
Floodplain woodland can be very effective at capturing/filtering and retaining river sediments by slowing and spreading flood flows, reducing downstream siltation and maintaining channel conveyance where most critical (Piégay and Bravard 1996).
The presence of floodplain woodland can also intercept and retain sediment in run-off from activities on the adjacent land, reducing delivery to watercourses.
Summary of the literature
There is medium confidence based on process understanding and modelled data that floodplain woodland has the potential to reduce medium to large flood flows in medium to large sized catchments. The magnitude of effect on flood flows, however, may be relatively small (<5%) unless the woodland is appropriately placed and sized to maximise the desynchronisation of subcatchment contributions.
Confidence is lower about the ability of floodplain woodland to reduce small floods, since this will be strongly dependent on the degree to which floodwaters come out-of-bank and interact with the wider floodplain woodland. The limited presence of the latter within small catchments means that it is less likely to play a role here.
Important! There is potential for floodplain woodland to have the opposite effect of increasing flood risk by synchronising subcatchment flows, the backing up of
29. Great Triley Wood – Abergavenny, Gwent, Wales
Project stage: Research project (2005 to present) WWNP measures: Existing floodplain woodland and constructed woody structures/dams Cost: £160,000 project management and research)
Key facts: The project investigated how floodplain woodland affects flood flows, looking at the evolution and impact of leaky woody structures. Results showed that idividual structures were predicted to delay a 1% AEP event by 2–3 minutes.
Effect on sedimentation and geomorphology M/H
Effect at different catchment scales L/M
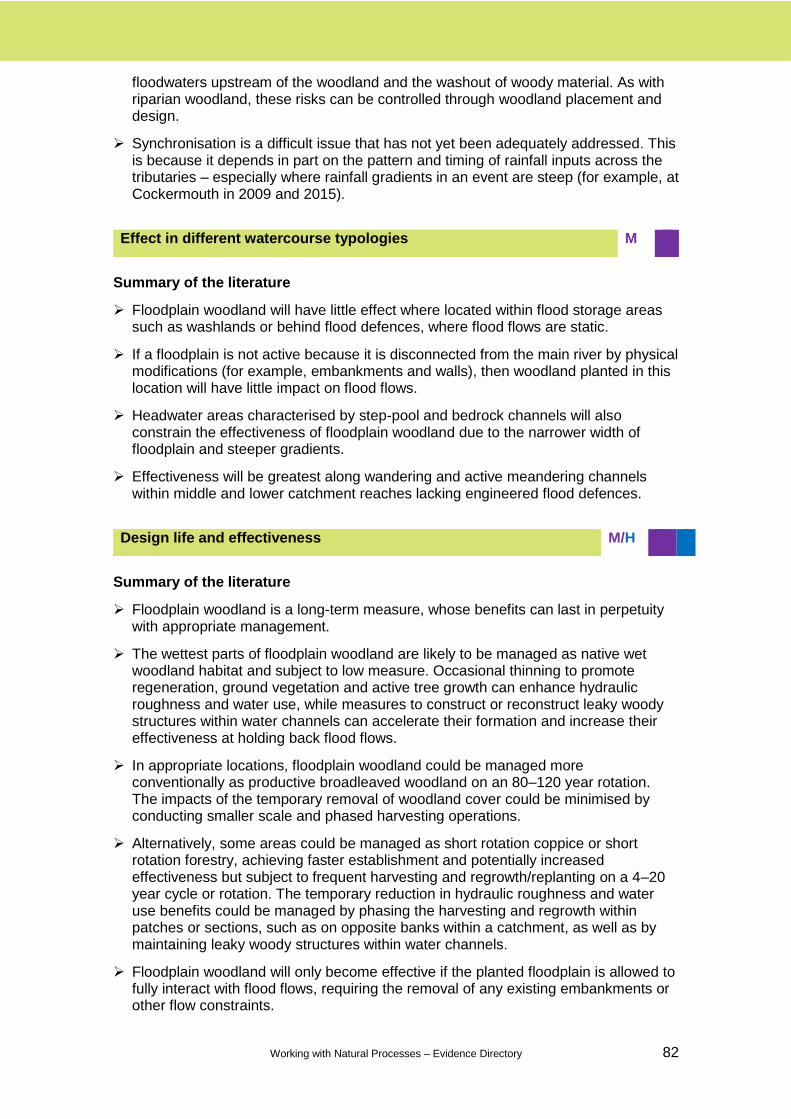
Working with Natural Processes – Evidence Directory 82
floodwaters upstream of the woodland and the washout of woody material. As with riparian woodland, these risks can be controlled through woodland placement and design.
Synchronisation is a difficult issue that has not yet been adequately addressed. This is because it depends in part on the pattern and timing of rainfall inputs across the tributaries – especially where rainfall gradients in an event are steep (for example, at Cockermouth in 2009 and 2015).
Summary of the literature
Floodplain woodland will have little effect where located within flood storage areas such as washlands or behind flood defences, where flood flows are static.
If a floodplain is not active because it is disconnected from the main river by physical modifications (for example, embankments and walls), then woodland planted in this location will have little impact on flood flows.
Headwater areas characterised by step-pool and bedrock channels will also constrain the effectiveness of floodplain woodland due to the narrower width of floodplain and steeper gradients.
Effectiveness will be greatest along wandering and active meandering channels within middle and lower catchment reaches lacking engineered flood defences.
Summary of the literature
Floodplain woodland is a long-term measure, whose benefits can last in perpetuity with appropriate management.
The wettest parts of floodplain woodland are likely to be managed as native wet woodland habitat and subject to low measure. Occasional thinning to promote regeneration, ground vegetation and active tree growth can enhance hydraulic roughness and water use, while measures to construct or reconstruct leaky woody structures within water channels can accelerate their formation and increase their effectiveness at holding back flood flows.
In appropriate locations, floodplain woodland could be managed more conventionally as productive broadleaved woodland on an 80–120 year rotation. The impacts of the temporary removal of woodland cover could be minimised by conducting smaller scale and phased harvesting operations.
Alternatively, some areas could be managed as short rotation coppice or short rotation forestry, achieving faster establishment and potentially increased effectiveness but subject to frequent harvesting and regrowth/replanting on a 4–20 year cycle or rotation. The temporary reduction in hydraulic roughness and water use benefits could be managed by phasing the harvesting and regrowth within patches or sections, such as on opposite banks within a catchment, as well as by maintaining leaky woody structures within water channels.
Floodplain woodland will only become effective if the planted floodplain is allowed to fully interact with flood flows, requiring the removal of any existing embankments or other flow constraints.
Effect in different watercourse typologies M
Design life and effectiveness M/H

Working with Natural Processes – Evidence Directory 83
The primary factor driving the effectiveness of floodplain woodland in reducing flood flows is hydraulic roughness. Hydraulic roughness gradually evolves over time, initially dominated by the growth of ground vegetation and shrubs (5–10 years). This is then followed by the establishment of trees (10+years), and in the longer term (decades), by increasing inputs of deadwood. The time frame can be shortened by the planting of faster growing tree species, including short rotation coppice, and by intervening to add/enhance deadwood and constructing leaky woody structures within watercourses.
A secondary factor is woodland water use, which increases with tree growth after planting and becomes largely established by the stage of ‘canopy closure’ at around 15–20 years. It can reduce if trees are unmanaged and left to become over mature.
Where there is scope for the formation of multiple channels and backwater pools, these can start to develop reasonably quickly, subject to the nature of the flooding regime.
Reductions in soil erosion and sediment delivery can begin relatively quickly in response to the cessation of agricultural pressures affecting the planted floodplain.
Summary of the literature
The main need is to protect planted trees to ensure successful establishment of the floodplain woodland. Maintenance work includes:
o replacing trees that have failed to establish
o protecting trees from pests, disease and browsing
o making repairs to infrastructure such as fences and gates
The relative depth of roughness elements is important for promoting interaction with floodplain flows. It can be increased through management to promote the growth of low shrubs, multistemmed trees, trees with low branches, and the supply and retention of deadwood.
Where possible, watercourses should be allowed to migrate and develop multiple side channels and backwater pools to improve connectivity and increase the storage of floodwaters.
Measure may be required to maintain associated woody structures/dams and to manage the risk of washout of woody material. Important! A greater degree of management will be required where these features are specifically designed and thus need to be maintained for reducing downstream flood risk, or where the washout of material poses a particular threat of blocking downstream structures.
Maintenance requirements H
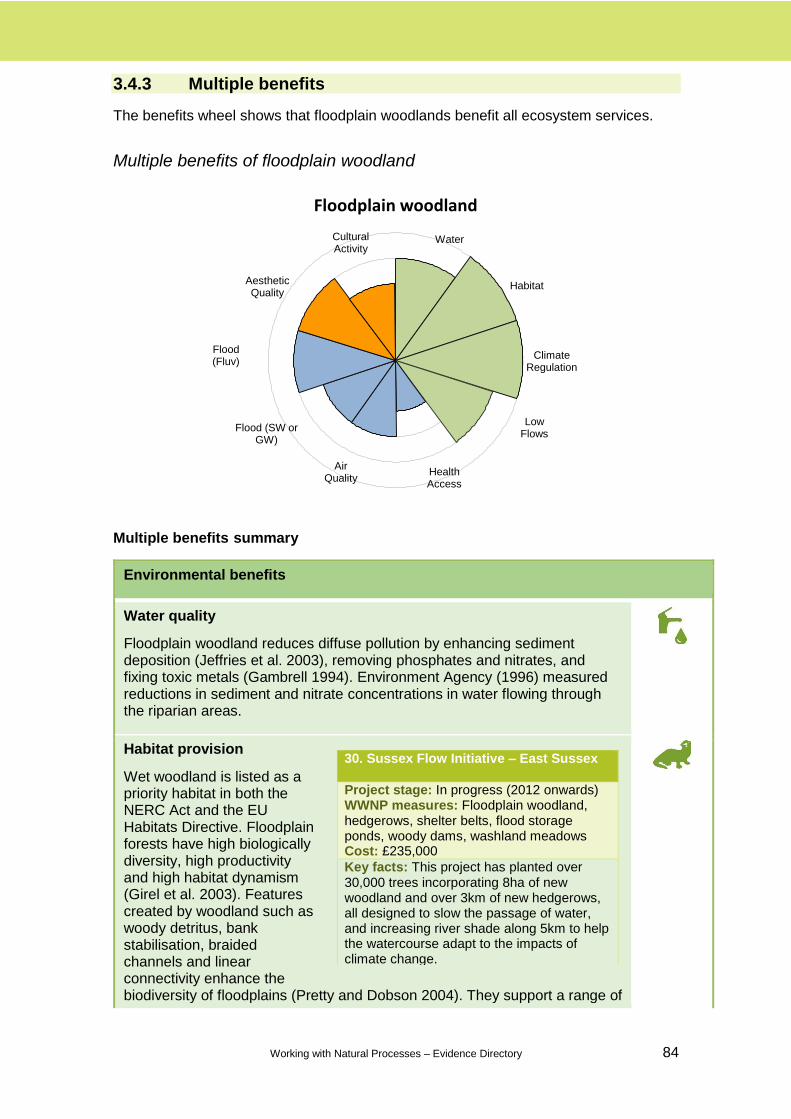
Working with Natural Processes – Evidence Directory 84
3.4.3 Multiple benefits
The benefits wheel shows that floodplain woodlands benefit all ecosystem services.
Multiple benefits of floodplain woodland
Multiple benefits summary
Environmental benefits
Water quality
Floodplain woodland reduces diffuse pollution by enhancing sediment deposition (Jeffries et al. 2003), removing phosphates and nitrates, and fixing toxic metals (Gambrell 1994). Environment Agency (1996) measured reductions in sediment and nitrate concentrations in water flowing through the riparian areas.
Habitat provision
Wet woodland is listed as a priority habitat in both the NERC Act and the EU Habitats Directive. Floodplain forests have high biologically diversity, high productivity and high habitat dynamism (Girel et al. 2003). Features created by woodland such as woody detritus, bank stabilisation, braided channels and linear connectivity enhance the biodiversity of floodplains (Pretty and Dobson 2004). They support a range of
Floodplain woodland
Water
Habitat
Climate Regulation
Low Flows
Flood (Fluv)
Flood (SW or GW)
Air Quality
Health Access
Cultural Activity
Aesthetic Quality
30. Sussex Flow Initiative – East Sussex
Project stage: In progress (2012 onwards) WWNP measures: Floodplain woodland, hedgerows, shelter belts, flood storage ponds, woody dams, washland meadows Cost: £235,000
Key facts: This project has planted over 30,000 trees incorporating 8ha of new woodland and over 3km of new hedgerows, all designed to slow the passage of water, and increasing river shade along 5km to help the watercourse adapt to the impacts of climate change.
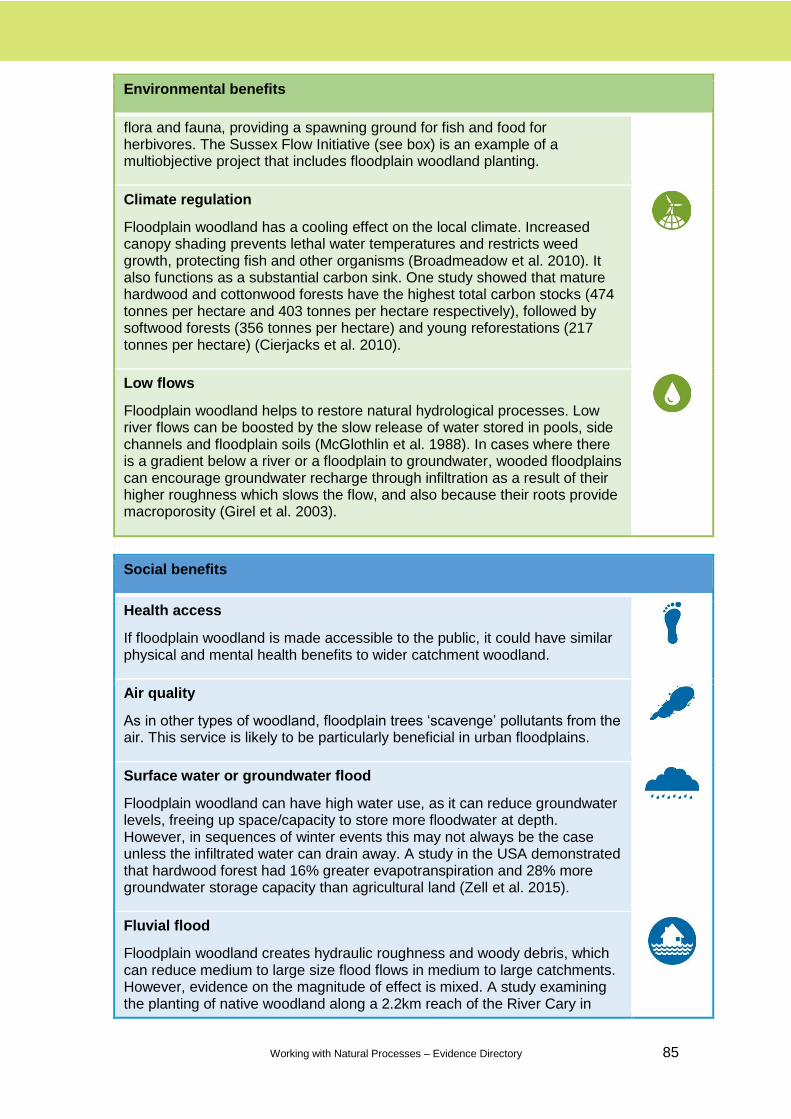
Working with Natural Processes – Evidence Directory 85
Environmental benefits
flora and fauna, providing a spawning ground for fish and food for herbivores. The Sussex Flow Initiative (see box) is an example of a multiobjective project that includes floodplain woodland planting.
Climate regulation
Floodplain woodland has a cooling effect on the local climate. Increased canopy shading prevents lethal water temperatures and restricts weed growth, protecting fish and other organisms (Broadmeadow et al. 2010). It also functions as a substantial carbon sink. One study showed that mature hardwood and cottonwood forests have the highest total carbon stocks (474 tonnes per hectare and 403 tonnes per hectare respectively), followed by softwood forests (356 tonnes per hectare) and young reforestations (217 tonnes per hectare) (Cierjacks et al. 2010).
Low flows
Floodplain woodland helps to restore natural hydrological processes. Low river flows can be boosted by the slow release of water stored in pools, side channels and floodplain soils (McGlothlin et al. 1988). In cases where there is a gradient below a river or a floodplain to groundwater, wooded floodplains can encourage groundwater recharge through infiltration as a result of their higher roughness which slows the flow, and also because their roots provide macroporosity (Girel et al. 2003).
Social benefits
Health access
If floodplain woodland is made accessible to the public, it could have similar physical and mental health benefits to wider catchment woodland.
Air quality
As in other types of woodland, floodplain trees ‘scavenge’ pollutants from the air. This service is likely to be particularly beneficial in urban floodplains.
Surface water or groundwater flood
Floodplain woodland can have high water use, as it can reduce groundwater levels, freeing up space/capacity to store more floodwater at depth. However, in sequences of winter events this may not always be the case unless the infiltrated water can drain away. A study in the USA demonstrated that hardwood forest had 16% greater evapotranspiration and 28% more groundwater storage capacity than agricultural land (Zell et al. 2015).
Fluvial flood
Floodplain woodland creates hydraulic roughness and woody debris, which can reduce medium to large size flood flows in medium to large catchments. However, evidence on the magnitude of effect is mixed. A study examining the planting of native woodland along a 2.2km reach of the River Cary in

Working with Natural Processes – Evidence Directory 86
Social benefits
Somerset predicted that it would reduce flood velocity by 50%, increase temporary water storage by 71%, and delay the downstream flood peak by 140 minutes (Thomas and Nisbet 2006). Other modelling studies have shown little to no effect on large flood peaks. Important! If not carefully placed, floodplain woodland can also increase flood risk by creating floodwater back up upstream, washing out woody debris and synchronising subcatchment flows. Table 3.2 provides monetary value estimates of the contribution of different types of WWNP to flood risk reduction.
Table 3.2 Floodplain woodland monetary value estimates of contribution of different types of NFM to flood risk reduction
Case Type and main measures
Benefits* (PV50) Costs (PV50) Benefit–cost ratio
River Cary
Woodland: planting (simulation)
£240,000 just for delay; up to £5 million for major NFM investments
Speculative figure is £300,000 to £1m million based on Pickering
Not known: from 1:1 to 1:4 based just on delay
Source: Eftec (2017)
Cultural benefits
Aesthetics
Restoration of floodplain woodland makes a significant contribution to landscape diversity and quality (Quine 2011). A floodplain forest is a complex vegetation mosaic, which is constantly being renewed, with only some parts forested at any point in time (Girel et al. 2003).
Cultural activities
Floodplain woodland may increase opportunities for recreational pursuits such as fishing and wildlife tourism. Other activities that are popular in woodlands include walking, cycling, camping and outdoor play. Woodlands also have high educational value.
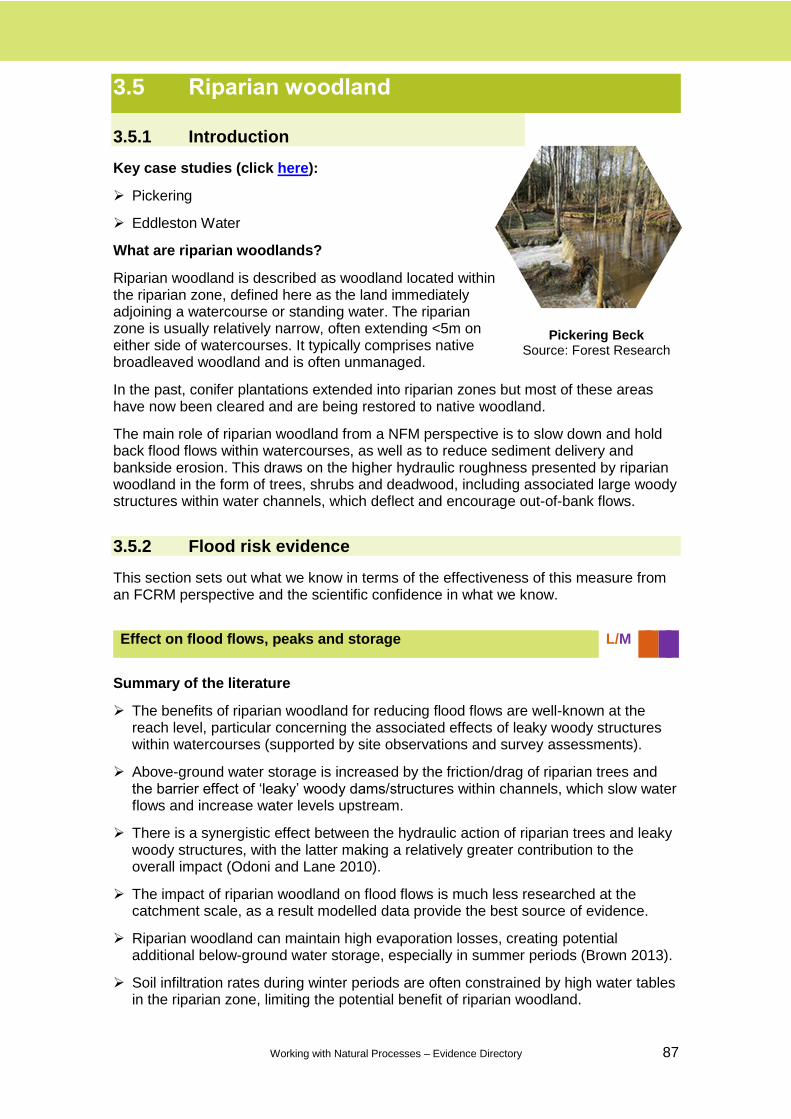
Working with Natural Processes – Evidence Directory 87
3.5 Riparian woodland
3.5.1 Introduction
Key case studies (click here):
Pickering
Eddleston Water
What are riparian woodlands?
Riparian woodland is described as woodland located within the riparian zone, defined here as the land immediately adjoining a watercourse or standing water. The riparian zone is usually relatively narrow, often extending <5m on either side of watercourses. It typically comprises native broadleaved woodland and is often unmanaged.
In the past, conifer plantations extended into riparian zones but most of these areas have now been cleared and are being restored to native woodland.
The main role of riparian woodland from a NFM perspective is to slow down and hold back flood flows within watercourses, as well as to reduce sediment delivery and bankside erosion. This draws on the higher hydraulic roughness presented by riparian woodland in the form of trees, shrubs and deadwood, including associated large woody structures within water channels, which deflect and encourage out-of-bank flows.
3.5.2 Flood risk evidence
This section sets out what we know in terms of the effectiveness of this measure from an FCRM perspective and the scientific confidence in what we know.
Summary of the literature
The benefits of riparian woodland for reducing flood flows are well-known at the reach level, particular concerning the associated effects of leaky woody structures within watercourses (supported by site observations and survey assessments).
Above-ground water storage is increased by the friction/drag of riparian trees and the barrier effect of ‘leaky’ woody dams/structures within channels, which slow water flows and increase water levels upstream.
There is a synergistic effect between the hydraulic action of riparian trees and leaky woody structures, with the latter making a relatively greater contribution to the overall impact (Odoni and Lane 2010).
The impact of riparian woodland on flood flows is much less researched at the catchment scale, as a result modelled data provide the best source of evidence.
Riparian woodland can maintain high evaporation losses, creating potential additional below-ground water storage, especially in summer periods (Brown 2013).
Soil infiltration rates during winter periods are often constrained by high water tables in the riparian zone, limiting the potential benefit of riparian woodland.
Effect on flood flows, peaks and storage L/M
Pickering Beck Source: Forest Research

Working with Natural Processes – Evidence Directory 88
Riparian woodland is unlikely to reduce large and extreme floods regardless of catchment size. This is partly due to its relatively small extent, but also the increased risk of the washout of bankside trees and leaky barriers during extreme events.
Important! There remains a view that riparian woodland is more likely to increase rather than reduce flood risk due to the threat posed by the washout of woody material blocking or damaging downstream culverts and bridges. This risk can be effectively managed (see Maintenance below) and needs to be balanced against the positive effects described above and wider benefits (see Section 3.5.3).
Modelled evidence
The planting of 50ha (0.7% of catchment) of riparian woodland plus the construction of 100 leaky woody structures within existing stretches of riparian woodland in the Pickering Beck catchment in north Yorkshire was predicted to reduce a 4% AEP flood by 4% and a 1% AEP event by 8% (Odoni and Lane 2010).
Tree planting on riparian areas occupying between 5% and 9% of 4 subcatchments in the River Tone catchment in Somerset had no significant effect on peak flows. Modelling predicted that the size of the largest peak flow event in January would be increased by between 2£ and 3%, while the largest event in May would be reduced by 1–2%; these small changes lay within the uncertainties of the model application and optimisation process (McIntyre and Thorne 2013).
The planting of deciduous riparian woodland on 9% of the 25km2 Hodder catchment in north England was predicted to reduce the average of the 10 largest peak flows by a mean of 2% (McIntyre and Thorne 2013).
Elsewhere, Ghavasieh et al. (2006) found that riparian woodland strips along a 20km reach could reduce peak discharge by 3.8%, while Anderson et al. (2006) predicted that tall vegetation reduced peak discharge by 12% over a 50km reach.
A larger effect was noted in a modelling study of the 98km2 catchment of the Lymington River in southern England, where the restoration of riparian woodland across 20–40% of the catchment was predicted to reduce peak flows by up to 19% for a 3% AEP flood (Dixon et al. 2016).
Modelling studies are thought to underestimate the impact of riparian woodland on flood flows by not incorporating the full range of relevant woodland processes.
Important! Modelling has demonstrated that the relative placement of riparian woodland within a catchment has a significant influence on the magnitude of the effect on peak flows by synchronising or desynchronising subcatchment flow responses. The largest reductions in peak flows resulted from placements designed to maximise the desynchronisation of the timings of subcatchment flood waves, which typically involved areas in the middle and upper catchment.
12. Pickering – north Yorkshire
Project stage: Constructed (2009) WWNP measures: Flood storage bund, timber bunds, wood dams, drain blocking, woodland planting, farm and road/track works Cost: £4 million (£2.7 million food storage area, rest WWNP measures and other project costs)
Key facts: The scheme as a whole (all measures) reduces the risk of flooding in Pickering from a 25% chance in any year to a less than 4% chance. An analysis of flow measurements from the Boxing Day 2015 storm event, when 50mm of rain fell over a 36-hour period, concluded with a relatively high degree of certainty that the project measures (including conventional flood storage reservoir) prevented flooding to a small number of properties in the town. It was estimated that the measures reduced the flood peak by 15–20%, with around half of the reduction due to the upstream land management measures and half due to the flood storage bund.
Working with Natural Processes – Evidence Directory 89
Summary of the literature
By slowing water flows across land into the channel, riparian woodland can be very effective at enhancing sediment deposition within the riparian zone, reducing downstream siltation (Piégay and Bravard 1996). A buffer of riparian woodland can also intercept and retain sediment in run-off from activities on the adjacent land, reducing delivery to watercourses.
Riparian woodland is known to strengthen river banks through rooting and protecting watercourses from disturbance.
Where sediment inputs from upslope or upstream land management are excessive, the flow-retarding effect of riparian woodland and leaky woody structures in particular can lead to heavy siltation within wooded channels, potentially reducing floodwater storage and causing a blockage to fish. This requires action to tackle sediment sources.
Summary of the literature
There is medium confidence based on observations at the reach scale plus modelling studies that riparian woodland has the potential to reduce small to medium flood flows in small and medium sized catchments. The magnitude of effect, however, may be relatively small (<5%) unless the woodland is appropriately placed to maximise the desynchronisation of subcatchment contributions.
There is low confidence that riparian woodland can exert a significant effect on flood risk at the large catchment scale. This mainly reflects the reduced footprint and interaction between the riparian zone and river flows as channel width increases, especially along Main Rivers protected by river embankments or defences.
Summary of the literature
The effect of riparian woodland on flood flows in different watercourse typologies is largely driven by the related effect of catchment size, as described above.
Benefits will be reduced where watercourse channels are deep or wide, where the riparian zone is restricted or disconnected by the presence of embankments, and where trees are held back from banksides.
Benefits will be greatest where:
o incised channels can be reconnected to their floodplains by the action of leaky woody structures
o channel gradient and width of riparian zone maximise contact and interaction with the riparian woodland
o existing pressures on banksides and channel morphology are significant and will be reduced or removed following woodland planting
Effect on sedimentation and geomorphology M/H
Effect at different catchment scales L/M
Effect in different watercourse typologies L/M

Working with Natural Processes – Evidence Directory 90
Summary of the literature
Riparian woodland is a long-term measure, whose benefits can last into perpetuity with appropriate management.
Occasional thinning to promote regeneration, ground vegetation and active tree growth can enhance hydraulic roughness and water use. Measures to construct or reconstruct leaky woody structures can accelerate their formation and increase their effectiveness at holding back flood flows.
In appropriate locations, riparian woodland could be managed as short rotation coppice or short rotation forestry, achieving faster establishment and potentially increased effectiveness but subject to frequent harvesting and regrowth/replanting on a 4–20 year cycle or rotation. The temporary reduction in hydraulic roughness and water use benefits could be managed by phasing the felling and regrowth along consecutive, longitudinal stretches or on opposite banks within a catchment, as well as by maintaining leaky woody structures within watercourses.
Riparian woodland can be slow to establish, particularly if left to natural regeneration and browsing pressure is high.
Hydraulic roughness generally evolves over time, initially dominated by the growth of ground vegetation and shrubs (5–10 years), followed by the establishment of trees (10+ years), and in the longer term (decades), by increasing inputs of deadwood. The time frame can be shortened by the planting of faster growing tree species, including short rotation coppice, and by intervening to add/enhance deadwood and constructing leaky woody structures within watercourses.
The woodland water use effect increases with tree growth after planting and becomes largely established by the stage of ‘canopy closure’ at around 15–20 years. It can reduce if trees are unmanaged and left to become over mature.
Reductions in soil erosion and sediment delivery can begin relatively quickly in response to the cessation of agricultural pressures affecting the riparian zone, such as from excluding livestock by fencing.
Summary of the literature
The main need is to protect planted trees to ensure successful establishment of the riparian woodland. Maintenance work includes:
o replacing trees that have failed to establish
o protecting trees from pests, disease and browsing
o making repairs to infrastructure such as fences and gates
The relative depth of roughness elements is more important for riparian woodland for interacting with overbank flood flows. It can be increased through management to promote the growth of low shrubs, multistemmed trees, trees with low branches, and the supply and retention of deadwood.
Where possible, watercourses should be left to migrate and develop side channels and other natural features that will help to improve connectivity with the woodland to
Design life and effectiveness M/H
Maintenance requirements M/H
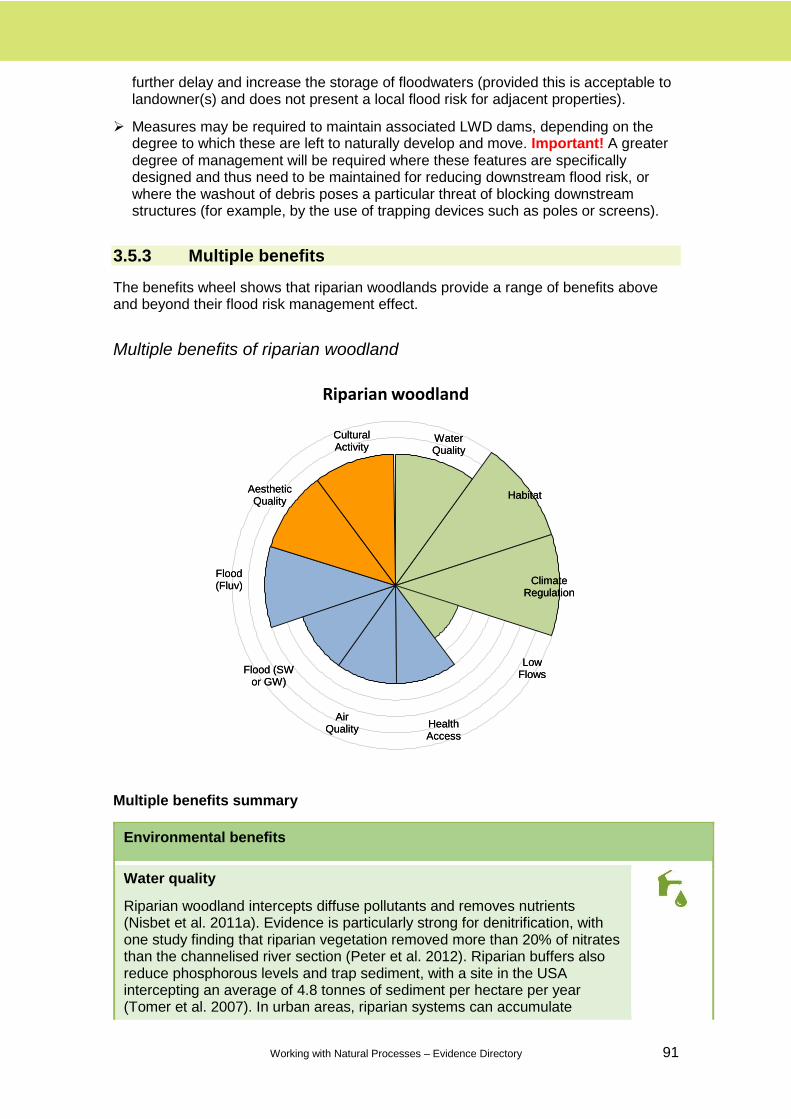
Working with Natural Processes – Evidence Directory 91
further delay and increase the storage of floodwaters (provided this is acceptable to landowner(s) and does not present a local flood risk for adjacent properties).
Measures may be required to maintain associated LWD dams, depending on the degree to which these are left to naturally develop and move. Important! A greater degree of management will be required where these features are specifically designed and thus need to be maintained for reducing downstream flood risk, or where the washout of debris poses a particular threat of blocking downstream structures (for example, by the use of trapping devices such as poles or screens).
3.5.3 Multiple benefits
The benefits wheel shows that riparian woodlands provide a range of benefits above and beyond their flood risk management effect.
Multiple benefits of riparian woodland
Multiple benefits summary
Environmental benefits
Water quality
Riparian woodland intercepts diffuse pollutants and removes nutrients (Nisbet et al. 2011a). Evidence is particularly strong for denitrification, with one study finding that riparian vegetation removed more than 20% of nitrates than the channelised river section (Peter et al. 2012). Riparian buffers also reduce phosphorous levels and trap sediment, with a site in the USA intercepting an average of 4.8 tonnes of sediment per hectare per year (Tomer et al. 2007). In urban areas, riparian systems can accumulate
Riparian woodland
Water Quality
Habitat
Climate Regulation
Low Flows
Flood (Fluv)
Flood (SW or GW)
Air Quality
Health Access
Cultural Activity
Aesthetic Quality
Water Quality
Habitat
Climate Regulation
Low Flows
Flood (Fluv)
Flood (SW or GW)
Air Quality
Health Access
Cultural Activity
Aesthetic Quality
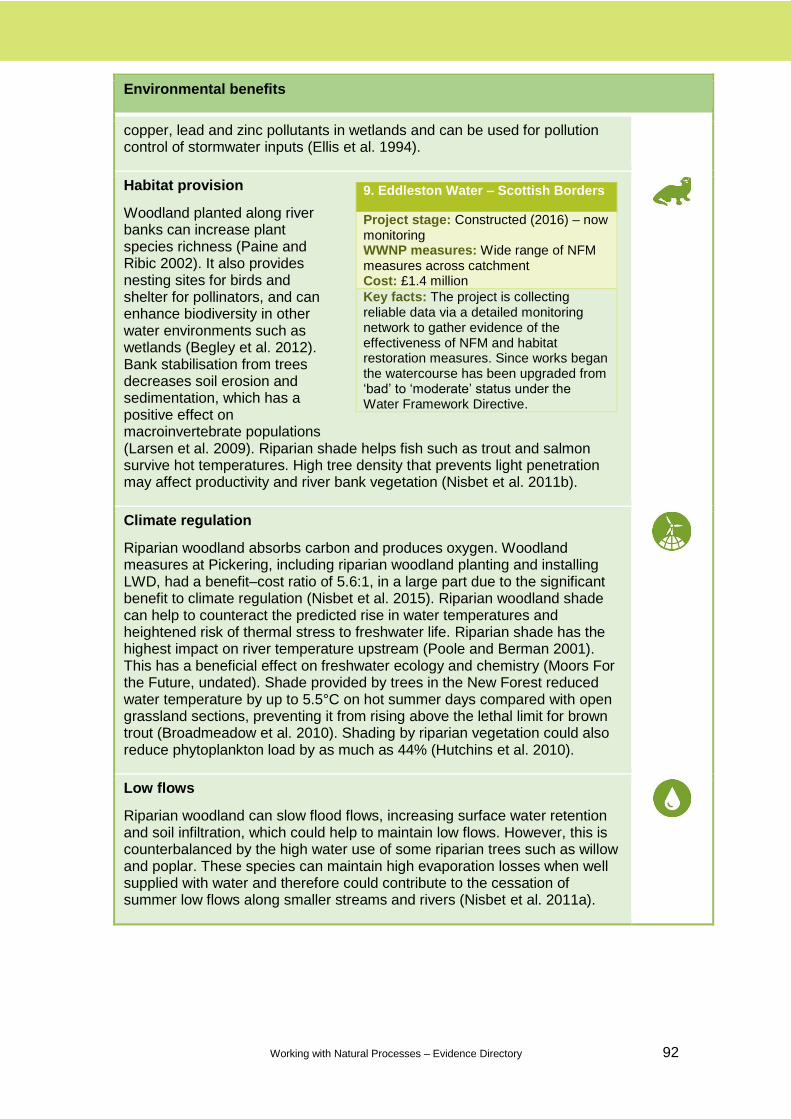
Working with Natural Processes – Evidence Directory 92
Environmental benefits
copper, lead and zinc pollutants in wetlands and can be used for pollution control of stormwater inputs (Ellis et al. 1994).
Habitat provision
Woodland planted along river banks can increase plant species richness (Paine and Ribic 2002). It also provides nesting sites for birds and shelter for pollinators, and can enhance biodiversity in other water environments such as wetlands (Begley et al. 2012). Bank stabilisation from trees decreases soil erosion and sedimentation, which has a positive effect on macroinvertebrate populations (Larsen et al. 2009). Riparian shade helps fish such as trout and salmon survive hot temperatures. High tree density that prevents light penetration may affect productivity and river bank vegetation (Nisbet et al. 2011b).
Climate regulation
Riparian woodland absorbs carbon and produces oxygen. Woodland measures at Pickering, including riparian woodland planting and installing LWD, had a benefit–cost ratio of 5.6:1, in a large part due to the significant benefit to climate regulation (Nisbet et al. 2015). Riparian woodland shade can help to counteract the predicted rise in water temperatures and heightened risk of thermal stress to freshwater life. Riparian shade has the highest impact on river temperature upstream (Poole and Berman 2001). This has a beneficial effect on freshwater ecology and chemistry (Moors For the Future, undated). Shade provided by trees in the New Forest reduced water temperature by up to 5.5°C on hot summer days compared with open grassland sections, preventing it from rising above the lethal limit for brown trout (Broadmeadow et al. 2010). Shading by riparian vegetation could also reduce phytoplankton load by as much as 44% (Hutchins et al. 2010).
Low flows
Riparian woodland can slow flood flows, increasing surface water retention and soil infiltration, which could help to maintain low flows. However, this is counterbalanced by the high water use of some riparian trees such as willow and poplar. These species can maintain high evaporation losses when well supplied with water and therefore could contribute to the cessation of summer low flows along smaller streams and rivers (Nisbet et al. 2011a).
9. Eddleston Water – Scottish Borders
Project stage: Constructed (2016) – now monitoring WWNP measures: Wide range of NFM measures across catchment Cost: £1.4 million
Key facts: The project is collecting reliable data via a detailed monitoring network to gather evidence of the effectiveness of NFM and habitat restoration measures. Since works began the watercourse has been upgraded from ‘bad’ to ‘moderate’ status under the Water Framework Directive.
Working with Natural Processes – Evidence Directory 93
Social benefits
Health access
If riparian woodland is well-maintained for public access, it can have significant health benefits. In the Tweed catchment, a riparian woodland planting project included measures to increase access and enhance footpaths and cycle routes. This led to a substantial increase in local visitor numbers, predominantly using the area for physical activities such as walking and cycling (Jura Consultants 2007). Walking regularly has been proven to reduce the risk of a heart attack by 50%, diabetes by 50%, colon cancer by 30% and fracture of the femur by up to 40% (Woolley et al. 2004).
Air quality
Riparian woodland can be an effective air quality filter. In rural areas it traps aerial drift from fertilisers (Lowrance et al. 1984), as well as pesticide spray drift (Lazzaro et al. 2008). The benefits are likely to be particularly pronounced in urban areas, where planting a high density buffer strip to intercept pollutants is most efficient (McDonald et al. 2007).
Surface water or groundwater flood
The main influence of riparian woodland is to delay flood flows and increase effective water storage capacity. The ability of riparian trees to maintain high evaporation losses creates additional soil capacity to store drainage waters, particularly in summer (Brown 2013). Above-ground storage is enhanced by friction from roots and woody debris, which increases water levels.
Fluvial flood
Riparian woodland increases water storage, slows water flows and reduces sedimentation. A number of modelling studies have demonstrated a reduction of peak flows at a catchment scale in small to medium flood events. On the Lymington River in southern England, restoration of riparian woodland along 20–40% of the total catchment area was the most effective WWNP measure tested, reducing peak flows by up to 19% for 3% annual probability of exceedance (Dixon et al. 2016). The placement of the woodland within the catchment is crucial to its success. Studies have found that planting in the upper catchment may have the greatest benefit, with riparian woodland in the lower reaches potentially increasing flood risk by synchronising catchment flows (Odoni and Lane 2010; Dixon et al. 2016). Table 3.3 provides monetary value estimates of the contribution of different types of WWNP to flood risk reduction.

Working with Natural Processes – Evidence Directory 94
Table 3.3 Riparian woodland monetary value estimates of contribution of different types of NFM to flood risk reduction
Case Type and main measures
Benefits* (PV50)
Costs (PV50)
Benefit–cost ratio
Cost per m3?
Benefit per m3?
Pickering Woodland: planting, attenuation and storage
~£5 million
~£4 million (£3.4 million for NFM)
1.25:1 on FRM only, positive with wider benefits
Range: £5 moorland measures; £20–£23 for dams and woodland; £1,450 farm measures
Estimate of £28 per m3
for 120,000m3
Source: Eftec (2017)
Cultural benefits
Aesthetics
Trees are highly valued aesthetically, and this becomes more significant when they are close to water. Proximity of watercourses and woodlands has been shown to increase property prices (Tyrväinen 1997). The value of a woodland landscape view on the urban fringe has been estimated at £269 per household per year (Willis et al. 2003).
Cultural activities
Riparian woodland can accommodate a range of cultural activities including exercise, access to nature, education and angling. Planting over 150ha of riparian woodland across the Tweed catchment, combined with improving recreational facilities, resulted in additional visitor spend of approximately £3 million per year (Jura Consultants 2007). Planting in riparian zones can improve fish stocks for angling due to its effect on reducing nutrient pollution and regulating the temperature of waterways (Johnstone and Markandya 2006).
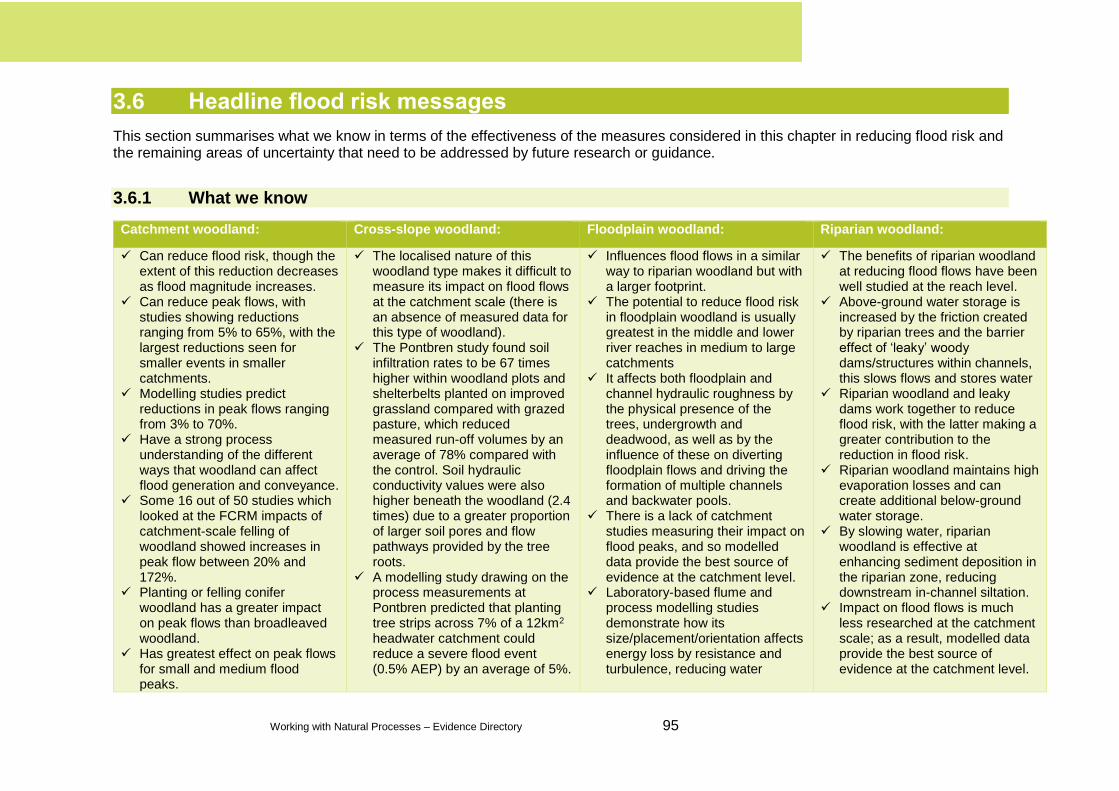
Working with Natural Processes – Evidence Directory 95
3.6 Headline flood risk messages
This section summarises what we know in terms of the effectiveness of the measures considered in this chapter in reducing flood risk and the remaining areas of uncertainty that need to be addressed by future research or guidance.
3.6.1 What we know
Catchment woodland: Cross-slope woodland: Floodplain woodland: Riparian woodland:
Can reduce flood risk, though the extent of this reduction decreases as flood magnitude increases.
Can reduce peak flows, with studies showing reductions ranging from 5% to 65%, with the largest reductions seen for smaller events in smaller catchments.
Modelling studies predict reductions in peak flows ranging from 3% to 70%.
Have a strong process understanding of the different ways that woodland can affect flood generation and conveyance.
Some 16 out of 50 studies which looked at the FCRM impacts of catchment-scale felling of woodland showed increases in peak flow between 20% and 172%.
Planting or felling conifer woodland has a greater impact on peak flows than broadleaved woodland.
Has greatest effect on peak flows for small and medium flood peaks.
The localised nature of this woodland type makes it difficult to measure its impact on flood flows at the catchment scale (there is an absence of measured data for this type of woodland).
The Pontbren study found soil infiltration rates to be 67 times higher within woodland plots and shelterbelts planted on improved grassland compared with grazed pasture, which reduced measured run-off volumes by an average of 78% compared with the control. Soil hydraulic conductivity values were also higher beneath the woodland (2.4 times) due to a greater proportion of larger soil pores and flow pathways provided by the tree roots.
A modelling study drawing on the process measurements at Pontbren predicted that planting tree strips across 7% of a 12km2 headwater catchment could reduce a severe flood event (0.5% AEP) by an average of 5%.
Influences flood flows in a similar way to riparian woodland but with a larger footprint.
The potential to reduce flood risk in floodplain woodland is usually greatest in the middle and lower river reaches in medium to large catchments
It affects both floodplain and channel hydraulic roughness by the physical presence of the trees, undergrowth and deadwood, as well as by the influence of these on diverting floodplain flows and driving the formation of multiple channels and backwater pools.
There is a lack of catchment studies measuring their impact on flood peaks, and so modelled data provide the best source of evidence at the catchment level.
Laboratory-based flume and process modelling studies demonstrate how its size/placement/orientation affects energy loss by resistance and turbulence, reducing water
The benefits of riparian woodland at reducing flood flows have been well studied at the reach level.
Above-ground water storage is increased by the friction created by riparian trees and the barrier effect of ‘leaky’ woody dams/structures within channels, this slows flows and stores water
Riparian woodland and leaky dams work together to reduce flood risk, with the latter making a greater contribution to the reduction in flood risk.
Riparian woodland maintains high evaporation losses and can create additional below-ground water storage.
By slowing water, riparian woodland is effective at enhancing sediment deposition in the riparian zone, reducing downstream in-channel siltation.
Impact on flood flows is much less researched at the catchment scale; as a result, modelled data provide the best source of evidence at the catchment level.
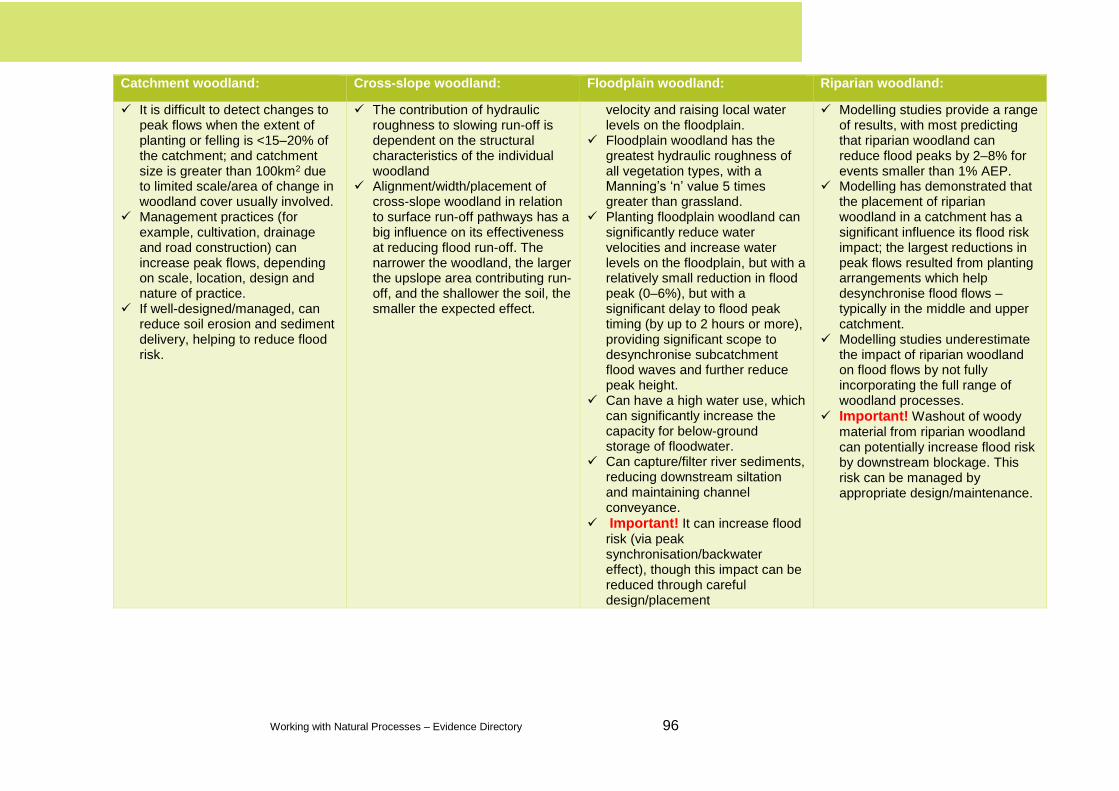
Working with Natural Processes – Evidence Directory 96
Catchment woodland: Cross-slope woodland: Floodplain woodland: Riparian woodland:
It is difficult to detect changes to peak flows when the extent of planting or felling is <15–20% of the catchment; and catchment size is greater than 100km2 due to limited scale/area of change in woodland cover usually involved.
Management practices (for example, cultivation, drainage and road construction) can increase peak flows, depending on scale, location, design and nature of practice.
If well-designed/managed, can reduce soil erosion and sediment delivery, helping to reduce flood risk.
The contribution of hydraulic roughness to slowing run-off is dependent on the structural characteristics of the individual woodland
Alignment/width/placement of cross-slope woodland in relation to surface run-off pathways has a big influence on its effectiveness at reducing flood run-off. The narrower the woodland, the larger the upslope area contributing run-off, and the shallower the soil, the smaller the expected effect.
velocity and raising local water levels on the floodplain.
Floodplain woodland has the greatest hydraulic roughness of all vegetation types, with a Manning’s ‘n’ value 5 times greater than grassland.
Planting floodplain woodland can significantly reduce water velocities and increase water levels on the floodplain, but with a relatively small reduction in flood peak (0–6%), but with a significant delay to flood peak timing (by up to 2 hours or more), providing significant scope to desynchronise subcatchment flood waves and further reduce peak height.
Can have a high water use, which can significantly increase the capacity for below-ground storage of floodwater.
Can capture/filter river sediments, reducing downstream siltation and maintaining channel conveyance.
Important! It can increase flood risk (via peak synchronisation/backwater effect), though this impact can be reduced through careful design/placement
Modelling studies provide a range of results, with most predicting that riparian woodland can reduce flood peaks by 2–8% for events smaller than 1% AEP.
Modelling has demonstrated that the placement of riparian woodland in a catchment has a significant influence its flood risk impact; the largest reductions in peak flows resulted from planting arrangements which help desynchronise flood flows –typically in the middle and upper catchment.
Modelling studies underestimate the impact of riparian woodland on flood flows by not fully incorporating the full range of woodland processes.
Important! Washout of woody material from riparian woodland can potentially increase flood risk by downstream blockage. This risk can be managed by appropriate design/maintenance.
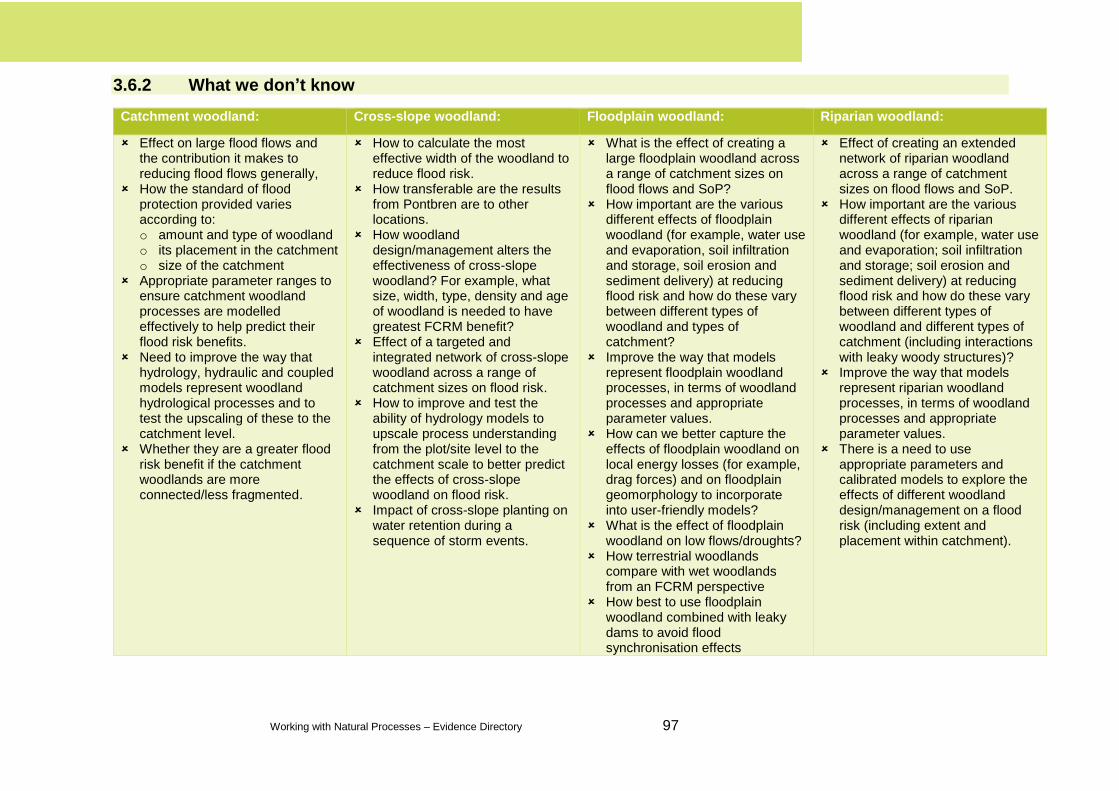
Working with Natural Processes – Evidence Directory 97
3.6.2 What we don’t know
Catchment woodland: Cross-slope woodland: Floodplain woodland: Riparian woodland:
Effect on large flood flows and the contribution it makes to reducing flood flows generally,
How the standard of flood protection provided varies according to: o amount and type of woodland o its placement in the catchment o size of the catchment
Appropriate parameter ranges to ensure catchment woodland processes are modelled effectively to help predict their flood risk benefits.
Need to improve the way that hydrology, hydraulic and coupled models represent woodland hydrological processes and to test the upscaling of these to the catchment level.
Whether they are a greater flood risk benefit if the catchment woodlands are more connected/less fragmented.
How to calculate the most effective width of the woodland to reduce flood risk.
How transferable are the results from Pontbren are to other locations.
How woodland design/management alters the effectiveness of cross-slope woodland? For example, what size, width, type, density and age of woodland is needed to have greatest FCRM benefit?
Effect of a targeted and integrated network of cross-slope woodland across a range of catchment sizes on flood risk.
How to improve and test the ability of hydrology models to upscale process understanding from the plot/site level to the catchment scale to better predict the effects of cross-slope woodland on flood risk.
Impact of cross-slope planting on water retention during a sequence of storm events.
What is the effect of creating a large floodplain woodland across a range of catchment sizes on flood flows and SoP?
How important are the various different effects of floodplain woodland (for example, water use and evaporation, soil infiltration and storage, soil erosion and sediment delivery) at reducing flood risk and how do these vary between different types of woodland and types of catchment?
Improve the way that models represent floodplain woodland processes, in terms of woodland processes and appropriate parameter values.
How can we better capture the effects of floodplain woodland on local energy losses (for example, drag forces) and on floodplain geomorphology to incorporate into user-friendly models?
What is the effect of floodplain woodland on low flows/droughts?
How terrestrial woodlands compare with wet woodlands from an FCRM perspective
How best to use floodplain woodland combined with leaky dams to avoid flood synchronisation effects
Effect of creating an extended network of riparian woodland across a range of catchment sizes on flood flows and SoP.
How important are the various different effects of riparian woodland (for example, water use and evaporation; soil infiltration and storage; soil erosion and sediment delivery) at reducing flood risk and how do these vary between different types of woodland and different types of catchment (including interactions with leaky woody structures)?
Improve the way that models represent riparian woodland processes, in terms of woodland processes and appropriate parameter values.
There is a need to use appropriate parameters and calibrated models to explore the effects of different woodland design/management on a flood risk (including extent and placement within catchment).

Working with Natural Processes – Evidence Directory 98
3.7 Potential funding mechanisms
Funding for woodland creation is primarily through the Rural Development Programme for individual countries as part of the EU Agricultural Fund for Rural Development. Payment rates and options vary between the home countries and include one-off capital payments. Table 3.4 lists some other potential funding mechanisms.
Table 3.4 Examples of potential funding mechanisms for woodland management measures
England Wales Scotland Countryside Stewardship
Private funding
Rural Development Programme
Water Framework Directive funding
Woodland Carbon Code
Woodland Carbon Fund
Woodland Trust ‘Morewoods’ scheme
Existing woodland management – Glastir Woodland Restoration (Welsh Government)
New planting – Glastir Woodland Creation (Welsh Government)
Scottish Rural Development Programme Forestry Grant Scheme
Notes: The information given is accurate as of the date of publication of this report.
3.8 Further reading
An appraisal of the Defra Multi-Objective Flood Management Projects (summary by the Moors for the Future Partnership*)
Floodplain woodland hydrodynamics (Xavier 2009)
Forests and Water: effects of forest management on floods, sedimentation, and water supply (Anderson et al. 1976)
Restoring floodplain woodland for flood alleviation (Nisbet and Thomas 2008)
Restoring and managing riparian woodlands (Parrott and Mackenzie 2000)
Systematic review to examine evidence on how trees influence flooding (CEH 2017)
SEPA’s Natural Flood Management Handbook (SEPA 2015)
The effects of riparian forest management on the freshwater environment: a literature review of best management practice (Broadmeandow and Nisbet 2004)
The potential for reducing flood risk through changes to rural land management (McIntyre et al. 2012)
The UK Forestry Standard (Forestry Commission 2014)
Woodland for Water: woodland measures for meeting Water Framework Directive objectives (Nisbet et al. 2011b)
* See Bibliography for further details
Working with Natural Processes – Evidence Directory 99
Chapter 4. Run-off management
4.1 Introduction
4.2 Soil and land management
4.3 Land and headwater drainage management
4.4 Run-off pathway management
4.1 Introduction
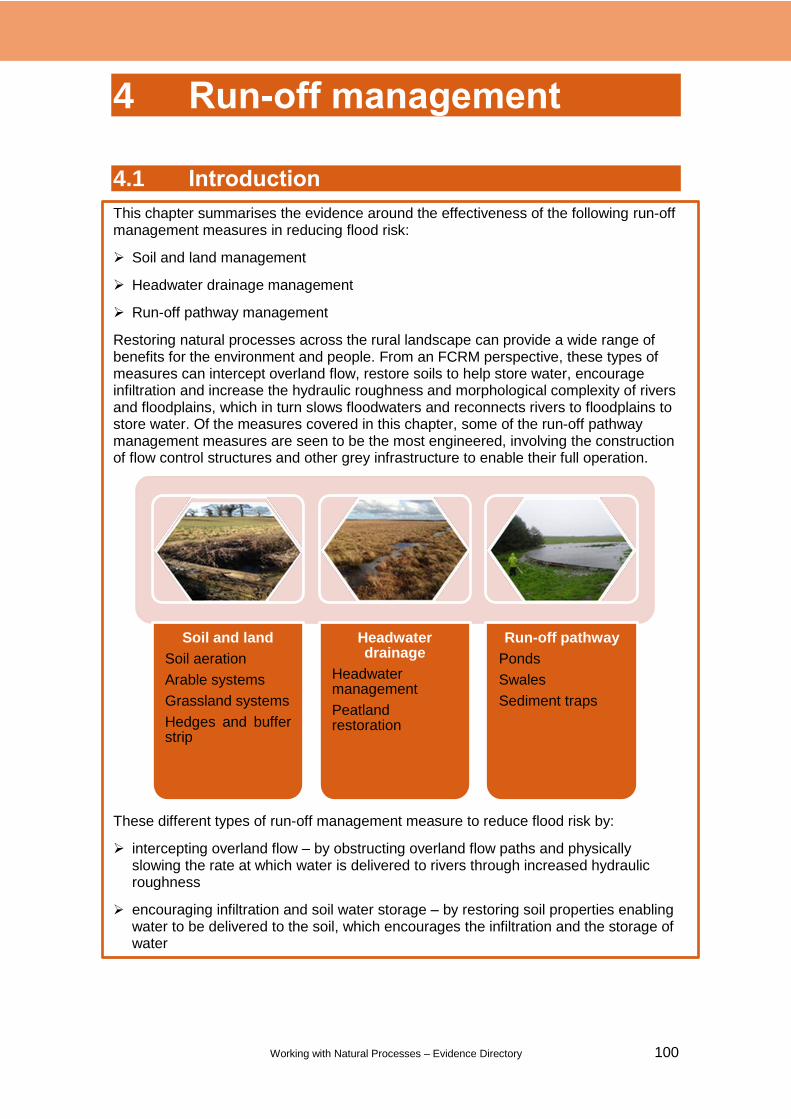
Working with Natural Processes – Evidence Directory 100
4 Run-off management
4.1 Introduction
This chapter summarises the evidence around the effectiveness of the following run-off management measures in reducing flood risk:
Soil and land management
Headwater drainage management
Run-off pathway management
Restoring natural processes across the rural landscape can provide a wide range of benefits for the environment and people. From an FCRM perspective, these types of measures can intercept overland flow, restore soils to help store water, encourage infiltration and increase the hydraulic roughness and morphological complexity of rivers and floodplains, which in turn slows floodwaters and reconnects rivers to floodplains to store water. Of the measures covered in this chapter, some of the run-off pathway management measures are seen to be the most engineered, involving the construction of flow control structures and other grey infrastructure to enable their full operation.
These different types of run-off management measure to reduce flood risk by:
intercepting overland flow – by obstructing overland flow paths and physically slowing the rate at which water is delivered to rivers through increased hydraulic roughness
encouraging infiltration and soil water storage – by restoring soil properties enabling water to be delivered to the soil, which encourages the infiltration and the storage of water
Soil and land
Soil aeration
Arable systems
Grassland systems
Hedges and bufferstrip
Headwater drainage
Headwater management
Peatlandrestoration
Run-off pathway
Ponds
Swales
Sediment traps
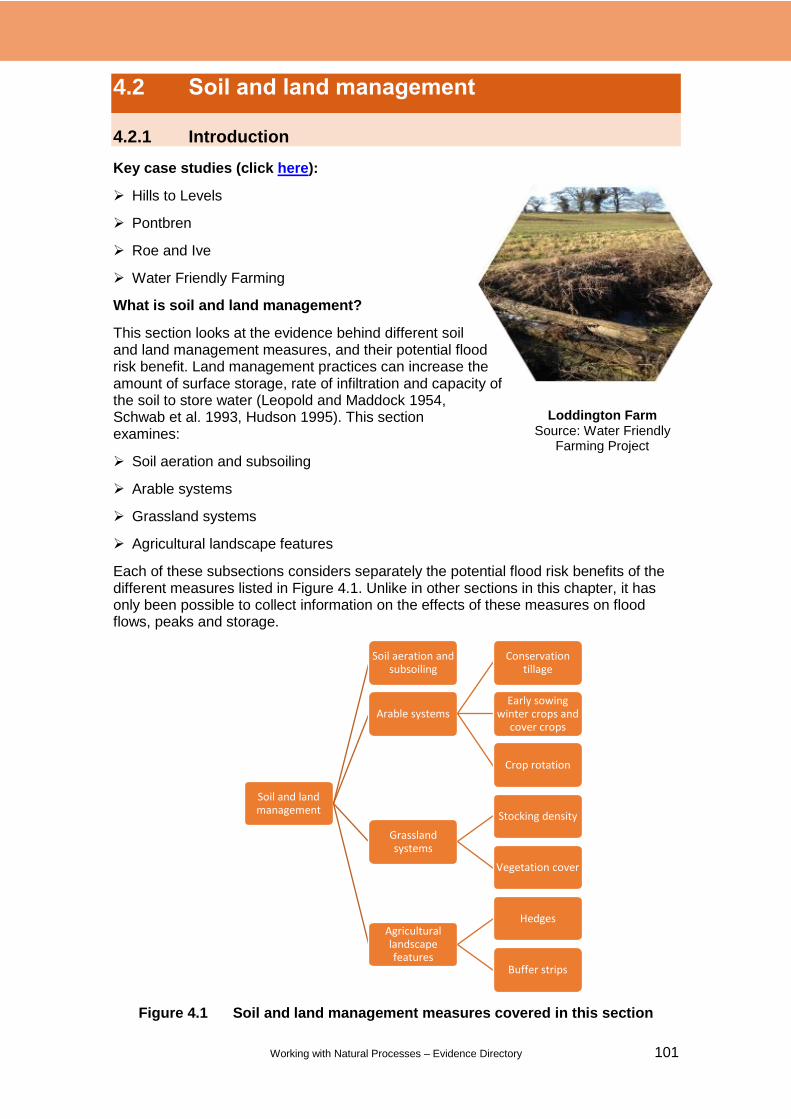
Working with Natural Processes – Evidence Directory 101
4.2 Soil and land management
4.2.1 Introduction
Key case studies (click here):
Hills to Levels
Pontbren
Roe and Ive
Water Friendly Farming
What is soil and land management?
This section looks at the evidence behind different soil and land management measures, and their potential flood risk benefit. Land management practices can increase the amount of surface storage, rate of infiltration and capacity of the soil to store water (Leopold and Maddock 1954, Schwab et al. 1993, Hudson 1995). This section examines:
Soil aeration and subsoiling
Arable systems
Grassland systems
Agricultural landscape features
Each of these subsections considers separately the potential flood risk benefits of the different measures listed in Figure 4.1. Unlike in other sections in this chapter, it has only been possible to collect information on the effects of these measures on flood flows, peaks and storage.
Figure 4.1 Soil and land management measures covered in this section
Soil and land management
Soil aeration and subsoiling
Arable systems
Conservation tillage
Early sowing winter crops and
cover crops
Crop rotation
Grassland systems
Stocking density
Vegetation cover
Agricultural landscape features
Hedges
Buffer strips
Loddington Farm Source: Water Friendly
Farming Project
Working with Natural Processes – Evidence Directory 102
4.2.2 Flood risk evidence
This section sets out what we know in terms of the effectiveness of this measure from an FCRM perspective and the scientific confidence in what we know.
Soil and land management practices have a localised flood risk benefit. There are currently no studies that provide qualitative or quantitative evidence that specifically links soil and land management changes to catchment-wide changes in flood risk. Research to date at the catchment scale has found that:
the impacts of soil and land management practices are highly uncertain, and spatially and temporally dependent
the phasing of tributary peak flow is a key control on how local-scale run-off changes are upscaled to the catchment scale (Pattison and Lane 2012, Lane 2017)
as results are upscaled, the confidence in the effect of the soil or land management measure decreases (Lane 2017)
determining the impacts of increasing flow attenuation in one tributary depends on the tributary’s relationship with water delivered from other tributaries (Lane 2017)
Given these research findings, the flood risk benefits of soil and land management measures are considered at a local scale only.
Soil aeration and subsoiling
Common methods to reduce soil compaction found in arable and grassland systems (from tractors or grazing) are soil aeration and subsoiling.
Soil aeration is a process that breaks up topsoil compaction and makes the cultivation of arable crops possible (Ritzema 1994). Breaking up the compaction and increasing the soil hydraulic conductivity is believed to increase soil infiltration and water retention capacity and, consequently, increase the travel time for incident rainfall to reach the arterial drainage system.
Subsoiling is also a type of soil aeration. It is performed to reduce compaction and increase drainage into the subsoil. Subsoiling involves loosening the subsoil to break it up to improve drainage and encourage better plant growth (Castle et al. 1984).
Summary of the literature
There is high confidence that soil aeration and subsoiling does increase the ability for soils to infiltrate water and drain, and potentially increase soil water storage capacity. However, there is currently low confidence in it as a measure to significantly reduce flood risk.
There are limited studies in the UK and so the evidence relies on international literature.
The benefits of soil aeration and subsoiling vary, depending on the soil type and degree of loosening.
Soil aeration improves the infiltration rate, soil strength and accumulation of organic material (Douglas et al. 1998).
Effect on flood flows, peaks and storage L
Working with Natural Processes – Evidence Directory 103
Douglas et al. (1998) outlined the beneficial effects of soil aeration on the structural properties of the soil in terms of the increase in the volume, size and number of macropores in the uppermost 100mm of soil that affected the infiltration rate, soil strength and accumulation of organic material. These results were supported by experiments situated on 2.5ha of land, 10km south of Edinburgh, on a clay loam topsoil in a profile described as imperfectly drained.
In a study undertaken in Georgia (USA), Frankin et al (2007) found a decreased run-off volume across well-drained soils (compared with non-aerated and slit aerated soils) and increased run-off volumes on poorly drained soils following the same treatment. Decreases in volumes were attributed to increased infiltration of rainfall (Curran Cournane et al. 2011). In poorly drained soils, however, soil aeration increased run-off volumes compared with a non-aerated soil treatment (Franklin et al. 2007).
Curran Cournane et al. (2011) found no significant difference in surface run-off volumes between aerated soils and control treatments. Changes in soil physical properties were found to be short-lived and unlikely to influence surface run-off in the long term. These findings cannot be transferred to other sites where infiltration-excess overland flow is the dominant run-off process, but can be applied to sites where surface run-off is generated under saturated-excess conditions.
Although soil aeration and subsoiling is a common agricultural practice, its benefits vary and are dependent on the soil type and degree of loosening.
O’Connell et al. (2007)) found that:
o soil structural degradation (due to compaction) can affect run-off generation
o changes in the way land is managed can alter the soil’s structure and increase surface water storage locally
There is however, a lack of quantified data to show how this improved local flood storage affects river flow response (Holman et al. 2003) or how it would reduce flood risk with an increasing frequency and magnitude of extreme rainfall events associated with climate change (Fowler 2005).
A study by Smith (2012) showed the effects of soil aeration can vary significantly from negligible effects to increasing soil water storage capacity by up to 100%, and delay run-off peaks in lightly compacted fields.
There is an optimum depth in which the subsoiling should be conducted when dealing with compaction. However, this can only be determined by trial and error (Castle et al. 1984).
Subsoiling should only occur during optimum soil moisture conditions, when the subsoil is dry, but not excessively so (Castle et al. 1984).
Modelling as part of the Somerset Hills to Levels project (see box) suggested that soil and land management measures coupled with this type of WWNP features in the upper catchment could reduce peak flow by up to 10% (1 in 30 year event) in steep subcatchments and up to 40% in flatter subcatchments.

Working with Natural Processes – Evidence Directory 104
The Roe and Ive project at Stockdalewath in Cumbria (see box) is using a suite of soil and land management measures to help reduce flood risk alongside property level resilience measures.
Arable systems
Agricultural practices that use larger machinery to produce uniformly fine seedbeds for autumn sown crops and for late harvesting of crops can compact subsoils. Palmer and Smith (2013) conducted an extensive survey of soil structural degradation in south-west England under many cropping systems and confirmed its linkage to the generation of enhanced surface water run-off. These poor agricultural practices can exacerbate the ‘normal’ response of streams to rainfall and are likely to have the greatest effect during extreme rainfall events at critical times of the year in late autumn, early winter, and spring (Holman et al. 2003). Conservation tillage, early sowing of winter crops, and cover crops and crop rotations can be used as remedial actions to help reduce compaction, encourage greater soil water retention capacity and increase travel time to reduce flood risk.
Summary of the literature
There is limited evidence or peer-reviewed literatures from the UK which shows that changes in crop management reduce flood risk locally or at the catchment scale.
Evidence shows that changes in arable practices can increase soil water retention capacity and increase travel time to a surface water body, but may not correlate to reduced flood risk. The evidence that is available is also conflicting.
Both arable and grassland farming inevitably change topsoil structure and bulk density, which affects the soil hydraulic properties.
The ‘Code of Good Agricultural Practice for Farmers, Growers and Land Managers’ (Defra 2009b) notes that:
o well-drained and well-structured soils allow water to enter more quickly and therefore should reduce the risk of run-off and erosion
o crops sown in early September will take up more nitrogen than later sown crops, and will also reduce the risk of run-off and soil erosion due to the presence of a vegetative cover over winter.
Effect on flood flows, peaks and storage L
32. Roe and Ive – Stockdalewath, Cumbria
Project stage: In progress (2016 onwards) WWNP measures: Leaky dams (25), grassland soil aeration and subsoiling (156 acres) Investigating opportunities for offline storage, tree planting and hedge planting Cost: £50,000 to date
Key facts: The local community has been flooded 3 times. Working with Durham University, this project has implemented some measures to help reduce flood risk.
31. Hills to Levels – south and west Somerset
Project stage: Ongoing (2015 onwards) WWNP measures: Improved soil and land management, runoff interception/diversion, water attenuation, slow the flow in-stream Cost: £1.25 million (£375,000 construction of NFM measures)
Key facts: Improved soil structure could help delay and reduce flood peaks by increasing water infiltration. Modelling suggests that attenuation features in the upper catchment could reduce peak flow by up to 10% (1 in 30 year event) and up to 40% in flatter subcatchments.

Working with Natural Processes – Evidence Directory 105
o residues of late harvested crops can be left undisturbed until the following spring unless the soil is compacted and there is risk of run-off or soil erosion
Conservation tillage
Recorded effects of conservation tillage on run-off are variable and dependent on soil, land and climatic factors.
Soil cultivation or tillage can, in the short term, have positive effects on soil water retention capacity by decreasing soil bulk density and increasing porosity (BIO Intelligence Service and Hydrologic 2014). In the long term, the continuity of macropores are destroyed, disturbing soil structure and rapidly reverses soil water retention capacity (Strudley et al. 2008).
Hill and Mannering (1995) found that:
o conservation tillage system reduces soil erosion rates by 50-60% compared with conventional tillage
o the plant residues that remain improve soil structure and increase soil water infiltration and soil water storage capacity
Reduced tillage is slightly more effective at capturing rainfall and enables annual irrigation to be reduced by 6–9% than non-tilled soil in Spain (Abrisqueta et al. 2007).
In a 5-year study, Deasy et al. (2009) found that minimum tillage was effective at 2 out of the 5 sites trialled (Loddington Farm in Lincolnshire and Old Hattons in Staffordshire) in reducing run-off, suspended solids and total phosphorus.
Deasy et al. (2014) compared traditional ploughing with minimum tillage at the Loddington site (2007 to 2008), collecting data from 20 separate rainfall events. They found that minimum tillage increased run-off generation, peak flow and run-off responses to rainfall events. Also, lag time between peak run-off response and the onset of rainfall events was increased compared with ploughing. However, this finding conflicted with the authors’ earlier study.
The review by Pierzynski et al. (2000) of the Loddington study suggested that run-off may take longer to peak due to the effects of stubble and crop residues, which increase surface roughness and slow the rate of run-off to the base of the hillslope.
Early sowing of winter crops and cover crops
Limited peer-reviewed literature shows that early sowing and cover crops have a flood risk benefit (Zheng et al. 2012). The literature that is available is conflicting.
Vegetation protects the soil surface from raindrop splash and capping, reduces erosion, increases organic material in the soil profile, increasing evapotranspiration and maintains open channels for longer, increasing the infiltration rate and soil water
33. Water Friendly Farming – Loddington, Leicestershire
Project stage: Constructed (2012), being monitored WWNP measures: Permeable dams, field edge wetlands and support for improved soil management Cost: £2 million (construction of WWNP measures 20% total cost)
Key facts: About 30,000m3 of temporary storage will have been installed in a 10km2 catchment by 2017. Modelling indicates that this is anticipated to reduce the 1:100 year flood peak by 20%. Modelling of the effect of previously installed buffer strips indicates that they have reduced sediment losses from the landscape by about 30%.

Working with Natural Processes – Evidence Directory 106
storage capacity (Environment Agency 2003, BIO Intelligence Service and Hydrologic 2014).
The success of cover crops and soil mulches at reducing field plot run-off is uncertain and dependent on soil type (O’Connell et al. 2004).
Results vary from 80% reduction in surface run-off using winter cover crops in Germany (Schafer 1986) to no significant difference using under-sown rye grass or winter cover crops in the UK (Environment Agency 2002).
There is confidence that planting cover crops increases the hydraulic roughness of the soil, which in turn will reduce run-off rates and overland flow, and encourage infiltration (Hansen et al. 1999, Kamphorst et al. 2000, Planchon et al. 2001, Zheng et al. 2012).
Crop rotations
O’Connell et al. (2004) stated that agricultural crop cycles are not well represented in the modelling of infiltration processes, run-off generation mechanisms and channel processes.
A 4-year cycle with one year in grass will lower the farming intensity and should increase soil hydraulic properties to reduce flood risk for the whole landscape (Defra 2017).
Grassland systems
Grassland (permanent and temporary grass) is approximately 46% of the total UK land area (Defra 2016). These systems therefore offer great potential to intercept rainfall or modify run-off generation and potentially mitigate flood risk (Macleod et al. 2013). Grassland systems can contribute to an increase in flood risk in places where soil has become compacted, leading to a reduction in infiltration and an increase in surface water run-off (O’Connell et al. 2007). Changes in management practice could reduce and/or delay locally generated surface run-off with the potential to significantly reduce downstream flood risk (O’Connell et al. 2007, Wheater and Evans 2009, McIntyre and Marshall 2010).
Summary of the literature
There are limited findings from scientific experiments on the impacts of stocking/destocking on run-off generation.
Most evidence is qualitative and focused on upland areas (Carroll et al. 2004, O’Connell et al. 2007, Wheater and Evans 2009).
Findings from scientific studies on this topic are conflicting. Heathwaite et al. (1989, 1990) found that there was a reduction in run-off and increased infiltration capacity compared with grazed fields. Marshall et al. (2014), however, found no significant difference between soil infiltration rates and soil bulk density on grazed and ungrazed plots.
The rate of change and overall extent of soil recovery depends on a multitude of different factors such as soil type, severity of grazing and climate (Greenwood et al. 1998).
Effect on flood flows, peaks and storage L

Working with Natural Processes – Evidence Directory 107
Bilotta et al. (2007) found that the impact of grazing animals on soil hydraulic conductivity depended on the amount of pressure exerted on the soil, together with the species and age of the grazing animal. The amount and form of soil structural alteration is determined by the stocking density, soil moisture content, soil texture and the presence/absence of a protective vegetation cover (Bilotta et al. 2007).
Stocking density
Removal of livestock generally leads to a reduction in surface flow volumes. This improves the structure of the upper layers of the soil, enhances infiltration and evaporation (Gifford and Hawkins 1978, Greenwood et al. 1998, Nguyen et al. 1998, Greenwood and McKenzie 2001 and Carroll et al. 2004).
Heathwaite et al. (1989, 1990) found that compared with grazed fields, ungrazed fields have greater infiltration capacity and so produce less run-off. Run-off from heavily grazed permanent grassland is nearly 12 times greater than that from ungrazed temporary grassland.
Lane (2003) suggested a link between an increased stocking density of sheep in the Yorkshire Ouse catchment (1970s and 1980s) and the speed with which rain reaches the drainage network. However, Fowler (2005) believed this change could be attributed to changes in rainfall seasonality and an increase in extreme rainfall events.
In Pontbren in mid-Wales, Marshall et al. (2014) found that the grazed plot had the shortest time to peak and the largest surface run-off volume, and the ungrazed plot had a shallower rising limb, smaller peak and smaller run-off volume. However, others suggest these differences could be attributed to the natural variability of run-off and infiltration rates (Biggar and Neilsen 1976, Beven et al. 1993).
Vegetation cover
Vegetation cover protects the soil, providing a physical barrier between hooves and soil (O’Connor 1956). This increases the soil’s shear strength and load-bearing capacity (Patto et al. 1978).
Research by Macleod et al. (2013) at the Rothamsted research centre in Devon (2006 to 2009) found that the type of vegetation present or planted in the grassland system is important. A hybrid grass species was found to reduce run-off by 51% compared with 43% for more commonly used grass types. This due to an initial phase of intense root growth, which resulted in a greater soil water storage capacity.
In Devon, Puttock and Brazier (2014) measured and monitored the water retention capacity of Culm grassland and found that it stores more water than intensively managed grasslands (~241 litres per m2 compared with 62 litres per m2 surface area), scrub and woodland.
27. Pontbren, Wales – Investigating the impacts of upland land use management on flood risk
Project stage: Catchment study carried out between 2005 and 2008 WWNP measures: Sheep removal, tree planting in hill slope plots, tree shelterbelts Cost: Not available
Key facts: The aim of this research project was to improve understanding of how changes in upland land management impact on flood risk at the catchment scale. Experimental plots were established to measure the effects of sheep grazing and tree planting on soil structure and the generation of flood runoff. Results showed that land management can have a major effect on run-off processes.

Working with Natural Processes – Evidence Directory 108
Agricultural landscape features
The planting, conservation and management of hedges helps to intercept overland flow across slopes in erosion-vulnerable areas and to reduce the concentration of animal or machinery operations in these vulnerable areas (Environment Agency 2012). Buffer strips also have similar effects; they can act as a mechanical filter for suspended matter and sediments during floods and can reduce the pesticides and herbicides input to the stream (Vought et al. 1995).
Summary of the literature
Agricultural landscape features can slow, store, filter and attenuate flow. However, there is limited evidence to demonstrate their flood risk benefits locally and at a catchment scale.
A number of studies reported in the literature focusing on hedges and buffer strips were centred around reducing agricultural diffuse pollution in lowland areas and therefore there was little interpretation or analysis of the run-off measurements.
Hedges
Hedgerows have been used in land management for decades across the globe to control water (Baudry et al. 2000). However, there is little or no quantitative or qualitative evidence to demonstrate their ability to reduce flood risk.
Hedges act as cross-slope interceptors. They increase the hydraulic roughness of the landscape, and this in turn slows down the flow of water across the landscape and increases the likelihood of soil infiltration, interception and evapotranspiration (Hansen et al. 1999, Kamphorst et al. 2000, Planchon et al. 2001, Harris et al. 2004, Zheng et al. 2012, BIO Intelligence Service and Hydrologic 2014).
The siting of hedgerows is rarely determined to minimise flood risk as the visual effects of the historical landscape and wildlife must also be considered (Defra 2009b).
Buffer strips
There is limited evidence to demonstrate that buffer strips reduce run-off at both the plot and catchment scale (Lane et al. 2007).
A buffer zone can occur anywhere in the catchment and should be sited to intercept pathways of concentrated surface run-off (Lane et al. 2007).
Buffer strips, similar to hedges, increase the hydraulic roughness of the landscape which in turn reduces surface water flow velocities and soil infiltration, trapping nutrients and enabling sediment deposition prior to their export to the waterbodies (Dillaha et al. 1986, Vought et al. 1995, Hansen et al. 1999, Kamphorst et al. 2000, Planchon et al. 2001, Zheng et al. 2012).
The location and size of a buffer strip influences how effective it is at reducing flood risk. Research in Italy found that including a buffer strip in a field reduced run-off to a greater extent than there not being one (Borin et al. 2010).
A modelling study by Gao et al. (2016) found that the effect of buffer strips on run-off can be enhanced depending on their location and size. A wider strip with a higher density of vegetation helped to delay the peak, whereas a narrower buffer strip on hill slopes surrounding upstream and downstream channels had a greater effect than a thicker buffer strip based around the downstream river network.
Effects on flood flows, peaks and storage L

Working with Natural Processes – Evidence Directory 109
4.2.3 Multiple benefits
The benefits wheel shows that soil and land management measures provide a range of benefits above and beyond their flood risk management effect.
Multiple benefits of soil and land management
Multiple benefits summary
Environmental benefits
Water quality
Poor soil structure and enhanced run-off caused by intensive agricultural and livestock practices can potentially mobilise large amounts of sediment and colloidal material (including soil, plant and livestock faecal matter) from the damaged and exposed soil surface, and deliver this matter into surface waters where it could contribute to sedimentation problems (Harrod and Theurer 2002, Walling et al. 2003), eutrophication (Haygarth and Jarvis 1999, Heathwaite and Johnes 1996), and pathogenic contamination (Chadwick and Chen 2002, Oliver et al. 2005). Improving land and soil management practices can have a significant impact on diffuse pollution from agricultural land. Methods such as lower livestock intensity and green coverage are associated with fewer sediment-related water quality issues (Bilotta et al. 2008, Gooday et al. 2014). Areas of set-aside and semi-natural grassland trap nutrients, preventing high loads of phosphates and nitrates from reaching watercourses (Ulen and Mattsson 2003). However, returning set-aside land to production creates a surge in nutrient leaching (Meissner 1998). Buffer strips are particularly beneficial, with 5m buffer strips in hilly areas found to reduce phosphorous by 42–96%, nitrogen by 27–81%,
Soil and land management
Water Quality
Habitat
Climate Regulation
Low Flows
Flood (Fluv)
Flood (SW or GW)
Air Quality
Health Access
Cultural Activity
Aesthetic Quality
Water Quality
Habitat
Climate Regulation
Low Flows
Flood (Fluv)
Flood (SW or GW)
Air Quality
Health Access
Cultural Activity
Aesthetic Quality

Working with Natural Processes – Evidence Directory 110
Environmental benefits
organic matter by 83–90% and suspended sediment by 55–97% (Somma 2013). In the Wensum Demonstration Test Catchment, Cooper et al. (2017) found that a winter oilseed radish cover crop reduced nitrate nitrogen (NO3-N) leaching losses by 75–97% relative to fallow, but had no impact on phosphorus losses. Despite covering 20% of the catchment, improvements in river water quality downstream of the trial area were not observed, indicating that prolonged use of cover crops may be required before catchment-scale impacts are detected. Dewald et al. (1996) found that grass hedges are effective in slowing run-off and reducing soil losses through erosion. They can cause a backwater effect, which allows time for deposition of eroded sediments; this in turn fills in low spots in fields so that future run-off is more broadly dispersed and less erosive, and reduces travel time. Hedges can improve infiltration and sedimentation, retaining eroded particles carrying pesticides and phosphorus (Environment Agency 2012).
Habitat provision
Soil retention and land use diversity are generally beneficial for habitats. Buffer strips managed for biodiversity have been shown to double the number of invertebrates compared with normal cropped margins (Meek et al 2002). They also increase plant diversity, and provide wildlife corridors and habitat connectivity (Constanza et al. 1997, Boutin et al. 2003). Semi-natural grasslands also have high plant and invertebrate diversity, providing pollination and pest control services (Bullock 2011). Crop rotations that create seasonal diversity can increase the number of seed-feeding birds (Peach et al. 2011). The inclusion of spring-sown crops in the rotation can bring extra benefits because, where stubbles are leftover in the winter, this can provide cover and food for farmland birds (Harris et al. 2004). Soil aeration could mitigate against plant diseases since deficient oxygen is a causal factor of plant diseases (Grable 1966).
Climate regulation
Land management practices including set-aside and the conversion of arable land to grassland have had a significant impact on increasing UK soil carbon storage (Bell et al. 2011). Green cover can provide up to 300kg of carbon per hour take up to the soil (Justes et al. 2012), while Culm grasslands store 1.8g per cm² of carbon in soils with a given surface area, 20% more than agriculturally improved fields (Puttock and Brazier 2014). Vegetated buffer strips have a cooling effect on local river temperatures.
Low flows
Land management practices involving revegetation (e.g. buffer strips) slow flow to watercourses, stabilising flows (Christen and Dalgaard 2013).
Social benefits
Health access
Benefits will only be realised if projects are designed with public access in mind, providing footpaths and other amenities. For example, in a project
Working with Natural Processes – Evidence Directory 111
Social benefits
which created a buffer zone on the River Avon, disabled access via a gate through the fencing was integral to the design (Environment Agency 2010b). Better access combined with improved landscape aesthetics provides opportunities for physical activity and mental relaxation.
Air quality
Agricultural greenhouse gas emissions can be reduced by soil conservation practices including ‘no-till’, green manures, agroforestry, conversion of arable to pasture, reducing grazing intensity and the use of nitrogen fixing forages (Holden et al. 2006, Sousanna et al. 2010). Soil conservation also reduces wind erosion, contributing to improved local air quality. While some crop rotations absorb greenhouse gases, others produce them, with one study showing that good practice still leads to carbon loss (Kutsch et al. 2010, Lehman and Osborne 2013).
Surface water or groundwater flood
Practices that improve soil stability and structure, such as no-till and reducing the intensity of livestock grazing, lead to less surface run-off and more infiltration (Bilotta et al. 2008, Soane et al. 2012). Green cover crops can reduce surface run-off by up to 80% (O’Connell et al. 2007). Grasslands also offer potential to intercept rainfall and reduce run-off (Macleod et al. 2007), although their ability to store moisture decreases when they are intensively managed (Brazier and Puttock 2014). Buffer strips can increase infiltration and slow surface flow, with a 10m buffer strip shown to reduce run-off rates by at least 50% (CORPEN 2007). Management techniques including disrupting tramlines, crop residue incorporation, cultivation on the contour, and remediating soil compaction also reduce run-off (Deasy et al. 2010, Palmer 2011).
Fluvial flood
The reduction in run-off and sedimentation from improved agricultural practices is also likely to reduce the impacts of fluvial flooding. Establishing buffer strips creates bank stability, with the reduction in soil erosion increasing channel conveyance capacity. A study at Pontbren in mid-Wales found that the yield of catchment coarse sediment was 12 times greater and the yield of fine sediment 5 times greater from intensively grazed land than from natural pasture (Henshaw 2009). Although there is evidence of land use change having an impact on localised flooding, effects are less palpable at a catchment scale.
Cultural benefits
Aesthetics
Diversification of land use is also likely to enhance landscape aesthetics. Buffer strips usually resemble natural scenery associated with ‘peaceful’ landscapes and may thus meet the criteria of acceptability for the wider public (Christen 2013). Grassland is also a popular landscape feature. It is

Working with Natural Processes – Evidence Directory 112
Cultural benefits
the major habitat of the new South Downs National Park, which a 2003 study showed that there were about 39 million visitor days per year (Bullock 2011).
Cultural activities
Improving biodiversity through better land management practices provides opportunities for ecotourism. Increased habitat for game and fish from grasslands and buffer strips is beneficial for angling and shooting (Christen 2013). Restoration of pasture encourages the long-term preservation of archaeological remains that would otherwise be damaged by ploughing and low water table levels (Holden et al. 2006).
4.3 Headwater drainage management
4.3.1 Introduction
Key case studies (click here):
Dunruchan Farm
Eycott Hill
Exmoor Mires
Hills to Levels
Moors for the Future
Pumlumon
River Ray
Others: Eden DTC and Yorkshire Peat Partnership
What is headwater drainage management?
This section looks at drainage management measures suitable in headwater catchments. Headwater catchments are loosely defined as typically small catchment areas up to several square kilometres in size. Within these headwater drainage networks, there are potential opportunities to intervene to change the storage and the travel time of water within them by slowing the flow of water before it reaches the drainage network. The section examines:
Agricultural headwater management
Headwater peatland restoration
Each subsection considers separately the potential flood risk benefits of the different measures listed in Figure 4.2.
Exmoor Mires Source: Exmoor Mires Partnership
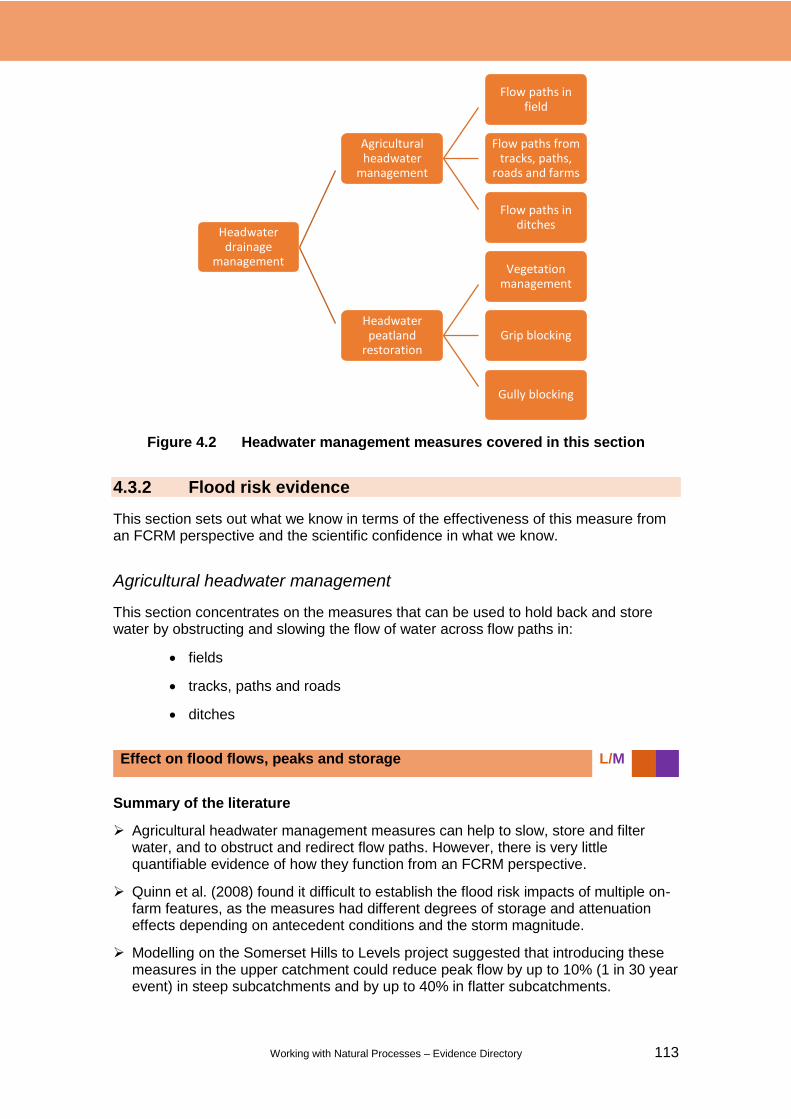
Working with Natural Processes – Evidence Directory 113
Figure 4.2 Headwater management measures covered in this section
4.3.2 Flood risk evidence
This section sets out what we know in terms of the effectiveness of this measure from an FCRM perspective and the scientific confidence in what we know.
Agricultural headwater management
This section concentrates on the measures that can be used to hold back and store water by obstructing and slowing the flow of water across flow paths in:
fields
tracks, paths and roads
ditches
Summary of the literature
Agricultural headwater management measures can help to slow, store and filter water, and to obstruct and redirect flow paths. However, there is very little quantifiable evidence of how they function from an FCRM perspective.
Quinn et al. (2008) found it difficult to establish the flood risk impacts of multiple on-farm features, as the measures had different degrees of storage and attenuation effects depending on antecedent conditions and the storm magnitude.
Modelling on the Somerset Hills to Levels project suggested that introducing these measures in the upper catchment could reduce peak flow by up to 10% (1 in 30 year event) in steep subcatchments and by up to 40% in flatter subcatchments.
Headwater drainage
management
Agricultural headwater
management
Flow paths in field
Flow paths from tracks, paths,
roads and farms
Flow paths in ditches
Headwater peatland
restoration
Vegetation management
Grip blocking
Gully blocking
Effect on flood flows, peaks and storage L/M

Working with Natural Processes – Evidence Directory 114
The Hills to Level and River Ray case studies are current examples where changes in land management practices are being implemented for to reduce flooding.
Flow pathways within fields
Tramlines that cross arable fields can intercept surface flows and create rapid flow pathways (Schwab et al. 1993, Environment Agency 2008).
Breaking up the compacted soil within tramlines is necessary to help disrupt the flow pathways (Withers et al. 2006, Withers et al. 2008, Environment Agency 2008).
Flow pathways from tracks, paths and roads
Tracks, paths and roads on farms can concentrate flow along their length due to their more impermeable nature and smoother bed.
Tracks can be artificially constructed for access purposes, or by animals whose hooves generate linear tracks which increase hydrological connectivity (Zhao 2009).
Track or path interceptions such as hump cross drains or channel cross drains can reduce the concentration of flow along pathways and may reduce flood risk.
Managing track run-off connectivity in the South Downs National Park was effective at controlling the impact of muddy floods (Evans and Baordman. 2003, Evans 2006).
Cross drains or any track or road-based drainage feature can divert flow laterally onto fields or into ponds, and have the potential to slow overland flow.
Flow pathways within ditches – widening, increasing roughness and partial blockage
There is good evidence that altering the hydraulics of a ditch will lower flow rates at the measure site. However, there is very little quantifiable evidence of how these features function from a flood risk management perspective.
Planting willows (living barriers) in ditches has been found to attenuate flow, but it is hard to quantify the peak flow reduction as the leakiness is highly nonlinear.
Modelling of the effect of widening and flattening in-ditch features and roughening the vegetation at Nafferton Farm in County Durham showed that:
31. Hills to Levels – south and west Somerset
Project stage: Ongoing (2015 onwards) WWNP measures: Improved soil and land management, runoff interception/diversion, water attenuation, slow the flow in-stream Cost: £1.25 million (£375,000 construction of NFM measures)
Key facts: Improved soil structure could help delay and reduce flood peaks by increasing water infiltration. Modelling suggested that attenuation features in the upper catchment could reduce peak flow by up to 10% (1 in 30 year event) and up to 40% in flatter subcatchments.
34. River Ray Rural Flooding – Oxfordshire
Project stage: Consultation phase (2014 to 2015) WWNP measures: Likely to include land management, soil improvements and run-off attenuation Cost: £33,500 (mainly for modelling and mapping)
Key facts: Modelling predicted damage reductions of: 61% (agricultural) and 64% (property) from watercourse maintenance; 31–37% reduction in agricultural damages from additional pond storage; ±34% (agricultural) and ±166% (urban) damage sensitivity from unconstrained soil compaction; and 15% damage increase from climate change.
Working with Natural Processes – Evidence Directory 115
o the features delayed and flattening the flood hydrographs for 1 in 20 to 1 in 25 year return period events (Kutija and Murray 2007)
o vegetating ditches can reduce peak discharge by 3.7%, while widening and vegetating ditches could reduce peak discharge by 22% (Jonczyk et al. 2008).
In-channel vegetation acts as a filter between flow leaving a field and the ditch; the ditch can still remove overland flow but at a slower rate (Eden DTC 2017).
Summary of the literature
Agricultural headwater management measures can slow flows and help trap sediment before it enters a watercourse.
Flow pathways within ditches – widening, increasing roughness and partial blockage
Widening ditches in particular locations can slow flows and help trap sediment.
The Arun and Rother Rivers Trust undertook a trial to look at the impact of widening drainage ditches to trap sediment. They found that constructing sediment traps which capture the majority of surface water run-off in a watershed is not practicable (Wright 2016).Smaller sediment traps were found to be effective in trapping a larger percentage of suspended sediments.
At Netherton Burn in north-east England, Barber (2013) designed a three-tiered sediment trap to slow the flow in the ditch, forcing suspended sediment and nutrients to be deposited in each of the storage cells. This feature was designed to overflow into the main ditch during storms and was found to slow the flood flows due to the longer/rougher flow pathway (Barber 2013).
Summary of the literature
The impact of the agricultural headwater management features on flood risk is difficult to estimate at the catchment scale.
At a catchment scale, a modelling study by Metcalfe et al. (2015) showed that such small features can easily be overwhelmed during a flood.
Flow pathways from tracks, paths and roads
Cross drains or any track or road-based drainage feature can divert flow laterally onto fields or into ponds, and have the potential to slow overland flow. However, it is difficult to quantify the impact at the headwater scale for flood reduction.
Summary of the literature
No information was found on effectiveness in different catchment types.
Effect on sedimentation and geomorphology H
Effect at different catchment scales L
Effect in different watercourse typologies L

Working with Natural Processes – Evidence Directory 116
Summary of the literature
Most agricultural headwater management features are effective at slowing and intercepting run-off as soon as they are installed.
Flow pathways within ditches – widening, increasing roughness and partial blockage
Modelling by Levasseur et al. (2012) found that the spatial configuration of the arterial drainage networks was key to the effectiveness of intercepting flow paths and reducing run-off.
Summary of the literature
Agricultural headwater management features need maintenance to ensure they are effective and long-lasting.
Flow pathways from tracks, paths and roads
Evans (2006) showed that diverting surface flows from tracks into ponds could help reduce local flooding issues, though they needed long-term management due to sediment accumulation.
Flow pathways within ditches – widening, increasing roughness and partial blockage
In non-flood conditions, drainage function is not impaired, unless the vegetation is so dense that low flow water levels are raised within the ditch (Eden DTC 2017).
Headwater peatland restoration
Although it is recognised that there may be opportunities to implement WWNP measures in lowland raised mire and fen settings, the focus of this assessment is on upland peat management techniques. It looks at 3 techniques:
vegetation management
grip blocking
gully blocking
Other techniques such as burning and grazing management are not covered here.
Summary of the literature
There is significant evidence at a range of scales that restoration techniques that replace bare peat with vegetation can reduce run-off rates through increased hydraulic roughness.
Evidence for the effectiveness of grip blocking at reducing flood risk is not consistent (Shepard et al. 2013).
Design life and effectiveness M
Maintenance requirements L/M
Effect on flood flows, peaks and storage M
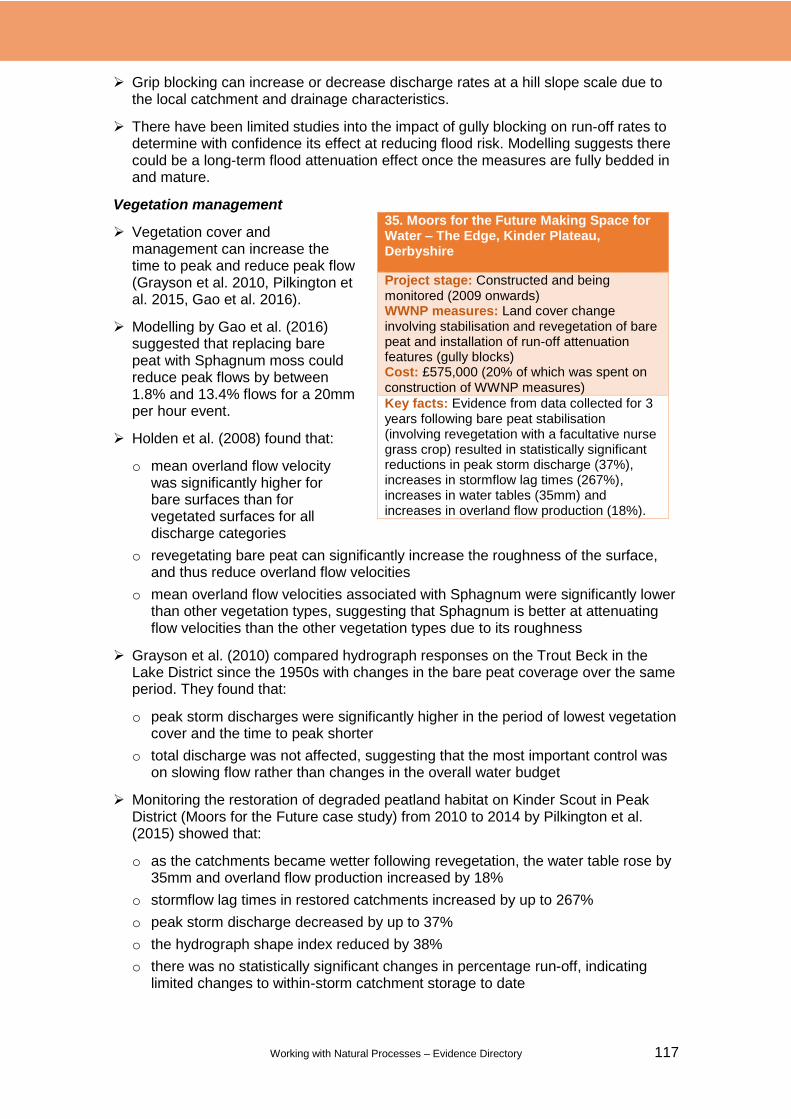
Working with Natural Processes – Evidence Directory 117
Grip blocking can increase or decrease discharge rates at a hill slope scale due to the local catchment and drainage characteristics.
There have been limited studies into the impact of gully blocking on run-off rates to determine with confidence its effect at reducing flood risk. Modelling suggests there could be a long-term flood attenuation effect once the measures are fully bedded in and mature.
Vegetation management
Vegetation cover and management can increase the time to peak and reduce peak flow (Grayson et al. 2010, Pilkington et al. 2015, Gao et al. 2016).
Modelling by Gao et al. (2016) suggested that replacing bare peat with Sphagnum moss could reduce peak flows by between 1.8% and 13.4% flows for a 20mm per hour event.
Holden et al. (2008) found that:
o mean overland flow velocity was significantly higher for bare surfaces than for vegetated surfaces for all discharge categories
o revegetating bare peat can significantly increase the roughness of the surface, and thus reduce overland flow velocities
o mean overland flow velocities associated with Sphagnum were significantly lower than other vegetation types, suggesting that Sphagnum is better at attenuating flow velocities than the other vegetation types due to its roughness
Grayson et al. (2010) compared hydrograph responses on the Trout Beck in the Lake District since the 1950s with changes in the bare peat coverage over the same period. They found that:
o peak storm discharges were significantly higher in the period of lowest vegetation cover and the time to peak shorter
o total discharge was not affected, suggesting that the most important control was on slowing flow rather than changes in the overall water budget
Monitoring the restoration of degraded peatland habitat on Kinder Scout in Peak District (Moors for the Future case study) from 2010 to 2014 by Pilkington et al. (2015) showed that:
o as the catchments became wetter following revegetation, the water table rose by 35mm and overland flow production increased by 18%
o stormflow lag times in restored catchments increased by up to 267%
o peak storm discharge decreased by up to 37%
o the hydrograph shape index reduced by 38%
o there was no statistically significant changes in percentage run-off, indicating limited changes to within-storm catchment storage to date
35. Moors for the Future Making Space for Water – The Edge, Kinder Plateau, Derbyshire
Project stage: Constructed and being monitored (2009 onwards) WWNP measures: Land cover change involving stabilisation and revegetation of bare peat and installation of run-off attenuation features (gully blocks) Cost: £575,000 (20% of which was spent on construction of WWNP measures)
Key facts: Evidence from data collected for 3 years following bare peat stabilisation (involving revegetation with a facultative nurse grass crop) resulted in statistically significant reductions in peak storm discharge (37%), increases in stormflow lag times (267%), increases in water tables (35mm) and increases in overland flow production (18%).
Working with Natural Processes – Evidence Directory 118
Grip blocking
Grip blocking restores natural drainage patterns, encourages revegetation, reduces erosion and minimises the effect of hydrological change downstream.
The Exmoor Mires project (see box) has shown a 33% reduction in peak flow from restored sites.
The pools of water created behind each dam may not have a significant amount of storage attenuation (Pumlumon case study in box), especially during storm events, since grip blocking often raises the water table. Redirection of water and changes in travel path length and time have a greater impact on flood flows.
The impact of grip blocking is usually positive with both a short-term and long-term recovery of water tables, the creation of desirable vegetation (namely Sphagnum moss) and the slow infilling of the local ponds created behind each dam (Holden et al. 2006, Holden et al. 2008, Wilson et al. 2010). However, it is less clear that there is a significant impact on downstream flood risk.
Gully blocking
Gullies are naturally occurring features of peatlands, where blanket peats spread to the heads of valleys. They also form where artificial drainage features become eroded.
Gullies are erosional features and are often aligned with the slope.
Ditch blocking in upland peatland areas is generally successful in raising the water table (<0.1m) in the immediate vicinity of the drains (LaRose et al. 1997, Worrall et al. 2007, Wilson et al. 2010), although it may not rise to the levels observed for intact peat sites (Holden et al. 2011).
Blocking gullies and encouraging vegetative cover within them may increase travel time and cause other flow paths to develop during rainfall events. This technique results in pools of water behind the features, which can contribute to additional temporary flood storage space provided the pools can drain down between events.
Summary of the literature
Headwater peatland management measures can slow flows and help trap sediment.
Effect on sedimentation and geomorphology L
37. Pumlumon Peatland restoration and floodwater management – Powys and Ceredigion, Wales
Project stage: Ongoing (2005) WWNP measures: Ditch blocking, tree planting and engagement with landowners Cost: £1.9 million
Key facts: In a 9ha area, 85 dams were installed on 2.3km of ditches, affecting the floodwater holding capacity of a 73ha catchment. In a 34ha area, 286 dams were installed on 3.4km of ditches, affecting the floodwater holding capacity of a 129ha catchment.
36. Exmoor Mires Partnership – Exmoor, Devon
Project stage: Implementation/construction (2000 onwards, 2016 ditch blocking) WWNP measures: Ditch blocking – 15,000 blocks installed by December 2016 Cost: £4.5 million
Key facts: The project aims to restore 3,000ha of peatland by 2020; to date 1,400ha have been restored. This has resulted in a 33% reduction in stormflow, leaving the restored sites equivalent to 6,630 Olympic sized swimming pools when extrapolated across the total restored area.

Working with Natural Processes – Evidence Directory 119
Summary of the literature
The impact of peatland management on flooding is difficult to estimate at the catchment scale.
Vegetation management
Research by Pilkington et al. (2015) showed that restoration slows stormwater as it moves through the catchments, attenuating flow and altering the storm hydrograph, with potential flood risk benefits downstream.
Grip blocking
The effect of grips and grip blocking on run-off is site-dependent. The orientation of grips relative to the hill slope can also mean that they intercept run-off flow paths, although the velocity of flows within grips can be higher than overland flow. As a result, grips have the potential to increase or decrease peak run-off rates at a local and catchment scale.
Lane and Milledge (2013) modelled the impacts of grips on flow hydrographs and found that the benefits of grip blocking may not translate into catchment-wide impacts. They found that the effects of grip blocking on run-off is site-dependent and relates to the orientation, density and topographic context of the grips.
Gully blocking
Pilkington et al. (2015) identified no significant effect on peak flows. However, modelling of gully blocking at Kinder Scout into the effect of upscaling this work concluded that gully blocking and vegetation restoration of 12% of the catchment would potentially reduce peak discharge by 5% for a 9km2 catchment area.
Summary of the literature
Limited information was found on the effectiveness of peatland management features in different catchment types or different geologies. This is because this suite of measures is only relevant in areas of peatland habitat.
Important! There is limited evidence of how these measures perform during extreme flood events. Caution is needed to ensure structures do not become detached.
Summary of the literature
Headwater peatland measures take time to bed in and become effective. Their effectiveness is not static, over time, soil properties change and adapt to the restoration measures with positive and negative effects on flow. Grip blocking can be effective in reducing flood peak but it is not as effective as intact peat.
Vegetation management
Modelling by Gao et al. (2016) suggested the spatial distribution of measures controls their effectiveness. Revegetation in the riparian zone and gently sloping areas are the most effective.
Effect at different catchment scales L
Effect in different watercourse typologies L
Design life and effectiveness L/M
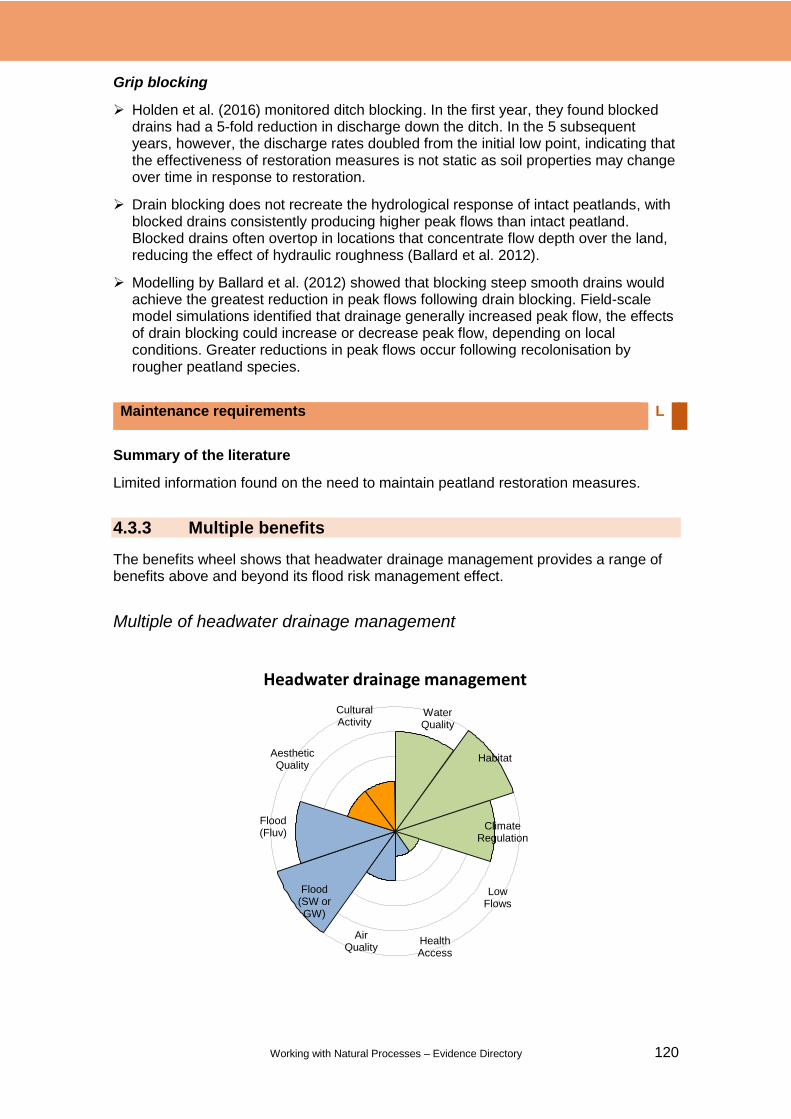
Working with Natural Processes – Evidence Directory 120
Grip blocking
Holden et al. (2016) monitored ditch blocking. In the first year, they found blocked drains had a 5-fold reduction in discharge down the ditch. In the 5 subsequent years, however, the discharge rates doubled from the initial low point, indicating that the effectiveness of restoration measures is not static as soil properties may change over time in response to restoration.
Drain blocking does not recreate the hydrological response of intact peatlands, with blocked drains consistently producing higher peak flows than intact peatland. Blocked drains often overtop in locations that concentrate flow depth over the land, reducing the effect of hydraulic roughness (Ballard et al. 2012).
Modelling by Ballard et al. (2012) showed that blocking steep smooth drains would achieve the greatest reduction in peak flows following drain blocking. Field-scale model simulations identified that drainage generally increased peak flow, the effects of drain blocking could increase or decrease peak flow, depending on local conditions. Greater reductions in peak flows occur following recolonisation by rougher peatland species.
Summary of the literature
Limited information found on the need to maintain peatland restoration measures.
4.3.3 Multiple benefits
The benefits wheel shows that headwater drainage management provides a range of benefits above and beyond its flood risk management effect.
Multiple of headwater drainage management
Headwater drainage management
Water Quality
Habitat
Climate Regulation
Low Flows
Flood (Fluv)
Flood (SW or GW)
Air Quality
Health Access
Cultural Activity
Aesthetic Quality
Maintenance requirements L

Working with Natural Processes – Evidence Directory 121
Multiple benefits summary
Environmental benefits
Water quality
Drain blocking generally improves water quality. It traps sediment, reduces levels of organic carbon, nitrates and sulphates, and decreases raw water colour production (Holden et al. 2007, Woltemade and Woodward 2008, Armstrong et al. 2010, Ross and Hammond 2015). However, increased water tables in restored peatland lead to the release of phosphorus into the soil solution, which could result in downstream pollution and eutrophication (Baum et al. 2003). Jonczyk et al. (2008, Ockenden et al. (2012) and Barber (2013) all observed that within ditch features show good reduction in phosphorus and sediment levels, leading to improvements to water quality. A number of studies have shown that increasing hydraulic roughness (such as vegetation) in ditches can reduce flood flows and improve water quality (see Whitworth 2011, The Rivers Trust 2014). On the Ripon Mitigation Option for Phosphorus and Sediment project, it was found that the 10 features reduced phosphorus and sediment levels, though it was difficult to determine the flow reduction provided (Ockenden et al. 2012). At Netherton Burn, Barber (2013) designed a three-tiered sediment trap to slow the flow in the ditch, forcing suspended sediment and nutrients to be deposited in each of the storage cells.
Habitat provision
Peat covers 1.58 million hectares, or about 7% of the land area in the UK, and is recognised as providing crucially important ecosystem services (Bonn et al. 2009). Rewetting uplands creates habitats for a range of species including specialised vegetation, fungi, birds, amphibians and water mammals. Drought-sensitive species such as aquatic invertebrates in particular benefit from a higher water table (Verberk et al. 2010). However, habitat will be lost by removing ditches, which are often rich in biodiversity (Marja and Herzon 2012). Blocking drains may also restrict fish passage. The Duchranan Farm and Eycott Hill case studies (see boxes) are examples of these measures being use to restore upland habitats.
39. Dunruchan Farm Peatland Restoration Project – Braco, Perthshire
Project stage: Constructed (2016) WWNP Measures: 762 peat dams, 10km ditch and gully reprofiling, 6 wooden sediment traps, 7 plastic dams Cost: £44,000 (£37,000 capital costs)
Key facts: This project restored 48.2ha of extensively drained upland blanket bog in the Allan Water catchment.
38. Eycott Hill Nature Reserve – Keswick, Cumbria
Project stage: Underway WWNP measures: Restoration of upland valley mire complex, blocking drainage channels, tree and scrub planting, change to extensive all year grazing, creation of wetland, river restoration and restoration of heathland Cost: £111,000
Key facts: Conservation management work aims to produce a more varied, complex mosaic of habitats that will be richer in wildlife and slow down and reduce the flow of water

Working with Natural Processes – Evidence Directory 122
Environmental benefits
Climate regulation
Peatlands are the largest carbon reserve in the UK, storing around 3 billion tonnes of carbon (Worrall and Evans 2007). They are also large stores of nitrogen (Defra 2009c). Stopping peatlands from emitting greenhouse gases, in addition to utilising their storage capacity, is particularly valuable. At a carbon price of £20 per tonne CO2e, restoring severely degraded peatland to a moderately degraded state could provide a carbon revenue of around £600 per hectare per year (Quick et al. 2013). However, the rewetting of previously drained areas can increase methane emissions if the water table is too high (van den Pol et al. 1999). Although peatland restoration can help to store carbon within the soil, rewetted peat can also increase the emissions of methane. Moxey and Moran (2014) estimated that peatland restoration could bring differential benefits of between 1 tonne and 20 tonnes of carbon dioxide per hectare per year, and depending on the value of carbon.
Low flows
Headwater drainage management measures can reduce fluctuations in groundwater level close to surface water such as rivers, while raising the water table to a higher, constant level further from rivers (Krause et al. 2007). Although restoration by ditch blocking can result in a relatively successful water table recovery, there may not be the full reinstatement of peatland hydrological processes (Wallage and Holden 2010).
Social benefits
Health access
Uplands are popular destinations for visitors. Visits are likely to include some form of physical exercise, with a visitor survey in the Peak District National Park showing that the main activity undertaken was walking (87% of visitors).
Some 59% of those surveyed claimed that they had visited for the tranquillity (Davies 2006), potentially contributing to positive mental health. Improving the landscape is likely to increase the number of visitors partaking in health-promoting activities. Amenities such as boardwalks may be needed to maintain access after rewetting areas.
Air quality
Land and headwater drainage management can significantly improve air quality through carbon sequestration. The combined created sink and avoided loss by gully/grip blocking could equate to 64–135 tonnes carbon per km2 per year (Evans et al. 2005). However, management of the water table level is essential. If it is too high, methane emissions go up, if it is too low, carbon dioxide emissions go up (van den Pol et al. 1999).
Restoring uplands also reduces the risk of uncontrolled moorland fires, which are sources of localised air pollution.
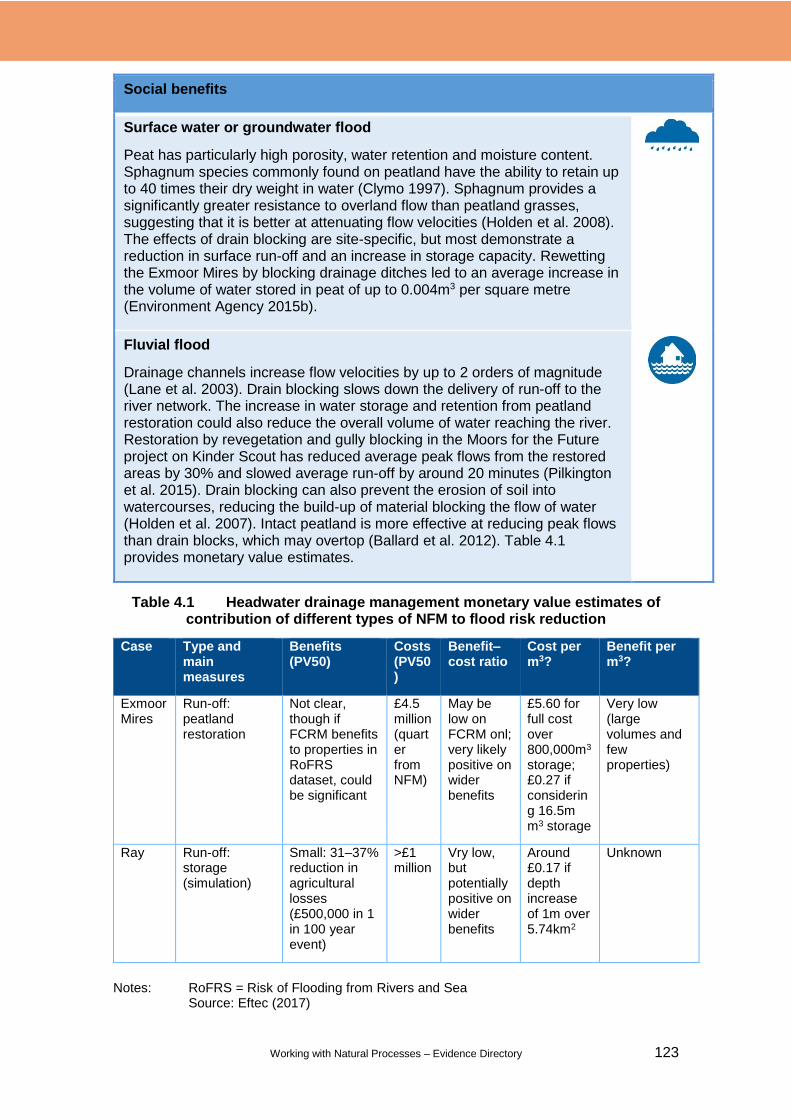
Working with Natural Processes – Evidence Directory 123
Social benefits
Surface water or groundwater flood
Peat has particularly high porosity, water retention and moisture content. Sphagnum species commonly found on peatland have the ability to retain up to 40 times their dry weight in water (Clymo 1997). Sphagnum provides a significantly greater resistance to overland flow than peatland grasses, suggesting that it is better at attenuating flow velocities (Holden et al. 2008). The effects of drain blocking are site-specific, but most demonstrate a reduction in surface run-off and an increase in storage capacity. Rewetting the Exmoor Mires by blocking drainage ditches led to an average increase in the volume of water stored in peat of up to 0.004m3 per square metre (Environment Agency 2015b).
Fluvial flood
Drainage channels increase flow velocities by up to 2 orders of magnitude (Lane et al. 2003). Drain blocking slows down the delivery of run-off to the river network. The increase in water storage and retention from peatland restoration could also reduce the overall volume of water reaching the river. Restoration by revegetation and gully blocking in the Moors for the Future project on Kinder Scout has reduced average peak flows from the restored areas by 30% and slowed average run-off by around 20 minutes (Pilkington et al. 2015). Drain blocking can also prevent the erosion of soil into watercourses, reducing the build-up of material blocking the flow of water (Holden et al. 2007). Intact peatland is more effective at reducing peak flows than drain blocks, which may overtop (Ballard et al. 2012). Table 4.1 provides monetary value estimates.
Table 4.1 Headwater drainage management monetary value estimates of contribution of different types of NFM to flood risk reduction
Case Type and main measures
Benefits (PV50)
Costs (PV50)
Benefit–cost ratio
Cost per m3?
Benefit per m3?
Exmoor Mires
Run-off: peatland restoration
Not clear, though if FCRM benefits to properties in RoFRS dataset, could be significant
£4.5 million (quarter from NFM)
May be low on FCRM onl; very likely positive on wider benefits
£5.60 for full cost over 800,000m3 storage; £0.27 if considering 16.5m m3 storage
Very low (large volumes and few properties)
Ray Run-off: storage (simulation)
Small: 31–37% reduction in agricultural losses (£500,000 in 1 in 100 year event)
>£1 million
Vry low, but potentially positive on wider benefits
Around £0.17 if depth increase of 1m over 5.74km2
Unknown
Notes: RoFRS = Risk of Flooding from Rivers and Sea
Source: Eftec (2017)
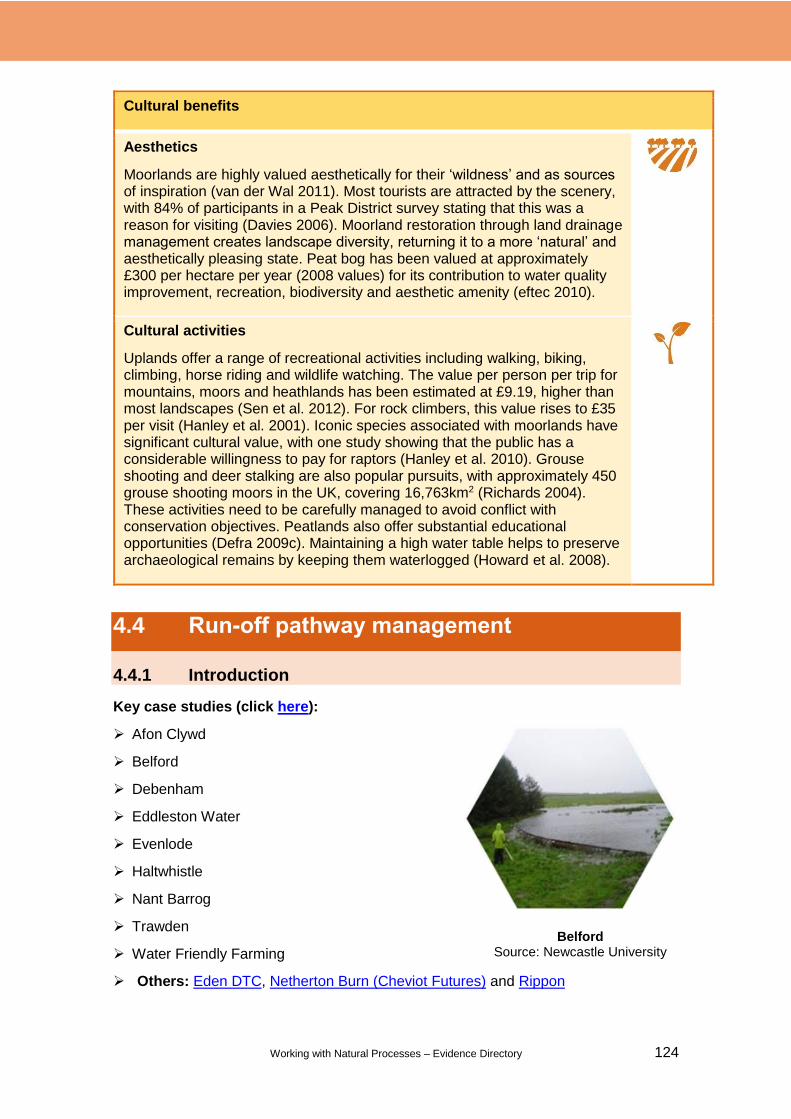
Working with Natural Processes – Evidence Directory 124
Cultural benefits
Aesthetics
Moorlands are highly valued aesthetically for their ‘wildness’ and as sources of inspiration (van der Wal 2011). Most tourists are attracted by the scenery, with 84% of participants in a Peak District survey stating that this was a reason for visiting (Davies 2006). Moorland restoration through land drainage management creates landscape diversity, returning it to a more ‘natural’ and aesthetically pleasing state. Peat bog has been valued at approximately £300 per hectare per year (2008 values) for its contribution to water quality improvement, recreation, biodiversity and aesthetic amenity (eftec 2010).
Cultural activities
Uplands offer a range of recreational activities including walking, biking, climbing, horse riding and wildlife watching. The value per person per trip for mountains, moors and heathlands has been estimated at £9.19, higher than most landscapes (Sen et al. 2012). For rock climbers, this value rises to £35 per visit (Hanley et al. 2001). Iconic species associated with moorlands have significant cultural value, with one study showing that the public has a considerable willingness to pay for raptors (Hanley et al. 2010). Grouse shooting and deer stalking are also popular pursuits, with approximately 450 grouse shooting moors in the UK, covering 16,763km2 (Richards 2004). These activities need to be carefully managed to avoid conflict with conservation objectives. Peatlands also offer substantial educational opportunities (Defra 2009c). Maintaining a high water table helps to preserve archaeological remains by keeping them waterlogged (Howard et al. 2008).
4.4 Run-off pathway management
4.4.1 Introduction
Key case studies (click here):
Afon Clywd
Belford
Debenham
Eddleston Water
Evenlode
Haltwhistle
Nant Barrog
Trawden
Water Friendly Farming
Others: Eden DTC, Netherton Burn (Cheviot Futures) and Rippon
Belford Source: Newcastle University
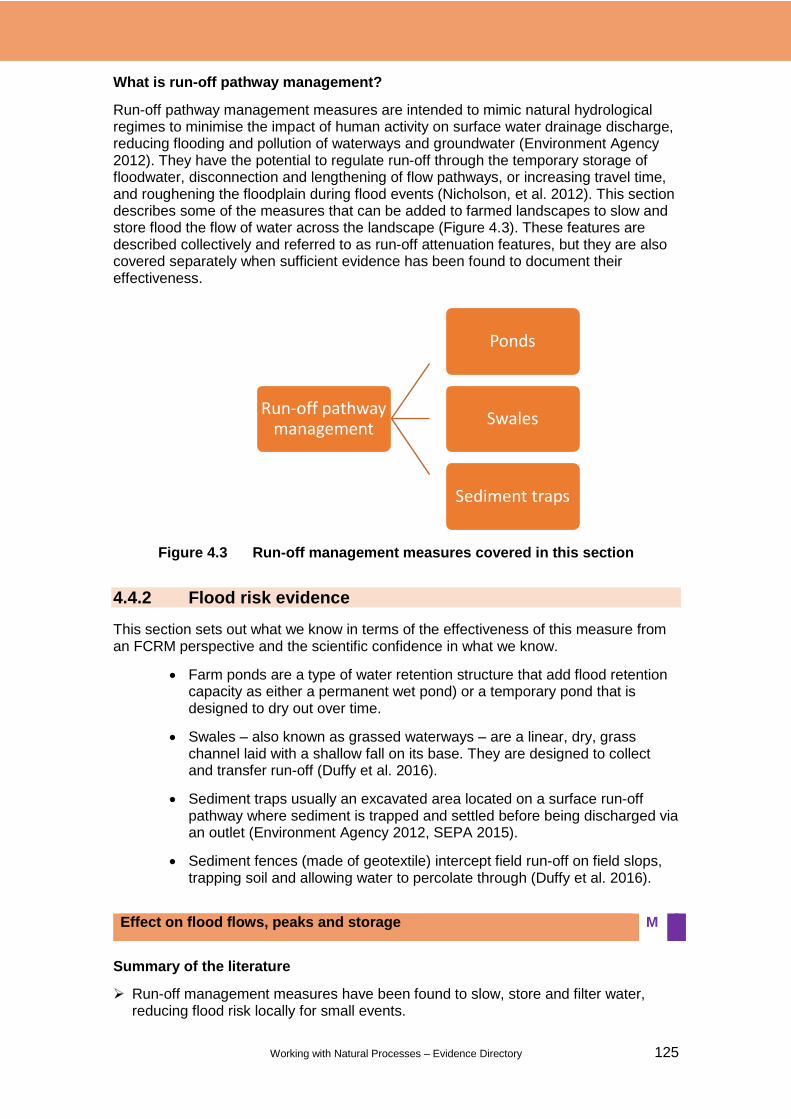
Working with Natural Processes – Evidence Directory 125
What is run-off pathway management?
Run-off pathway management measures are intended to mimic natural hydrological regimes to minimise the impact of human activity on surface water drainage discharge, reducing flooding and pollution of waterways and groundwater (Environment Agency 2012). They have the potential to regulate run-off through the temporary storage of floodwater, disconnection and lengthening of flow pathways, or increasing travel time, and roughening the floodplain during flood events (Nicholson, et al. 2012). This section describes some of the measures that can be added to farmed landscapes to slow and store flood the flow of water across the landscape (Figure 4.3). These features are described collectively and referred to as run-off attenuation features, but they are also covered separately when sufficient evidence has been found to document their effectiveness.
Figure 4.3 Run-off management measures covered in this section
4.4.2 Flood risk evidence
This section sets out what we know in terms of the effectiveness of this measure from an FCRM perspective and the scientific confidence in what we know.
Farm ponds are a type of water retention structure that add flood retention capacity as either a permanent wet pond) or a temporary pond that is designed to dry out over time.
Swales – also known as grassed waterways – are a linear, dry, grass channel laid with a shallow fall on its base. They are designed to collect and transfer run-off (Duffy et al. 2016).
Sediment traps usually an excavated area located on a surface run-off pathway where sediment is trapped and settled before being discharged via an outlet (Environment Agency 2012, SEPA 2015).
Sediment fences (made of geotextile) intercept field run-off on field slops, trapping soil and allowing water to percolate through (Duffy et al. 2016).
Summary of the literature
Run-off management measures have been found to slow, store and filter water, reducing flood risk locally for small events.
Effect on flood flows, peaks and storage M
Run-off pathway management
Ponds
Swales
Sediment traps

Working with Natural Processes – Evidence Directory 126
Run-off pathway management measures have been found to have a positive flood risk management benefit especially at source within hours of the flow being generated (Verstraeten and Posen 1999, Heathwaite et al. 2005, Evrard et al. 2007, Quinn et al. 2007a, Biggs et al. 2016).
Observed and modelled evidence from Belford
A suite of run-off attenuation features have been installed In the Belford catchment (6km2) (see box).
A pilot run-off attenuation feature, constructed using permeable timber barriers, diverts peak flow from the stream using a control structure. It stores approximately 800m3 of water during a storm event and takes ~8–12 hours to drain from full to empty. The effectiveness of this attenuation process can be seen in the stream flow characteristics (Wilkinson and Quinn 2010).
During high magnitude storm events, the flow diverted into the pilot run-off attenuation features from the stream can be as much as 15% (Nicholson 2014) and it can be attenuated within the feature for approximately 8 hours (Wilkinson et al. 2010b).
Research by Wilkinson et al. (2010a) enabled the Belford run-off attenuation features to be modified so that water could drain from them faster in order to accommodate a double peaked storm event. Empirical evidence is needed to establish if this has been effective.
The results of the pilot run-off attenuation feature in the Belford catchment indicated that it increased the travel time of the peak from 20 to 35 minutes, compared with the peak flows before construction (Wilkinson et al. 2010b).
This research demonstrates a significant reduction in peak overland flow (>50%) generated in the small contributing area preceding the dry retention pond (Nicholson 2014).
Locally these types of measures can be used target and reduce risk across overland flow paths (Nicholson 2014).
The storage capacity of the RAFs is small, but they have an attenuation effect on the flood hydrograph (Wilkinson et al. 2010b).
Modelling evidence
The Eddleston Water case study (see box) has a large network of measures that have been instrumented and there is confidence they are altering flow rates (Spray 2017). As part of the same study, initial model results suggested that a series of larger ponds on the floodplain could reduce the discharge peak by 19–20% and delay the peak flow by up to 6 hours for a 1.5 year return interval flow event.
The Water Friendly Farming work at Loddington (10km2 catchments of Eye Brook and Stonton Brook) (see box) modelled the performance of the existing features and
16. Belford NFM scheme – Northumberland
Project stage: Completed (2015) WWNP measures: Field ponds, overland flow disconnection, flow diversion structures, leaky dams, offline floodplain storage, online ditch management features, wooden screens and large wood dams Cost: £450,000
Key facts: Monitored evidence from Belford shows the impact of individual features during a range of storm events. Belford flooded 7 times between 1997 and 2007. Since the project reached 35 constructed runoff attenuation features (amounting to ~8,000m³ storage), only one property has been impacted by flooding. There are now a total of 45 features (amounting to ~12,000m³ storage).
Working with Natural Processes – Evidence Directory 127
found that, by installing more features such as permeable dams, there is the potential to reduce the 1 in 100 year flood peak by 20% (Biggs et al. 2016).
Two studies in north Wales (Afon Clywd and Nant Barrog – see boxes) modelled the impact of a range of WWNP solutions and found:
o Afon Clywd – a reduction in peak flow and increase in time to peak
o Nant Barrog – flooding remains in-channel during a 1 in 50 year event once WWNP measures are implemented
Ponds
A modelling exercise by Heathwaite et al. (2005) found that small ponds which store overland flow temporarily at the bottom of a field were very effective in reducing overland flow following storm events.
At the Nafferton Farm, Quinn et al. (2007a) showed that ponds, barriers and bunds can physically store large amounts of run-off, helping to slow flow and so creating transient storage. However, there is currently no supporting quantitative evidence.
Swales
There are limited peer-reviewed papers that show rural swales reduce flood risk.
Evrard et al. (2007) modelled the effect of a 12ha of grassed swale in a small rural catchment in Belgium and found a reduction in the peak discharge and total run-off volume by 50% (0.5m3s-1 instead of 1.0m3s-1) and 40% respectively (2,651 m3 instead of 4,586 m3), while the lag time increased by 16%.
33. Water Friendly Farming – Loddington, Leicestershire
Project stage: Constructed (2012), being monitored WWNP measures: Leaky dams, field edge wetlands and improved soil management Cost: £2 million (construction of WWNP measures 20% total cost)
Key facts: In a 10km2 catchment, ~30,000m3 of temporary storage has been installed. Modelling indicates it could reduce the 1 in 100 year flood peak by 20%.
9. Eddleston Water – Scottish Borders
Project stage: Constructed (2016) – now monitoring WWNP measures: Wide range of NFM measures across catchment Cost: £1.4 million
Key facts: ‘bad’ to ‘moderate’ status under the WFD. Modelling indicates that floodplain roughness could be the most effective means of flood management, with peak flows reduced by up to 23% when combined with the enhanced storage and infiltration.
40. Afon Clywd – Vale of Clwyd, Denbighshire/Flint, north Wales
Project stage: Pending implementation WWNP measures: Dam storage, gully planting and land use management Cost: To be confirmed
Key facts: Modelling shows a peak flow reduction of 6% for the 5 year design event and 1% for the 200 year design event.
41. Nant Barrog – Llanfair Talhaiarn, Conwy, North Wales
Project stage: Pending implementation WWNP measures: river restoration, tree belts, woody dams, gully planting, storage areas Cost: To be confirmed
Key facts: Water Street culvert has an inlet capacity of 4.2m3s-1; flooding will occur at a 1 in 50 year event (4.8m3s-1). Modelling of NFM shows sufficient reductions would occur at the 1 in 50 year event to retain flow in channel
Working with Natural Processes – Evidence Directory 128
Sediment traps
The effectiveness and performance of sediment traps are not well-documented in regard to their ability to reduce flood risk. Theoretically, sediment traps could act as another form of flood attenuation. However, there is no peer-reviewed evidence which suggests they can attenuate peak flows.
The bunds and barriers around sediment traps could increase their effectiveness from a flood risk management perspective (Biggs et al. 2016), as they increase the roughness of the land slowing travel time, enable water to pond and be stored.
Sediment traps can attenuate peak flows due to the volume of the detention trap volume but once the trap is filled there is minimal impact on flows (Environment Agency 2012).
It has been suggested that if sediment traps target known overland flow pathways, they can disrupt and attenuate overland flow, slowing the time taken for the water to reach the channel and potentially reducing the flood peak (Wilkinson et al. 2010b, Owen et al. 2012).
Summary of the literature
These measures trap fine sediment, reducing the amount that enters watercourses. There is limited evidence to demonstrate the flood risk benefits of this, though it may improve conveyance and reduce the need for in-channel maintenance.
Ponds
There is limited literature available to determine how farm ponds can increase flood storage in the landscape or increase travel time to surface water bodies.
Swales
Evrard et al. (2008) undertook monitoring in the same study area as described above which showed that:
o sediment discharge was reduced by 93%
o peak discharge (per hectare) was reduced by 69% between the upstream and the downstream extremities of the grassed waterway
o the sediment yield and sediment transfer decreased dramatically, reducing the damage costs associated with muddy floods in the study area
Sediment traps
Sediment traps are unlikely to provide significant flooding benefits on their own. In conjunction with other run-off management features, however, they can help to control the release of sediment to the river network and maintain the capacity of rivers to convey floodwaters (Environment Agency 2012, SEPA 2015).
Evidence from the Eden Demonstration Test Catchment (DTC) monitoring results shows that the attenuation of overland flow in sediment traps increased the time taken for water to reach the channel and could potentially reduce the flood peak (Owen et al. 2012).
Effect on sedimentation and geomorphology M

Working with Natural Processes – Evidence Directory 129
Summary of the literature
The evidence that individual run-off pathway management measures operate efficiently during the peak of storms is uncertain.
The run-off attenuation feature approach (see Quinn et al. 2013) advocates the use of many features located throughout the landscape, with the benefits accrued by the network of features rather than one large-scale or dominant measure (Nicholson et al. 2012).
Run-off management measures have been found to slow, store and filter water, reducing flood risk locally for small events. However, this evidence has yet to demonstrate their benefits for bigger flood events at larger catchment scales.
Results for the Belford (5km2 catchment) show that a well-designed feature can operate as designed in the field and that there is potential to use such features, or clusters of features to reduce flood risk. Important! More research is needed to understand their benefits across larger catchments and during larger storm events, and any potential negative effects such as peak synchronisation (Quinn et al. 2013).
The Debenham and Evenlode case studies (see boxes) are catchment-based examples which, as they develop, will help to bridge our knowledge around the effectiveness of different measures across different spatial scales. Modelling for the Debenham project, suggests that, for a 1 in 10 and 1 in 20 year flood events, installing WWNP features has the potential to reduce the risk of flooding to as many as 24 properties.
Ponds
Modelling by McIntyre et al. (2012) of the Parrett catchment found a 1% coverage of ponds in a catchment is needed for a significant (modest) impact on surface run-off.
At Belford, Quinn et al. (2007a) determined that much larger ponds, or larger numbers of ponds, would be required to increase the effectiveness of ponds at reducing flood risk during storms.
Scaled up, approximately 20,000m3 of storage would be required to be an effective form of flood risk management (for the smallest floods) for a catchment the size of Belford (Nicholson et al. 2012).
Effect at different catchment scales L
43. Evenlode NFM and WFD Project – Milton-under-Wychwood, Oxfordshire
Project stage: Consultation and design (2016 to 2021) WWNP measures: Likely to include river floodplain reconnection, tree planting, run-off interception, online and offline storage, and track runoff management. Cost: £480,000 at present
Key facts: The Environment Agency is working with partners to develop a 5 year project that integrates Water Framework Directive requirements with an NFM demonstration scheme. A tributary catchment (16.3km2) trial has been set up in the Littlestock Brook.
42. Debenham Flood Storage Options – Debenham, Suffolk
Project stage: Modelling and business case development (2016 to 2017) WWNP measures: To be confirmed; will include ~10 NFM features Cost: Not yet constructed
Key facts: Modelling has shown that installing 10 NFM features could provide 34,250m3 of storage across 3 subcatchments (~34km2) which drain into Debenham, reducing the annual average damages to properties and farmland by 31%.

Working with Natural Processes – Evidence Directory 130
At the catchment scale, Wilkinson and Quinn (2010) emphasised the need to understand the effectiveness of the mitigation measures. It is important to characterise the catchment pre-, during and post-change. A long period of background data before installation of WWNP measures would be ideal.
Swales and sediment traps
No information was found.
Summary of the literature
No information was found on the effectiveness of run-off attenuation features in different catchment types. The Debenham and Evenlode case studies (see boxes above) are catchment-based examples that will help expand understanding of the effectiveness of WWNP measures in lowland catchments.
Important! There is limited evidence of how these measures perform during extreme flood events. A great deal of caution is needed when designing them to ensure that any associated infrastructure (e.g. containment bunds, inlets, outlets and spillways) are robustly designed and do not impact public safety.
Summary of the literature
Run-off attenuation features are effective as soon as they are installed.
Nicholson et al. (2012) noted that to have a flood risk benefit, the storage area within the features needs to be available during times of peak flow.
Ponds
To maximise the effectiveness of the run-off pathway management measures, the measures should be located in areas of high surface connectivity or areas where the river and floodplain are able to interact (Nicholson et al. 2012).
In the Zwettl/Kamp catchment in Austria, microponds were used to manage hill slope run-off (CRUE 2008). Unlike ponds, microponds do not have an outflow but instead drain slowly via percolation into the soil. The lack of outflow means that the microponds are ineffective if 2 storms occur in rapid succession. This can be counteracted by installing many microponds across the whole catchment.
Summary of the literature
Run-off pathway management measures need long-term maintenance to be effective.
The need for sediment removal can depend on many factors including the characteristics of the catchment, soil health and the size of the run-off pathway management measure.
Maintenance usually involves sediment removal for farm ponds, drainage pipes, sediment traps and swales (Newcastle University and Environment Agency 2011, Duffy et al. 2016).
Effect in different watercourse typologies L
Design life and effectiveness H
Maintenance requirements M

Working with Natural Processes – Evidence Directory 131
Other maintenance such as vegetation and fence management, and regular inspection of measures for eroded or damaged areas may also be needed (Newcastle University and Environment Agency 2011, Environment Agency 2012, Duffy et al. 2016).
The Haltwhistle Burn case study (see box) is an example of a multiobjective WWNP project where citizen science is being used to help monitor the effectiveness of the measures used. Monitoring the performance of these features will help to establish more information around long-term maintenance requirements.
Ponds
Farm ponds require regular maintenance to ensure sedimentation remains at a low level, depending on the rate of sediment influx and the size of the ponds. In the Rippon project, it was anticipated that farm ponds would need to be dredged after 5–10 years, depending on the size and sediment load (Deasy et al. 2010).
Verstraeten and Posen (1999) stated that, as a result of capturing sediment, retention ponds gradually fill and their water retention capacity is diminished. Consequently, the pond may not be able to store the run-off from an event for which it was constructed (Verstraeten and Posen 1999). These results highlight the need for maintenance of these pond features to remain effective.
The mean cost of more than 100 retention ponds constructed for the study in central Belgium was €380,000, with an annual maintenance cost of €1.5 million for regular dredging (Verstraeten and Poesen 1999).
Research by Fiener et al. (2005) found that dry ponds needed dredging after the first year; this was low cost using on-farm machinery at low costs. The small, earth dammed detention ponds established at field borders were inspected regularly to identify any weaknesses. They also found that a reduction in peak run-off rates and low maintenance costs could only be achieved if regular siltation of the ponds was prevented through effective soil conservation in the watershed.
Swales
Fiener and Auerswald (2006) found that swales that had not been subject to maintenance for 9 years could reduce sediment delivery (by 90–100%) as well as run-off from a rural catchment more effectively than if the swale was managed.
Sediment traps
No information was found on the maintenance of sediment traps. However, it is anticipated that they do require maintenance in order to remove accumulated sediment to retain their storage capacity.
44. Haltwhistle Burn: a catchment approach to headwater run-off and pollution – Haltwhistle, Northumberland
Project stage: Constructed (2015) WWNP measures: River floodplain restoration, bank/road/footpath erosion protection, fish passage, wetland, 10 leaky dams, sediment traps and tree planting, forest/urban drainage measures, flood monitoring/fixed point photography Cost: £363,000 (90% cost relates to construction of WWNP measures)
Key facts: This project has taken a total catchment approach to improving water quality and reducing flood flows. A citizen science approach to catchment monitoring means this project has been able to obtain a large number of observations in and around the Haltwhistle Burn catchment
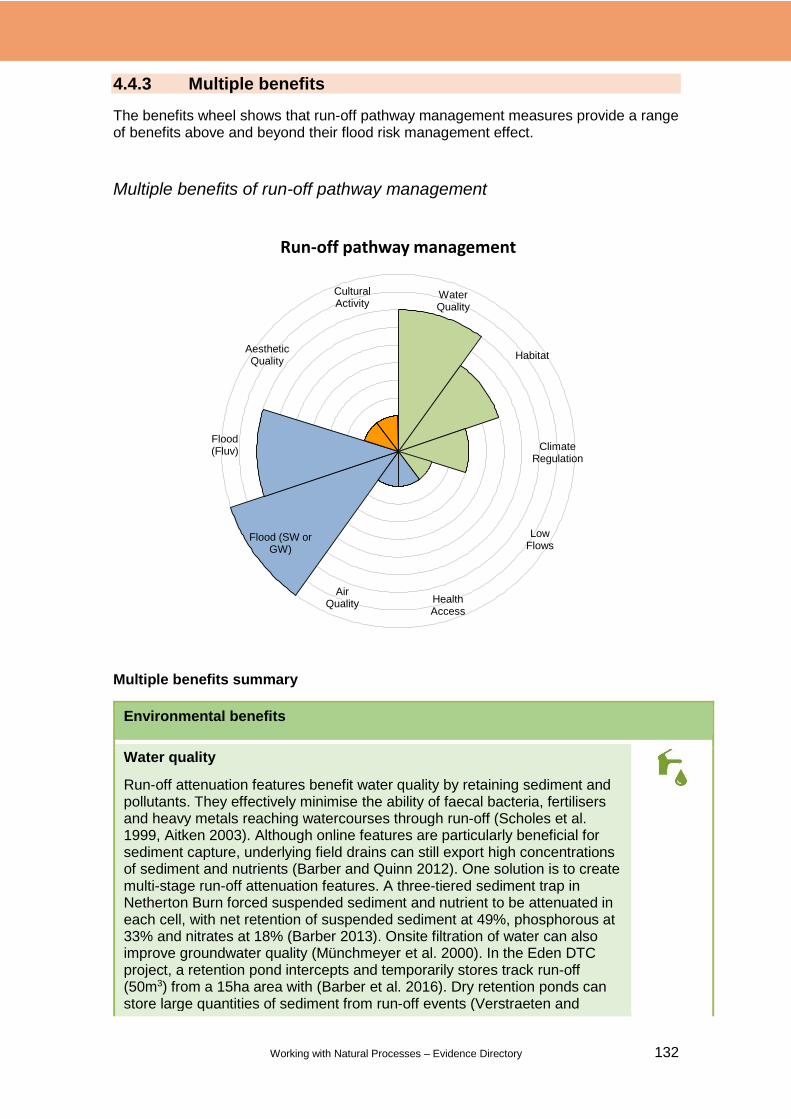
Working with Natural Processes – Evidence Directory 132
4.4.3 Multiple benefits
The benefits wheel shows that run-off pathway management measures provide a range of benefits above and beyond their flood risk management effect.
Multiple benefits of run-off pathway management
Multiple benefits summary
Environmental benefits
Water quality
Run-off attenuation features benefit water quality by retaining sediment and pollutants. They effectively minimise the ability of faecal bacteria, fertilisers and heavy metals reaching watercourses through run-off (Scholes et al. 1999, Aitken 2003). Although online features are particularly beneficial for sediment capture, underlying field drains can still export high concentrations of sediment and nutrients (Barber and Quinn 2012). One solution is to create multi-stage run-off attenuation features. A three-tiered sediment trap in Netherton Burn forced suspended sediment and nutrient to be attenuated in each cell, with net retention of suspended sediment at 49%, phosphorous at 33% and nitrates at 18% (Barber 2013). Onsite filtration of water can also improve groundwater quality (Münchmeyer et al. 2000). In the Eden DTC project, a retention pond intercepts and temporarily stores track run-off (50m3) from a 15ha area with (Barber et al. 2016). Dry retention ponds can store large quantities of sediment from run-off events (Verstraeten and
Run-off pathway management
Water Quality
Habitat
Climate Regulation
Low Flows
Flood (Fluv)
Flood (SW or GW)
Air Quality Health
Access
Cultural Activity
Aesthetic Quality
Working with Natural Processes – Evidence Directory 133
Environmental benefits
Poesen 1999, 2000). Grass swales remove particulate-associated contaminants by sedimentation, filtration through the grass lining of the swale, and adsorption onto soil particles upon infiltration (Charlesworth et al. 2003). Ellis (1992) found that a swale 30–60m in length can retain 60–70% of solids and 30–49% of metals, hydrocarbons and bacteria. Sediment traps trap sediment by intercepting overland flow pathways and temporarily detaining the flow to allow sediment to settle out before the run-off is discharged (Environment Agency 2012). In the Eden DTC, sediment traps were found to accumulate annually 263kg per hectare of sediment, 1.2kg per hectare of total phosphorous and 2.9kg per hectare of total nitrogen with a storage volume of 100m3 (2 sediment traps) from a contributing area of 1.9ha (Barber et al. 2016).
Habitat provision
Ponds are NERC Act priority habitats. In England, ponds support more of NERC Act priority species than lakes, and a similar number to streams, rivers and floodplains combined (UK National Ecosystem Services Assessment 2014). Biodiversity is rich in ponds because they are both intrinsically productive and environmentally heterogeneous. A study of temporary ponds found that 75% supported at least one uncommon species (Nicolet et al. 2004).
Ponds provide habitats for a range of aquatic mammals, amphibians and invertebrates, as well as farmland birds (Sayer et al. 2012, Davies et al. 2016). They need to be well-designed and managed to stop them becoming overrun by vegetation and sediment.
Climate regulation
Deposition of organic material in ponds is an important part of the carbon budget (van der Wal 2011). A study found that organic carbon stored in pond sediments is highest in uncompacted sediments in permanent ponds with extensive natural vegetation (approximately 10% organic carbon), and lowest in sediments in ponds in arable or pasture fields (approximately 3% organic carbon) and in adjacent soil controls (approximately 3% organic carbon) (Gilbert et al. 2014). The Trawden case study (see box) is an example of where WWNP is being considered as a means of making a catchment more resilient to the impacts of climate change.
45. Trawden NFM study – Trawden, Lancashire
Project stage: Scoping (2016 to 2017) WWNP measures: To be confirmed Cost: £95,000
Key facts: The results of the scoping study were published in summer 2017. Key questions are whether it will be possible to reduce flood risk to Trawden through NFM alone, or in combination with a proposed traditional capital scheme, or whether it will be necessary to add climate change resilience to a traditional capital scheme. Landscape scale geomorphological assessment of the Trawden catchment has identified over 150 potential NFM measures.
Working with Natural Processes – Evidence Directory 134
Environmental benefits
Low flows
Permanent and online run-off attenuation features provide water storage areas for times of drought. They also promote infiltration, enabling groundwater recharge.
Social benefits
Health access
The health benefits derived from run-off attenuation features depend on the level of public access, which may be restricted on agricultural land. Research has found that the presence of water is associated with tranquillity and therapeutic benefits, suggesting that creating additional water features such as ponds could enhance the mental health benefits of the natural environment (Research Box 2009).
Air quality
Run-off attenuation features can sequester carbon, particularly if they include permanent ponds. They may also reduce the dust produced from windblown soil erosion. However, there is little evidence specifically focusing on the benefits of run-off attenuation features to air quality.
Surface water or groundwater flood
Run-off attenuation features can be designed to intercept and store overland flow during intense rainfall. An overland flow interception bund at Belford reduced peak run-off flow from an 11ha catchment by over 50% in an extreme run-off event, with 91kg per hectare of sediment deposited (Palmer 2012, Nicholson 2014). Microponds have been used to successfully manage hill slope run-off, providing storage capacity and enabling water to slowly percolate into the ground. However, their small size means that it is necessary to have thousands within a catchment to attenuate run-off, and they are ineffective for multiple extreme rainfall events in quick succession due to the lack of outlet flow (CRUE 2008).
Fluvial flood
Offline run-off attenuation features such as temporary ponds are generally more effective than online run-off attenuation features at attenuating flood peaks, as they disconnect flow pathways and provide storage capacity. Run-off ponds are effective in reducing downstream discharge and sediment discharge (Evrard et al. 2008). However, they need careful management as they can eventually fill up with sediment, decreasing storage capacity (Verstraeten and Posen 1999). Catchment level modelling in Pontbren in mid-Wales has shown that careful placement of storage ponds, along with other measures including buffer strips and grassland, can significantly reduce the magnitude of peak run-off (Wheater et al. 2008). Table 4.2 provides monetary value estimates of the contribution of different types of WWNP to flood risk reduction.
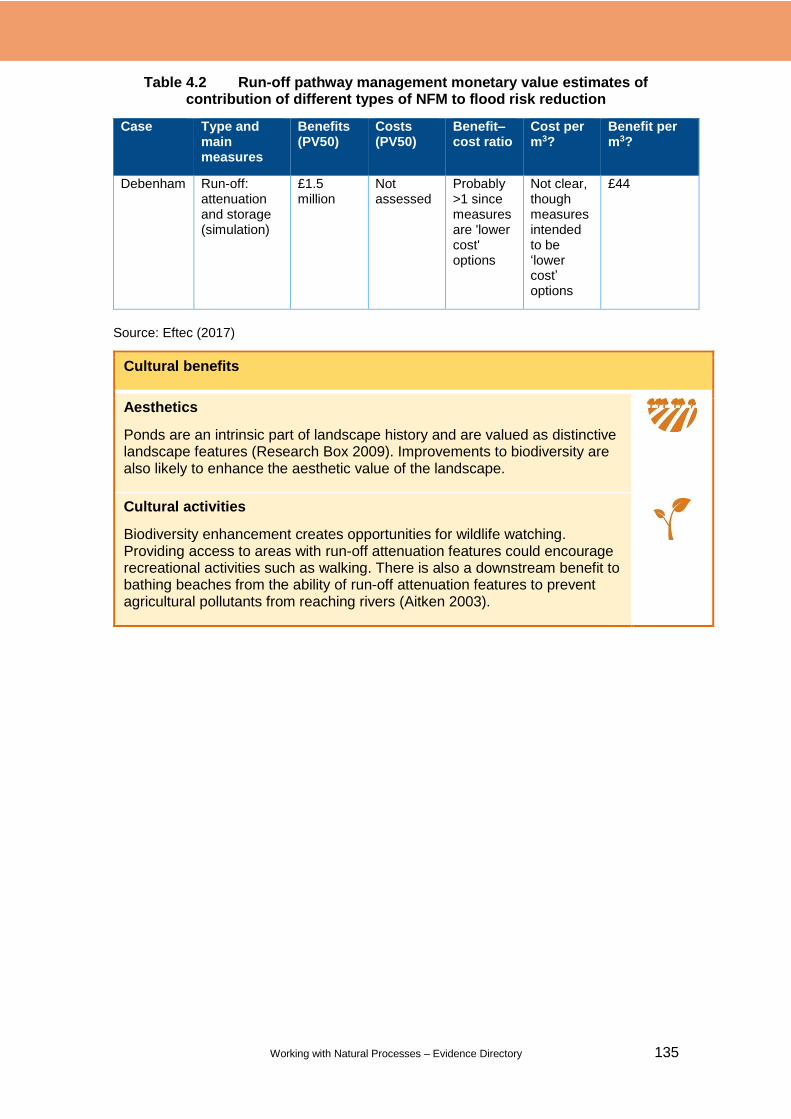
Working with Natural Processes – Evidence Directory 135
Table 4.2 Run-off pathway management monetary value estimates of contribution of different types of NFM to flood risk reduction
Case Type and main measures
Benefits (PV50)
Costs (PV50)
Benefit–cost ratio
Cost per m3?
Benefit per m3?
Debenham Run-off: attenuation and storage (simulation)
£1.5 million
Not assessed
Probably >1 since measures are 'lower cost' options
Not clear, though measures intended to be ‘lower cost’ options
£44
Source: Eftec (2017)
Cultural benefits
Aesthetics
Ponds are an intrinsic part of landscape history and are valued as distinctive landscape features (Research Box 2009). Improvements to biodiversity are also likely to enhance the aesthetic value of the landscape.
Cultural activities
Biodiversity enhancement creates opportunities for wildlife watching. Providing access to areas with run-off attenuation features could encourage recreational activities such as walking. There is also a downstream benefit to bathing beaches from the ability of run-off attenuation features to prevent agricultural pollutants from reaching rivers (Aitken 2003).
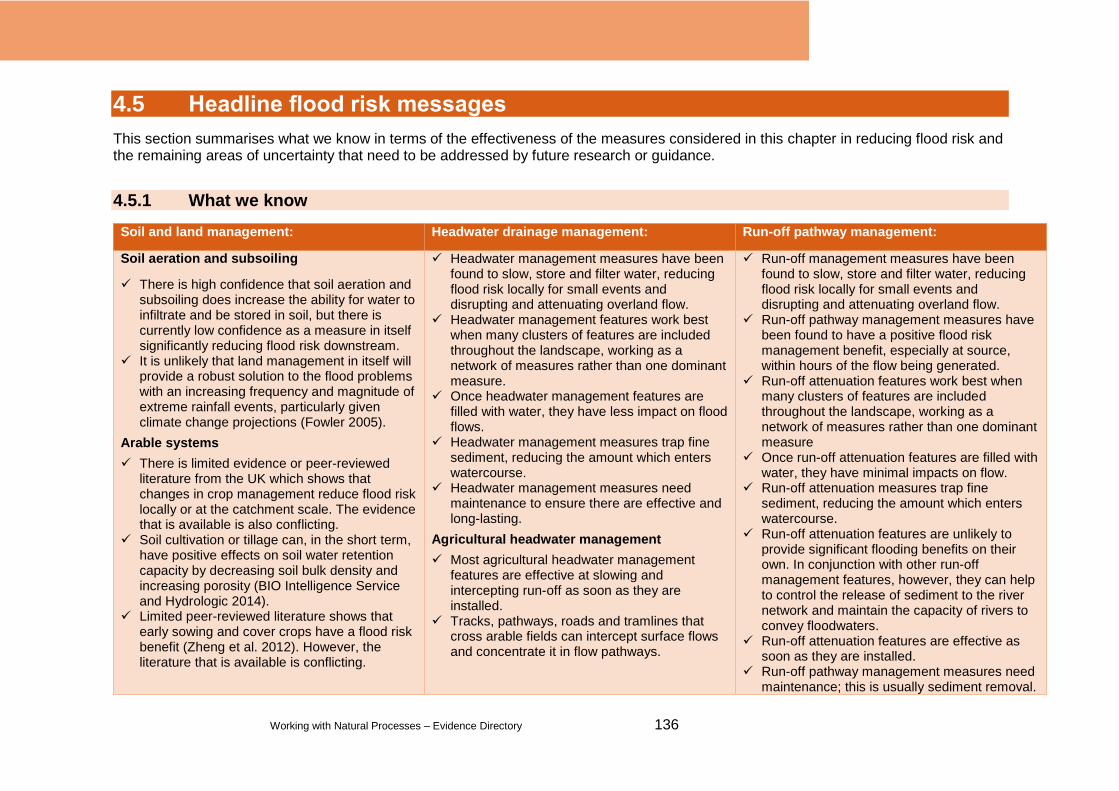
Working with Natural Processes – Evidence Directory 136
4.5 Headline flood risk messages
This section summarises what we know in terms of the effectiveness of the measures considered in this chapter in reducing flood risk and the remaining areas of uncertainty that need to be addressed by future research or guidance.
4.5.1 What we know
Soil and land management: Headwater drainage management: Run-off pathway management:
Soil aeration and subsoiling
There is high confidence that soil aeration and subsoiling does increase the ability for water to infiltrate and be stored in soil, but there is currently low confidence as a measure in itself significantly reducing flood risk downstream.
It is unlikely that land management in itself will provide a robust solution to the flood problems with an increasing frequency and magnitude of extreme rainfall events, particularly given climate change projections (Fowler 2005).
Arable systems
There is limited evidence or peer-reviewed literature from the UK which shows that changes in crop management reduce flood risk locally or at the catchment scale. The evidence that is available is also conflicting.
Soil cultivation or tillage can, in the short term, have positive effects on soil water retention capacity by decreasing soil bulk density and increasing porosity (BIO Intelligence Service and Hydrologic 2014).
Limited peer-reviewed literature shows that early sowing and cover crops have a flood risk benefit (Zheng et al. 2012). However, the literature that is available is conflicting.
Headwater management measures have been found to slow, store and filter water, reducing flood risk locally for small events and disrupting and attenuating overland flow.
Headwater management features work best when many clusters of features are included throughout the landscape, working as a network of measures rather than one dominant measure.
Once headwater management features are filled with water, they have less impact on flood flows.
Headwater management measures trap fine sediment, reducing the amount which enters watercourse.
Headwater management measures need maintenance to ensure there are effective and long-lasting.
Agricultural headwater management
Most agricultural headwater management features are effective at slowing and intercepting run-off as soon as they are installed.
Tracks, pathways, roads and tramlines that cross arable fields can intercept surface flows and concentrate it in flow pathways.
Run-off management measures have been found to slow, store and filter water, reducing flood risk locally for small events and disrupting and attenuating overland flow.
Run-off pathway management measures have been found to have a positive flood risk management benefit, especially at source, within hours of the flow being generated.
Run-off attenuation features work best when many clusters of features are included throughout the landscape, working as a network of measures rather than one dominant measure
Once run-off attenuation features are filled with water, they have minimal impacts on flow.
Run-off attenuation measures trap fine sediment, reducing the amount which enters watercourse.
Run-off attenuation features are unlikely to provide significant flooding benefits on their own. In conjunction with other run-off management features, however, they can help to control the release of sediment to the river network and maintain the capacity of rivers to convey floodwaters.
Run-off attenuation features are effective as soon as they are installed.
Run-off pathway management measures need maintenance; this is usually sediment removal.
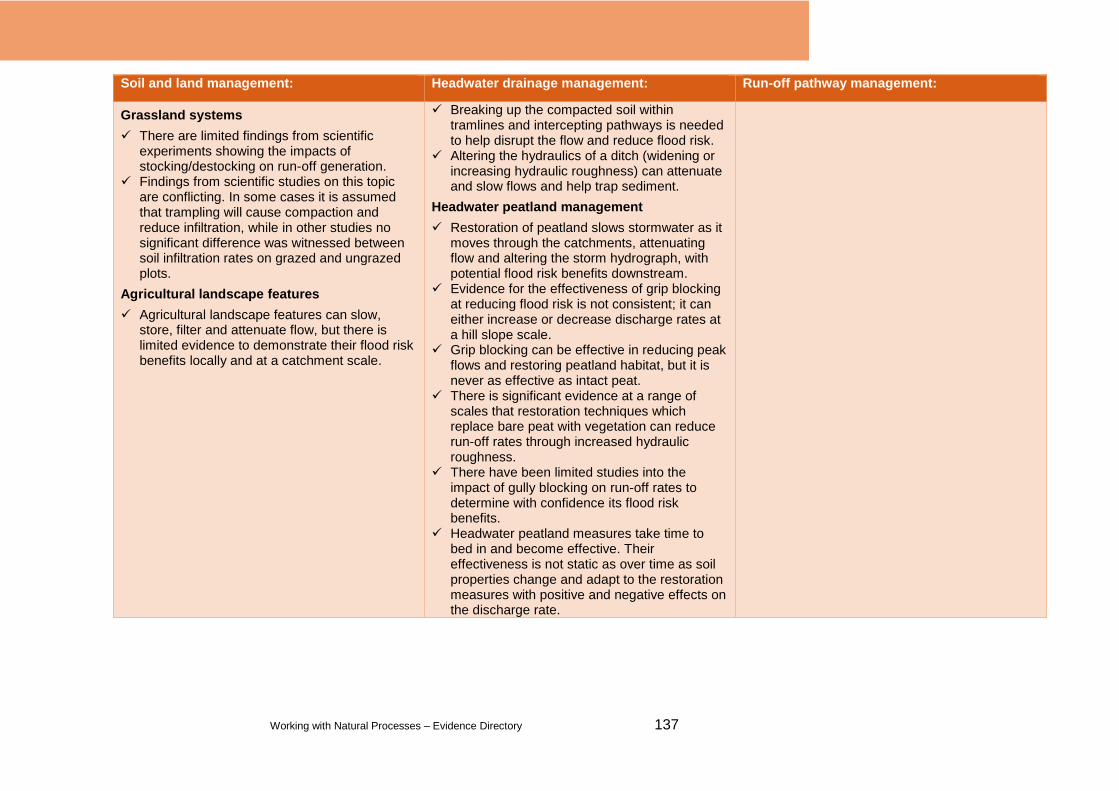
Working with Natural Processes – Evidence Directory 137
Soil and land management: Headwater drainage management: Run-off pathway management:
Grassland systems
There are limited findings from scientific experiments showing the impacts of stocking/destocking on run-off generation.
Findings from scientific studies on this topic are conflicting. In some cases it is assumed that trampling will cause compaction and reduce infiltration, while in other studies no significant difference was witnessed between soil infiltration rates on grazed and ungrazed plots.
Agricultural landscape features
Agricultural landscape features can slow, store, filter and attenuate flow, but there is limited evidence to demonstrate their flood risk benefits locally and at a catchment scale.
Breaking up the compacted soil within tramlines and intercepting pathways is needed to help disrupt the flow and reduce flood risk.
Altering the hydraulics of a ditch (widening or increasing hydraulic roughness) can attenuate and slow flows and help trap sediment.
Headwater peatland management
Restoration of peatland slows stormwater as it moves through the catchments, attenuating flow and altering the storm hydrograph, with potential flood risk benefits downstream.
Evidence for the effectiveness of grip blocking at reducing flood risk is not consistent; it can either increase or decrease discharge rates at a hill slope scale.
Grip blocking can be effective in reducing peak flows and restoring peatland habitat, but it is never as effective as intact peat.
There is significant evidence at a range of scales that restoration techniques which replace bare peat with vegetation can reduce run-off rates through increased hydraulic roughness.
There have been limited studies into the impact of gully blocking on run-off rates to determine with confidence its flood risk benefits.
Headwater peatland measures take time to bed in and become effective. Their effectiveness is not static as over time as soil properties change and adapt to the restoration measures with positive and negative effects on the discharge rate.

Working with Natural Processes – Evidence Directory 138
4.5.2 What we don’t know
Soil and land management: Headwater drainage management: Run-off pathway management:
Headwater drainage management: Headwater drainage management: Run-off pathway management:
Run-off pathway management: Headwater drainage management: Run-off pathway management:
Land management measures can affect local run-off production, slowing the flow of water and encouraging infiltration. However, it is uncertain how these measures reduce flood risk at a catchment scale (Fowler 2005).
There is limited evidence (qualitative and quantitative) that takes into account the complexity of catchment hydrological connectivity, flood generating processes and land management across vast areas to determine the type of land management required to create an impact of flood risk on a catchment scale.
The uncertainties associated with hydrological science are either more than or equally as uncertain as the potential benefits of the WWNP measures (Lane 2017).
Most of the evidence on the effectiveness of land/soil management measures on flood risk are at the plot scale. Upscaling these results is hard to do because, at the catchment scale, the impacts are highly uncertain and spatially and temporally dependent (for example, the way in which weather moves across the catchment and the timings of tributary contributions to main channel) (Pattison and Lane 2012).
Determining the impacts of increasing flow attenuation in one tributary depends on the tributary’s relationship with water delivered from other tributaries, consequently, determining whether land management will have an impact downstream is strongly scale dependent (Lane 2017).
Modelling and prediction of the hydrological impacts of land use change continue to remain
Headwater management measures have been found to slow, store and filter water, reducing flood risk locally for small events, but this evidence has yet to demonstrate their benefits for bigger flood events at larger catchment scales.
No information was found on the effectiveness of headwater management features in different catchment types or different geologies (though for peatland measures this is not surprising as these types of measure are relevant to this specific habitat).
Research is needed to help understand how flood flows are affected when headwater management features are full.
There is need for a new breed of hydraulic models to enable the assessment of clusters of WWNP features throughout a catchment.
Agricultural headwater management
It is difficult to establish the flood risk impacts that multiple on-farm features as the measures have different degrees of storage and attenuation effects.
There is little quantifiable evidence of how altering hydraulics within a ditch will reduce flood risk.
Headwater peatland management
Limited information was found on the need to maintain headwater peatland management features. This is not to say maintenance is not needed, as clearly to function effectively, these sorts of measures may need to be maintained or adapted over time.
The evidence that individual run-off pathway management measures operate efficiently during the peak of storms is uncertain.
Run-off management measures have been found to slow, store and filter water, reducing flood risk locally for small events, but this evidence has yet to demonstrate their benefits for bigger flood events at larger catchment scales.
Run-off attenuation measures trap fine sediment reducing the amount which enters watercourse, but there is limited evidence to demonstrate the flood risk benefits of this, although it may reduce the need for in-channel maintenance activities and have a positive impact on conveyance.
No information was found on the effectiveness of run-off attenuation features in different catchment types or different geologies
There is limited UK-based peer-reviewed papers looking at the role of rural swales in reducing flood risk.
The effectiveness and performance of sediment traps are not well-documented in regard to their ability to reduce flood risk.
There is limited literature available to determine how farm ponds can increase flood storage in the landscape or increase travel time to surface water bodies.
Capturing data in ponds and run-off attenuation features during storm events is necessary to understand how they function in storm events so that their design can be optimised from a flood risk perspective.

Working with Natural Processes – Evidence Directory 139
Soil and land management: Headwater drainage management: Run-off pathway management:
Headwater drainage management: Headwater drainage management: Run-off pathway management:
Run-off pathway management: Headwater drainage management: Run-off pathway management:
an evidence gap (Wheater 2002, O'Connell et al. 2007).
To determine the effect of soil and land use management measures on flood risk, further data and assessments are required.
Further research needs to be conducted to clarify how increasing measures on a larger scale impact other complex tributary interactions and flood risk downstream (Lane 2017).
Rogger et al. (2017) identified the need to better understand the dynamic nature of soil structure and its effects on hydrology, particularly how the seasonal variations of soil hydraulic properties are modified by tillage, compaction, cracking by repeated shrinking and swelling and soil sealing processes.
Research is needed to help understand when run-off attenuation features are full how to they affect flood flows.
There is need for a new breed of hydraulic models to enable the assessment of clusters of WWNP features throughout a catchment.
A top-down analysis is needed that can determine, for any catchment, the amount of flood storage and the number and type of features needed to gain a specified peak flow reduction at a flood impacted site while also addressing the potential issue of flow synchronisation.

Working with Natural Processes – Evidence Directory 140
4.6 Potential funding mechanisms
Funding for run-off management measures will vary depending upon the main driver of the project. Table4.3 lists some potential funding mechanisms.
Table 4.3 Examples of potential funding mechanisms for run-off management measures
England Wales Scotland Countrywide Stewardship
Flood Defence Grant in Aid
Local Levy
Private funding
Water Framework Directive funding
Glastir Advanced (Welsh Government)
Glastir Woodland Creation (Welsh Government)
Heritage Lottery Fund
Horizon 2020
Joseph Rowntree –Sustainable Futures
LIFE
Sustainable Management Scheme (Welsh Government Rural Development Programme)
Scottish Rural Development Programme Agri-environment and Climate Scheme
Notes: The information given is accurate as of the date of publication of this report.
4.7 Further reading
An appraisal of the Defra Multi-Objective Flood Management Projects (summary by the Moors for the Future Partnership*)
How to model and map catchment processes (outputs from Defra and Environment Agency FCRM project SC1200015*)
Countryside hedgerows: protection and management (Natural England online guidance*)
Crop rotation and Integrated Crop Management (Defra 2017)
Flood storage and attenuation on farms (Quinn et al. 2008)
Illustrated guide to ponds and scrapes (Natural England 2010)
Land use management effects on flood flows and sediment – guidance on prediction (McIntryre and Thorne 2013)
Potential use of run-off attenuation features in small rural catchments for flood mitigation (Quinn et al. 2013)
Restoration of blanket bog (Shepherd et al. 2013)
Working with Natural Processes – Evidence Directory 141
Run-off attenuation features: a guide for all those working in catchment management (Newcastle University and Environment Agency 2011)
Rural sustainable drainage systems (Environment Agency 2012)
Rural sustainable drainage systems: a practical design and build guide for Scotland’s farmers and landowners (Duffy et al. 2016)
Soils and Natural Flood Management Devon and Cornwall (Smith, 2017)
SEPA’s Natural Flood Management Handbook (SEPA 2015)
The proactive approach to Farm Integrated Run-off Management (FIRM) plans with respect to nutrients (Quinn et al. 2007b)
Thinksoils Manual (Environment Agency 2008)
* See Bibliography for further details

Working with Natural Processes – Evidence Directory 142
Chapter 5. Coast and estuary management
5.1 Introduction
5.4 Beach nourishment
5.2 Saltmarshes and mudflat management and restoration
5.3 Sand dune management and restoration
5.1 Introduction
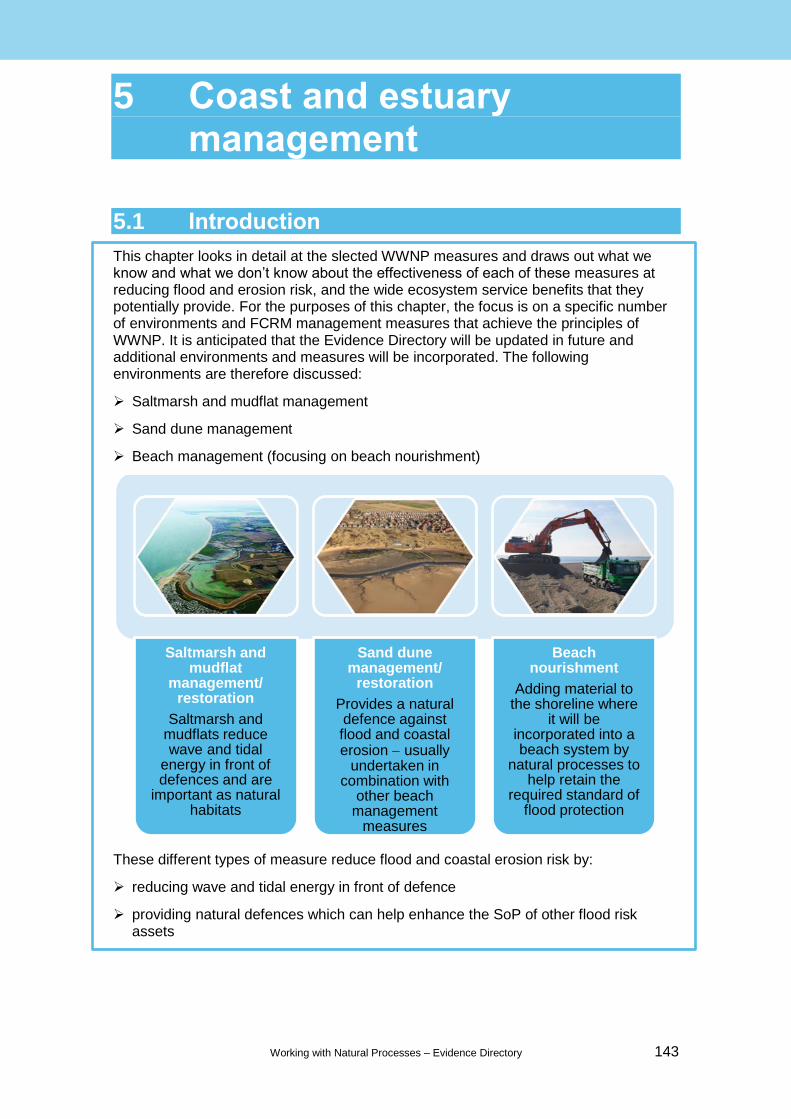
Working with Natural Processes – Evidence Directory 143
5 Coast and estuary management
5.1 Introduction
This chapter looks in detail at the slected WWNP measures and draws out what we know and what we don’t know about the effectiveness of each of these measures at reducing flood and erosion risk, and the wide ecosystem service benefits that they potentially provide. For the purposes of this chapter, the focus is on a specific number of environments and FCRM management measures that achieve the principles of WWNP. It is anticipated that the Evidence Directory will be updated in future and additional environments and measures will be incorporated. The following environments are therefore discussed:
Saltmarsh and mudflat management
Sand dune management
Beach management (focusing on beach nourishment)
These different types of measure reduce flood and coastal erosion risk by:
reducing wave and tidal energy in front of defence
providing natural defences which can help enhance the SoP of other flood risk assets
Saltmarsh and mudflat
management/ restoration
Saltmarsh and mudflats reduce wave and tidal
energy in front of defences and are
important as natural habitats
Sand dune management/
restoration
Provides a natural defence against flood and coastal erosion usually
undertaken in combination with
other beach management
measures
Beach nourishment
Adding material to the shoreline where
it will be incorporated into a beach system by
natural processes to help retain the
required standard of flood protection
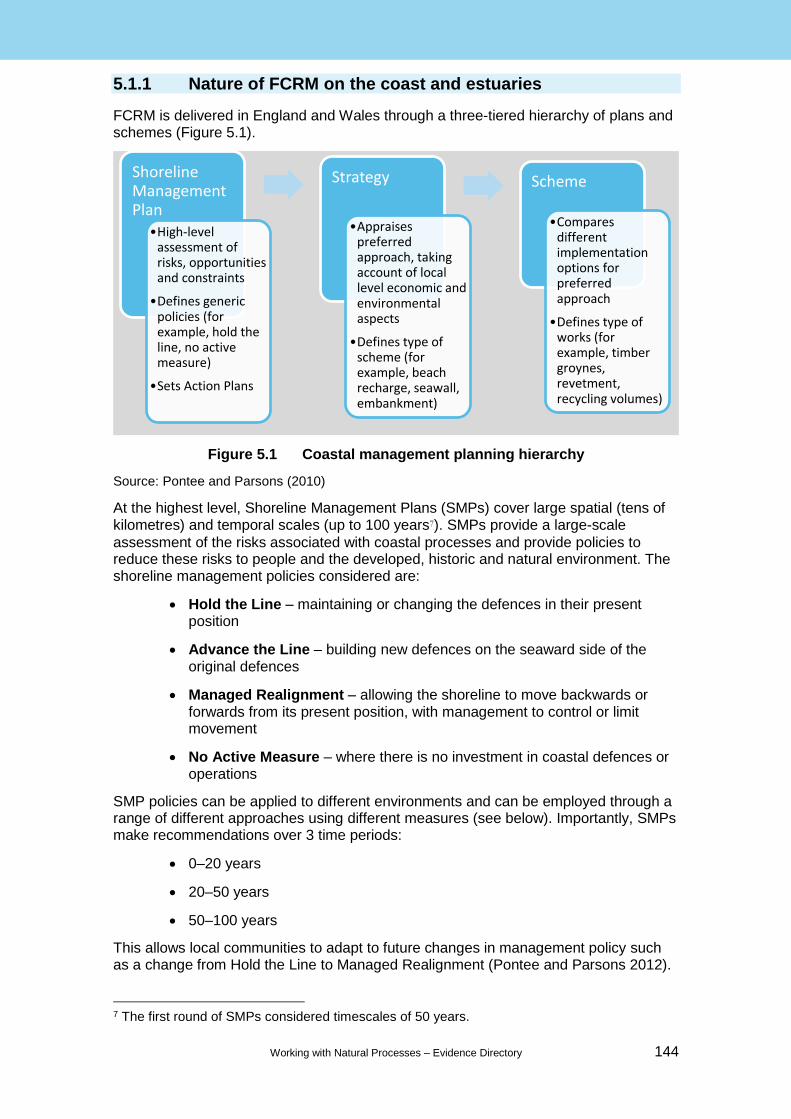
Working with Natural Processes – Evidence Directory 144
5.1.1 Nature of FCRM on the coast and estuaries
FCRM is delivered in England and Wales through a three-tiered hierarchy of plans and schemes (Figure 5.1).
Figure 5.1 Coastal management planning hierarchy
Source: Pontee and Parsons (2010)
At the highest level, Shoreline Management Plans (SMPs) cover large spatial (tens of kilometres) and temporal scales (up to 100 years7). SMPs provide a large-scale
assessment of the risks associated with coastal processes and provide policies to reduce these risks to people and the developed, historic and natural environment. The shoreline management policies considered are:
Hold the Line – maintaining or changing the defences in their present position
Advance the Line – building new defences on the seaward side of the original defences
Managed Realignment – allowing the shoreline to move backwards or forwards from its present position, with management to control or limit movement
No Active Measure – where there is no investment in coastal defences or operations
SMP policies can be applied to different environments and can be employed through a range of different approaches using different measures (see below). Importantly, SMPs make recommendations over 3 time periods:
0–20 years
20–50 years
50–100 years
This allows local communities to adapt to future changes in management policy such as a change from Hold the Line to Managed Realignment (Pontee and Parsons 2012).
7 The first round of SMPs considered timescales of 50 years.
Shoreline Management Plan
•High-level assessment of risks, opportunities and constraints
•Defines generic policies (for example, hold the line, no active measure)
•Sets Action Plans
Strategy
•Appraises preferred approach, taking account of local level economic and environmental aspects
•Defines type of scheme (for example, beach recharge, seawall, embankment)
Scheme
•Compares different implementation options for preferred approach
•Defines type of works (for example, timber groynes, revetment, recycling volumes)
Working with Natural Processes – Evidence Directory 145
The coastal boundaries of SMPs are based on sediment cells. These cells are units of coastline within which the natural processes are relatively self-confined and there are distinct inputs (sources), throughputs (sediment transport) and outputs (sinks or stores) of non-cohesive sediment (Motyka and Brampton 1993, Pontee and Parsons 2010).
At a more detailed level, Strategy Plans develop the policies recommended in SMPs by defining the preferred approach to shoreline management requirements over a 100 year period. For any one SMP policy there are a range of engineering measures. For Hold the Line policies, for example, suitable shoreline management measures might include seawalls, revetments, groynes, beach nourishment, offshore breakwaters, or a combination of these measures.
In implementing policies, it is also necessary to decide on the SoP to be provided in the light of rising sea levels and climate change. Where there is an existing defence, the intention may be to maintain the present standard of defence, or to improve it, or to accept that while the defence may be maintained, the SoP may decrease with time (for example, as the defence is overtopped more often by higher wave and water level).
Strategy Plans generally focus on more localised sediment sub-cells or frontages that usually span a few kilometres. The studies supporting Strategy Plans involve the more detailed analysis of coastal processes, asset types, costs, benefits and environmental issues.
From these strategies, individual schemes can be identified which design and deliver preferred solutions at a local scale in line with strategic objectives for the area. The Humber case study (see box) is an example of how the future FCRM management of the Humber Estuary is being defined through the development of an estuary-wide strategy.
5.1.2 What is WWNP on the coast?
Although WWNP is a new term, some principles have been incorporated into FCRM solutions in the UK for over a hundred years. Early engineers recognised the role that a full beach could play in providing protection to a seawall, with the concept of groyning to hold a beach dating back to at least the last 1800s in the UK and the beginning of the 1600s in the Netherlands (Williams et al. 2016).
Since the early days of coastal defence design, new knowledge and experience has become available and with that a greater acknowledgement of wider scale impacts of defence works. This, together with an increased appreciation of the importance of ecology, landscape and an ability to adapt to changing conditions, has led in a shift in attitudes towards coastal and flood management globally.
Recent decades have therefore seen a change in focus from traditional ‘hard’ or ‘grey’ engineering solutions that exclusively involve structural features (for example, seawalls and breakwaters) to ‘softer’, more eco-friendly solutions. The term ‘soft’ engineering came into use in the 1980s to describe those solutions which attempt to have a beneficial influence on coastal processes and in doing so improve the level of service provided by a sea defence or coast protection structure.
46. Humber Estuary Erosion Protection Programme – Humber estuary, Yorkshire
Project stage: Programme development (2016 to 2017) WWNP measures: Programme is expected to include both WWNP and traditional approaches to erosion protection. Cost: Not provided
Key facts: The flood defences around the Humber estuary are affected by erosive forces as a result of strong currents, wave energy and navigational activity. These forces cause damage to the defences and over time undermine their stability and integrity. If not addressed, the defences are at risk of breaching, potentially causing significant flooding and risk to life. The Humber Estuary Erosion Protection Programme aims to remediate and manage this erosion.
Working with Natural Processes – Evidence Directory 146
In the past 5–10 years, a variety of new terms have started to be used to describe these type of solutions including ‘Building with Nature’, ‘Living Shorelines’, ‘Engineering with Nature’, ‘Ecological Engineering’ and ‘Green Infrastructure’. This variety of terms, applied to a range of coastal environments, coupled with a lack of specific details about the measures intended can cause confusion (Pontee et al. 2016).
The project team has debated how best to define WWNP for the purpose of FCRM. It was realised that defining WWNP on the coast was very subjective and dependent on the perspective adopted. For example, there was some agreement within the team that seawalls, revetments and gabions did not represent WWNP since they ‘resisted natural processes’, while beach nourishment, saltmarsh mudflat and restoration, and some dune management measures did represent WWNP since they allowed natural processes to be maintained. A number of other measures that work with natural processes but which provide limited FCRM benefits were also discussed, such as the creation of eelgrass beds, estuarine reed beds and dune slacks. However, wider consultation led to the following conclusions.
There are a number of natural processes that could be considered to be working with or against each other such as:
- onshore/offshore sediment movement
- alongshore sediment movement
- the seaward or landward translation of habitats
- the formation of stable bays between headlands
Working with one natural process might involve working against another.
There is a variety of scales of coastal measure from short lengths of defence (tens to hundreds of metres) to larger scale measures such as creating bays between artificial headlands.
Many FCRM measures on the coast involve a combination of different measures to enable an integrated approach to long-term management.
These factors means that it is not possible to easily distinguish WWNP on the basis of the presence of a particular measure (for example, the seawall) since the whole scheme needs to be considered. For example, it is possible to envisage a coastal defence option which involves hard structures such as seawalls to create artificial headlands in between which there is a nourished beach and dune system. It can be seen that such a scheme would resist erosion to promote headlands (which could be seen as preventing natural processes) but would also enable a more naturally functioning coast in between these areas.
Rather than focus on the ‘natural processes’ themselves, WWNP on the coast is more concerned with utilising the natural FCRM function of natural environments. In this regard it is comparable with the US Army Corps of Engineers (USACE) approach (Bridges et al. 2015), which describes such measures as ‘natural’ and ‘nature-based’ solutions. The principle is that these measures mimic the characteristics of natural features, but may be enhanced or created by man to provide specific services such as wave energy dissipation and erosion reduction. In temperature climates such as in the UK, approaches can include management of beaches, dunes and saltmarshes. Importantly the USACE approach acknowledges that many FCRM problems will require a combination of approaches, involving ‘nature-based’ in combination with ‘structural’ (such as seawalls and revetments) and ‘non-structural’ measures (adaptation measures such as evacuation plans). Such approaches have also been referred to as ‘hybrid’ solutions elsewhere. The North Norfolk case study (see box)is an example of a situation where a range of approaches was adopted to facilitate WWNP.

Working with Natural Processes – Evidence Directory 147
Ideally, in WWNP, natural systems would be left unmanaged to evolve in response to prevailing waves, tides and waves. However, for a variety of reasons including human interference in various forms, many saltmarsh, dune and beach systems in the UK have diminished in size over time and coastal pressures on the coastal zone have increased. This means that large coastal stretches, which were unprotected a century ago, now need protection or management. In such settings, No Active Measure is often not a realistic option. This chapter therefore looks at possible measures to address the issue of flooding and erosion around the UK coastline while working within the principles of WWNP and minimising impacts on the wider coastal environment.
As highlighted throughout this chapter, there is no ‘one fit all’ solution due to the vast range of coastal environments present around the UK coastline and the array of different pressures, issues and opportunities on those environments. For each measure, a summary of pros and cons have been identified, based on existing literature, to provide an overview of what needs to be considered when deciding the future management of the coastline.
It is hoped that, where feasible, implementation of measures that adopt the principles of WWNP will lead to the development of more natural coasts that:
may be able to adapt more readily to future change
provide multiple benefits such as habitat provision and/or recreation in addition to flood and coastal erosion risk reduction
47. North Norfolk coast – various sites
Project stage: Constructed (2002 to 2014) WWNP measures: Managed realignment, habitat creation, secondary defence construction, withdrawal of beach maintenance, soft engineering, drainage improvements, reconnection of tidal drainage channels and creation of wider, flatter flood embankments Cost: Brancaster: £389,000. Blakeney Freshes: £510,000. Titchwell: £1.2 million (€1.5 million). Cley-Salthouse and Holme: cost unknown
Key facts: Between 2002 and 2015, a series of projects have restored more natural function to ~8km (18%) of this coastline. These locations showed good resilience to the 2013 storm surge; for example, the naturally functioning shingle ridge at Cley, although breached in the event, closed naturally within weeks.
5.2 Saltmarsh and mudflat management and restoration
5.2.1 Introduction
Key case studies (click here):
Alkborough
Fingringhoe
Hesketh
Levington
Medmerry
North Norfolk
Nigg Bay
Rhymney
Rye Harbour
Sandwich
Waldringfield
Wandsworth
Medmerry Source: Environment Agency

Working with Natural Processes – Evidence Directory 148
What is saltmarsh and mudflat management/restoration? Saltmarsh and mudflats reduce wave and tidal energy in front of flood defences, and are also important as natural habitats with a range of other ecosystem services. Saltmarshes may be fronted by mudflats or sandflats, but these intertidal flat environments may also exist in the absence of saltmarsh.
To date, most schemes in the UK to restore mudflat and saltmarsh have involved managed realignment although other methods of management/restoration do exist. In this context,8 The ‘Natural Flood Management Handbook’ (SEPA 2015) defines managed realignment as:
‘the removal of part (breach) or all of existing coastal structures. Where there is no naturally occurring high ground, new flood protection structures are created further inland, creating a new or “set back” line of protection’.
A related approach is regulated tidal exchange where structures, rather than breaches, are used to control the exchange of water between the newly created area and the existing estuary/coastal area.
Over the last 20 years, managed realignment in low-lying areas has become a well-established approach to coastal management, mainly within estuaries (see, Pontee 2007) but also on the open coast (for example, Medmerry in West Sussex).
The Online Marine Registry (OMREG) is a registry of managed realignment projects in the UK. Most of the managed realignment schemes that have been undertaken have been done so to create compensatory habitat, as in the Nigg Bay case study (see box), rather than to reduce flood or erosion risk.
Managed realignment schemes can produce flood defence benefits by creating new higher embankments to replace aging fronting defences, creating shorter defence lengths and/or locating defences in lower energy environments where maintenance requirements may be lower and thus defences may last longer. Managed realignment schemes can also be used to moderate floodwater levels in rivers and estuaries (referred to as flood storage schemes). The dissipation of wave energy over marsh surfaces potentially offers the opportunity to reduce landward defence heights.
5.2.2 Flood risk evidence
This section also describes some of the other approaches that can be used to reduce erosion and enhance existing mudflat and saltmarsh environments for FCRM.
Summary of the literature
8 Managed realignment as a policy can also apply to other environments such as managing cliff
retreat or the roll-back of dunes or gravel barriers.
48. Nigg Bay Coastal Realignment Project – Cromarty Firth, Scotland
Project stage: Constructed (2003) WWNP measures: Two 20m breaches in existing seawall Cost: £47,000
Key facts: 25ha of new intertidal habitats was created, increasing the area of saltmarsh in the bay by 23%. it is an essential high tide refuge for up to 2,000 birds
Flood and coastal erosion risk evidence M

Working with Natural Processes – Evidence Directory 149
Like beaches, mudflats represent accumulations of sediment in the intertidal zone that act to dissipate wave energy. Beaches are composed of sand or coarser sediment, while mudflats include fine-grained sediment (muds and silts).
Saltmarshes act in similar way to mudflats, though the presence of halophytic (salt-loving) vegetation over their surfaces means they are even more effective in attenuating wave energy. The presence of vegetation also helps to trap sediment and resist erosion. Saltmarshes are typically formed from silt- and mud-sized sediments, although some contain sand-sized sediments.
Saltmarshes are commonly backed by earth embankments which separate them from former areas of the coastal floodplain, although in some settings, they may extend back to naturally high rising land.
In the UK, like many other parts of the northern hemisphere, past management of saltmarshes and mudflats has been due to their use for grazing or their reclamation to gain land for agriculture of port development. Marsh reclamation, at least on a small scale, started as early as Roman times and was particularly widespread during the 19th and 20th centuries. As noted above, over the past 20 years marsh and mudflat management has shifted towards restoration, mainly by managed realignment.
Marshes also deliver additional socioeconomic and environmental benefits. They have a high amenity value and provide economic value through several sources. They are important natural habitats and many are designated conservation areas. They also provide a range of other ecosystem services such as carbon and nutrient sequestration and water quality enhancement.
Coastal flooding and erosion risks commonly arise from high wave and water levels resulting from a combination of high tides, onshore winds and low atmospheric pressure. The degree of risk reduction that can be derived from mudflats and saltmarshes will depend on the cause of risk in any one location, for example, overtopping from waves or still water levels. Although marshes reduce wave energy, they have a more limited impact on still water levels (see below).
The ability of marshes to dissipate wave energy has been recognised for some time (see, for example, Bird et al. 2000, Environment Agency et al. 2007). Numerous studies have noted the significant reductions in wave heights (for example, 70%; Bird et al. 2000) and the fact that most of this reduction occurs over the seaward portion of the marsh (for example, <10m; Möller and Spencer 2002). There is a substantial body of evidence documenting the most important factors that contribute to wave height reduction in habitats such as marshes based on field measurements, laboratory studies and numerical modelling exercises (see, for example, Shepard et al. 2011, Ysebaert et al. 2011). Although many early studies quoted values for reductions in wave height or energy, these were often for low wave heights during summer months when vegetation growth was high. More recent studies have sought to examine the performance of marshes under storm conditions, which is more relevant to FCRM.
In the UK, the Cambridge Coastal Research Unit (CCRU) has been researching wave attenuation for many years (see Möller and Spencer 2002, Möller et al. 1996, 2001, 2014). More recent field and laboratory work has demonstrated that saltmarshes can reduce wave heights under higher wave and water level conditions (for example, water depths of up to 2m and wave heights up to 0.9m), although they are most effective at low to intermediate water depths (<1.1m). CCRU’s Foreshore Assessment using Space Technology (FAST) project is intended to allow FCRM managers to establish the degree to which a particular foreshore is likely to act as a natural coastal protection, both in terms of wave dissipation and surface stability.

Working with Natural Processes – Evidence Directory 150
Similar tools have been developed in North America to evaluate the effectiveness of various coastal habitats in reducing coastal risk.9
A number of studies have suggested that the cost of defences is reduced if they are fronted by marshes which reduce wave energy. For example, Empson et al. (1997), stated that 80m width of saltmarsh in front of a flood defence structure can save about £4,600 per metre in additional wall protection. However, the ability of saltmarshes to contribute to FCRM will vary depending on the magnitude of the event and the characteristics of the saltmarsh, including the type of vegetation and the time of year which will both affect the degree of vegetation growth (see below).
In terms of the role of saltmarshes in reducing wave energy and thus defence heights in managed realignment sites, the time for the vegetation to establish needs to be considered – as this will be at least 5 years. In these instances, defences may initially need to be constructed assuming no vegetation is present, taking into account that, if and when vegetation does develop, energy levels at the defence will decrease and so maintenance requirements may reduce.
The ability of saltmarshes to reduce currents has received less attention (Shi et al. 1995), although it is widely recognised that they reduce near-bed currents. This in turn facilitates the accretion of sediment and reduces the potential for resuspension. Roots of vegetation also bind sediment, making it more resistant to erosion.
Saltmarshes can also lead to a reduction in still water levels. Marsh vegetation increases bed friction, leading to the slower propagation of water across it compared with smoother surfaces such as mudflats. The degree of this effect depends on:
o the elevation of the marsh versus water levels
o marsh size
o vegetation characteristics
o the duration of the high water event
It is common for water levels within managed realignment schemes to be lower than the surrounding estuary due to the combined effects of bed friction and the throttling function of breaches. The creation of additional saltmarsh and mudflats within an estuary can reduce water levels if they are located in the correct areas. At an estuary-wide scale, research from the Netherlands has shown that the presence of saltmarsh can reduce water levels along the margin of the estuary and slow the propagation of storm surges up an estuary (Meire et al. 2014, Smolders et al. 2015, Stark et al. 2015, Stark et al. 2016).
In summary, the ability of saltmarshes to provide flood risk reduction relates primarily to their ability to reduce wave energy. In this regard performance is influenced by the following factors.
o Nature of the incoming waves. Certain heights and periods are attenuated more than others.
o Saltmarsh/mudflat height and width. A wider, higher marsh will provide more protection to backing assets. The ability of marshes/mudflats to attenuate wave energy decreases when they are covered by greater depths of water.
o Saltmarsh/mudflat slope. A wider shallower slope is generally more effective in the dissipation of wave energy, with steeper beaches potentially resulting in greater wave reflection and increasing potential for scour. However, the slope of a beach naturally varies over time in response to prevailing conditions and also depends on the sediment composition.
9 See http://coastalresilience.org/project/coastal-defense/
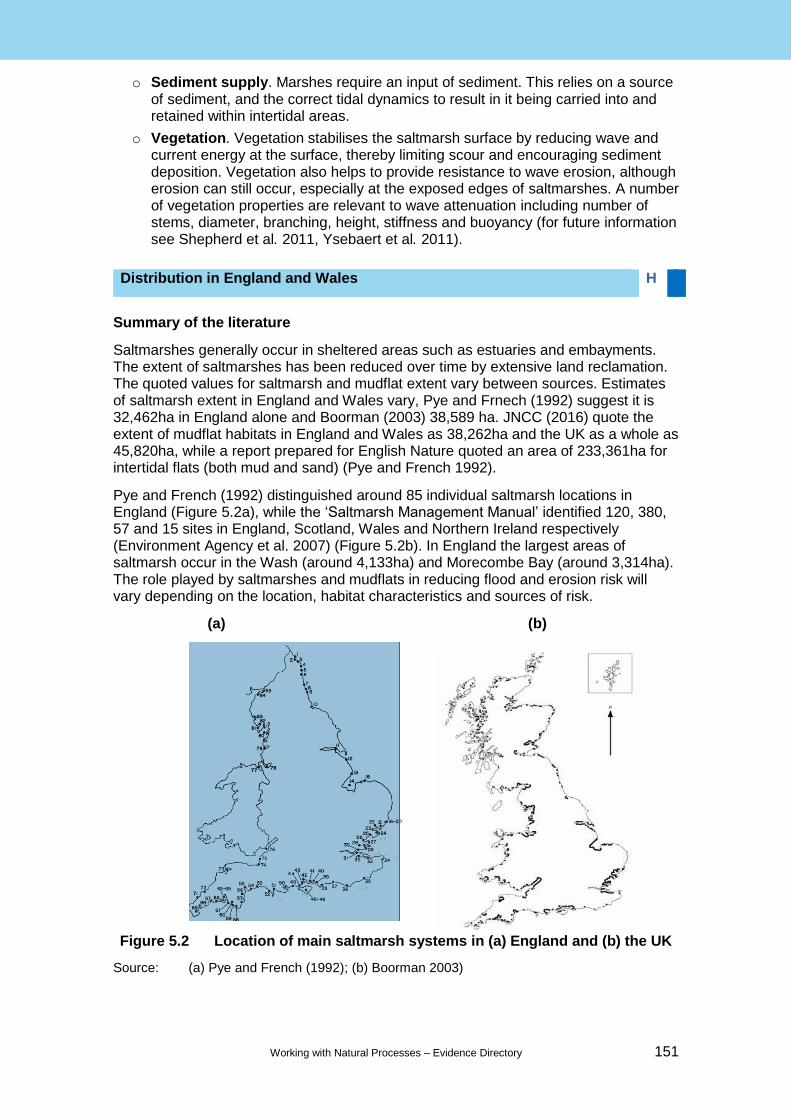
Working with Natural Processes – Evidence Directory 151
o Sediment supply. Marshes require an input of sediment. This relies on a source of sediment, and the correct tidal dynamics to result in it being carried into and retained within intertidal areas.
o Vegetation. Vegetation stabilises the saltmarsh surface by reducing wave and current energy at the surface, thereby limiting scour and encouraging sediment deposition. Vegetation also helps to provide resistance to wave erosion, although erosion can still occur, especially at the exposed edges of saltmarshes. A number of vegetation properties are relevant to wave attenuation including number of stems, diameter, branching, height, stiffness and buoyancy (for future information see Shepherd et al. 2011, Ysebaert et al. 2011).
Summary of the literature
Saltmarshes generally occur in sheltered areas such as estuaries and embayments. The extent of saltmarshes has been reduced over time by extensive land reclamation. The quoted values for saltmarsh and mudflat extent vary between sources. Estimates of saltmarsh extent in England and Wales vary, Pye and Frnech (1992) suggest it is 32,462ha in England alone and Boorman (2003) 38,589 ha. JNCC (2016) quote the extent of mudflat habitats in England and Wales as 38,262ha and the UK as a whole as 45,820ha, while a report prepared for English Nature quoted an area of 233,361ha for intertidal flats (both mud and sand) (Pye and French 1992).
Pye and French (1992) distinguished around 85 individual saltmarsh locations in England (Figure 5.2a), while the ‘Saltmarsh Management Manual’ identified 120, 380, 57 and 15 sites in England, Scotland, Wales and Northern Ireland respectively (Environment Agency et al. 2007) (Figure 5.2b). In England the largest areas of saltmarsh occur in the Wash (around 4,133ha) and Morecombe Bay (around 3,314ha). The role played by saltmarshes and mudflats in reducing flood and erosion risk will vary depending on the location, habitat characteristics and sources of risk.
(a) (b)
Figure 5.2 Location of main saltmarsh systems in (a) England and (b) the UK
Source: (a) Pye and French (1992); (b) Boorman 2003)
Distribution in England and Wales H

Working with Natural Processes – Evidence Directory 152
Summary of the literature
There is extensive literature available on the physical processes that govern the development and evolution of mudflats and saltmarshes (for example, Reed et al. 1999). The key points are summarised here, focusing on aspects which relate to their management for FCRM.
Like beaches, mudflats are dynamic features that can respond to changes in the prevailing conditions, wind wave and tides resulting in relatively small-scale accretion/erosion over single tides. The presence of vegetation means that saltmarshes tend to be less dynamic over these timescales, although changes can still occur due to wave erosion of marsh edges or the deposition of sediment on top of the marsh. Over longer timescales (for example, decades), changes in hydrodynamic considerations and sediment supply can lead to larger changes in the extent of saltmarshes and mudflats.
Since mudflats are formed of fine-grained silts and muds, sediment transport occurs as suspension rather than bedload. Both waves and tides are important, but given the relatively sheltered locations that these environments occur in (typically estuaries and embayments), tidal processes are usually dominant. On saltmarshes, fine-grained sediment transport is again likely to be dominated by tidal currents especially within marsh creeks or over the interior of the marsh, but waves may play a role in resuspending material at the marsh edge or in causing the erosion of the marsh edges.
For saltmarshes, the vigour of vegetation growth can be an important factor in marsh development. The development of the Spartina anglica hybrid following the introduction of Spartina alterniflora from North America in 1870 initially led to the rapid expansion of marshes along the east, west and south coasts of the UK during the mid-1900s, although this reverted to die back in many places around the 1980s (Lacambra et al. 2004, JNCC 2006).
Mudflats and marshes can both accrete (that is, gain sediment), which can result in an increase in height and/or seawards growth (known as progradation), and erode (lose sediment), resulting in lowering and/or recession (landward movement) of the mudflat/saltmarsh contours. Landward recession is more apparent in saltmarsh than in mudflats due to the delineation of the lower marsh boundary in the form of a change from vegetation to bare intertidal flat/open water. Since mudflats and saltmarshes occur in the environments that have migrating tidal channels, the movement of these channels can be an important factor in governing changes in habitat extent over time.
Mudflats and saltmarshes can also migrate inland through the landward transport of sediment and, in the case of saltmarshes, the colonisation of vegetation. It is important to realise that the processes causing the landward erosion of the seaward edge of saltmarshes (for example, storm wave activity, channel migration, rising sea level) occur on different timescales to the development of vegetation. The latter will require repeated inundation by tidal waters, and the germination and growth of vegetation.
In the UK, saltmarsh vegetation tends to occupy the vertical range between the level of the mean high water neap tide and the highest astronomical tide. Within this there are different vegetative zones corresponding to high, middle and lower marsh.
Models have been proposed to describe the process of vertical accretion from mudflats to saltmarsh (see, for example, Pethick 1981, Allen 1990). The process of
Relevant physical processes M

Working with Natural Processes – Evidence Directory 153
vertical accretion is also accompanied by the development of creek networks (Steel and Pye 1997, Allen 2003). Vertical accretion models typically take the form of vertical accretion proceeding rapidly at first and then declining as the intertidal area rises higher in the tidal frame and becomes inundated less often by sediment-laden waters. An equilibrium is reached when the intertidal area reaches an elevation that is constant to the moving tidal frame (assuming rising sea levels) but is substantially less than the height for extreme tides. In UK marshes, this is typically around the level of mean high water spring tides.
The dynamics of mudflats and saltmarshes depend on a number of factors.
o Sediment supply. High rates of supply encourage accretion and progradation, while low rates of supply encourage erosion and retreat. Sources of sediment may include cliff erosion, reworking of bed material within estuaries or embayments, and in some circumstances fluvial supply.
o Wave energy. For example, wave energy can be due to changes in the wind climate, or increased water depth resulting from sea level rise or changes in nearshore bathymetry.
o Tidal currents. The migration of channel towards or away from saltmarshes and mudflat can increase or reduce wave and tidal energy, and lead to shifts in accretional/erosion status.
o Vegetation cover/ growth rates. High growth of vegetation promotes greater accretion and progradation.
The response of mudflat and saltmarsh systems to sea level rise is strongly determined by site-specific factors such as geomorphological setting, sediment availability, local wave and tidal climates. With sufficient sediment available, marshes and mudflats may accrete vertically and may expand landwards and seawards. Landward movement may be hindered by defences or rising land. The term ‘coastal squeeze’ is often used to describe the loss of mudflats and saltmarshes in front of defences due to sea level rise. The various causes for changes in coastal habitats and the validity of the coastal squeeze term are considered in more detail by Pontee (2013, 2017).
A more extensive discussion on physical processes and causes for change in the extent of saltmarsh habitats can be found in the Saltmarsh Management Manual (Environment Agency et al. 2007).
Summary of the literature
Several management options can be employed in the management of mudflats and saltmarshes. For this report, the primary consideration is management to fulfil, restore or improve their function as a flood and coastal erosion defence – though these measures may also enhance or restore the saltmarshes in terms of their ecological value). This report therefore does not specifically discuss conservation management measures such as the removal of Spartina anglica.
In the UK, most saltmarsh and mudflat restoration schemes have primarily been driven by the need to create habitat rather than to fulfil a defence function, although this is commonly a secondary benefit of a scheme. More extensive works have been undertaken elsewhere, particularly in Germany and the Netherlands. For example within the Wadden Sea area, restoration works have included the use of sedimentation fences and polder fields, which have been used to encourage sedimentation.
Management approach M/H

Working with Natural Processes – Evidence Directory 154
A good overview of past projects where saltmarsh and mudflats have been created or managed is provided by Atkinson et al. (2001), with case studies and additional references. The Saltmarsh Management Manual (Environment Agency et al. 2007) provides a good overview of the various techniques that can be applied for maintaining, restoring, enhancing or creating saltmarsh.
This section summarises the main techniques relevant to the management of mudflats and saltmarshes from an FCRM perspective (Table 5.1).
Table 5.1 Saltmarsh and mudflat management techniques
Description Policy Measures
Methods to create new intertidal areas further landwards
Managed Realignment
Managed realignment
Regulated tidal exchange
Flood storage areas
Methods used to reduce wave erosion, promote sedimentation or artificially add sediment to existing intertidal areas
Hold the Line or Managed Realignment
Sedimentation fields/ fences
Vegetation planting
Intertidal recharge
Wave energy reduction structures (for example, detached breakwaters, artificial reefs, edge protection)
Generally saltmarsh and mudflat management can be considered under the FCRM strategic policy of managed realignment, but where structures are used to maintain existing habitats they may be considered under a Hold the Line policy (see Section 5.1 for more details of FCRM policies). The following sections summarise in turn the measures listed in Table 5.1, outlining the most important benefits and potential issues.
Managed realignment
Description/ rationale:
Managed realignment involves the removal of part of (breach) or all existing coastal structures to allow the re-introduction of tidal regimes to areas of previously reclaimed low-lying land. Where there is no naturally occurring high ground, new flood protection structures are created further inland, creating a new or ‘set back’ line of protection’.
The majority of schemes carried out to date in the UK have been multiobjective, often being driven by the need to create compensatory habitat following the loss of intertidal habitat through, for example, land claim, dredging, coastal squeeze or coastal defence works, but taking advantage of this need to provide improved flood defences (for example, larger defences).
A smaller number of schemes have been driven primarily by flood defence needs such as reducing flood defence costs by shortening or removing the line of defence.
Managed realignment can be used to create a combination of intertidal mudflat and saltmarsh habitat. Some schemes have coupled managed realignment with intertidal recharge (for example, at Wallasea) to raise bed levels with the site to promote the development of saltmarsh vegetation. Other
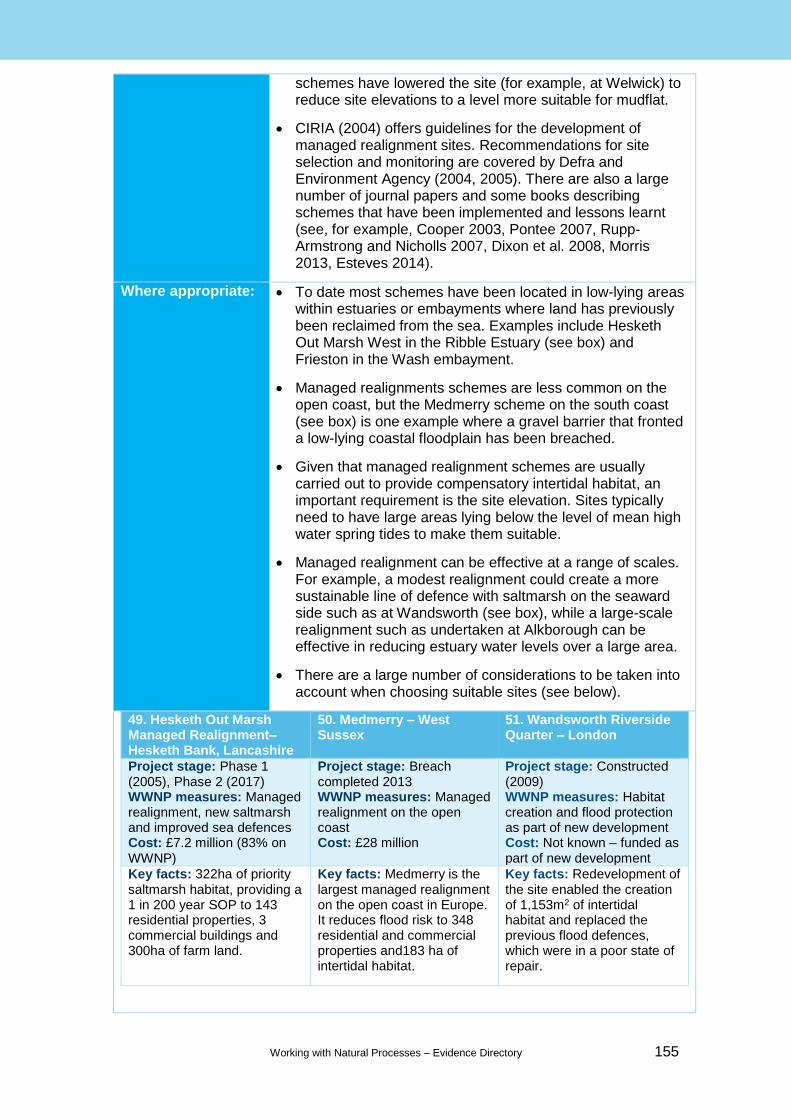
Working with Natural Processes – Evidence Directory 155
schemes have lowered the site (for example, at Welwick) to reduce site elevations to a level more suitable for mudflat.
CIRIA (2004) offers guidelines for the development of managed realignment sites. Recommendations for site selection and monitoring are covered by Defra and Environment Agency (2004, 2005). There are also a large number of journal papers and some books describing schemes that have been implemented and lessons learnt (see, for example, Cooper 2003, Pontee 2007, Rupp-Armstrong and Nicholls 2007, Dixon et al. 2008, Morris 2013, Esteves 2014).
Where appropriate: To date most schemes have been located in low-lying areas within estuaries or embayments where land has previously been reclaimed from the sea. Examples include Hesketh Out Marsh West in the Ribble Estuary (see box) and Frieston in the Wash embayment.
Managed realignments schemes are less common on the open coast, but the Medmerry scheme on the south coast (see box) is one example where a gravel barrier that fronted a low-lying coastal floodplain has been breached.
Given that managed realignment schemes are usually carried out to provide compensatory intertidal habitat, an important requirement is the site elevation. Sites typically need to have large areas lying below the level of mean high water spring tides to make them suitable.
Managed realignment can be effective at a range of scales. For example, a modest realignment could create a more sustainable line of defence with saltmarsh on the seaward side such as at Wandsworth (see box), while a large-scale realignment such as undertaken at Alkborough can be effective in reducing estuary water levels over a large area.
There are a large number of considerations to be taken into account when choosing suitable sites (see below).
49. Hesketh Out Marsh Managed Realignment– Hesketh Bank, Lancashire
50. Medmerry – West Sussex
51. Wandsworth Riverside Quarter – London
Project stage: Phase 1 (2005), Phase 2 (2017) WWNP measures: Managed realignment, new saltmarsh and improved sea defences Cost: £7.2 million (83% on WWNP)
Project stage: Breach completed 2013 WWNP measures: Managed realignment on the open coast Cost: £28 million
Project stage: Constructed (2009) WWNP measures: Habitat creation and flood protection as part of new development Cost: Not known – funded as part of new development
Key facts: 322ha of priority saltmarsh habitat, providing a 1 in 200 year SOP to 143 residential properties, 3 commercial buildings and 300ha of farm land.
Key facts: Medmerry is the largest managed realignment on the open coast in Europe. It reduces flood risk to 348 residential and commercial properties and183 ha of intertidal habitat.
Key facts: Redevelopment of the site enabled the creation of 1,153m2 of intertidal habitat and replaced the previous flood defences, which were in a poor state of repair.
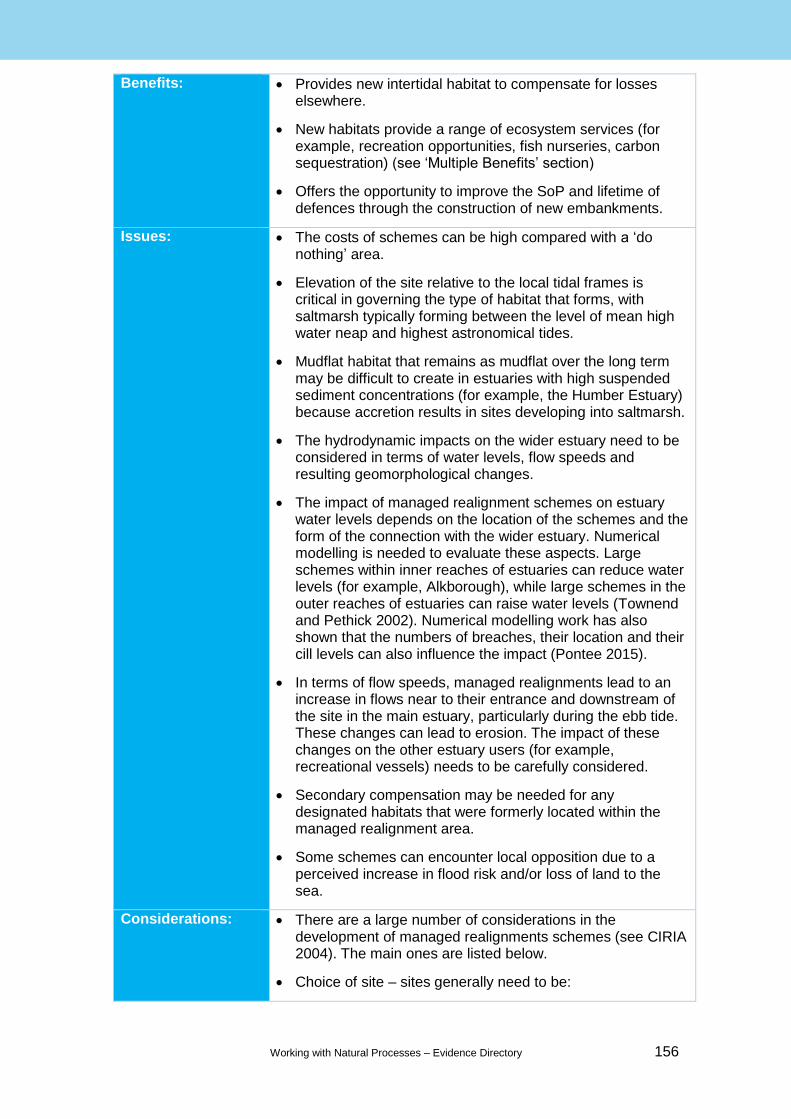
Working with Natural Processes – Evidence Directory 156
Benefits: Provides new intertidal habitat to compensate for losses elsewhere.
New habitats provide a range of ecosystem services (for example, recreation opportunities, fish nurseries, carbon sequestration) (see ‘Multiple Benefits’ section)
Offers the opportunity to improve the SoP and lifetime of defences through the construction of new embankments.
Issues: The costs of schemes can be high compared with a ‘do nothing’ area.
Elevation of the site relative to the local tidal frames is critical in governing the type of habitat that forms, with saltmarsh typically forming between the level of mean high water neap and highest astronomical tides.
Mudflat habitat that remains as mudflat over the long term may be difficult to create in estuaries with high suspended sediment concentrations (for example, the Humber Estuary) because accretion results in sites developing into saltmarsh.
The hydrodynamic impacts on the wider estuary need to be considered in terms of water levels, flow speeds and resulting geomorphological changes.
The impact of managed realignment schemes on estuary water levels depends on the location of the schemes and the form of the connection with the wider estuary. Numerical modelling is needed to evaluate these aspects. Large schemes within inner reaches of estuaries can reduce water levels (for example, Alkborough), while large schemes in the outer reaches of estuaries can raise water levels (Townend and Pethick 2002). Numerical modelling work has also shown that the numbers of breaches, their location and their cill levels can also influence the impact (Pontee 2015).
In terms of flow speeds, managed realignments lead to an increase in flows near to their entrance and downstream of the site in the main estuary, particularly during the ebb tide. These changes can lead to erosion. The impact of these changes on the other estuary users (for example, recreational vessels) needs to be carefully considered.
Secondary compensation may be needed for any designated habitats that were formerly located within the managed realignment area.
Some schemes can encounter local opposition due to a perceived increase in flood risk and/or loss of land to the sea.
Considerations: There are a large number of considerations in the development of managed realignments schemes (see CIRIA 2004). The main ones are listed below.
Choice of site – sites generally need to be:

Working with Natural Processes – Evidence Directory 157
o adjacent to an existing intertidal area below mean high water springs to create intertidal habitat
o free for infrastructure (for example, roads, buildings)
o free from significant areas of contaminated land
The potential impact on estuary dynamics and receptors needs to be considered (see above). This is particularly important for large sites and numerical modelling is likely to be required.
The type of connection with the wider estuary – the number and configuration of breaches, whether or not the breach will be armoured or will be left to adjust naturally, and the requirement for wholesale removal of existing embankments are all aspects to be considered.
The rerouting of existing freshwater drainage through or around the newly created site needs to be incorporated into scheme designs.
The dimensions of new embankments within the scheme – these need to take account of the desired SoP and design life, source of material (for example, within site or imported) and the incident conditions (for example, water levels and wave heights).
Long-term maintenance needs to be fully costed and its requirements built into the scheme – though the Fingringhoe example (see box) shows that, in some cases. Maintenance costs can be reduced following scheme construction.
The future development of habitats within the scheme. This is particularly important for schemes aiming to create a particular amount of mudflat and saltmarsh, or schemes needing to create habitat for particular bird species.
Managed realignment schemes represent significant developments (often covering up to several hundred hectares) which may affect many stakeholders. Stakeholder consultation is therefore essential. Affected parties/issues include landowners (particularly farmers), navigation users and footpath users.
Future use of the site – future site managers need to be identified early in the design process since their requirements are likely to influence the design (for example, requirement for future grazing or visitor access).
52. Fingringhoe Managed Realignment – Fingringhoe, Essex
Project stage: Breached 2015 WWNP measures: 300m breach in the seawall Cost: £436, 000
Key facts: Created 22ha of new, internationally important intertidal habitat on the Colne estuary. This new habitat has removed maintenance cost and responsibility on 2km of seawall.

Working with Natural Processes – Evidence Directory 158
Regulated tidal exchange
Description/ rationale:
Similar to managed realignment except that instead of the removal of breaches or a bank, structures are used to control the ingress and egress of water into and out of the scheme (Figure 5.3). See Pett Frontage case study.
A range of types of structure can be used. These influence the hydrodynamic regime.
o Basic culverts (with no tidal flap). Tidal water will flow in and out on every tide as long as the invert level is around the mean low water mark. A variation is to have a dropboard on the landward side to prevent water flowing out of the culvert, creating a permanently flooded area.
o Manually operated sluices. These can be used to let water through into an impoundment at high tide over several high tides.
o Self-regulated tidal gates. These typically have an adjustable float system, which allows the gate to close at a certain stage on the flood tide and open at a certain stage on the ebb tide.
o Electronically operated tide gates. Here electronic sensors control the opening and closing of the gate depending on water levels outside and inside the schemes. The gate may take the form of a vertical gate.
Where appropriate: Similar locations to managed realignments are suitable.
Regulated tidal exchange can be used to produce artificially water levels within the schemes. For example, this can be used to deter the development of saltmarsh vegetation and to encourage the development of mudflat.
The ability to control water levels may allow sites with a wider range of elevations to be chosen.
The relatively small hydraulic capacity of spillways, culverts and pipes compared with defence removal or breach creation (managed realignment) usually tends to
53. Rye Harbour Farm regulated tidal exchange (Rye, East Sussex) and Pett Frontage (Rother Tidal Walls West)
Project stage: Constructed (2006) WWNP measures: Intertidal habitat creation (tidal exchange) Cost: £1.6 million (£790,000 relates to WWNP)
Key facts: In November 2013, a tidal surge entered the habitat creation area, providing a large area of tidal storage, which was then gradually released via the new creek. Some 100ha of water-dependent and coastal habitats have also been created.
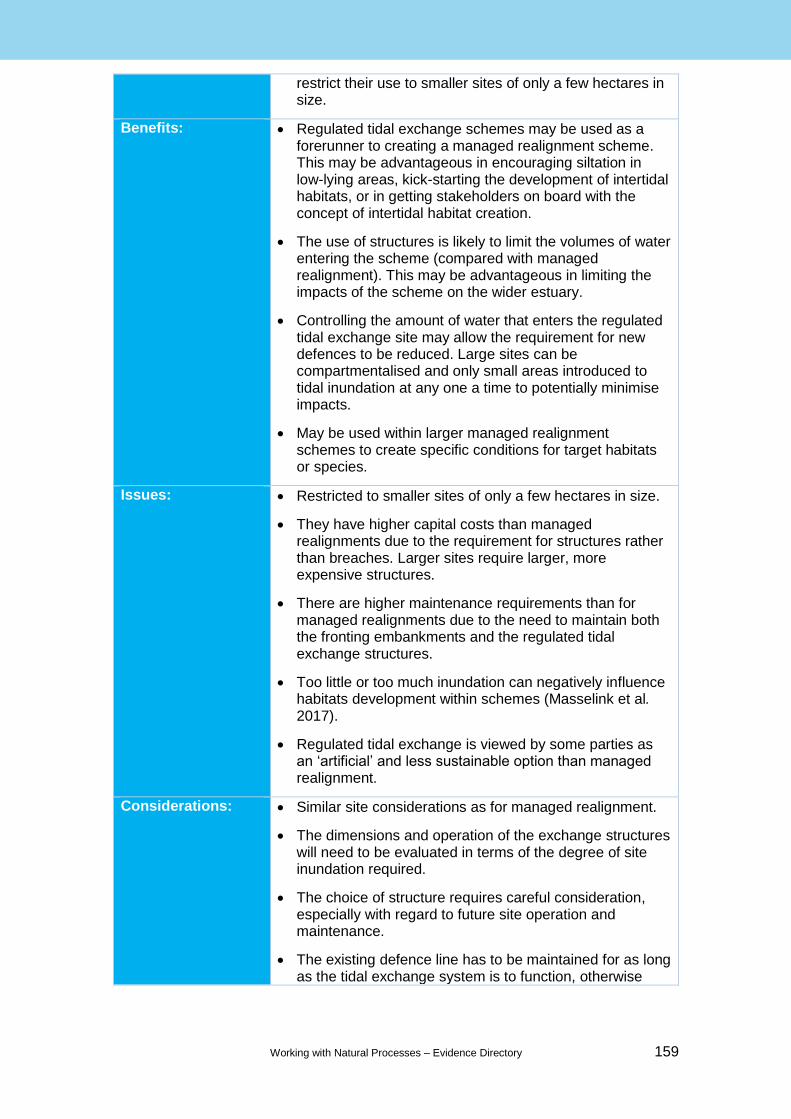
Working with Natural Processes – Evidence Directory 159
restrict their use to smaller sites of only a few hectares in size.
Benefits: Regulated tidal exchange schemes may be used as a forerunner to creating a managed realignment scheme. This may be advantageous in encouraging siltation in low-lying areas, kick-starting the development of intertidal habitats, or in getting stakeholders on board with the concept of intertidal habitat creation.
The use of structures is likely to limit the volumes of water entering the scheme (compared with managed realignment). This may be advantageous in limiting the impacts of the scheme on the wider estuary.
Controlling the amount of water that enters the regulated tidal exchange site may allow the requirement for new defences to be reduced. Large sites can be compartmentalised and only small areas introduced to tidal inundation at any one a time to potentially minimise impacts.
May be used within larger managed realignment schemes to create specific conditions for target habitats or species.
Issues: Restricted to smaller sites of only a few hectares in size.
They have higher capital costs than managed realignments due to the requirement for structures rather than breaches. Larger sites require larger, more expensive structures.
There are higher maintenance requirements than for managed realignments due to the need to maintain both the fronting embankments and the regulated tidal exchange structures.
Too little or too much inundation can negatively influence habitats development within schemes (Masselink et al. 2017).
Regulated tidal exchange is viewed by some parties as an ‘artificial’ and less sustainable option than managed realignment.
Considerations: Similar site considerations as for managed realignment.
The dimensions and operation of the exchange structures will need to be evaluated in terms of the degree of site inundation required.
The choice of structure requires careful consideration, especially with regard to future site operation and maintenance.
The existing defence line has to be maintained for as long as the tidal exchange system is to function, otherwise
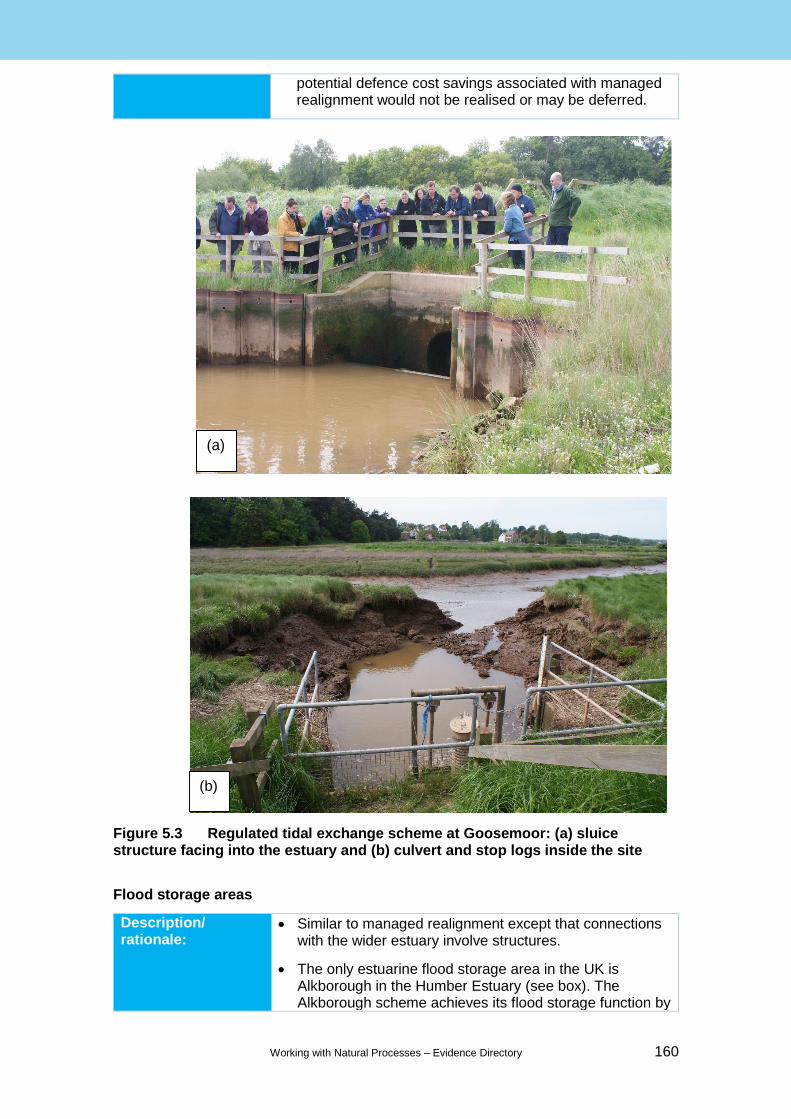
Working with Natural Processes – Evidence Directory 160
potential defence cost savings associated with managed realignment would not be realised or may be deferred.
Figure 5.3 Regulated tidal exchange scheme at Goosemoor: (a) sluice structure facing into the estuary and (b) culvert and stop logs inside the site
Flood storage areas
Description/ rationale:
Similar to managed realignment except that connections with the wider estuary involve structures.
The only estuarine flood storage area in the UK is Alkborough in the Humber Estuary (see box). The Alkborough scheme achieves its flood storage function by
(a)
(b)
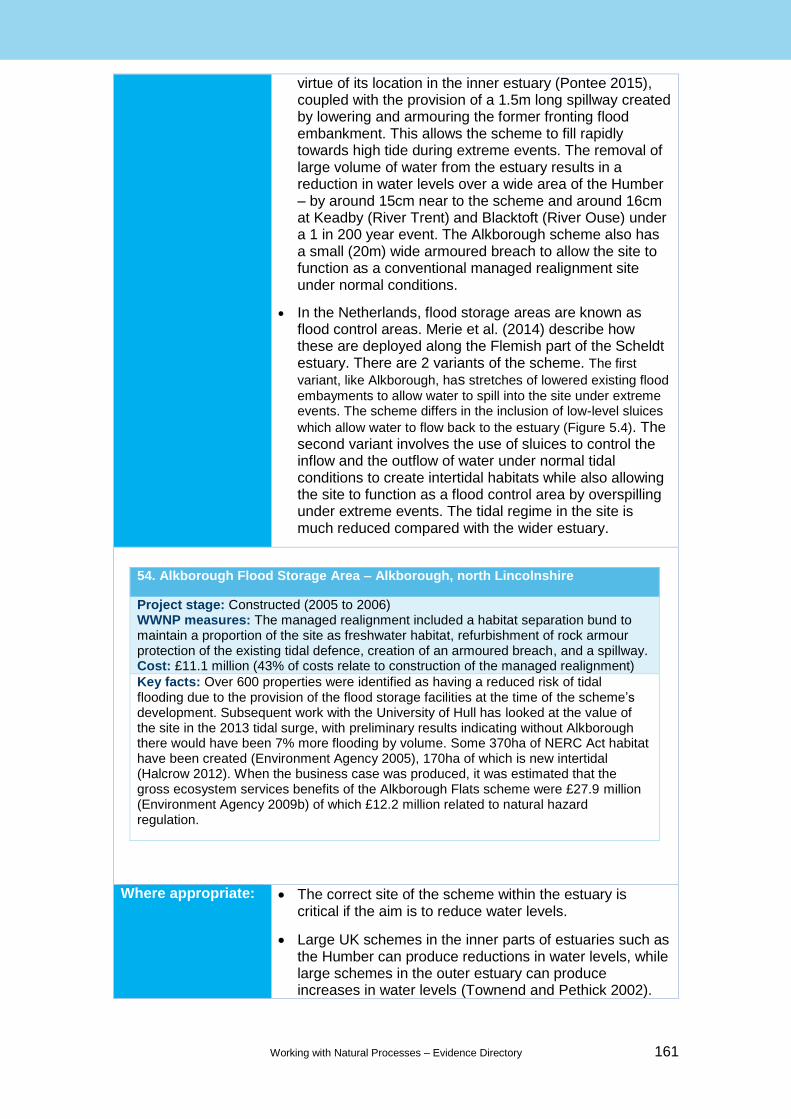
Working with Natural Processes – Evidence Directory 161
virtue of its location in the inner estuary (Pontee 2015), coupled with the provision of a 1.5m long spillway created by lowering and armouring the former fronting flood embankment. This allows the scheme to fill rapidly towards high tide during extreme events. The removal of large volume of water from the estuary results in a reduction in water levels over a wide area of the Humber – by around 15cm near to the scheme and around 16cm at Keadby (River Trent) and Blacktoft (River Ouse) under a 1 in 200 year event. The Alkborough scheme also has a small (20m) wide armoured breach to allow the site to function as a conventional managed realignment site under normal conditions.
In the Netherlands, flood storage areas are known as flood control areas. Merie et al. (2014) describe how these are deployed along the Flemish part of the Scheldt estuary. There are 2 variants of the scheme. The first
variant, like Alkborough, has stretches of lowered existing flood
embayments to allow water to spill into the site under extreme events. The scheme differs in the inclusion of low-level sluices
which allow water to flow back to the estuary (Figure 5.4). The second variant involves the use of sluices to control the inflow and the outflow of water under normal tidal conditions to create intertidal habitats while also allowing the site to function as a flood control area by overspilling under extreme events. The tidal regime in the site is much reduced compared with the wider estuary.
Where appropriate: The correct site of the scheme within the estuary is critical if the aim is to reduce water levels.
Large UK schemes in the inner parts of estuaries such as the Humber can produce reductions in water levels, while large schemes in the outer estuary can produce increases in water levels (Townend and Pethick 2002).
54. Alkborough Flood Storage Area – Alkborough, north Lincolnshire
Project stage: Constructed (2005 to 2006) WWNP measures: The managed realignment included a habitat separation bund to maintain a proportion of the site as freshwater habitat, refurbishment of rock armour protection of the existing tidal defence, creation of an armoured breach, and a spillway. Cost: £11.1 million (43% of costs relate to construction of the managed realignment)
Key facts: Over 600 properties were identified as having a reduced risk of tidal flooding due to the provision of the flood storage facilities at the time of the scheme’s development. Subsequent work with the University of Hull has looked at the value of the site in the 2013 tidal surge, with preliminary results indicating without Alkborough there would have been 7% more flooding by volume. Some 370ha of NERC Act habitat have been created (Environment Agency 2005), 170ha of which is new intertidal (Halcrow 2012). When the business case was produced, it was estimated that the gross ecosystem services benefits of the Alkborough Flats scheme were £27.9 million (Environment Agency 2009b) of which £12.2 million related to natural hazard regulation.

Working with Natural Processes – Evidence Directory 162
Alkborough is located at the confluence of the Ouse and Trent, ~60km upstream of the estuary mouth.
In the Netherlands, Meire et al (2014) noted the impact of schemes that are too close to the mouth will be small, and if they are situated too far upstream, their impact will be negligible in more downstream parts. In the Scheldt estuary, the first flood control area is situated about 100km from the mouth of the estuary.
Regulated tidal exchange can be used to produce artificially water levels within the scheme.
It can be used to deter the development of saltmarsh vegetation and encourage the development of mudflat.
The ability to control water levels may allow sites with less than optimal elevations for managed realignment to be chosen.
Benefits: Can be used to reduce water levels within estuaries.
May reduce defence costs in other areas of the estuary.
Can be used in combination with regulated tidal exchange or managed realignment to create intertidal habitats and related benefits.
Issues: Capital costs are higher than for managed realignments due to the requirement for structures rather than breaches.
Larger sites require larger more expensive structures.
Maintenance requirements are higher.
Flood storage areas are viewed by some parties as an ‘artificial’ and less sustainable option than managed realignment.
Considerations: Site considerations are similar to those for managed realignment.
Numerical modelling is needed to choose an appropriate location and design.
The dimensions of the structure will need to be evaluated in terms of the degree of site inundation that is required.
The existing defence line has to be maintained for as long as the flood storage area is to function, otherwise the potential defence cost savings associated with managed realignments would not be realised or may be deferred.
The Sandwich case study is an example where flood storage has been developed alongside wall raising to provide compensatory habitat and water storage.
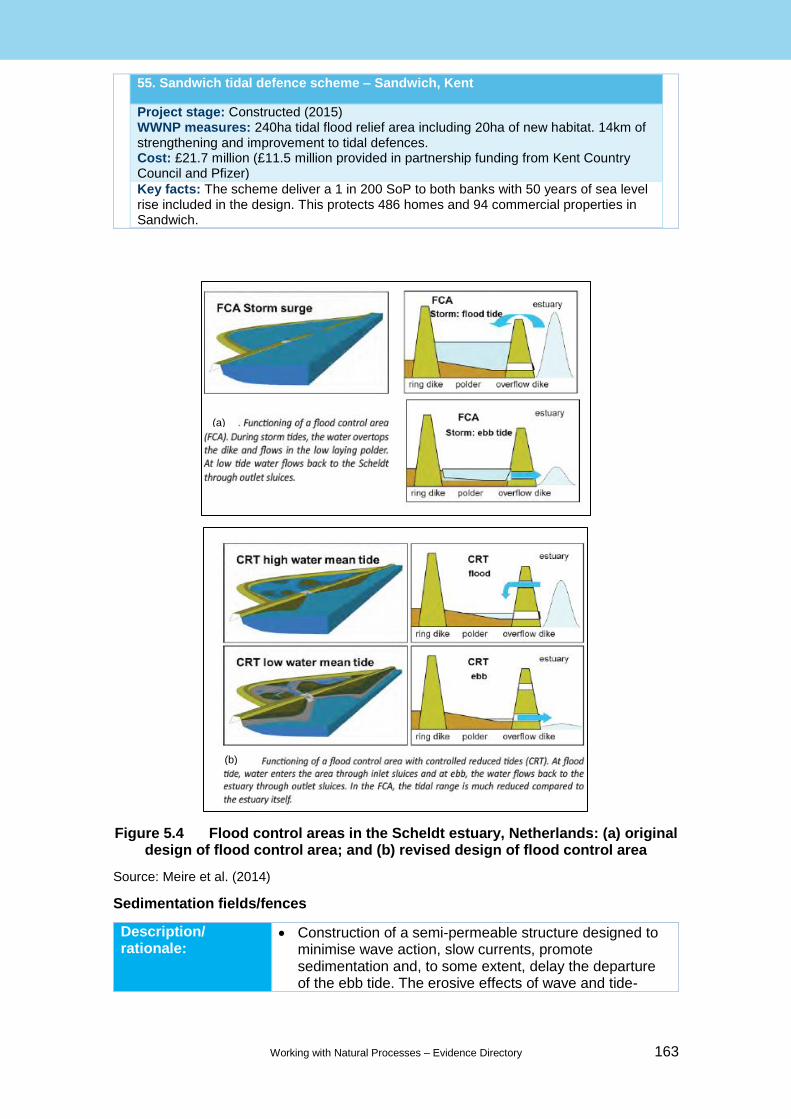
Working with Natural Processes – Evidence Directory 163
55. Sandwich tidal defence scheme – Sandwich, Kent
Project stage: Constructed (2015) WWNP measures: 240ha tidal flood relief area including 20ha of new habitat. 14km of strengthening and improvement to tidal defences. Cost: £21.7 million (£11.5 million provided in partnership funding from Kent Country Council and Pfizer)
Key facts: The scheme deliver a 1 in 200 SoP to both banks with 50 years of sea level rise included in the design. This protects 486 homes and 94 commercial properties in Sandwich.
Figure 5.4 Flood control areas in the Scheldt estuary, Netherlands: (a) original design of flood control area; and (b) revised design of flood control area
Source: Meire et al. (2014)
Sedimentation fields/fences
Description/ rationale:
Construction of a semi-permeable structure designed to minimise wave action, slow currents, promote sedimentation and, to some extent, delay the departure of the ebb tide. The erosive effects of wave and tide-
(a)
(b)
Working with Natural Processes – Evidence Directory 164
generated shear stress are diminished, allowing deposition of fine-grained sediment.
Tends to be used in combination with other measures such as intertidal recharge and/or vegetation planting.
There are 2 types: brushwood groynes and brushwood sediment fields or ‘polders’.
o Brushwood groynes generally consist of 2 parallel rows of wooden stakes driven deep into the mud, placed at right angles to the foreshore. A variety of materials can be used as infill, but brushwood has been found to be the most durable.
o Polders involve enclosing a width of upper marsh and fronting mudflat by a perimeter fence. Ditches are dug in a regular grid pattern across the polder to collect deposited sediment, which is cleared and piled on the banks between the ditches. Gaps in the fencing along the seaward line allow the tide to flow into a series of channels within the area. This approach also involves re-excavating the ditches and placing this sediment in the intervening space such that the general level of the area becomes raised over time.
Where appropriate: Not appropriate where wave erosion is severe or sediment supply is an issue.
More suitable for aiding mudflats/saltmarshes that are already stable or recovering by enhancing accretion.
May also be appropriate where there is localised scour or erosion (for example, due to a change in tidal flows).
Benefits: Can be used to enhance the level of flood protection by encouraging vertical growth.
The design can be modified to achieve optimum sedimentation.
Likely to result in more rapid accretion than using vegetation alone.
Can potentially improve the natural resilience of mudflats and saltmarshes.
Issues: Success depends upon the availability of sediment, which in turn depends on local budget and prevailing conditions. Limited success previously experienced in UK.
o Regular and continual maintenance is essential to the fences to ensure they remain effective and ditches within the polder fields need to be constantly re-dug.
o Construction can have a major impact on the environment through trampling and disturbance during construction and maintenance.
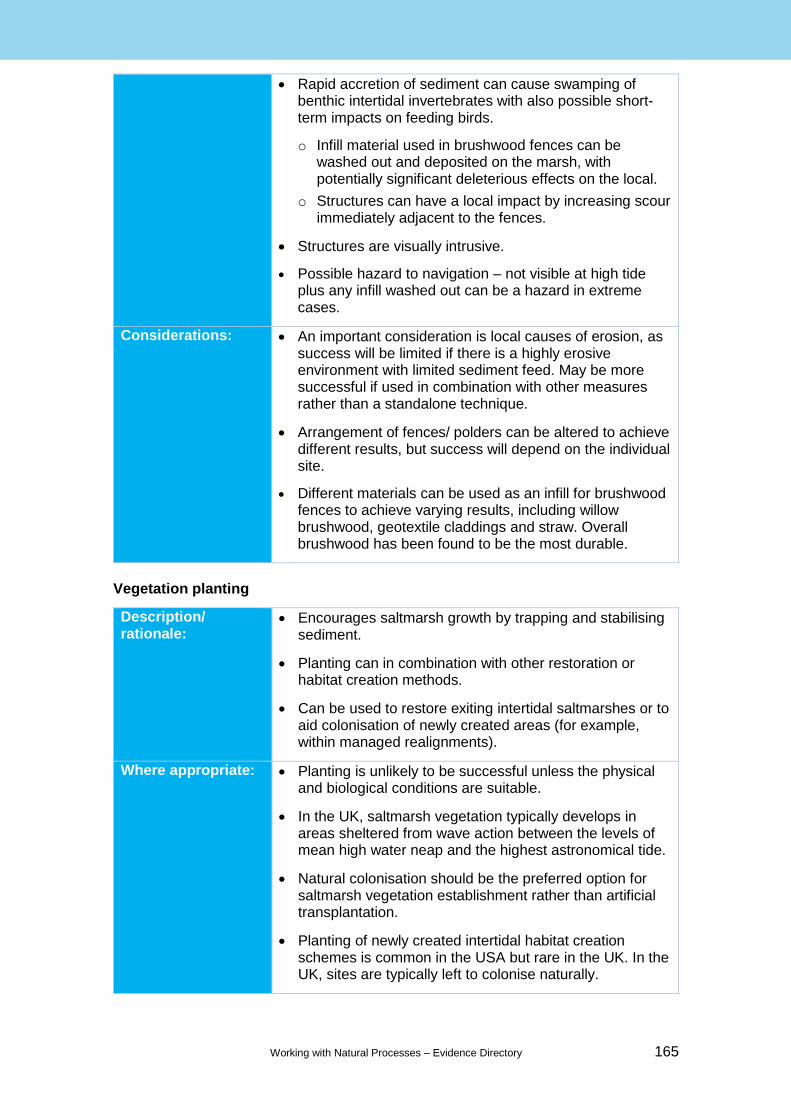
Working with Natural Processes – Evidence Directory 165
Rapid accretion of sediment can cause swamping of benthic intertidal invertebrates with also possible short-term impacts on feeding birds.
o Infill material used in brushwood fences can be washed out and deposited on the marsh, with potentially significant deleterious effects on the local.
o Structures can have a local impact by increasing scour immediately adjacent to the fences.
Structures are visually intrusive.
Possible hazard to navigation – not visible at high tide plus any infill washed out can be a hazard in extreme cases.
Considerations: An important consideration is local causes of erosion, as success will be limited if there is a highly erosive environment with limited sediment feed. May be more successful if used in combination with other measures rather than a standalone technique.
Arrangement of fences/ polders can be altered to achieve different results, but success will depend on the individual site.
Different materials can be used as an infill for brushwood fences to achieve varying results, including willow brushwood, geotextile claddings and straw. Overall brushwood has been found to be the most durable.
Vegetation planting
Description/ rationale:
Encourages saltmarsh growth by trapping and stabilising sediment.
Planting can in combination with other restoration or habitat creation methods.
Can be used to restore exiting intertidal saltmarshes or to aid colonisation of newly created areas (for example, within managed realignments).
Where appropriate: Planting is unlikely to be successful unless the physical and biological conditions are suitable.
In the UK, saltmarsh vegetation typically develops in areas sheltered from wave action between the levels of mean high water neap and the highest astronomical tide.
Natural colonisation should be the preferred option for saltmarsh vegetation establishment rather than artificial transplantation.
Planting of newly created intertidal habitat creation schemes is common in the USA but rare in the UK. In the UK, sites are typically left to colonise naturally.

Working with Natural Processes – Evidence Directory 166
There is some evidence from small-scale trials in the UK that planting of rarer saltmarsh species may help establish a fuller range of plant species within managed realignments (Mossman et al. 2012).
May difficult to achieve over large geographical areas.
Benefits: Can speed up natural vegetation processes leading to improved sediment stability and sediment trapping.
Can potential improve the natural resilience of saltmarshes.
Can potentially improve species diversity in recreated saltmarshes.
Potentially self-sustaining once vegetation becomes established.
Issues: Success rate depends on the prevailing conditions and location of planting. May be lost to storm erosion.
Labour-intensive with ongoing management commitment.
Likely to take several years before transplants begin to thrive and spread.
Spartina has demonstrated the ability to colonise in different locations in the UK and in different parts of the intertidal in relation to the tidal frame. However, it has also died back in places, remained moribund in others, and smothered other indigenous species elsewhere (Environment Agency et al. 2007).
Considerations: Use indigenous plant species – also consider increasing diversity.
If transplanting other areas, the potential impacts of this need to be considered.
May require some pre-works such as reprofiling to create a more site elevation.
Some companies grow saltmarsh plants specifically for restoration projects.
Sediment nourishment
Description/ rationale:
This involves addition of sediment to mudflats/saltmarshes to:
o increase volumes, with the benefit of increased levels which reduce wave overtopping
o help promote vegetation development
o increase wave attenuation
In many cases this is considered to be a sacrificial sediment supply since the processes responsible for

Working with Natural Processes – Evidence Directory 167
erosion are likely to remain. However, this can be an important response to critical conditions.
It can provide a sustainable solution in some circumstances. Most schemes utilise sediment derived from the navigational dredging of nearby port areas –also known as beneficial use (see Levington case study).
Sediment is commonly placed is using a dredger linked to a pipeline, which pumps a suspension of sediment and water onto the areas to be nourished. In some areas, material may be sprayed directly from the dredger over through the air – a technique known as ‘rainbowing’.
Sediment nourishment approach has been implemented at various locations in the south-east of England, including Hamford Water, the Blackwater Estuary, the Colne Estuary and the Orwell Estuary (see Environment Agency et al. 2007 for case studies).
Where appropriate: Shorelines suffering erosion and low elevations due to a deficient of sediment supply.
Sand and gravel material derived from capital dredging can be used to create to protective bunds to retain finer grained material behind.
Nourishment material may be placed anywhere in the upper to lower beach or nearshore zone, depending on the specific requirements and opportunities at a particular site.
Nourishment may be used to:
o directly raise levels on eroding intertidal mudflats or saltmarsh areas – for example, Harwich Haven (Environment Agency et al. 2007) and Lymington (Lowe 2013)
o indirectly increase sediment supply by placing sediment subtidally, or in the ‘water column recharge’ adjacent to eroding intertidal margins (latter is sometimes known as trickle charging – relatively small volumes of material being added repeatedly over time)
o raise levels within managed realignment schemes to achieve elevations more suitable for saltmarsh formation (see Wallasey case study)
56. Levington Salt Marsh Restoration, Suffolk
Project stage: Ongoing (1997 to present day) WWNP measures: Saltmarsh restoration through beneficial use of dredged material Cost: £100,000–£150,000 per year
Key facts: A partnership approach has achieved environmental benefits from using maintenance dredgings to accrete and restore fragmented areas of saltmarsh local to the dredging site and at a relatively modest cost.
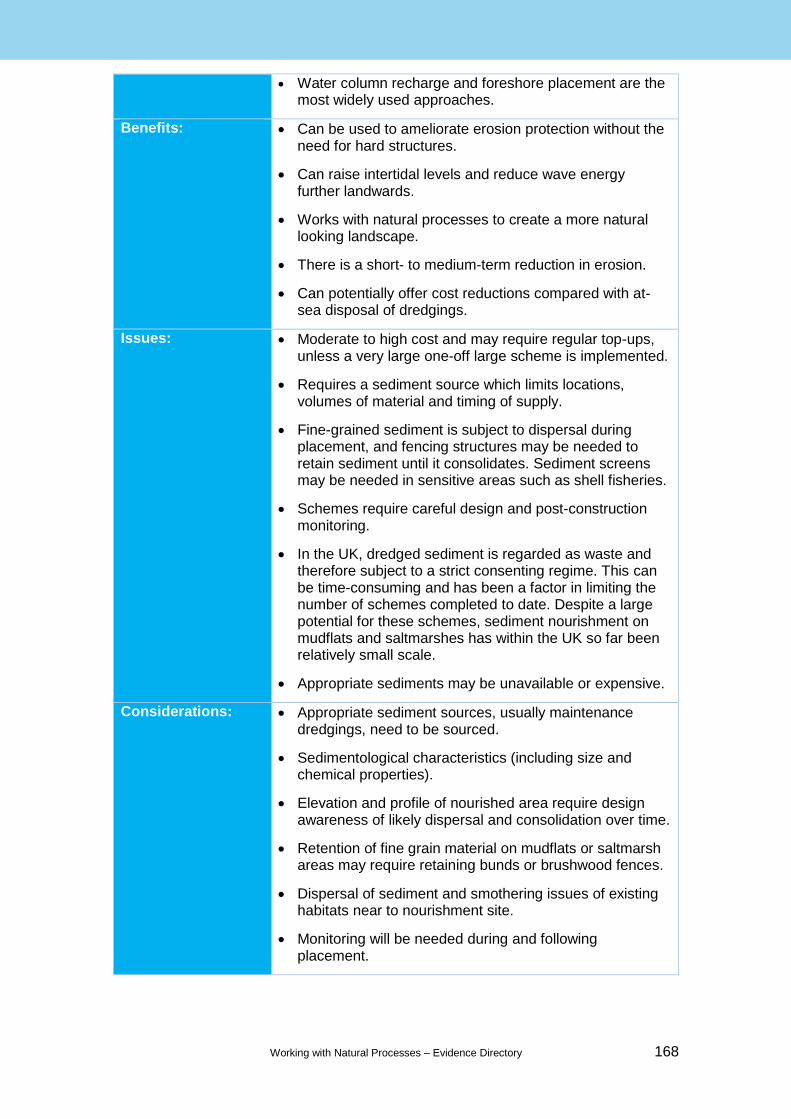
Working with Natural Processes – Evidence Directory 168
Water column recharge and foreshore placement are the most widely used approaches.
Benefits: Can be used to ameliorate erosion protection without the need for hard structures.
Can raise intertidal levels and reduce wave energy further landwards.
Works with natural processes to create a more natural looking landscape.
There is a short- to medium-term reduction in erosion.
Can potentially offer cost reductions compared with at-sea disposal of dredgings.
Issues: Moderate to high cost and may require regular top-ups, unless a very large one-off large scheme is implemented.
Requires a sediment source which limits locations, volumes of material and timing of supply.
Fine-grained sediment is subject to dispersal during placement, and fencing structures may be needed to retain sediment until it consolidates. Sediment screens may be needed in sensitive areas such as shell fisheries.
Schemes require careful design and post-construction monitoring.
In the UK, dredged sediment is regarded as waste and therefore subject to a strict consenting regime. This can be time-consuming and has been a factor in limiting the number of schemes completed to date. Despite a large potential for these schemes, sediment nourishment on mudflats and saltmarshes has within the UK so far been relatively small scale.
Appropriate sediments may be unavailable or expensive.
Considerations: Appropriate sediment sources, usually maintenance dredgings, need to be sourced.
Sedimentological characteristics (including size and chemical properties).
Elevation and profile of nourished area require design awareness of likely dispersal and consolidation over time.
Retention of fine grain material on mudflats or saltmarsh areas may require retaining bunds or brushwood fences.
Dispersal of sediment and smothering issues of existing habitats near to nourishment site.
Monitoring will be needed during and following placement.
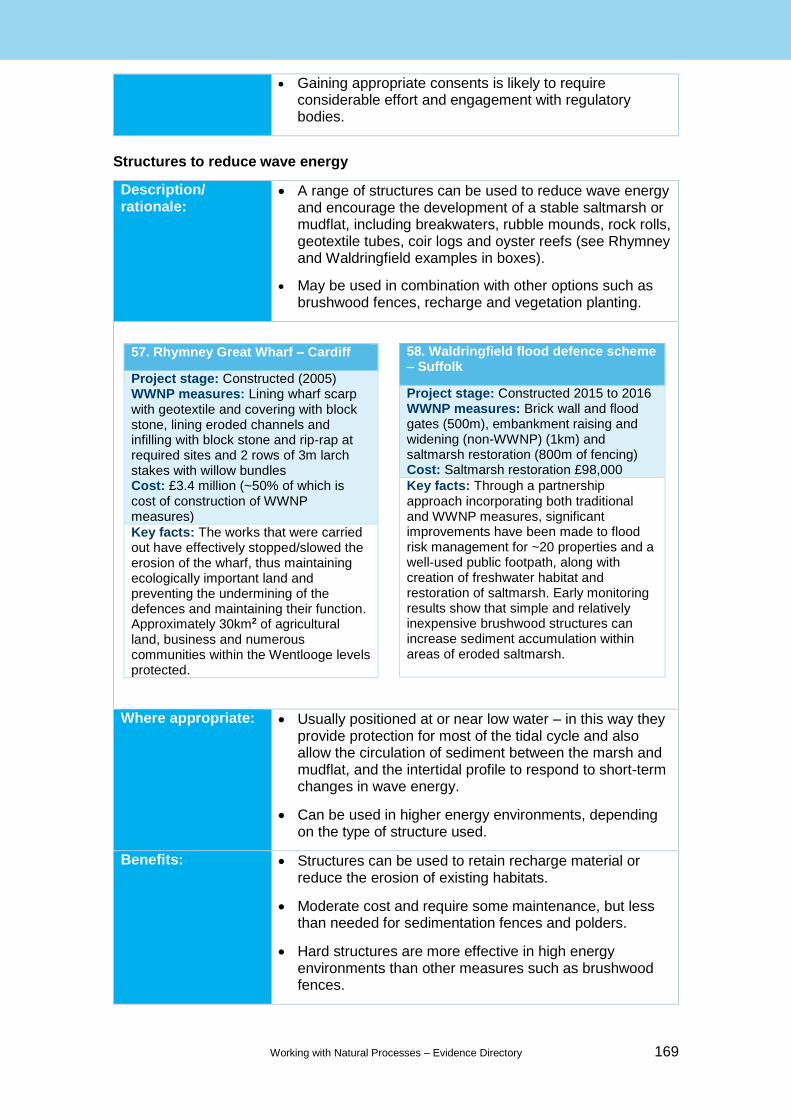
Working with Natural Processes – Evidence Directory 169
Gaining appropriate consents is likely to require considerable effort and engagement with regulatory bodies.
Structures to reduce wave energy
Description/ rationale:
A range of structures can be used to reduce wave energy and encourage the development of a stable saltmarsh or mudflat, including breakwaters, rubble mounds, rock rolls, geotextile tubes, coir logs and oyster reefs (see Rhymney and Waldringfield examples in boxes).
May be used in combination with other options such as brushwood fences, recharge and vegetation planting.
Where appropriate: Usually positioned at or near low water – in this way they provide protection for most of the tidal cycle and also allow the circulation of sediment between the marsh and mudflat, and the intertidal profile to respond to short-term changes in wave energy.
Can be used in higher energy environments, depending on the type of structure used.
Benefits: Structures can be used to retain recharge material or reduce the erosion of existing habitats.
Moderate cost and require some maintenance, but less than needed for sedimentation fences and polders.
Hard structures are more effective in high energy environments than other measures such as brushwood fences.
57. Rhymney Great Wharf – Cardiff
Project stage: Constructed (2005) WWNP measures: Lining wharf scarp with geotextile and covering with block stone, lining eroded channels and infilling with block stone and rip-rap at required sites and 2 rows of 3m larch stakes with willow bundles Cost: £3.4 million (~50% of which is cost of construction of WWNP measures)
Key facts: The works that were carried out have effectively stopped/slowed the erosion of the wharf, thus maintaining ecologically important land and preventing the undermining of the defences and maintaining their function. Approximately 30km2 of agricultural land, business and numerous communities within the Wentlooge levels protected.
58. Waldringfield flood defence scheme – Suffolk
Project stage: Constructed 2015 to 2016 WWNP measures: Brick wall and flood gates (500m), embankment raising and widening (non-WWNP) (1km) and saltmarsh restoration (800m of fencing) Cost: Saltmarsh restoration £98,000
Key facts: Through a partnership approach incorporating both traditional and WWNP measures, significant improvements have been made to flood risk management for ~20 properties and a well-used public footpath, along with creation of freshwater habitat and restoration of saltmarsh. Early monitoring results show that simple and relatively inexpensive brushwood structures can increase sediment accumulation within areas of eroded saltmarsh.
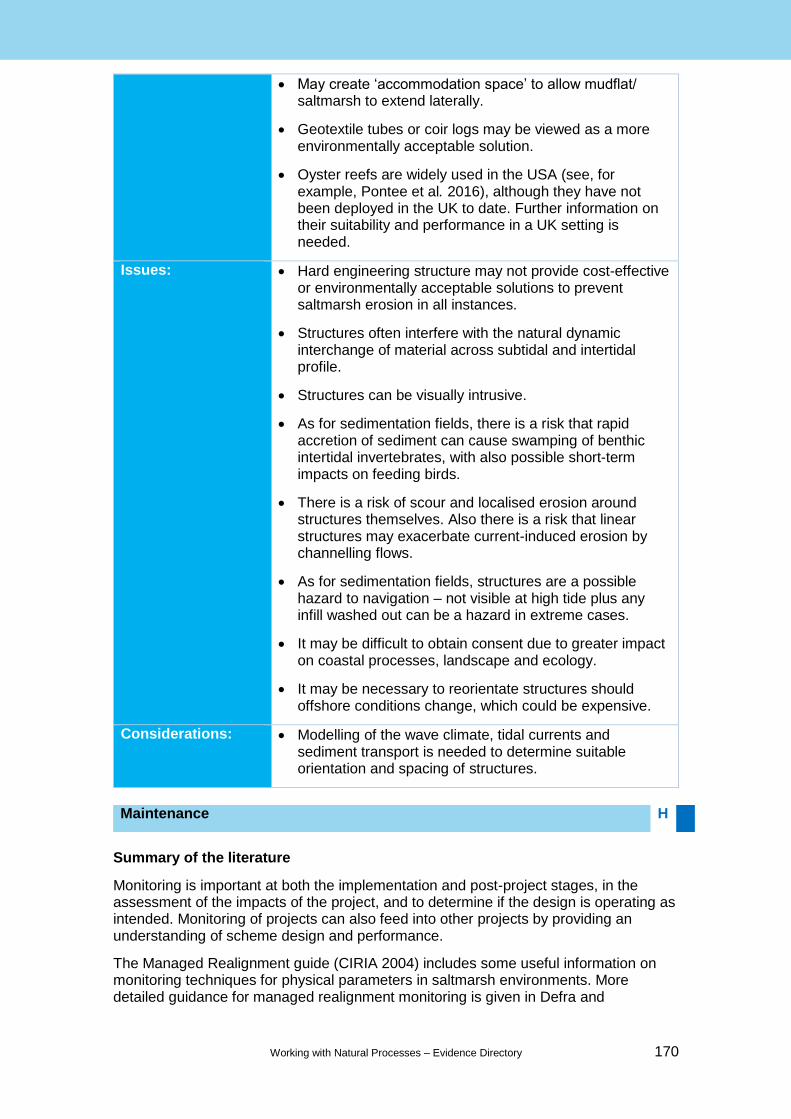
Working with Natural Processes – Evidence Directory 170
May create ‘accommodation space’ to allow mudflat/ saltmarsh to extend laterally.
Geotextile tubes or coir logs may be viewed as a more environmentally acceptable solution.
Oyster reefs are widely used in the USA (see, for example, Pontee et al. 2016), although they have not been deployed in the UK to date. Further information on their suitability and performance in a UK setting is needed.
Issues: Hard engineering structure may not provide cost-effective or environmentally acceptable solutions to prevent saltmarsh erosion in all instances.
Structures often interfere with the natural dynamic interchange of material across subtidal and intertidal profile.
Structures can be visually intrusive.
As for sedimentation fields, there is a risk that rapid accretion of sediment can cause swamping of benthic intertidal invertebrates, with also possible short-term impacts on feeding birds.
There is a risk of scour and localised erosion around structures themselves. Also there is a risk that linear structures may exacerbate current-induced erosion by channelling flows.
As for sedimentation fields, structures are a possible hazard to navigation – not visible at high tide plus any infill washed out can be a hazard in extreme cases.
It may be difficult to obtain consent due to greater impact on coastal processes, landscape and ecology.
It may be necessary to reorientate structures should offshore conditions change, which could be expensive.
Considerations: Modelling of the wave climate, tidal currents and sediment transport is needed to determine suitable orientation and spacing of structures.
Summary of the literature
Monitoring is important at both the implementation and post-project stages, in the assessment of the impacts of the project, and to determine if the design is operating as intended. Monitoring of projects can also feed into other projects by providing an understanding of scheme design and performance.
The Managed Realignment guide (CIRIA 2004) includes some useful information on monitoring techniques for physical parameters in saltmarsh environments. More detailed guidance for managed realignment monitoring is given in Defra and
Maintenance H
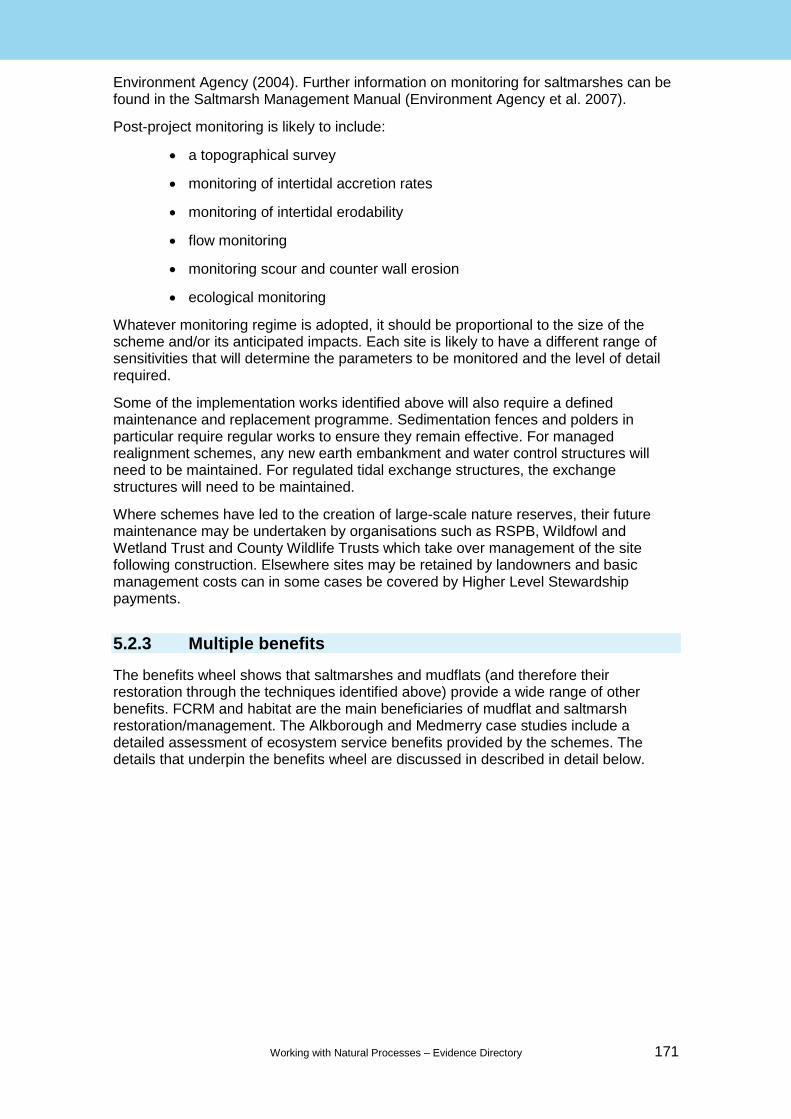
Working with Natural Processes – Evidence Directory 171
Environment Agency (2004). Further information on monitoring for saltmarshes can be found in the Saltmarsh Management Manual (Environment Agency et al. 2007).
Post-project monitoring is likely to include:
a topographical survey
monitoring of intertidal accretion rates
monitoring of intertidal erodability
flow monitoring
monitoring scour and counter wall erosion
ecological monitoring
Whatever monitoring regime is adopted, it should be proportional to the size of the scheme and/or its anticipated impacts. Each site is likely to have a different range of sensitivities that will determine the parameters to be monitored and the level of detail required.
Some of the implementation works identified above will also require a defined maintenance and replacement programme. Sedimentation fences and polders in particular require regular works to ensure they remain effective. For managed realignment schemes, any new earth embankment and water control structures will need to be maintained. For regulated tidal exchange structures, the exchange structures will need to be maintained.
Where schemes have led to the creation of large-scale nature reserves, their future maintenance may be undertaken by organisations such as RSPB, Wildfowl and Wetland Trust and County Wildlife Trusts which take over management of the site following construction. Elsewhere sites may be retained by landowners and basic management costs can in some cases be covered by Higher Level Stewardship payments.
5.2.3 Multiple benefits
The benefits wheel shows that saltmarshes and mudflats (and therefore their restoration through the techniques identified above) provide a wide range of other benefits. FCRM and habitat are the main beneficiaries of mudflat and saltmarsh restoration/management. The Alkborough and Medmerry case studies include a detailed assessment of ecosystem service benefits provided by the schemes. The details that underpin the benefits wheel are discussed in described in detail below.
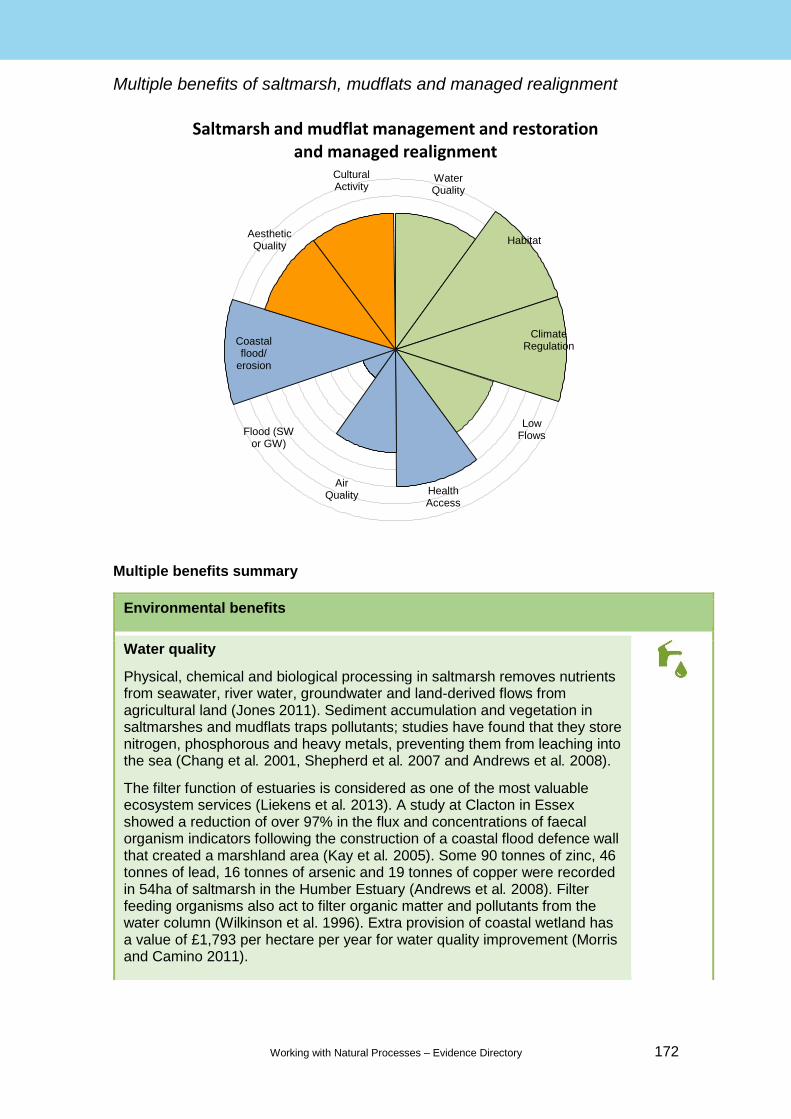
Working with Natural Processes – Evidence Directory 172
Multiple benefits of saltmarsh, mudflats and managed realignment
Multiple benefits summary
Environmental benefits
Water quality
Physical, chemical and biological processing in saltmarsh removes nutrients from seawater, river water, groundwater and land-derived flows from agricultural land (Jones 2011). Sediment accumulation and vegetation in saltmarshes and mudflats traps pollutants; studies have found that they store nitrogen, phosphorous and heavy metals, preventing them from leaching into the sea (Chang et al. 2001, Shepherd et al. 2007 and Andrews et al. 2008).
The filter function of estuaries is considered as one of the most valuable ecosystem services (Liekens et al. 2013). A study at Clacton in Essex showed a reduction of over 97% in the flux and concentrations of faecal organism indicators following the construction of a coastal flood defence wall that created a marshland area (Kay et al. 2005). Some 90 tonnes of zinc, 46 tonnes of lead, 16 tonnes of arsenic and 19 tonnes of copper were recorded in 54ha of saltmarsh in the Humber Estuary (Andrews et al. 2008). Filter feeding organisms also act to filter organic matter and pollutants from the water column (Wilkinson et al. 1996). Extra provision of coastal wetland has a value of £1,793 per hectare per year for water quality improvement (Morris and Camino 2011).
Saltmarsh and mudflat management and restoration and managed realignment
Water Quality
Habitat
Climate Regulation
Low Flows
Coastal flood/
erosion
Flood (SW or GW)
Air Quality Health
Access
Cultural Activity
Aesthetic Quality
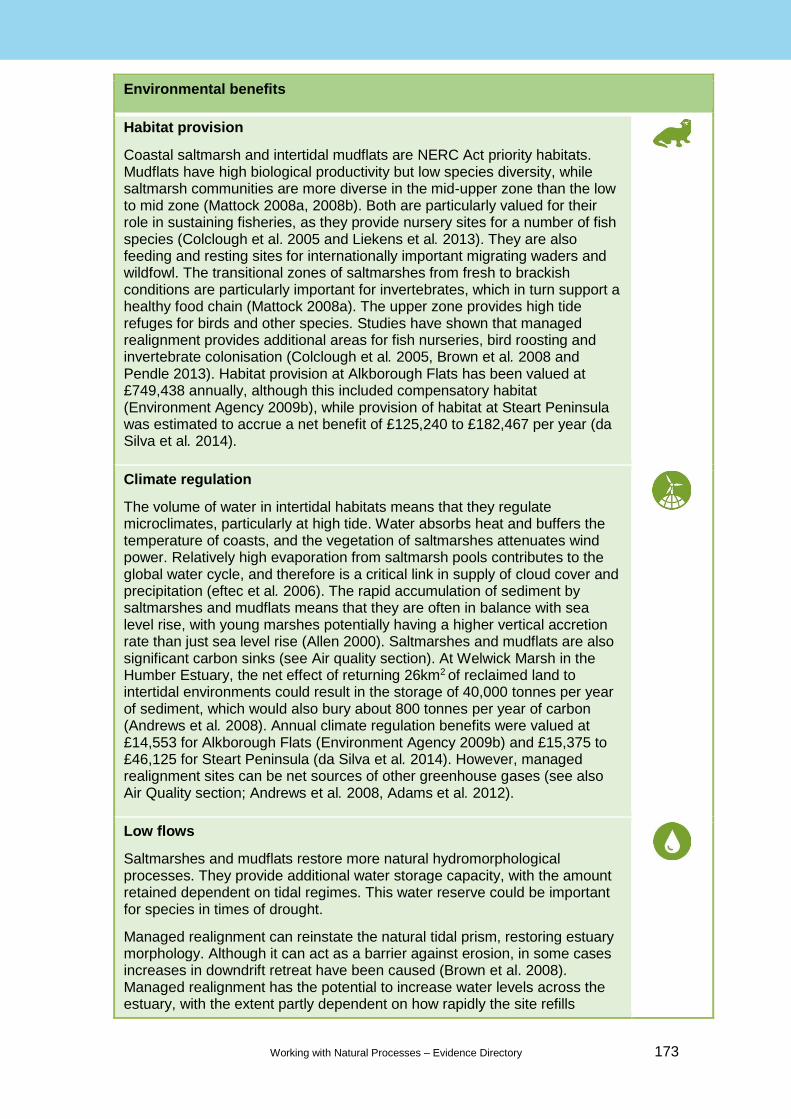
Working with Natural Processes – Evidence Directory 173
Environmental benefits
Habitat provision
Coastal saltmarsh and intertidal mudflats are NERC Act priority habitats. Mudflats have high biological productivity but low species diversity, while saltmarsh communities are more diverse in the mid-upper zone than the low to mid zone (Mattock 2008a, 2008b). Both are particularly valued for their role in sustaining fisheries, as they provide nursery sites for a number of fish species (Colclough et al. 2005 and Liekens et al. 2013). They are also feeding and resting sites for internationally important migrating waders and wildfowl. The transitional zones of saltmarshes from fresh to brackish conditions are particularly important for invertebrates, which in turn support a healthy food chain (Mattock 2008a). The upper zone provides high tide refuges for birds and other species. Studies have shown that managed realignment provides additional areas for fish nurseries, bird roosting and invertebrate colonisation (Colclough et al. 2005, Brown et al. 2008 and Pendle 2013). Habitat provision at Alkborough Flats has been valued at £749,438 annually, although this included compensatory habitat (Environment Agency 2009b), while provision of habitat at Steart Peninsula was estimated to accrue a net benefit of £125,240 to £182,467 per year (da Silva et al. 2014).
Climate regulation
The volume of water in intertidal habitats means that they regulate microclimates, particularly at high tide. Water absorbs heat and buffers the temperature of coasts, and the vegetation of saltmarshes attenuates wind power. Relatively high evaporation from saltmarsh pools contributes to the global water cycle, and therefore is a critical link in supply of cloud cover and precipitation (eftec et al. 2006). The rapid accumulation of sediment by saltmarshes and mudflats means that they are often in balance with sea level rise, with young marshes potentially having a higher vertical accretion rate than just sea level rise (Allen 2000). Saltmarshes and mudflats are also significant carbon sinks (see Air quality section). At Welwick Marsh in the Humber Estuary, the net effect of returning 26km2 of reclaimed land to intertidal environments could result in the storage of 40,000 tonnes per year of sediment, which would also bury about 800 tonnes per year of carbon (Andrews et al. 2008). Annual climate regulation benefits were valued at £14,553 for Alkborough Flats (Environment Agency 2009b) and £15,375 to £46,125 for Steart Peninsula (da Silva et al. 2014). However, managed realignment sites can be net sources of other greenhouse gases (see also Air Quality section; Andrews et al. 2008, Adams et al. 2012).
Low flows
Saltmarshes and mudflats restore more natural hydromorphological processes. They provide additional water storage capacity, with the amount retained dependent on tidal regimes. This water reserve could be important for species in times of drought.
Managed realignment can reinstate the natural tidal prism, restoring estuary morphology. Although it can act as a barrier against erosion, in some cases increases in downdrift retreat have been caused (Brown et al. 2008). Managed realignment has the potential to increase water levels across the estuary, with the extent partly dependent on how rapidly the site refills
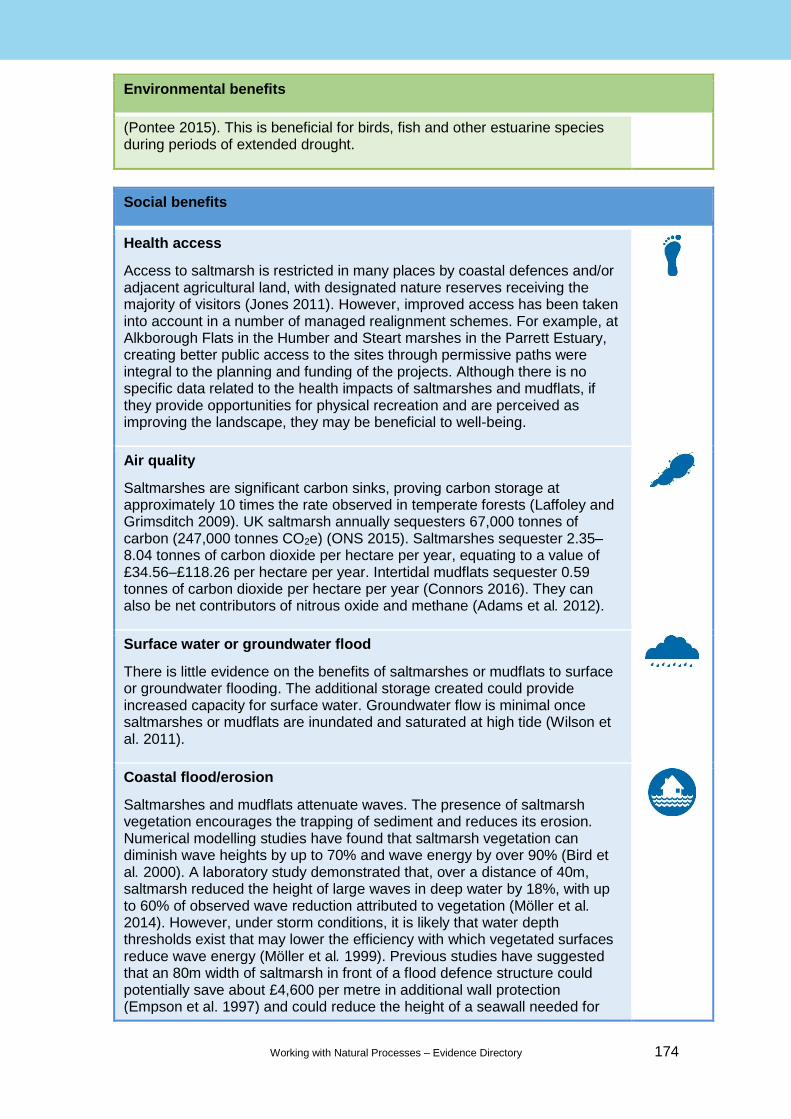
Working with Natural Processes – Evidence Directory 174
Environmental benefits
(Pontee 2015). This is beneficial for birds, fish and other estuarine species during periods of extended drought.
Social benefits
Health access
Access to saltmarsh is restricted in many places by coastal defences and/or adjacent agricultural land, with designated nature reserves receiving the majority of visitors (Jones 2011). However, improved access has been taken into account in a number of managed realignment schemes. For example, at Alkborough Flats in the Humber and Steart marshes in the Parrett Estuary, creating better public access to the sites through permissive paths were integral to the planning and funding of the projects. Although there is no specific data related to the health impacts of saltmarshes and mudflats, if they provide opportunities for physical recreation and are perceived as improving the landscape, they may be beneficial to well-being.
Air quality
Saltmarshes are significant carbon sinks, proving carbon storage at approximately 10 times the rate observed in temperate forests (Laffoley and Grimsditch 2009). UK saltmarsh annually sequesters 67,000 tonnes of carbon (247,000 tonnes CO2e) (ONS 2015). Saltmarshes sequester 2.35–8.04 tonnes of carbon dioxide per hectare per year, equating to a value of £34.56–£118.26 per hectare per year. Intertidal mudflats sequester 0.59 tonnes of carbon dioxide per hectare per year (Connors 2016). They can also be net contributors of nitrous oxide and methane (Adams et al. 2012).
Surface water or groundwater flood
There is little evidence on the benefits of saltmarshes or mudflats to surface or groundwater flooding. The additional storage created could provide increased capacity for surface water. Groundwater flow is minimal once saltmarshes or mudflats are inundated and saturated at high tide (Wilson et al. 2011).
Coastal flood/erosion
Saltmarshes and mudflats attenuate waves. The presence of saltmarsh vegetation encourages the trapping of sediment and reduces its erosion. Numerical modelling studies have found that saltmarsh vegetation can diminish wave heights by up to 70% and wave energy by over 90% (Bird et al. 2000). A laboratory study demonstrated that, over a distance of 40m, saltmarsh reduced the height of large waves in deep water by 18%, with up to 60% of observed wave reduction attributed to vegetation (Möller et al. 2014). However, under storm conditions, it is likely that water depth thresholds exist that may lower the efficiency with which vegetated surfaces reduce wave energy (Möller et al. 1999). Previous studies have suggested that an 80m width of saltmarsh in front of a flood defence structure could potentially save about £4,600 per metre in additional wall protection (Empson et al. 1997) and could reduce the height of a seawall needed for

Working with Natural Processes – Evidence Directory 175
Social benefits
landward defences from 12m to only 3m (King and Lester 1995). Projected long-term benefits from UK managed realignment schemes are high: the flood defence benefit of the Alkborough Flats development has been valued at £12.26 million (Environment Agency 2009b). However, such values need to be treated with care and the potential for cost savings needs to be evaluated on a case by case basis. Site-specific assessments need to consider the time taken for new saltmarshes to establish in front of defences, the future longevity of any saltmarsh habitats and the source of risk.
Cultural benefits
Aesthetics
Saltmarshes are wild places, creating iconic landscapes depicted in art and literature (Jones 2011). Saltmarsh is valued at approximately £1,400 per hectare per year (2008 prices) for benefits to water quality improvement, recreation, biodiversity and aesthetic amenity, while intertidal mudflat is valued at approximately £1,300 per hectare per year (eftec 2010). Studies have found significant willingness to pay for the restoration of saltmarshes and mudflats (Udziela and Bennett 1997). Estimates of willingness to pay for those that are Sites of Special Scientific Interest (SSSIs), based on a ‘maintain funding’ scenario are £1,035 per hectare per year, while for an increased funding scenario, they are £709 per hectare per year (Christie and Rayment 2012).
Managed realignment schemes can have aesthetic benefits, particularly when compared with hard flood defences. Aesthetics and amenity of additional coastal wetlands have a marginal value of £1,394 per hectare per year (Morris and Camino 2011). An assessment at Steart concluded that managed realignment would have a beneficial impact on landscape character and visual amenity by creating a more diverse, sustainable environment (Environment Agency 2011b). At the Blackwater Estuary, there was significant willingness to pay for the recreational, amenity and biodiversity benefits of the managed realignment scheme (Luisetti et al. 2008). However, public perception studies have found mixed opinions about managed realignment (Myatt et al. 2003, Waddington 2016). This is partly due to a belief that it brings flood risk closer, with local residents ‘feeling safer’ behind large engineered defences such as seawalls (Freiss et al. 2008). The extent of landscape change involved may also attract opposition from local stakeholders. Public engagement and education can improve perceptions of managed realignment.
Cultural activities
Saltmarshes and mudflats predominantly attract visitors with a natural history interest. A new nature reserve created in 2002 provided public access to The Wash, attracting more than 50,000 visits in its second year of opening, with visitors spending an estimated £500,000 locally on food and services (Jones 2011). Activities including bird watching, wildfowl hunting, fishing and water sports are particularly popular. The intertidal zone is rich in archaeology, including shipwrecks and settlements, which is well-preserved by sediments

Working with Natural Processes – Evidence Directory 176
Cultural benefits
(eftec et al. 2006). These environments also provide opportunities for farm diversification into high value products such as saltmarsh lamb.
Diversification of the landscape from managed realignment enhances opportunities for a range of cultural activities, including nature tourism and physical recreation. Non-consumptive recreation from additional coastal wetland provision has a marginal value of £504 per hectare per year (Morris and Camino 2011). At Steart, the creation of wetland habitat and a new network of paths was projected to triple visitor numbers, creating economic benefits in the order of £300,840 to £469,310 per year. It was also expected to bring enhanced opportunities for public engagement and formal learning, yielding an educational benefit per annum of £87,000 to £132,000 (da Silva et al. 2014). Recreation and tourism benefits at Alkborough were estimated at £164,830 based on the expansion of amenities and predicted increase in visitors (Environment Agency 2009c).
5.3 Sand dune management and restoration
5.3.1 Introduction
Key case studies (click here):
Hightown
South Milton Sands
What is sand dune management/restoration?
Coastal dunes provide natural flood defence and erosion protection, as well as many other functions and benefits. Ideally, in WWNP, dunes would be left unmanaged to evolve in response to prevailing waves, tides and waves. However, most dune systems in the UK accommodate some form of human development and therefore erosion management is required to reduce the risk to backshore assets such as properties, caravan parks, golf courses and recreational facilities, or to reduce damage caused by various activities.
Current management responses depend predominately on the assets at risk and range from large-scale works to stabilise beaches and dunes to low key measures such as access control. The relationship between the morphology of dunes and the ecology they support means that there is significant overlap between ecology management and flood and coastal erosion risk management.
The interrelationship between the beach and dune systems means that management of dunes commonly involves the management of fronting beaches. Approaches to beach management through beach nourishment are discussed in Section 5.4.
Hightown Sand Dunes Source: Sefton Council
Working with Natural Processes – Evidence Directory 177
5.3.2 Flood risk evidence
This section sets out what we know in terms of the effectiveness of this measure from an FCRM perspective and the scientific confidence in what we know.
Summary of the literature
Beach dune systems form a natural barrier that reduces the risk of tidal inundation landward of the dune.
Dunes also act as reservoirs of sand to nourish beaches during storms. Through this function they form a buffer zone, protecting structures or cliffs behind from direct wave attack and erosion.
They also protect estuaries and lagoons through restricting the passage of storm surges and open sea waves (Pye et al. 2007).
Dunes are dynamic features and changes can be unpredictable and rapid. Periods of little of no change can be followed by significant erosion during storms when several metres of recession can occur in a few hours.
Their dynamic nature is, however, a benefit of dunes in terms of their defence capacity. This means that, although dunes may erode during storms, if there is a sufficient supply of sand, the dunes will naturally rebuild with little or no measures needed. However, there are 2 potential issues:
o a dune may not be of sufficient size to sustain an adequate level of protection during a particular storm event
o if there is no replenishment source for the dunes, the dunes will not rebuild naturally
Compared with other structural options, dunes are more adaptable as they are potentially able to respond more readily to changes in environmental forcing factors such as climate change, sea level change and sediment supply conditions then other structural options (Pye et al. 2007).
Dunes also deliver additional socioeconomic and environmental benefits. They support a wide range of important habitats and many are designated conservation areas. Dunes are also important for recreation and other related activities.
In the past, dune management has focused on trying to halt any natural processes, fully stabilise dunes and thereby fix the position of frontal dunes. Through recognition that this has had detrimental effects on the environmental value of dunes, more recently there has been a move towards working more with the natural mobility of the dune while still managing erosion and restoring dunes where necessary in order to fulfil their FCRM function.
Performance factors in terms of FCRM function:
Dune height and width. Wider and higher dunes provide a more significant FCRM function through proving a larger buffer of sand and providing a more substantial barrier. Dune systems <5m wide and/or <2m high can be considered to have limited flood defence value since it is possible for such dunes to be eroded or severely overtopped in a single storm (Pye et al. 2007). Previous dune management in the Netherlands had focused on maintaining a defined dune height and width; however, more recently management there has moved towards
Flood and coastal erosion risk evidence M

Working with Natural Processes – Evidence Directory 178
dynamic management whereby dune recovery is unaided (see, for example, de Jong et al. 2014).
o Dune morphology. The topography of the frontal dunes is also important. Natural, more irregular frontal dunes may not provide a consistent SoP, with the development and evolution of blowouts in naturally low areas potentially increasing the risk of breach. Composite dune systems comprising multiple dune ridges of low to moderate height can form a valuable natural flood defence.
o Presence of vegetation. Vegetation stabilises the dune surface by reducing wind energy at the surface, thereby limiting scour and encouraging sediment deposition. Sand-binding grasses also help provide some resistance to wave erosion, but will not prevent erosion. There have, however, been situations where the presence of trees along the frontal dunes has accelerated erosion due to falling trees (and associated root system), resulting in a larger area of frontal dune failure.
o Beach morphology. Sediment supply and, in particular, beach width and fetch length, are critical factors in dune initiation and growth (Hesp 2013). In general, the wider the beach (or available sediment fetch), the greater the likelihood that dunes will form and survive. There is therefore a close relationship between the dune and beach. Recent dynamic dune management in the Netherlands has focused on improving beach–dune dynamics through nourishing the frontal beaches and nearshore (see, for example, Arens et al. 2013). This approach has not been commonly used in the UK to date.
o Sediment supply. Dunes rely on an available source of sand. The vast majority of dune systems in England and Wales are composed of medium, well-sorted sand, although some sites, especially in the south-west, are composed of less well-sorted, coarser sand (Pye et al. 2007).
In the UK, where dunes are defined as a defences or included as part of an integrated defence scheme that incorporates hard structures, a ‘standard’ or ‘level of protection’ may be defined. There is, however, no set guidance on how this relates to dune height or width, or how the breach potential should be calculated. Elsewhere, however, such as in the Netherlands and parts of the North Sea coasts of Denmark, Germany and Belgium, dunes have been heavily engineering to provide a set SoP (Pye et al. 2007). In the Netherlands, in particular, minimum beach widths have previously been prescribed for dune barriers based on observations of dune recession, risk of breaching and overtopping.
59. Hightown sand dune restoration – Hightown, Merseyside
Project stage: Constructed (2011) WWNP measures: Sand dune restoration, rock groyne, seawall. Cost: £1.4 million (~£800,000 for sand dune restoration)
Key facts: Works were carried out to reinstate dunes to the same position they were in 30 years ago. Prior to the project, this section of coast was losing, on average, 1,000m3 of sand per year. Post-project, the frontage is losing the same, so increasing the dune volume by 28,000m3 of sand potentially has ‘bought’ around 28 years of time.
60. South Milton Sands – Devon
Project stage: Constructed (2009) and further modified (2014) WWNP measures: Dune reinstatement and management, construction of timber palisade Cost: £10,000
Key facts: It is possible to manage dunes for flood defence, conservation and recreation while engaging local communities in doing so. Long-term sustainability requires sufficient accommodation space to accommodate naturally occurring coastal realignment.
Working with Natural Processes – Evidence Directory 179
Summary of the literature
Coastal dunes in England and Wales occupy an area of ~200km2, made up of around 158 individual locations (Pye et al. 2007), and ranging in character from pocket beaches and climbing dunes to large-scale dune fields. In general, dunes are poorly developed along the coasts of south-east and southern England due to lack of accommodation space, local dominance of muddy or gravelly coastal sediments and/or limited exposure to onshore winds (Pye et al. 2007). The largest dune system in England and Wales is at Sefton on the Lancashire coast, and is nearly 20km2 in area (Pye et al. 2007). There are 3 key coastal settings (open coast, embayment and estuarine) but many dunes systems transgress across the 3 types.
There are few, if any, areas of entirely natural coastal dune landscapes in England and Wales (Pye et al. 2007). Most have either been directly modified over a number of centuries to accommodate a range of land uses from the construction of buildings and properties to livestock grazing, or have been affected by beach management activities along adjacent stretches of coast, such as groynes and seawalls that have had an impact on sediment supply to the dunes.
The flood and coastal defence function of dunes varies in significance around England and Wales (Pye et al. 2007) (Figure 5.5). In the south-west, a number of the dunes systems are climbing dunes or pocket dunes, backed by hard rock cliffs and therefore perform little defence function. In contrast, dunes in north Norfolk form an important flood barrier to extensive low-lying agriculture areas.
Summary of the literature
There is extensive literature available on the physical processes that govern the development and evolution of dunes. The key points are summarised here, focusing on aspects which relate to their management for FCRM.
Dunes are dynamic features that respond readily to prevailing conditions. They can both accrete (gain sediment), which can result in either an increase in dune height or seawards growth (known as progradation), and erode (lose sediment), resulting in recession (landward movement) of the dune front. Dunes can also migrate inland – without any gain or loss of sediment – through the landward transport of sand; this could be due to wind processes or as a result of wave overwashing.
Dunes form beyond the action of normal waves, as a result of sediment accumulating around beach debris (this could be natural, such as seaweed or boulders, or manmade, that is, beach litter). Pioneer vegetation then starts to grow on these mounds of sand, which reduces the wind flow over the small dune forms, stabilises the sand, and encourages further deposition of sand. These small dune forms are known as embryo dunes. They will continue to grow both vertically and seawards, and potentially join to form a new dune ridge, unless they are removed by wave erosion. Further colonisation of the dune occurs as foredunes grow vertically above the level of normal wave run-up.
In order for dunes to form, there needs to be an adequate supply of sand over a wide drying beach, onshore (or near onshore) winds and accommodation space to enable the accumulation of sand
Distribution in England and Wales H
Relevant physical processes H
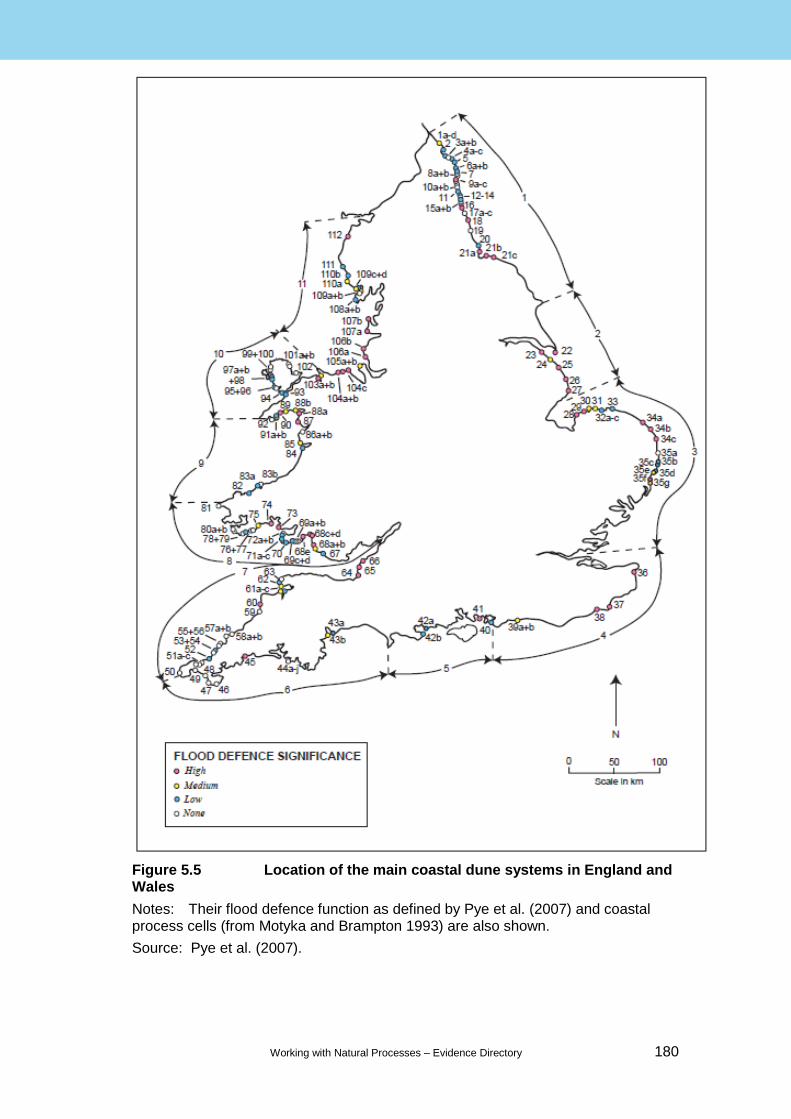
Working with Natural Processes – Evidence Directory 180
Figure 5.5 Location of the main coastal dune systems in England and Wales
Notes: Their flood defence function as defined by Pye et al. (2007) and coastal process cells (from Motyka and Brampton 1993) are also shown.
Source: Pye et al. (2007).
Working with Natural Processes – Evidence Directory 181
Dunes should not be considered in isolation. Their morphology and behaviour is closely related to that of the beach and nearshore; these affect both wave energy at the toe of the dunes and the availability of sediment for accretion.
The mobility of frontal dunes depends upon a number of factors.
o Wind energy. High wind speeds promotes mobility of frontal and hind dunes.
o Wave energy (including frequency and magnitude of storms). Higher wave energy results in greater erosion and may affect recovery rates of frontal dunes.
o Vegetation cover/ growth rates. Low growth or low existing vegetation cover promotes greater mobility.
o Precipitation. Low rainfall leads to lower rates of vegetation growth and therefore increases sand blow and mobility.
o Water table levels. As for precipitation, a low water table level leads to lower rates of vegetation growth, and therefore increases sand blow and mobility.
o Sand availability. While high rates of littoral sand supply can lead to greater dune mobility, they can conversely result in coastal progradation and frontal dune stability.
o Fronting beach condition. This affects exposure of the frontal dunes to waves and affects sediment supply.
o Disturbance (human, animal). High levels of disturbance, such as recreation activities and grazing by livestock and rabbits, tend to reduce vegetation cover and increase mobility.
Although increased dune mobility is beneficial in terms of increasing habitat and species biodiversity, and also the ability of the system to adapt to future changes, where dunes form the primary defence against flooding Where sufficient accommodation space exists landwards of the coast, it may be possible to encourage increased mobility and allow dune rollback in order to allow the shoreline to reach a more sustainable position.
Dunes lie above the action of normal waves and therefore marine erosion is related to storm conditions, when both waves and water levels are high. During these conditions, the beach in front of the dunes may erode and be flattened by waves, leading to increased exposure of the dune toe to wave attack. During a storm event there are 3 possible scenarios:
o Erosion – the dune may loss some sediment from the front face but still retain sufficient volume to provide flood protection
o Overwash – the dune is eroded to the point that waves can flow over the dune crest, accelerating erosion damage and potential exposing landward areas to flooding from overtopping water
o Breach – this is when a gap forms into the dunes meaning that most or all of the dune’s capacity to protect landward areas from flooding by surge is eliminated
The impact of future climate change on dune behaviour remains uncertain, in part due to uncertainty in the likely rate of change in prevailing conditions (namely sea level rise, wind regime, wave energy and storm surge frequency and magnitude) and the critical values of these. If change becomes increasingly rapid, some beach and dune systems may not be able to adapt sufficiently quickly and there may be major changes in the size and morphology of some dune fields (Pye et al. 2007). At a local level, the dune response will also depend on the size and type of dune systems, and the management of the dunes and adjoining beaches.

Working with Natural Processes – Evidence Directory 182
Summary of the literature
This section considers the range of possible approaches and measures to managing dune erosion. Although these may also enhance or restore the dune in terms of their ecological value, the primary consideration here is management of dunes to fulfil, restore or improve their function as a flood and coastal erosion defence. Therefore within this report, there is no specific discussion of conservation management measures such as actively destabilising/ remobilising a dune system (see, for example, Pye and Blott 2017 In Press), or the repair/prevention of damage caused to dunes by recreation or overgrazing (see, for example, see Agate 1986, Arens et al. 2005, Brooks and Agate 2005, Houston 2008).
There are 4 general approaches to managing dune erosion:
non-interference
erosion-slowing
selectively defend
establish a fixed shoreline
Table 5.2 shows how each of these could be considered under one of the 4 FCRM strategic policies of No Active Measure, Managed Realignment, Hold the Line or Advance the Line (although it is unlikely that dune management would be considered under an Advance the Line policy). Relevant measures under each approach are also identified. Note that this list is not exhaustive but covers the main measures currently employed in the UK.
Table 5.2 Four approaches to dune management
Approach Description Policy Measures
Non-interference
Allow natural processes and accept losses or relocate backshore assets
No Active Measure or Managed Realignment
Adaptive management
Erosion-slowing
Measures to delay erosion but with minimal disruption to natural processes, wider environment and landscape
Managed Realignment
Dune grass planting
Thatching
Fencing
Dune reprofiling
Nourishment
Sand bag structures
Gabion baskets
Selectively defend
Local and medium-term measures that will minimise erosion but will have some impact on natural processes, the wider environment and landscape
Managed Realignment or Hold the Line
Individual rock or gabion headlands
Groynes
Artificial reefs
Detached breakwater
Establish a fixed shoreline
Large-scale, long-term defences that fundamentally alter natural processes and therefore affect
Hold the Line Rock revetments
Timber revetments and breastwork
Management approach M

Working with Natural Processes – Evidence Directory 183
Approach Description Policy Measures
the coastal environment and landscape
Seawalls
Source: modified from SNH (2000)
There is overlap between the various approaches, and a number of measures could equally apply to a different category depending on the scale and nature of works proposed. The various measures are also often used in combination.
For the purpose of this report, the focus is on the erosion-slowing measures. These are measures that are used to delay erosion but with minimal disruption to natural processes, and therefore fit within the principles of WWNP.
The following sections summarise each of the measures listed in Table 5.2, outlining the most important benefits and potential issues. This builds on information provided in SNH (2000) and Pye et al. (2007), with additional information from other studies, both from the UK and overseas. Although nourishment is included within this section, further information is provided in Section 5.4 on beach nourishment.
It is not possible to define a list of recommended measures, as this will vary from site to site due to differences in the nature of the problem, the main objectives and constraints. Each dune site therefore needs to be considered independently and measures tailored accordingly, and it is recommended that Dune Management Plans are established prior to any management works (see below). Some advice is, however, provided in below table on where measures may be used most appropriately.
It is also important to understand that not all measures will work in all situations. In the Netherlands, there is currently a move towards ‘dynamic coastal management’, also referred to as ‘building with nature’ (see, for example, De Jong et al. 2014). In this aspect, management is moving away from use of measures such as sand fences, reprofiling and revegetation to restore dunes. Instead the emphasis is on large-scale nourishments of the beach and nearshore zone, and allowing nature to redistribute the sand in such a way that the necessary SoP provided by the dunes is maintained or improved. This is, however, a high cost measure and is unlikely to be justified economically along many of the UK dune frontages. It is also unlikely to address issues or achieve the requirements for FCRM in locations where existing dunes are narrow or discontinuous.
Dynamic management can only be considered in places where the dune belt is wide, that is, over 500m (Pye et al. 2007). Success will also depend on local conditions such as prevailing wind and waves, tidal range and longshore drift. Although it is likely that there will also be a need for some of the more traditional ‘soft’ measures described below, the aim should be to tailor the solution to the problem and to minimise the disruption to natural processes.
Dune grass planting
Description/ rationale:
Encourages dune growth by trapping and stabilising blown sand, thereby increasing the buffer zone.
Does not prevent wave erosion but may encourage better recovery following storms and increase the resilience of dunes. Can also be used effectively to repair damaged areas to sustain the SoP.
Can be used in combination with other measures such as thatching, fencing and beach nourishment.
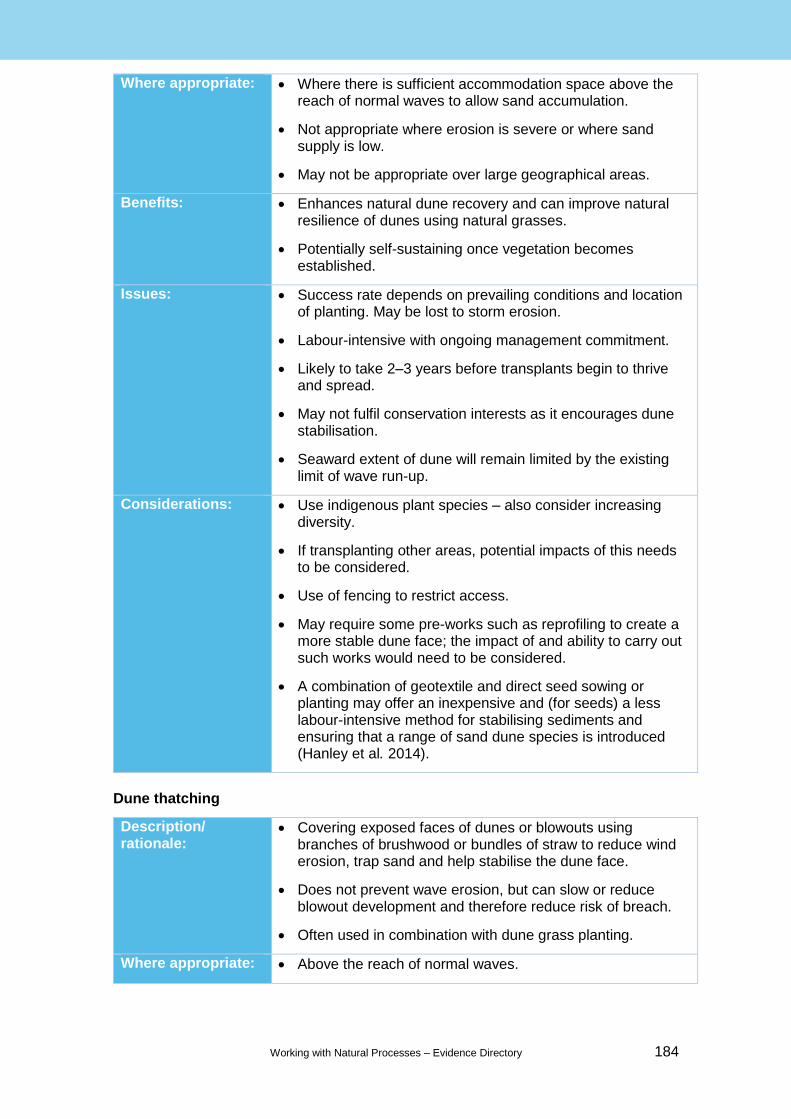
Working with Natural Processes – Evidence Directory 184
Where appropriate: Where there is sufficient accommodation space above the reach of normal waves to allow sand accumulation.
Not appropriate where erosion is severe or where sand supply is low.
May not be appropriate over large geographical areas.
Benefits: Enhances natural dune recovery and can improve natural resilience of dunes using natural grasses.
Potentially self-sustaining once vegetation becomes established.
Issues: Success rate depends on prevailing conditions and location of planting. May be lost to storm erosion.
Labour-intensive with ongoing management commitment.
Likely to take 2–3 years before transplants begin to thrive and spread.
May not fulfil conservation interests as it encourages dune stabilisation.
Seaward extent of dune will remain limited by the existing limit of wave run-up.
Considerations: Use indigenous plant species – also consider increasing diversity.
If transplanting other areas, potential impacts of this needs to be considered.
Use of fencing to restrict access.
May require some pre-works such as reprofiling to create a more stable dune face; the impact of and ability to carry out such works would need to be considered.
A combination of geotextile and direct seed sowing or planting may offer an inexpensive and (for seeds) a less labour-intensive method for stabilising sediments and ensuring that a range of sand dune species is introduced (Hanley et al. 2014).
Dune thatching
Description/ rationale:
Covering exposed faces of dunes or blowouts using branches of brushwood or bundles of straw to reduce wind erosion, trap sand and help stabilise the dune face.
Does not prevent wave erosion, but can slow or reduce blowout development and therefore reduce risk of breach.
Often used in combination with dune grass planting.
Where appropriate: Above the reach of normal waves.
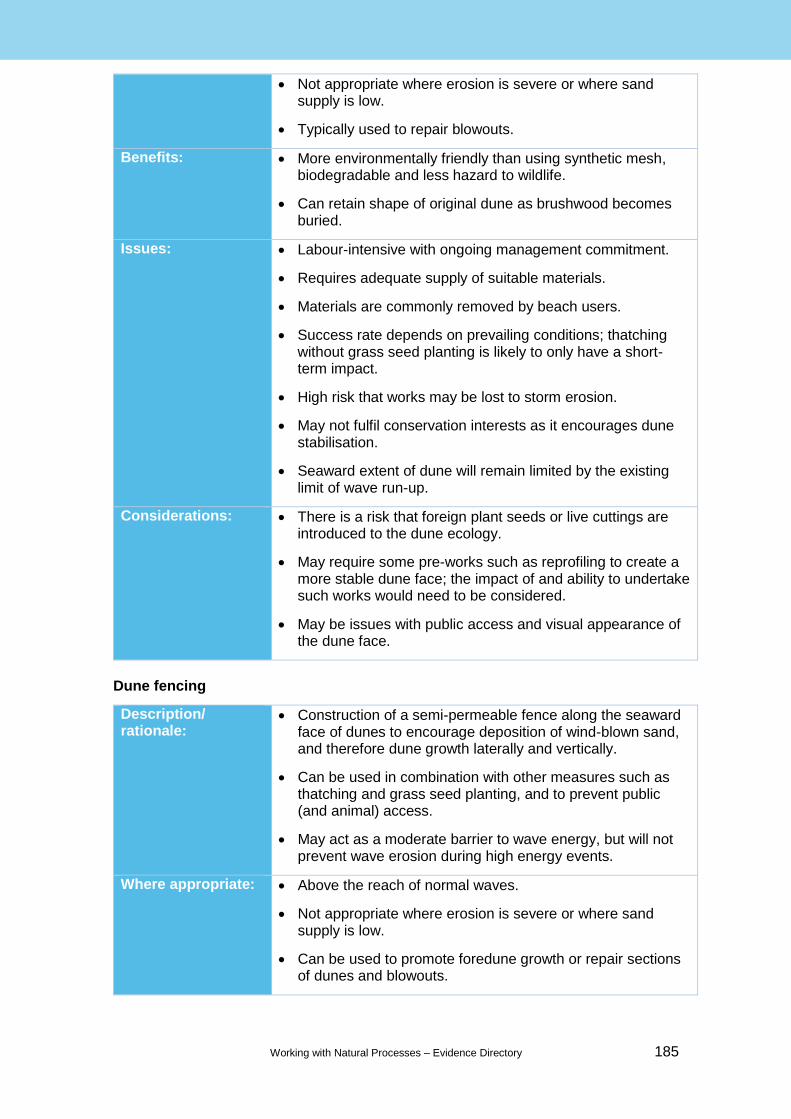
Working with Natural Processes – Evidence Directory 185
Not appropriate where erosion is severe or where sand supply is low.
Typically used to repair blowouts.
Benefits: More environmentally friendly than using synthetic mesh, biodegradable and less hazard to wildlife.
Can retain shape of original dune as brushwood becomes buried.
Issues: Labour-intensive with ongoing management commitment.
Requires adequate supply of suitable materials.
Materials are commonly removed by beach users.
Success rate depends on prevailing conditions; thatching without grass seed planting is likely to only have a short-term impact.
High risk that works may be lost to storm erosion.
May not fulfil conservation interests as it encourages dune stabilisation.
Seaward extent of dune will remain limited by the existing limit of wave run-up.
Considerations: There is a risk that foreign plant seeds or live cuttings are introduced to the dune ecology.
May require some pre-works such as reprofiling to create a more stable dune face; the impact of and ability to undertake such works would need to be considered.
May be issues with public access and visual appearance of the dune face.
Dune fencing
Description/ rationale:
Construction of a semi-permeable fence along the seaward face of dunes to encourage deposition of wind-blown sand, and therefore dune growth laterally and vertically.
Can be used in combination with other measures such as thatching and grass seed planting, and to prevent public (and animal) access.
May act as a moderate barrier to wave energy, but will not prevent wave erosion during high energy events.
Where appropriate: Above the reach of normal waves.
Not appropriate where erosion is severe or where sand supply is low.
Can be used to promote foredune growth or repair sections of dunes and blowouts.
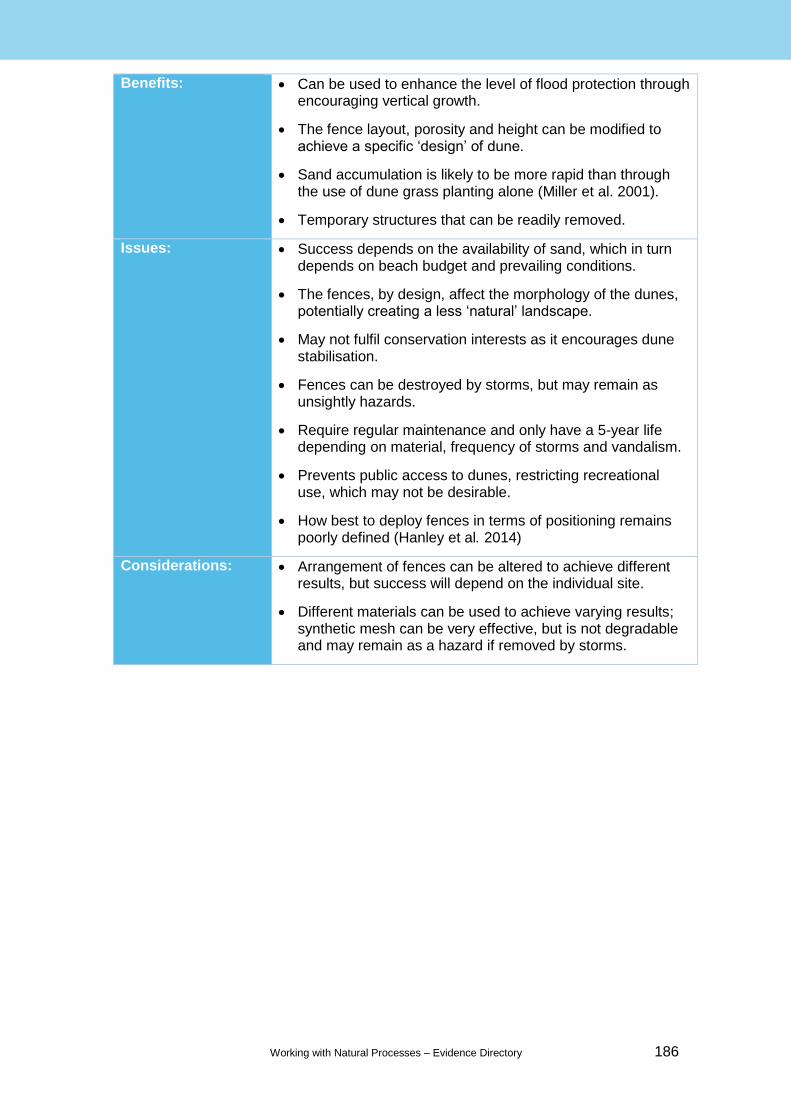
Working with Natural Processes – Evidence Directory 186
Benefits: Can be used to enhance the level of flood protection through encouraging vertical growth.
The fence layout, porosity and height can be modified to achieve a specific ‘design’ of dune.
Sand accumulation is likely to be more rapid than through the use of dune grass planting alone (Miller et al. 2001).
Temporary structures that can be readily removed.
Issues: Success depends on the availability of sand, which in turn depends on beach budget and prevailing conditions.
The fences, by design, affect the morphology of the dunes, potentially creating a less ‘natural’ landscape.
May not fulfil conservation interests as it encourages dune stabilisation.
Fences can be destroyed by storms, but may remain as unsightly hazards.
Require regular maintenance and only have a 5-year life depending on material, frequency of storms and vandalism.
Prevents public access to dunes, restricting recreational use, which may not be desirable.
How best to deploy fences in terms of positioning remains poorly defined (Hanley et al. 2014)
Considerations: Arrangement of fences can be altered to achieve different results, but success will depend on the individual site.
Different materials can be used to achieve varying results; synthetic mesh can be very effective, but is not degradable and may remain as a hazard if removed by storms.

Working with Natural Processes – Evidence Directory 187
Dune reprofiling
Description/ rationale:
Reprofiling or recontouring is used to either reshape dunes so that other measures such as fences or grass planting can be undertaken, or in extreme cases to reconstruct dunes or widen dunes following erosion and overwash events.
Where appropriate: Frontal and hind dunes where sites can be readily accessed by plant.
Benefits: Rapid and easy method of facilitating dune recovery.
There is more control over the shape of the dunes and therefore standard of defence required.
Facilitates use of other measures.
Could be used to create habitats such as dune slacks as part of an integrated technique.
Issues: Creating wider frontal dunes by moving sand from the beach may only be a temporary solution, as subsequent waves may remove unbound material.
Potentially creates an artificial landscape.
Potential to cause damage to existing habitats.
Does not create internal dune sedimentary architecture of multiple sub-horizontal bedding planes and this may have different porosity, permeability and water content to natural dunes.
Considerations: May be appropriate as a one-off activity as part of an integrated management technique.
Access to sites and risk of damage to existing habitats by plant.
Morphology and sustainability of new sand mounds, given local prevailing conditions.
Risk of wind-blown sand from reprofiled areas, which can create issue in built-up areas behind dunes.
Sand bag structures
Description/ rationale:
Geotextile bags filled with local sand and buried beneath the beach at the toe of the dunes to form a final line of protection and protect the toe of the dunes. The seaward line of bags is intended to be sacrificial.
Also known as ‘Terrafix’ bags.
Where appropriate: Low to moderate energy coasts where dunes form a primary defence and hinterland assets are at risk.
Only suitable along upper part of beach and buried under beach in front of dunes, covered by recycled or imported sand.
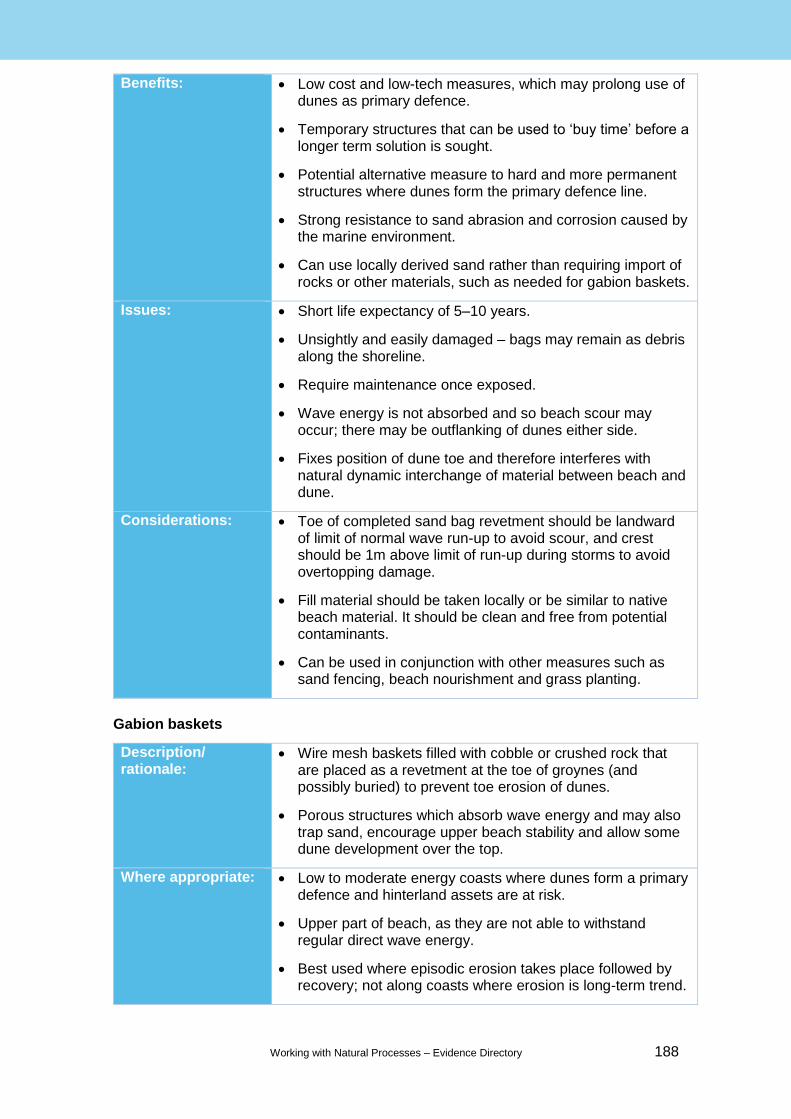
Working with Natural Processes – Evidence Directory 188
Benefits: Low cost and low-tech measures, which may prolong use of dunes as primary defence.
Temporary structures that can be used to ‘buy time’ before a longer term solution is sought.
Potential alternative measure to hard and more permanent structures where dunes form the primary defence line.
Strong resistance to sand abrasion and corrosion caused by the marine environment.
Can use locally derived sand rather than requiring import of rocks or other materials, such as needed for gabion baskets.
Issues: Short life expectancy of 5–10 years.
Unsightly and easily damaged – bags may remain as debris along the shoreline.
Require maintenance once exposed.
Wave energy is not absorbed and so beach scour may occur; there may be outflanking of dunes either side.
Fixes position of dune toe and therefore interferes with natural dynamic interchange of material between beach and dune.
Considerations: Toe of completed sand bag revetment should be landward of limit of normal wave run-up to avoid scour, and crest should be 1m above limit of run-up during storms to avoid overtopping damage.
Fill material should be taken locally or be similar to native beach material. It should be clean and free from potential contaminants.
Can be used in conjunction with other measures such as sand fencing, beach nourishment and grass planting.
Gabion baskets
Description/ rationale:
Wire mesh baskets filled with cobble or crushed rock that are placed as a revetment at the toe of groynes (and possibly buried) to prevent toe erosion of dunes.
Porous structures which absorb wave energy and may also trap sand, encourage upper beach stability and allow some dune development over the top.
Where appropriate: Low to moderate energy coasts where dunes form a primary defence and hinterland assets are at risk.
Upper part of beach, as they are not able to withstand regular direct wave energy.
Best used where episodic erosion takes place followed by recovery; not along coasts where erosion is long-term trend.
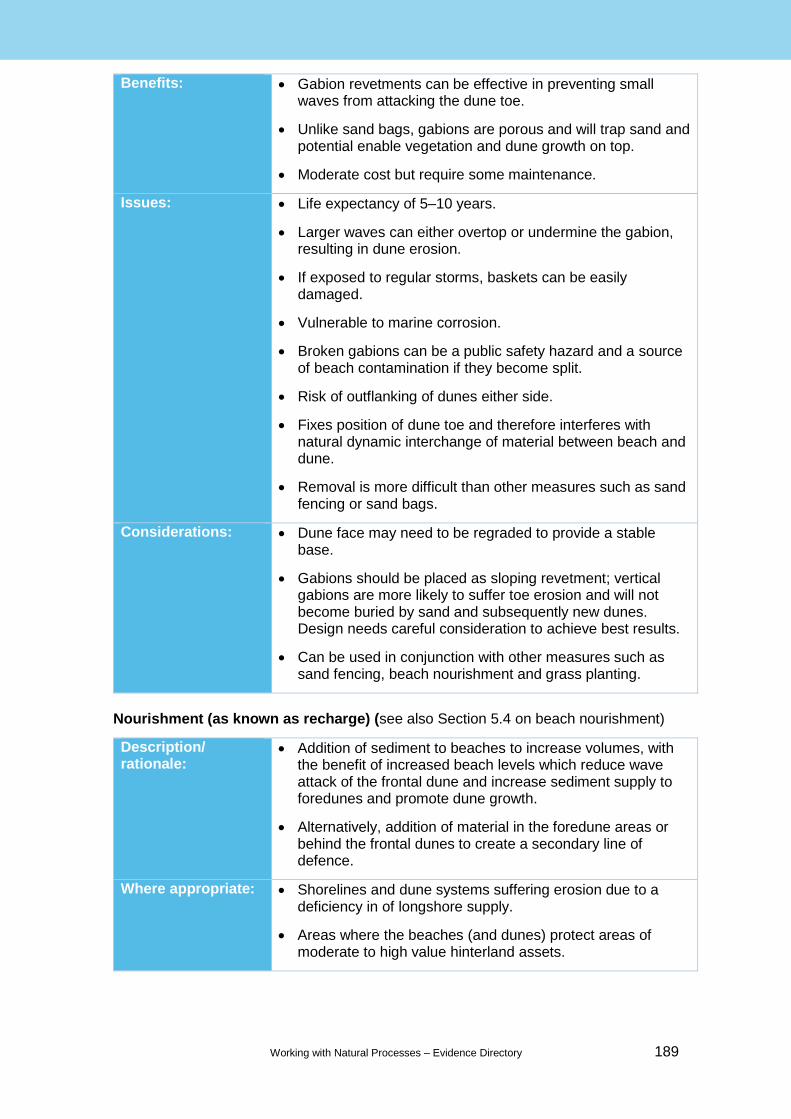
Working with Natural Processes – Evidence Directory 189
Benefits: Gabion revetments can be effective in preventing small waves from attacking the dune toe.
Unlike sand bags, gabions are porous and will trap sand and potential enable vegetation and dune growth on top.
Moderate cost but require some maintenance.
Issues: Life expectancy of 5–10 years.
Larger waves can either overtop or undermine the gabion, resulting in dune erosion.
If exposed to regular storms, baskets can be easily damaged.
Vulnerable to marine corrosion.
Broken gabions can be a public safety hazard and a source of beach contamination if they become split.
Risk of outflanking of dunes either side.
Fixes position of dune toe and therefore interferes with natural dynamic interchange of material between beach and dune.
Removal is more difficult than other measures such as sand fencing or sand bags.
Considerations: Dune face may need to be regraded to provide a stable base.
Gabions should be placed as sloping revetment; vertical gabions are more likely to suffer toe erosion and will not become buried by sand and subsequently new dunes. Design needs careful consideration to achieve best results.
Can be used in conjunction with other measures such as sand fencing, beach nourishment and grass planting.
Nourishment (as known as recharge) (see also Section 5.4 on beach nourishment)
Description/ rationale:
Addition of sediment to beaches to increase volumes, with the benefit of increased beach levels which reduce wave attack of the frontal dune and increase sediment supply to foredunes and promote dune growth.
Alternatively, addition of material in the foredune areas or behind the frontal dunes to create a secondary line of defence.
Where appropriate: Shorelines and dune systems suffering erosion due to a deficiency in of longshore supply.
Areas where the beaches (and dunes) protect areas of moderate to high value hinterland assets.
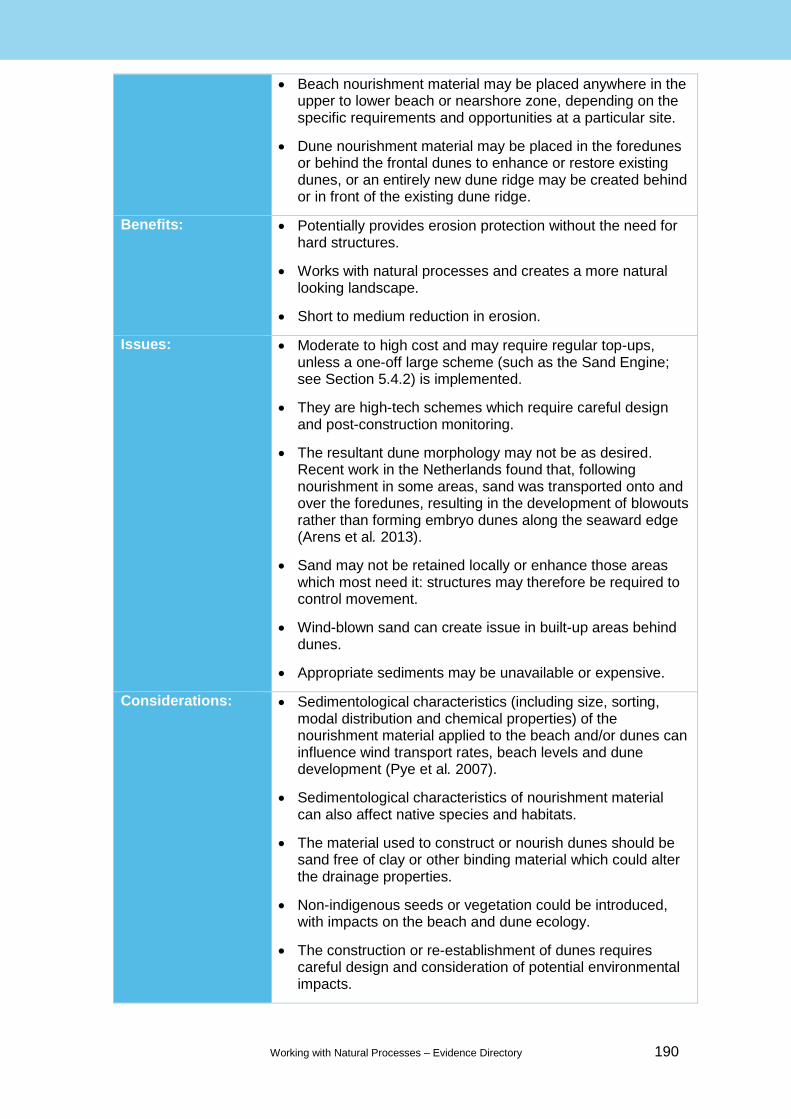
Working with Natural Processes – Evidence Directory 190
Beach nourishment material may be placed anywhere in the upper to lower beach or nearshore zone, depending on the specific requirements and opportunities at a particular site.
Dune nourishment material may be placed in the foredunes or behind the frontal dunes to enhance or restore existing dunes, or an entirely new dune ridge may be created behind or in front of the existing dune ridge.
Benefits: Potentially provides erosion protection without the need for hard structures.
Works with natural processes and creates a more natural looking landscape.
Short to medium reduction in erosion.
Issues: Moderate to high cost and may require regular top-ups, unless a one-off large scheme (such as the Sand Engine; see Section 5.4.2) is implemented.
They are high-tech schemes which require careful design and post-construction monitoring.
The resultant dune morphology may not be as desired. Recent work in the Netherlands found that, following nourishment in some areas, sand was transported onto and over the foredunes, resulting in the development of blowouts rather than forming embryo dunes along the seaward edge (Arens et al. 2013).
Sand may not be retained locally or enhance those areas which most need it: structures may therefore be required to control movement.
Wind-blown sand can create issue in built-up areas behind dunes.
Appropriate sediments may be unavailable or expensive.
Considerations: Sedimentological characteristics (including size, sorting, modal distribution and chemical properties) of the nourishment material applied to the beach and/or dunes can influence wind transport rates, beach levels and dune development (Pye et al. 2007).
Sedimentological characteristics of nourishment material can also affect native species and habitats.
The material used to construct or nourish dunes should be sand free of clay or other binding material which could alter the drainage properties.
Non-indigenous seeds or vegetation could be introduced, with impacts on the beach and dune ecology.
The construction or re-establishment of dunes requires careful design and consideration of potential environmental impacts.

Working with Natural Processes – Evidence Directory 191
Dune nourishment needs to be undertaken grass planting to help retain material.
The environmental impacts of obtaining sediment either locally or from an offshore source need to be considered; further guidance is provided in the ‘Beach Management Manual’ (CIRIA 2010).
Summary of the literature
Prior to any works being carried out, a Dune Management Plan (or Beach–Dune Management Plan) should be produced. The scale of study will depend on the size of the dune system, its defence function, environmental value and local constraints and opportunities. As a minimum, the Dune Management Plan should:
o define baseline conditions, namely beach and dune volumes, the FCRM function of the dune and beach, environmental value and prevailing conditions (wind, wave, tides, sediment budgets)
o describe the nature of the problem (rates of morphological change, locations of highest FCRM risk)
o identify possible causes of the problem
o recommend practical solutions and measures
o set out a monitoring and maintenance programme
Monitoring of both the dune and fronting beaches and nearshore is an essential element of dune management. This allows issues to be identified early enough to allow a suitable solution to be considered and implemented, thereby avoiding reactive management. Some dune systems are already covered by comprehensive monitoring programmes (for example, the Sefton coast), but this is not true everywhere (Pye et al. 2007).
In England, there is a network of 6 Regional Coastal Monitoring Programmes which collect coastal monitoring data in a co-ordinated and systematic manner. Data can be accessed via the Channel Coastal Observatory website (www.channelcoast.org). The local differences in coastline and the risks being managed mean that programme composition varies regionally, but typically includes some combination of:
o beach profiles/topographic data
o bathymetry
o aerial photography surveys
o aerial photography
o LiDAR
o hydrodynamics (waves, tides)
o terrestrial ecological mapping
o other monitoring, such as satellite imagery, fixed photography (for example, ARGUS cameras), bathymetric LiDAR, laser scanners and other local measurements such as cliff monitoring and sediment sampling
In Wales, monitoring of coastal erosion at a national level is led by the Welsh Coastal Monitoring Centre, currently co-ordinated by Gwynedd Council and funded by the Welsh Government. The Welsh Government is considering the future
Maintenance H
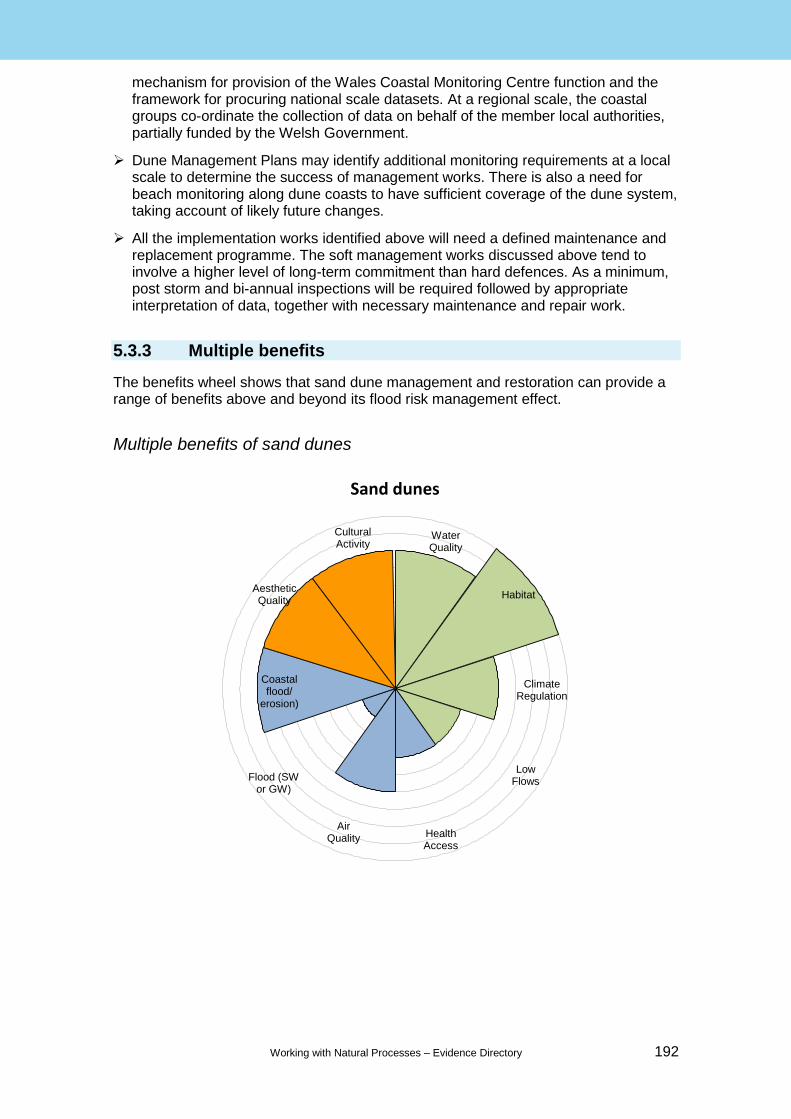
Working with Natural Processes – Evidence Directory 192
mechanism for provision of the Wales Coastal Monitoring Centre function and the framework for procuring national scale datasets. At a regional scale, the coastal groups co-ordinate the collection of data on behalf of the member local authorities, partially funded by the Welsh Government.
Dune Management Plans may identify additional monitoring requirements at a local scale to determine the success of management works. There is also a need for beach monitoring along dune coasts to have sufficient coverage of the dune system, taking account of likely future changes.
All the implementation works identified above will need a defined maintenance and replacement programme. The soft management works discussed above tend to involve a higher level of long-term commitment than hard defences. As a minimum, post storm and bi-annual inspections will be required followed by appropriate interpretation of data, together with necessary maintenance and repair work.
5.3.3 Multiple benefits
The benefits wheel shows that sand dune management and restoration can provide a range of benefits above and beyond its flood risk management effect.
Multiple benefits of sand dunes
Sand dunes
Water Quality
Habitat
Climate Regulation
Low Flows
Coastal flood/
erosion)
Flood (SW or GW)
Air Quality Health
Access
Cultural Activity
Aesthetic Quality

Working with Natural Processes – Evidence Directory 193
Multiple benefits summary
Environmental benefits
Water quality
Sand dunes are effective at improving water quality, filtering nutrients before they reach the marine environment. In Amsterdam, dunes are part of the water purification infrastructure, supplying 50 million m3 per year of drinking water to 1.5 million people (van der Meulen et al. 2004).
Habitat provision
Sand dunes provide a highly diverse mix of habitats and services (Everard et al. 2010). Fixed dunes and dune heath are particularly threatened habitats and are regarded as priorities under the Habitats Directive.
Dunes support a wide range of plant species and more than 680 Red Data Book or Nationally Rare/Scarce invertebrate species (Howe et al. 2010), as well as a number of rare vertebrates (Jones 2011).
Climate regulation
Sand dunes create microclimates which support many distinct species. They have potential to adapt to some impacts of climate change through natural sediment processes (Rees et al. 2010).
As dunes are an early successional habitat, carbon accumulation rates are high at 2.16 ± 0.91 tonnes of carbon dioxide per hectare per year (Jones et al. 2008). This equates to £18.36–£45.9 per hectare per year (Connors 2016).
Carbon sequestration is greater in the dune slacks, but these may also be a source of greenhouse gases such as methane and nitrous oxide. There are also questions about the permanence of sequestration due to the natural dynamics of sand dunes (Everard et al. 2010).
Low flows
Sand has high hydraulic conductivity and a high rate of infiltration of rain water (Tsoar 2005). Sand dunes form a shallow aquifer, which creates additional water storage under large dune systems (Heslenfeld et al. 2004). Few other habitats provide such rapid groundwater recharge.
Social benefits
Health access
There is little evidence supporting the health function of sand dunes. However, sand dunes are well visited and often accessible to the public, presenting opportunities for a range of physical activities including walking, cycling and horse riding. Recreation in coastal areas provides physical health benefits (eftec et al. 2006).

Working with Natural Processes – Evidence Directory 194
Social benefits
Air quality
The canopy roughness of low-level grassland and scrub may be significant in particulate fallout and dry gaseous pollutant deposition (Sutton et al. 1993).
Sand dunes store carbon, but can emit other greenhouse gases including methane and nitrous oxide (Everard et al. 2010). Wind-blown sand from bare areas of sand within dunes can be perceived as a nuisance (Sherman and Nordstrom 1994).
Surface water or groundwater flood
There is little evidence of the effects of dune management on surface and groundwater flooding. The permeability of sand means that run-off is likely to rapidly infiltrate into the ground, reducing the risk of surface water flooding but potentially increasing the possibility of groundwater saturation.
Coastal flood/erosion
Dune systems function as barriers to coastal flooding. They can act as a natural dynamic coastal defence, absorbing wave energy and releasing sediment to the beach during storms and rebuilding by wind action during periods of fair weather.
The natural sea defence value of dunes has been estimated at £1,734 per metre of dune (Connors 2016).
Cultural benefits
Aesthetics
Sand dunes provide characteristic ‘wild’ landscapes. They are increasingly valued for their wildness, and as a place of escape and solitude, also offering artistic inspiration for poets and painters (Everard et al. 2010). Willingness to pay estimates for SSSI conservation activities for sand dunes include £1,377 per hectare per year for a ‘maintain funding’ scenario, the highest of any habitat measured. The willingness to pay for increasing funding is £860 per hectare per year (Christie and Rayment 2012).
Cultural activities
Dunes are a major reason for visiting the coast. The Sefton Coast, has 4.5 million visits per year, generating £62.7 million towards the local economy (Jones 2011). One million people per year visit the Meijendel Dunes in the Nwetherlands (van der Meulen et al. 2004). Dunes also provide educational opportunities and help preserve archaeology (Everard et al. 2010).
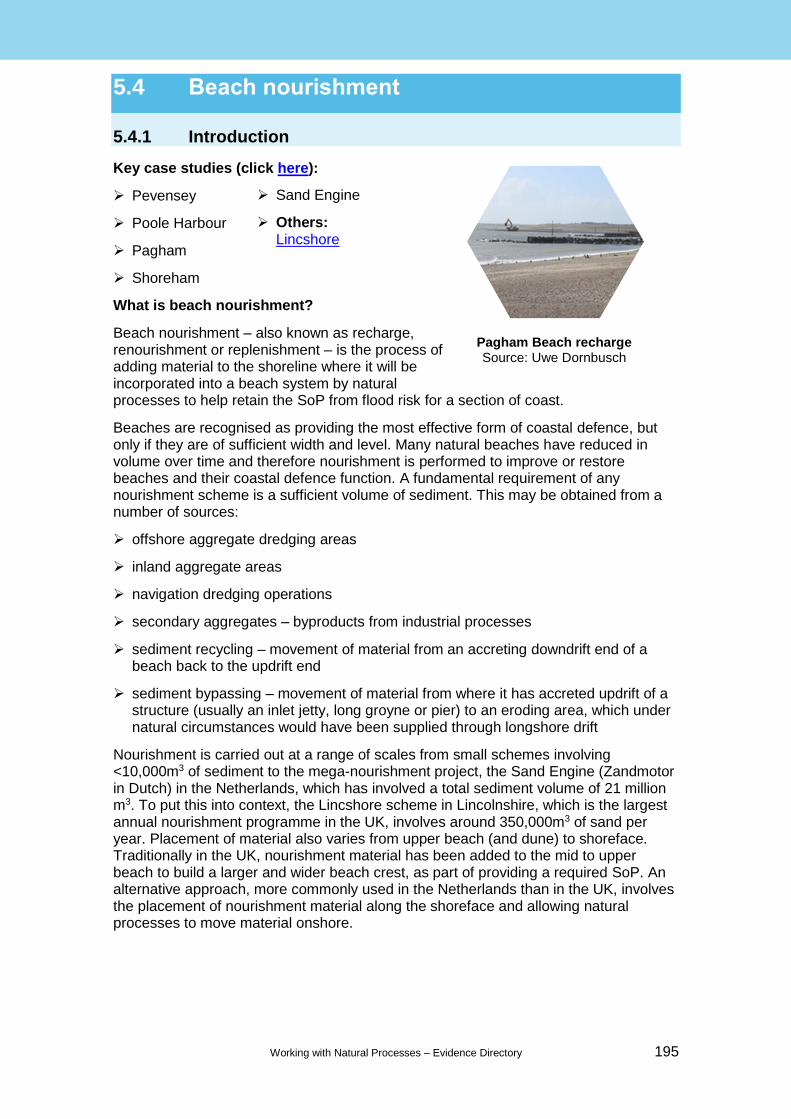
Working with Natural Processes – Evidence Directory 195
5.4 Beach nourishment
5.4.1 Introduction
Key case studies (click here):
Pevensey
Poole Harbour
Pagham
Shoreham
What is beach nourishment?
Beach nourishment – also known as recharge, renourishment or replenishment – is the process of adding material to the shoreline where it will be incorporated into a beach system by natural processes to help retain the SoP from flood risk for a section of coast.
Beaches are recognised as providing the most effective form of coastal defence, but only if they are of sufficient width and level. Many natural beaches have reduced in volume over time and therefore nourishment is performed to improve or restore beaches and their coastal defence function. A fundamental requirement of any nourishment scheme is a sufficient volume of sediment. This may be obtained from a number of sources:
offshore aggregate dredging areas
inland aggregate areas
navigation dredging operations
secondary aggregates – byproducts from industrial processes
sediment recycling – movement of material from an accreting downdrift end of a beach back to the updrift end
sediment bypassing – movement of material from where it has accreted updrift of a structure (usually an inlet jetty, long groyne or pier) to an eroding area, which under natural circumstances would have been supplied through longshore drift
Nourishment is carried out at a range of scales from small schemes involving <10,000m3 of sediment to the mega-nourishment project, the Sand Engine (Zandmotor in Dutch) in the Netherlands, which has involved a total sediment volume of 21 million m3. To put this into context, the Lincshore scheme in Lincolnshire, which is the largest annual nourishment programme in the UK, involves around 350,000m3 of sand per year. Placement of material also varies from upper beach (and dune) to shoreface. Traditionally in the UK, nourishment material has been added to the mid to upper beach to build a larger and wider beach crest, as part of providing a required SoP. An alternative approach, more commonly used in the Netherlands than in the UK, involves the placement of nourishment material along the shoreface and allowing natural processes to move material onshore.
Sand Engine
Others: Lincshore
Pagham Beach recharge Source: Uwe Dornbusch

Working with Natural Processes – Evidence Directory 196
5.4.2 Flood risk evidence
This section sets out what we know in terms of the effectiveness of this measure from an FCRM perspective and the scientific confidence in what we know.
Summary of the literature
In most locations around England and Wales, beaches form a vital part of the defence against erosion and flooding.
Beaches are a natural buffer between the land and sea, and are efficient dissipaters of wave energy. They therefore reduce damage to backing assets, including defence structures, from direct wave energy, overtopping and flooding.
In many locations around the UK coast, beaches are backed by hard structures such as seawalls and revetments or cliffs, but in other locations beaches form the only defence against flooding.
Beaches are dynamic features and respond to changes in the prevailing conditions, wind wave and tide over timescales of a few hours to decades.
Beaches also deliver additional socioeconomic and environmental benefits. They have a high amenity value and provide economic value through several sources. They also support a wide range of important habitats and many are designated conservation areas.
Management of beaches has taken place for centuries, with a particular surge in the construction of defence and amenity structures such as seawalls and promenades from the 1800s onwards with the expansion of tourism. The concept of beach nourishment as a form of coastal defence in the UK is a fairly recent one, with nourishment using marine sand and gravel dating from the 1970s (Hanson et al. 2002), although there is evidence of some pioneer schemes dating back to the early 1900s (Williams 2005).
Performance factors in terms of FCRM function are listed below.
o Beach height and width. A wider, higher beach will provide more protection to backing assets.
o Slope. A wider shallower slope is generally more effective in dissipating wave energy, with steeper beaches potentially resulting in greater wave reflection and increasing potential for scour. However, the slope of a beach varies naturally over time in response to prevailing conditions and also depends on the sediment composition.
o Sediment composition. There are variations in the way a beach responds depending on the sediment composition of the beach. Sand beaches tend to respond more rapidly than beaches composed of coarser sediment, and are therefore more mobile than shingle beaches.
o Sediment supply. Beaches rely on an available source of sediment. While many beaches around the coasts of England and Wales are still receiving sediment, some – particularly shingle beaches – are relict features with little or no contemporary source of sediment.
Where UK beaches are defined as a defence or included as part of an integrated defence scheme which incorporates hard structures, a ‘standard’ or ‘level of protection’ may be defined. This is commonly expressed as a return period or AEP.
Flood and coastal erosion risk evidence H

Working with Natural Processes – Evidence Directory 197
For example 1 in 200 year SoP can also be expressed as 0.5% AEP, and means the defence system is expected to withstand an event with a return period of 200 years or a 0.5% chance of occurring in any one year, without experiencing significant failure. Latest guidance from the Environment Agency (2017) now advises that, rather than SoP being expressed as a single return period value, the chance that the overtopping or overflow rate across a defence may exceed an acceptable value should be expressed as range of AEP values.
For coastal defence purposes, the SoP is typically linked to characteristics of the beach profile, namely width at a specific levels, crest elevation or volume of material above a base level (CIRIA 2010). When considering beaches within a coastal defence system, the impact on both overtopping risk and defence failure (through beach undermining) needs to be considered.
Summary of the literature
It is estimated that beaches fringe around 40% of the world’s coastline (Bird 2008), with over 1,500km of sand beaches and 1,000km of shingle beaches in the UK. Beach sediments range from fine sand to boulders, and beaches exist in a range of geologically and hydrodynamic settings.
The large variety in beach systems around the coastline of England and Wales is due to alongshore variability in geology, sediments and prevailing conditions (wave, waves, storms and tides) (Scott et al. 2011).
Beaches in England and Wales are a legacy of the most recent and penultimate glacial periods, which resulted in large quantities of sediments ranging from mud to boulders, being left behind the retreating glaciers, to be reworked and moved alongshore and onshore to form dunes, beaches and other coastal features.
Summary of the literature
There is extensive literature on the physical processes that affect the formation and development of beaches; a summary of this is provided in CIRIA (2010) and is therefore not repeated here. The most important points are summarised here, focusing on aspects which relate to their management for FCRM.
Beaches around the UK reflect a continuing evolutionary process which started over 10,000 years ago (CIRIA 2010). In many locations around the UK, this means that beaches no longer have a natural source of sediment.
The morphology of a beach responds to prevailing conditions over a range of time scales and temporal scales (
Figure 5.6). During winter months the greater occurrence of storm waves means beaches experience sediment drawn down as a slope profile develops. During summer months there is potential for beach building resulting in a steeper profile. Beach lowering and recovery therefore occurs over a range of spatial and time scales which need to be taken into account when considering SoPs.
Distribution in England and Wales H
Relevant physical processes H
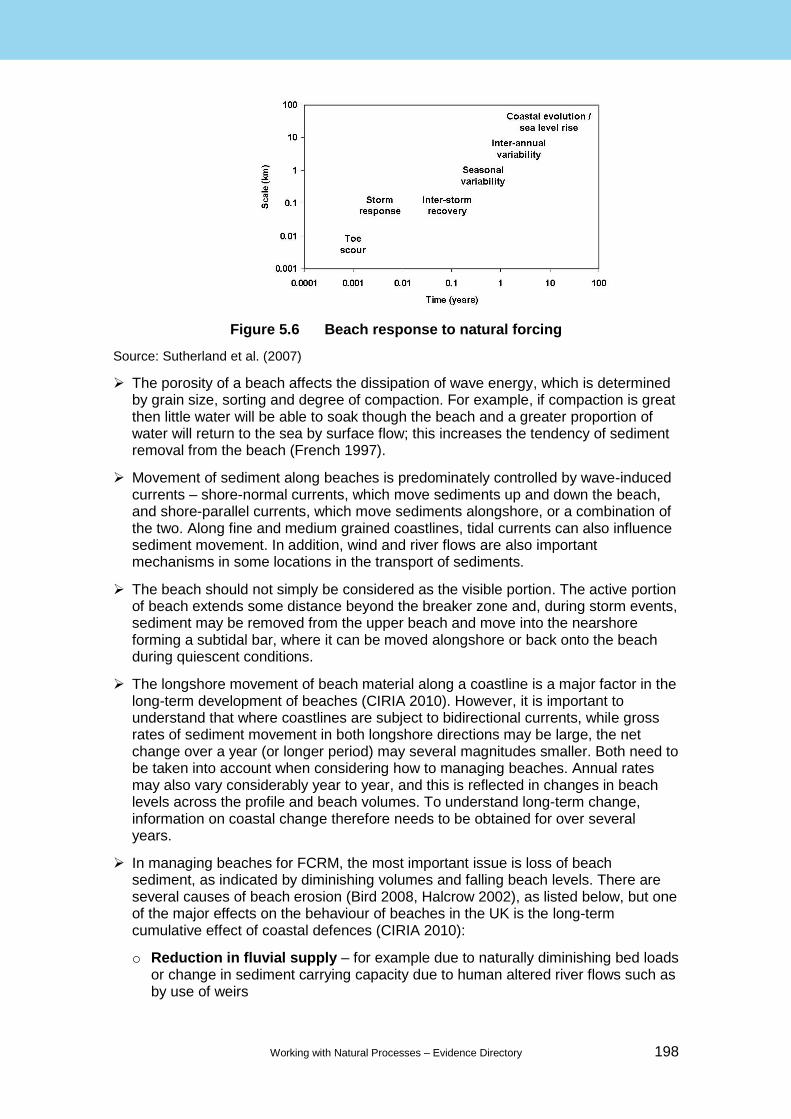
Working with Natural Processes – Evidence Directory 198
Figure 5.6 Beach response to natural forcing
Source: Sutherland et al. (2007)
The porosity of a beach affects the dissipation of wave energy, which is determined by grain size, sorting and degree of compaction. For example, if compaction is great then little water will be able to soak though the beach and a greater proportion of water will return to the sea by surface flow; this increases the tendency of sediment removal from the beach (French 1997).
Movement of sediment along beaches is predominately controlled by wave-induced currents – shore-normal currents, which move sediments up and down the beach, and shore-parallel currents, which move sediments alongshore, or a combination of the two. Along fine and medium grained coastlines, tidal currents can also influence sediment movement. In addition, wind and river flows are also important mechanisms in some locations in the transport of sediments.
The beach should not simply be considered as the visible portion. The active portion of beach extends some distance beyond the breaker zone and, during storm events, sediment may be removed from the upper beach and move into the nearshore forming a subtidal bar, where it can be moved alongshore or back onto the beach during quiescent conditions.
The longshore movement of beach material along a coastline is a major factor in the long-term development of beaches (CIRIA 2010). However, it is important to understand that where coastlines are subject to bidirectional currents, while gross rates of sediment movement in both longshore directions may be large, the net change over a year (or longer period) may several magnitudes smaller. Both need to be taken into account when considering how to managing beaches. Annual rates may also vary considerably year to year, and this is reflected in changes in beach levels across the profile and beach volumes. To understand long-term change, information on coastal change therefore needs to be obtained for over several years.
In managing beaches for FCRM, the most important issue is loss of beach sediment, as indicated by diminishing volumes and falling beach levels. There are several causes of beach erosion (Bird 2008, Halcrow 2002), as listed below, but one of the major effects on the behaviour of beaches in the UK is the long-term cumulative effect of coastal defences (CIRIA 2010):
o Reduction in fluvial supply – for example due to naturally diminishing bed loads or change in sediment carrying capacity due to human altered river flows such as by use of weirs
Working with Natural Processes – Evidence Directory 199
o Reduction in inputs from cliff erosion – such as due to cliff protection works or changes in exposures
o Reduction in natural supply from offshore – for example because stores have been naturally exhausted, dredging activities or a reduction in biological production in the case of beaches reliant of shelly materials
o Changes in human activities – for example where beaches are largely composed of colliery or steel production waste, cessation of operations may result in beach erosion due to the lack of fresh inputs
o Changes in the composition of material supplied – for example if a beach has been nourished updrift, this may affect local beach behaviour
o Sand and shingle extraction from both the beach and nearshore – historically, material has been removed from UK beaches for a range of purposes such as agriculture, construction and ballast, but nowadays is uncommon in the UK though it remains an issue elsewhere in the world (CIRIA 2010)
o Interception of longshore drift – for example due to beach management structures such as groynes, or naturally due to landslides, such as occurs along the Lyme Regis coastline
o Increased wave energy – for example, due to climate change, increased water depth resulting from sea level rise or changes in the nearshore bathymetry, such as shifting sandbanks and intervening channels off the Norfolk and Suffolk coasts
o Changes in dominant wave direction – for example, due to changes in nearshore bathymetry or due to breakwater construction, this may in turn cause a large-scale change from a swash-aligned beach plan-form to a drift-aligned form
o Wave reflection – for example due to structures such as seawalls, resulting in beach scour
o Increased storminess – this may be strength duration and/or frequency, for example, the damage resulting from the 2013 to 2014 storms along the south coast of England. Recovery of beaches depends upon subsequent conditions and the onshore movement of sediment.
o Migration of shoreline features – such as nesses, for example, Benacre Ness in Suffolk
o Attrition – the movement of sediment and resultant abrasion causes their gradual breakdown; the rate of abrasion is difficult to determine and varies from location to location, depending on sediment characteristics, exposure conditions and sediment transport rates (Dornbusch et al. 2002)
As the volume of beach sediment reduces, the beach face is lowered and cut back. This can result in loss or narrower, thinner beaches along coasts backed by rocky cliffs or hard structures, or erosion of backshore landforms, where backed by dunes, slopes or soft cliffs, which may enable the roll back of the beach.
Steepening foreshores, resulting from the high water position being fixed while the mean low water continues to retreat, is an ongoing concern for coastal managers as it affects the vulnerability of structures and the risk of wave overtopping during storms.
The response of beach systems to sea level rise is strongly determined by site-specific factors, such as geomorphological setting, sediment availability, local wave and tidal climates and management (Masselink and Russell 2013). In simple terms, beaches have a tendency to roll landward where able and with sufficient sediment available. However, where such movement is restricted, for example, due to resistant cliffs or hard structures, beaches are likely to become depleted or lost altogether.

Working with Natural Processes – Evidence Directory 200
Summary of the literature
Beaches will play an increasingly important role in the future as sole barriers to coastal flooding and erosion, or as part of a system together with cliffs or manmade defences (CIRIA 2010).
There is a range of beach management options that can be employed in the management of beaches, the majority of these would fall under the FCRM strategic policy of Hold the Line and /or Managed Realignment. There are 4 general approaches to managing beach erosion (Table 5.3).
Table 5.3 Four approaches to beach nourishment
Approach Description Policy Measures
Non-interference
Allow natural processes and accept losses or relocate backshore assets
No Active Intervention or Managed Realignment
Adaptive management
Withdrawal of defences
Erosion-slowing
Measures to delay erosion but with minimal disruption to natural processes, wider environment and landscape
Managed Realignment or Hold the Line
Beach nourishment using
imported sediment
Beach nourishment
through recycling
Beach nourishment
through artificial sediment
bypassing
Mega-nourishment1
Reprofiling
Selectively defend
Local and medium-term measures that will minimise erosion but will have some impact on natural processes, the wider environment and landscape
Managed Realignment or Hold the Line
Individual rock or gabion
headlands
Groynes (rock or timber)
Artificial reefs
Detached breakwaters
Establish a fixed shoreline
Large-scale, long-term defences that fundamentally alter natural processes, fix the shoreline position and therefore affect the coastal environment and landscape
Hold the Line Rock revetments
Timber revetments and
breastwork
Seawalls
Notes: Although mega-nourishment is simply a version of nourishment using imported
sediment, there are some different issues and benefits and it is therefore discussed separately in this report. Due to its scale, this approach will potentially have a much greater impact on natural processes and therefore its impact on the wider coastal environment.
There is overlap between the various approaches, and a number of measures could equally apply to a different category, depending on the scale and nature of the works proposed. The various measures are also often used in combination.
For the purpose of this report, the focus is on erosion-slowing approaches. These are measures that are used to delay erosion but with minimal disruption to natural processes, and therefore fit within the principles of WWNP.
Management approach H
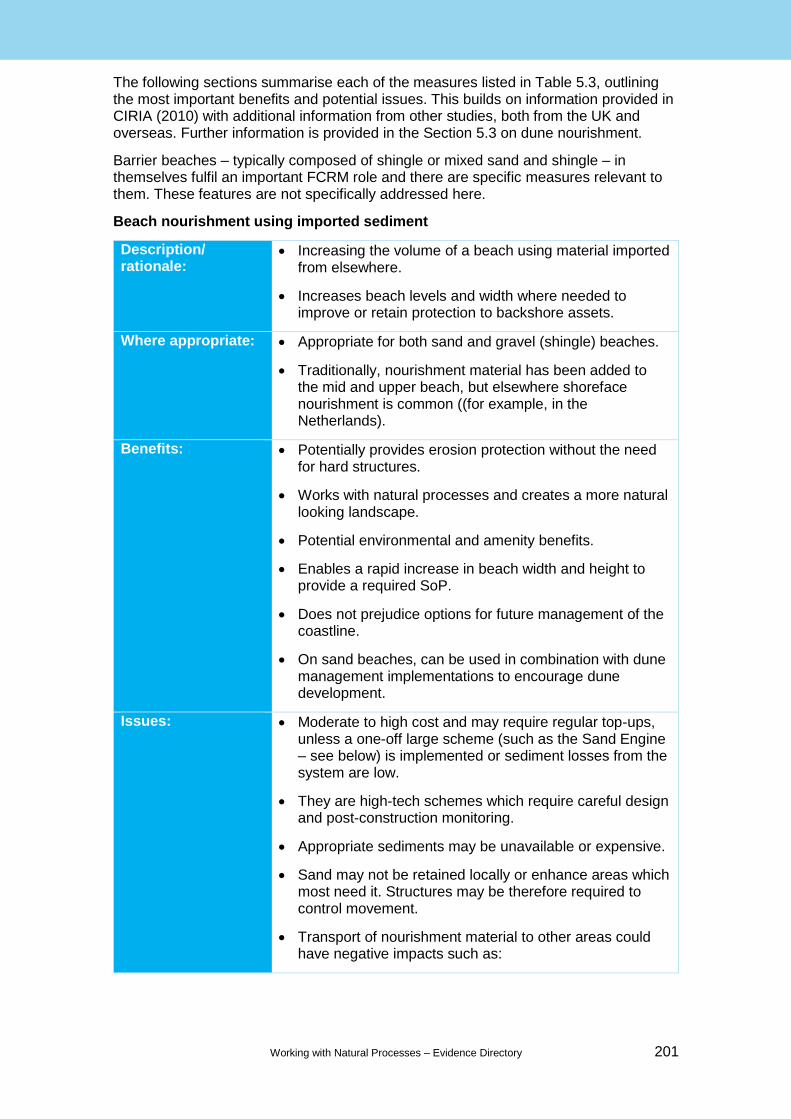
Working with Natural Processes – Evidence Directory 201
The following sections summarise each of the measures listed in Table 5.3, outlining the most important benefits and potential issues. This builds on information provided in CIRIA (2010) with additional information from other studies, both from the UK and overseas. Further information is provided in the Section 5.3 on dune nourishment.
Barrier beaches – typically composed of shingle or mixed sand and shingle – in themselves fulfil an important FCRM role and there are specific measures relevant to them. These features are not specifically addressed here.
Beach nourishment using imported sediment
Description/ rationale:
Increasing the volume of a beach using material imported from elsewhere.
Increases beach levels and width where needed to improve or retain protection to backshore assets.
Where appropriate: Appropriate for both sand and gravel (shingle) beaches.
Traditionally, nourishment material has been added to the mid and upper beach, but elsewhere shoreface nourishment is common ((for example, in the Netherlands).
Benefits: Potentially provides erosion protection without the need for hard structures.
Works with natural processes and creates a more natural looking landscape.
Potential environmental and amenity benefits.
Enables a rapid increase in beach width and height to provide a required SoP.
Does not prejudice options for future management of the coastline.
On sand beaches, can be used in combination with dune management implementations to encourage dune development.
Issues: Moderate to high cost and may require regular top-ups, unless a one-off large scheme (such as the Sand Engine – see below) is implemented or sediment losses from the system are low.
They are high-tech schemes which require careful design and post-construction monitoring.
Appropriate sediments may be unavailable or expensive.
Sand may not be retained locally or enhance areas which most need it. Structures may be therefore required to control movement.
Transport of nourishment material to other areas could have negative impacts such as:

Working with Natural Processes – Evidence Directory 202
o on existing habitats – where nourishment may differ from existing sediment, causes excessive accretion or outwash, or silts smother benthic communities)
o on navigation – for example, if nourishment overwhelms existing jetties
o on fisheries – due to excessive siltation/ accretion
o on geomorphology – if nourishment or silts from nourished beaches bury existing features
Wind-blown sand can create issue in built-up areas behind the beach.
Considerations: Nourishment may be a one-off scheme, or part of a staged or progressive strategy. The volumes involved tend to be greater if a one-off approach is employed (CIRIA 2010).
Sedimentological characteristics of the nourishment material (including size, sorting, modal distribution, chemical properties) applied to the beach can influence beach performance, wind transport rates, beach levels and dune development (Pye et al. 2007), and can affect species and habitats.
Non-indigenous seeds or vegetation could be introduced, with impacts on the beach and dune ecology.
The environmental impacts of obtaining sediment from an offshore source need to be considered. See CIRIA (2010) for further guidance.
If the beach is predominately used for recreation, the choice of sediment size may also depend on what is considered acceptable to beach users.
Placement of sediment needs to be considered in terms of where nourishment is placed along the beach profile, design slope and crest width/height. There is guidance available, but where possible, existing conditions should be mimicked if a similar sediment size to native material is used. There may be a balance, however, between beach slope and the volume of sediment that can be afforded along a coastline, with more intensive post nourishment management accepted as a compromise should a steeper design slope be used.
Following nourishment, rapid readjustment may occur, which needs to be taken into account at the design stage.
Reprofiling may be necessary to ensure that following storms the beach is returned to a sufficient height and width – the issues and benefits of this approach are discussed below.
Along beaches where drift rates are naturally high, repeated nourishment will be necessary unless a controlled system is created through use of structures. The need for nourishment needs to take account of
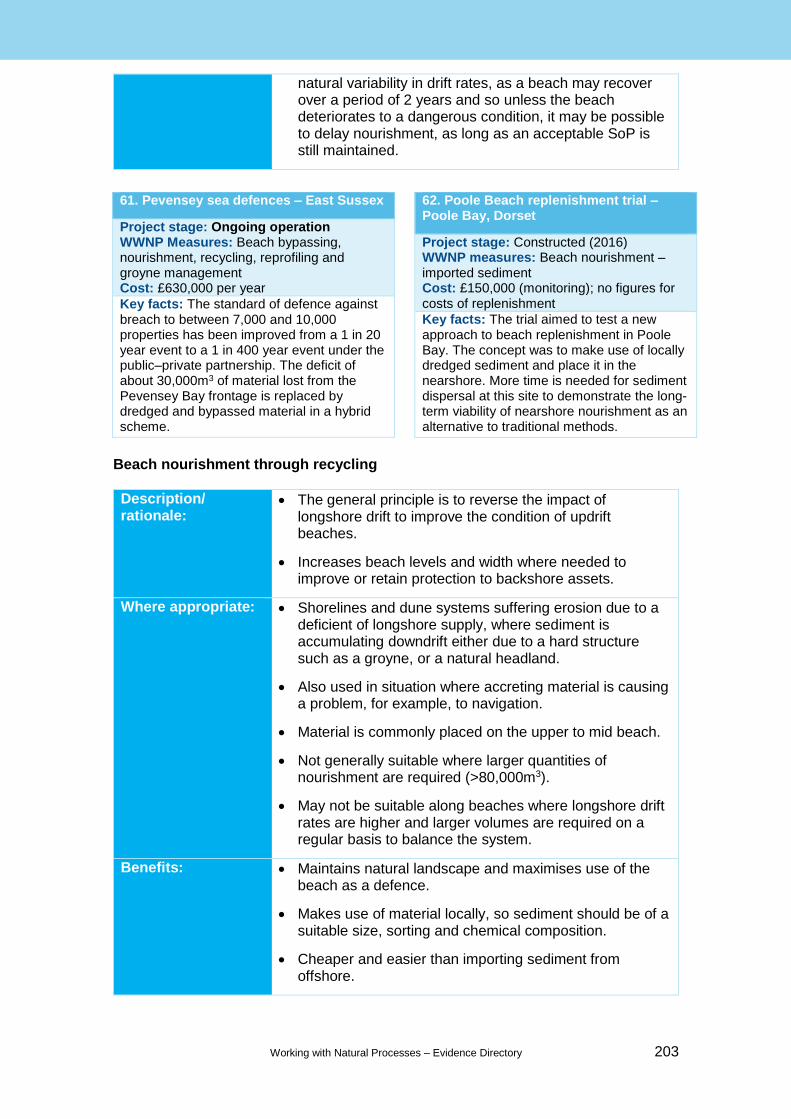
Working with Natural Processes – Evidence Directory 203
natural variability in drift rates, as a beach may recover over a period of 2 years and so unless the beach deteriorates to a dangerous condition, it may be possible to delay nourishment, as long as an acceptable SoP is still maintained.
Beach nourishment through recycling
Description/ rationale:
The general principle is to reverse the impact of longshore drift to improve the condition of updrift beaches.
Increases beach levels and width where needed to improve or retain protection to backshore assets.
Where appropriate: Shorelines and dune systems suffering erosion due to a deficient of longshore supply, where sediment is accumulating downdrift either due to a hard structure such as a groyne, or a natural headland.
Also used in situation where accreting material is causing a problem, for example, to navigation.
Material is commonly placed on the upper to mid beach.
Not generally suitable where larger quantities of nourishment are required (>80,000m3).
May not be suitable along beaches where longshore drift rates are higher and larger volumes are required on a regular basis to balance the system.
Benefits: Maintains natural landscape and maximises use of the beach as a defence.
Makes use of material locally, so sediment should be of a suitable size, sorting and chemical composition.
Cheaper and easier than importing sediment from offshore.
61. Pevensey sea defences – East Sussex
Project stage: Ongoing operation WWNP Measures: Beach bypassing, nourishment, recycling, reprofiling and groyne management Cost: £630,000 per year
Key facts: The standard of defence against breach to between 7,000 and 10,000 properties has been improved from a 1 in 20 year event to a 1 in 400 year event under the public–private partnership. The deficit of about 30,000m3 of material lost from the Pevensey Bay frontage is replaced by dredged and bypassed material in a hybrid scheme.
62. Poole Beach replenishment trial – Poole Bay, Dorset
Project stage: Constructed (2016) WWNP measures: Beach nourishment – imported sediment Cost: £150,000 (monitoring); no figures for costs of replenishment
Key facts: The trial aimed to test a new approach to beach replenishment in Poole Bay. The concept was to make use of locally dredged sediment and place it in the nearshore. More time is needed for sediment dispersal at this site to demonstrate the long-term viability of nearshore nourishment as an alternative to traditional methods.

Working with Natural Processes – Evidence Directory 204
Can be used as a rapid response to effects of change in littoral drift or severe storms.
On sand beaches, can be used in combination with dune management implementations to encourage dune development.
Issues: Disturbance to habitats such as vegetated shingle habitats, dune habitats, and intertidal breeding and feeding grounds.
Risk that removing sediment from downdrift frontages could increase risk there in the future.
If there is any offshore of longshore loss from the frontage, the net volume on the beach will diminish over time.
Tracking along the beach crest could cause compaction issues affecting the porosity of the beach and the linkage between sand beaches and any backing dunes. This could be mitigated by tracking along the lower beach at low water (but with obvious tidal restrictions on working times).
Possible restrictions (natural or constrained by licence) on the availability of sediment for recycling; this is also likely to vary from year to year. This means there is a risk that insufficient material is available in some years.
Removal of material from the mid to lower source beach may introduce fines, which could have an impact on beach porosity, morphology and defence function.
Potential disturbance to beach users and restrictions on beach access.
Potential impacts on archaeological sites and geomorphological features.
Considerations: Impacts on designated conservation areas need careful consideration, with post-operation monitoring required.
May require use of additional structures such as groynes or reefs to retain sediment and reduce the frequency of operations. The impact and cost of these would need to be balanced against alternative solutions.
May require reprofiling (see below) to achieve sufficient beach dimensions.
Regular monitoring is required to identify appropriate source areas and subsequent movement of nourishment sediment.
All recycling schemes need to meet current environmental legislation and standards, and obtain necessary consents.
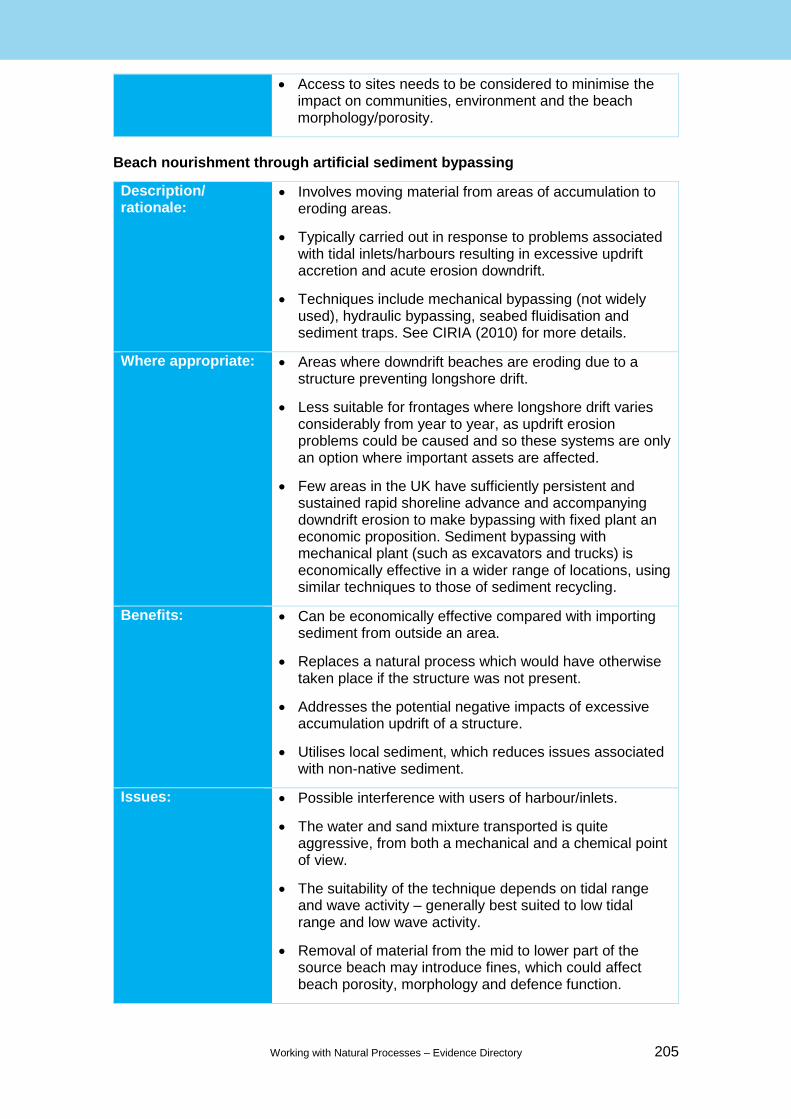
Working with Natural Processes – Evidence Directory 205
Access to sites needs to be considered to minimise the impact on communities, environment and the beach morphology/porosity.
Beach nourishment through artificial sediment bypassing
Description/ rationale:
Involves moving material from areas of accumulation to eroding areas.
Typically carried out in response to problems associated with tidal inlets/harbours resulting in excessive updrift accretion and acute erosion downdrift.
Techniques include mechanical bypassing (not widely used), hydraulic bypassing, seabed fluidisation and sediment traps. See CIRIA (2010) for more details.
Where appropriate: Areas where downdrift beaches are eroding due to a structure preventing longshore drift.
Less suitable for frontages where longshore drift varies considerably from year to year, as updrift erosion problems could be caused and so these systems are only an option where important assets are affected.
Few areas in the UK have sufficiently persistent and sustained rapid shoreline advance and accompanying downdrift erosion to make bypassing with fixed plant an economic proposition. Sediment bypassing with mechanical plant (such as excavators and trucks) is economically effective in a wider range of locations, using similar techniques to those of sediment recycling.
Benefits: Can be economically effective compared with importing sediment from outside an area.
Replaces a natural process which would have otherwise taken place if the structure was not present.
Addresses the potential negative impacts of excessive accumulation updrift of a structure.
Utilises local sediment, which reduces issues associated with non-native sediment.
Issues: Possible interference with users of harbour/inlets.
The water and sand mixture transported is quite aggressive, from both a mechanical and a chemical point of view.
The suitability of the technique depends on tidal range and wave activity – generally best suited to low tidal range and low wave activity.
Removal of material from the mid to lower part of the source beach may introduce fines, which could affect beach porosity, morphology and defence function.
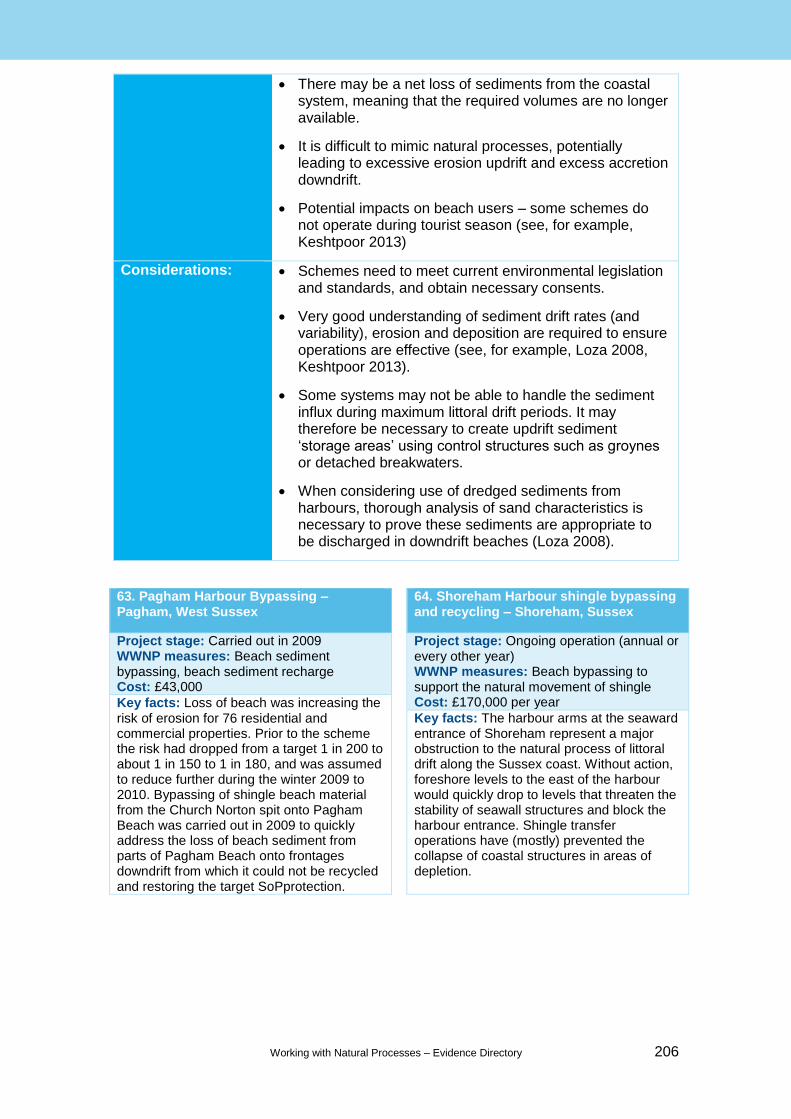
Working with Natural Processes – Evidence Directory 206
There may be a net loss of sediments from the coastal system, meaning that the required volumes are no longer available.
It is difficult to mimic natural processes, potentially leading to excessive erosion updrift and excess accretion downdrift.
Potential impacts on beach users – some schemes do not operate during tourist season (see, for example, Keshtpoor 2013)
Considerations: Schemes need to meet current environmental legislation and standards, and obtain necessary consents.
Very good understanding of sediment drift rates (and variability), erosion and deposition are required to ensure operations are effective (see, for example, Loza 2008, Keshtpoor 2013).
Some systems may not be able to handle the sediment influx during maximum littoral drift periods. It may therefore be necessary to create updrift sediment ‘storage areas’ using control structures such as groynes or detached breakwaters.
When considering use of dredged sediments from harbours, thorough analysis of sand characteristics is necessary to prove these sediments are appropriate to be discharged in downdrift beaches (Loza 2008).
63. Pagham Harbour Bypassing – Pagham, West Sussex
Project stage: Carried out in 2009 WWNP measures: Beach sediment bypassing, beach sediment recharge Cost: £43,000
Key facts: Loss of beach was increasing the risk of erosion for 76 residential and commercial properties. Prior to the scheme the risk had dropped from a target 1 in 200 to about 1 in 150 to 1 in 180, and was assumed to reduce further during the winter 2009 to 2010. Bypassing of shingle beach material from the Church Norton spit onto Pagham Beach was carried out in 2009 to quickly address the loss of beach sediment from parts of Pagham Beach onto frontages downdrift from which it could not be recycled and restoring the target SoPprotection.
64. Shoreham Harbour shingle bypassing and recycling – Shoreham, Sussex
Project stage: Ongoing operation (annual or every other year) WWNP measures: Beach bypassing to support the natural movement of shingle Cost: £170,000 per year
Key facts: The harbour arms at the seaward entrance of Shoreham represent a major obstruction to the natural process of littoral drift along the Sussex coast. Without action, foreshore levels to the east of the harbour would quickly drop to levels that threaten the stability of seawall structures and block the harbour entrance. Shingle transfer operations have (mostly) prevented the collapse of coastal structures in areas of depletion.
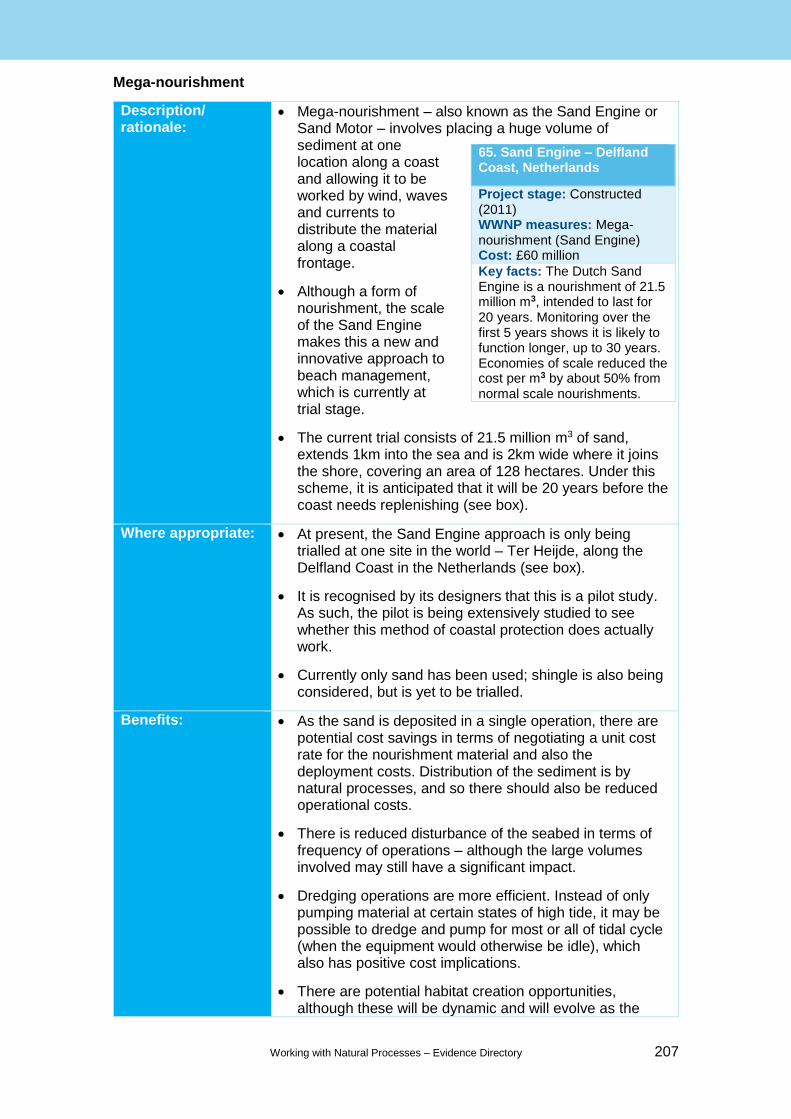
Working with Natural Processes – Evidence Directory 207
Mega-nourishment
Description/ rationale:
Mega-nourishment – also known as the Sand Engine or Sand Motor – involves placing a huge volume of sediment at one location along a coast and allowing it to be worked by wind, waves and currents to distribute the material along a coastal frontage.
Although a form of nourishment, the scale of the Sand Engine makes this a new and innovative approach to beach management, which is currently at trial stage.
The current trial consists of 21.5 million m3 of sand, extends 1km into the sea and is 2km wide where it joins the shore, covering an area of 128 hectares. Under this scheme, it is anticipated that it will be 20 years before the coast needs replenishing (see box).
Where appropriate: At present, the Sand Engine approach is only being trialled at one site in the world – Ter Heijde, along the Delfland Coast in the Netherlands (see box).
It is recognised by its designers that this is a pilot study. As such, the pilot is being extensively studied to see whether this method of coastal protection does actually work.
Currently only sand has been used; shingle is also being considered, but is yet to be trialled.
Benefits: As the sand is deposited in a single operation, there are potential cost savings in terms of negotiating a unit cost rate for the nourishment material and also the deployment costs. Distribution of the sediment is by natural processes, and so there should also be reduced operational costs.
There is reduced disturbance of the seabed in terms of frequency of operations – although the large volumes involved may still have a significant impact.
Dredging operations are more efficient. Instead of only pumping material at certain states of high tide, it may be possible to dredge and pump for most or all of tidal cycle (when the equipment would otherwise be idle), which also has positive cost implications.
There are potential habitat creation opportunities, although these will be dynamic and will evolve as the
65. Sand Engine – Delfland Coast, Netherlands
Project stage: Constructed (2011) WWNP measures: Mega-nourishment (Sand Engine) Cost: £60 million
Key facts: The Dutch Sand Engine is a nourishment of 21.5 million m3, intended to last for 20 years. Monitoring over the first 5 years shows it is likely to function longer, up to 30 years. Economies of scale reduced the cost per m3 by about 50% from normal scale nourishments.
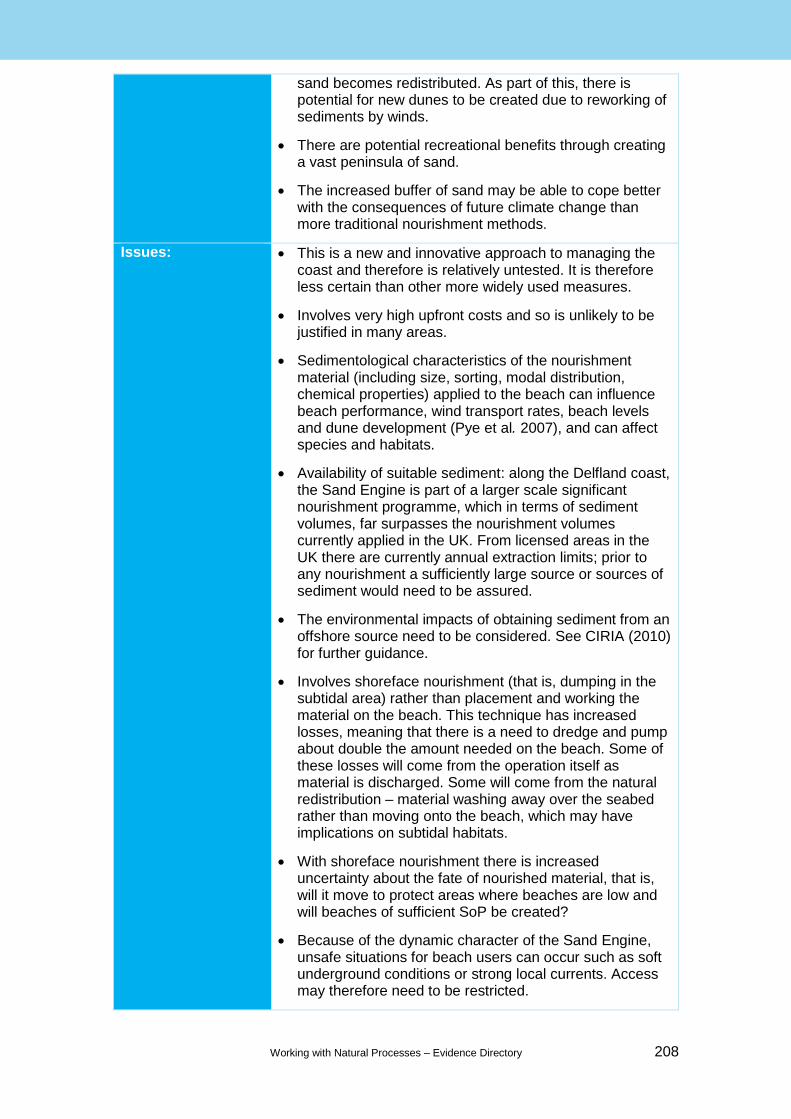
Working with Natural Processes – Evidence Directory 208
sand becomes redistributed. As part of this, there is potential for new dunes to be created due to reworking of sediments by winds.
There are potential recreational benefits through creating a vast peninsula of sand.
The increased buffer of sand may be able to cope better with the consequences of future climate change than more traditional nourishment methods.
Issues: This is a new and innovative approach to managing the coast and therefore is relatively untested. It is therefore less certain than other more widely used measures.
Involves very high upfront costs and so is unlikely to be justified in many areas.
Sedimentological characteristics of the nourishment material (including size, sorting, modal distribution, chemical properties) applied to the beach can influence beach performance, wind transport rates, beach levels and dune development (Pye et al. 2007), and can affect species and habitats.
Availability of suitable sediment: along the Delfland coast, the Sand Engine is part of a larger scale significant nourishment programme, which in terms of sediment volumes, far surpasses the nourishment volumes currently applied in the UK. From licensed areas in the UK there are currently annual extraction limits; prior to any nourishment a sufficiently large source or sources of sediment would need to be assured.
The environmental impacts of obtaining sediment from an offshore source need to be considered. See CIRIA (2010) for further guidance.
Involves shoreface nourishment (that is, dumping in the subtidal area) rather than placement and working the material on the beach. This technique has increased losses, meaning that there is a need to dredge and pump about double the amount needed on the beach. Some of these losses will come from the operation itself as material is discharged. Some will come from the natural redistribution – material washing away over the seabed rather than moving onto the beach, which may have implications on subtidal habitats.
With shoreface nourishment there is increased uncertainty about the fate of nourished material, that is, will it move to protect areas where beaches are low and will beaches of sufficient SoP be created?
Because of the dynamic character of the Sand Engine, unsafe situations for beach users can occur such as soft underground conditions or strong local currents. Access may therefore need to be restricted.
Working with Natural Processes – Evidence Directory 209
Considerations: Prior to constructing the Sand Engine, the Dutch had already experimented with other innovative techniques, which would have helped improve understanding of the beach and nearshore dynamics, prior to the construction of the Sand Motor. Similar understanding would be required before testing on other sites and with other materials.
An extensive monitoring programme is currently underway to evaluate how the Sand Engine is evolving and it is envisaged that similar effort would be required if undertaken elsewhere.
As this is an innovative technique, there are no design criteria that can be applied – differences between the Delfland pilot site in terms of tidal range, wave climate and nearshore bathymetry need to be carefully considered and modelled.
The extensive monitoring of the Delfland site should improve the understanding and applicability of this technique over time.
Reprofiling
Description/ rationale:
Involves the artificial adjustment of the beach profile. Often used to aid beach recovery during storms or to reinstate a ‘design’ profile follow nourishment.
Carried out using land-based plant such as bulldozers and is a rapid way to modify the beach morphology.
Where appropriate: Normally carried out within the intertidal and supratidal zone of the beach – usually to move material from the lower to upper beach, but also used to remove steep cliffs caused by cliffing and occasionally to move material from the upper beach (or backing promenades), for example, where sand blow has become an issue along accreting beaches.
Undertaken on all beach types, but more commonly on coarse sediment beaches.
Benefits: Low cost and rapid measure that can be used to improve the defence function of a beach. Can be used in emergency works.
May avoid the need for repeat nourishment if it avoids loss of nourishment materials seaward.
Where used to infill scour at the toe of seawalls, it can be effective in reducing the risk of undermining and destabilisation of structures, and therefore negate the need for more intrusive works.
Issues: Short-term measure which does not address the long-term cause of erosion.
Working with Natural Processes – Evidence Directory 210
May create an unsustainable profile, which then requires constant management to maintain.
Moving sediment from lower beach can introduce fines and affect beach porosity and morphology, and therefore defence function. Along coarse beaches, there may also be increased risk of cliffing if the percentage of sand increases.
Can result in a reflective beach being created if profile is oversteep, resulting in reduced absorption of wave energy and increased risk of scour and beach drawdown.
If undertaken following nourishment, there may be subsequent readjustment – meaning initial reprofiling works may be futile.
Potential impact on coastal habitats and geomorphology through disturbing seeds and existing plants, affecting invertebrates and nesting birds, and damaging the natural strata within the beach deposits.
Movement of material from the upper beach (and promenades) may introduce pollutants.
Excessive used of plant such as bulldozers on beaches may increase risk of compaction and affect both habitats and the defence function of the beach.
Morphology of the beach may be damaged – this is particularly an issue on coarse beaches.
Considerations: The ability of the beach to recover naturally post storm should be considered prior to any reprofiling works.
Natural seasonal changes in the beach should also be taken into account prior to any reactive works.
Areas of key conservation importance such as vegetated shingle should be protected from works.
Possible impact on beach grading and therefore on the porosity of the beach should be considered/monitored.
Summary of the literature
Prior to any beach management scheme, a project appraisal should consider the technical, economic and environment appraisal of different options. This may involve the development of a Beach Management Plan (BMP) or similar document. This document may simply discuss beach monitoring and performance, or identify the need for the implementation of beach management scheme and set out schedules for maintenance, monitoring and performance assessment (CIRIA 2010). A guidance BMP template is provided in the Beach Management Manual (CIRIA 2010), though the plan should be proportional to the works undertaken (Dornbusch et al. 2013).
Maintenance H

Working with Natural Processes – Evidence Directory 211
A BMP may therefore include the following (CIRIA 2010, Dornbusch et al. 2013):
o definition of the problem and the site boundaries, including the history of the site and its management, and the flood and erosion risk
o consideration of site constraints and opportunities
o baseline conditions, that is, existing morphology, inshore waves, winds, tides and sediment transport
o technical, environmental and economic appraisal of solutions (if undertaken prior to a scheme)
o design and implementation of the solution (if undertaken prior to a scheme) or details of the design process
o review of existing management and maintenance activities (including costs where appropriate) and identification of future activities
o statement of monitoring requirements (method and frequency)
o definition of performance appraisal and action levels
o programme of future reviews of the BMP to appraise performance and evaluate design against up-to-date monitoring data
In England, there is a network of 6 Regional Coastal Monitoring Programmes which collect coastal monitoring data in a co-ordinated and systematic manner. Data can be accessed via the Channel Coastal Observatory website (www.channelcoast.org).
The local differences in coastline and the risks being managed mean that programme composition varies regionally, but typically includes some combination of:
o beach profiles/topographic data
o bathymetry
o aerial photography surveys
o aerial photography
o LiDAR
o hydrodynamics (waves, tides)
o terrestrial ecological mapping
o other monitoring such as satellite imagery, fixed photography (for example, ARGUS cameras), bathymetric LiDAR, laser scanners and other local measurements such as cliff monitoring and sediment sampling
In Wales, monitoring of coastal erosion at a national level is led by the Welsh Coastal Monitoring Centre, currently co-ordinated by Gwynedd Council and funded by the Welsh Government. The Welsh Government is currently considering the future mechanism for provision of the Wales Coastal Monitoring Centre function and the framework for procuring national scale datasets. At a regional scale, the coastal groups co-ordinate the collection of data on behalf of the member local authorities, partially funded by the Welsh Government.
Although data collated as part of these national monitoring programmes will inform the choice of schemes, the BMP may identify additional monitoring requirements at a local scale to determine the performance of management works.
Management activities (both regular and emergency) should be linked to trigger conditions that are themselves linked to SoPs and to monitoring of the beach (Dornbusch et al. 2013).
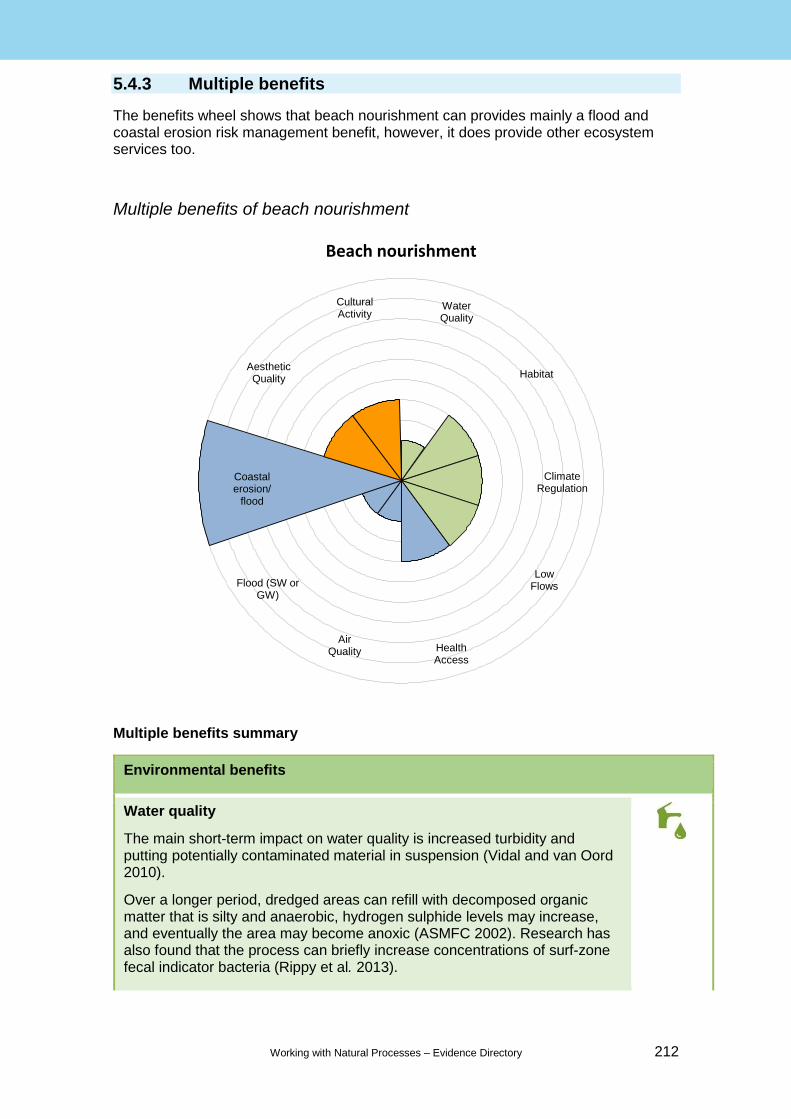
Working with Natural Processes – Evidence Directory 212
5.4.3 Multiple benefits
The benefits wheel shows that beach nourishment can provides mainly a flood and coastal erosion risk management benefit, however, it does provide other ecosystem services too.
Multiple benefits of beach nourishment
Multiple benefits summary
Environmental benefits
Water quality
The main short-term impact on water quality is increased turbidity and putting potentially contaminated material in suspension (Vidal and van Oord 2010).
Over a longer period, dredged areas can refill with decomposed organic matter that is silty and anaerobic, hydrogen sulphide levels may increase, and eventually the area may become anoxic (ASMFC 2002). Research has also found that the process can briefly increase concentrations of surf-zone fecal indicator bacteria (Rippy et al. 2013).
Beach nourishment
Water Quality
Habitat
Climate Regulation
Low Flows
Coastal erosion/
flood
Flood (SW or GW)
Air Quality Health
Access
Cultural Activity
Aesthetic Quality
Working with Natural Processes – Evidence Directory 213
Environmental benefits
Habitat provision
The impact of beach nourishment on biodiversity depends on factors including species type, sediment structure, nourishment strategy and nourishment size and timing (Speybroeck et al. 2006, Colosio et al. 2007). The immediate impacts are usually large and may be caused by burial or emigration, which can be compounded by changes in beach morphology (Defeo et al. 2009). Deposition of sediments onto subtidal shoals may bury and selectively kill populations of benthic invertebrates (Bishop et al. 2006).
The accretion of material can preserve habitats, but may destroy them at the removal site. However, most studies show that beach fauna recovers quickly from short-term decline after nourishment, with some pioneer species benefitting from the change (ASMFC 2002, Lewis et al. 2012). Beach nourishment can enhance shorebird nesting areas and habitat (Silveira et al. 2013).
A case study from Pagham Harbour in Sussex showed that increasing the beach width avoids or delays loss of vegetated shingle, which is part of a local nature reserve. Coastal vegetated shingle is a NERC Act priority habitat, supporting rare vegetation, breeding birds and diverse invertebrate communities.
A feasibility study of the Sand Engine approach in North Norfolk concluded that, if it were to increase the beach width over a frontage length of 3km, 30ha of new intertidal habitat would be created, with a value of £1.5 million (Royal HaskoningDHV 2015).
Climate regulation
Beach nourishment can temporarily help areas adapt to sea level rise due to climate change. However, this is a short-term measure if carried out in isolation, with the process needing to be continually repeated, although larger nourishments require less frequent measures.
Low flows
Beach recharge can affect water circulation. This impact depends on the granularity of the sediment, with larger sand grain sizes that help to reduce erosion favoured in beach nourishment. This could artificially increase beach slopes and permeability, creating higher rates of groundwater flow and exchange (Evans and Wilson 2016).
Social benefits
Health access
The increased area of beach available can create health benefits if the beach is made accessible to the public. Research has found that beaches encourage physical activity and psychological benefits including stress relief, having fun and engaging with nature (Ashbullby et al. 2013).
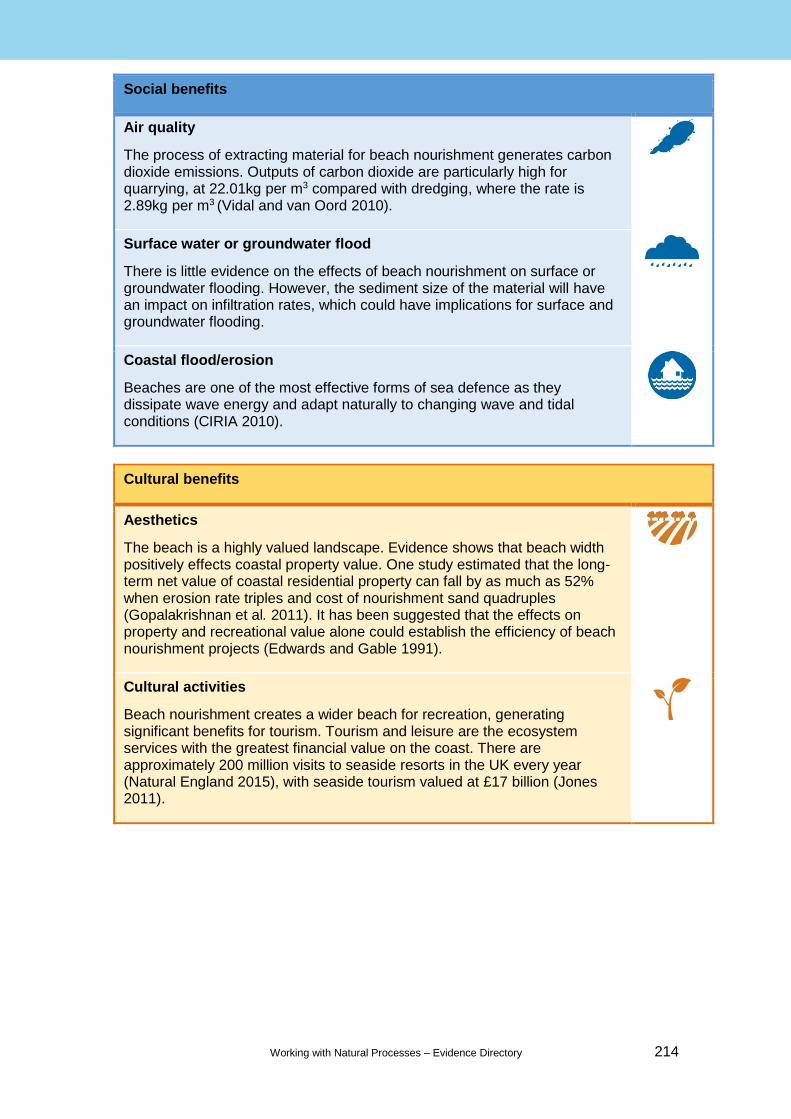
Working with Natural Processes – Evidence Directory 214
Social benefits
Air quality
The process of extracting material for beach nourishment generates carbon dioxide emissions. Outputs of carbon dioxide are particularly high for quarrying, at 22.01kg per m3 compared with dredging, where the rate is 2.89kg per m3 (Vidal and van Oord 2010).
Surface water or groundwater flood
There is little evidence on the effects of beach nourishment on surface or groundwater flooding. However, the sediment size of the material will have an impact on infiltration rates, which could have implications for surface and groundwater flooding.
Coastal flood/erosion
Beaches are one of the most effective forms of sea defence as they dissipate wave energy and adapt naturally to changing wave and tidal conditions (CIRIA 2010).
Cultural benefits
Aesthetics
The beach is a highly valued landscape. Evidence shows that beach width positively effects coastal property value. One study estimated that the long-term net value of coastal residential property can fall by as much as 52% when erosion rate triples and cost of nourishment sand quadruples (Gopalakrishnan et al. 2011). It has been suggested that the effects on property and recreational value alone could establish the efficiency of beach nourishment projects (Edwards and Gable 1991).
Cultural activities
Beach nourishment creates a wider beach for recreation, generating significant benefits for tourism. Tourism and leisure are the ecosystem services with the greatest financial value on the coast. There are approximately 200 million visits to seaside resorts in the UK every year (Natural England 2015), with seaside tourism valued at £17 billion (Jones 2011).
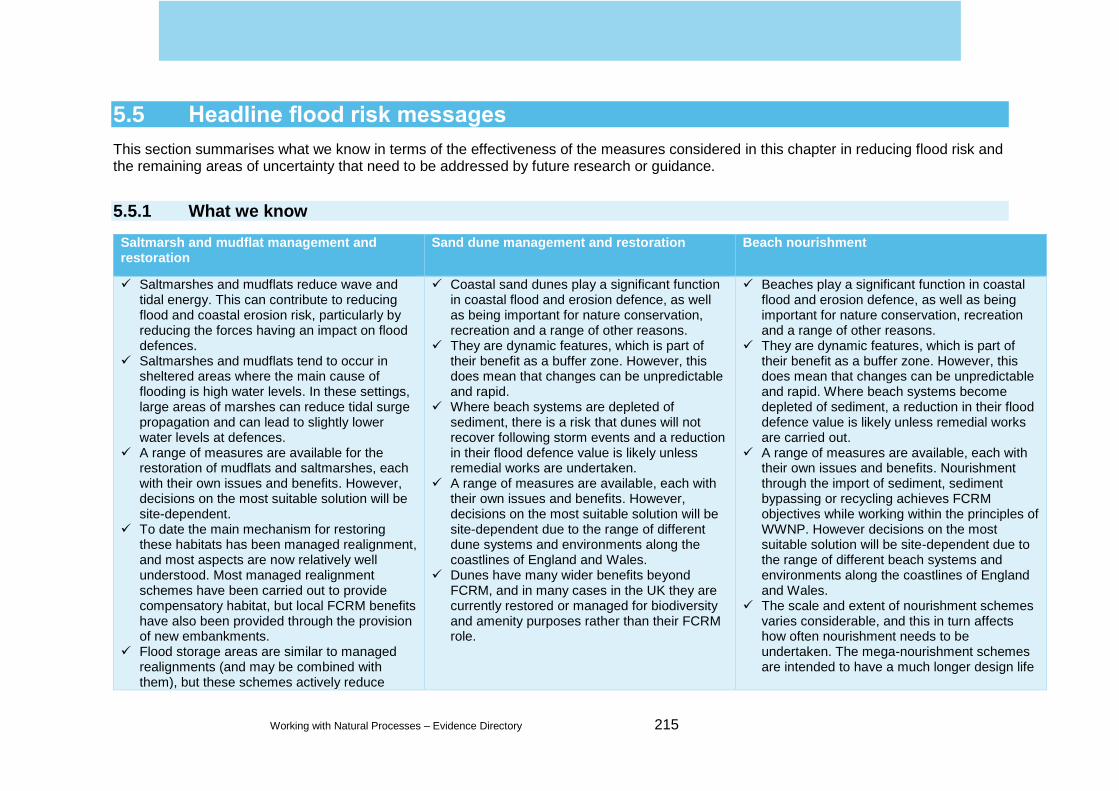
Working with Natural Processes – Evidence Directory 215
5.5 Headline flood risk messages
This section summarises what we know in terms of the effectiveness of the measures considered in this chapter in reducing flood risk and the remaining areas of uncertainty that need to be addressed by future research or guidance.
5.5.1 What we know
Saltmarsh and mudflat management and restoration
Sand dune management and restoration Beach nourishment
Saltmarshes and mudflats reduce wave and tidal energy. This can contribute to reducing flood and coastal erosion risk, particularly by reducing the forces having an impact on flood defences.
Saltmarshes and mudflats tend to occur in sheltered areas where the main cause of flooding is high water levels. In these settings, large areas of marshes can reduce tidal surge propagation and can lead to slightly lower water levels at defences.
A range of measures are available for the restoration of mudflats and saltmarshes, each with their own issues and benefits. However, decisions on the most suitable solution will be site-dependent.
To date the main mechanism for restoring these habitats has been managed realignment, and most aspects are now relatively well understood. Most managed realignment schemes have been carried out to provide compensatory habitat, but local FCRM benefits have also been provided through the provision of new embankments.
Flood storage areas are similar to managed realignments (and may be combined with them), but these schemes actively reduce
Coastal sand dunes play a significant function in coastal flood and erosion defence, as well as being important for nature conservation, recreation and a range of other reasons.
They are dynamic features, which is part of their benefit as a buffer zone. However, this does mean that changes can be unpredictable and rapid.
Where beach systems are depleted of sediment, there is a risk that dunes will not recover following storm events and a reduction in their flood defence value is likely unless remedial works are undertaken.
A range of measures are available, each with their own issues and benefits. However, decisions on the most suitable solution will be site-dependent due to the range of different dune systems and environments along the coastlines of England and Wales.
Dunes have many wider benefits beyond FCRM, and in many cases in the UK they are currently restored or managed for biodiversity and amenity purposes rather than their FCRM role.
Beaches play a significant function in coastal flood and erosion defence, as well as being important for nature conservation, recreation and a range of other reasons.
They are dynamic features, which is part of their benefit as a buffer zone. However, this does mean that changes can be unpredictable and rapid. Where beach systems become depleted of sediment, a reduction in their flood defence value is likely unless remedial works are carried out.
A range of measures are available, each with their own issues and benefits. Nourishment through the import of sediment, sediment bypassing or recycling achieves FCRM objectives while working within the principles of WWNP. However decisions on the most suitable solution will be site-dependent due to the range of different beach systems and environments along the coastlines of England and Wales.
The scale and extent of nourishment schemes varies considerable, and this in turn affects how often nourishment needs to be undertaken. The mega-nourishment schemes are intended to have a much longer design life

Working with Natural Processes – Evidence Directory 216
Saltmarsh and mudflat management and restoration
Sand dune management and restoration Beach nourishment
flood risk by reducing water levels in the wider estuary – they are an excellent example of WWNP.
Saltmarshes and mudflats have many wider benefits beyond FCRM, and in many cases in the UK they are currently restored or managed for biodiversity and amenity purposes rather for than their FCRM role.
(20–30 years), while elsewhere at least annual nourishment is necessary.
Commonly beach nourishment is carried out in combination with other forms of coastal management, for example, backing seawalls or groyne systems that are designed to improve retention of sediment.
5.5.2 What we don’t know
Saltmarsh and mudflat management and restoration
Sand dune management and restoration Beach nourishment
The concepts of ‘standard of protection’ and ‘design life’, having been derived for engineered structures, are less well suited to natural environments such as saltmarshes and mudflats. The assessment of the wave and water level reductions gained from the creation or restoration of these habitats can be assessed using a range of approaches including numerical modelling.
Prediction of the long-term evolution (50–100 years) of existing habitats and habitats created within managed realignment schemes is subject to large levels of uncertainty due to the large number of controlling factors.
Within managed realignment schemes, the progression of mudflat to saltmarsh is of particular interest for compensatory habitats schemes. This requires improved models for siltation and vegetation development.
In the UK, there has been limited implementation of flood storage areas in estuaries compared with the Netherlands. Further research is needed to judge whether
Each dune site is different and therefore there is no ‘one fit all’ solution. In places the root cause of the issue will remain unknown and monitoring will be required to determine whether a measure has been a success.
Although there is significant literature on the behaviour and management of dunes, there is less guidance on the best ways to employ the measures discussed above, such as the best positioning of fencing. Often this is based on local experience and trial and error approaches. Continued monitoring and knowledge sharing of experiences will improve understanding.
The response and therefore resilience of a dune system to a storm or series of storms is less predictable than an engineered hard structure. This will only be informed by continual monitoring at each individual site.
Similarly, future evolution of dune systems remain uncertain, in part due to the uncertainty in the predicting of future changes to prevailing conditions, particularly at a local level, and the
The prediction of long-term evolution (50–100 years) of beaches is subject to high levels of uncertainty due to the large number of controlling factors.
Each site is unique, and decisions about the suitability and/or design of a nourishment scheme depend on a number of factors including physical setting, environmental impact, and the availability of suitable sediments, costs and aesthetics. In places, the root cause of the erosion will remain unknown and monitoring will be required to determine whether it has been a success.
The fate of nourishment sediment depends on prevailing conditions. Although there may be data relating to past behaviour, there will always be uncertainty about future change. The design should be able to incorporate some variability, but the response and therefore resilience of the beach to a storm or series of storms remains less predictable than for an engineered hard structure.
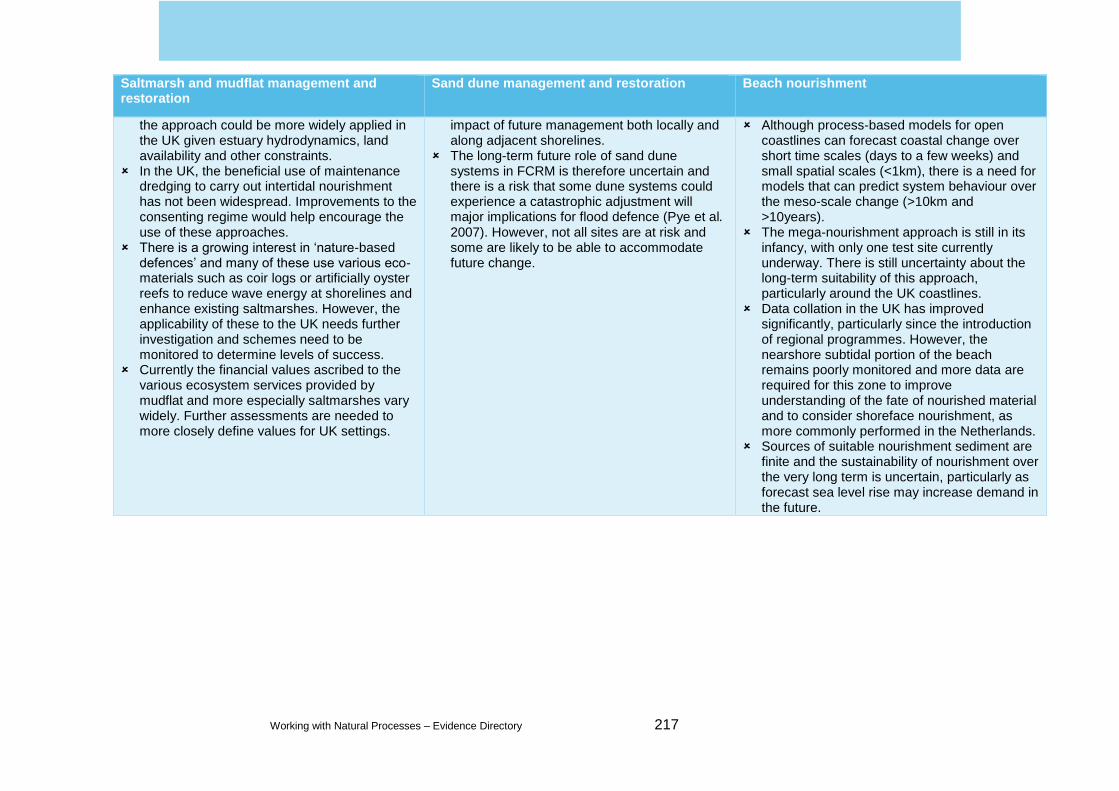
Working with Natural Processes – Evidence Directory 217
Saltmarsh and mudflat management and restoration
Sand dune management and restoration Beach nourishment
the approach could be more widely applied in the UK given estuary hydrodynamics, land availability and other constraints.
In the UK, the beneficial use of maintenance dredging to carry out intertidal nourishment has not been widespread. Improvements to the consenting regime would help encourage the use of these approaches.
There is a growing interest in ‘nature-based defences’ and many of these use various eco-materials such as coir logs or artificially oyster reefs to reduce wave energy at shorelines and enhance existing saltmarshes. However, the applicability of these to the UK needs further investigation and schemes need to be monitored to determine levels of success.
Currently the financial values ascribed to the various ecosystem services provided by mudflat and more especially saltmarshes vary widely. Further assessments are needed to more closely define values for UK settings.
impact of future management both locally and along adjacent shorelines.
The long-term future role of sand dune systems in FCRM is therefore uncertain and there is a risk that some dune systems could experience a catastrophic adjustment will major implications for flood defence (Pye et al. 2007). However, not all sites are at risk and some are likely to be able to accommodate future change.
Although process-based models for open coastlines can forecast coastal change over short time scales (days to a few weeks) and small spatial scales (<1km), there is a need for models that can predict system behaviour over the meso-scale change (>10km and >10years).
The mega-nourishment approach is still in its infancy, with only one test site currently underway. There is still uncertainty about the long-term suitability of this approach, particularly around the UK coastlines.
Data collation in the UK has improved significantly, particularly since the introduction of regional programmes. However, the nearshore subtidal portion of the beach remains poorly monitored and more data are required for this zone to improve understanding of the fate of nourished material and to consider shoreface nourishment, as more commonly performed in the Netherlands.
Sources of suitable nourishment sediment are finite and the sustainability of nourishment over the very long term is uncertain, particularly as forecast sea level rise may increase demand in the future.
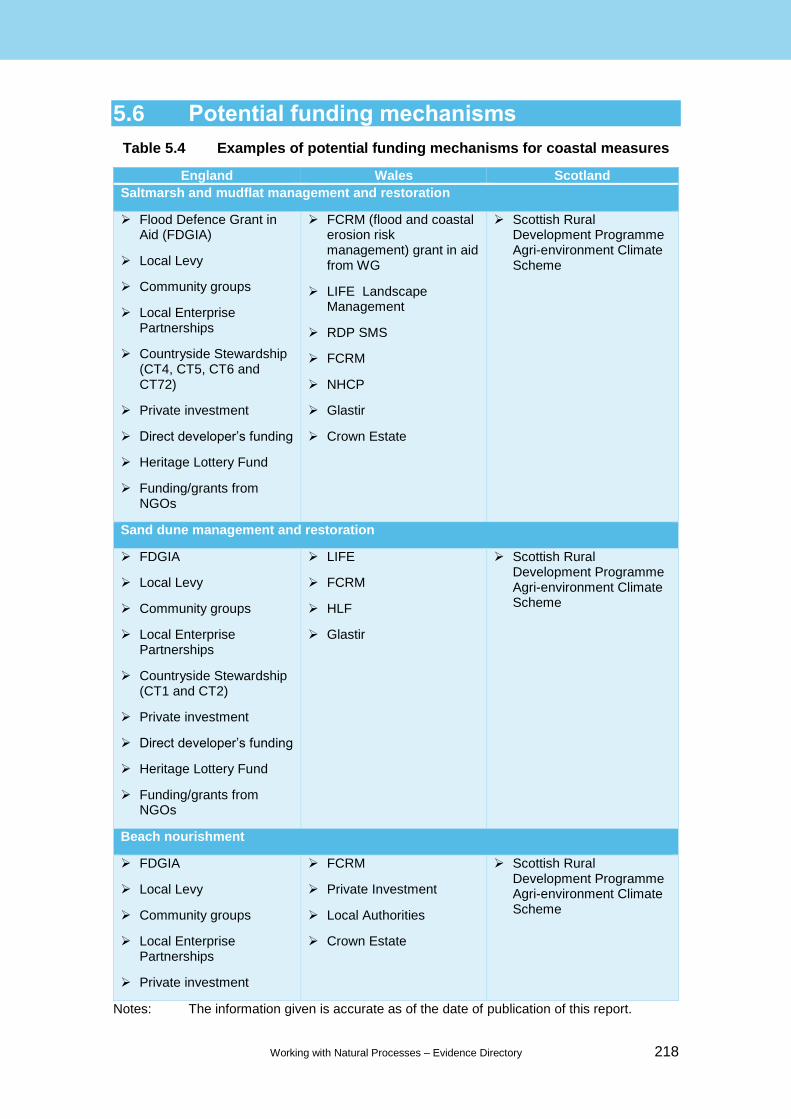
Working with Natural Processes – Evidence Directory 218
5.6 Potential funding mechanisms
Table 5.4 Examples of potential funding mechanisms for coastal measures
England Wales Scotland
Saltmarsh and mudflat management and restoration
Flood Defence Grant in Aid (FDGIA)
Local Levy
Community groups
Local Enterprise Partnerships
Countryside Stewardship (CT4, CT5, CT6 and CT72)
Private investment
Direct developer’s funding
Heritage Lottery Fund
Funding/grants from NGOs
FCRM (flood and coastal erosion risk management) grant in aid from WG
LIFE Landscape Management
RDP SMS
FCRM
NHCP
Glastir
Crown Estate
Scottish Rural Development Programme Agri-environment Climate Scheme
Sand dune management and restoration
FDGIA
Local Levy
Community groups
Local Enterprise Partnerships
Countryside Stewardship (CT1 and CT2)
Private investment
Direct developer’s funding
Heritage Lottery Fund
Funding/grants from NGOs
LIFE
FCRM
HLF
Glastir
Scottish Rural Development Programme Agri-environment Climate Scheme
Beach nourishment
FDGIA
Local Levy
Community groups
Local Enterprise Partnerships
Private investment
FCRM
Private Investment
Local Authorities
Crown Estate
Scottish Rural Development Programme Agri-environment Climate Scheme
Notes: The information given is accurate as of the date of publication of this report.
Working with Natural Processes – Evidence Directory 219
5.7 Further reading
A guide to managing coastal erosion in beach/dune systems (SNH 2000)
Beach Management Manual (2nd edition) (CIRIA 2010)
Coastal and estuarine managed realignment – design issues (CIRIA 2004)
Dossier: Building with nature (news and information from Dutch researchers*)
Eco-engineering in the Netherlands: soft interventions with a solid impact (report from Deltares*)
Greening the Grey: a framework for integrated green grey infrastructure (IGGI) (Naylor et al 2017)
Saltmarsh management manual (Environment Agency et al. 2007)
Sand dune processes and management for flood and coastal defence (Pye et al. 2007)
SEPA’s Natural Flood Management Handbook (SEPA 2015)
The cost of undertaking managed realignment schemes in the UK (ABPmer 2015)
Use of natural and nature-based features (NNBF) for coastal resilience (Bridges et al. 2015)
* See Bibliography for further details

Working with Natural Processes – Evidence Directory 220
Chapter 6. Research gaps and monitoring
Mayes Brook restoration – explaining ecological monitoring to local school children (source: Environment Agency)

Working with Natural Processes – Evidence Directory 221
6 Research gaps and monitoring
6.1 Introduction
The previous chapters summarise the evidence base behind WWNP, explaining what we know and what we don’t know about how effective these different measures are at reducing flood risk and the wider benefits which they can achieve for people and the environment.
The ‘Headline flood risk messages’ sections of Chapters 2 to 5 summarise the main areas of uncertainty where more research is needed to address these gaps and expand these areas of science. When you develop a WWNP project and plan to undertake monitoring, it is suggested you look at these chapters, and consider for the measures you are planning to construct whether you could potentially address any of these gaps. Table 6.1 summarises some of the key knowledge gaps common across most types of measures.
This chapter provides some high level guidelines to help you establish a robust monitoring strategy as part of a project. This chapter focuses solely on monitoring the effects of WWNP from a flood risk perspective. In reality, you would rarely monitor a scheme solely from a flood risk perspective, but you would work with a range of different experts to develop a monitoring plan that helped you to assess the impacts of your projects from a range of different perspective.
Alongside the flood risk examples described in this chapter, the case studies listed below include a wide range of different monitoring approaches.
Eddleston Water
Evenlode
Exmoor Mires
Haltwhistle
Mayes Brook
Moors for the Future
New Forest
Pickering
Pontbren
Table 6.1 Research gaps summary
Gap 1: The flood risk Impact of WWNP measures across different scales
The effectiveness of WWNP measures alone, in clusters or in combination with other forms of FCRM for a range of return periods and a range of different catchment scales on:
flood level/flow for range return periods
flood peak (including synchronisation and backwater effect)
flood storage
Including understanding of:
what scale/extent of a WWNP measure is needed in a catchment to reduce flood risk

Working with Natural Processes – Evidence Directory 222
how effective measure (including soils) are when fully saturated
Gap 2: Performance and design life
The whole life performance and engineering design standard of WWNP measures need to be understood. Specifically information is required on:
whole life costs of measures
SoP to downstream communities
comparative assessments between WWNP/NFM and traditional measures
how long does it take for the measures to work
how long does the measure last (design life)
how frequently do they need to be maintained
Gap 3: Typology, geology, sediment management and conveyance
How do WWNP measures function in different catchment typologies/geologies and what effect do they have on sediment management and conveyance? Specifically:
What are the flood risk effects of proposed measures in groundwater-fed catchments?
What are the flood risk effects of your proposed measures in lowland catchments? (including pumped catchments and perched river systems)
Do the measures affect channel conveyance?
Do the measures trap sediment and reduce the need for channel maintenance?
Gap 4: Wider benefits
Ecosystem service benefits of different measures including (quantitative information if possible)
Role of WWNP/NFM in making catchments more adaptable/resilient to climate change
6.1.1 Setting monitoring objectives
Monitoring is necessary to:
demonstrate success
learn from mistakes
know when adaptive management is needed
fill known research gaps
inform funders, partners and local stakeholders of how the projects has worked
Monitoring and evaluation needs to be a part of initial project planning (Figure 6.1). It and can help to secure future funding and engage local communities.
One of the first steps when developing a monitoring programme is articulate the overall aim of the project (that is, describe what you are trying to achieve). Defining clear objectives will help to ensure that monitoring is cost-effective and aligned to the project’s targets. It will also help to identify what baseline data and resources are required for monitoring (RRC 2017).

Working with Natural Processes – Evidence Directory 223
Figure 6.1 Planning your monitoring
Source: RRC (2017)
Monitoring should primarily focus on demonstrating that project objectives have been achieved. Project objectives should be developed using the SMART approach explained in the Practical River Restoration Appraisal Guidance for Monitoring Options (PRAGMO) guide (RRC 2012).
Objectives should target a Specific area of improvement or answer a specific need.
Measurable. Objectives must be quantifiable, or at least allow for measurable progress.
Attainable. Objectives should be realistic, and based on a review of evidence of success by others.
Realistic. Based on available resources (money, people, time) and existing constraints
Time-bound. Objectives must have a deadline or defined end.10
However, project objectives and specific monitoring objectives may be different. For example, the project objective may be ‘To reduce flood risk to community X’ and the SMART monitoring objective is ‘To reduce the risk of flooding to community X for flood events up to a 1 in 30 year SoP by 2025, as demonstrated with a flood model and gauged flood levels during flood events’.
Using the RRC’s Monitoring Planner (www.therrc.co.uk/monitoring-planner) at this early stage in the project can help you plan your monitoring and consider key questions such as the following.
Why are you doing the project, what are the project objectives?
What is your monitoring objective/what are you trying to observe?
How will you collect data and what assessment methods are you using?
Do you have any access to pre-project baseline data?
When are you collecting data?
Who is going to monitor data? Who is going to evaluate the data?
How much will the monitoring AND its evaluation cost?
How confident are you that the monitoring will show what you are trying to observe?
10 The amount of time needed to monitor a measure will depend on how long it takes to become
effective. For some measures this is immediate, but for woodland it is much longer.

Working with Natural Processes – Evidence Directory 224
How will your collected monitoring data be processed, analysed and reported?
Quantifying the effect of WWNP measures is challenging: developing a monitoring plan that enables change to be detected needs careful thought and planning. When setting your monitoring objectives, think about whether your project can fill any of the gaps listed in Table 6.1.
6.2 Extent of monitoring needed
The monitoring of WWNP projects generally takes one of 2 approaches.
‘Detailed’ approach. This looks at the extent of effects of local-scale flow changes and or catchment-scale flow changes on flood risk.
‘Lighter touch’ approach. This looks at:
- how, where and when a measure is working
- whether the effects of a measure can be used to inform modelling studies
- how the measures perform in non-flood and low flow conditions
Developing monitoring objectives using the RRC’s monitoring planner will help you to establish the extent of monitoring necessary to establish if the project is successful. Alongside this, using two-part of the decision flow chart shown in Figure 6.2 will help you to establish the extent of monitoring that may be feasible in the project catchment.
6.2.1 Detailed approach to monitoring
When designing a detailed programme of monitoring to quantify the impacts of WWNP at a catchment or field scale, a Before–After Control–Impact (BACI) approach. The principles of BACI can be summarised as follows.
The measure has not yet been implemented, or there are suitable pre-measure baseline observations as a temporal control.
The type, timing, magnitude and location(s) of the measure are known.
It is possible to collect the variables required by the experimental design.
A suitable area not subject to change must be monitored in a similar way as performed in the measure area to provide a spatial control.
Where it is not possible to fulfil all the BACI criteria listed above, there will be greater uncertainty associated with any results.

Working with Natural Processes – Evidence Directory 225
Figure 6.2a Decision tree to help select right level of monitoring when adopting a ‘detailed’ experimental design
1 Length of baseline needed depends on the SoP of proposed measures: (i) 1 in 5 years or less, are 1 year of baseline data available? (ii) Between 1 in 5 and 1 in 25 years, are >3 years of baseline data available? (iii) 1 in 25 years or greater, are >10 years of baseline data available?
2 Will the proportion of the upstream catchment affected by the measures exceed 20%? Will the proposed additional storage volume be sufficient to achieve the desired SoP?
3 For example, install a water level recorder linked to a rated channel or use ultrasonic Doppler discharge instrument. Install rain gauge(s) to record the amount and distribution of rainfall in catchment.
Is your optimal monitoring scheme (which will help determine the effect of the measures on flood flows)
feasible?
Is existing monitoring in place to provide a sufficient length of baseline record?1 Or can you install monitoring equipment to collect a sufficient baseline record?
Go to decision tree on next
page
Can the proposed measures (area, number or size) be expected to have a measureable impact2 on flood flows
and levels at specific locations?
Is a well maintained flow control structure in place or can one be constructed? (check existing gauge performance). Is
there a suitable section of channel downstream available where data on flood flows and levels canb e collected?
Install monitoring instrumentation3 at suitable upstream and downstream points, plus possibly within a separate control
catchment, to monitor changes to flows and levels.
Are the NFM measures likely to cause flood flows to bypass the flow measuring point(s)?
Are nearby control or upstream monitoring sites available to record and take into account any background changes in rainfall regime? Is it possible to control/limit any significant
changes to land use and land management (aside from NFM) that could affect flood measurement in the
catchment(s) during the period of study?
Will the NFM measure(s) become established within the timeframe of the project?
Y
Y
Y
Y
Y
N
Y
Y
N
N
N
N
N
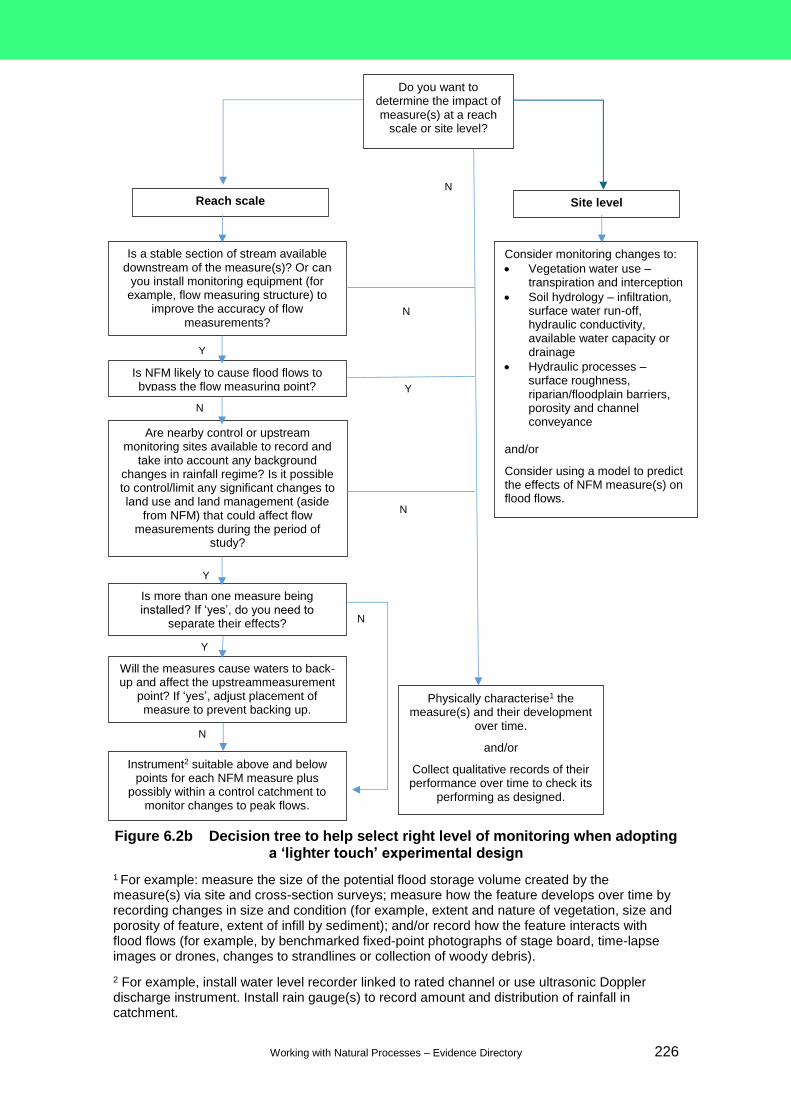
Working with Natural Processes – Evidence Directory 226
Top
Figure 6.2b Decision tree to help select right level of monitoring when adopting a ‘lighter touch’ experimental design
1 For example: measure the size of the potential flood storage volume created by the measure(s) via site and cross-section surveys; measure how the feature develops over time by recording changes in size and condition (for example, extent and nature of vegetation, size and porosity of feature, extent of infill by sediment); and/or record how the feature interacts with flood flows (for example, by benchmarked fixed-point photographs of stage board, time-lapse images or drones, changes to strandlines or collection of woody debris).
2 For example, install water level recorder linked to rated channel or use ultrasonic Doppler discharge instrument. Install rain gauge(s) to record amount and distribution of rainfall in catchment.
Do you want to determine the impact of measure(s) at a reach
scale or site level?
Reach scale
Is a stable section of stream available downstream of the measure(s)? Or can
you install monitoring equipment (for example, flow measuring structure) to
improve the accuracy of flow measurements?
Is NFM likely to cause flood flows to bypass the flow measuring point?
Are nearby control or upstream monitoring sites available to record and
take into account any background changes in rainfall regime? Is it possible to control/limit any significant changes to land use and land management (aside
from NFM) that could affect flow measurements during the period of
study?
Is more than one measure being installed? If ‘yes’, do you need to
separate their effects?
Site level
Consider monitoring changes to:
Vegetation water use – transpiration and interception
Soil hydrology – infiltration, surface water run-off, hydraulic conductivity, available water capacity or drainage
Hydraulic processes – surface roughness, riparian/floodplain barriers, porosity and channel conveyance
and/or
Consider using a model to predict the effects of NFM measure(s) on flood flows.
Will the measures cause waters to back-up and affect the upstreammeasurement
point? If ‘yes’, adjust placement of measure to prevent backing up.
Instrument2 suitable above and below points for each NFM measure plus
possibly within a control catchment to monitor changes to peak flows.
Physically characterise1 the measure(s) and their development
over time.
and/or
Collect qualitative records of their performance over time to check its
performing as designed.
Y
Y
N
N
Y
N
N
Y
N
N
Working with Natural Processes – Evidence Directory 227
Baseline data
Baseline monitoring is the monitoring conducted before the WWNP measures are constructed. It is needed to evaluate the effects the measures have on hydrological pathways, so that the pre and post installation periods can be compared.
A long baseline period (the length depends on the catchment setting) is always preferable to gain a basic understanding of the background hydrological processes taking place in a catchment. A short baseline timeframe is likely to increase the uncertainty in the understanding of how effective the project has been and whether monitoring objectives have been met.
In some cases, baseline data may already exist. For example, there are:
more than 3,000 river level and flow gauges in Great Britain managed by the Environment Agency, Natural Resources Wales and SEPA
thousands of rain gauges scattered across the UK11
Environment Agency Level only sites
It is essential to consider what monitoring equipment may already be present in the catchment, and the duration and quality of the datasets. Other organisations and landowners within the catchment may also hold or collect monitoring data which could be used.
Control sites
Control sites can be useful because they allow comparisons of how site(s) are performing with a similar site with no measures included. Control site can include:
Paired catchment approach – usually consists of a control catchment and a catchment where WWNP measures are to be applied
Nested pair catchment approach – where a catchment is split into 2 sections: a downstream section is used as a control and any WWNP measure are applied to the upstream section (Hewlett and Pienaar 1973)
However, it can be difficult to find an area in the catchment or a paired catchment that:
is not subject to change
can be monitored simultaneously to the site(s) where the WWNP project has been constructed
Control sites can be set up upstream of the site(s) on the same river, provided that they will not be affected by the measure.
Representative monitoring
Monitoring equipment should be positioned in areas that will provide representative monitoring of the impact of WWNP measures, but are not drowned out by other environmental variables or catchment areas not covered by WWNP measures.
11 See the National River Flow Archive (https://nrfa.ceh.ac.uk) for river gauges and the British
Atmospheric Data Centre (https://badc.nerc.ac.uk/home/index.html) for rain gauges.
Working with Natural Processes – Evidence Directory 228
6.2.2 Lighter touch approach to monitoring
A lighter touch approach to monitoring will lack either a baseline dataset or a control site. In some cases, projects may need to be constructed before a baseline dataset can established. In this case it is recommended that as soon as the project starts, a monitoring network is established to enable a control site to be established (see above).
In cases where baseline data are available but there is not a suitable control site, a lighter touch approach to monitoring will only be able to demonstrate how the project has changed compared with the baseline dataset.
The length of baseline record that is adequate will be specific to the type(s) of WWNP measure(s) being constructed. An adequate baseline should represent the sequence of hydrological events (for example, a series of events associated with peak flood flows) that the WWNP measures are trying to affect.
If undertaking a ‘before and after’ study, any long-term data that may be available should be reviewed to:
match similar years before and after implementation
allow comparison of similar flow events
6.2.3 Monitoring for modelling
The aim of monitoring of hydrological variables (for example, discharge, and soil moisture content) or sampling of hydrological parameters (for example, soil hydraulic conductivity) may be to:
inform changes in model parameters to simulate WWNP effectiveness
allow validation of a model structure for a particular purpose
In these cases, concentrating monitoring the processes that the model simulates is most appropriate. Transforming field measurements into effective model parameters is a major research challenge and requires careful consideration when planning monitoring to make sure the right types of data are collected.
6.2.4 Determining catchment rainfall–run-off characteristics
To understand the effects of WWNP within a catchment, it is necessary to understand its rainfall–run-off characteristics by constructing a rainfall–run-off model or developing typical run-off statistics (such SPRHOST and BFIHOST) from conceptual models of soil/subsoil hydrological processes. However, these models and run-off indicators have limitations because they are:
based on observations and assumptions
developed from time series which are measured at a large scale
based on models that have been calibrated but may not be representative of what is happening in a catchment
When developing a monitoring programme for a WWNP project, it is comparatively easy to show through a time series how the WWNP features fill up and drain in response to rainfall. What is more challenging is scaling up the effects of WWNP locally to understand their impact at a catchment scale. To upscale, information is needed on parameters such as:
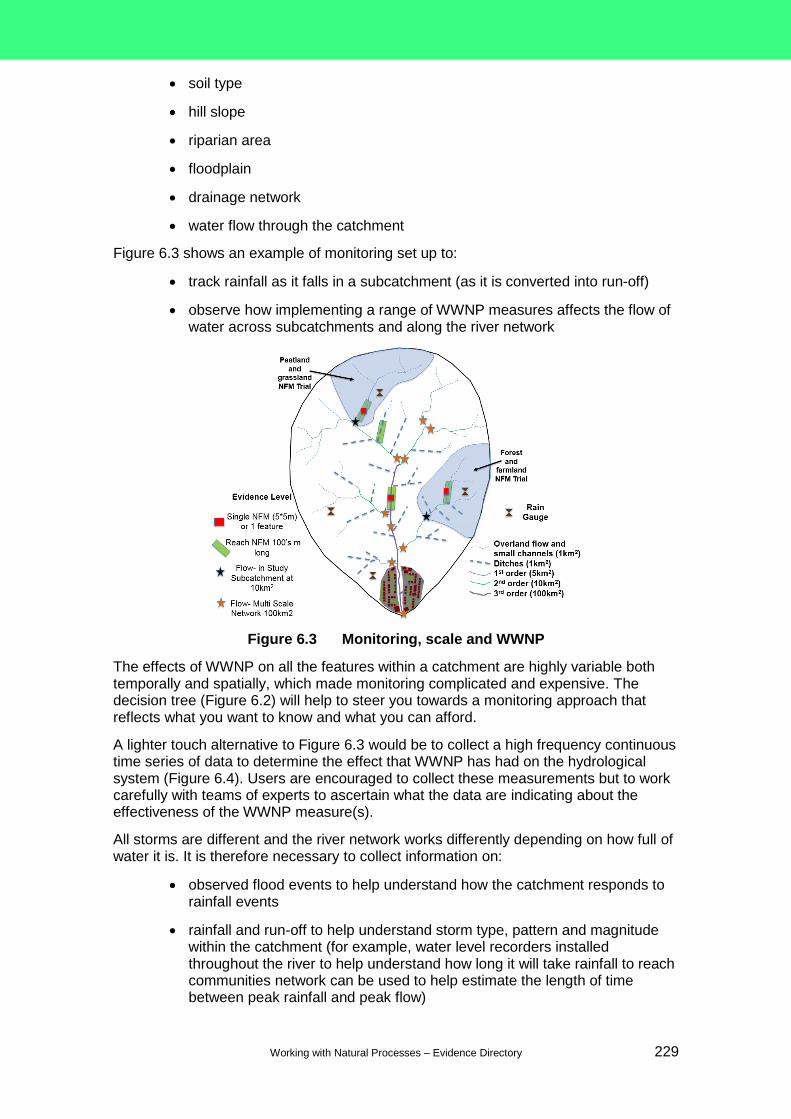
Working with Natural Processes – Evidence Directory 229
soil type
hill slope
riparian area
floodplain
drainage network
water flow through the catchment
Figure 6.3 shows an example of monitoring set up to:
track rainfall as it falls in a subcatchment (as it is converted into run-off)
observe how implementing a range of WWNP measures affects the flow of water across subcatchments and along the river network
Figure 6.3 Monitoring, scale and WWNP
The effects of WWNP on all the features within a catchment are highly variable both temporally and spatially, which made monitoring complicated and expensive. The decision tree (Figure 6.2) will help to steer you towards a monitoring approach that reflects what you want to know and what you can afford.
A lighter touch alternative to Figure 6.3 would be to collect a high frequency continuous time series of data to determine the effect that WWNP has had on the hydrological system (Figure 6.4). Users are encouraged to collect these measurements but to work carefully with teams of experts to ascertain what the data are indicating about the effectiveness of the WWNP measure(s).
All storms are different and the river network works differently depending on how full of water it is. It is therefore necessary to collect information on:
observed flood events to help understand how the catchment responds to rainfall events
rainfall and run-off to help understand storm type, pattern and magnitude within the catchment (for example, water level recorders installed throughout the river to help understand how long it will take rainfall to reach communities network can be used to help estimate the length of time between peak rainfall and peak flow)
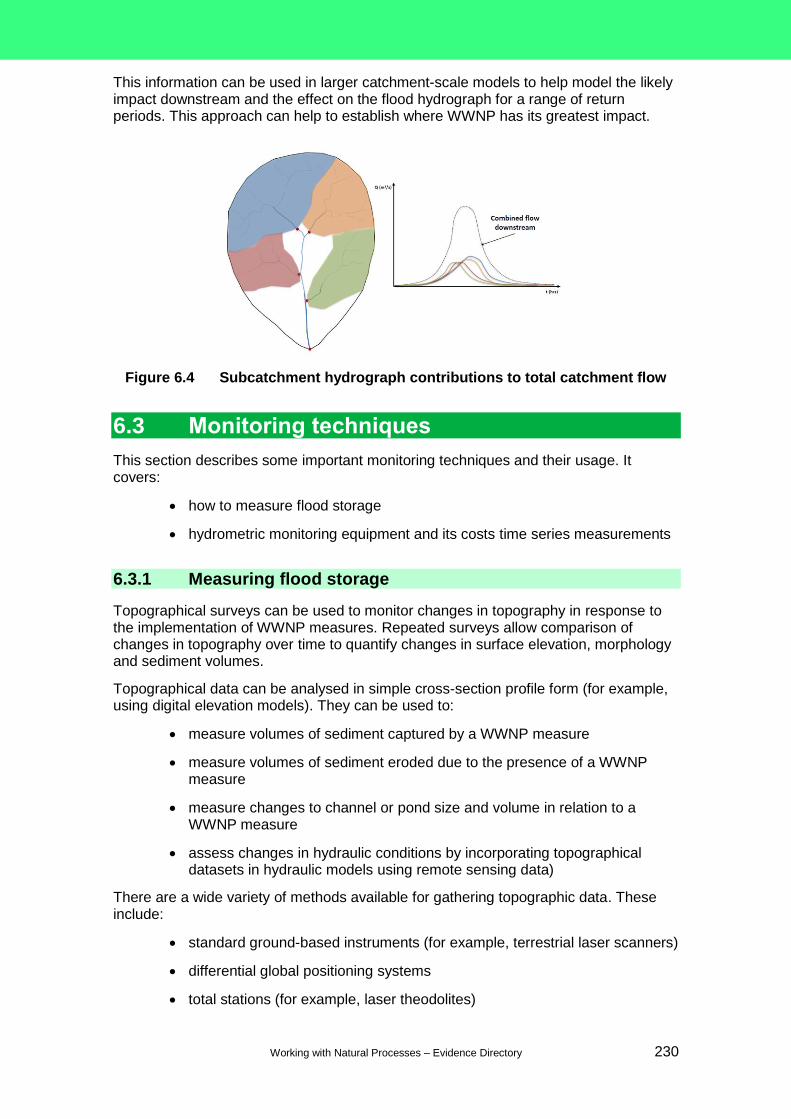
Working with Natural Processes – Evidence Directory 230
This information can be used in larger catchment-scale models to help model the likely impact downstream and the effect on the flood hydrograph for a range of return periods. This approach can help to establish where WWNP has its greatest impact.
Figure 6.4 Subcatchment hydrograph contributions to total catchment flow
6.3 Monitoring techniques
This section describes some important monitoring techniques and their usage. It covers:
how to measure flood storage
hydrometric monitoring equipment and its costs time series measurements
6.3.1 Measuring flood storage
Topographical surveys can be used to monitor changes in topography in response to the implementation of WWNP measures. Repeated surveys allow comparison of changes in topography over time to quantify changes in surface elevation, morphology and sediment volumes.
Topographical data can be analysed in simple cross-section profile form (for example, using digital elevation models). They can be used to:
measure volumes of sediment captured by a WWNP measure
measure volumes of sediment eroded due to the presence of a WWNP measure
measure changes to channel or pond size and volume in relation to a WWNP measure
assess changes in hydraulic conditions by incorporating topographical datasets in hydraulic models using remote sensing data)
There are a wide variety of methods available for gathering topographic data. These include:
standard ground-based instruments (for example, terrestrial laser scanners)
differential global positioning systems
total stations (for example, laser theodolites)
Working with Natural Processes – Evidence Directory 231
remotely sensed data (for example, LiDAR12 and satellite imagery) which can be used in part to capture data around the effectiveness of the measures during flood events
structure from motion techniques, which have been used on the ground and based on aerial platforms
The choice of survey technique will depend on:
the level of accuracy required
the study’s objectives
the characteristics of the site being surveyed
A crucial aspect when considering morphological change is the level of uncertainty in the data. The techniques listed above all have their pros and cons based on factors such as instrument precision and the data processing steps taken after a survey.
6.3.2 Hydrometric monitoring equipment
Table 6.2 summarises the types of monitoring approach that can be implemented in a catchment to characterise:
the functioning of measures and the impact on the wider channel network
the associated cost of each measure (not including the cost of its construction)
the time needed to install the equipment at a site
All equipment highlighted in Table 6.2 has an associated monitoring frequency. It is recommended to record on the finest time resolution possible, bearing in mind that a data logger which is recording every minute could be full within days and therefore require frequent downloading (which has cost and time implications).
Generally, it is recommended that if the catchment is <10km2 in area then every 5 minutes is adequate. If the catchment is >10km2 in area, then a 15 minute13 frequency should be explored. Hourly data are generally too coarse a resolution to detect response times in a catchment of <100km2. Early on in the data collection period (that is, the first 3–4 weeks), the flow data should be checked visually to ensure that the peak flows are being captured. If the peak flows are being missed, the monitoring frequency may need to be adjusted.
Ideally all monitoring equipment across a field site should be set to the same monitoring frequency to allow the data to be easily compared and analysed across the monitoring catchment.
Telemetry can be added to most monitoring sensors/networks. This can be done using a normal mobile data contract or through a specialist telemetry data provider. Telemetry can allow real to near real-time data to be obtained from the monitoring sensor; these data can be supplied to a computer server or public website. Presenting these data on a website can be a useful mechanism for stakeholder engagement; it can also provide flood and storm warnings through an SMS alert system.
Generally, telemetry can reduce the time needed to visit and download loggers, saving on maintenance and download costs. However, telemetered loggers are more expense
12 LiDAR sensors based on aerial platforms can capture topographical data over wide areas. 13 15 minutes is the standard on most Environment Agency gauges.

Working with Natural Processes – Evidence Directory 232
(£100–500 extra) and require an ongoing Sim card contract. Telemetry can also alert users to any logger problems which would not normally be spotted until somebody visited the logger; this helps to reduce the number of gaps in data time series. Telemetry can also reduce the number of sampling staff needed, thus reducing monitoring costs.
When collecting field data, natural environmental processes can have an impact on data quality (Table 6.3). Funds should be held back to help calibrate and/or replace monitoring equipment in case of damage, theft or vandalism.
Table 6.2 Basic hydrological monitoring instruments with estimated costs
Parameter Monitoring instrument
Estimate guide price (capital costs)
Installation time in days (in ~10km2 catchment)
Limitations Maintenance frequency
Water level Capacitance rod
£100–£300
0.5 Not as robust as a pressure transducer; limited depth range.
All water level/velocity recorders should realistically be maintained monthly and after high flow events
Water level Non-vented pressure transducer
£400–£600
0.5 Requires barometric correction for air pressure.
As above
Water level Vented pressure transducer
£800–£1,000
0.5 Vent breathing tube must always be above the highest flood level.
As above
Water level Chain and counterweight system
£1,000–£1,500
1 Physical measure – must always be taller than the highest level.
As above
Water velocity
Acoustic Doppler devices
£2,000–£6,000
1 Cost and installation is trickier than the above.
As above
Rainfall Tipping bucket rain gauge
£400–£800
0.25 (assuming compound fence is in place to protect from livestock)
Must be located following guidelines as this can lead to underestimation of rainfall.
Monthly to ensure equipment is clean
Weather parameters for
Weather station
£3,000–£8,000
1 Lots of parts to maintain.
Minimum monthly
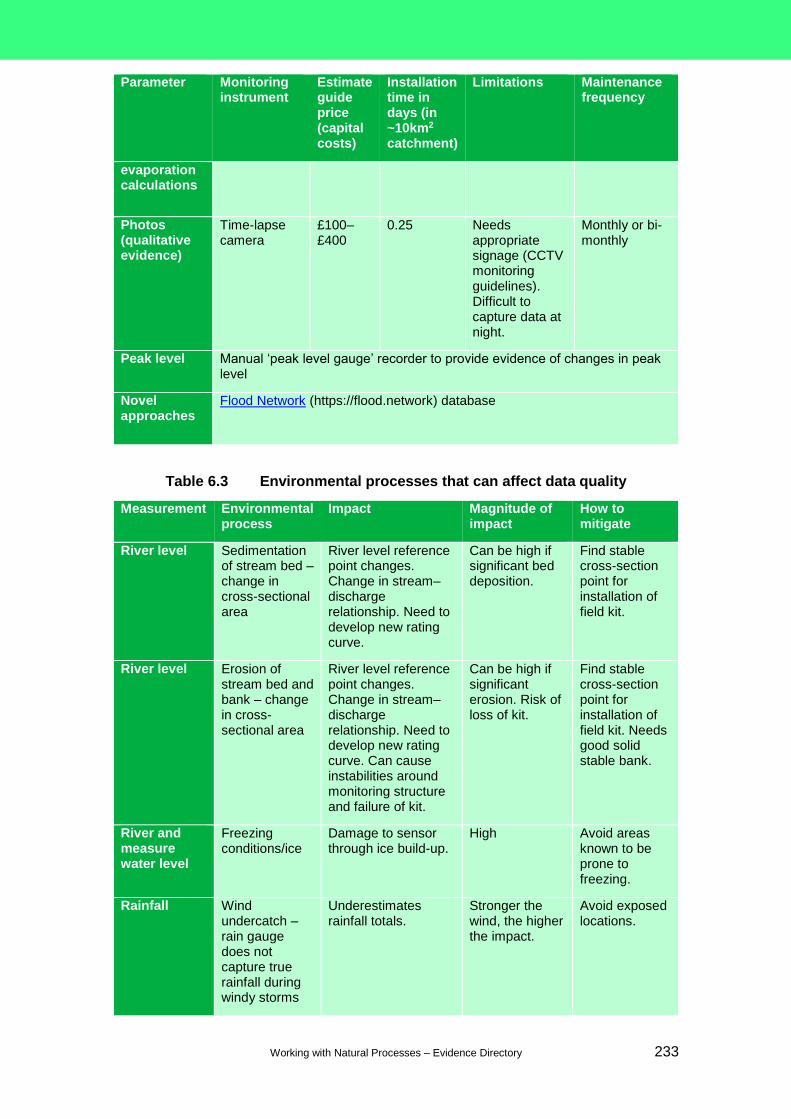
Working with Natural Processes – Evidence Directory 233
Parameter Monitoring instrument
Estimate guide price (capital costs)
Installation time in days (in ~10km2 catchment)
Limitations Maintenance frequency
evaporation calculations
Photos (qualitative evidence)
Time-lapse camera
£100–£400
0.25 Needs appropriate signage (CCTV monitoring guidelines). Difficult to capture data at night.
Monthly or bi-monthly
Peak level Manual ‘peak level gauge’ recorder to provide evidence of changes in peak level
Novel approaches
Flood Network (https://flood.network) database
Table 6.3 Environmental processes that can affect data quality
Measurement Environmental process
Impact Magnitude of impact
How to mitigate
River level Sedimentation of stream bed – change in cross-sectional area
River level reference point changes. Change in stream–discharge relationship. Need to develop new rating curve.
Can be high if significant bed deposition.
Find stable cross-section point for installation of field kit.
River level Erosion of stream bed and bank – change in cross-sectional area
River level reference point changes. Change in stream–discharge relationship. Need to develop new rating curve. Can cause instabilities around monitoring structure and failure of kit.
Can be high if significant erosion. Risk of loss of kit.
Find stable cross-section point for installation of field kit. Needs good solid stable bank.
River and measure water level
Freezing conditions/ice
Damage to sensor through ice build-up.
High Avoid areas known to be prone to freezing.
Rainfall Wind undercatch – rain gauge does not capture true rainfall during windy storms
Underestimates rainfall totals.
Stronger the wind, the higher the impact.
Avoid exposed locations.
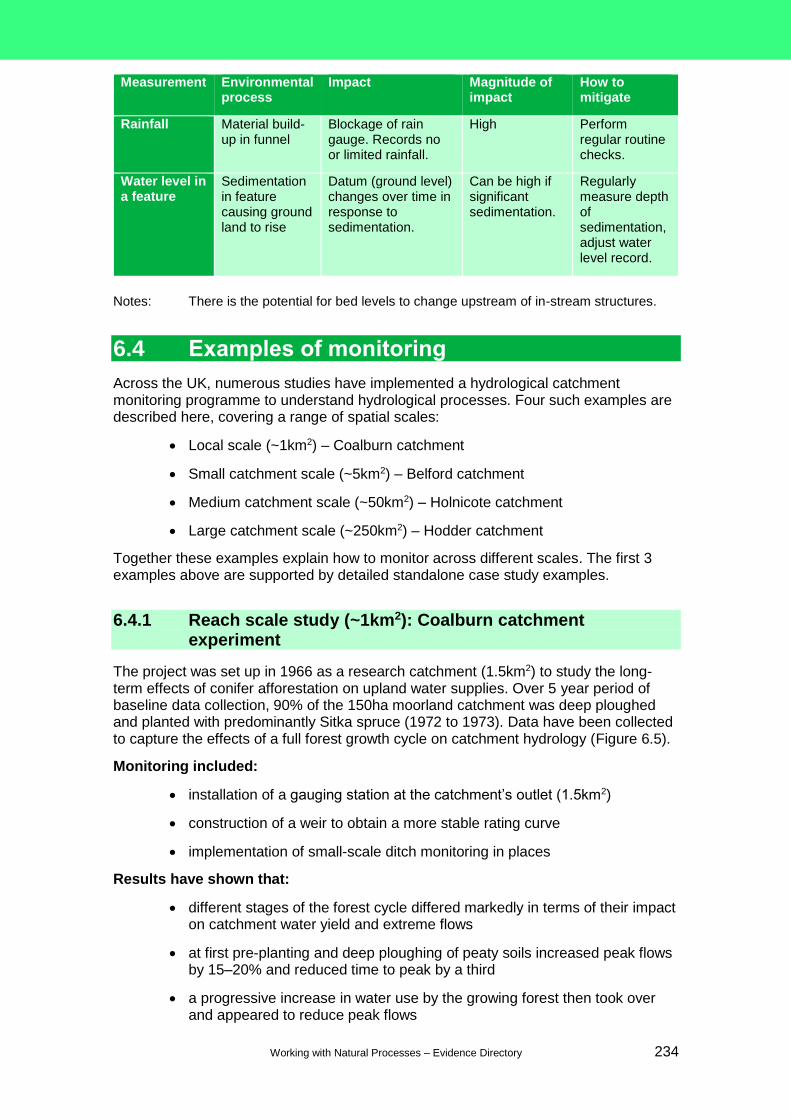
Working with Natural Processes – Evidence Directory 234
Measurement Environmental process
Impact Magnitude of impact
How to mitigate
Rainfall Material build-up in funnel
Blockage of rain gauge. Records no or limited rainfall.
High Perform regular routine checks.
Water level in a feature
Sedimentation in feature causing ground land to rise
Datum (ground level) changes over time in response to sedimentation.
Can be high if significant sedimentation.
Regularly measure depth of sedimentation, adjust water level record.
Notes: There is the potential for bed levels to change upstream of in-stream structures.
6.4 Examples of monitoring
Across the UK, numerous studies have implemented a hydrological catchment monitoring programme to understand hydrological processes. Four such examples are described here, covering a range of spatial scales:
Local scale (~1km2) – Coalburn catchment
Small catchment scale (~5km2) – Belford catchment
Medium catchment scale (~50km2) – Holnicote catchment
Large catchment scale (~250km2) – Hodder catchment
Together these examples explain how to monitor across different scales. The first 3 examples above are supported by detailed standalone case study examples.
6.4.1 Reach scale study (~1km2): Coalburn catchment experiment
The project was set up in 1966 as a research catchment (1.5km2) to study the long-term effects of conifer afforestation on upland water supplies. Over 5 year period of baseline data collection, 90% of the 150ha moorland catchment was deep ploughed and planted with predominantly Sitka spruce (1972 to 1973). Data have been collected to capture the effects of a full forest growth cycle on catchment hydrology (Figure 6.5).
Monitoring included:
installation of a gauging station at the catchment’s outlet (1.5km2)
construction of a weir to obtain a more stable rating curve
implementation of small-scale ditch monitoring in places
Results have shown that:
different stages of the forest cycle differed markedly in terms of their impact on catchment water yield and extreme flows
at first pre-planting and deep ploughing of peaty soils increased peak flows by 15–20% and reduced time to peak by a third
a progressive increase in water use by the growing forest then took over and appeared to reduce peak flows
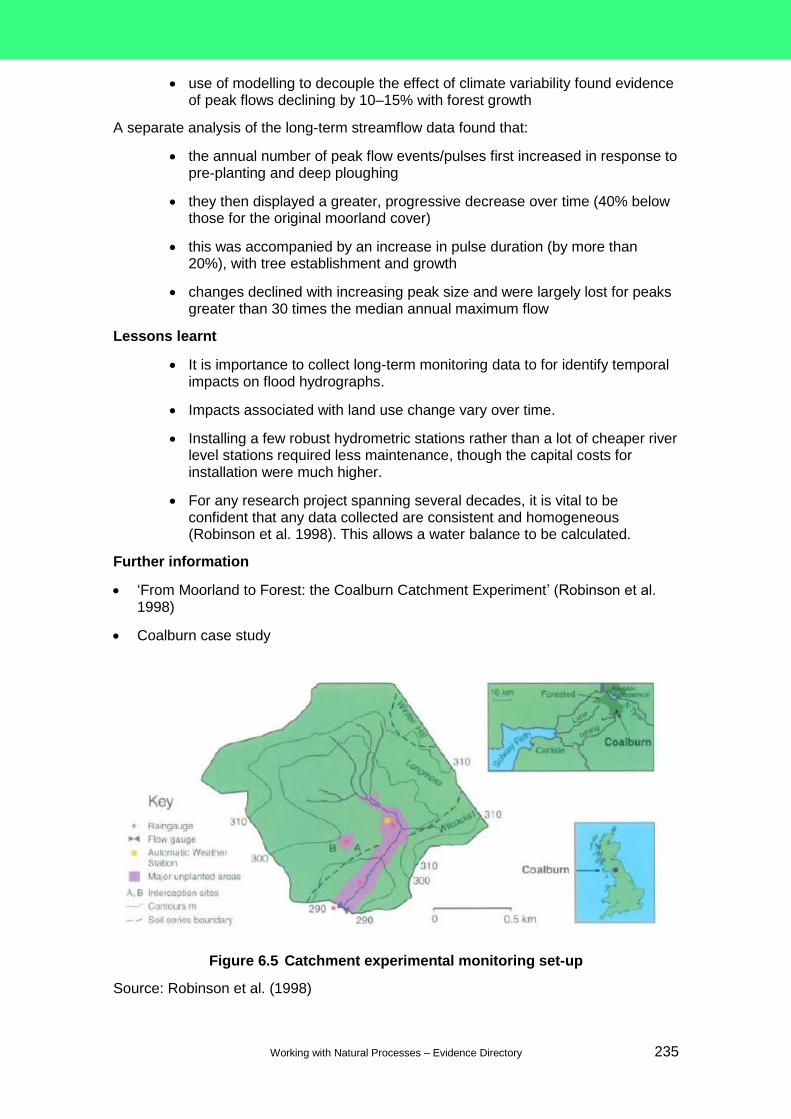
Working with Natural Processes – Evidence Directory 235
use of modelling to decouple the effect of climate variability found evidence of peak flows declining by 10–15% with forest growth
A separate analysis of the long-term streamflow data found that:
the annual number of peak flow events/pulses first increased in response to pre-planting and deep ploughing
they then displayed a greater, progressive decrease over time (40% below those for the original moorland cover)
this was accompanied by an increase in pulse duration (by more than 20%), with tree establishment and growth
changes declined with increasing peak size and were largely lost for peaks greater than 30 times the median annual maximum flow
Lessons learnt
It is importance to collect long-term monitoring data to for identify temporal impacts on flood hydrographs.
Impacts associated with land use change vary over time.
Installing a few robust hydrometric stations rather than a lot of cheaper river level stations required less maintenance, though the capital costs for installation were much higher.
For any research project spanning several decades, it is vital to be confident that any data collected are consistent and homogeneous (Robinson et al. 1998). This allows a water balance to be calculated.
Further information
‘From Moorland to Forest: the Coalburn Catchment Experiment’ (Robinson et al. 1998)
Coalburn case study
Figure 6.5 Catchment experimental monitoring set-up
Source: Robinson et al. (1998)

Working with Natural Processes – Evidence Directory 236
6.4.2 Small catchment scale (5–10km2): Belford catchment experiment
Between 2008 and 2012, approximately 35 run-off attenuation features were constructed in the catchment (6km2) to reduce the risk of flooding. Owing to the density of measures installed in the catchment, the study provided a unique chance to monitor the impact of this cluster of measures on flood risk.
Monitoring included:
5 river gauges on a 5-minute time series
1 river gauge on 15-minute time series
3 tipping bucket rain gauges
2 barometers
8 stage gauges inside run-off attenuation features all on 5-minute time series
surveys using GPS devices
High flow (responsive) gaugings were conducted when needed (Figure 6.6). The detailed monitoring ended in early 2013. However, continued monitoring at the catchment outlet and rainfall data makes it is possible to look at long-term catchment scale responses. The monitoring network took a full day to download and maintain. This was carried out monthly; stream–discharge gaugings were conducted on the same day.
Surveys using GPS real-time kinetic devices have allowed the generation of stage–volume look-up tables for the run-off attenuation features to help understand how they perform. An analytical technique was developed, using observed data from within the run-off attenuation features and from nearby river gauging stations to demonstrate the impact of individual RAFs on downstream discharge (Figure 6.7).
Results have shown that:
Percentage decreases (up to 10%) in discharge have been achieved downstream of run-off attenuation features during short duration, low-medium magnitude events (for offline storage areas).
The run-off attenuation features have an impact on overland flow interception during a large storm event, demonstrating a 50% decrease in the magnitude of discharge in the form of local surface run-off.
Lessons learnt
At some gauging sites, the cross-sectional area changed after high flow events. This required further stream gaugings to correct the rating curve.
Multiscale nested networks, even at small scales give detailed understanding of catchment response times.
Placing level recorders within features (for example, besides a stream) enables to the impact of that feature to be assessed and linked to the multiscale hydrometric network.
In contrast to Coalburn, Belford opted for many lower cost level recorders, the maintenance required was greater but the level of information obtained enabled the impacts of the cluster of measures to be assessed.
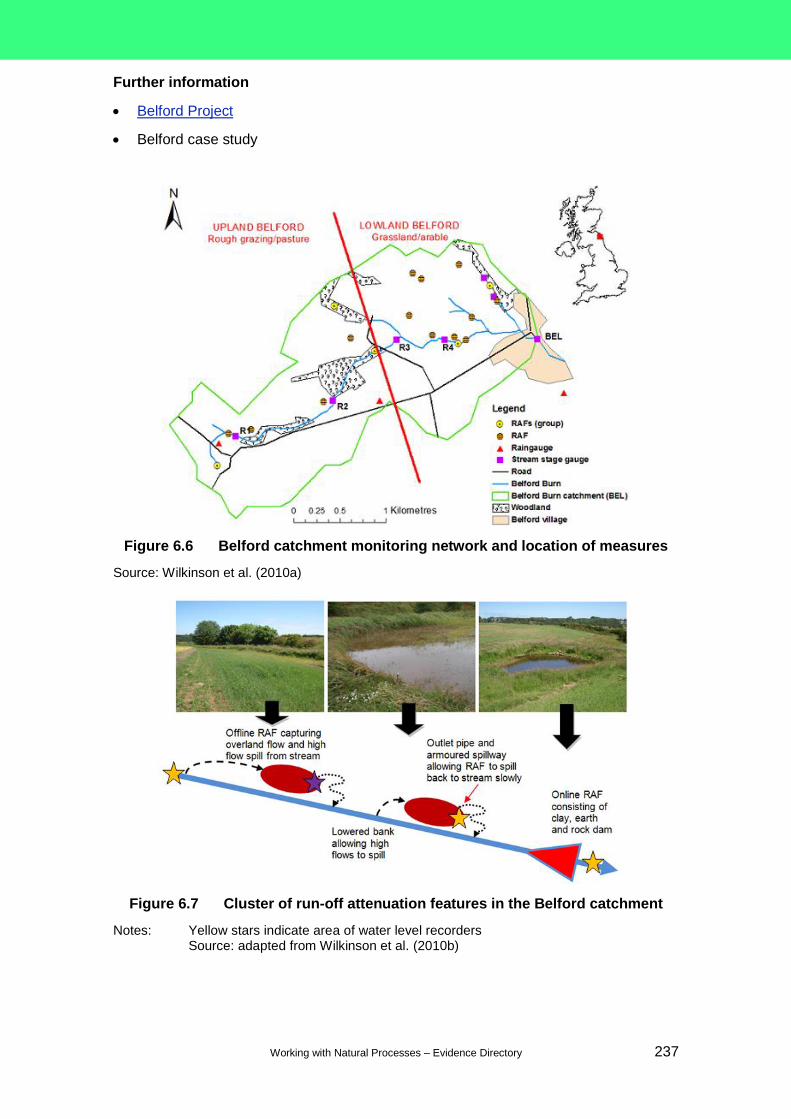
Working with Natural Processes – Evidence Directory 237
Further information
Belford Project
Belford case study
Figure 6.6 Belford catchment monitoring network and location of measures
Source: Wilkinson et al. (2010a)
Figure 6.7 Cluster of run-off attenuation features in the Belford catchment
Notes: Yellow stars indicate area of water level recorders Source: adapted from Wilkinson et al. (2010b)
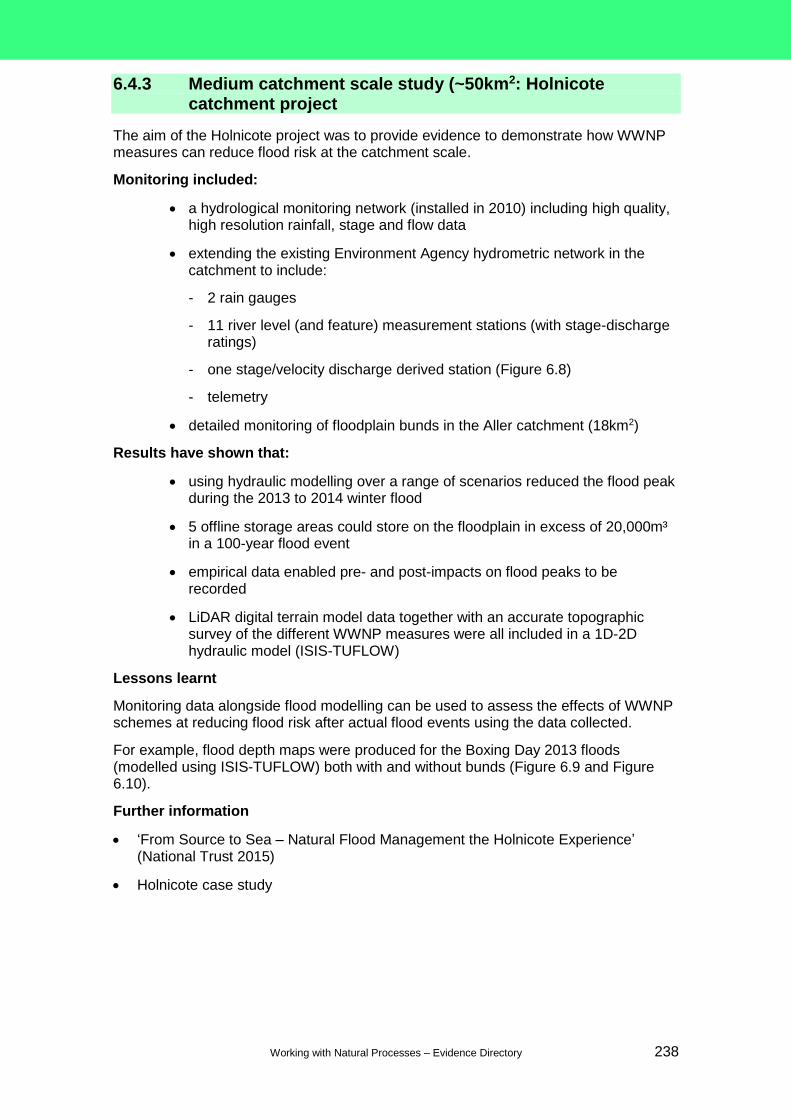
Working with Natural Processes – Evidence Directory 238
6.4.3 Medium catchment scale study (~50km2: Holnicote catchment project
The aim of the Holnicote project was to provide evidence to demonstrate how WWNP measures can reduce flood risk at the catchment scale.
Monitoring included:
a hydrological monitoring network (installed in 2010) including high quality, high resolution rainfall, stage and flow data
extending the existing Environment Agency hydrometric network in the catchment to include:
- 2 rain gauges
- 11 river level (and feature) measurement stations (with stage-discharge ratings)
- one stage/velocity discharge derived station (Figure 6.8)
- telemetry
detailed monitoring of floodplain bunds in the Aller catchment (18km2)
Results have shown that:
using hydraulic modelling over a range of scenarios reduced the flood peak during the 2013 to 2014 winter flood
5 offline storage areas could store on the floodplain in excess of 20,000m³ in a 100-year flood event
empirical data enabled pre- and post-impacts on flood peaks to be recorded
LiDAR digital terrain model data together with an accurate topographic survey of the different WWNP measures were all included in a 1D-2D hydraulic model (ISIS-TUFLOW)
Lessons learnt
Monitoring data alongside flood modelling can be used to assess the effects of WWNP schemes at reducing flood risk after actual flood events using the data collected.
For example, flood depth maps were produced for the Boxing Day 2013 floods (modelled using ISIS-TUFLOW) both with and without bunds (Figure 6.9 and Figure 6.10).
Further information
‘From Source to Sea – Natural Flood Management the Holnicote Experience’ (National Trust 2015)
Holnicote case study
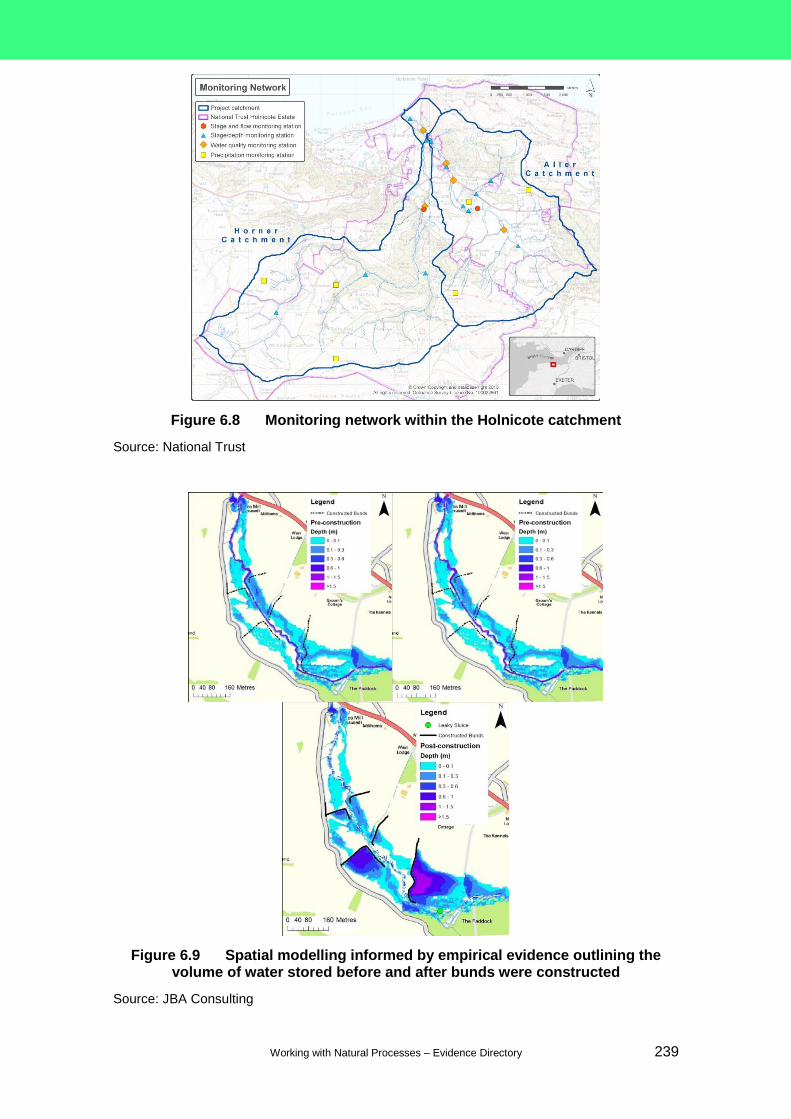
Working with Natural Processes – Evidence Directory 239
Figure 6.8 Monitoring network within the Holnicote catchment
Source: National Trust
Figure 6.9 Spatial modelling informed by empirical evidence outlining the volume of water stored before and after bunds were constructed
Source: JBA Consulting

Working with Natural Processes – Evidence Directory 240
Figure 6.10 Outputs from hydraulic model in the Holnicote catchment using empirical evidence from the 23–24 December 2013 event
Source: JBA Consulting
6.4.4 Large catchment-scale study (~250km2): Hodder catchment project
This study established a very dense hydrometric network as part of a PhD project (Geris 2012) to determine over a 2.5 year period the effect of WWNP measures on reducing flood flows using hydrometric monitoring (Figure 6.11).
Monitoring included:
The project had 2 control subcatchments (Easington and Loud).
A total of 28 stream gauges were installed over 5 orders of scale ranging from 1ha to 261km2.
A 14.5 month pre-change dataset was created.
Data collection and maintenance of the whole network took 2–3 days (some stations were hard to access) every 2 weeks over the entire monitoring period.
Steam level gauges were placed downstream of land use management change sites.
In Croasdale and Brennand, the study monitored upland ditch blocking measures at multiple scales.
In Whitendale, large areas of woodland have been planted and the outlets of these subcatchments were monitored.
In Landgden the impact of stock density changes was monitored.
Results have shown:
The multiscale network of channel flow gauges can be used to investigate the impact of different land treatments at increasing scales.

Working with Natural Processes – Evidence Directory 241
The monitoring network captured a variety of storm events within the study period.
The data were used in a range of statistical and modelling techniques to compare pre- and post-change hydrographs through the multiscale network to detect short -impacts on flood peaks.
No statistically significant evidence was found to suggest that the land use management changes had a short-term impact on catchment scales from 1km2 to 261km2.
This finding could be linked to the amount of restoration, the timescales of impact and finally natural variability in the catchment.
Lessons learnt
Longer time series are required from the catchment network to estimate impacts from catchment measures.
At the small scale (<1km2), the study found that the impacts of upland drain blocking did increase the local storage and changed local flow pathways.
At smaller scales, the impacts are more likely to be detected with shorter data records (Geris 2012, Environment Agency 2015c); however, this is site and measure dependant.
Further information
‘Multi-scale Impacts of Land Use/Land Management changes on flood response in the Hodder Catchment’ (Geris 2012).
Figure 6.11 Left: Hodder catchment with main subcatchments. Right: schematic representation of the Hodder catchment, including an overview of the
hydrometric monitoring scheme
Notes: The Sustainable Catchment Management Plan (SCaMP) area is indicated by the black dashed line in the catchment map. Source: Geris (2012)

Working with Natural Processes – Evidence Directory 242
6.5 Evaluating monitoring data
To understand the effects of monitoring, the data needs to be analysed. It is suggested that this is done alongside a hydrology/hydrometric expert to help understand issues such as uncertainties surrounding the data and the way in which natural variability influences data findings. This expert should also be knowledgeable about the site-specific hydrological and hydrogeological processes that occur across the field site(s), as this will help understand uncertainties surrounding the data.
Some basic evaluation techniques include the following.
Travel time of peak between 2 monitoring stations. This method looks at the time of the flood peak at 2 monitoring stations and assesses the speed at which it moved between them. This helps to determine whether the WWNP project has slowed the flood peak.
Lag time analysis. This technique looks at the difference in time between the centroid of a rain storm and the flood peak – the shorter the time, the flashier the catchment is. This helps to determine whether the WWNP project has reduced the flashiness by increasing the time.
Reduction and delay in the actual flood peak. This method requires some modelling to assess the pre- and post- measure impact on a flood peak (see Section 6.4.3). This helps to determine whether the WWNP measures have delayed the timing of a flood peak and reduced the actual flood peak.
6.6 Further reading
Modular river surveys (Modular River Survey online assessment method and tools*)
Monitoring and evaluating your project (RRC 2017)
Practical River Restoration Appraisal Guidance for Monitoring Options (RRC 2014)
REFORM river restoration wiki (REstoring rivers FOR effective catchment Management website*)
River Restoration Centre Monitoring Planner (free RRC online tool*)
* See Bibliography for further details
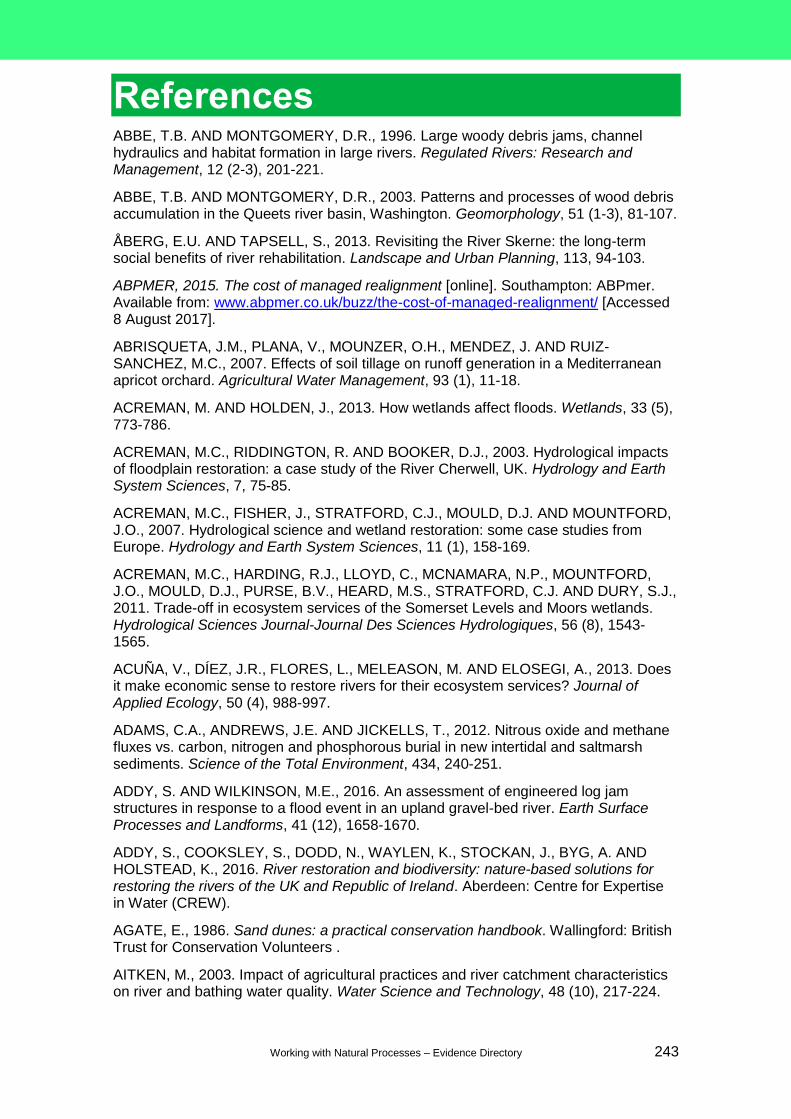
Working with Natural Processes – Evidence Directory 243
References ABBE, T.B. AND MONTGOMERY, D.R., 1996. Large woody debris jams, channel hydraulics and habitat formation in large rivers. Regulated Rivers: Research and Management, 12 (2-3), 201-221.
ABBE, T.B. AND MONTGOMERY, D.R., 2003. Patterns and processes of wood debris accumulation in the Queets river basin, Washington. Geomorphology, 51 (1-3), 81-107.
ÅBERG, E.U. AND TAPSELL, S., 2013. Revisiting the River Skerne: the long-term social benefits of river rehabilitation. Landscape and Urban Planning, 113, 94-103.
ABPMER, 2015. The cost of managed realignment [online]. Southampton: ABPmer. Available from: www.abpmer.co.uk/buzz/the-cost-of-managed-realignment/ [Accessed 8 August 2017].
ABRISQUETA, J.M., PLANA, V., MOUNZER, O.H., MENDEZ, J. AND RUIZ-SANCHEZ, M.C., 2007. Effects of soil tillage on runoff generation in a Mediterranean apricot orchard. Agricultural Water Management, 93 (1), 11-18.
ACREMAN, M. AND HOLDEN, J., 2013. How wetlands affect floods. Wetlands, 33 (5), 773-786.
ACREMAN, M.C., RIDDINGTON, R. AND BOOKER, D.J., 2003. Hydrological impacts of floodplain restoration: a case study of the River Cherwell, UK. Hydrology and Earth System Sciences, 7, 75-85.
ACREMAN, M.C., FISHER, J., STRATFORD, C.J., MOULD, D.J. AND MOUNTFORD, J.O., 2007. Hydrological science and wetland restoration: some case studies from Europe. Hydrology and Earth System Sciences, 11 (1), 158-169.
ACREMAN, M.C., HARDING, R.J., LLOYD, C., MCNAMARA, N.P., MOUNTFORD, J.O., MOULD, D.J., PURSE, B.V., HEARD, M.S., STRATFORD, C.J. AND DURY, S.J., 2011. Trade-off in ecosystem services of the Somerset Levels and Moors wetlands. Hydrological Sciences Journal-Journal Des Sciences Hydrologiques, 56 (8), 1543-1565.
ACUÑA, V., DÍEZ, J.R., FLORES, L., MELEASON, M. AND ELOSEGI, A., 2013. Does it make economic sense to restore rivers for their ecosystem services? Journal of Applied Ecology, 50 (4), 988-997.
ADAMS, C.A., ANDREWS, J.E. AND JICKELLS, T., 2012. Nitrous oxide and methane fluxes vs. carbon, nitrogen and phosphorous burial in new intertidal and saltmarsh sediments. Science of the Total Environment, 434, 240-251.
ADDY, S. AND WILKINSON, M.E., 2016. An assessment of engineered log jam structures in response to a flood event in an upland gravel-bed river. Earth Surface Processes and Landforms, 41 (12), 1658-1670.
ADDY, S., COOKSLEY, S., DODD, N., WAYLEN, K., STOCKAN, J., BYG, A. AND HOLSTEAD, K., 2016. River restoration and biodiversity: nature-based solutions for restoring the rivers of the UK and Republic of Ireland. Aberdeen: Centre for Expertise in Water (CREW).
AGATE, E., 1986. Sand dunes: a practical conservation handbook. Wallingford: British Trust for Conservation Volunteers .
AITKEN, M., 2003. Impact of agricultural practices and river catchment characteristics on river and bathing water quality. Water Science and Technology, 48 (10), 217-224.
Working with Natural Processes – Evidence Directory 244
ALILA, Y., KURAŚ, P.K., SCHNORBUS, M. AND HUDSON, R., 2009. Forests and floods: a new paradigm sheds light on age-old controversies. Water Resources Research, 45, article W08416.
ALLEN, J.R.L., 1990. Salt-marsh growth and stratification: a numerical model with special features to the Severn Estuary, SW Britain. Marine Geology, 95 (2), 77-96.
ALLEN, J.R.L., 2000. Morphodynamics of Holocene salt marshes: a review sketch from the Atlantic and Southern North Sea coasts of Europe. Quaternary Science Reviews, 19 (12), 1155-1231.
ALLEN, J.R.L., 2003. An eclectic morphostratigraphic model for the sedimentary response to Holocene sea-level rise in northwest Europe. Sedimentary Geology, 161 (1-2), 31-54.
ALVARENGA, C.A., MELLO, C.R., MELLO, J.M. AND VIOLA, M.R., 2011. Spatial continuity of the saturated hydraulic conductivity in soils of the Alto Rio Grande basin, MG. Revista Brasileira de Ciência do Solo, 35 (5), 1745-1757.
ANDERSON, B.G., RUTHERFURD, I.D. AND WESTERN, A.W., 2006. An analysis of the influence of riparian vegetation on the propagation of flood waves. Environmental Modelling and Software, 21 (9), 1290-1296.
ANDERSON, H.W., HOOVER, M.D., REINHART, K.G., 1976. Forests and water: Effects of forest management on floods, sedimentation, and water supply. General Technical Report PSW-18/1976. Berkeley, California: Forest Service, US Department of Agriculture.
ANDREWS, J.E., SAMWAYS, G. AND SHIMMIELD, G.B., 2008. Historical storage budgets of organic carbon, nutrient and contaminant elements in saltmarsh sediments: Biogeochemical context for managed realignment, Humber Estuary, UK. Science of the Total Environment, 405 (1-3), 1-13.
ARCHER, D. AND NEWSON, M., 2002. The use of indices of flow variability in assessing the hydrological and instream habitat impacts of upland afforestation and drainage. Journal of Hydrology, 268 (1-4), 244-258.
ARCHER, N.A.L., BONELL, M., COLES, N., MACDONALD, A.M., AUTON, C.A. AND STEVENSON, R., 2013. Soil characteristics and landcover relationships on soil hydraulic conductivity at a hillslope scale: a view towards local flood management. Journal of Hydrology, 497, 208-222.
ARDÓN, M., MORSE, J.L., DOYLE, M.W. AND BERNHARDT, E.S., 2010. The water quality consequences of restoring wetland hydrology to a large agricultural watershed in the southeastern coastal plain. Ecosystems, 13 (7): 1060-1078.
ARENS, S.M., GEELEN, L.H.W.T., SLINGS, Q.L. AND WONDERGEM, H.E., 2005. Restoration of dune mobility in the Netherlands. In Proceedings ‘Dunes & Estuaries 2005’. International Conference on Nature Restoration Practices in European Coastal Habitats (Koksijde, Belgium, September 2005), edited by J.-L. Herrier, J. Mees, J. Salman, H. van Nieuwenhuyse and I. Dobbelaere, pp. 129-138. VLIZ Special Publication 19. Oostende, Belgium: Flanders Marine Institute.
ARENS, S.M., MULDER, J.P.M., QUIRINUS L. SLINGS, Q.L., GEELEN L.H.W.T. AND DAMSMA, P., 2013. Dynamic dune management, integrating objectives of nature development and coastal safety: Examples from the Netherlands. Geomorphology, 199, 205–213.
ARMITAGE, A.R., JENSEN, S.M., YOON, J.E. AND AMBROSE, R.F., 2007. Wintering shorebird assemblages and behavior in restored tidal wetlands in southern California. Restoration Ecology, 15 (1), 139-148.
Working with Natural Processes – Evidence Directory 245
ARMSTRONG, A., HOLDEN, J., KAY, P., FRANCIS, B., FOULGER, M., GLEDHILL, S., MCDONALD, A.T. AND WALKER, A., 2010. The impact of peatland drain-blocking on dissolved organic carbon loss and discolouration of water; results from a national survey. Journal of Hydrology, 381 (1-2), 112-120.
ARSCOTT, D.B., TOCKNER, K. AND WARD, J., 2005. Lateral organization of aquatic invertebrates along the corridor of a braided floodplain river. Journal of the North American Benthological Society, 24 (4), 934-954.
ASHBULLBY, K.J., PAHL, S., WEBLEY, P. AND WHITE, M.P., 2013. The beach as a setting for families’ health promotion: a qualitative study with parents and children living in coastal regions in southwest England. Health & Place, 23, 138-147.
ATKINSON, P.W., CROOKS, S., GRANT, A. AND REHFISCH, M., 2001. The success of creation and restoration schemes in producing intertidal habitat suitable for waterbirds. English Nature Research Report No. 425. Peterborough: English Nature.
BALLARD, C.E., MCINTYRE, N. AND WHEATER, H.S., 2012. Effects of peatland drainage management on peak flows. Hydrology and Earth System Sciences, 16, 2299-2310.
BADIOU, P., MCDOUGAL, R., PENNOCK, D. AND CLARK, B., 2011. Greenhouse gas emissions and carbon sequestration potential in restored wetlands of the Canadian prairie pothole region. Wetlands Ecology and Management, 19 (3), 237-256.
BALLARD, C., 2011. The role of physics-based models for simulating flood flow responses to rural land management scenarios. Dept. Civil and Environmental Engineering, Imperial College London. PhD, 322 pp.
BANGEN, S.G., WHEATON, J.M., BOUWES, N., BOUWES, B. AND JORDAN, C., 2014. A methodological intercomparison of topographic survey techniques for characterizing wadeable streams and rivers. Geomorphology, 206, 343-361.
BARBER, N., 2013. Sediment, nutrient and runoff management and mitigation in rural catchments. PhD thesis, Newcastle University.
BARBER, N.J. and QUINN, P.F., 2012. Mitigating diffuse water pollution from agriculture using soft-engineered runoff attenuation features. Area, 44 (4), 454-462.
BARBER, N., REANEY, S.M., BARKER, P.A., BENSKIN, C., BURKE, S., CLEASBY, W., HAYGARTH, P., JONCZYK, J., OWEN, G., SNELL, M.A., SURRIDGE, B. AND QUINN, P.F., 2016. The Treatment Train approach to reducing non-point source pollution from agriculture. Poster presented at the American Geophysical Union Fall General Assembly, abstract #H13D-1396.
BARLAUP, B.T., GABRIELSEN, S.E., SKOGLUND, H. AND WIERS, T., 2008. Addition of spawning gravel - A means to restore spawning habitat of Atlantic salmon (Salmo salar L.), and anadromous and resident brown trout (Salmo trutta L.) in regulated rivers. River Research and Applications, 24 (5), 543-550.
BATEMAN, I.J. AND DAY, B.H., 2014. UK National Ecosystem Assessment Follow-on. Work Package Report 3: Economic value of ecosystem services. UN Environment Programme World Conservation Monitoring Centre, Living with Environmental Change, UK.
BAUDRY, J., BUNCE, R.G.H. AND BUREL, F.. 2000. Hedgerows: an international perspective on their origin, function and management. Journal of Environmental Management, 60 (1), 7-22.

Working with Natural Processes – Evidence Directory 246
BAUM, C., LEINWEBER, P. AND SCHLICHTING, A., 2003. Effects of chemical conditions in re-wetted peats on temporal variation in microbial biomass and acid phosphatase activity within the growing season. Applied Soil Ecology, 22 (2), 167-174.
BEECHIE, T.J., SEAR, D.A., OLDEN, J.D., PESS, G.R., BUFFINGTON, J.M., MOIR, H., RONI, P. and POLLOCK, M.M., 2010. Process-based principles for restoring river ecosystems. BioScience, 60 (3), 209-222.
BEGLEY, A.J.P., GRAY, B.T. AND PASZKOWSKI, C.A., 2012. A comparison of restored and natural wetlands as habitat for birds in the prairie pothole region of Saskatchewan, Canada. The Raffles Bulletin of Zoology, 25, 173-187.
BELL, M.J., WORRALL, F., BHOGAL, A., BLACK, H., LILLY, A., BARRACLOUGH, D. AND MERRINGTON, G., 2011 .UK land-use change and its impact on SOC: 1925–2007. Global Biogeochemical Cycles, 25 (4), GB4015; DOI: 10.1029/2010GB003881.
BENITO, E., SANTIAGO, J.L., DE BLAS, E. AND VARELA M.E., 2003. Deforestation of water‐repellent soils in Galicia (NW Spain) effects on surface runoff and erosion under simulated rainfall. Earth Surface Processes and Landforms, 28 (2), 145-155.
BENNETT, S.J., WU, W., ALONSO, C.V. AND WANG, S.S., 2008. Modeling fluvial response to in‐stream woody vegetation: implications for stream corridor restoration. Earth Surface Processes and Landforms, 33 (6), 890-909.
BESCHTA, R.L., PYLES, M.R., SKAUGSET, A.E. AND SURFLEET, C.G., 2000. Peakflow responses to forest practices in the western cascades of Oregon, USA. Journal of Hydrology, 233 (1), 102-120.
BEVEN, K.J., HENDERSEN, D.E. AND, REEVES, A.D.,1993. Dispersion parameters for undisturbed partially saturated soil. Journal of Hydrology, 143 (1-2), 19-43.
BIGGAR, J.W. AND NEILSEN, D.R., 1976. Spatial variability of the leaching characteristics of a field soil. Water Resources Research, 12 (1), 78-84.
BIGGS, J., BILTON, D., WILLIAMS, P., NICOLET, P., BRIGGS, L., EELES, B. AND WHITFIELD, M., 2004. Temporary ponds of eastern Poland: an initial assessment of their importance for nature conservation. Archives des Sciences, 57, 73-83.
BIGGS, J., STOATE, C., WILLIAMS P., BROWN, C., CASEY,A., DAVIES, S., GRIJALVO DIEGO, I., HAWCZAK, A., KIZUKA, T., MCGOFF, E. AND SZCZUR, J., 2014. Water Friendly Farming. Results and practical implications of the first 3 years of the programme. Oxford: Freshwater Habitats Trust; Fordingbridge: Game & Wildlife Conservation Trust.
BIGGS, J., STOATE, C., WILLIAMS P., BROWN, C., CASEY,A., DAVIES, S., GRIJALVO DIEGO, I., HAWCZAK, A., KIZUKA, T., MCGOFF, E., SZCZUR, J. AND VILLAMIZAR VELEZ, M., 2016. Water Friendly Farming. Autumn 2016 update. Oxford: Freshwater Habitats Trust; Leicester: game & Wildlife Conservation Trust.
BILBY, R.E., 1984. Removal of woody debris may affect stream channel stability. Journal of Forestry, 82 (10), 609-613.
BILOTTA, G.S., BRAZIER, R.E. AND HAYGARTH, P.M., 2007. The impacts of grazing animals on the quality of soils, vegetation, and surface waters in intensively managed grasslands. Advances in Agronomy, 94, 237-280.
BILOTTA, G.S., BRAZIER, R.E., HAYGARTH, P.M., MACLEOD, C.J.A, BUTLER, P., GRANGER, S., KREUGER, T., FREER, J. AND QUINTON, J., 2008. Rethinking the contribution of drained and undrained grassland to sediment related water quality problems. Journal of Environmental Quality, 37 (3), 906-914.
Working with Natural Processes – Evidence Directory 247
BIO INTELLIGENCE SERVICE AND HYDROLOGIC, 2014. Soil and water in a changing environment. Final report. Brussels: European Commission.
BIRD, E.C.F., 2008. Coastal Geomorphology: An Introduction, 2nd edition, Chichester: Wiley.
BIRD, E.C.F., HANSOM, J.D. AND MAY, V.J., 2000. Saltmarshes. In Coastal Geomorphology of Great Britain (ed. J.D. Hansom and V.J. May), pp. 515-562. Peterborough: Joint Nature Conservation Committee.
BIRKINSHAW, S.J., BATHURST, J.C., IROUMÉ, A. AND PALACIOS, H., 2011. The effect of forest cover on peak flow and sediment discharge – an integrated field and modelling study in central-southern Chile. Hydrological Processes, 25 (8), 1284-1297.
BIRKINSHAW, S.J., BATHURST, J.C. AND ROBINSON, M., 2014. 45 years of non-stationary hydrology over a forest plantation growth cycle, Coalburn catchment, Northern England. Journal of Hydrology, 519, 559-573.
BISHOP, M., PETERSON, C., SUMMERSON, H., LENIHAN, H. AND GRABOWSKI, J., 2006. Deposition and long-shore transport of dredge spoils to nourish beaches: impacts on benthic infauna of an ebb-tidal delta. Journal of Coastal Research, 22 (3), 530-546.
BONN, A., ALLOTT, T., HUBACEK, K. AND STEWART, J., 2009. Managing change in the uplands – challenges in shaping the future. In Drivers of Environmental Change in Uplands (ed. A. Bonn, T. Allott, K. Hubacek and J. Stewart), pp. 475-494. Routledge, London and New York.
BOORMAN, L.A., 2003. Saltmarsh review: an overview of coastal saltmarshes, their dynamic and sensitivity characteristics for conservation and management. JNCC Report No 334. Peterborough: Joint Nature Conservation Committee.
BOOTH, D.B., MONTGOMERY, D.R. AND BETHEL, J.P., 1997. Large woody debris in urban streams of the Pacific Northwest. In Effects of Watershed Development and Management on Aquatic Ecosystems, Proceedings of an Engineering Foundation Conference (Snowbird, UT, August 1996), edited by L.A. Roesner, pp. 178-197. Reston, VA: American Society of Civil Engineers.
BORIN, M., PASSONI, M., THIENE, M. AND TEMPESTA, T., 2010. Multiple functions of buffer strips in farming areas. European Journal of Agronomy, 32 (1), 103-111.
BOSCH, J.M. AND HEWLETT, J.D., 1982. A review of catchment experiments to determine the effect of vegetation changes on water yield and evapotranspiration. Journal of Hydrology, 55 (1–4), 3-23.
BOUTIN, C., JOBIN, B. AND BELANGER, L., 2003. Importance of riparian habitats to flora conservation in farming landscapes of southern Quebec, Canada. Agriculture, Ecosystems & Environment, 94 (1), 73-87.
BOYER, T. AND POLASKY, S., 2004. Valuing urban wetlands: a review of non-market valuation studies. Wetlands, 24 (4), 744-755.
BRAZIER, R., PUTTOCK, A., GRAHAM, H., ANDERSON, K., CUNLIFFE, A. AND ELLIOTT, M., 2016. Quantifying the multiple benefits of reintroducing the Eurasian beaver. Presentation to River Restoration Centre’s 17th Annual Network Conference (Blackpool, 2016).
BRIDGES, T., WAGNER, P.W., BURKS-COPES, K.A., BATES, M.E., COLLIER, Z.A., FISCHNICH, C.J., GAILANI, J.Z., LEUCK, L.D., PIERCY, C.D., ROSATI, J.D., RUSSO, E.J., SHAFER, D.J., SUEDEL, B.C., VUXTON, E.A. AND WAMSLEY, T.V., 2015. Use of natural and nature-based features (NNBF) for coastal resilience. North Atlantic
Working with Natural Processes – Evidence Directory 248
Coast comprehensive study: resilient adaptation to increasing risk. Vicksburg, MS: US Army Corps of Engineers, Engineer Research and Development Center.
BROADMEADOW, S. AND NISBET, T.R., 2004. The effects of riparian forest management on the freshwater environment: a literature review of best management practice. Hydrology and Earth System Sciences, 8, 286-305.
BROADMEADOW, S., JONES, J.G., LANGFORD, T.E.L., SHAW, P.J. AND NISBET, T.R., 2010. The influence of riparian shade on lowland streamwater temperatures in southern England and their viability for brown trout. River Research and Applications, 27 (2), 226-237.
BROOKS, A. AND AGATE, E., 2005. Sand Dunes – A Practical Handbook, revised edition. Doncaster: British Trust for Conservation Volunteers.
BROWN, A., DJOHARI, N. AND STOLK, P., 2012. Fishing for Answers: the final report of the Social and Community Benefits of Angling Project. Manchester: Substance.
BROWN, K., 2013. Quantifying bottomland hardwood forest and agricultural grassland evapotranspiration in floodplain reaches of a mid-Missouri stream. Master’s thesis, University of Missouri-Columbia.
BROWN, S., COTTON, J., STALEY, P., MURBY, P. AND BADLEY, J., 2008. Future monitoring at coastal realignment sites: lessons learnt from the Frieston flood defence scheme. Presentation to Flood & Coastal Management Conference (Lancaster, 2008).
BROWN, S., BARTON, M.E. AND NICHOLLS, R.J., 2012. The effect of coastal defences on cliff top retreat along the Holderness coastline. Proceedings of the Yorkshire Geological Society, 59 (1), 1-13.
BRULAND, G. AND RICHARDSON, C., 2005. Hydrologic, edaphic, and vegetative responses to microtopographic reestablishment in a restored wetland. Restoration Ecology, 13 (3), 515-523.
BRUNET, R.C., ASTIN, K.B. AND DARTIGUELONGUE, S., 2003. The role of a floodplain in regulating aquifer recharge during a flood event of the River Adour in southwest France. Wetlands, 23, 190-199.
BUFFINGTON, J.M. and MONTGOMERY, D.R. 1999. Effects of hydraulic roughness on surface textures of gravel-bed rivers. Water Resources Research, 35 (11), 3507-3521.
BUFFINGTON, J.M., LISLE, T.E., WOODSMITH, R.D. AND HILTON, S. 2002. Controls on the size and occurrence of pools in coarse-grained forest rivers. River Research and Applications, 18 (6), 507-531.
BULLOCK, A. AND ACREMAN, M., 2003. The role of wetlands in the hydrological cycle. Hydrology and Earth System Sciences, 7 (3), 358-389.
BULLOCK, C.H. AND KAY, J., 1997. Preservation and change in the upland landscape: the public benefits of grazing management. Journal of Environmental Planning and Management, 40 (3), 315-334.
BULLOCK, J.M., 2011. Semi-natural grasslands. In UK National Ecosystem Assessment: Technical Report, Chapter 6, pp. 162-196. Cambridge: UN Environment Programme – World Conservation Monitoring Centre.
BULYGINA, N., MCINTYRE, N. AND WHEATER, H., 2009. Conditioning rainfall-runoff model parameters for ungauged catchments and land management impacts analysis. Hydrology and Earth System Sciences, 13 (6), 893-904.
Working with Natural Processes – Evidence Directory 249
BURNSIDE, N.G., METCALFE, D.J., SMITH, R.F. AND WAITE, S., 2006. Ghyll woodlands of the weald: characterisation and conservation. Biodiversity and Conservation, 15 (4), 1319-1338.
BUTLER, D.R. and MALANSON, G.P. 2005. The geomorphic influences of beaver dams and failures of beaver dams. Geomorphology, 71 (1-2), 48-60.
CALDER, I.R., 1990. Evaporation in the Uplands. Chichester: Wiley.
CALDER, I.R., REID, I., NISBET, T.R. AND GREEN, J.C., 2003. Assessing the water use of short vegetation and forests: application of the Hydrological Land Use Change (HYLUC) model. Water Resources Research, 39 (11), 1319-1328.
CAMERON, K., MADRAMOOTOO, C., CROLLA, A. AND KINSLEY, C., 2003. Pollutant removal from municipal sewage lagoon effluents with a free-surface wetland. Water Research, 37 (12), 2803-2812.
CARROLL, Z.L., REYNOLDS, B., EMMETT, B.A., SINCLAIR, F.L., RUIZ DE ONA, C. AND WILLIAMS, P., 2004. The effect of stocking density on soil in upland Wales. Countryside Council for Wales Science Report Number 630. Bangor: Centre for Ecology and Hydrology.
CASHMAN, M.J., PILOTTO, F., HARVEY, G.L., WHARTON, G. and PUSCH, M.T., 2016. Combined stable-isotope and fatty-acid analyses demonstrate that large wood increases the autochthonous trophic base of a macroinvertebrate assemblage. Freshwater Biology, 61 (4), 549-564.
CASTLE, D.A., MCCUNNALL, J. AND TRING, I.M., 1984. Field Drainage: Principles and Practices. London: Batsford Academic and Educational.
CBEC, MOTT MACDONALD AND THE WALKING TALK, 2013. Physical restoration options to address morphology and flood pressures on the River Nith – a pilot study. Report for SEPA. Alford, Aberdeenshire: cbec eco-engineering UK Ltd.
CHADWICK, D.R. AND CHEN, S., 2002. Manures. In Agriculture, Hydrology and Water Quality (ed. P.M. Haygarth and S.C. Jarvis), pp. 437-451. Wallingford: CAB International.
CHANDLER, K.R. AND CHAPPELL, N.A., 2008. Influence of individual oak (Quercus robur) trees on saturated hydraulic conductivity. Forest Ecology and Management, 256 (5), 1222-1229.
CHANG, Y.-H., SCRIMSHAW, M.D., MACLEOD, C.L. AND LESTER, J.N., 2001. Flood defence in the Blackwater Estuary, Essex, UK: the impact of sedimentological and geochemical changes on salt marsh development in the Tollesbury managed realignment site. Marine Pollution Bulletin, 42 (6), 469-480.
CHARLESWORTH, S., HARKER, E. AND RICKARD, S., 2003. A review of sustainable drainage systems (SuDS): a soft option for hard drainage questions? Geography, 88 (2), 99-107.
CHERRY, J. AND BESCHTA, R.L., 1989. Coarse woody debris and channel morphology – a flume study. Water Resources Bulletin, 25 (5), 1031-1036.
CHESTERTON, C., 2009. Environmental impacts of land management. Natural England Research Report NERR030. Bristol: Natural England.
CHOW, V.T., 1959. Open Channel Hydraulics. New York: McGraw-Hill.
CHRISTEN, B. AND DALGAARD, T., 2013. Buffers for biomass production in temperate European agriculture: a review and synthesis on function, ecosystem services and implementation. Biomass & Bioenergy, 55, 53-67.
Working with Natural Processes – Evidence Directory 250
CHRISTIE, M. AND RAYMENT, M., 2012. An economic assessment of the ecosystem service benefits derived from the SSSI biodiversity conservation policy in England and Wales. Ecosystem Services, 1 (1), 70-84.
CIERJACKS, A., KLEINSCHMIT, B., BABINSKY, M., KLEINSCHROTH, F., MARKERT, A., MENZEL, M., ZIECHMANN, U., SCHILLER, T., GRAF, M. AND LANG, F., 2010. Carbon stocks of soil and vegetation on Danubian floodplains. Journal of Plant Nutrition and Soil Science, 173 (5), 644-653.
CIRIA, 2004. Coastal and estuarine managed realignment – design issues. CIRIA Report C628. London: CIRIA.
CIRIA, 2010, Beach management manual, 2nd edition. CIRIA Report C685. London: CIRIA.
CLILVERD, H.M., THOMPSON, J.R., HEPPELL, C.M., SAYER, C.D. and AXMACHER, J.C., 2013. River–floodplain hydrology of an embanked lowland Chalk river and initial response to embankment removal. Hydrological Sciences Journal-Journal Des Sciences Hydrologiques, 58 (3), 627-650.
CLILVERD, H., THOMPSON, J., HEPPELL, K., SAYER, C. AND AXMACHER, J., 2015. Removal of river embankments and the modelled effects on river–floodplain hydrodynamics. EGU General Assembly Conference Abstracts 2015, abstract 12974.
CLILVERD, H.M., THOMPSON, J.R., HEPPELL, C.M., SAYER, C.D. and AXMACHER, J.C., 2016. Coupled hydrological/hydraulic modelling of river restoration impacts and floodplain hydrodynamics. River Research and Applications, 32 (9), 1927-1948.
CLYMO, R.S., 1997. The roles of Spagnum in peatland. In Conserving Peatlands (ed. L. Parkyn, K. Stoneham and H. Ingham). Wallingford: CAB International.
COGHLAN, A., 2015. Should the UK bring back beavers to help manage floods? [online]. New Scientist, 13 November 2015. Available from: https://www.newscientist.com/article/dn28488-should-the-uk-bring-back-beavers-to-help-manage-floods/ [Accessed 9 August 2017].
COGNARD-PLANCQ, A.-L., MARC, V., DIDON-LESCOT, J.-F. AND NORMAND, M., 2001. The role of forest cover on streamflow down sub-Mediterranean mountain watersheds: a modelling approach. Journal of Hydrology, 254 (1), 229-243.
COLCLOUGH, S., FONSECA, L., ASTLEY, T., THOMAS, K. AND WATTS, W., 2005. Fish utilisation of managed realignments. Fisheries Management and Ecology, 12 (6), 351-360.
COLLINS, A.L. AND WALLING, D.E., 2007. Sources of fine sediment recovered from the channel bed of lowland groundwater-fed catchments in the UK. Geomorphology, 88, 120-138.
COLOSIO, F., ABBIATI, M. AND AIROLDI, L., 2007. Effects of beach nourishment on sediments and benthic assemblages. Marine Pollution Bulletin, 54 (8), 1197-1206.
CONNORS, E., 2016. Methodology: scoping UK coastal margin ecosystem accounts. London: Office for National Statistics and Department for Environment Food and Rural Affairs.
COOPER, N.J., 2003. The use of ‘managed retreat’ in coastal engineering. Proceedings of the Institution of Civil Engineers – Engineering Sustainability, 156 (2), 101-110.
COOPER, R., HAMA-AZIZ, Z., HISCOCK, K.,. LOVETT, A., DUGDALE, S., SÜNNENBERG, G., NOBLE, L., BEAMISH, J. AND HOVESEN, P., 2017. Assessing

Working with Natural Processes – Evidence Directory 251
the farm-scale impacts of cover crops and non-inversion tillage regimes on nutrient losses from an arable catchment. Agriculture, Ecosystems and Environment, 237, 181-193.
CORNISH, P.M., 1993. The effects of logging and forest regeneration on water yields in a moist eucalypt forest in New South Wales, Australia. Journal of Hydrology, 150 (2-4), 301-322.
CORPEN, 2007. Les fonctions environnementales des zones tampons. Les bases scientifiques et techniques des fonctions de protection des eaux [Environmental functions of buffer zones. The scientific and technical basis of water protection functions]. Paris: Comite d’Orientation pour des Pratiques Agricoles Respectueuses de l’Environnement.
COSTANZA, R., D'ARGE, R., DE GROOT, R., FARBER, S., GRASSOT, M., HANNON, B., LIMBURG, S., NAEEM, S., O'NEILL, R.V., PARUELO, J., RASKIN, R.G., SUTTON, P. AND VAN DEN BELT, M., 1997. The value of the world’s ecosystem services and natural capital. Nature, 387 (253-260), 253-260.
CROCI, S., BUTET, A., GEORGES, A., AGUEJDAD, R. AND CLERGEAU, P., 2008. Small urban woodlands as biodiversity conservation hot-spot: a multi-taxon approach. Landscape Ecology, 23 (10), 1171-1186.
CRUE, 2008. Efficiency of non-structural flood mitigation measures: ‘room for the river’ and ‘retaining water in the landscape’. CRUE Research Report No. 1-6. Results from the 1st ERA-Net CRUE Funding Initative. London: CRUE. Available from: http://www.crue-eranet.net/publications.asp [Accessed 14 August 2017].
CURRAN, J.H. AND WOHL, E.E., 2003. Large woody debris and flow resistance in step-pool channels, Cascade Range, Washington. Geomorphology, 51 (1-3), 141-157.
CURRAN COURNANE, F., MCDOWELL, R.W., LITTLEJOHN, R.P., HOULBROOKE, D.J. AND CONDRON, L.M., 2011. Is mechanical soil aeration a strategy to alleviate soil compaction and decrease phosphorus and suspended sediment losses from irrigated and rain‐fed cattle‐grazed pastures? Soil Use and Management, 27 (3), 376-384.
DA SILVA, L.V., EVARARD, M. AND SHORE, R.G., 2014. Ecosystem services assessment at Steart Peninsula, Somerset, UK. Ecosystem Services, 10, 19-34.
DANIEL, H., 2001. Replenishment versus retreat: the cost of maintaining Delaware's beaches, Ocean & Coastal Management , 44 (1-2), 87-104.
DAVIES, S., 2006. Recreation and visitor attitudes in the Peak District moorlands. Moors for the Future Report No. 12. Edale, Derbyshire: Moors for the Future Partnership.
DAVIES, S.R., SAYER, C.D., GREAVES, H., SIRIWARDENA, G.M. AND AXMACHER, J.C., 2016. A new role for pond management in farmland bird conservation. Biological Conservation, 233, 179-191.
DEASY, C., QUINTON, J.N., SILGRAM, M., BAILEY, A.P., JACKSON, B. AND STEVENS, C.J., 2009. Mitigation options for sediment and phosphorus loss from winter-sown arable crops. Journal of Environmental Quality, 38 (5), 2121-2130.
DEASY, C., TITMAN, A. AND QUINTON, J., 2014. Measurement of flood peak effects as a result of soil and land management, with focus on experimental issues and scale. Journal of Environmental Management, 132, 304-312.
Working with Natural Processes – Evidence Directory 252
DEFEO, O., MCLACHLAN, A., SCHOEMAN, D.S., SCHLACHER, T.A., DUGAN, J., JONES, A., LASTRA, M. AND SCAPINI, F., 2009. Threats to sandy beach ecosystems: a review. Estuarine, Coastal and Shelf Science, 81 (1), 1-12.
DEFRA, 2009a. Appraisal of flood and coastal erosion risk management. A Defra policy statement. London: Department for Environment, Food and Rural Affairs.
DEFRA, 2009b. Protecting our water, soil and air: a code of good agricultural practice for farmers, growers and land managers. London: Department for Environment, Food and Rural Affairs.
DEFRA, 2009c. Ecosystem services of peat – Phase 1 – SP0572 2009 [online]. London: Department for Environment, Food and Rural Affairs. Available from: http://randd.defra.gov.uk/Default.aspx?Menu=Menu&Module=More&Location=None&Completed=0&ProjectID=15990%20 [Accessed 9 August 2017].
DEFRA, 2016. Key results by UK country: 1866 to 2016 [online]. Statistical data set: Structure of the agricultural industry in England and the UK at June. London: Defra. Available from: https://www.gov.uk/government/statistical-data-sets/structure-of-the-agricultural-industry-in-england-and-the-uk-at-june [Accessed 10 May 2017].
DEFRA, 2017. Crop rotation [online]. In Integrated Crop Management (CPA Book), published by the Crop Protection Association in 1996 and made available online by Defra. Available from: http://adlib.everysite.co.uk/adlib/defra/content.aspx?id=000IL3890W.17USY7NEWZ4R1 [Accessed 9 August 2017].
DEFRA AND ENVIRONMENT AGENCY, 2004. Suitability criteria for habitat creation. Report I: reviews of present practices and scientific literature relevant to site selection criteria. R&D Technical Report FD1917/TR1. London: Department for Environment, Food and Rural Affairs.
DEFRA AND ENVIRONMENT AGENCY, 2005. Habitat quality measures and monitoring protocols. R&D Technical Report FD1918. Bristol: Environment Agency.
DEFRA AND ENVIRONMENT AGENCY, 2011. The national flood and coastal erosion risk management strategy for England. Bristol: Environment Agency.
DE JONG, B., KEIJSERS, J.G.S., RIKSEN, M.J.P.M., KROL, J. AND SLIM, P.A., 2014. Soft engineering vs. a dynamic approach in coastal dune management: a case study on the North Sea barrier island of Ameland, the Netherlands. Journal of Coastal Research, 30 (4), 670-684.
DE JONG, K., ALBIN, M., SKARBACK, E., GRAHN, P. AND BJORK, J., 2012. Perceived green qualities were associated with neighborhood satisfaction, physical activity, and general health: results from a cross-sectional study in suburban and rural Scania, southern Sweden. Health and Place, 18 (6), 1374-1380.
DE VISSCHER, M., NYSSEN, J., PONTZEELE, J., BILLI, P. AND FRANKL, A., 2014. Spatio-temporal sedimentation patterns in beaver ponds along the Chevral river, Ardennes, Belgium. Hydrological Processes, 28 (4), 1602-1615.
DE VRIES, S., VERHEIJ, R., GROENEWEGEN, P. AND SPREEUWENBERG, P., 2003. Natural environments – healthy environments? An exploratory analysis of the relationship between greenspace and health. Environment and Planning A, 35 (10), 1717-1731.
DEWALD, C.L., HENRY, J., BRUCKERHOFF, S., RITCHIE, J., DABNEY, S., SHEPHERD, D. AND WOLF, D., 1996. Guidelines for establishing warm season grass hedges for erosion control. Journal of Soil and Water Conservation, 51 (1), 16-20.
Working with Natural Processes – Evidence Directory 253
DILLAHA, T.A., SHERRARD, J.H. AND LEE, D., 1986. Long-term effectiveness and maintenance of vegetative filter strips. Bulletin 153. Blacksberg, VA: Virginia Water Resources Research Center, Virginia Polytechnic Institute and State University.
DIXON, A.M, MORRIS, R.K., SCOTT, C.R, BIRCHENOUGH, A. AND COLCLOUGH, S., 2008. Managed realignment – lessons learned from Wallasea, UK. Proceedings of the Institution of Civil Engineers – Maritime Engineering, 161 (2), 61-71.
DIXON, S.J., 2013. Investigating the effects of large wood and forest management on flood risk and flood hydrology. PhD thesis, University of Southampton.
DIXON, S.J., SEAR, D.A., ODONI, N.A., SYKES T. AND LANE S.N., 2016. The effects of river restoration on catchment scale flood risk and flood hydrology. Earth Surface Processes and Landforms, 41 (7), 997-1008.
DODD, J., NEWTON, M. AND ADAMS, C. 2016. The effect of natural flood management in-stream wood placements on fish movement in Scotland. CD2015_02. Aberdeen: Centre for Expertise in Water (CREW).
DOICK, K. AND HUTCHINGS, T., 2013. Air temperature regulation by urban trees and green infrastructure. Edinburgh: Forestry Commission.
DONOVAN, G.H., BUTRY, D.T., MICHAEL, Y.L., PRESTEMON, J.P., LIEBHOLD, A.M., GATZIOLIS, D. AND MAO, M.Y., 2013. The relationship between trees and human health: evidence from the spread of the emerald ash borer. American Journal of Preventative Medicine, 44 (2), 139-145.
DORNBUSCH, U., 2005. Beach material properties. BAR Phase 1, February 2003-January 2005.Science Report.
DORNBUSCH, U., WILLIAMS, R.B.G., MOSES, C.A. AND ROBINSON D.A., 2002. Life expectancy of shingle beaches: measuring in situ abrasion. Journal of Coastal Research, Special Issue 36, 249-255.
DORNBUSCH, U., BRADBURY, A., CURTIS, B. AND LANE, G., 2013. Beach management plans for mixed beaches: review and ways forward [online]. Presentation to ICE Coastal Management conference (Belfast, 2011). Available from: http://www.se-coastalgroup.org.uk/wp-content/uploads/2013/10/Beach-management-plans-for-mixed-beaches.pdf [Accessed 9 August 2017].
DOUGLAS, J.T., KOPPI, A.J. AND CRAWFORD, C.E., 1998. Structural improvement
in a grassland soil after changes to wheel‐traffic systems to avoid soil compaction. Soil Use and Management, 14 (1), 14-18.
DOWNS, P.W. and THORNE, C.R., 2000. Rehabilitation of a lowland river: reconciling flood defence with habitat diversity and geomorphological sustainability. Journal of Environmental Management, 58 (4), 249-268.
DOWNS, P.W. and KONDOLF, G.M., 2002. Post-project appraisals in adaptive management of river channel restoration. Environmental Management, 29 (4), 477-496.
DUFFY, A., MOIR, S, BERWICK, N., SHABASHOW, J., D’ARCY, B. AND WADE, R., 2016. CREW Rural sustainable drainage systems. A practical design and build guide for Scotland’s farmers and landowners. CRW2015/2.2. Aberdeen: Centre for Expertise in Water (CREW).
DUFOUR, S. and PIÉGAY, H. 2009. From the myth of a lost paradise to targeted river restoration: forget natural references and focus on human benefits. River Research and Applications, 25 (5), 568-581.
Working with Natural Processes – Evidence Directory 254
DUNBAR, M.J., PEDERSEN, M.L., CADMAN, D., EXTENCE, C., WADDINGHAM, J., CHADD, R. AND LARSEN, S.E., 2010. River discharge and local-scale physical habitat influence macroinvertebrate LIFE scores. Freshwater Biology, 55 (1), 226-242.
EDEN DTC, 2017. A National Demonstration Test Catchment [online]. Available from: http://www.edendtc.org.uk [Accessed 9 August 2017].
EDMONDSON, J.L., DAVIES, Z.G., MCCORMACK, S.A., GASTON, K.J. AND LEAKE, J.R., 2011. Are soils in urban ecosystems compacted? A citywide analysis. Biology Letters, 7 (5), 771-774.
EDWARDS, D., ELLIOTT, A., HISLOP, M., MARTIN, S., MORRIS, J., O’BRIEN, L., PEACE, A., SARAJEVS, V., SERRAND, M. AND VALATIN, G., 2009. A valuation of the economic and social contribution of forestry for people in Scotland. Edinburgh: Forestry Commission Scotland.
EDWARDS, S.F. AND GABLE, F.J., 1991. Estimating the value of beach recreation from property values: An exploration with comparisons to nourishment costs. Ocean and Shoreline Management, 15 (1), 37-55.
EEA, 2015. Water-retention potential of Europe’s forests. A European overview to support natural water-retention measures. Technical Report No.13/2015. Copenhagen: European Environment Agency.
EFTEC, 2010. Flood and coastal erosion risk management: economic valuation of environmental effects. Handbook for the Environment Agency for England and Wales. Revised version. London: Eftec. Available from: http://www.gov.uk/government/uploads/system/uploads/attachment_data/file/487240/LIT_10352.pdf [Accessed 9 August 2017].
EFTEC, 2015. Beam Parklands Natural Capital Account: final report. Report for the Greater London Authority.
EFTEC, 2017. Flood risk reduction benefit valuation for natural flood management. Report for the Environment Agency. London: Eftec.
EFTEC, JUST ECOLOGY AND TURNER, R.K., 2006. England’s Ecosystem Services. A preliminary assessment of three habitat types: broad-leaved woodland, the inter-tidal zone and fresh-water wetland. English Nature Research Report No. 701. Peterborough: English Nature.
ELLIS, J.B., 1992. Quality issues of source control. In Urban Drainage: The Natural Way, Proceedings of CONFLO 92: Integrated Catchment Planning and Source Control (Oxford, 1992). Clevedon, Avon: Hydro Research & Development.
ELLIS, J., SHUTES, R., REVITT, D. AND ZHANG, T., 1994. Use of macrophytes for pollution treatment in urban wetlands. Resources Conservation and Recycling, 11 (1-4), 1-12.
EMPSON, B., COLLINS, T., LEAFE and LOWE, J., 1997. Sustainable flood defence and habitat conservation in estuaries – a strategic framework. Proceedings of 32nd MAFF Conference of River and Coastal Engineers 1997; F2.1-F2.12.
ENVIRONMENT AGENCY, 1996. The restoration of floodplain woodlands in lowland Britain: a scoping study and recommendations for research. R&D Technical Report W15. Bristol: Environment Agency.
ENVIRONMENT AGENCY, 1999. Large wood debris in British headwater rivers: summary report. Technical Report W185. Bristol: Environment Agency.

Working with Natural Processes – Evidence Directory 255
ENVIRONMENT AGENCY, 2002. Erosion control in maize. Technical Report P2-123/TR. Bristol: Environment Agency.
ENVIRONMENT AGENCY, 2003. Review of soil management techniques for water retention and minimising diffuse water pollution in the River Parrett catchment. R&D Technical Report P2-261/10/TR. Bristol: Environment Agency.
ENVIRONMENT AGENCY, 2005. Project appraisal report – Humber Estuary tidal defences, Alkborough Tidal Defence Scheme. Newcastle: Environment Agency, North East.
ENVIRONMENT AGENCY, 2006. Delivering regeneration through environmental improvement. Science Report SC040051/SR. Bristol: Environment Agency.
ENVIRONMENT AGENCY, 2007. Flood risk management estimating guide. Unit Cost Database 2007. Bristol: Environment Agency.
ENVIRONMENT AGENCY, 2008, Thinksoils manual. Bristol: Enivronment Agency. Available from: http://www.ahdb.org.uk/projects/documents/ThinkSoils.pdf [Accessed 14 August 2017].
ENVIRONMENT AGENCY, 2009a. Economic evaluation of inland fisheries. Managers report. Science Report SC050026/SR2. Bristol: Environment Agency.
ENVIRONMENT AGENCY, 2009b. Lincshore 2010–2015 Scoping Report. Bristol: Environment Agency.
ENVIRONMENT AGENCY, 2009c. Ecosystem services case studies. Better regulation science programme. Bristol: Environment Agency.
ENVIRONMENT AGENCY, 2010a. Flood and coastal erosion risk management appraisal guidance (FCERM-AG). Bristol: Environment Agency.
ENVIRONMENT AGENCY, 2010b. Ecosystem services assessment of buffer zone installation on the upper Bristol Avon, Wiltshire. Bristol: Environment Agency.
ENVIRONMENT AGENCY, 2011a. The Mayes Brook restoration in Mayesbrook Park, East London: an ecosystem services assessment. Bristol: Environment Agency.
ENVIRONMENT AGENCY, 2011b. Steart Coastal Management Project: Environmental Statement. Report number: IMSW001389. Bristol: Environment Agency.
ENVIRONMENT AGENCY, 2012a. Greater Working with Natural Processes in flood and coastal erosion risk management. A response to Pitt Review Recommendation 27. Bristol: Environment Agency. Available from: http://www.jbatrust.org/wp-content/uploads/2016/02/Greater-working-with-natural-processes-in-flood-and-coastal-erosion-risk-management-REPORT.pdf [Accessed 4 July 2017].
ENVIRONMENT AGENCY, 2012b. Rural sustainable drainage systems. Bristol: Environment Agency.
ENVIRONMENT AGENCY, 2015a. Energy crops and floodplain flows. Report SC060092/R2. Bristol: Environment Agency.
ENVIRONMENT AGENCY, 2015b. The effect of peatland restoration on baseflows: Exmoor and Dartmoor Mires Project. Environment Agency hydrology report. Bristol: Environment Agency.
ENVIRONMENT AGENCY, 2015c. Multiscale experimentation, monitoring and analysis of long-term land use changes and flood risk. Report SC060092/R1. Bristol: Environment Agency.

Working with Natural Processes – Evidence Directory 256
ENVIRONMENT AGENCY, 2016. Restoration measures to improve river habitats during low flows. Report SC120050/R. Bristol: Environment Agency.
ENVIRONMENT AGENCY, 2017. Accounting for residual uncertainty: updating the freeboard guide. Report SC120014. Bristol: Environment Agency.
ENVIRONMENT AGENCY, HASKONINGS AND DEFRA, 2007. Saltmarsh management manual. R&D Technical Report SC030220. Bristol: Environment Agency.
ERWIN, S.O., SCHMIDT, J.C. AND ALLRED, T.M. 2016. Post-project geomorphic assessment of a large process-based river restoration project. Geomorphology, 270, 145-158.
ERWIN, S.O., SCHMIDT, J.C. AND ALLRED, T.M. 2016. Post-project geomorphic assessment of a large process-based river restoration project. Geomorphology, 270, 145-158.
ESTEVES, L.S., 2014. Managed realignment: a viable long-term coastal management strategy? Springer Briefs in Environmental Science. New York: Springer.
EVANS, K.L., NEWSON, S.E. AND GASTON, K.J., 2009. Habitat influences on urban avian assemblages. Ibis, 151 (1), 19-39.
EVANS, R., 2006. Land use, sediment delivery and sediment yield in England and Wales. In Soil Erosion and Sediment Redistribution in River Catchments: Measurement, Modelling and Management (ed. P.N. Owens and A.J. Collins), pp. 70-84. Wallingford: CABI Publishing.
EVANS, R. AND BOARDMAN, J., 2003. Curtailment of muddy floods in the Sompting catchment, South Downs, West Sussex, southern England. Soil Use and Management, 19 (3), 223-231.
EVANS, R.O., BASS, K.L., BURCHELT, M.R., HINSON, R.D., JOHNSON, R. AND DOXEY, M., 2007. Management alternatives to enhance water quality and ecological function of channelized streams and drainage canals. Journal of Soil and Water Conservation, 62 (4), 308-320.
EVANS, T.B. AND WILSON, A.M., 2016. Groundwater transport and the freshwater – saltwater interface below sandy beaches. Journal of Hydrology, 538, 563-573.
EVERARD, M., JONES, M.L.M. AND WATTS, B., 2010. Have we neglected the societal importance of sand dunes? An ecosystem services perspective. Aquatic Conservation: Marine and Freshwater Ecosystems, 20 (4), 476-487.
EVRARD, O., PERSOONS, E., VANDAELE, K. AND VAN WESEMAEL, B., 2007. Effectiveness of erosion mitigation measures to prevent muddy floods: a case study in the Belgian loam belt. Agriculture, Ecosystems and Environment, 118 (1), 149-158.
EVRARD, O., VANDAELE, K., VAN WESEMAEL, B. AND BIELDERS, C.L., 2008. A grassed waterway and earthen dams to control muddy floods from a cultivated catchment of the Belgian loess belt. Geomorphology, 100 (3-4), 419-428.
FAHEY, B. AND JACKSON, R., 1997. Hydrological impacts of converting native forests and grasslands to pine plantations, South Island, New Zealand. Agricultural and Forest Meteorology, 84 (1), 69-82.
FERRARI, M.R., MILLER, J.R. and RUSSELL, G.L., 1999. Modeling the effect of wetlands, flooding, and irrigation on river flow: application to the Aral Sea. Water Resources Research, 35 (6), 1869-1876.
Working with Natural Processes – Evidence Directory 257
FIENER, P. AND AUERSWALD, K., 2003. Effectiveness of grassed waterways in reducing runoff and sediment delivery from agricultural watersheds. Journal of Environmental Quality, 32 (3), 927-936.
FIENER, P. AND AUERSWALD, K., 2006. Seasonal variation of grassed waterway effectiveness in reducing runoff and sediment delivery from agricultural watersheds in temperate Europe. Soil and Tillage Research, 87 (1), 48-58.
FIENER, P. AUERSWALD, K. AND WEIGAND, S., 2005. Managing erosion and water quality in agricultural watersheds by small detention ponds. Agriculture, Ecosystems and Environment, 110 (3), 132-142.
FINCH, J.W., HALL, R.L., ROSIER, P.T.W., CLARK, D.B., STRATFORD, C., DAVIES, H.N., MARSH, T.J., ROBERTS, J.M., RICHE, A. AND CHRISTIAN, D., 2004. The hydrological impacts of energy crop production in the UK. London: Department of Trade and Industry.
FISCHENICH, J.C. AND MORROW, J.V., 2000. Streambank habitat enhancement with large woody debris. Report ERDC TN-EMRRP-SR-13. Vicksburg, MI: Ecosystem Management and Restoration Research Program (EMRRP).
FJØRTOFT, I., 2001. The natural environment as a playground for children: the impact of outdoor play activities in pre-primary school children. Early Childhood Education Journal, 29 (2), 111-117.
FLEMING, A., 2016. The important of urban forests: why money really does grow on trees [online]. The Guardian, 12 October. Available from: https://www.theguardian.com/cities/2016/oct/12/importance-urban-forests-money-grow-trees [Accessed 18 August 2017].
FOREST RESEARCH, 2008. The Robinwood Robinflood report. Evaluation of large woody debris in watercourses. Report for the Robinwood Project, an INTEREG IIIc Regional Framework Operation project. Farnham, Surrey: Forest Research.
FORESTRY COMMISSION, 2011. The UK Forestry Standard. Edinburgh: Forestry Commission.
FORESTRY COMMISSION, 2014. UK Woodland Carbon Code: requirements for voluntary carbon sequestration projects; Version 1.3. Edinburgh: Forestry Commission.
FOWLER, H.J., 2005. Are extremes increasing? Changing rainfall patterns in Yorkshire. The Yorkshire and Humberside Regional Review, 15 (1), 21-24.
FRANKLIN, D.H., CABRERA, M.L., WEST, L.T., CALVERT, V.H. AND REMA, J.A., 2007. Aerating grasslands: effects on runoff and phosphorus loss from applied broiler litter. Journal of Environmental Quality, 36 (1), 208–215.
FREEBORN, J.R., SAMPLE, D.J. AND FOX, L.J., 2012. Residential stormwater: methods for decreasing runoff and increasing stormwater infiltration. Journal of Green Building, 7 (2), 15-30.
FRENCH, P.W., 1997. Coastal and Estuarine Management. London: Routledge.
FRIESS, D., MÖLLER, I. AND SPENCER, T., 2008. Case study: managed realignment and the reestablishment of saltmarsh habitat, Freiston Shore, Lincolnshire, United Kingdom. In Annex 1: Case studies of The Role of Environmental Management and Eco-Engineering in Disaster Risk Reduction and Climate Change Adaptation, pp. 65-78. ProAct Network 2008. Available from: https://www.unisdr.org/we/inform/publications/4148 [Accessed 9 August 2017].
Working with Natural Processes – Evidence Directory 258
FULLER, I.C., LARGE, A.R., CHARLTON, M.E., HERITAGE, G.L. AND MILAN, D.J.,
2003. Reach‐scale sediment transfers: An evaluation of two morphological budgeting approaches. Earth Surface Processes and Landforms, 28 (8), 889-903.
GAMBRELL, P.R., 1994. Trace and toxic metals in wetlands: a review. Journal of Environmental Quality, 23 (5), 883-891.
GAO, J., HOLDEN, J. AND KIRKBY, M., 2016. The impact of land‐cover change on flood peaks in peatland basins. Water Resources Research, 52 (5), 3477-3492.
GAYWOOD, M., 2015. Beavers in Scotland: a report to the Scottish Government. Inverness: Scottish Natural Heritage.
GERIS, J.R.M.C., 2012. Multiscale impacts of land use/management changes on flood response in the River Hodder catchment, north-west England, Newcastle upon Tyne. PhD thesis, Newcastle University. Available from: https://theses.ncl.ac.uk/dspace/bitstream/10443/1499/1/Geris_2012.pdf [Accessed 30 August 2017].
GHAVASIEH, A.R., POULARD, C. AND PASQUIER, A., 2006. Effect of roughened strips on flood propagation: assessment on representative virtual cases and validation. Journal of Hydrology, 318 (1), 121-137.
GHIMIRE, S., WILKINSON, M.E. AND DONALDSON-SELBY, G., 2014. Assessing the effectiveness of Natural Flood Management (NFM) in a rural catchment of Scotland. In Informatics and the Environment: Data and Model Integration in a Heterogeneous Hydro World, Proceedings of 11th International Conference on Hydroinformatics (New York, 2014), pp. 482-489. Red Hook, NY: Curran Associates.
GIBBONS, S., MOURATO, S. AND RESENDE, G.M., 2014. The amenity value of English nature: a hedonic price approach. Environmental and Resource Economics, 57 (2), 175-196.
GIFFORD, G.F. AND HAWKINS, R.H., 1978. Hydrologic impact of grazing on infiltration: a critical review. Water Resources Research, 14 (2), 305-313.
GILBERT, P., TAYLOR, S., COOKE, D., DEARY, M., COOKE, M. AND JEFFRIES, M., 2014. Variations in sediment organic carbon among different types of small natural ponds along Druridge Bay, Northumberland, UK. Journal of the International Society of Limnology, 4 (1), 57-64.
GILVEAR, D., CECIL, J. AND PARSONS, H., 2000. Channel change and vegetation diversity on a low-angle alluvial fan, River Feshie, Scotland. Aquatic Conservation: Marine and Freshwater Ecosystems, 10 (1), 53-71.
GIPPEL, C.J., 1995. Environmental hydraulics of large woody debris in streams and rivers. Journal of Environmental Engineering, 121 (5), 388-395.
GIREL, J., HUGHES, F.M.R., MOSS, T., MULLER, E., NILSSON, C. AND RICHARDS, K., 2003. A case for floodplain forests? In The Flooded Forest: guidance for policy makers and river managers in Europe on the restoration of floodplain forests (ed. F.M.R. Hughes), pp. 6-23. Cambridge: The FLOBAR2 Project, Department of Geography, University of Cambridge.
GIRIAT, D., GORCZYCA, E. AND SOBUCKI, M., 2016. Beaver ponds’ impact on fluvial processes (Beskid Niski Mts., SE Poland). Science of the Total Environment, 544, 339-353.
GLENDELL, M., MCSHANE, G., FARROW, L., JAMES, M.R., QUINTON, J., ANDERSON, K. AND JONES, L., 2017. Testing the utility of structure‐from‐motion photogrammetry reconstructions using small unmanned aerial vehicles and ground

Working with Natural Processes – Evidence Directory 259
photography to estimate the extent of upland soil erosion. Earth Surface Processes and Landforms, DOI: 10.1002/esp.4142.
GOODAY, R.D., ANTHONY, S.G., CHADWICK, D.R., NEWELL-PRICE, P., HARRIS, D., DUETHMANN, D., FISH, R., COLLINS, A.L. AND WINTER, M., 2014. Modelling the cost-effectiveness of mitigation methods for multiple pollutants at farm scale. Science of the Total Environment, 468-469, 1198-1209.
GOPALAKRISHNAN, S., SMITH, M.D., SLOTT, J.M. AND MURRAY, B., 2011. The value of disappearing beaches: A hedonic pricing model with endogenous beach width. Journal of Environmental Economics and Management, 61 (3), 297-310
GRABLE, A.R., 1966. Soil aeration and plant growth. Advances in Agronomy, 18, 57-106.
GRABOWSKI, R.C. AND GURNELL, A.M., 2016. Hydrogeomorphology–ecology interactions in river systems. River Research and Applications, 32 (2), 139-141.
GRAYSON, R., HOLDEN, J. AND ROSE, R., 2010. Long-term change in storm hydrographs in response to peatland vegetation change. Journal of Hydrology, 389 (3-4), 336-343.
GREEN, R.H., 1979. Sampling Design and Statistical Methods for Environmental Biologists. Chichester: Wiley Interscience.
GREENWOOD, K.L., MACLEOD, D.A., SCOTT, J.M. AND HUTCHINSON, K.J., 1998. Changes to soil physical properties after grazing exclusion. Soil Use and Management, 14 (1), 19-24.
GREENWOOD, K.L. AND MCKENZIE, B.M., 2001. Grazing effects on soil physical properties and the consequences for pastures: a review. Australian Journal of Experimental Agriculture, 41 (8), 1231-1250.
GREGORY, K.J., GURNELL, A.M. AND HILL, C.T., 1985. The permanence of debris dams related to river channel processes. Hydrological Sciences Journal-Journal Des Sciences Hydrologiques, 30 (3), 371-381.
GREGORY, K.J., GURNELL, A.M., HILL, C.T. AND TOOTH, S.,1994. Stability of the pool riffle sequence in changing river channels. Regulated Rivers: Research and Management, 9 (1), 35-43.
GRYGORUK, M. AND NOWAK, M., 2014. Spatial and temporal variability of channel retention in a lowland temperate forest stream settled by European beaver (Castor fiber). Forests, 5, 2276-2288.
GUILLEMETTE, F., PLAMONDON, A.P., PREVOST, M. AND LEVESQUE, D., 2005. Rainfall generated stormflow response to clearcutting a boreal forest: peak flow comparison with 50 world-wide basin studies. Journal of Hydrology, 302 (1-4), 137–153.
GURNELL, A.M., 2013. Wood in fluvial systems. In Treatise on Geomorphology (ed. J.F. Shroder), pp. 163-188. San Diego: Academic Press.
GURNELL, A., 2014. Plants as river system engineers. Earth Surface Processes and Landforms, 39 (1), 4-25.
GURNELL, A.M. and SWEET, R., 1998. The distribution of large woody debris accumulations and pools in relation to woodland stream management in a small, low-gradient stream. Earth Surface Processes and Landforms, 23 (12), 1101-1121.
GURNELL, J., GURNELL, A.M., DEMERITT, D., LURZ, P.W.W., SHIRLEY, M.D.F., RUSHTON, S.P., FAULKES, C.G., NOBERT, S. and HARE, E.J., 2009. The feasibility
Working with Natural Processes – Evidence Directory 260
and acceptability of reintroducing the European beaver to England. Natural England Commissioned Report NECR002. Report commissioned jointly by Natural England and the People’s Trust For Endangered Species. Worcester: Natural England
GUYETTE, R.P., COLE, W.G., DEY, D.C. AND MUZIKA, R.-M., 2002. Perspectives on the age and distribution of large wood in riparian carbon pools. Canadian Journal of Fisheries and Aquatic Sciences, 59 (3), 578-585.
HABERSACK, H., HAUER, C., SCHOBER, B., DISTER, E., QUICK, I., HARMS, O., DOPKE, M., WINTZ, M. AND PIQUETTE, E., 2008. Flood risk reduction by PReserving and restOring river Floodplains (PRO_Floodplain). CRUE Research Report No I-3. Results from the 1st ERA-Net CRUE Funding Imitative. London: CRUE. Available from: http://www.crue-eranet.net/publications.asp [Accessed 9 August 2017].
HALCROW, 2002. Futurecoast geomorphology manual. Produced for Defra.
HALCROW, 2012. Assessment of siltation at Alkborough. Swindon: Halcrow. HAMMERSMARK, C.T., RAINS, M.C. AND MOUNT, J.F., 2008. Quantifying the hydrological effects of stream restoration in a montane meadow, northern California, USA. River Research and Applications, 24 (6), 735-753.
HANLEY, N., KOOP, G.M.. ALVAREZ-FARIZO, B., WRIGHT, R.E. AND NEVIN, C., 2001. An application of recreation demand models to rock climbing. Journal of Agricultural Economics, 52 (1), 36-52.
HANLEY, N., CJAJKOWSKI, M., HANLEY-NICKOLLS, R. AND REDPATH, S., 2010. Economic values of species management options in human-wildlife conflicts: hen harriers in Scotland. Ecological Economics, 70 (1), 107-113.
HANLEY, M.E., HOGGART, S.P.G, SIMMONDS, D.J., BICHOT, A., COLANGELO, M.A., BOZZEDA, F., HEURTEFEUX, H., ONDIVIELA, B., OSTROWSKI, R., RECIOE, M., TRUDE, R., ZAWADZKA-KAHLAU, E. AND THOMPSON, R.C., 2014. Shifting sands? Coastal protection by sand banks, beaches and dunes. Coastal Engineering, 87, 136-146.
HANSEN, B., SCHØNNING, P. AND SIBBESEN, E., 1999. Roughness indices for estimation of depression storage capacity of tilled soil surfaces. Soil and Tillage Research, 52 (1-2), 103-111.
HANSON, H., BRAMPTON, A., CAPOBIANCO, M., DETTE, H.H., HAMM, L., LAUSTUP, C., LECHUGA, A. AND SPANHOFF, R., 2002. Beach nourishment projects, practices and objectives – a European overview. Coastal Engineering, 47 (2), 81-111.
HARDY, R.J., BATES, P.D. AND ANDERSON, M.G., 2000. Modelling suspended sediment deposition on a fluvial floodplain using a two-dimensional dynamic finite element model. Journal of Hydrology, 229 (3-4), 202-218.
HARR, R.D., 1986. Effects of clearcutting on rain-on-snow runoff in western Oregon: a new look at old studies. Water Resources Research, 22 (7), 1095-1100.
HARRIS, G.L., CLEMENTS, R.O., ROSE, S.C., PARKIN, A. AND SHEPHERD, M., 2004. Review of impacts of rural land use and management on flood generation. Impact study report. Appendix C Current state of managed rural land and mitigation measures. R&D Technical Report FD2114/TR. London: Department for Environment, Food and Rural Affairs.
HARROD, T.R. AND THEURER, F.D., 2002. Sediment. In Agriculture, Hydrology and Water Quality (ed. P.M. Haygarth and S.C. Jarvis), pp. 155-170. Wallingford: CABI Publishing.
Working with Natural Processes – Evidence Directory 261
HARROLD, L.L., BRAKENSIEK, D.L. AND MCGUINNESS, J.L., 1962. Influence of land use and treatment on the hydrology of small watersheds at Coshocton, Ohio 1938-1957. Technical Bulletin 1256. Washington DC: US Department of Agriculture.
HAYGARTH, P.M. AND JARVIS, S.C., 1999. Transfer of phosphorus from agricultural soils. Advances in Agronomy, 66, 196-249.
HEATHWAITE, A.L. AND JOHNES, P.J., 1996. The contribution of nitrogen species and phosphorus fractions to stream water quality in agricultural catchments. Hydrological Processes, 10 (7), 971–983.
HEATHWAITE, A.L., BURT, T.P. AND TRUDGILL, S.L., 1989. Runoff, sediment, and solute delivery in agricultural drainage basins. In Regional Characterization of Water Quality (ed. S. Ragone), pp. 175-190. IAHS Publication No. 182. Walllingford: IAHS Press.
HEATHWAITE, A.L., BURT, T.P. AND TRUDGILL, S.T., 1990. Land-use controls on sediment production in a lowland catchment, south-west England. In Soil Erosion on Agricultural Land (ed. J. Boardman. I.D.L. Foster and J.A. Dearing), pp. 70-86. Chichester: John Wiley and Sons.
HEATHWAITE, A.L., P.F. QUINN, P.F. AND HEWETT, C.J.M., 2005. Modelling and managing critical source areas of diffuse pollution from agricultural land using flow connectivity simulation. Journal of Hydrology, 304 (1-4), 446-461.
HENSHAW, A.J., 2009. Impacts of land use changes and land management practices on upland catchment sediment dynamics: Pontbren, mid-Wales. PhD thesis, University of Nottingham. Available from: http://eprints.nottingham.ac.uk/10889/ [Accessed 9 August 2017].
HERRERA ENVIRONMENTAL CONSULTANTS, 2006. Conceptual design guidelines: application of engineered log jams. Report prepared for the Scottish Environment Protection Agency. Seattle, WA: Herrra Environmental Consultants, Inc.
HESLENFELD, P., JUNGERIUS, P.D. AND KLIJN, J.A., 2004. European policy for coastal dunes. In Coastal Dunes: Ecology and Conservation (ed. M.L. Martinez and N.P. Psuty), pp. 335-351. Berlin: Springer-Verlag.
HESP, P.A., 2013. A 34 year record of foredune evolution, Dark Point, NSW, Australia. Journal of Coastal Research, Special Issue No. 65, 1295-1300.
HEWLETT, J.D. AND PIENAAR, L., 1973. Design and analysis of the catchment experiment. In The Use of Small Watersheds in Determining Effects of Forest Land Use on Water Quality, Proceedings of a symposium (Lexington, KY, 1973), edited E.H. White, pp. 88-106.
HICKMANN, M., ASH, J. AND FENN, T., 2001. Sustainable flood defence: the case for washlands. English Nature Research Reports No. 406. Peterborough: English Nature.
HILL, P.R. AND MANNERING, J.V., 1995. Conservation tillage and water quality. WQ-20. West Lafayette, IN: School of Agriculture, Purdue University
HILLMAN, G.R., 1998. Flood wave attenuation by a wetland following a beaver dam failure on a second order boreal stream. Wetlands, 18 (1), 21-34.
HODGE, I. AND READER, M., 2010. The introduction of Entry Level Stewardship in England: extension or dilution in agri-environment policy. Land Use Policy, 27 (2), 270-282.
HOFFMANN, C.C., KRONVANG, B. AND AUDET, J., 2011. Evaluation of nutrient retention in four restored Danish riparian wetlands. Hydrobiologia, 674 (1), 5-24.

Working with Natural Processes – Evidence Directory 262
HOLDEN, J. AND BURT, T.P., 2003. Hydrological studies on blanket peat: The significance of the acrotelm–catotelm model. Journal of Ecology, 91 (1), 86-102.
HOLDEN, J., WEST, L.J., HOWARD, A.J., MAXFIELD, E., PANTER, I. AND OXLEY, J., 2006. Hydrological controls of in situ preservation of waterlogged archaeological deposits. Earth-Science Reviews, 78 (1-2), 59-83.
HOLDEN, J., GASCOIGN, M. AND BOSANKO, N.R., 2007. Erosion and natural revegetation associated with surface land drains in upland peatlands. Earth Surface Processes and Landforms, 32 (10), 1547-1557.
HOLDEN, J., KIRKBY, M.J., LANE, S.N., MILLEDGE, D.G., BROOKES, C.J., HOLDEN, V. AND MCDONALD, A.T., 2008. Overland flow velocity and roughness properties in peatlands. Water Resources Research, 44 (6), article W06415.
HOLDEN, J., WALLAGE, Z.E., LANE, S.N. AND MCDONALD, A.T., 2011. Water table dynamics in undisturbed, drained and restored blanket peat. Journal of Hydrology, 402 (1-2), 103-114.
HOLDEN, J., GREEN, S.M., BAIRD, A.J., GRAYSON, R.P., DOOLING, G.P., CHAPMAN, P.J., EVANS, C.D., PEACOCK, M. AND SWINDLES, G., 2016. The impact of ditch blocking on the hydrological functioning of blanket peatlands. Hydrological Processes, 31 (3), 525-539.
HOLMAN, I.P., HOLLIS, J.M., BRAMLEY, M.E. AND THOMPSON, T.R.E., 2003. The contribution of soil structural degradation to catchment flooding: a preliminary investigation of the 2000 floods in England and Wales. Hydrology and Earth System Sciences, 7 (5), 755-766.
HOOIJER, A., 1996. Floodplain hydrology: an ecologically oriented study of the Shannon Callows, Ireland. PhD thesis, Vrije University Amsterdam.
HOUSTON J., 2008. Management of Natura 2000 habitats. 2130 Fixed coastal dunes with herbaceous vegetation (‘grey dunes’). Technical Report 2008 04/24. Brussels: European Commission.
HOWARD, A.J., CHALLIS, K., HOLDEN, J., KINCEY, M. AND PASSMORE, D.G., 2008. The impact of climate change on archaeological resources in Britain: a catchment scale assessment. Climatic Change, 91 (3-4), 405-422.
HOWE, M.A., KNIGHT, G.T. AND CLEE, C., 2010. The importance of coastal sand dunes for terrestrial invertebrates in Wales and the UK, with particular reference to aculeate Hymenoptera (bees, wasps & ants). Journal of Coast Conservation, 14 (2), 91-102.
HUDSON, N., 1995. Soil Conservation, 3rd edition. London: B.T. Batsford.
HUTCHINS, M.G., JOHNSON, A.C., DEFLANDRE-VLANDAS, A., COMBER, S., POSEN, P. AND BOORMAN, D., 2010. Which offers more scope to suppress river phytoplankton blooms: reducing nutrient pollution or riparian shading? Science of the Total Environment, 408 (21), 5065-5077.
HYGELUND, B. AND MANGA, M., 2003. Field measurements of drag coefficients for model large woody debris. Geomorphology, 51 (1-3), 175-185.
ISHIDA, S., YAMAZAKI, A., TAKANOSE, Y. AND KAMITANI, T., 2010. Off-channel temporary pools contribute to native riparian plant species diversity in a regulated river floodplain. Ecological Restoration, 25 (6), 1045-1055.
JACOBS, 2011. Development of methodology for assessment required under Section 20. Stirling: Scottish Environment Protection Agency.

Working with Natural Processes – Evidence Directory 263
JBA CONSULTING, 2007. Ripon Land Management Project. Final report to Defra (Project SLD2332). Skipton: JBA Consulting.
JEFFRIES, R., DARBY, S.E. AND SEAR, D.A., 2003. The influence of vegetation and organic debris on flood-plain sediment dynamics: case study of a low-order stream in the New Forest, England. Geomorphology, 51 (1-3), 61-80.
JNCC, 2006. Spartina anglica [online]. Peterborough: Joint Nature Conservation Committee. Available from: http://jncc.defra.gov.uk/page-1680 [Accessed 9 August 2017].
JNCC, 2016.Extent and distribution of UK coastal habitats [online]. Peterborough: Joint Nature Conservation Committee. Available from: http://jncc.defra.gov.uk/page-5379-theme=default [Accessed 19 September 2017].
JOHNSON, R.C. (ED.), 1995. Effects of upland afforestation on water resources. The Balquhidder Experiment 1981-1991. Report No.116. Wallingford: Institute of Hydrology.
JOHNSON, R.C. 2006. SAFER - Flood Risk Assessment and Survey of the River Enrick. River Enrick flood risk assessment, Final Report. Jacobs Babtie. Glasgow.
JOHNSTONE, C. AND MARKANDYA, A., 2006. Valuing river characteristics using combined choice and participation travel cost models. Journal of Environmental Management, 80 (3), 237-247.
JONCZYK, J., QUINN, P.F., RIMMER, D.L., BURKE, S. and WILKINSON, M., 2008. Farm Integrated Runoff Management (FIRM) plans: a tool to reduce diffuse pollution. Presentation to British Hydrological Society 10th National Hydrology Symposium (Exeter, 2008).
JONES, J.A., 2000. Hydrologic processes and peak discharge response to forest removal, regrowth, and roads in 10 small experimental basins, western Cascades, Oregon. Water Resources Research, 36 (9), 2621-2642.
JONES, L., 2011. Coastal margins. In UK National Ecosystem Assessment: Technical Report, Chapter 11, pp. 411-458. Cambridge: UN Environment Programme – World Conservation Monitoring Centre.
JONES, M.L.M., SOWERBY, A., WILLIAMS, D.L. AND JONES, R.E., 2008. Factors controlling soil development in sand dunes: evidence from a coastal dune soil chronosequence. Plant and Soil, 307 (1-2), 219-234.
JURA CONSULTANTS, 2007. Tweed Rivers Heritage Project: socio-economic impact assessment. Midlothian, Scotland: Jura Consultants.
JURAJDA, P., ONDRACKOVA, M. AND REICHARD, M., 2004. Managed flooding as a tool for supporting natural fish reproduction in man-made lentic water bodies. Fisheries Management and Ecology, 11 (3-4), 237-242.
JUSTES, E., BEAUDOIN, N., BERTUZZI, P., CHARLES, R., CONSTANTIN, J., DÜRR, C., HERMON, C., JOANNON, A., LE BAS, C., MARY, B., MIGNOLET, C., MONTFORT, F., RUIZ, L., SARTHOU, J.P., SOUCHÈRE, V., TOURNEBIZE, J., SAVINI, I. AND RÉCHAUCHÈRE, O., 2012. Réduire les fuites de nitrate au moyen de cultures intermédiaires: conséquences sur les bilans d’eau et d’azote, autres services écosystémiques. Paris: INRA.
KADYKALO, A.N. AND FINDLAY, S.C., 2016. The flow regulation services of wetlands. Ecosystems Services, 20, 91-103.

Working with Natural Processes – Evidence Directory 264
KAIL, J., HERING, D., MUHAR, S., GERHARD, M. and PREIS, S. 2007. The use of large wood in stream restoration: experiences from 50 projects in Germany and Austria. Journal of Applied Ecology, 44 (6), 1145-1155.
KAMPHORST, E.C., JETEN, V., GUÉRIF, J., PITKÄNEN, J., IVERSEN, B.V., DOUGLAS, J.T. AND PAZ, A. 2000. Predicting depressional storage from soil surface roughness. Soil Science Society of America Journal, 64 (5), 1749-1758.
KAY, D., WYER, M.D., CROWTHER, J., WILKINSON, J., STAPELTON, C. AND GLASS, P., 2005. Sustainable reduction in the flux of microbial compliance parameters from urban and arable land use to coastal bathing waters by a wetland ecosystem produced by a marine flood defense structure. Water Resources, 39 (14), 3320-3332.
KEESSTRA, S., KONDRLOVA, E., CZAJKA, A., SEEGER, M. and MAROULIS, J. 2012. Assessing riparian zone impacts on water and sediment movement: a new approach. Netherlands Journal of Geosciences, 91 (1-2), 245-255.
KESHTPOOR M., PULEO, J.A., GEBERT, J. AND PLANT, N.G., 2013. Beach response to a fixed sand bypassing system. Coastal Engineering, 73, 28-42.
KING, S.E. AND LESTER, J.N., 1995. The value of salt marsh as a sea defence. London: Imperial College Centre for Environmental Technology.
KITTS, D.R., 2010. The hydraulic and hydrological performance of large wood accumulations in a low-order forest stream. PhD thesis, University of Southampton.
KNOWLES, L., ILES, J., LU, Y., KOBAYASHI, T. AND WEN, L., 2012. Phosphorus dynamics in an ephemeral wetland ecosystem after re-flooding. Environmental Modelling & Software, 35, 31-37.
KONDOLF, G.M., 1998. Lessons learned from river restoration projects in California. Aquatic Conservation: Marine and Freshwater Ecosystems, 8 (1), 39-52.
KONDOLF, G.M., 2006. River restoration and meanders. Ecology and Society, 11 (2), article 42.
KRAUSE, S., JACOBS, J. AND BRONSTERT, A., 2007. Modelling the impacts of land-use and drainage density on the water balance of a lowland–floodplain landscape in northeast Germany. Ecological Modelling, 200 (3-4), 475-492.
KRAUSE, S., KLAAR, M.J., HANNAH, D.M., MANT, J., BRIDGEMAN, J., TRIMMER, M. AND MANNING-JONES, S., 2014. The potential of large woody debris to alter biogeochemical processes and ecosystem services in lowland rivers. Wiley Interdisciplinary Reviews: Water, 1 (3), 263-275.
KREIS, N., LEVIANDIER, T. AND ARNAUD, P., 2005. Hydrological and hydraulics modelling to assess mitigation effectiveness of floodplain reconnection in the context of a mountain river. International Journal of River Basin Management, 3 (2), 117-123.
KRONVANG, B., SVENDSEN, L., BROOKES, A., FISHER, K., MÖLLER, B., OTTOSEN, O., NEWSON, M. AND SEAR, D., 1998. Restoration of the rivers Brede, Cole and Skerne: a joint Danish and British EU-LIFE demonstration project. III – Channel morphology, hydrodynamics and transport of sediment and nutrients. Aquatic Conservation. Marine and Freshwater Ecosystems, 8 (1), 209-222.
KUO, F.E. AND SULLIVAN, W.C., 2001. Environment and crime in the inner city. Does vegetation reduce crime? Environment and Behavior, 33 (3), 343-367.
KURAŚ, P.K., ALILA, Y. AND WEILER, M., 2012. Forest harvesting effects on the magnitude and frequency of peak flows can increase with return period. Water Resources Research, 48 (1), article W01544.
Working with Natural Processes – Evidence Directory 265
KURTH, A.-M. AND SCHIRMER, M., 2014. Impact of river restoration on groundwater - surface water interactions. Geophysical Research Abstracts, Volume 16, abstract EGU2014-1078.
KUTIJA, V. AND MURRAY M.G., 2007. An object-oriented approach to the modelling of free-surface flows. Journal of Hydroinfomatics, 9 (2) 81-94.
KUTSCH, W.L., AUBINET, M., BUCHMANN, N., SMITH, P., OSBORNE, B., EUGSTER, W., WATTENBACH, M., SCHRUMPF, M., SCHULZE, E.D., TOMELLERI, E., CESCHIA, E., BERNHOFER, C., BEZIAT, P., CARRARA, A., DI TOMMASI, P., GRUENWALD, T., JONES, M., MAGLIULO, V., MARLOIE, O., MOUREAUX, C., OLIOSO, A., SANZ, M.J., SAUNDERS, M., SOGAARD, H. AND ZIEGLER, W., 2010. The net biome production of full crop rotations in Europe. Agriculture, Ecosystems and Environment, 139 (3), 336-345.
KWEON, B.-S., SULLIVAN, W.C. AND WILEY, A.R., 1998. Green common spaces and the social integration of inner-city older adults. Environment and Behavior, 30 (6), 832-858.
LACAMBRA, C., CUTTS, N., ALLEN, J., BURD, F. AND ELLIOTT, M., 2004. Spartina anglica: a review of its status, dynamics and management. English Nature Report No. 527. Peterborough: English Nature.
LAFFOLEY, D. AND GRIMSDITCH, G. (ED.), 2009. The management of natural coastal carbon sinks. Gland, Switzerland: International Union for Conservation of Nature.
LANE, S.N., 2003. More floods, less rain? Changing hydrology in a Yorkshire context. In Global Warming in a Yorkshire Context (ed. M. Atherden). York: PLACE Research Centre.
LANE, S.N., 2008. Slowing the floods in the UK Pennine Uplands: a case of waiting for Godot. Journal of Practical Ecology and Conservation, 7 (1), 75-91.
LANE, S.N., 2017. Natural flood management. Wiley Interdisciplinary Reviews: Water, 4 (3), e1211.
LANE, S.N AND MILLEDGE, D.G., 2013. Impacts of upland open drains upon runoff generation: a numerical assessment of catchment-scale impacts. Hydrological Processes, 27 (12), 1701-1726.
LANE, S.N., BROOKES, C.J., HARDY, R.J., HOLDEN, J., JAMES, T.D., KIRKBY, M.J., MCDONALD, A.T., TAYEFI, V. AND YU, D., 2003. Land management, flooding and environmental risk: new approaches to a very old question. Presentation to CIWEM National Conference, September 2003.
LANE, S.N., MORRIS, J., O’CONNELL, P.E. AND QUINN, P.F., 2007. Managing the rural landscape. In Future Flooding and Coastal Erosion Risks (ed. C.R. Thorne, E.P. Evans and E.C. Penning-Rowsell), Chapter 18, pp. 297-319. London: Thomas Telford.
LAROSE, S., PRICE, J. AND ROCHEFORT, L., 1997. Rewetting of a cutover peatland: hydrologic assessment. Wetlands, 17, 416-423.
LARSEN, S., VAUGHAN, I.P. AND ORMEROD, S.J., 2009. Scale-dependent effects of fine sediments on temperate headwater invertebrates. Freshwater Biology, 54 (1), 203-219.
LATHAM, D., PONTEE, N., MONROE, B. AND BOND, I., 2013. Reconstructing habitats in a heavily industrialised estuary: from brine wells to salt marsh. Presentation at Coasts, Marine Structures and Breakwaters 2013 (Aberdeen, 2013).
Working with Natural Processes – Evidence Directory 266
LAW, A., MCLEAN, F. AND WILLBY, N.J., 2016. Habitat engineering by beaver benefits aquatic biodiversity and ecosystem processes in agricultural streams. Freshwater Biology, 61 (4), 486-499.
LAZZARO, L., OTTO, S. AND ZANIN, G., 2008. Role of hedgerows in intercepting spray drift: evaluation and modelling of the effects. Agriculture, Ecosystems and Environment, 123 (4), 317-327.
LEEWIS, L., VAN BODEGOM, P.M., ROZEMA, J. AND JANSSEN, G.M., 2012. Does beach nourishment have long-term effects on intertidal macroinvertebrate species abundance? Estuarine Coastal and Shelf Science, 113, 172-181.
LEHMAN, R.M. AND OSBORNE, S.L., 2013. Greenhouse gas fluxes from no-till rotated corn in the upper Midwest. Agriculture, Ecosystems and Environment, 170, 1-9.
LEOPOLD, L.B. AND MADDOCK, T., 1954. The Flood Control Controversy. New York: Ronald Press.
LEVASSEUR, F.. BAILLY, J.S., LAGACHERIE, P., COLIN, F. AND RABOTIN M., 2012. Simulating the effects of spatial configurations of agricultural ditch drainage networks on surface runoff from agricultural catchments. Hydrological Processes, 26 (22), 3393-3404.
LIEKENS, I., BROEKX, S. AND DE NOCKER, L., 2013. Manual for the valuation of ecosystem services in estuaries. Study commissioned by the Antwerp Port Authority as part of the European Interreg IVB North Sea Region project TIDE (Tidal River Development).
LIU, G., ZHANG, J., TIAN, G. AND WEI, C., 2005. The effects of land use on purplish soil erosion in hilly area of Sichuan Province China. Journal of Mountain Science – English 2, (1), 68-75.
LIU, Y., GEBREMESKEL, S., DE SMEDT, F., HOFFMANN, L. AND PFISTER, L., 2004. Simulation of flood reduction by natural river rehabilitation using a distributed hydrological model. Hydrology and Earth System Sciences Discussions, 8 (6), 1129-1140.
LOFROTH, E., 1998. The dead wood cycle. In Conservation Biology Principles for Forested Landscapes (ed. J. Voller and S. Harrison), pp. 185-207. Vancouver: UBC Press.
LOWE, S., 2013. Marine Research Report. Lymington Harbour habitat replenishment scheme – Phase II. Summary of works. London: The Crown Estate.
LOWRANCE, R., TODD, R., FAIL, J., HENDRICKSON, O., LEONARD, R. AND ASMUSSEN, L., 1984. Riparian forests as nutrient filters in agricultural watersheds. BioScience, 34 (6), 374-377.
LOZA, P.R.G., 2008. Sand bypassing systems. Masters’ thesis, University of Porto, Portugal. Available from: https://repositorio-aberto.up.pt/handle/10216/11039 [Accessed 11 August 2017].
LUISETTI, T., TURNER, K. AND BATEMAN, I., 2008. An ecosystem services approach to assess managed realignment coastal policy in England. CSERGE Working Paper. Norwich: Centre for Social and Economic Research on the Global Environment, University of East Anglia.
MACLEOD, C.J.A., BINLEY, A., HAWKINS, S.L., HUMPHREYS, M.W., TURNER, L.B., WHALLEY, W.R. AND HAYGARTH, P.M., 2007. Genetically modified hydrographs: what can grass genetica do for temperate catchment hydrology?. Hydrological Processes, 21 (16), 2217-2221.
Working with Natural Processes – Evidence Directory 267
MACLEOD, C.J.A., HUMPRHREYS, M.W., WHALLEY, W.R., TURNER, L., BINLEY, A., WATTS, C.W., SKØT, L., JOYNES, A., HAWKINS, S., KING, I.P., O’DONOVAN, S AND HAYGARTH, P., 2013. A novel grass hybrid to reduce flood generation in temperate regions. Scientific Reports, 3, article 1683.
MALTBY, E. AND ORMEROD, S., 2011. Freshwaters – openwaters, wetlands and floodplains. In UK National Ecosystem Assessment: Technical Report, Chapter 9, pp. 295-360. Cambridge: UN Environment Programme – World Conservation Monitoring Centre.
MANNERS, R.B. AND DOYLE, M.W., 2008. A mechanistic model of woody debris jam evolution and its application to wood-based restoration and management. River Research and Applications, 24 (8), 1104-1123.
MARJA, R. AND HERZON, I., 2012. The importance of drainage ditches for farmland birds in agricultural landscapes in the Baltic countries: does field type matter? Ornis Fennica, 89 (3), 170-181.
MARSHALL, M.R., BALLARD, C.E., FROGBROOK, Z.L., SOLLOWAY, I., MCINTYRE, N., REYNOLDS, B. AND WHEATER, H.S., 2014. The impact of rural land management changes on soil hydraulic properties and runoff processes: results from experimental plots in upland UK. Hydrological Processes, 28 (4), 2617-2629.
MASSELINK, G. AND RUSSELL, P., 2013. Impacts of climate change on coastal erosion. In MCCIP Science Review 2013, pp. 71-86. Lowestoft: Marine Climate Change Impacts Partnership. Available from: http://www.mccip.org.uk/impacts-report-cards/full-report-cards/2013/climate-of-the-marine-environment/coastal-erosion/ [Accessed 11 August 2017].
MASSELINK, G., HANLEY, M.E., HALWYN, A.C., BLAKE, W., KINGSTON, K., NEWTON, T. AND WILLIAMS, M., 2017. Evaluation of salt marsh restoration by means of self-regulating tidal gate – Avon estuary, south Devon, UK. Ecological Engineering, 106 Part A, 174-190.
MATTOCK, A. (ED.), 2008a. Coastal saltmarsh. UK Biodiversity Action Plan; Priority Habitat Descriptions. Peterborough: Joint Nature Conservation Committee, Biodiversity Reporting and Information Group (BRIG).
MATTOCK, A. (ED.), 2008b. Intertidal mudflats. UK Biodiversity Action Plan; Priority Habitat Descriptions. Peterborough: Joint Nature Conservation Committee, Biodiversity Reporting and Information Group (BRIG).
MATTOCK, A. (ED.), 2008c. Coastal vegetated shingle. UK Biodiversity Action Plan; Priority Habitat Descriptions. Peterborough: Joint Nature Conservation Committee, Biodiversity Reporting and Information Group (BRIG).
MCDONALD, A.G., BEALEY, W.J., FOWLER, D., DRAGOSITS, U., SKIBA, U., SMITH, R.I., DONOVAN, R.G., BRETT, H.E., HEWITT, C.N. AND NEMITZ, E., 2007. Quantifying the effect of urban tree planting on concentrations and depositions of PM10 in two UK conurbations. Atmospheric Environment, 41 (38), 8455-8467.
MCGLOTHLIN, D., JACKSON, W.J. AND SUMMERS, P., 1988. Groundwater geomorphic processes and riparian values: San Pedro River, Arizona. In Proceedings of a Symposium on Water Use Data for Water Resource Management (Tuscan, AZ, August 1988), pp. 537-545. Tuscon, AZ: American Water Resources Association.
MCINTYRE, N. AND MARSHALL, M., 2010. Identification of rural land management signals in runoff response. Hydrological Processes, 24 (24), 3521-3534.
MCINTYRE, N. AND THORNE, C. (ED.), 2013. Land use management effects on flood flows and sediments – guidance on prediction. CIRIA Report C719. London: CIRIA.
Working with Natural Processes – Evidence Directory 268
MCINTYRE, N., BALLARD, C., BULYGINA, N., FROGBROOK, Z., CLUCKIE, I., DANGERFIELD, S., EWEN, J., GERIS, J., HENSHAW, A., JACKSON, B., MARSHALL, M., PAGELLA, T., PARK, J.-S., REYNOLDS, B., O’CONNELL, E., O’DONNELL, G., SINCLAIR, F., SOLLOWAY, I., THORNE, C. AND WHEATER, H., 2012. The potential for reducing flood risk through changes to rural land management: outcomes from the Flood Risk Management Research Consortium. Presentation to British Hydrological Society’s 11th National Symposium, Hydrology for a Changing World (Dundee, 2012).
MEEK, B., LOXTON, D., SPARKS, T., PYWELL, R., PICKETT, H. and NOWAKOWSKI, M., 2002. The effect of arable field margin composition on invertebrate biodiversity. Biological Conservation, 106, 259–271.
MEIRE, P., DAUWE, W., MARIS, T., PEETERS, P., COEN, L., DESCHAMPS, M., RUTTEN, J. AND TEMMERMAN, S., 2014. The recent ‘Saint Nicholas’ storm surge in the Scheldt estuary: the Sigma plan proves its efficiency! ECSA Bulletin, 62, 19-23.
MEISSNER, R., SEEGER, J. AND RUPP, H., 1998. Lysimeter studies in East Germany concerning the influence of set aside of intensively fanned land on the seepage water quality. Agriculture, Ecosystems and Environment, 67 (2-3), 161-173.
MERRITT, A., 1994. Wetlands, industry and wildlife: a manual of principles and practices. Slimbridge, Gloucestershire: The Wildfowl and Wetland Trust.
METCALFE, P., BEVEN, K. AND FREER, J., 2015. Dynamic TOPMODEL: a new implementation in R and its sensitivity to time and space intervals. Environmental Modelling and Software, 72 (C), 155-172.
METCALFE, P., BEVEN, K., HANKIN, B. and LAMB, R., 2016. Natural Flood Management in context: evaluating and enhancing the impact. EGU General Assembly Conference Abstracts 2016, abstract 8831.
METCALFE, P., BEVEN, K., HANKIN, B. AND LAMB, R., 2017. A modelling framework for evaluation of the hydrological impacts of nature-based approaches to flood risk management, with application to in-channel interventions across a 29 km2 scale catchment in the United Kingdom: a modelling framework for nature-based flood risk management. Hydrological Processes, 31 (9), 1734-1748.
MILLER, D.L., THETFORD, M. AND YAGER, L., 2001. Evaluating sand fence and vegetation for dune building following overwash by Hurricane Opal on Santa Rosa Island, Florida. Journal of Coastal Research, 17 (4), 936-948.
MILLIDINE, K.J., MALCOLM, I.A., GIBBINS, C.N., FRYER, R.J. AND YOUNGSON, A.F., 2012. The influence of canalisation on juvenile salmonid habitat. Ecological Indicators, 23, 262-273.
MITCHELL, R. AND POPHAM, F., 2008. Effect of exposure to natural environment on health inequalities: an observational population study. The Lancet, 372 (9650), 1655-1660.
MÖLLER, I. AND SPENCER, T., 2002. Wave dissipation over macro-tidal saltmarshes: effects of marsh edge typology and vegetation change. Journal of Coastal Research, Special Issue 36, 506-521.
MÖLLER, I., SPENCER, T. AND FRENCH, J.R., 1996. Wind wave attenuation over saltmarsh surfaces: preliminary results from Norfolk, England. Journal of Coastal Research, 12 (4), 1009-1016.
MÖLLER, I., SPENCER, T., FRENCH, J.R., LEGGETT, D.J. AND DIXON, M., 1999. Wave transformation over salt marshes: a field and numerical modelling study from North Norfolk, England. Estuarine, Coastal and Shelf Science, 49 (3), 411-426.
Working with Natural Processes – Evidence Directory 269
MÖLLER, I., SPENCER, T., FRENCH, J.R., LEGGETT, D.J. AND DIXON, M., 2001. The sea-defence value of salt marshes: field evidence from north Norfolk. Water and Environment Journal, 15 (2), 109-116.
MÖLLER, I., KUDELLA, M., RUPPRECHT, F., SPENCER, T., PAUL, M., VAN WESENBEECK, B.K., WOLTERS, G., JENSEN, K., BOUMA, T.J., MIRANDA-LANGE, M. AND SCHIMMELS, S., 2014. Wave attenuation over coastal salt marshes under storm surge conditions. Nature Geoscience, 7, 727-731.
MONTGOMERY, D.R., BUFFINGTON, J.M., SMITH, R.D., SCHMIDT, K.M. AND PESS, G. 1995. Pool spacing in forest channels. Water Resources Research, 31 (4), 1097-1105.
MONTGOMERY, D.R., COLLINS, B.D., BUFFINGTON, J.M. AND ABBE, T.B., 2003. Geomorphic effects of wood in rivers. In Ecology and Management of Wood in World Rivers, Proceedings of the International Conference on Wood in World Rivers (Corvallis, OR, 2000), American Fisheries Society Symposium 37 (ed. S.V. Gregory, K.L. Boyer and A.M. Gurnell), pp. 21-47. Bethseda, MD: American Fisheries Society.
MOORS FOR THE FUTURE, undated. Clough Woodland Project [online]. Edale, Derbyshire: Moors for the Future Partnership. Available from: http://www.moorsforthefuture.org.uk/clough-woodland-project [Accessed 18 August 2017].
MORRIS, J. AND CAMINO, M., 2011. UK National Ecosystem Assessment working paper: economic assessment of freshwater, wetland and floodplain (FWF) ecosystem services. Bedford: Cranfield University.
MORRIS, J., HESS, T.M., GOWING, D.J., LEEDS-HARRISON, P.B., BANNISTER, N., WADE, M. AND VIVASH, R.M., 2004. Integrated washland management for flood defence and biodiversity. Presentation to 38th Defra Flood and Coastal Management Conference (Keele, 2003). Available from: https://core.ac.uk/download/pdf/140774.pdf [Accessed 11 August 2017].
MORRIS, R.K.A., 2013. Managed realignment as a tool for compensatory habitat creation – a re-appraisal. Ocean & Coastal Management, 73, 82-91.
MOSSMAN, H.L., DAVY, A.J. AND GRANT, A., 2012. Does managed coastal realignment create saltmarshes with ‘equivalent biological characteristics’ to natural reference sites? Journal of Applied Ecology, 49 (6), 1446-1456.
MOTYKA, J. AND BRAMPTON, A., 1993. Coastal management: mapping of littoral cells. Report SR328. Wallingford: HR Wallingford.
MOXEY, A. AND MORAN, D., 2014. UK peatland restoration: some economic arithmetic. Science of the Total Environment, 484, 114-120
MÜNCHMEYER, U., RUSSOW, R. AND AUGUSTIN, J., 2000. Net and gross nitrogen mineralization in drained and reflooded fen soils. Isotopes in Environmental and Health Studies, 36 (1), 79-98.
MYATT, L.B., SCRIMSHAW, M. AND LESTER, J., 2003. Public perceptions and attitudes towards a current managed realignment scheme: Brancaster West Marsh, North Norfolk, U.K. Journal of Coastal Research, 19 (2), 278-286.
NATIONAL TRUST, 2015. From source to sea. Natural flood management: the Holnicote experience. Defra Multi-Objective Flood Management Demonstration Project. Defra project RMP5508. London: Defra.
NATURAL ENGLAND, 2010. Illustrated guide to ponds and scrapes. Natural England Technical Information Note TIN079. Sheffield: Natural England.

Working with Natural Processes – Evidence Directory 270
NATURAL ENGLAND, 2015. Monitor of engagement with the natural environment: Headline report from the 2014-2015 survey. York: Natural England.
NEWCASTLE UNIVERSITY AND ENVIRONMENT AGENCY, 2011. Runoff attenuation features: a guide for all those working in catchment management. Newcastle upon Tyne: Northumbria Regional Flood Defence Committee. Available from: https://research.ncl.ac.uk/proactive/belford/papers/Runoff_Attenuation_Features_Handbook_final.pdf [Accessed 7 July 2017].
NEWMAN, J.R., DUENAS-LOPEZ, M.A., ACREMAN, M.C., PALMER-FELGATE, E.J., VERHOEVEN, J.T.A, SCHOLZ, M. AND MALTBY, E., 2015. Do on-farm natural, restored, managed and constructed wetlands mitigate agricultural pollution in Great Britain and Ireland? A systematic review. Final report WT0989. London: Department for Environment, Food and Rural Affairs.
NGUYEN, M. L., SHEATH, G. W., SMITH, C. M. AND COOPER, A. B., 1998. Impact of cattle treading on hill land: 2. Soil physical properties and contaminant runoff. New Zealand Journal of Agricultural Research, 41(2), 279-290.
NICHOLSON, A.R., 2014. Quantifying and simulating the impact of flood mitigation features in a small rural catchment, PhD thesis, Newcastle University. Available from: https://theses.ncl.ac.uk/dspace/bitstream/10443/2382/1/Nicholson,%20A.%2014.pdf [Accessed 11 August 2017].
NICHOLSON, A.R., WILKINSON, M.E., O’DONNELL, G.M. AND QUINN, P.F., 2012. Runoff attenuation features: a sustainable flood mitigation strategy in the Belford catchment, UK. Area, 44 (4), 463-469.
NICOLET, P., BIGGS, J., FOX, G., HODSON, M., REYNOLDS, C., WHITFIELD, M. AND WILLIAMS, P., 2004. The wetland plant and macroinvertebrate assemblages of temporary ponds in England and Wales. Biological Conservation, 120 (2), 261-278.
NISBET, T., 2005. Water use by trees. Forest Research Information Note FCIN065. Farnham, Surrey: Forest Research.
NISBET, T.R. AND THOMAS, H., 2008. Restoring floodplain woodland for flood alleviation. Final report for Defra, Project SLD2316. London: Department for Environment, Food and Rural Affairs.
NISBET, T., MARRINGTON, S., THOMAS, H., BROADMEADOW, S. and VALATIN, G. 2011a. Slowing the Flow at Pickering. Final report for Phase1 for Defra FCERM Multi-objective Flood Management Demonstration project RMP5455. London: Department for Environment, Food and Rural Affairs.
NISBET, T.R., SILGRAM, M., SHAH, N., MORROW, K. AND BROADMEADOW, S., 2011b. Woodland for water: woodland measures for meeting Water Framework Directive objectives. Summary of final report fromk Forest Research to the Environment Agency and Forestry Commission (England). Bristol: Environment Agency. Available from: https://www.gov.uk/government/publications/woodland-for-water [Accessed 17 August 2017].
NISBET, T.R., ROE, P., MARRINGTON, S., THOMAS, H., BROADMEADOW, S.B. AND VALATIN, G., 2015. Slowing the Flow at Pickering. Final report for Phase2 for Defra FCERM Multi-objective Flood Management Demonstration project RMP5455. London: Department for Environment, Food and Rural Affairs.
OCKENDEN, M., DEASY, C., QUINTON, J., BAILEY, A., SURRIDGE, B. AND STOATE, C., 2012. Evaluation of field wetlands for mitigation of diffuse pollution from agriculture: Sediment retention, cost and effectiveness. Environmental Science and Policy, 24, 110-119.
Working with Natural Processes – Evidence Directory 271
O’CONNELL, E., EWEN, J., O’DONNELL, G. AND QUINN, P., 2007. Is there a link between land-use management and flooding? Hydrology and Earth Systems Sciences,
O’CONNELL, J., 2008. Modelling the effects of floodplain woodland in flood mitigation. A short-term case study. Irish Forestry, 65 (1-2), 17-36.
O’CONNELL, P.E., BEVEN, K.J., CARNEY, J.N., CLEMENTS, R.O., EWEN, J., FOWLER, H., HARRIS, G.L., HOLLIS, J., MORRIS, J., O’DONNELL, G.M., PACKMAN, J.C., PARKIN, A., QUINN, P.F., ROSE, S.C., SHEPHERD, M. AND TELLIER, S., 2004. Review of impacts of rural land use and management on flood generation. Impact study report. R&D Technical Report FD2114/TR. London: Department of Environment, Food and Rural Affairs.
O’CONNOR, K. 1956. The influence of wheel and foot treading on soils under grasslands. Proceedings of the New Zealand Society of Soil Science, 2, 35-37.
ODONI, N.A. AND LANE, S.N. 2010. Assessment of the impact of upstream land management measures on flood flows in Pickering using OVERFLOW. Contract report to Forest Research for the Slowing the Flow at Pickering project. Durham: Durham University.
ODUM, E.P., 1971. Fundamentals of Ecology, 3rd edition. Philadelphia: Saunders College Publications.
OGAWA, H. and MALE, J.W., 1986. Simulating the flood mitigation role of wetlands. Journal of Water Resources Planning and Management, 112 (1), 114-128.
OLIVER, D.M., HEATHWAITE, A.L., HAYGARTH, P.M. AND CLEGG, C.D., 2005. Transfer of Escherischia coli to water from drained and undrained grassland after grazing. Journal of Environmental Quality, 34 (3), 918-925.
OLD, G.H., NADEN, P.S., RAMESHWARAN, R., ACREMAN, M.C., BAKER, S., EDWARDS, F., SORENSEN, J., MOUNTFORD, O., GOODDY, G., STRATFORD, C.J., SCARLETT, P.M., NEWMAN, J.R. AND NEAL, M., 2014. Instream and riparian implications of weed cutting in a chalk river. Ecological Engineering, 71, 290-300.
O’NEAL, B.J., HESKE, E.J. AND STAFFORD, J.D., 2008. Waterbird response to wetlands restored through the conservation reserve enhancement program. Journal of Wildlife Management, 72 (3), 654-664.
ONS, 2015. Natural capital accounting 2020 roadmap. Interim review and forward look. London: Office for National Statistics.
OWEN, G.J., PERKS, M.T., BENSKIN, C.M.H., WILKINSON, M.E., JONCZYK, J. AND QUINN, P.F., 2012. Monitoring agricultural diffuse pollution through a dense monitoring network in the River Eden Demonstration Test Catchment, Cumbria, UK. Area, 44 (4), 443-453.
PAINE, L.K. AND RIBIC, C.A., 2002. Comparison of riparian plant communities under four land management systems in southwestern Wisconsin. Agriculture, Ecosystems and Environment, 92 (1), 93-105.
PALMER, M., 2012. Agricultural fine sediment: sources, pathways and mitigation. PhD thesis, Newcastle University.
PALMER, M.A., LETTENMAIER, D.P., POFF, N.L., POSTEL, S.L., RICHTER, B. AND WARNER, R., 2009. Climate change and river ecosystems: protection and adaptation options. Environmental Management, 44 (6), 1053-1068.
Working with Natural Processes – Evidence Directory 272
PALMER, R.C., 2011. Assessment of effectiveness of attempts to improve soil structure in three East Devon catchments in 2009-11. Unpublished report to the Environment Agency.
PALMER, R.C. AND SMITH, R.P., 2013. Soil structural degradation in SW England and its impact on surface-water runoff generation. Soil Use and Management, 29, 567-575.
PARK, J. S., 2006. Whole catchment modelling project. Unpublished, technical report to the Environment Agency, Ref. PCP/PCM/WEMRC.
PARK, R., 2013. Challenges in Wales. Presentation to ABPmer Habitat Creation Conference (London, 2013).
PARK, J.S., REN, Q., CHEN, Y., CLUCKIE, I.D., BUTTS, M. AND GRAHAM, D., 2009. Effectiveness of complex physics and DTM based distributed models for flood risk management of the River Tone, UK. IAHS Publ. no. 331, 114–121. (ISBN: 978-1-907161-02-5).
PARROTT, J. AND MACKENZIE, N., 2000. Restoring and managing riparian woodlands. Aberfeldy, Perthshire: Scottish Native Woods.
PATTISON, I. AND LANE, S.N., 2012. The link between land-use management and fluvial flood risk: A chaotic conception? Progress in Physical Geography, 36 (1), 72-92.
PATTO, P.M., CLEMENT, C.R. AND FORBES, T.J., 1978. Grassland poaching in England and Wales. Maidenhead: Grassland Research Institute.
PEACH, W.J., DODD, S., WESTBURY, D.B., MORTIMER, S.R., LEWIS, P., BROOK, A.J., HARRIS, S.J., KESSOCK-PHILIP, R., BUCKINGHAM, D.L. AND CHANEY, K., 2011. Cereal-based wholecrop silages: a potential conservation measure for farmland birds in pastoral landscapes. Biological Conservation, 144 (2), 836-850.
PEDERSEN, T., BAATTRUP-PEDERSEN, A. AND MADSEN, T., 2006. Effects of stream restoration and management on plant communities in lowland streams. Freshwater Biology, 51 (1), 161-179.
PENDLE, M., 2013. Estuarine and coastal managed realignment sites in England. A compariuson of predictions with monitoring results for selected case studies. Wallingford: HR Wallingford.
PEPER, P.J., MCPHERSON, E.G., SIMPSON, J.R., GARDNER, S.L., VARGAS, K.E. AND XIAO, Q., 20007. New York City, New York municipal forest resource analysis. Technical report to Forestry and Horticulture Department of Parks and Recreation New York City. Davis, CA: Center for Urban Forest Research, US Department of Agriculture.
PETER, S., RECHSTEINER, R., LEHMANN, M.F., BRANKATSCHK, R., VOGT, T., DIEM, S., WEHRLI, B., TOCKNER, K. AND DURISCH-KAISER, E., 2012. Nitrate removal in a restored riparian groundwater system: functioning and importance of individual riparian zones. Biogeosciences, 9, 4295-4307.
PETHICK, J.S., 1981. Long-term accretion rates on tidal salt marshes. Journal of Sedimentary Petrology, 51 (2), 571–577.
PIÉGAY, H. AND BRAVARD J.P., 1996. Response of a Mediterranean riparian forest to a 1 in 400 year flood, Ouveze River, Drome-Vaucluse, France. Earth Surface Processes and Landforms, 22 (1), 31-43.
PIERZYNSKI, G.M., SIMS, J.T. AND VANCE, G.F., 2000. Soil and Environmental Quality, 2nd edition. Boca Raton, FL: CRC Press.
Working with Natural Processes – Evidence Directory 273
PILKINGTON, M., WALKER, J., MASKILL, R., ALLOTT, T. AND EVANS, M., 2015. Restoration of blanket bogs; flood risk reduction and other ecosystem benefits. Final report of the Making Space for Water project. Edale, Derbyshire: Moors for the Future Partnership. Available from: http://www.moorsforthefuture.org.uk/sites/default/files/Summary.a.pdf [Accessed 11 August 2017].
PITT, M., 2008. The Pitt Review: lessons learned from the 2007 floods. London: Cabinet Office.
PLANCHON, O., ESTEVES, M., SILVERA, N. AND LAPETITE, J.M., 2001. Microrelief induced by tillage: measurement and modeling of surface storage capacity. Catena, 46 (2-3), 141-157.
PONTEE, N.I., 2007. Managed realignment in low lying coastal areas: experiences from the UK. Proceedings of the Institution of Civil Engineers - Maritime Engineering, 160 (4), 155-166.
PONTEE, N., 2013. Defining coastal squeeze: a discussion. Ocean and Coastal Management, 84, 204-207.
PONTEE, N.I., 2015. Impact of managed realignment design on estuarine water levels. Proceedings of the Institution of Civil Engineers - Maritime Engineering, 168 (2), 48-61.
PONTEE, N., 2017. Dispelling the myths surrounding coastal squeeze. Presentation to Flood and Coast 2017 conference (Telford, 2017).
PONTEE N.I. AND PARSONS, A., 2010. A review of coastal risk management in the UK. Proceedings of the Institution of Civil Engineers - Maritime Engineering, 163 (1), 31-42.
PONTEE, N.I. AND PARSONS, A., 2012. Adaptation as part of sustainable shoreline management in England and Wales. Proceedings of the Institution of Civil Engineers - Maritime Engineering, 165 (3), 113-130.
PONTEE, N.I., NARAYAN, S., BECK, M., HOSKING A.H., 2016. Building with nature: lessons from around the world. Maritime Engineering Journal, 169 (1), 29-36.
POOLE, G.C. AND BERMAN, C.H., 2001. An ecological perspective on in-stream temperature: natural heat dynamics and mechanisms of human-caused thermal degradation. Environmental Management, 27 (6), 787-802.
PRETTY, J. AND DOBSON, M., 2004. The response of macroinvertebrates to artificially enhanced detritus levels in plantation streams. Hydrology and Earth System Sciences, 8 (3), 550-559.
PUTTOCK, A. AND BRAZIER, R., 2014. Culm grasslands proof of concept phase 1: developing an understanding of the hydrology, water quality and soil resources of unimproved grasslands. Exeter: Devon Wildlife Trust.
PUTTOCK, A., GRAHAM, H.A., CUNLIFFE, A.M., ELLIOTT, M. AND BRAZIER, R.E., 2017. Eurasian beaver activity increases water storage, attenuates flow and mitigates diffuse pollution from intensively-managed grasslands. Science of the Total Environment, 576, 430-443.
PYE, K. AND FRENCH, P.W., 1992. Targets for coastal habitat re-creation. English Nature Science Report No. 13. Peterborough: English Nature.
PYE, K. AND BLOTT, S.J., 2012. A geomorphological survey of Welsh dune systems to determine best methods of dune rejuvenation. CCW Science Report No. 1002. Bangor: Countryside Council for Wales.

Working with Natural Processes – Evidence Directory 274
Pye, K. AND BLOTT, S.J., 2017. Evolution of a sediment-starved, over-stabilised dunefield: Kenfig Burrows, South Wales, UK. Journal of Coastal Conservation in press.
PYE, K., SAYE, S. AND BLOTT, S., 2007. Sand dune processes and management for flood and coastal defence, Part 4: Techniques for sand dune management. Defra/Environment Agency R&D Technical Report FD1302/TR. London: Department for Environment, Food and Rural Affairs.
QUICK, T., REED, M., SMYTH, M., BIRNIE, R., BAIN, C., ROWCROFT, P. AND WHITE, A., 2013. Developing place-based approaches for payments for ecosystem services. London: URS.
QUINE, C., 2011. Woodlands. In UK National Ecosystem Assessment: Technical Report, Chapter 8, pp. 241-294. Cambridge: UN Environment Programme – World Conservation Monitoring Centre.
QUINN, P.F., HEWETT, C.J.M., JONCZYK, J. AND GLENIS, V.A., 2007a. The PROACTIVE approach to Farm Integrated Runoff Management (FIRM) plans: flood storage on farms. Newcastle upon Tyne: Newcastle University. Available from: https://research.ncl.ac.uk/proactive/ms4w/PROACTIVEReportPQ.pdf [Accessed 11 August 2017].
QUINN, P., JONCZYK, J., RIMMER, F. AND HEWETT, C., 2007b. ‘Store, slow and filter’. The PROACTIVE approach to Farm Integrated Runoff Management (FIRM) plans with respect to nutrients. Newcastle upon Tyne: Newcastle University. Available from: https://research.ncl.ac.uk/proactive/ms4w/Proactivenutrients.pdf [Accessed 11 August 2017].
QUINN, P., BURKE, S., JONCZYK, J., HEWITT, C., WILKINSON, M. and RIMMER, D., 2008. Flood storage and attenuation on farms. Making Space for Water (MS4W): Nafferton Farm water quantity study. Newcastle upon Tyne: Newcastle University. Available from: http://research.ncl.ac.uk/proactive/ms4w/firmflood%20leaflet.pdf [Accessed 11 August 2017].
QUINN, P., O’DONNELL, G., NICHOLSON, A., WILKINSON, M., OWEN, G., JONCZYK, J., BARBER, N., HARDWICK N. AND DAVIES, G., 2013. Potential use of runoff attenuation features in small rural catchments for flood mitigation: evidence from Belford, Powburn and Hepscott. Joint Newcastle University, Royal Haskoning and Environment Agency report. Available from: https://research.ncl.ac.uk/proactive/belford/newcastlenfmrafreport/reportpdf/June%20NFM%20RAF%20Report.pdf [Accessed 11 August 2017].
RANZI, R., BOCHICCHIO, M. AND BACCHI, B., 2002. Effects on floods of recent afforestation and urbanisation in the Mella River (Italian Alps). Hydrology and Earth System Sciences Discussions, 6 (2), 239-254.
RAVEN, E.K., LANE, S.N., FERGUSON, R.I. AND BRACKEN, L.J., 2009. The spatial and temporal patterns of aggradation in a temperate, upland, gravel‐bed river. Earth Surface Processes and Landforms, 34 (9), 1181-1197.
REED, D.J., SPENCER, T., MURRAY, A., FRENCH, J.R. AND LEONARD, L., 1999. Marsh surface sediment deposition and the role of tidal creeks: implications for created and managed coastal marshes. Journal of Coastal Conservation, 5 (1), 81-90.
REES, S., ANGUS, S., RHIND, P. AND DOODY, J.P., 2010. Coastal margin habitats. In MCCIP Annual Report Card Science Review 2010-11. Lowestoft: Marine Climate Change Impacts Partnership. Available from: http://www.mccip.org.uk/media/1323/mccip201011_coastalhabitats.pdf [Accessed 11 August 2017].
Working with Natural Processes – Evidence Directory 275
RESEARCH BOX, 2009. Capturing the ‘cultural services’ and ‘experiential qualities’ of landscape. Natural England Commissioned Report 24. Bristol: Natural England.
RICHARDS, C., 2004. Grouse shooting and its landscape: the management of grouse moors in Britain. Anthropology Today, 20 (4), 10-15.
RIPPY, M.A., FRANKS, P.J.S., FEDDERSEN, F., GUZA, R.T. AND WARRICK, J.A., 2013. Beach nourishment impacts on bacteriological water quality and phytoplankton bloom dynamics. Environmental and Science Technology, 47 (12), 6146-6154.
RITZEMA, H.P. (ED.), 1994. Drainage principles and applications. ILRI Publication 16. Wageningen, The Netherlands: International Institute for Land Reclamation and Improvement.
ROBERTS, J.M., ROSIER, P.T.W. AND SMITH, D.M., 2001. Effects of afforestation on chalk groundwater resources. Centre for Ecology and Hydrology report to Defra. Wallingford: Centre for Ecology and Hydrology.
ROBINSON, M., MOORE, R.E., NISBET, T.R. AND BLACKIE, J.R., 1998. From moorland to forest: the Coalburn catchment experiment. Institute of Hydrology Report No. 133. Wallingford: Centre for Ecology and Hydrology.
ROBINSON, M., COGNARD-PLANCQ, A,-L., COSANDEY, C., DAVID, J., DURAND, P., FÜHRER, H,-W., HALL, R., HENDRIQUES, M.O., MARC, V., MCCARTHY, R., MCDONNELL, M., MARTIN, C., NISBET, T., O’DEA, P., RODGERS, M. AND ZOLLNER, A., 2003. Studies of the impact of forests on peak flows and baseflows: a European perspective. Forest Ecology and Management, 186 (1), 85-97.
ROGGER, M., AGNOLETTI, M., ALAOUI, A., BATHURST, J.C., BODNER, G., BORGA, M., CHAPLOT, V., GALLART, F., GLATZEL, G., HALL, J., HOLDEN, J., HOLOI, L., HORN, R., KISS, A., KOHNOVA, S., LEITINGER, G., LENMARTZ, B., PARAJKA, J., PERDIGAO, R., PETH, S., PLAVCOVA, L., QUINTON, QUINTON, J.N., ROBINSON, M., SALINAS, J.L., SANTORO, A., SZOLGAY, J., TRON, S., VAN DEN AKKER, J.J.H., CAN DEN, VIGLIONE., A. AND BLÖSCH, G., 2017. Land-use change impacts on flood at the catchment scale: challenges and opportunities for future research. Water Resources Research, DOI: 10.1002/2017WR020723.
ROLLINSON, T.J.D., 2003. Changing needs – changing forests: the UK experience. Presentation to UNFF Intersessional Experts Meeting on the Role of Planted Forests in Sustainable Forest Management (Wellington, New Zealand, 2003).
RONGRONG, W. AND GUISHAN, Y., 2007. Influence of land use/cover change on storm runoff. A case study of Xitiaoxi River Basin in upstream of Taihu Lake watershed. Chinese Geographical Science, 17 (4), 349-356.
RONI, P. and QUINN, T.P., 2001. Effects of wood placement on movements of trout and juvenile coho salmon in natural and artificial stream channels. Transactions of the American Fisheries Society, 130 (4), 675-685.
ROSS, S. AND HAMMOND, G., 2015. United Utilities Sustainable Catchment Management Plan: final report. Buxton: Penny Anderson Associates Limited.
ROYAL HASKONINGDHV, 2015. North Norfolk sandscaping: feasibility study. Report for the Crown Estate. Peterborough: Royal Haskoning DHV UK.
RRC, 2012. Practical River Restoration Appraisal Guidance for Monitoring Options (PRAGMO). Cranfield, Bedfordshire: River Restoration Centre.
RRC, 2016. Manual of river restoration techniques [online]. Cranfield, Bedfordshire: River Restoration Centre. Available from: http://www.therrc.co.uk/manual-river-restoration-techniques [Accessed 11 August 2017].

Working with Natural Processes – Evidence Directory 276
RRC, 2017. Monitoring and evaluating your projects. Factsheet. Cranfield, Bedfordshire: River Restoration Centre. Available from: http://www.therrc.co.uk/sites/default/files/general/Training/esmee/monitoring_and_evaluting_projects_final.pdf [Accessed 30 August 2017].
RUIZ-VILLANUEVA, V., PIÉGAY, H., GURNELL, A.A., MARSTON, R.A. AND STOFFEL, M., 2016. Recent advances quantifying the large wood dynamics in river basins: new methods and remaining challenges. Reviews of Geophysics, 54 (3), 611-652.
RUPP-ARMSTRONG, S. AND NICHOLLS, R.J., 2007. Coastal and estuarine retreat: a comparison of the application of managed realignment in England and Germany. Journal of Coastal Research, 23 (6), 1418-1430.
RYSZKOWSKI, L. AND KĘDZIORA, A., 2007. Modification of water flows and nitrogen fluxes by shelterbelts. Ecological Engineering, 29 (4), 388-400.
SAMARITANI, E., SHRESTHA, J., FOURNIER, B., FROSSARD, E., GILLET, F., GUENAT, C., NIKLAUS, P.A., PASQUALE, N., TOCKNER, K., MITCHELL, E.A.D. AND LUSTER, J., 2011. Heterogeneity of soil carbon pools and fluxes in a channelized and a restored floodplain section (Thur River, Switzerland). Hydrology and Earth System Sciences, 15 (6), 1757-1769.
SAMSOM, A.L., 1999. Upland vegetation management: the impacts of overstocking. Water Science and Technology, 39 (12), 85-92.
SAYER, C.D., ANDREWS, K., SHILLAND, E., EDMONDS, N., EDMONDS-BROWN, R., PATMORE, I.R., EMSON, D. AND AXMACHER, J.A., 2012. The role of pond management for biodiversity conservation in an agricultural landscape. Aquatic Conservation: Marine and Freshwater Ecosystems, 22 (5), 626-638.
SCHAFER, K., 1986. Experiments with catch crops for erosion control in maize production. Wirtschaftseigene Futter, 32, 60-71.
SCHAICH, H., 2009. Local residents' perceptions of floodplain restoration measures in Luxembourg’s Syr Valley. Landscape Urban Planning, 93 (1), 20-30.
SCHOLES, L., SHUTES, R., REVITT, D., PURCHASE, D. AND FORSHAW, M., 1999. The removal of urban pollutants by constructed wetlands during wet weather. Water Science and Technology, 40 (3), 333-340.
SCHWAB, G.O., FANGMEIER, D.D., FREVERT, R.K. AND ELLIOT, W.J., 1993. Soil and Water Conservation Engineering, 4th edition. New York: John Wiley and Sons.
SCOTT, T., MASSELINK, G. AND RUSSELL. P., 2011. Morphodynamic characteristics and classification of beaches in England and Wales. Marine Geology, 286 (1), 1-20.
SEAR, D. AND NEWSON, M., 2004. The hydraulic impact and performance of a lowland rehabilitation scheme based on pool-riffle installation: the River Waveney, Scole, Suffolk, UK. River Research and Applications, 20 (7), 847-863.
SEAR, D.A., NEWSON, M.D. AND BROOKES, A., 1995. Sediment related river maintenance: the role of fluvial geomorphology. Earth Surface Processes & Landforms, 20, 629 - 647. SEAR, D., WILCOCK, D., ROBINSON, M. AND FISHER, K., 2000. River channel modification in the UK. In The Hydrology of the United Kingdom: a study of change (ed. M. Acreman). Oxford: Routledge.
SEAR, D.A., NEWSON, M.D. AND THORNE, C.R., 2003. Guidebook of Applied Fluvial Geomorphology. R&D Technical Report FD1914. London: Department for Environment,
Working with Natural Processes – Evidence Directory 277
Food and Rural Affairs. Available from: http://randd.defra.gov.uk/Default.aspx?Menu=Menu&Module=More&Location=None&ProjectID=10695&FromSearch=Y&Publisher=1&SearchText=FD1914&SortString=ProjectCode&SortOrder=Asc&Paging=10#Description [Accessed 13 February 2018].
SEAR, D., KITTS, D. AND MILLIGAN, C., 2006. New Forest LIFE-III monitoring report: the geomorphic and hydrological response of New Forest streams to river restoration. Southampton: University of Southampton.
SEAR, D.A., HILL, C.T. AND DOWNES, R.H., 2008. Geomorphological assessment of riverine SSSIs for the strategic planning of physical restoration. Natural England Research Report, NER013, 80pp. SEAR, D.A., HILL, C.T, NEWSON, M.D., EMERY, J. AND BRANSON, J., 2009. A method for applying fluvial geomorphology in support of catchment-scale river restoration planning. Aquatic Conservation, 19, 5, 506-519. SEAR, D.A., NEWSON, M.D. AND THORNE, C.R., 2010. Applied Fluvial Geomorphology. Thomas Telford, 249p. SEAR, D.A., MILLINGTON, C.E., KITTS, D.R. AND JEFFRIES, R., 2010. Logjam controls on channel:floodplain interactions in wooded catchments and their role in the formation of multi-channel patterns. Geomorphology, 116 (3-4), 305-319.
SEN, A., DARNELL, A., BATEMAN, I., MUNDAY, P., CROWE, A., BRANDER, L., RAYCHAUDHURI, J., LOVETT, A., PROVINS, A. AND FODEN, J., 2012. Economic assessment of the recreational value of ecosystems in Great Britain. CSERGE Working Paper 2012-01 Norwich: Centre for Social and Economic Research on the Global Environment, University of East Anglia.
SEPA, 2015. Natural Flood Management Handbook. Stirling: Scottish Environment Protection Agency.
SEPA AND FORESTRY COMMISSSION SCOTLAND, 2012. Flood Risk Management (Scotland) Act 2009: methods to screen and quantify natural flood management effects. Stirling: Scottish Environment Protection Agency.
SHEAFFER, J.R., MULLAN, J.D. and HINCH, N.B., 2002. Encouraging wise use of floodplains with market-based incentives. Environment: Science and Policy for Sustainable Development, 44 (1), 32-43.
SHEPARD, C.C., CRAIN, C.M. AND BECK, M.W., 2011. The protective role of coastal marshes: A systematic review and meta-analysis. PLoS One, 6 (11), e27374.
SHEPHERD, D, BURGESS, D., JICKELLS, T., ANDREWS, J., CAVE, R., TURNER, R.K., ALDRIDGE, J., PARKER, E.R. AND YOUNG, E., 2007. Modelling the effects and economics of managed realignment on the cycling and storage of nutrients, carbon and sediments in the Blackwater estuary, UK. Estuarine, Coastal and Shelf Science, 73 (3-4), 355-367.
SHEPHERD, M., LABADZ, J., CAPORN, S., CROWLE, A., GOODISON, R., REBANE, M. AND WATERS, R., 2013. Restoration of blanket bog. Report NEER003. York: Natural England.
SHERMAN, D.J. AND NORDSTROM, K.F., 1994. Hazards of wind-blown sand and coastal sand drifts: a review. Journal of Coastal Research, Special Issue 12, 263-275.
SHI, Z., PETHICK, J.S. AND PYE, K., 1995. Flow structure in and above the various heights of a saltmarsh canopy: a laboratory flume study. Journal of Coastal Research, 11 (4), 1204-1209.
Working with Natural Processes – Evidence Directory 278
SHIELDS, F.D. AND GIPPEL, C.J., 1995. Prediction of effects of woody debris removal on flow resistance. Journal of Hydraulic Engineering, 121 (4), 341-354.
SHIVLANI, M.P., LETSON, D. AND THEIS, M., 2003. Visitor preferences for public beach amenities and beach restoration in South Florida. Coastal Management, 31 (4), 367-385.
SHOLTES, J.S. AND DOYLE, M.W., 2011. Effect of channel restoration on flood wave attenuation. Journal of Hydraulic Engineering, 137 (2), 196-208.
SHRESTHA, J., NIKLAUS, P.A., FROSSARD, E., SAMARITANI, E., HUBER, B., BARNARD, R.L., SCHLEPPI, P., TOCKNER, K. AND LUSTER, J., 2012. Soil nitrogen dynamics in a river floodplain mosaic. Journal of Environmental Quality, 41 (6), 2033-2045.
SILVEIRA, T.M., SANTOS, C.F. AND ANDRADE, F., 2013. Beneficial use of dredged sand for beach nourishment and coastal landform enhancement-the case study of Tria, Portugal. Journal of Coastal Conservation, 17 (3), 825-832.
SKELCHER, G., 2008. Fylde Sand Dunes Management Action Plan. Lytham St Annes, Lancashire: Fylde Borough Council.
SMART, J., AMAR, A., O’BRIEN, M., GRICE, P. AND SMITH, K., 2008. Changing land management of lowland wet grasslands of the UK: impacts on snipe abundance and habitat quality. Animal Conservation, 11 (4), 339-351.
SMITH, K.A., 2012. Evaluation of land management impacts on low flows in northern England. Master’s thesis, Durham University. Available from: http://etheses.dur.ac.uk/3501/ [Accessed 14 August 2017].
SMOLDERS, S., PLANCKE, Y., IDES, S. AND MEIRE, P., 2015. Role of intertidal wetlands for tidal and storm tide attenuation along a confined estuary: a model study. Natural Hazards and Earth System Sciences, 15, 1659-1675.
SMOKOROWSKI, K.E. AND RANDALL, R.G., 2017. Cautions on using the Before-After-Control-Impact design in environmental effects monitoring programs. FACETS, 2, 212-232; DOI: 10.1139/facets-2016-0058.
SNH, 2000. A guide to managing coastal erosion in beach/ dune systemsI [online]. Inverness: Scottish Natural Heritage. Available from: http://www.snh.org.uk/publications/on-line/heritagemanagement/erosion/index.shtml [Accessed 14 August 2017].
SOANE, B.D., BALL, B.C., ARVIDSSON, J., BASCH, G., MORENO, F. AND ROGER-ESTRADE, J., 2012. No-till in northern, western and south-western Europe: a review of problems and opportunities for crop production and the environment. Soil and Tillage Research, 118, 66-87.
SOAR, P.J. and THORNE, C.R. (2001). Channel Restoration Design for Meandering Rivers. ERDC/CHL CR-01-1, U.S. Army Engineer Research and Development Center, Flood Damage Reduction Research Program, Vicksburg, MS.
SOARES, A.L., REGO, F.C., MCPHERSON, E.G., SIMPSON, J.R., PEPER, P.J. AND XIAO, Q., 2011. Benefits and costs of street trees in Lisbon, Portugal. Urban Forestry & Urban Greening, 10 (2), 69-78.
SOLARI, L., VAN OORSCHOT, M., BELLETTI, B., HENDRIKS, D., RINALDI, M. AND VARGAS‐LUNA, A., 2016. Advances on modelling riparian vegetation –hydromorphology interactions. River Research and Applications, 32 (2), 164-178.
Working with Natural Processes – Evidence Directory 279
SOLLOWAY, I., 2012. Effects of tree shelterbelts on the hydrology of upland areas. PhD thesis, Imperial College London.
SOMMA, F. (ED.), 2013. River Basin Network on Water Framework Directive and Agriculture. Practical experiences and knowledge exchange in support of the WFD implementation (2010-2012). Luxembourg: Publications Office of the European Union.
SOUSSANA, J.F., TALLEC, T. AND BLANFORT, V., 2010. Mitigating the greenhouse gas balance of ruminant production systems through carbon sequestration in grasslands. Animal, 4 (3), 334-350.
SPEYBROECK, J., BONTE, D., COURTENS, W., GHESKIERE, T., GROOTAERT, P., MAELFAIT, J.-P., MATHYS, M., PROVOOST, S., SABBE, K., STIENEN, E.W.M., VAN LANCKER, V., VINCX, M. AND DEGRAER, S., 2006. Beach nourishment: an ecologically sound coastal defence alternative? A review. Aquatic Conservation: Marine and Freshwater Ecosystems, 16 (4), 419-435.
SPRAY, C.J. (ED.), 2017. Eddleston Water: Project Report 2016. Melrose, Roxburghshire: Tweed Forum. Available from: http://tweedforum.org/publications/pdf/Eddleston_Report_Jan_2017.pdf [Accessed 14 August 2017].
STAL, L.J. AND DE BROUWER, J.F.C., 2003. Biofilm formation by benthic diatoms and their influence on the stabilization of intertidal mudflats. Berichte – Forschungszentrum Terramare, 12, 109-111.
STARK, J., VAN OYEN, T., MEIRE,P. AND TEMMERMAN, S., 2015. Observations of tidal and storm surge attenuation in a large tidal marsh. Limnology and Oceanography, 60 (4), 1371-1381.
STARK, J., PLANCKE, Y., IDES, S., MEIRE, P. AND TEMMERMAN, S., 2016. Coastal flood protection by a combined nature-based and engineering approach: modeling the effects of marsh geometry and surrounding dikes. Estuarine, Coastal and Shelf Science, 175, 34-45.
STEDNICK, J.D., 1996. Monitoring the effects of timber harvest on annual water yield. Journal of Hydrology, 176 (1-4), 79-95.
STEEL, T.J. AND PYE, K., 1997. The development of salt marsh tidal creek networks: evidence from the UK. In Proceedings of Canadian Coastal Conference (Guelph, Ontario, 1997), Vol. 1, pp. 267-280. Ottawa: Canadian Coastal Science and Engineering Association.
STEWART, H., OWEN, S., DONOVAN, R., MACKENSIE, R., HEWITT, N., SKILBA, U. AND FOWLAR, D., 2003. Trees and sustainable urban air quality. Using trees to improve air quality in cities. Lancaster: Lancaster University.
STRUDLEY, M.W., GREEN, T.R. AND ASCOUGH, J.C., 2008. Tillage effects on soil hydraulic properties in space and time: state of the science. Soil and Tillage Research, 99 (1), 4-48.
SURIAN, N., ZILIANI, L., COMITI, F., LENZI, M.A. AND MAO, L., 2009. Channel
adjustments and alteration of sediment fluxes in gravel‐bed rivers of north‐eastern Italy: potentials and limitations for channel recovery. River Research and Applications, 25 (5), 551-567.
SURRIDGE, B.W.J., HEATHWAITE, A.L. AND BAIRD, A.J., 2012. Phosphorus mobilisation and transport within a long-restored floodplain wetland. Ecological Engineering, 44, 348-359.
Working with Natural Processes – Evidence Directory 280
SUTHERLAND, J., BRAMPTON A.H., OBHRAI, C., DUNN, S. AND WHITEHOUSE R.J.S., 2007. Understanding the lowering of beaches in front of coastal defence structures, stage 2. R&D Technical Report FD1927/TR. London: Department for Environment, Food and Rural Affairs.
SUTTON, M.A., FOWLER, D. AND MONCRIEFF, J.B., 1993. The exchange of atmospheric ammonia with vegetated surfaces. 1. Unfertilized vegetation. Quarterly Journal of the Royal Meteorological Society, 119 (513), 1023-1045.
TEKLEHAIMANOT, Z., JARVIS, P.G. AND LEDGER, D.C., 1991. Rainfall interception and boundary layer conductance in relation to tree spacing. Journal of Hydrology, 123 (3-4), 261-278.
THE RIVERS TRUST, 2013. River Improvement Fund – Phase 1, 2 and 3. Economic evaluation summary of main findings. Callington, Cornwall: The Rivers Trust
THE RIVERS TRUST, 2014. Managing ditches – practical examples. PINPOINT Best Practice Information Sheet. Soil Management Sheet 21.0b. Callington, Cornwall: The Rivers Trust. Available from: http://www.theriverstrust.org/media/2017/04/Pinpoint-21.0-Soil-Management-Managing-ditches.pdf [Accessed 7 July 2017].
THOMAS, H. AND NISBET, T.R., 2006. An assessment of the impact of floodplain woodland on flood flows. Water and Environment Journal, 21 (2), 114-126.
THOMAS, H. AND NISBET, T., 2012. Modelling the hydraulic impact of reintroducing large woody debris into watercourses. Journal of Flood Risk Management, 5 (2), 164-174.
THOMAS, H. AND NISBET, T.R., 2016. Slowing the Flow at Pickering: quantifying the effect of catchment woodland planting on flooding using the Soil Conservation Service Curve Number method. International Journal of Safety and Security Engineering, 6 (3), 466-474.
THORNE, C.R., LAWSON, E.C., OZAWA, C., HAMLIN, S.L. AND SMITH, S.A., 2015. Overcoming uncertainty and barriers to adoption of Blue-Green Infrastructure for urban flood risk management. Journal of Flood Risk Management, DOI: 10.1111/jfr3.12218.
TINCH, R. AND LEDOUX, L., 2006. Economics of managed realignment in the UK. Final report to the Coastal Futures Project. Report prepared by Environmental Futures Ltd report to the RSPB.
TINCH, R., TINCH, D. AND PROVINS, A., 2009. Economic valuation of uplands ecosystem services. Natural England Commissioned Report NECR029. Bristol: Natural England.
TINCH, R., DUTTON, A. AND MATHIEU, L., 2012. Valuing ecosystem services: case studies from lowland England. Annex 2 – Reconnecting the Broads and Fens: Norfolk. York: Natural England.
TOCKNER, K. AND STANFORD, J.A. 2002. Riverine flood plains: present state and future trends. Environmental Conservation, 29 (3), 308-330.
TOMER, M.D., MOORMAN, T.B., KOVAR, J.L., JAMES, D.E. AND BURKART, M.R., 2007. Spatial patterns of sediment and phosphorus in a riparian buffer in western Iowa. Journal of Soil Water Conservation, 62 (5), 329-338.
TOWNEND, I. AND PETHICK, J., 2002. Estuarine flooding and managed retreat. Philosophical Transactions of the Royal Society A: Mathematical, Physical and Engineering Sciences, 360 (1796), 1477-1495.
Working with Natural Processes – Evidence Directory 281
TSOAR, H., 2005. Sand dunes mobility and stability in relation to climate. Physica A: Statistical Mechanics and its Applications, 357 (1), 50-56.
TYRVÄINEN, L., 1997. The amenity value of the urban forest: an application of the hedonic pricing method. Landscape and Urban Planning, 37 (3-4), 211-222.
UCAR, T. AND HALL, F.R., 2001. Windbreaks as a pesticide drift mitigation strategy: a review. Pest Management Science, 57 (8), 663-675.
UDZIELA, M.K. AND BENNETT, L.L., 1997. Contingent valuation of an urban salt marsh restoration. In Restoration of an Urban Salt Marsh: An Interdisciplinary Approach, Bulletin No. 100 (ed. A. Casagrande), pp. 41-61. New Haven, CT: Yale School of Forestry and Environmental Studies.
ULEN, B. AND MATTSSON, L., 2003. Transport of phosphorus forms and of nitrate through a clay soil under grass and cereal production. Nutrient Cycling in Agroecosystems, 65 (2), 129-140.
UK NATIONAL ECOSYSTEM SERVICES ASSESSMENT, 2014. The UK National Ecosystem Assessment: synthesis of the key findings. Cambridge: UN Environment Programme World Conservation Monitoring Centre.
VALVERDE, R.S., 2013. Roughness and geometry effects of engineered log jams on 1-D flow characteristics. Master’s thesis, Oregon State University.
VAN DE NOORT, R., FLETCHER, W. THOMAS, G., CARSTAIRS, I. AND PATRICK, D., 2002. Monuments at risk in England’s wetlands. Report for English Heritage. Exeter: Exeter University. Available from: http://projects.exeter.ac.uk/marew/finalreport.pdf [Accessed 14 August 2017].
VAN DEN POL-VAN DASSELAAR, A., VAN BEUSICHEM, M. AND OENEMA, O., 1999. Determinants of spatial variability of methane emissions from wet grasslands on peat soil. Biogeochemistry, 44 (2), 221-237.
VAN DER MEULEN, F., BAKKER, T.W.M. AND HOUSTON, J.A., 2004. The costs of our coasts: examples of dynamic dune management from western Europe. In Coastal Dunes – Ecology and Conservation (ed. M.L. Martinez and N.P. Psuty), pp. 259-277. Berlin: Springer-Verlag.
VAN DER WAL, R., 2011.) Mountains, moorlands and heaths. In UK National Ecosystem Assessment: Technical Report, Chapter 5, pp. 105-160. Cambridge: UN Environment Programme – World Conservation Monitoring Centre.
VÁSQUEZ-MÉNDEZ, R., VENTURA-RAMOS, E., OLESCHKO, K., HERNÁNDEZ-SANDOVAL, L., PARROT, J.F. AND NEARING, M.A., 2010. Soil erosion and runoff in different vegetation patches from semiarid Central Mexico. Catena, 80 (3), 162-169.
VERBERK, W.C.E.P., LEUVEN, R.S.E.W., VAN DUINEN, G.A. AND ESSELINK, H., 2010. Loss of environmental heterogeneity and aquatic macroinvertebrate diversity following large-scale restoration management. Basic and Applied Ecology, 11 (5), 440-449.
VERSTRAETEN, G. AND POESEN, J., 1999. The nature of small-scale flooding, muddy floods and retention pond sedimentation in central Belgium. Geomorphology, 29 (3), 275-292.
VERSTRAETEN, G. AND POESEN, J., 2000. Estimating trap efficiency of small reservoirs and ponds: methods and implications for the assessment of sediment yield. Progress in Physical Geography, 24 (2), 219-251.
Working with Natural Processes – Evidence Directory 282
VERTESSY, R.A., WATSON, F.G.R. AND O’SULLIVAN, S.K., 2001. Factors determining relations between stand age and catchment water balance in mountain ash forests. Forest Ecology and Management, 143 (1-3), 13-26.
VIDAL, R. AND VAN OORD, G., 2010. Environmental impacts in beach nourishment: a comparison of options. Terra et Aqua, 119, 14-20.
VOUGHT, L.B.M., PINAY, G., FUGLSANG, A. AND RUFFINONI, C., 1995. Structure and function of buffer strips from a water quality perspective in agricultural landscapes. Landscape and Urban Planning, 31 (1-3), 323-331.
WADDINGTON, E., 2016. Public use and perception of managed realignment sites on the Severn Estuary – 2016: a pilot study into the public use and perception of the Steart managed realignment site. A report produced as part of the Marine Renewable Energy Exchange Programmes.
WAHREN, A., SCHWÄRZEL, K. AND FEGER K.‐H., 2012. Potentials and limitations of natural flood retention by forested land in headwater catchments: evidence from experimental and model studies. Journal of Flood Risk Management, 5 (4), 321-335.
WALLAGE, Z.E. AND HOLDEN, J., 2010. Spatial and temporal variability in the relationship between water colour and dissolved organic carbon in blanket peat pore waters. Science of the Total Environment, 408 (24), 6235-6242.
WALLING, D.E., COLLINS, A.L. AND MCMELLIN, G.K., 2003. A reconnaissance survey of the source of interstitial fine sediment recovered from salmonid spawning gravels in England and Wales. Hydrobiologia, 497 (1-3), 91-108.
WALTON, R., CHAPMAN, R.S. AND DAVIS, J.E. 1996. Development and application of the wetlands Dynamic Water Budget Model. Wetlands, 16 (3), 347-357.
WARREN, S.D., NEVILL, M.B., BLACKBURN, W.H. AND GARZA, N.E. 1986. Soil response to trampling under intensive rotation grazing. Soil Science Society of America Journal, 50 (5), 1336-1341.
WENZEL, R., REINHARDT-IMJELA, C., SCHULTE, A. AND BOLSCHER, J., 2014. The potential of in-channel large woody debris in transforming discharge hydrographs in headwater areas (Ore Mountains, Southeastern Germany). Ecological Engineering, 71, 1-9.
WESTCOUNTRY RIVERS TRUST, 2016. Local action toolkit. Ecosystem services in urban water environments. Callington, Cornwall: Devon: WestCountry Rivers Trust. Available from: http://urbanwater-eco.services/resources/LAT_Urban_Toolbox_Defra_WRT.pdf [Accessed 14 August 2017].
WG POM, 2014. EU policy document on Natural Water Retention Measures. Technical Report-2014-082. Prepared by the drafting team of the Water Framework Directive Common Implementation Strategy Working Group Prorgamme of Measures (WG PoM). Luxembourg: Office for Official Publications of the European Communities.
WHARTON, G. AND GILVEAR, D., 2007. River restoration in the UK: meeting the dual needs of the European Union Water Framework Directive and flood defence? International Journal of River Basin Management, 5 (2), 143-154.
WHEATER, H.S., 2002. Progress in and prospects for fluvial flood modelling. Philosophical Transactions of the Royal Society of London A, 360 (1796), 1409-1431.
WHEATER, H. AND EVANS, E., 2009. Land use, water management and future flood risk. Land Use Policy, 26(Suppl. 1), S251-S264.

Working with Natural Processes – Evidence Directory 283
WHEATER, H., REYNOLDS, B., MCINTYRE, N., MARSHALL, M., JACKSON, B., FROGBROOK, Z., SOLLOWAY, I., FRANCIS, O. AND CHELL, J., 2008. Impacts of upland land management on flood risk: multi-scale modeling methodology and results from the Pontbren experiment. FRMRC Research Report UR16. Manchester: Flood Risk Management Research Consortium.
WHITFIELD, C.J., BAULCH, H.M., CHUN, K.P. AND WESTBROOK, C.J., 2015. Beaver-mediated methane emission: the effects of population growth in Eurasia and the Americas. Ambio, 44 (1), 7-15.
WHITTAKER, P., WILSON, C., ABERLE, J., RAUCH, H.-P. AND XAVIER, P., 2013. A drag force model to incorporate the reconfiguration of full-scale riparian trees under hydrodynamic loading. Journal of Hydraulic Research, 51 (5), 569-580.
WHITWORTH, G.A., 2011. Flood exceedance attenuation: a rural solution. MSc thesis, Aberystwyth University.
WILKINSON, M.E. AND QUINN, P.F., 2010. Belford catchment proactive flood solutions: a toolkit for managing runoff in the rural landscape. Edinburgh, Proceedings of the SAC and SEPA Biennial Conference. In Climate, Water and Soil: Science, Policy and Practice, Proceedings of the SAC and SEPA Biennial Conference (Edinburgh, 2010) edited by K. Crighton and R. Audsley, pp 103-110. Edinburgh: Scottish Agricultural College.
WILKINSON, M.E., QUINN, P.F., BENSON, I. AND WELTON, P., 2010a. Runoff management: mitigation measures for disconnecting flow pathways in the Belford Burn catchment to reduce flood risk. In Managing Consequence of Changing Global Environment, Proceedings of the British Hydrological Society 3rd International Conference (Newcastle upon Tyne, 2010).
WILKINSON, M.E., QUINN, P.F. AND WELTON, P., 2010b. Runoff management during the September 2008 floods in the Belford catchment, Northumberland. Journal of Flood Risk Management, 3 (4), 285-295.
WILKINSON, M.E., HOLSTEAD, K. AND HASTINGS, E., 2013. Natural Flood Management in the context of UK reservoir legislation. Aberdeen: Centre of Expertise for Waters (CREW).
WILKINSON, M.E., QUINN, P.F., BARBER, N.J. AND JONCZYK, J., 2014. A framework for managing runoff and pollution in the rural landscape using a catchment systems engineering approach. Science of the Total Environment, 468, 1245-1254.
WILKINSON, M.E., MACKAY, E., QUINN, P.F., STUTTER, M.I., BEVEN, K.J., MACLEOD, C.J.A., MACKLIN, M.G., ELKHATIB, Y., PERCY, B., VITOLO, C. AND HAYGARTH, P.M., 2015. A cloud based tool for knowledge exchange on local scale flood risk. Journal of Environmental Management, 161, 38-50.
WILKINSON, S.B., ZHENG, W. AND ALLEN, J.R., 1996. Water quality improvements in Liverpool docks: the role of filter feeders in algal and nutrient dynamics. Marine Ecology, 17 (1-3), 197–211
WILLIAMS, A.T., GIARDINO A. AND PRANZINI, E., 2016. Canons of coastal engineering in the United Kingdom: seawalls/groynes, a century of change? Journal of Coastal Research, 32 (5), 1196-1211.
WILLIAMS, L., HARRISON, S. AND O’HAGAN, A.M., 2012. The use of wetlands for flood attenuation. Final report. Cork, Ireland: Aquatic Services Unit, University College Cork.
WILLIAMS, R., 2005. Beach recharge in Sussex and East Kent: a preliminary inventory and overview. Science report. Beaches at Risk Phase 1, February 2003 – January
Working with Natural Processes – Evidence Directory 284
2005. Brighton: University of Sussex. Available from: http://www.sussex.ac.uk/geography/researchprojects/BAR/publish/Phase-1-final-Beach%20recharge.pdf ]Accessed 14 August 2017].
WILLIAMS, R.D., 2012. DEMs of difference. In Geomorphological Techniques, online edition (ed. S.J. Cook, L.E. Clarke and J.M. Nield), Section 2.3.2. London: British Society for Geomorphology. Available from: http://geomorphology.org.uk/geomorph_techniques [Accessed 14 August 2017].
WILLIS, K. AND GARROD, G., 1993. Valuing landscapes: a contingent valuation approach. Journal of Environmental Management, 37 (1), 1-22.
WILLIS, K.G., GARROD, G., SCARPA, R., POWE, N., LOVETT, A., BATEMAN, I.J., HANLEY, N. AND MACMILLAN, D.C., 2003. The social and environmental benefits of forests in Great Britain. Edinburgh: Forestry Commission.
WILSON, A.M., MOORE, W.S., JOYE, S.B. ANDERSON, J.L. AND SCHUTTE, C.A., 2011. Storm-driven groundwater flow in a salt marsh. Water Resources Research, 47 (2), 1944-1973.
WILSON, L., WILSON, J., HOLDEN, J., JOHNSTONE, I., ARMSTRONG, A. AND MORRIS, M., 2010. Recovery of water tables in Welsh blanket bog after drain blocking: discharge rates, time scales and the influence of local conditions. Journal of Hydrology, 391 (3-4), 377-386.
WITHERS, P.J.A., HODGKINSON, R.A., BATES, A. AND WITHERS, C.M., 2006. Some effects of tramlines on surface runoff, sediment and phosphorus mobilization on an erosion‐prone soil. Soil Use and Management, 22 (3), 245-255.
WOLTEMADE, C.J. AND WOODWARD, J., 2008. Nitrate removal in a restored spring-fed wetland, Pennsylvania, USA. Journal of the American Water Resources Association, 44 (1), 222-234.
WOODWARD, R.T. AND WUI, Y.S., 2001. The economic value of wetland services: a meta-analysis. Ecological Economics, 37 (2), 257-270.
WOOLLEY, H., ROSE, S. AND FREEDMAN, J., 2004. The value of public space: how high quality parks and public spaces create economic, social and environmental value. London: CABE Space.
WORRALL, F. AND EVANS, M., 2007. Peak District moorland: carbon flux. Moors for the Future Research Note No 12. Edale, Derbyshire: Moors for the Future Partnership.
WORRALL, F., ARMSTRONG, A. AND HOLDEN, J., 2007. Short-term impact of peat drain-blocking on water colour, dissolved organic carbon concentration and water table depth. Journal of Hydrology, 337 (3-4), 315-325.
WRIGHT, S., 2016. Trialling in-ditch sediment traps to help limit agricultural runoff to rivers. In Proceedings of South Downs Research Conference 2016, pp.13-14. Available from: http://eprints.brighton.ac.uk/16237/1/what%20community%20stories.pdf [Accessed 10 July 2017].
XAVIER, P., 2010. Floodplain woodland hydrodynamics. PhD thesis, Hydroenvironmental Research Centre, Cardiff University.
YSEBAERT, T, YANG, S-L., ZHANG, L., HE, Q., BOUMA, T.J., HERMAN, P.M.J., 2011. Wave attenuation by two contrasting ecosystem engineering salt marsh macrophytes in the intertidal pioneer zone. Wetlands, 31 (6), 1043-1054.

Working with Natural Processes – Evidence Directory 285
ZEHETNER, F., LAIR, G.J. AND GERZABEK, M.H., 2009. Rapid carbon accretion and organic matter pool stabilization in riverine floodplain soils. Global Biogeochemical Cycles, 23, GB4004; DOI: 10.1029/2009GB00348
ZELL, C., KELLNER, E. AND HUBBART, J.A., 2015. Forested and agricultural land use impacts on subsurface floodplain storage capacity using coupled vadose zone-saturated zone modeling. Environmental Earth Sciences, 74 (10), 7215-7228.
ZHANG, G.H., SHEN, R.C., LUO, R.T., CAO, Y. AND ZHANG, X.C., 2010. Effects of sediment load on hydraulics of overland flow on steep slopes. Earth Surface Processes and Landforms, 35 (15), 1811-1819.
ZHANG, M., WEI, X., SUN, P. AND LIU, S., 2012. The effect of forest harvesting and climatic variability on runoff in a large watershed: the case study in the Upper Minjiang River of Yangtze River basin. Journal of Hydrology, 464-465, 1-11.
ZHAO, Y., 2009. Livestock impacts on hydrological connectivity. PhD thesis, University of Leeds.
ZHENG, Z.C., HE, S.Q. AND WU, F.Q., 2012. Relationship between soil surface roughness and hydraulic roughness coefficient on sloping farmland. Water Science and Engineering, 5 (2), 191-201.
Working with Natural Processes – Evidence Directory 286
Bibliography
Chapter 1
CLARK, A. 2017. High water common ground [online]. Top of the tree film productions. Available from: http://www.highwaterfilm.co.uk/common-ground/ [Accessed 6 October 2017].
DEFRA AND ENVIRONMENT AGENCY, 2014. Working with natural processes R&D framework [online]. Series of reports from Joint Defra and Environment Agency FCERM R&D programme, Project SC130004. Bristol: Environment Agency. Available from: https://www.gov.uk/government/publications/working-with-natural-processes-to-reduce-flood-risk-a-research-and-development-framework [Accessed 1 September 2017].
ECOSHAPE, undated. Building with Nature Guideline [online]. Dordrecht, Netherlands: Ecoshape. Available from: https://publicwiki.deltares.nl/display/BWN1/Guideline [Accessed 1 September 2017].
ENVIRONMENT AGENCY, 2010. Working with natural processes to manage flood and coastal erosion risk. Guidance document. Bristol: Environment Agency.
ENVIRONMENT AGENCY, 2012. Greater Working with Natural Processes in flood and coastal erosion risk management. A response to Pitt Review Recommendation 27. Bristol: Environment Agency.
OXFORD MARTIN SCHOOL, 2017. A restatement of the natural science evidence concerning catchment-based ‘natural’ flood management in the UK. Oxford Martin Restatement 4. Oxford: Oxford Martin School, University of Oxford. Available from: http://www.oxfordmartin.ox.ac.uk/downloads/academic/Oxford_Martin_Restatement4_Natural_Flood_Management.pdf [Accessed 1 September 2017].
POST, 2014. Catchment-wide flood management. POST-PN-484. London: Parliamentary Offices of Science and Technology.
RESTORE, 2014. Healthy Catchments – Managing water for flood risk and the Water Framework Directive [online]. European Centre for River Restoration. Available from: http://www.ecrr.org/RiverRestoration/Floodriskmanagement/HealthyCatchmentsmanagingforfloodriskWFD/tabid/3098/Default.aspx [Accessed 1 September 2017].
SNH, 2010. Sustaining nature's services: adopting an ecosystem approach. Inverness: Scottish Natural Heritage.
YDNPA, 2017. Natural Flood Management Measures – a practical guide for farmers [Online]. Yorkshire Dales National Parks Authority. Available from: http://www.yorkshiredales.org.uk/__data/assets/pdf_file/0003/1010991/11301_flood_management_guide_WEBx.pdf [Accessed 6 October 2017].
Chapter 2
DEFRA AND ENVIRONMENT AGENCY, 2014. Aquatic and riparian plant management: controls for vegetation in watercourses [online]. Series of reports from Joint Defra and Environment Agency FCERM R&D programme, Project SC120008. Bristol: Environment Agency. Available from: https://www.gov.uk/government/publications/aquatic-and-riparian-plant-management-controls-for-vegetation-in-watercourses [Accessed 1 September 2017].
Working with Natural Processes – Evidence Directory 287
DEFRA AND ENVIRONMENT AGENCY, 2016. How to model and map catchment processes when flood risk planning [online]. Series of outputs from Joint Defra and Environment Agency FCERM R&D programme, Project SC120015. Bristol: Environment Agency. Available from: https://www.gov.uk/government/publications/how-to-model-and-map-catchment-processes-when-flood-risk-management-planning [Accessed 5 September 2017].
ENVIRONMENT AGENCY, 2009. Fluvial Design Guide [online]. Bristol: Environment Agency. Available from: http://evidence.environment-agency.gov.uk/FCERM/en/FluvialDesignGuide.aspx [Accessed 23 August 2017].
ENVIRONMENT AGENCY, 2015. Channel management handbook for flood risk management. Bristol: Environment Agency.
FOREST RESEARCH, 2008. The Robinwood Robinflood report. Evaluation of large woody debris in watercourses. Report for the Robinwood Project, an INTEREG IIIc Regional Framework Operation project. Farnham, Surrey: Forest Research.
HERRERA ENVIRONMENTAL CONSULTANTS, 2006. Conceptual design guidelines: application of engineered log jams. SEPA Engineering Guidance WAT-SG-37. Stirling: Scottish Environment Protection Agency.
MOTT, N., 2011. Fish live in trees too. River rehabilitation and large woody debris. Stafford: Staffordshire Wildlife Trust.
ROTHERO, E., LAKE, S. AND GOWING, D. (ED.), 2016. Floodplain meadows. Beauty and utility: a technical handbook. Milton Keynes: Floodplain Meadows Partnership
RESTORE, 2013. Rivers by design. Rethinking development and river restoration. A guide for planners, developers, architects and landscape architects on maximising the benefits of river restoration. Bristol: Environment Agency.
RESTORE, 2014. Healthy Catchments – Managing water for flood risk and the Water Framework Directive [online]. European Centre for River Restoration. Available from: http://www.ecrr.org/RiverRestoration/Floodriskmanagement/HealthyCatchmentsmanagingforfloodriskWFD/tabid/3098/Default.aspx [Accessed 1 September 2017].
ROCA, M., ESCARAMEIA, M., GIMENO, O., DE VILDER, L., SIMM, J.D., HORTON, B. AND THORNE, C., 2017. Green approaches in river engineering – supporting implementation of Green Infrastructure. Wallingford: HR Wallingford.
STROUD DISTRICT COUNCIL, undated. Stroud RSudS project film. Rural sustainable drainage – Natural flood management in the Stroud Valleys. Video. Available from: https://www.stroud.gov.uk/environment/flooding-and-drainage/stroud-rural-sustainable-drainage-rsuds-project/stroud-rsuds-project-film-rural-sustainable-drainage-natural-flood-management-in-the-stroud-valleys [Accessed 1 September 2017].
SUSSEX FLOW INITIATIVE, 2016. Natural flood management guidance: woody dams, deflectors and diverters. Grantham: Woodland Trust.
Chapter 3
CEH, 2017. Systematic review to examine evidence on how trees influence flooding. CEH, Wallingford. Available from: https://www.ceh.ac.uk/news-and-media/news/review-launched-examine-how-trees-influence-flooding [Accessed 9 September 2017].
Working with Natural Processes – Evidence Directory 288
MOORS FOR THE FUTURE, 2015. An appraisal of the Defra Multi-Objective Flood Management Projects. Edale, Derbyshire: Moors for the Future Partnership.
Chapter 4
DEFRA AND ENVIRONMENT AGENCY, 2016. How to model and map catchment processes when flood risk planning [online]. Series of outputs from Joint Defra and Environment Agency FCERM R&D programme, Project SC120015. Bristol: Environment Agency. Available from: https://www.gov.uk/government/publications/how-to-model-and-map-catchment-processes-when-flood-risk-management-planning [Accessed 5 September 2017].
NATURAL ENGLAND, 2017. Countryside hedgerows: protection and management [online]. York. Natural England. Available from: https://www.gov.uk/guidance/countryside-hedgerows-regulation-and-management [Accessed 1 September 2017].
SMITH, R., 2017. Soils and Natural Flood Management. East Devon Catchment Partmership. Available from: https://www.catchmentbasedapproach.org/images/Soils%26NFM.pdf [Accessed 11 October 2017].
Chapter 5
DELTARES, 2013. Eco-engineering in the Netherlands: soft interventions with a solid impact. The Hague: Ministry of Infrastructure and the Environment.
THAMES ESTUARY PARTNERSHIP, 2012. Estuary Edges: ecological design advice. Bristol: Environment Agency.
NAYLOR, L.A., KIPPEN, H. AND COOMBES, M.A., 2017. Greening the Grey: a framework for integrated green grey infrastructure (IGGI). University of Glasgow report. Available from: www.biogeomorph.org/greengrey [Accessed 19 September 2017]. WAGENINGEN UNIVERSITY & RESEARCH, undated. Dossier: Building with nature [online]. Wageningen: The Netherlands: Wageningen University & Research. Available from: https://www.wur.nl/en/Dossiers/file/Building-with-Nature-2.htm [Accessed 1 September 2017].
Chapter 6
MODULAR RIVER SURVEY, 2016. Modular river surveys [online]. Available from: https://www.modularriversurvey.org/ [Accessed 1 September 2017].
REFORM, 2015. REFORM river restoration wiki [online]. Available from: http://wiki.reformrivers.eu/index.php/Main_Page [Accessed 1 September 2017].
RRC, undated. Monitoring planner [online]. Cranfield, Bedfordshire: River Restoration Centre. Available from: http://www.therrc.co.uk/monitoring-planner [Accessed 1 September 2017].

Working with Natural Processes – Evidence Directory 289
List of abbreviations AEP annual exceedance probability
BACI Before–After Control–Impact
BMP Beach Management Plan
CO2e carbon dioxide equivalent
DTC Demonstration Test Catchment
FCRM flood and coastal risk management
FRM flood rism management
LiDAR light detection and ranging
LWD large woody debris
NERC Natural Environment Research Council
NERC Act Natural Environment and Rural Communities Act
NFM Natural Flood Management
PV50 present value over 50 years
RRC River Restoration Centre
SMP Shoreline Management Plan
SoP standard of protection
SSSI Site of Special Scientific Interest
SUDS sustainable urban drainage system
USACE US Army Corps of Engineers
WWNP Working with Natural Processes
Working with Natural Processes – Evidence Directory 290
Glossary of terms Catchment scale A catchment is an area of land defined by its topographic
watershed – including streams, rivers, wetlands and lakes – from which precipitation collects and discharges to a defined outlet such as a river mouth, tributary confluence or lake.
Extreme, moderate and frequent events
Extreme events are discrete occurrences that are statistically ‘rare’ in that they are observed very infrequently; >100 year return period events (<1% chance of being exceeded in any one year)
Moderate events – moderate frequency range: 10–100 year return period events (10% to 1% chance of being exceeded in any one year)
Frequent events – common occurrence; <10 year return period events (>10% chance of being exceeded in any one year)
The terminology ‘large’, ‘medium’ and ‘small’ floods is also used to describe these same return periods.
Flood event types Synoptic scale events (commonly referred to as winter floods): prolonged rainfall associated with extra-tropical cyclones that have travelled across the Atlantic picking up moisture which then falls as rain as the cyclones pass over land. These events are more prevalent during the winter period (October to March) but can also take place in summer, often last several days, resulting in long periods of flooding (days) and typically covering large areas (hundreds to thousands of km2).
Convective scale events (commonly referred to as summer floods): short-lived intense rainfall events, such as convective storms, that take place during the summer period (April to September), resulting in flooding that lasts a few hours and often only affecting smaller areas (often less than tens of km2).
Flood frequency Flood frequency can also be expressed in terms of an annual exceedance probability (AEP). The 100-year return period flood can be expressed as the 1% AEP flood, which has a 1% chance of being exceeded in any year. A 20% AEP event has a 20% chance of being exceeded in any one year, and is equivalent to the 5-year return period flood. The return period of a flood is the average period of time expected to elapse between the occurrence of a flood event of a certain size at a given site. The actual number of years between consecutive floods varies considerably lot because of the naturally changing climate. A 100-year event is an extreme flood event of such size that over a long period of time, the average time between flood events of equal or greater magnitude is 100 years.
Flood magnitude This term is most referred to as the peak magnitude of flow for an event. Flood magnitude is also regularly used to
Working with Natural Processes – Evidence Directory 291
describe flood frequency. It is described by a statistically derived recurrence interval or return period. The return period is based on the probability that the given event will be equalled or exceeded in any given year. For example, a 1 in 100 year flood is calculated to be the flood flow or level that is expected to be equalled or exceed every 100 years on average. The 1 in 100 year flood is more accurately referred to as the 1% annual exceedance probability (AEP) flood, since it is a flood that has a 1% chance of being equalled or exceeded in any given year.
Flood synchronisation
The synchronisation of the flood hydrograph just downstream of a confluence between a river and a tributary watercourse will be the cumulative result of the propagation of the individual flood wave (magnitude and timing) down each watercourse and how they are generated by the atmospheric–land–watercourse interactions taking place within each contributing catchment for a flood event.
Hierarchy of catchment scale
Catchments are often classified according to size when considering the relative effectiveness of natural flood management. A common hierarchy is:
Micro-catchment: ~1km2
Small (mini) catchment: ~10km2
Medium (meso) catchment: ~100km2
Large catchment: ~1,000km2
Hydraulic conductivity
The rate of water movement through the soil mass, which is dependent on the soil properties.
Hydrograph A graphical plot that shows changes in water flow (discharge) or water depth (stage) over time. The time scale can vary depending on the data sources and can include minutes, hours, days, months, years or even decades.
Infiltration The process by which water on the ground surface enters the soil.
Infiltration-excess run-off (or overland flow)
This occurs when water is trying to enter a soil system faster than the soil can absorb or move it, at which point the precipitation exceeds the infiltration capacity of the soil causing surface runoff. Also known as Hortonian overland flow.
Measures The terms ‘measures’ and ‘measures of Working With Natural Processes’ have been used interchangeably throughout this report. Measures are the change to a landscape or management regime with an intention to reduce flood risk. Examples include a change in a land management practice, construction of a run-off attenuation feature, planting of a new woodland, and managed realignment on the coast.
Quickflow Water generated by a storm rainfall event, consisting primarily of surface run-off and throughflow (or interflow).
Working with Natural Processes – Evidence Directory 292
Run-off Total run-off or discharge, comprising both surface run-off and throughflow.
Saturation-excess run-off (or overland flow)
This occurs when the soil profile becomes saturated, and any additional precipitation or irrigation causes surface run-off.
Sediment accretion The accumulation of sediment, deposited by natural processes (fluvial or tidal).
Storm surge A change in sea level caused by a storm – usually caused by high winds pushing the sea water towards the coast.
Surface run-off (also known as overland flow or sheet flow)
Rapid movement of water over the land surface, downslope towards a watercourse or stream/river.
Throughflow (interflow)
Lateral unsaturated flow of water in the soil zone, where a highly permeable geological unit overlays a less permeable one, and which returns to the surface – as return flow – before entering a surface body of water or groundwater. Throughflow can also apply to preferential flow routes under saturated conditions.
Working with Natural Processes
Taking action to manage fluvial and coastal flood and coastal erosion risk by protecting, restoring and emulating the natural regulating function of catchments, rivers, floodplains and coasts.

Working with Natural Processes – Evidence Directory 293
Appendix 1. List of case studies Important! You can find these case studies on the website where you accessed this report. We have created four zip files (you can access through the hyperlinks below) in which we have batched the case studies according to which chapters they fall into.
River and floodplain management
# Name Main intervention type(s)
# Name Main intervention type(s)
1 New Forest River restoration and leaky barriers
13 Stroud Frome Leaky barriers
2 Mayes Brook
River restoration and floodplain restoration
14 Bowmont Leaky barriers
3 Avon River restoration 15 Devon Beavers Leaky barriers
4 Dorset Frome River restoration
16 Belford Leaky barriers, offline storage, runoff pathway
5 Glaven Floodplain restoration
17 Blackbrook Leaky barriers
6 Chelmer Floodplain restoration
18 Tutta Beck Leaky barriers
7 Mill Brook Floodplain restoration
19 Beam Offline storage area
8 St Austell Floodplain restoration
20 Holnicote Offline storage area
9 Eddleston
Floodplain restoration and riparian woodland
21 Lustrum Beck Offline storage area
10 Padgate Brook
Floodplain restoration
22 Guisborough Offline storage area
11 Low Stanger Floodplain restoration
23 Swindale Valley Offline storage area
12 Pickering Leaky barriers and riparian woodland
25 Brackenhurst All 4 intervention types
Woodland management
# Name Main intervention type(s)
# Name Main intervention types(s)
24 Coalburn Catchment woodland
28 Cary Floodplain woodland
25 Brackenhurst Catchment woodland
29 Great Triley Floodplain woodland
26 Torne Catchment woodland
30 Sussex Flow Floodplain woodland
27 Pontbren
Cross-slope woodland and soil/ land management

Working with Natural Processes – Evidence Directory 294
Runoff management
# Name Main intervention type(s)
# Name Main intervention type(s)
31 Hills to levels
Soil and land management and headwater drainage management
39 Dunruchan Farm
Headwater drainage management
32 Roe and Ive Soil and land management
40 Afon Clywd Runoff pathway management
33
Water Friendly Farming
Soil and land management and runoff pathway management
41 Nant Barrog Runoff pathway management
34 River Ray Headwater drainage management
42 Debenham Runoff pathway management
35 Moors for the Future
Headwater drainage management
43 Evenlode Runoff pathway management
36 Exmoor Headwater drainage management
44 Haltwhistle Runoff pathway management
37 Pumlumon Headwater drainage management
45 Trawden Runoff pathway management
38 Eycott Hill Headwater drainage management
Coast and estuary management
# Name Main intervention type
# Name Main intervention type
46 Humber Saltmarsh and mudflat
56 Levington Saltmarsh and mudflat
47 North Norfolk Saltmarsh and mudflat
57 Rhymney Saltmarsh and mudflat
48 Nigg Bay Saltmarsh and mudflat
58 Waldringfield Saltmarsh and mudflat
49 Hesketh Saltmarsh and mudflat
59 Hightown Sand dunes
50 Medmerry Saltmarsh and mudflat
60 South Milton Sand
Sand dunes
51 Wandsworth Saltmarsh and mudflat
61 Pevensey Beach nourishment
52 Fineringhoe Saltmarsh and mudflat
62 Poole Beach nourishment
53 Rye Harbour Saltmarsh and mudflat
63 Pagham Beach nourishment
54 Alkborough Saltmarsh and mudflat
64 Shoreham Beach nourishment
55 Sandwich Saltmarsh and mudflat
65 Sand Engine Beach nourishment

15 of 15
www.gov.uk/environment-agency