Embed Size (px)
Citation preview

Working Paper Series Paper 42
The Rise and Transformation of the UK Domestic Appliances Industry
Huw Beynon, Surhan Cam, Peter Fairbrother and Theo Nichols ∗ October, 2003
Corresponding Author: Surhan Cam [email protected] ISBN 1 904815 02 2
∗ This paper arises from the ESRC financed project International Sector Comparison of Management Strategy and Employee Relations. The authors gratefully acknowledge the initial contributions of Dr Lee Pegler, who worked on this project for the first 12 months.

2
The UK domestic appliances manufacturing industry had its origin in the 19th
century, when it was established as a nationally based and focused industry,
aimed at the prosperous middle classes. By the 1930s and 1940s, ownership
of production plants had become complicated, comprising subsidiaries of US
multinationals or divisions of large diversified mainly British firms. Even by the
1950s, it was an industry that still focused on a largely middle class market. In
the 1960s and 1970s, however, this structure of relations began to change,
initially with imports from Italy, focused on the cheap end of the market which
opened to the working class. By the 1980s, there had been a decline of
nationally based domestic appliance producers and an increasing presence of
international producers, selling their goods under a range of brands.
This paper examines the changing position of the UK domestic appliances
industry with respect to a number of dimensions – consumption, production,
ownership, trade relations and employment. It does so in the context of what
might be called the ‘regional idea’. This is the idea that in the modern political
economy ‘trade flows are dominated by exchanges within and between the
three major regions of the global economy (the so-called triad): Europe, North
America, and East Asia’ (Hoekman and Kostecki, 2001: 9); and that over the
last two decades or more there has been a regionalisation of trade and
foreign direct investment flows (Kozul-Wright, 1995; Ohmae, 1995).
Following an outline of the history of cooking and cooling products – which are
two major constituents of the industry – it focuses on the industry over the last
quarter of a century. To anticipate: this review points to the industry as one
that has been in secular decline as far as employment is concerned. The now

3
mature domestic market is seen to be subject to continued foreign domination
and high levels of ownership concentration. With respect to the regional idea
set out above, both imports and exports are seen to have taken a largely
(European) regional form. However, recent evidence also suggests that the
source of imports has been shifting from the EU to the EU periphery and may
now be beginning to move outside the region.

4
A Brief History of Domestic Appliance Production in the UK
The production of domestic appliances in the UK goes back to the late
nineteenth century. As a new industry, it was in part an adaptation of more
established industries, such as the general engineering industry, foundries
and related product industries. One sequence of development was for existing
engineering companies to move into domestic appliances, presumably in
response to a perceived potential demand. To illustrate, Davis Gas Stove
Company bought into T. and J. Jackson Ltd (electric lighting specialists) in
1912 and went on to produce the Jackson electric cooker (Corley, 1966: 30-
31). For the first part of the twentieth century, the British market was
dominated by foreign companies, via imports or by operations run through
British subsidiaries. The industry has its roots in the beginnings of a broader
based consumer market for such products, first among the middle classes
and then slowly extended to the working classes in the first part of the
twentieth century.
Cookers
The forerunner of the domestic appliances industry came in the form of
cookers, first gas cookers and then electric. Sometime in the 1820s, following
the supply of gas to houses, the first gas cooker was developed and used in
the UK (Houghton, 1972). These early models were adaptations of the
available cookers, the coal range. They were cast iron boxes, insulated with
straw and heated by piped gas. There was little development and refinement
5
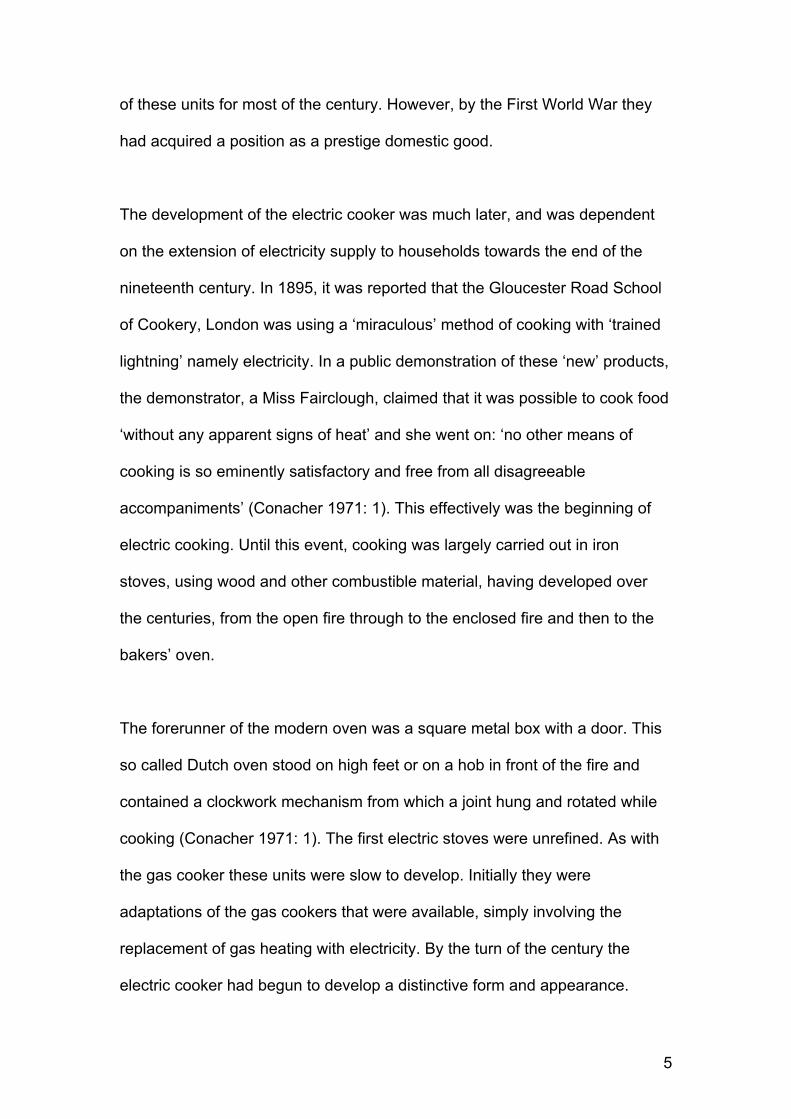
of these units for most of the century. However, by the First World War they
had acquired a position as a prestige domestic good.
The development of the electric cooker was much later, and was dependent
on the extension of electricity supply to households towards the end of the
nineteenth century. In 1895, it was reported that the Gloucester Road School
of Cookery, London was using a ‘miraculous’ method of cooking with ‘trained
lightning’ namely electricity. In a public demonstration of these ‘new’ products,
the demonstrator, a Miss Fairclough, claimed that it was possible to cook food
‘without any apparent signs of heat’ and she went on: ‘no other means of
cooking is so eminently satisfactory and free from all disagreeable
accompaniments’ (Conacher 1971: 1). This effectively was the beginning of
electric cooking. Until this event, cooking was largely carried out in iron
stoves, using wood and other combustible material, having developed over
the centuries, from the open fire through to the enclosed fire and then to the
bakers’ oven.
The forerunner of the modern oven was a square metal box with a door. This
so called Dutch oven stood on high feet or on a hob in front of the fire and
contained a clockwork mechanism from which a joint hung and rotated while
cooking (Conacher 1971: 1). The first electric stoves were unrefined. As with
the gas cooker these units were slow to develop. Initially they were
adaptations of the gas cookers that were available, simply involving the
replacement of gas heating with electricity. By the turn of the century the
electric cooker had begun to develop a distinctive form and appearance.

6
Cookers gradually evolved with the attributes and features that are taken for
granted today. The Belling company, an early domestic appliances producer,
developed the boiler grill, (heat above and below) for the electric cooker in
1915. Originally switch controls had only three settings, High, Medium and
Low, and it was not until 1946 that the ‘Simmerstat’ was developed, which
gave a choice of six different settings for boiler rings (Conacher 1971: 4)
As with many of the innovations on gas and electric cookers, wartime
developments were important. To an important extent research development
for war purposes in the First World War and particularly the Second World
War resulted in initiatives that were later utilised in the domestic appliance
area. Similarly, the now popular microwave technology has its origins in
defence development, which was subsequently transferred to domestic
household use.
Refrigeration
The development of refrigeration units occurred at a later stage and outside
the UK. It began in the USA with the development of cooling systems, in the
first instance insulated ice-boxes (e.g. Sears Roebuck), and then via kerosene
powered units to the modern refrigerator. The modern refrigerator was
created with the development in the 1920s of compressors and evaporative
technology. The first residential electric refrigerator was developed in the
1920s by General Electric. In 1926 General Electric sold 2000, by 1928 the

7
company estimated there were over one million refrigerators in US homes. By
1937 it is estimated there were nearly 3 million. At first these ‘luxury items’
were for the few who could afford them but by 1950 90 per cent of Americans
living in towns and 80 per cent living in rural areas owned domestic
refrigerators (Russo 2002; Weightman 2003: 189-90).
By 1927, the United States provided the bulk of refrigerator imports into
Britain (Corley, 1966: 107). In the same year, Electrolux began producing the
first small gas refrigerator in Britain. This development foreshadowed the later
move in Britain towards ‘waist high’ or small refrigeration units (Hardyment,
1988: 141 - 142). Demand for refrigerators remained low in part also because
the American penchant for ice in the home (initially stimulated and supplied by
the frozen ice trade) had no counterpart in the UK or in Europe generally
(Weightman 2003: 144). Compression unit, an essential unit for electric
refrigerators, was only introduced into Britain in 1933. Compressor production
did not assume any major importance in the British market until after the
Second World War, when a franchise was granted to L. Sterne of Glasgow by
the American Tecumseh Co. to make its sealed units, which were small
enough to be incorporated into the refrigerator (Corley, 1966: 107-108). By
the mid-1960s Sterne supplied compressors to most refrigerator
manufacturers in the UK, apart from Hotpoint, Frigidaire, Kelvinator and Lec,
which all produced their own compressors.

8
Design and Users
Initially, these appliances were very utilitarian, with little emphasis on style.
Until the 1940s, the design of domestic appliances was largely dominated by
engineering, ‘the layout of the appliance’s chassis, or inside mechanism’
(Corley, 1966: 105). The result was an approach to product development in
which relatively little attention was given to users. In fact, it is claimed that the
view amongst appliance manufacturers was ‘that since appliances were finely
engineered products, the housewife ought to value their qualities even if the
specification did not exactly suit her needs’ (Corley, 1966: 51). It was only in
1956/7 that Hotpoint (principal products –cookers, refrigerators, vacuum
cleaners and washing machines) carried out market research with
‘housewives’ to see what they wanted in relation to their electrical domestic
appliances, this being the first time that this had happened in the electric
domestic appliance industry (Corley 1966: 51). Until relatively recently, these
products were designed and developed by men for largely ‘imagined’ women
(Cockburn and Furst-Dilic, 1994).

9
The Beginning of a Mass Market: 1950s - 1970s
The acquisition of domestic appliances was initially confined to the middle
classes, and it was during the 1950s that the more affluent working class
began to purchase such items. As reported by Goldthorpe and Lockwood
(1969: 22), real earnings increased sharply during this decade, and this was
reflected in the acquisition of consumer goods:
… it was estimated that the average real earnings of industrial workers
had risen by more than 20 per cent between 1951 and 1958; and that
by the spring of 1959 the average working-class household income
was about £850 per year (gross), with nearly half of all employed
working-class families having an annual income of over £1000. It was
revealed further, as a result of national surveys, that by 1959 among
this more prosperous half of the working class 85 per cent of all
household had a television set, 44 per cent a washing machine, 44 per
cent a lawnmower, 32 per cent a car and 16 per cent a refrigerator. In
addition 35 per cent of the families in question owned, or were buying,
their own house
Lockwood had noted in an earlier article that this was part of a desire to
acquire the material goods now thought necessary for a relatively comfortable
life. Rather than these working class families seeing such consumer durables
as status symbols, he argued, they recognised that: ‘A washing machine is a
washing machine is a washing machine’ (1960: 253). It was on this basis that

10
these consumer durables became an increasing feature of working class as
well as middle class family life in Britain.
Nonetheless, during the 1950s and into the 1960s, the production of domestic
appliances in Britain had remained largely focused on middle class families,
with little attention paid to the potential of a broader consumer base (Corley,
1966: 54). It was an industry that in Paba’s words was ‘essentially one of
unspecialised, over-fragmented, undynamic’ firms (Paba 1986: 306). These
firms had limited product lines. Many firms manufactured under licence,
particularly for the large US firms that led the industry. It was an industry that
had been led either by subsidiaries of US multinationals (Frigidaire, Hoover,
General Electric and Kelvinator) or divisions of other large diversified firms
(AEI-Hotpoint, English Electric, Thorn, Simplex (Tube Investments) and
Electrolux). By the 1960s, in the context of competitive pressures around
quality, development and innovation, the smaller entrepreneurial units began
to withdraw from the British domestic appliance market (Paba 1986: 306-07).
Thus, the British industry was largely nationally based – in the sense that
production took place in Britain largely for a British market - although shaped
by the presence of multinational firms. The British market expanded as the
acquisition and use of the basic domestic appliances increased throughout
the early to mid-twentieth century, such products being popularised as labour-
saving goods for the modern household (Slater 2000: 179-180). This
expansion is reflected in the focus of advertising on the consuming
households, predicated on an expanding ‘affluent working class’.

11
The emerging affluent working class in western societies from 1950
onwards was seen as a new relatively undifferentiated ‘mass’ market
by producers, department stores, advertisers and distributors of all
types of what were termed ‘consumer durables’, such as televisions,
washing machines, cars, transistor radios and record players.
(Bockock, 1992: 133)
Although the British market had begun to expand, it was an industry that for a
number of decades was relatively closed to imports. One reason for this
closure was that after 1946 imports were tightly controlled by the Board of
Trade, against a pre-war background of an increasingly restrictive import
policy for the electrical domestic appliance industry, so as to protect Britain’s
electrical industry. In 1932 an Import Duties Act placed tariffs on many goods
based on preferential principles, with a first level of protection for British
manufacturers, a second level for Commonwealth manufacturers and no
protection for others. After the Second World War, these policies were
liberalised, although imports from the dollar area were restricted until 1959.
They had however had the effect of encouraging foreign firms to produce
inside the UK domestic appliance market.
Government concern about the balance of payments led to policies to
promote exports. In 1951, at the time of the Korean War, refrigerator
manufacturers were required to increase their exports from 66⅔ to 85 per
cent of production. The result was that aggregate appliance exports increased

12
to about 42 per cent of total production. While this formal requirement was a
short-term measure and exports thereafter declined to 35 per cent in 1954
and were down to 19 per cent by 1964 (Corley, 1966: 122-23).
As far as imports are concerned, it is argued by Paba that the principal barrier
to import penetration in the UK industry during this period was ‘high product
differentiation’ (1986: 307). In brief, domestic appliances is an industry in
which it is very difficult to judge the quality of the product before purchase and
consumers were drawn towards known and familiar brands. Such a situation
gave established brands a considerable advantage, making it difficult for new
entrants to persuade consumers to try them out. Coupled with this resistance,
as Paba (1986: 307-08) points out, it may also be the case that consumers
had negative views about products from particular countries. During the 1950s
and 1960s this may have constituted an additional barrier to import
penetration.
During the 1960s and 1970s, the patterns of production and marketing of
domestic appliances in Europe began to change, with major consequences
for the UK in the 1980s and 1990s. One feature of this period was the growth
of a few European based firms, principally, through merger and acquisition. In
fact, it is argued by Paba that the domestic appliances industry in Europe was
marked by an external pattern of growth, whereby the growth of a few large
firms in the industry was accounted for by mergers and takeovers, rather than
by increasing production or entering new markets (1991: 22 – 24).

13
As far as the UK domestic appliance industry is concerned, the development
of the Italian domestic appliance industry is critical. The modern Italian
domestic appliance industry (refrigerators, washing machines, freezers, and
dishwashers) dates from the 1950s, when the industry was transformed by
the entry of ‘“new generation” specialised firms’, such as Zanussi, Ignis,
Zoppas, Castor, Candy and Indesit (Paba, 1986: 308). During the 1950s and
1960s these few firms came to dominate the industry, with Ignis, Zanuusi,
Indesit and Zoppas accounting for 77.8 per cent of the total production in
refrigerators in Italy in 1964. This level of concentration in domestic appliance
production was quite unlike any other European country at the time (Paba,
1986: 309). Significantly, these firms, unlike their larger European
competitors, focused on the emerging mass market, developing products that
were ‘reasonably’ priced and produced at low costs. To achieve these goals,
these firms built up their productive capacity, and capitalised on the relatively
low cost of Italian labour. Thus this was an industry that was highly
concentrated, aimed at the mass market, with products that were relatively
cheaply priced.
The Italian firms pursued a then distinctive entry strategy aimed at the ‘low
income segments of the market’ (Paba, 1986: 309). This strategy had two
components to it. First, UK companies were provided with non-branded
goods, which they then sold under their own name. Brand-naming involved
General Electric, Hotpoint, English Electric, Frigidaire and Imperial. The
appeal of this strategy to the British-based companies was that it helped them
to widen the model range in a particular product. Sometimes companies also

14
used this method to open up new product markets. For example, Hoover, with
30 per cent of the domestic British market for washing machines pursued this
approach in the mid-1960s to enter the refrigerator market.
Second, the Italian firms sought agreements with retailers and commercial
houses to market the Italian goods under such firms’ own labels, thereby
assuring potential purchasers of the quality of these goods. Of the main Italian
firms, Indesit, by contrast, always sold under the ‘Indesit’ label, attributed by
Paba to the fact that the firm was closely linked to Fiat and influenced by this
multinational company (1986: 312, fn 2).
The Italian firms were successful in pursuing these entry strategies across
Europe. Paba notes that during the 1960s, Italy became the second largest
producer of domestic appliances in the world, and the largest exporter of
domestic appliances. In 1963, Italy became the largest European producer of
washing machines and in 1966 of refrigerators (Paba 1986: 308). The Italians
rapidly had developed an innovative, expansionist industry based on big
plants with low-cost labour and more efficient mass production techniques.
During the 1970s, changes took place with implications for the pattern of
production and consumer demand in Britain, as well as the other main
European countries. On the one hand, the Italian industry began to lose its
way. Paba argues that the European market began to show signs of
saturation, replacement demand coming to the fore towards the end of the
1960s. In this situation, increased emphasis was placed on ‘product

15
differentiation and after-sales service’ rather than production skills, as had
been the case earlier (1986: 312-13). On the other hand, after 1969 the Italian
firms could no longer maintain the low wage levels that had characterised the
earlier period, partly as a consequence of a resurgence of unions at this time.
Their place was taken to a certain extent by East European firms, which
began (as the Italians themselves had first done) by selling non-branded
goods to European firms.
There then followed a period where key Italian firms, such as Ignis and
Zanussi, which were both actively involved in non-brand sales exports, were
either absorbed as a managerial division of a multinational (Phillips in the
case of Ignis) or part ownership (AEG-Telefunken in the case of Zanussi from
1973 to 1979) and subsequent takeover (Electrolux taking over Zanussi in
1984). Some firms, such as Smeg began to specialise in high quality
products, which were still sold abroad through non-branded channels (Paba,
1986: 314-15). However, overall there was increased emphasis on branded
goods.
Such developments had major implications for the British domestic appliance
industry. In the process of becoming a mass market, the entry of Italian
products, either non-branded or branded, had been crucial, as was the case
elsewhere in Europe. It is to a more detailed account of the history of the UK
Domestic Appliance industry in 1980s and 1990s that we now turn.
16
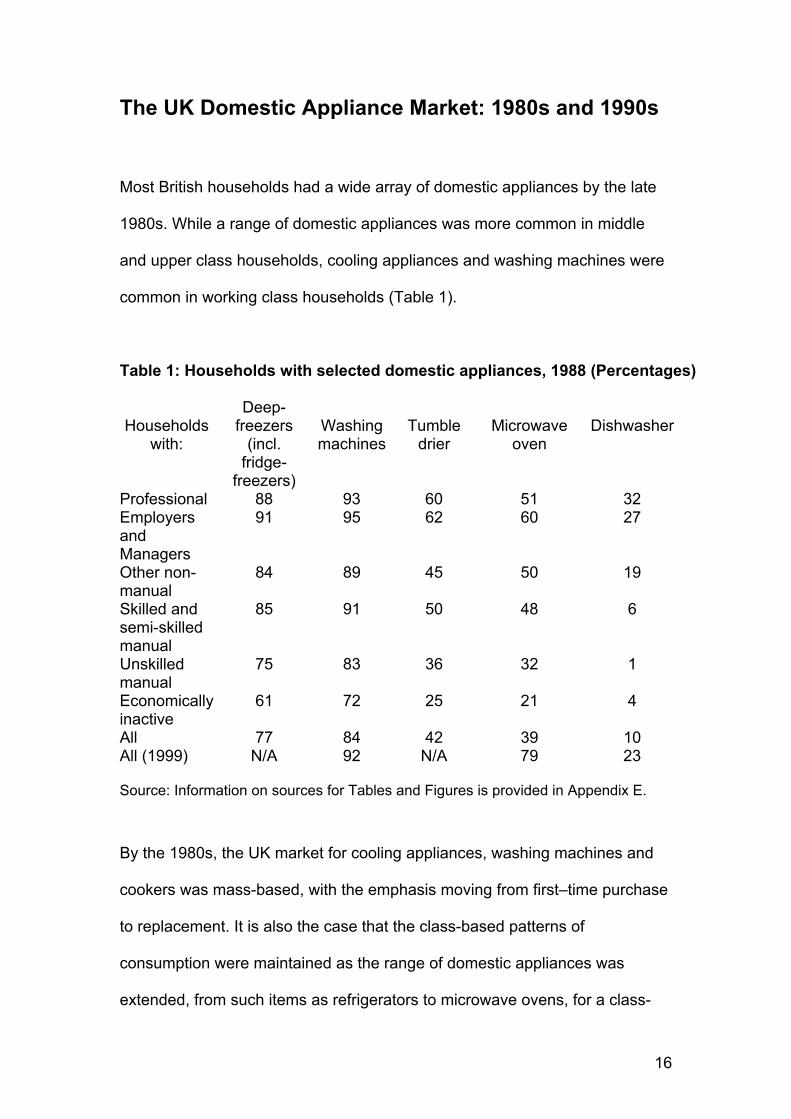
The UK Domestic Appliance Market: 1980s and 1990s
Most British households had a wide array of domestic appliances by the late
1980s. While a range of domestic appliances was more common in middle
and upper class households, cooling appliances and washing machines were
common in working class households (Table 1).
Table 1: Households with selected domestic appliances, 1988 (Percentages)
Households
with:
Deep-freezers
(incl. fridge-
freezers)
Washing machines
Tumble
drier
Microwave
oven
Dishwasher
Professional 88 93 60 51 32 Employers and Managers
91 95 62 60 27
Other non-manual
84 89 45 50 19
Skilled and semi-skilled manual
85 91 50 48 6
Unskilled manual
75 83 36 32 1
Economically inactive
61 72 25 21 4
All 77 84 42 39 10 All (1999) N/A 92 N/A 79 23 Source: Information on sources for Tables and Figures is provided in Appendix E.
By the 1980s, the UK market for cooling appliances, washing machines and
cookers was mass-based, with the emphasis moving from first–time purchase
to replacement. It is also the case that the class-based patterns of
consumption were maintained as the range of domestic appliances was
extended, from such items as refrigerators to microwave ovens, for a class-

17
based sequencing remained in the acquisition of new domestic appliances as
they came onto the market.
However, the UK markets for domestic appliances saw no overall growth in
value terms for core products such as cookers and cooling appliances. By this
stage the market was a mature one with high levels of penetration for most
products (Appendix A). It was also sensitive to changes in consumer demand.
But whereas cyclical fluctuations made for falls in the market in the early
1980s and early 1990s, which were followed by upswings in each decade, this
still left the overall market worth less in 2000 than it had been in 1979. At the
start of this period the market had stood at £3,891 million at 1995 prices. It
reached a highpoint of over £4,000 million in 1989 but was still only £3,500
million in 2000 (Figure 1).
A slight compositional shift took place over the 1980s with electrical
appliances rising from 78 per cent of all domestic appliances in 1979 to 84 per
cent in 1989. This share then remained stable throughout the 1990s.

18
Figure 1: UK Market for Domestic Appliances (£ Million 1995 Prices)
0500
10001500200025003000350040004500
1979
1980
1981
1982
1983
1984
1985
1986
1987
1988
1989
1990
1991
1992
1993
1994
1995
1996
1997
1998
1999
2000
Figure 2: UK Market for Cooking and Cooling Appliances (£ Million, 1995 Prices)
0100200300400500600700800
1979
1980
1981
1982
1983
1984
1985
1986
1987
1988
1989
1990
1991
1992
1993
1994
1995
1996
1997
1998
1999
2000
Cooling Appliances Cooking Appliances
*Note: The terms ‘cooling appliances’ and ‘refrigeration appliances’ are used
interchangeably. Refrigerators are part of cooling appliances, together with freezers
and fridge-freezers.
If this market is disaggregated for cooking and cooling appliances it can be
seen that the two markets follow a similar pattern of movement to that of the
overall domestic appliances market (cf. Figures 1 and 2). As with the overall

19
domestic appliances market, the declines at the beginning of each decade
were followed by increases in later years (in fact domestic appliances are a
good cyclical indicator). The most notable difference was in the performance
of the cooking appliance market in the 1990s. In contrast to the fall in the
domestic appliance market as a whole, these markets did see a small amount
of growth. However, such growth was very limited. Over the entire period
between 1979 and 2000 the cooking appliances market increased by only 23
per cent from £447 million in 1979 to £548 million in 2000. Cooling appliances
increased by only 14 per cent from £415 million in 1979 to £475 million in
2000. These changes amounted to annual average rates of growth of only
1.07 and 0.68 per cent respectively.
Turnover and Value-Added
In 1979 total turnover of UK-based domestic appliances stood at £3120
million. In 2000, it was down to £2433 million. Only the second half of the
1980s saw year on year increases. This trend was not maintained in the
1990s, which were characterised by gradual decline (Figure 3). The share of
electric domestic appliances in total turnover grew during the 1980s, declining
slightly in the 1990s. On average electrical goods contributed 78 per cent over
the whole period, a shift from 75 to 80 per cent having occurred 1979 to 2000.

20
Figure 3: Turnover in Domestic Appliances Manufacturing (£m)
0500
100015002000250030003500
1979
1980
1981
1982
1983
1984
1985
1986
1987
1988
1989
1990
1991
1992
1993
1994
1995
1996
1997
1998
1999
2000
Figure 4: The Share of Value Added in Overall Turnover in Domestic Appliances and Overall Manufacturing (Percentages)
0
10
20
30
40
50
1979
1980
1981
1982
1983
1984
1985
1986
1987
1988
1989
1990
1991
1992
1993
1994
1995
1996
1997
1998
1999
2000
Domestic Appliances Overall Manufacturing
The unimpressive performance for turnover was matched by an equally
unimpressive performance for share of value added in turnover (Figure 4).
The weak share of value added performance in domestic appliances is clear
when the share for domestic appliances is compared with that in
manufacturing as a whole. The share of value added in domestic appliances
turnover fell below that in manufacturing as a whole for the entire period. In
manufacturing the share of value added remained remarkably stable with an

21
average of 38 per cent 1979-2000. In domestic appliances it averaged only 33
per cent for the entire period, the high points of 1984-86 and 1997-98 which
approached the level for manufacturing as a whole proving transitory. This
lack of a sustained upward movement in both turnover and the share of value
added should be seen in the context of increased UK based production. More
units have been produced but without significant benefit to the total value of
production or the share of value added.

22
UK-based production has of course undergone some changes in product mix
over the past two decades. In the case of cooking appliances, for example,
the 1990s saw some rise in gas cookers at the expense of electric ones and
there have been changes in the share contributed by hoods. In the case of
cooling appliances, the share taken by refrigerators has tended to fall and
those of freezers and fridge-freezers has grown (further detail is provided in
Appendix B). However, there was an increase in the number of both cooking
and cooling appliances produced in the UK between 1979 and 2000 (Figure
5).
Figure 5: Production of Cooking and Cooling Appliances (Thousands of Units)
0
500
1000
1500
2000
2500
1979
1980
1981
1982
1983
1984
1985
1986
1987
1988
1989
1990
1991
1992
1993
1994
1995
1996
1997
1998
1999
2000
Cooling Appliances Cooking Appliances
In the case of cooking appliances, the growth occurred in the 1990s and
overall the number of cooking appliances almost doubled to one million. In the
case of cooling appliances, the rise was steadier, but units produced again
almost doubled rising from 1.2 million in 1979 to 2.2 million in 2000.

23
There was therefore a more or less continuous decline in the price of UK
manufactured units over the past two decades (Figures 6 and 7).
Figure 6: Wholesale Unit prices of different cooking appliances, 1995 prices, (£s)
050
100150200250300350400450
1979
1980
1981
1982
1983
1984
1985
1986
1987
1988
1989
1990
1991
1992
1993
1994
1995
1996
1997
1998
1999
2000
Gas Cookers Electric Cookers Hoods
Figure 7: Wholesale Unit prices of different cooling appliances, 1995 prices, (£s)
050
100150200250300
1979
1980
1981
1982
1983
1984
1985
1986
1987
1988
1989
1990
1991
1992
1993
1994
1995
1996
1997
1998
1999
2000
Refrigerators Fridge-Freezers Freezers
In 1979, the average price for cooking appliances was £219 (all prices here
are wholesale). By the early 1980s this had fallen to £167 and by 2000 it was
more like £100. For cooling appliances average price followed a similar path –

24
from £203 in 1979 to £171 in 1983 and again to about £100 in 2000. While
there are sometimes substantial price differences between the different sub-
products, the general trend is born out in the major cases. Gas cookers have
declined from £407 in 1979 to £268 in 2000. Electric cookers have declined
from £292 in 1979 to £151 in 2000 (hoods, in any case a low price item, have
held up better). Amongst cooling appliances, fridge-freezers fell from £274 in
1979 to £163 in 2000. The pricing of refrigerators and freezers underwent falls
that are even more pronounced.
The problem of falling unit prices relates to a further problem that besets
domestic appliance production in the UK. Prices have been driven downwards
by cheaper and/or cheapening imports. In cooling appliances the prices of UK
produced and imported products have been closely matched, but in both
cooking (where imports have typically been cheaper) and in cooling
appliances there has been a long-term downward trend in unit price, shown in
Figure 8 and 9.

25
Figure 8: Cooling Appliances, Wholesale Unit Prices, 1995 Prices (£’s)
0
50
100
150
200
25019
7919
8019
8119
8219
8319
8419
8519
8619
8719
8819
8919
9019
9119
9219
9319
9419
9519
9619
9719
9819
9920
00
Manufacturing Import
Figure 9: Cooking Appliances, Wholesale Unit Prices, 1995 Prices (£’s)
0
50
100
150
200
250
1979
1980
1981
1982
1983
1984
1985
1986
1987
1988
1989
1990
1991
1992
1993
1994
1995
1996
1997
1998
1999
2000
Manufacturing Import
Reviewing the wider situation in 2001, Electrolux Chief Executive Michael
Treschow commented that it was a 'very competitive environment in which
customers are paying less and less for the products' (George 2001). This
most certainly reflects the problem in the British-based industry.
26
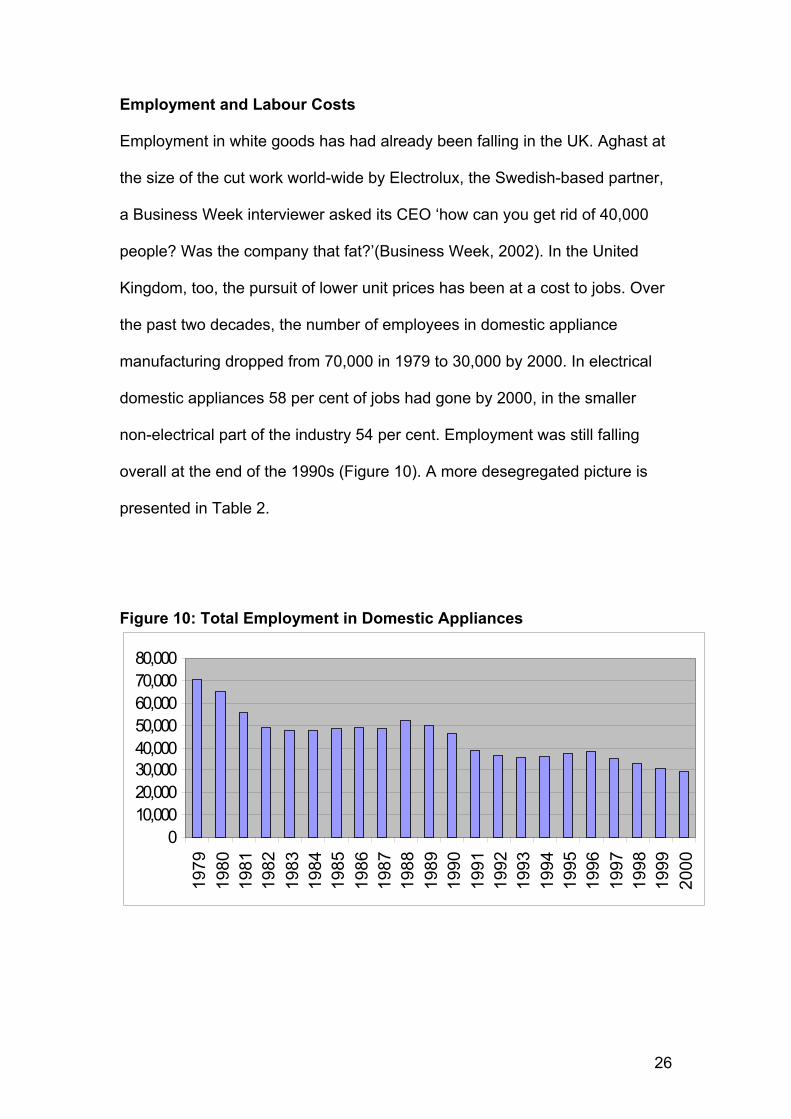
Employment and Labour Costs
Employment in white goods has had already been falling in the UK. Aghast at
the size of the cut work world-wide by Electrolux, the Swedish-based partner,
a Business Week interviewer asked its CEO ‘how can you get rid of 40,000
people? Was the company that fat?’(Business Week, 2002). In the United
Kingdom, too, the pursuit of lower unit prices has been at a cost to jobs. Over
the past two decades, the number of employees in domestic appliance
manufacturing dropped from 70,000 in 1979 to 30,000 by 2000. In electrical
domestic appliances 58 per cent of jobs had gone by 2000, in the smaller
non-electrical part of the industry 54 per cent. Employment was still falling
overall at the end of the 1990s (Figure 10). A more desegregated picture is
presented in Table 2.
Figure 10: Total Employment in Domestic Appliances
010,00020,00030,00040,00050,00060,00070,00080,000
1979
1980
1981
1982
1983
1984
1985
1986
1987
1988
1989
1990
1991
1992
1993
1994
1995
1996
1997
1998
1999
2000

27
Table 2: Employment in Domestic Appliances manufacturing (000s)
Electric
Appliances
Non-Electric Appliances
Total Employment in
Domestic Appliances
1979 54.7 15.8 70.5 1980 50.8 14.4 65.2 1981 45.1 10.6 55.7 1982 38.3 10.4 48.7 1983 36.9 11.2 48.1 1984 37.9 10.1 47.9 1985 37.5 10.7 48.2 1986 38.1 10.6 48.7 1987 38.1 10.4 48.5 1988 42.1 10.1 52.2 1989 39.6 10.3 49.9 1990 36.9 9.4 46.3 1991 31.2 7.7 38.9 1992 29.2 7.4 36.6 1993 28.2 7.3 35.5 1994 28.6 7.2 35.8 1995 30.2 7.2 37.4 1996 31.0 7.3 38.3 1997 27.8 7.4 35.1 1998 25.9 7.3 33.3 1999 23.5 7.3 30.8 2000 22.2 7.3 29.6 Other things being equal, what has been said already – more units produced,
fewer workers producing them – suggests a significant improvement in
economic outcome. However, we have already seen that unit prices were
falling and in addition to this, despite a loss of over 40,000 jobs in domestic
appliances between 1979 and 2000, total employee compensation did not fall
by a corresponding proportion. It fell only 22 per cent over the same period,
compensation per employee rising (Appendix C).
The share of employee compensation in gross value added in the domestic
appliances industry underwent a sharp rise 1979-1981, reaching 95 per cent

28
in 1981. This was at a time when employment fell drastically from about
70,000 to 55,000 employees (employee compensation includes redundancy
payments). It then fell, bottoming out in the-mid 1980s and thereafter it has
undergone a steady rise. By 1990 it was 76 per cent of gross value added and
in 2000 it was 83 per cent.
Figure 11: Labour’s Share of Gross Value Added (percentage)
0102030405060708090
100
1979
1980
1981
1982
1983
1984
1985
1986
1987
1988
1989
1990
1991
1992
1993
1994
1995
1996
1997
1998
1999
2000
This pattern of labour’s share of gross value added (Figure 11) is a measure
of the trouble facing the UK-based domestic appliance industry. A financially
successful firm or industry has been said to require a labour share in value
added which is steadily ‘at or below 70 per cent‘ (Williams et al., 1994: 174).
For much of the last two decades labour’s share in value added has been at a
higher level than this.

29
International Trade (Exports and Imports) During the 1980s, imports of domestic appliances remained more or less
stable at around 35 per cent of the domestic appliances market in the UK
(data is only available for the domestic appliance industry as a whole). In the
1990s they then grew rapidly. In 2000 imports accounted for 80 per cent of
the UK market with a value of circa £2 billion. To the problem of a lack of
growth in the home market there therefore has to be added the problem of a
growing percentage of imports (Figure 12).
Figure 12: Domestic Appliance Exports* and Imports**
0
20
40
60
80
100
1979
1980
1981
1982
1983
1984
1985
1986
1987
1988
1989
1990
1991
1992
1993
1994
1995
1996
1997
1998
1999
2000
Exports Imports
* Exports as percentage of output of UK-based domestic appliance manufacturing. ** Imports as percentage of domestic appliances sales in the UK
Some growth has taken place in exports. In 1979 their share in the sales of
UK-based manufacturers stood at 10 per cent. By 1990 this had risen to
nearly 20 per cent. By 2000 it had reached 33 per cent, this growth having
levelled out in the second half of the 1990s. Despite this increased share of
UK production going to exports, UK-based producers could not hold on to the

30
home market. The giant share of the home market was made up of imports. In
fact, it is reported that in 2001 the UK was the world’s leading importer of
refrigerators (World Appliance Industry 2002: 8).
Of importance to the export–import patterns, are the politics of trade
arrangements. In this industry, there has been a strong regional basis toward
trade within the EU. From the 1960s the international trade of the UK in
domestic appliances has largely been carried out with other EU countries.
However, especially during the 1990s, there was a fall in the EU contribution
and a marked growth in the share of developing countries imports to the UK
In 2000 the UK imported 57 per cent of refrigerators from the EU countries.
More than half of them (29 per cent) came from Italy, followed by Germany
with 19 per cent. In the case of electric cookers, the EU accounted for a yet
higher proportion of imports to the UK in 2000, 78 per cent. Italy was again
the largest provider with 52 per cent of all electric cookers imported to the UK.
Germany had a 10 per cent share.
Even so, British trade with the EU countries has undergone considerable
changes: the share of EU countries in imports of refrigerators and electric
cookers to the UK has declined. Although EU countries contributed just over
57 per cent of refrigerator imports in 2000 they had contributed over 70 per
cent in 1990 (Table 3). In particular, Italy’s share fell from 41 per cent to 29
per cent over the 1990s. In the case of electric cookers, EU countries
contributed 91 per cent of imports into the UK in 1990 but 78 per cent in 2000

31
(Table 4). Italy’s share again experienced a noticeable decline in this period,
from 68 per cent to 52 per cent.
There has been little change in the share of North American imports to UK.
The share of North America in refrigerator imports to the UK increased from
1.7 per cent of in 1985 to 4.7 per cent in 2000. In the case of electric cookers
imports to the UK, the share of North America averaged about one per cent
throughout the 1980s and 1990s (1.1 per cent in 1985 and 0.7 per cent in
2000).
The remarkable change in imports, especially of refrigerators, is the growth
that has taken place in the share of the ‘Rest of the World’. The countries so
classified increased their share from 12 per cent to 38 per cent between 1985
and 2000. The major growth has come from Turkey, a low wage economy,
with an increase from 9 per cent in 1985 to over 17 per cent in 2000. South
Korea has also achieved an increase in share, from nearly 3 per cent to 7 per
cent, with a similar increase for Hungary over these same years.
The increased share in imports from ‘Rest of the World’ countries is more
modest in the case of electric cookers, from 16 to 21 per cent between 1985
and 2000, and this with some fall in the middle years. Here again, though, the
contribution of Turkey is plain to see, with a rise from one per cent to 17 per
cent over the decade till the end of the century (details for electric cookers
only and refrigerators for particular countries are provided in Table 5). Turkish
goods were first aimed at the bottom end of the market and sent direct to

32
large electrical retailers such as Comet. They were not to be found for sale in
kitchen specialist outlets. But producers in the UK anticipate that they will
attempt to climb the market. Already though there is a shift from imports being
sourced from within the EU to them being sourced from the EU (itself
undergoing enlargement) and the EU periphery, and to a smaller extent from
right outside the European region.
Table 3: Direction of Trade for Refrigeration Appliances (As percentage of Total)
1985 1990 1995 2000 Imports Exports Imports Exports Imports Exports Imports Exports
EU 86.0 71.5 72.3 54.9 57.5 60.9 57.1 68.5North America
1.7 2.4 2.8 8.8 4.4 7.9 4.7 8.9
Rest of the World *
12.3 26.1 24.9 36.3 38.1 31.2 38.2 22.6
* The shares of Japan, Australia, New Zealand and the non-EU countries of western Europe were of minor importance. Detailed information is available in the Tables for Direction of Trade. Table 4: Direction of Trade for Electric Cooking Appliances (As percentage of Total)
1985 1990 1995 2000 Imports Exports Imports Exports Imports Exports Imports Exports
EU 82.5 86.5 91.1 77.1 87.5 85.3 78.1 83.6North America
1.1 0.9 1.1 0.3 1.0 1.4 0.7 1.0
Rest of the World *
16.4 12.4 8.8 19.9 12.5 13.3 21.2 15.4
* As for previous Table.

33
Table 5: Direction of Trade by Countries (Percentage Contributions)
Electric Cookers Refrigerators 1990 2000 1990 2000 Imports Exports Imports Exports Imports Exports Imports Exports
Total EU 94.0 77.1 78.1 83.6 68.1 54.9 57.1 68.5France 5.1 0.2 3.2 3.5 9.0 4.4 6.5Belgium and Luxembourg
0.4 2.6 0.1 0.0
Netherlands 0.1 0.3 1.9 0.1 4.1Germany 13.9 7.0 19.3 13.4 18.9 18.7Italy 68.7 0.5 52.2 40.5 10.8 28.2 1.4Irish Republic 2.5 75.9 2.5 83.4 0.1 12.0 0.1 31.4Denmark 1.9 2.0 3.2Portugal 0.3 11.0 0.4 2.2 0.4Spain 0.5 0.1 2.9 0.3 0.3Sweden 0.5 0.3Austria 2.1 2.0 0.4 1.0Finland 0.0 0.3Greece 0.3 0.2 0.0 0.3Total Non-EU Developed Countries
1.4 0.3 1.0 9.2 3.3 17.2 5.6 3.7
Norway 0.3 1.4 0.0 0.3Switzerland 0.3 0.3 1.9 0.9 2.1USA 0.7 0.3 0.7 1.0 3.0 8.8 4.7 1.2Canada 0.4 Japan 5.1 0.4 0.1Australia 7.0 New Zealand 1.2 Rest of the World*
4.6 22.6 20.9 7.2 28.6 27.9 32.8 27.8
Turkey 1.0 17.7 9.1 17.4 0.9Hungary 0.5 2.6 6.1 0.0Poland 3.7 0.6 Czech Republic
0.1 0.3 0.0 0.8
Slovenia 5.6 1.9 2.7 0.0Romania 2.5 0.8 0.0 0.5Russia 1.1 Bulgaria 1.1 South Korea 2.8 7.1 0.0China 1.8 0.0Nigeria 7.1 0.0 0.0Kenya 15.1 0.8 0.0 1.2Qatar 1.4 Mauritius 4.2 Tanzania 0.2 0.1 0.6 0.0 1.1South Africa 0.1 1.2 0.3 * List is of selected countries only

34
The pattern of exports from the UK can be seen from Tables 3 - 4. In 2000,
EU countries accounted for about 69 per cent of refrigerator exports from the
UK, 32 per cent going to Ireland, whose share had increased substantially
over the decade and 19 per cent to Germany (Table 5). In the case of electric
cookers, the EU accounted for 84 per cent of exports– nearly 100 per cent of
these going to Ireland (which was described by a manager at one large
manufacturer as part of the ‘home’ market). Australia, with 7 per cent was the
only other export market that was at all significant.

35
Growing Concentration of Ownership (and the Hidden Face of Oligopoly)
Most of the world’s regions are dominated by a few multinationals (further
details on Regional Market Concentration are provided in Appendix D). These
corporations are likely to implement their own production systems wherever in
the globe they settle and this means that low wage overseas producers are
therefore unlikely to be left behind in terms of technical and organisational
innovation. In these circumstances the pressure is on to increase market
share and volume, to develop common platforms and to gain from other
economies of scale by further rationalisation and the purchase across sites of
materials and components (not least of course components cheaply produced
abroad). One case in point is Stoves, which was badly affected by imports
from East Europe in 1999 and which, when faced with falling profits as a
consequence of this, began to eagerly search for alliances with other white
goods firms across Europe to get better prices for steel and components
(Gracie 1999). Another is Glen Dimplex, an Irish-based company that also
owns British production facilities (including Stoves which it took over in 2001).
The company now buys in $100 million of electrical components every year
from China – and no less significantly it has had Chinese suppliers for 15
years (Brown, 2002).
To a significant extent, competition between firms in the UK is no longer
competition between British-based companies or even between British firms
and non-British ones. For the most part, the British white goods industry is
owned and operated by non-British based companies, with the UK the site of

36
competition between global players. However, this development is not
necessarily evident to the consumer. Brand names can make it difficult to tell
which firm’s products they are buying. The Swedish owned Electrolux has so
many brands (25 different ones in Europe alone) that it has come to regard
this as a marketing problem and plans to reduce the number to three (Brown-
Humes 2002). The profusion of brand is of course a function of past growth by
acquisitions. Over the last 30 years or so, Electrolux claims to have bought
450 companies (Business Week, 2002).
Such is the situation with respect to cooking appliances that in 2000 UK
buyers were offered, among others, Cannon, Creda and Hotpoint machines
(all from GDA, the last two at that time accounting for 12 and 9 per cent of the
market respectively); they were also offered machines which were apparently
made by firms called Zanussi, AEG, Electrolux, Tricity Bendix and Parkinson
Cowan (all of which came from Electrolux, the first three accounting for 9, 8
and 3 per cent of the market respectively); and they could also choose Indesit
machines, actually from Merloni (accounting for another 3 per cent of the
market). In effect, despite the several brand names, five firms controlled over
half the UK market in 2000 (Table 6). Concentration has proceeded yet faster
since then. Until 2002, Marconi from the UK (previously called GEC) owned
GDA on a 50/50 basis with GE from the US. But faced with mounting
difficulties in its other operations, in that year Marconi sold its share to the
Italian firm Merloni. At this point any British ownership was voided from the
top five. Merloni also bought GE’s 50 per cent stake, thus making for further
concentration.

37
Table 6: Ownership and Brand Shares of Retail Volume: Cooking Appliances, 2000
Ownership
Country of
Brand Owner
Brand names
Brand share in retail volume
(Per cent)
Company share in
retail volume
(Per cent) Creda
12.1 General Domestic Appliances Ltd
USA / UK
Hotpoint 9.321.4
Zanussi 9.2AEG 8.4
Electrolux UK Ltd
Sweden
Electrolux 3.521.1
Whirlpool UK Ltd
USA Whirlpool 4.1 4.1
Merloni Domestic Appliances Ltd
Italy Indesit 3.5 3.5
Bosch Home Appliances Ltd
German Bosch Siemens
3.0 3.0
SHARE OF TOP 5 COMPANIES 53.1Private Label* 3.4 3.4Others 43.5 43.5Total 100.0 100.0
*Exclusive to certain retailers

38
In cooling appliances the market is even more concentrated than in cooking
(Table 7). In 2000 the top five companies held 68 per cent of the refrigeration
appliances market. Again, Marconi’s sale of its 50 per cent share in GDA to
Merloni voided British ownership from the top five and Merloni’s purchase of
GE, previous share in GDA has further increased market concentration. In
fact, Merloni’s acquisition of GDA has now given it 30 per cent of the UK white
goods market, making through what many regard as the traditional, British,
Hotpoint brand (Marsh, 2003).

39
Table 7: Ownership and Brand Shares of Retail Volume: Refrigeration Appliances, 2000
Ownership
Country of Brand Owner
Brand name
Brand share in retail volume
(Per cent)
Company share in
retail volume
(Per cent) General Domestic Appliances Ltd
USA / UK Hotpoint 22.0 22.0
Lec
Malaysia Lec 12.5 12.5
Zanussi
11.5 Electrolux
Sweden
Electrolux 10.0
21.5
Merloni
Italy Indesit 7.2 7.2
Bosch Germany Bosch 5.0 5.0SHARE OF TOP 5 COMPANIES
68.2
Private Labels 6.9 6.9Others 24.9 24.9Total 100.0 100.0

40
World-wide there are moves by the major domestic appliance manufacturers
to enter low cost producer countries. In Eastern Europe for example Merloni
completed building plants in Poland and Russia in 2000 and has acquired
another refrigerator plant in Russia. Candy of Italy, which took over Hoover in
1995, announced the construction of a refrigerator and freezer factory in the
Czech Republic in 2002 and is setting up plants in Turkey, China and other
countries. Polar SA, a major Polish producer was bought by Whirlpool in
2002. By the December of that year it was planned to transfer production of
the group’s washing machines to Poprad and to cut jobs at Amiens, France
(FT.com 2002). The next year Whirlpool announced that production in its
PolarSA factory in Wroclaw was to be moved to Slovakia where its factory in
Poprad was already producing washing machines. In 2001 Bosch
consolidated its shareholdings in a subsidiary in Romania and also in one in
Portugal. In the first half of 2003 Merloni’s Lodz-based cooker plant, in which it
had $60m invested since 1999 and which was due for another $20m to start
production of a new type of cooker, exported almost 80 per cent of its total
production (Polish News Bulletin 2003).
Inside the UK, in 2002 the Turkish firm Arcelik bought out the brand names,
‘Leisure’ and ‘Flavel’ from the British oven producer Leisure Consumer
Products. The ultimate owner of these products, Glynwed International,
changed its name to Aga Foodservice in 2000, its decline having rightly been
said to signal ‘the further decline of the once-mighty Midlands metal-bashing
industry’ (Guthrie 2001). As already reported, the turn of the century also saw

41
Glen Dimplex, a private Republic of Ireland firm, take over Stoves, which had
manufactured cooking products on Merseyside under various brands and
ownership since 1920, and which had bought the loss making Valor Cookers
from Yale and Valor ten years earlier and more recently New World. Stoves
thereby joined Belling, another well known brand name, and a producer of
cooling and cooking appliances and other white goods brands which Glen
Dimplex had taken over in 1992. And of course, Merloni is now the major
player in the UK white goods market.

42
The Future of Domestic Appliance Manufacture in the UK
In many ways the industry has performed worse than British manufacturing as
a whole. The bare bones of this adverse comparison are that whereas in the
1990s turnover remained flat in manufacturing as a whole, even showing a
slight increase, it actually fell in domestic appliances (Figure 13); that the
share of value added in turnover in domestic appliances also trended below
that in manufacturing for the whole of the period; that whereas in the 1980s
labour’s share in value added generally ran at a lower level in domestic
appliances than in manufacturing as a whole, it ran at a higher level in the
1990s (Figure 4); and that whereas in the case of manufacturing as a whole
imports increased from 15 per cent in 1979 to 46 per cent in 2000, in domestic
appliances the same years saw a rise from 34 per cent to 80 per cent.

43
Figure 13: Turnover in Domestic Appliances Manufacturing and Overall Manufacturing (Index for 1995 Prices, 1979=100)
020406080
100120140
1979
1980
1981
1982
1983
1984
1985
1986
1987
1988
1989
1990
1991
1992
1993
1994
1995
1996
1997
1998
1999
2000
Overall Manufacturing Domestic Appliances Manufacturing
Figure 14: Employees’ Total Compensation Compared to Gross Value Added (Percentages)
0
20
40
60
80
100
1979
1980
1981
1982
1983
1984
1985
1986
1987
1988
1989
1990
1991
1992
1993
1994
1995
1996
1997
1998
1999
2000
Manufacturing Domestic Appliances
It is difficult to attribute this comparatively worse performance to any special
characteristics of the work force. According to LFS data although in 2002
trade union density was slightly higher in domestic appliances (34 per cent)
than in manufacturing as a whole (26 per cent), the industry’s employment
profile was rather similar. Temporary workers of all kinds – contracted
workers, agency workers, casual workers and others – amounted to 3 per

44
cent of the workforce in domestic appliances and 4 per cent in all
manufacturing. Part-time workers amounted to 8 per cent of the work force
compared to 9 per cent. The industry was not even a bastion of white male
workers – not to a greater extent than manufacturing as a whole anyway. In
domestic appliances 30 per cent of the labour force were women, compared
to 27 per cent for all manufacturing; similarly 6 per cent were non-white
compared to 5 per cent for all manufacturing. The key difference is that wages
in domestic appliances are lower. In Autumn 2002 average gross weekly
earnings for domestic appliance workers stood at £355 compared to £410 in
manufacturing as a whole and they were 10 to 20 per cent lower than for
manufacturing as a whole for the whole of the decade (Appendix E). The
problem is that although wages in domestic appliances are lower than for UK
manufacturing as a whole, they are not low compared to some of the
international competition.
The UK-based industry first suffered from the invasion of the European region
by Italian producers. Then it was exposed to increased imports from Turkey
and other countries on the periphery of the EU (some of which will soon be
politically incorporated, a fact not lost on Whirlpool and other giants of the
industry who are moving in). Now it is also being exposed to competition from
right outside the region, from East Asia. Whatever else these countries have
offered – and Italy contributed design just as today South Korea contributes
electronics – the common element has been cheap labour. Indeed in the case
of South Korea – which performs the remarkable fact of exporting to the UK
despite current transportation costs- labour is not simply cheaper but highly

45
flexible. One leading Korean white goods firm operates on 50 per cent agency
labour, and with a company union (Nichols et al, 2004). Other firms operate
with no union at all. And China has begun to make an appearance in the
import figures, and a further contribution, not so visible, through the provision
of components for the domestic appliances that are still made in the UK.
In the 1990s the redundancy pay that swelled labour costs squeezed value
added. If redundancies ceased this would therefore make for some reduction
in labour costs. Even then, compared to Turkey, East Europe and East Asia
wages would still be ‘too high’. It is most unlikely that they will be driven low
enough to compete with foreign imports– or indeed that redundancies will
cease.
Attempts to modernise methods of production have been carried out. British
companies have stripped down their plants already. As an industry trade
union official put it:
Oven factories used to have their own foundries, paint shops and
machine shops. Today, they’re like big Meccano shops.
In the 1980s, Hotpoint, owned by GDA, faced by increasingly aggressive and
sophisticated competitors, changed its work methods. A Total Quality
programme was started in 1989 and after an initial failure was then pushed
further. The number of reporting levels was reduced; company plans were
cascaded down into departmental and individual plans; an appraisal system

46
was introduced; shop floor training audits were instituted; and team work was
introduced. As a result substantial cost savings were claimed at the
Peterborough factory, which was recognised as an Investor in People, and
company managers claimed response times for customer order to delivery fell
from 19 weeks to 8 days, with Peterborough Hotpoint claiming to achieve
results equal to those at general Electric’s Lousiville plant. In another
development, in the 1990s the oven producer, Stoves, was celebrated in the
business press for the introduction of a flexible manufacturing system which
offered customers 2000 or so variants (Gracie 1999) . But highly flexible as
this was, trade union officials report that within months of Glen Dimplex taking
over that it had cut the number to less than half.
Especially in cooking appliances, there are niche markets that established and
more often, small new companies can enter. Custom-made iron ranges are a
case in point (Marsh, 1998). But to flourish in volume production is much more
difficult. Prominent strategies that have been attempted already are to
specialise in fridges/fridge freezers/chest freezers or to specialise in built-in or
free-standing cookers or to add some bells and whistles or do both. And of
course branding remains central to the operation of the industry. Such is the
profusion of models that has resulted that in February 2003 Comet, the high
street electrical retailer, offered around 310 different cooling appliances priced
from £150 to £1,300 and around 360 different cooking appliance items priced
from £500 to £1900. Products now vary in terms of colour, height, width,
electronic technology, energy use and styling (though this is very much a
minimum list) and in the case of cookers, that is now gas or electric or dual

47
use. Amongst the cooling appliances that Comet offers there are 134 Fridge-
Freezers including 13 different types of American style larger Fridge-Freezers,
89 Fridges, 68 upright Freezers, 15 Chest Freezers, and four Chillers (for
drinks). Brands on offer include Hotpoint, Bosch, AEG, Beko, Lec, Liebherr,
LG, Indesit, Hoover, Candy, Daewoo, Mielle, Neff, Proline, Samsung,
Scandinova, Servis, Siemens, Tricity, Whirlpool, Zanussi, Asko and Brandt. In
cooking appliances, there are 126 different types of Electric/Dual fuel Range
Cookers, 114 Free-Standing Electric Cookers, 91 Gas Free-Standing
Cookers, 19 Dual Fuel Free-standing cookers, 11 Electric built-in ovens.
Brands include Rangemaster, Belling, Stoves, Cannon, Delonghi, Leisure and
Zanussi. Such is the strategy for brand loyalty that producers place a great
deal of emphasis on after-sales service agreements, through which they seek
to tie-in customers and which, in any case, according to unquantified claims
by some company managers are a more profitable use of time than the
business of actually producing domestic appliances.
Another strategy to counter high margins is to get into the high value end of
the market – but this by definition is only part of the market and various firms
are there already – the ovens producer Aga for example. In fact, the UK white
goods product market is now so differentiated that part of it even caters to the
buyer who wants something like an Aga but can’t afford the real thing. Yet
another strategy is to get into the market for fitted kitchens, which are stocked
with a range of a particular producer’s white goods – the oven, washing
machine, fridge-freezer, even small appliances such as kettles. But here, too,
there is competition.

48
Continued foreign dominance of the UK market and further concentration of
ownership and contraction of employment look likely. The UK home market, is
dominated by imports and imports from low wage countries have been on the
rise. This market lacks any significant expansion in refrigerators and to a
lesser extent in cookers. In this situation, UK-based producers face a number
of difficult choices if they are to remain in this highly competitive market. The
industry has been in secular decline. A strategy that remains to be tried to any
great extent in cooking and cooling appliances is the one recently pursued by
Dyson, the vacuum cleaner producer. In 2002, in the pursuit of cheap labour,
the company switched production of its bag-less cleaner from Malmesbury,
Wiltshire to Malaysia with the loss of 800 local jobs (Gibbs 2002); it made a
further such switch in 2003. It remains to be seen whether other
manufacturers in the industry will begin to take this option and reverse out of
the UK and indeed the EU region into its periphery and beyond. Even if this
does not occur, the pattern of imports is now such that the importance of the
EU region has declined, albeit this decline has to be seen in the context of a
double process of restructuring whereby the political form is catching up with
the economic, Turkey having joined the EU Customs Union in 1996 and
Hungary and other ‘EU 15’ countries being scheduled to join the EU from
2004.

49
References
BBC (2003) ‘US Company Moves from Poland to Slovakia to Reduce Production costs’ BBC Monitoring Services, January 3.
Bocock, M. (1992) ‘Consumption and Lifetsyles’, in R. Bocock and K. Thompson (eds) Social and Cultural Forms of Modernity, Cambridge: Polity Press in association with the Open University.
Brown, J. M. (2002) ‘Glen Dimplex Has Hot Idea for Cold China’ Financial Times 6 June
Brown-Humes, C (2002) ‘Electrolux: A Careful Clean-up to Consolidate the Company’ Financial Times, 5 August
Business Week (2002) ‘Electrolux Swings into America’, Business Week, 23 September.
Cockburn, C. and Furst-Dilic, R. (1994) Bringing Technology Home: Gender and Technology in a Changing Europe, Buckingham: Open University Press.
Conacher, G. (1971) Electric Cookers, London: Forbes Publication Limited.
Corley, T. (1966) Domestic Electrical Appliances, London: Jonathan Cape.
Dicken, P. (1992) Global Shift: The Internationalization of Economic Activity, London: Paul Chapman.
Dunning, J.H. (1993a) The Globalization of Business, London: Routledge.
Dunning, J.H. (1993b) Multinational Enterprises in a Global Economy, Wokingham, Surrey: Addison-Wesley.
Edwards, P. and Elger, T. (eds. (1999) The Global Economy, National States and the Regulation of Labour, London: Mansell.
Euromonitor (2002) White Goods in China, October, Full Report is available on http://www.euromonitor.com/gmid/
FT.com (2002) ‘Whirlpool to Cut Jobs in Northern France’ [Abstracted from Les Echos’ 16 October] Ft.com. 17 October

50
George,N. (2001) 'Electrolux to Cut a Further 2,800 jobs' Financial Times, 15 December.
Gibbs, G. (2002) ‘Beating a Retreat from Britain’, The Guardian, 4 October.
Goldthorpe, J., Lockwood, D., Bechhofer, F. and Platt J. (1969) The Affluent Worker in the Class Structure, Cambridge: Cambridge University Press.
Gracie, S. (1999) ‘Coping with the Over-heated Pound’, The Sunday Times, 11 July.
Guthrie, J. (2001) ‘Latest Chapter of the Aga Saga Reaches a Close: The Break-up of Glynwed Marks Another Stage in the Decline of Midlands Engineering, Financial Times, 23 January
Hardyment, C (1988) From Mangle to Microwave, Cambridge: Polity Press in association with Basil Blackwell.
Hirst, P. and Thompson, G. (1999) Globalization in Question: The International Economy and the Possibilities of Governance, Second Edition; Cambridge: Polity.
Hoekman, B. and Kostecki, M. (2001) The Political Economy of the World Trading System: The WTO and Beyond, Second Edition; Oxford: Oxford University Press.
Houghton, J. (1972) Gas Cookers, London: Forbes Publications Limited.
Hudson, R (2001) Producing Places: Perspectives on Economic Change, New York: Guilford Publications.
Kozul-Wright, R. (1995) ‘Transnational Corporations and the Nation State’, in J. Michie and J. Grieve-Smith (eds.) Managing the Global Economy, Oxford: Oxford University Press, pp. 135 – 171.
Lockwood, D. (1960) ‘The “New Working Class”’, European Journal of Sociology, 1 (2).
Marsh, P (2003) ‘Merloni Builds Market Share’, Financial Times, 8 September.
Marsh, P. (1998) ‘When the Thoughts of Tumble Dryer Makers Turn to Summer’, Financial Times, 27 March.
Michie, J. and Grieve Smith, J. (eds.) (1995) Managing the Global Economy, Oxford: Oxford University Press.

51
Nichols, T., Cam, S., Tongqing, F., Wei, Z., Chun, S., and Chou, W. (2004) ‘White Goods in East Asia’ forthcoming.
Office of National Statistics (ONSa) (various years) Annual Employment Survey (AES), GSS, London: HMSO
Office of National Statistics (ONSa), Consumer Trends, HMSO, various years
Office of National Statistics (ONSc) (2000) Annual Business Inquiry (ABI): Employee Analysis, GSS, London: HMSO.
Ohmae, K. (1990) The Borderless World, London: Collins.
Ohmae, K. (1995) The End of the Nation State: The Rise of Regional Economies, London: Harper Collins
Paba, S. (1986) ‘“Brand-naming” As An Entry Strategy in the European White Goods Industry’, Cambridge Journal of Economics, 10: 305 – 318.
Paba, S. (1991) ‘Brand Reputation, Efficiency and the Concentration Process: A Case Study’, Cambridge Journal of Economics, 15: 21 – 43.
Polish News Bulletin (2003) ‘Producer of Household Appliances Plans More Investment in Poland’, Polish News Bulletin 25 July.
Russo, L. (2002) ‘What’s Cooking in Kitchen Collectables’, The Collector Newsmagazine, www.drspublishing.com/thecollector/feature.htm
Slater, D. (2000) ‘Looking Backwards’, in M. Lee (ed.) The Consumer Society – Reader, Oxford: Blackwell.
Weightman,G. (2003) The Frozen Water Trade: How Ice from New England Lakes Kept the World Cool, London: HarperCollins.
Williams, K., Haslam, C., Johal, S. and Williams, J. (1994) Cars: Analysis, History, Cases, Oxford: Berghahn Books
World Appliance Companies (2002) World Appliance Companies, Oak Brook, Illinois. Dana Chess Publications, Inc.

52
Appendices

53
Appendix A: Market Characteristics
Penetration rates for domestic appliances in the UK have increased in recent
decades. By 2000, 99 per cent of households had refrigeration and cooking
appliances (Table A.1). This is basically in line with the penetration rates of
many other domestic appliances. For example, telephones 96 per cent,
washing machines 93 per cent, central heating 91 per cent. Yet although there
is certainly a sense in which both cooking and cooling appliances may be said
to constitute ‘mature’ markets, significant changes have also taken place
within them. In the case of cooling appliances, for example, while the
proportion of households which had fridge-freezers increased from 27 per
cent to almost 40 per cent between 1979 and 2000, the proportion for
refrigerators actually declined from 80 per cent in 1979 to 42 per cent in 2000
(Figure A.1).
Table A.1: Percentage of Households with Durable Goods Car /
Van
Central
Heating
Washing
Machines
Telephone Cooling
Appliances
Microwave Cooking
Appliances*
1970 52 30 65 35 66 - -
1975 57 47 72 52 85 - -
1980 60 59 79 72 95 1 -
1985 63 69 83 81 98 19 -
1990 67 79 86 87 98 52 -
1995 70 85 91 91 99 70 -
2000 74 91 93 96 99 80 99
*Data incompatibility in various years means that long-term time series for aggregated cooking appliances data is not available for household penetration rates.

54
Figure A.1: Cooling Appliances Household Penetration Rate (Percentages)
0
2040
6080
10019
79
1980
1981
1982
1983
1984
1985
1986
1987
1988
1989
1990
1991
1992
1993
1994
1995
1996
1997
1998
1999
2000
Refrigerators Freezers Fridge and Freezer
Similar changes are evident in the case of cooking appliances. The data for
historical trends is available only for free-standing and build-in cookers, but
this suggests important changes have occurred in the sorts of cooking
appliances used by households. Thus, the penetration rate for build-in gas
and electric cookers rose from 8 per cent to 25 per cent between 1979 and
2000 but that for free standing cookers actually declined from 40 per cent in
1979 to 30 per cent for the same years (Figure A.2). Moreover, although
microwaves are not included in the statistical category for cooking appliances
in this study, it should be noted that there was a continuous growth in the
household penetration rates of microwaves in the 1980s and 1990s with
obvious implications for some other products.

55
Figure A.2: Cooking Appliances Household Penetration Rate (Percentages)
0
2040
6080
10019
79
1980
1981
1982
1983
1984
1985
1986
1987
1988
1989
1990
1991
1992
1993
1994
1995
1996
1997
1998
1999
2000
Microwave Free-Standing Build-In
Market dynamism in white goods is not only a function of aggregate market
penetration or even the penetration of more tightly defined sub-products
however. There are various demographic factors that also play a part. Some
of these run counter to the major fact that the British population is relatively
stable compared to the population of some ‘emerging market’ economies. For
example the UK has seen a growth in the number of households (Table A.2).
This reflects a decline in the average size of households- down from 2.9 in
1970 to 2.3 in 2000. The growth of one-person households is particularly is
notable both in relative and absolute terms –up from 3.1m in 1970 to 7.2m in
2000. To a potential increase in demand from this source and from an
increase in the stock of dwellings has to be added the increase in the number
of paid females – up by over 40 per cent between 1970 and 2000. Changes in
the number of property transactions have perhaps been less helpful in the
generation of demand over the long term and –despite manufacturers’
attempts to attract consumers with increased energy efficiency and other
innovative and design features – the fact remains that domestic appliances

56
purchases in the UK are now largely for replacement rather than first time
buys. This is particularly so for cooking and cooling appliances. In 2000, 80
per cent of sales of cooking and cooling appliances were replacement
compared to 75 per cent of laundry appliances, and 15 per cent of
dishwashers.

57
Table A.2: Demographic/Social Factors on the Market
One-Person households
(m)
One-Person Households As % of All
Households)
Average Household
size
Number of Households
(m)
Women Workers
(000)
Property transactions
(000)
Stock of Dwellings
(m)
1970 3.1 17 2.91 18.3 8,962 1,407 16.1
1975 3.7 20 2.78 18.8 9,719 1,391 16.9
1980 4.3 22 2.70 19.5 10,347 1,292 17.5
1985 5.1 24 2.56 21.1 10,173 1,796 18.5
1990 5.9 26 2.48 22.4 11,604 1,620 19.4
1995 6.6 28 2.40 23.5 11,599 1,318 20.3
2000 7.2 29 2.29 24.5 12,647 1,471 21.1

58
Replacement is not a frequent event. The majority of people in the UK cannot
afford to replace an expensive item such as a cooker or a washing machine
until it breaks down or poses a threat to health. Further, the life of domestic
appliances tends to increase not only because of technological improvements,
but also because of changing life styles. In the cooking appliances sector, for
instance, consumer use is changing, and even people who enjoy cooking are
less likely to prepare a meal at home every night. Eating out, buying
takeaways or microwave meals are all more common in the UK today than
they were five or 10 years ago. This means that the cooker is used less than
ever, and will therefore last longer. Replacement rates are now 11 to 13 years
for the majority of large kitchen appliances (Table A.3).
Table A.3: Replacement Cycles of Selected Large Kitchen Appliances by Sector 2000
Number of years:
1 to 5
6 to 9
10
11 to 13
14 to 16
over 16
Refrigeration appliances
–
–
X
–
–
–
Home laundry appliances
–
–
–
X
–
–
Dishwashers – – – X – –
Large cooking appliances
–
–
–
X
–
–
Microwaves – X – – – –

59
Appendix B: Product Composition
In general, the composition of cooking appliances manufactured in the UK has
undergone some change over the past two decades in terms of type of
product.
Cooking Appliances.
The 1980s witnessed a rise in electric cookers and a decline in the much
smaller market for hoods (Figure B.1). The 1990s, on the other hand,
witnessed a rise in gas cookers at the expense of electric cookers.
Figure B.1: Share of the Different Types in Cooking Appliances manufacturing (As percentages of total unit numbers)
0
20
40
60
80
100
1979
1980
1981
1982
1983
1984
1985
1986
1987
1988
1989
1990
1991
1992
1993
1994
1995
1996
1997
1998
1999
2000
Gas Cookers Electric Cookers Hoods
Although we are not concerned with microwaves, the opportunity is taken here
to document their rise. The number of microwaves manufactured in the UK
increased from 119,000 in 1984 to 805,000 in 2000 (Figure B.2). In these
years total turnover also rose in real terms, from £25m to £65m (Figure B.3).
Even so, a slower growth in the latter compared to the former reflected on a
decline in unit prices for microwaves -down from £210 in 1984 to £80 in 2000.

60
It can be seen, then, that microwaves have also experienced a problem of
falling value.
Figure B.2: Microwaves, UK-Based Manufacturing, Number of Units, (Thousands)
0
200
400
600
800
1000
1200
1984
1985
1986
1987
1988
1989
1990
1991
1992
1993
1994
1995
1996
1997
1998
1999
2000
Figure B.3: Microwaves, UK-Based Manufacturing, £m, 1995 Prices
0
20
40
60
80
100
120
1984
1985
1986
1987
1988
1989
1990
1991
1992
1993
1994
1995
1996
1997
1998
1999
2000

61
Cooling Appliances As noted in Appendix A, the 1980s and 1990s saw a long-term growth in the share
of fridge-freezers in total cooling appliances units manufactured in the UK,
despite a decline in the second half of the 1980s. This growth in fridge-
freezers was largely at the expense of refrigerators whilst the production of
freezers have largely remained stable in relation to total production.
During the 1980s, there was a decline in the proportion of refrigerators in the
total number of cooling appliances manufactured in the UK; it went down from
53 per cent in 1979 to 38 per cent in 1990 (Figure B.4). This decline has been
opposed by an increase in the share of fridge-freezers production in the total;
it increased from 20 per cent in 1979 to as high as 45 per cent in 1985,
although it declined to 36 per cent in 1990. Despite some fluctuations, on the
other hand, there was no substantial change in the share of freezers in
cooling appliances manufacturing with an annual average of 24 per cent
during the 1980s.

62
Figure B.4: Share of the Different Types in Cooling Appliances manufacturing (As percentages of total unit numbers)
0
20
40
60
80
10019
7919
8019
8119
8219
8319
8419
8519
8619
8719
8819
8919
9019
9119
9219
9319
9419
9519
9619
9719
9819
9920
00
Refrigerators Freezers Fridge-Freezers
In the 1990s, cooling appliances production has maintained its shift to fridge-
freezers at the cost of refrigerators. Fridge-freezers represented 47 per cent of
the total in 2000. Refrigerators’ share in total unit production of cooling
appliances on the other hand declined to 28 per cent -from 38 per cent in
1990. Despite some fluctuations, there was no substantial change in the share
of freezers in the cooling appliances manufacturing with an annual average of
26 per cent during the 1990s.

63
Appendix C: Compensation and Compensation per employee
In domestic appliances manufacturing, it was not possible to produce time
series for wages as opposed to employees’ compensation since the data is
not strictly comparable for each year. It should be noted therefore that
employees’ compensation covers pay for redundancies and the contribution
employers to social security. Data for redundancy payments are subject to
inconsistent definition and we have not been able to quantify their
contribution. In the case of employers’ contribution to social security there was
a decline in the proportion of employers’ contribution to wages in the 1980s –
from 18 per cent in 1979 to 13 per cent in 1990. In the 1990s, on the other
hand, this proportion did not decline but remained basically stable.
Compensation per Employee
Despite a relative sluggishness in the 1980s and early 1990s, there has been
a noticeable growth in compensation per employee in domestic appliances
overall. This has been so in both electric and non-electric domestic
appliances.

64
Table C.1: Compensation Per employee, Annual Averages, (£, 1995 Prices)
Manufacturing
Domestic Appliances
Electric Domestic
Appliances
Non-Electric Domestic
Appliances 1979 13749.4 12603.0 12626.7 12521.1 1980 13606.8 12594.8 12684.8 12277.2 1981 13934.7 12860.0 12900.4 12688.2 1982 14080.2 12471.3 12470.8 12473.2 1983 15152.8 12645.7 12672.9 12556.0 1984 14897.6 13021.6 12791.0 13888.4 1985 15435.4 13174.1 13121.9 13357.3 1986 15781.2 13679.8 13651.4 13781.8 1987 17431.6 14249.0 14311.3 14020.9 1988 17175.9 14450.3 14283.9 15143.9 1989 16382.9 14171.3 14168.2 14183.5 1990 16232.2 14019.8 13895.4 14507.9 1991 16224.6 15618.2 15361.6 16664.9 1992 16609.3 17084.9 16991.1 17457.4 1993 17044.9 18623.4 18734.7 18193.3 1994 18905.9 19255.4 19405.3 18663.0 1995 18986.0 18917.9 18972.4 18847.9 1996 18551.9 19445.1 18520.3 23207.2 1997 18815.4 22837.2 21935.9 25030.4 1998 18947.7 21858.8 20831.8 24610.6 1999 21324.2 23448.8 22937.9 24162.6 2000 23135.2 23701.9 23269.8 24047.4
The yearly average compensation per employee in domestic appliances was
£12,603 in 1979 (Table C.1). There was no significant difference between the
electrical and non-electrical sub-sectors. No substantial change ensued during
the 1980s. But there was a definite increase starting in 1993 and continuing
during the rest of the 1990s. Compensation per employee was £17084 in
1993, it had reached £23701 in 2000. This growth was largely comparable in
electrical and non-electrical domestic appliances. In electricals it grew from
£16991 in 1993 to £23268 in 2000. In non-electricals it grew from £17457 to
£24047.

65
Total Compensation of Employees
The massive job losses in British domestic appliances have meant that total
employee compensation has followed a different path to that of compensation
per employee. Total compensation of employees had actually declined 1979-
2000.
Total compensation of employees in domestic appliances went down from
£888m in 1979 to £600m in 1991, implying a decline of more than 30 per cent
(Table C.2). This was more pronounced than the 10 per cent decline for
British manufacturing in the UK, which fell from £10bn to £9bn.
Within domestic appliances, electric domestic appliances were most
responsible for the decline in the total compensation of employees in the
1980s. It represented 74 per cent of this decline, diminishing from £690 in
1979 to £475 in 1991. However, there was a proportionate decline in the
(smaller) non-electrical domestic appliances that went down from £197m in
1979 to £132m in 1991.
In the 1990s, the curve of total compensations in domestic appliances turned
up. It grew from £475m in 1991 to £690m in 2000. Yet this was still lower than
the £888m level of the 1979. (In this regard, domestic appliances differ from
the overall British manufacturing in the UK where the total compensation of
employees went up back to the 1979 £10bn level in 2000 –from £9bn in 1991.

66
The growth in total compensation of employees in non-electrical appliances
was noticeably higher during the 1990s than in electrical appliances. It grew
by 38 per cent up from £127m in 1991 to £175m in 2000, compared to only 8
per cent growth in electrical domestic appliances, up to £518m in 2000 from
£474m in 1991.
Table C.2: Employees’ Total Compensation, £m, 1995 Prices
Manufacturing Domestic Appliances
Electric Appliances
Non-Electrical Appliances
1979 101676.5 888.5 690.6 197.8 1980 96349.5 821.1 644.3 176.7 1981 88694.1 716.3 581.8 134.4 1982 84551.5 607.3 477.6 129.7 1983 85825.3 608.2 467.6 140.6 1984 87329.4 624.7 484.7 140.0 1985 91593.5 634.9 492.0 142.9 1986 93676.9 666.2 520.1 146.0 1987 99046.5 691.0 545.2 145.8 1988 102471.6 754.3 601.3 152.9 1989 97855.2 707.1 561.0 146.0 1990 96224.1 649.1 512.7 136.3 1991 91912.4 606.7 479.2 127.4 1992 89723.3 623.7 495.4 128.3 1993 90422.6 660.6 527.9 132.6 1994 92204.1 688.7 554.0 134.7 1995 93392.2 708.4 572.0 136.4 1996 93724.0 743.8 573.2 170.5 1997 94190.0 796.2 609.0 187.1 1998 94946.8 720.1 540.4 179.6 1999 104189.9 714.9 538.8 176.1 2000 109660.6 694.2 518.7 175.5

67
Appendix D: Regional Market Concentration
Three of the world’s biggest six appliance companies are American –
Whirlpool, General Electric (known as General Electric Appliances or GEA)
and Maytag (Table D.1). Whirlpool and Sweden’s Electrolux are prominent
players in most world regions.
Table D.1: Leading Major Appliance Companies in the World, Revenues 2001 Country Revenue
(US$bn) Whirlpool USA 10.3 Electrolux Sweden 8.9 General Electric Appliances (GEA)
USA 5.8
Bosch and Siemens Hausgerate
Germany 4.8
Haier China 4.5 Maytag USA 4.1 Merloni Italian 1.8
North America
Among the different world regions the domestic appliance market is most
concentrated of all in North America. Whirlpool is the leading player in the
North American domestic appliance market, holding (according to 1998 data)
28 per cent of the regional market (Table D.2). General Electric is the second
largest player, followed by Electrolux. Just five companies share nearly 80 per
cent of the market.

68
Table D.2: North America Domestic Appliances Market 1998 (Percentages)
Whirlpool Corp 28.0 General Electric 22.8 Electrolux AB 12.0 Maytag Corp 10.6 Raytheon Co 4.5 Private label 1.7 Others 20.4 TOTAL 100.0
Western Europe
Electrolux leads the domestic appliances market in Western Europe. It had 19
per cent of the regional market in 1998 (Table D.3). BSH was the second
largest player. These were then the only two companies holding more than 10
per cent of the regional market. But the situation has changed, with Merloni
now at 15 per cent (Marsh, 2003). The top five companies hold well over 50
per cent of the market between them.

69
Table D.3: Western Europe Domestic Appliances Market 1998 (Percentages)
Electrolux AB 19.1 Bosch-Siemens Hausgeräte GmbH 15.1 Whirlpool Corp 6.0 Miele & Cie GmbH & Co 5.5 Merloni Elettrodomestici SpA 5.2 EL.FI SpA 4.5 Candy Group 4.1 General Electric 3.0 Quelle Schickedanz AG & Co 2.9 Moulinex SA 2.9 Groupe SEB 2.2 Arçelik AS 2.0 MCC Mondragón Corporación Cooperativa
1.8
Dyson Appliances Ltd 1.1 The Gillette Co 1.0 Philips BV 0.8 Private label 2.9 Others 19.9 TOTAL 100.0
Asia-Pacific
The domestic appliances market in Asia-Pacific is one of the least developed
and the least concentrated. Only one manufacturer – Japan’s Matsushita -
commands a market share exceeding 10 per cent (Table D.4). Apart from
Haier Group (China), all of the top five players – who have 43 per cent of the
market between them - are Japanese manufacturers. The development of the
market in China has been characterised by the emergence of a considerable
number of small Chinese companies, there being in the region of 40-50 of
these. Here as elsewhere it is likely that the big fish will eat the little fish. On
one estimate there will be only four or five of these left in the next few years
(Euromonitor, 2002).

70
Table D.4: Asia Pacific Domestic Appliances Market, 1998 (Percentages)
Matsushita Electric Industrial Co Ltd 14.2 Toshiba Corp 7.9 Hitachi Electronics Ltd 7.2 Sharp Corp 7.0 Haier Group 6.9 Sanyo Electric Co 5.9 Kelon Group 2.0 Meilin Refrigerators Ltd 1.7 Xinfei Refrigerators Ltd 1.7 Jinan Washing Machines Ltd 1.5 Mitsubishi Electric Corp 1.5 Rinnai Corp 1.3 Wuxi Washing Machines Ltd 1.2 Paloma Industries 1.2 Shanglin Refrigerators Ltd 1.1 Harman Industries Int 1.1 Guangdong Gelanshi Microwave Ltd 1.0 Guangdong Shunde Aide Washing Machines Ltd
1.0
LG Group 1.0 Others 33.6 TOTAL 100.0
Latin America
Whirlpool has a leading position in the Latin American domestic appliances
market. Electrolux has nearly 10 per cent (Table D.5). The top five companies
again account for more than half of total sales.

71
Table D.5: Latin America Domestic Appliances Market 1998 (Percentages)
Whirlpool Corp 17.8 Groupo Vitro 9.7 Electrolux AB 9.3 Organización MABE 8.3 Bosch-Siemens Hausgeräte GmbH 7.7 Philips BV 5.0 General Electric 4.1 Black & Decker Corp 3.9 Vistar SA de CV 2.3 Sunbeam Mexicana SA de CV 2.2 Enxuta 2.1 Groupe SEB 1.9 Others 25.7 TOTAL 100.0
Eastern Europe
As in China, local manufacturers played an important role in the development
of the market in Eastern Europe. But eastern Europe has proved attractive to
the large international groups. In 1998, Polar of Poland was the largest
manufacturer in central Europe (Table D.6). In 2002, it was taken over by
Whirlpool. The American Whirlpool is the second largest company in the
regions’ markets for domestic appliances with a share of almost 12 per cent.
The top five accounted for just under half the market (46 per cent).

72
Table D.6: Eastern Europe, Domestic Appliances Market 1998 (Percentages)
Polar SA 12.3 Whirlpool Corp 11.9 Amica Wronki SA 8.2 Zelmer Sp zoo 7.2 Bosch-Siemens Hausgeräte GmbH 6.6 Mora AS 6.5 Candy SpA 6.2 Wrozamet SA 3.4 Gorenje Group 3.3 Eta AS 2.8 Merloni Elettrodomestici SpA 2.7 Electrolux AB 2.5 Ardo 2.4 Groupe SEB 1.9 Moulinex SA 1.8 Philips BV 1.4 The Gillette Co 0.8 Others 18.1 TOTAL 100.0
Note: Shares in Central Europe (Poland, Czech Republic, Hungary) only. Russia excluded.
Africa & the Middle East
A local manufacturer Defy Appliances, based in South Africa leads the
domestic appliances market in Africa & the Middle East (Israel and South
Africa). Kelvinator taken over by Electrolux in 1986, is the second largest
regional player. Electrolux has also its own extension in the African and
Middle Eastern markets, Electrolux AB as the fourth largest player after the
third largest Tadiran Ltd (Table D.7). Thus, the total share of Electrolux in
effect adds up to over 20 per cent -roughly equal to that of the largest single
company, Defy Appliances Ltd.
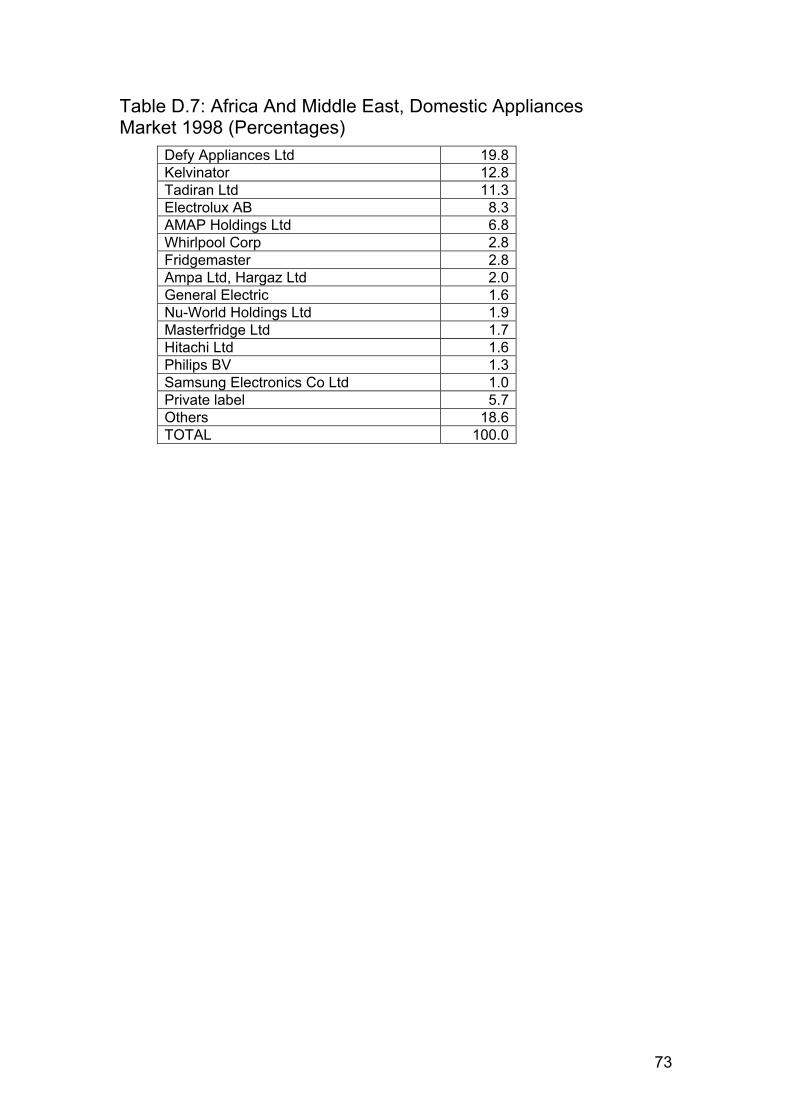
73
Table D.7: Africa And Middle East, Domestic Appliances Market 1998 (Percentages)
Defy Appliances Ltd 19.8 Kelvinator 12.8 Tadiran Ltd 11.3 Electrolux AB 8.3 AMAP Holdings Ltd 6.8 Whirlpool Corp 2.8 Fridgemaster 2.8 Ampa Ltd, Hargaz Ltd 2.0 General Electric 1.6 Nu-World Holdings Ltd 1.9 Masterfridge Ltd 1.7 Hitachi Ltd 1.6 Philips BV 1.3 Samsung Electronics Co Ltd 1.0 Private label 5.7 Others 18.6 TOTAL 100.0

74
Appendix E: Data Sources and Technical Notes Households with selected Domestic Appliances
Breakdown by the Standard Classification of Occupations (SOC, 1982).
Source: Central Statistical Office, Social Trends, 1991, Table 6.4, p. 101
UK Market for Domestic Appliances
UK market for domestic appliances is the total sales of domestic appliances in
the UK calculated as [(T-E)+I] where ‘T’ is total turnover of manufacturers as
defined by their sales in domestic appliances, ‘E’ is exports of domestic
appliances, ‘I’ is the imports of domestic appliances.
Information about the definitions and sources of total turnover, exports and
imports in domestic appliances is provided in the related parts of this
appendix as separate titles
UK Market For Cooking and Cooling Appliances
Cooling Appliances include refrigerators, freezers, and fridge-freezers. Data is
re-chained by the latest year of the available series. Data Source: AMDEA,
Association for the Manufacturers of Domestic Appliances, Annual Industry
Report, 1985, pp.4-9; 1992, pp.6-9; 2001, pp.6-10.
Cooking Appliances include electric cookers, gas cookers and hoods
(Microwaves are excluded). Data is re-chained by the latest year of the
available series. Data Source: AMDEA, Association for the Manufacturers of
Domestic Appliances, Annual Industry Report, 1985, pp.8-11; 1992, pp.11-14;
2001, pp.11-15.
Domestic Appliance Exports and Imports
As given MQ10: 1 and MQ10: 2 by ONS (Office for National Statistics) on

75
http://www.statistics.gov.uk/statbase/tsdtimezone.asp
Updated on 4/ 3/2003
Imports
Seasonally Adjusted
Electric Domestic Appliances QGQA (SIC ’92)
Non-Electric Domestic Appliances QGQB (SIC ’92)
Exports
Seasonally Adjusted
Electric Domestic Appliances QBQP (SIC ’92)
Non-Electric Domestic Appliances QBQS (SIC ’92)
Direction of Trade for Refrigerators
Data Source: AMDEA, Association for the Manufacturers of Domestic
Appliances, Annual Industry Report, 1988, p7; 1992, p6; 2001, p5.
Direction of Trade for Electric Cooking Appliances Data Source: AMDEA, Association for the Manufacturers of Domestic Appliances, Annual Industry Report, 1988, p4; 1992, p6; 2001, p6.
Direction of Trade by Countries (Percentage Contributions)
Data Source: AMDEA, Association for the Manufacturers of Domestic
Appliances, Annual Industry Report, 1992, p6; 2001, p6.
Ownership and Brand Shares of Retail Volume: Cooking Appliances
Data Source: Euromonitor, Global Market Information Data Base, Large
Kitchen Appliances, December 2001, Part II, Table 16 & 17

76
Ownership and Brand Shares of Retail Volume: Refrigeration Appliances
Data Source: Euromonitor, Global Market Information Data Base, Large
Kitchen Appliances, December 2001, Part II, Table 10 & 11
Turnover in Domestic Appliances Manufacturing
Turnover is the total sales of manufacturers as defined by ONS (Office for National Statistics). For further Information about definition of turnover and some other relevant concepts, see ONS, Blue Book: Glossary, 2001, pp.326-336.
AIEO IOP: Industry 29.7 (SIC ’92): Manufacturing of Domestic Appliances: KPSA, 1995 Constant Prices, Seasonally Adjusted
NOS (National Office for Statistics)
http://www.statistics.gov.uk/statbase/TSDtimezone.asp
Updated on 24/ 1/2003
The Share of Value Added in Overall Turnover in Domestic Appliances and Overall Manufacturing
Turnover
Overall Manufacturing
DIOP: A1: CKYY: IOP: Industry: D, KPSA 1995 Constant Prices, Seasonally
Adjusted
NOS (National Office for Statistics)
http://www.statistics.gov.uk/statbase/TSDtimezone.asp
Updated on 24/ 1/2003
Domestic Appliances
AIEO IOP: Industry 29.7 (SIC ’92): Manufacturing of Domestic Appliances: KPSA, 1995 Constant Prices, Seasonally Adjusted

77
NOS (National Office for Statistics)
http://www.statistics.gov.uk/statbase/TSDtimezone.asp Updated on 24/ 1/2003
Value Added
Domestic Appliances Industry:
AIEO IOP: Industry 29.7 (SIC ’92): Manufacturing of Domestic Appliances: KPSA, 1995 Constant Prices, Seasonally Adjusted
NOS (National Office for Statistics)
http://www.statistics.gov.uk/statbase/tsdtimezone.asp?vlnk=pgdp
Updated on 24/ 1/2003
Overall Manufacturing
CKYY IOP: Industry D: Manufacturing: KPSA 1995 Constant Prices, Seasonally Adjusted
NOS (National Office for Statistics)
http://www.statistics.gov.uk/statbase/tsdtimezone.asp?vlnk=pgdp
Updated on 24/ 1/2003
Production of Cooking and Cooling Appliances
Cooling Appliances: Cooling are Refrigerators, freezers, and fridge-freezers. Data is re-chained according to the available series of the latest year.
Data Source: AMDEA, Annual Industry Report, 1985, pp.4-9; 1992, pp.6-9;
2001, pp.6-10.
Cooking Appliances: Cooling are Electric Cooker, Gas Cooker and Hoods (Microwaves are excluded). Data is re-chained according to the available series of the latest year.
Data Source: AMDEA, Annual Industry Report, 1985, pp.8-11; 1992, pp.11-
14; 2001, pp.11-15.

78
Wholesale Unit Prices of Different Cooking Appliances
Current values given in the original source were converted to constant prices by using the Producers Price Index (1995=100)
Electric Cookers
Data is re-chained according to the available series of the latest year.
Data Source: AMDEA, Annual Industry Report, 1985, p8; 1992, p11; 2001,
p9.
Gas Cookers Data is re-chained according to the available series of the latest year.
Data Source: AMDEA, Annual Industry Report, 1985, p9; 1992, p10; 2001,
p8.
Hoods
Data is re-chained according to the available series of the latest year.
Data Source: AMDEA, Annual Industry Report, 1985, p14; 1992, p16; 2001,
p12.
Wholesale Unit Prices of Different Cooling Appliances
Current values given in the original source were converted to constant Prices by using the Producers Price Index (1995=100)
Refrigerators Data is re-chained according to the available series of the latest year.
Data Source: AMDEA, Annual Industry Report, 1985, p23; 1992, p21; 2001,
p18.
Freezers Freezers are chest freezers and upright freezers (Data is aggregated by AMDEA)

79
Data is re-chained according to the available series of the latest year. Data Source: AMDEA, Association for the Manufacturers of Domestic
Appliances, Annual Industry Report, 1985, p22; 1992, p23; 2001, p24.
Fridge-freezers Data is re-chained according to the available series of the latest year.
Data Source: AMDEA, Annual Industry Report, 1985, p23; 1992, p25; 2001,
p27.
Cooling Appliances, Wholesale Unit Prices
Current values given in the original source were converted to constant Prices by using the Producers Price Index (1995=100)
Cooling Appliances are Refrigerators, freezers, and fridge-freezers. Data is re-chained according to the available series of the latest year.
AMDEA, Annual Industry Report, 1985, pp.4-9; 1992, pp.6-9; 2001, pp.6-10.
Cooking Appliances, Wholesale Unit Prices
Current values given in the original source were converted to constant Prices by using the Producers Price Index (1995=100)
Cooking Appliances are Electric Cooker, Gas Cooker and Hoods (Microwaves are excluded). Data is re-chained according to the available series of the latest year.
AMDEA, Annual Industry Report, 1985, pp.8-11; 1992, pp.11-14; 2001, pp.11-
15.

80
Total Employment in Domestic Appliances
Industry 29.7 (SIC ’92): Domestic Appliances Industry
Data from 1995 to 2000 is taken from Annual Business Inquiry (ABI), Subsection
DK - Manufacture of Machinery and Equipment. Information about the ABI of ONS
is available on:
http://www.statistics.gov.uk/CCI/article.asp?ID=74&Pos=2&ColRank=1&Rank=224
Data for the period of 1979 and 1995 years are extracted from the
employment indices given by ONS at
http://www.statistics.gov.uk/statbase/tsdtimezone.asp?vlnk=lms
Whole period of 1979 and 2000 are re-chained according to 2000
Employment Index Series
Employment In Electric and Non-Electric Domestic Appliances Manufacturing
Electric Domestic Appliances: Industry 2971 (SIC ’92)
Non-Electric Domestic Appliances: Industry 2972 (SIC ’92)
Data from 1995 to 2000 is taken from Annual Business Inquiry (ABI),
Subsection DK - Manufacture of Machinery and Equipment. Information about
the ABI of ONS is available on:
http://www.statistics.gov.uk/CCI/article.asp?ID=74&Pos=2&ColRank=1&Rank
=224
Data for the period of 1979 and 1995 years are extracted from the
employment indices given by ONS at
http://www.statistics.gov.uk/statbase/tsdtimezone.asp?vlnk=lms
Whole period of 1979 and 2000 are re-chained according to 2000
Employment Index Series

81
Labour’s Share of Gross Value Added
Employees’ total compensation is takes as percentage of gross value added
in domestic appliances and overall manufacturing. Information about
employees’ compensation and gross value added is provided in the relevant
parts of this appendix.
Labour Market Data from LFS LFS, Labour Force Surveys, Not Seasonally Adjusted Data is extracted from the 2002 Autumn Data Set http://www.data-archive.ac.uk/findingData/lfsAbstract.asp
Households with Durable Goods
ONS, Office for National Statistics, Family Spending, 2000-2001, Table 9.3
Demographic/Social Factors on the Market
Female Employment
Figures are based on the number of those who are currently in employment,
ONS, Office for National Statistics
http://www.statistics.gov.uk/statbase/tsdtimezone.asp?vlnk=emp
Updated on 24/ 1/2003
Household Figures
Data from 1990 to 2000:
ONS, Office for National Statistics, Social Trends 2001, Table 2.1 and 2.4
Data from 1979 to 1990:
http://www.statistics.gov.uk/statbase/explorer.asp?CTG=3&SL=4110&D=4116
&DCT=32&DT=32#4116
82
Number of Dwellings
Data from 1990 to 2000:
ONS, Office for National Statistics, Social Trends 2001, Table 10.3 and 10.4
Data from 1979 to 1990:
http://www.statistics.gov.uk/statbase/explorer.asp?CTG=3&SL=4110&D=4116
&DCT=32&DT=32#4116
Replacement Cycles of Large Kitchen Appliances by Sector
Euromonitor, Global Market Information Data Base, Large Kitchen
Appliances, April 2001, Table 5
Share of the Different Types in Cooking Appliances Manufacturing (Microwaves are excluded from the data)
Electric Cookers Data is re-chained according to the available series of the latest year.
AMDEA, Association for the Manufacturers of Domestic Appliances, Annual
Industry Report, 1985, p8; 1992, p11; 2001, p9.
Gas Cookers Data is re-chained according to the available series of the latest year. AMDEA, Association for the Manufacturers of Domestic Appliances, Annual
Industry Report, 1985, p9; 1992, p10; 2001, p8.
Hoods Data is re-chained according to the available series of the latest year. AMDEA, Association for the Manufacturers of Domestic Appliances, Annual
Industry Report, 1985, p14; 1992, p16; 2001, p12.

83
Microwaves, UK-Based Manufacturing Number of units
Mintel, ‘Microwave Ovens’, Market Intelligence, November 2000, Figure 3 (Data from 1994 to 2000) Mintel, ‘Microwave Ovens’, Market Intelligence, October 1999, Figure 4 Data from 1988 to 1994) Mintel, ‘Microwave Ovens’, Market Intelligence, March 1988, Table 3 Data from 1984 to 1988) Figures are re-chained according to the latest year, Real Prices
Mintel, ‘Microwave Ovens’, Market Intelligence, November 2000, Figure 3 (Data from 1994 to 2000) Mintel, ‘Microwave Ovens’, Market Intelligence, October 1999, Figure 4 Data from 1988 to 1994) Mintel, ‘Microwave Ovens’, Market Intelligence, March 1988, Table 3 Data from 1984 to 1988) Figures are re-chained according to the latest year. Current Values given in the original source are converted to constant prices by using producers’ price index Share of the Different Types in Cooling Appliances Manufacturing
Refrigerators Data is re-chained according to the available series of the latest year.
Data Source: AMDEA, Association for the Manufacturers of Domestic
Appliances, Annual Industry Report, 1985, p23; 1992, p21; 2001, p18.
Freezers Freezers are chest freezers and upright freezers (Data is aggregated by AMDEA) Data is re-chained according to the available series of the latest year.

84
Data Source: AMDEA, Association for the Manufacturers of Domestic
Appliances, Annual Industry Report, 1985, p22; 1992, p23; 2001, p24.
Fridge-freezers Data is re-chained according to the available series of the latest year.
Data Source: AMDEA, Association for the Manufacturers of Domestic
Appliances, Annual Industry Report, 1985, p23; 1992, p25; 2001, p27.
Employees’ Compensation
Compensation Per Employee
Employees compensation covers all payments made for employees (including
pay for redundancy compensation).
Compensation per employee is an average estimation. It is produced by
dividing the total compensation of employees by the total number of
employees in domestic appliances industry and overall manufacturing.
Information about the total number of employees and their total compensation
is provided in the related parts of this Apendix.
Employees’ Total Compensation
ONS, Office for National Statistics, Annual Employment Survey: Employee
Analysis
For the data from 1979 to 1983, 1984 Edition, Table 1
For the Data from 1983 to 1991, 1992 Edition Table 2
For the Data from 1991 to 1998, 1999 Edition Table 1
For the Data from 1998 to 2000, 2001 Edition Table 2
Figures are re-chained according to the latest series available.
Current values given in the original source are converted to constant prices by
using retail price index (1995=100)

85
Leading Major Appliance Companies in the World, Revenues
Appliance, ‘World Appliance Companies’, 2002, Illinois, p.21
North America Domestic Appliances Market 1998
Euromonitor, Global Market Information Data Base, Corporate Strategies,
April 1999, Table 11.10
Western Europe Domestic Appliances Market 1998
Euromonitor, Global Market Information Data Base, Corporate Strategies,
April 1999, Table 11.11
Asia Pacific Domestic Appliances Market, 1998
Euromonitor, Global Market Information Data Base, Corporate Strategies,
April 1999, Table 11.12
Latin America Domestic Appliances Market 1998
Euromonitor, Global Market Information Data Base, Corporate Strategies,
April 1999, Table 11.13
Eastern Europe, Domestic Appliances Market 1998
Euromonitor, Global Market Information Data Base, Corporate Strategies,
April 1999, Table 11.14
Africa and Middle East, Domestic Appliances Market 1998 Euromonitor, Global Market Information Data Base, Corporate Strategies,
April 1999, Table 11.15