Embed Size (px)
Citation preview

FINAL PAPER P1(42)
NAME MAGWARO WEBSTER
COUNTRY ZIMBABWE
TITLE LOW COST CALIBRATION IN
DEVELOPING COUNTRIES: DESIGNING
A TEMPERATURE AND RELATIVE HUMIDITY
CALIBRATION CHAMBER

CHAPTER 1
INTRODUCTION
1.1 Background of the study
Sensor or system calibration involves comparison against a known standard to
determine how closely instrument output matches the standard over the expected range of
operation. Calibration also refers to a set of operations that establish, under specified
conditions, the relationship between the values indicated by a measuring instrument or
measuring system and the corresponding known values of a measurand. The calibration of
instruments or measurement systems is customarily carried out by comparing them against
one or more measurement standards. Among the standards are: primary, secondary,
international, reference and national.
A calibration history over successive calibrations provides confidence in the
instrument’s stability by defining data validity and traceability as well as promoting
standardization of measuring instruments. The result of a calibration is often expressed as a
calibration factor or as a series of calibration factors in the form of a calibration table or
calibration curve. The results of a calibration must be recorded in a document called a
calibration certificate or a calibration report. The calibration certificate or report should
define any bias that can then be removed through mechanical, electrical or software
adjustment. Since random errors are not repeatable and cannot be removed, they can be
statistically be defined through a sufficient number of measurement repetitions during
calibration.
The standard used in calibration should be traceable, that is the results can be related to a
reference through a documented unbroken chain of calibrations, each contributing to the
measurement uncertainty. The calibration of instruments is normally carried out in a
laboratory where appropriate measurement standards and calibration devices are located.
They may be a Regional Instruments Centre (RIC), national laboratories, private laboratories,
or laboratories established within the organization. A calibration laboratory is responsible for
the maintenance of the necessary qualities of its measurement standards and keeping records
for their traceability. The laboratory also issues calibration certificates that should also
contain an estimate of the accuracy of calibration and in order to guarantee traceability a
calibration laboratory should be recognized and authorized by the appropriate national
authorities.
Many measurement quantities can not be directly compared with metrological
standards and hence to absolute references — for example, visibility, relative humidity and
precipitation. For such quantities, inter-comparisons are of primary value. Inter-comparisons
of instruments and observing systems are essential for the establishment of compatible data
sets. Because of the importance of standardization across national boundaries, several
regional associations have set up Regional Instrument Centers to organize and assist with
standardization and calibration activities in the following African countries:
Cairo (Egypt)
Casablanca (Morocc0)
Nairobi (Kenya)
Gaborone (Botswana)
The controlled maintenance of relative humidity is an essential factor in a climate chamber.
In practice this is achieved by an actively adjustable system for humidification and
dehumidification in which the water supply is outside the chamber.
The water from an external tank is heated up in an evaporator and fed as steam into
the calibration chamber. A humidity sensor continually measures the humidity content in the
inner chamber thus a controlled humidification generally between 10% and 98% rh (relative
humidity). For dehumidification purposes the chamber is condensed out at a specific point by
means of a fan. In humidity and temperature chambers test are usually carried at constant
temperatures and over a long period of time often several months. The decisive criteria in this
case thus an accurate maintenance of temperature along with energy efficiency. For this
reason some manufacturers provide these applications with an energy saving and adjustable
heating and cooling system with Peltier elements.
A technical distinction is made in climate chambers as to whether they are cooled or
not. A large number of appliances can be found in practice which in terms of their
temperature range , performance ,light spectrum ,size and fittings are designed for specific

applications such as plant growth. Calibration in general, is the backbone of quality
management in biomedical instrumentation , meteorological services and in all other
manufacturing industries.
1.2 Problem statement
More than fifty (50) African countries and the world at large are embarking on
disaster and risk management projects in a bid to find solutions to problems associated with
the damaging of the ozone layer. The climatic conditions are changing every time and this
has caused a lot of disasters like heat waves , tropical typhoons, elnino , floods ,fire hazards
to mention but a few. Temperature and relative humidity are fundamental parameters that
need constant observation as they play a major role in in day to day life..
In agriculture ,industry farming largely depends on temperature and relative
humidity. Decision making depends on weather forecasts made upon these parameters.
Farmers need to know if it is going to rain so that they can plan in advance. They also need to
know the maximum and minimum temperatures so that they take corrective measures to
protect their crops from frost damage or drought. Zimbabwe has been affected by floods in
areas like Muzarabani and people lost their homes , crops , life and domesticated animals.
This could have been prevented if only weather forecasts were carried properly and
accurately so that early warning systems could be put in place.
In manufacturing industries , huge losses are incurred because temperature and
relative humidity is not measured accurately. In food processing , a stipulated percentage of
relative humidity is to be met before food is packaged . This pauses a great hazard to human
life as some percentages promotes fungal growth within the processed food and also the food
can quickly bad even before it is dispatched to consumers. In biomedical industry doctors and
nurse prescribe according to the temperature of the patient recorded.. many cases have been
reported where patients are overdosed or under dosed. In all the cases the blame fall upon the
doctor ,the meteorologist , supervisors and managers. In most cases these people perform
their duties perfectly however they rely on instruments which are giving wrong readings
because they are not calibrated.
When an instrument is manufactured , it has to undergo calibration first before it is
used . when in use it is given a time frame before it is calibrated again. This is a measure to
minimize the risks of error.
1.3 Aim
The aim of this project was to design a low cost temperature and relative humidity
calibration chamber.
1.4 Objectives
The objectives of this project were:
To calibrate temperature and relative humidity sensors using known standards
kept in the chamber.
to interface standard sensors to a microcontroller that will receive data and send it
for display on LCD.
To develop a microcontroller program that will enable adjustments of
temperature and relative humidity in the chamber using a key pad.
1.5 Scope of study
A calibration chamber was designed which allows a technician to calibrate
temperature and relative humidity. A micro controller program was developed which allows
the technician to adjust parameters in the chamber by using a keypad interfaced to a LCD
through a microcontroller .The program responds to inputs from the sensors and display on
the LCD. It also allows for temperature and relative humidity adjustment in the chamber.
CHAPTER 3
SYSTEM DESIGN
3.1 Overview of the system

The purpose of this system is to provide all the relevant requirements for the process
of calibrating temperature and relative humidity .The interfacing between the LCD, keypad
and the sensors to the micro controller enables the technicians to enter preset values during
the process.
3.2 System block diagram
The block diagram of fig 3.2.1 consists of ten main blocks interconnected through the
microcontroller unit. The Mikro c program interfaces the keypad and the LCD to the heart
of the system . that is the microcontroller.

Fig 3.2.1 Block diagram of temperature and relative humidity calibration chamber
3.3 System Description
The aim of this project was to design a low cost calibration chamber. The system
consists of the control elements which include the keypad, LCD , relay switches as well as
the heart of the system thus the microcontroller PIC 18f5420.. and the sensing elements. The
instrument under test is placed inside the calibration chamber together with the reference
standard. Temperature and humidity at that particular time is noted and recorded.. in tabular
form.. the technician would then set a higher value using a keypad . Upon pressing the Enter
key the microcontroller will set the pin for a relay connected to the heater high thus turning
on the heater to raise temperature to the preset value. When the preset value is reached ..the
bit is set to low and the heater is switched off.. the temperature and relative humidity of the
instrument under test is recorded again. The procedure is repeated for higher temperature
values until at least six or more readings are taken.
Power
Supply
MCU
PIC
18F4520
4*4
Keypad
20*4
LCD
Heater
Humidifier
Fan
Relay
RH
Sensor
Tempetature
sensor

The same procedure was carried for relative humidity.. to raise humidity inside the
chamber a humidifier was used in which a 350 watts heater was immersed in water to raise
the steam which automatically increases the humidity in the chamber. To dehumidify and
lower temperatures in the chamber an ac fan relay driven was used. The inside of the
chamber was designed with wood and kaylite which are all insulators to minimize the
increase and rapid escape of heat during the process.
3.4 The power supply
The power supply comprises of three sections. The system required 220 v
supply to turn on the fan heater and humidifier.. another section required 12v to supply the
relay switches . the 5v was required to power up the microcontroller. supply is a reference to
a source of electrical power. A device or system that supplies electrical or other types of
energy to an output load or group of loads is called a power supply unit or PSU. The term is
most commonly applied to electrical energy supplies, less often to mechanical ones, and
rarely to others. Here in our application I need a 5v DC power supply for all electronics
involved in the project. This requires step down transformer, rectifier,
voltage regulator, and filter circuit for generation of 5v DC power.
Figure 3.4.1 A 5V/12 V DC power supply

Power Supply is an important part of a circuit. It provides required supply to different blocks
of the circuit from input 220 V AC. The main blocks include transformer, rectifier circuit,
filter circuit, and regulator circuit. Voltage regulator IC LM7805 is used as a voltage
regulator. The microcontroller and other devices get power supply from AC to DC adapter
through7805, 5 volts regulator. The adapter output voltage will be 12V DC non regulated.
The 7805 regulates the voltage to 5v.
3.5 Microcontroller PIC 18F4520
In these design PIC 18f4520 is the heart of the system . Because of its simplicity and
a larger memory , the microcontroller is able to store and manipulate a Mikro C program with
a variety of functionalities. The microcontroller interfaces all the project elements. It takes
signals from the keypad and displays on the LCD . Upon receiving a command to turn on the
heater or fan the microcontroller responds by setting bits low or high thus turning off control
elements.
PIC 184520 Special Microcontroller Features:
C Compiler Optimized Architecture: - Optional extended instruction set designed to
optimize re-entrant code
100,000 Erase/Write Cycle Enhanced Flash Program Memory Typical
1,000,000 Erase/Write Cycle Data EEPROM Memory Typical
Flash/Data EEPROM Retention: 100 Years Typical
Self-Programmable under Software Control
Priority Levels for Interrupts
8 x 8 Single-Cycle Hardware Multiplier
Extended Watchdog Timer (WDT): - Programmable period from 4 ms to 131s
Single-Supply 5V In-Circuit Serial Programming™ (ICSP™) via Two Pins
In-Circuit Debug (ICD) via Two Pins
Wide Operating Voltage Range: 2.0V to 5.5V
Programmable Brown-out Reset (BOR) with Software Enable Option - Device
Program Memory Data Memory I/O 10-Bit A/D (ch) CCP/ ECCP (PWM) MSSP
EUSART Comp.
3.6 HR 202 Humidity sensor
In the calibration chamber , the HR202 is the standard sensor that measures relative
humidity and the PIC displays the measurement on the LCD. This module is based on HR202
resistive humidity sensor, which exposes excellent linearity, has a wide measurement range
and a low power consumption. The module features both a power output indicator LED and a
digital output indicator.
This module is ideal for custom humidity sensing applications, and can be used in fields like
meteorology, storage facility humidity control, textile industry and other applications which
need ambient humidity monitoring. The output is available both as an analog output and as a
digital output obtained using a comparator based on LM393 integrated circuit.

Specifications
Sensitivity: adjustable
Operating voltage: 3.3V ~ 5V
Output: AO - analog output, DO - digital output
Fig 3.6.1 HR202 Humidity sensor
3.6.2 Operation of a humidity sensor
A capacitive humidity sensor measures relative humidity by placing a thin strip of metal
oxide between two electrodes. The metal oxide's electrical capacity changes with the
atmosphere's relative humidity. These types of sensors are used for weather, commercial and
industrial applications.
Resistive humidity sensors utilize ions in salts to measure the electrical impedance of atoms.
As humidity changes, so does the resistance of the electrodes on either side of the salt
medium. State-of-the-art resistive humidity sensors use ceramics to overcome areas where
condensation occurs.

Thermal conductivity sensors measure changes in heat to detect humidity. Two thermal
sensors conduct electricity based upon the humidity of the surrounding air. One sensor is
encased in dry nitrogen as a comparison to the other sensor which measures the ambient air.
The difference between the two measures the humidity.
The reason these detection methods work is that humidity changes with air temperature.
3.7 LM35 Temperature sensor
In the design the LM35 sensor was used as a standard to measure temperature inside
the chamber against the instrument under test. The LM35 is an integrated circuit sensor that
can be used to measure temperature with an electrical output proportional to the temperature
(in oC). The sensor was chosen because:
You can measure temperature more accurately than a using a thermistor.
The sensor circuitry is sealed and not subject to oxidation, etc.
The LM35 generates a higher output voltage than thermocouples and may not
require that the output voltage be amplified.
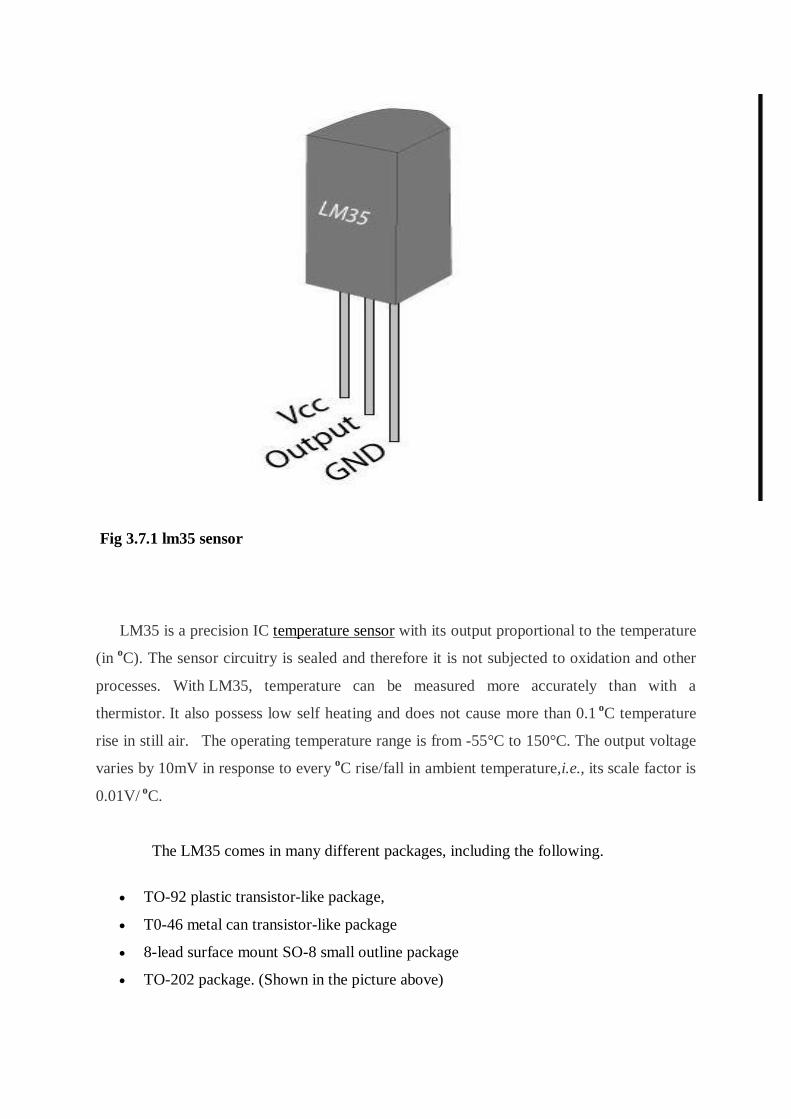
Fig 3.7.1 lm35 sensor
LM35 is a precision IC temperature sensor with its output proportional to the temperature
(in oC). The sensor circuitry is sealed and therefore it is not subjected to oxidation and other
processes. With LM35, temperature can be measured more accurately than with a
thermistor. It also possess low self heating and does not cause more than 0.1 oC temperature
rise in still air. The operating temperature range is from -55°C to 150°C. The output voltage
varies by 10mV in response to every oC rise/fall in ambient temperature,i.e., its scale factor is
0.01V/ oC.
The LM35 comes in many different packages, including the following.
TO-92 plastic transistor-like package,
T0-46 metal can transistor-like package
8-lead surface mount SO-8 small outline package
TO-202 package. (Shown in the picture above)
How Do You Use An LM35? (Electrical Connections)
Here is a commonly used circuit. In this design the commonly used values are.
Vc= 4 to 30v
5v or 12v are typical values used.
Ra = Vc /10-6
Actually, it can range from 80 KW to 600 KW , but most just use 80 KW.
The lm35 together with the HR 202 were connected to the microcontroller port A for
analogue to digital conversion.
3.8 LCD
The 20 *4 was used to display all the relevant values during calibration process. The
LCD has the capacity of displaying 80 characters at once . This is the example for the Parallel
Port. This example doesn't use the Bi-directional feature found on newer ports, thus it should
work with most, if not all Parallel Ports. It however doesn't show the use of the Status Port as
an input for a 16 Character x 2 Line LCD Module to the Parallel Port. These LCD Modules
are very common these days, and are quite simple to work with, as all the logic required
running them is on board.
Frequently, an 8051 program must interact with the outside world using input and
output devices that communicate directly with a human being. One of the most common
devices attached to an 8051 is an LCD display. Some of the most common LCDs connected
to the 8051 are 16x2 and 20x2 displays. This means 16 characters per line by 2 lines and 20
characters per line by 2 lines, respectively. Fortunately, a very popular standard exists which
allows us to communicate with the vast majority of LCDs regardless of their manufacturer.
The standard is referred to as HD44780U, which refers to the controller chip which receives
data from an external source (in this case, the 8051) and communicates directly with the
LCD.

Fig 3.8.1 LCD pin connection
The EN line is called "Enable." This control line is used to tell the LCD that you are
sending it data. To send data to the LCD, your program should make sure this line is low (0)
and then set the other two control lines and/or put data on the data bus. When the other lines
areThe RS line is the "Register Select" line. When RS is low (0), the data is to be treated as a
command or special instruction (such as clear screen, position cursor, etc.). When RS is high
(1), the data being sent is text data which should be displayed on the screen. For example, to
display the letter "T" on the screen you would set RS high.
The RW line is the "Read/Write" control line. When RW is low (0), the information
on the data bus is being written to the LCD. When RW is high (1), the program is effectively
querying (or reading) the LCD. Only one instruction ("Get LCD status") is a read command.
All others are write commands--so RW will almost always be low . Finally, the data bus
consists of 4 or 8 lines (depending on the mode of operation selected by the user). In the case
of an 8-bit data bus, the lines are referred to as DB0, DB1, DB2, DB3, DB4, DB5, DB6, and
DB7.
CHAPTER 4
Hardware and software implementation
4.1 Hardware implementation
4.1.1 PCB design and fabrication
The PCB design was done using Proteus 8 version 4. It offers the simplest library where one
can pick and place components schematically. It provides a user friendly platform that
allows users to perform all kinds of drawing operations.
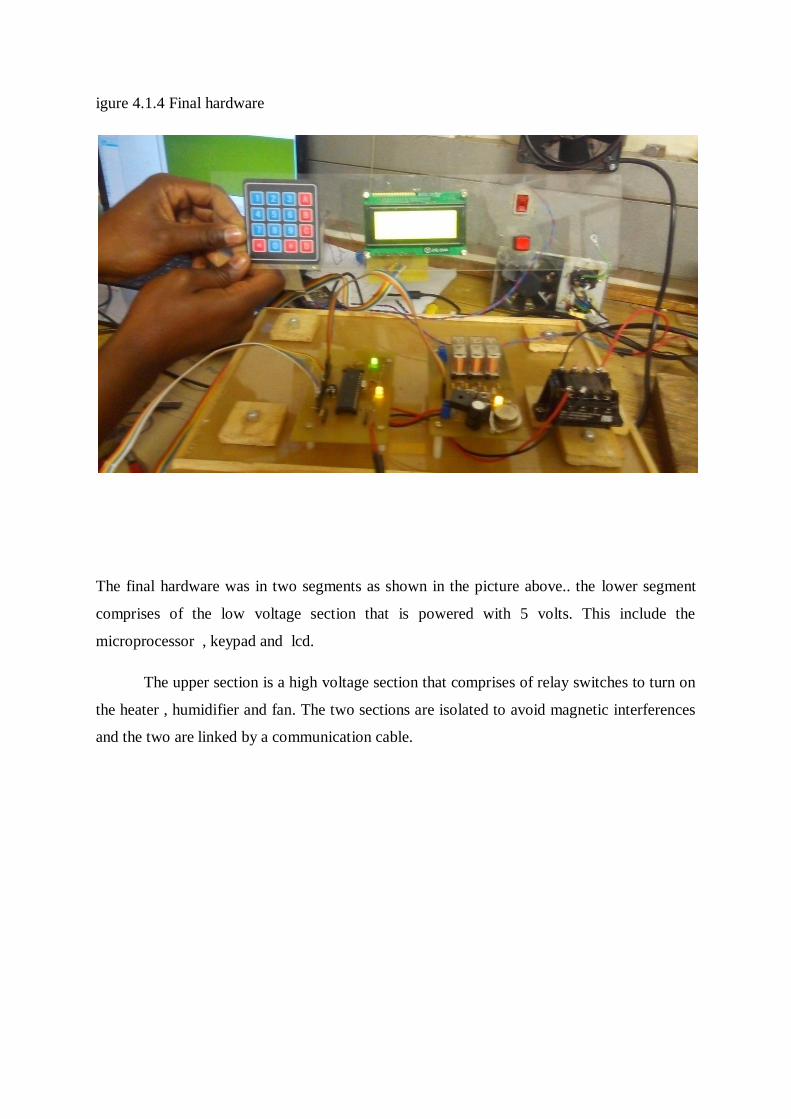
igure 4.1.4 Final hardware
The final hardware was in two segments as shown in the picture above.. the lower segment
comprises of the low voltage section that is powered with 5 volts. This include the
microprocessor , keypad and lcd.
The upper section is a high voltage section that comprises of relay switches to turn on
the heater , humidifier and fan. The two sections are isolated to avoid magnetic interferences
and the two are linked by a communication cable.
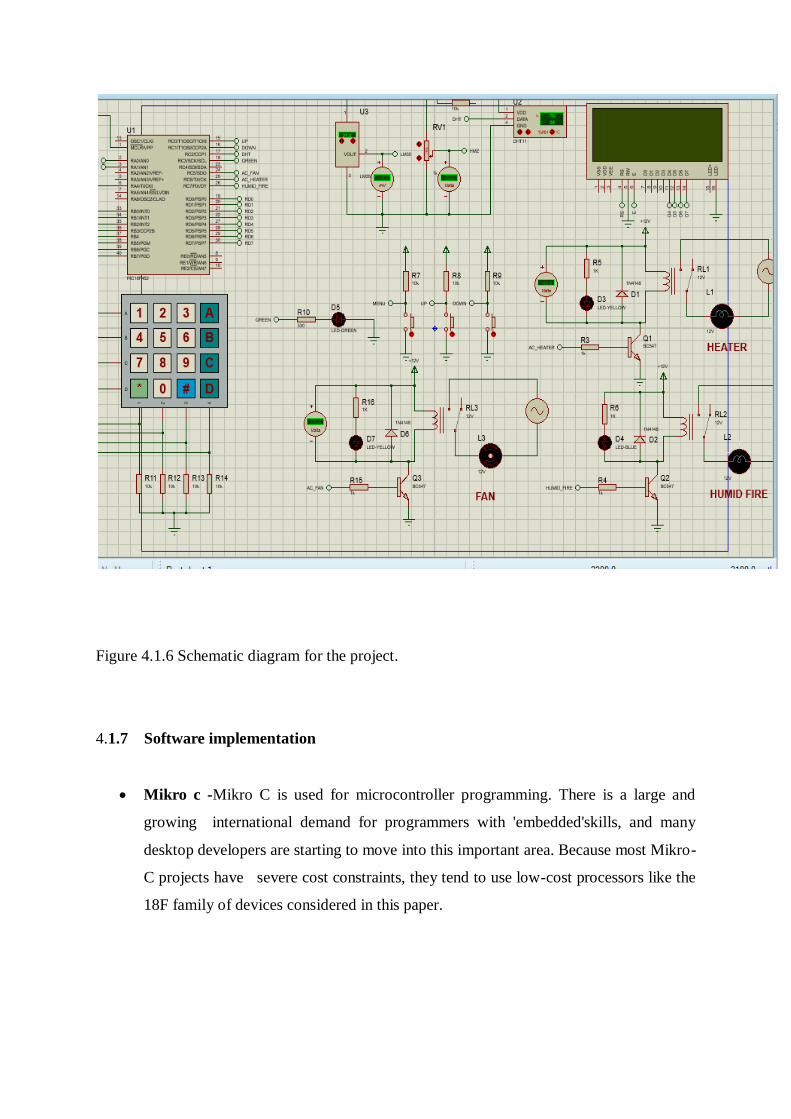
Figure 4.1.6 Schematic diagram for the project.
4.1.7 Software implementation
Mikro c -Mikro C is used for microcontroller programming. There is a large and
growing international demand for programmers with 'embedded'skills, and many
desktop developers are starting to move into this important area. Because most Mikro-
C projects have severe cost constraints, they tend to use low-cost processors like the
18F family of devices considered in this paper.

4.1.8 LCD , HR202 AND PIC 18F4520 interfacing
The above are the simulation results after interfacing the humidity , the microcontroller and
the alphanumeric lcd. The mikro c program displays the current temperature and humidity.
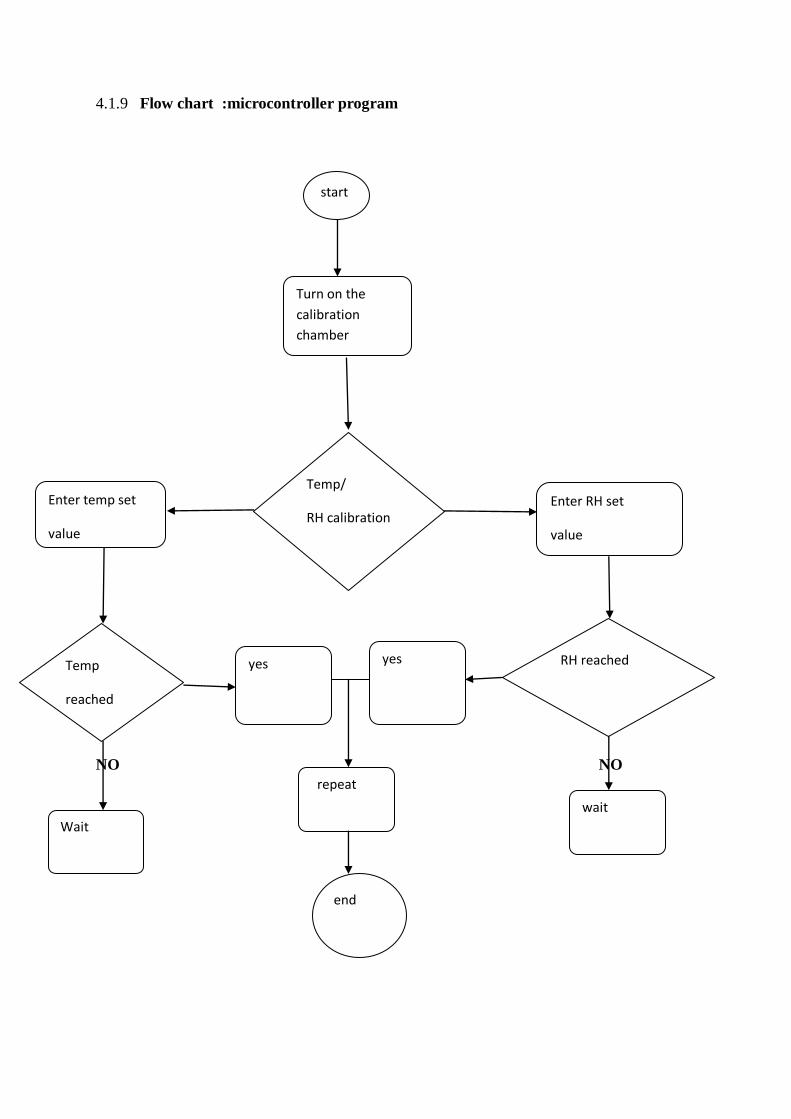
4.1.9 Flow chart :microcontroller program
NO NO
start
Turn on the
calibration
chamber
Temp/
RH calibration Enter RH set
value
Enter temp set
value
Temp
reached
RH reached
end
yes yes
repeat
Wait
wait

CHAPTER 5
RESULTS AND DISCUSSION
The design was successfully set and two experiments were carried out to calibrate a
temperature measuring instrument and a relative measuring instrument.. results were
tabulated as below.
5.1 Experiment 1
Calibration of a digital thermometer.
Instrument
under test
Reference
standard
deviation Permissible
deviation
1 25.4 25 +0.4
2 30.3 30 +0.3
3 35.3 35 +0.3
4 39.8 40 -0.2
5 44.7 45 -0.3
6 51.2 50 +0.2
7 55.4 55 +0.4 +/- 0.2
Table 5.1.1 results for calibration of a digital thermometer.
From the experiment as shown by the results . the digital thermometer has an uncertainty
value of ( 0.4+0.3+0.3+0.2+0.4-0.3-0.2)/7= 0.06. the thermometer still lies within the
maximum permissible deviation.

CHAPTER 6
CONCLUSIONS AND RECOMMENDATIONS
6.1 Summary of the project
The aim of this project was to design and develop a temperature and relative
humidity calibration chamber. The design uses a keypad to enter the preset values of
temperature and relative humidity. when the preset value is set the microcontroller sends a
signal to either turn on or disenable one or two of the control elements like heater ,fan and
humidifier. Once the preset value is attained the pins that connect to relay switches are set to
a low hence the heater is switched off .
The microcontroller takes information from the keypad and display s it on the LCD so
that the technician can interactively perform the calibration process. Both the temperature and
relative humidity can be lowered down in a calibration chamber by the use of a fan that takes
warm air from inside and dissipate it outside the chamber.
6.2 Project achievement
Both the hardware and software components of this system functioned so as to meet
the objectives stated in this report. All the objectives were met, and the I was able to
calibrate a digital thermometer as well as thermo hygrograph. Both the sensors used in the
design were calibrated against an HMP255 Vaisala standard sensor .
6.3 Future recommendation
This project is a small implication of our concept in calibration of meteorological
observation equipment. The practical applications of this project are immense and can have
vast level of implementation. This small concept can be used in fields such as weather
forecasting, remote sensing, robotics, aeronautics, bio medical and many other related fields
where continuous monitoring and regulation is needed. So this is not the end of the project
but rather is a step towards exploring other possibilities that it brings with it. I feel very happy
to work in such a challenging project which has tremendous application and possibilities.

I recommend students to work in such field of Metrology, which actually gives a lot
of satisfaction while working. The project work in the fact gives a lot of confidence to fight
out in this challenging world. As one proceeds one can not believe how much knowledge
he/she gains and the teamwork, which the project work teaches, really will have a new
experience.
6.4 Future Improvements
The future implications of the project are very great considering the amount of time
and resources it saves. The project I have undertaken can be used as a reference or as a base
for realizing the significance of calibration in biomedical instrumentation, weather
forecasting, aviation and manufacturing industries.
6.5 Problems Faced
Initially I had problems in getting a stabilised value from my temperature sensor and
also getting the correct mathematical formula to calculate relative humidity. I faced also a
challenge finding the humidifier with 500 watts or less to raise temperature inside a chamber.
The heater raised the temperature inside the chamber so abruptly that at the instant of turning
on the chamber.. the microcontrollers set low the relay switch bit ..turning off the heater.
Instead the heater and the fan were all set on at once so that the heat inside the chamber was
raised gradually to the preset value.
6.6 Conclusion
The project I have undertaken has helped gain a better perspective on various aspects
related to calibration as well as practical knowledge of electronic equipments and
communication. I became familiar with software analysis, designing, implementation, testing
and maintenance concerned with my project. The extensive capabilities of this system are
what make it so interesting. From the convenience of calibrating chamber , technicians are
able to carry out calibration processes on different measuring instruments. Organizations,
industries and other commercial institutes are able to maintain standards, a requirement for
Quality management systems.

REFERENCES
Books
[1]: GSM and Personal Communicati – ons Handbook- SiegmundRedl - MatthiasWeber-
MalcolmW. OliphantJohn S. Wilson. “Sensor Technology Handbook” Newnes. 2005
[2] Jacob Fraden. “Handbook of Modern Sensors Physics, Designs, and Applications”. T h i r
d e d i t i o n. Springer. 2003
[3] Zhi Chen, Chi Lu, “Humidity Sensors: A Review of Materials and Mechanisms”, Sensor
Letters, 2005
[4 ] . Sedra and Smith, Microelectronic Circuits, fourth edition, Oxford University Press,
1998
[5 ]. R.S. Sedha, 2002. A Text Book of Applied Electronics, S. Chand and Company Ltd.,
New Delhi
[6] . Theodore S. Rappaport, Wireless Communications, second edition, PHI. New Delhi
[7] Muhammad Ali Mazidi, Janice G. Mazidi, Rolin D. McKinlay, The 8051 microcontroller
and embedded systems using assembly and C, 2nd edition 01-Sep-2007,Pearson Education
India.
[8.] Sedra and Smith, Microelectronic Circuits, fourth edition, Oxford University
Press, 1998
[9] R.S. Sedha, 2002. A Text Book of Applied Electronics, S. Chand and
Company Ltd., New Delhi
[9]. Theodore S. Rappaport, Wireless Communications, second edition, PHI. New
JOURNALS
[1] Zhi Chen, Chi Lu, “Humidity Sensors: A Review of Materials and Mechanisms”, Sensor
Letters, 2005
[2] Humidity measurement , WMO AWS training. www.wmo.int/.../IOM-87_Module_B

WEB PAGES
[1] www.google.com
[2] www.keil.com, November 2008
port. All the objectives were met, and the I was able

APPENDIX A
APPENDIX B
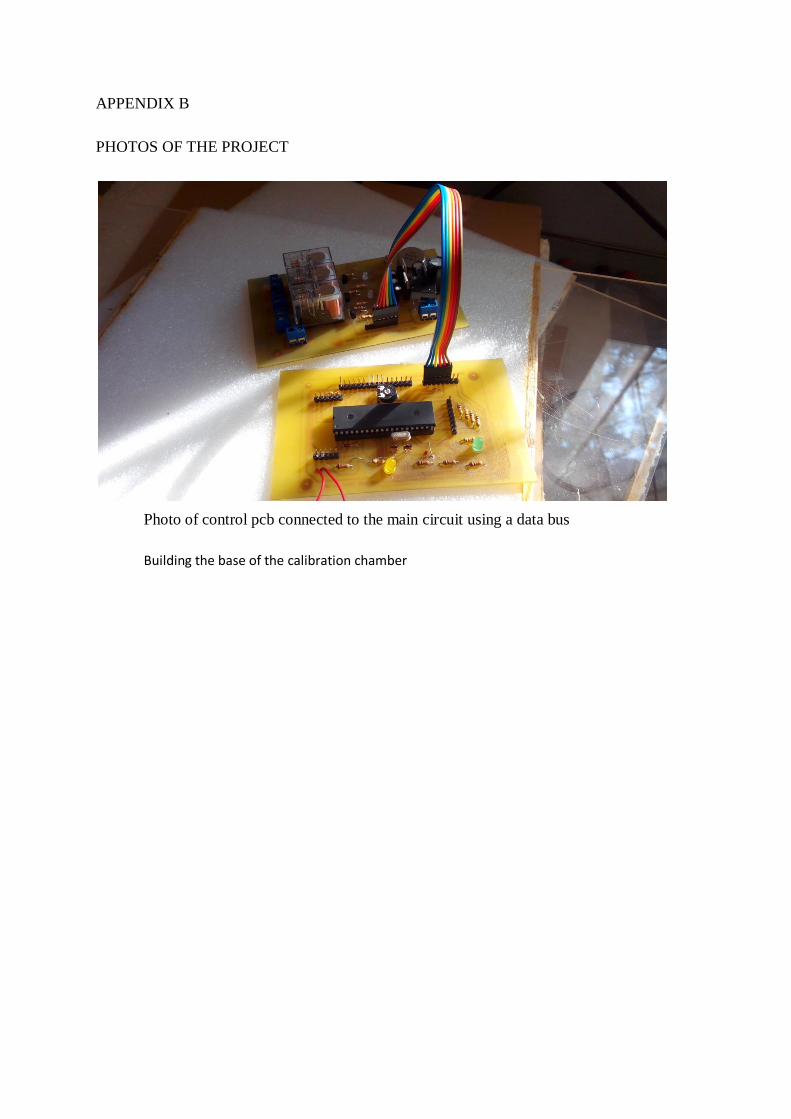
PHOTOS OF THE PROJECT
Photo of control pcb connected to the main circuit using a data bus
Building the base of the calibration chamber

Building the base of the calibration chamber