Embed Size (px)
Citation preview

Working Paper Series 2004 National Postsecondary Student Aid Study (NPSAS:04) Field Test Methodology Report
April 2005
U.S. Department of Education Institute of Education Sciences NCES 2005–02
The Working Paper Series was initiated to promote the sharing of the valuable work experience and knowledge reflected in these preliminary reports. These reports are viewed as works in progress, and have not undergone a rigorous review for consistency with NCES Statistical Standards prior to inclusion in the Working Paper Series.

U.S. Department of Education Margaret Spellings Secretary
Institute of Education Sciences Grover J. Whitehurst Director
National Center for Education Statistics Grover J. Whitehurst Acting Commissioner
The National Center for Education Statistics (NCES) is the primary federal entity for collecting, analyzing, and reporting data related to education in the United States and other nations. It fulfills a congressional mandate to collect, collate, analyze, and report full and complete statistics on the condition of education in the United States; conduct and publish reports and specialized analyses of the meaning and significance of such statistics; assist state and local education agencies in improving their statistical systems; and review and report on education activities in foreign countries.
NCES activities are designed to address high-priority education data needs; provide consistent, reliable, complete, and accurate indicators of education status and trends; and report timely, useful, and high-quality data to the U.S. Department of Education, the Congress, the states, and other education policymakers, practitioners, data users, and the general public.
We strive to make our products available in a variety of formats and in language that is appropriate to a variety of audiences. You, as our customer, are the best judge of our success in communicating information effectively. If you have any comments or suggestions about this or any other NCES product or report, we would like to hear from you. Please direct your comments to:
National Center for Education Statistics Institute of Education Sciences U.S. Department of Education 1990 K Street NW Washington, DC 20006-5651
April 2005
The NCES World Wide Web home page address is http://nces.ed.gov/ The NCES World Wide Web electronic catalog address is http://nces.ed.gov/pubsearch/
Suggested Citation Riccobono, J., Siegel, P., Cominole, M., Dudley, K., Charleston, S., and Link, M. (2005). 2004 National Postsecondary Student Aid Study (NPSAS:04) Field Test Methodology Report (NCES 2005–02). U.S. Department of Education. Washington, DC: National Center for Education Statistics.
Contact: Aurora D’Amico (202)502-7334 Aurora.D’[email protected]

iii NPSAS:04 Field Test Methodology Report
Executive Summary
Introduction The 2004 National Postsecondary Student Aid Study (NPSAS:04), conducted for the U.S.
Department of Education’s National Center for Education Statistics (NCES), collected comprehensive data regarding how students and their families pay for postsecondary education. The primary objective of NPSAS:04 is to produce reliable national estimates of characteristics related to financial aid for postsecondary students. NPSAS:04 also serves as the base year of data collection for the Beginning Postsecondary Students Longitudinal Study (BPS), which will follow a cohort of students from the start of their postsecondary education and collect further data from them in 2006 and 2009.
For the first time, NPSAS:04 is being conducted as the student component study of the 2004 National Study of Faculty and Students (NSoFaS:04). The faculty component—the 2004 National Study of Postsecondary Faculty (NSOPF:04)—is primarily a separate study, with the exception of institutional sampling and contacting. Historically, there has been considerable overlap in the institutions selected for participation in NPSAS and NSOPF; therefore, institutional sampling and contacting activities for both studies were coordinated in order to minimize response burden on institutions and to realize data collection efficiencies.
This report only describes the methodology and findings of the NPSAS:04 field test, which took place during the 2002–03 school year. The NPSAS:04 field test was used to plan, implement, and evaluate methodological procedures, instruments, and systems proposed for use in the full-scale study scheduled for the 2003–04 school year. The methodology and findings of the NSOPF:04 field test are provided in a separate report.
Sample Design The NPSAS:04 field test is based on a nationally representative sample of all students
(aided and nonaided) in postsecondary institutions throughout the United States and Puerto Rico. The institutions sampled represented all types and levels of postsecondary institutions in the United States, including public, private for-profit, and private not-for-profit institutions, at the 4-year, 2-year, and less-than-2-year levels. In the institutional sample, 200 institutions were selected purposively to ensure that no institution would be included in both the field test and full-scale studies. Of these, 150 were also included in the NSOPF field test sample, and 195 were determined to be eligible for the NPSAS:04 field test. Enrollment lists were obtained from 173 of the 195 eligible institutions.
Approximately 1,300* undergraduate, graduate, and first-professional students enrolled in postsecondary education between July 1, 2002 and April 30, 2003 comprised the student sample, with special concern for the accurate sampling of students eligible to participate in the BPS longitudinal studies in the future. Students were selected on a flow basis from the first 77
*The numbers appearing in the tables and text of this report have been rounded to the nearest tens and hundreds to maintain the confidentiality of study respondents.

Executive Summary
NPSAS:04 Field Test Methodology Report iv
institutions providing lists. Of the 1,300 students sampled, 120 were determined to be ineligible for the study, resulting in 1,200 eligible student sample members.
Instrumentation Unlike in previous NPSAS cycles, the NPSAS:04 student instrument was designed as a
web-based instrument to be used both for self-administered “interviews” via the Web and by telephone interviewers. In addition, a study website was developed for access to the self-administered interview and to provide sample members with additional information about the study.
The instrument was designed to accommodate the mixed-mode data collection approach and to ensure the collection of the highest quality data. Design considerations included the following: appropriate question wording for both self-administered and telephone interviews; the provision of extensive help text to assist self-administered respondents and telephone interviewers; and pop-up boxes indicating out-of-range values.
The instrument consisted of six sections grouped by topic. The first section determined student eligibility for the NPSAS:04 study and the future BPS study, and obtained enrollment history. The second section contained questions relating to student expenses and financial aid. Included in this section were items regarding employment at the NPSAS institution, such as work-study participation, assistantships, and fellowships. Section three focused on employment and finances. Educational experiences, such as courses taken and admission test scores, were included in the fourth section, as well as educational experience items specific only to BPS respondents. The fifth section of the interview gathered background and demographic information about students and their family members. The final section, applicable only to BPS respondents, requested contacting information in order to make subsequent follow-up contact with them easier for future surveys.
Data Collection Design and Outcomes
Institutional Contacting Once institutions were sampled, attempts were made to contact the Chief Administrator
to verify institutional eligibility, solicit participation, and request the appointment of an Institutional Coordinator to oversee data collection within the institution. Institutional coordinators were asked to provide lists or data files of all eligible students enrolled at any time between July 1, 2002 and April 30, 2003. Several checks on quality and completeness of student lists were implemented prior to sampling students from each institution. Of the 195 eligible institutions sampled for the field test, 173 provided lists, resulting in an overall institutional participation rate of about 89 percent.
Institutional Record Abstraction A web-based computer-assisted data entry (CADE) software system was used for the
abstraction of student records from institutions. Institutions were given the option of completing CADE using their own staff, or, upon request, having an RTI International (RTI) field data

Executive Summary
v NPSAS:04 Field Test Methodology Report
collector complete the record abstraction process at the institution. Prior to the initialization of the CADE software system for an institution, records for all students sampled from a school were requested from the U.S. Department of Education’s Central Processing System (CPS), which contains financial aid application data. This information was preloaded into the CADE system to provide edit checks for the data entered by an institution. The CADE system consisted of three sections focusing on eight topics: locating information, demographic characteristics, admissions tests, enrollment, tuition, financial aid awards, needs analysis, and institutional student information records (ISIRs). As noted earlier, students were sampled from the first 77 institutions providing enrollment lists; therefore, CADE record abstraction was only requested from these institutions. Of these 77 institutions, 75 provided information for 1,200 sample members.
Interviewer Training Field test training programs were developed for two types of project staff: telephone
interviewers and help desk operators. Programs on successfully locating and interviewing sample members were developed for all telephone interviewers. Topics covered in telephone interviewer training included administrative procedures required for case management, quality control of interactions with sample members, parents, and other contacts; the purpose of NPSAS:04 and the uses of the data to be collected; and the organization and operation of the web-based student instrument to be used in data collection. Help desk operators received essentially the same training as telephone interviewers because they were expected to complete the instrument over the telephone if requested by a caller; however, help desk operators also received specific training on “frequently asked questions” regarding the instrument and technical issues related to completion of the instrument via the Web.
Student Locating and Interviewing The NPSAS:04 field test data collection design involved initial locating of sample
members, providing an opportunity for the student to complete the self-administered interview via the Web, following up web nonrespondents after 3 weeks, and attempting to conduct a telephone interview with them if necessary. Upon receipt of student lists, batch-locating activities were employed to update address and telephone activities. Sources for this task included the CPS, the U.S. Postal Service National Change of Address system, and Telematch. Students were then sent a notification mailing containing a lead letter, informational brochure, and username and password for completing the interview via the Web. Telephone contact began for self-administered web nonrespondents 3 weeks after the initial mailing. Locating and tracing activities by telephone interviewers occurred simultaneously with efforts to gain cooperation from sample members. When all tracing options were exhausted by the interviewer, cases were sent to RTI’s Tracing Operations Unit (TOPS). Cases for which further contacting information was obtained were sent back for contact by telephone interviewers; those for whom no additional information could be obtained were finalized as unlocatable.
Of the 1,200 eligible sample members, 820 (71 percent) completed the student interview. Of these, 300 were confirmed BPS respondents. The average time overall to complete the student interview for all respondents was about 33 minutes. Self-administered respondents, on

Executive Summary
NPSAS:04 Field Test Methodology Report vi
average, took 36 minutes to complete the interview and respondents to the telephone interview took about 32 minutes.
Evaluation of Operations and Data Quality As noted above, the NPSAS:04 field test was used to plan, implement, and evaluate
methodological procedures, instruments, and systems proposed for use in the full-scale study scheduled for the 2003–04 school year; therefore, assessments of operations, procedures, and data quality were critical at this stage. Evaluations of operations and procedures1 focused on newly introduced joint institutional contacting endeavor, the timeline for data collection from both institutions (CADE) and students (self-administered and interviewer-administered), tracing and locating procedures, refusal conversion efforts, the effectiveness of incentives for increasing early response via the Web and for refusal conversion, and the length of the student interview. Evaluations of data quality included an examination of items with high rates of missing data, the reliability of the CADE and student instruments, use of online help text, conversion efforts of nonrespondents to critical items in the instrument, and question delivery and data entry quality control procedures.
Data Files Data from field tests such as NPSAS:04 are not released to the public; however, all data
file processing procedures were tested rigorously in preparation for the full-scale effort. Procedures tested included a review of online coding and editing systems, range and consistency checks for all data, and post-data-collection data editing. Detailed documentation was also developed to describe question text, response options, logical imputations, and recoding.
Planned Changes for the NPSAS:04 Full-Scale Study The final chapter of this report summarizes the changes planned for the NPSAS:04 full-
scale study. General changes for efficiency and clarity have been suggested for the study such as enrollment list acquisition, institutional record abstraction, tracing and locating, and student interviewing. More substantial changes planned for the NPSAS:04 full-scale study include the following:
• the upward adjustment of full-scale sampling rates to account for ineligibility and nonresponse;
• increasing the sampling rate for students who may be eligible for the subsequent BPS, while decreasing the sampling rate for other undergraduates, to ensure adequate numbers of these students in the full-scale sample;
• offering incentives to all sample members to encourage early response via the Web, and to aid in refusal conversion at the end of the data collection; and
• modifying the student instrument through the elimination of items, changes to question wording, and the administration of particular items to different subsets of respondents.
1All comparisons have been tested using a significance level of 0.05.

vii NPSAS:04 Field Test Methodology Report
Working Paper Foreword In addition to official NCES publications, NCES staff and individuals commissioned by NCES produce preliminary research reports that include analyses of survey results, and presentations of technical, methodological, and statistical evaluation issues.
The Working Paper Series was initiated to promote the sharing of the valuable work experience and knowledge reflected in these preliminary reports. These reports are viewed as works in progress, and have not undergone a rigorous review for consistency with NCES Statistical Standards prior to inclusion in the Working Paper Series.
Copies of Working Papers can be downloaded as pdf files from the NCES Electronic Catalog (http://nces.ed.gov/pubsearch/).
Marilyn M. Seastrom Ralph Lee Chief Mathematical Statistician Mathematical Statistician Statistical Standards Program Statistical Standards Program

Working Paper Foreword
NPSAS:04 Field Test Methodology Report viii
This page is intentionally blank.

ix NPSAS:04 Field Test Methodology Report
Foreword This report describes and evaluates the methods and procedures used in the field test of
the 2004 National Postsecondary Student Aid Study (NPSAS:04), the student component of the 2004 National Study of Faculty and Students (NSoFaS:04). The NPSAS:04 field test included important changes from previous NPSAS studies. One of the most significant changes was the fielding of the institutional contacting stage of the study jointly with that for the faculty component of NSoFaS:04, the 2004 National Study of Postsecondary Faculty (NSOPF:04). A second major change was conducting student record abstraction from institutional records and student interviewing simultaneously, rather than sequentially as had been done in previous NPSAS cycles. Another change was the development of a single web-based instrument for self-administration by sample members and use by telephone interviewers alike.
We hope that the information provided in this report will be useful to interested readers. This study was based on a purposive and complementary sample of the nationally representative sample of institutions to be used in the NPSAS:04 full-scale study. Additional information about NPSAS:04 is available on the Web at http://www.nces.ed.gov/surveys/npsas.
C. Dennis Carroll Associate Commissioner Postsecondary Studies Division

Foreword
NPSAS:04 Field Test Methodology Report x
This page is intentionally blank.

xi NPSAS:04 Field Test Methodology Report
Acknowledgments The authors gratefully acknowledge the assistance of staff members of the National
Center for Education Statistics (NCES) for their advice, guidance, and review in the design of the field test study, and in preparation of this document. We are particularly grateful to C. Dennis Carroll, Associate Commissioner, Postsecondary Studies Division; Paula R. Knepper, Senior Technical Advisor, Postsecondary Studies Division; James Griffith, Program Director, Postsecondary Longitudinal and Sample Survey Studies (PLSSS); Tracy Hunt-White, Statistician (PLSSS); and Linda Zimbler, Statistician (PLSSS), for their constructive input and review.
Particular thanks are also extended to the Technical Review Panel members, who provided considerable insight and guidance in the development of the design and instrumentation of the study. Thanks are also extended to the many project staff members, with special acknowledgment given to Jill Snider, Jason Guder, and Lynne Hawley for their tireless efforts in preparing this document.
Most of all, we are greatly indebted to the students who generously participated in the survey. Their willingness to take the time to share information made this study a success.

Acknowledgments
NPSAS:04 Field Test Methodology Report xii
This page is intentionally blank.

xiii NPSAS:04 Field Test Methodology Report
Table of Contents Executive Summary................................................................................................................... iii Foreword .................................................................................................................................. vii Acknowledgments ..................................................................................................................... xi List of Tables............................................................................................................................. xv List of Figures ......................................................................................................................... xvii Chapter 1 Overview of NPSAS:04 ............................................................................................ 1
1.1 Background and Purpose of NPSAS............................................................................................ 1 1.2 Purpose of the Field Test ............................................................................................................. 2 1.3 Schedule and Products of NPSAS:04 .......................................................................................... 3
Chapter 2 Design and Methodology of the Field Test ............................................................. 5 2.1 Respondent Universe ................................................................................................................... 5
2.1.1 Institutional Sample and Eligibility ................................................................................5 2.1.2 Student Sample and Eligibility .......................................................................................8
2.2 Data Collection Design .............................................................................................................. 12 2.2.1 Institutional Website .....................................................................................................12 2.2.2 Contacting Institutions ..................................................................................................14 2.2.3 Student List Acquisition and Sampling ........................................................................15 2.2.4 Overview of Extant Data Sources for Student Data......................................................17 2.2.5 Student Instrument Development..................................................................................18 2.2.6 CADE Data Abstraction From Student Records...........................................................20 2.2.7 Student Contacting and Locating..................................................................................21 2.2.8 Student Interviewing.....................................................................................................25 2.2.9 NPSAS:04 Field Test Incentive Experiment and Data Quality Evaluations ................28
2.3 Data Collection Systems ............................................................................................................ 29 2.3.1 Instrument Design and Documentation System............................................................29 2.3.2 Integrated Management System....................................................................................29
Chapter 3 Institutional and Student Data Collection Outcomes........................................... 31 3.1 Response Rates .......................................................................................................................... 31
3.1.1 Institutional Participation..............................................................................................31 3.1.2 Central Processing System/National Student Loan Data System Matching .................34 3.1.3 Student Locating and Response Rate Summary ...........................................................37 3.1.4 Student Record Abstraction ..........................................................................................40 3.1.5 NPSAS:04 Field Test Study Respondents ....................................................................43
3.2 Locating ..................................................................................................................................... 44 3.2.1 Student Locating Overview ..........................................................................................44 3.2.2 Database Batch Tracing Before Data Collection ..........................................................46 3.2.3 Intensive Tracing During Data Collection ....................................................................47 3.2.4 Conversion of Nonrespondents.....................................................................................50
3.3 Response Burden and Effort ...................................................................................................... 51 3.3.1 Time to Complete the Student Interview ......................................................................51 3.3.2 Help Desk .....................................................................................................................54 3.3.3 Call Attempts ................................................................................................................55
3.4 Incentive Experiment Results .................................................................................................... 58 3.4.1 Analysis of Phase I Data ...............................................................................................59 3.4.2 Analysis of Phase II Data..............................................................................................60

Table of Contents
NPSAS:04 Field Test Methodology Report xiv
3.4.3 Analysis of Phase III Data ............................................................................................61 3.4.4 Web and CATI Incentive Results .................................................................................61 3.4.5 Experiment Summary ...................................................................................................62
Chapter 4 Evaluation of Field Operations and Data Quality ................................................. 63 4.1 Potential FTB Identification....................................................................................................... 63 4.2 Institutional Data Sources .......................................................................................................... 64
4.2.1 Enrollment List Acquisition and Quality ......................................................................64 4.2.2 CADE Completion Rates ..............................................................................................68 4.2.3 CADE Record Verification...........................................................................................70
4.3 Instrument Reliability and Usability .......................................................................................... 71 4.3.1 Reliability of Student Instrument..................................................................................71 4.3.2 Coding Systems ............................................................................................................75 4.3.3 Help Text Usage ...........................................................................................................76
4.4 Item Nonresponse ...................................................................................................................... 77 4.4.1 Item-Level Nonresponse...............................................................................................77 4.4.2 Critical Item Conversion...............................................................................................80
4.5 CATI Monitoring and Quality Assurance.................................................................................. 81 4.5.1 Question Delivery and Data Entry Error Rates.............................................................81 4.5.2 Quality Circle Meetings ................................................................................................83
4.6 File Preparation.......................................................................................................................... 84 4.6.1 Overview of the NPSAS:04 Field Test Files ................................................................84 4.6.2 Online Coding and Editing ...........................................................................................85 4.6.3 Post-Data-Collection Editing ........................................................................................86
Chapter 5 Planned Changes for the NPSAS:04 Full-Scale Study........................................ 91 5.1 Full-Scale Student Sample ......................................................................................................... 91 5.2 Institutional Contacting, List Acquisition, and Student Record Abstraction ............................. 91 5.3 Use of Incentives........................................................................................................................ 92 5.4 Instrumentation .......................................................................................................................... 92 5.5 Tracing and Locating ................................................................................................................. 93 5.6 Interviewer Training .................................................................................................................. 93 5.7 CATI Interviewing..................................................................................................................... 93 5.8 Conclusion ................................................................................................................................. 94
References................................................................................................................................. 95 Appendix A. Technical Review Panel .................................................................................... 97 Appendix B. Data Collection Notification Materials............................................................ 107 Appendix C. Student Instrument Facsimile......................................................................... 137 Appendix D. CADE Facsimile ............................................................................................... 313 Appendix E. CATI Training.................................................................................................... 325 Appendix F. CADE Verification Form................................................................................... 331

Table of Contents
xv NPSAS:04 Field Test Methodology Report
List of Tables Table 1. Schedule of major NPSAS:04 activities: 2002–04 ................................................................ 4 Table 2. Field test institutional sampling, eligibility, and participation, by sampling stratum:
2003 ....................................................................................................................................... 7 Table 3. Expected and actual field test student samples, by student type and level of institutional
offering: 2003 ..................................................................................................................... 10 Table 4. Initial classification of field test student sample, by institutional characteristic and
student type: 2003............................................................................................................... 11 Table 5. Field test training sessions: 2003 ......................................................................................... 25 Table 6. Number of student enrollment lists provided, by transmittal mode and institutional
sampling stratum: 2003 ...................................................................................................... 32 Table 7. Field test institutional participation response rates, by NPSAS cycle 1996–present:
2003 ..................................................................................................................................... 33 Table 8. Participation rates for NPSAS/NSOPF and NPSAS-only institutions: 2003 ...................... 33 Table 9. Results of CPS matching, by institutional characteristic and student type: 2003................ 34 Table 10. Results of NSLDS matching, by institutional characteristic and student type: 2003 .......... 36 Table 11. Field test student interview results, by institutional characteristic and student type:
2003 ..................................................................................................................................... 38 Table 12. Field test response rates and mode of completion, by institutional characteristic and
student type: 2003............................................................................................................... 39 Table 13. CADE abstraction methods, by institutional characteristic and highest offering: 2003 ...... 41 Table 14. CADE abstraction results, by institutional and student characteristics: 2003 ..................... 42 Table 15. Field test response rate comparisons for CADE, student interview, and study
respondents, by institutional characteristic and student type: 2003 ................................... 44 Table 16. Field test student locating, by institutional characteristic and student type: 2003............... 45 Table 17. Field test locate and interview rates, by CPS batch processing: 2003................................. 46 Table 18. Field test locate and interview rates, by NCOA batch processing: 2003............................. 47 Table 19. Field test locate and interview rates, by Telematch batch processing: 2003 ....................... 47 Table 20. Field test students requiring intensive tracing procedures, by institutional characteristic
and student type: 2003........................................................................................................ 48 Table 21. Field test locate and interview rates, by intensive tracing efforts: 2003.............................. 49 Table 22. Field test locate and interview rates, by outcome of intensive tracing efforts: 2003........... 49 Table 23. Field test locate rates, by intensive tracing source: 2003..................................................... 50 Table 24. Field test locate and interview rates, by nonresponse mailings: 2003 ................................. 51 Table 25. Average minutes to complete field test student interview, by mode of administration
and interview section: 2003................................................................................................ 52 Table 26. Average minutes to complete field test student self-administered web interview, by
web connection type: 2003................................................................................................. 53 Table 27. Average minutes to complete field test student interview, by student type and interview
section: 2003....................................................................................................................... 54 Table 28. Field test help desk incident type: 2003............................................................................... 55 Table 29. Call counts, by interview status and mode of completion: 2003 ......................................... 55 Table 30. Number and result of calls made to sample members, by institutional characteristic
and student type: 2003........................................................................................................ 56 Table 31. Field test location and interview rates for hard-to-reach sample members, by
percentage of calls in which an answering machine was reached: 2003 ............................ 57 Table 32. Field test telephone number type for respondent interview completion: 2003.................... 58

Table of Contents
NPSAS:04 Field Test Methodology Report xvi
Table 33. Allocation of students to the six treatment groups: 2003 .................................................... 59 Table 34. Response rates, by early response treatment group for phase I: 2003 ................................. 60 Table 35. Response rates, by early response treatment group for phase II: 2003................................ 60 Table 36. Response rates, by nonresponse treatment group for phase III: 2003 ................................. 61 Table 37. Distribution of completed interviews for all three phases, by early response treatment
group and data collection mode: 2003................................................................................ 61 Table 38. First-time beginning status determination, by sample student type: 2003........................... 64 Table 39. Enrollment list receipt, by institutional calendar system and month: 2003 ......................... 65 Table 40. Types of list problems encountered, by institutional sampling stratum: 2003 .................... 66 Table 41. Comparison of NPSAS:04 field test CADE data element completion rates, by method
of abstraction: 2003 ............................................................................................................ 69 Table 42. CADE verification percentage agreement, by abstraction method: 2003............................ 71 Table 43. Reliability reinterview response, by institution and student type: 2003 .............................. 72 Table 44. Reliability indices for items on the reinterview, by interview section: 2003....................... 74 Table 45. Summary of recode results, by respondent type: 2003 ........................................................ 76 Table 46. Number of help text accesses, by mode and interview item: 2003...................................... 76 Table 47. NPSAS:04 field test interview overall item nonresponse, by section: 2003 ....................... 78 Table 48. NPSAS:04 field test interview item-level nonresponse, by mode of interview
completion and interview section: 2003............................................................................. 79 Table 49. Conversion rates for critical items: 2003 ............................................................................. 80 Table 50. Quality circle meeting summary: 2003................................................................................ 83 Table 51. Description of missing data codes: 2003 ............................................................................. 86

Table of Contents
xvii NPSAS:04 Field Test Methodology Report
List of Figures Figure 1. NSoFaS institutional website home page: 2003 .................................................................. 12 Figure 2. NSoFaS institutional website status screen: 2003 ............................................................... 13 Figure 3. Field test student data collection overview: 2003................................................................ 22 Figure 4. NPSAS:04 student website home page: 2003...................................................................... 26 Figure 5. Field test locating and interviewing outcomes: 2003 .......................................................... 37 Figure 6. Field test cumulative response rates, by mode of interview: 2003 ...................................... 40 Figure 7. Monitoring error rates for CATI question delivery: 2003 ................................................... 82 Figure 8. Monitoring error rates for CATI data entry: 2003 ............................................................... 82

Table of Contents
NPSAS:04 Field Test Methodology Report xviii
This page is intentionally blank.

1 NPSAS:04 Field Test Methodology Report
Chapter 1 Overview of NPSAS:04
This document provides the description, summary, and evaluation of methodological procedures and results for the field test of the 2004 National Postsecondary Student Aid Study (NPSAS:04). The 2004 field test and subsequent full-scale study are being conducted for the National Center for Education Statistics (NCES) of the U.S. Department of Education, Washington, DC, as authorized by Title I, Section 153 of the Education Sciences Reform Act [PL 107–279]. For reference, previous cycles of NPSAS and its spin-off studies, the Beginning Postsecondary Students Longitudinal Study (BPS) and the Baccalaureate and Beyond Longitudinal Study (B&B), were authorized by the following legislation:
The General Education Provisions Act, as amended, 20 U.S.C. §1221 e-1 (2001).
The Higher Education Act of 1965, as amended by the Higher Education Amendments of 1986, Title XIII(a), Section 1303, and Title XIV, 20 U.S.C. §1070 et seq. (1994).
The Higher Education Act of 1965, Augustus F. Hawkins – Robert T. Stafford Elementary and Secondary School Improvement Amendments of 1988, 20 U.S.C. §2911 to 2976 (2001).
Sections 404(a), 408(a), and 408(b) of the National Education Statistics Act of 1994, 20 U.S.C. 9001 et seq. (2002).
NPSAS:04 is being conducted as the student component study of the 2004 National Study of Faculty and Students (NSoFaS:04) under contract by RTI International (RTI). Field test results for the faculty component study of NSoFaS:04—the 2004 National Study of Postsecondary Faculty (NSOPF:04)—are provided in a separate methodology report (Cahalan et al. 2004).
This introductory chapter describes the background, purposes, schedule, and products of the NPSAS:04 study, as well as the unique purposes of the field test. In chapter 2, field test design and methods are described. Descriptions and overall outcomes of the several stages of data collection and results of special experiments are presented in chapter 3. Chapter 4 presents evaluations of procedures used to collect information from institutions and students and the quality of the data collected.1 Chapter 5 summarizes the major planned changes for the full-scale study design and implementation based on field test findings. Materials used during the field test study are provided as appendixes to the report and cited in the text where appropriate.
1.1 Background and Purpose of NPSAS
NPSAS is a comprehensive nationwide study to determine how students and their families pay for postsecondary education. The study is based on a nationally representative
1 All comparisons provided in chapters 3 and 4 have been tested using a significance level of 0.05.

Chapter 1: Overview of NPSAS:04
NPSAS:04 Field Test Methodology Report 2
sample of all students (aided and nonaided) in postsecondary educational institutions. Undergraduate, graduate, and first-professional students comprise the sample; these students attend all types and levels of institutions, including public and private for-profit and not-for-profit institutions, and less-than-2-year institutions to 4-year colleges and universities.
The first NPSAS study was conducted in 1986–87 to meet the need for national-level data about significant financial aid issues. Since 1987, NPSAS has been fielded every 3 to 4 years, with the last cycle conducted during the 1999–2000 academic year. Beginning in 1990, each NPSAS data collection has provided the base-year data and sample for either the BPS or the B&B. NPSAS:04 will serve as the base-year study for BPS:2004. These students will be followed up in 2006, and again in 2009.
A main objective of NPSAS:04 is to produce reliable national estimates of characteristics related to financial aid for postsecondary students. No other single national database contains student-level records for students receiving financial aid from all of the numerous and disparate programs funded by the federal government, the states, postsecondary institutions, employers, and private organizations. The data are part of NCES’s comprehensive information on student financial aid and other characteristics of those enrolled in postsecondary education. The study focuses on three general questions with important policy implications for financial aid programs:
• How do students and their families finance postsecondary education?
• How does the process of financial aid work, in terms of both who applies for and who receives aid?
• What are the effects of financial aid on students and their families and on postsecondary institutions?
1.2 Purpose of the Field Test
The major purpose of the NPSAS:04 field test was to plan, implement, and evaluate operational and methodological procedures, instruments, and systems proposed for use in the full-scale study. The field test was particularly important in this, the sixth cycle of NPSAS, because of several fundamental changes from prior years. Perhaps the most salient change was the decision of NCES to combine two major studies (NPSAS and NSOPF) previously conducted independently, into one overarching data collection, the 2004 National Study of Faculty and Students (NSoFaS:04). The decision was made to combine these studies because historically there has been considerable overlap in the institutions selected for participation in NPSAS and NSOPF. Given that each of these studies is conducted periodically, it was decided that they should be combined under one data collection effort to minimize response burden on institutions and to realize data collection efficiencies. However, it should be noted that NPSAS and NSOPF, as well as the subsequent BPS, still maintain separate identities, and the purpose of this report is only to provide a description of procedures and results for the NPSAS:04 field test. Some of the other design changes to NPSAS:04 include the following:
• introduction of representative samples from 12 states in order to ascertain the feasibility of developing state-specific reporting in future NPSAS cycles;

Chapter 1: Overview of NPSAS:04
3 NPSAS:04 Field Test Methodology Report
• parallel rather than sequential collection of student data from institutional records and from student interviews;
• use of a single, web-based student instrument for both self-administered and computer-assisted telephone interviews; and
• elimination of abbreviated interviews for refusal conversion and students of limited English proficiency.
A comprehensive field test has been used throughout the NPSAS series to enhance and advance the methodologies in these surveys. Just as the results of past NPSAS surveys and their associated field tests have served to improve subsequent design and method, the results of the NPSAS:04 field test have improved the NPSAS:04 full-scale study. The full-scale study has been modified to maximize operational efficiency, response rate, and the quality of information obtained.
1.3 Schedule and Products of NPSAS:04
Table 1 provides a summary of the schedule for the field test, as well as the proposed schedule for the full-scale study in 2004. Electronically documented, restricted-access research files (with associated electronic codebooks) as well as NCES Data Analysis Systems (DASs) for public release will be constructed from the full-scale data and distributed to a variety of organizations and researchers. NPSAS:04 will produce the following types of reports: (1) a full-scale methodology report, providing details of sample design and selection procedures, data collection procedures, weighting methodologies, estimation procedures and design effects, and the results of nonresponse analyses; and (2) up to four descriptive summaries of significant findings. Past descriptive reports included student financing of undergraduate education (Berkner et al. 2002), student financing of graduate and professional education (Choy and Geis 2002), and a profile of undergraduates at U.S. postsecondary institutions (Horn, Peter, and Rooney 2002).

Chapter 1: Overview of NPSAS:04
NPSAS:04 Field Test Methodology Report 4
Table 1. Schedule of major NPSAS:04 activities: 2002–04 Activity Start date1 End date2 Field test
Select institutional sample 5/22/02 9/10/02 Mail and make phone contact with Chief Administrator 9/25/02 6/04/03 Mail and make phone contact with Institutional Coordinator 10/08/02 6/06/03 Obtain lists for student sampling 1/08/03 8/15/03 Select student samples 2/13/03 4/30/03 Request/obtain CPS data 2/14/03 4/24/03 Preload CPS data into CADE records 2/14/03 4/28/03 Implement CADE record abstraction 3/07/03 6/30/03 Implement web interviewing of students 3/20/03 7/20/03 Implement CATI of students 4/10/03 7/18/03
Full-scale study3 Select institutional sample 5/22/02 7/25/03 Mail and make phone contact with Chief Administrator 3/10/03 7/29/04 Mail and make phone contact with Institutional Coordinator 3/24/03 7/29/04 Obtain lists for student sampling 1/07/04 7/01/04 Select student samples 1/14/04 7/08/04 Send prenotification mailing 2/02/04 7/30/04 Request/obtain CPS data 1/14/04 7/14/04 Preload CPS data into CADE records 1/14/04 7/14/04 Implement CADE record abstraction 2/04/04 8/31/04 Implement web interviewing of students 2/04/04 8/31/04 Implement CATI of students 2/26/04 8/31/04
1This is the date on which the activity was initiated for the first applicable institution and/or its associated students. 2This is the date on which the activity was completed for the last applicable institution and/or its associated students. 3The dates for the full-scale study are approximate. NOTE: CPS = Central Processing System; CADE = Computer-assisted data entry; CATI = Computer-assisted telephone interviewing. SOURCE: U.S. Department of Education, National Center for Education Statistics, 2004 National Postsecondary Student Aid Study (NPSAS:04) Field Test.
The remainder of this report provides details on the NPSAS:04 field test sampling design, methodology, and data collection results at the institution and student levels. It also presents the results of analyses conducted to evaluate the effectiveness of the NPSAS:04 procedures in preparation for implementation in the full-scale data collection. Unless otherwise indicated, a criterion probability level of 0.05 was used for all tests of significance

5 NPSAS:04 Field Test Methodology Report
Chapter 2 Design and Methodology of the Field Test
This chapter provides a detailed summary of the design of the 2004 National Postsecondary Student Aid Study (NPSAS:04) field test and the methods implemented in the study. All procedures and methods were developed in consultation with a Technical Review Panel comprised of nationally recognized experts in higher education. A complete listing of this panel is provided in appendix A. Sampling is discussed in particular detail because it occurs in several stages in this study; it has implications for the future Beginning Postsecondary Students Longitudinal Study follow-up surveys (BPS:04/06 and BPS:04/09), as the cohort is generated from the NPSAS:04 sample and interview. In addition, institutional contacting, instrument development, student data collection procedures, study experiments, data quality evaluations, and data management systems are described.
2.1 Respondent Universe
The sample selected for the NPSAS:04 field test was selected purposely from among institutions not included in the NPSAS:04 full-scale sample. The students of analytic interest were those enrolled in Title IV-eligible2 postsecondary education in the United States and Puerto Rico at any time between July 1, 2002 and April 30, 2003.3
2.1.1 Institutional Sample and Eligibility
The institutions eligible for the NPSAS:04 field test were required during the 2002–03 academic year to do the following:
• meet the following conditions required to distribute federal Title IV aid; – offer an educational program designed for persons who have completed a high
school education; – offer at least one academic, occupational, or vocational program of study lasting
at least 3 months or 300 clock hours; • offer courses that are open to more than the employees or members of the company
or group (e.g., union) that administers the institution;
2 A Title IV-eligible institution is an institution that has a written agreement (Program Participation Agreement) with the Secretary of Education that allows the institution to participate in any of the Title IV federal student financial assistance programs other than the State Student Incentive Grant (SSIG) and the National Early Intervention Scholarship and Partnership (NEISP) programs. 3The population of interest for the full-scale NPSAS:04 study includes students enrolled in any term during the 2003–04 financial aid award year, which would be any time between July 1, 2003 and June 30, 2004. However, defining the sample year this way introduces considerable schedule delays with only marginal associated benefits because the bulk of the target population is contained within the operationally defined population. The field test population mirrors what will be used a year later for the full-scale study.

Chapter 2: Design and Methodology of the Field Test
NPSAS:04 Field Test Methodology Report 6
• be located in the 50 states, the District of Columbia, or Puerto Rico; and • be an institution other than a U.S. service academy.
Institutions providing only avocational, recreational, or remedial courses or only in-house courses for their own employees are excluded. U.S. service academies were excluded because of their unique funding/tuition base.
The above institutional eligibility conditions were consistent with previous NPSAS studies with two exceptions. First, the requirement to be eligible to distribute federal Title IV aid was implemented for NPSAS:2000. Also, where prior NPSAS studies excluded institutions that offered only correspondence courses, NPSAS:04 includes such institutions if they were eligible to distribute federal Title IV student aid.
The institutional sampling frame for the NPSAS:04 field test was constructed from the 2001 Integrated Postsecondary Education Data System (IPEDS) Institutional Characteristics file, the 2001 IPEDS Completions file, and the 2001 Fall Enrollment file. Two hundred institutions were selected for the NPSAS:04 field test with an expected yield of approximately 184 institutions providing lists for selection of sample students. The 200 field test sample institutions were selected purposively from the complement of the institutions selected for the full-scale study4 (150 of these institutions were also in the 2004 National Study of Postsecondary Faculty [NSOPF:04] field test sample). This ensured that no institution would be burdened with participation in both the field test and full-scale samples without affecting the representativeness of the full-scale sample.
To the extent possible, the field test sample of institutions was selected to approximate the distribution by institutional strata for the full-scale study. However, several institutions were designated as “certainty institutions” for the full-scale sample (i.e., they were definitely to be selected for the full-scale sample)—both for the national sample and for the state samples. Furthermore, for some of the 12 states, all institutions were to be selected for the full-scale, so no institutions from those states were included in the field test sample. Fifty-six institutions from 6 of the 12 states were in the field test sample.
A breakdown of sampled institutions by institutional strata is provided in table 2. This table also shows eligibility rates, rates for providing student lists, and past NPSAS participation overall and by stratum among the sampled institutions. Overall, about 98 percent of the sampled institutions met NPSAS eligibility requirements; of those, about 89 percent provided enrollment lists for student sampling.
4 The institutions on the full-scale sampling frame were partitioned into 58 institutional strata based on institutional control, highest level of offering, and Carnegie classification. NPSAS:04 also includes state-representative undergraduate student samples for three institutional sectors (public 4-year, public 2-year, and private not-for-profit 4-year) in 12 states. These 12 states were selected by NCES from those expressing interest. The 12 states were categorized into three groups based on population size: four small states (CT, DE, NE, OR), four medium size states (GA, IN, MN, TN), and four large states (CA, IL, NY, TX). Interested readers are referred to the forthcoming NPSAS:04 Methodology Report for a more detailed description of the sample designs, including a complete listing of the 58 strata and further details.

7
NPSA
S:04 Field Test Methodology R
eport
Chapter 2: D
esign and Methodology of the Field Test
Table 2. Field test institutional sampling, eligibility, and participation, by sampling stratum: 2003 Sample institutions Eligible institutions Provided lists Past NPSAS participant
Institutional sampling stratum Number Percent1 Number Percent2 Number Percent3 Number Percent3
All institutions 200 100.0 195 97.5 173 88.7 106 54.4 Public
Less-than-2-year 3 1.5 2 66.7 2 100.0 1 50.0 2-year 71 35.5 70 98.6 59 84.3 38 54.3 4-year non-doctorate-granting 22 11.0 22 100.0 21 95.5 17 77.3 4-year doctorate-granting 12 6.0 12 100.0 11 91.7 10 83.3
Private, not-for-profit Less-than-4-year 6 3.0 5 83.3 5 100.0 2 40.0 4-year non-doctorate-granting 46 23.0 45 97.8 38 84.4 21 46.7 4-year doctorate-granting 15 7.5 15 100.0 13 86.7 12 80.0
Private, for-profit Less-than-2-year 15 7.5 14 93.3 14 100.0 0 0.0 2-year-or-more 10 5.0 10 100.0 10 100.0 5 50.0
1 Percent is based on overall total within column. 2 Percent is based on number sampled within row. 3 Percent is based on number eligible within row. SOURCE: U.S. Department of Education, National Center for Education Statistics, 2004 National Postsecondary Student Aid Study (NPSAS:04) Field Test.

Chapter 2: Design and Methodology of the Field Test
NPSAS:04 Field Test Methodology Report 8
2.1.2 Student Sample and Eligibility
To be eligible for the NPSAS:04 field test, students must have been enrolled in a NPSAS-eligible institution in any term or course of instruction at any time from July 1, 2002 through April 30, 2003. Additionally, study eligibility required that students met the following requirements:
• enrolled in either (a) an academic program; (b) at least one course for credit that could be applied toward fulfilling the requirements for an academic degree; or (c) an occupational or vocational program that required at least 3 months or 300 clock hours of instruction to receive a degree, certificate, or other formal award;
• not currently enrolled in high school; and
• not enrolled solely in a General Equivalency Diploma (GED) or other high school completion program.
Students concurrently enrolled in high school or who were enrolled only in a GED or other high school completion program were not eligible. Also excluded were students taking only courses for remedial or vocational purposes and not receiving credit, those only auditing courses, and those taking courses only for leisure, rather than as part of an academic, occupational, or vocational program or course of instruction.
These student eligibility conditions for NPSAS:04 are almost identical to those used for NPSAS:93, NPSAS:96, and NPSAS:2000. The ideal survey year is July 1 through June 30 because this is the financial aid year. The NPSAS:04 survey year is July 1 through April 30. This definition of survey year differs from NPSAS:93 and NPSAS:96 because those studies had a survey year that began in May or June rather than in July. This change for NPSAS:04 makes the survey year more consistent with the ideal survey year than NPSAS:93 and NPSAS:96 because the starting date is the same, and it does not include students from the past financial aid year. The NPSAS:04 survey year differs from the definition used in NPSAS:2000 because that study had a survey year that ended June 30 rather than April 30. This change for NPSAS:04 will expedite timely completion of data collection and preparation of data files. In the full-scale study, poststratification of survey estimates based on U.S. Department of Education administrative records (on enrollment and aid distributed) will adjust for the fact that the survey year ends with the terms starting by April 30, excluding a small number of students who are newly enrolled in May or June.
To create student sampling frames, each participating institution was asked to send in a list of eligible students. The requests for student lists specifically indicated how to handle special cases such as students taking only correspondence or distance learning courses, foreign exchange students, continuing education students, extension division students, nonmatriculated students, and so on. The data required for each enrollee were the student’s name and identification (ID)/Social Security number (for abstracting student records), the student’s level during the last term of enrollment (undergraduate, master’s, doctoral, other graduate, or first-

Chapter 2: Design and Methodology of the Field Test
9 NPSAS:04 Field Test Methodology Report
professional), and first-time beginning5 (FTB) status. Contacting information, such as local and permanent telephone numbers and addresses and campus and permanent e-mail addresses also were requested.
The student sample sizes for the field test were set to approximate the distribution planned for the full-scale study with the exception that additional FTB students were selected to have a sufficient sample size for the field test of the Beginning Postsecondary Students Longitudinal Study (BPS). As shown in table 3, the field test was designed to sample approximately 1,300 students, including 810 FTB students; 360 other undergraduate students; and 130 graduate and first-professional students. There were eight student sampling strata:
• four sampling strata for undergraduate students: − FTB in-state tuition students, − FTB out-of-state tuition students, − other undergraduate in-state tuition students, and − other undergraduate out-of-state tuition students;
• three sampling strata for graduate students: − master’s, − doctoral, − other graduate students; and
• a sampling stratum for first-professional students.
The numbers of FTB students shown in table 3 include both “true” FTB students who began their postsecondary education for the first time during the NPSAS field test year, and effective FTBs, who had not completed a postsecondary class prior to the NPSAS field test year. Unfortunately, some postsecondary institutions cannot readily identify their FTB students. Therefore, the NPSAS sampling rates for those identified as FTB students and other undergraduate students by the sample institutions were adjusted in order to determine the expected sample sizes after accounting for expected false positive and false negative rates. The false positive and false negative FTB rates experienced in NPSAS:96 (i.e., the most recent NPSAS to include a BPS base-year cohort) were used to set appropriate sampling rates for the NPSAS:04 field test.6
The student sampling procedures implemented in the field test were as comparable as possible to those planned for the full-scale study. For example, students will be sampled at fixed rates based on student sampling strata and institutional strata in the full-scale study, so students were selected at fixed rates defined by institutional and student strata in the field test also. Sample yield was monitored and the sampling rates were adjusted when necessary. This approach was used to achieve the required field test sample sizes, just as will be necessary in the full-scale study.
5 A first-time beginning student is one who began postsecondary education for the first time during the NPSAS year. 6 The NPSAS:96 false positive rate was 27.6 percent for students identified at the time of sampling as potential FTB students by the sample institution but determined during the interview not to be FTB; and the false negative rate was 9.1 percent for those identified at the time of sampling as other undergraduate students but determined during the interview to be FTB students.

Chapter 2: Design and Methodology of the Field Test
NPSAS:04 Field Test Methodology Report 10
Table 3. Expected and actual field test student samples, by student type and level of institutional offering: 2003
Student type and institutional offering level Expected student sample size1 Actual student sample size Total 1,300 1,300 Potential FTB2 student 810 790 Less-than-2-year 200 80 2-year 360 410 4-year 250 300 Other undergraduate 360 360 Less-than-2-year 30 10 2-year 80 70 4-year 250 280 Master’s (4-year) 60 30 Doctoral (4-year) 40 30 Other graduate (4-year) 10 60 First-professional (4-year) 20 20
1 Based on sampling rates, Fall 2001 Integrated Postsecondary Education Data System (IPEDS) Fall Enrollment file counts, and Fall 2001 IPEDS Completions file counts. 2 First-time beginning. SOURCE: U.S. Department of Education, National Center for Education Statistics, 2004 National Postsecondary Student Aid Study (NPSAS:04) Field Test.
Student samples were selected only from the first 77 institutions that sent in lists passing quality control (QC) checks (described in section 2.2.3). These 77 institutions provided a sufficient variation and numbers of sample students for the field test. If the 1,300 expected sample students were selected from all 173 participating institutions, the sample size per institution would have been too small for field test purposes. However, samples were selected from 170 lists received so that full-scale sampling procedures could be fully tested. Students selected from the later lists were processed in the same manner as those selected from the earlier lists, but no further data collection occurred.
The expected and actual student sample sizes are shown in table 3 by student type and level of institution. Overall, the application of predetermined sampling rates yielded a sample that was slightly below expectations. The other undergraduate and other graduate types yielded overall samples over expectations, and the remaining types yielded overall samples below expectations. The other graduate type was much larger than expected because some of the early lists that were received had all graduate students identified as other graduates. A QC check was later added to address this issue (see section 2.2.3). The samples selected early were larger than expected because these institutions had more students than expected. The student sampling rates were later adjusted downward for remaining institutions, so that the overall sample sizes for FTB students, other undergraduates, graduates, and first-professionals would be close to the expected overall totals. This accounts for some of the large discrepancies between the expected and actual sample sizes in the field test.
An additional perspective of the student sample that includes institutional characteristics is shown in table 4. Over one-half of the overall, FTB, other undergraduate, and graduate/first-professional samples were selected from public institutions. Also, more than one-third of all students and of FTB students were sampled from 2-year institutions.

Chapter 2: D
esign and Methodology of the Field Test
11
NPSA
S:04 Field Test Methodology R
eport
Table 4. Initial classification of field test student sample, by institutional characteristic and student type: 2003 Student type
Total sample Potential FTB sample Other undergraduate
sample Graduate/first-
professional sample1
Institutional characteristic Number Percent
Number Percent
Number Percent
Number Percent
Total 1,300 100.0 700 100.0 360 100.0 130 100.0
Institutional level
Less-than-2-year 90 7.3 80 10.7 10 2.8 † †
2-year 480 37.3 410 51.6 70 19.9 † †
4-year non-doctorate-granting 430 33.2 210 26.3 180 50.4 40 27.1
4-year doctorate-granting 280 22.2 90 11.4 100 26.9 100 72.9
Institutional control
Public 800 62.5 250 65.4 210 58.7 70 55.6
Private not-for-profit 370 29.1 170 22.1 140 38.8 60 44.4
Private for-profit 110 8.4 100 12.5 10 2.5 † †
Institutional sector
Public
Less-than-2-year 40 2.7 30 3.4 10 2.2 † †
2-year 380 29.9 330 41.7 60 15.2 † †
4-year non-doctorate-granting 190 14.6 100 12.6 80 21.9 10 6.8
4-year doctorate-granting 200 15.3 60 7.8 70 19.4 70 48.9
Private, not-for-profit
2-year-or-less 60 4.6 50 6.0 10 3.3 † †
4-year non-doctorate-granting 230 17.6 100 12.5 100 28.0 30 20.3
4-year doctorate-granting 90 6.9 30 3.7 30 7.5 30 24.1
Private, for-profit
Less-than-2-year 60 4.6 60 7.2 # 0.5 † †
2-year-or-more 50 3.7 40 5.2 10 1.9 † † † Not applicable. # Rounds to zero. 1 For this presentation, the master’s, doctorate, other graduate, and first-professional strata have been combined into a single graduate/first-professional student type. NOTE: Detail may not sum to totals because of rounding. SOURCE: U.S. Department of Education, National Center for Education Statistics, 2004 National Postsecondary Student Aid Study (NPSAS:04) Field Test.

Chapter 2: Design and Methodology of the Field Test
12 NPSAS:04 Field Test Methodology Report
2.2 Data Collection Design
2.2.1 Institutional Website
A 2004 National Study of Faculty and Students (NSoFaS:04) website was developed for use by field test institutions. The NSoFaS website served a number of functions for both of the component studies: NPSAS and NSOPF. It provided institutions with a reliable and easily accessible reference to all study documents. It also provided for the uploading of electronic lists requested in data collection. Figure 1 presents the home page of the field test NSoFaS website.
Figure 1. NSoFaS institutional website home page: 2003
SOURCE: U.S. Department of Education, National Center for Education Statistics, 2004 National Postsecondary Student Aid Study (NPSAS:04) Field Test.
Visitors to the website were provided with the following links (see navigational bar on the left side of the screen):
• About NSOPF provided information for the faculty component of NSoFaS.
• About NPSAS provided information on the mandate and research objectives for the student component of NSoFaS, with a link to National Center for Education Statistics (NCES) reports from previous study cycles.
• Endorsements listed the 25 national organizations that endorsed NSoFaS.

Chapter 2: Design and Methodology of the Field Test
13 NPSAS:04 Field Test Methodology Report
• Frequently Asked Questions (FAQs) included questions and answers concerning all the stages of data collection for both components of NSoFaS.
• Help provided the help desk toll-free number and e-mail address for contacting project staff, along with instructions for login.
• Contact Us contained address information for RTI International (RTI).
• Login provided fields for entering a username and password, giving access to all data collection pages, such as coordinator designation and coordinator response sheet, the institutional questionnaire, and upload of student lists.
All data entry applications were protected by Secure Sockets Layer (SSL) encryption. Further security was provided by an automatic “time out” feature, through which a user was automatically logged out if the system was idle for 30 minutes or longer. The system did not use any persistent “cookies,” thus adhering to the U.S. Department of Education’s privacy policy.
A status screen, shown in figure 2, indicated which stages of institutional data collection were completed (denoted by a check mark) and allowed institutions to select those stages that were not yet completed. Once a stage was completed, it was no longer accessible via the Web.
Figure 2. NSoFaS institutional website status screen: 2003
NOTE: NSoFaS= National Study of Faculty and Students. SOURCE: U.S. Department of Education, National Center for Education Statistics, 2004 National Postsecondary Student Aid Study (NPSAS:04) Field Test.

Chapter 2: Design and Methodology of the Field Test
NPSAS:04 Field Test Methodology Report 14
2.2.2 Contacting Institutions
In order to increase the likelihood of institutional participation, endorsements from relevant organizations that had previously endorsed NPSAS or NSOPF or both were renewed and extended to both NSoFaS component studies when necessary. New endorsements were solicited from other organizations as it was deemed helpful. In all, 25 organizations endorsed NSoFaS, with one organization whose endorsement was relevant only to NPSAS-only institutions in the for-profit sector.
The institutional contacting effort began with an initial call to each sampled institution to verify the address of the institution, confirm eligibility for the sample (as appropriate), and collect contact information for the Chief Administrator. Chief Administrators at institutions sampled for NSoFaS received the following materials:
• a cover letter printed on NCES letterhead providing background information on NSOPF and NPSAS—the two component studies of NSoFaS (if the institution was sampled for both). The letter requested that the Chief Administrator designate an Institutional Coordinator (IC) for both components of the study, and it provided the user ID, password, and web address necessary to access the NSoFaS Designation of Coordinator form online;
• an NSoFaS brochure summarizing the objectives of both NPSAS and NSOPF, and providing background information and key findings for each component;
• an NSOPF brochure that would be mailed to the sampled faculty; and
• an NPSAS brochure that would be mailed to sampled students.
One key procedural change instituted for the NPSAS:04 field test was that Chief Administrators were encouraged to appoint the institutional research director as the IC. In past NPSAS cycles, it was far more likely that the IC was a member of the staff in the Financial Aid Office or Registrar’s Office. This change was necessitated by the desirability of designating a single coordinator who had access to sources of both student and faculty data.
If the Chief Administrator did not designate an IC, one of a team of four institutional contactors made follow-up telephone contact with the Chief Administrator. The Chief Administrator was asked to complete the Designation of Coordinator form online, or to provide the information by telephone.
Mailings containing instructions for participation in the studies were sent to ICs on a flow basis as they were designated by the Chief Administrator. The following materials were included:
• a cover letter describing the study, the institution’s password, IPEDS unit ID, and the web address necessary to access the NSoFaS website;
• a copy of the letter that went to the Chief Administrator and a facsimile of the Designation of Coordinator form;
• a listing of all endorsements, and a copy of the endorsement letter from the National Association of Financial Aid Administrators;

Chapter 2: Design and Methodology of the Field Test
15 NPSAS:04 Field Test Methodology Report
• a schedule of activities, including a flowchart of all NSoFaS activities;
• instructions for preparing the list of students, including a list of data elements requested, and a suggested file layout;
• complete instructions for participation in each phase of NPSAS;
• a list of transmittal options for sending faculty lists by mail, e-mail, and direct upload to the NSoFaS website, together with a packet and label for mailing the lists via overnight courier if required; and
• FAQs.
Copies of all letters and brochures sent to Chief Administrators and ICs can be found in appendix B.
2.2.3 Student List Acquisition and Sampling
The enrollment list requested was to contain all eligible students enrolled at any time between July 1, 2002 and April 30, 2003. (Sampled institutions could not provide complete lists until after the last applicable term began.) Institutions were encouraged to submit electronic lists in one of two ways: as a secure upload to the NSoFaS website or as an attachment to an e-mail sent to the project e-mail address. The data items requested for each listed student were the following:
• student ID number;
• Social Security number (possibly identical with student ID number);
• full name;
• education level—undergraduate, master’s, doctoral, other graduate, or first-professional—in the last term of enrollment during the study-defined year (only necessary for 4-year institutions);
• FTB indicator—yes, no, or unknown; and
• contact information—local and permanent address and phone number and campus and permanent e-mail address.
As noted in chapter 1, the collection of student information from institutional records via computer-assisted data entry (CADE)7 and directly from students (via a self-administered web interview or computer-assisted telephone interview [CATI]) occurred simultaneously for the first time in the field test for NPSAS:04. This change made it necessary to request address information as part of the student list. In previous iterations, locating information was requested through CADE only for those students selected for the sample. The purpose of this change was to expedite data collection for sampled students so that they could be contacted concurrent with CADE data collection from the institution.
7 See section 2.2.6 for a description of the CADE software system.

Chapter 2: Design and Methodology of the Field Test
NPSAS:04 Field Test Methodology Report 16
Instructions for preparing the student list were provided in the binder of materials sent to the IC; instructions were further clarified in follow-up telephone conversations as needed. In such subsequent telephone contacts, contractor staff worked closely with the IC to determine the best reasonable list of student information that could be provided by the institution.
Prompting telephone calls were made to the institutions that had not provided lists following the target date(s) set by the IC. Throughout the list acquisition process, the contractor attempted to accommodate institutional constraints and to reduce their burden, including elimination of duplicate lists. Where requested, institutions were reimbursed for personnel and computer time for list preparation.
Prior to actual student sampling, several checks were implemented on quality and completeness of provided student enrollment lists. Institutions providing lists that failed at least one of these checks were called to rectify the detected problem(s). Completeness or quality checks were failed if any of the following conditions existed:
• education level—undergraduate, master’s, doctoral, other graduate, or first-professional—was not included or was unclear;
• the FTB indicator was not included or was unclear; or
• the number of students listed was inconsistent with the latest IPEDS data, as described below.
QC checks were performed by checking the unduplicated counts from the enrollment lists provided by institutions against the nonimputed unduplicated student fall enrollment counts from the 2001 IPEDS fall enrollment file, which provides enrollment information only for the fall term rather than the entire 2001–02 school year. For any count that was imputed on the IPEDS enrollment file, no QC check was performed. For 4-year institutions, separate checks were made for four student types: FTBs, other undergraduates, graduates, and first-professionals. Upper and lower bounds were formed around the IPEDS counts to create a range. If the list count was in the range, the list passed QC; otherwise, the list failed QC. Given that one of the goals of the field test was to test the appropriate range of allowable boundaries, the upper and lower bounds were chosen to allow a range wider than what was actually expected. Furthermore, the upper and lower bounds for the IPEDS counts used in the QC process took into account that: (1) IPEDS counts are based on fall enrollment while the list counts were for July 1 through April 30 and (2) IPEDS counts were a 1½ years old at the time of use.
FTB students are defined differently for NPSAS than for IPEDS,8 but a comparison was made between NPSAS FTB students and IPEDS first-time freshmen to see if such a comparison was feasible. As is detailed later in this report (section 4.2.1), this comparison was useful to identify institutions that did not include all of its FTB students. The institution failed the check if
8 IPEDS defines FTB students as first-time degree-seeking freshmen. These are students attending any institution for the first time at the undergraduate level. Included are students enrolled in academic or occupational programs, students enrolled in the fall term who attended college for the first time in the prior summer term, and students who entered with advanced standing (college credits earned before graduation from high school). These students are enrolled in courses for credit who are recognized by the institution as seeking a degree or other formal award. For a complete description of the NPSAS definition of FTB, please refer to section 4.1.

Chapter 2: Design and Methodology of the Field Test
17 NPSAS:04 Field Test Methodology Report
the number of FTB students differed sufficiently from the IPEDS nonimputed fall enrollment count. For FTB students, the failure occurred when the respective list count was less than 50 percent of the IPEDS fall enrollment count or when the respective list count was more than double the IPEDS fall enrollment count.
Upper and lower bounds on the IPEDS counts for other undergraduates, graduates, and first-professionals were initially set based on what was used in previous NPSAS studies and then expanded, as necessary, until it was determined that the bounds worked well. Bounds were also set for total enrollment to test the feasibility of such a comparison. Institution lists failed the QC check if the number of other undergraduates, graduates, first-professionals, and total students provided differed sufficiently from the IPEDS nonimputed fall enrollment count. For the total count, the failure occurred when the respective list count was less than 50 percent of the IPEDS fall enrollment count or when the respective list count was more than double the IPEDS fall enrollment count. For other undergraduates, graduates, and first-professionals, the failure occurred when the list count was less than 25 percent of the IPEDS fall enrollment count or more than 50 percent of the IPEDS fall enrollment count.
If any student count failed the check, but the absolute difference between the counts for that student level (FTB, other undergraduate, graduate, first-professional, or total) was fewer than 100 students and the student list count was not zero, then the student count for that level passed the QC check. Also, if the IPEDS fall enrollment count was zero for any student level and the institution provided a list of students of that level, then the count passed the QC check.
The student sample was selected on a flow basis as the lists were received, reconciled, and unduplicated (as applicable).9 Stratified systematic sampling procedures were used to facilitate sampling from both electronic and hardcopy lists. As student lists were received from institutions, students were sampled. Stratified systematic sampling was used to ensure comparable sampling procedures for both paper-copy and electronic lists. In the case of duplicated paper-copy lists, a stratified systematic sample was selected from each list provided (typically separate lists by term) and the samples selected were “unduplicated” against master lists. When institutions provided hardcopy lists, sometimes a separate list for each student stratum was provided and other times a single list. In the latter case, stratum was indicated but the list was not sorted by stratum. Therefore, all students on the list were sampled at the highest of the student sampling rates for the strata represented by the list. After the sample was keyed, the students selected from each stratum were subsampled to achieve the appropriate sampling rate for that stratum. For each institution, student sampling rates, rather than student sample sizes, were fixed.
2.2.4 Overview of Extant Data Sources for Student Data
A portion of the student study data were obtained from two extant databases, which served several useful functions. First, these additional data sources provided some information
9 Electronic lists were unduplicated using Social Security or student ID numbers prior to sampling. To avoid duplication on paper copy lists, samples were drawn from the “most recent” list (typically a spring term) as well as from earlier term lists. The “most recent” term sample was retained while the other samples were unduplicated against that “most recent” sample.

Chapter 2: Design and Methodology of the Field Test
NPSAS:04 Field Test Methodology Report 18
that could not be collected from the institutions or the students. Second, they provided a way to “fill in” certain data that were obtained in institutional record abstraction or the student interview but were missing for individual sample members (e.g., demographics). Also, these data sources served to check or confirm information obtained from student records or interviews.
To reduce institutional burden in subsequent data collections, information related to applications for federal financial aid during the financial aid year was obtained from the U.S. Department of Education’s Central Processing System (CPS). Students give this information on the Free Application for Federal Student Aid (FAFSA) form; it is then converted to an electronic form, analyzed, and provided to involved institutions and other approved parties. As was the case in NPSAS:96 and NPSAS:2000, RTI was assigned a “special designation code.” Under this procedure, financial aid application data were requested through a standard Federal Data Request process.10 The CPS was accessed semiweekly to download CPS data from the completed request.
Data on the nature and amount of Pell grants or federal student loans were obtained from the National Student Loan Data System (NSLDS) database maintained by the U.S. Department of Education. The electronic data interchange with NSLDS was initiated toward the end of student data collection. It included a query of both federal student loan and Pell grant files. A successful match with the NSLDS loan and Pell database required that the student have a valid application record within the database. The accessed NSLDS Pell grant and loan files included information for the year of interest, as well as a complete federal grant or loan history for each applicable student.
2.2.5 Student Instrument Development
Unlike previous NPSAS cycles, the NPSAS:04 student instrument was created as a web-based instrument to be used both for self-administered “interviews” and by telephone interviewers. The overall content of the NPSAS:04 field test instrument was based on the instruments used in NPSAS:2000 and NPSAS:96 in order to provide data users with the ability to make comparisons over time. Items relevant to the BPS were drawn from NPSAS:96, the last cycle that produced a BPS cohort. NPSAS:2000 items specific to the B&B cohort were deleted. The NPSAS:04 instrument content was also modified to reflect current policy issues and topics relevant to researchers.
The instrument consisted of six sections grouped by topic. The first section determined student eligibility for the NPSAS:04 study and obtained the enrollment history. The second section contained questions relating to student expenses and financial aid. Included in this section were items regarding employment at the NPSAS institution, such as work-study participation, assistantships, and fellowships. Section three focused on employment and finances. Educational experiences such as courses taken and admission test scores were included in the fourth section, as well as items specific to BPS respondents. The fifth section of the interview gathered background and demographic information about students and their family
10 This is a request process similar to that available to state and federal requests from the system, through which information can be requested about individuals regardless of the institution they attend. Requests made by an institution are restricted to applicants to that institution only.

Chapter 2: Design and Methodology of the Field Test
19 NPSAS:04 Field Test Methodology Report
members. The final section, applicable only to BPS respondents, requested contacting information in order to make subsequent follow-up contact with these respondents easier for future studies.
After the interview was complete, respondents were asked to complete an additional opinion questionnaire for methodological purposes that asked them about their experience completing the survey. See appendix C for a facsimile of the complete web-based instrument, with the exception of the opinion questionnaire.
Mixed-mode data collection introduces other concerns that are not found when dealing solely with a single mode. In the past, data collection was done primarily via CATI. The interviewer’s presence provided the respondent a means to clarify question meanings and served to increase data quality because interviewers could probe when responses were unclear. With self-administration, this benefit is removed. Therefore, modifications to the instrument were made to account for the mixed-mode presentation (i.e., self-administered and CATI) to ensure high-quality data were obtained and to make the interview process as efficient as possible for respondents. Changes included the following:
• modifications to question wording so that it was appropriate if read by a respondent or read to a respondent by a CATI interviewer, while also maintaining question integrity;
• the provision of additional help text to assist self-administered respondents in completing the interview;
• the addition of pop-up boxes to the instrument when out-of-range values were entered as a value for an item;
• the removal of “don’t know” response options for all items except for key items such as parent income (respondents could implicitly refuse answering all items by leaving the screen blank and proceeding with the interview); and
• the provision of prompt boxes that were programmed to display if a respondent implicitly refused to answer (i.e., left blank) three consecutive screens. The prompt box reiterated the importance of the study and completeness of data, and requested that the respondent complete the items left blank.
Another important consideration while developing the NPSAS:04 field test instrument was the introduction of variation in response time. Web users connect through a variety of sources (e.g., dial-up, T1, high-speed cable access), use different operating systems, and have different computer resources. All of these factors were relevant to designing the instrument in order to ensure minimal burden on the respondent.
With an instrument as large and complex as this, another critical factor was the determination of skip logic. Not only was it important to determine the appropriate routing from item to item on the basis of respondent status (e.g., BPS, undergraduate, graduate student), but it was also necessary to ensure that the skip logic was as efficient as possible. Sending respondents from one screen to another can add considerable transit time to web-based instruments. This

Chapter 2: Design and Methodology of the Field Test
NPSAS:04 Field Test Methodology Report 20
increases the burden on the respondent and can lead to increased data collection costs as interviewers wait for screens to load during the interview.
Once the instrument was complete and programmed, rigorous testing was conducted over several iterations. Project staff and NCES staff used preloaded scenarios to test the skip logic, question wording, screen layout, and efficiency of the instrument. This testing was done from a variety of locations, using a range of connection options, and at varied times of the day in order to identify areas needing revision. This process was facilitated by the use of RTI’s Instrument Design and Documentation System (IDADS), which is described in detail in section 2.3.1. This system allowed project staff and NCES to coordinate testing efforts, and provided a historical account of all problems and the solutions implemented.
2.2.6 CADE Data Abstraction From Student Records
Data from sampled students’ records at the NPSAS institution were collected using procedures similar to those successfully tested and implemented during NPSAS:2000. Specifically, a web-based CADE software system was developed for use in collecting data from student records. For the NPSAS:04 field test study, CADE was created using Active Server Pages technology against a structured query language (SQL) server database. The same CADE system was loaded onto laptops used by the RTI field data collectors for field-CADE.
As was the case in NPSAS:2000, institutions could choose either to enter the data (self-CADE) or to have an RTI-employed field data collector complete data entry (field-CADE). Institutions were encouraged to use their own staff for this data collection (with compensation for staff time when requested), in order to minimize the overall cost of the data collection.
The CADE record abstraction process began when a student sample had been selected and transmitted to the CPS to obtain financial aid application data. Upon completion of the CPS matching (typically a 24-hour turnaround), a number of data elements were preloaded into the CADE database, thus initializing the CADE system for that institution. These preloaded elements included an indicator of whether the student had been matched successfully to the CPS system, as well as selected CPS variables for use in CADE software edit checks. In addition, the system was customized for each institution by preloading the names of institutional financial aid programs and up to 12 state financial aid programs to assist in identifying aid received by students.
Once CADE was initialized for a particular institution, the ICs who previously indicated a willingness to complete the data collection via self-CADE received a user name and password to gain access to the CADE system, along with a hardcopy list of the students sampled and a copy of the NPSAS CADE User’s Guide. Within 2–3 days, help desk staff called to confirm the receipt of the materials and requested a date for estimated completion of record abstraction and data entry. Field-CADE institutions also received these materials but were contacted by the field data collector to identify a mutually convenient time to conduct the visit to the institution.
The CADE record abstraction instrument (the full contents of which appear in appendix D) was structured into three sections covering eight general topics:

Chapter 2: Design and Methodology of the Field Test
21 NPSAS:04 Field Test Methodology Report
1. locating—for collecting/updating address and phone information for students, students’ parents, and other contacts;
2. characteristics—for collecting demographic data such as sex, race, and marital status;
3. admissions—for collecting scores for undergraduate, graduate, and first-professional admissions tests;
4. enrollment—for collecting terms of enrollment, degree program, and field of study;
5. tuition—for collecting tuition data for the terms of enrollment;
6. financial aid awards—for collecting additional financial aid data for aid recipients;
7. need analysis—for collecting student financial aid budget data for aid applicants; and
8. Institutional Student Information Records (ISIRs)—for collecting name and Social Security number for students not previously matched successfully to CPS, but for whom an ISIR was available, indicating the student had applied for federal financial aid for the study year.
Based on daily status reports summarizing the progress of the self-CADE institutions, staff placed periodic calls to the coordinators to prompt completion of the record abstraction. In general, status reports indicated that institutions were typically slow to begin the CADE task (often waiting many weeks after system initialization before starting data collection), but once record abstraction began, they completed the task relatively quickly.
2.2.7 Student Contacting and Locating
The NPSAS:04 data collection design involved initial locating of sample members, providing an opportunity for the student to complete the self-administered interview via the Web, following up with nonrespondents after 3 weeks, and attempting to conduct a CATI interview with them if necessary. Data collection activities are shown in figure 3 and include pre-data-collection batch-locating activities, notification letter mailings, CATI tracing, intensive tracing procedures, interviewing, and nonrespondent follow-ups.

Chapter 2: Design and Methodology of the Field Test
NPSAS:04 Field Test Methodology Report 22
Figure 3. Field test student data collection overview: 2003
Obtain student lists
Sample students
Batch updatingCPS, NCOA, Telematch
Load cases for web-based interview
Successful? Load cases for CATI follow-up Cases to tracingoperations
Completed interview
Successful ? Located
Final nonrespondent Final unlocatable
Yes Yes
No Not Located
Located
NoNo
Yes
Sample institutions
1Cases designated by tracing operations as “located” were reloaded for CATI follow-up. If the CATI follow-up failed to confirm the new locating information the case was sent to tracing operations a second time. Cases sent to tracing operations twice but remaining unlocated were coded as “final unlocatable.” NOTE: CPS =Central Processing Systems; NCOA = National Changes of Address; CATI = computer-assisted telephone interviewing. SOURCE: U.S. Department of Education, National Center for Education Statistics, 2004 National Postsecondary Student Aid Study (NPSAS:04) Field Test.
Pre-Data-Collection Batch Locating. Upon receipt of student lists from the participating institutions, batch locating activities were employed to update address and

Chapter 2: Design and Methodology of the Field Test
23 NPSAS:04 Field Test Methodology Report
telephone information for the selected sample members. This was a multi-step task. Initially, information received from the institutions was entered into the NPSAS:04 locator database. This database served as a central repository for all locating information obtained for the students. Several databases were then used to update the student locating information provided by the institutions.
First, cases with a valid Social Security number were sent to the CPS for updating. The information obtained from the CPS was compared with that already obtained from the institutions; any updates were loaded into the locator database. Next, all cases with one or more valid addresses were sent to the U.S. Postal Service National Change of Address (NCOA) system. The NCOA database consists of change-of-address data submitted to the U.S. Postal Service and is updated every 2 weeks, with records stored for 18 months. New address information provided another update for the locator database. Finally, all student addresses and telephone numbers were sent to Telematch for telephone number updating. Telematch offers a computerized residential telephone number updating service consisting of over 65 million listings, over one million not-yet-published numbers of new residents, and over 10 million numbers for businesses. The service uses a name, street address, and ZIP code as search criteria and returns a telephone number for each match. These new numbers were then added to the NPSAS:04 database.
In some cases, the batch database searches confirmed or updated the contact information provided by the institution; in other cases, the searches resulted in new contact information. All locating information obtained as a result of these searches was loaded into the NPSAS:04 database, with information from each source listed on a separate line.
Initial Student Notification Letter Mailing. After addresses were updated, a notification mailing was sent to all sample members. Letters were sent twice a week on a flow basis depending on when the student information was received from the institution after all batch-tracing procedures for the case were complete. The initial student mailing contained a lead letter and informational brochure (provided along with institutional contacting materials in appendix B). The materials contained information about the study; responses to commonly asked questions; provisions for confidentiality and security; contact information for project and NCES staff, as well as the NPSAS:04 help desk; and details on how to access the web instrument (including username and password).
CATI Locating. Telephone contact began for self-administered web nonrespondents 3 weeks after the initial mailing. CATI locating and tracing activities occurred concurrently with efforts to gain cooperation from sample members. When assigned a case, the telephone interviewer called the telephone number designated by CATI as the number that appeared to have the greatest potential for contacting the sample member, and attempted an interview. When the person answering the call said that the sample member could not be reached at that number, the interviewer asked the person how to contact the sample member. If this approach did not provide the information needed, the interviewer initiated tracing procedures, using all other available information for other contact persons in an attempt to locate the student. When all tracing options available to the interviewer were exhausted, the case was assigned to RTI’s Tracing Operations Unit (TOPS) for intensive tracing.

Chapter 2: Design and Methodology of the Field Test
NPSAS:04 Field Test Methodology Report 24
Intensive Tracing Efforts. Cases were sent to TOPS for intensive tracing in two situations: when cases had no telephone number for loading into CATI and when cases were designated as a dead-end in CATI (i.e., there were no more telephone numbers to call for the case). TOPS had access to both proprietary and public-domain locating databases. Proprietary databases provided real-time access to several consumer databases (Transunion, Equifax, and Experian), which contain current address and phone listings for the majority of consumers with a credit history. TOPS also had access to a variety of other information sources, such as data miners and commercial list houses. These sources provided the following searches: name, address, neighbor, phone matching searches, and status (decedent, incarcerated, incapacitated, or military personnel).
A two-tiered intensive tracing plan was used to locate NPSAS:04 sample members. The first tier involved identifying sample members with Social Security numbers and processing that information through consumer databases. If a search generated a new telephone number, that case was sent back to CATI for telephone interviewing. If a new address was generated but a new telephone number was not, tracers called directory assistance or accessed other databases to obtain telephone numbers for CATI. This first level of effort minimized the time that cases were out of production.
All remaining cases (those lacking new information from the Social Security number search) underwent a more intensive level of tracing in the second tier. The second tier of tracing activities included the following:
• checking directory assistance for telephone listings at various addresses;
• using electronic reverse-match databases to obtain the names and telephone numbers of neighbors, and then calling the neighbors;
• contacting the current or last known residential sources such as the neighbors, landlords, current residents, tax assessors, realtors, and other business establishments related to previous addresses associated with the sample member; and
• using various tracing websites.
Tracers checked new leads produced by these tracing steps to confirm the addresses and telephone numbers for the sample members. When the information was confirmed, that case was returned to CATI for telephone interviewing. If TOPS located a new e-mail address for a sample member, the information was loaded into the database for future e-mail correspondence to nonrespondents. Cases that could not be located (e.g., there were no working telephone numbers or numbers for relevant neighborhood sources were unpublished) were reviewed by supervisors, and (if necessary) were finalized as unlocatable.

Chapter 2: Design and Methodology of the Field Test
25 NPSAS:04 Field Test Methodology Report
2.2.8 Student Interviewing
Staff Training. The mixed-mode design of the NPSAS:04 field test data collection required the development of three separate training programs: help desk training, CATI interviewer training, and training of tracing staff. Separate training sessions were conducted for supervisors, help desk agents, telephone interviewers, and tracers (see table 5 for specific training dates). Table 5. Field test training sessions: 2003
Activity Date Number of staffTelephone supervisors and monitors March 5, 2003 7Help desk staff March 10-14, 2003 5CATI telephone interviewers March 25-27, 2003 8Tracing supervisors and tracing specialists April 7, 2003 8NOTE: CATI = computer-assisted telephone interviewing. SOURCE: U.S. Department of Education, National Center for Education Statistics, 2004 National Postsecondary Student Aid Study (NPSAS:04) Field Test.
The interviewer training program was designed to maximize the trainees’ active participation. Training manuals included a training guide, an interviewer’s manual, and a question-by-question specification manual. The 12-hour training session consisted of lectures, demonstrations, and hands-on practice exercises with the instrument and online coding modules. Trainees were introduced to the procedural aspects of data collection for NPSAS:04 and were given a thorough review of the instrument. Interviewers also trained in techniques for gaining cooperation with sample members, parents, and other contacts, as well as techniques for addressing the concerns of reluctant participants and avoiding refusals.
Common to each training session was a study overview, a review of the confidentiality requirements, a demonstration interview, an in-depth review of the instrument, hands-on practice exercises with the instrument, and open-ended coding modules. The help desk and CATI telephone training sessions were customized as follows:
• Help desk agents reviewed the “frequently asked questions” in detail, including responses to instrument-specific questions, as well as technical issues and instructions for documenting each call to the study hot line.
• Telephone interviewers were trained in techniques for gaining cooperation of sample members and other contacts, as well as techniques for addressing the concerns of reluctant participants and avoiding refusal.
See appendix E for a copy of the telephone interviewer training agenda and the table of contents from the training manual.
A separate training was held for staff working in tracing operations. Supervisors, tracers, and QC specialists received a 2-hour overview of the study. The session focused on the design of NPSAS:04, the characteristics of the sample population, and a discussion of the tracing techniques best suited for locating such a diverse and mobile population.

Chapter 2: Design and Methodology of the Field Test
NPSAS:04 Field Test Methodology Report 26
Student Website. The website for the NPSAS:04 field test served a dual purpose. The primary function was to provide access to the student instrument for the sampled students. The secondary function was to provide information, including background information about the study, the selected sample, the sponsor, the contractor, and confidentiality assurances. In addition to the information available on the site, links were provided to other relevant sites (e.g., NCES). The home page of the NPSAS:04 field test website is depicted in figure 4.
Figure 4. NPSAS:04 student website home page: 2003
NOTE: NPSAS:04 = 2004 National Postsecondary Student Aid Study. SOURCE: U.S. Department of Education, National Center for Education Statistics, 2004 National Postsecondary Student Aid Study (NPSAS:04) Field Test.
The initial login page provided the link to the web instrument. The login process involved entering a specific study ID and password, which were provided to the respondent in the lead letter. Respondents could also obtain their study ID and password by e-mailing the project, or by contacting a help desk agent at the NPSAS toll-free number.

Chapter 2: Design and Methodology of the Field Test
27 NPSAS:04 Field Test Methodology Report
The web instrument was protected by SSL encryption safeguard. Further security was provided by an automatic “time out” feature, which automatically logged out of the web instrument if the system was idle for 30 minutes or longer. The system did not use any persistent “cookies,” thus adhering to the U.S. Department of Education’s privacy policy.
Self-Administered Interviews. The web-interviewing option was introduced to sample members in the lead letter packet. During the first 3 weeks of data collection, only self-administered interviews via the Web were completed unless a student called in to the help desk for assistance and decided to complete the telephone interview. The web interview site remained open and available 24 hours per day, 7 days per week throughout the entire data collection period. This availability gave sample members the option to complete interviews online during the entire data collection period.
Help Desk Operations. The NPSAS:04 help desk opened on March 19, 2003 in anticipation of the first student calls after the introductory mailing. The help desk staff was available to assist sample members who had questions or problems accessing and completing the self-administered interview. A toll-free hotline was set up to accept incoming help desk calls. If technical difficulties prevented a sample member from completing a self-administered interview, a help desk staff member, who was also trained to conduct telephone interviews, would encourage him/her to complete a telephone interview rather than to attempt the self-administered interview.
The help desk application documented all incoming calls from sample members. In addition to this primary documentation function, it provided the following:
• information needed to verify a sample member’s identity;
• login information allowing a sample member to access the web interview;
• systematic documentation of each call; and
• means for tracking calls that could not be immediately resolved.
The help desk application also provided project staff with various reports on the type and frequency of problems experienced by sample members, as well as a way to monitor the resolution status of all help desk inquiries.
Telephone Interviewing. CATI follow-up locating and interviewing were conducted from April 13, 2003 through July 20, 2003. CATI procedures included attempts to locate, gain cooperation from, and interview sample members who had not completed the online interview. Interviewers encouraged respondents to complete the interview by telephone as soon as they made contact; however, they informed sample members that they could still complete the interview online if that was their preference.
An automated call scheduler assigned cases to interviewers based on time of day, day of week, existence of precise appointments, and type of case. Case assignment was designed to maximize the likelihood of contacting and interviewing sample members, and cases were assigned to various queues for this purpose. Some of the queues included new cases, Spanish-

Chapter 2: Design and Methodology of the Field Test
NPSAS:04 Field Test Methodology Report 28
language cases,11 initial refusals, and various appointment queues (appointments set by the sample member, appointments suggested by locator sources, and appointments for cases that were initial refusals).
For each case, a calling roster prioritized the names and telephone numbers for the interviewers to call. The roster included locating information provided by institutions and students and obtained through tracing activities. For example, this information might have included a student’s permanent or local address and telephone number, contacting information for the student’s parents, and the address and telephone number or both of other contacts listed for the student. New roster lines were added as the result of CATI tracing and intensive tracing efforts.
Once located, some sample members required special treatment. To gain cooperation from those who initially refused to participate (including locator sources who acted as “gatekeepers” to prevent access to the sample member), certain interviewers were trained in refusal-conversion techniques. Sample members and their locator sources who spoke only Spanish were assigned to bilingual interviewers.
2.2.9 NPSAS:04 Field Test Incentive Experiment and Data Quality Evaluations
As part of the field test study, an experiment was conducted to test three hypotheses regarding the efficacy of incentives for the NPSAS:04 full-scale study. Specifically, the resulting data from the sample of students was used to test the following hypotheses:
• Incentives increase the response rate during the initial phase of data collection and promote a higher rate of self-administered responses.
• Incentives increase the completion rate during the nonresponse follow-up phase of CATI data collection.
• A larger incentive increases the response rate more than a smaller one.
The first hypothesis addresses the need for increasing the number of web-based responses, since this method was expected to reduce costs while increasing data quality. Testing the second hypothesis was expected to verify the effectiveness of incentives for refusal conversion. The aim of testing the third hypothesis was to determine whether there was a differential benefit between incentive levels on response rates.
Sample members were randomly assigned to treatment groups (no incentive, $10, or $20) and were eligible for the early response incentive during the first 3 weeks of data collection,
11 Cases identified in initial calls as needing a Spanish interpreter were contacted by a project-certified, Spanish-speaking, bilingual interviewer. The interviewer assessed the sample member capability of completing the interview in English. If possible, the survey was conducted in English, with occasional Spanish translations provided for words or phrases the sample member had difficulty understanding. If the interview could not be conducted in English, the case was finalized as "Spanish language nonrespondent." If the sample member spoke a language other than English or Spanish and was not able to complete the interview in English, the case was coded as "other language nonrespondent."

Chapter 2: Design and Methodology of the Field Test
29 NPSAS:04 Field Test Methodology Report
which was a web-only period.12 For refusal conversion, all sample members who refused to complete the survey were randomly assigned to treatment groups (no incentive or $20). A detailed description of the incentive experiment and its results is provided in section 3.4.
2.3 Data Collection Systems
2.3.1 Instrument Design and Documentation System
The Instrument Design and Documentation System (IDADS) is a controlled web environment in which project staff developed, reviewed, modified, and communicated changes to specifications, code, and documentation for the NPSAS:04 instrument. All information relating to the NPSAS:04 instrument was stored in an SQL server database and was made accessible through Windows™ and web interfaces. IDADS contains three modules: specification, programming, and documentation.
Initial specifications were generated within the IDADS specification module. This module enabled access for searching, reviewing, commenting on, updating, exporting, and importing information associated with instrument development. All records were maintained individually for each item, which provided a historical account of all changes requested by both project staff and NCES.
Once specifications were finalized, the programming module within IDADS produced hypertext transfer markup language (html), Active Server Pages (ASPs), and JavaScript template program code for each screen based on the contents of the SQL Server database. This output included screen wording, response options, and code to write the responses to a database, as well as code to automatically handle such web-instrument functions as backing up and moving forward, recording timer data, and linking to context-specific help text. Programming staff edited the code that was automatically generated by this module to customize screen appearance and program response-based routing.
The documentation module contained the finalized version of all instrument items, the screen wording for each, and variable and value labels. Also included in this module were the more technical descriptions of items such as variable types (alpha or numeric), information regarding those to whom the item was administered, and frequency distributions for response categories. The documentation module was used to generate the instrument facsimiles and the deliverable electronic codebook (ECB) input files.
2.3.2 Integrated Management System
All aspects of the field test were under the control of an Integrated Management System (IMS). The IMS is a comprehensive set of desktop tools designed to give project staff and NCES easy access to a centralized repository for project data and documents. The NPSAS:04 IMS is comprised of several modules: the management module, the Receipt Control System (RCS), and the web-CATI Case Management System (CMS).
12 If a sample member called into the help desk and completed the interview over the telephone during the early response incentive period, they were given the incentive.

Chapter 2: Design and Methodology of the Field Test
NPSAS:04 Field Test Methodology Report 30
The management module of the IMS contains tools and strategies to assist project staff and the NCES project officer in managing the study. All information pertinent to the study is located there, accessible via the Web, in a secure desktop environment. Available on the IMS are the current project schedule, monthly progress reports, daily data collection reports and status reports (available through the RCS described below), project plans and specifications, key project information and deliverables, instrument specifications, staff contacts, the project bibliography, and a document archive. The IMS also has a download area from which the client and subcontractors can retrieve files when necessary.
The RCS is an integrated set of systems that monitors all activities related to data collection, including tracing and locating. Through the RCS, project staff are able to perform stage-specific activities, track case statuses, identify problems early, and implement solutions effectively. RCS locator data were used for a number of daily tasks related to sample maintenance. Specifically, the mail out program produces mailings to sample members, the query system enables administrators to review the locator information and status for a particular case, and the mail return system enables project staff to update the locator database. The RCS also interacts with the Case Management System and Tracing Operations (TOPS) databases, sending locator data between the three systems as necessary.
The CMS is the technological infrastructure that connects the various components of the CATI system, including the questionnaire, utility screens, databases, call scheduler, report modules, links to outside systems, and other system components. It utilizes a call scheduler to assign cases to interviewers in a predefined priority order. In addition to delivering appointments to interviewers at the appropriate time, the call scheduler also calculates the priority scores (the order in which cases need to be called based on preprogrammed rules), sorts cases in nonappointment queues, and computes time zone adjustments to ensure that cases are not delivered outside the specified calling hours. The call scheduler also permits callbacks to be set, and assigns status codes to the case. In addition, each case contains one or more roster lines that detail specific contact information for a case (e.g., home phone number, work phone number, etc.). The call scheduler uses a call algorithm based on the previous call results to determine which roster line should be called next.

31 NPSAS:04 Field Test Methodology Report
Chapter 3 Institutional and Student Data Collection
Outcomes The National Center for Education Statistics (NCES) has established strict standards
regarding the participation rates from sample members in order to maintain data integrity and generalizability. To obtain the rates required, successful data collection at all stages is crucial. This chapter provides a summary of institutional and student response rates, the results of locating activities for sample members, refusal conversion efforts, the burden involved in data collection, and the results of an experimental evaluation of the impact of incentives on student response rates introduced in section 2.2.9.
3.1 Response Rates
3.1.1 Institutional Participation
Of the 195 eligible institutions, 99 percent (193) of the Chief Administrators agreed to participate; all of these appointed an Institutional Coordinator (IC) to assist with study requirements.13 The first request of the ICs was to provide a student enrollment list to be used in selecting the student sample. Eight of the ICs explicitly refused to provide an enrollment list, and 12 of the ICs did not provide the lists in the time frame allocated for the activity. The remaining 173 (88.7 percent) eligible institutions provided lists. As previously shown in table 2, list provision varied by type of institution considered; however, all nine institutional strata had participation rates of at least 84 percent. The percentage of institutions providing or agreeing to provide enrollment lists across strata ranged from about 84 percent to 100 percent. The lowest participation rates were among the public 2-year and private not-for-profit institutions (table 6).
The lists requested (see section 2.2.3) were to indicate all students enrolled at any time between July 1, 2002 and April 30, 2003. The preferred type of list was a single, unduplicated (i.e., with duplicate entries over terms of enrollment removed) electronic enrollment list, because such lists required no preprocessing prior to electronic sampling. However, any set of electronic lists was preferable to hardcopy lists, because they could easily be unduplicated using the institutional student ID number. The types of lists provided by participating institutions are shown in table 6. Of the 173 institutions sending lists, 78 did so by e-mail, 82 were uploaded to the 2004 National Postsecondary Student Aid Survey (NPSAS:04) website, 4 were by diskette, 5 were a single, unduplicated paper list, and 4 were multiple paper lists that required unduplication by the contractor.
13 At some of the smaller institutions, the Chief Administrator also served as IC.

Chapter 3: Institutional and Student D
ata Collection O
utcomes
NPSA
S:04 Field Test Methodology R
eport 32
Table 6. Number of student enrollment lists provided, by transmittal mode and institutional sampling stratum: 2003 Institutions providing list
Electronic Paper Total E-mail Upload Diskette Single list Multiple list
Institutional sampling stratum Number Percent Number Percent Number Percent Number Percent Number Percent Number Percent All institutions 173 100.0 78 100.0 82 100.0 4 100.0 5 100.0 4 100.0Public
Less-than-2-year 2 1.2 1 1.3 1 1.2 0 0.0 0 0.0 0 0.02-year 59 34.1 29 37.2 26 31.7 3 75.0 1 20.0 0 0.04-year non-doctorate-granting 21 12.1 12 15.4 9 11.0 0 0.0 0 0.0 0 0.04-year doctorate-granting 11 6.4 6 7.7 5 6.1 0 0.0 0 0.0 0 0.0
Private, not-for-profit Less-than-4-year 5 2.9 3 3.8 1 1.2 0 0.0 0 0.0 1 25.04-year non-doctorate-granting 38 22.0 14 17.9 20 24.4 1 25.0 2 40.0 1 25.04-year doctorate-granting 13 7.5 6 7.7 7 8.5 0 0.0 0 0.0 0 0.0
Private, for-profit Less-than-2-year 14 8.1 3 3.8 7 8.5 0 0.0 2 40.0 2 50.02-year-or-more 10 5.8 4 5.1 6 7.3 0 0.0 0 0.0 0 0.0
NOTE: Detail may not sum to totals because of rounding. Number of eligible institutions and institutional response rates by stratum are provided in table 2. SOURCE: U.S. Department of Education, National Center for Education Statistics, 2004 National Postsecondary Student Aid Study (NPSAS:04) Field Test.

Chapter 3: Institutional and Student Data Collection Outcomes
33 NPSAS:04 Field Test Methodology Report
Some key factors in study design may have impacted institutional participation rates in the field test. First, because some institutions were sampled with certainty for the full-scale study, the field test sample excluded most “research” (public and private doctoral-granting) institutions. In past full-scale collections, these institutions had been among the most cooperative strata. Thus, the field test sample contained a higher proportion of less cooperative institutions than will occur in the full-scale study.
The NPSAS:04 field test represents the first time the institutional phases of two large-scale higher education studies (NPSAS and the National Study of Postsecondary Faculty [NSOPF]) were fielded simultaneously. Therefore, the sample size for the NPSAS:04 field test (200 institutions) was nearly three times that of sample sizes fielded for previous field tests. Most importantly, it included 150 institutions sampled for both component studies.
Table 7 provides the participation rates for the current field test, as well as those achieved in field tests in the last two cycles of NPSAS. There is no clear indication based on these participation rates that fielding NSOPF and NPSAS together as the National Study of Faculty and Students (NSoFaS) had a measurable impact on the overall response rate for NPSAS. The response rate for the current field test was 89 percent, 84 percent for the NPSAS:2000 field test, and 90 percent for the NPSAS:96 field test (x2=1.856, p > 0.05). Table 7. Field test institutional participation response rates, by NPSAS cycle 1996–present: 2003 NPSAS cycle Institutional sample1 Number providing list Participation rate2
1996 field test 73 66 90.4 2000 field test 73 61 83.6 2004 field test 195 173 88.7 1 Eligible institutions. 2 Unweighted percentage. SOURCE: U.S. Department of Education, National Center for Education Statistics, 2004 National Postsecondary Student Aid Study (NPSAS:04) Field Test; National Postsecondary Student Aid Study: 1996 Field Test Methodology Report, Working Paper No. 96–17; and National Postsecondary Student Aid Study:2000 Field Test Methodology Report, Working Paper No. 2000–17.
Table 8 summarizes the participation rates based on NPSAS-only or NPSAS/NSOPF sampling status. As noted above, 150 institutions sampled for NPSAS:04 were also sampled for NSOPF, while 50 institutions were sampled solely for the NPSAS:04 field test. Both types of institutions had high participation rates. Institutions sampled for both studies had a participation rate of 87 percent, while those sampled only for NPSAS:04 had a participation rate of 93 percent. Table 8. Participation rates for NPSAS/NSOPF and NPSAS-only institutions: 2003
NSoFaS Sample Number sampled
for NPSASNumber eligible for
NPSASProvided
NPSAS list Participation
rate1
NPSAS/NSOPF 150 150 131 87.3 NPSAS-only 50 45 42 93.3 1 Unweighted percentage. NOTE: NPSAS = National Postsecondary Student Aid Study; NSOPF = National Study of Postsecondary Faculty; NSoFaS = National Study of Faculty and Students. SOURCE: U.S. Department of Education, National Center for Education Statistics, 2004 National Postsecondary Student Aid Study (NPSAS:04) Field Test; National Postsecondary Student Aid Study: 1996 Field Test Methodology Report, Working Paper No. 96–17; and National Postsecondary Student Aid Study:2000 Field Test Methodology Report, Working Paper No. 2000–17.

Chapter 3: Institutional and Student Data Collection Outcomes
NPSAS:04 Field Test Methodology Report 34
Based on these findings, it does not appear that fielding both studies simultaneously had a negative impact on the institutional participation rates for the NPSAS:04 field test (z = 1.11, p > 0.05). List provision was high overall for the NPSAS:04 field test, for both NPSAS/NSOPF institutions and NPSAS-only institutions.
3.1.2 Central Processing System/National Student Loan Data System Matching
Central Processing System (CPS) Matching. Table 9 summarizes the results of matching and downloading student data from the U.S. Department of Education’s CPS. The CPS contains data provided to the Department by students and their families when they complete the Free Application for Federal Student Aid (FAFSA). The matching process required the use of the Federal Data Request component of the Department’s EDConnect software. This component allowed RTI staff to connect to the CPS mainframe computer and to upload/download files on a regular basis. A successful match required that the student have a valid application record within the CPS database. Table 9. Results of CPS matching, by institutional characteristic and student type: 2003
Sent to CPS1 Matched to CPS
Institutional characteristic and student type Sampled students Number2 Percent
Number Percent3 All students 1,300 1,300 98.3 770 60.8 Institutional level
Less-than-2-year 90 90 100.0 70 74.5 2-year 480 480 100.0 250 52.3 4-year non-doctorate-granting 430 410 95.3 290 70.4 4-year doctorate-granting 280 280 99.3 160 56.7
Institutional control Public 800 800 99.8 430 54.1 Private, not-for-profit 370 350 94.6 250 70.0 Private, for-profit 110 110 100.0 90 80.4
Institutional sector Public
Less-than-2-year 40 40 100.0 20 68.6 2-year 380 380 100.0 180 47.3 4-year non-doctorate-granting 190 190 99.5 120 65.1 4-year doctorate-granting 200 200 99.5 110 54.4
Private, not-for-profit 2-year-or-less 60 60 100.0 40 67.8 4-year non-doctorate-granting 230 210 91.6 150 73.9 4-year doctorate-granting 90 90 98.9 50 62.1
Private, for-profit Less-than-2-year 60 60 100.0 50 78.0 2-year-or-more 50 50 100.0 40 83.3
Student type Potential FTB student 560 550 99.5 370 66.4 Other undergraduate 580 580 99.1 360 61.9 Graduate/first-professional 140 130 90.3 40 31.5
1 If an institution did not provide student names and/or Social Security numbers, cases were not sent to CPS for matching. 2 Number of cases sent to CPS for matching, including 70 cases resubmitted with new information from CADE. 3 Based on those sent to CPS for matching. NOTE: Detail may not sum to totals because of rounding. CPS = Central Processing System; FTB = full-time beginning; CADE = computer-assisted data entry. SOURCE: U.S. Department of Education, National Center for Education Statistics, 2004 National Postsecondary Student Aid Study (NPSAS:04) Field Test.

Chapter 3: Institutional and Student Data Collection Outcomes
35 NPSAS:04 Field Test Methodology Report
The CPS matching process occurred after the student sample had been selected for an institution, but before computer-assisted data entry (CADE) and student interview data collection activities began. Matching was completed using the CPS data for the 2002–03 financial aid year. Not all of the students in the sample were submitted to the CPS for matching. This noninclusion was primarily because some institutions were unwilling or unable to provide required information. Following CADE, a small number of student cases that had not previously matched successfully to CPS were resubmitted, based either on newly obtained student information or evidence in the institutional records that the student had applied for federal student aid for the 2002–03 year. Of the 70 cases that were resubmitted with new information after CADE, 55 percent returned a match.
Approximately 32 percent of graduate/first-professional students matched to the CPS, while between 62 percent and 66 percent of undergraduate students and full-time beginning (FTB) students did so. Nearly all institutions require undergraduate aid applicants to file a FAFSA in order to determine their eligibility for federal Pell Grants, federal campus-based aid, and federal loans as part of the undergraduate aid packaging process. Graduate/first-professional students are not usually required to file a FAFSA unless they are specifically applying for federal loans, the only type of federal aid generally available to graduate students. Graduate students often apply directly through their institution or department for fellowships and assistantships, which are usually not need-based and do not require the completion of the federal financial aid forms on which CPS matching is based.
National Student Loan Data System (NSLDS) Matching. Results for the attempt to match to the NSLDS are provided in table 10. Because NSLDS files are historical, information about receipt of such loans was available not only for the NPSAS field test year, but also for prior years of postsecondary education (where applicable). Therefore, table 10 shows historical match rates for sample members, which does not necessarily mean that the match was for the current NPSAS year. In total, 660 sampled students (52.1 percent of those submitted) were matched.
For NSLDS matches and within the student classifications considered, the relative numbers of matches followed a pattern somewhat similar to that seen for CPS matching. The table shows high match rates for those in private for-profit institutions but low match rates for those in public institutions. Low rates were also observed for students attending institutions offering programs of 2 years or less.
Results of attempted matches to the NSLDS Pell Grant data are also shown in table 10. As with NSLDS loan files, the Pell files are historical. Matches were obtained for 480 field test sample students (38 percent of those submitted). This is not statistically different from the NPSAS:2000 full-scale result of 35 percent who matched over all years (z = 1.36, p > 0.05).

NPSA
S:04 Field Test Methodology R
eport 36
Chapter 3: Institutional and Student D
ata Collection O
utcomes
Table 10. Results of NSLDS matching, by institutional characteristic and student type: 2003 Sent to NSLDS Matched to NSLDS loan1 Matched to NSLDS Pell1
Institutional characteristic and student type Sampled students Number Percent
Number Percent2
Number Percent2
All students 1,300 1,300 98.6 660 52.1 480 38.0 Institutional level
Less-than-2-year 90 90 100.0 50 50.0 60 59.6 2-year 480 480 100.0 180 36.6 200 41.0 4-year non-doctorate-granting 430 420 98.1 270 63.8 140 32.6 4-year doctorate-granting 280 270 96.5 170 62.0 90 33.6
Institutional control Public 800 800 99.4 350 44.2 300 37.9 Private, not-for-profit 370 360 96.5 230 62.5 110 30.6 Private, for-profit 110 110 100.0 80 75.7 70 63.6
Institutional sector Public
Less-than-2-year 40 40 100.0 10 40.0 20 45.7 2-year 380 380 100.0 110 27.4 140 37.1 4-year non-doctorate-granting 190 180 97.9 110 61.2 60 35.0 4-year doctorate-granting 200 200 99.5 120 62.1 80 41.0
Private, not-for-profit 2-year or less 60 60 100.0 30 57.6 30 54.2 4-year non-doctorate-granting 230 220 98.2 140 64.0 70 29.7 4-year doctorate-granting 90 80 89.8 50 62.0 10 15.2
Private, for-profit Less-than-2-year 60 60 100.0 30 55.9 40 67.8 2-year-or-more 50 50 100.0 50 100.0 30 58.3
Student type Potential FTB student 560 550 99.1 240 42.9 200 36.2 Other undergraduate 580 570 98.4 340 59.5 250 43.8 Graduate/first-professional 140 140 97.2 80 57.9 30 21.4
1 Matching was completed on historical files. Matching was only conducted for cases with correct Social Security numbers. 2 Based on those sent to NSLDS for matching. NOTE: Detail may not sum to totals because of rounding. NSLDS = National Student Loan Data System; FTB = full-time beginning. SOURCE: U.S. Department of Education, National Center for Education Statistics, 2004 National Postsecondary Student Aid Study (NPSAS:04) Field Test.

Chapter 3: Institutional and Student Data Collection Outcomes
37 NPSAS:04 Field Test Methodology Report
3.1.3 Student Locating and Response Rate Summary
Overall locating and interviewing outcomes are shown in figure 5. Of the 1,300 students with records initially loaded into the Case Management System (CMS) for self-administered and/or computer-assisted telephone interviewing (CATI), 990 were located, 170 were not located, and 120 were located but determined to be ineligible for the study. Of the located sample members, 820 completed either a full interview (n = 800) or completed enough of the questionnaire to be considered a partial interview (n = 20). Students who completed the enrollment section of the questionnaire but did not complete the entire survey were considered partial interviews.
Figure 5. Field test locating and interviewing outcomes: 2003
Samplen=1,300
Locatedn=990
Not locatedn=170
Ineligiblen=120
Respondentn=820
Nonrespondentn=170
Full interview - 800Partial interview - 20
Time ran out - 50Refusal - 120
With intensive tracing - 120Without intensive tracing - 40
SOURCE: U.S. Department of Education, National Center for Education Statistics, 2004 National Postsecondary Student Aid Study (NPSAS:04) Field Test.
The unweighted response rate for the student data collection was 71.1 percent (820 full or partial interviews/1,200 confirmed or potentially eligible sample members). Unweighted response rates by type of institution and type of student are shown in table 11. Comparing the different types of institutions, student response rates were highest among those sampled from private, not-for-profit, 4-year, doctorate-granting institutions (80.5 percent). Response rates were lowest among students from private, for-profit, less-than-2-year institutions (55.8 percent) (x2 = 29.7, p < 0.001). In terms of student type, response rates were highest among graduate

Chapter 3: Institutional and Student Data Collection Outcomes
NPSAS:04 Field Test Methodology Report 38
students (77.9 percent), followed by non-FTB undergraduates (76.0 percent), and finally by potential FTB undergraduates (63.8 percent) (x2 = 22.0, p < 0.001). Table 11. Field test student interview results, by institutional characteristic and student type: 2003
Interviewed Institutional characteristic and student type Total
Number Percent
Total 1,200 820 71.1Institutional level
Less-than-2-year 70 50 63.02-year 410 260 63.54-year non-doctorate-granting 410 320 77.44-year doctorate-granting 270 210 75.2
Institutional control Public 710 490 69.1Private, not-for-profit 360 280 76.7Private, for-profit 90 60 64.0
Institutional sector Public
Less-than-2-year 30 20 73.32-year 320 200 62.14-year non-doctorate-granting 180 140 77.14-year doctorate-granting 190 140 72.7
Private, not-for-profit 2-year-or-less 60 40 66.74-year non-doctorate-granting 220 170 77.84-year doctorate-granting 90 70 80.5
Private, for-profit Less-than-2-year 40 20 55.8Private, for-profit 2-year-or-more 40 30 72.1
Student type Potential FTB student 490 310 63.8Other undergraduate 540 410 76.0Graduate 140 110 77.9
NOTE: Detail may not sum to totals because of rounding. Excludes 120 cases determined to be ineligible for the study. FTB = full-time beginning. SOURCE: U.S. Department of Education, National Center for Education Statistics, 2004 National Postsecondary Student Aid Study (NPSAS:04) Field Test.
Students responding to NPSAS:04 also varied significantly in terms of the mode by which they completed the survey (see table 12). Students from public 4-year doctorate-granting institutions were most likely to have completed the survey via the Web without the need for telephone prompting. About one-third (32.4 percent) of these students chose this mode (x2 = 63.3, p < 0.001). By contrast, none of the students from the private for-profit institutions completed the interview over the Web with no telephone prompting. Instead, these students (along with those from public less-than-2-year institutions) were more likely to have completed the interview by CATI. A higher percentage of graduate students (31.1 percent) completed the questionnaire over the Web without telephone prompting, compared to other undergraduates (19.6 percent), and FTB undergraduates (16.8 percent), who were more likely to complete the survey via CATI (x2 = 11.8, p < 0.05).

39
NPSA
S:04 Field Test Methodology R
eport
Chapter 3: Institutional and Student D
ata Collection O
utcomes
Table 12. Field test response rates and mode of completion, by institutional characteristic and student type: 2003 Mode of completion
Total complete Web, no prompt Web, with prompt CATI
Institutional characteristic and student type Number eligible Number
Percent of eligible
Number
Percent of total
Number
Percent of total Number
Percent of total
Total 1,200 820 71.1 170 20.0 120 14.3 540 65.7Institutional level
Less-than-2-year 70 50 63.0 # 6.5 # 2.2 40 91.32-year 410 260 63.5 40 15.2 30 11.7 190 73.24-year non-doctorate-granting 410 320 77.4 60 20.0 60 18.4 190 61.64-year doctorate-granting 270 210 75.2 60 29.1 30 14.1 120 56.8
Institutional control Public 710 490 69.1 100 19.5 70 13.6 330 66.9Private, not-for-profit 360 280 76.7 70 25.0 40 15.9 160 59.1Private, for-profit 90 60 64.0 0 0.0 10 12.7 50 87.3
Institutional sector Public
Less-than-2-year 30 20 73.3 0 13.6 0 0.0 20 86.42-year 320 200 62.2 30 17.3 20 9.6 140 73.14-year non-doctorate-granting 180 140 77.1 20 10.9 30 21.7 90 67.44-year doctorate-granting 190 140 72.7 40 32.4 20 13.2 70 54.4
Private, not-for-profit 2-year-or-less 60 40 66.7 10 13.2 10 21.0 30 65.84-year non-doctorate-granting 220 170 77.8 50 28.6 30 14.9 100 56.54-year doctorate-granting 90 70 80.5 20 22.9 10 15.7 40 61.4
Private, for-profit Less-than-2-year 40 20 55.8 0 0.0 # 4.2 20 95.82-year-or-more 40 30 72.1 0 0.0 10 19.4 30 80.6
Student type Potential FTB students 490 310 63.8 50 16.8 40 13.2 220 70.0Other undergraduate 540 410 76.0 80 19.6 60 15.0 270 65.4Graduate 140 110 77.9 30 31.1 20 15.1 60 53.8
# Rounds to zero. NOTE: Detail may not sum to totals because of rounding. All percentages are unweighted. Reporting excludes 120 cases determined to be ineligible for the study. CATI = computer-assisted telephone interviewing; FTB = full-time beginning. SOURCE: U.S. Department of Education, National Center for Education Statistics, 2004 National Postsecondary Student Aid Study (NPSAS:04) Field Test.

Chapter 3: Institutional and Student Data Collection Outcomes
NPSAS:04 Field Test Methodology Report 40
Student data collection spanned 18 weeks from March 16 through July 20, 2003. The cumulative response rate—overall and by mode—is provided in figure 6. A mail prompt encouraged sample members to complete the self-administered survey via the Web before follow-up with telephone interviewing was attempted. It is not surprising to see that the majority of the web completions were obtained early in the data collection period, while CATI completions began somewhat later and continued at a relatively steady pace across the time frame.
Figure 6. Field test cumulative response rates, by mode of interview: 2003
0%
10%
20%
30%
40%
50%
60%
70%
80%
1 2 3 4 5 6 7 8 9 10 11 12 13 14 15 16 17 18
Time (in weeks)
Response rate
Web CATI Total
NOTE: CATI = computer-assisted telephone interviewing. SOURCE: U.S. Department of Education, National Center for Education Statistics, 2004 National Postsecondary Student Aid Study (NPSAS:04) Field Test.
A total of 870 respondents began the NPSAS:04 student interview. As noted earlier in this section, 820 of these completed either a full or partial interview. Thirty sample members, deemed “breakoffs,” accessed the student interview but did not meet the requirement for a partial respondent (completion of the enrollment section). Of these 30 breakoffs, 87 percent were last contacted via CATI, and 13 percent only accessed the Web. Eight percent of the 30 contacted in CATI had accessed the interview via the Web at some point during data collection. The remaining 20 cases marked as beginning the student interview were incorrect, designated as such due to an error in the case management system.
3.1.4 Student Record Abstraction The NPSAS IC was given an option as to how information about sampled students would
be abstracted from institutional records. The first option was for the institution’s staff to use the CADE application, while the second option was to have trained field data collectors visit the institution and abstract the data. The first option, self-CADE, was the recommended option, since it was the least expensive.
Table 13 shows the CADE participation rates by institutional characteristics. Most ICs (87 percent) chose the self-CADE option. Because students were sampled from the lists received

Chapter 3: Institutional and Student Data Collection Outcomes
41 NPSAS:04 Field Test Methodology Report
early in the data collection period, all of the field-CADE institutions were identified earlier than will be expected in the full-scale study. Given the small sample sizes extracted from each institution in the field test, it was anticipated that very few institutions would choose the field-CADE option; therefore in order to test the procedures for the NPSAS:04 full-scale study, eight institutions were selected for field data collection. An additional two institutions also chose to use a field data collector at the end of data collection. The high proportion of institutions using self-CADE (87 percent) indicates that neither confidentiality concerns nor inadequate access to the Web were major hindrances for the field test. However, it should be noted that sample sizes were small (a range of 5 students to a maximum of 50 students) in the field test and this could also have been a contributing factor. Table 13. CADE abstraction methods, by institutional characteristic and highest offering: 2003
Abstraction Method Self-CADE Field-CADE
Institutional characteristic Sample size Number Percent Number Percent Total 80 70 87.0 10 13.9Institutional level
Less-than-2-year 10 10 87.5 # 12.52-year 30 20 71.9 10 28.14-year non-doctorate-granting 30 30 100.0 0 0.04-year doctorate-granting 10 10 100.0 0 0.0
Institutional control Public 40 30 81.0 10 19.0Private, not-for-profit 30 20 96.0 # 4.0Private, for-profit 10 10 90.0 # 10.0
# Rounds to zero. NOTE: Detail may not sum to totals because of rounding. CADE = computer-assisted data entry. SOURCE: U.S. Department of Education, National Center for Education Statistics, 2004 National Postsecondary Student Aid Study (NPSAS:04) Field Test.
For a student to be considered a CADE respondent in the NPSAS:04 field test, the student record abstracted from the institution was required to indicate whether the student received any financial aid, information regarding the student’s enrollment status during the NPSAS year, and valid responses to a portion of the demographic items in the CADE student characteristics section. This definition did not change from NPSAS:2000 and was roughly equivalent to, though slightly more stringent than, the definition used in either NPSAS:93 or NPSAS:96.
Using this definition, about 98 percent of the eligible sample students were classified as CADE respondents, as shown in table 14. This result also shows that about 97 percent of the students whose CADE records were abstracted by the institution (self-abstraction) were determined to be eligible in the field test. By contrast, approximately 66 percent of the field-CADE students were determined to be eligible. A large number of the ineligible field-CADE students were concentrated at one institution; the 2-year, public institution had included a number of students on the enrollment list who were not enrolled in a program for credit but were in a remedial/training program. This fact explains a large part of the discrepancy between self and field results, which was also magnified due to the field-CADE option having far fewer students. This observation also explains why the number of students found to be eligible was only 86 percent for that institutional level.

NPSA
S:04 Field Test Methodology R
eport 42
Chapter 3: Institutional and Student D
ata Collection O
utcomes
Table 14. CADE abstraction results, by institutional and student characteristics: 2003 Institutions providing CADE Eligible students1 CADE respondents Institutional/student characteristics and abstraction
method Number Percent Total students Number Percent Number Percent 2 Total 80 100.0 1,300 1,200 92.9 1,200 98.1 Institutional level
Less-than-2-year 10 10.7 90 90 90.4 90 100.0 2-year 30 41.3 470 410 86.2 400 98.0 4-year non-doctorate-granting 30 36.0 410 400 97.6 400 100.0 4-year doctorate-granting 10 12.0 280 280 97.9 260 95.0
Institutional control Public 40 56.0 800 720 89.9 700 96.9 Private, not-for-profit 20 30.7 360 350 98.9 350 100.0 Private, for-profit 10 13.3 110 100 95.3 100 100.0
Institutional sector Public
Less-than-2-year # 2.7 40 30 82.9 30 100.0 2-year 30 34.7 380 320 83.6 310 97.5 4-year non-doctorate-granting 10 12.0 190 180 96.8 180 100.0 4-year doctorate-granting 10 6.7 200 190 96.9 180 92.6
Private, not-for-profit 2-year-or-less # 2.7 50 50 100.0 50 100.0 4-year non-doctorate-granting 20 22.7 210 210 98.1 210 100.0 4-year doctorate-granting # 5.3 90 90 100.0 90 100.0
Private, for-profit Less-than-2-year 10 8.0 60 60 94.9 60 100.0 2-year-or-more # 5.3 50 50 95.8 50 100.0
Abstraction method Self 70 86.7 1,100 1,100 97.1 1,000 97.9 Field 10 13.3 170 110 66.1 110 100.0
Student type † Potential FTB student † † 560 500 89.2 490 98.8 Other undergraduate † † 560 540 95.4 530 98.5 Graduate/first-professional † † 140 140 97.2 130 94.3
# Rounds to zero. † Not applicable. 1 Students determined to be eligible in CADE. Some of these students may have subsequently been determined ineligible during the student interview. For purposes of this analysis, eligibility is based solely on CADE. 2 Percentage of eligible students who met the criteria for qualification as a CADE respondent, which required an indication of financial aid receipt, enrollment status, and valid responses to a subset of demographic items in the CADE instrument. NOTE: Detail may not sum to totals because of rounding. CADE = computer-assisted data entry; FTB = full-time beginning. SOURCE: U.S. Department of Education, National Center for Education Statistics, 2004 National Postsecondary Student Aid Study (NPSAS:04) Field Test.

Chapter 3: Institutional and Student Data Collection Outcomes
43 NPSAS:04 Field Test Methodology Report
During the field test, the experience was that many of the public 2-year institutions included workforce development “students” (enrolled in resume writing, job interviewing techniques, etc.), who were not enrolled for credit or who were enrolled in a program that meets the “other” eligibility criteria. Institutional respondents may have been confused about whom to include on the enrollment list. This outcome became apparent during CADE. It also contributed to the high number of ineligible students in field-CADE, since the field sample overly represented public 2-year institutions. Because of these results, the “eligibility criteria” will be worded more clearly in all of the full-scale materials. In addition, the full-scale CADE will include a verify/confirm screen to prompt the institution to “classify” the reason for student ineligibility. This approach should improve the quality of eligibility status for both field-CADE and self-CADE.
3.1.5 NPSAS:04 Field Test Study Respondents
In an effort to ensure that respondent records released to the public on analysis files have as complete data as possible, the NPSAS:04 field test introduces the concept of a “study respondent.” A NPSAS:04 study respondent is a case containing both a completed CADE record and a completed student interview. Using study respondents as the analytic level of analysis will provide researchers more complete data for each case, simplifying the use of the single study weight provided to users of the data. In previous rounds of NPSAS, data for CADE and the student interview were treated as separate data collections, each with differing levels of nonresponse across the same set of students. This approach required researchers to use separate weights depending on the items being analyzed. Releasing data only for cases with both CADE and student interview data will alleviate this somewhat cumbersome approach to analysis of the data. However, the approach is not without its drawbacks.
For instance, requiring study respondents to have both a complete CADE record and student interview (full or partial) leads to a reduction in study response rates. Table 15 provides an overview of CADE response rates, student interview response rates, and study respondent rates. Note that the CADE response rates reported in this table differ from those reported in table 14. This difference is because table 15 excludes all cases determined to be ineligible during the course of administering the student interview. It also excludes nonrespondents to the student interview, who were declared CADE ineligible by their institutions.
The unweighted response rate for NPSAS:04 study respondents was 66.4 percent, while the CADE response rate was 93.4 percent; the student interview response rate was 71.1 percent for this same set of cases. More study respondents were obtained from private, not-for-profit institutions (72.8 percent), than for public institutions (63.7 percent), and private for-profit (62.8 percent) institutions (x2 = 9.44, p<0.01). The study respondent rate was highest among those from 4-year non-doctorate-granting institutions (74.4 percent) and lowest among 2-year institutions (55.6 percent) (x2 = 36.8, p < 0.001). Finally, potential FTB students (60.5 percent) were significantly less likely to be study respondents than were other types of undergraduates (70.4 percent) or graduate students (72.1 percent).
Defining a study respondent as one with both CADE and student interview data also leads to a reduction in the amount of data released when compared to data collected. Among the 1,100 eligible CADE respondents, 770 (71.2 percent) are study respondents, meaning that data

Chapter 3: Institutional and Student Data Collection Outcomes
NPSAS:04 Field Test Methodology Report 44
from 28.8 percent of the CADE respondents will not be included in the study respondent file. There is also a loss of student interview data, but the loss is less severe. Of the 820 student interview respondents, 770 (93.4 percent) are study respondents, with 6.6 percent of the student interview respondents not qualifying as study respondents. Table 15. Field test response rate comparisons for CADE, student interview, and study
respondents, by institutional characteristic and student type: 2003 Response rates
CADE1 Student interview2 Study respondents3
Institutional characteristic and student type Total
eligible Number Percent Number Percent Number Percent Total 1,200 1,100 93.4 820 71.1 770 66.4Institutional level
Less-than-2-year 70 70 95.9 50 63.0 50 63.02-year 410 360 89.4 260 63.5 230 55.64-year non-doctorate-granting 410 390 96.3 320 77.4 300 74.44-year doctorate-granting 270 260 94.2 210 75.2 200 71.5
Institutional control Public 710 660 92.0 490 69.1 450 63.7Private, not-for-profit 360 340 94.7 280 76.7 260 72.8Private, for-profit 90 90 98.8 60 64.0 50 62.8
Institutional sector Public
Less-than-2-year 30 30 90.0 20 73.3 20 73.32-year 320 280 88.6 200 62.2 170 53.64-year non-doctorate-granting 180 180 98.9 140 77.1 140 76.04-year doctorate-granting 190 170 91.4 140 72.7 130 67.4
Private, not-for-profit 2-year-or-less 60 50 89.5 40 66.7 30 59.64-year non-doctorate-granting 220 200 94.0 170 77.8 160 73.14-year doctorate-granting 90 90 100.0 70 80.5 70 80.5
Private, for-profit Less-than-2-year 40 40 100.0 20 55.8 20 55.82-year-or-more 40 40 97.7 30 72.1 30 69.8
Student type Potential FTB student 490 460 93.8 310 63.8 290 60.5Other undergraduate 540 500 93.3 410 76.0 380 70.4Graduate 140 130 91.9 110 77.9 100 72.1
1 The criteria for qualification as a CADE respondent required an indication of financial aid receipt, enrollment status, and valid responses to a subset of demographic items in the CADE instrument. 2 Includes both full and partial completed interviews. 3 “Study respondents” are those with both CADE and student interview information. NOTE: Detail may not sum to totals because of rounding. All percentages are unweighted. Excludes 120 cases determined to be ineligible for the study either in CADE or during the student interview. CADE = computer-assisted data entry; FTB = full-time beginning. SOURCE: U.S. Department of Education, National Center for Education Statistics, 2004 National Postsecondary Student Aid Study (NPSAS:04) Field Test.
3.2 Locating
3.2.1 Student Locating Overview
Students are prone to move frequently throughout their time in college, particularly at the end of an academic year. Many do not update their records in a timely manner with new locating information. When dealing with a mobile group such as the NPSAS:04 student sample, locating

Chapter 3: Institutional and Student Data Collection Outcomes
45 NPSAS:04 Field Test Methodology Report
them can be one of the more difficult tasks. A variety of approaches were used during the NPSAS:04 field test to locate and interview the sampled students. These approaches included the use of an initial mailing to all students, follow-up letters and e-mails to nonrespondents, telephone tracing (calling local and permanent numbers as well as any other numbers obtained during the course of contacting), and intensive tracing (i.e., using consumer databases, web searches, and criss-cross directories).
As shown on table 16, of the 1,200 confirmed or potentially eligible sample members, 85.7 percent were successfully located. The highest location rates were for students attending private, not-for-profit, 4-year doctorate-granting institutions (95.4 percent), while the lowest location rates were among those from private, for-profit, less-than-2-year institutions (67.4 percent) (x2 = 49.1, p < 0.001). Graduate students proved the easiest group to find, with 94.1 percent of these students being located, compared to 88.1 percent of other undergraduates, and 80.7 percent of FTB undergraduates (x2 = 20.4, p < 0.001). Table 16. Field test student locating, by institutional characteristic and student type: 2003
Located Institutional characteristic and student type Total Number Percent
Total 1,200 990 85.7Institutional level
Less-than-2-year 70 50 74.02-year 410 320 78.34-year non-doctorate-granting 410 370 90.74-year doctorate-granting 270 250 92.3
Institutional control Public 710 600 84.3Private, not-for-profit 360 330 91.1Private, for-profit 90 60 74.4
Institutional sector Public
Less-than-2-year 30 30 83.32-year 320 250 78.24-year non-doctorate-granting 180 160 88.34-year doctorate-granting 190 170 90.9
Private, not-for-profit 2-year-or-less 60 50 78.94-year non-doctorate-granting 220 200 92.64-year doctorate-granting 90 80 95.4
Private, for-profit Less-than-2-year 40 30 67.42-year-or-more 40 40 81.4
Student type Potential FTB student 490 390 80.7Other undergraduate 540 470 88.1Graduate 140 130 94.1
NOTE: Detail may not sum to totals because of rounding. Excludes 120 cases determined to be ineligible for the study. FTB = full-time beginning. SOURCE: U.S. Department of Education, National Center for Education Statistics, 2004 National Postsecondary Student Aid Study (NPSAS:04) Field Test.

Chapter 3: Institutional and Student Data Collection Outcomes
NPSAS:04 Field Test Methodology Report 46
3.2.2 Database Batch Tracing Before Data Collection
In order to locate students for the study, institutions were asked to provide both local and permanent telephone numbers and addresses for students. This information was then confirmed or updated by matching to three locating databases: CPS, National Change of Address (NCOA), and Telematch.
The CPS database contains information from students who have applied for student loans. If a student is in the CPS database, additional locating information often can be obtained for the student. This information can include new (or previous) local and/or permanent addresses and telephone numbers, locating information for the student’s parents or guardians, and information about other potential contacts. Of the 1,100 cases sent to and processed through CPS prior to the end of data collection, 680 (61.8 percent) were returned with new or confirmed information (table 17). Curiously, the location rates for students where CPS either confirmed current information or provided new information varied little when compared to students for whom CPS reported no match (85.4 percent versus 84.5 percent) (x2 = 0.2, p > 0.05). However, and most importantly, the interview rates varied significantly. Interviews were completed with 73.8 percent of those for whom CPS returned a match, compared to 66.0 percent of those for whom no match was returned. (x2 = 7.8, p < 0.01). Therefore, it appears that students who have applied for financial aid (and thus are in the CPS database) are no more likely to be located, but are more likely to complete the interview than are those who have not filed for financial aid. Table 17. Field test locate and interview rates, by CPS batch processing: 2003
Located Interviewed CPS match status Total Number Percent Number Percent Total 1,100 940 85.1 780 70.8Confirmed/new information from CPS 680 580 85.4 500 73.8No match from CPS 420 360 84.5 280 66.0NOTE: Detail may not sum to totals because of rounding. Total excludes 120 cases sent to CPS who were located, but were subsequently determined to be ineligible for study, and 60 cases sent to CPS but not returned prior to the end of data collection. CPS = Central Processing System. SOURCE: U.S. Department of Education, National Center for Education Statistics, 2004 National Postsecondary Student Aid Study (NPSAS:04) Field Test.
All student address information obtained from the institutions and from CPS was then sent to NCOA to search for updates. NCOA, a database consisting of change of address data submitted to the U.S. Postal Service, contains almost 100 million records, which are updated every 2 weeks and stored for 18 months. Of the 1,200 cases sent to NCOA for processing, 100 (8.4 percent) were returned with updated address information (table 18). Students for whom an NCOA update was obtained were more difficult to locate than those for whom no match was found (72.9 percent versus 86.9 percent) (x2 = 14.0, p < 0.001). As a result, a lower percentage of completions was obtained from cases in which an NCOA update was obtained (62.5 percent) compared to that obtained where NCOA had no match (71.9 percent) (x2 = 3.8, p < 0.05).

Chapter 3: Institutional and Student Data Collection Outcomes
47 NPSAS:04 Field Test Methodology Report
Table 18. Field test locate and interview rates, by NCOA batch processing: 2003 Located Interviewed
NCOA match status Total Number Percent Number Percent Total 1,100 980 85.7 820 71.1Confirmed/new information from NCOA 100 70 72.9 60 62.5No match from NCOA 1,100 910 86.9 760 71.9NOTE: Detail may not sum to totals because of rounding. Excludes 120 cases sent to NCOA who were located, but subsequently determined to be ineligible for study, and 10 cases with no viable address. NCOA = National Change of Address. SOURCE: U.S. Department of Education, National Center for Education Statistics, 2004 National Postsecondary Student Aid Study (NPSAS:04) Field Test.
In order to determine whether a new telephone number was available for any of the addresses obtained for the students from the institutions, CPS, or NCOA, all contact information was sent for batch processing by Telematch. This database uses name, street address, and ZIP code as search criteria and returns either a telephone number update/confirmation or an indication that no match was available for a particular address. As table 19 illustrates, 1,200 eligible cases were sent to Telematch, with about one-half (50.7 percent) of the cases returned with new or confirmed telephone information. Cases where Telematch was able to provide an updated or confirmed telephone number were somewhat more likely to result in location than were those where no match was obtained (87.9 percent versus 83.4 percent) (x2 = 4.9, p < 0.05). The resulting completion rates for the two groups, however, were not statistically different (72.8 percent versus 69.4 percent) (x2 = 1.7, p > 0.05). Table 19. Field test locate and interview rates, by Telematch batch processing: 2003
Located Interviewed Telematch match status Total Number Percent Number Percent Total 1,200 990 85.7 820 71.1Confirmed/new information from 590 520 87.9 430 72.8No new information from Telematch 570 480 83.4 400 69.4
NOTE: Detail may not sum to totals because of rounding. Excludes 120 cases sent to Telematch who were located, but subsequently were determined to be ineligible for study. SOURCE: U.S. Department of Education, National Center for Education Statistics, 2004 National Postsecondary Student Aid Study (NPSAS:04) Field Test.
3.2.3 Intensive Tracing During Data Collection
Intensive tracing efforts were required for cases in which no interview was obtained via self-administration nor did the preloaded CATI locating information result in contact with the sample member. These cases were assigned to RTI’s Tracing Operations Unit (TOPS) for intensive centralized tracing, utilizing searches of public and proprietary databases, the Web, and a variety of information directories. Overall, one-fifth (21.9 percent) of the potential or confirmed eligible sample members required intensive tracing efforts (table 20). A higher percentage of students from private for-profit (25.6 percent) and public (24.3 percent) institutions required intensive tracing than those from private not-for-profit institutions (16.4 percent) (x2=9.4, p<0.01). Similarly, those in 2-year (32.6 percent) and less-than-2-year (28.8 percent) institutions were more likely to require intensive tracing than those in 4-year doctorate-granting (15.3 percent) and 4-year non-doctorate-granting institutions (14.5 percent) (x2 = 49.0, p < 0.001). Among different types of students, the percentage of students requiring
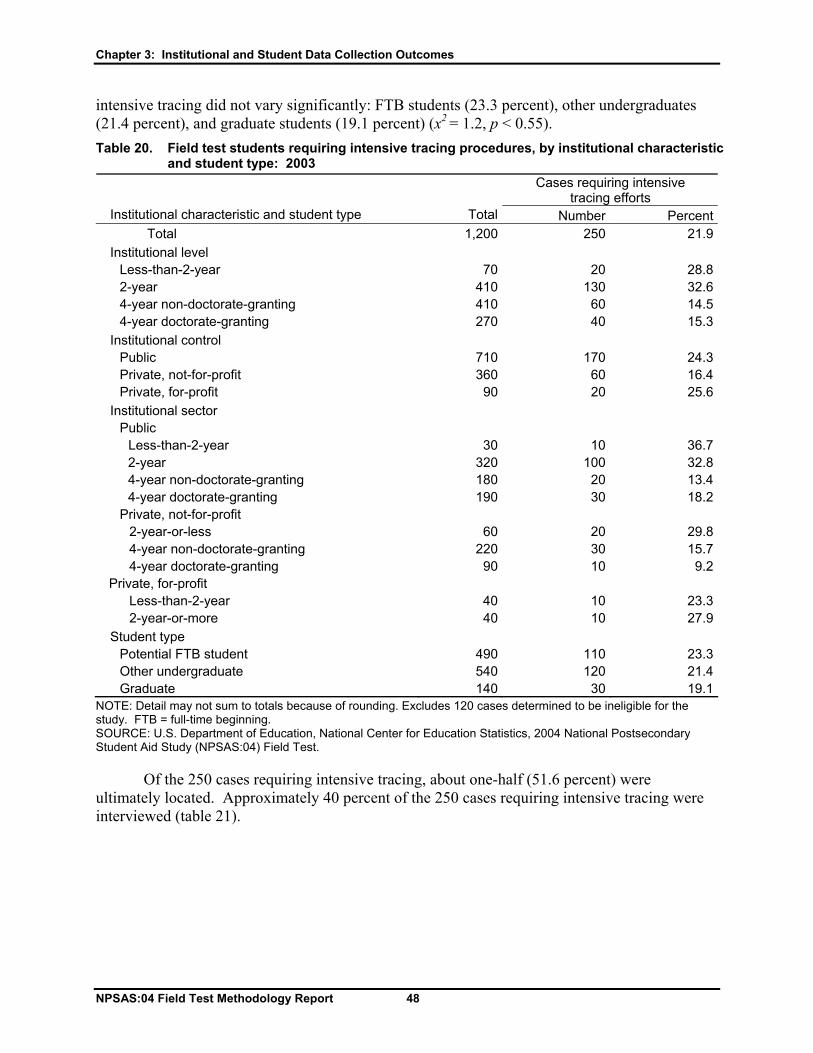
Chapter 3: Institutional and Student Data Collection Outcomes
NPSAS:04 Field Test Methodology Report 48
intensive tracing did not vary significantly: FTB students (23.3 percent), other undergraduates (21.4 percent), and graduate students (19.1 percent) (x2 = 1.2, p < 0.55). Table 20. Field test students requiring intensive tracing procedures, by institutional characteristic
and student type: 2003 Cases requiring intensive
tracing efforts Institutional characteristic and student type Total Number Percent Total 1,200 250 21.9Institutional level
Less-than-2-year 70 20 28.82-year 410 130 32.64-year non-doctorate-granting 410 60 14.54-year doctorate-granting 270 40 15.3
Institutional control Public 710 170 24.3Private, not-for-profit 360 60 16.4Private, for-profit 90 20 25.6
Institutional sector Public
Less-than-2-year 30 10 36.72-year 320 100 32.84-year non-doctorate-granting 180 20 13.44-year doctorate-granting 190 30 18.2
Private, not-for-profit 2-year-or-less 60 20 29.84-year non-doctorate-granting 220 30 15.74-year doctorate-granting 90 10 9.2
Private, for-profit Less-than-2-year 40 10 23.32-year-or-more 40 10 27.9
Student type Potential FTB student 490 110 23.3Other undergraduate 540 120 21.4Graduate 140 30 19.1
NOTE: Detail may not sum to totals because of rounding. Excludes 120 cases determined to be ineligible for the study. FTB = full-time beginning. SOURCE: U.S. Department of Education, National Center for Education Statistics, 2004 National Postsecondary Student Aid Study (NPSAS:04) Field Test.
Of the 250 cases requiring intensive tracing, about one-half (51.6 percent) were ultimately located. Approximately 40 percent of the 250 cases requiring intensive tracing were interviewed (table 21).

Chapter 3: Institutional and Student Data Collection Outcomes
49 NPSAS:04 Field Test Methodology Report
Table 21. Field test locate and interview rates, by intensive tracing efforts: 2003 Located Interviewed
Intensive tracing status Total Number Percent Number Percent Total 1,200 990 85.7 820 71.1Intensive tracing required 250 130 51.6 100 38.6No intensive tracing required 910 860 95.2 730 80.2
NOTE: Detail may not sum to totals because of rounding. Excludes 120 cases determined to be ineligible for the study. SOURCE: U.S. Department of Education, National Center for Education Statistics, 2004 National Postsecondary Student Aid Study (NPSAS:04) Field Test.
The primary goal of intensive tracing is to identify the telephone number and address for the selected sample member. Of the 250 potentially eligible sample members requiring intensive tracing, either a telephone number or both a telephone number and address were found for 150 (60.2 percent) of the cases, while an address, but no telephone number was identified for 20 (9.4 percent) sample members (table 22). Of the remaining cases, 10 (3.9 percent) were located but refused to participate and 70 (26.4 percent) were unlocatable. Given the design of NPSAS:04 and the need to contact sample members as quickly and efficiently as possible, a telephone number is perhaps the most important piece of information to be obtained during intensive tracing. Among the cases where a telephone number was obtained, 70.6 percent resulted in locates, while 16.7 percent of the cases where only an address was found were located. Table 22. Field test locate and interview rates, by outcome of intensive tracing efforts: 2003
Located1 Interviewed Outcome of intensive tracing efforts
Total requiring intensive tracing Number Percent2 Number Percent2
Total 250 140 53.9 100 38.6 New/confirmed telephone
number 150 110 70.6 80 53.6 New/confirmed address (only) 20 # 16.7 # 8.3 Refusal at tracing stage 10 10 100.0 # 10.0 Unable to locate3 70 20 22.4 10 19.4
# Rounds to zero. 1 Located by CATI telephone interviewers after release from intensive tracing. 2 Percent of total for each row. 3 These respondents were unlocatable in intensive tracing but subsequently called the telephone center to complete the interview or completed it on the Web. NOTE: Detail may not sum to totals because of rounding. Excludes 30 cases which were traced who were located, but subsequently determined to be study ineligible. SOURCE: U.S. Department of Education, National Center for Education Statistics, 2004 National Postsecondary Student Aid Study (NPSAS:04) Field Test.
Table 23 provides an overview of the primary sources used during the intensive tracing process and the percentage of cases that resulted in locating when these techniques were used. It is important to note that most cases were traced using multiple sources. For this reason, it is extremely difficult to isolate the effectiveness of any single source of information. Among the techniques used most often for intensive tracing of NPSAS:04 sample members were calls to directory assistance (250 cases), web-based searches (240 cases), consumer database Social Security number searches (190 cases), and address searches in a proprietary locator database (170 cases).

Chapter 3: Institutional and Student Data Collection Outcomes
NPSAS:04 Field Test Methodology Report 50
Table 23. Field test locate rates, by intensive tracing source: 2003 Located
Tracing source Total Number PercentDirectory assistance 250 140 54.4Web search 240 130 53.4Consumer database search – Social Security number search 190 80 44.9Address search – database 170 80 45.0Reverse phone lookup – database 130 70 50.4Consumer database search – address search 120 70 58.5Consumer database search 100 40 42.4Name search – database 60 20 35.6Directory Assistance–Plus 40 20 34.1Neighbor search – database 10 # 20.0
# Rounds to zero. NOTE: Detail may not sum to totals because of rounding. Most cases were traced using multiple sources so that row totals and percentages are not mutually exclusive. SOURCE: U.S. Department of Education, National Center for Education Statistics, 2004 National Postsecondary Student Aid Study (NPSAS:04) Field Test.
3.2.4 Conversion of Nonrespondents
In addition to the initial mailing sent to all sample members and the follow-up telephone contacts for web nonrespondents, additional mailings and e-mail prompts were used in conjunction with incentives to selected sample members to contact and convince them to participate in NPSAS:04 (see section 3.4 for details on the incentive experiment). Letters for each mailing were modified slightly; however, all contained some of the same general information. This information included an overview of the study, the student’s user name and password for accessing the web instrument, and information for contacting NPSAS:04 project staff via a toll-free number or e-mail if the sample members wanted to ask questions, set a callback appointment, or conduct the interview over the telephone. The location and interview rates associated with each of these nonrespondent mailings is shown in table 24.
Refusal conversion letters were sent on a flow basis to sample members who initially refused to participate in the study. These letters were tailored to address the typical concerns expressed by those refusing to participate. While it was clear in some cases that the person refusing was the selected sample member, in many other cases it was difficult to determine whether the person refusing was the actual sample member or a contact. Among the 130 cases who were sent refusal conversion letters, the location of the sample member was confirmed for 93.3 percent, and 46.3 percent of those members completed the interview.
Another letter was tailored for use with nonrespondents who did not actively refuse to participate. A letter indicating attempts to contact the sample member was sent to those for whom 15 or more call attempts had been made, but not completed. In total, nonrespondent letters were sent to 460 sample members (some received multiple mailings if different local and permanent addresses were available). Of these members, 300 (66.2 percent) were located and 220 (47.5 percent) were interviewed.

Chapter 3: Institutional and Student Data Collection Outcomes
51 NPSAS:04 Field Test Methodology Report
Three weeks before the end of the data collection period, all nonrespondents (refusals and nonrefusals alike) were sent a final mailing asking for their participation. Of the 270 that were sent the end-of-study letter, 210 (75.6 percent) were ultimately located and 130 (46.4 percent) were interviewed. By the end of the study, 260 of the 1,200 confirmed or potentially eligible sample members had initially refused to participate in NPSAS:04. Interviews were ultimately conducted with 100 (38.6 percent) of these students. Table 24. Field test locate and interview rates, by nonresponse mailings: 2003
Located Interviewed Student mailing status Total Number Percent Number Percent1
(a) Refusal conversion letter 130 130 93.3 60 46.3(b) Nonrespondent (nonrefusal) conversion letter 460 300 66.2 220 47.5(c) End-of-study nonrespondent conversion letter 270 210 75.6 130 46.41 Percent of total for each row. NOTE: Detail may not sum to totals because of rounding. Excludes the following cases sent the mailing who were located, but subsequently were determined to be ineligible for study: (a) 10 cases, (b) 40 cases, and (c) 30 cases. SOURCE: U.S. Department of Education, National Center for Education Statistics, 2004 National Postsecondary Student Aid Study (NPSAS:04) Field Test.
3.3 Response Burden and Effort
3.3.1 Time to Complete the Student Interview
This section reviews the effort and burden associated with the NPSAS:04 student interview. Interview length was examined both overall and by mode of interview administration and student type. This information is useful because it provides evidence that can reduce respondent burden, reduce data collection effort and cost, and improve data quality for the full-scale study. Since this was the first cycle of NPSAS to use a web-based instrument, it was also important to examine the impact of connection type on data collection for web respondents.
The student instrument was developed with time stamps embedded throughout. This approach allowed project staff to determine the time required to complete specific interview items, the online coding programs, individual sections of the interview, and the interview as a whole. In addition, these time stamps were also necessary to determine the differential impact that connection type and completion time of day had on respondent burden, if any.
Table 25 presents the timing results (combining onscreen and transit times) for the NPSAS:04 field test respondents by interview section and mode of administration. The overall average time to complete the interview was about 33 minutes. Web respondents, at nearly 36 minutes, took longer to complete the interview than CATI respondents, who took about 32 minutes (t = 4.43, p < 0.01). This outcome was not unexpected because of the variation in timing introduced by differences in connection type and speed for web respondents. This source of variation was held relatively constant for CATI interviews because all interviews were completed using the same connection type and speed (see table 26 for timing results based on connection type).

Chapter 3: Institutional and Student Data Collection Outcomes
NPSAS:04 Field Test Methodology Report 52
Table 25. Average minutes to complete field test student interview, by mode of administration and interview section: 2003
All respondents Web respondents CATI respondents
Interview section Numberof cases
Average time
Number of cases
Average time
Number of cases
Average time
Total interview1 770 33.0 250 35.5 520 31.8Section A – Enrollment 770 9.2 250 9.9 520 8.9Section B – Financial aid 770 4.9 250 5.0 520 4.8Section C – Employment 690 7.0 250 7.2 440 6.9Section D—Education experiences 770 3.0 260 2.7 520 3.1Section E – Background 770 5.7 240 6.3 520 5.4Section F – Locating 300 4.1 90 3.5 210 4.41 Total interview time combines onscreen and transit times across all sections and respondents. NOTE: Detail may not sum to totals because of rounding. Outliers of more than two standard deviations were excluded: 30 from Section A, 30 from Section B, 30 from Section C, 30 from Section D, 40 from Section E, 10 from Section F, and 30 from the total interview. CATI= computer-assisted telephone interviewing. SOURCE: U.S. Department of Education, National Center for Education Statistics, 2004 National Postsecondary Student Aid Study (NPSAS:04) Field Test.
The longest section to complete was the enrollment section, taking on average slightly over 9 minutes for all respondents. The longer completion time was to be expected, because this section was critical to the progression of the interview and therefore the most complex. The routing and question wording for respondents for the remainder of the interview was based on the responses in the enrollment section; therefore, it was necessary to obtain a detailed enrollment history. Again, web respondents took longer (about 10 minutes) to complete this section when compared to CATI respondents (about 9 minutes).
Overall, respondents took approximately 5 minutes to complete the section concerning financial aid. Items in this section focused on the application for federal student aid, type and amount of aid, graduate fellowships and assistantships, and work-study program. CATI and web respondents both took, on average, 5 minutes on this section.
Completion of the employment section took approximately 7 minutes. This section pertained to employment outside the university. Included were occupation and industry items requiring the respondents to code their responses, salary, the effects of working on education, affordability of education without employment, spousal income, receipt of federal assistance, assets, and credit card burden. Web and CATI respondents both took equal time to complete this section of the interview.
The education section was very short. On average, it took about 3 minutes for all respondents to complete, regardless of the mode of administration. Many items in this section did not pertain to all respondents. For example, items concerning why a respondent dropped out of the NPSAS institution and transferred to or from the NPSAS institution were not appropriate for many respondents. Another subset of items were applicable only to students identified as FTB students. Other items in this section focused on admissions test scores, reasons for choosing the NPSAS institution, experiences at the institution, and high school coursework.

Chapter 3: Institutional and Student Data Collection Outcomes
53 NPSAS:04 Field Test Methodology Report
The background section, containing demographic items about respondents and their families, took nearly 6 minutes to complete. CATI respondents took less time than web respondents for this section (t = 4.65, p < 0.01). The final section did not apply to all respondents. The locating section was applicable only to students identified as FTB students, who, overall, took 4 minutes. Again, there was a difference in the amount of time to complete this section based on mode of administration; however, CATI respondents took longer than web respondents in this instance (t = 4.18, p < 0.01).
In order to put the timing results by mode in context, the impact of web connection type on the variation in respondent burden should be also assessed. Table 26 provides the timing results based on connection type, including transit times, for web respondents. Respondents using a dial-up modem took nearly 13 minutes longer to complete the interview than those using a fast connection type (t = 7.85, p < 0.01). This difference was due almost solely to transit time, which was considerably shorter for those using a fast web connection when compared to those using dial-up (t = 13.09, p < 0.01). The difference in transit times between the two groups was approximately 12 minutes. Table 26. Average minutes to complete field test student self-administered web interview, by web
connection type: 2003
Web connection type Average
interview time Transit time Number of cases
Dial-up modem 43.7 19.7 60Fast connection 30.8 7.4 110
Cable modem 28.7 8.5 60Digital subscriber line (DSL) 30.4 6.0 20Integrated services digital network (ISDN) 35.4 16.5 #Corporate local area network (LAN; T1 or T3) 34.4 9.7 30
Do not know connection type 37.8 12.5 50# Rounds to zero. NOTE: Detail may not sum to totals because of rounding. Fast connection time is the average interview time of respondents with a cable modem, DSL, ISDN, or corporate LAN. Average interview time is the total amount of time that the respondent spent completing the interview, including transit time. Transit time is the amount of time required to submit data to and from the server. SOURCE: U.S. Department of Education, National Center for Education Statistics, 2004 National Postsecondary Student Aid Study (NPSAS:04) Field Test.
In addition to understanding the variation in time required to complete the NPSAS:04 field test student interview based on mode of administration and web connection type, it is also useful to determine the difference in burden placed on different types of students. The NPSAS:04 field test student instrument comprised several items, some of which applied to all respondents. Others applied only to certain subgroups of respondents. Table 27 summarizes the average time to complete the interview by student type and interview section.

Chapter 3: Institutional and Student Data Collection Outcomes
NPSAS:04 Field Test Methodology Report 54
Table 27. Average minutes to complete field test student interview, by student type and interview section: 2003
FTB student Other
undergraduate Graduate/first-
professional student
Interview section Number of cases
Average time
Number of cases
Average time
Number of cases
Average time
Total interview 270 37.9 370 30.3 100 28.9Section A – Enrollment 290 8.5 360 7.7 100 9.2Section B – Financial aid 280 5.2 360 4.7 100 4.3Section C – Employment 250 6.9 320 7.3 90 6.4Section D – Education experiences 270 6.0 380 1.3 100 1.2Section E – Background 270 6.6 370 5.3 100 4.9Section F – Locating 280 4.2 † † † †
† Not applicable. NOTE: Detail may not sum to totals because of rounding. Total interview time combines onscreen and transit times across all sections and respondents. Outliers of more than two standard deviations were excluded: 30 from Section A, 30 from Section B, 30 from Section C, 30 from Section D, 40 from Section E, 10 from Section F, and 30 from the total interview. FTB = full-time beginning. SOURCE: U.S. Department of Education, National Center for Education Statistics, 2004 National Postsecondary Student Aid Study (NPSAS:04) Field Test.
As noted earlier, the locating section of the interview applied only to students identified as FTB students. On average, it took this group of students over 4 minutes to complete this section. Therefore, it was not surprising that this group took significantly longer to complete the interview than both other undergraduates and graduate/first-professional students (F = 56.4, p < 0.01). The least amount of burden was placed on the graduate/first-professional students, who took about 29 minutes to complete the interview, while other undergraduates took about 30 minutes to do so. FTB students also took longer than the other two groups to complete the financial aid (F = 12.61, p < 0.01), education experiences (F = 1077.6, p < 0.01), and background sections (F = 35.58, p < 0.01). All three groups of students took equally as long, between 6 and 7 minutes, to complete the employment section.
3.3.2 Help Desk
In order to gain a better understanding of the problems encountered by students attempting to complete the interview over the Web, a software program was developed to record each help desk incident that occurred during data collection. For each occurrence, help desk staff confirmed contact information for the sample member, recorded the type of problem, a description of the problem and resolution, incident status (pending or resolved), and the approximate time it took to assist the caller. Help desk staff were trained to answer any calls received from the help desk hotline, as well as conduct telephone interviews as needed. Help desk staff members assisted sample members with questions about the web instrument, and provided technical assistance to sample members who experienced problems while completing the self-administered web interview. Help desk agents also responded to voice-mail messages left by respondents when the Call Center was closed.
Table 28 provides a summary of help desk incidents. Help desk staff assisted 40 students (3 percent of the sample) with 51 incidents. About three-quarters (74 percent) of these cases called the help desk only once, while 18 percent called in twice, and 8 percent called in three or more times. On average, help desk agents spent about 4 minutes resolving incidents. Of the 40

Chapter 3: Institutional and Student Data Collection Outcomes
55 NPSAS:04 Field Test Methodology Report
students who called the help desk, 13 percent completed the interview while on the telephone with the agent who took their call.
The majority of the problems (45 percent) reported by students who called the Help Desk were errors in the questionnaire programming (see table 28). Other problems included requests for study ID and/or password or both (35.3 percent), problems with browser settings and computer or both (7.8 percent), the study website being down or unavailable (5.9 percent), and general questions about the study (5.9 percent). Table 28. Field test help desk incident type: 2003 Type of incident Total incidents recorded Percent of total incidents Total 51 100.0Program error 23 45.1Study ID/password 18 35.3Browser settings/computer problems 4 7.8Website unavailable 3 5.9Question about study 3 5.9
NOTE: Detail may not sum to totals because of rounding. SOURCE: U.S. Department of Education, National Center for Education Statistics, 2004 National Postsecondary Student Aid Study (NPSAS:04) Field Test.
3.3.3 Call Attempts
A total of 2,015 telephone interviewer hours (exclusive of training, supervision, monitoring, administration, and quality circle meetings) were expended to obtain completed interviews from 820 sample members. Since the time to administer the interview was, on average, approximately 30 minutes, the large majority of interviewer time was spent on other case-related activities. A small percentage of this time was required to bring up a case, review its history, and close the case (with appropriate reschedule, comment, and disposition entry) when completed. The bulk of the time, however, was devoted to locating and contacting sample members.
A total of 21,179 call attempts were made as a part of the NPSAS:04 field test (excluding calls to the 120 cases determined to be ineligible for study), averaging 18.3 calls per case (table 29). Among all completed cases, an average of 12.3 call attempts were required, while the average for nonrespondents was 33.0 calls. Table 29. Call counts, by interview status and mode of completion: 2003
Interview status and completion mode Number of cases Number of calls Average calls
per case Total 1,200 21,179 18.3Interviewed 820 10,108 12.3Not interviewed 340 11,071 33.0By mode Web complete – no telephone follow-up 170 † †Web complete – with telephone follow-up 120 2,155 18.3CATI complete 540 7,953 14.7† Not applicable. NOTE: Detail my not sum to totals because of rounding. Excludes 120 cases determined to be ineligible for study. CATI = computer-assisted telephone interviewing. SOURCE: U.S. Department of Education, National Center for Education Statistics, 2004 National Postsecondary Student Aid Study (NPSAS:04) Field Test.

Chapter 3: Institutional and Student Data Collection Outcomes
NPSAS:04 Field Test Methodology Report 56
The average call count varied across the mode of data collection. Of the 820 completed cases, approximately 20 percent were completed via the self-web instrument and required no telephone contact. However, the remaining 120 self-web completions required an average of 18.3 calls. Finally, approximately two-thirds of the completions (65.7 percent) were obtained via CATI by a telephone interviewer and required an average of 14.7 call attempts.
Significant variation in the number of calls per case was noted across different types of students and those from different types of institutions (see table 30). On average, potential FTB students required more telephone calls (20.3 calls) than other types of undergraduates (16.9 calls) or graduate students (16.7 calls) (F = 0.781, p < 0.458). Additionally, those from 2-year institutions (20.6 calls) and less-than-2-year institutions (19.7 calls) required more calls on average than those from either 4-year, non-doctorate-granting (16.6 calls) or 4-year, doctorate-granting (16.9 calls) institutions. Table 30. Number and result of calls made to sample members, by institutional characteristic and
student type: 2003
Institutional characteristic and student type CATI sample
casesTotal calls to
sample cases Calls per case Total 1,200 21,179 18.3Institutional level
Less-than-2-year 70 1,438 19.72-year 410 8,343 20.64-year non-doctorate-granting 410 6,756 16.64-year doctorate-granting 270 4,642 16.9
Institutional control Public 710 13,461 18.9Private, not-for-profit 360 6,232 17.3Private, for-profit 90 1,486 17.3
Institutional sector Public
Less-than-2-year 30 515 17.22-year 320 6,476 20.44-year non-doctorate-granting 180 3,261 18.24-year doctorate-granting 190 3,213 17.2
Private, not-for-profit 2-year-or-less 60 1,438 25.24-year non-doctorate-granting 220 3,374 15.64-year doctorate-granting 90 1,418 16.3
Private, for-profit Less-than-2-year 40 922 21.42-year-or-more 40 562 13.1
Student type Potential FTB student 490 9,851 20.3Other undergraduate 540 9,075 16.9Graduate student 140 2,253 16.7
NOTE: Detail may not sum to totals because of rounding. Excludes 122 cases determined to be ineligible for the study. CATI = computer-assisted telephone interviewing; FTB = full-time beginning. SOURCE: U.S. Department of Education, National Center for Education Statistics, 2004 National Postsecondary Student Aid Study (NPSAS:04) Field Test.

Chapter 3: Institutional and Student Data Collection Outcomes
57 NPSAS:04 Field Test Methodology Report
Call screening has been a continuing problem in studies that rely on the telephone as a mode of contact. Devices such as telephone answering machines can be used to screen unwanted calls yet also serve as a means of staying in touch, particularly for those with busy lifestyles like most college-age students. Table 31 looks at the success in locating and interviewing traditionally “hard to reach” sample members. These sample members require 10 or more call attempts. Of the 600 students requiring 10 or more attempts, 78.9 percent were located and 54.9 percent completed the NPSAS interview. Location rates among these students varied significantly based on the percentage of time a telephone answering machine was reached on those calls. Location of a student was less likely to occur if an answering machine was never reached on any of the call attempts (66.7 percent located) compared to when an answering machine was reached less then one-half of the time (83.1 percent) or on one-half or more of the call attempts (78.8 percent) (x2 = 8.4, p < 0.02). Interestingly, the percentage of completions obtained was not significantly different across these three groups (x2 = 1.6, p < 0.447). Table 31. Field test location and interview rates for hard-to-reach sample members, by percentage
of calls in which an answering machine was reached: 2003 Located Interviewed
Extent of call attempts resulting in answering machine
Total hard-to-reach sample
members Number Percent Number Percent Total 600 470 78.9 330 54.9None 70 50 66.7 30 47.8Less-than half 210 170 83.1 120 55.6Half or more 320 250 78.8 180 56.1
NOTE: Detail may not sum to totals because of rounding. Calculations include only cases with 10 or more call attempts (i.e., those considered to be hard to reach). SOURCE: U.S. Department of Education, National Center for Education Statistics, 2004 National Postsecondary Student Aid Study (NPSAS:04) Field Test.
Patterns in the telephone numbers that ultimately result in finding a sample member were examined, as well as how these patterns changed over the course of the study. Telephone numbers for the 520 CATI completes and the 120 web completes that required at least one telephone follow-up were coded as “local number” or “permanent number” based on the list obtained from the institutions. In a plurality of cases, the institutions had the same number listed as “local” and “permanent”—these were coded as “local or permanent (unknown).” Finally, if a completion was obtained at a number other than local or permanent, the number was coded as “other source.” As shown on table 32, 31.2 percent of the completes were obtained at the student’s “permanent number,” 11.9 percent at the student’s “local number,” and 14.9 percent from some other number (other than local or permanent). For the remaining 41.9 percent of the completions, it was impossible to identify whether the number was local or permanent since it was listed by the institution in both fields. A higher percentage of cases was completed at the local number during the first 9 weeks of data collection (15.2 percent) than during the final 9 weeks (8.7 percent). Conversely, a greater percentage of cases was completed using some other source during the last 9 weeks of data collection (18.4 percent) than during the initial weeks of the study (11.4 percent) (x2 = 10.4, p < 0.001).

Chapter 3: Institutional and Student Data Collection Outcomes
NPSAS:04 Field Test Methodology Report 58
Table 32. Field test telephone number type for respondent interview completion: 2003
Local number Permanent numberLocal or permanent (unknown) number Other source
Data collection Total
completes Number Percent Number Percent Number Percent Number Percent Total 640 80 11.9 200 31.2 270 41.9 100 14.9First 9 weeks 320 50 15.2 100 30.7 140 42.7 40 11.4Last 9 weeks 320 30 8.7 100 31.8 130 41.1 60 18.4NOTE: Detail may not sum to totals because of rounding. Includes 520 cases completed by CATI and 120 cases completed by self-web where telephone prompting calls were required; excludes 20 final partial interviews. CATI = computer-assisted telephone interviewing. SOURCE: U.S. Department of Education, National Center for Education Statistics, 2004 National Postsecondary Student Aid Study (NPSAS:04) Field Test.
3.4 Incentive Experiment Results
This section provides a summary of the results obtained from the experiment conducted during the NPSAS:04 field test. This experiment was conducted to assess the following hypotheses regarding the efficacy of incentives:
• Incentives increase the response rate during the initial phase of data collection (phase I) and promote a higher rate of self-administered web responses.
• Incentives increase the completion rate during the nonresponse follow-up phase of CATI data collection (phase III).
• A larger incentive increases the response rate more than a smaller one during phase I.
The first hypothesis addressed the need for increasing the number of early responses, which were expected to decrease the overall cost of data collection because the assumption was that the self-administered response would be the least costly. Testing the second hypothesis assessed the effectiveness of incentives as a tool for increasing the overall completion rate by reducing initial refusals, particularly for hard-to-reach students. The third hypothesis determined the effect of differing levels of incentives for increasing the phase I response rates.
The employed experimental design comprised three early response incentive groups – ER1 ($0), ER2 ($10), and ER3 ($20), within which two CATI nonresponse follow-up groups of NF1 ($0) and NF2 ($20) were nested. In order to avoid potential issues resulting from offering different amounts of incentives, each institution was randomly assigned to one of the six treatment groups when the student sample was selected and all students within the institution were offered the same incentive amount. The randomization process was controlled so that the number of sample members assigned to treatment groups was approximately the same during the three phases of the experiment as shown in table 33:
Phase I: Those in groups ER2 and ER3 were offered an incentive to complete the survey by self-administration within 3 weeks of receiving the initial mailing.
Phase II: All nonrespondents from phase I were prompted by telephone to complete the survey by self-administration or CATI, during which no individual was offered an incentive.
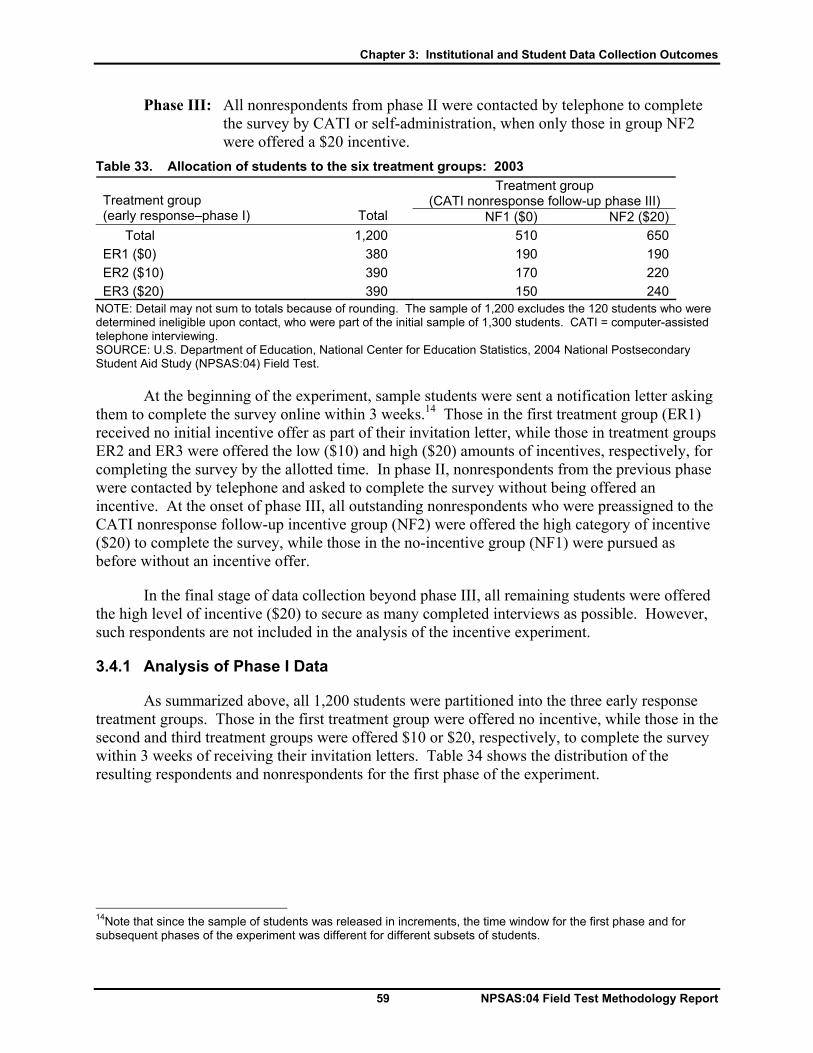
Chapter 3: Institutional and Student Data Collection Outcomes
59 NPSAS:04 Field Test Methodology Report
Phase III: All nonrespondents from phase II were contacted by telephone to complete the survey by CATI or self-administration, when only those in group NF2 were offered a $20 incentive.
Table 33. Allocation of students to the six treatment groups: 2003 Treatment group
(CATI nonresponse follow-up phase III) Treatment group (early response–phase I) Total NF1 ($0) NF2 ($20) Total 1,200 510 650ER1 ($0) 380 190 190ER2 ($10) 390 170 220ER3 ($20) 390 150 240
NOTE: Detail may not sum to totals because of rounding. The sample of 1,200 excludes the 120 students who were determined ineligible upon contact, who were part of the initial sample of 1,300 students. CATI = computer-assisted telephone interviewing. SOURCE: U.S. Department of Education, National Center for Education Statistics, 2004 National Postsecondary Student Aid Study (NPSAS:04) Field Test.
At the beginning of the experiment, sample students were sent a notification letter asking them to complete the survey online within 3 weeks.14 Those in the first treatment group (ER1) received no initial incentive offer as part of their invitation letter, while those in treatment groups ER2 and ER3 were offered the low ($10) and high ($20) amounts of incentives, respectively, for completing the survey by the allotted time. In phase II, nonrespondents from the previous phase were contacted by telephone and asked to complete the survey without being offered an incentive. At the onset of phase III, all outstanding nonrespondents who were preassigned to the CATI nonresponse follow-up incentive group (NF2) were offered the high category of incentive ($20) to complete the survey, while those in the no-incentive group (NF1) were pursued as before without an incentive offer.
In the final stage of data collection beyond phase III, all remaining students were offered the high level of incentive ($20) to secure as many completed interviews as possible. However, such respondents are not included in the analysis of the incentive experiment.
3.4.1 Analysis of Phase I Data
As summarized above, all 1,200 students were partitioned into the three early response treatment groups. Those in the first treatment group were offered no incentive, while those in the second and third treatment groups were offered $10 or $20, respectively, to complete the survey within 3 weeks of receiving their invitation letters. Table 34 shows the distribution of the resulting respondents and nonrespondents for the first phase of the experiment.
14Note that since the sample of students was released in increments, the time window for the first phase and for subsequent phases of the experiment was different for different subsets of students.

Chapter 3: Institutional and Student Data Collection Outcomes
NPSAS:04 Field Test Methodology Report 60
Table 34. Response rates, by early response treatment group for phase I: 2003 Phase I response
Treatment group (early response) Total Respondent Nonrespondent Percent response Total 1,200 230 930 19.9ER1 ($0) 380 50 330 13.1ER2 ($10) 390 90 290 24.3ER3 ($20) 390 90 300 22.2
NOTE: Detail may not sum to totals because of rounding. SOURCE: U.S. Department of Education, National Center for Education Statistics, 2004 National Postsecondary Student Aid Study (NPSAS:04) Field Test.
As indicated in table 34, those offered incentives were more likely to respond during the initial web-only data collection period (x2 = 4.43, p < 0.01). Fifty of the 380 students who were not offered incentives responded to the survey during the first phase (13.1 percent), while 180 (90+90) of 780 (390+390) students offered incentives (low or high) responded to the survey during this phase (23.2 percent).
3.4.2 Analysis of Phase II Data
In accordance with office of management and budget (OMB) guidelines, attempts were made to complete as many interviews as possible during the second phase without offering incentives. For this purpose, all outstanding students from the first phase were contacted by telephone and asked to complete the survey at their convenience, either on the phone or via the Web. Table 35 shows the distribution of the resulting respondents and nonrespondents for the second phase of the experiment. Table 35. Response rates, by early response treatment group for phase II: 2003
Phase II response Treatment group (early response) Total Respondent Nonrespondent Percent response Total 930 330 600 35.0ER1 ($0) 330 110 220 33.9ER2 ($10) 290 120 170 40.6ER3 ($20) 300 90 210 30.8
NOTE: Detail may not sum to totals because of rounding. SOURCE: U.S. Department of Education, National Center for Education Statistics, 2004 National Postsecondary Student Aid Study (NPSAS:04) Field Test.
While results from this phase were not of particular analytical interest, similar analyses as those conducted for the first phase were applied to the data from this phase as well. No significant difference in the response rates during phase II were detected among those who were offered incentives (low or high) during the first phase and those who were not, 35.6 percent versus 33.9 percent, respectively (p > 0.05). This finding suggested that there were no “residual effects” from phase I to phase II. In other words, the offer of an incentive during the first phase had no significant effect on response rates during the second phase when no one was offered an incentive.

Chapter 3: Institutional and Student Data Collection Outcomes
61 NPSAS:04 Field Test Methodology Report
3.4.3 Analysis of Phase III Data
Upon expiration of the allotted time for the second phase, the remaining nonrespondents were contacted by telephone for nonresponse follow-up. Those who were preassigned to the CATI nonresponse follow-up treatment group NF1 were not offered an incentive, while those in the treatment group NF2 were offered $20 to complete the survey. Table 36 provides the distribution of the resulting respondents and nonrespondents for the third phase of the incentive experiment. Table 36. Response rates, by nonresponse treatment group for phase III: 2003
Phase III response
Treatment group (nonresponse follow-up) Total Respondent Nonrespondent Percent
response Total 600 160 440 26.4NF1 ($0) 220 40 190 15.8NF2 ($20) 380 120 260 32.5
NOTE: Detail may not sum to totals because of rounding. SOURCE: U.S. Department of Education, National Center for Education Statistics, 2004 National Postsecondary Student Aid Study (NPSAS:04) Field Test.
Similar to the findings from phase I, those offered an incentive were more likely to complete the survey (x2 = 4.84, p < 0.01). Of those not offered an incentive, about 16 percent responded to the survey during the third phase, while 33 percent of those offered a $20 incentive responded to the survey during this phase.
3.4.4 Web and CATI Incentive Results
A comparison was also made among all respondents for the three phases of the experiment to detect differences in proportions of respondents who completed the survey by the Web versus CATI. As summarized in table 37, over 35 percent of all responses were secured via the Web. It was anticipated that the offer of incentive during the first phase of data collection, which promoted self-administered interviews, was in part responsible for this favorable outcome. While the amount of incentive did not significantly affect participation rates, a significantly higher proportion (41.9 percent) of students who were offered an early response incentive (either low or high) completed the survey via the Web as compared to those who were not offered an incentive (21.6 percent). Table 37. Distribution of completed interviews for all three phases, by early response treatment
group and data collection mode: 2003 Data collection mode
Treatment group (early response) Total Web CATI Percent web Total 710 250 460 35.4ER1 ($0) 230 50 180 21.6ER2 ($10) & ER3 ($20) 490 200 280 41.9
NOTE: Detail may not sum to totals because of rounding. CATI = computer-assisted telephone interviewing. SOURCE: U.S. Department of Education, National Center for Education Statistics, 2004 National Postsecondary Student Aid Study (NPSAS:04) Field Test.

Chapter 3: Institutional and Student Data Collection Outcomes
NPSAS:04 Field Test Methodology Report 62
3.4.5 Experiment Summary
As seen above, the results of this field test experiment support the first two hypotheses. Offering incentives significantly boosted the response rate during the first phase of data collection, and it increased the completion rate during the CATI nonresponse follow-up phase of data collection (phase III). Moreover, it is also believed that the offer of early response incentives during the first phase (when web interviews were encouraged) was partially responsible for securing over 35 percent of interviews via the Web. Results from the first phase seem to indicate that a higher amount of incentive may not further increase response rates when compared to a lower amount. However, this outcome could be due to small sample sizes and the potentially inadequate increment between the low and high amounts of incentive ($10).

63 NPSAS:04 Field Test Methodology Report
Chapter 4 Evaluation of Field Operations and Data Quality
The 2004 National Postsecondary Student Aid Study (NPSAS:04) is used by government agencies, academics, and researchers alike; therefore, assurance of the highest quality data is critical to the success of the study. This chapter evaluates the effectiveness of field test survey instrumentation and procedures for the quality and completeness of the data obtained. Included are results of first-time beginning FTB student identification efforts, institutional data collection, instrument reliability and usability, item nonresponse, computer-assisted telephone interviewing (CATI) quality assurance monitoring, and data file preparation.
4.1 Potential FTB Identification
The NPSAS:04 study will serve as the base year of a longitudinal study of FTB students. Those students determined to be FTB during the NPSAS survey, as well as a sample of potential FTB students who were NPSAS nonrespondents, will be followed up 2 years later as part of the Beginning Postsecondary Students Longitudinal Study (BPS) cohort. Data collected during NPSAS:04 will serve as the base-year data for the subsequent study. An FTB student was defined as a student satisfying all of the following conditions:
• first term of enrollment at the sample institution was between July 1, 2002 and April 30, 2003 or had not completed a postsecondary class prior to July 1, 2002;
• was an undergraduate between July 1, 2002 and April 30, 2003;
• was a freshman or first-year student between July 1, 2002 and April 30, 2003; and
• had no transfer credits from another postsecondary institution.
For the field test, institutions were asked to include an FTB student indicator on the enrollment list to facilitate identification and sample selection of these students. However, as learned in past NPSAS studies (i.e., NPSAS:90 and NPSAS:96), many institutions have difficulty identifying FTB students. Students are often identified as FTB students if they are new to the institution. Usually, only new freshmen are included, but some institutions even designate new upperclassmen or new graduate students as FTB. Some institutions simply provide class level as a substitute for FTB studnets, (i.e., equate freshman and FTB). Although institutions are asked to check transcripts when determining FTB status, many do not.
Students’ correct classification was identified during the field test student interview. Table 38 indicates that of the 480 students sampled as FTB who completed an interview, 180 were determined not to be FTB students, for a false-positive rate of about 37 percent. Conversely, of the 350 students sampled as other undergraduate or graduate/first-professional students who completed an interview, about 10 were FTB students, for a false-negative rate of about 3 percent.

Chapter 4: Evaluation of Field Operations and Data Quality
NPSAS:04 Field Test Methodology Report 64
Table 38. First-time beginning status determination, by sample student type: 2003 Confirmed first-time beginning
(FTB) student Student type
Students interviewed1 Number Percent
Total 820 310 37.6FTB student 480 300 63.2Other undergraduate and graduate/first-professional 350 10 2.9
1 Includes all eligible sample members who completed the student interview because confirmation of FTB status required contact with sample members. NOTE: Detail may not sum to totals because of rounding. SOURCE: U.S. Department of Education, National Center for Education Statistics, 2004 National Postsecondary Student Aid Study (NPSAS:04) Field Test.
4.2 Institutional Data Sources
4.2.1 Enrollment List Acquisition and Quality
On the basis of prior NPSAS studies, many of the challenges inherent in obtaining and processing student lists were anticipated. Among these challenges were the following:
• obtaining lists in a timely manner;
• ensuring appropriate formatting and accuracy of lists;
• performing sample unduplication when duplicated hardcopy lists were provided; and
• verifying students’ educational level against the data provided by their institutions.
Other considerations for the field test were the feasibility of using e-mail and upload functions via the NPSAS website, and the viability of obtaining contact information on the student lists in order to facilitate location of sample members. These topics are discussed in the appropriate sections below.
Student List Acquisition. To facilitate improved participation in the field test, institutions received a binder of information and were contacted by telephone in the fall of 2002. This process encouraged those institutions with early participation agreements to send lists early in 2003. Table 39 shows the flow of student list receipt by institutional calendar system and month. As a result of the early contact process, about one-half of the lists arrived during the first 3 months of the year.

Chapter 4: Evaluation of Field Operations and Data Quality
65 NPSAS:04 Field Test Methodology Report
Table 39. Enrollment list receipt, by institutional calendar system and month: 2003 All institutions Semester/trimester Quarter Continuous/other
Month Number received Percent
Number received Percent
Number received Percent
Number received Percent
All months 173 100.0 134 100.0 8 100.0 31 100.0January 18 10.4 17 12.7 0 0.0 1 3.2February 50 28.9 47 35.1 0 0.0 3 9.7March 24 13.9 23 17.2 0 0.0 1 3.2April 41 23.7 22 16.4 4 50.0 15 48.4May 11 6.4 8 6.0 1 12.5 2 6.5June 7 4.0 2 1.5 0 0.0 5 16.1July 12 6.9 7 5.2 3 37.5 2 6.5August 10 5.8 8 6.0 0 0.0 2 6.5
NOTE: All statistics are based on eligible institutions that provided enrollment lists. Percentages are based on the “all months” total for all institutions. Detail may not sum to totals because of rounding. SOURCE: U.S. Department of Education, National Center for Education Statistics, 2004 National Postsecondary Student Aid Study (NPSAS:04) Field Test.
Ultimately, 173 of the 195 eligible institutions in the NPSAS:04 field test sample provided student lists (see discussion in section 3.1.1). As noted earlier, 10 of the 195 eligible institutions explicitly refused to take part in the study—two by the Chief Administrator upon first contact by NPSAS staff, and eight by Institutional Coordinators (ICs) despite an agreement to participate by the Chief Administrator. Lists were not obtained within an 8-month time frame from about 6 percent of the 185 eligible institutions that had previously agreed to participate. Many institutions sent the lists on or before the negotiated deadline. However, obtaining the lists at some institutions required many prompting calls after the institutions missed several deadlines. Likely some delay problems will always exist because study requirements compete with other duties for institutional staff members’ time. Where it was deemed necessary, reimbursement was offered for institutional costs related to list compilation.
Appropriate Format and Accuracy of Lists. Institutions were encouraged to send their student lists as electronic files, but hardcopy lists were accepted if that was the institution’s preference. Four options existed for sending the lists:
• electronic mail (e-mail);
• upload;
• diskette or CD-ROM; and
• hardcopy.
The preferred format for enrollment lists specifies unduplicated lists or electronic lists, which are much more easily processed and unduplicated when necessary. Of the 173 institutions sending lists (as shown previously in table 6), 78 did so by e-mail, 82 were uploaded to the NPSAS website, and four were by diskette. Five percent of institutions provided lists in hardcopy format, of which five were a single unduplicated list, and four were multiple paper lists that required unduplication by the contractor. That is, 95 percent of the lists provided met the preferred formats. Sometimes institutional staff found it easier to provide printed lists than to provide an electronic file in the appropriate format. Despite the formatting problems, any reasonable list provision was preferred to no list and was accepted.

Chapter 4: Evaluation of Field Operations and Data Quality
NPSAS:04 Field Test Methodology Report 66
To facilitate cooperation and list accuracy, institutions received instructions for preparing electronic or hardcopy lists. The electronic list instructions requested certain data elements for the enrollment list, including contact information. While some institutions followed the instructions, many did not. Electronic lists received included files with a different layout than specified, a Dbase IV file, and a text file with multiple lines per student. While these files were more difficult to process, they were still preferable to hardcopy lists.
Some of the accuracy and formatting problems experienced with the lists provided by the 173 institutions are shown in table 40. The table does not provide a comprehensive list of all formatting issues encountered, but provides a solid overview. Table 40. Types of list problems encountered, by institutional sampling stratum: 2003
Type of list problems
Institution sampling stratum
Institutions providing
lists None
Un-readable
file/list
File sent too
early
Count(s) out of
bounds
Insufficient documen-
tation
Cannot identify student
strata Multiple1
All institutions 173 46 2 1 92 3 14 15 Public
Less-than-2-year 2 2 0 0 0 0 0 0 2-year 59 9 0 1 40 2 5 2 4-year non-doctorate-granting 21 7 0 0 13 0 1 0 4-year doctorate-granting 11 3 0 0 6 0 2 0
Private, not-for-profit 2-year-or-less 5 2 0 0 3 0 0 0 4-year non-doctorate-granting 38 11 1 0 18 1 2 5 4-year doctorate-granting 13 3 0 0 4 0 0 6
Private, for-profit Less-than-2-year 14 5 1 0 4 0 3 1 2-year-or-more 10 4 0 0 4 0 1 1
1 If a list had multiple problems it was recorded as such rather than each separate problem being recorded. SOURCE: U.S. Department of Education, National Center for Education Statistics, 2004 National Postsecondary Student Aid Study (NPSAS:04) Field Test.
Institutions that sent lists via e-mail did not appear to have difficulty sending the lists, although many sent lists to the general National Study of Faculty and Students (NSoFaS) e-mail address rather than to the NSoFaS list e-mail address. Institutions that sent the file via the upload feature were required to provide the contact information and specified data elements. However, those who e-mailed the file frequently excluded this information. Occasionally, institutions responding by e-mail provided the file layout or specified how the layout differed from specifications. E-mailed files were often handled as attachments. Files that were too large to include as attachments were sometimes zipped (i.e., put into a compressed archive file) or split into two files. Other institutions switched to the upload option when they realized the files were too large to e-mail. In addition, institutions with security concerns could choose to upload files.
Many lists exhibited counts that were out of bounds (i.e., list counts were different from IPEDS counts). This outcome resulted from comparisons of the IPEDS counts to the list counts (see section 2.2.3). As noted earlier, IPEDS counts were for fall enrollment rather than for the entire year and were from 2001. Also, the IPEDS counts of full-time, first-time students did not provide a good point of comparison to the counts of FTB students provided by the institutions, as was expected. However, when the NPSAS FTB student count was less than the IPEDS count, it

Chapter 4: Evaluation of Field Operations and Data Quality
67 NPSAS:04 Field Test Methodology Report
sometimes helped identify institutions that did not identify all of their FTB students. Extensive problems with the count checks made it necessary to expand the bounds to those described in section 2.2.3. However, some of the quality control (QC) failures that resulted from out-of-bounds counts were legitimate, usually because students had been excluded from the lists.
Multiplicity on Duplicated Lists. When institutional student sampling lists are formatted in a manner that permits the same student to appear on more than one list, that student has multiple chances of being selected into the sample; thus, the lists need to be unduplicated. Duplication may occur in instances such as separate lists for each institutional term. During the field test, when a single list was supplied in electronic form, unduplication prior to selection was readily accomplished by computer matching on Social Security number and institutional ID.
In contrast, hardcopy lists pose a much more labor-intensive problem of unduplication prior to selection. Consequently, the field test procedures for unduplicating the samples from such lists were carried over from previous NPSAS studies. When an institution sent multiple enrollment lists, samples were selected from each enrollment list, using the appropriate sampling rates. Then, the samples from each list were unduplicated, beginning with the sample from the most recent term (spring 2003). Unduplication then continued through the least recent term (summer or fall 2002).
Multiplicity Across Lists. Institutional student samples were selected on a flow basis and then added to the master sample (which included all student samples already selected.) Even though the individual student samples had been unduplicated within institutions, it was possible to have students who were sampled at more than one institution. To avoid student sample duplication across institutions, each institution’s student sample (that had been unduplicated as described above) was checked against the master sample prior to being added to the master sample. In this manner, students initially included in an institution’s student sample who were already in the master sample were dropped from the institution’s sample and, therefore, not added to the master sample.
Student’s Education Level. Institutions were asked to provide student’s education level and an FTB status indicator on the student list (see section 2.2.3). These data were used to form the student sampling strata (see section 2.1.2). Some institutions followed the instructions and provided education level as specified in the list instructions. However, other institutions did not follow the instructions.
Institutions that did not follow the list instructions can be classified into four groups. First, some institutions did not originally provide student’s education level. Second, some institutions provided education level but did not classify the graduate students into the three categories requested (master’s, doctoral, and other graduate). In this situation, the institution’s website was consulted to determine whether the school offered only one type of graduate program (i.e., only master’s, doctoral, or other graduate programs). Third, other institutions provided codes to designate education level but did not provide sufficient documentation for the codes. Fourth, some institutions did not provide education level but instead provided student’s degree programs or majors, which could be difficult to translate into education levels.

Chapter 4: Evaluation of Field Operations and Data Quality
NPSAS:04 Field Test Methodology Report 68
Contact Information. For the first time in the administration of NPSAS, institutions were asked to provide contact information for the student lists. The contact data were to include local and permanent addresses and phone numbers, as well as campus and permanent e-mail addresses. Nearly all of the lists received included some contact information. However, many institutions provided only one address, phone number, and e-mail address. Frequently, the data labels did not identify whether the information was local or permanent. Few institutions provided such information for all the students on the list. When provided, the data were usually complete, rarely missing items for individuals.
Ineligible Students. About 10 percent of the sampled students were ineligible for the study. The evidence suggests that the primary reason for this high percentage is that about 45 percent of the sample students were selected from either 2-year or less-than-2-year institutions. The percentage of such institutions was high so that the number of FTB students selected would be sufficient for future BPS field tests. Some of these institutions had difficulty identifying ineligible students. The student eligibility criteria (see section 2.1.2) were provided to the institutions, but they sometimes were unclear about which students were indeed eligible.
4.2.2 CADE Completion Rates
Table 41 provides completion rates for key computer-assisted data entry (CADE) data elements overall, and for both the self- and field-CADE respondents. It is not surprising that item-level response differs among data elements, since institutional record-keeping systems vary dramatically. Not all data elements are available at every institution. However, as can be seen from the table, most of the key CADE data elements showed a high percentage of item-level completeness.
Low overall completion rates were observed for marital status, veteran status, and additional phone numbers. This outcome was not surprising because student records frequently lack these items. It was also expected among CADE respondents that higher rates of item-level completeness would be achieved for the financial aid items, because the criteria for student qualification as a respondent included the condition that the first financial aid question be completed.
Overall, field data collectors obtained high completion rates. This result was probably due to the emphasis on the importance of obtaining complete CADE data in field data collection training. The data collectors were trained to seek out records that may not be readily available; while at the institution, they are focused solely on student files, resulting in the most complete CADE data available. Institutional staff completing CADE may not have the resources to seek these alternative sources for data and are burdened with job duties in addition to CADE record abstraction, which may explain the variability in item completion rates for web abstraction.

Chapter 4: Evaluation of Field Operations and Data Quality
69 NPSAS:04 Field Test Methodology Report
Table 41. Comparison of NPSAS:04 field test CADE data element completion rates, by method of abstraction: 2003
Method of abstraction Total Self Field
Data element Count Percent Count Percent Count Percent Total CADE respondents 1,200 100.0 1,000 100.0 110 100.0 Student characteristics
Gender 1,100 99.7 1,000 99.8 110 99.1 Marital status 660 57.6 590 57.0 70 62.8 Citizenship 1,100 95.7 990 95.4 110 98.2 Veteran status 760 66.2 660 63.8 100 88.5 High school completion type1 930 90.8 820 89.9 110 98.2 Race 1,000 90.9 940 90.7 110 92.9 Hispanic status 960 83.3 850 82.1 110 94.7 At least one phone number 1,100 97.3 1,000 97.2 110 98.2 At least two phone numbers 320 27.5 280 26.9 40 32.7
Enrollment Type of degree program 1,100 98.8 1,000 98.8 110 98.2 Master’s, doctorate, or first-professional degree
program2 120 89.7 120 91.0 0 0.0 Student class level 1,100 91.6 950 91.1 110 95.6 Tuition jurisdiction classification 1,100 97.1 1,000 96.8 110 100.0 Total tuition amount 1,100 95.4 990 95.2 110 97.3
Financial aid Any aid received (Y/N) 1,200 100.0 1,000 100.0 110 100.0 Federal aid received (Y/N) 1,200 100.0 1,000 100.0 110 100.0 State aid received (Y/N) 1,200 100.0 1,000 100.0 110 100.0 Undergraduate aid received (Y/N) 1,200 100.0 1,000 100.0 110 100.0 Graduate aid received (Y/N)3 140 100.0 130 100.0 # 100.0 Other aid received (Y/N) 1,200 100.0 1,000 100.0 110 100.0 Total financial aid amount 1,200 100.0 1,000 100.0 110 100.0 Expected family contribution (EFC) amount4 740 99.5 670 90.1 70 100.0
# Rounds to zero. 1 High school completion type was only applicable to 1,000 undergraduates of the 1,200 CADE respondents. Of the 1,000 to whom the item applied, 910 were self CADE and the remainder were field CADE. 2 Master’s, doctorate, and first-professional degree program was only applicable to 140 graduate/first-professional students of the 1,200 CADE respondents. Of the 140 to whom the item applied, 130 were self CADE and the remainder were field CADE. 3 Graduate aid received was only applicable to 140 graduate/first-professional students of the 1,200 CADE respondents. Of the 140 to whom the item applied, 130 were self CADE and the remainder were field CADE. 4 EFC amount was only applicable to 750 students for whom the institution said data were available. Of the 750 to whom the item applied, 680 were self CADE and 70 were field CADE. NOTE: Detail my not sum to totals because of rounding. CADE = computer-assisted data entry. SOURCE: U.S. Department of Education, National Center for Education Statistics, 2004 National Postsecondary Student Aid Study (NPSAS:04) Field Test.

Chapter 4: Evaluation of Field Operations and Data Quality
NPSAS:04 Field Test Methodology Report 70
4.2.3 CADE Record Verification
Verification and any needed correction for CADE responses (both self and field) were requested of ICs at 75 of the field test institutions.15 The verification form is provided in appendix F. Verification of five CADE data elements was requested for five randomly selected students sampled at each institution. A total of 70 institutions completed CADE verification form (62 self-CADE; 8 field-CADE), providing verification data for 380 students (330 self-CADE; 50 field-CADE).
The five data elements chosen for the self-CADE verification were:
• enrollment status during fall of 2002; • citizenship status; • total tuition charges for 2002–03; • expected family contribution (EFC) for 2002–03; and • total financial aid received for 2002–03.
A student’s enrollment status during fall 2002 was derived based on their attendance status during the institution’s “fall term.”16 Because the CADE data record did not explicitly indicate terms in which this student was not enrolled, a lack of a reference to the fall term was interpreted to mean that the student was not enrolled during fall 2002.
Table 42 shows that, for all five variables, the percent agreement was high for self-CADE institutions (ranging from 89 to 95 percent) and moderate for field-CADE institutions (ranging from 54 to 80 percent) (z = 3.05 to 4.33, all p < 0.01).
Table 42 reveals that agreement rates among the field-CADE cases were somewhat low overall. The low sample size (n = 40 students) makes these results difficult to interpret. However, it should be noted that at two of the eight field-CADE institutions for which a verification form was returned, all of the students had at least one erroneous value flagged by the IC. Each of these errors was in one of the dollar fields (e.g., financial aid received, EFC, or total tuition). This may indicate that specific field data collectors had difficulty obtaining these types of information or may be due to the time at which the data were collected. More complete records were likely available in June than in April/May. The two items, financial aid received and total tuition, often require summation of data from multiple sources at the institutions. These results indicate the need for additional emphasis on the collection of financial data during the full-scale training.
15Of the 77 field test institutions that were originally included in the CADE data collection process, two were excluded from the verification process because these did not provide data files. 16Fall term for the purposes of verification included enrollment either during any term labeled “fall” or in any term that included any of the months from August to December.

Chapter 4: Evaluation of Field Operations and Data Quality
71 NPSAS:04 Field Test Methodology Report
Table 42. CADE verification percentage agreement, by abstraction method: 2003 Abstraction method
Total Self-CADE Field-CADE
CADE item verified Total Percent
agreement Total Percent
agreement Total Percent
agreement Enrollment status, fall term 350 92.8 310 94.7 40 80.0 Citizenship 350 92.8 310 94.7 40 80.0 Total tuition charges 290 77.3 260 80.9 30 54.0 Expected family contribution 330 88.8 300 92.0 30 68.0 Total financial aid received 320 86.1 290 88.6 40 70.0
NOTE: Detail may not sum to totals because of rounding. CADE = computer-assisted data entry. SOURCE: U.S. Department of Education, National Center for Education Statistics, 2004 National Postsecondary Student Aid Study (NPSAS:04) Field Test.
4.3 Instrument Reliability and Usability
4.3.1 Reliability of Student Instrument
Reliability Reinterview Response Rates. A subsample of eligible sample members completing the NPSAS:04 field test interview was selected to participate in a reliability reinterview, containing a subset of items from the initial interview. Students selected for the reinterview were informed of their selection at the end of the initial interview and asked to participate in the subsequent reinterview.
A total of 160 respondents were selected for the reliability reinterview. A summary of the reinterview sample and subsequent participation rates by institution and student type, and by mode of administration are shown in table 43. Due to the built-in delay in administering the reinterview (a delay of approximately 3–4 weeks from the initial interview) and the need to complete reinterviews during the same time frame as the field test interview, those selected for reinterview were more likely to be those sampled and interviewed early during the field test data collection period. Such individuals were those most easily located and convinced to participate in the initial interview.

NPSA
S:04 Field Test Methodology R
eport 72
Chapter 4: Evaluation of Field O
perations and Data Q
uality
Table 43. Reliability reinterview response, by institution and student type: 2003
Selected for reinterview Participated in reinterview
Overall Web CATI Overall Web CATI Institutional characteristic and student type Number Percent Number Percent Number Percent Number Percent Number Percent Number Percent
Total 160 100.0 80 100.0 80 100.0 100 67.1 40 50.6 60 84.2Institutional level
2-year 50 32.9 20 20.3 40 46.1 40 68.6 10 37.5 30 82.94-year 100 67.1 60 79.7 40 53.9 70 66.3 30 54.0 40 85.4
Institutional control Public 100 61.3 40 54.4 50 68.4 70 68.4 20 41.9 50 90.4Private, not-for-profit 50 34.8 30 39.2 20 30.3 40 64.8 20 58.1 20 73.9Private, for-profit 10 3.9 10 6.3 # 1.3 # 66.7 # 80.0 0 0.0
Student type FTB student 60 38.7 30 40.5 30 36.8 40 61.7 10 43.8 20 82.1Other undergraduate 80 49.0 40 46.8 40 51.3 50 67.1 20 51.4 30 82.1Graduate/first-professional 20 12.3 10 12.7 10 11.8 20 84.2 10 70.0 10 100.0
# Rounds to zero. NOTE: Detail may not sum to totals because of rounding. SOURCE: U.S. Department of Education, National Center for Education Statistics, 2004 National Postsecondary Student Aid Study (NPSAS:04).

Chapter 4: Evaluation of Field Operations and Data Quality
73 NPSAS:04 Field Test Methodology Report
Of those selected for reinterview, 67 percent completed the second interview overall. Reinterviews were obtained from 84 percent of computer-assisted telephone interviewing (CATI) respondents and 51 percent of web respondents. Comparison between groups is difficult due to the small cell sizes. Graduate students across all levels had a high level of reinterview participation. Based on the results of the analyses, CATI follow-up with respondents was successful in obtaining a high number of reinterviews, although many web respondents also completed the reinterview.
Reliability Reinterview Results. The results of the reliability reinterview analysis are presented in table 44 by interview section. Results by individual items are discussed below. The relational statistics provided serve as an indicator of association, with 1.00 indicating that the original response and those on the reinterview matched for all respondents.
Only two items in the enrollment section were included in the reliability reinterview. The first item concerned the type of measurement used to calculate the respondent’s grade point average, and this item had a 96 percent rate of agreement. No relational statistic was calculated for this item because nearly all of the respondents to the reliability reinterview provided the same response. The other enrollment item asked respondents to indicate the type of high school they attended. No disparities existed between answers on the field test interview and the reinterview for this item.
By contrast, items in the financial aid section varied considerably. The percentage of agreement was high, ranging from 100 percent to 78 percent. However, the relational statistics for this series of items were not as strong. Nine of the financial aid items included in the reinterview had relational statistics that were moderate to very high, ranging from 0.69 to 1.00. Several items had low-moderate to low relational statistics due to a restriction of range.17 One item that asked respondents to indicate the amount of financial aid received from a private organization had a relational statistic of 0.35 with 90 percent agreement. The relational statistic was low because 4 of the 79 respondents showed large discrepancies in the amount of aid received between interviews. These four had indicated receiving no aid in one interview and provided an amount in the other interview ranging from $250 to $10,000.
The reliability of items chosen from the employment section was strong overall. Three items were included from this section, with the percent agreement ranging from 71 to 81. However, relational statistics were moderate for earnings in 2002 (0.76), and moderately high for parent income (0.85). The item asking if respondents were expected to work had a low relational statistic of 0.56, but had an 81 percent agreement. As was the case with several other items on the reliability reinterview, this item had a restriction of range.
The reliability reinterview included 12 items focused on education experience. The reliability of items in this section were moderate to high for most items. Generally, the items with low relational statistics exhibited a moderate to high percentage of agreement (62 to 93 percent). Many of these items with low relational statistics concerned the level of participation in various education-related activities. Three of the items referred specifically to interaction with
17This relational statistic appears to be deflated due to little variation across valid response categories (e.g., restriction of range). As a result, minor changes in the distribution of responses between the initial interview and reinterview tend to lower the relational statistic.

Chapter 4: Evaluation of Field Operations and Data Quality
NPSAS:04 Field Test Methodology Report 74
faculty and advisors. Based on the distribution of responses, the change in response was not due to a problem with the item, but perhaps resulted from a decrease in the interaction respondents were having with academic staff as the semester progressed. Table 44. Reliability indices for items on the reinterview, by interview section: 2003
Variable label Number of
cases1Percent
agreement2 Relational
statisticEnrollment
GPA measured on 4.00 scale 100 96.0 † Type of high school attended 100 100.0 1.00 3
Financial aid Receive financial aid 100 92.3 0.82 3 Receive employer aid – NPSAS 100 96.2 0.82 3 Amount of employer aid – NPSAS 70 97.2 0.93 4 Receive aid from private organization – NPSAS 100 92.3 0.73 3 Amount of private aid – NPSAS 80 89.9 0.35 4 Receive aid from veteran’s benefits – NPSAS 100 100.0 1.00 3 Amount of veteran’s benefits – NPSAS 60 98.4 1.00 4 Receive alternative loan – NPSAS 100 95.2 0.64 4/6
Parents pay housing expenses 50 77.8 0.71 5 Tuition paid by: parents 70 86.6 0.73 3 Tuition paid by: own money 70 85.1 0.69 3 Tuition paid by: financial aid 70 88.1 0.62 3 Tuition paid by: other 70 92.5 0.51 3/6
Employment Expected to have job to pay for school 30 80.8 0.56 3/6
Earnings in 2002 80 70.5 0.76 5 Parent’s income in 2002 50 79.6 0.85 5
Education experiences Classes taught by graduate students 20 90.5 0.82 5 Have large lecture classes 40 67.6 0.62 5 Have to write essay answers 40 75.7 0.68 5 Have to write papers 40 78.4 0.75 5 Talk with faculty outside class 30 65.5 0.40 5 Meet advisor about academic plans 30 75.9 0.70 5 Informal meeting with faculty 30 69.0 0.51 5 Attend study groups 30 62.1 0.46 5 Participate in school clubs 30 82.8 0.71 3 Attend fine arts activities 30 88.9 0.75 5 Participate in sports 30 82.8 0.63 5 Distance education courses 100 93.3 0.67 3,6
Background State of legal residence 100 99.0 0.99 5 Distance from NPSAS school to home 100 99.0 0.98 4 Number of people supported by parents 50 81.6 0.71 4 Ever attend school outside the United States 100 99.0 0.95 3
† Not applicable. No statistics were computed because the reinterview responses had less than two non-missing levels. 1 Analyses were conducted only for respondents with responses on both the initial interview and the reinterview; not all questions were applicable to all respondents. 2 This percentage reflects an exact match of the paired responses. 3 The relational statistic presented is Kendall’s tau b. 4 The relational statistic presented is Cramer’s V. 5 Pearson’s product-moment correlation coefficient r was used. 6 This relational statistic appears to be deflated due to little variation across valid response categories. As a result, minor changes in the distribution of responses between the initial interview and reinterview tend to lower the relational statistic. NOTE: Detail may not sum to totals because of rounding. SOURCE: U.S. Department of Education, National Center for Education Statistics, 2004 National Postsecondary Student Aid Study (NPSAS:04) Field Test.

Chapter 4: Evaluation of Field Operations and Data Quality
75 NPSAS:04 Field Test Methodology Report
Items in the background section were reliable, with the percent agreements ranging from 82 to 99 and relational statistics from 0.71 to 0.99. One itemnumber of people supported by parentshad percent agreement of 82 and a relational statistic of 0.71, because 10 percent of those included in the analysis originally indicated their parents supported no one. They later changed their responses in the reinterview. Respondents may have misunderstood this item because it asked them to include themselves in the count. For the full-scale study, this term will be emphasized further to prevent recurrence of this problem.
4.3.2 Coding Systems
The NPSAS:04 instrument included tools that allowed computer-assisted online coding of text responses for the major field of study, occupation, and industry. Online coding systems were used to improve data quality by obtaining both a code and a text string for such items, rather than subsequently attempting to code only text strings after the completion of data collection. The primary purpose of the coding system analysis was to assess the effectiveness of the coding system for the improvement of data quality.
The major field of study, occupation, and industry codings used a drop-down menu that was specific to each topic. For major field of study, the respondents were asked to code their general major field of study; for those fields where further options were available, they were also asked to indicate a specific subfield. The decision was made to require both a general and specific area (where applicable) for major field of study in order to ease the burden on respondents. The list of unique major fields of study was extensive. By creating general fields with corresponding specific fields, the respondent was not required to scroll down long lists. Occupation and industry coding required only that the respondent choose one code and examples were provided to assist the respondent/interviewer in the coding process.
The coding analysis was conducted on a random sample of 10 percent of the data for each set of coding results. Expert coders evaluated the verbatim strings for completeness and for the appropriateness of the assigned codes, determining whether a different code should have been assigned or if a string was too vague to code.
Table 45 provides the results of the coding analyses. Overall, the coding results for major field of study and occupation were similar between modes of data collection, indicating that expert coders agreed with self-administered respondent coding at about the same rate as they agreed with interviewer-administered interview coding (x2 = 4.06, p > 0.05). The quality of the text strings was high, with only 15 to 17 percent of text strings too vague to be coded. The results between modes for industry coding showed a statistically significant difference. Expert coders agreed with interviewer-administered coding at a higher rate than with self-administered respondent coding (x2 = 7.17, p < 0.05). It also appears that industry coding was the easiest for respondents/interviewers to use, while occupation proved more difficult. Self-administered respondent coding was successful in coding 65 percent of industry strings gathered, but 42 percent of occupational coding strings (z = 3.02, p < 0.01). The same pattern was seen for interviewer-administered coding, which successfully coded almost 81 percent of industry strings but about one-half (48 percent) of occupation strings (z = 6.61, p < 0.01).

Chapter 4: Evaluation of Field Operations and Data Quality
NPSAS:04 Field Test Methodology Report 76
Table 45. Summary of recode results, by respondent type: 2003 Self-administered Interviewer-administered
Type of coding
Coding attempts sampled
Percent original code
correct
Percent text string too vague to
code
Coding attempts sampled
Percent original code
correct
Percent text string too vague to
code Total 315 50.8 15.2 686 55.5 16.8 Major field of study 103 55.3 25.2 198 51.0 31.8 Occupation 152 42.1 10.5 348 48.0 11.5 Industry 60 65.0 10.0 140 80.7 8.6
SOURCE: U.S. Department of Education, National Center for Education Statistics, 2004 National Postsecondary Student Aid Study (NPSAS:04) Field Test.
4.3.3 Help Text Usage
To help respondents and telephone interviewers complete interviews, help text was made available for every screen of the instrument. This information was considered useful for self-administered respondents because it provided detailed information on the intent of the item, clarification of response options, and some examples. The provision of help text was also useful to interviewers who needed quick access to additional information in order to expedite the interview process for respondents. Counters helped determine the number of times each help text screen was accessed, making it possible to identify screens that were confusing to interviewers or respondents, as well as giving an overall summary of sections of the interview that may have been more problematic for the respondents. Please note that a screen could contain text for several related interview items or for just a single item.
Overall, the usage of help text was low. Of the 253 screens in the student instrument, only four had help-text access rates of 10 percent or more. Table 46 summarizes help text usage for these items overall, and by interview item and mode. Although small sample sizes prevented a statistical comparison by mode of administration, interviewers may have been more likely to use help text for all but one item presented. It should be noted that interviewers were trained to use help text, whereas self-administered respondents may have forgotten it was available.
Table 46. Number of help text accesses, by mode and interview item: 2003 Percent
Item Variable label TotalSelf-
administered Interviewer-
administeredQ13 Mainly taking undergraduate or graduate classes 11.1 4.8 14.7Q15 Type of associate’s degree 20.3 10.0 23.3Q365 Type of industry 10.5 2.7 14.4Q453–455 GRE score: verbal, math, analytic 57.7 100.0 0.0NOTE: GRE = Graduate Record Exam. SOURCE: U.S. Department of Education, National Center for Education Statistics, 2004 National Postsecondary Student Aid Study (NPSAS:04) Field Test.
Q13: This item asked “During the 2002-2003 school year, have you been taking mainly undergraduate or graduate classes at [NPSAS institution]?” The help text accesses for this form were made primarily by telephone interviewers rather self-administered respondents.
Q15: This item asked respondents to indicate the type of associate’s degree they were working on. Again, the rate of help text usage was high for interviewer-administered

Chapter 4: Evaluation of Field Operations and Data Quality
77 NPSAS:04 Field Test Methodology Report
respondents, but 10 percent of self-administered respondents also accessed help text for this item. The response options only differentiated between Art/Science and Occupational/Technical types of degrees; therefore, respondents may have been unsure of which category applied to their degree.
Q365: This item, asking respondents to indicate the type of industry in which they were working while enrolled during the 2002–03 school year, had nearly an 11 percent overall help text usage rate. Respondents were required to respond with a text string for their industry of employment. This item immediately followed the item requesting respondent occupation. The high overall rate of help text usage was most likely because interviewers and self-administered respondents were unclear about the distinction between the two terms.
Q453–455: This screen contained three items asking respondents to indicate their Graduate Record Exam (GRE) verbal, math, and analytic scores. All help text accesses were made by self-administered respondents for this item. This screen provided ranges for the three types of GRE scores, indicating the recently adjusted scoring system for the analytic section (range 0–6). This may account for the high rate of help text usage by self-administered respondents. If they took the GRE prior to this new scoring system, the help text may have been reviewed to determine how to provide the requested information. Telephone interviewers may have been less likely to use help text since this issue was covered in training.
4.4 Item Nonresponse
All respondents were provided the option to decline to answer any item. In previous rounds of the NPSAS study, interviewers were provided with one of two options for this purpose: “don’t know” and “refused.” In the NPSAS:04 field test, the “don’t know” response was available only for key items and was only provided as a follow-up option when the screen was initially left blank (see section 4.4.2 for a more detailed description of this type of item conversion). There was no “refusal” option in the NPSAS:04 field testonly item nonresponse for all other items.
Nonresponses to interview questions were most common for items considered sensitive by respondents, while “don’t know” responses may have resulted from a number of potential circumstances. The most obvious reason a respondent will offer a “don’t know” response is that the answer is truly unknown or is in some way inappropriate for the respondent. “Don’t know” responses may also be evoked when question wording is not understood by the respondent (with no explanation by the interviewer), or when the respondent hesitates to provide a “best guess” response (with insufficient prompting from the interviewer). “Don’t know” responses and item nonresponse need to be reduced to the greatest extent possible. They introduce indeterminacies in the data, and must be resolved by imputation or dealt with during subsequent analysis.
4.4.1 Item-Level Nonresponse
The item-level nonresponse analysis for the NPSAS:04 field test focused only on the number of missing responses to instrument items (i.e., respondents proceeded with the interview without providing a response). Overall item-level nonresponse rates were low, with only 12 items of approximately 620 that contained more than 10 percent missing data. These items are

Chapter 4: Evaluation of Field Operations and Data Quality
NPSAS:04 Field Test Methodology Report 78
shown in table 47 and are grouped by interview section. Item nonresponse rates were calculated based on the number of sample members for whom the item was applicable and asked. Table 47. NPSAS:04 field test interview overall item nonresponse, by section: 2003 Interview section and variable name Label
Number administered to
Percentmissing
Enrollment N4GPAEST Estimate of major GPA 160 17.0
Financial aid N4TAXCRD Use educational tax credit 490 20.8N4RNTAMT Amount rent/mortgage per month 150 55.3N4UGLN Amount borrowed for undergraduate loans 810 11.7N4UGOWE Amount owed for undergraduate education 810 12.4
Employment N4EARNT Time frame for institution year earnings 560 12.4N4EARNS Time frame for institution year earnings other than years 550 13.9N4CONTRB Amount parents expect student to contribute to expenses 120 25.0N4INCS02 Spouse’s earnings in 2002 220 16.3
Background N4DADOC Father’s current occupation 250 10.7N4DADOCD Father’s occupation code 250 16.2N4MAIN Main limiting condition 60 19.6
NOTE: Detail may not sum to totals because of rounding. GPA = grade point average. SOURCE: U.S. Department of Education, National Center for Education Statistics, 2004 National Postsecondary Student Aid Study (NPSAS:04) Field Test.
Many respondents were reluctant to answer items that could be deemed sensitive, such as personal information and family finances. Seven of the items listed in table 47 focused on earnings, monthly expenses, and loan burden. Another sensitive item with a high amount of missing data concerned the main limiting disability of the respondent. Three items that were not sensitive in nature resulted in a nonresponse rate higher than 10 percent. For instance, the item concerning education tax credit usage also had a considerable amount of missing data. However, this result likely is attributable to respondents’ unfamiliarity with tax laws. Finally, two items pertaining to the occupation of the respondent’s father were problematic for respondents. Eleven percent of respondents to whom the item was administered did not provide this information, and 16 percent did not provide an occupational code.
It is important to understand which items, if any, are difficult for self-administered respondents to understand because they do not have the additional assistance of a trained interviewer while completing the interview. Therefore, in addition to the overall analysis, item-level nonresponse was determined on the basis of mode of interview completion, the results of which are presented in table 48.

Chapter 4: Evaluation of Field Operations and Data Quality
79 NPSAS:04 Field Test Methodology Report
Table 48. NPSAS:04 field test interview item-level nonresponse, by mode of interview completion and interview section: 2003
Interview section and variable name Label
Number administered to
Percent missing
Self-administered respondents (n = 283)
Enrollment N4GPAEST Estimate of major GPA 20 14.3
Financial aid N4TAXCRD Use educational tax credit 160 34.6N4RNTAMT Amount rent/mortgage 40 74.4N4UGLN Amount borrowed for undergraduate loans 280 10.1N4UGOWE Amount owed for undergraduate education 280 10.1
Employment N4EARNS Time frame for institution year earnings other than years 190 11.2N4INCS02 Spouse’s earnings in 2002 80 11.3N4CONTRB Amount parents expect to contribute to expenses 30 11.8
Background N4SIBCOL Number of siblings in college 130 23.1N4CARE2 Child enrolled in private institution 40 14.3N4DADOCD Father’s occupation code 80 13.6
Interviewer-administered respondents (n = 541)
Enrollment N4GPAEST Estimate of major GPA 140 17.4N4EXPNP Highest level of education expected: NPSAS 490 10.6
Financial aid 0 N4TAXCRD Use educational tax credit 330 14.3N4HOPE Parents used Hope scholarship 170 10.8N4RNTAMT Amount rent/mortgage 110 48.6N4UGLN Amount borrowed for undergraduate loans 530 12.6N4UGOWE Amount owed for undergraduate education 540 13.6
Employment N4EARNT Time frame for institution year earnings 370 14.1N4EARNS Time frame for institution year earnings other than years 370 15.3N4INCS02 Spouse’s earnings in 2002 140 19.2N4CONTRB Amount parents expect to contribute to expenses 90 29.4
Background N4DAGE02 Age of dependent child 2 110 12.8N4CARE1 Child enrolled in daycare 150 21.5N4CARE2 Child enrolled in private institution 110 28.6N4DADOC Father’s current occupation 170 13.4N4DADOCD Father’s occupation code 170 17.4N4MAIN Main limiting condition 40 23.3
NOTE: Detail may not sum to totals because of rounding GPA = grade point average. SOURCE: U.S. Department of Education, National Center for Education Statistics, 2004 National Postsecondary Student Aid Study (NPSAS:04) Field Test.
Only ten items had rates of nonresponse higher than 10 percent among self-administered respondents. Of these, only one was unique to those completing the survey online. This item asked respondents to indicate the number of siblings who were attending college and had 23 percent missing data. It could be possible that this item was confusing to web respondents and additional help text is necessary for the full-scale study.
Seventeen items had 10 percent or higher nonresponse rates from interviewer-administered respondents. As was the case with self-administered respondents, many of these items were the same ones indicated in the overall item-level nonresponse analysis. Six items

Chapter 4: Evaluation of Field Operations and Data Quality
NPSAS:04 Field Test Methodology Report 80
were unique to the CATI-respondent analysis, however. One was an additional enrollment item asking respondents to indicate the highest level of education they planned on completing at the NPSAS institution, while three items pertained to dependent children, and another to father’s occupation. Another item was an additional item related to tax deductions.
Based on these findings, items will be modified for the full-scale study. These modifications may include changes to question wording and the addition of help text to assist respondents. However, many of the items found to have high nonresponse rates are those that are sensitive in nature, and which have been problematic in past surveys.
4.4.2 Critical Item Conversion
As noted earlier, NPSAS:04 is the first cycle to provide the option for self-administration of the student instrument. To obtain the most complete data from all respondents, it was necessary to modify the student instrument to prompt self-administered respondents to answer items deemed critical to the study. These items focused on enrollment status and dates, the employment history of the respondent, and parent income. However, it should be noted that since a single instrument was used for both self-administration and CATI, the conversion text appeared regardless of mode of administration.
If a respondent did not answer one of the six items (i.e., left the item blank and hit the continue button), the item screen was reloaded with two additions: added text emphasizing the importance of the item and a “don’t know” option added to some items’ response options. The intent was to encourage respondents to provide an answer to the item and to discern the reason for leaving the item blank originally (e.g., refusal or did not know the answer).
The results of the use of critical item conversion text are presented in table 49. Overall, few respondents failed to provide responses for these key items. For five of the six items for which conversion text was used, presentation of conversion text ranged from only 6 to 14 respondents of the 820 respondents. The results indicated that the use of this text was successful in obtaining additional valid responses. Between 70 and 100 percent of respondents provided valid responses on all items. Table 49. Conversion rates for critical items: 2003
Variable Cases viewing conversion text
Cases subsequently providing a valid
response1 Percent of
conversionStudent status at NPSAS 10 10 100.0NPSAS enrollment by month2 10 10 100.0Date first began NPSAS2 10 10 70.0Date first attended school # # 75.0Number of jobs during NPSAS year 10 10 78.6Parents’ income 20022 150 140 91.0
# Rounds to zero. 1 A valid response was defined as choosing one of the original response options or “don’t know” (when provided). 2 For these items, a “don’t know” response option was added when the screen reloaded, in addition to the text emphasizing the importance of the item. NOTE: Detail may not sum to totals because of rounding. SOURCE: U.S. Department of Education, National Center for Education Statistics, 2004 National Postsecondary Student Aid Study (NPSAS:04) Field Test.

Chapter 4: Evaluation of Field Operations and Data Quality
81 NPSAS:04 Field Test Methodology Report
4.5 CATI Monitoring and Quality Assurance
4.5.1 Question Delivery and Data Entry Error Rates
Monitoring of telephone data collection leads to better interviewing and better quality survey data, as well as improvements in costs and efficiency in telephone facilities. Monitoring in the NPSAS:04 field test helped to meet these important quality objectives:
• identification of problem items; • reduction in the number of interviewer errors; • improvement in interviewer performance by reinforcing good interviewer behavior; and • assessment of the quality of the data being collected.
Monitors listened to interviews as they were in progress. For each question they evaluated two aspects of the interviewer-respondent interchange: whether the interviewer delivered the question correctly and whether the interviewer keyed the appropriate response. Each of these measures was quantified, and daily, weekly, and cumulative reports were produced for the study’s Integrated Management System (IMS). During the data collection period, 2,459 items were monitored. The majority of the monitoring was conducted during the first half of data collection. Toward the end of data collection, monitoring efforts were scaled back due to the lighter caseload being worked by telephone interviewers, the greater experience of the interviewers, and the satisfaction by project staff that the process was in appropriate control. Figure 7 shows error rates for question delivery; figure 8 shows error rates for data entry. During data collection, the error rates were monitored to ensure that they were within the upper and lower control limits for these measures.18
Throughout the monitoring period, error rates remained within acceptable limits. Among the 2,459 items observed, there were 54 total CATI question delivery errors and 28 total data entry errors. This outcome resulted in overall error rates of less than 2.5 percent for both question delivery (2.2 percent) and data entry (1.1 percent).
18 The upper and lower control limits were defined by three times the standard error (SE) of the cumulative proportion of errors to the number of questions observed for the period (+3 * SE for the upper limit; –3 * SE for the lower limit). These values represent the upper and lower boundaries of expected normal range of statistical variation for the data during the observation period.

Chapter 4: Evaluation of Field Operations and Data Quality
NPSAS:04 Field Test Methodology Report 82
Figure 7. Monitoring error rates for CATI question delivery: 2003
0123456789
10
1 2 3 4 5 6 7 8 9 10Time (in weeks)
Error rate (in percent)
SOURCE: U.S. Department of Education, National Center for Education Statistics, 2004 National Postsecondary Student Aid Study (NPSAS:04) Field Test.
Figure 8. Monitoring error rates for CATI data entry: 2003
0
12
34
5
6
7
89
10
1 2 3 4 5 6 7 8 9 10
Time (in weeks)
Error rate (in percent)
SOURCE: U.S. Department of Education, National Center for Education Statistics, 2004 National Postsecondary Student Aid Study (NPSAS:04) Field Test.

Chapter 4: Evaluation of Field Operations and Data Quality
83 NPSAS:04 Field Test Methodology Report
4.5.2 Quality Circle Meetings
Quality circle meetings were vital to the field test. The purpose of the field test was to test all procedures and identify areas for improvement; therefore, regular and detailed feedback from those most familiar with the instrument—telephone interviewers—was crucial to the process. During these regularly scheduled meetings, interviewers, supervisors, and project technical staff met to discuss issues relevant to locating respondents and conducting CATI interviews in the most effective manner. These meetings proved to be a good tool for communication, as they provided a forum to discuss many elements of the CATI instrument. Telephone interviewers attended the quality circle meetings on a rotating basis to ensure representation of various experiences, opinions, and challenges faced. Summaries of discussions and decisions were distributed to all telephone interviewers and supervisors in a newsletter. An electronic copy of this newsletter was sent to project staff not in attendance, so those who did not attend the meeting could also benefit. Table 50 provides a summary of these meetings. Table 50. Quality circle meeting summary: 2003
Description of activities Number of meetings Six Attendees Project technical staff
Telephone supervisors Telephone interviewers
Issues addressed Clarification of item responses and interpretation of meanings
Additions to and/or revisions of CATI items and response options Changes to help text and procedures Submission of problem sheets and notification of supervisors Reminders to focus on coding and accuracy Stressing the importance of providing detailed case comments General morale boosting and reinforcement of positive interviewing techniques
NOTE: CATI= computer-assisted telephone interviewing. SOURCE: U.S. Department of Education, National Center for Education Statistics, 2004 National Postsecondary Student Aid Study (NPSAS:04) Field Test.
Quality circle meetings addressed the concerns of project staff regarding the survey instrument and were critical in providing prompt solutions to problems encountered by interviewers. Throughout the duration of the survey, a variety of issues were addressed at the quality circle meetings. Some of the issues covered in quality circle meetings included the following:
• Clarification of item responses and interpretation of meanings. Misinterpretation of questions was addressed consistently.
• Changes to the instrument. Minor modifications to the instrument that were made after interviewer training were explained and demonstrated. This process ensured that interviewers were aware of the changes and could work with them effectively.

Chapter 4: Evaluation of Field Operations and Data Quality
NPSAS:04 Field Test Methodology Report 84
• Help screens. Interviewers were reminded of the help text feature. The help text screens provided additional explanation to allow interviewers to verify the intent of questions, as well as definitions of unfamiliar terms. Any changes to help text were also discussed.
• Problem sheets. Issues identified on problem sheets and proper documentation procedures were also discussed. Problem sheets were used to convey a variety of information regarding the interview, including data corrections, case anomalies, and areas of confusion.
Quality circle meetings helped to refine interviewer skills and gave project staff feedback that was influential in making the survey clear for respondents and interviewers alike. Interviewers were reminded to focus on coding and accuracy. Overall, the quality circle meetings were used to help project staff and programmers refine the instrument, to ensure that the most accurate information was obtained during data collection, and to provide reinforcement of positive interviewing techniques.
4.6 File Preparation
4.6.1 Overview of the NPSAS:04 Field Test Files
The field test data files for NPSAS:04 contain a number of component data files from a variety of sources. Included are student-level data collected from student interviews and government financial aid databases, as well as institution-level data collected from institutional records. The following files were produced at the end of the field test:
• Student data file. Contains student interview data collected from approximately 820 respondents. Topics include background, enrollment history, education, employment, and financial aid.
• CADE data file. Contains raw data collected from institutional records for the approximately 1,150 sample members whose institutions completed CADE.
• CPS 2002–03 data file. Contains data received from the Central Processing System (CPS)19 for the approximately 770 sample members who matched to the 2002–03 federal aid application files.
• NSLDS file. Contains raw loan-level data received from the National Student Loan Data System (NSLDS) for the nearly 660 sample members who received loans. This is a history file with separate records for each transaction in the loan files and, therefore, there can be multiple records per case spanning several academic years.
• Pell data file. Contains raw grant-level data received from the NSLDS for the approximately 480 sample members who received Pell Grants during the 2002–03
19 The Central Processing System is a database run by the U.S. Department of Education and contains FAFSA (Free Application for Federal Student Aid) data for all students who applied for federal aid. See chapter 2 for a more detailed summary.

Chapter 4: Evaluation of Field Operations and Data Quality
85 NPSAS:04 Field Test Methodology Report
year or prior years. This is a history file with separate records for each transaction in the Pell system, and therefore, there can be multiple records per case.
4.6.2 Online Coding and Editing
As noted in section 2.2.4, the NPSAS:04 field test study had a single student data collection system for both self-administered and CATI interviews: a web-based instrument. The web instrument included online coding systems used for the collection of industry, occupation, and major field of study data. The instrument also included a coding module used to obtain information for all postsecondary institutions that the student attended during the NPSAS year, in addition to the institution from which they were sampled (i.e., all institutions attended besides the NPSAS institution required coding). Below is a description of the coding systems included in the NPSAS:04 field test student web instrument.
NPSAS Student Interview Coding Systems
• Major field of study was entered as a text string. The interviewer or sample member was then asked to choose from a list where major fields of study were listed by general subject matter. Based on the general area of study selected, a more specific major subject area listing was displayed, thereby capturing both a general and specific category.
• Occupation was recorded as a text string for those students who were employed. Respondents were also asked to provide a general description of their job activities. Based on the respondent’s occupational title and job description, the interviewer or sample member then selected a general occupational category. A list of job titles within each general occupational category was displayed onscreen to aid in the coding process. Once a general occupational category was selected, a more specific category was chosen. Examples were provided in order to assist in the coding process.
• Respondent’s industry (if the student was employed) was entered as a text string. Based on the industry text string, a category was selected. For each industry, examples of different industries within that category were displayed onscreen to aid in the coding process.
• All postsecondary institutions other than the NPSAS institution in which the student had been enrolled during the 2002–03 institution year were selected from a list, based on the respondent’s report or the interviewer’s entry of the city and state in which the institution was located. Upon selection, the name of the institution, as well as selected IPEDS variables (institutional level, control) were inserted into the database.
Range and Consistency Checks
CADE and the web-based student instrument both included edit checks to ensure that data collected were within valid ranges. Examples of some of the general online edit checks include the following:
• Range checks were applied to all numerical entries such that only valid numeric responses could be entered.

Chapter 4: Evaluation of Field Operations and Data Quality
NPSAS:04 Field Test Methodology Report 86
• A consistency check was triggered when a respondent provided a valid answer and also checked a “none of the above” option. Respondents and interviewers were advised to uncheck other options before checking the “none of the above” option.
• Consistency checks were also used for cross-item comparisons. For example, if a respondent indicated that they were 23 years of age but graduated from high school in 1988, they were asked to verify this information.
• Enrollment dates were checked to verify they were within the field test study period (July 1, 2002 – June 30, 2003).
• Data collected from CPS were preloaded into CADE for data checking purposes, but were not shown to be filled on the screen. If a user entered something different from data received from CPS, a warning pop-up box would appear, allowing the user to keep what was entered or to accept what was loaded from the CPS. Examples of these items are date of birth and citizenship status.
4.6.3 Post-Data-Collection Editing
The NPSAS:04 field test data were edited using procedures developed and implemented for previous studies sponsored by the National Center for Education Statistics (NCES). These procedures were tested again during the field test in preparation for the full-scale study.
Following data collection, the information collected in both CADE and the student instrument was subjected to various QC checks and examinations. These checks were to confirm that the collected data reflected appropriate skip patterns. Another evaluation examined all variables with missing data and substituted specific values to indicate the reason for the missing data. A variety of explanations are possible for missing data. For example, an item may not have been applicable to certain students, a respondent may not have known the answer to the question, or a respondent may have just skipped the item entirely. Table 51 lists the set of consistency codes used to assist analysts in understanding the nature of missing data associated with NPSAS data elements. Table 51. Description of missing data codes: 2003 Missing data code Description –3 Not applicable –6 Out of range –7 Item was not reached (partial interviews) –8 Item was not reached due to an error –9 Data missing, reason unknown
SOURCE: U.S. Department of Education, National Center for Education Statistics, 2004 National Postsecondary Student Aid Study (NPSAS:04) Field Test.
Skip-pattern relationships in the database were examined by methodically running cross-tabulations between gate items and their associated nested items. In many instances, gate-nest relationships had multiple levels within the instrument. That is, items nested within a gate question may themselves have been gate items for additional items. Therefore, validating the gate-nest relationships often required several iterations and many multiway cross-tabulations to ensure the proper data were captured.
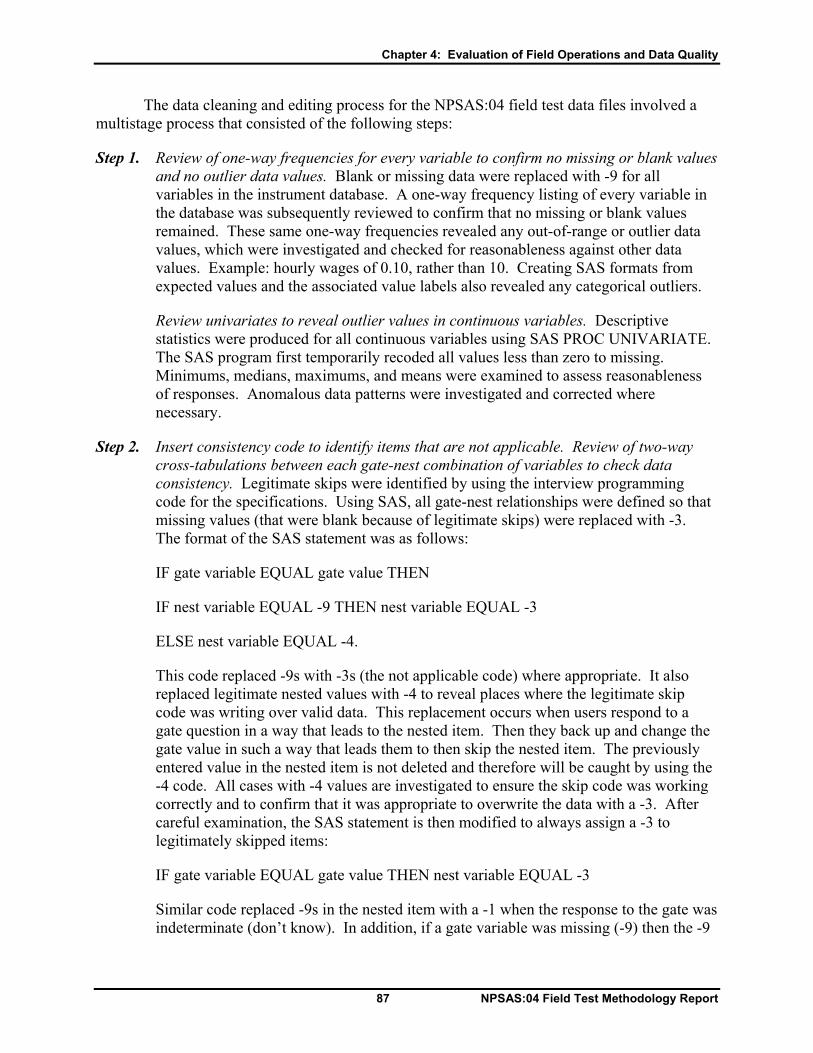
Chapter 4: Evaluation of Field Operations and Data Quality
87 NPSAS:04 Field Test Methodology Report
The data cleaning and editing process for the NPSAS:04 field test data files involved a multistage process that consisted of the following steps:
Step 1. Review of one-way frequencies for every variable to confirm no missing or blank values and no outlier data values. Blank or missing data were replaced with -9 for all variables in the instrument database. A one-way frequency listing of every variable in the database was subsequently reviewed to confirm that no missing or blank values remained. These same one-way frequencies revealed any out-of-range or outlier data values, which were investigated and checked for reasonableness against other data values. Example: hourly wages of 0.10, rather than 10. Creating SAS formats from expected values and the associated value labels also revealed any categorical outliers.
Review univariates to reveal outlier values in continuous variables. Descriptive statistics were produced for all continuous variables using SAS PROC UNIVARIATE. The SAS program first temporarily recoded all values less than zero to missing. Minimums, medians, maximums, and means were examined to assess reasonableness of responses. Anomalous data patterns were investigated and corrected where necessary.
Step 2. Insert consistency code to identify items that are not applicable. Review of two-way cross-tabulations between each gate-nest combination of variables to check data consistency. Legitimate skips were identified by using the interview programming code for the specifications. Using SAS, all gate-nest relationships were defined so that missing values (that were blank because of legitimate skips) were replaced with -3. The format of the SAS statement was as follows:
IF gate variable EQUAL gate value THEN
IF nest variable EQUAL -9 THEN nest variable EQUAL -3
ELSE nest variable EQUAL -4.
This code replaced -9s with -3s (the not applicable code) where appropriate. It also replaced legitimate nested values with -4 to reveal places where the legitimate skip code was writing over valid data. This replacement occurs when users respond to a gate question in a way that leads to the nested item. Then they back up and change the gate value in such a way that leads them to then skip the nested item. The previously entered value in the nested item is not deleted and therefore will be caught by using the -4 code. All cases with -4 values are investigated to ensure the skip code was working correctly and to confirm that it was appropriate to overwrite the data with a -3. After careful examination, the SAS statement is then modified to always assign a -3 to legitimately skipped items:
IF gate variable EQUAL gate value THEN nest variable EQUAL -3
Similar code replaced -9s in the nested item with a -1 when the response to the gate was indeterminate (don’t know). In addition, if a gate variable was missing (-9) then the -9

Chapter 4: Evaluation of Field Operations and Data Quality
NPSAS:04 Field Test Methodology Report 88
was carried through the nested items in such a way that the nested items in this case will never be -3.
Two-way cross-tabulations between each gate-nest combination revealed both numbers of nonreplaced -9 codes and the inserted -3 codes for legitimate skips. These cross-tabulations were investigated to ensure skip-pattern integrity and to verify that no skip logic was missed.
Step 3. Apply general edits.
Step 3a. Standardization. Standard variable recoding and formatting (e.g., formatting dates as YYYYMM) and standardizing units of time (where an item collected amount of time in a variety of units) were performed during this step.
Step 3b. Logical imputations. Logical imputations were implemented during this step if values were assigned to variables (i.e., “missing”) for which values could have been implicitly determined (in other words were appropriately skipped in the instrument). For instance, if respondents indicated that they were not disabled in any manner, they were not presented with detailed disability questions. Following data collection, the values for the detailed disability questions were imputed to “no” rather than remaining a -3.
Step 3c. Coding. During this stage previously uncodable values (e.g., text strings) collected in the various coding systems were upcoded, if possible. During the student interview if a user entered a postsecondary institution or occupation that was not found in the coding system, it was flagged as uncodable. On a flow basis throughout data collection, expert coders attempted to assign values. This type of coding occurred for all four coded items: postsecondary institutions, major field of study, industry, and occupation.
Step 3d. Merging to additional databases. Another step at this stage involved merging to external databases used as part of the online coding systems. During the interview, postsecondary institutions were coded for all respondents who had enrolled in formal degree programs during the NPSAS year using the IPEDS database. During the interview, the institution name, location, and identification code were coded. Subsequent to the interview, these files were merged by the institution code to pick up additional information, including level, control, and so forth, for delivery with the NPSAS:04 student data.
Step 4. Identify and specially code items that were not administered due to a partial student interview. This code replaced -9 and -3 values with -7 (item not administered) based on the section completion indicators. The -7 code allowed analysts to easily distinguish items not administered from items that were either skipped or simply left blank (i.e., implicit refusal or “don’t know”).

Chapter 4: Evaluation of Field Operations and Data Quality
89 NPSAS:04 Field Test Methodology Report
Step 5. Identify out-of-range or outlier values. One-way frequency distributions for all categorical variables and descriptive statistics for all continuous variables were examined. Out-of-range or outlier values were either replaced with a -6 (out of range) or recoded to a more reasonable value, and the data file indicated when such edits were implemented. For example, if a respondent gave an income of more than $500,000, then that income variable was set to $500,000, which was determined to be the most reasonable maximum amount allowed.
Step 6. Final check of data. One-way frequencies on all categorical variables were regenerated and examined. Variables with high counts of -9 were investigated. However, because self-administered web respondents could skip over most items without providing an answer, -9s did remain a valid value, especially for sensitive items, such as financial questions. At this stage, the logical imputations were also confirmed to ensure proper implementation.
Concurrent with the data cleaning process, detailed documentation was developed to describe question text, response options, logical imputations, recoding, and the “applies to” text for each delivered variable. The documentation information can be found in the student instrument facsimile in appendix C.

Chapter 4: Evaluation of Field Operations and Data Quality
NPSAS:04 Field Test Methodology Report 90
This page is intentionally blank.

91 NPSAS:04 Field Test Methodology Report
Chapter 5 Planned Changes for the
NPSAS:04 Full-Scale Study The purpose of the 2004 National Postsecondary Student Aid Study (NPSAS:04) field
test was to test the procedures and methods to be used for the implementation of the full-scale study. For this cycle of NPSAS, the field test was particularly important because of the changes from previous years, which are summarized in chapter 1 of this report. Overall, the changes to the NPSAS:04 field test resulted in greater efficiency, better data quality, and lower burden on both institutional and student respondents. Based on the field test findings discussed in chapters 3 and 4, some procedural and methodological modifications are planned for the full-scale study and are summarized below.
5.1 Full-Scale Student Sample
The full-scale sampling rates will be adjusted upwards to account for ineligibility and nonresponse. This adjustment will be based on the eligibility and response rates from NPSAS:96 and NPSAS:2000, rather than the eligibility and response rates from the NPSAS:04 field test. NPSAS:96 was the last cycle in which first-time beginning (FTB) students were oversampled, that is, the last time that a Beginning Postsecondary Students Longitudinal Study (BPS) cohort was generated from NPSAS data, and NPSAS:2000 eligibility and response rates serve as a useful reference because that was the most recently conducted study. The current field test eligibility and response rates will not be used, because they may not be representative of what will occur in the full-scale study.
It is also critical that the full-scale study achieve a sufficient yield of FTB students for the BPS in 2006 and 2009. As noted in chapter 4, institutions can have difficulty identifying FTB students, resulting in false identifications (e.g., false positives and false negatives). Therefore, the sampling rates for the FTB stratum within each institutional stratum will be increased in the full-scale study, while the sampling rates for the other undergraduate stratum within each institutional stratum will be decreased to account for these false identifications. The modification to the sampling rates will be based on FTB false positive and false negative rates of this field test, as well as on NPSAS:96, the most recent study that generated a BPS cohort.
5.2 Institutional Contacting, List Acquisition, and Student Record Abstraction
The National Study of Faculty and Students (NSoFaS) was the first study to combine institutional contacting efforts between two national postsecondary education studies, NPSAS and the National Study of Postsecondary Faculty (NSOPF). The use of a single Institutional Coordinator (IC) for both studies (for those institutions sampled in both) streamlined the process and eliminated the need to make multiple contacts at the same institution. As noted in chapter 3,
Chapter 5: Recommendations for the NPSAS:04 Full-Scale Study
NPSAS:04 Field Test Methodology Report 92
the fielding of both studies simultaneously did not appear to have a negative impact on the participation rates of institutions for the NPSAS:04 field test. Therefore, the field test approach of using a single IC for both components of NSoFaS will be adopted in the full-scale study.
Several changes will be implemented at the institutional level in the full-scale study to optimize the classification of student type on enrollment lists, and to clarify the understanding of student eligibility rules. These changes include the following:
• Enrollment list instructions and frequently asked questions (FAQs) will be modified. The eligibility criteria will be explained more clearly and additional questions will be added to the FAQs.
• The FTB student definition will also be added to the FAQs to help institutions understand which students qualify as FTB.
• The computer-assisted data entry (CADE) instrument will be modified to incorporate an additional eligibility check. When an institution labels a student ineligible, a secondary window will open requiring that specific reasons for ineligibility be indicated. This modification will allow project staff to followup with an institution if it appears that they have made an error in eligibility determination.
In addition to these changes, the quality control (QC) checks on enrollment lists will be modified for the full-scale study. In the past, the number of students obtained from the Integrated Postsecondary Educational Data System (IPEDS) on the institutional sample files used in QC checks of enrollment lists referred solely to fall enrollment. These IPEDS numbers were then compared to the enrollment list counts (number of records received on an enrollment list). However, the enrollment list counts are for the entire year and were not comparable to the fall enrollment counts. Since IPEDS now contains data on full-year enrollment, these counts will be used for the enrollment list QC checks, rather than the fall enrollment data.
5.3 Use of Incentives
Two experiments were conducted to assess the benefit of offering incentives on the overall response rate for the NPSAS:04 field test. The early response experiment described in chapter 3 compared response rates for three groups—those offered a $10 incentive for completing the student interview via the Web during the first 3 weeks of data collection, those offered a $20 incentive to do the same, and those not offered an incentive. The results indicated that the offering of incentives significantly increased response rates. The nonresponse incentive experiment, compared the response rates of nonrespondents offered a $20 incentive to complete the survey and those offered no incentive. Again, those offered an incentive were more likely to complete the survey. Based on these findings, the use of a $10 incentive is recommended for the full-scale study to encourage early response, and the use of a $20 incentive is recommended for nonresponse conversion.
5.4 Instrumentation
Revisions will be made to the field test on the basis of the examination of the field test results presented in chapters 3 and 4. Modifications to the instrument include the elimination of

Chapter 5: Recommendations for the NPSAS:04 Full-Scale Study
93 NPSAS:04 Field Test Methodology Report
items, changes to question wording, and changing the administration of particular items to a different subset of respondents. Specific changes are described below.
Given the differences in interview time across modes, the goal will be to develop a full-scale interview that averages 25 minutes in length. The logical method for shortening an instrument is to eliminate items. Based on the results of the field test, 19 screens (some containing multiple items) will be recommended for deletion from the NPSAS:04 student interview for the full-scale study. These items were chosen for several reasons, including excessive time to complete a screen and poor data quality (e.g., little variability in responses, low reliability estimates, high level of indeterminate responses). Likewise, some screens were found to collect data of limited analytic value for the intended data users. Other changes include the modification of response options for clarity and the elimination of some items for certain subsets of respondents.
5.5 Tracing and Locating
Overall, the tracing and locating systems customized for the NPSAS:04 field test worked well, efficiently handling the locating information collected for each sample member. Two changes are suggested for the full-scale study to streamline these processes further. First, the initial mailing to sample members will be sent to both the local and permanent addresses provided on enrollment lists, rather than solely the local address (which was the case in the field test). This change should increase the likelihood that sample members will receive the information about the study quickly, thereby increasing the percentage of sample members responding via the web option, and decreasing the amount of time needed to locate sample members. Second, because intensive tracing can be a costly effort, a more stringent set of criteria will be employed when identifying cases to be sent to tracing operations. Cases in institutional sectors that were shown to be hard to locate in the field test will be given priority, as will potential FTB students.
5.6 Interviewer Training
Telephone data collection staff gave favorable reviews about project training. Among the strengths noted were the enthusiasm of the project training team, an increased emphasis on how to answer respondent questions, and a training schedule that allowed time for more individual practice. Some aspects of training will be modified for the full-scale study in response to interviewers’ suggestions for improving the training process. These improvements include developing training examples from actual field test data when preparing the full-scale training materials and simplifying access to the “responses for frequently asked questions” utility available to the help desk and computer-assisted telephone interviewing (CATI) staff.
5.7 CATI Interviewing
Overall, CATI interviewers reported that the locating information for most sample members appeared reasonably complete. Once reached, sample members tended to be receptive to the request for an interview, according to interviewers. The primary difficulty was in initially reaching the “on the go” sample members. To expedite locating of respondents, the CATI front-end module, which directs the interviewer to the number to be dialed, will be modified to provide
Chapter 5: Recommendations for the NPSAS:04 Full-Scale Study
NPSAS:04 Field Test Methodology Report 94
both local and permanent telephone numbers for each sample member until the sample member is located. Interviewers will therefore be able to make calls to multiple telephone numbers more easily than was possible in the field test. Additionally, sample members in institutional sectors with low response rates will be immediately directed to special queues once their information has been loaded into the CATI system. These cases will be routed to the most experienced interviewers. This approach should increase the likelihood of gaining participation from these harder-to-interview sample members.
5.8 Conclusion
The purpose of the NPSAS:04 field test was to fully test all data collection procedures in preparation for the full-scale study. The NPSAS:04 field test introduced a single, web-based student instrument used for multimode data collection. It was important that this instrument function successfully across modes in order to realize data collection efficiencies in the full-scale study, which will involve over 120,000 sample members. The NPSAS:04 instrument was effective for both self-administration and telephone interviewing, and will require relatively few modifications for the full-scale study.
As described in this chapter, there will be minor changes to the student sample, list acquisition, the computer-assisted data entry (CADE) instrument, tracing and locating procedures, help desk operations, CATI interviewer training, and interviewing procedures. The use of incentives is planned to encourage both early response via the Web during the first 3 weeks of data collection and conversion of nonresponse at the end. The use of an incentive is particularly important in the attempt to increase web response rates, which were lower than anticipated in the field test, in order to minimize data collection costs in the full-scale study.
Additionally, it appears that the fielding of NPSAS with NSOPF did not have a negative impact on the successful completion of the study. Institutional contacting flowed smoothly and institutional participation rates were high. It was also a concern that the breaking of the CADE/CATI dependency would significantly impact the quality of data obtained, as well as the ability to locate respondents. In previous cycles of NPSAS, CADE was conducted prior to CATI, with CADE data being preloaded into the CATI system prior to contacting sample members. In NPSAS:04, due to a compressed project schedule, this sequential progression was not possible. Results from the field test indicate that conducting both data collections simultaneously did not have an impact on CATI locating, or on the data collected, as had been previously speculated.

95 NPSAS:04 Field Test Methodology Report
References Berkner, L., Berker, A., Rooney, K., and Peter, K. (2002). Student Financing of Undergraduate
Education: 1999–2000 (NCES 2002–167). U.S. Department of Education. Washington, DC: National Center for Education Statistics.
Cahalan, M., Heuer, R., Fahimi, M., Curry, J., Hinsdale, M., Carley-Baxter, L., Kuhr, B., Curtin, T.R., Jewell, D., Teague, J., and McLean, L. (2004). 2004 National Study of Postsecondary Faculty (NSOPF:04) Field Test Methodology Report (NCES 2004–01). U.S. Department of Education. Washington, DC: National Center for Education Statistics.
Choy, S.P., and Geis, S. (2002). Student Financing of Graduate and First-Professional Education: 1999–2000 Profiles of Students in Selected Degree Programs and Their Use of Assistantships (NCES 2002–166). U.S. Department of Education. Washington, DC: National Center for Education Statistics.
Horn, L., Peter, K., and Rooney, K. (2002). Profile of Undergraduates at U.S. Postsecondary Institutions: 1999–2000 (NCES 2002–168). U.S. Department of Education. Washington, DC: National Center for Education Statistics.

References
NPSAS:04 Field Test Methodology Report 96
This page is intentionally blank.