Embed Size (px)
Citation preview

Working Paper Series
Measuring corruption in the field using
behavioral games
Alex Armand
Nova School of Business and Economics, CEPR, Institute for Fiscal
Studies and NOVAFRICA
Alexander Coutts
Schulich School of Business – York University, and NOVAFRICA
Pedro C. Vicente
Nova School of Business and Economics, NOVAFRICA, and BREAD
Inês Vilela
Royal Holloway – University of London, and NOVAFRICA
ISSN 2183-0843
Working Paper No 2112
September 2021

Any opinions expressed here are those of the author(s) and not those of NOVAFRICA.
Research published in this series may include views on policy, but the center itself takes
no institutional policy positions.
NOVAFRICA is a knowledge center created by the Nova School of Business and
Economics of the Nova University of Lisbon. Its mission is to produce distinctive
expertise on business and economic development in Africa. A particular focus is on
Portuguese-speaking Africa, i.e., Angola, Cape Verde, Guinea-Bissau, Mozambique, and
Sao Tome and Principe. The Center aims to produce knowledge and disseminate it
through research projects, publications, policy advice, seminars, conferences and other
events.
NOVAFRICA Working Papers often represent preliminary work and are circulated to
encourage discussion. Citation of such a paper should account for its provisional
character. A revised version may be available directly from the author.
NOVAFRICA Working Paper
Series
NOVAFRICA | Nova School of Business and Economics - Faculdade de Economia da Universidade Nova de Lisboa
Campus de Carcavelos | Rua da Holanda, Nº 1, 2775-405 Carcavelos – Portugal | T: (+351) 213 801 673 | www.novafrica.org
Measuring corruption in the field using behavioral games*
Alex Armand Alexander Coutts Pedro C. Vicente Ines Vilela
September 2021
Abstract
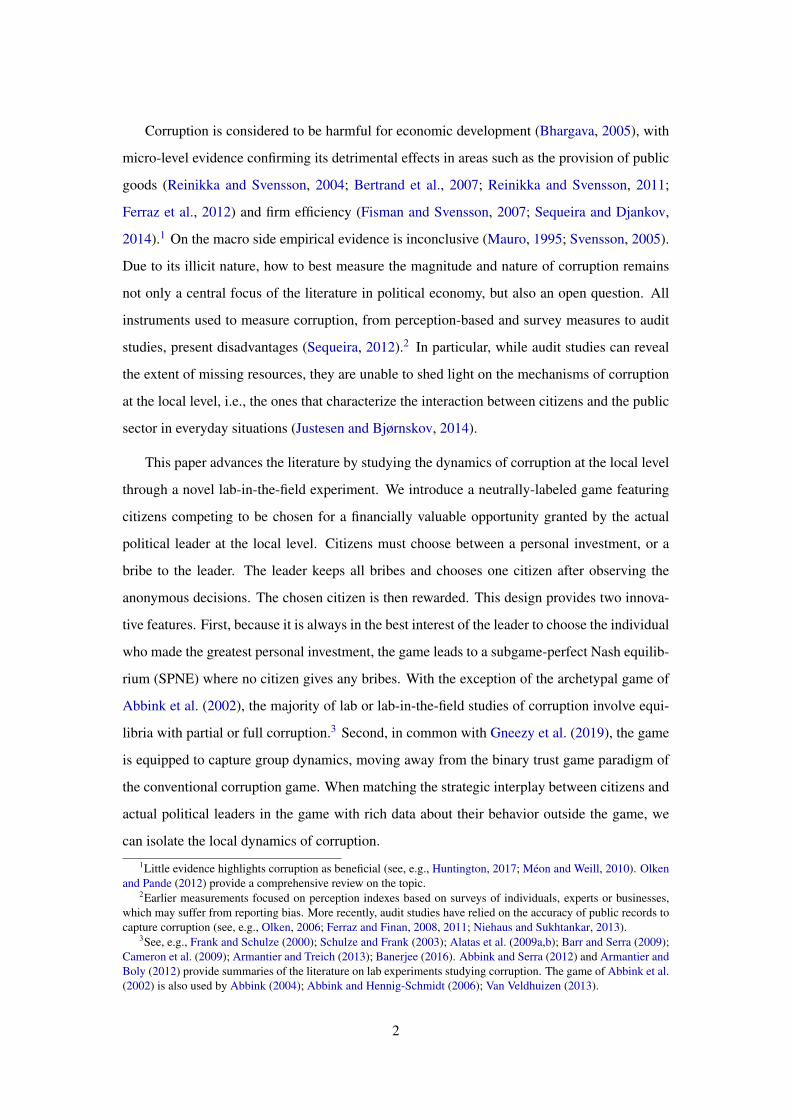
Corruption is often harmful for economic development, yet it is difficult to measure
due to its illicit nature. We propose a novel corruption game to characterize the interaction
between actual political leaders and citizens, and implement it in Northern Mozambique.
Contrary to the game-theoretic prediction, both leaders and citizens engage in corruption.
Importantly, corruption in the game is correlated with real-world corruption by leaders:
citizens send bribes to leaders whom we observe appropriating community money, and
these leaders are likely to reciprocate the bribes. In corrupt behavior, we identify an im-
portant trust dimension captured by a standard trust game. (JEL D10, D70, D72, D73,
C90)
Keywords: Corruption, Game, Trust, Lab-in-the-field, Citizen, Political leader, Incen-
tives, Behavior, Elite capture.
*Armand: Nova School of Business and Economics – Universidade Nova de Lisboa, CEPR, NOVAFRICA,and Institute for Fiscal Studies (e-mail: [email protected]); Coutts: Schulich School of Business – YorkUniversity, and NOVAFRICA (e-mail: [email protected]); Vicente: Nova School of Business and Eco-nomics – Universidade Nova de Lisboa, BREAD, and NOVAFRICA (e-mail: [email protected]); Vilela:Royal Holloway – University of London, and NOVAFRICA (e-mail: [email protected]). We would like tothank conference/seminar participants at the 2019 ESA World Meeting – Simon Fraser University, IMEBESS 2019– Utrecht University, Norwegian School of Economics’s FAIR, and SEEDEC – University of California Berkeleyfor helpful comments and feedback. This project would not be possible without the generous and insightful helpof Imamo Mussa. We also acknowledge fruitful collaborations with our institutional partners, which included theProvincial Government of Cabo Delgado. We are grateful to Henrique Barros, Benedita Carvalho, Ana Costa,Joao Dias, Lucio Raul, Matteo Ruzzante, Alexander Wisse, and a large team of enumerators, who were vital in thesuccessful completion of this project in the field. Ethics approval was secured from Universidade Nova de Lisboa.We wish to acknowledge financial support from 3ie International Initiative for Impact Evaluation (grant numberTW8R2/1008) and the International Growth Centre (grant number 89330).
1
Corruption is considered to be harmful for economic development (Bhargava, 2005), with
micro-level evidence confirming its detrimental effects in areas such as the provision of public
goods (Reinikka and Svensson, 2004; Bertrand et al., 2007; Reinikka and Svensson, 2011;
Ferraz et al., 2012) and firm efficiency (Fisman and Svensson, 2007; Sequeira and Djankov,
2014).1 On the macro side empirical evidence is inconclusive (Mauro, 1995; Svensson, 2005).
Due to its illicit nature, how to best measure the magnitude and nature of corruption remains
not only a central focus of the literature in political economy, but also an open question. All
instruments used to measure corruption, from perception-based and survey measures to audit
studies, present disadvantages (Sequeira, 2012).2 In particular, while audit studies can reveal
the extent of missing resources, they are unable to shed light on the mechanisms of corruption
at the local level, i.e., the ones that characterize the interaction between citizens and the public
sector in everyday situations (Justesen and Bjørnskov, 2014).
This paper advances the literature by studying the dynamics of corruption at the local level
through a novel lab-in-the-field experiment. We introduce a neutrally-labeled game featuring
citizens competing to be chosen for a financially valuable opportunity granted by the actual
political leader at the local level. Citizens must choose between a personal investment, or a
bribe to the leader. The leader keeps all bribes and chooses one citizen after observing the
anonymous decisions. The chosen citizen is then rewarded. This design provides two innova-
tive features. First, because it is always in the best interest of the leader to choose the individual
who made the greatest personal investment, the game leads to a subgame-perfect Nash equilib-
rium (SPNE) where no citizen gives any bribes. With the exception of the archetypal game of
Abbink et al. (2002), the majority of lab or lab-in-the-field studies of corruption involve equi-
libria with partial or full corruption.3 Second, in common with Gneezy et al. (2019), the game
is equipped to capture group dynamics, moving away from the binary trust game paradigm of
the conventional corruption game. When matching the strategic interplay between citizens and
actual political leaders in the game with rich data about their behavior outside the game, we
can isolate the local dynamics of corruption.1Little evidence highlights corruption as beneficial (see, e.g., Huntington, 2017; Meon and Weill, 2010). Olken
and Pande (2012) provide a comprehensive review on the topic.2Earlier measurements focused on perception indexes based on surveys of individuals, experts or businesses,
which may suffer from reporting bias. More recently, audit studies have relied on the accuracy of public records tocapture corruption (see, e.g., Olken, 2006; Ferraz and Finan, 2008, 2011; Niehaus and Sukhtankar, 2013).
3See, e.g., Frank and Schulze (2000); Schulze and Frank (2003); Alatas et al. (2009a,b); Barr and Serra (2009);Cameron et al. (2009); Armantier and Treich (2013); Banerjee (2016). Abbink and Serra (2012) and Armantier andBoly (2012) provide summaries of the literature on lab experiments studying corruption. The game of Abbink et al.(2002) is also used by Abbink (2004); Abbink and Hennig-Schmidt (2006); Van Veldhuizen (2013).
2

We implement our lab-in-the-field experiment with citizens and local political leaders in
206 communities in Northern Mozambique. Mozambique, one of the poorest countries in the
world (UNDP, 2020), is considered as “partly free” in terms of democratic rights (Freedom
House, 2020), and is ranked 149th out of 180 countries on 2020 Transparency International’s
Corruption Perceptions Index. The local leaders (village chiefs or chefes de aldeia) are the
official political representatives of their communities, and they were empowered as part of the
decentralization process implemented in Mozambique in the 1990s (West and Kloeck-Jenson,
1999). Discretionary power, combined with a lack of competitive political forces, present
favorable conditions for corruption to arise, involving rent-seeking and nepotism, and increased
collusion between ordinary villagers and leaders to siphon off government funds (Shleifer and
Vishny, 1993; Veron et al., 2006; Ferraz and Finan, 2011). As decentralization is closely linked
to corruption when accountability is low (Fisman and Gatti, 2002; Fan et al., 2009; Lessmann
and Markwardt, 2010), this setting is particularly relevant for many nations in Sub-Saharan
Africa which have significantly reformed their political structures towards greater autonomy of
local political leaders (Bardhan and Mookherjee, 2006; Ribot and Oyono, 2012).
Despite the stark theoretical predictions of our corruption game, both citizens and leaders
engage in corrupt transactions. Ninety-one percent of citizens send a strictly positive bribe
to the leader, and 39% of leaders do not choose the profit-maximizing choice of selecting the
person with the highest private investment. This results in a significant transfer from citizens to
their leaders: citizens earn about two-thirds of their expected (equilibrium) payoff, but leaders
earn over five times theirs.
We establish a clear link between behavior in the game and corrupt behavior observed
outside of the game by looking at the interaction between citizens and real political leaders in an
incentivized setting. To provide an external measure of corruption, we measure village leaders’
appropriation of funds earmarked for their community using a structured community activity
(Casey et al., 2012). During the game, citizens send significantly more bribes to leaders who
are observed appropriating these funds, providing convincing evidence that the lab-in-the-field
experiment captures real corruption dynamics within these communities. To our knowledge
this is the first attempt to measure the external validity outside of the lab of a corruption game.4
4Barr et al. (2009) relate corrupt behavior in their experiment to the experience of their population of interest,but the focus is on how different treatments alter corrupt behavior within the game, rather than relating it to externalbehavior. Banerjee (2016) intentionally over-pays subjects in a corruption lab game and shows a slight positivecorrelation between failure to report the over-payment and in-game behavior. Related work on the external validityof behavior in the lab includes work on dishonesty (Dai et al., 2018; Hanna and Wang, 2017; List, 2009), and
3

Finally, employing survey questions and a standard trust game played between citizens
and local leaders, we show a strong correlation between trust and behavior in the corruption
game. This is in line with the reciprocal nature of corruption, as an individual pays a bribe
in expectation that the act will be reciprocated (Abbink and Hennig-Schmidt, 2006). While
Gneezy et al. (2019) observe only a minor role for reciprocity, we find that 39% of leaders
go against their self-interest in the corruption game and reciprocate citizens’ bribes. Citizen
giving in the trust game is also predictive of leaders’ observed appropriation. Incentivized trust
games may measure particular forms of financial trust and reciprocity that can enable greater
corruption. Linking trust and corrupt behavior in and outside the lab presents a further novel
contribution of this study.
1 Context and sampling
Corruption is particularly relevant in the presence of natural resource wealth. Together, they
could lead to the natural resource curse and civil conflict (Auty, 1993; Treisman, 2000; Collier
and Hoeffler, 2004; Ross, 2004). These concerns are particularly salient in our context: the
Cabo Delgado province in Mozambique, where one of the largest off-shore reserves of liquefied
natural gas (LNG) in the world was recently discovered (Fruhauf, 2014).
Cabo Delgado is the northernmost province of Mozambique, a low-income country, rank-
ing 7th from the bottom worldwide in terms of GDP per capita (US$1,247, PPP current interna-
tional $, The World Bank, 2017) and on a decreasing trend in terms of voice and accountability
(Freedom House, 2020; UNDP, 2020). Mozambique has had a tumultuous history of conflict
since the 1960s, from its war of independence from Portugal to a civil war. Although the war
formally ended in 1992, violence has resurged in recent years. Cabo Delgado province is pri-
marily rural, with a total of 1.8 million inhabitants, and within the country it ranks lowest in
human development (INE, 2015a).
Like many countries in Sub-Saharan Africa, Mozambique underwent a decentralization
process in the 1990s that resulted in the creation of newly empowered political leaders at the
community level (West and Kloeck-Jenson, 1999). The main authority is to resolve issues of
land disputes, enforce justice, and be consulted before the implementation of rural development
or aid programs in the community. While leaders are in theory tasked with the dual role of rep-
collective action (Kosfeld and Rustagi, 2015).
4

resenting their communities and acting as authority figures for the state, the reality leans much
closer to the latter (Buur and Kyed, 2005). There is no systematic formal democratic process
for electing local leaders in rural villages: the selection must be in accordance with the tradi-
tional rules of the respective community, and the state has the final say over the appointment
(Buur and Kyed, 2005).
Our study involves a representative set of communities in the province, each led by a local
leader. Specifically, we randomly selected 206 communities from the list of all 454 polling
stations in the province, stratified on urban, semi-urban, and rural areas. Of the 206, 169
communities (80%) were located in rural areas. This sample of communities was part of a
larger field experiment on the provision of information about the discovery of natural gas in the
province, with further details provided in Armand et al. (2020).5
Local leaders are clearly-identified in the community, thus we have a total of 206 partici-
pating leaders. In addition, selection of citizens to participate in the study was the product of
physical random walks within the communities. In each house, heads of households were se-
lected to participate. In each community, 10 individuals participated in the games, for a total of
2060 participating citizens. Panel A in Table 1 presents descriptive statistics for both citizens
and leaders. The majority of citizens is male, with an average age of 46 years, with primary
education only (65%), and of Muslim religion (56%). Leaders are predominantly male (98%),
more educated and with more assets relative to citizens, and have been in power on average
for 10 years. In terms of religion, the distribution among leaders is comparable to the one of
citizens.
2 The corruption game
The game encompasses 11 participants, including 10 citizens and the local leader, but it can
be easily adopted for any number of citizens ≥ 2. The game script is provided in Appendix
A. Each citizen receives an endowment of 10 tokens worth 10 Meticais (MT) each, for a total5Different variations of information provision were delivered after randomly allocating communities in three
groups. In a control group, communities did not receive any information module. In a leader treatment group, theinformation module delivered to the leaders only, while in a community treatment group, the information modulewas provided to both the leaders and the local community as a whole. The behavioral measurements presented inSection 2 were conducted after the completion of interventions in Armand et al. (2020), from August to November2017. While interventions were randomized and do not pose a threat to our analysis, we control for treatmentindicators in all specifications including community characteristics as control variables (see Section 3.1). AppendixB.10 presents treatment effects on the outcomes studied in this paper.
5

of 100 MT (US$1.5). The total endowment corresponds to approximately two-thirds of daily
income (INE, 2015b). Each citizen must choose how many tokens to send to the leader (which
we refer to as a bribe), with the remaining units being kept for oneself (which we refer to
as private investment). The leader’s only action is to choose one citizen after observing the
allocation chosen by all of them, without observing their identity.
In terms of payoffs, the leader keeps the bribes from all citizens, independent of which
citizen they chose. Citizens not chosen by the leader keep their private investment. In contrast,
the citizen chosen by the leader receives a bonus of 300 MT (US$4.5), but the entirety of their
private investment accrues to the leader.6
The leader receives all units sent as bribes plus the private investment of the selected citi-
zen. The dominant strategy of the leader is to choose the citizen who made the largest private
investment. This format is analogous to a setting in which the leader is incentivized to select
the most qualified entrepreneur. Knowing the leader’s behavior, citizens’ best responses are to
send no bribes, and allocate their full endowment to their private investment. The simplicity of
the game is intentional to guarantee understanding in contexts with low literacy.
The main theoretical feature of this game, characterized by a subgame-perfect Nash equi-
librium (SPNE) where no citizen gives any bribes, is shared by the game of Abbink et al.
(2002). They present a neutrally-framed lab experiment resembling a modified trust game in
which reciprocation is interpreted as returning the favor from a bribe. Our game is instead
designed to capture group dynamics, while also moving away from the trust game paradigm.
It shares common elements with Gneezy et al. (2019), who study how bribes affect the judg-
ment of individuals with discretionary power. In their experiment, two individuals compete
to be selected by a referee, who, depending on the treatment, can either accept only the bribe
of the individual they choose as the winner, or accept both bribes and choose the winner at
their discretion. Although the latter treatment is similar to our setup, leaders in our game are
incentivized to always choose the lowest bribe, whereas referees in Gneezy et al. (2019) are
financially indifferent, leading to multiple equilibria. Their focus on selfish versus reciprocal
motives in corrupt decisions with anonymous populations is different from, but complementary6Citizens deposited their bribes in small purses, which were brought to a separate enumerator who recorded
them privately on a tablet. A software aggregated the information and the tablet was brought to the leader whowas presented with the options in the form of an anonymous ordered list. When the leader selected an amount thatwas sent by multiple citizens, the software randomly selected one of them for payment. After citizens made theirdecisions, they were also asked for their incentivized belief about the size of the private investment that would bechosen by the leader.
6

to our interest in studying real dynamics among connected individuals.
Our game used neutral terminology, leaving it free of strong norms about socially-appropriate
behaviors.7 We use the terms corrupt behavior and bribes to help elucidate the mapping from
game behavior to real community dynamics. An alternative interpretation of the game is as a
rent-seeking game, where citizens seek to accrue rents from the leader by paying bribes rather
than engaging in a productive activity. This distinction can get blurred, as rent-seeking is
sometimes referred to as a form of corruption (Rose-Ackerman, 1999). Previous experiments
on rent-seeking have typically studied the contest model of Tullock (1980).8 Our game shares
some similarities as citizens compete to be chosen by the leader (Lambsdorff, 2002). However,
rather than an exogenous rule with expenditures monotonically increasing the probability of
earning the fixed prize, it is the leader who has complete autonomy to allocate the prize. While
both rent-seeking and corruption are typically assumed to generate deadweight losses, we ex-
cluded this feature from our design to minimize complexity. Following the results of Abbink
et al. (2002), we hypothesized that deadweight losses would not significantly alter behavior.
While we conducted a one-shot version of the game with our participants, our interest is
not purely with in-game decisions per se, but relates to how these decisions reflect the real dy-
namics between citizens and leaders. Due to the leader’s central authority in their community,
they are involved in many interactions with ordinary citizens. If citizens and leaders view the
game as being similar to real life interactions, they may approach the game with the mentality
that these interactions are repeated (Cardenas and Carpenter, 2005). In repeated interactions
leaders may wish to cultivate a reputation of corruptibility using the language of Ryvkin and
Serra (2012). Leaders are able to increase their long-term earnings through a culture of cor-
ruption, which more than offsets the immediate losses from selecting less productive citizens.
Therefore, in the infinitely repeated version of the game, there are multiple equilibria with cor-
ruption (see Appendix B.1 for a discussion). For example, there exists an equilibrium where
three citizens send maximum bribes of 100 MT each, while all other citizens send zero. As-
suming the leader’s strategy is to reward whomever sends the largest bribe, then each of these
citizens receives an expected payoff of 100 MT, with the non-corrupt citizens also receiving
their private investment of 100 MT. The leader thus earns a per-period payoff of 300 MT. By7Decisions in the game were described literally by either keeping the money or sending it to the leader. We
confirmed during piloting that there were no negative associations with giving tokens to the leader.8In these experiments individuals tend to over-compete relative to the Nash prediction (Sheremeta, 2018). These
games are rarely linked to corruption, and behavior appears to be driven by preferences for winning competitionsor by bounded rationality (Lim et al., 2014).
7

cultivating a reputation of corruption, the leader earns three times the static equilibrium pay-
off, while citizens earn approximately four-fifths of their analogous static expected payoff (120
MT). Total welfare is identical, but the distribution is substantially more unequal in the equilib-
rium with corruption. Relating private investments to productive activities, the citizens being
selected are no longer the most qualified.
2.1 Additional measurements
We supplement information about behavior in the corruption game with additional survey and
behavioral measurements, summarized in this section. Additional information about these mea-
surements can be found in Armand et al. (2020). Panel B in Table 1 presents descriptive statis-
tics for these variables.
Survey measures. We have available survey measures about citizens, leaders, and the
community. These were collected in three separate questionnaires. The household question-
naire was answered by the household head and included questions on the demographic traits
of the respondent and his/her household, trust, public goods provision, assets, exposure to
crime, as well as a Raven’s test to proxy cognitive ability. The leader questionnaire had a
similar structure. The community survey was completed by an individual (or group) which
was knowledgeable about the community. For citizens, the main variables of interest are the
self-reported attitudes in favor of bribes and trust in leaders. For leaders, the main variable of
interest is on their views about whether accountability is supported by community.
Behavioral measurements. We implemented a real-life behavioral measurement of the
leader’s corruption, often classified as a structured community activity (Casey et al., 2012).
We observed whether leaders appropriated funds that had been set aside to cover refreshments
and snacks for their citizens during community meetings. Leaders were privately given 400 MT
(US$6) and asked to purchase refreshments and snacks for the community meetings. Quantities
and types of food items purchased were observed and recorded by enumerators during the
meetings, and the cost of each item was inquired at the nearest store. Of the 400 MT, we
observe actual expenditure by leaders, with the remainder recorded as appropriation. The vast
majority of leaders (80%) appropriated a strictly positive amount of funds, while 14% were
recorded as spending the exact amount.9 Overall, appropriation was 27% on average, with 9%9Six percent of leaders were recorded as spending more than the amount they were given, with a median amount
over-spent of 10%. We re-coded these values as zero. Our results are robust to this transformation.
8
of leaders appropriating the full value.
In addition, we conducted the classic trust game (Berg et al., 1995) between leaders and
citizens. The trust game involved the same participants as in the corruption game. Each citizen
received an endowment of 100 MT in the form of 10 tokens worth 10 MT each. Citizens had
to decide to keep this income for themselves or send a portion to the leader. The funds sent
to the leader were tripled and the leader had to decide how much to give back to the citizens.
For the leader’s decision, we used the strategy method: for every possible positive amount sent
from 1 to 10 tokens (which became 3 to 30), the leader was asked how much he/she would like
to send back. The main variable of interest for citizens is the amount sent, while for leaders
it is the share returned (averaged across the 10 conditional responses).10 The average citizen
gave 4.15 out of 10 tokens, while leaders returned on average 4.66 tokens (37%) when faced
with a citizen who gave 4.15 (becoming 12.45) tokens. Citizens were marginally better off
trusting leaders, receiving an average payoff of 108 MT. Figure B3 shows the distributions of
the amount sent by citizens, and the share returned by the leader. Results are comparable to
average play in trust games worldwide (Johnson and Mislin, 2011).
3 Results
In the corruption game, citizens sent on average 4.22 tokens as bribes to the leader (Panel
B in Table 1). This substantially deviates from the prediction of zero corruption. Compared
to the trust game, which involves similar dynamics and equilibrium predictions but does not
involve competition among participants, citizens send slightly more tokens in the corruption
game. Leaders’ behavior is instead closer to the SPNE prediction: on average, leaders select
a citizen who sent a bribe of 2.6 tokens. Consistent with these behaviors, leaders payoffs are
extremely high (496 MT or US$7.5). In contrast, unlike giving in the trust game, bribery in
the corruption game is a losing proposition. Citizens earned on average 81 MT (US$1.2),
significantly less than their endowment of 100 MT.11 Leaders earn five times their one-shot
theoretically predicted payoff, while citizens earn less than two-thirds of theirs. If we consider
the leader’s maximum equilibrium payoff in case the game were infinitely repeated, the leader10In total, we conducted three behavioral games with citizens: the public goods game, the trust game, and the
corruption game. The order was randomized; results are robust to controlling for order. We do not focus on thepublic goods game because it does not involve the leader.
11Potential payoffs ranged from 0 to 310. Beyond the maximum payoff of the game of 300 MT, a bonus of 10MT could be earned if the citizen had correct beliefs about the leader’s decision. See Appendix A for the scripts.
9
still earns 67% more than the theoretical upper bound of 300 MT.
Figure 1 presents the behavior in the corruption game in more detail by looking at distri-
butions. Denoting the size of the bribe sent by a citizen to the leader as b ∈ [0, 10], just under
9% of citizens send the predicted amount of b = 0 (highlighted by darker shading in Panel A).
In contrast, 30% of leaders chose a citizen who sent b = 0. This underestimates the number
of leaders choosing the SPNE action, as some leaders may not have had the option to choose
it if no citizen sent b = 0. This situation happened in 50% of the communities. In total, 61%
of leaders chose the SPNE action by selecting the minimum bribe available (highlighted by
darker shading in Panel B), while 39% of leaders go against their direct material interest.
Citizens tend to overestimate the likelihood that leaders will choose individuals who send
positive bribes and/or underestimate the extent of bribery by others. To verify this result, we
examine (incentivized) data on beliefs about the level of the bribe the leader would choose. The
vast majority of citizens projected that intermediate levels of tokens would be selected by the
leader: the average belief is 4.6 tokens, similar to the average bribe sent. Only 13% of citizens
selected one of the extremes of 0 or 10.
3.1 Citizens’ and leaders’ behavior inside and outside the lab
Within the game, corruption depends on both citizens’ willingness to engage in corruption by
sending bribes, and leaders’ willingness to engage in and reward corruption. We investigate
how the corresponding in-game decisions are associated with external measures of corruption.
Table 2 presents OLS regressions of the bribe sent by the citizen to the leader (columns (1)–
(3)), and of the bribe chosen by the leader (columns (4)–(6)) on attitudes and behavior gathered
outside the game. We refer to measures of citizens’ attitudes and behavior outside the game as
citizen variables, and to measures of leaders’ attitudes and behavior outside the game as leader
variables.
Columns (1) and (4) present a specification without controls. Columns (2) and (5) add con-
trols for citizens’ and leaders’ characteristics, which include gender, age, education, religion,
ethnicity, household size, marital status and wealth of both citizens, and the leaders’ time in
power. Citizens’ controls also include a measure of cognitive ability proxied by the Raven’s test
score (Raven, 1936). Appendix B.2 shows robustness to the exclusion of this control. Finally,
columns (3) and (6) add controls for community characteristics, which include an infrastructure
10

index, district fixed effects, and indicator variables for the treatment groups studied in Armand
et al. (2020). Results are robust to a wide variety of specifications (Appendix B.3).
We first investigate determinants of citizen bribery in the corruption game. Contrary to
expectations, citizens’ accommodating attitudes toward paying bribes are not associated with
bribery in the game. On the contrary, trust game giving is positively associated with sending
bribes, significant at the 1% level. The magnitude is large: every additional token sent by
citizens to their leaders in the trust game being associated with approximately one-third of an
additional token given in bribes. The same is not true for the survey measure of trust (Section
3.2).12
While focusing on how leaders’ attitudes and behavior outside the game affect citizens’
bribe decisions in the game, we observe three main results. First, citizen bribery in the game is
associated with the extent to which leaders engage in actual corruption. Leaders’ appropriation
of community funds is positive and significantly associated with citizen bribery: citizens send
19% more bribes when leaders appropriate all funds as compared to when leaders do not ap-
propriate any funds.13 This suggests that citizens are, on average, able to perceive how corrupt
their leaders are, and consequently send more bribes to more corrupt leaders. Second, citizen
bribery in the game is associated with trust game behavior of leaders: citizens send signifi-
cantly more bribes to leaders who return more in the trust game, suggesting that expectation
of reciprocation (trustworthiness) is an important factor in bribery decisions. The magnitude
is comparable to the effect of the proportion appropriated. Third, citizens send significantly
fewer bribes to leaders who believe accountability is supported by their community.
Columns (4)–(6) in Table 2 examine how the size of the bribe that the leader selects is as-
sociated with attitudes and behavior measured outside the game. Regarding citizen variables,
neither accommodating attitudes towards bribes, nor trust in leaders are significantly associ-
ated with leaders’ decisions. Regarding instead leader variables, leaders who appropriate more
community funds are also significantly more likely to select citizens giving larger bribes, echo-
ing the earlier results for citizens. Leaders’ reciprocation in the trust game is significantly
associated at the 1% level with the selection of citizens who sent higher bribes: a leader who12Incentivized and survey measures of trust are positively related, but this relationship is only marginally signif-
icant (Appendix B4). Most demographic variables are not significantly related to bribe decisions (Appendices B.2and B.5). An exception is gender: female citizens are more likely to send bribes (significant at the 10% level).
13Conditioning regressions on self-reported leader’s attitudes towards corruption does not alter the results (Ap-pendix B.6).
11

returned half of what they received in the trust game is predicted to choose a citizen who sent
an additional 2 bribe tokens over one who returned nothing. In addition, leaders who are more
likely to agree that accountability is supported by the community are significantly less likely
to select citizens who send bribes. Finally, while the leaders’ choice sets in the corruption
game are restricted by the number of bribes sent by the citizens, restricting the analysis to only
leaders who were not constrained in their choice set leads to similar results and slightly larger
effects (Appendix B.7).
3.2 Who engages in corruption?
To understand who engages in corruption, we analyze whether bribery in the corruption game
arises for all leaders or only for leaders at the extremes of both corrupt behavior and recipro-
cation in the trust game. Figure 2 shows (unconditional) non-linear relationships between citi-
zens’ and leaders’ behavior in the corruption game and leaders’ appropriation outside the game
(Panel A), and between citizens’ and leaders’ behavior in the corruption game and leader’s re-
ciprocation in the trust game (Panel B).14 In terms of appropriation, behavior in the corruption
game by both citizens and leaders is relatively flat in the central part of the distribution, while
it is steeper at the extremes. Bribery in the corruption game tends to be smaller for leaders that
appropriate little, and much larger for leaders that appropriate most of the funds. While the
relationship between bribery by citizens is linear in the leader’s reciprocation in the trust game,
the relationship between the bribe chosen by the leader and its reciprocation is mainly driven
by leaders who return a very large share in the trust game. This reinforces the finding that
high levels of corruption require a robust trustful relationship with citizens. This relationship
can have deep consequences in the communities, as we show that corruption is associated with
higher crime and lower public good provision (Appendix B.8).
These findings highlight a relationship between the leaders’ corrupt behavior and trust re-
ciprocation. While corrupt behavior is widely perceived as harmful for development, trust is
often viewed as enhancing investment and growth (Zak and Knack, 2001). Paradoxically, cor-
rupt acts can require a high degree of reciprocal affect-based trust (Rose-Ackerman, 2001). In
Appendix B.9, we show that citizens’ behavior in the trust game predicts their leaders’ cor-14Significant predictors of the bribe chosen by the leader are the leader’s age (the effect is non-linear, with
initially negative effects on selecting citizens sending higher bribes, turning to positive effects at older ages), leader’seducation (decreasing bribes), and leader’s household size (increasing bribes).
12

ruption. This suggests that trust games may indeed capture a “dark-side” which could enable
corrupt transactions.
By contrast, we do not find any significant association using the self-reported trust in lead-
ers. Behavior in the corruption game is also more robustly associated with leaders’ appropria-
tion as compared with trust game behavior.15 This result is in line with the literature highlight-
ing differences between survey and incentivized measures of trust. Survey measures might be
capturing different dimensions of trust, such as “trustworthiness” or expectations about oth-
ers’ behavior (Glaeser et al., 2000; Sapienza et al., 2013). Sender behavior in the trust game
may also be motivated by other considerations, such as risk-aversion or altruism (Cox, 2004;
Schechter, 2007).
Because behavior in the corruption game relates to the type of leader, we further analyze
whether behavior is reflecting citizens’ private information about their leader, measured by
whether the citizen personally knows the leader, and by whether the leader is an established
leader, measured by the time in power being equal or larger than the sample median of 7
years. Table 3 provides estimates in line with Table 2 restricting the sample according to these
dimensions.
Citizens’ behavior in the trust game significantly predicts behavior in the corruption game
among both connected and non-connected citizens, and for both established and non-established
leaders. However, the leader’s corrupt behavior and reciprocity in the trust game predict bribery
by citizens in the corruption game only among those not connected to their leaders. This sug-
gests that the behavior of citizens is not driven by private information about the leader, but more
likely driven by a desire to gain favors from a leader that they do not know personally. Apart
from real-life leaders’ corruption, we do not observe large differences for citizen’s behavior
according to whether the leader is established or not. More importantly, leader’s behavior in
the corruption game relates to leader’s characteristics outside the game only among established
leaders, reinforcing the role of power of the leader in explaining corrupt behavior inside and
outside the game.16
15Citizens send significantly more in the trust game to leaders that appropriate more outside the game and havemore corrupt attitudes (Appendix Table B9). These associations are diminished by conditioning on behavior in thecorruption game, while they continue to be significant for leaders’ appropriation.
16In our setting, Armand et al. (2020) shows that, when local leaders are empowered by being the sole recipientsin the community of an information campaign about the discovery of natural gas (i.e., the leader treatment), elitecapture is increased. Appendix B.10 shows that, on average, the leader treatment has no effect on the behavior in thecorruption game. Citizens’ behavior is impacted by the leader treatment heterogeneously depending on the powerof the leader. For established leaders, it translates into further bribing in the corruption game, while the opposite is
13

4 Conclusion
This paper introduces a novel corruption game in a setting where citizens play with their actual
political leaders. The game is simple to implement and understand: the SPNE predicts that
there will be no corruption in any one-shot game. However, this prediction is not borne out
in the data. In addition, citizens’ bribery in the game is strongly predicted by their leader’s
corrupt behavior, measured by a behavioral observation of appropriation of community funds.
Turning to leaders’ decisions, leaders who appropriate more community resources are more
likely to reward citizens who send larger bribes. It appears that citizens are correctly able to
anticipate the corrupt behavior of their leaders. Still, we observe a large transfer of wealth from
citizens to their leaders, with leaders earning five-times their equilibrium predicted payoff.
We also record a novel important relationship between trust and corruption, suggesting
that the type of reciprocity measured by the trust game can also enable corruption. This finding
also highlights a clear warning for social scientists using trust games. Because survey measures
of trust are not positively associated with corruption dynamics, diversifying the measurement
of trust can address these concerns. While the literature on trust has typically focused on its
positive benefits, our results suggest that they may also capture corrupt relationships.
Sensitive measures of corrupt behavior by leaders can be captured through simple and
appropriately designed lab-in-the-field games. This is critical for measuring and understanding
corruption dynamics at the local level, particularly in areas with low levels of transparency
and less developed institutions, where traditional survey methods may fundamentally suffer
from reporting bias. While we noted negative associations between corruption and community
outcomes (Appendix B.8), the extent to which such corruption is harmful for local development
remains an important unanswered question.
true for not established leaders. This result is confirmed by established leaders choosing citizens with higher bribesin communities being part of the leader treatment.
14

Figure 1: Bribery in the corruption game
0
.1
.2
.3
Perc
ent
0 2 4 6 8 10Bribe to leader
A. Citizens
0
.1
.2
.3
Perc
ent
0 2 4 6 8 10Bribe of citizen chosen by leader
B. Leaders
Note. Panel A shows the distribution of the number of tokens sent by citizens to the leader as bribe (N = 2052). Panel B showsthe distribution of the number of tokens sent by citizens as bribes restricting to individuals chosen by leaders (N = 206). Theshare choosing the SPNE actions is reported with darker shading. The vertical lines indicate the sample mean (solid line) and themedian (dashed line). Details about the corruption game are provided in Section 2, while the scripts are detailed in Appendix A.1.
Figure 2: Behavior in the corruption game, by leaders’ corrupt behavior and reciprocation
1
2
3
4
5
6
0 .2 .4 .6 .8 1Appropriation
A. Behavior by leader's appropriation
0
2
4
6
8
10
0 .2 .4 .6 .8 1Share returned in trust game
B. Behavior by leader's reciprocation in trust game
Bribe sent by citizen to leader Bribe chosen by the leader
Note. Panel A shows a cubic fit between citizen’s and leader’s behavior in the corruption game and the proportion of communityfunds that is observed as being appropriated by the leader in the incentivized structured community activity (see Section 2.1).Panel B shows a cubic fit between citizen’s and leader’s behavior in the corruption game and the share returned by the leader inthe trust game (Section 2). Bribe sent by citizen to leader is the number of tokens sent by citizens to the leader as bribe in thecorruption game, ranging from from 0 (citizen gave no bribe) to a maximum of 10. Bribe chosen by the leader is the number oftokens sent by the citizen that is chosen by the leader in the corruption game, ranging from 0 (citizen chosen gave no bribe) toa maximum of 10. Details about the game are provided in Section 2. Confidence intervals are built assuming a 90% confidencelevel and assuming standard errors are clustered at the community level. Point and squares are averages of the correspondingvariables computed in equally spaced intervals of the horizontal axis.
15
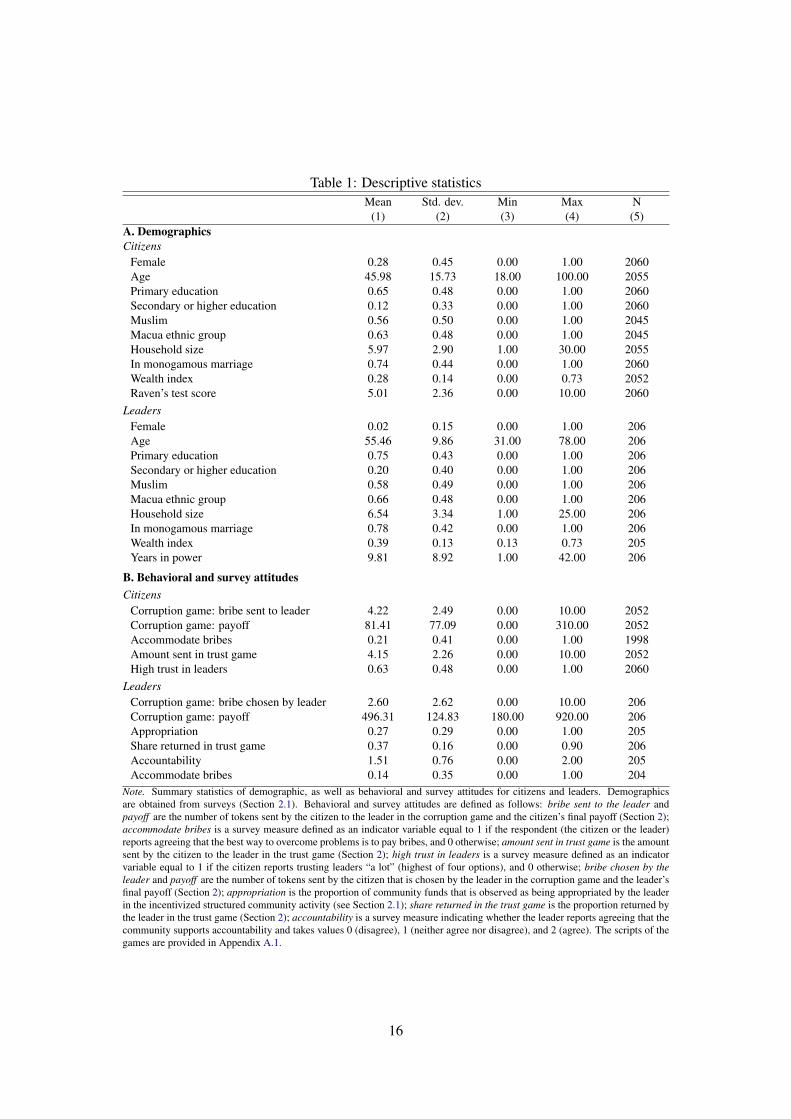
Table 1: Descriptive statisticsMean Std. dev. Min Max N
(1) (2) (3) (4) (5)A. DemographicsCitizens
Female 0.28 0.45 0.00 1.00 2060Age 45.98 15.73 18.00 100.00 2055Primary education 0.65 0.48 0.00 1.00 2060Secondary or higher education 0.12 0.33 0.00 1.00 2060Muslim 0.56 0.50 0.00 1.00 2045Macua ethnic group 0.63 0.48 0.00 1.00 2045Household size 5.97 2.90 1.00 30.00 2055In monogamous marriage 0.74 0.44 0.00 1.00 2060Wealth index 0.28 0.14 0.00 0.73 2052Raven’s test score 5.01 2.36 0.00 10.00 2060
LeadersFemale 0.02 0.15 0.00 1.00 206Age 55.46 9.86 31.00 78.00 206Primary education 0.75 0.43 0.00 1.00 206Secondary or higher education 0.20 0.40 0.00 1.00 206Muslim 0.58 0.49 0.00 1.00 206Macua ethnic group 0.66 0.48 0.00 1.00 206Household size 6.54 3.34 1.00 25.00 206In monogamous marriage 0.78 0.42 0.00 1.00 206Wealth index 0.39 0.13 0.13 0.73 205Years in power 9.81 8.92 1.00 42.00 206
B. Behavioral and survey attitudesCitizens
Corruption game: bribe sent to leader 4.22 2.49 0.00 10.00 2052Corruption game: payoff 81.41 77.09 0.00 310.00 2052Accommodate bribes 0.21 0.41 0.00 1.00 1998Amount sent in trust game 4.15 2.26 0.00 10.00 2052High trust in leaders 0.63 0.48 0.00 1.00 2060
LeadersCorruption game: bribe chosen by leader 2.60 2.62 0.00 10.00 206Corruption game: payoff 496.31 124.83 180.00 920.00 206Appropriation 0.27 0.29 0.00 1.00 205Share returned in trust game 0.37 0.16 0.00 0.90 206Accountability 1.51 0.76 0.00 2.00 205Accommodate bribes 0.14 0.35 0.00 1.00 204
Note. Summary statistics of demographic, as well as behavioral and survey attitudes for citizens and leaders. Demographicsare obtained from surveys (Section 2.1). Behavioral and survey attitudes are defined as follows: bribe sent to the leader andpayoff are the number of tokens sent by the citizen to the leader in the corruption game and the citizen’s final payoff (Section 2);accommodate bribes is a survey measure defined as an indicator variable equal to 1 if the respondent (the citizen or the leader)reports agreeing that the best way to overcome problems is to pay bribes, and 0 otherwise; amount sent in trust game is the amountsent by the citizen to the leader in the trust game (Section 2); high trust in leaders is a survey measure defined as an indicatorvariable equal to 1 if the citizen reports trusting leaders “a lot” (highest of four options), and 0 otherwise; bribe chosen by theleader and payoff are the number of tokens sent by the citizen that is chosen by the leader in the corruption game and the leader’sfinal payoff (Section 2); appropriation is the proportion of community funds that is observed as being appropriated by the leaderin the incentivized structured community activity (see Section 2.1); share returned in the trust game is the proportion returned bythe leader in the trust game (Section 2); accountability is a survey measure indicating whether the leader reports agreeing that thecommunity supports accountability and takes values 0 (disagree), 1 (neither agree nor disagree), and 2 (agree). The scripts of thegames are provided in Appendix A.1.
16

Table 2: Citizen and leader behavior in the corruption gameDependent variable: Bribe ...
sent by citizen to leader chosen by the leader(1) (2) (3) (4) (5) (6)
A. Citizen variables
Accommodate bribes -0.084 -0.054 -0.024 -0.065 -0.042 0.143(0.132) (0.141) (0.134) (0.186) (0.183) (0.172)
Amount sent in trust game 0.330*** 0.327*** 0.316*** 0.052 0.034 0.038(0.032) (0.031) (0.032) (0.044) (0.038) (0.033)
High trust in leaders -0.028 0.040 0.050 -0.167 -0.121 -0.141(0.110) (0.112) (0.114) (0.149) (0.152) (0.130)
B. Leader variables
Appropriation 0.974*** 0.915*** 0.777** 1.144** 1.138** 1.497**(0.276) (0.276) (0.309) (0.547) (0.552) (0.628)
Share returned in trust game 1.075** 0.902** 0.818* 3.478*** 3.900*** 3.779***(0.476) (0.456) (0.465) (1.213) (1.217) (1.188)
Accountability -0.266** -0.279*** -0.265** -0.429** -0.499** -0.585***(0.110) (0.106) (0.102) (0.210) (0.203) (0.203)
Observations 1970 1928 1928 1970 1928 1928R2 0.134 0.157 0.166 0.088 0.178 0.227Citizen and leader controls - Yes Yes - Yes YesCommunity controls - - Yes - - YesLevel of analysis Citizen Citizen Citizen Leader Leader Leader
Note. Results based on OLS regressions. Statistical significance at * 0.1; ** 0.05; *** 0.01. Robust standard errors clustered atcommunity level. Dependent variables are defined by column: (1)–(3) number of tokens sent by citizens to the leader as bribein the corruption game, ranging from from 0 (citizen gave no bribe) to a maximum of 10; (3)–(6) number of tokens sent bythe citizen that is chosen by the leader in the corruption game, ranging from 0 (citizen chosen gave no bribe) to a maximum of10. Details about the game are provided in Section 2. In Panel A, citizen variables refer to independent variables pertaining tocitizen behavior or survey measures and are defined as follows: accommodate bribes is a survey measure defined as an indicatorvariable equal to 1 if the citizen reports agreeing that the best way to overcome problems is to pay bribes, and 0 otherwise; amountsent in trust game is the amount sent by the citizen to the leader in the trust game (Section 2); high trust in leaders is a surveymeasure defined as an indicator variable equal to 1 if the citizen reports trusting leaders “a lot” (highest of four options), and 0otherwise. In Panel B, leader variables refer to independent variables pertaining to leader behavior or survey measures and aredefined as follows: appropriation is the proportion of community funds that is observed as being appropriated by the leader inthe incentivized structured community activity (see Section 2.1); share returned in the trust game is the proportion returned bythe leader in the trust game (Section 2); accountability is a survey measure indicating whether the leader reports agreeing that thecommunity supports accountability and takes values 0 (disagree), 1 (neither agree nor disagree), and 2 (agree). The full list ofcontrols is provided in Section 3.1.
17

Tabl
e3:
Con
nect
edne
ssan
dpo
wer
Dep
ende
ntva
riab
le:
Bri
bese
ntby
citiz
ento
a[..
.]le
ader
Bri
bech
osen
by[..
.]le
ader
Not
conn
ecte
dC
onne
cted
Not
esta
blis
hed
Est
ablis
hed
Not
esta
blis
hed
Est
ablis
hed
(1)
(2)
(3)
(4)
(5)
(6)
A.C
itize
nva
riab
les
Acc
omm
odat
ebr
ibes
-0.2
780.
106
-0.0
100.
164
0.33
5-0
.010
(0.2
22)
(0.1
84)
(0.1
63)
(0.2
30)
(0.2
27)
(0.1
61)
Am
ount
sent
intr
ustg
ame
0.28
5***
0.34
6***
0.24
9***
0.35
3***
-0.0
270.
049
(0.0
53)
(0.0
41)
(0.0
48)
(0.0
48)
(0.0
41)
(0.0
37)
Hig
htr
usti
nle
ader
s0.
037
0.06
30.
022
0.04
4-0
.126
-0.1
02(0
.170
)(0
.144
)(0
.166
)(0
.151
)(0
.182
)(0
.107
)B
.Lea
der
vari
able
s
App
ropr
iatio
n1.
186*
**0.
347
1.47
6***
0.61
22.
143*
1.76
0***
(0.4
06)
(0.3
41)
(0.5
17)
(0.3
78)
(1.1
20)
(0.6
19)
Shar
ere
turn
edin
trus
tgam
e1.
465*
*0.
279
1.37
4*0.
560
1.51
86.
516*
**(0
.632
)(0
.529
)(0
.750
)(0
.764
)(1
.794
)(1
.580
)A
ccou
ntab
ility
-0.2
04-0
.315
***
-0.0
49-0
.189
-0.2
84-0
.765
***
(0.1
35)
(0.1
08)
(0.1
47)
(0.1
33)
(0.3
44)
(0.2
76)
Obs
erva
tions
774
1154
976
952
976
952
R2
0.17
70.
195
0.19
20.
213
0.29
30.
485
Citi
zen
and
lead
erco
ntro
lsY
esY
esY
esY
esY
esY
esC
omm
unity
cont
rols
Yes
Yes
Yes
Yes
Yes
Yes
Lev
elof
anal
ysis
Citi
zen
Citi
zen
Citi
zen
Citi
zen
Lea
der
Lea
der
Not
e.R
esul
tsba
sed
onO
LS
regr
essi
ons.
Stat
istic
alsi
gnifi
canc
eat
*0.
1;**
0.05
;***
0.01
.Rob
usts
tand
ard
erro
rscl
uste
red
atco
mm
unity
leve
l.D
epen
dent
vari
able
sar
ede
fined
byco
lum
n:(1
)–(4
)num
ber
ofto
kens
sent
byci
tizen
sto
the
lead
eras
brib
ein
the
corr
uptio
nga
me,
rang
ing
from
from
0(c
itize
nga
veno
brib
e)to
am
axim
umof
10;(
5)–(
6)nu
mbe
rof
toke
nsse
ntby
the
citiz
enth
atis
chos
enby
the
lead
erin
the
corr
uptio
nga
me,
rang
ing
from
0(c
itize
nch
osen
gave
nobr
ibe)
toa
max
imum
of10
.Col
umn
(1)r
estr
icts
the
sam
ple
toci
tizen
sth
atdo
notp
erso
nally
know
the
lead
er(n
otco
nnec
ted
lead
er),
and
colu
mn
(2)t
oci
tizen
sth
atpe
rson
ally
know
the
loca
llea
der(
conn
ecte
dle
ader
),us
ing
netw
ork
data
amon
gci
tizen
s(s
eeA
rman
det
al.,
2020
ford
etai
ls).
Col
umns
(3)a
nd(5
)res
tric
tthe
sam
ple
tole
ader
sth
atar
eno
test
ablis
hed
(i.e
.in
pow
erfo
rles
sth
an7
year
s,w
hich
corr
espo
nds
toth
esa
mpl
em
edia
n),w
hile
colu
mns
(4)a
nd(6
)res
tric
tthe
sam
ple
tole
ader
sth
atar
ees
tabl
ishe
d.In
Pane
lA,c
itize
nva
riab
les
refe
rto
inde
pend
entv
aria
bles
pert
aini
ngto
citiz
enbe
havi
oror
surv
eym
easu
res
and
are
defin
edas
follo
ws:
acco
mm
odat
ebr
ibes
isa
surv
eym
easu
rede
fined
asan
indi
cato
rvar
iabl
eeq
ualt
o1
ifth
eci
tizen
repo
rts
agre
eing
that
the
best
way
toov
erco
me
prob
lem
sis
topa
ybr
ibes
,and
0ot
herw
ise;
amou
ntse
ntin
trus
tgam
eis
the
amou
ntse
ntby
the
citiz
ento
the
lead
erin
the
trus
tgam
e(S
ectio
n2)
;hig
htr
usti
nle
ader
sis
asu
rvey
mea
sure
defin
edas
anin
dica
torv
aria
ble
equa
lto
1if
the
citiz
enre
port
str
ustin
gle
ader
s“a
lot”
(hig
hest
offo
urop
tions
),an
d0
othe
rwis
e.In
Pane
lB,l
eade
rva
riab
les
refe
rto
inde
pend
entv
aria
bles
pert
aini
ngto
lead
erbe
havi
oror
surv
eym
easu
res
and
are
defin
edas
follo
ws:
appr
opri
atio
nis
the
prop
ortio
nof
com
mun
ityfu
nds
that
isob
serv
edas
bein
gap
prop
riat
edby
the
lead
erin
the
ince
ntiv
ized
stru
ctur
edco
mm
unity
activ
ity(s
eeSe
ctio
n2.
1);s
hare
retu
rned
inth
etr
ustg
ame
isth
epr
opor
tion
retu
rned
byth
ele
ader
inth
etr
ustg
ame
(Sec
tion
2);a
ccou
ntab
ility
isa
surv
eym
easu
rein
dica
ting
whe
ther
the
lead
erre
port
sag
reei
ngth
atth
eco
mm
unity
supp
orts
acco
unta
bilit
yan
dta
kes
valu
es0
(dis
agre
e),1
(nei
ther
agre
eno
rdis
agre
e),a
nd2
(agr
ee).
The
full
listo
fcon
trol
sis
prov
ided
inSe
ctio
n3.
1.
18

References
Abbink, Klaus (2004) “Staff rotation as an anti-corruption policy: An experimental study,”
European Journal of Political Economy, Vol. 20, No. 4, pp. 887–906.
Abbink, Klaus and Heike Hennig-Schmidt (2006) “Neutral versus loaded instructions in a
bribery experiment,” Experimental Economics, Vol. 9, No. 2, pp. 103–121.
Abbink, Klaus, Bernd Irlenbusch, and Elke Renner (2002) “An Experimental Bribery Game,”
Journal of Law, Economics, and Organization, Vol. 18, No. 2, pp. 428–454.
Abbink, Klaus and Danila Serra (2012) “Anticorruption policies: Lessons from the lab,” Re-
search in Experimental Economics, Vol. 15, No. 1, pp. 77–115.
Alatas, Vivi, Lisa Cameron, Ananish Chaudhuri, Nisvan Erkal, and Lata Gangadharan (2009a)
“Subject pool effects in a corruption experiment: A comparison of Indonesian public ser-
vants and Indonesian students,” Experimental Economics, Vol. 12, No. 1, pp. 113–132.
Alatas, Vivi, Lisa Cameron, Nisvan Erkal, Lata Gangadharan, and Ananish Chaudhuri (2009b)
“Gender, culture, and corruption: Insights from an experimental analysis,” Southern Eco-
nomic Journal.
Armand, Alex, Alexander Coutts, Pedro C. Vicente, and Ines Vilela (2020) “Does information
break the political resource curse? Experimental evidence from mozambique,” American
Economic Review, Vol. 110, No. 11, pp. 3431–3453.
Armantier, Olivier and Amadou Boly (2012) “On the external validity of laboratory experi-
ments on corruption,” Research in Experimental Economics, Vol. 15, No. 1, pp. 117–144.
Armantier, Olivier and Nicolas Treich (2013) “Eliciting beliefs: Proper scoring rules, incen-
tives, stakes and hedging,” European Economic Review, Vol. 62, pp. 17–40.
Auty, Richard (1993) Sustaining Development in Mineral Economies: The Resource Curse
Thesis, London: Routledge.
Banerjee, Ritwik (2016) “On the interpretation of bribery in a laboratory corruption game :
moral frames and social norms,” Experimental Economics, Vol. 19, No. 1, pp. 240–267.
Bardhan, Pranab and Dilip Mookherjee (2006) Decentralization and Local Governance in De-
veloping Countries: A Comparative Perspective: The MIT Press.
19

Barr, Abigail, Magnus Lindelow, and Pieter Serneels (2009) “Corruption in public service
delivery: An experimental analysis,” Journal of Economic Behavior and Organization, Vol.
72, No. 1, pp. 225–239.
Barr, Abigail and Danila Serra (2009) “The effects of externalities and framing on bribery in a
petty corruption experiment,” Experimental Economics, Vol. 12, No. 4, pp. 488–503.
Berg, Joyce, John Dickhaut, and Kevin McCabe (1995) “Trust, Reciprocity, and Social His-
tory,” Games and Economic Behavior, Vol. 10, No. 1, pp. 122–142.
Bertrand, Marianne, Simeon Djankov, Rema Hanna, and Sendhil Mullainathan (2007) “Ob-
taining a Driver’s License in India: An Experimental Approach to Studying Corruption,”
Quarterly Journal of Economics, Vol. 122, No. 4, pp. 1639–1676.
Bhargava, Vinay (2005) “The Cancer of Corruption,” World Bank Global Issues Seminar Se-
ries.
Buur, Lars and Helene Maria Kyed (2005) State Recognition of Traditional Authority in
Mozambique. The Nexus of Community Representation and State Assistance, pp.31.
Cameron, Lisa, Ananish Chaudhuri, Nisvan Erkal, and Lata Gangadharan (2009) “Propensities
to engage in and punish corrupt behavior: Experimental evidence from Australia, India,
Indonesia and Singapore,” Journal of Public Economics, Vol. 93, No. 7-8, pp. 843–851.
Cardenas, Juan Camilo and Jeffrey P. Carpenter (2005) “Three themes on field experiments
and economic development,” in John A. List Glenn W. Harrison, Jeffrey Carpenter ed. Field
Experiments in Economics, pp. 71–123.
Casey, Kathrine, Edward Miguel, and Rachel Glennerster (2012) “Reshaping Institutions: Evi-
dence on Aid Impacts using a Preanalysis Plan,” Quarterly Journal of Economics, pp. 1–58.
Collier, Paul and Anke Hoeffler (2004) “Greed and grievance in civil war,” Oxford Economic
Papers, Vol. 56, No. 4, pp. 563–595.
Cox, James C. (2004) “How to identify trust and reciprocity,” Games and Economic Behavior,
Vol. 46, No. 2, pp. 260–281.
Dai, Zhixin, Fabio Galeotti, and Marie Claire Villeval (2018) “Cheating in the Lab Predicts
Fraud in the Field: An Experiment in Public Transportation,” Management Science, Vol. 64,
No. 3, pp. 1081–1100.
20

Fan, C. Simon, Chen Lin, and Daniel Treisman (2009) “Political decentralization and corrup-
tion: Evidence from around the world,” Journal of Public Economics, Vol. 93, No. 1-2, pp.
14–34.
Ferraz, Claudio and Frederico Finan (2008) “Exposing corrupt politicians: The effects of
Brazil’s publicly released audits on electoral outcomes,” Quarterly Journal of Economics,
Vol. 123, No. 2, pp. 703–745.
(2011) “Electoral accountability and corruption: Evidence from the audits of local
governments,” American Economic Review, Vol. 101, No. 4, pp. 1274–1311.
Ferraz, Claudio, Frederico Finan, and Diana B. Moreira (2012) “Corrupting learning. Evidence
from missing federal education funds in Brazil,” Journal of Public Economics, Vol. 96, No.
9-10, pp. 712–726.
Fisman, Raymond and Roberta Gatti (2002) “Decentralization and corruption: evidence across
countries,” Journal of Public Economics, Vol. 83, No. 3, pp. 325–345.
Fisman, Raymond and Jakob Svensson (2007) “Are corruption and taxation really harmful
to growth? Firm level evidence,” Journal of Development Economics, Vol. 83, No. 1, pp.
63–75.
Frank, Bjorn and Gunther G. Schulze (2000) “Does economics make citizens corrupt?,” Jour-
nal of Economic Behavior and Organization.
Freedom House (2020) “Freedom in the World 2020.”
Fruhauf, Anne (2014) Mozambique’s LNG revolution: A political risk outlook for the Rovuma
LNG ventures, No. April, pp.62.
Glaeser, Edward L., David I. Laibson, Jose A. Scheinkman, and Christine L. Soutter (2000)
“Measuring Trust*,” Quarterly Journal of Economics, Vol. 115, No. 3, pp. 811–846.
Gneezy, Uri, Silvia Saccardo, and Roel van Veldhuizen (2019) “Bribery: Behavioral Drivers
of Distorted Decisions,” Journal of the European Economic Association, Vol. 17, No. 3, pp.
917–946.
Hanna, Rema and Shing-yi Wang (2017) “Dishonesty and Selection into Public Service: Evi-
dence from India,” American Economic Journal: Economic Policy, Vol. 9, No. 3, pp. 262–
290.
21

Huntington, Samuel P (2017) “Modernization and corruption,” in Political corruption: Rout-
ledge, pp. 253–266.
INE (2015a) Estatisticas e Indicadores Sociais: Instituto Nacional de Estatıstica, Republica de
Mocambique.
(2015b) Household Budget Survey 2014-2015: Instituto Nacional de Estatıstica.
Johnson, Noel D. and Alexandra A. Mislin (2011) “Trust games: A meta-analysis,” Journal of
Economic Psychology, Vol. 32, No. 5, pp. 865–889.
Justesen, Mogens K. and Christian Bjørnskov (2014) “Exploiting the Poor: Bureaucratic Cor-
ruption and Poverty in Africa,” World Development, Vol. 58, pp. 106–115.
Kosfeld, Michael and Devesh Rustagi (2015) “Leader Punishment and Cooperation in Groups:
Experimental Field Evidence from Commons Management in Ethiopia ,” American Eco-
nomic Review, Vol. 105, No. 2, pp. 747–783.
Lambsdorff, Johann Graf (2002) “Corruption and rent-seeking,” Public Choice, Vol. 113, No.
1, pp. 97–125.
Lessmann, Christian and Gunther Markwardt (2010) “One Size Fits All? Decentralization,
Corruption, and the Monitoring of Bureaucrats,” World Development, Vol. 38, No. 4, pp.
631–646.
Lim, Wooyoung, Alexander Matros, and Theodore L. Turocy (2014) “Bounded rationality and
group size in Tullock contests: Experimental evidence,” Journal of Economic Behavior &
Organization, Vol. 99, pp. 155–167.
List, John (2009) “The economics of open air markets,” NBER Working Paper.
Mauro, P. (1995) “Corruption and Growth,” The Quarterly Journal of Economics.
Meon, Pierre Guillaume and Laurent Weill (2010) “Is Corruption an Efficient Grease?,” World
Development.
Niehaus, Paul and Sandip Sukhtankar (2013) “Corruption dynamics: The golden goose effect,”
American Economic Journal: Economic Policy, Vol. 5, No. 4, pp. 230–269.
22
Olken, Benjamin A. (2006) “Corruption and the costs of redistribution: Micro evidence from
Indonesia,” Journal of Public Economics, Vol. 90, No. 4-5, pp. 853–870.
Olken, Benjamin A. and Rohini Pande (2012) “Corruption in developing countries,” Annual
Review of Economics, Vol. 4, pp. 479–509.
Raven, John Carlyle (1936) “Mental Tests Used in Genetic Studies: The Performance of Re-
lated Individuals on Tests Mainly Educative and Mainly Reproductive,” MSc Thesis, Lon-
don: University of London.
Reinikka, Ritva and Jakob Svensson (2004) “Local capture: Evidence from a central govern-
ment transfer program in Uganda,” Quarterly Journal of Economics, Vol. 119, No. 2, pp.
679–705.
(2011) “The power of information in public services: Evidence from education in
Uganda,” Journal of Public Economics, Vol. 95, No. 7-8, pp. 956–966.
Ribot, Jesse C. and Phil Rene Oyono (2012) “The politics of decentralization,” in Towards a
New Map of Africa: Taylor and Francis, pp. 205–228.
Rose-Ackerman, Susan (1999) “Political corruption and democracy,” Conn. J. Int’l L, Vol. 14,
p. 363.
(2001) “Trust , honesty and corruption: reflection on the state-building process,” Eu-
ropean Journal of Sociology, Vol. 42, No. 3, pp. 526–570.
Ross, Michael L. (2004) “What do we know about natural resources and civil war?,” Journal
of Peace Research, Vol. 41, No. 3, pp. 337–356.
Ryvkin, Dmitry and Danila Serra (2012) “How corruptible are you? Bribery under uncertainty,”
Journal of Economic Behavior and Organization, Vol. 81, No. 2, pp. 466–477.
Sapienza, Paola, Anna Toldra-Simats, and Luigi Zingales (2013) “Understanding trust,” Eco-
nomic Journal, Vol. 123, No. 573, pp. 1313–1332.
Schechter, Laura (2007) “Traditional trust measurement and the risk confound: An experiment
in rural Paraguay,” Journal of Economic Behavior and Organization, Vol. 62, No. 2, pp.
272–292.
23

Schulze, Gunther G. and Bjorn Frank (2003) “Deterrence versus intrinsic motivation: Exper-
imental evidence on the determinants of corruptibility,” Economics of Governance, Vol. 4,
No. 2, pp. 143–160.
Sequeira, Sandra (2012) Advances in measuring corruption in the field, Vol. 15: Emerald
Group Publishing Ltd. pp.145–175.
Sequeira, Sandra and Simeon Djankov (2014) “Corruption and firm behavior: Evidence from
African ports,” Journal of International Economics, Vol. 94, No. 2, pp. 277–294.
Sheremeta, Roman M. (2018) “Behavior in Group Contests: a Review of Experimental Re-
search,” Journal of Economic Surveys, Vol. 32, No. 3, pp. 683–704.
Shleifer, A and R.W. Vishny (1993) “Andrei shleifer and robert,” The Quarterly Journal of
Economics, Vol. 108, No. 3, pp. 599–617.
Svensson, Jakob (2005) “Eight questions about corruption,” in Journal of Economic Perspec-
tives.
The World Bank (2017) World Development Indicators 2017: Washington D.C.: The World
Bank Publications.
Treisman, Daniel (2000) “The causes of corruption: a cross-national study,” Journal of Public
Economics, Vol. 76, No. 3, pp. 399–457.
Tullock, Gordon (1980) “Efficient rent-seeking.,” in J.M. Buchanan, R.D. Tollison, and G. Tul-
lock eds. Toward a theory of the rent-seeking society, College Station: Texas A&M Univer-
sity Press, pp. 97–112.
UNDP (2020) “Human Development Report 2020.”
Van Veldhuizen, R. (2013) “The influence of wages on public officials’ corruptibility: A labo-
ratory investigation,” Journal of Economic Psychology.
Veron, Rene, Glyn Williams, Stuart Corbridge, and Manoj Srivastava (2006) “Decentralized
Corruption or Corrupt Decentralization? Community Monitoring of Poverty-Alleviation
Schemes in Eastern India,” World Development, Vol. 34, No. 11, pp. 1922–1941.
24

West, Harry G. and Scott Kloeck-Jenson (1999) “Betwixt and between: ’Traditional authority’
and democratic decentralization in post-war Mozambique,” African Affairs, Vol. 98, No. 393,
pp. 455–484.
Zak, Paul J. and Stephen Knack (2001) “Trust and Growth,” The Economic Journal, Vol. 111,
No. 470, pp. 295–321.
25

ONLINE APPENDIX
Measuring corruption in the field using behavioral games
Alex Armand, Alexander Coutts, Pedro C. Vicente, Ines Vilela
A Game scripts
This section provides the translation of the original instructions for the corruption game (Ap-
pendix A.1) and the trust game (Appendix A.2). Scripts are translated from the local languages
used in the implementation of the game.
A.1 Corruption game
The participants are 10 citizens and the leader. Everyone must be seated individually, with two
small bags [numbered inside]: one green and one blue. The leader must not be able to identify
the numbers of the individuals. The materials necessary for the game are 10 beans for each
citizen (that will be used for the decision made by each participant), 10 beans for each citizen
(that will be used to capture beliefs for each participant), 10 green bags and 10 blue bags (for
choices), and 10 brown bags (for beliefs).
The script for Part I of the game is the following:
All 10 participants will be doing the same activity today. You will notice the leader is present as
well, he will participate, but he will have to make different decisions from you. You will all been
given 10 beans. Each bean is worth 10 MT. Therefore, you have a total of 100 MT. You have two
bags: one green and one blue. All the beans you put in the blue bag will be yours to keep. All the
beans you put in the green bag will go to the leader.
You can choose to put in the green and blue bags any combination of beans, but you must use all 10
beans. ALL decisions must be taken in private. No one, including us, will know how you decided.
The final decisions will be analyzed by another enumerator who does not know who you are.
After your choice, the leader is going to make an important decision. The leader will know how
many beans are in each pair of blue and green bags. He will know that he can keep all the beans you
put in the green bags.
The leader must choose ONE person and will get all the beans in their blue bag. That person will
receive 300 MT for being chosen. All other participants who were not chosen will earn the amount
they kept in their blue bags.
1

There are two ways to earn money in this activity: 1) keep beans in the blue bag (10 MT for each
bean); 2) be chosen by the leader (300 MT).
The leader receives more money in this activity when there are more beans in the green bags. After
the leader observe the content of the bags, he will earn more money if he chooses a person who puts
more in the blue bag. If you want to be chosen by the leader, you have to decide how the leader will
choose. There is no right or wrong answer. Are there any questions?
To show you how the game works, we will do a short example. Remember you can allocate the
beans the way you prefer, the example is just for understanding better the tasks. [For the example,
we made use of visual cards depicted in Figure A1]
Figure A1: Visual help used in the corruption game
CARD A CARD B
CARD C CARD D
Lets imagine the three of us are playing this activity. Person 1 puts 0 beans in the green bag. How
many in the blue bag? Answer: 10. This means person 1 keeps 100 MT for himself, and doesnt
give any to the leader. Person 2 puts 5 beans in the green bag. How many in the blue bag? Answer:
5. This means person 1 keeps 50 MT for himself, and gives 50 MT to the leader. Person 3 puts 10
beans in the green bag. How many in the blue bag? Answer: 0. This means person 1 keeps 0 MT
for himself, and gives 100 MT to the leader.
How much will the leader have? Answer: 15 beans = 150 MT. Whoever the leader chooses, the
leader will receive the beans in their blue bag. That person will instead receive 300 MT. If the leader
chooses person 1, he will receive an extra 100 MT, 250 MT total, and person 1 receives 300. If the
2
leader chooses person 2, he will receive an extra 50 MT, 200 MT total, and person 2 receives 300. If
the leader chooses person 3, he will not receive any extra MT, 150 MT total, while person 3 receives
300. Remember your decisions are private, and you should not reveal them to anyone. Are there any
questions?
The script for Part II of the game is the following:
The leader should leave now. You can start the activity after all questions have been answered. After
all participants have made their decisions and the bags have been collected, the game continues.
Now, we will add one extra task to this activity. We want you to estimate how the leader will make
his choice. To do so, we are giving you a brown bag and 10 new beans. You have to estimate how
many beans will be in the blue bag of the person the leader will chose. We will collect the bags and
then the enumerator in the other room will check how many beans were in the blue bag of the person
the leader actually chose. If you estimated correctly the number, you will earn a bonus of 10 MT.
Are there any questions?
A.2 Trust game
The participants are 10 citizens and the leader. Everyone must be seated individually, with
two small bags [numbered inside]: one green and one blue. The leader must not be able to
identify the numbers of the individuals. The materials necessary for the game are 10 beans for
each citizen (that will be used for the decision made by each participant), 15 beans for each
citizen (that will be used for the beliefs of each participant), 10 green bags and 10 blue bags
(for choices), and 10 brown bags (for beliefs).
The script for Part I of the game is the following:
Every participant will be doing the same activity today. You will notice the leader is present as well,
he will participate, but he will have to make different decisions as compared to you. You will all
been given 10 beans. Each bean is worth 10 MT. Therefore, you have a total of 100 MT. You will
also have two bags: one green and one blue. All the beans you put in the blue bag will be yours to
keep. All the beans you put in the green bag will go to the leader.
You can choose to put in the green and blue bags any combination of beans, but you must use all 10
beans. ALL decisions must be taken in private. No one, including us, will know how you decided.
The final decisions will be analyzed by another enumerator who does not know who you are.
The beans that go to the leader (in the green bags) are going to be tripled. Next the leader will
decide how many of these beans, if any, he would like to return to you. Remember the leader does
3
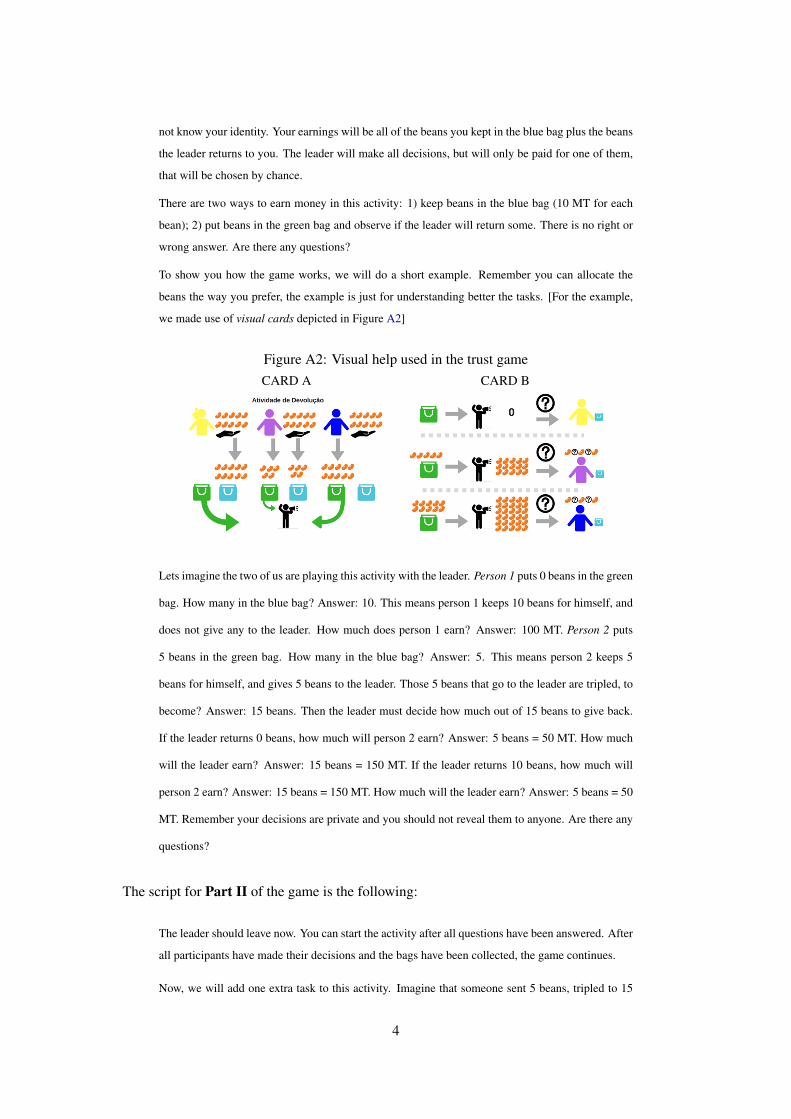
not know your identity. Your earnings will be all of the beans you kept in the blue bag plus the beans
the leader returns to you. The leader will make all decisions, but will only be paid for one of them,
that will be chosen by chance.
There are two ways to earn money in this activity: 1) keep beans in the blue bag (10 MT for each
bean); 2) put beans in the green bag and observe if the leader will return some. There is no right or
wrong answer. Are there any questions?
To show you how the game works, we will do a short example. Remember you can allocate the
beans the way you prefer, the example is just for understanding better the tasks. [For the example,
we made use of visual cards depicted in Figure A2]
Figure A2: Visual help used in the trust gameCARD A CARD B
Lets imagine the two of us are playing this activity with the leader. Person 1 puts 0 beans in the green
bag. How many in the blue bag? Answer: 10. This means person 1 keeps 10 beans for himself, and
does not give any to the leader. How much does person 1 earn? Answer: 100 MT. Person 2 puts
5 beans in the green bag. How many in the blue bag? Answer: 5. This means person 2 keeps 5
beans for himself, and gives 5 beans to the leader. Those 5 beans that go to the leader are tripled, to
become? Answer: 15 beans. Then the leader must decide how much out of 15 beans to give back.
If the leader returns 0 beans, how much will person 2 earn? Answer: 5 beans = 50 MT. How much
will the leader earn? Answer: 15 beans = 150 MT. If the leader returns 10 beans, how much will
person 2 earn? Answer: 15 beans = 150 MT. How much will the leader earn? Answer: 5 beans = 50
MT. Remember your decisions are private and you should not reveal them to anyone. Are there any
questions?
The script for Part II of the game is the following:
The leader should leave now. You can start the activity after all questions have been answered. After
all participants have made their decisions and the bags have been collected, the game continues.
Now, we will add one extra task to this activity. Imagine that someone sent 5 beans, tripled to 15
4

beans. We want you to estimate how much you think the leader will send back out of the 15 beans
(150 MT). We are giving you a brown bag and 15 new beans. You have to estimate how many beans
the leader will send back from 0 to 15 by introducing them in the brown bag. We will collect the
bags and then the enumerator in the other room will check how much the leader actually sent back.
If you estimated correctly the number, you will earn a bonus of 10 MT. Are there any questions?
5

B Additional analysis
B.1 The repeated corruption game
In this section, we consider an infinitely repeated version of the corruption game, where all
players have discount factors δ ∈ (0, 1). In the infinitely repeated version of this game, the
best-responses of the one-shot game continue to lead to a subgame-perfect Nash equilibrium
(SPNE), the equilibrium without corruption. However there are additional equilibria, involving
corruption.
Consider only pure strategies and denote bribes from citizens by b. Note that the minimum
average payoff of citizens in any equilibrium is 100, which they can guarantee by setting b = 0.
Due to the zero-sum nature of bribes, this also fixes the leader’s maximum average payoff at 300
(which would mean the leader is able to appropriate the full surplus deriving from the bonus).
Here we illustrate only one such equilibrium, although there are many. In this equilibrium three
citizens send b = 10 bribes, while the remaining seven send b = 0. The leader’s strategy is
always to choose the player who sends the highest bribe, randomizing for ties. The payoff to
these three citizens is then 100 in expectation(3003
). The payoff to each of the other seven is
their private investment of 100. As can be seen, there is no profitable deviation for citizens.
The bribing citizens would stand to gain nothing (or would lose) from sending fewer bribes.
The non-bribing citizens could only earn the bonus by sending b = 10, but then their payoff
would be lowered to 3004 = 75.
We thus know the citizens are playing best responses. But what about the leader? Assume
that citizens play a grim-trigger strategy, where any deviation of the leader to not choosing the
highest bribe results in citizens choosing to forever send zero bribes. In this case the leader’s
continuation payoff from not deviating is:
300 + δ300 + δ2300 + ...
And the leader’s continuation payoff from deviating is:
400 + δ100 + δ2100 + ...
6

The leader will not deviate so long as:
400 + 100(1 + δ + δ2 + ...) ≤ 300(1 + δ + δ2 + ...)
400 ≤ 2001
1− δ
δ ≥ 1
2
Note that in this equilibrium the leader makes 300 per period, while all ten citizens make
100 in expectation. There are equilibria where the leader earns less, e.g., another equilibrium
is for only two citizens to send b = 10, and in this case the leader receives an average of 200
per period. There are also equilibria which involve more citizens giving bribes, although these
involve a different strategy from leaders (e.g., there exists an equilibrium where five citizens
send b = 5, with the others sending b = 0, and the leader only rewards citizens sending
b = 5. In this equilibrium the citizens also earn 100 in expectation, while the leader earns 300.
In the no bribery equilibrium, the leader makes 100, and all 10 citizens make in expectation9·100+300
10 = 120.
To summarize, there are multiple equilibria in the repeated game which involve corruption.
In the unique equilibrium with no corruption, the distribution of payoffs approaches equality
(with all citizens receiving the same amount). In the most favorable equilibrium for the leader,
the leader will receive triple the amount received by the average citizen.
B.2 Controlling for cognitive ability
In all specification controlling for citizen characteristics, we include a measure of cognitive
ability, captured using the Raven’s test, a nonverbal test used in measuring abstract reasoning
and regarded as a means of estimating intelligence, especially in settings of low literacy. To
verify how estimates varies depending on the inclusion or the exclusion of the test score, which
ranges from 0 to 10, Table B1 presents the main estimates with and without the Raven’s test
score as control variable, showing few differences.
7

Table B1: Behavior in the corruption game: controlling for cognitive abilityDependent variable: Bribe ...
sent by citizen to leader chosen by the leader(1) (2) (3) (4) (5) (6)
A. Citizen variables
Accommodate bribes -0.084 -0.079 -0.024 -0.065 -0.072 0.146(0.132) (0.134) (0.134) (0.186) (0.190) (0.170)
Amount sent in trust game 0.330*** 0.329*** 0.315*** 0.052 0.053 0.034(0.032) (0.032) (0.033) (0.044) (0.043) (0.033)
High trust in leaders -0.028 -0.023 0.052 -0.167 -0.173 -0.135(0.110) (0.112) (0.114) (0.149) (0.149) (0.126)
B. Leader variables
Appropriation 0.974*** 0.969*** 0.736** 1.144** 1.151** 1.298**(0.276) (0.274) (0.307) (0.547) (0.546) (0.609)
Share returned in trust game 1.075** 1.064** 0.835* 3.478*** 3.494*** 3.811***(0.476) (0.473) (0.463) (1.213) (1.212) (1.196)
Accountability -0.266** -0.263** -0.273*** -0.429** -0.433** -0.610***(0.110) (0.109) (0.101) (0.210) (0.210) (0.196)
C. Cognitive ability
Raven’s test score 0.021 0.022 -0.029 -0.022(0.026) (0.027) (0.031) (0.023)
Observations 1970 1970 1928 1970 1970 1928R2 0.134 0.135 0.168 0.088 0.089 0.255Citizen and leader controls (excl.Raven’s test score)
- - Yes - - Yes
Community controls - - Yes - - YesLevel of analysis Citizen Citizen Citizen Leader Leader Leader
Note. Results based on OLS regressions. Statistical significance at * 0.1; ** 0.05; *** 0.01. Robust standard errors clustered atcommunity level. Dependent variables are defined by column: (1)–(3) number of tokens sent by citizens to the leader as bribein the corruption game, ranging from from 0 (citizen gave no bribe) to a maximum of 10; (3)–(6) number of tokens sent bythe citizen that is chosen by the leader in the corruption game, ranging from 0 (citizen chosen gave no bribe) to a maximum of10. Details about the game are provided in Section 2. In Panel A, citizen variables refer to independent variables pertaining tocitizen behavior or survey measures and are defined as follows: accommodate bribes is a survey measure defined as an indicatorvariable equal to 1 if the citizen reports agreeing that the best way to overcome problems is to pay bribes, and 0 otherwise; amountsent in trust game is the amount sent by the citizen to the leader in the trust game (Section 2); high trust in leaders is a surveymeasure defined as an indicator variable equal to 1 if the citizen reports trusting leaders “a lot” (highest of four options), and 0otherwise. In Panel B, leader variables refer to independent variables pertaining to leader behavior or survey measures and aredefined as follows: appropriation is the proportion of community funds that is observed as being appropriated by the leader inthe incentivized structured community activity (see Section 2.1); share returned in the trust game is the proportion returned bythe leader in the trust game (Section 2); accountability is a survey measure indicating whether the leader reports agreeing thatthe community supports accountability and takes values 0 (disagree), 1 (neither agree nor disagree), and 2 (agree). In Panel C,cognitive ability refer to the Raven’s test score, a variable that ranges from 0 (low score) to 10 (maximum score). The full list ofcontrols is provided in Section 3.1.
B.3 Alternative specifications
We present alternative specifications as compared to our main estimates presented in Table
2. To show robustness of partial correlations, we examine specifications where the studied
variables are separately added to the estimating equation. Table B2 presents results analyzing
citizen variables, while Table B3 presents results for leader variables. All regressions include
citizen, leader, and community controls. In both tables, the specification in column (12) in
8

Table B2 corresponds to the specification estimated in column (3) in Table 2, while column
(12) in Table B3 corresponds to the specification estimated in column (6) in Table 2.
9

Tabl
eB
2:C
itize
nbe
havi
orin
the
corr
uptio
nga
me:
alte
rnat
ive
spec
ifica
tions
Dep
ende
ntva
riab
le:B
ribe
sent
byci
tizen
tole
ader
(1)
(2)
(3)
(4)
(5)
(6)
(7)
(8)
(9)
(10)
(11)
(12)
A.C
itize
nva
riab
les
Acc
omm
odat
ebr
ibes
-0.2
09-0
.161
-0.0
56-0
.021
-0.0
60-0
.024
(0.1
35)
(0.1
35)
(0.1
34)
(0.1
33)
(0.1
35)
(0.1
34)
Am
ount
sent
intr
ustg
ame
0.32
8***
0.31
6***
0.32
3***
0.31
1***
0.32
3***
0.31
1***
0.32
7***
0.31
6***
(0.0
32)
(0.0
32)
(0.0
32)
(0.0
32)
(0.0
32)
(0.0
32)
(0.0
33)
(0.0
32)
Hig
htr
usti
nle
ader
s0.
044
0.03
70.
086
0.07
80.
058
0.05
0(0
.109
)(0
.109
)(0
.113
)(0
.113
)(0
.113
)(0
.114
)B
.Lea
der
vari
able
s
App
ropr
iatio
n1.
010*
**0.
777*
*0.
747*
*0.
747*
*0.
956*
**0.
777*
*(0
.341
)(0
.309
)(0
.310
)(0
.310
)(0
.339
)(0
.309
)Sh
are
retu
rned
intr
ustg
ame
0.92
2*0.
817*
0.86
1*0.
860*
0.95
1*0.
818*
(0.5
49)
(0.4
65)
(0.4
94)
(0.4
94)
(0.5
66)
(0.4
65)
Acc
ount
abili
ty-0
.305
***
-0.2
65**
-0.2
66**
*-0
.266
***
-0.3
08**
*-0
.265
**(0
.108
)(0
.102
)(0
.101
)(0
.101
)(0
.107
)(0
.102
)
Obs
erva
tions
1948
1928
1948
1928
2009
1989
2009
1989
2009
1989
1948
1928
R2
0.07
30.
094
0.15
10.
166
0.14
80.
163
0.14
90.
163
0.07
20.
093
0.15
10.
166
Citi
zen
and
lead
erco
ntro
lsY
esY
esY
esY
esY
esY
esY
esY
esY
esY
esY
esY
esC
omm
unity
cont
rols
Yes
Yes
Yes
Yes
Yes
Yes
Yes
Yes
Yes
Yes
Yes
Yes
Lev
elof
anal
ysis
Citi
zen
Citi
zen
Citi
zen
Citi
zen
Citi
zen
Citi
zen
Citi
zen
Citi
zen
Citi
zen
Citi
zen
Citi
zen
Citi
zen
Not
e.R
esul
tsba
sed
onO
LS
regr
essi
ons.
Stat
istic
alsi
gnifi
canc
eat
*0.
1;**
0.05
;**
*0.
01.
Rob
usts
tand
ard
erro
rscl
uste
red
atco
mm
unity
leve
l.T
hede
pend
entv
aria
ble
isth
enu
mbe
rof
toke
nsse
ntby
citiz
ens
toth
ele
ader
asbr
ibe
inth
eco
rrup
tion
gam
e,ra
ngin
gfr
omfr
om0
(citi
zen
gave
nobr
ibe)
toa
max
imum
of10
.In
Pane
lA,c
itize
nva
riab
les
refe
rto
inde
pend
entv
aria
bles
pert
aini
ngto
citiz
enbe
havi
oror
surv
eym
easu
res
and
are
defin
edas
follo
ws:
acco
mm
odat
ebr
ibes
isa
surv
eym
easu
rede
fined
asan
indi
cato
rvar
iabl
eeq
ualt
o1
ifth
eci
tizen
repo
rts
agre
eing
that
the
best
way
toov
erco
me
prob
lem
sis
topa
ybr
ibes
,and
0ot
herw
ise;
amou
ntse
ntin
trus
tgam
eis
the
amou
ntse
ntby
the
citiz
ento
the
lead
erin
the
trus
tgam
e(S
ectio
n2)
;hig
htr
usti
nle
ader
sis
asu
rvey
mea
sure
defin
edas
anin
dica
tor
vari
able
equa
lto
1if
the
citiz
enre
port
str
ustin
gle
ader
s“a
lot”
(hig
hest
offo
urop
tions
),an
d0
othe
rwis
e.In
Pane
lB,l
eade
rva
riab
les
refe
rto
inde
pend
entv
aria
bles
pert
aini
ngto
lead
erbe
havi
oror
surv
eym
easu
res
and
are
defin
edas
follo
ws:
appr
opri
atio
nis
the
prop
ortio
nof
com
mun
ityfu
nds
that
isob
serv
edas
bein
gap
prop
riat
edby
the
lead
erin
the
ince
ntiv
ized
stru
ctur
edco
mm
unity
activ
ity(s
eeSe
ctio
n2.
1);s
hare
retu
rned
inth
etr
ustg
ame
isth
epr
opor
tion
retu
rned
byth
ele
ader
inth
etr
ustg
ame
(Sec
tion
2);a
ccou
ntab
ility
isa
surv
eym
easu
rein
dica
ting
whe
ther
the
lead
erre
port
sag
reei
ngth
atth
eco
mm
unity
supp
orts
acco
unta
bilit
yan
dta
kes
valu
es0
(dis
agre
e),1
(nei
ther
agre
eno
rdis
agre
e),a
nd2
(agr
ee).
The
full
listo
fcon
trol
sis
prov
ided
inSe
ctio
n3.
1.
10

Tabl
eB
3:L
eade
rbeh
avio
rin
the
corr
uptio
nga
me:
alte
rnat
ive
spec
ifica
tions
Dep
ende
ntva
riab
le:B
ribe
chos
enby
the
lead
er(1
)(2
)(3
)(4
)(5
)(6
)(7
)(8
)(9
)(1
0)(1
1)(1
2)A
.Citi
zen
vari
able
s
Acc
omm
odat
ebr
ibes
0.11
90.
143
0.14
50.
149
0.12
10.
143
(0.1
77)
(0.1
76)
(0.1
78)
(0.1
76)
(0.1
75)
(0.1
72)
Am
ount
sent
intr
ustg
ame
0.05
20.
046
0.06
6*0.
056
0.06
00.
038
(0.0
37)
(0.0
34)
(0.0
35)
(0.0
35)
(0.0
37)
(0.0
33)
Hig
htr
usti
nle
ader
s-0
.143
-0.1
44-0
.145
-0.1
41-0
.141
-0.1
41(0
.127
)(0
.131
)(0
.132
)(0
.130
)(0
.127
)(0
.130
)B
.Lea
der
vari
able
s
App
ropr
iatio
n1.
665*
**1.
587*
*1.
687*
**1.
627*
*1.
552*
*1.
497*
*(0
.628
)(0
.640
)(0
.619
)(0
.630
)(0
.616
)(0
.628
)Sh
are
retu
rned
intr
ustg
ame
3.86
5***
3.83
7***
3.43
3***
3.37
9***
3.35
3***
3.30
3***
3.80
4***
3.77
9***
(1.2
16)
(1.2
29)
(1.2
65)
(1.2
74)
(1.2
25)
(1.2
36)
(1.1
73)
(1.1
88)
Acc
ount
abili
ty-0
.610
***
-0.5
94**
*-0
.640
***
-0.6
23**
*-0
.599
***
-0.5
85**
*(0
.207
)(0
.206
)(0
.218
)(0
.217
)(0
.204
)(0
.203
)
Obs
erva
tions
2007
1938
2007
1938
2017
1948
2007
1938
2007
1938
1997
1928
R2
0.15
70.
158
0.20
20.
202
0.17
60.
178
0.20
40.
204
0.16
90.
171
0.22
90.
227
Citi
zen
and
lead
erco
ntro
lsY
esY
esY
esY
esY
esY
esY
esY
esY
esY
esY
esY
esC
omm
unity
cont
rols
Yes
Yes
Yes
Yes
Yes
Yes
Yes
Yes
Yes
Yes
Yes
Yes
Lev
elof
anal
ysis
Lea
der
Lea
der
Lea
der
Lea
der
Lea
der
Lea
der
Lea
der
Lea
der
Lea
der
Lea
der
Lea
der
Lea
der
Not
e.R
esul
tsba
sed
onO
LS
regr
essi
ons.
Stat
istic
alsi
gnifi
canc
eat
*0.
1;**
0.05
;**
*0.
01.
Rob
usts
tand
ard
erro
rscl
uste
red
atco
mm
unity
leve
l.T
hede
pend
entv
aria
ble
isth
enu
mbe
rof
toke
nsse
ntby
the
citiz
enth
atis
chos
enby
the
lead
erin
the
corr
uptio
nga
me,
rang
ing
from
0(c
itize
nch
osen
gave
nobr
ibe)
toa
max
imum
of10
.In
Pane
lA,c
itize
nva
riab
les
refe
rto
inde
pend
entv
aria
bles
pert
aini
ngto
citiz
enbe
havi
oror
surv
eym
easu
res
and
are
defin
edas
follo
ws:
acco
mm
odat
ebr
ibes
isa
surv
eym
easu
rede
fined
asan
indi
cato
rvar
iabl
eeq
ualt
o1
ifth
eci
tizen
repo
rts
agre
eing
that
the
best
way
toov
erco
me
prob
lem
sis
topa
ybr
ibes
,and
0ot
herw
ise;
amou
ntse
ntin
trus
tgam
eis
the
amou
ntse
ntby
the
citiz
ento
the
lead
erin
the
trus
tgam
e(S
ectio
n2)
;hi
ghtr
usti
nle
ader
sis
asu
rvey
mea
sure
defin
edas
anin
dica
tor
vari
able
equa
lto
1if
the
citiz
enre
port
str
ustin
gle
ader
s“a
lot”
(hig
hest
offo
urop
tions
),an
d0
othe
rwis
e.In
Pane
lB,l
eade
rva
riab
les
refe
rto
inde
pend
entv
aria
bles
pert
aini
ngto
lead
erbe
havi
oror
surv
eym
easu
res
and
are
defin
edas
follo
ws:
appr
opri
atio
nis
the
prop
ortio
nof
com
mun
ityfu
nds
that
isob
serv
edas
bein
gap
prop
riat
edby
the
lead
erin
the
ince
ntiv
ized
stru
ctur
edco
mm
unity
activ
ity(s
eeSe
ctio
n2.
1);s
hare
retu
rned
inth
etr
ustg
ame
isth
epr
opor
tion
retu
rned
byth
ele
ader
inth
etr
ustg
ame
(Sec
tion
2);a
ccou
ntab
ility
isa
surv
eym
easu
rein
dica
ting
whe
ther
the
lead
erre
port
sag
reei
ngth
atth
eco
mm
unity
supp
orts
acco
unta
bilit
yan
dta
kes
valu
es0
(dis
agre
e),1
(nei
ther
agre
eno
rdis
agre
e),a
nd2
(agr
ee).
The
full
listo
fcon
trol
sis
prov
ided
inSe
ctio
n3.
1.
11
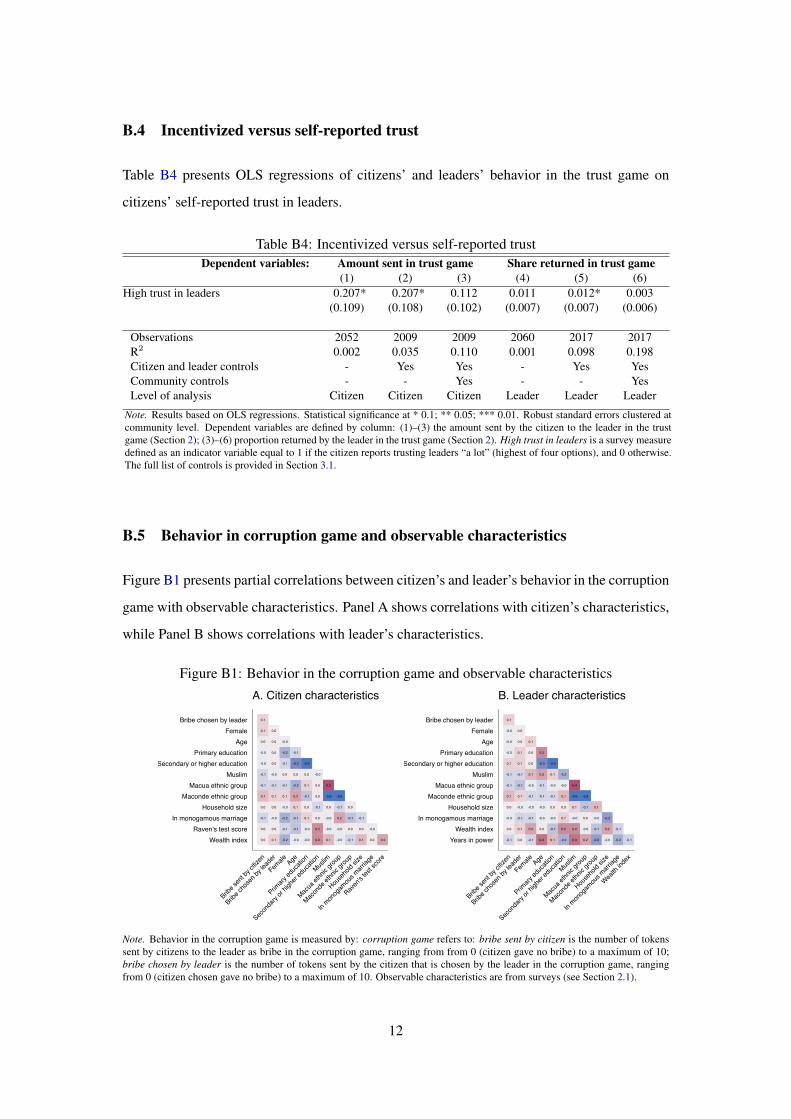
B.4 Incentivized versus self-reported trust
Table B4 presents OLS regressions of citizens’ and leaders’ behavior in the trust game on
citizens’ self-reported trust in leaders.
Table B4: Incentivized versus self-reported trustDependent variables: Amount sent in trust game Share returned in trust game
(1) (2) (3) (4) (5) (6)High trust in leaders 0.207* 0.207* 0.112 0.011 0.012* 0.003
(0.109) (0.108) (0.102) (0.007) (0.007) (0.006)
Observations 2052 2009 2009 2060 2017 2017R2 0.002 0.035 0.110 0.001 0.098 0.198Citizen and leader controls - Yes Yes - Yes YesCommunity controls - - Yes - - YesLevel of analysis Citizen Citizen Citizen Leader Leader Leader
Note. Results based on OLS regressions. Statistical significance at * 0.1; ** 0.05; *** 0.01. Robust standard errors clustered atcommunity level. Dependent variables are defined by column: (1)–(3) the amount sent by the citizen to the leader in the trustgame (Section 2); (3)–(6) proportion returned by the leader in the trust game (Section 2). High trust in leaders is a survey measuredefined as an indicator variable equal to 1 if the citizen reports trusting leaders “a lot” (highest of four options), and 0 otherwise.The full list of controls is provided in Section 3.1.
B.5 Behavior in corruption game and observable characteristics
Figure B1 presents partial correlations between citizen’s and leader’s behavior in the corruption
game with observable characteristics. Panel A shows correlations with citizen’s characteristics,
while Panel B shows correlations with leader’s characteristics.
Figure B1: Behavior in the corruption game and observable characteristics
0.1
0.1 0.0
0.0 0.0 -0.0
-0.0 0.0 -0.2 -0.1
-0.0 0.0 -0.1 -0.3 -0.5
-0.1 -0.0 0.0 0.0 0.0 -0.0
-0.1 -0.1 -0.1 -0.2 0.1 0.0 0.3
0.1 0.1 0.1 0.2 -0.1 0.0 -0.5 -0.8
0.0 0.0 -0.0 0.1 0.0 -0.1 0.0 -0.1 0.0
-0.1 -0.0 -0.2 -0.1 0.1 0.0 -0.0 0.2 -0.1 -0.1
0.0 0.0 -0.1 -0.1 -0.0 0.2 -0.0 -0.0 0.0 0.0 -0.0
0.0 0.1 -0.2 -0.0 -0.0 0.2 0.1 -0.0 -0.1 0.1 0.0 0.2
Bribe chosen by leaderFemale
AgePrimary education
Secondary or higher educationMuslim
Macua ethnic groupMaconde ethnic group
Household sizeIn monogamous marriage
Raven's test scoreWealth index
Bribe s
ent b
y citiz
en
Bribe c
hose
n by le
ader
Female Age
Primary
educ
ation
Secon
dary
or hig
her e
duca
tion
Muslim
Macua
ethn
ic grou
p
Macon
de et
hnic g
roup
House
hold
size
In mon
ogam
ous m
arriag
e
Raven
's tes
t sco
re
A. Citizen characteristics
0.1
-0.0 0.0
-0.0 0.0 0.1
-0.0 0.1 0.0 0.2
0.1 0.1 0.0 -0.3 -0.9
-0.1 -0.1 0.1 0.2 0.1 -0.2
-0.1 -0.1 -0.0 -0.1 -0.0 -0.0 0.4
0.1 0.1 -0.1 -0.1 -0.1 0.1 -0.6 -0.8
0.0 -0.0 -0.0 -0.0 0.0 0.0 0.1 -0.1 0.1
-0.0 -0.1 -0.1 -0.0 -0.0 0.1 -0.0 0.0 -0.0 -0.2
0.0 0.1 0.2 0.0 -0.1 0.2 0.2 -0.0 -0.1 0.2 -0.1
-0.1 0.0 -0.1 0.3 0.1 -0.2 0.3 0.2 -0.2 -0.0 -0.2 -0.1
Bribe chosen by leaderFemale
AgePrimary education
Secondary or higher educationMuslim
Macua ethnic groupMaconde ethnic group
Household sizeIn monogamous marriage
Wealth indexYears in power
Bribe s
ent b
y citiz
en
Bribe c
hose
n by le
ader
Female Age
Primary
educ
ation
Secon
dary
or hig
her e
duca
tion
Muslim
Macua
ethn
ic grou
p
Macon
de et
hnic g
roup
House
hold
size
In mon
ogam
ous m
arriag
e
Wealth
inde
x
B. Leader characteristics
Note. Behavior in the corruption game is measured by: corruption game refers to: bribe sent by citizen is the number of tokenssent by citizens to the leader as bribe in the corruption game, ranging from from 0 (citizen gave no bribe) to a maximum of 10;bribe chosen by leader is the number of tokens sent by the citizen that is chosen by the leader in the corruption game, rangingfrom 0 (citizen chosen gave no bribe) to a maximum of 10. Observable characteristics are from surveys (see Section 2.1).
12

B.6 Measuring corruption using leader’s attitudes towards bribes
Table B5 presents analogous analysis to Table 2, but conditioning on the survey measure on
whether the leader holds favorable attitudes towards paying bribes (accommodate bribes), in
addition to the incentivized measure of appropriation. Alternatively, replacing appropriation
with the survey measure leads to comparable results.
Table B5: Behavior in the corruption game controlling for leaders’ attitudesDependent variable: Bribe ...
sent by citizen to leader chosen by the leader(1) (2) (3) (4) (5) (6)
A. Citizen variables
Accommodate bribes -0.081 -0.077 -0.032 -0.055 -0.061 0.123(0.133) (0.135) (0.134) (0.188) (0.191) (0.171)
Amount sent in trust game 0.323*** 0.322*** 0.311*** 0.037 0.039 0.026(0.032) (0.032) (0.033) (0.042) (0.042) (0.033)
High trust in leaders -0.023 -0.019 0.054 -0.159 -0.165 -0.130(0.110) (0.112) (0.114) (0.153) (0.153) (0.127)
B. Leader variables
Appropriation 0.866*** 0.862*** 0.676** 0.917 0.924 1.128*(0.281) (0.280) (0.304) (0.564) (0.563) (0.626)
Share returned in trust game 1.145** 1.134** 0.865* 3.598*** 3.615*** 3.916***(0.469) (0.467) (0.451) (1.164) (1.163) (1.134)
Accountability -0.260** -0.257** -0.263** -0.440** -0.445** -0.613***(0.113) (0.112) (0.103) (0.216) (0.216) (0.200)
Leader accommodates bribes 0.530*** 0.527*** 0.559*** 0.804* 0.807* 0.978**(0.182) (0.181) (0.174) (0.460) (0.459) (0.465)
Observations 1950 1950 1908 1950 1950 1908R2 0.140 0.140 0.173 0.099 0.100 0.267Citizen and leader controls - Yes Yes - Yes YesCommunity controls - - Yes - - YesLevel of analysis Citizen Citizen Citizen Leader Leader Leader
Note. Results based on OLS regressions. Results based on OLS regressions. Statistical significance at * 0.1; ** 0.05; *** 0.01.Robust standard errors clustered at community level. Dependent variables are defined by column: (1)–(3) number of tokens sentby citizens to the leader as bribe in the corruption game, ranging from from 0 (citizen gave no bribe) to a maximum of 10; (3)–(6)number of tokens sent by the citizen that is chosen by the leader in the corruption game, ranging from 0 (citizen chosen gave nobribe) to a maximum of 10. Details about the game are provided in Section 2. Leader accommodates bribes is a survey measuredefined as an indicator variable equal to 1 if the leader reports agreeing that the best way to overcome problems is to pay bribes,and 0 otherwise. In Panel A, citizen variables refer to independent variables pertaining to citizen behavior or survey measures andare defined as follows: accommodate bribes is a survey measure defined as an indicator variable equal to 1 if the citizen reportsagreeing that the best way to overcome problems is to pay bribes, and 0 otherwise; amount sent in trust game is the amount sentby the citizen to the leader in the trust game (Section 2); high trust in leaders is a survey measure defined as an indicator variableequal to 1 if the citizen reports trusting leaders “a lot” (highest of four options), and 0 otherwise. In Panel B, leader variablesrefer to independent variables pertaining to leader behavior or survey measures and are defined as follows: appropriation is theproportion of community funds that is observed as being appropriated by the leader in the incentivized structured communityactivity (see Section 2.1); share returned in the trust game is the proportion returned by the leader in the trust game (Section 2);accountability is a survey measure indicating whether the leader reports agreeing that the community supports accountability andtakes values 0 (disagree), 1 (neither agree nor disagree), and 2 (agree). The full list of controls is provided in Section 3.1.
13
B.7 Leader behavior when unconstrained
One concern arises because leaders’ choices were limited to choosing the bribes that citizens
sent. For example, a leader may have strictly preferred to choose a citizen sending a bribe of
b = 0, but may have faced a set of citizens who all sent b ≥ 1. To be certain that our results
are not driven by leaders choosing non-preferred bribe amounts, we can restrict the analysis to
games in which leaders were not constrained in their choice by citizens’ decisions. Specifically,
we define a leader as not constrained (from below) when there exists at least one citizen who
sent a bribe that was smaller than that chosen by the leader – excluding cases when the leader
already chose the minimum, b = 0.
To alleviate this concern, Table B6 examines the analog of Table 2, but restricting the
sample to only leaders who were not constrained from below. As an additional check, Table
B7 imposes a further restriction by also excluding games in which leaders were not constrained
from above: there exists at least one citizen who sent a bribe that was larger than that chosen
by the leader – excluding cases when the leader already chose the maximum, b = 10.
The number of observations significantly declines in both tables. Both tables confirms the
results presented in the main text for the full sample of leaders. These results suggest that
main results are not driven by constrained leaders and provide consistent evidence that leaders’
decisions in the corruption game are significantly associated with their actual involvement in
corruption.
14

Table B6: Behavior in the corruption game when leaders are unconstrained (only lower bound)Dependent variable: Bribe ...
sent by citizen to leader chosen by the leader(1) (2) (3) (4) (5) (6)
A. Citizen variables
Accommodate bribes -0.112 -0.110 -0.027 -0.100 -0.106 0.201(0.158) (0.160) (0.161) (0.250) (0.252) (0.213)
Amount sent in trust game 0.280*** 0.280*** 0.283*** 0.052 0.054 0.012(0.037) (0.037) (0.038) (0.055) (0.055) (0.042)
High trust in leaders 0.034 0.037 0.118 -0.216 -0.227 -0.226(0.136) (0.139) (0.145) (0.209) (0.209) (0.170)
B. Leader variables
Appropriation 0.924*** 0.924*** 0.609* 1.366 1.366 1.742**(0.331) (0.331) (0.352) (0.844) (0.841) (0.838)
Share returned in trust game 1.064* 1.058* 0.881 3.746*** 3.770*** 4.232***(0.576) (0.574) (0.557) (1.426) (1.425) (1.333)
Accountability -0.281** -0.278** -0.304** -0.558* -0.571* -0.861***(0.134) (0.133) (0.137) (0.289) (0.289) (0.284)
Observations 1381 1381 1348 1381 1381 1348R2 0.102 0.103 0.133 0.096 0.097 0.304Citizen and leader controls - Yes Yes - Yes YesCommunity controls - - Yes - - YesLevel of analysis Citizen Citizen Citizen Leader Leader Leader
Note. Results based on OLS regressions restricting the sample by excluding games in which leaders choose the minimum bribe,which is strictly larger than 0. Statistical significance at * 0.1; ** 0.05; *** 0.01. Robust standard errors clustered at communitylevel. Dependent variables are defined by column: (1)–(3) number of tokens sent by citizens to the leader as bribe in the corruptiongame, ranging from from 0 (citizen gave no bribe) to a maximum of 10; (4)–(6) number of tokens sent by the citizen that ischosen by the leader in the corruption game, ranging from 0 (citizen chosen gave no bribe) to a maximum of 10. In PanelA, citizen variables refer to independent variables pertaining to citizen behavior or survey measures and are defined as follows:accommodate bribes is a survey measure defined as an indicator variable equal to 1 if the citizen reports agreeing that the best wayto overcome problems is to pay bribes, and 0 otherwise; amount sent in trust game is the amount sent by the citizen to the leader inthe trust game (Section 2); high trust in leaders is a survey measure defined as an indicator variable equal to 1 if the citizen reportstrusting leaders “a lot” (highest of four options), and 0 otherwise. In Panel B, leader variables refer to independent variablespertaining to leader behavior or survey measures and are defined as follows: appropriation is the proportion of community fundsthat is observed as being appropriated by the leader in the incentivized structured community activity (see Section 2.1); sharereturned in the trust game is the proportion returned by the leader in the trust game (Section 2); accountability is a survey measureindicating whether the leader reports agreeing that the community supports accountability and takes values 0 (disagree), 1 (neitheragree nor disagree), and 2 (agree). The full list of controls is provided in Section 3.1.
15

Table B7: Behavior in the corruption game when leaders are unconstrained (lower and upperbounds)
Dependent variable: Bribe ...sent by citizen to leader chosen by the leader
(1) (2) (3) (4) (5) (6)A. Citizen variables
Accommodate bribes -0.100 -0.098 0.030 -0.326 -0.332 0.185(0.177) (0.178) (0.179) (0.219) (0.219) (0.185)
Amount sent in trust game 0.282*** 0.281*** 0.278*** 0.082 0.085 0.077**(0.039) (0.039) (0.041) (0.055) (0.055) (0.035)
High trust in leaders 0.116 0.120 0.211 -0.187 -0.203 -0.169(0.140) (0.143) (0.146) (0.201) (0.200) (0.160)
B. Leader variables
Appropriation 1.192*** 1.189*** 0.896** 1.142 1.154 2.079**(0.362) (0.361) (0.396) (0.845) (0.842) (0.842)
Share returned in trust game 1.335** 1.322** 1.164* 3.661*** 3.712*** 4.081***(0.662) (0.662) (0.632) (1.328) (1.329) (1.363)
Accountability -0.299** -0.295** -0.346** -0.692** -0.709** -1.056***(0.144) (0.143) (0.145) (0.295) (0.294) (0.301)
Observations 1208 1208 1177 1208 1208 1177R2 0.111 0.111 0.149 0.118 0.121 0.346Citizen and leader controls - Yes Yes - Yes YesCommunity controls - - Yes - - YesLevel of analysis Citizen Citizen Citizen Leader Leader Leader
Note. Results based on OLS regressions restricting the sample to games in which leaders choose the minimum bribe, which isstrictly larger than 0, or choose the maximum bribe, which is strictly smaller than 10. Statistical significance at * 0.1; ** 0.05;*** 0.01. Robust standard errors clustered at community level. Dependent variables are defined by column: (1)–(3) number oftokens sent by citizens to the leader as bribe in the corruption game, ranging from from 0 (citizen gave no bribe) to a maximumof 10; (4)–(6) number of tokens sent by the citizen that is chosen by the leader in the corruption game, ranging from 0 (citizenchosen gave no bribe) to a maximum of 10. In Panel A, citizen variables refer to independent variables pertaining to citizenbehavior or survey measures and are defined as follows: accommodate bribes is a survey measure defined as an indicator variableequal to 1 if the citizen reports agreeing that the best way to overcome problems is to pay bribes, and 0 otherwise; amountsent in trust game is the amount sent by the citizen to the leader in the trust game (Section 2); high trust in leaders is a surveymeasure defined as an indicator variable equal to 1 if the citizen reports trusting leaders “a lot” (highest of four options), and 0otherwise. In Panel B, leader variables refer to independent variables pertaining to leader behavior or survey measures and aredefined as follows: appropriation is the proportion of community funds that is observed as being appropriated by the leader inthe incentivized structured community activity (see Section 2.1); share returned in the trust game is the proportion returned bythe leader in the trust game (Section 2); accountability is a survey measure indicating whether the leader reports agreeing that thecommunity supports accountability and takes values 0 (disagree), 1 (neither agree nor disagree), and 2 (agree). The full list ofcontrols is provided in Section 3.1.
16

B.8 Community outcomes
This section studies whether there are any significant associations between corruption and
broader community outcomes. First, we examine whether citizens witnessed and were involved
in any violent event. We build a crime index using information about whether the citizen was
involved in the following type of violence in the three months previous to the interview: ver-
bal violence, physical violence, violence against women, theft, and property destruction. The
index is constructed using a simple equally-weighted linear combination of the indicator vari-
ables for the involvement in each type of crime. Therefore the index ranges from 0 (no crime)
to 5 (all types of crime). Panel A in Figure B2 shows the distribution of the crime index in the
sample of citizens.
The second outcome of interest is citizens’ participation in public good provision within
their communities. We construct an index which aggregates four survey questions about whether
the citizen contributed towards public goods in the 12 months previous to the interview. The
questions asked whether the citizen attended community meetings, provided any financial con-
tribution for the community, provided any material contribution to the community, or con-
tributed with labor. The index is constructed through a simple equally-weighted linear com-
bination of the four binary variables, thus ranging from 0 (no contribution) to 4 (contributed
in all means). Panel B in Figure B2 shows the distribution of the participation in public good
contribution index in the sample of citizens.
Figure B2: Crime and participation in public good provision
0
.2
.4
.6
.8
Frac
tion
0 1 2 3 4 5Crime index
A. Crime
0
.1
.2
.3
.4
Frac
tion
0 1 2 3 4Participation in public good provision index
B. Public good provision
Note. Panel A shows the distribution of the crime index (N = 2, 045). The index ranges from 0 (no crime) to 5 (all typesof crime). Panel B shows the distribution of the nparticipation in public good contribution index (N = 1, 994). The indexranges from 0 (no contribution) to 4 (contributed with all means).
Both the crime and the public good contribution variables provide us with a sense of the
17

broader implications of our measurements for critical community outcomes. Table B8 show
the results for crime in columns (1)–(3) and for public goods contributions in column (4)–(6).
Examining involvement with crime, the survey-based measure of trust in leaders is negative and
significant, indicating that higher trust in leaders is associated with lower levels of violence.
We also observe a significant positive relationship between leader appropriation and the crime
index. This suggests that the appropriation of funds we privately observe is associated with
real negative consequences for citizens. In addition, citizens with leaders who agree that their
community supports accountability are also significantly less likely to experience crime.
Regarding participation in public good provision, we observe that citizens’ attitudes to-
wards bribes are significantly associated with their contributions. The direction is as expected:
citizens who hold favorable attitudes towards bribes are less likely to contribute to public goods
in their community. Concerning other dimensions, the appropriation of the leader is negatively
related with public goods contributions, but estimates are only marginally significant.
18

Table B8: Behavior, crime and participation in public good provisionDependent variables: Crime Participation in
public good provision(1) (2) (3) (4) (5) (6)
A. Citizen variables
Accommodate bribes 0.070* 0.072* 0.047 -0.152** -0.135** -0.139**(0.040) (0.040) (0.041) (0.066) (0.065) (0.062)
Amount sent in trust game 0.006 0.006 0.007 0.007 0.005 -0.007(0.007) (0.007) (0.008) (0.013) (0.013) (0.013)
High trust in leaders -0.074** -0.071** -0.090*** 0.101* 0.116** 0.055(0.032) (0.032) (0.032) (0.057) (0.057) (0.055)
B. Leader variables
Appropriation 0.067 0.065 0.180*** -0.202 -0.213* -0.112(0.057) (0.057) (0.050) (0.127) (0.127) (0.134)
Share returned in trust game -0.022 -0.028 -0.024 0.211 0.168 0.201(0.100) (0.100) (0.098) (0.222) (0.223) (0.220)
Accountability -0.044** -0.043* -0.045** -0.044 -0.036 -0.020(0.022) (0.022) (0.019) (0.047) (0.047) (0.048)
C. Corruption game
Bribe sent by citizen -0.003 -0.003 -0.003 0.003 0.001 0.013(0.007) (0.007) (0.007) (0.012) (0.011) (0.012)
Bribe chosen by leader -0.011 -0.010 -0.005 -0.006 -0.004 -0.014(0.007) (0.007) (0.006) (0.013) (0.013) (0.013)
Observations 1957 1957 1915 1909 1909 1868R2 0.010 0.011 0.075 0.009 0.025 0.123Citizen and leader controls - Yes Yes - Yes YesCommunity controls - - Yes - - YesLevel of analysis Citizen Citizen Citizen Citizen Citizen Citizen
Note. Results based on OLS regressions. Statistical significance at * 0.1; ** 0.05; *** 0.01. Robust standard errors clusteredat community level. Dependent variables are defined by column: (1)–(3) individual crime index, ranging from 0 (no crime) toa maximum of 5; (3)–(6) individual public good index which ranges from 0 (no contribution) to a maximum of 4. In PanelA, citizen variables refer to independent variables pertaining to citizen behavior or survey measures and are defined as follows:accommodate bribes is a survey measure defined as an indicator variable equal to 1 if the citizen reports agreeing that the best wayto overcome problems is to pay bribes, and 0 otherwise; amount sent in trust game is the amount sent by the citizen to the leader inthe trust game (Section 2); high trust in leaders is a survey measure defined as an indicator variable equal to 1 if the citizen reportstrusting leaders “a lot” (highest of four options), and 0 otherwise. In Panel B, leader variables refer to independent variablespertaining to leader behavior or survey measures and are defined as follows: appropriation is the proportion of community fundsthat is observed as being appropriated by the leader in the incentivized structured community activity (see Section 2.1); sharereturned in the trust game is the proportion returned by the leader in the trust game (Section 2); accountability is a survey measureindicating whether the leader reports agreeing that the community supports accountability and takes values 0 (disagree), 1 (neitheragree nor disagree), and 2 (agree). In Panel C, corruption game refers to: bribe sent by citizen is the number of tokens sent bycitizens to the leader as bribe in the corruption game, ranging from from 0 (citizen gave no bribe) to a maximum of 10; bribechosen by leader is the number of tokens sent by the citizen that is chosen by the leader in the corruption game, ranging from 0(citizen chosen gave no bribe) to a maximum of 10. The full list of controls is provided in Section 3.1.
19
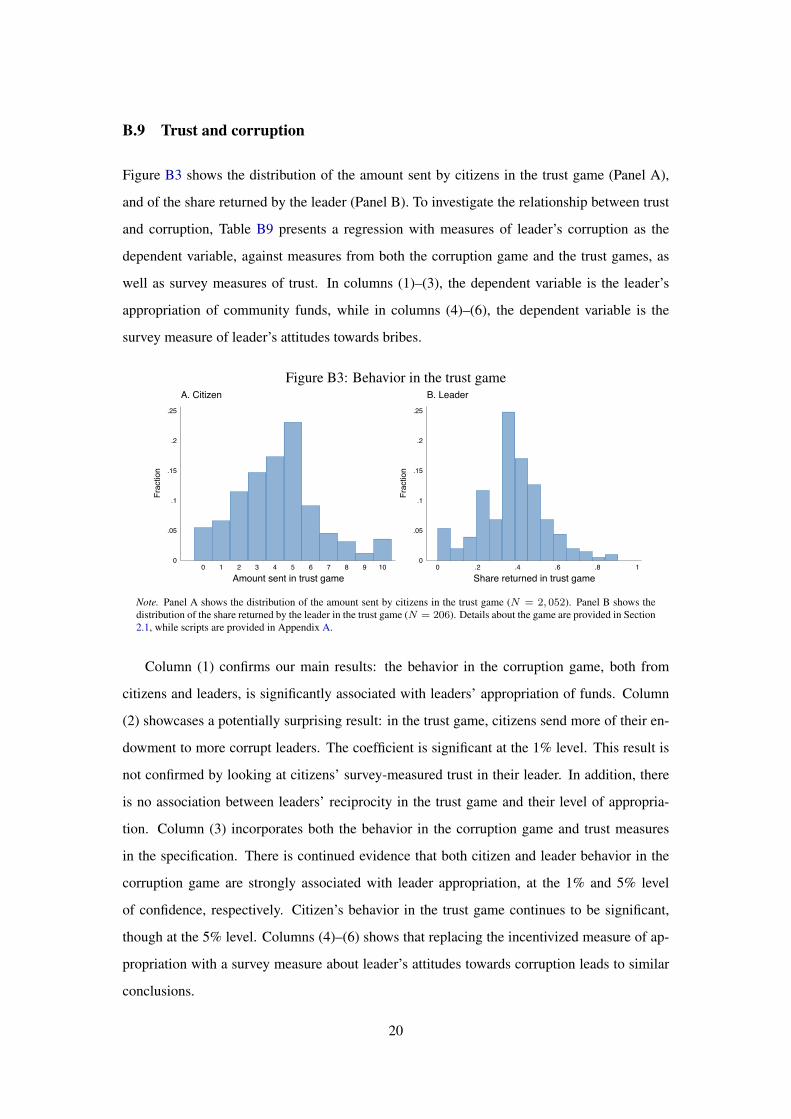
B.9 Trust and corruption
Figure B3 shows the distribution of the amount sent by citizens in the trust game (Panel A),
and of the share returned by the leader (Panel B). To investigate the relationship between trust
and corruption, Table B9 presents a regression with measures of leader’s corruption as the
dependent variable, against measures from both the corruption game and the trust games, as
well as survey measures of trust. In columns (1)–(3), the dependent variable is the leader’s
appropriation of community funds, while in columns (4)–(6), the dependent variable is the
survey measure of leader’s attitudes towards bribes.
Figure B3: Behavior in the trust game
0
.05
.1
.15
.2
.25
Frac
tion
0 1 2 3 4 5 6 7 8 9 10Amount sent in trust game
A. Citizen
0
.05
.1
.15
.2
.25Fr
actio
n
0 .2 .4 .6 .8 1Share returned in trust game
B. Leader
Note. Panel A shows the distribution of the amount sent by citizens in the trust game (N = 2, 052). Panel B shows thedistribution of the share returned by the leader in the trust game (N = 206). Details about the game are provided in Section2.1, while scripts are provided in Appendix A.
Column (1) confirms our main results: the behavior in the corruption game, both from
citizens and leaders, is significantly associated with leaders’ appropriation of funds. Column
(2) showcases a potentially surprising result: in the trust game, citizens send more of their en-
dowment to more corrupt leaders. The coefficient is significant at the 1% level. This result is
not confirmed by looking at citizens’ survey-measured trust in their leader. In addition, there
is no association between leaders’ reciprocity in the trust game and their level of appropria-
tion. Column (3) incorporates both the behavior in the corruption game and trust measures
in the specification. There is continued evidence that both citizen and leader behavior in the
corruption game are strongly associated with leader appropriation, at the 1% and 5% level
of confidence, respectively. Citizen’s behavior in the trust game continues to be significant,
though at the 5% level. Columns (4)–(6) shows that replacing the incentivized measure of ap-
propriation with a survey measure about leader’s attitudes towards corruption leads to similar
conclusions.
20

Table B9: Corruption among leaders and trustDependent variables: Appropriation Leader accommodates bribes
(1) (2) (3) (4) (5) (6)A. Corruption game
Bribe sent by citizen 0.008** 0.006* 0.010** 0.009***(0.003) (0.003) (0.004) (0.003)
Bribe chosen by leader 0.015** 0.016** 0.015* 0.017**(0.007) (0.007) (0.008) (0.008)
B. Trust (citizen)
Amount sent in trust game 0.009** 0.006* 0.009 0.005(0.004) (0.004) (0.006) (0.005)
High trust in leaders 0.006 0.007 -0.005 -0.004(0.012) (0.012) (0.012) (0.012)
C. Trust (leader)
Share returned in trust game -0.018 -0.085 -0.078 -0.141(0.117) (0.117) (0.201) (0.192)
Observations 1999 1999 1999 1989 1989 1989R2 0.323 0.305 0.327 0.223 0.209 0.227Citizen and leader controls Yes Yes Yes Yes Yes YesCommunity controls Yes Yes Yes Yes Yes YesLevel of analysis Leader Leader Leader Leader Leader Leader
Note. Results based on OLS regressions. Statistical significance at * 0.1; ** 0.05; *** 0.01. Robust standard errors clustered atcommunity level. Dependent variables are defined by column: (1)–(3) proportion of community funds that is observed as beingappropriated by the leader in the incentivized structured community activity (see Section 2.1); (3)–(6) survey measure definedas an indicator variable equal to 1 if the leader reports agreeing that the best way to overcome problems is to pay bribes, and 0otherwise. In Panel A, corruption game refers to: bribe sent by citizen is the number of tokens sent by citizens to the leader asbribe in the corruption game, ranging from from 0 (citizen gave no bribe) to a maximum of 10; bribe chosen by leader is thenumber of tokens sent by the citizen that is chosen by the leader in the corruption game, ranging from 0 (citizen chosen gave nobribe) to a maximum of 10. In Panel B, trust (citizen) refers to: amount sent in trust game is the amount sent by the citizen tothe leader in the trust game (Section 2); high trust in leaders is a survey measure defined as an indicator variable equal to 1 ifthe citizen reports trusting leaders “a lot” (highest of four options), and 0 otherwise. In Panel C, trust (leader) refers to: sharereturned in the trust game is the proportion returned by the leader in the trust game (Section 2). The full list of controls is providedin Section 3.1.
B.10 Effect of randomized interventions on behavior in the corruption game
Table B10 shows estimates of treatment effects on citizens’ and leaders’ behavior in the cor-
ruption game. Table B11 shows estimates of treatment effects by connectedness of citizens
with leaders and by power of the leader, in a similar fashion to Table 3 in the main text. In
both tables we condition on citizen and leader variables because the interventions had a signif-
icant effect on appropriation (Armand et al., 2020), which is also an important determinant of
behavior in the game.
21

Table B10: Behavior in the corruption game: effect of information campaignsDependent variable: Bribe ...
sent by citizen to leader chosen by the leader(1) (2) (3) (4) (5) (6)
A. Randomized interventions
Leader treatment 0.280 0.384 0.240 0.287 0.409 0.315(0.258) (0.237) (0.205) (0.506) (0.513) (0.500)
Community treatment 0.144 0.173 0.157 0.121 0.170 0.186(0.231) (0.207) (0.180) (0.424) (0.419) (0.382)
B. Citizen variables
Accommodate bribes -0.024 0.143(0.134) (0.172)
Amount sent in trust game 0.316*** 0.038(0.032) (0.033)
High trust in leaders 0.050 -0.141(0.114) (0.130)
C. Leader variables
Appropriation 0.777** 1.497**(0.309) (0.628)
Share returned in trust game 0.818* 3.779***(0.465) (1.188)
Accountability -0.265** -0.585***(0.102) (0.203)
Observations 2052 2009 1928 2060 2017 1928R2 0.002 0.072 0.166 0.002 0.139 0.227Citizen and leader controls - Yes Yes - Yes YesCommunity controls - Yes Yes - Yes YesLevel of analysis Citizen Citizen Citizen Leader Leader Leader
Note. Results based on OLS regressions. Statistical significance at * 0.1; ** 0.05; *** 0.01. Robust standard errors clustered atcommunity level. Dependent variables are defined by column: (1)–(3) number of tokens sent by citizens to the leader as bribein the corruption game, ranging from from 0 (citizen gave no bribe) to a maximum of 10; (3)–(6) number of tokens sent by thecitizen that is chosen by the leader in the corruption game, ranging from 0 (citizen chosen gave no bribe) to a maximum of 10.Details about the game are provided in Section 2. In Panel A, randomized interventions refer to indicator variables for treatmentsof Armand et al. (2020). In Panel B, citizen variables refer to independent variables pertaining to citizen behavior or surveymeasures and are defined as follows: accommodate bribes is a survey measure defined as an indicator variable equal to 1 if thecitizen reports agreeing that the best way to overcome problems is to pay bribes, and 0 otherwise; amount sent in trust game isthe amount sent by the citizen to the leader in the trust game (Section 2); high trust in leaders is a survey measure defined asan indicator variable equal to 1 if the citizen reports trusting leaders “a lot” (highest of four options), and 0 otherwise. In PanelC, leader variables refer to independent variables pertaining to leader behavior or survey measures and are defined as follows:appropriation is the proportion of community funds that is observed as being appropriated by the leader in the incentivizedstructured community activity (see Section 2.1); share returned in the trust game is the proportion returned by the leader in thetrust game (Section 2); accountability is a survey measure indicating whether the leader reports agreeing that the communitysupports accountability and takes values 0 (disagree), 1 (neither agree nor disagree), and 2 (agree). The full list of controls isprovided in Section 3.1.
22

Tabl
eB
11:C
onne
cted
ness
and
pow
er:e
ffec
tofi
nfor
mat
ion
cam
paig
nsD
epen
dent
vari
able
:B
ribe
sent
byci
tizen
toa
[...]
lead
erB
ribe
chos
enby
[...]
lead
erN
otco
nnec
ted
Con
nect
edN
otes
tabl
ishe
dE
stab
lishe
dN
otes
tabl
ishe
dE
stab
lishe
d(1
)(2
)(3
)(4
)(5
)(6
)A
.Ran
dom
ized
inte
rven
tions
Lea
dert
reat
men
t0.
364
0.15
9-0
.768
**0.
545*
*-0
.949
1.20
7*(0
.304
)(0
.226
)(0
.307
)(0
.271
)(0
.783
)(0
.649
)C
omm
unity
trea
tmen
t0.
157
0.15
4-0
.249
0.20
90.
020
0.71
9(0
.237
)(0
.197
)(0
.280
)(0
.238
)(0
.682
)(0
.491
)B
.Citi
zen
vari
able
s
Acc
omm
odat
ebr
ibes
-0.2
780.
106
-0.0
100.
164
0.33
5-0
.010
(0.2
22)
(0.1
84)
(0.1
63)
(0.2
30)
(0.2
27)
(0.1
61)
Am
ount
sent
intr
ustg
ame
0.28
5***
0.34
6***
0.24
9***
0.35
3***
-0.0
270.
049
(0.0
53)
(0.0
41)
(0.0
48)
(0.0
48)
(0.0
41)
(0.0
37)
Hig
htr
usti
nle
ader
s0.
037
0.06
30.
022
0.04
4-0
.126
-0.1
02(0
.170
)(0
.144
)(0
.166
)(0
.151
)(0
.182
)(0
.107
)C
.Lea
der
vari
able
s
App
ropr
iatio
n1.
186*
**0.
347
1.47
6***
0.61
22.
143*
1.76
0***
(0.4
06)
(0.3
41)
(0.5
17)
(0.3
78)
(1.1
20)
(0.6
19)
Shar
ere
turn
edin
trus
tgam
e1.
465*
*0.
279
1.37
4*0.
560
1.51
86.
516*
**(0
.632
)(0
.529
)(0
.750
)(0
.764
)(1
.794
)(1
.580
)A
ccou
ntab
ility
-0.2
04-0
.315
***
-0.0
49-0
.189
-0.2
84-0
.765
***
(0.1
35)
(0.1
08)
(0.1
47)
(0.1
33)
(0.3
44)
(0.2
76)
Obs
erva
tions
774
1154
976
952
976
952
R2
0.17
70.
195
0.19
20.
213
0.29
30.
485
Citi
zen
and
lead
erco
ntro
lsY
esY
esY
esY
esY
esY
esC
omm
unity
cont
rols
Yes
Yes
Yes
Yes
Yes
Yes
Lev
elof
anal
ysis
Citi
zen
Citi
zen
Citi
zen
Citi
zen
Lea
der
Lea
der
Not
e.R
esul
tsba
sed
onO
LS
regr
essi
ons.
Stat
istic
alsi
gnifi
canc
eat
*0.
1;**
0.05
;***
0.01
.Rob
usts
tand
ard
erro
rscl
uste
red
atco
mm
unity
leve
l.D
epen
dent
vari
able
sar
ede
fined
byco
lum
n:(1
)–(4
)num
ber
ofto
kens
sent
byci
tizen
sto
the
lead
eras
brib
ein
the
corr
uptio
nga
me,
rang
ing
from
from
0(c
itize
nga
veno
brib
e)to
am
axim
umof
10;(
5)–(
6)nu
mbe
rof
toke
nsse
ntby
the
citiz
enth
atis
chos
enby
the
lead
erin
the
corr
uptio
nga
me,
rang
ing
from
0(c
itize
nch
osen
gave
nobr
ibe)
toa
max
imum
of10
.C
olum
n(1
)re
stri
cts
the
sam
ple
toci
tizen
sth
atdo
notp
erso
nally
know
the
lead
er(n
otco
nnec
ted
lead
er),
and
colu
mn
(2)t
oci
tizen
sth
atpe
rson
ally
know
the
loca
llea
der(
conn
ecte
dle
ader
),us
ing
netw
ork
data
amon
gci
tizen
s(s
eeA
rman
det
al.,
2020
ford
etai
ls).
Col
umns
(3)a
nd(5
)res
tric
tthe
sam
ple
tole
ader
sth
atar
eno
test
ablis
hed
(i.e
.in
pow
erfo
rle
ssth
an7
year
s,w
hich
corr
espo
nds
toth
esa
mpl
em
edia
n),w
hile
colu
mns
(4)
and
(6)
rest
rict
the
sam
ple
tole
ader
sth
atar
ees
tabl
ishe
d.In
Pane
lA,r
ando
miz
edin
terv
entio
nsre
fer
toin
dica
tor
vari
able
sfo
rtr
eatm
ents
ofA
rman
det
al.(
2020
).In
Pane
lB,c
itize
nva
riab
les
refe
rto
inde
pend
entv
aria
bles
pert
aini
ngto
citiz
enbe
havi
oror
surv
eym
easu
res
and
are
defin
edas
follo
ws:
acco
mm
odat
ebr
ibes
isa
surv
eym
easu
rede
fined
asan
indi
cato
rvar
iabl
eeq
ualt
o1
ifth
eci
tizen
repo
rts
agre
eing
that
the
best
way
toov
erco
me
prob
lem
sis
topa
ybr
ibes
,and
0ot
herw
ise;
amou
ntse
ntin
trus
tgam
eis
the
amou
ntse
ntby
the
citiz
ento
the
lead
erin
the
trus
tgam
e(S
ectio
n2)
;hig
htr
usti
nle
ader
sis
asu
rvey
mea
sure
defin
edas
anin
dica
torv
aria
ble
equa
lto
1if
the
citiz
enre
port
str
ustin
gle
ader
s“a
lot”
(hig
hest
offo
urop
tions
),an
d0
othe
rwis
e.In
Pane
lC,l
eade
rva
riab
les
refe
rto
inde
pend
entv
aria
bles
pert
aini
ngto
lead
erbe
havi
oror
surv
eym
easu
res
and
are
defin
edas
follo
ws:
appr
opri
atio
nis
the
prop
ortio
nof
com
mun
ityfu
nds
that
isob
serv
edas
bein
gap
prop
riat
edby
the
lead
erin
the
ince
ntiv
ized
stru
ctur
edco
mm
unity
activ
ity(s
eeSe
ctio
n2.
1);s
hare
retu
rned
inth
etr
ustg
ame
isth
epr
opor
tion
retu
rned
byth
ele
ader
inth
etr
ustg
ame
(Sec
tion
2);a
ccou
ntab
ility
isa
surv
eym
easu
rein
dica
ting
whe
ther
the
lead
erre
port
sag
reei
ngth
atth
eco
mm
unity
supp
orts
acco
unta
bilit
yan
dta
kes
valu
es0
(dis
agre
e),
1(n
eith
erag
ree
nord
isag
ree)
,and
2(a
gree
).T
hefu
lllis
tofc
ontr
ols
ispr
ovid
edin
Sect
ion
3.1.
23