Embed Size (px)
Citation preview

European Research Centre for Anti-Corruption and State-Building
Working Paper No. 48
Measuring Control of Corruption by a New Index of Public Integrity
Alina Mungiu-Pippidi Ramin Dadašov
Hertie School of Governance
April 2016
www.againstcorruption.eu
ER
CA
S W
ork
ing
Pape
rs
1
1. Abstract
While the last twenty years saw the invention of corruption rankings, allowing comparison over
countries and the shaming of corrupt governments, such measurements are largely based on
perceptions of experts, lacking both specificity and transparency. New research, based on a
comprehensive theory of governance defined as the set of formal and informal institutions
determining who gets what in a given context, allows more specific and objective, although indirect
measurements of control of corruption. Such measurements focus on the institutional framework
which empowers public integrity and eliminates many current anticorruption tools, while validating
others. Most importantly, it provides a broader specific context which can empower reforms based
on evidence and a clear measure to determine status and progress of corruption control.1
Keywords: corruption, public integrity, measurement, anticorruption policy
1 A. Mungiu-Pippidi is Professor of Democracy Studies: [email protected]. R. Dadasov is postdoctoral
researcher for ANTICORRP: [email protected]. This research was made possible by support from the
EU FP7 ANTICORRP project (Grant agreement no: 290529) at the Hertie School of Governance.
2
Table of Contents
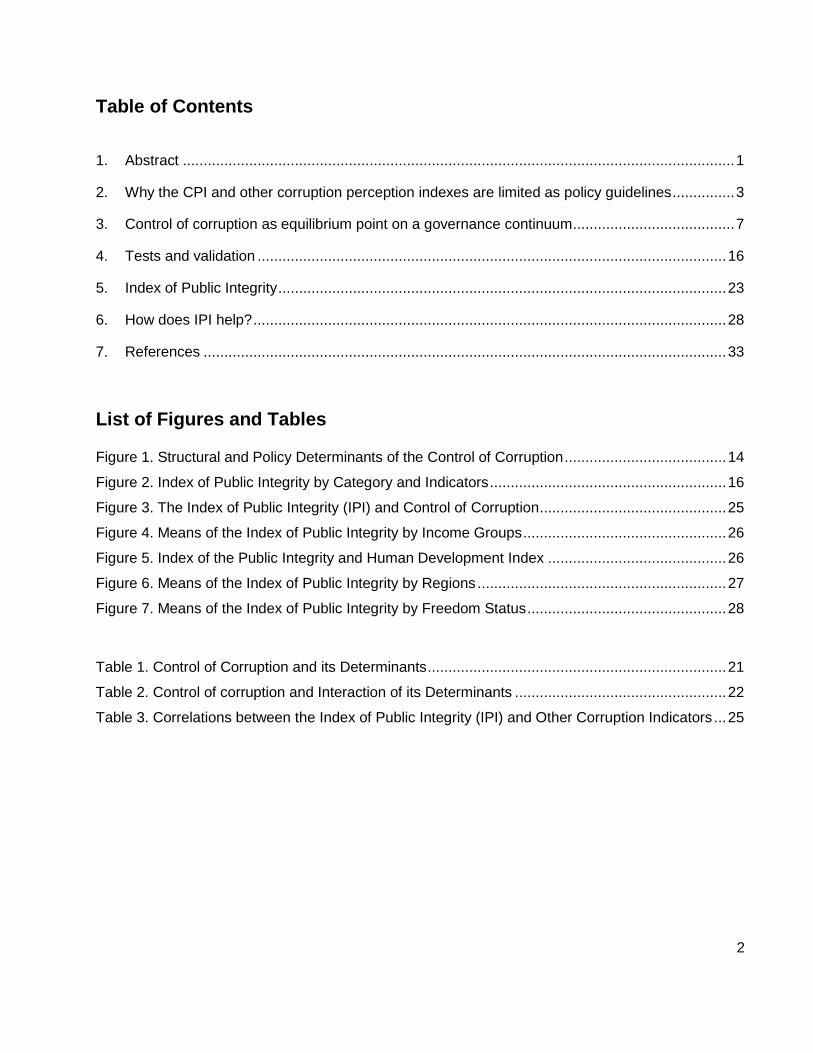
1. Abstract ..................................................................................................................................... 1
2. Why the CPI and other corruption perception indexes are limited as policy guidelines ............... 3
3. Control of corruption as equilibrium point on a governance continuum ....................................... 7
4. Tests and validation ................................................................................................................. 16
5. Index of Public Integrity ............................................................................................................ 23
6. How does IPI help? .................................................................................................................. 28
7. References .............................................................................................................................. 33
List of Figures and Tables
Figure 1. Structural and Policy Determinants of the Control of Corruption ....................................... 14
Figure 2. Index of Public Integrity by Category and Indicators ......................................................... 16
Figure 3. The Index of Public Integrity (IPI) and Control of Corruption ............................................. 25
Figure 4. Means of the Index of Public Integrity by Income Groups ................................................. 26
Figure 5. Index of the Public Integrity and Human Development Index ........................................... 26
Figure 6. Means of the Index of Public Integrity by Regions ............................................................ 27
Figure 7. Means of the Index of Public Integrity by Freedom Status ................................................ 28
Table 1. Control of Corruption and its Determinants ........................................................................ 21
Table 2. Control of corruption and Interaction of its Determinants ................................................... 22
Table 3. Correlations between the Index of Public Integrity (IPI) and Other Corruption Indicators ... 25

3
2. Why the CPI and other corruption perception indexes are limited
as policy guidelines
One day in October 2015, the Prime Minister of Moldova, a splinter Republic from former USSR with
four million inhabitants decided to sack of head of the national anticorruption centre CNA, soon after
this agency had arrested his party boss, a former Prime Minister himself. So far a common gesture-
heads of anticorruption agencies are frequently dismissed especially if they take their job seriously
and arrest top people- but Prime Minister Valeriu Strelet was most inventive in his motivation. He
claimed that he had the top anticorruption job reshuffled because Moldova regressed in the
Corruption Perception Index (CPI) of Transparency International (TI) compared to the previous
year.2
The first catch is that due to methodological issues, the CPI could not be used to compare across
time until very recently. TI itself warns readers about this (largely without result) on its website
(Transparency International 2012). Despite some recent repairs of methodology its safest use is to
simply compare across countries. The second catch is that there is no way of knowing exactly why
Moldova regressed that year. Just as with the World Bank’s Control of Corruption indicator (WGI),
the CPI only aggregates subjective assessments of national corruption, the exact components of
which are hard to decipher since their scores were normalized. In other words, these indexes are an
attempt to build objective measures through the statistical aggregation of multiple subjective
evaluations. While the exercise manages to create a reasonable framework for comparing across
countries, as we have argued elsewhere (ACR 2013, Mungiu-Pippidi 2015), the index remains
obscure as to what the country has done right or wrong or even who has done something right or
wrong, as trends within a government or a society are not necessarily unitary.
The head of an anticorruption agency can therefore not be hold accountable and sacked for not
managing to improve the ranking of his country on such opaque and imprecise data. The only thing
the CPI can tell us about Moldova that year is that the level of corruption was still worse than
Estonia but probably better than Azerbaijan. It is difficult, however, to be sure of the latter, as a
2http://protv.md/stiri/actualitate/moldova-mai-corupta-in-2015-decat-in-2014-indicele-de-perceptie---
1337721.html; http://www.mediafax.ro/externe/premierul-republicii-moldova-a-initiat-procedura-pentru-
demiterea-procurorului-sef-anticoruptie-14850525

4
billion euros was reported stolen from the main Moldovan banks that year despite them being under
the supervision of the National Bank and the International Monetary Fund (IMF) ..
It becomes clear then what seems to be missing from the index that Prime Minister Strelet quotes.
First, a more transparent methodology would allow to trace evolution from one year to another, while
keeping the capacity to compare across countries. Second, more concreteness and specificity
would permit to observe the area where the evolution does or does not take place, e.g. the judiciary,
the administration, etc. Tracing down trends to specific developments or sectors would bring great
value for policy action, especially since we know that formal developments, like the adoption of
legislation, do not necessarily have an impact and but that corruption can be found in different
practices (Lambsdorff 2008).
To sum up, the major concerns on the aggregate perception indicators can be synthesized as
follows:
Lack of validity of underlying theoretical concepts and of a unitary theory on corruption and
governance. The WGI and TI measurements are not based on a thoroughly systematized
concept as they rely on various sources with different definitions. That is, instead of having
an explicit common definition, they are defined implicitly by the available surveys, which are
used for their construction (Knack 2006, Voigt 2009). Although the construction of the WGI
index is based on the (unobserved) component analysis which extracts the common factor
out of different sources, thereby making the index comparable across countries, the
aggregate index cannot naturally distinguish between particular frames of corruption by
original sources, constraining also its usefulness for policy purposes.3 The index developers
themselves acknowledge this potential limitation (Kaufmann et al. 2007b).
Lagging nature of indicators. As noted by Knack (2006) and Hawken and Munck (2009),
changes in the assessments of governance might reflect corrections of errors done in the
past. Notable example in this context is the worsening of Control of Corruption scores in
Greece, Spain, Italy, and Portugal in the aftermath of the recent financial and fiscal crisis
which might have resulted from a reassessment of the governance context in the individual
data sources. Another related example is the behaviour of the perception indicators which
3 The construction of the CPI is, by contrast, based on simple averaging, which makes the problem of
aggregation of different concepts even more severe.

5
showed corruption in Indonesia to be falling until the 1997 financial crisis and rising after the
crisis (Hawken and Munck 2009).4
Non-actionable nature of such aggregates. Previous two points imply that the possibility to
use this indicator for guiding policymakers and thus to monitor the effectiveness of any
anticorruption policy is very limited. Moreover, until very recently the methodology of CPI,
has not even allowed for comparison across years even with limitations. Theoretically, the
methodology of the WGI allows for comparison over time; in practice, however, Control of
Corruption scores exhibit large time persistence. Therefore these indicators can even be
harmful for policymakers since their insensitivity to change might give the wrong feedback
about the potential outcome of the corresponding reforms (Galtung 2006).
While criticism towards these indexes can be found in plenty, attempts to either replace them or
improve on them have been less frequent. The purpose of this study is to build on the state of the
art in corruption studies, in particular the work of Bretton Woods institutions (Tanzi 1994; Mauro
1995; Kaufmann et al. 1999; Huther and Shah 2000; Kaufmann et al. 2011) and ours (Mungiu-
Pippidi 2006; 2014; 2015), to develop and validate a new construct of control of corruption.
According to Nunnally and Bernstein (1994: 86-87), three major aspects of construct validation need
to be considered: (1) specifying the domain of observables related to the construct; (2) determining
the extent to which observables tend to measure the same thing from empirical research and
statistical analyses; and (3) performing subsequent individual difference studies and/or experiments
to determine the extent to which supposed measures of the construct are consistent “best guesses”
about the construct. In accordance to this strategy, we undertook the following steps:
1. We carefully reviewed all separate items associated with control of corruption in econometric
literature, identified correlations between them and grouped them into related categories.
2. We defined and adopted the categories based on the theory offered by Mungiu-Pippidi
(2006). It sees the control of corruption as a continuum that ranges from absolute
particularism (all allocation of public resources and goods in a society is based on some
particular connection between the power holders who authorize the allocation and the
receiving party) to absolute ethical universalism (allocation is impartial and impersonal,
based on equality). In corrupt societies, transactions based on particularism constitute a
majority, while in less corrupt ones ethical universalism become the norm and particularism
4 However, Kaufmann et al. (2007b) do not find systematic evidence that proves this argument.

6
the exception. Rather than normatively identifying a benchmark of good governance we that
a society’s position on this continuum is an equilibrium determined by the resources that
facilitate the spoiling of the state and the constraints that prevent such an occurrence
(Mungiu-Pippidi 2015, ch. 4).
3. We tested the resources vs. constraints model described above and found it valid at national
level on a panel of 119-153 countries in time series, with some foreseeable limitations due to
the subjective nature of dependent variables (CPI, CoC and Global Corruption Barometer
survey item”Most officials are corrupt”) and the linkage between variables in the model. This
is reported in Mungiu-Pippidi 2015 (chapter 4).
4. Further on, we selected a single proxy from each category of variables (on grounds of their
effectiveness as determinants, policy relevance and availability of continuous documentation
in the public domain as open data) and rebuilt the model with these determinants or pairs of
them (one for resources and one for constraints) showing that the interaction multiplies their
effect and the equilibrium is thus a result of both.
5. We then engage in the construction of the scale by correlating one item per category and
extracting a principal component, which we label as “Index of Public Integrity”. We then
classify countries on the index and each of the components and result with a global ranking
of public integrity.
6. We validate the construct by correlating it with other corruption and development indicators.
The result is an indirect way of capturing the national level of control of corruption which we infer
from our own statistical exercises and fully based on institutional factors empirically proven to be
significantly associated with effective control of corruption.
The selected factors capture the following elements: the degree of the judicial independence, the
extent of administrative discretion, the level of trade openness, the degree of budget transparency,
the endowment of citizens with electronic means which can be used to supervise government and/or
associate among themselves, and the degree of free media. We identify for almost each objective
indicators. In addition to their separate significant association with control of corruption, we also
show how possible interactions of these factors might create control of corruption. These factors are
thus supposed to reflect the complex mechanisms between transparency and accountability on one
side and limited resources for discretionary power on the other, in order to establish a national
framework for public integrity. In the next step, we therefore combine them into one single indicator.
By doing so, we rely on the observation that these factors are mutually correlated to a certain extent
and extract the common component, which we label as the overall Index of Public Integrity (IPI).

7
The IPI covers 105 countries and explains more than 75% of cross-national variation of control of
corruption as measured by the corresponding World Bank indicator. Furthermore, it correlates highly
with some other popular corruption measurements. Unlike those measurements, however, the Index
of Public Integrity allows to trace back a country’s performance to specific actionable components
that can help policy makers identify reform areas for improvement. Although the IPI is strongly
correlated with the development level of countries, its variation cannot be mainly explained by the
income differences between the countries, which means that it is leaving sufficient room for policy
action. Moreover, with exception of the Western societies, which unsurprisingly show on average
the highest scores on the public integrity scale, the mean IPI values of other regions do not differ
significantly across them. This additionally suggests that policies that can promote better control of
corruption are not bounded by the geographical differences across countries.
The next section introduces the categories at the basis of IPI and their theoretical foundation.
Section 3 then offers the updated statistical evidence at the basis of our construct and the results of
the validation test attempted so far. Section 4 presents the construction of IPI and the global
distribution of the scores. Section 5 concludes with the possibilities opened for each country to
design its own evidence-based good governance strategy.
3. Control of corruption as equilibrium point on a governance
continuum
The academic field has been mostly divided between micro-theoretical models, which dominantly
conceptualize corruption from the principal-agent perspective, and macro-empirical models at the
country level, with insufficient communication across disciplines. A bridge, however, is both possible
and necessary. Below, we briefly summarize the two perspectives and present a framework that
aims to unify an equilibrium theory of control of corruption at macro level.
The micro based principal-agent framework explains corruption as the result of an agent, usually a
bureaucrat, who abuses his public office and thereby betrays the principal’s interest, typically a top-
level policy-maker, for his own individual gain. An important underlying assumption behind this
approach is the existence of information asymmetry that prevents the principal to effectively monitor
and control the agent’s behavior. In other words, corruption at the individual level is attributed, as
are other criminal activities (see e.g., Becker 1968), to individuals’ weighting of the expected costs
and benefits of their actions in a given context. This approach was formalized by Klitgaard (1988) in

8
his well-known formula that explains corruption as a function of monopoly power over a good or
service, the discretion to decide who receives it, and the degree of accountability of public
authorities.
The principal-agent framework has become a dominant approach to explain corruption and its
consequences. For example, in their seminal paper Shleifer and Vishny (1993) take the principal
agent problem as given and analyse how corrupt activities among bureaucrats, in form of accepting
bribes, arise depending on the types of public services they provide and the organizational structure
of the administrations. Acemoglu and Verdier (2000) ask how the ability of a government to control
and punish its bureaucrats feeds back into corruption and misallocation of resources; and Ades and
Di Tella (1999) look at the (bureaucrats’) incentives to become more corrupt when economic rents
are high. As summarized by Aidt (2003), corruption in the public sector is therefore mainly the result
of three factors: Discretionary power of the relevant public officials, economic rents and weak
administrative institutions.
Consequently, the design of the most anti-corruption policies in developing countries has largely
followed the principal-agent framework (Persson et al. 2013). For example, Huther and Shah (2000)
developed an evaluation framework for the World Bank’s anti-corruption programs that was based
on the incentives for opportunistic behaviour by public officials. Effective anti-corruption programs
should accordingly aim at “reducing the number of transactions involving public officials, reducing
the scope for gains from each transaction, increasing the probability of paying a penalty, or
increasing the penalty from corrupt behaviour” (Huther and Shah 2000, p. 3). Moreover, the
principal-agent framework implies that that the implementation of the resulting anti-corruption
policies not only requires the existence of a non-corrupt principal, but also that only some specific
and mostly incremental institutional changes are necessary in order to curb and prevent corruption
(Rothstein 2011).
This is the background of the policy approach centered on repression of corruption as deviation from
a norm. In fact, the international anti-corruption community and inter-governmental organizations
developed and promoted a number of must-have specific anti-corruption policy instruments and
legal standards, which have been subsequently adopted en masse by countries. The establishment
of an anti-corruption agency (ACA) has been one of the most prominent recommendations in this
context. Arguments that the ACAs are as likely to be affected by the same problems as any other
public sector institution failed to convince donors and governments (Doig et al. 2006) and by 2008,
98 countries had already adopted an ACA by the OECD categorization. Scholars found, however,

9
that countries which adopted an ACA had not progressed more than countries which did not
(Mungiu-Pippidi et al. 2011), especially in countries which had not historically attained rule of law,
with weak conventional law enforcement bodies (e.g., police, courts, attorney-general offices), even
if in some isolated cases the agencies themselves managed to be very active.
This lack of impact of ACAs points to the crucial problem of addressing corruption from a principal-
agent perspective: How realistic is it to insulate an agency from domestic politics to make it an
objective and effective principal? Why would governments in countries where particularism
remains the rule of the game want to change a status quo which is so profitable for their rents and
empower truly independent, well-trained and equipped anti-corruption agencies to fight against
themselves, and not use against political opponents? Accordingly, after gathering some experience,
reports have started to warn that ACAs should not be created without a “systematic assessment of
the local (political) context” (USAID 2006: 5). Other related studies also suggest that the success of
the anti-corruption efforts, which are based on legal instruments and constraints alone, has been
very limited around the world (see, e.g., Fjeldstad and Isaksen 2008; Johnsøn et al. 2012; Persson
et al. 2013). Furthermore, as documented by Global Integrity, countries with the best legal
equipment are far from being the least corrupt.5
To conclude, the principal agent model does not work except at the individual level- in other words,
when corruption is an exception and the broader norm is ethical universalism. For the rest, which
means for most of the developing world, the approach is not helpful because it ignores context:
where particularism is the norm, predatory elites largely control also law enforcement and civil
service and people are not equal before the law. Designing ‘incentives’ for individuals to be less
corrupt, as this school of thought conceives anti-corruption has not worked so far as societies can
hardly offer more to the elites which already hijacked their natural resources and public budget and
spoil them for their own profit.
5 The last relatively large scale Global Integrity report was produced in 2011. Since then the organization has
been struggling to continue its work. Reports and further information can be accessed here:
https://www.globalintegrity.org/global-report/what-is-gi-report/. See also Lambsdorff (2008) for an assessment
of the gap between anti-corruption legal framework and the actual practice; and a related joint study on the
implementation gap by the Center for International Private Enterprise and Global Integrity:
http://www.cipe.org/sites/default/files/publication-docs/GI%20CIPE_Implementation%20Gap_for%20web.pdf

10
At a macro level, the dominant model of control of corruption resulting from cross-country empirical
literature oscillates between two broad categories of factors: i) structural and cultural factors
(population, legacies, religion, past regimes, development); ii) current politics, policy and
constitutional factors. We operate for our index mainly with some key factors from the latter category
as the relevance of the first set of factors for any meaningful policy is quite restricted. (See, e.g.,
Svensson 2005; Seldadyo and De Haan 2006; Treisman 2007; Mungiu-Pippidi et al. 2011 for more
extensive surveys). We do believe that the first set of factors can be considered as determinants of
the second, and is therefore included indirectly. We can consider that the entire history of a country
is conducive to its present quality of governance, but we do not see any reason to consider this as
other than a context control, which still allows human agency in any given society to plan and
implement actions for better governance, even if with widely varied chances of success (Johnston
2012).
The summary of a country’s social and economic history is embodied in the variable known as level
of development – best proxied by the Human Development Index which, in addition to the income
level, comprises measurements of education and life expectancy (Norris and Zinnbauer 2002;
Mungiu-Pippidi et al. 2011; Mungiu-Pippidi 2014). It should also be noted that despite the
determinism of human development for the quality of governance, at least two fifths of the variation
remains unexplained, with impressive overachievers (countries which control corruption far better
than predicted by their HDI, like Chile, Botswana, Scandinavian countries) and under-achievers
(countries which do far worse than they should, like Venezuela, Zimbabwe, Russia, most Central
Asian countries). While the consensus seems to bend towards those who claim that development
does not occur when predatory elites are in charge and spoil resources without restraint, what
Acemoglu and Robinson (2012) call “extractive institutions”, there is also broad consensus on the
complex causality of this relation (Bardhan 1997).6
The association between corruption and political development is equally complex. Montinola and
Jackman (2002) and Treisman (2007) find a significant nonlinear relationship between democracy
and corruption noting that this is potentially driven by older and consolidated democracies. The
6Treisman (2007) shows that the significant relationship between income levels and corruption also holds
using historical GDP per capita data as an instrument for its current realization. Other strand of literature
focuses on the growth and corruption nexus where the causality might be reversed with high corruption
reducing long-term growth rates (see, e.g., Mauro 1995; Aidt et al. 2008).

11
association of the extent of corruption with more specific democratic institutions, such as protection
of personal autonomy (measured by the data from the Freedom House) or with the physical rights
integrity index (a measure of basic political rights by Cingranelli and Richards 1999) seem to be
more robust and strong (Mungiu-Pippidi 2014; 2015; ch. 4). In other words, what matters to a
democracy in terms of control of corruption is not elections as one-time mechanisms for selecting
between candidates, but rather the permanent capacity to ensure that whoever is elected respects
individual rights, autonomy, and voice (Persson and Tabellini 2003).
The control of corruption explanation thus cuts across economic and political development and
seems to reside largely in the area of modernization theory. Societies which do not fulfill the basic
requirements of economic and political modernization, such as literacy, economic individual
autonomy and some balance of power between rulers and the ruled do not manage to control
corruption and their states remain in the grip of private interest (Mungiu-Pippidi 2015). Control of
corruption is indeed significantly associated with most of these components of modernity. Low life
expectancy, rural residence, and low average schooling (in descending order of explanatory power)
all significantly increase the likelihood that a country will be corrupt. But individual education does
not discriminate between corrupt and non-corrupt behavior (Mungiu-Pippidi 2015), the significance
of education as a predictor of national corruption must be elsewhere, in something that educated
individuals as a group can perform, which would explain why countries with more educated people
perform better. And this action aggregated in time seems to be the essential factor, otherwise when
testing the impact of aggregate years of schooling at 1900 on control of corruption we should not
find a staggering 70 percent explanatory power (Uslaner and Rothstein 2012), which indicates a
long, complex determinism of the current governance regime. It also explains why governance
evolution is so incremental and path dependent.
Political factors and institutional arrangements tested in the literature are plenty, but few are robust
in time series and a large country panel (Persson and Tabellini 2004). Scholars found a positive
impact of press and media freedom (Brunetti and Weder 2003; Kalenborn and Lessmann 2013).
Judicial independence has been often reported to significantly affect the extent of corruption (e.g.,
Ali and Isse 2003, Herzfeld and Weiss 2003, Damania et al. 2004). This factor belongs to a larger
cluster of factors actually measuring executive constraints, the capacity of a society to constrain
government action, which seem influential in most tests. Mixed results exist for political competition -
in our large time series sample we found no consistent evidence on competition, electoral systems
or state organization, although many contradictory reports exist.

12
Significant policy factors impact control of corruption, though they are fewer and some in another
area than we would expect them. Robust evidence points to a positive relationship between the
degree of economic freedom as well as openness (in particular, trade) and effective control of
corruption. The argument behind these findings is that less regulation of economic activities (both
internal and with the rest of the world) create less room for administrative discretion and thereby
reduce the possibilities for rent-seeking. The room for corrupt activities is potentially also reduced by
the higher level of economic competition resulting from less restricted bureaucratic regularities.
Studies that analyse this link using various measurements of the extent of regulations and economic
liberalization are, for example, Ades and Di Tella (1999), Treisman (2000), Park (2003), Gurgur and
Shah (2005), Sequeira (2013), Badinger and Nindl (2014).
Transparency tools and access to information are assumed to prevent the discretionary use of
administrative power and, correspondingly, are documented to be negatively related to the national
level of corruption (e.g., Islam 2006, DiRienzo et al. 2007). In this context, recent works focus on the
ability of new information technologies to promote transparency and social accountability thereby
providing better governance. For example, Elbahnasawy (2014) shows that e-government services
significantly improve control of corruption.
While individual determinants tested are far more in the literature, we argue that the equilibrium
described in micro studies, between crime and punishment (Becker 1968) translates into the macro
world by a categorization of factors as either opportunities (resources) or constraints (costs) (Huther
and Shah 2010; Mungiu-Pippidi et al. 2011; Mungiu-Pippidi 2014; 2015, ch. 4). We can reunite
these important and disparate findings from the literature on causes of corruption under a unitary
concept of control of corruption that we can observe, explain and measure. We believe that
evidence shows the existence of an underlying ‘governance’ concept of the World Governance
Indicators (Kaufmann et al. 2007a; 2011; Langbein and Knack 2010), but we see in this an
opportunity rather than a ground for disputes. An underlying concept of governance order is in line
with the classic political sociology on corruption and clientelism, from Weber to Eisenstadt. On the
basis of Mungiu-Pippidi’s definition of governance as a set of formal and informal rules determining
who gets what in a given society, we describe corruption as an equilibrium determined by the public
resources available for spoiling by the government and its clients and the constraints that the rest of
the society can inflict to prevent such an occurrence, an equilibrium strongly influenced by the
degree of human development of a society rather than a specific form of state organization. The
outcome of the existing equilibrium is the norm in social allocation (more or less particularism in
government transactions) which can be observed and measured (how many of government
13
contracts are given to favorite firms, for instance, see ACR 2013; 2014; 2015). But the equilibrium
itself is best described by its causal framework, not its consequences, the balance between
opportunities and constraints, itself strongly determined by the position and history of a given
country.
Mirroring to some extent the micro, individual-level theoretical approaches, we then define optimal
control of corruption as the capacity of a society to constrain corrupt behaviour in order to enforce
the norm of individual integrity in public service and politics and to uphold a state which is free from
the capture of particular interests. A state’s degree of corruption is then an equilibrium between its
collective resources and constraints. Resources in this concept are by no means restricted to pure
material ones but also comprise opportunities resulting from power discretion. Opportunities are
thus a mixture of resources and the discretion to allow them to be used for rent creation.
Constraints, on the other hand, have to be seen as societal constraints allowing truly independent
limitation of the power to spoil public resources that lies in the hands of those endowed with superior
authority and that generates uneven and particularistic access to public rents, with the resulting
privilege and discrimination. Collective constraints therefore result from of an independent, impartial
and effective judiciary system (legal constraints) as well as an active and autonomous civil society
and free and independent media (normative constraints). A graphic model is provided in Figure 1
with structural factors as background (themselves highly inter-related) and the more immediate
political and policy factors illustrated as resources versus constraints. A more synthetic expression
is this:
Control of Corruption
=
Constraints (Legal + Normative) – Opportunities (Power discretion + Material resources)

14
Figure 1. Structural and Policy Determinants of the Control of Corruption
RESOURCES
CONSTRAINTS
War and
violence
Human development
Geography
and climate
Colonial or Communist Past
Administrative
burden
Judicial
independe
nce
Freedom of
the press
E-citizenship
Budget
transparency
Trade
openness
Under opportunities or resources we find:
Discretionary power resources due not only to monopoly, but also to privileged access
under power arrangements other than monopoly or oligopoly – for example, status groups,
negative social capital networks, social orders, cartels, and so on. Red tape or poor
regulation provides authorities with undue power discretion. Violence or economic inequality
are major sources of power inequality. The acceptance of differences in power status in a
society was described by social psychologist Geert Hofstede as power distance. Its
measurement is closely associated with control of corruption (Mungiu-Pippidi 2015).
Material resources, such as natural resources, public sector jobs, or the funds available
for discretionary distribution such as external aid, subsidies, and any other public resources
which can be turned into spoils or generate rents.
15
Under constraints we describe:
Executive constraints which presume an autonomous, accountable, and effective
judiciary, an effective judiciary review of legislation and an autonomous basis for horizontal
accountability more generally (such as Courts or audit agencies)
Normative constraints, which imply that existing societal norms endorse ethical
universalism and permanently and effectively monitor deviations from that norm (through
public opinion, media, civil society, critical citizens/voters, etc.). For effective sanctions we
need a population of autonomous and critical citizens capable of collective action, not a
mass of citizens merely conforming to the corrupt rules of the game (Norris and Zinnbauer
2002).
Structural factors determine both resources and constraints, which also interact greatly. A
satisfactory disaggregation of this framework by statistical means is not possible. But we do argue
that sufficient robust evidence exists to prove this causal framework, which actually shows that
governance should be understood as a complex path model, not in terms on one exogenous
dependent variable versus the rest. By selecting only the most robust and actionable element per
category, we arrive at the inner circle from the two figures above, divided into six areas, three
roughly covering constraints: electronic empowerment of citizens (e-citizens), judicial independence
and freedom of the media, and three covering opportunities, with red tape as proxy for power
discretion, trade openness for economic rents and budget transparency capturing both material
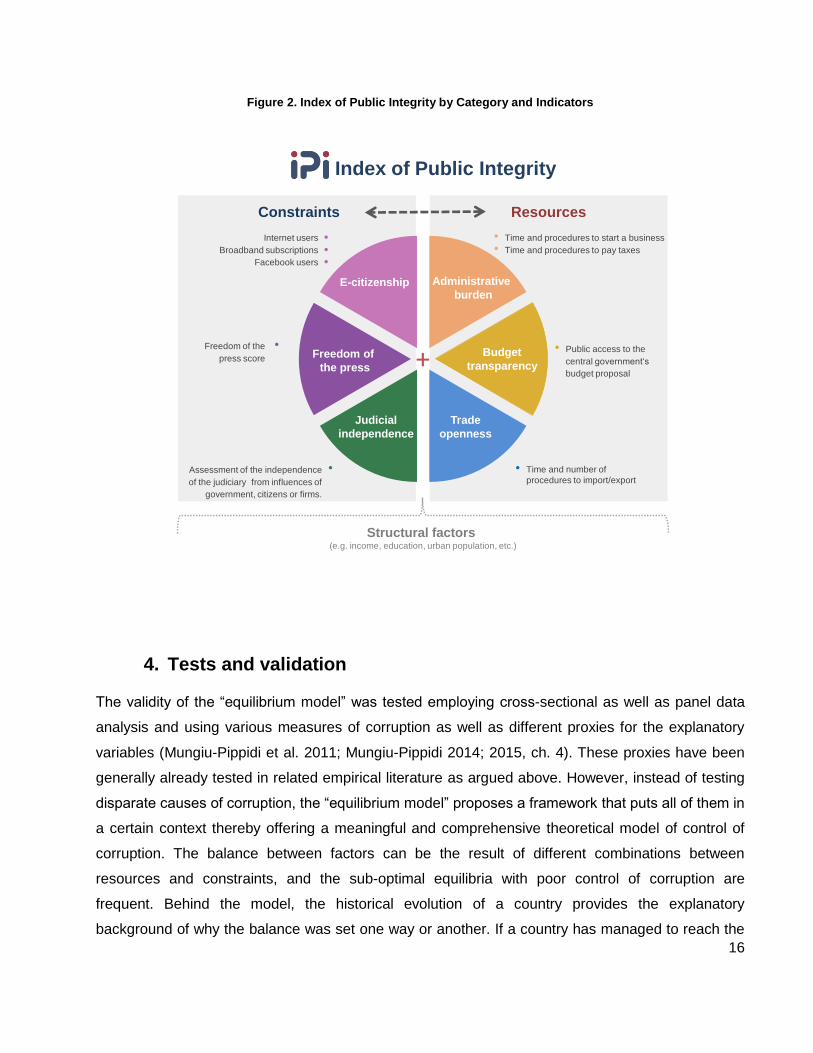
resources and power discretion. A more detailed translation into de facto indicators can be found in
Figure 2, which shows the constructed components. As argued elsewhere, we include judicial
independence because it makes both historical and policy sense to conceive that the judicial elite is
able to check on the bureaucratic and political elite due to its independent selection and career, and
we do not include independence of civil service because we consider it part of the dependent
variable (the government), beyond the absence of trustworthy data on it (Mungiu-Pippidi 2015, ch.
3).
Figure 2. Index of Public Integrity by category and indicators
16
Figure 2. Index of Public Integrity by Category and Indicators
+
•
•
•••
Constraints Resources
Administrative
burden
Judicial
independence
Freedom of
the press
E-citizenship
Budget
transparency
Trade
openness
• Time and procedures to start a business
• Time and procedures to pay taxes
• Public access to the
central government‘s
budget proposal
• Time and number of
procedures to import/exportAssessment of the independence
of the judiciary from influences of
government, citizens or firms.
Freedom of the
press score
Internet users
Broadband subscriptions
Facebook users
Index of Public Integrity
Structural factors(e.g. income, education, urban population, etc.)
4. Tests and validation
The validity of the “equilibrium model” was tested employing cross-sectional as well as panel data
analysis and using various measures of corruption as well as different proxies for the explanatory
variables (Mungiu-Pippidi et al. 2011; Mungiu-Pippidi 2014; 2015, ch. 4). These proxies have been
generally already tested in related empirical literature as argued above. However, instead of testing
disparate causes of corruption, the “equilibrium model” proposes a framework that puts all of them in
a certain context thereby offering a meaningful and comprehensive theoretical model of control of
corruption. The balance between factors can be the result of different combinations between
resources and constraints, and the sub-optimal equilibria with poor control of corruption are
frequent. Behind the model, the historical evolution of a country provides the explanatory
background of why the balance was set one way or another. If a country has managed to reach the
17
optimal balance where control of corruption works, with Norway being one example, it is unlikely the
discovery of natural resources will affect it negatively. But if governance is poor when such
resources are available, their existence will further subvert the possibility that a powerless society
will constrain those who manipulate such resources to increase their advantage. The model cuts
across state and society, suggesting that formal institutions which constrain rulers are a
consequence of the society’s normative constraints, and not the other way around.
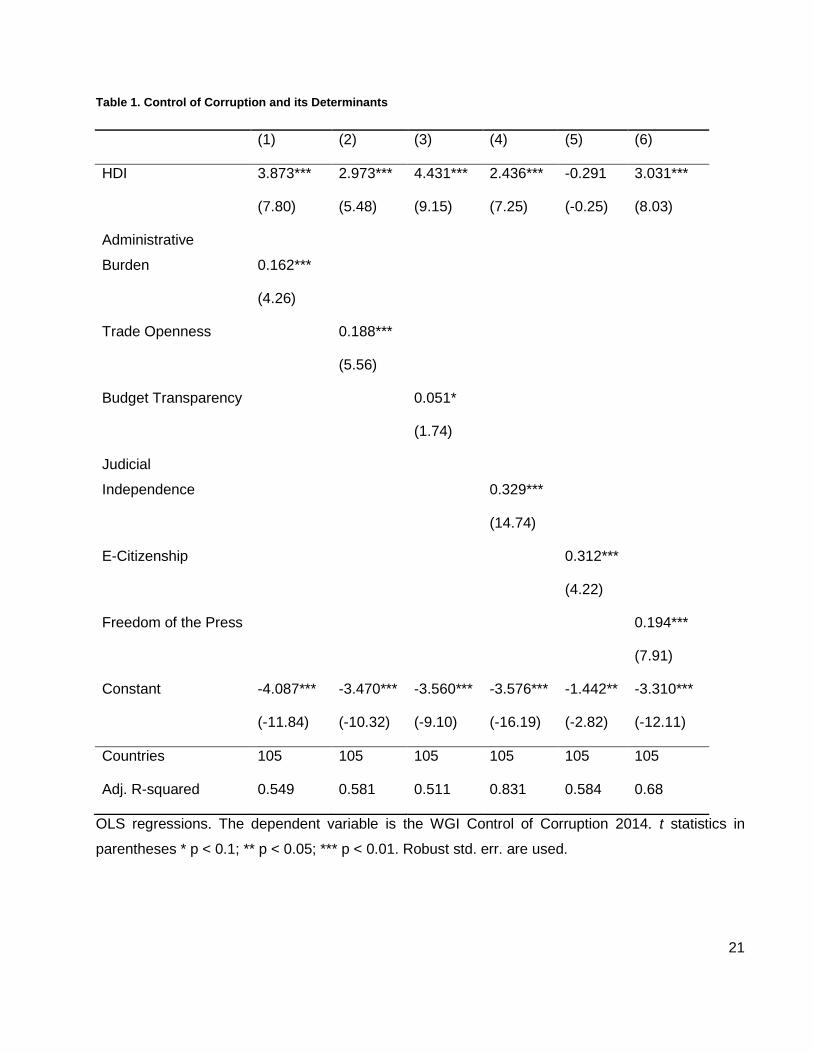
Relying on our theoretical framework and on the evidence from other studies discussed in the
previous section, we present here a basic regression model to illustrate the main significant
components of control of corruption for a sample of 105 countries. Table 1 shows simple OLS
regression results that test the relationship between the WGI’ measure on Control of Corruption and
different indicators, which capture various dimensions of collective constraints and resources. The
selection of these particular indicators can certainly be debated and there is no claim for
completeness. However, this selection is an outcome of a long decision and research process that
needed to take into account the problem of data availability for each of the variables (in terms of
both country coverage and regular updates), objectivity and thus actionability of the measures, and
their consistency with the theoretical framework as well as corresponding empirical literature. All
regressions additionally control for the level of socio-economic development measured by the
Human Development Index (HDI).7 The results show that each of the variables is significantly
associated with control of corruption. Accordingly, these factors can be summarized as follows:
1. Red tape. Excessive administrative and regulatory burden open the doors for discretionary
implementation and non-compliance, resulting in a high risk of corruption. Captured by the
number of procedures and time needed to start a business and pay corporate taxes from the
World Bank’s Doing Business dataset, our measure of red tape or administrative burden
therefore refers to the extent of bureaucratic regulations of domestic entrepreneurial
activities, and is indeed significantly and strongly associated with control of corruption (Model
1). Note that a high value for this indicator means a low degree of administrative burden.
2. Trade barriers. Although being correlated, the extent of regulations covering a country’s
external economic activities does not overlap with the extent of bureaucratic regulations of
domestic entrepreneurial activities. However, we obtain the same relationship between
7 All the results presented in Table 1 also statistically hold when we use alternative measures of corruption
such as, for example, CPI from Transparency International or the ICRG corruption scores.

18
control of corruption and de jure trade openness (Model 2). Open countries can control
corruption better, eliminating room for discretion at the level of administrative trade barriers
and thus allowing free competition. The measure combines the average number of
procedures and time for exporting and importing using data from the Doing Business
datasets.
3. Transparent Budget. Budget transparency measures the extent and the quality of public
accessibility of the executive’s budget proposal in order to provide a control mechanism for
discretionary public spending. The component is based on selected questions, which are
used for the Open Budget Survey provided by the International Budget Partnership. Note
that this measure does not fully correspond to the Open Budget Index but captures some of
its key concepts. It is significant association with control of corruption is shown in Model 3.
4. A non-corrupt and independent judiciary. Impartiality and independence of the overall
judiciary system constitute legal constraints and thus are key elements of an effective control
of corruption. The indicator on judicial independence from the Global Competitiveness
Database developed by the World Economic Forum strongly and positively correlates with
control of corruption (Model 4).
5. Electronic empowerment of citizens. E-citizenship (Model 5) captures the endowment of
citizens to use online tools and social media and thus exercise social accountability.
Evidence exists that internet media in general and social networks in particular are
indispensable components of citizen empowerment. The component is constructed by
combining the number of broadband subscriptions and internet users with the share of
Facebook users relative to the population. The data stems from the International
Telecommunication Union and Internet World Stats.
6. Free Media. Transparency tools work best if they are implemented in a society with an
overall strong capacity and environment for collective action. Free media serves as an
important monitoring indicator for democratic institutions, public accountability and good
government and thus lays the ground for such an environment. The indicator on Freedom of
the Press measures the degree of media independence thereby capturing the national legal,
political and economic environment in which print, broadcast, and internet-based media
operate, and is unsurprisingly significantly associated with better control of corruption (Model
6). The measure stems from Freedom House.
Red tape, trade barriers and budget opacity (variables 1-3) measure the extent of bureaucratic
regulations and lack of transparency capturing thereby potential resources for administrative power

19
discretion. Variables 4-6 look at the capacity of the society to develop autonomous constraints in the
form of autonomous magistrates and journalists as well as engaged citizens. Despite selecting the
most relevant variables which also have the largest possible coverage, the country sample
comprises 105 countries relatively evenly covering every region in the world. The raw data for most
components stems from 2015. The data sources enable us to produce these components at least
every second year, thus offering the possibility to record changes over time. Most importantly, all
variables except judicial independence are either based on hard data or result from an evaluation of
clearly defined and very specific questionnaires. For example, our index on budget transparency is
based on a 14-item detailed questionnaire taken from the Open Budget Survey. The questions
mainly refer to the scope and the form of information on different types of government expenditures
presented in the Executives’ Budget Proposal (EBP).8 Similarly, primary data for freedom of press
results from 23 questions and 132 subquestions which are in turn divided into three categories of
the legal, the political, and the economic environment in which the local media operates so the score
can be attributed to very specific details. Only our measure of judicial independence is an outcome
of an expert assessment of a single question compiled by the World Economic Forum (WEF).
However, objective measures of judiciary independence, which significantly explain its de facto
performance, are available for too few countries as yet.9 More detailed description of the six
components with respective data sources is provided in Table A4.
Our empirical results from Table 1 imply that each component partially affects the level of control of
corruption. From a theoretical point of view, the “equilibrium model” should not be understood in
8 The entire Open Budget Survey consists of 109 questions covering beyond the Executives’ Budget Proposal
(EBP) also other documents of a budgetary process. We focused on the EBP because it is one of the most
important policy documents that a country issues each year, for it is through the budget that governments
translate many of their key policy goals into action, and because a score based on the EBP explains most of
the variation of the overall Open Budget Index. For more information see Table A4 and http://integrity-
index.org.
9 See, e.g., Melton and Ginsburg 2012 on the relationship between de jure and de facto judicial independence.
Furthermore, the so-called Rule of Law Index (http://worldjusticeproject.org/rule-of-law-index) provides an
alternative and more comprehensive assessment of the de facto judiciary system. We decided to use the
WEF indicator because it highly correlates with the Rule of Index (r≈0.80) and covers far more countries in our
sample.

20
terms of separate variables but rather more generally as a complex mechanism with certain
interdependencies and interactions between resources and constraints as well as within groups of
similar factors. For example, negative consequences of discretionary power resources are likely to
be amplified in an environment with weak legal and normative constraints. By contrast, resources
used for investments in social and physical infrastructure can contribute to the improvement of
governance once sufficient transparency and accountability mechanisms to control these
investments are established. On the other hand, a policy targeted at strengthening normative
constraints, for example, via improving transparency tools, is likely to be more effective if it is
implemented in an environment with a sufficient mass of critical and active civil society or open and
free media, which can effectively monitor the consequences resulting from improved transparency.
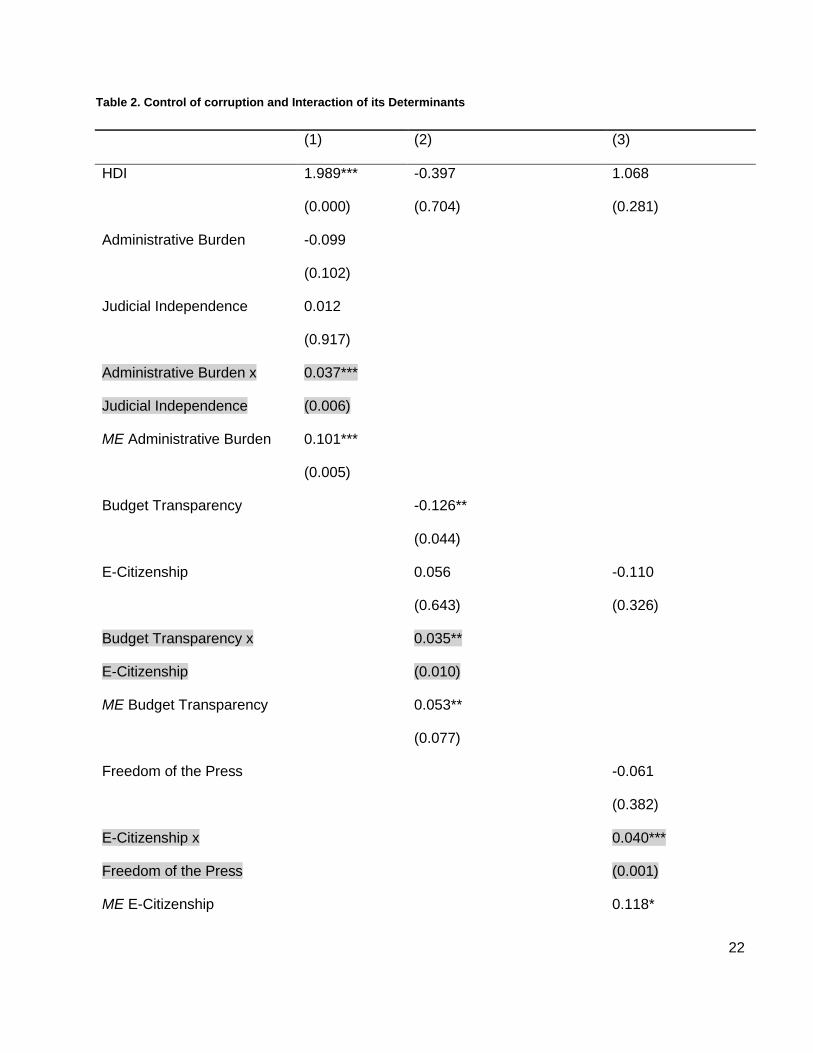
As Mungiu-Pippidi (2014; 2015, ch. 4) thus argues, a very complex “path model” would be needed
to do full justice to relationships between resources and constraints and the development factors
behind them. A few parsimonious regressions (Table 2) offer some examples for the empirical
relevance of interaction mechanisms. In model 1 we interact the index on administrative burden with
judicial independence to capture the interdependencies between opportunities, which may arise
from administrative discretion, and legal constraints. Indeed, once the interaction term is included,
the individual coefficients of judicial independence and administrative burden become insignificant
but the interaction itself is significantly positive: less bureaucratic burden together with impartial and
independent legal system result in better control of corruption. The marginal effect of administrative
burden is significantly positive, too. This implies that even for a given (sample average) degree of
judicial independence, administrative reforms targeting at deregulation of entrepreneurial activities
improve control of corruption. We get similar relationships when looking at the interaction between
budget transparency and freedom of the press to capture another potential link in the balance
between resources and constraints (Model 2). According to these results, the positive effects of the
transparency tools to control corruption are stronger if they meet an environment of free and
independent media. Finally, we illustrate interdependencies within the cluster of normative
constraints by interacting E-citizenship with freedom of the press and obtain, as expected,
significantly positive impact (Model 3). Note that the marginal effect of both budget transparency
and E-citizenship are significant, too.
21
Table 1. Control of Corruption and its Determinants
(1) (2) (3) (4) (5) (6)
HDI 3.873*** 2.973*** 4.431*** 2.436*** -0.291 3.031***
(7.80) (5.48) (9.15) (7.25) (-0.25) (8.03)
Administrative
Burden 0.162***
(4.26)
Trade Openness
0.188***
(5.56)
Budget Transparency
0.051*
(1.74)
Judicial
Independence
0.329***
(14.74)
E-Citizenship
0.312***
(4.22)
Freedom of the Press
0.194***
(7.91)
Constant -4.087*** -3.470*** -3.560*** -3.576*** -1.442** -3.310***
(-11.84) (-10.32) (-9.10) (-16.19) (-2.82) (-12.11)
Countries 105 105 105 105 105 105
Adj. R-squared 0.549 0.581 0.511 0.831 0.584 0.68
OLS regressions. The dependent variable is the WGI Control of Corruption 2014. t statistics in
parentheses * p < 0.1; ** p < 0.05; *** p < 0.01. Robust std. err. are used.
22
Table 2. Control of corruption and Interaction of its Determinants
(1) (2) (3)
HDI 1.989*** -0.397 1.068
(0.000) (0.704) (0.281)
Administrative Burden -0.099
(0.102)
Judicial Independence 0.012
(0.917)
Administrative Burden x 0.037***
Judicial Independence (0.006)
ME Administrative Burden 0.101***
(0.005)
Budget Transparency
-0.126**
(0.044)
E-Citizenship
0.056 -0.110
(0.643) (0.326)
Budget Transparency x
0.035**
E-Citizenship
(0.010)
ME Budget Transparency
0.053**
(0.077)
Freedom of the Press
-0.061
(0.382)
E-Citizenship x
0.040***
Freedom of the Press
(0.001)
ME E-Citizenship
0.118*

23
(0.100)
Constant -2.381*** -0.478 -1.219*
(0.000) (0.488) (0.058)
Countries 105 105 105
Adj. R-squared 0.845 0.632 0.742
OLS regressions. The dependent variable is the WGI Control of Corruption 2014. p values in
parentheses: *p < 0.1; **p < 0.05; ***p < 0.01. Robust std. err. are used. ME stands for the average
marginal effect calculated with the Delta-method.
5. Index of Public Integrity
From individual components and the evidence of interaction we move on to build our composite
Index of Public Integrity (IPI). Its construction is very straight forward. To obtain the components
used in Table 1, we first standardize the raw data to equalize the mean values and standard
variations of the respective variables thereby making their units comparable. That is, the so-called z-
scores with zero means and unit variance for every variable are constructed to avoid that the
composite index (IPI) strongly depends on the component with greatest dispersion. In case that a
component consists of sub-components, the same procedure is applied at the disaggregated level
and then a simple mean of the z-scores of the sub-components is built to obtain the values of the
respective component. For example, the measure of administrative burden is a simple mean of z-
scores of number of procedures and time to start business and pay corporative taxes. In the next
step, the standardized values of each component are normalized to be in range between 1 and 10
using the min-max-transformation, and making sure that for each component higher values imply
better respective institutional dimension.
In combing the components into a single index, the natural question of a proper aggregation and
weighting method arises. The relevance of possible interaction mechanisms between the variables
might suggest that a kind of geometric aggregation, which multiplicatively link the individual
components, can be adapted. Obviously, this method would then neglect the isolated importance of
an individual component implying a quite strong assumption given the empirical evidence for the
significant partial effects of certain variables. Besides, we cannot empirically prove the relevance of
all possible interactions, and even theoretically these mechanisms need to be further elaborated.

24
Choosing weights for the components on its turn is to a certain degree always normative and
requires some arbitrariness.
To deal with both challenges – aggregation and weighting - in our context, we explore the statistical
observation that all six components show some positive significant correlation among them (Table
A1) and use principal component analysis (PCA) to derive the overall IPI. The PCA retrieves the
common latent factor(s) that our six components jointly share thereby using the factor loadings of
each variable for the corresponding individual weights. As a result, the first principal component
explains around 56 % of the variation in the data that consists of 105 quite heterogeneous countries
and is the only one with an eigenvalue of larger than one (Table A2). Moreover, the Kaiser-Meyer-
Olkin (KMO) measure of sampling adequacy shows that only one component (the budget
transparency index) slightly falls below 0.7, a value that commonly assumed to be an upper bound
for mediocre variables. All other indices have KMO values close to or larger than 0.8 indicating
meritorious variables (Table A3). These statistical results confirm the notion that the usage of the
first principal component to retrieve the data for the IPI can be justified. It should also be noted,
however, that using an arithmetic mean with equal weighting as an aggregation method yields a
value that correlates with the the first princal component at 99%. Hence, for the sake of simplicity,
transparency, and better visualization of the composition of the IPI the simple aggregation to build
the IPI can be even more appropriate. In fact, our research team has used this method to develop
an online interactive tool that visualizes the IPI and the component scores providing various options
for country comparisons as well as additional material including the full dataset. The tool is under
construction yet and will be available on http://integrity-index.org.
The strong and positive relationship between the Index of Public Integrity and Control of Corruption
is illustrated in Figure 3, which also reveals that more than 75 % of the variation in control of
corruption across 105 countries can be explained by the IPI. Note that the values for the IPI have
been normalized to range between 1 and 10. The IPI is not only highly correlated with the World
Bank’s measure on Control of Corruption (which is not surprising given the selection process of the
components) but with several other corruption indicators (Table 3) including CPI, the ICRG’s
corruption risk, and a more specific expert assessment on the extent of diversion of public funds.

25
Table 3. Correlations between the Index of Public Integrity (IPI) and Other Corruption Indicators
WGI Control of
Corruption 2014
ICRG
Corruption
2014
TI Corruption
Perception
Index 2014
WEF Diversion
of Public Funds
2014
Correlation
Coefficients 0.880 0.830 0.891 0.701
Countries 105 94 105 101
Correlations are significant at p<0.01.10
Figure 3. The Index of Public Integrity (IPI) and Control of Corruption
Figure 4 displays the mean values of the IPI among the four income groups of countries according
to the World Bank’s classification. Not surprisingly, high income countries exhibit on average highest
IPI scores while the countries in the lowest income group perform worst on the public integrity scale.
The mean values between the three income groups do not differ strongly suggesting that
differences in IPI cannot be purely attributed to the differences in the income level. The strong
correlation between the IPI and the level of socio-economic development (measured by the HDI) is
10 Note that the TI’s, ICRG’s, and WEF’s indices are scaled in a way that higher values imply less corruption.
-2-1
01
2
WG
I C
ontr
ol o
f C
orr
uptio
n 2
014
0 2 4 6 8 10Index of Public Integrity
R-squared = 0.775

26
also illustrated in Figure 5 verifying the general positive association between good governance and
modernization. However, the relationship additionally shows that some countries perform better on
the public integrity capacity relative to their development level (e.g., Scandinavian countries or Mali),
and some others have a lot room for improvement (e.g., Venezuela or Kazakhstan).
Figure 4. Means of the Index of Public Integrity by Income Groups
Figure 5. Index of the Public Integrity and Human Development Index
02
46
8
Mean IP
I
Low Lower middle Upper middle High
Income Groups
95 % CI
AGO
ALB ARG
AUT
AZE
BEL
BEN
BFA
BGD
BGR
BIH
BOL
BRA
BWA
CHL
CHNCMR
COL
CRI CZE
DEU
DNK
DOM
DZA
ECU
EGY
ESP
EST
FIN
FRAGBR
GEO
GHA
GRC
GTM
HND
HRV
HUN
IDNIND
IRL
ITA
JOR
KAZ
KEN
KGZ
KHM
KOR
LBN
LBR LKA
LTU
LUX
LVA
MARMEX
MKD
MLI
MLT
MMR
MNGMOZ
MWI
MYS
NAM
NGA
NIC
NLDNOR
NPL
NZL
PAK
PER
PHL
POL
PRT
QAT
ROM
RUS
RWA
SAUSEN
SLE
SLVSRB
SVK
SVN
SWE
TCD
THA
TJK
TMP
TTO
TUN
TUR
TZAUGA
UKR
USA
VEN
VNMYEM
ZAF
ZMB
ZWE
mean IPI
mean HDI
02
46
810
Index o
f P
ublic
Inte
gri
ty
.4 .6 .8 1Human Development Index 2014

27
When looking at the geographical distribution of the mean values of the IPI, only the region that
includes the European countries and the USA clearly shows the highest scores while the IPI does
not significantly differ on average across other regions (Figure 6). Finally, in Figure 7 we illustrate
the average values of the IPI dividing the sample into three categories using the Freedom House
classification of a political system: free, partly free, and not free. Unsurprisingly, the IPI scores are
the highest in the most democratic states and the lowest in the most autocratic ones, yet the
difference being not so large between the two groups of countries which are classified as partly and
not free, respectively.
Figure 6. Means of the Index of Public Integrity by Regions
02
46
8
Mean IP
I
EURNA EAP ECA LAC MENA SSA
Regions
95 % CI
EURNA: EU & Norway & USA; EAP: East & South Asia & Pacific; ECA: Eastern Europe & Central Asia;LAC: Latin America & Caribbean; MENA: Middle East & North Africa; SSA: Sub-Saharan Africa

28
Figure 7. Means of the Index of Public Integrity by Freedom Status
6. How does IPI help?
In this paper we presented an alternative approach of how to capture and measure the national
level of control of corruption. We operationalized the components of control of corruption as an
equilibrium by mostly objective and actionable data and showed their statistical relationships. We
then combined these variables into one single measure – the Index of Public Integrity (IPI) – that
can be used to assess national levels of control of corruption. To aggregate the components, we
relied on the observation that they are mutually correlated and used principal component analysis to
retrieve the common factor. The resulting IPI is highly correlated with other popular corruption
measurements including those, which are based on actual corrupt activities. Moreover, the
distribution of the mean IPI scores among different global regions, income classes, and political
systems indicates that these factors might be related to but do not constrain a country’s capacity to
establish effective control of corruption.
The underlying data for the IPI is also employed to construct an interactive online tool that is
available on http://integrity-index.org. It offers various options to assess and compare national level
public integrity using both the aggregate and the components scores. In particular, this web tool
enables the users to observe the performance of countries in certain income groups and different
regions as well as to select and compare countries of individual interest. Moreover, it provides
specific information on each of 105 countries which, in addition to the IPI related data and contains
02
46
8
Mean IP
I
Not Free Partly Free Free
Freedom Status
95 % CI
29
data on key socio-economic country characteristics. It is therefore a comprehensive tool for an
analysis of national capacity to control corruption. The current version of the IPI employs most
currently available data, but the original data sources enable us to produce the measure at least for
every second year offering the possibility to monitor changes over time.
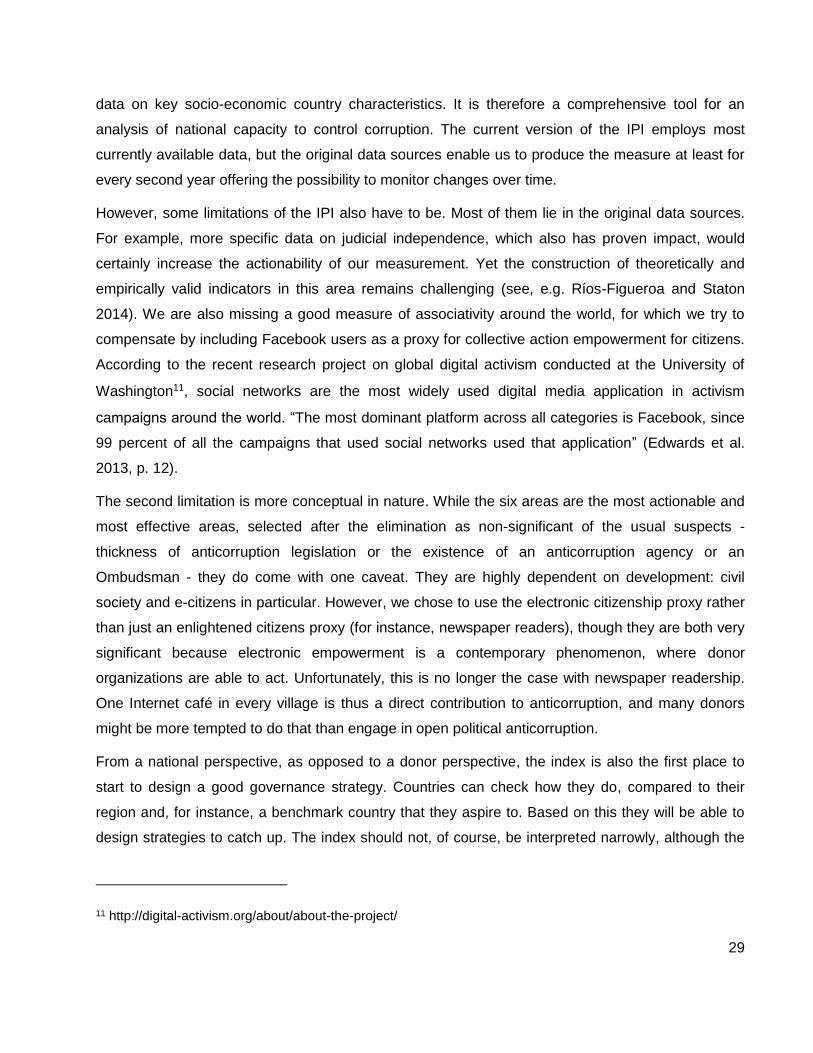
However, some limitations of the IPI also have to be. Most of them lie in the original data sources.
For example, more specific data on judicial independence, which also has proven impact, would
certainly increase the actionability of our measurement. Yet the construction of theoretically and
empirically valid indicators in this area remains challenging (see, e.g. Ríos-Figueroa and Staton
2014). We are also missing a good measure of associativity around the world, for which we try to
compensate by including Facebook users as a proxy for collective action empowerment for citizens.
According to the recent research project on global digital activism conducted at the University of
Washington11, social networks are the most widely used digital media application in activism
campaigns around the world. “The most dominant platform across all categories is Facebook, since
99 percent of all the campaigns that used social networks used that application” (Edwards et al.
2013, p. 12).
The second limitation is more conceptual in nature. While the six areas are the most actionable and
most effective areas, selected after the elimination as non-significant of the usual suspects -
thickness of anticorruption legislation or the existence of an anticorruption agency or an
Ombudsman - they do come with one caveat. They are highly dependent on development: civil
society and e-citizens in particular. However, we chose to use the electronic citizenship proxy rather
than just an enlightened citizens proxy (for instance, newspaper readers), though they are both very
significant because electronic empowerment is a contemporary phenomenon, where donor
organizations are able to act. Unfortunately, this is no longer the case with newspaper readership.
One Internet café in every village is thus a direct contribution to anticorruption, and many donors
might be more tempted to do that than engage in open political anticorruption.
From a national perspective, as opposed to a donor perspective, the index is also the first place to
start to design a good governance strategy. Countries can check how they do, compared to their
region and, for instance, a benchmark country that they aspire to. Based on this they will be able to
design strategies to catch up. The index should not, of course, be interpreted narrowly, although the
11 http://digital-activism.org/about/about-the-project/

30
improvement of these indicators should be the primary target. Broadly speaking, the strategies
should envisage an improvement of the entire area, and not just the indicator.
For instance, if a country does badly on red tape it should not only ease registering a business and
reducing the time to pay taxes, although we found those to be most effective and the place to start
de-bureaucratization. Countries showing a high score on the red tape component frequently have
regulations meant only to create legal privileges, and those should all be replaced. As a ground rule,
every regulation which will end up in discriminatory implementation should be avoided, as it is likely
to increase corruption.
Next, having transparent budgets, publishing them in time and allowing budget consultation are
crucial steps for sound government. Digitalization has helped sound financial management a lot, and
even poor countries can have transparent budgets - a school budget posted on the door of a school
or a hospital, if not on a website is a tremendous step forward for accountable public services. All
procurement budgets and contracts should be posted by all government agencies and companies.
There are few better ways to expose and prevent government favoritism.
Third, enabling free trade is important. Burdensome procedures at the borders are key obstacles
for both importing and exporting. Benefits of open trade policies frequently fail to materialize
because weaknesses in customs administration keep transaction costs high. Reducing trade
barriers and reforms of the custom service are enablers of competition, which reduce corruption,
creating a virtuous circle. Such reforms include simplified procedures and selective controls, better
use of technology and enhanced transparency and partnerships with the private sector: best
practices already exist.12
Fourth, social accountability exercised by a general population of autonomous and critical citizens
can amplify the effects of transparency in combating corruption. Digital citizens are empowered
citizens. For instance, the existence of a freedom of information law (or of financial disclosures for
public officials) is not in itself a significant determinant of good governance, but becomes significant
when combined with an active civil society (or freedom of the media, for financial disclosures),
because its activity (information requests, litigations) helps the law enact real transparency. Apart the
indicator that we propose countries can check when available on the closely related usage of E-
government services, which captures the actual demand for e-government and transparency by the
12 http://www1.worldbank.org/prem/PREMNotes/premnote67.pdf

31
general population. What we measure is the potential: practical tools are digital whistleblowing (as
Xnet in Spain, with secure mailboxes asking for citizen leaks on corrupt activity, see Bankia case),
digital monitoring (extensive publication of public contract data leads to free auditing by interested
parties, see project DIGIWHIST.eu), digital activism (as watchdogs organizations such as
CleanRomania, which offers an e-template to report corrupt activity to the anticorruption prosecuting
office with 14 000 monthly users in 201513), digital consultation, evaluation and audit of public
services. Digital tools are powerful. They largely explain why Estonia, a new EU Member State is
ranked sixth in Europe14. When they are missing, due to extreme poverty, they can be replaced with
more traditional transparency means serving the same purpose (school budget posted on school
door, including voluntary contributions from parents). Poor countries are catching up fast and even in
these societies Facebook or its equivalents provide a tool to mobilize people if needed.
The fifth factor, freedom of the press also requires strategies from both governments and civil
society. It is a considerable achievement for the government not to repress the press, but this
achievement alone is insufficient: in corrupt countries the media also tends to be corrupt and its
business model, including advertising, is often centered on white or black PR (blackmail) and not
purely on information. Traditional media needs sound investors, transparent private and government
ownership as well as transparent advertising from both private and government sources. It requires
impartial audience measurements, civil courts able to defend individuals from libel and blackmail.
These are all difficult conditions to satisfy in difficult environments. New media is increasingly a better
alternative, easier to fund and distribute. Both in repressed environments and in highly corrupt, but
not violent ones, charities and international donors have a lot of work to do in helping investigative
journalists to be able make their work visible. Bravery in journalism seems to exist everywhere, but
sometimes it needs servers or broadcasting stations outside the country to be able to disclose top
level corruption.
Finally, the sixth factor, independence of the judiciary is the one where a lot of work is generally
done with meagre results; there is no organization recipe on how to create effective and accountable
magistrates. Some cases, like Ukraine, have received a lot of investment from the side of donor, with
poor results. In others - like Ghana - judges and clerks remain so poorly paid that any assistance
does not bring much progress. Each country has a different tradition and strategies of creating and
13 www.romaniacurata.ro
14 https://www.government.nl/documents/reports/2016/01/18/integrity-in-international-perspective
32
empowering an accountable magistracy have to be national. However, a few contemporary
successes, as in Botswana, Estonia and Romania do exist,. These cases off different quality but all
lessons to be learned. We cite these three cases because of their very different backgrounds, proving
that not one factor - for instance, common law- is responsible for progress. The World Justice Project
and American Bar Association have developed great micro tools and intervention instruments, but the
bottom line seems to be that people are essential: What is needed is a reservoir of sound people,
from law schools, the legal profession, and even from the diaspora. The Estonian lesson, the most
successful in Eastern Europe, is one relying on the replacing of an entire judiciary with Soviet habits.
Many of the anticorruption tools needed by these magistrates are ineffective and countries which
adopt them do not seem to progress more than those which do. The bare essential remains some
clear private-public separation enshrined in law, for instance conflict of interest legislation and rules
against nepotism.
Most of the anticorruption strategies in the last years have been driven by the promotion of specific
legal instruments, generally overestimating the power of formal rules and institutions to preserve
clean politics or encourage whistleblowing. The results of these policies tend to confirm an old Latin
saying that warns that the most corrupt republic is the one with the most laws. With both the Index of
Public Integrity and the corresponding online tool we hope to contribute to more evidence based
political debate on the mechanisms that bring about effective and sustainable good governance,
although we are the first to acknowledge the imperfection of our work.

33
7. References
Acemoglu, D. and J.A. Robinson (2012). Why Nations Fail: The Origins of Power, Prosperity, and
Poverty. Crown Business.
Acemoglu, D. and T. Verdier (2000). “The Choice between Market Failures and Corruption”.
American Economic Review 90, 194-211.
ACR (2013). Controlling Corruption in Europe. The Anticorruption Report, Vol. 1. A. Mungiu-Pippidi
(ed). Barbara Budrich Publishers.
ACR (2014). The Anticorruption Frontline. The Anticorruption Report, Vol. 2. A. Mungiu-Pippidi (ed).
Barbara Budrich Publishers.
ACR (2015). Government Favouritism in Europe. The Anticorruption Report, vol. 3. A. Mungiu-
Pippidi (ed). Barbara Budrich Publishers.
Ades, A. and R. Di Tella (1999) “Rents, Competition and Corruption”. American Economic Review
89, 982-993.
Aidt, T. S. (2003). “Economic Analysis of Corruption: A Survey.” Economic Journal 113, 632–652.
Aidt, T., J. Dutta and V. Sena (2008). “Governance Regimes, Corruption and Growth: Theory and
Evidence”. Journal of Comparative Economics 36, 195–220.
Ali, M. A. and H. S. Isse (2003). “Determinants of Economic Corruption: A Cross-country
Comparison”. Cato Journal 22, 449-466.
Badinger, H. and E. Nindl (2014). “Globalisation and Corruption, Revisited.” The World Economy 37,
1424-1440.
Bardhan, P. (1997). “Corruption and Development: A Review of Issues.” Journal of Economic
Literature 35, 1320-1346.
Becker, G. (1968). “Crime and Punishment: An Economic Approach.” The Journal of Political
Economy 76, 169–217.
Brunetti, A. and B. Weder (2003). “A Free Press is Bad News for Corruption”. Journal of Public
Economics 87, 1801-1824.

34
Cingranelli, D.L. and D.L. Richards (1999). “Measuring the Level, Pattern, and Sequence of
Government Respect for Physical Integrity Rights.” International Studies Quarterly 43. 407–17.
Damania, R., P. Fredriksson and M. Muthukumara (2004). “The Persistence of Corruption and
Regulatory Compliance Failures: Theory and Evidence”. Public Choice 121, 363-390.
DiRienzo, C. E, J. Das, K.T. Cort and J. Burbridge (2007). “Corruption and the Role of Information".
Journal of International Business Studies 38, 320-332.
Doig, A., D. Watt and R. Williams (2006). “Hands-on or Hands-off? Anti-corruption Agencies in
Action, Donor Expectations, and a Good Enough Reality.” Public Administration and Development
26, 163–172.
Edwards, F., P. N.Howard and M. Joyce (2013). “Digital Activism and Non-Violent Conflict Report.”
Digital Activism Research Project. University of Washington, Seattle.
Elbahnasawy, N.G. (2014). “E-Government, Internet Adoption, and Corruption: An Empirical
Investigation” World Development 57, 114-126.
Fjeldstad, O-H. and J. Isaksen (2008). “Anti-Corruption Reforms: Challenges, Effects and Limits of
World Bank Support Report in External Series”. Independent Evaluation Group (IEG), World Bank
Working Paper No. 7.
Galtung (2006). “Measuring the Immeasurable: Boundaries and Functions of (Macro) Corruption
Indices.” In Sampford, C. J., Shacklock, A. H., Connors, C., & Galtung, F. (eds.). Measuring
corruption. Ashgate.
Hawken, A. and G. L. Munck “Do You Know Your Data? Measurement Validity in Corruption
Research.” Unpublished paper, September 19, 2009.
Herzfeld, T. and C. Weiss. (2003). “Corruption and Legal (In)-Effectiveness: An Empirical
Investigation”. European Journal of Political Economy 19, 621-632.
Huther, J. and A. Shah (2000). “Anti-corruption Policies and Programs: A Framework for
Evaluation”. World Bank Policy Research Working Paper No. 2501.
Islam, R. (2006). “Does More Transparency Go Along with better Governance?” Economics &
Politics 18, 121-167.

35
Johnsøn, J. Taxell, N. and D. Zaum (2012) “Mapping Evidence Gaps in Anti-corruption. Assessing
the State of the Operationally Relevant Evidence on Donors’ Actions and Approaches to Reducing
Corruption.” U4 Anti-Corruption Resource Centre, U4 Issue, No. 7 , CMI, Bergen.
Kalenborn, C. and Lessmann, C. (2013). “The Impact of Democracy and Press Freedom on
Corruption: Conditionality Matters“. Journal of Policy Modeling 35, 857-886.
Kaufmann, D., A. Kraay, and M. Mastruzzi (2011). „The Worldwide Governance Indicators:
Methodology and Analytical Issues.” Hague Journal on the Rule of Law 3, 220-246.
_______________, (2007a). “Growth and Governance: A Reply”. Journal of Politics 69, 555-562.
__________________, (2007b). “The Worldwide Governance Indicators Project: Answering the
Critics”. World Bank Policy Research Working Paper 4149.
Kaufmann, D., A. Kraay and P. Zoido-Lobatón (1999).“Aggregating Governance Indicators”. World
Bank Policy Research Working Paper No. 2195.
Klitgaard, R. (1988). Controlling Corruption. Berkley CA: University of California Press.
Knack, S. (2006). "Measuring Corruption in Eastern Europe and Central Asia: A Critique of the
Cross-Country Indicators". World Bank Policy Research Department Working Paper 3968.
Lambsdorff, J. (2008). “The Organization of Anti-corruption: Getting Incentives Right!” Passauer
Discussion Paper Series No V-57-08.
____________ (2005). “Consequences and Causes of Corruption: What Do We Know from a
Cross-section of Countries”. Passauer Discussion Paper Series No V-34-05.
Langbein, L. and S. Knack (2010). The Worldwide Governance Indicators: Six, One, or None?. The
Journal of Development Studies, 46(2), 350-370.
Mauro, P. (1995). “Corruption and Growth.” The Quarterly Journal of Economics 110, 681–712.
Melton, J. and Ginsburg, T. (2012) "Does De Jure Judicial Independence Really Matter? A
Reevaluation of Explanations for Judicial Independence". Institute for Law and Economics Working
Paper No. 612.
Montinola, G.R. and R.W. Jackman. (2002). “Sources of Corruption: A Cross-Country Study.” British
Journal of Political Science 32, 147–170.
Mungiu-Pippidi, A. (2006). ”Corruption: Diagnosis and treatment”. Journal of Democracy 17, 86-99

36
_______________ (2014). „Why Control of Corruption Works – when it does“ in Mungiu-Pippidi
(ed.) The Anticorruption Report Vol 2., Barbara Budrich Publishers.
________________(2015). The Quest for Good Governance. How Societies Develop Control of
Corruption. Cambridge: Cambridge University Press.
Mungiu-Pippidi, A. (editor and main author), M. Loncaric, B.Vaz Mundo, A. C. Sponza Braga, M.
Weinhardt, A.P. Solares, A. Skardziute, M. Martini, F. Agbele, M.F. Jensen, Ch. von Soest, M.
Gabedava (2011). “Contextual Choices in Fighting Corruption: Lessons Learned.” NORAD, Report
4/2011.
Norris, P and D. Zinnbauer (2002). “Giving Voice to the Voiceless: Good Governance, Human
Development and Mass Communications”. Human Development Report 2002, Ch. 5
Nunnally, J. C. and I.H. Bernstein (1994). Psychometric Theory. New York, NY: McGraw-Hill
Park, H. (2003),"Determinants of Corruption: A Cross-National Analysis", Multinational Business
Review 11, 29 – 48.
Persson, A., B. Rothstein and J. Teorell (2013). “Why Anticorruption Reforms Fail—Systemic
Corruption as a Collective Action Problem”. Governance 26, 449 – 471.
Persson, T and G.E. Tabellini (2003). The Economic Effects of Constitutions. Cambridge, MA: MIT
Press.
_______________________ 2004. “Constitutions and Economic Policy.” The Journal of Economic
Perspectives 18, 75–98.
Ríos-Figueroa, J. and J.K. Staton (2014). “An Evaluation of Cross-national Measures of Judicial
Independence.” Journal of Law, Economics, and Organization 30, 104-137.
Rothstein, B. (2011). “Anti-Corruption: The Indirect ‘Big Bang’ Approach.” Review of
International Political Economy 18, 228–250.
Seldadyo H. and J. de Haan (2006). “The Determinants of Corruption: A Literature Survey and New
Evidence”. Paper prepared for the 2006 EPCS Conference, Turku, 20-23 April.
Sequeira, Sandra (2013) “Tariffs and Corruption: Evidence from a Tariff Liberalization Program”.
The London School of Economics and Political Science, London, UK.
Shleifer, A and R.W. Vishny (1993) “Corruption”. The Quarterly Journal of Economics 108, 599-617.

37
Svensson, J. (2005). “Eight questions about corruption”. Journal of Economic Perspectives 19, 19–
42.
Tanzi, V. (1994). “Corruption, Governmental Activities and Markets”, IMF Working Paper 94/ 99,
International Monetary Fund, Washington, DC.
Transparency International (2012). “Corruption Perceptions Index 2012: An Updated Methodology”.
http://cpi.transparency.org/cpi2012/in_detail/.
Treisman, D. (2000). “The Causes of Corruption: a Cross-national Study.” Journal of Public
Economics 76, 399-457.
___________ (2007). “What Have We Learned About the Causes of Corruption from Ten Years of
Cross-National Empirical Research?” Annual Review of Political Science 10, 211-244.
Voigt, S. (2009). “How (not) to Measure Institutions”. Joint discussion paper series in economics,
No. 2009, 37.
USAID (2006). “Anti-corruption Agencies (ACAs)”. Anti-corruption Program Brief, Office of
Democracy and Governance, USAID.
Uslaner, E and B. Rothstein (2012). „Mass Education, State-Building, and Equality”. Working Paper
Series 5. QoG Institute

38
Appendix
Table A1. Correlations between the Components of the Index of Public Integrity
Indices Judicial
Independence
Administrative
Burden
Trade
Openness
Budget
Transparency
E-
Citizenship
Freedom of
the Press
Judicial
Independence 1.00
Administrative
Burden 0.472* 1.00
Trade
Openness 0.505* 0.442* 1.00
Budget
Transparency 0.223+ 0.386* 0.371* 1.00
E-Citizenship 0.545* 0.466* 0.721* 0.282* 1.00
Freedom of the
Press 0.542* 0.359* 0.612* 0.508* 0.601* 1.00
* significant at p<0.01; + significant at p<0.05; number of observations: 105
Table A2. Results of the Principal Component Analysis
Component Eigenvalue Difference Proportion Cumulative
Comp1 3.39 2.54 0.56 0.56
Comp2 0.85 0.16 0.14 0.70
Comp3 0.69 0.17 0.11 0.82
Comp4 0.52 0.22 0.09 0.90
Comp5 0.30 0.04 0.05 0.95

39
Comp6 0.26
0.04 1.00
Number of observations: 105
Table A3. Kaiser-Meyer-Olkin measure of sampling adequacy
Indices
KMO
Administrative Burden 0.80
Trade Openness 0.82
Budget Transparency 0.68
Judicial Independence 0.82
E-Citizenship 0.80
Freedom of the Press 0.78
Overall 0.79
Table A4. Variables and Sources
Component Variables and Measurement Sources for raw data
Administrative Burden Simple mean of standardized values of:
number of procedures required to start
up a business
time needed to start up a business
number of tax payments per year
time to pay taxes
This value has then been transformed to be in
range between 1 and 10 with 10 implying the
lowest administrative burden.
Doing Business
Dataset 2016, World
Bank
Trade Openness Simple mean of standardized values of: Doing Business
Dataset 2015, World

40
total number of documents required to
export and import
time for exporting and importing
This value has then been transformed to be in
range between 1 and 10 with 10 implying the
highest trade openness.
Bank
Judicial Independence “judicial independence” indicator from the
Executive Opinion Survey that asks the
question “To what extent is the judiciary in
your country independent from influences of
members of government, citizens, or firms? [1
= heavily influenced; 7 = entirely independent].
The indicator has been standardized and
transformed to be in range between 1 and 10
with 10 implying the highest judicial
independence.
Global
Competitiveness
Dataset 2015-2016,
World Economic
Forum
Budget Transparency Simple mean value of the scores resulting
from 14 specific questions that cover
transparency of the Executive’s Budget
Proposal. This value has then been
standardized and transformed to be in range
between 1 and 10 with 10 implying the highest
budget transparency.
Open Budget Survey
2015, International
Budget Partnership
and own data*
E-Citizenship Simple mean of standardized values of the:
Fixed broadband subscriptions
(% population)
Internet users (% population)
Facebook users (% population)
This value has then been transformed to be in
range between 1 and 10 with 10 implying the
First two measures:
ICT Dataset 2015;
International
Telecommunication
Union
Third measure:
Internet World Stats

41
highest score for E-Citizenship. 2015
Freedom of the Press Freedom of the Press score that has then
been standardized and transformed to be in
range between 1 and 10 with 10 implying the
highest freedom of the press.
Freedom of the Press
Dataset 2015;
Freedom House
*The budget transparency score is based on the coding the questions number 1-
7,9,15,19,33,35,37,53 from the Open Budget Questionnaire 2015. Using the same questions, our
research team collected data for 12 EU member states, which are not covered in the Open Budget
Survey: Austria, Belgium, Denmark, Estonia, Finland, Greece, Ireland, Latvia, Lithuania,
Luxembourg, Malta and Netherlands.


![Corruption Index 2010[1]](https://img.dokumen.tips/doc/110x75/577d26a11a28ab4e1ea1bd53/corruption-index-20101.jpg)