Embed Size (px)
Citation preview

Working Paper Series Macroeconomic Policy and Financing for Development Division
June 2016

Senior International Consultant, FAO-Regional
Office for Asia and the Pacific

MPFD Working Papers WP/16/07
i
Contents
I. Introduction ...................................................................................................................... 1 II. Trends and Patterns of Rural Areas and Agriculture ........................................................ 1 A. Rural population ......................................................................................................... 1 B. Importance of agriculture in the national economy ................................................... 2 III. Increasing Productivity in the Rural and Agriculture Sector ........................................... 10 A. Productivity, rural industrialization and agricultural growth ..................................... 10 B. Agricultural Productivity: approach, estimates and observations ............................. 15 C. Productivity growth and policy frameworks .............................................................. 17 D. Country profiles of agricultural productivity and policies .......................................... 18 IV. Conclusions and Recommendations ............................................................................... 26 A. Conclusions ................................................................................................................. 26 B. Recommendations ...................................................................................................... 29 References ............................................................................................................................... 32
Fostering productivity in the rural and agricultural sector
for inclusive growth and sustainable development in Asia and the Pacific
WP/16/07
MPFD Working Papers
Macroeconomic Policy and Financing for Development Division
FOSTERING PRODUCTIVITY IN THE RURAL AND AGRICULTURAL SECTOR FOR INCLUSIVE GROWTH
AND SUSTAINABLE DEVELOPMENT
IN ASIA AND THE PACIFIC*
by
Upali Wickramasinghe
June 2016
* This paper was prepared as a background paper for the Economic and Social Survey of Asia and the Pacific
2016.

MPFD Working Papers WP/16/07
1
I. Introduction
The declining contribution of agricultural value-added in GDP (AVAgdp) has been a major
concern among policy makers in recent years. In the Asia - Pacific (A-P) region, from the
1990s to 2012, AVAgdp has declined from 19.2 per cent in the 1990s to 9.8 per cent, while
the share of agriculture in total employment (SAE) declined by about 30 per cent. At the
same time, the contribution of services to value-added now exceeds 52 per cent in developing
ESCAP economies as a whole, compared to 42 per cent in 1990 (ESCAP, 2015).
Understanding the causes and consequences of this change from the lens of an inclusive
development perspective is an urgent imperative, particularly within the new Sustainable
Development Goals (SDG) framework, which among other things expects to end hunger,
achieve food security and improved nutrition and promote sustainable development by 2030.
The world is shifting towards a phase of implementing the SDGs adopted by the United
Nations in September 2015. Major international and national level efforts are underway to
identify appropriate policies to realize the SDGs. The 17 goals in the SDG framework, as the
UN resolution itself recognized, “are integrated and indivisible.” Given that targets are
defined as “inspirational and global, with each Government setting its own national targets
guided by the global level of ambition but taking into account its own national
circumstances.” (para. 55), Governments need to undertake their own review of
circumstances and identify best approaches to realizing the SDGs.
This paper is motivated by the need to identify potential links between productivity in the
rural and agriculture sector in The A-P with a view to proposing policies and strategies on
how strengthening productivity in the rural and agriculture sector will contribute to the
realization of SDGs. In order to identify broad regional trends, the paper analyses the
circumstances of 23 countries of the ESCAP region1, but policy discussions are limited to a
selected few from among the 23 countries.
II. Trends and Patterns of Rural Areas and Agriculture
This section describes the main trends of the rural and agricultural sector that underpin
agricultural productivity, emphasizing their importance in developing the rural and agriculture
sector. It also describes main issues that are constraining the agricultural and rural sector.
A. Rural population
In 2014, 53 per cent of people in the region lived in rural areas. This is equivalent to a
staggering 2.1 billion people, which accounts for 29 per cent of the global population and 63
per cent of all people living in rural areas in the world. In other words, two-thirds of people
considered “rural” in the world live in The A-P. This is after an unprecedented decline in the
1 Countries selected for the analysis within each sub-region are: East and North-east Asia (China, Japan, and
Republic of Korea); North and Central Asia (Tajikistan and Uzbekistan); Pacific – developed (Australia and
New Zealand); Pacific – developing (Fiji and Papua New Guinea); South Asia (Bangladesh, India, Nepal,
Pakistan and Sri Lanka); and South-west Asia (Iran and Turkey). All 23 countries could not be used throughout
the paper because of data limitations. Averages and percentages referred to in this paper are averages or
percentage values for those countries only, unless otherwise stated. Sample countries cover a significant
proportion of the total ESCAP population, geographic area and national income, and hence, the results may be
applicable for the whole region, but caution should be exercise in interpreting the results.

Fostering productivity in the rural and agricultural sector
for inclusive growth and sustainable development in Asia and the Pacific
2
share of rural population in this region. In the 1960s, over 60 per cent of people lived in rural
areas, and a much greater proportion depended on agriculture and was relatively poor.
In the sample countries, the share of rural population as a percentage of the total population
has declined from 78 per cent in 1961 to 53 per cent in 2014 (Figure 1). The progress has
been quite uneven across sub-regions and countries. The rural-urban transformation in East
and North-east Asia, South-east Asia and South-west Asia has been quite impressive,
whereas in the Pacific developing countries and South-Asia, the progress has been quite slow.
In the 1960s, over 60 per cent of the populations lived in rural areas in 20 out of the 23
countries analysed. By 2011-14, only 11 countries had populations of over 60 per cent living
in rural areas.
Figure 1. Share of people living in rural areas in selected economies in Asia and the
Pacific
0.0
10.0
20.0
30.0
40.0
50.0
60.0
70.0
80.0
90.0
100.0
China
Japan
Korea
Tajikistan
Uzbekistan
Australia
NewZealand
Fiji
PNG
Bangladesh
India
Nepal
Pakistan
SriLanka
Cam
bodia
Indonesia
Laos
Malaysia
Philippines
Thailand
VietNam
Iran
Turkey
Percent
1961-70 1991-00 2011-14
Source: Author based on WDI (2015).
B. Importance of agriculture in the national economy
1. Agriculture in national incomes
Figure 2 shows the average agricultural contribution to national economies measured by
AVAgpd for the 23 countries analysed for three time periods. Except for six countries,
agriculture’s contribution to GDP was less than 40 per cent even in the 1960s, but by the
period 2011-13 it was less than 20 per cent in 14 countries, and less than 10 per cent in seven
countries. Major differences between sub-regions in terms of the contribution of agriculture
has almost disappeared, and only in five countries out of the 23 analysed had AVAgdp over
20 per cent, namely Tajikistan, Nepal, Pakistan, Cambodia and Lao PDR.
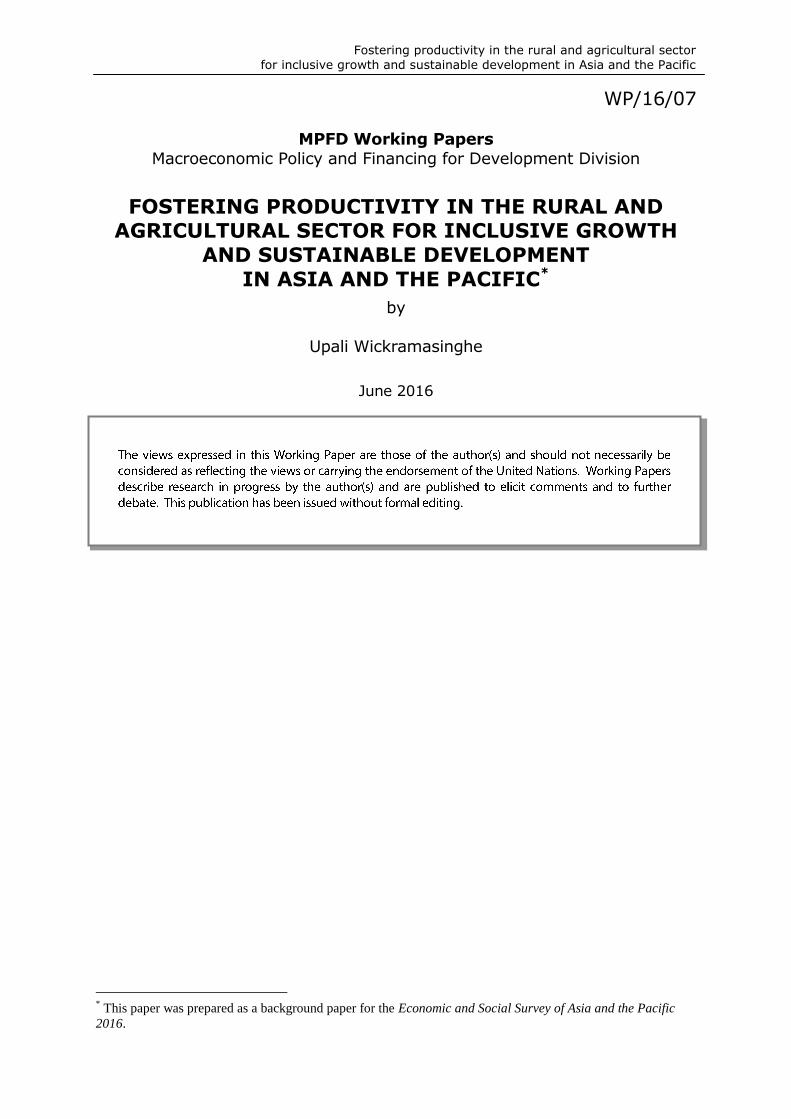
Shares of agriculture in total employment (SAE) have declined, albeit at a much slower rate
than that of the decline in AVA in GDP across all the countries analysed (except Malaysia)
MPFD Working Papers WP/16/07
3
and the Pacific developing countries (Figure 3). 2
China’s reduction of the share of
agriculture in employment is 34 percentage points from the levels of the 1970s. The shares of
agricultural employment further declined in West Asian countries from their historically low
levels. In the 1970s.
Figure 2. Agricultural value added in GDP of selected economies in Asia and the Pacific
0.0
10.0
20.0
30.0
40.0
50.0
60.0
70.0
China
Japan
Korea,Rep
.
Tajikistan
Uzbekistan
Australia
New
Zealand
Fiji
PNG
Banglade
sh
India
Nep
al
Pakistan
SriLanka
Cambo
dia
Indo
nesia
LaoPD
R
Malaysia
Philipp
ines
Thailand
Vietnam
Iran
Turkey
Percen
t
1961-70 1991-00 2011-13
Source: Author based on WDI (2015).
Figure 3. Share of agriculture in total employment (per cent)
0.0
10.0
20.0
30.0
40.0
50.0
60.0
70.0
80.0
90.0
China
Japan
Korea,Rep
.
Tajikistan
Uzbekistan
Australia
New
Zealand
PNG
Bangladesh
India
Nep
al
Pakistan
SriLanka
Cam
bodia
Indo
nesia
LaoPD
R
Malaysia
Philipp
ines
Thailand
Vietnam
Iran
Turkey
Percent
1971-80 1981-90 1991-00 2001-10 2011-2013
Source: Author, based on WDI (2015).
2 Figures are not available for Fiji, and employment figure is available only for one year for PNG. Anecdotal
evidence suggests both the countries still have fairly high agricultural employment shares.

Fostering productivity in the rural and agricultural sector
for inclusive growth and sustainable development in Asia and the Pacific
4
A comparison of Figure 2 and Figure 3 shows that agriculture’s share in GDP has declined
much faster than the corresponding decline of agriculture in total employment. To compare
the relative decline of the two variables over time and across countries, AVAgdp and SAE
for 1981-90 and 2011-13 were marked with arrows pointing in the direction and magnitude
of change Figure 4.3 Large gaps between the two would be an indication of a relatively faster
growth of the industrial and services sectors faster than that of the agriculture sector
combined with an extremely slow movement of labour out of agriculture. An examination of
labour force changes in agriculture over time provides a rough guide to the overall economic
progress of a country. This paper compared the overall labour force in agriculture in 2013
compared to the level in 1990. Data show that from 1990 to 2013 agricultural labour force
has decreased in six countries (China, Japan, Rep. of Korea, Malaysia, Thailand and Turkey)
by 143 million and increased in all the other 16 countries in the A-P region considered for the
analysis by 103 million. Between the two years, agricultural labour force reduced in China
by 131 million in absolute terms and in India it increased by 62 million. Therefore, it can be
concluded that agriculture remains the largest employment and continues to absorb more
labour despite its relative decline both in terms of agricultural value added and in total
employment.
Figure 4. Share of agriculture in GDP and in employment
0
10
20
30
40
50
60
70
80
90
0
10
20
30
40
50
60
70
80
90
Japan
China
Korea,Rep
.
Uzbekistan
Australia
New
Zealand
Bangladesh
India
Nep
al
Pakistan
SriLanka
Cam
bodia
Indonesia
LaoPDR
Malaysia
Philippines
Thailand
VietNam
Iran
Turkey
Agriculture'sshareinGDP(%)
Agriculture'sshareinemploym
ent(%
)
AVAinGDP(1981-90) AVAinGDP(2011-13) SAE(%)(1981-90) SAE(2011-13)
Source: Author based on WDI (2015).
To see this in a better light, the measure known as the Agricultural Productivity Gap (APG)
(Gollin and others, 2013), defined as the ratio between the share of value added and
3 The figure could be constructed using any two years, but decadal averages were used to minimize a potential
bias that may arise due to the selection of an inappropriate year for a particular year. Even this may have
introduced some biases. For example, Uzbekistan has limited number of observations for the earlier years, and
Tajikistan was dropped because of the unavailability of data on earlier years. Arrow indicates the direction and
size of the change.

MPFD Working Papers WP/16/07
5
employment in non-agriculture and agriculture,4 is calculated and shown in Figure 5. The
ratio is close to one only in Australia, New Zealand and Malaysia, and that labour
misallocation appears to be particularly large in Lao PDR, Sri Lanka, China, Bangladesh and
India. This further confirms an observation made by Timmer (2007) that a large number of
countries in Asia and the Pacific have been unsuccessful in integrating ‘surplus labour’ into
the rest of the economy. In this sense, this can be considered a systemic issue that needs to be
urgently addressed.
Figure 5. Agricultural productivity gap
5.1
3.5 3.5
2.8
1.7
1.2
4.9
4.0
3.4
2.4
5.2
2.1
3.7
1.2
3.6
4.5
3.8
2.4
3.3
0.00
1.00
2.00
3.00
4.00
5.00
6.00
China
Japan
Korea,Rep
.
Uzbekistan
Australia
New
Zealand
Bangladesh
India
Nep
al
Pakistan
SriLanka
Cam
bodia
Indonesia
LaoPDR
Malaysia
Philippines
Thailand
VietNam
Iran
Turkey
AgriculturalProducvityGap
(ra
o)
GAP1981-90 GAP2011-13
Source: Author, based on WDI (2015).
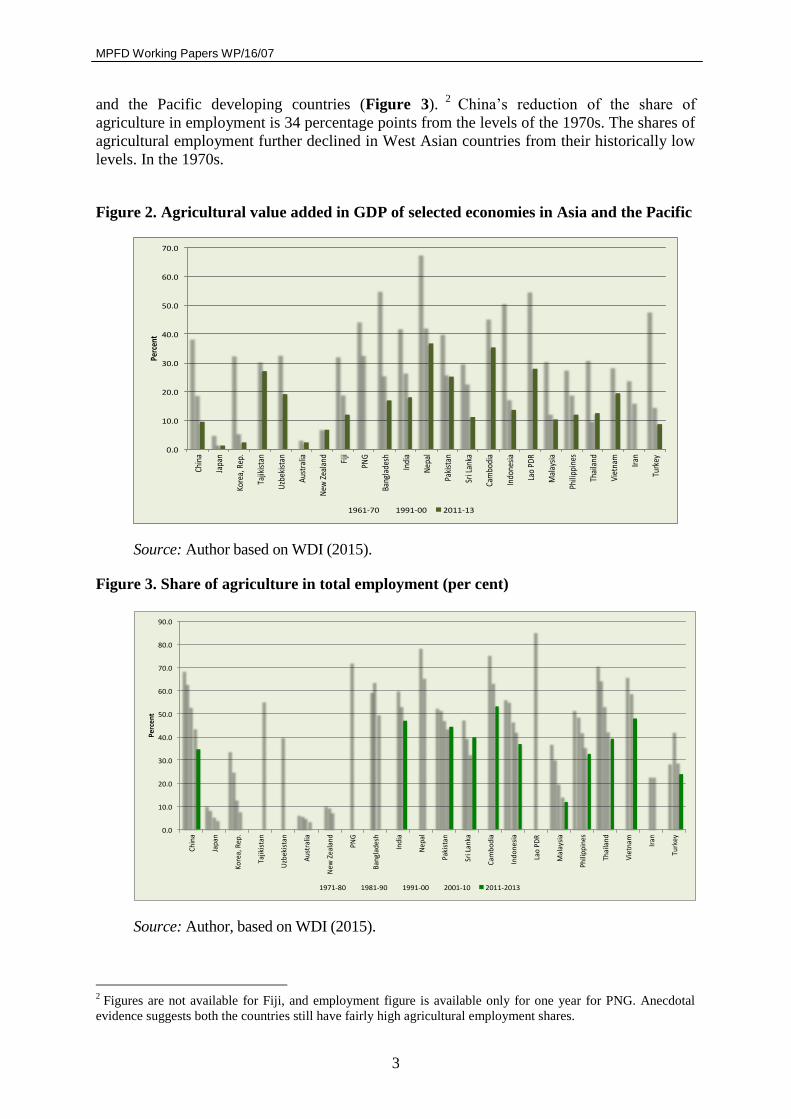
The relative position of agricultural incomes, measured by agricultural value added per
worker (AVApw), in comparison to GDP per capita also shows that agricultural value added
per worker is below that of GDP per capita across a large number of countries, and that ratio
has declined significantly in a large number of countries over the years. Figure 6 shows the
ratio between the real values of agricultural value added per worker and per capita GDP for
19901-2000 and 2011-2014. The value must be equivalent to one when values for AVApw
are equal to per capita GDP and values below one indicate situations where AVApw is lower
than per capita GDP. It can be observed that values for agricultural value added per worker
are below that of per capita GDP. Out of the 23 countries surveyed, China has the highest
ratio between the two followed by Thailand, Viet Nam, Sri Lanka and Indonesia. In a number
of countries including in China the gap has widened making agricultural workers relatively
poorer. For example, in case of China, agricultural value added per worker in 1991-2000 was
US$ 382 when per capita GDP was US $ 813 (ratio of 0.47), but in 2011-2014 the values
respectively were US $ 721 and US $ 3,503 (ratio of 0.21).5
4 Agricultural productivity gap is defined as , where ya is the share of agriculture in GDP and la is
the share of agriculture in total employment. The ratio must be equal to one under the assumption of competitive
labour market, which implies workers are paid the value of their marginal product, and that firms hire up to the
point where the marginal value product of labour equals the wage. This measure has some serious biases coming
from various sources and data noise. For a comprehensive review, see Gollin et al. (2013). 5 When vertical axis crosses at 1, values below one is represented as one minus the actual value.
Fostering productivity in the rural and agricultural sector
for inclusive growth and sustainable development in Asia and the Pacific
6
Figure 6. Ratio between agricultural value added per worker and per capita GDP
0.00 0.50 1.00 1.50 2.00 2.50
China
Thailand
Vietnam
SriLanka
Indonesia
India
Nepal
LaoPDR
Philippines
Fiji
Cambodia
Turkey
Bangladesh
NewZealand
Korea,Rep.
Japan
Australia
Pakistan
Malaysia
Tajikistan
Uzbekistan
2011-14
1991-00
Source: Author, based on WDI (2015).
2. Agriculture in exports, imports and manufacturing
Agriculture contributes to national economies through exports, and the impact of exports is
generally higher in low-income countries. To examine agriculture’s role in national
economies, this study considered five variables: agricultural raw material exports and imports
in merchandise trade; food exports and imports in merchandise trade; and food, beverages
and tobacco in value added in manufacturing.
The A-P region is no longer as dependent on agricultural raw materials exports as it was in
the 1960s. Indonesia and Malaysia perhaps illustrate the case well. In the two countries,
respectively, raw materials constituted 33 per cent and 52 per cent of exports in the 1960s,
but the share declined to 6.4 per cent and 2.6 per cent in 2011-13 (Table 1). Agricultural raw
materials imports have never been a large part of the region except in Japan and Korea in the
1960s. In 2011-13, food exports constitute over 10 per cent of merchandise exports in 14, and
food imports in 9, out of 21 countries analysed However, agriculture’s contribution to value
added in manufacturing is relatively high across all countries analysed. What this means is
that although agriculture is generally viewed as having little impact on industrialization and
the larger economy, it provides the basis for many other activities including manufacturing.

MPFD Working Papers WP/16/07
7
In summary, the A-P region has moved away from an era where agricultural raw material
exports dominated national exports to one where agriculture contributes to a declining but
significant and stable share of food exports, imports and in manufacturing. Improvements in
agricultural productivity can boost the share of food and agriculture in manufacturing and
exports, provided countries provide the other enabling environment as is discussed later.
Table 1. Agriculture in international trade and in manufacturing
1991-00 2011-2013 1991-00 2011-2013 1991-00 2011-2013 1991-00 2011-2013 1991-00 2001-10
Japan 0.52 0.81 5.0 1.5 0.53 0.60 15.9 8.9 10.5 11.9
China 1.72 0.48 4.7 3.9 8.61 2.77 4.9 5.2 14.6 12.7
Korea,Rep. 1.17 1.10 5.1 1.6 2.36 1.13 5.8 4.9 9.2 6.9
North&CentralAsia Tajikistan 12.59 0.7 4.37 10.2
Australia 8.06 2.90 1.6 0.6 23.13 12.47 5.0 5.4 20.2 20.0
NewZealand 16.36 11.44 1.0 0.6 46.60 57.11 7.8 10.6 30.7 27.2
Fiji 2.43 5.26 0.4 0.3 56.00 64.82 16.2 19.3 49.1 48.5
PapuaNewGuinea 9.87 5.58 0.7 0.4 20.32 27.98 18.6 11.3
Bangladesh 2.88 1.75 4.7 7.3 10.31 3.86 16.8 19.5 25.8 14.8
India 1.69 1.95 3.6 1.8 16.47 10.24 5.1 3.9 12.2 10.1
Nepal 0.82 3.18 5.4 1.9 11.56 21.05 11.8 17.3 31.2 39.1
Pakistan 4.64 2.19 4.3 4.4 10.85 18.85 16.1 11.1 22.4 21.6
SriLanka 3.26 3.33 1.8 1.4 22.84 26.24 15.4 12.3 39.3 32.5
Cambodia 2.89 2.95 3.4 1.0 0.96 3.24 9.7 6.7 26.6
Indonesia 4.79 6.42 5.9 2.8 11.13 17.30 9.1 8.8 21.0 23.5
Malaysia 6.17 2.57 1.3 2.4 9.09 12.52 5.6 8.4 9.6 9.6
Philippines 1.09 1.00 2.0 0.7 11.38 10.07 8.1 10.4 31.5 24.8
Thailand 4.20 5.59 3.8 1.8 20.34 13.64 4.8 5.3 18.2 16.4
Vietnam 2.13 2.90 2.7 3.5 28.67 16.70 5.29 8.41 30.2 22.4
Iran,IslamicRep. 0.72 0.20 2.6 2.4 4.29 3.67 19.2 14.1 13.4 9.2
Turkey 1.58 0.48 4.5 2.6 19.75 10.87 5.5 4.6 16.1 14.4
South-westAsia
Region Country
East&North-EastAsia
Pacific-developed
Pacific-developing
SouthAsia
Agriculturalraw
materialsexports
(%ofmerchandise
exports)
Agriculturalraw
materialsimports
(%ofmerchandise
imports)
Foodexports(%of
merchandise
exports)
Foodimports(%of
merchandise
imports)
Food,beverages
andtobacco(%of
valueaddedin
manufacturing)
South-eastAsia
Source: WDI (2015).
3. Agricultural Production
In aggregate terms in a sample of countries, agricultural production in increased from US$
276 billion to US$ 1,185 billion, in constant 2004-2006 values, over the period between
1961-2013. The region is producing four times more food than it did at the beginning of the
1960s. The structure of agricultural production has changed as well. In the 1960s, cereals,
non-cereal crops and livestock contributed 41 per cent, 43 per cent and 16 per cent,
respectively. By 2011-13, they respectively contributed 26 per cent, 46 per cent and 28 per
cent. So, in five decades, the relative share of cereal in total production declined by 15
percentage points; non-cereals crops and livestock sectors gained three and 12 percentage
points. The share of livestock in total production increased from 17 per cent in 1961 to 38 per
cent in 2013. In other words, the share of livestock in total production is rising faster, but the
share of non-cereal crops remains high across the region.
Figure 7 shows the changing structure of agriculture in selected countries of The A-P6.
Numbers 1 to 3 refer to periods 1961-70, 1991-00 and 2011-13, and for each period, the
6 Numbers 1 to 3 respectively refer to 1961-70, 1991-00 an 2011-13, and country names are shortened to avoid
clutter.

Fostering productivity in the rural and agricultural sector
for inclusive growth and sustainable development in Asia and the Pacific
8
value given is the average for that period, and country names are shortened to avoid visual
clutter. The figure identifies the general structure of agriculture in sub-regions and countries,
and their changes over time. For example, it is quite visible from the figure that Australia and
New Zealand are highly dependent on livestock, whereas in other countries the general crops
sector including cereals dominates agriculture. The structure of agriculture has changed in
two opposite directions with respect to the two sets of countries. The agricultural structure in
Australia and New Zealand has shifted towards producing more crops and reducing the
dependency on livestock; in other countries the livestock share has increased in overall terms.
Although this change may seem trivial, it can have far-reaching implications on the demand
for resources throughout the food value chain, dietary patterns, health, and the environmental
footprint of agriculture.
Figure 7. Structure of agriculture in Asia and the Pacific
0
10
20
30
40
50
60
70
80
90
100
12312312323123123123123123123123123123123123123123123123123123
CH JP KR TK AU NZ FJ BG IN NP PK SL CM IND LA MA PH TH VN IR TU
Percent
Cereal Non-cerealcrops Livestock
Source: FAOSTAT (2015).
4. Changing Use of Agricultural Inputs
The A-P region has a variety of agricultural production systems, ranging from highly
specialized rice farming systems to rain-fed agriculture and commercial crops, and they all
tend have their own unique characteristics that determine the quantity and quality of input
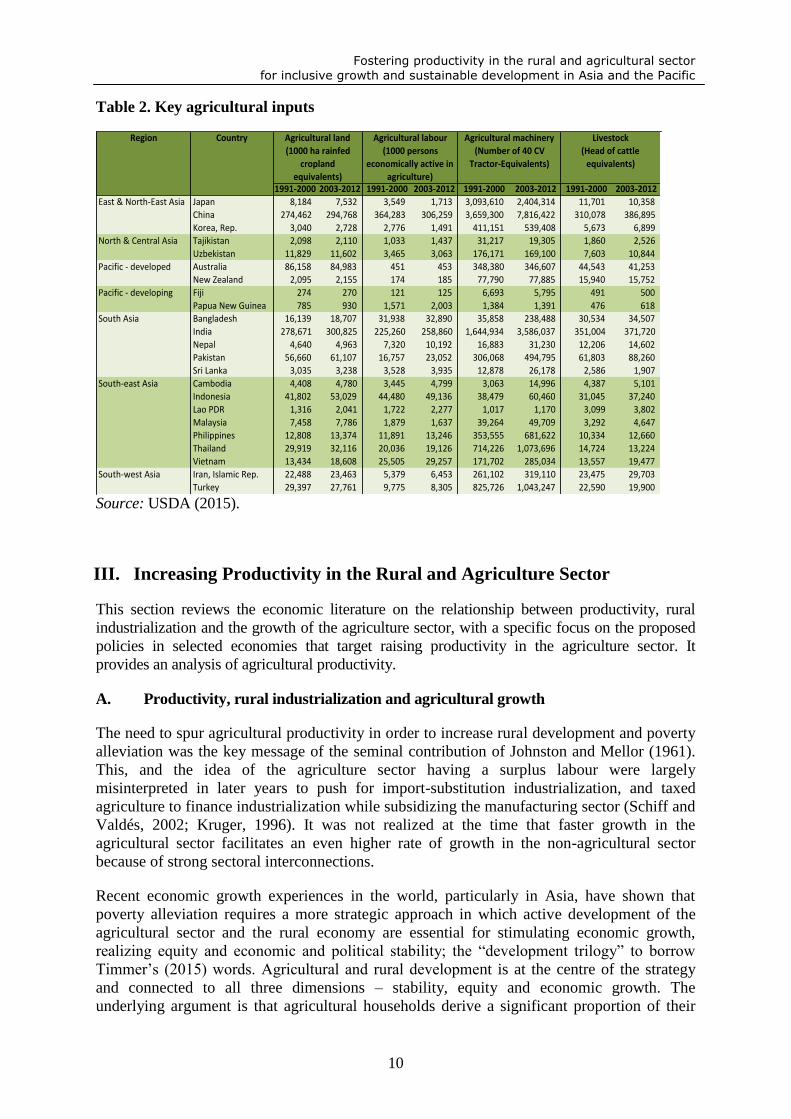
use. Data on four key agricultural inputs over two time periods are shown in Table 2. Several
key features are observed.
The distribution of resources across countries has the potential to alter growth dynamics
within and across countries, through spillovers of economic growth or slowdowns,
environmental externalities, international trade and possibilities for knowledge and
technology transfer on the one hand, and internally through a country’s capacity to generate
its own demand within the country. Indeed, growth performances and dynamics have been
very different across countries. Over the two periods 1991-00 and 2003-12, China and India
each added close to 20 million hectares of land to agriculture and doubled the use of
agricultural machinery but differed significantly in agricultural labour utilization. The key
difference lies in the agricultural labour force change. In China, the average agricultural

MPFD Working Papers WP/16/07
9
labour force decreased from 364 million in 1991-2000 to 306 million in 2003-2012,
registering a decline of 58 million agricultural workers. In India, agricultural labour force
during the same period increased from 225 million to 259 million, effectively adding 33
million more to the agricultural sector. This change needs to be viewed in relation to
population dynamics of the two countries. In China, population increased from 1.15 billion in
1990 to 1.36 billion in 2013, and increase of 208 million people; and in India, during the
same period, population increased from 0.87 billion in to 1.3 billion, an increase of over 400
million. Similarly, agricultural labour force has declined in Japan, Republic of Korea,
Malaysia, Thailand, Turkey and Uzbekistan. Agricultural labour force has increased by about
24 million in all the other countries that were analysed
South Asian countries added more land, labour, machinery and livestock7 to agriculture.
Bangladesh has expanded the use of machinery, perhaps to counter their limited capacity to
expand agricultural land. In Nepal, the agricultural labour force increased significantly
without a parallel increase of complementary inputs (land and machinery). In Turkey,
agriculture is becoming more mechanized along with a reduction of labour and land.
In South East Asia, both Malaysia and Thailand shed workers from agriculture, but
compensated for it by deepening mechanization. Indonesia on the other hand added land and
labour above and beyond the amount of new agricultural machinery. Cambodia and Viet
Nam have sharply increased the use of agricultural machinery, with subdued growth in both
land and labour. In Tajikistan and Uzbekistan, reforms that began after the independence
from the Soviet Union is continuing with adjustments to use agricultural inputs agriculture is
still undergoing a transformation that began after independence, which resulted in internal
reforms that led to sharp declines in the use of agricultural inputs.
In the Pacific, Australia reduced its land under agriculture by 1.1 million hectares in the two
periods, and kept other resources intact. In Fiji and PNG, agricultural sectors were yet to pick
up from their underperformance.
7 The only exception is Sri Lanka that experienced a decline in livestock capital.
Fostering productivity in the rural and agricultural sector
for inclusive growth and sustainable development in Asia and the Pacific
10
Table 2. Key agricultural inputs
1991-2000 2003-2012 1991-2000 2003-2012 1991-2000 2003-2012 1991-2000 2003-2012
Japan 8,184 7,532 3,549 1,713 3,093,610 2,404,314 11,701 10,358
China 274,462 294,768 364,283 306,259 3,659,300 7,816,422 310,078 386,895
Korea,Rep. 3,040 2,728 2,776 1,491 411,151 539,408 5,673 6,899
Tajikistan 2,098 2,110 1,033 1,437 31,217 19,305 1,860 2,526
Uzbekistan 11,829 11,602 3,465 3,063 176,171 169,100 7,603 10,844
Australia 86,158 84,983 451 453 348,380 346,607 44,543 41,253
NewZealand 2,095 2,155 174 185 77,790 77,885 15,940 15,752
Fiji 274 270 121 125 6,693 5,795 491 500
PapuaNewGuinea 785 930 1,571 2,003 1,384 1,391 476 618
Bangladesh 16,139 18,707 31,938 32,890 35,858 238,488 30,534 34,507
India 278,671 300,825 225,260 258,860 1,644,934 3,586,037 351,004 371,720
Nepal 4,640 4,963 7,320 10,192 16,883 31,230 12,206 14,602
Pakistan 56,660 61,107 16,757 23,052 306,068 494,795 61,803 88,260
SriLanka 3,035 3,238 3,528 3,935 12,878 26,178 2,586 1,907
Cambodia 4,408 4,780 3,445 4,799 3,063 14,996 4,387 5,101
Indonesia 41,802 53,029 44,480 49,136 38,479 60,460 31,045 37,240
LaoPDR 1,316 2,041 1,722 2,277 1,017 1,170 3,099 3,802
Malaysia 7,458 7,786 1,879 1,637 39,264 49,709 3,292 4,647
Philippines 12,808 13,374 11,891 13,246 353,555 681,622 10,334 12,660
Thailand 29,919 32,116 20,036 19,126 714,226 1,073,696 14,724 13,224
Vietnam 13,434 18,608 25,505 29,257 171,702 285,034 13,557 19,477
Iran,IslamicRep. 22,488 23,463 5,379 6,453 261,102 319,110 23,475 29,703
Turkey 29,397 27,761 9,775 8,305 825,726 1,043,247 22,590 19,900
Livestock
(Headofcattle
equivalents)
Region
East&North-EastAsia
North&CentralAsia
Pacific-developed
Pacific-developing
SouthAsia
South-eastAsia
South-westAsia
Country Agriculturalland
(1000harainfed
cropland
equivalents)
Agriculturallabour
(1000persons
economicallyactivein
agriculture)
Agriculturalmachinery
(Numberof40CV
Tractor-Equivalents)
Source: USDA (2015).
III. Increasing Productivity in the Rural and Agriculture Sector
This section reviews the economic literature on the relationship between productivity, rural
industrialization and the growth of the agriculture sector, with a specific focus on the proposed
policies in selected economies that target raising productivity in the agriculture sector. It
provides an analysis of agricultural productivity.
A. Productivity, rural industrialization and agricultural growth
The need to spur agricultural productivity in order to increase rural development and poverty
alleviation was the key message of the seminal contribution of Johnston and Mellor (1961).
This, and the idea of the agriculture sector having a surplus labour were largely
misinterpreted in later years to push for import-substitution industrialization, and taxed
agriculture to finance industrialization while subsidizing the manufacturing sector (Schiff and
Valdés, 2002; Kruger, 1996). It was not realized at the time that faster growth in the
agricultural sector facilitates an even higher rate of growth in the non-agricultural sector
because of strong sectoral interconnections.
Recent economic growth experiences in the world, particularly in Asia, have shown that
poverty alleviation requires a more strategic approach in which active development of the
agricultural sector and the rural economy are essential for stimulating economic growth,
realizing equity and economic and political stability; the “development trilogy” to borrow
Timmer’s (2015) words. Agricultural and rural development is at the centre of the strategy
and connected to all three dimensions – stability, equity and economic growth. The
underlying argument is that agricultural households derive a significant proportion of their

MPFD Working Papers WP/16/07
11
income from agriculture than from other sources, and therefore growth in that sector
enhances incomes of rural, agricultural households. In addition, agricultural productivity
growth reduces food insecurity, through enhancing the food accessibility of poor households
because household incomes are likely to be positively correlated with AVA per worker.
Cross-country data on GDP per capita, share of agricultural employment in total
employment, AVA per worker, share of rural population, Poverty Headcount Ratio (PHR)
and Prevalence of Undernourishment (PoU) from the A-P countries confirm this relationship.
Figure 8 shows several possible links among the five variables. It is possible to see that
agriculture and rural sectors share many common elements, and largely confirm the general
perception that being rural is synonymous with having a small amount of cash income, being
poor and food insecure. AVA per worker seems to be the key variable that runs through all
the graphs. The figure in the upper left corner shows that the share of rural population is
negatively correlated with GDP per capita and that a rise in GDP per capita implies a
reduction in the share of rural population by a significant margin, especially at lower levels of
income. The figure in the upper right corner shows that people living in rural areas are highly
likely to be working in the agricultural sector. The figure in the lower left corner shows that
GDP per capita is positively correlated with Ava per worker, meaning that people in low-
income countries also earn relatively little from agriculture. The figure in the lower right
corner shows that agricultural value added per worker is strongly negatively correlated with
the indicators of poverty and food insecurity. It also shows that a rise in AVA per worker will
induce a greater reduction in poverty and food insecurity, at lower levels of income than at
higher levels.
Figure 8. Agricultural productivity, ruralness, poverty and food insecurity
y=31815x-3.223R²=0.74322
0.00
10.00
20.00
30.00
40.00
50.00
60.00
70.00
80.00
90.00
100.00
5.00 6.00 7.00 8.00 9.00 10.00 11.00
Ruralpopula
on%
GDPpercapitaUS$(constant2005)logscale
y=0.2706x1.203R²=0.82039
0.00
10.00
20.00
30.00
40.00
50.00
60.00
70.00
80.00
0.00 10.00 20.00 30.00 40.00 50.00 60.00 70.00 80.00 90.00
Agriculturalemploym
ent%oftotal
Ruralpopula on(%)
y=0.9791x-0.041R²=0.8546
5.00
6.00
7.00
8.00
9.00
10.00
11.00
12.00
5.00 6.00 7.00 8.00 9.00 10.00 11.00Agriculturalvalueaddedperworker(US
$constant2005)logscale
GDPpercapitaUS$(constant2005)logscale
y=-0.2176x3+7.1768x2-78.333x+283.1R²=0.43852
y=1530.2x-2.527R²=0.4413
-5
0
5
10
15
20
25
30
35
40
45
5.00 6.00 7.00 8.00 9.00 10.00 11.00 12.00
PovertyHeadcountRa
oat$1
.25(%
)
Prevelanceofundernousishmen
t(%
)
AgriculturalvalueaddedperworkerUS$(constant2005)logscale
Source: Author based on WDI (2015).
Empirical studies have shown that agricultural income growth is more effective at reducing
poverty than growth in other sectors and that the welfare effects of non-agricultural growth

Fostering productivity in the rural and agricultural sector
for inclusive growth and sustainable development in Asia and the Pacific
12
are smaller among the poorer households (Ligon and Sadoulet, 2011; FAO, 2012).
Agricultural growth reduces poverty many times more than an identical growth in the non-
agricultural sector (excluding sub-Saharan Africa) (FAO, 2012). The same result has been
found in India during the Green Revolution (Binswanger-Mkhize, 2013); in Indonesia
(Cervantes-Godoy and Dewbre, 2010) and in China (Liu and Yang, 2015).
China’s recent growth is characterized by its strong inter-sectoral linkages, which also
enabled China to shift a significant number of agricultural workers from agriculture to non-
agriculture sector. Lie and Yang (2014) observed that between 1978 and 2004 labour
productivity of India in relation to China, measured by output per worker, had fallen from
147 per cent to 58 per cent. Using a three-sector model, they show that higher productivity
growth in China’s manufacturing and agriculture explains most of the aggregate productivity
gap.
These and similar findings elsewhere point to the need for countries to increase jobs outside
of agriculture in parallel with agricultural productivity growth in order for agricultural
productivity to have a meaningful impact on poverty (Timmer, 2015). Similarly, Warr (2006)
shows that in Indonesia and Thailand, virtually all factor productivity growth at the sectoral
level derives from agriculture, but the reallocation of resources away from agriculture was a
much larger source of aggregate national productivity. In the period leading to the financial
crisis of 1998, agricultural GDP per worker grew faster than per worker gains in other
sectors, and it was in that same period that Indonesia made the most rapid progress in
reducing poverty (OECD, 2010).
This is not unique to The A-P. The voluminous literature across the world over many decades
points out that economic development is associated with a fairly uniform pattern of structural
transformation in which the share of agriculture declines in total output and labour force and
agricultural output per worker increases are accompanied by the rising share of
manufacturing and services in output.8
Economic transformation does not end there. It forces the replacement of old production
processes and institutions with new economic structures and institutions; capital and labour to
shift from less to more productive sectors; old agricultural production structures including the
way farms are organized to be replaced by new and more resilient structures and institutions
(Brooks, 2012), supported by growing income and productivity changes that induce rural
people to use their resources more efficiently. The issue is not whether or not farms or firms
are large or small, but whether they are efficient (Roumasset, 2010). Rural-urban migration is
part of this process, and it eventually leads to an agglomeration of economic activities, which
effectively reduces the unit cost of the provision of electricity, telephone connectivity,
sanitation, education and health care because more people can be served with the same
amount of funding for public services.
Sectoral productivity gaps appear to have widened in recent years because of slow growth,
and in some cases stagnation, of agricultural productivity, and trapped a large proportion of
workers in agriculture without ever finding opportunities in the industrial and services
sectors. So what Timmer (2007) observed, that Asia has become less successful in integrating
low-productive agricultural labour into the rest of the economy” appears to remain valid.
Policy frameworks in the A-P region have largely dampened labour movements out of
agriculture on the premise that growth in Asia was too rapid to allow for such a rapid
8See Timmer (1988) for a comprehensive review of this literature.

MPFD Working Papers WP/16/07
13
movement and that it would have politically untenable because of its potential contribution to
unsustainable urbanization.
However, the current environment is propitious for a second wave of agricultural
development and transformation. Agricultural science, technology and innovations such as
agricultural biotechnology have made significant advances. A broad understanding is
emerging on the need to use a rather broad spectrum of food available in the world for
ensuring food security including secondary crops such as millets, cassava and root crops that
are rich in vitamins and minerals and the danger of depending on few selected commodities
for sustenance (Giovannucci and others, 2012). Advancement of new agricultural processing
and marketing systems that are capable of supporting small-scale farm households have
emerged (Reardon and others, 2003; Reardon and Timmer, 2007).
Transforming these advantages to spur agricultural productivity growth in the A-P region is
the key challenge. Historical experience from successful agricultural transformations across
the world offers a few lessons: creating an enabling environment for both farmers and others
to effectively participate in agricultural value chains; establishing or strengthening
institutions for innovation, identifying and applying agricultural technologies; providing
policy stability with sufficient flexibility to change over time when circumstances change;
strengthening rural extension services along with inclusive financial systems and risk
insurance; and income support to ensure farmers’ stability of income in times of crisis
(Wickramasinghe and others, 2012).
Farm households operate at the interface between macro-policy environment and micro-
economic factors that incentivize farmers to put extra efforts required to produce, process and
market food and agricultural commodities. Transaction costs are fundamental to this process
(Coase, 1937; North, 1981).9 Public policies that contribute to reducing transaction costs,
including rural infrastructure and the provision of information and communication
technologies, electricity and other public utilities, encourage farmers to put extra effort into
producing for markets, usually within their own resource limits, which contributes to a rise in
agricultural productivity. As the transformation progresses, agricultural productivity growth
leads to the emergence of new forms of agricultural production including in some cases, crop
specialization (Kurosaki, 2003) and in others, crop diversification. This allows for the
emergence of more diversified, higher quality and distinctive agricultural products, supported
by the availability of a strong supplier base and services.
Further impetus for raising productivity growth comes from scale effects, more specifically,
increasing returns to scale (Young, 1928). Although the original concept was applied to
industrial development, the process remains the same in that increasing returns to scale in
agriculture incentivize: farm households to pursue knowledge, acquire skills, learn new
techniques and marketing methods; become more efficient in production, processing and
marketing; and the use of machinery and agricultural inputs. These, in turn, enable farmers to
use labour more productively; and interact with markets vigorously to explore trading
opportunities. Accordingly, it is the capacity of an economy to utilize increasing returns to
scale, not larger operations per se, which determines agricultural productivity growth. In this
sense, debates on small vs. large farms, small vs. large corporations etc. largely miss the
fundamental forces that govern agricultural productivity growth and transformation in
developing countries.
9 For a review of this literature see Wickramasinghe and Weinberger, 2013).

Fostering productivity in the rural and agricultural sector
for inclusive growth and sustainable development in Asia and the Pacific
14
Stigler’s (1951) suggestion that it is the capacity for functional operation of firms, especially
purchasing and storing material, transforming it first into semi-finished and then into finished
products, storing and selling the output and extending credit to buyers, played a significant
role in the emergence of specialized firms and business operations is equally valid to rural,
agricultural industrialization.
Institutions play a critical role in many of these processes, and hence accurately identifying
institutional issues from others is as important as devising strategies to remove bottlenecks.
Gulati and others, (2005) provide a convincing case. In a case study of two water scarce
states of India, Gulati and others (2005) conclude that the issues that persist (e.g., increasing
costs of new irrigation schemes; the backlog of incomplete schemes; and the increasing
neglect of existing systems; lack of maintenance, inadequate operations, poor water
distribution system; and the poor timing of water delivery) are all not technical but
institutional. Another closely related issue is the evolution of coordination. Reardon and
Gulati (2008) show how agriculture and food systems in The A-P are evolving from systems
with limited coordination to better-organized systems of governance, guided by economies of
scale (Reardon and Gulati, 2008). The food retailing sector is expanding fast linking agro
processors, wholesale and logistic suppliers and farmers through emerging rural business and
service hubs.
Recent literature identified the importance of the decline in fixed costs of supplying new,
intermediate products as well as fixed transaction costs for farms and firms in their efforts to
identify new products (Yang, 2003) and markets (Key and others, 2000).
Agricultural productivity growth is both a cause and effect of supply and demand forces.
Agricultural productivity growth contributes to a general rise in per capita incomes, which, in
turn, increases demand for a whole range of commodities, including agricultural, industrial
goods, intermediate goods and services. This leads to the emergence of agro-industrialization,
a process that has become the key that drives agricultural growth in some countries, but is
missing in many others. Spurring such dynamic systems will be a key to transforming
agriculture and enhancing farmers’ incomes, which will lead to poverty alleviation and food
security.
Klasen and others (2013), who examined the impact of households’ diversification to
nonfarm income activities, productivity improvements of coffee and cocoa cultivation, and
crop switching on rural income dynamics, found that non-agricultural sources of income have
increased constantly over time, but agriculture still constitutes the financial backbone of rural
households across the entire income distribution model. The study also found significant
entry barriers for poorer households to engage in non-agricultural economic activities,
especially capital constraints. For this to make a bigger impact on poverty, new and
innovative mechanisms need to be identified to increase investment in infrastructure that
benefit the poor.
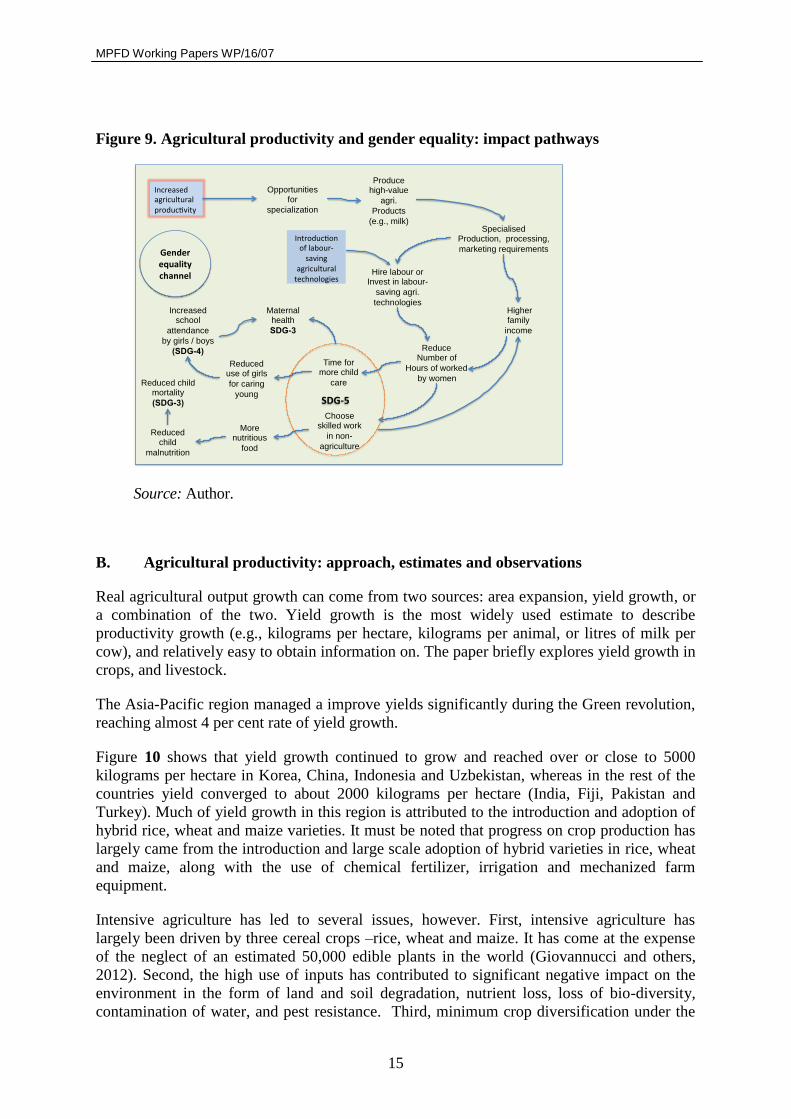
Literature identifies several impact pathways of agricultural productivity to poverty
reduction: income and employment, education, gender equality; reduced exposure to risk,
vulnerability and diseases; and the environment. The importance of identifying and working
along those impact pathways for realizing sustainable development is illustrated in
Figure 9 for gender dimension.
MPFD Working Papers WP/16/07
15
Figure 9. Agricultural productivity and gender equality: impact pathways
Increasedagriculturalproduc vity
Reduce Number of
Hours of worked
by women
Reduced use of girls
for caring
young
Opportunities for
specialization
Genderequalitychannel
Produce high-value
agri.
Products
(e.g., milk)
Time for more child
care
Specialised Production, processing,
marketing requirements
Higher family
income
Hire labour or Invest in labour-
saving agri.
technologies
Choose skilled work
in non-
agriculture
Increased school
attendance
by girls / boys
(SDG-4)
More nutritious
food
Reduced child
malnutrition
Introduc onoflabour-saving
agriculturaltechnologies
Reduced child mortality
(SDG-3) SDG-5
Maternal health
SDG-3
Source: Author.
B. Agricultural productivity: approach, estimates and observations
Real agricultural output growth can come from two sources: area expansion, yield growth, or
a combination of the two. Yield growth is the most widely used estimate to describe
productivity growth (e.g., kilograms per hectare, kilograms per animal, or litres of milk per
cow), and relatively easy to obtain information on. The paper briefly explores yield growth in
crops, and livestock.
The Asia-Pacific region managed a improve yields significantly during the Green revolution,
reaching almost 4 per cent rate of yield growth.
Figure 10 shows that yield growth continued to grow and reached over or close to 5000
kilograms per hectare in Korea, China, Indonesia and Uzbekistan, whereas in the rest of the
countries yield converged to about 2000 kilograms per hectare (India, Fiji, Pakistan and
Turkey). Much of yield growth in this region is attributed to the introduction and adoption of
hybrid rice, wheat and maize varieties. It must be noted that progress on crop production has
largely came from the introduction and large scale adoption of hybrid varieties in rice, wheat
and maize, along with the use of chemical fertilizer, irrigation and mechanized farm
equipment.
Intensive agriculture has led to several issues, however. First, intensive agriculture has
largely been driven by three cereal crops –rice, wheat and maize. It has come at the expense
of the neglect of an estimated 50,000 edible plants in the world (Giovannucci and others,
2012). Second, the high use of inputs has contributed to significant negative impact on the
environment in the form of land and soil degradation, nutrient loss, loss of bio-diversity,
contamination of water, and pest resistance. Third, minimum crop diversification under the

Fostering productivity in the rural and agricultural sector
for inclusive growth and sustainable development in Asia and the Pacific
16
intensive agriculture model has contributed to loss of bio-diversity, faster spread of diseases,
and loss of soil nutrients.
Figure 10. Yield growth in cereals and livestock in selected countries
0
1000
2000
3000
4000
5000
6000
7000
8000
1961
1963
1965
1967
1969
1971
1973
1975
1977
1979
1981
1983
1985
1987
1989
1991
1993
1995
1997
1999
2001
2003
2005
2007
2009
2011
2013
kgperhectare
Cereal
Korea,Rep. China Indonesia Uzbekistan Thailand
India Fiji Turkey Pakistan Australia
0
50
100
150
200
250
300
350
400
1961
1963
1965
1967
1969
1971
1973
1975
1977
1979
1981
1983
1985
1987
1989
1991
1993
1995
1997
1999
2001
2003
2005
2007
2009
2011
2013
KG/carcass
Livestock-Beefandbuffalomeat
Korea Thailand Australia Indonesia Turkey
Fiji Uzbekistan Pakistan China India
Source: Author based on FAOSTAT (2015).
Livestock and fisheries (marine and freshwater) contribute to a significant proportion of food
diet, especially protein. Consumption of livestock and fisheries remains low in general in
Asia, although it has risen in the recent past. As
Figure 10 shows, livestock yield has increased only in four out of 10 countries – Korea,
Thailand, Australia and Indonesia. While several others have recorded small yield growth
until the 1990s, yield growth has come to a virtual standstill since then. There is scope for
enhancing current yield levels, but that needs to be evaluated against the heavy use of maize
and other cereal as animal feed and its ethical considerations. Unlike in cereals, the private
sector-led breeding and intensive feeding methods were largely restricted to the chicken and
pig subsectors.
Although yield per acre provides an estimate that allows for cross- or within-country
comparisons of agricultural productivity, it does not inform the sources of growth of output.
Total Factor Productivity provides such a measure10
. Agricultural output growth occurs due
to: (i) an expansion of input use such as sawn area or livestock inventories (extension); (ii)
increased application of inputs such as fertilizer, machinery or feed on a given unit of input
(intensification); and (iii) efficiency improvements through the adoption of better
technologies, or from farming practices that result in more outputs from existing resources
(Total factor Productivity)11
(Figure 11).
The efficiency improvements that result in better use of existing resources are measured by
total factor productivity (TFP). TFP is measured either by its level or its growth. The level of
TFP is measured by dividing an index of agricultural outputs (index of gross crop and
livestock output) by an index of inputs comprising of land, fertilizer, machinery, livestock
and feed. TFP growth, on the other hand, is measured by taking the difference between
growth rates of the index of agricultural outputs and the index of inputs. TFP growth results
10
For a comprehensive review of methodology, refer to Headey et al., (2010), and for a description of
estimation procedure with a guide to data, see USDA (2015). 11
Productivity growth comes from technical progress, which consists of two key components: technical change
and technical progress. While the first arises from improvements in production practices the latter comes from a
movement of production practices close to the existing good practices. This paper does not provide further
decomposition of TFP.

MPFD Working Papers WP/16/07
17
from growth in the efficiency of using existing resources and crop and livestock varieties
arising from the use of high-yielding, disease-resistant and drought tolerant varieties; the
implementation of efficient and timely cultivation and harvesting practices; and the
application of agricultural practices that control the use of water, fertilizer and other input
more precisely (precision agriculture); providing better rural education that enhances
community understanding of modern agricultural practices; institutional innovation; or
improved quality of resources. TFP growth could be positive when output growth is higher
than input growth, which indicates an improvement of the sources mentioned above. It could
be negative when input growth surpasses that of output growth.
Figure 11. Output growth, yield, and total factor productivity
In
Areagrowth
Yieldgrowth
RealO
utputGrowth
Yield–Areagrowthdecomposi on
Areagrowth
InputIntensifica on
TotalfactorProduc vityGrowth
Inputgrowthdecomposi on
R&DandextensionRuraleduca onResourcequality
ResourcesIns tu ons
ResourceendowmentsInputpoliciesPricesandcostsExchangerates
ResourcesIns tu ons
Source: USDA (2015).
C. Productivity growth and policy frameworks
1. Key trends
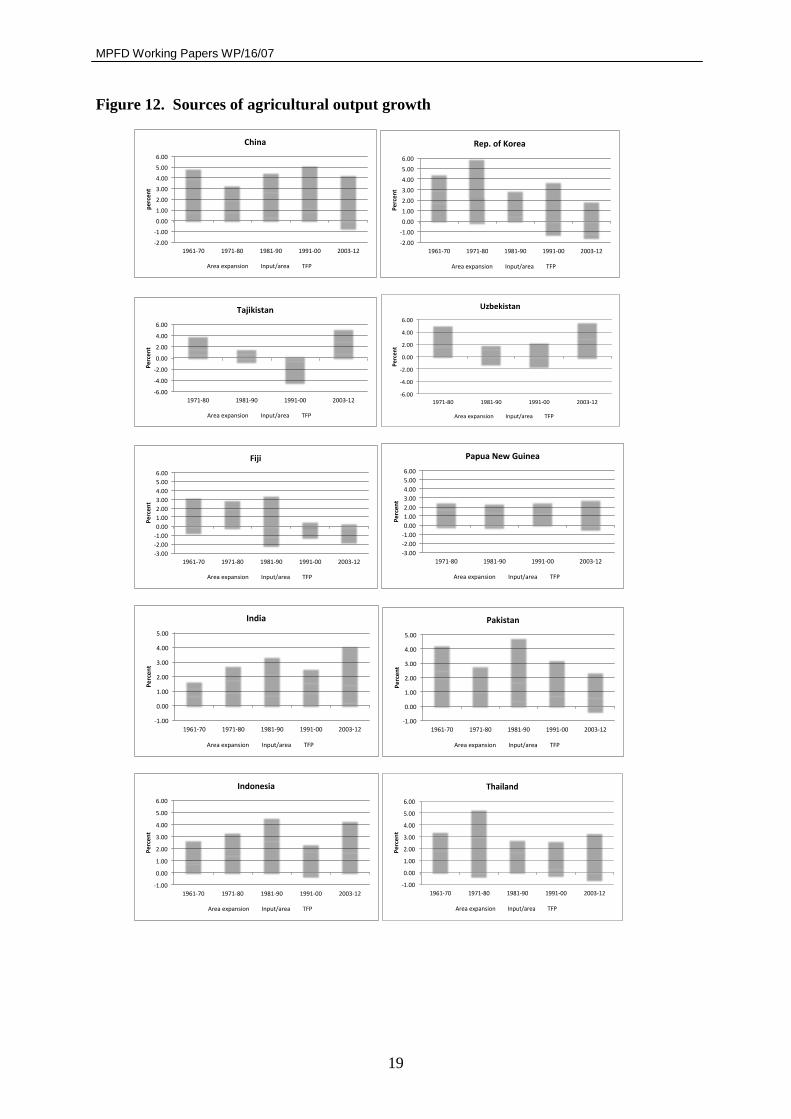
Annex Table 1 provides estimates of output growth due to: area expansion (extensification),
intensive use of inputs (inputs/area) (intensification), and TFP. For selected countries, the
estimates are shown in Figure 12. Several salient features emerge from the estimates. First,
several countries have begun to take land away from agriculture including Japan, Korea,
Australia, Turkey and Uzbekistan. In several others, while land area under agriculture is still
expanding, it is occurring at much slower rates than in earlier periods. So the contribution of
area expansion to output growth has declined across several countries. Second, the
contribution of intensive use of land in output growth is largely continuing, but in several
countries the contribution of intensification to output growth is also declining. Third, the
contribution of TFP growth to output growth has become larger over time in several
countries, indicating that a large proportion of output growth comes from the adoption of
good agricultural practices and scientific methods of cultivation.
Area expansion has been a key strategy to increase agricultural production throughout Asia
and the Pacific and it continues to date, but in recent years the rate of area expansion has

Fostering productivity in the rural and agricultural sector
for inclusive growth and sustainable development in Asia and the Pacific
18
declined. For example, in the 1960s, only Japan and Rep. of Korea reported reductions of
land under agriculture, but in the 1990s, 10 out of 23 countries analysed reported some
reduction of land. Of these 10, five countries continued to have negative growth rates
continuously in subsequent periods (Australia, Rep. of Korea, Japan, Fiji and Uzbekistan).
Agricultural intensification is another common practice utilized by the region as part of the
Green Revolution. Estimates show that the number of countries that derived more output
growth from intensive agriculture increased up to a point and began to decline. For example,
19 out of the 23 countries analysed reported having positive contributions from
intensification in the 1980s, but the number declined to 13 during the period 2003-12.
The contribution of TFP growth to output growth has been rising in several countries, but for
others, its contribution has not been consistently positive or rising over time. Thus, it is
necessary to review TFP growth along with policy frameworks that support TFP growth to
better understand how and why TFP growth has been so divergent across countries. A
common pattern that can nevertheless be observed is that those countries that successfully
managed a transition from land expansion to agricultural intensification consistently also
appear to have managed to increase contribution of TFP growth over time.
D. Country profiles of agricultural productivity and policies
1. Tajikistan and Uzbekistan
In Tajikistan, following agricultural reforms after independence, agricultural output growth
plummeted in the 1980s and the 1990s. In the last decade, agriculture has recovered with
output growing annually by 5.18 per cent and TFP by 2.17 per cent, along with growth
coming from intensification (2.16 per cent) and land intensification (0.85 per cent). Tajikistan
has managed to transform its economy fast allowing TFP growth and intensification to drive
its agricultural output growth. Uzbekistan did not experience as dramatic a drop in
agricultural output growth after economic reforms as Tajikistan did; it managed the transition
with a slump in agricultural output growth.
Using the standard Solow growth accounting framework, Lerman and Sedik (2009) showed
that 45 per cent of growth in crop production came from productivity growth and the
remaining 55 per cent from area expansion in Tajikistan; and in Uzbekistan, because land
area declined while crop production grew, the whole increase in crop production is attributed
to productivity improvement. They further noted that there are significant differences of
productivity across farm types, with apparently higher productivity among smaller farms.
Tajikistan and Uzbekistan went through a rapid reform process after the two countries
became independent on the promise that higher levels of agricultural productivity and
efficiency can be gained from family farms organized in smaller units (Lerman and Sedik,
2009). Thus, land reforms were the main instrument used for enhancing agricultural
productivity. Land reforms began in 1991-92 but real implementation started only in the late
1990s. The reforms resulted in a decline of land parcel sizes; land under large collective
“farm enterprises” also declined; but land under household cultivation as well as peasant
farms expanded.
MPFD Working Papers WP/16/07
19
Figure 12. Sources of agricultural output growth
-2.00
-1.00
0.00
1.00
2.00
3.00
4.00
5.00
6.00
1961-70 1971-80 1981-90 1991-00 2003-12
percent
China
Areaexpansion Input/area TFP
-2.00
-1.00
0.00
1.00
2.00
3.00
4.00
5.00
6.00
1961-70 1971-80 1981-90 1991-00 2003-12
Percent
Rep.ofKorea
Areaexpansion Input/area TFP
-6.00
-4.00
-2.00
0.00
2.00
4.00
6.00
1971-80 1981-90 1991-00 2003-12
Percent
Tajikistan
Areaexpansion Input/area TFP
-6.00
-4.00
-2.00
0.00
2.00
4.00
6.00
1971-80 1981-90 1991-00 2003-12
Percent
Uzbekistan
Areaexpansion Input/area TFP
-3.00
-2.00
-1.00
0.00
1.00
2.00
3.00
4.00
5.00
6.00
1961-70 1971-80 1981-90 1991-00 2003-12
Percent
Fiji
Areaexpansion Input/area TFP
-3.00
-2.00
-1.00
0.00
1.00
2.00
3.00
4.00
5.00
6.00
1971-80 1981-90 1991-00 2003-12
Percent
PapuaNewGuinea
Areaexpansion Input/area TFP
-1.00
0.00
1.00
2.00
3.00
4.00
5.00
1961-70 1971-80 1981-90 1991-00 2003-12
Percent
India
Areaexpansion Input/area TFP
-1.00
0.00
1.00
2.00
3.00
4.00
5.00
1961-70 1971-80 1981-90 1991-00 2003-12
Percent
Pakistan
Areaexpansion Input/area TFP
-1.00
0.00
1.00
2.00
3.00
4.00
5.00
6.00
1961-70 1971-80 1981-90 1991-00 2003-12
Percent
Indonesia
Areaexpansion Input/area TFP
-1.00
0.00
1.00
2.00
3.00
4.00
5.00
6.00
1961-70 1971-80 1981-90 1991-00 2003-12
Percent
Thailand
Areaexpansion Input/area TFP

Fostering productivity in the rural and agricultural sector
for inclusive growth and sustainable development in Asia and the Pacific
20
-2.00
-1.00
0.00
1.00
2.00
3.00
4.00
5.00
6.00
1971-80 1981-90 1991-00 2003-12
Percent
Iran
Areaexpansion Input/area TFP
-2.00
-1.00
0.00
1.00
2.00
3.00
4.00
5.00
6.00
1971-80 1981-90 1991-00 2003-12
Turkey
Areaexpansion Input/area TFP
Source: Author based on USDA (2015).
The Soviet agricultural system was organized to supply agricultural inputs to corporate farms
and purchasing of output at fixed prices. In the aftermath of implementing policy reforms, the
system that supplied inputs through a planned process was no longer available. That resulted
in a sharp decline of agricultural production immediately after the reforms, but production
began to show signs of recovery towards the end of the 1990s.
2. China
In China, growth of agricultural output coming from TFP productivity has been consistently
positive throughout the last five decades. Starting from a moderate growth rate of 0.90 per
cent in the 1960s, it reached 3.99 per cent in the 1990s, and 3.2 per cent in the last decade. In
contrast to TFP growth, growth that came from intensification fluctuated. In the 1960s,
agricultural intensification was the main driver of agricultural output growth, but its impact
had largely been exhausted in the 1970s and revived again during the period 1981-90 due to
policy reforms in the 1970s. Growth coming from intensification is no longer the main source
of agricultural growth.
In a study covering the period 1979-2000 where TFP was further broken down into technical
change, technical efficiency and a scale effect found high levels of technical efficiency in
1979-84 but a decline in 1985-89, which authors attribute to exhaustion of the impact of
economic reforms carried out in the earlier periods (Zhang and Bruemmer, 2011). In
contrast, technical change has increased dramatically over the whole period, which authors
attribute to long-term investment in agricultural technology and rural infrastructure. The
contribution of scale effect was limited. Overall TFP growth that combines all three effects
shows a net increase over the whole period, confirming the results noted above.
Agricultural productivity growth in China began with economic reforms launched in 1978.
Decentralization of agricultural production by giving households responsibility to decide
what and how much to grow, followed by liberalization of the system of pricing and
marketing agricultural goods were the keys to agricultural transformation (Braun and others,
2005). The first period, 1979 to 1984, focused on the decentralization of the production
system and reforming agricultural procurement (Fan, et al. 2002). Successive reforms and
adjustments during the 1980s led to dismantling of price and quantity controls imposed by
the central government, and by 1993 more than 90 per cent of all agricultural production was
sold at market-determined prices (Fan et al., 2002). Some price and quantity controls
remained in sub-sectors (cotton, oil crops, livestock and vegetables). The segmentation of
regional markets continued along with the isolation of domestic markets from international
markets (Brummer et al., 2006, as cited in Zhang, Y. and Brummer, B, 2011)

MPFD Working Papers WP/16/07
21
A new phase of reforms began in the early 2000s to address some market adjustment issues.
Two key issues were excess supply and the rising gap between urban and rural areas. And
thus, the government began introducing reforms to raising farmers’ income (OECD, 2005)
which included: providing input subsidies for farmers to purchase improved seed; direct
payments to farmers engaged in grain production; and reducing, and later on abolishing,
agricultural taxes (Zhang, Y. and Brummer, 2011).
3. India
In India, TFP growth contributes to an increasingly larger share of agricultural output growth.
Intensification growth played a key role in output growth in the Green Revolution era, but
lost steam in subsequent periods. Extensification played a key role in the earlier periods, but
its contribution to output growth has declined sharply in recent years, suggesting that land
expansion is continuing but not at the rates that it did in earlier periods. TFP growth has
become a key source of output growth, but both extensification and intensification continue
to play a role.
Studies have confirmed several sources of TFP growth: public and private research and
extension that led to crop genetic improvements (Evenson, 2003; Chand et al. 2011; Joshi et
al. 2003); infrastructure and irrigation development (Evenson et al. ibid); rapid adoption of
high-yielding varieties and new technology (Evenson and others, 1999; Fan and others, 1999;
Kumar, 2001); years of schooling of labour force and dietary energy (Avila and Evenson,
2004).
In a crop level study, Chand et al. (Op. cit.) found that TFP growth in 11 out of 15 crops
benefitted from agricultural research, but public investment in extension and technology
transfer contributed positively toward TFP in only two crops, and that both the investment
levels and quality of extension and technology dissemination matter. In the livestock sector,
the structural shift in consumption towards milk, meat, and poultry has contributed to sector’s
growth. The contribution of technical progress to livestock sector growth has accelerated
especially after the 1980s (Birthal et al. 1999).
India, since its independence in 1947, has implemented several initiatives to increase food
production. The Green Revolution period was characterised by building institutional capacity
(setting up of agricultural research institutes, and a system of agricultural universities),
dissemination of new technologies, and food price stabilization and farmer incentives (Chand
and others, 2011). Farmers were often provided subsidies to buy agricultural inputs,
especially targeting high-yielding varieties. In the post-Green Revolution era, the government
of India emphasized diversification from grains and pulses to high-value food and
agricultural commodities (vegetables, fruits, spices and livestock), particularly targeting the
Southern and Western parts of the country (Gulati, 2009; Chand, 2011).
The Twelfth Five-Year Plan (2012-2017) of the Government identified three priorities for the
agricultural sector: (i) better weather forecasting, (ii) effective water management and
development, and (iii) dissemination of agricultural technologies that can help farmers
increase yields, without depleting natural resources.
The government and researchers have identified several challenges facing India for raising
agricultural productivity: scarcity and fragmentation of land (India, 2014); small farm size
that is largely efficient but lacking economies of scale; soil degradation (ICAR, 2010);
inefficiencies in water use ranging from 35 per cent in flooding method and canals to 65-75

Fostering productivity in the rural and agricultural sector
for inclusive growth and sustainable development in Asia and the Pacific
22
per cent in pumping water; and the vulnerability to climate change of some areas.
4. Pakistan
In Pakistan too, TFP growth was high during the early period of the Green Revolution, but it
could not be sustained for long. Agricultural development efforts in the 1970s enabled
Pakistan to revive the agricultural sector, but TFP growth began dissipating again, and ended
up in being negative in recent years. As a result, agricultural output growth is increasingly
coming area expansion or intensification.
Pasha et al. (2002) found TFP growth to vary over time ranging from 2.7 per cent from 1977-
78 to 1982-83 and 4.2 per cent in the period 1992-93 to 1997-98. Avila and Evenson (2004),
as cited by Kumar (et al. 2009), found slower TFP growth rates for the whole period, and a
slight deceleration in the 1990s. They attribute this sober TFP growth to the reduction of
public expenditure on R&D (Kumar and others, 2009); inadequate human resources (Pasha
and others, 2002); and inadequate infrastructure (transport, energy, communication-and non-
factor inputs fertilizer and water) (Kumar et al., 2009).
Policy instruments that Pakistan used to enhance agricultural productivity included: the use
of high-yielding varieties, supported by irrigation, and subsidized inputs; public investment in
R&D and extension; and improved innovations such as improved fodder supply, substitution
of milk animals for drought animas, and the one-time slaughter of drought animals in the
livestock sector.
Agricultural pricing policy, especially price fixing, has been a key policy instrument targeted
to achieve multiple objectives including production, marketing and consumer price stability.
The introduction of a fixed commodity price scheme along with a mandatory procurement by
government agencies and commodity export bans characterized the agricultural policy regime
up to 1980s. In subsequent periods, the government dismantled trade restrictive practices
such as the export ban on cereals and the mandatory grain procurement, and replaced them
with import controls using tariff.
5. Thailand
In Thailand, the contribution of area expansion to agricultural output growth was high in the
1960s; it became the most prominent contributor in the 1970s, but its importance has waned
since then. Growth due to intensification of agriculture fluctuated significantly in earlier
periods, but became negative in the 1990s. Instead, TFP growth has become the key source of
output growth since the beginning of the 1990s; in 2003-2012, agricultural sector grew by 2.7
per cent in spite of a decline of intensification growth (-0.63 per cent) because of high
contributions of extensification (1.1 per cent) and TFP growth (2.2 per cent).
Suphannachart and Warr (2011) found that between 1970-2006, growth of the capital stock
(mechanisation) accounted for 60 per cent of output growth, growth of quality-adjusted
labour and land account for another 10 per cent and growth of TFP for a further 20 per cent.
Thailand had three distinct phases of agricultural development: a period of high land
expansion in the 1960s and 1970s, a period of surge in private investment in response to an
exodus of young workers from agriculture (Poapngsakorn, 2006); and efficiency-driven
agricultural development along with a decline in the use of external inputs. The establishment
of a land tenure system where farmers were allowed to clear new land and gain secure

MPFD Working Papers WP/16/07
23
property rights by paying taxes paved to way for expanding the land frontier in the earlier
periods. Once farmers cleared land, the government invested in roads and large irrigation
systems, later complemented by spending on rural education, electrification and
telecommunication (Poapongsakorn et al., 1995). The government also strengthened the
agricultural education system by investing in agricultural research; and established and
expanded agricultural universities and research centres throughout the country, supplemented
by extension services that promoted new high-yielding varieties. GOT ensured continuity of
funding to R&D in agriculture, and went beyond many other countries by developing better
varieties not just in cereal and food crops, but also secondary crops such as corn and sorghum
and commercial crops such as rubber and cotton (Poapongsakorn et al. ibid), but was
inadequate to compensate for generally weak private investment in R&D ((Suphannachart
and Warr, 2011).
The role of government policy in Thailand is a story of successful transition from a stage that
relied on the use of underused factors of production to work, with only limited improvements
in productivity, to a later stage where land and labour became increasingly scarce and growth
could only come from increased returns to scare factors (OECD, 2012).
In this process, the role of government has been largely limited to establishing an enabling
environment for private initiatives to take place, investing in infrastructure (roads, irrigation,
telecommunication and energy) and research, expanding agricultural credit, and investing in
education. In addition, the government focused on facilitating funding for farmers to adopt
new seed varieties and spur farmers’ investment in agriculture initially by instructing
commercial banks to allocate a minimum of 5 per cent of their commercial credit portfolio to
rural credit, and later by establishing its own bank (The Bank for Agriculture and
Agricultural Cooperatives). The novelty of the new system was the implementation of a
modality of extending credit to farm households through cooperatives without the usual
collateral requirement.
With the passage of time, the government has shifted its focus more to strengthening
agricultural markets through the promotion of food certification schemes; bilateral and
regional trade negotiations for opening up export markets; strengthening value chains; and
support for global campaign such as ‘kitchen to the world’. In recent years, GOT has reduced
heavy taxes imposed on the agriculture in earlier periods.
6. Indonesia
In Indonesia, agricultural output grew consistently over the last five decades, ranging from
2.7 per cent in 1961-70 to 4.6 per cent in 2001-10. The contribution of land expansion to
output growth increased during 1961-90, and continued in the next two decades at slower
rate; agricultural intensification contributed to growth through the 1990s but since then it has
not been a source of growth consistently. TFP growth on the other hand shrank in the first
three decades, but picked up again in the 1990s, contributing to 60 per cent of agricultural
output growth in 2003-12. The gradual shift from food staples to higher-value perennial,
horticultural and livestock commodities such as palm oil and away from food staples largely
explain this TFP growth (Fuglie, 2012).
In Indonesia, two key policy goals stand out: food self-sufficiency and price stability. The
rice policy constituted a highly regulated food production and marketing system,
supplemented by export / import controls and high tariffs. The government used subsidies for
agricultural inputs to incentivize production of identified products, namely rice, soybean,

Fostering productivity in the rural and agricultural sector
for inclusive growth and sustainable development in Asia and the Pacific
24
maize, sugar and beef. Fertilizer accounted for nine per cent of the total development budget
in 1984 to 1990. After a period of lapse, the government reintroduced fertilizer subsidy in
2009, and in that year alone fertilizer subsidy was 30 per cent of the agriculture budget
(OECD, 2010).
The government also promoted the adoption of high-yielding varieties in rice and other crops
and invested in irrigation schemes, agricultural R&D, and dissemination; provided credit at
subsidized rates. In recent years, the policy focus has shifted from the promotion of rice to
encourage greater crop diversification targeting secondary crops (cassava, banana, maize),
and commercial crops (rubber, coffee, cocoa, tea, and palm oil).
Border controls including export bans, export tariffs and variable levies have also been used
extensively including in export crops such as palm oil, cocoa and rubber. In recent years, the
government has encouraged biofuel production through the conversion of six million hectares
of land into biofuel production (OECD, 2010). A number of additional measures are being
contemplated including export bans on palm oil, sugarcane molasses, and convert them for
producing biofuel or bioethanol.
7. Fiji
In Fiji, the agriculture sector contributes to about 10 per cent of the national GDP and
employs approximately two-third of labour force (Fiji, 2014). In recent years, the agricultural
sector has experienced negative growth, and that currently, agriculture (Annex Table 1). The
agriculture sector grew at 2.45 and 2.74 per cent per annum respectively in the 1960s and the
1970s, which declined to roughly half that rate in the 1980s and became negative since then.
In the period from 2003 to 2012, the sector recorded a negative growth rate of 1.47 per
annum. The TFP growth has been negative in the last five decades, making Fiji the only
country among those analysed where the TFP growth was consistently negative for five
decades. Area expansion has been the main contributor for agricultural output to grow at
positive rates before 1990. Agricultural intensification has made a positive but very small
contribution to agricultural output growth in some years. The Fiji 2020 Agriculture
Development Policy Agenda attributed the poor performance of the agricultural sector to: the
decline in the performance of the sugar industry, the inability to cope with trade
liberalization, the occurrence of natural disasters and pest and disease outbreaks, export trade
restrictions, political instability, and inconsistent public sector support (Fiji, 2014). In
addition, the poor performance of the agricultural sector development in the last several
decades is attributed to issues related to land ownership that constrain access to credit, poor
quality and small volume of agricultural commodities, weaknesses in agricultural policies
pursued by successive governments and weak institutional organization to implement even
well-formulated policies.
Agricultural policies pursued by the government changed over time. In the 1970s, the
government pursued a policy of import substitution aimed at replacing import dependence of
food and agricultural commodities. In the 1980s and 90s, the government introduced policy
reforms aimed at liberalizing the market including the agricultural sector along with more
emphasis on the role of private sector in economic activities. Towards the end of the 1990s
and early 2000s, the government again introduced some protective measures to safeguard the
agricultural sector through various schemes including through the Farm Assistance
Programme and the Commodity Development Framework. The first decade of the century

MPFD Working Papers WP/16/07
25
dominated policies targeting livelihoods development, efforts to develop marketing of
agricultural produce and the rehabilitation of some critical agro industries such as sugar.
In a review of agricultural policy environment in Fiji, Duncan and Sing (2009) concluded
that agricultural policies and schemes have ‘failed’ due to the unnecessary government
interventions and that they had particularly detrimental impact on research and extension
services and have reinforced a ‘dependent mind set’ in the farming community.
The most recent effort towards revitalizing the agricultural sector is the development of the
Fiji 2020 agriculture sector development agenda (Fiji, ibid). It aims to develop a modern
organized agricultural sector, build integrated support infrastructure, strengthen agriculture
support services, improve capability in planning and policy formulation, and an enhance
capability in investment and international cooperation.
8. Papua New Guinea
In PNG, in the 1970s and 1980s, both area expansion and more inputs use have contributed to
output growth but in the period 2003-12 output growth was driven primarily by area
expansion. Both TFP growth and intensification growth were negative during 2003-2012.
PNG’s agriculture remains underutilized, despite having abundant land supply, fairly stable
water resources and climatic conditions suitable for agriculture (Wickramasinghe and others,
2013).
However, agriculture is the biggest contributor to rural village households (Bourke et al.,
2009); over 85 per cent of the population lives in rural areas and depends on subsistence
agriculture, forests and rivers for their basic food needs. Fresh food crops sold in informal
open markets provide 21.7 per cent of income and involve 94 per cent of the total rural
population (Bourke et al., ibid). In overall terms, agriculture contributes to about 40 per cent
of GDP in recent years.
Agriculture in PNG is constrained by many factors that are pervasive at early stages of
development. Apart from a standard set of constraints such as a weak or lack of
infrastructure, limited or no capacity of human resources and limited access to markets for
output and inputs, and financial resources, PNG has an unresolved land tenure system that
appears to hinder progress towards a commercially viable agricultural system, although it
supports a highly stable subsistence agricultural system (Wickramasinghe and others, 2013).
The Papua New Guinea Vision 2050 recognized that agriculture needs to be developed along
with manufacturing, services and ecotourism to shift from an economy that is heavily
dependent on the mining and energy sectors to one that is well balanced where all sectors
contribute to economic growth and development. Land reforms are an essential part of the
process of restructuring the economy (GoP, 2011). The midterm development plan has a
target of converting 70 per cent of subsistence farmers into small- and medium-scale
agricultural enterprises, using five strategic priorities: (i) develop an efficient land
administration, allowing land owners to profit from their land; (ii) develop roads and supply
chains to link producers and markets; (iii) provide extension services to improve
productivity; (iv) utilize economic corridors, enabling to utilize niche markets; and (v)
enforce CODEX marketing standards to improve agricultural exports.
9. Turkey

Fostering productivity in the rural and agricultural sector
for inclusive growth and sustainable development in Asia and the Pacific
26
The Turkish agricultural reform program, which gained momentum in 2001, had two target
areas: to reduce the fiscal burden of support to agriculture and to move towards a more
efficient production structure (Cakmak and Eruygur, 2008). The first target aimed at phasing
out government interventions in the output, fertilizer and credit markets and the introduction
of direct income support to farmers through per hectare payment independent from the choice
of crop. The second theme included commercialization and privatization of state owned
enterprises in agriculture and restructuring of quasi-government institutes. The third theme
covered grants to farmers who required assistance in switching out of surplus crops
(hazelnuts, tobacco and sugar) to net imported crops (oilseeds, feed crops and corn).
Agricultural policies are becoming market friendlier, although the transition is slow (Cakmak
and Eruygur, ibid).
Investing in R&D has been a major part of Turkish agricultural development efforts. In recent
years, the government has established gene banks; supported the development of new product
varieties through biotechnology, nanotechnology and techno-parks and the use of renewable
energy in agriculture.
The 10th Development Plan 2014-2018 identified important ‘problem areas’: the small and
fragmented structure of agricultural businesses, insufficiencies in market access, organization
of farmers and their training and extension needs. Key policy areas covered by Turkey
include: strengthening effective private sector institutions; strengthening law and order;
increasing efficiency of operations; strengthening of food quality and competition; and the
promotion of new ICT in agriculture. Several rural development programmes have also been
implemented over the years with the objective of raising rural income and living standards
through the diversification of economic activities, irrigation rehabilitation and construction of
rural roads.
IV. Conclusions and Recommendations
This section provides a brief summary and recommendations for enhancing the productivity
of the rural and agriculture sector.
A. Conclusions
The declining contribution of agriculture to national incomes and the high dependency of a
disproportionately large number of people on agriculture for livelihoods on the one hand and
an apparent mismatch between economic growth and capacity for absorbing ‘surplus’ labour
from agriculture to the non-agricultural sector on the other have received considerable
attention by policy makers in recent years for their implications for poverty, food insecurity,
unsustainable urbanization and sustainable development. This paper is motivated by the need
to identify potential links between productivity in the rural and agriculture sector in The A-P
with a view to proposing policies and strategies on how strengthening productivity in the
rural and agriculture sector will contribute to the realization of SDGs.
The paper reviewed key trends and patterns of rural and agricultural development; offers a
review of literature on the connection between ruralness, agricultural productivity growth and
poverty and food insecurity; analyses agricultural productivity trends using both yield and
total factor productivity; reviews broad policy and intuitional frameworks that countries have
pursued.
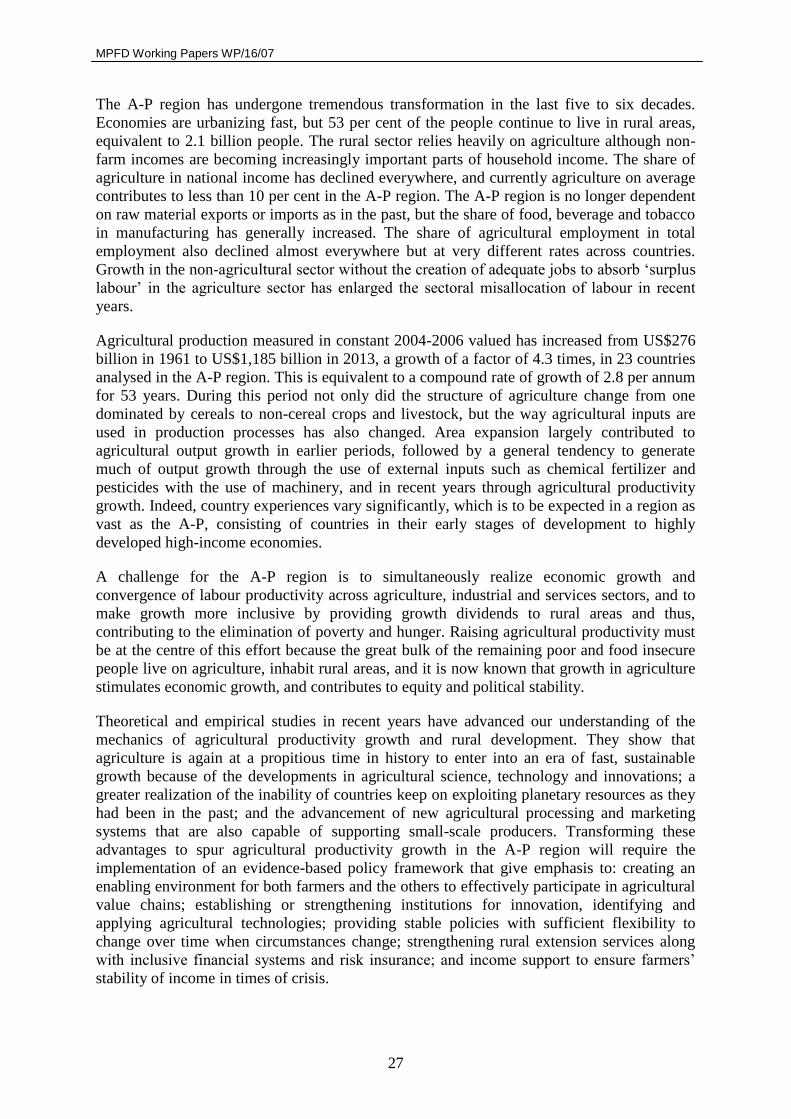
MPFD Working Papers WP/16/07
27
The A-P region has undergone tremendous transformation in the last five to six decades.
Economies are urbanizing fast, but 53 per cent of the people continue to live in rural areas,
equivalent to 2.1 billion people. The rural sector relies heavily on agriculture although non-
farm incomes are becoming increasingly important parts of household income. The share of
agriculture in national income has declined everywhere, and currently agriculture on average
contributes to less than 10 per cent in the A-P region. The A-P region is no longer dependent
on raw material exports or imports as in the past, but the share of food, beverage and tobacco
in manufacturing has generally increased. The share of agricultural employment in total
employment also declined almost everywhere but at very different rates across countries.
Growth in the non-agricultural sector without the creation of adequate jobs to absorb ‘surplus
labour’ in the agriculture sector has enlarged the sectoral misallocation of labour in recent
years.
Agricultural production measured in constant 2004-2006 valued has increased from US$276
billion in 1961 to US$1,185 billion in 2013, a growth of a factor of 4.3 times, in 23 countries
analysed in the A-P region. This is equivalent to a compound rate of growth of 2.8 per annum
for 53 years. During this period not only did the structure of agriculture change from one
dominated by cereals to non-cereal crops and livestock, but the way agricultural inputs are
used in production processes has also changed. Area expansion largely contributed to
agricultural output growth in earlier periods, followed by a general tendency to generate
much of output growth through the use of external inputs such as chemical fertilizer and
pesticides with the use of machinery, and in recent years through agricultural productivity
growth. Indeed, country experiences vary significantly, which is to be expected in a region as
vast as the A-P, consisting of countries in their early stages of development to highly
developed high-income economies.
A challenge for the A-P region is to simultaneously realize economic growth and
convergence of labour productivity across agriculture, industrial and services sectors, and to
make growth more inclusive by providing growth dividends to rural areas and thus,
contributing to the elimination of poverty and hunger. Raising agricultural productivity must
be at the centre of this effort because the great bulk of the remaining poor and food insecure
people live on agriculture, inhabit rural areas, and it is now known that growth in agriculture
stimulates economic growth, and contributes to equity and political stability.
Theoretical and empirical studies in recent years have advanced our understanding of the
mechanics of agricultural productivity growth and rural development. They show that
agriculture is again at a propitious time in history to enter into an era of fast, sustainable
growth because of the developments in agricultural science, technology and innovations; a
greater realization of the inability of countries keep on exploiting planetary resources as they
had been in the past; and the advancement of new agricultural processing and marketing
systems that are also capable of supporting small-scale producers. Transforming these
advantages to spur agricultural productivity growth in the A-P region will require the
implementation of an evidence-based policy framework that give emphasis to: creating an
enabling environment for both farmers and the others to effectively participate in agricultural
value chains; establishing or strengthening institutions for innovation, identifying and
applying agricultural technologies; providing stable policies with sufficient flexibility to
change over time when circumstances change; strengthening rural extension services along
with inclusive financial systems and risk insurance; and income support to ensure farmers’
stability of income in times of crisis.

Fostering productivity in the rural and agricultural sector
for inclusive growth and sustainable development in Asia and the Pacific
28
Policies will need to be evaluated from the lens of efficiency, economies of scale and
capacity for functional operation of farm operations and businesses. In such an approach,
debates such as small vs. large farms or firms will disappear and give rise to a broader
understanding of best possible approaches suitable for specific environments.
Agricultural output growth generally comes from three sources: area expansion, agricultural
intensification and productivity growth. Expansion of agricultural land has been continuing
albeit at slower rates in recent years. Only a handful of countries have been able to actually
reduce land under agriculture. Notwithstanding very different agricultural growth experiences
across countries, countries do appear to have shifted over time from being highly dependent
on land expansion to raise agricultural output, especially in the 1970s and the 1980s, to using
agricultural inputs more intensively in their second stage of agricultural development,
followed by a transition towards raising agricultural productivity supported by agricultural
R&D, adoption of good agricultural practices and technology improvements in the last
stages.
In spite of very different country circumstances and resource endowments, policies that
helped countries to raise agricultural productivity have several common elements. First,
economic reforms in more successful countries started with reforms that supported the
poorest segments of the society, and it usually happened to be those in the rural, agricultural
sector. The cases of China in recent times and the Republic of Korea in the 1950s are
examples. Second, these policy reforms were not merely targeted to gain political expediency
but all attempts were made to improve the economic efficiency of using resources, especially
land. Third, in all successful transformations, public policy facilitated the process by
establishing an enabling environment for farms and agro-firms to operate smoothly; investing
in rural infrastructure such as roads, irrigation and ICT; easing access to credit through
mechanisms to reduce or eliminate collateral requirements; investing in R&D; and providing
extension services. The countries that attempted to coerce farmers and agro-firms to deliver
results by a combination of policy instruments and controls such as price fixing, subsidies,
and mandatory procurement requirements have largely failed to raise agricultural
productivity beyond a certain level sustainably.
In the past, progress in crop yield increases have been realized through the introduction of
high-yielding crop varieties and the intensive use of inputs such as fertilizer and pesticides
along with irrigated water. Although this mode of agricultural production allowed the A-P
region to increase agricultural production manifold and alleviate hunger and food insecurity,
it led to negatively affected the resource base, contributing to land degradation, soil nutrient
loss, over-exploitation of ground water and erosion of bio- and genetic diversity. This model
cannot be continued in the future. A formidable challenge for the region is to arrive at a broad
consensus on a long-term vision for the planet, countries and societies, and guide the
economies to a sustainable growth trajectory. The A-P region is facing several challenges to
realize sustainable productivity growth and to translate that into socially desirable outcomes
in the area of poverty reduction, food security and sustainable agricultural development. They
can be broadly classified under four headings: technical, policy, institutional, and
implementation.
Technically, studies show three sets of challenges: reaching economically exploitable yields
based on current technology and resources, identifying new varieties to meet certain quality
and traits required to meet current and future food demand, and exploiting all edible plant
varieties for enhancing agricultural productivity and food security. All three technical
MPFD Working Papers WP/16/07
29
problems are hampered by weaknesses in policy, institutional and implementation
arrangements. Addressing one without paying to attention to others will eventually fail to
yield results.
In the area of policy, despite the wide availability of knowledge on agricultural policies that
are successful in raising agricultural productivity and promoting inclusive growth and
development, governments tend to make bad policy choices as well as inaccurate sequencing
of policy implementation. Much greater effort will be needed to identify why governments
continue to make bad policy choices time and again and ways to assist governments to avoid
common pitfall.
Institutional constraints are so pervasive in the A-P region, ranging from poor coordination
among farmers, CSOs, the private sector, R&D and extension services, and government
ministries; poor services delivery due to wrong or misplaced incentives and poor
organizational structures; lack or inadequate technical skills in many areas required for
developing new varieties, adopting existing varieties, using good agricultural practices, and
collecting data and undertaking policy-relevant analysis; inadequate funding for R&D; and
lack of direction for organizing research and development.
A review of studies finds that almost all the countries have reasonably well-designed policies,
strategies and action plans targeting long-time horizons; mid-term plans and in some
instances even annual plans. However, very rarely do they get implemented for a variety of
reasons. Often, long-term objectives are shelved in the presence of ‘urgent’ requirements,
limiting the potential of a country to realize its development objectives.
B. Recommendations
Enhancing agricultural productivity and realizing inclusive development is very much of an
art rather than a science. There are many paths that governments in the A-P region could
traverse. Making policy recommendations for a region as vast as the A-P can be so
meaningless given its enormous diversity in terms of history, culture, economic strengths and
political institutions. This section therefore focuses on areas that the A-P region could adopt
to get the basic fundamentals right so that the region could move onto, and traverse along, a
sustainable growth trajectory.
Recommendation 1: Recognize the indestructible inter-connections between the agriculture,
industry and services sectors rather than defining sectors narrowly. The review and analysis
recognized that the three sectors are interwoven in many different directions. This recognition
will immediately lead to a related recognition that the issue of large and unsustainable
‘surplus labour’ in agriculture cannot be solved within the boundaries of agriculture alone.
Within this broad framework, the target should be to introduce policies, strategies and action
plans to realize a convergence of labour productivity across the three sectors over time. That
alone will lead to inclusive development and poverty reduction. This means that government
policy should target the removal of rules and regulations that limit the movement of labour
and capital across sectors; facilitate such movements by retraining workers to carry out
different functions (e.g., training some farmers in operating machines, and training industrial
workers to better technical services in rural areas); and offer productivity-based financial
incentives for encouraging such movements.
Recommendation 2: Recognize food and agriculture as systems operating within well-
defined geographical spaces and landscapes (e.g., river basin systems) with unique
Fostering productivity in the rural and agricultural sector
for inclusive growth and sustainable development in Asia and the Pacific
30
characteristics (climate, soil conditions, topography, humans and animals, flora and fauna).
Value chain development should also follow the same principle so as to prevent
overexploitation of resources within a given landscape. The past overuse of key agricultural
resources –land, soil, water, forests that preserve bio- and genetic diversity- is primarily a
result of our inability to understand that resources interact in numerous ways to produce a
particular outcome, which in turn, determine human wellbeing. This recognition will enable
us to design better agricultural value chains that are sustainable over time as such systems
will have to conform to environmental, economic and social boundaries in a given setting.
Recommendation 3: Policy focus should be to get efficiency of resource allocations right.
For example, the fundamental policy focus should be to enhance the efficiency of organizing
land within a given environment rather than whether or not small farms are efficient. The
above review revealed that small farms are efficient in some environments but large farms
are efficient in others, under different conditions. The same principle applies to technology
choice. The issue is not whether more mechanisation is the right way, but rather which
technology and machinery will be more efficient for producing a given commodity.
Similarly, enhancing quality and efficiency of extension services should be the main criterion
for choosing and recommending extension services, not whether if the private or public
sector should deliver them.
In order to create policies with the maximum ability to enhance agricultural productivity and
its impacts on rural poverty reduction and sustainable development, policy makers need to
identify and target the most effective impact pathways. More research needs to be carried out
to empirically validate impact pathways.
Recommendation 4: Strengthen institutional foundations required for undertaking
technology related R&D activities as well as policy formation and analysis including data
collection. While the A-P region as a whole has a large number of R&D institutions, small
countries generally have inadequate capacity for R&D activities. Even when R&D institutes
are available, many of them are not geared towards undertaking fundamental research, but
focus mainly on applied or translational research. The A-P region also has a large number of
policy research institutes but institutes targeted to undertake focus policy research affecting
agriculture and its links to industrial and services sectors are rare. In parallel with the
advancements this region has made, it is high time for the region to invest more in
fundamental R&D and policy research. The target should be quality rather than quantity. The
paper recommends developing strong networking arrangements to link public R&D
institutions, academic institutions, CSOs, the private sector and farmers.
As a part of strengthening institutions for R&D and innovations, focus should also be to
address some fundamental issues facing agriculture from a technical point of view. Three
technical issues need to be addressed: minimizing exploitable yield gaps; identifying good
farming practices to raise yield where possible; and developing new crop varieties with
certain qualities required. Responsibility for the first two may largely lie within national
economies with some assistance from CGIAR centres and international organizations, but for
the third, a greater international effort involving south-south-north cooperation will be
required. Regional economic organizations can play a decisive role here.
Strengthening institutional organization required to deliver better extension services is
another strong requirement of the region. New forms have emerged to deliver extension
services more efficiently including innovative ways of using ICT and public and private

MPFD Working Papers WP/16/07
31
partnerships. Extension services could be converted into an effective mechanism for
collecting agricultural statistics, processing and dissemination.
Recommendation 5: Strengthen agricultural skills development and training. Agriculture is
changing fast and becoming more sophisticated than merely ploughing, sowing seed and
collecting harvest. The region needs more agricultural scientists, policy and programme
analysts, statisticians, technology experts, logistic managers, etc. An overwhelming number
of researchers point out that R&D expenditures are declining across many countries, and that
when R&D is reasonably large there are large quality issues. An effort towards building a
truly modern sector with versatile farmers, agricultural scientists and many other numerous
professionals will be required.
In the new environment where resources are scarce, new and innovative technologies and
agricultural practices such as precision agriculture, laser-guided land preparation, automated
agricultural systems are becoming the norm because they conserve resources. Future
agricultural competition and productivity will depend on how the region is able to innovate,
identify, adapt or adopt new technologies. All of them require better human skills, and
countries in the A-P region will have to lay the foundation for this transition by attracting and
training the youth to be part of the new agriculture.
Human capital also helps build the capacity for establishing business ventures and running
them efficiently and effectively; by learning ways to reduce costs and waste throughout the
food system; exploring the capacity for using new marketing techniques, ICT
communication, negotiate and entering into sophisticated contractual arrangements for
production, marketing as well as financial instruments; managing futures markets; and by
evaluating a range of potential risks and uncertainties affecting agriculture and agricultural
trade. Human capital formation in agriculture will have far-reaching positive impacts on
social and political institutions, including in addressing gender imbalances.

Fostering productivity in the rural and agricultural sector
for inclusive growth and sustainable development in Asia and the Pacific
32
References
Alston, J.M., J.M. Beddow, and P.G. Beddow (2010). Food commodity prices in the long run:
the crucial role of agricultural research and productivity. EuroChoices. The Agricultural
Economics Society and the European Association of Agricultural Economists.
Birthal, P.S., and others (1999). Sources of growth in livestock sector. Policy Paper, No. 9. New
Delhi: National Centre for Agricultural Economics and Policy Research.
Binswanger-Mkhize (2013). The stunted structural transformation of the Indian economy:
agriculture, manufacturing and the rural non-farm sector. In Economic and Political
Weekly Supplement, 29 June, vol. XLVVIII, Nos. 26 &27, pp. 5-13.
Blum, E.H. (2005). Functions of soil for society and the environment reviews. Environmental
Science and Bio/technology, vol. 3, No. 2005, pp. 75-79.
Brooks, J., ed. (2012). Agricultural Policies for Poverty Reduction. Paris: OECD Publishing.
Cakmak, E.H., O.H. Eruygur (2008). Food, rural, agricultural and fisheries policies in Turkey.
In Les Agricultures Méditerranéennes: Analyses par Pays, M. Allaya, ed. Montpellier:
CIHEAM. (Option s Méditerranéennes: Série B. Etudes et Recherches, No. 61).
Cervantes-Gody, D., and J. Dewbre (2010). Economic importance of agriculture for sustainable
development and poverty reduction: findings from a case study of Indonesia. OECD.
Chand, R., and S. Parappurathu (2012). Temporal and spatial variations in agricultural growth
and its determinants. Review of Rural Affairs, Economic & Political Weekly Supplement,
vol. XLVILI, Nos. 26 & 27, p. 55.
Chand, R., K. Praduman, and S. Kumar (2011). Total factor productivity and contribution of
research investment to agricultural growth in India. Policy Paper, No. 25. New Delhi:
National Centre for Agricultural Economics and Policy Research.
_________ (2012). Total factor productivity and contribution of research investment to
agricultural growth in India. Policy Paper, No. 25. New Delhi: National Centre for
Agricultural Economics and Policy Research.
Coase, R.H. (1937). The nature of the firm. Economica, New Series, vol. 4, No. 16, pp. 386-405.
Codron J.M., and others (2004). Supermarkets in low-income Mediterranean countries: impacts
on horticulture systems. Development Policy Review, vol. 22, No. 5, pp. 587-602.
Denny, M., M. Fuss, and L. Waverman (1981). The measurement and interpretation of total
factor productivity in regulated industries, with application to Canadian
telecommunications. In Productivity Measurement in Regulated Industries. New York:
Academic Press.
Dewi, S., B. Belchor, and A. Puntodewo (2005). Village economic opportunities, forest
dependence and rural livelihoods in East Kalimantan, Indonesia. World Development,
vol. 33, No. 9, pp. 1419-1434.
Duncan, R., and Y.W. Sing (2009). The failure of agricultural policy making in Fiji. Pacific
Economic Bulletin, vol. 24, No. 2, pp. 167-184.

MPFD Working Papers WP/16/07
33
Eberhardt, M. and F. Teal (2010). Mangos in the Tundra? Spatial heterogeneity in agricultural
productivity analysis. Agriculture and Its External Linkages, vol. 2, Part A of Handbook
of Agricultural Economics, Centre for the Study of African Economies, Department of
Economics, University of Oxford, eds. Elsevier, 2002.
Evenson, R.E., C. Pray, and M.W. Rosergrant (1999). Agricultural research and productivity
growth in India. Research Report, No. 109. Washington, D.C.: International Food
Policy Research Institute.
Fan, S., P.B.R. Hazel, and S. Thorat (1999). Linkages between government spending, growth,
and poverty in rural India. Research Report, No. 110. Washington, D.C.: International
Food Policy Research Institute,
Fan, S., B. Yu, and S. Jitsuchon (2008). Does allocation of public spending matter in poverty
reduction? Evidence from Thailand. Asian Economic Journal, vol. 22, No. 4, pp. 411-
430.
Fan, S., L. Zhang, and X. Zhang (2002). Growth, inequality, and poverty in rural China: the role
of public investments. IFPRI Research Report.
Fiji (2014). 2020 Agriculture Sector Policy Agenda: Modernizing Agriculture. Suva: Ministry
of Agriculture, Fisheries and Forests, Rural and Maritime Development, and National
Disaster Management.
Food and Agriculture Organization (FAO) (2012). State of Agriculture in the World 2012.
Rome.
Fuglie, K. (2010). Sources of growth in Indonesian agriculture. Journal of Productivity Analysis,
vol. 33, pp. 225-240.
Fukase, E., and W. Marin (2015). Who will feed China in the 21st century? Income growth and
food demand and supply in China. Journal of Agricultural Economics, Early view.
Available from http://onlinelibrary.wiley.com/doi/10.1111/1477-9552.12117 .
Gibson, J., and S. Olivia (2010). The effect of infrastructure access and quality on non-farm
enterprises in rural Indonesia. World Development, vol. 38, No. 5, pp. 717-726
Giovannucci, D.S., and others (2012). Food and agriculture: the future of sustainability. A
strategic input to the sustainable development in the 21st century (SD21) project. New
York: United Nations Department of Economic and Social Affairs, Division for
Sustainable Development.
Global Harvest Initiative (GHI) (2014). 2014 GAP Report: Global Agriculture Productivity
Report. Washington, D.C.: Global Harvest Initiative.
Gollin, D., D. Lagakos, and M.E. Waugh (2013). The agricultural productivity gap. Working
Paper, No. 19628. Cambridge: National Bureau of Economic Research.
Gulati, A. (2009). Indian agriculture: changing landscape. Paper prepared for the IAAE
Conference. Beijing, 17 August.
Gulati, A., R. Meinzen-Dick, and K.V. Raju (2005). Institutional reforms in Indian irrigation.
Food Policy Statement, No. 2 (February). IFPRI.
Headey, D., M. Alauddin,, and D.S.P. Rao (2010). Explaining agricultural productivity growth:
an international perspective. Agricultural Economics, vol. 41, pp. 1-14.
India (2014). Agriculture Census 2010-11 (Phase-I). New Delhi: Ministry of Agriculture,
Department of Agriculture & Co-Operation, Agriculture Census Division.
Fostering productivity in the rural and agricultural sector
for inclusive growth and sustainable development in Asia and the Pacific
34
Indian Council for Agricultural Research (ICAR) (2010). Degraded and Wastelands of India:
Status and Spatial Distribution. New Delhi: Indian Council for Agricultural Research.
Johnston, B.F., and J.W. Mellor (1961). The role of agriculture in economic development.
American Economic Review, vol. 51, pp. 566-593.
Joshi, P.K., and others (2000). Socioeconomic constraints to legumes production in rice-wheat
cropping systems of India. In Rice-Whet production System Sustainability in IGP, C.
Johansen and others, eds. ICRISAT and Cornell University.
Kabeer, N. (1994). Reversed Realities: Gender Hierarchies in Development Thought. London:
Verso.
Kaur, M., and M.L. Sharma (1991). Role of women in rural development. Journal of Rural
Studies, vol. 7, pp. 11-16.
Key, N., S. Sadoulet, and A. de Janvry (2000). Transaction costs and agricultural household
supply response. American Journal of Agricultural Economics, vol. 82, No. 2, pp. 245-
259.
Klasen, S.K., J. Priebe, and R. Rudolf (2013). Cash crop choice and income dynamics in rural
areas: evidence for post-crisis Indonesia. Agricultural Economics, vol. 44, pp. 349-364.
Krueger, Anne O. (1996). Political Economy of Agricultural Policy, Public Choice. vol. 87,
No. 1/2, pp. 163-175.
Kumar, P., S. Mittal, and M. Hossain (2008). Agricultural growth accounting and total factor
productivity in South Asia: a review and policy implications. Agricultural Economics
Research Review, vol. 21 (July-December), pp. 145-172.
Lerman, Z., and D.J. Sedik (2009). Sources of agricultural productivity growth in central Asia:
the case of Tajikistan and Uzbekistan. Policy Studies on Rural Transformation, No.
2009-05. FAO Regional Office for Europe and Central Asia.
Ligon, Ethan A., and Elisabeth Sadoulet (2011). Estimating the effects of aggregate agricultural
growth on the distribution of expenditures. CUDARE Working Paper Series, 1115.
University of California at Berkeley, Department of Agricultural and Resource
Economics and Policy.
Liu, H., and T. Yang (2015). Explaining the productivity growth gap between China and India:
the role of structural transformation. The Developing Economies, vol. 53, No. 2 (June),
pp. 100-121.
National Academy of Agricultural Sciences (NAAS) (1999). Reorienting land grant system of
agricultural education in India. Policy Paper, No. 6. National Academy of Agricultural
Sciences.
North, D. (1981). Structure and Change in Economic History. New York: W.M. Norton.
OECD (2010). Economic importance of agriculture for sustainable development and poverty
reduction: findings from a case study of Indonesia. Global Forum on Agriculture. Paris,
29-30 November.
__________ (2012). Agricultural Policies for Poverty Reduction. Paris: OECD Publishing.
Pasha, H.A., A.G. Pasha, and K. Hyder (2002). The slowing down of the growth of total factor
productivity in Pakistan. Karachi: Social Policy and Development Centre.
Poapongsakorn, N. (2006). The decline and recovery of Thai agriculture: causes, responses,
prospects and challenges. In Rapid Growth of Selected Asian Economies: Lessons and

MPFD Working Papers WP/16/07
35
Implications for Agriculture and Food Security. FAO Regional Office for Asia and the
Pacific. Policy Assistance Series 1/3 (2006/06).
Poapongsakorn, N., and others (1995). Agricultural diversification/restructuring of agricultural
production systems in Thailand. Paper prepared for the Food and Agriculture
Organization of the United Nations, Bangkok.
Rada, N.E. (2013). Agricultural growth in India: examining the post-green revolution transition.
Selected paper prepared for presentation at the Agricultural and Applied Economics
Association’s 2013 AAEA and CAES Joint Meeting. Washington, D.C., 4-6 August.
Rada, N.E., and K.O. Fuglie (2012). Shifting sources of agricultural growth in Indonesia: a
regional analysis. In Productivity Growth in Agriculture: An International Perspective,
Fuglie and others, eds. CAB International.
Randhawa, M.S. (1979). A History of the Indian Council of Agricultural Research. Available
from https://ia601602. us.archive.org/0/items/Icar History/IcarHistory.pdf.
Reardon, T., and C.P. Timmer (2007). Transformation of markets for agricultural output in
developing countries since 1950s: How has thinking changed? In Handbook of
Agricultural Economics, R. Evenson and P. Pingali, eds., vol. 3.
Reardon, T., and others (2003). The rise of supermarkets in Africa, Asia and Latin America.
American Journal of Agricultural Economics, vol. 85, No. 5, pp. 1140-1146.
Rosegrant, M.W., and PB.R. Hazell (1992). Agricultural productivity and sources of growth in
South Asia. American Journal of Agricultural Economics, vol. 67, No. 3, pp. 757-761.
Roumasset, J. Wither (2010). The economics of agricultural development? Working Paper, No.
10-3 (March). University of Hawaii at Manoa, Department of Economics.
Schiff, Maurice, and Alberto Valdes (2002). Agriculture and the macroeconomy, with emphasis
on developing countries. In Handbook of Agricultural Economics, edition 1, vol. 2, B.L.
Gardner and G.C. Rausser, eds. Elsevier.
Stigler, G.J. (1951). The division of labor is limited by the extent of the market. Journal of
Political Economy, vol. 59, No. 3, pp. 185-193.
Suphannachart, W., and P. Warr (2011). Research and productivity in Thai agriculture. The
Australian Journal of Agricultural and Resource Economics, vol. 55, pp. 35-52.
Suryahadi, A., D. Suryadarma, and S. Sumarto (2009). The effects of location and sectoral
components of economic growth on poverty: evidence from Indonesia. Journal of
Development Economics, vol. 89, pp. 109-117.
Timmer, P.C. (2007). The structural transformation and the changing role of agriculture in
economic development: empirics and implications. Wendt Lecture. American
Enterprise Institute, Washington, D.C., 30 October.
_________ (2015). Food security and scarcity: why ending hunger is so hard. Philadelphia:
University of Pennsylvania Press.
Unnevehr, L.J., and M.L. Stanford (1985). Technology and the demand for women’s labour in
Asian rice farming. In Women in Rice Farming. Proceedings of a Conference on
Women in Rice Farming Systems. Aldershot: Gower Publishing.
United States Department of Agriculture (USDA) (2010). Total factor productivity calculations.
Available from www.ers.usda.gov/data-products/international-agriculturalproductivity/
documentation-and-methods.aspx.

Fostering productivity in the rural and agricultural sector
for inclusive growth and sustainable development in Asia and the Pacific
36
Von Braun, J., A. Gulati, and S. Fan (2005). Agricultural and economic development strategies
and the transformation of China and India. IFPRI Annual Report: Essays.
Warr, P. (2006). Productivity growth in Thailand and Indonesia: how agriculture contributes to
economic growth. , Working paper in Economics and Development Studies. Pajajaran
University, Center for Economics and Development Studies, Department of Economics .
World Development Indicators (WDI) (2015). WDI Database for 2015.
Wickramasinghe, U., S. Saifullah, and H. Siregar (2013). The role of policies in agricultural
transformation: lessons from Brazil, Indonesia and South Korea. Working Paper, No.
105. Bogor: Centre for the Alleviation of Poverty through Sustainable Agriculture.
Wickramasinghe, U., and K. Weinberger (2013). Smallholder market participation and
production specialization. Working Paper, No. 107. Bogor: Centre for Alleviation of
Poverty through Sustainable Agriculture.
World Bank (1991). Gender and Poverty in India. Washington, D.C.
_________ (2006). Indonesia: Revitalizing the Rural Economy. Washington, D.C.
Yang, X. (2003). Economic Development and the Division of Labour. New York: Blackwell.
Zaman, H. (1995). Patterns of activity and use of time in rural Bangladesh: class, gender, and
seasonal variations. Journal of Developing Areas, vol. 29, pp. 371-388.
Zhang, Y., and B. Brummer (2011). Productivity change and the effects of policy reforms in
China’s agriculture since 1979. Asian-Pacific Economic Literature, vol. 25, No. 2
(November), pp. 131-150.

MPFD Working Papers WP/16/07
37
Subregion Country
Output growth due to area expansion Output growth due to intensive use of
inputs (inputs / area)
Output growth due to growth in total
factor productivity
Total agricultural output growth
1961 -
70
1971 -
80
1981 -
90
1991 -
00
2003 -
12
1961 -
70
1971 -
80
1981 -
90
1991 -
00
2003 -
12
1961 -
70
1971 -
80
1981 -
90
1991 -
00
2003 -
12
1961 -
70
1971 -
80
1981 -
90
1991 -
00
2003 -
12
East & North-
East Asia China 0.80 0.83 0.35 0.90 1.07 3.18 1.13 2.35 0.27 -0.72 0.90 1.34 1.78 3.99 3.20 4.87 3.31 4.49 5.16 3.55
Japan 0.54 -0.76 -0.52 -0.81 -0.48 1.09 0.78 0.19 -1.80 -2.77 1.37 1.38 0.84 1.55 2.87 2.99 1.40 0.51 -1.06 -0.39
Korea 1.79 -0.16 0.10 -1.28 -1.16 1.17 2.24 0.39 0.14 -0.41 1.51 3.73 2.42 3.60 1.89 4.48 5.81 2.91 2.46 0.31
North & Central
Asia Tajikistan 0.67 0.84 -0.48 0.85 0.95 0.74 -3.96 2.16 2.28 -0.71 0.34 2.17 0.00 3.90 0.87 -4.09 5.18
Uzbekistan 1.73 1.30 -0.09 -0.17 0.42 0.60 -1.50 2.99 2.93 -1.23 2.31 2.59 0.00 5.07 0.68 0.72 5.42
Pacific -
developed Australia 1.94 0.30 0.28 -0.26 -0.81 0.07 -0.21 0.23 0.71 0.11 0.95 1.76 1.17 3.12 1.64 2.96 1.85 1.68 3.57 0.94
New Zealand 1.23 1.27 0.17 -0.18 1.30 0.47 -0.92 -0.58 0.66 -0.56 1.06 0.94 1.42 1.78 0.39 2.76 1.29 1.01 2.26 1.14
Pacific -
developing Fiji -0.74 2.02 3.44 -0.01 -0.14 3.14 0.92 -1.11 0.54 0.34 0.06 -0.20 -1.07 -1.27 -1.66 2.45 2.74 1.25 -0.74 -1.47
PNG 3.09 1.79 1.43 1.32 2.73 0.18 -0.20 0.97 1.14 -0.47 -0.31 0.74 -0.27 0.01 0.08 2.97 2.33 2.12 2.46 2.34
South Asia Bangladesh 2.15 0.97 2.45 1.21 0.55 0.27 0.76 0.74 0.71 0.68 -0.28 0.24 -1.10 1.03 3.04 2.15 1.97 2.09 2.95 4.27
India 0.71 0.94 0.74 0.91 0.24 0.53 0.85 1.40 0.70 1.22 0.43 0.97 1.22 0.94 2.64 1.68 2.75 3.36 2.55 4.10
Nepal 0.96 4.48 1.67 1.59 0.44 0.66 -1.44 0.90 1.41 1.49 -0.16 -1.18 2.12 -0.19 1.68 1.46 1.87 4.70 2.81 3.61
Pakistan 2.01 1.04 0.42 0.77 0.65 0.50 1.73 1.28 1.32 1.73 1.76 0.01 3.08 1.14 -0.37 4.26 2.78 4.78 3.24 2.00
Sri Lanka 2.29 0.24 0.27 0.29 1.27 -0.42 0.85 0.83 0.62 -0.09 0.79 2.17 -1.69 0.17 1.96 2.67 3.26 -0.59 1.08 3.15
South-east Asia Cambodia 0.06 1.38 8.06 0.22 1.22 3.59 -4.01 -5.24 2.21 1.85 -0.98 -4.41 3.32 2.29 5.08 2.67 -7.04 6.14 4.73 8.16
Indonesia 0.78 1.46 2.68 1.83 1.16 0.22 0.61 1.55 -0.30 0.57 1.71 1.27 0.35 0.56 2.58 2.71 3.34 4.57 2.08 4.32
Lao PDR 0.53 3.66 0.80 3.18 2.85 4.50 -1.57 1.16 -0.12 0.94 0.66 -0.90 1.05 2.22 1.54 5.69 1.20 3.00 5.29 5.32
Malaysia 2.54 2.28 3.56 0.26 0.94 -0.16 0.02 -1.99 0.39 -0.85 3.03 2.10 3.04 1.81 2.91 5.41 4.40 4.61 2.46 3.01
Philippines 1.05 3.18 0.73 -0.43 1.39 1.83 -1.33 0.95 2.04 -0.69 -0.23 3.23 0.15 0.46 1.80 2.64 5.08 1.82 2.06 2.50
Thailand 1.89 3.04 1.73 0.33 1.10 1.19 -0.34 0.98 -0.27 -0.63 0.35 2.27 0.04 2.34 2.22 3.43 4.97 2.74 2.39 2.70
Vietnam 0.64 1.65 1.87 2.44 1.31 0.44 -0.05 1.04 0.92 0.03 -0.62 1.34 1.11 2.34 2.71 0.46 2.94 4.02 5.69 4.05
South-west Asia Iran 0.39 -1.56 1.83 -0.48 1.06 1.30 3.03 1.66 1.94 -0.95 2.24 2.48 1.24 2.41 1.79 3.93 3.95 4.74 3.86 1.90
Turkey 0.97 0.36 0.34 -0.36 -1.24 1.15 1.41 1.50 1.03 0.64 0.70 1.46 0.70 1.02 3.13 2.82 3.22 2.54 1.69 2.52
Source: USDA (2015).

Recent MPDD Working Papers
WP/09/01 Towards a New Model of PPPs: Can Public Private Partnerships Deliver Basic Services to the Poor? by Miguel Pérez-Ludeña
WP/09/02 Filling Gaps in Human Development Index: Findings for Asia and the Pacific by David A. Hastings
WP/09/03 From Human Development to Human Security: A Prototype Human Security Index by David A. Hastings
WP/09/04 Cross-Border Investment and the Global Financial Crisis in the Asia-Pacific Region by Sayuri Shirai
WP/09/05 South-South and Triangular Cooperation in Asia-Pacific: Towards a New Paradigm in Development Cooperation by Nagesh Kumar
WP/09/06 Crises, Private Capital Flows and Financial Instability in Emerging Asia by Ramkishen S. Rajan
WP/10/07 Towards Inclusive Financial Development for Achieving the MDGs in Asia and the Pacific by Kunal Sen
WP/10/08 G-20 Agenda and Reform of the International Financial Architecture: an Asia-Pacific Perspective by Y. Venugopal Reddy
WP/10/09
The Real Exchange Rate, Sectoral Allocation and Development in China and East Asia: A Simple Exposition by Ramkishen S. Rajan and Javier Beverinotti
WP/10/10 Approaches to Combat Hunger in Asia and the Pacific by Shiladitya Chatterjee, Amitava Mukherjee, and Raghbendra Jha
WP/10/11 Capital Flows and Development: Lessons from South Asian Experiences
by Nagesh Kumar
WP/10/12 Global Partnership for Strong, Sustainable and Balanced Growth: An Agenda for the G20 Summit by Nagesh Kumar, Shuvojit Banerjee, Alberto Isgut and Daniel Lee
WP/10/13 Economic Cooperation and Connectivity in the Asia-Pacific Region by Haruhiko Kuroda
WP/11/14 Inflationary pressures in South Asia by Ashima Goyal
WP/11/15 Social and Economic Impact of Disasters: Estimating the Threshold between Low and High Levels of Risk by Clovis Freire
WP/11/16 Financial Crisis and Regional Economic Cooperation in Asia-Pacific: Relevance, Trends and Potential by Nagesh Kumar
WP/11/17 Productive Capacities in Asia and the Pacific by Clovis Freire
WP/11/18 High Food and Oil Prices and Their Impact on the Achievement of MDG 1 in Asia and the Pacific by Clovis Freire and Alberto Isgut
WP/11/19 Impact of Health Expenditure on Achieving the Health-related MDGs by Clovis Freire and Nobuko Kajiura
WP/12/01 High Food Prices in Asia-Pacific: Policy Initiatives in view of Supply Uncertainty and Price Volatility by Clovis Freire, Aynul Hasan and M. Hussain Malik
WP/12/02 Building Productive Capacities: Challenges and Opportunities for Least Developed Countries by Clovis Freire
WP/12/03 Euro zone debt crisis: Scenario analysis and implications for developing Asia-Pacific by Sudip Ranjan Basu, Clovis Freire, Pisit Puapan, Vatcharin Sirimaneetham, and Yusuke Tateno
WP/12/04 Strategies for Structural Transformation in Countries in South and South-West Asia by Clovis Freire
WP/12/05 In which industries to invest? Aligning market and development incentives in Myanmar by Steven Ayres and Clovis Freire
WP/13/01 Policies for structural transformation: An analysis of the Asia-Pacific experience by C.P. Chandrasekhar and Jayati Ghosh
WP/14/01 G20 agenda for the World Economy: Asia-Pacific perspectives By Sudip Ranjan Basu, Alberto Isgut and Daniel Jeongdae Lee
WP/15/01 Infrastructure Financing, Public-Private Partnerships, and Development in the Asia-Pacific Region by Gilberto Llanto, Adoracion Navarro, Ma. Kristina Ortiz
WP/15/02 Financing for Development: Infrastructure Development in the Pacific Islands by ESCAP Pacific Office
WP15/03 Capital Market Development and Emergence of Institutional Investors in the Asia-Pacific Region by Hans Genberg
WP/15/04 Trade Finance for Sustainable Development in Asia and the Pacific by Sailendra Narain
WP/15/05 Financing Small and Medium Sized Enterprises for Sustainable Development: A View from the Asia-Pacific Region by Nick Freeman
WP/15/06 Financing the Social Sector: Regional Challenges and Opportunities by Social Development Division, ESCAP
WP/15/07 Inclusive Finance in the Asia‐ Pacific Region: Trends and Approaches by Md. Ezazul Islam
WP/15/08 Climate finance in the Asia-Pacific: Trends and Innovative Approaches by Ilaria Carrozza
WP/15/09
Financing Disaster Risk Reduction for sustainable development in Asia and the Pacific by Disaster Risk Reduction Section, ICT and Disaster Risk Reduction Division, ESCAP
WP/15/10 Financing Statistics Development in Asia and the Pacific by Statistics Division, ESCAP
WP/15/11 Financing Sustainable Development – What Can We Learn from The Australian Experience of Reform? by Wayne Swan
WP/15/12 Financing Development Gaps in the Countries with Special Needs in the Asia-Pacific Region by Mustafa K. Mujeri
WP/15/13 Polarizing world: GDP, development and beyond by Michael Shashoua and Sudip Ranjan Basu
WP/16/01
Strengthening the capacities of Asia and the Pacific to protect workers against unemployment By John Carter
WP/16/02 Asia-Pacific’s experience with national systems of TVET By Jenny Grainger, Liz Bowen-Clewley and Sarah Maclean
WP/16/03 An analytical framework for identifying optimal pathways towards sustainable development By Jaebeum Cho, Alberto Isgut, and Yusuke Tateno
WP/16/04 Pathways for adapting the Sustainable Development Goals to the national context: the case of Pakistan By Jaebeum Cho, Alberto Isgut, and Yusuke Tateno
WP/16/05 Obstacles to productivity in Asia and Pacific region: finance reigns By Filipe Lage de Sousa
WP/16/06 China's productivity: past success and future challenges By Yanqun Zhang
WP/16/07 Fostering productivity in the rural and agricultural sector for inclusive growth and sustainable development in Asia and the Pacific By Upali Wickramasinghe

READERSHIP SURVEY
The Macroeconomic Policy and Financing for Development Division of ESCAP is
undertaking an evaluation of “Fostering productivity in the rural and agricultural sector
for inclusive growth and sustainable development in Asia and the Pacific”, with a view
to making future issues more useful for our readers. We would appreciate it if you could
complete this questionnaire and return it, at your earliest convenience, to:
Director
Macroeconomic Policy and Financing for Development Division
ESCAP, United Nations Building Rajadamnern Nok Avenue
Bangkok 10200, THAILAND
...........................................................................................................................................
...........................................................................................................................................
...........................................................................................................................................
...........................................................................................................................................
...........................................................................................................................................
...........................................................................................................................................
...........................................................................................................................................
...........................................................................................................................................
...........................................................................................................................................
...........................................................................................................................................

MPDD Working Papers WP/16/..