Embed Size (px)
Citation preview

Working Paper No. 154
Drinking Water Supply: Environmental Problems,
Causes, Impacts and Remedies – Experiences from Karnataka
Puttaswamaiah S.
Gujarat Institute of Development Research Gota, Ahmedabad 380 060 March 2005

1
Abstract Drinking water is a basic requirement for life and a determinant of standard of living. However, besides government efforts, supply and demand side factors of both surface and groundwater determine the level of drinking water available to people. Natural and human induced factors like pollution, depletion of water table, limit drinking water supply provision and raise the delivery cost. In Karnataka, over 35 per cent of the rural habitations and 77 per cent of urban local bodies are yet to be covered with adequate water supply. But, decline in groundwater table and availability of surface water, particularly in summer months, has put large number of people in hardship to avail drinking water. Similarly, poor water quality problem has also been observed in more number of habitations. Consumption of poor quality water has adversely affected the health status of people. Inadequate resource management and institutional system seem to be the major causes for the present problems. In this context, the paper examines the nature and magnitude of environmental problems, causes and impacts in drinking water supply of Karnataka. The study observes: activities like operation and maintenance of the schemes; water quality monitoring; groundwater conservation and rainwater harvesting measures have to be implemented for better provision of drinking water supply. Further, an integrated institutional system for water quality monitoring and groundwater recharging seems to be necessary.
JEL Classification : I18, I31 Keywords : Drinking water, Water Quality, Institutions

2
Acknowledgements
This paper is a revised version of the report ‘Rural and Urban Drinking Water Supply
and Sanitation’ prepared for the “State of Environment Report and Action Plan –
Karnataka - 2004”. The author is thankful to Dr. Gopal K. Kadekodi, Dr. Smita
Mishra, Ms. Lata Krisnha Rao and Mrs. Nayanatara Nayak for their suggestions and
comments. The paper was presented in the Drinking Water Session of the IWMI-
TATA 4th Annual Partners Meet, during February 24-26, 2005, Anand, Gujarat. The
author is thankful to the anonymous referees and Dr. Keshab Das for their
constructive suggestions/comments. The usual disclaimers are mine.
3
Drinking Water Supply: Environmental Problems, Causes, Impacts and Remedies –
Experiences from Karnataka
Puttaswamaiah S. 1. Introduction
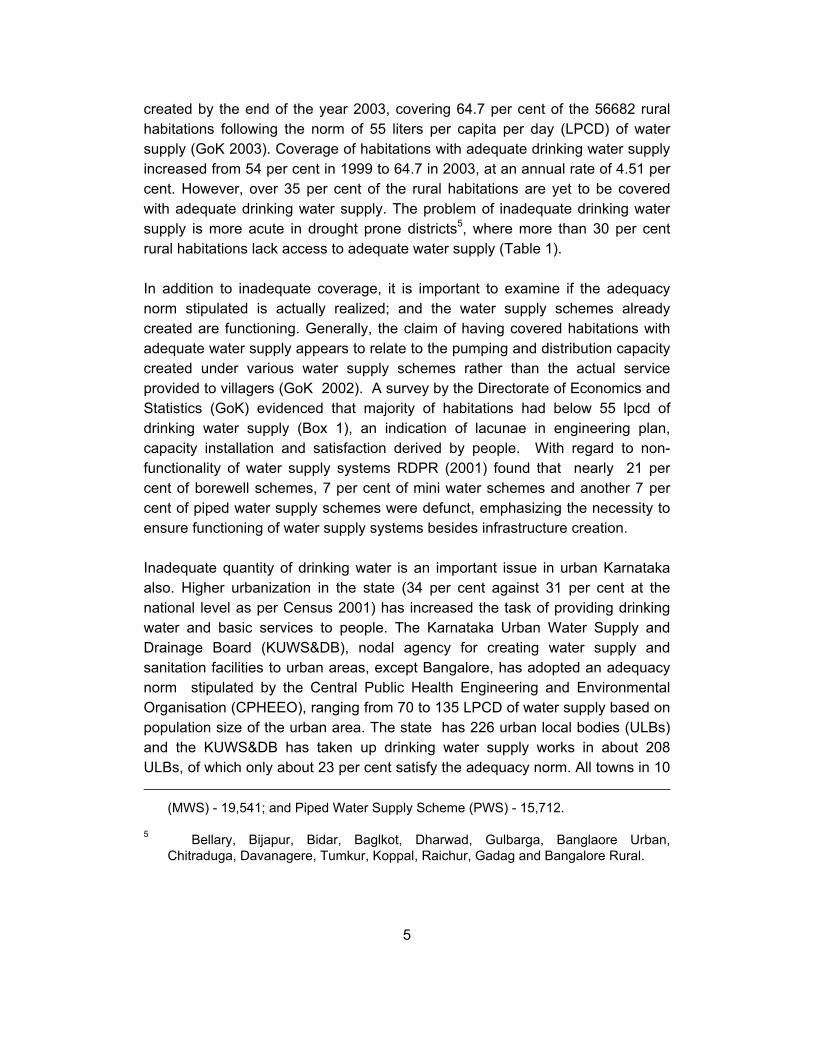
Drinking water, in adequate quantity and safe quality, is a basic requirement for life and a determinant of standard of living. Poor or no access to safe water supply can result in many diseases including diarrhea1, flourosis, cholera, hepatitis – A, trachoma, etc. These ailments potentially constrain human resource development and productivity, especially of the poor. The National Water Policy 2002 reflects the significance attached to drinking water by stating, “adequate safe drinking water facilities should be provided to the entire population both in urban and rural areas. Irrigation and multipurpose projects should invariably include a drinking water component, wherever there is no alternative source of drinking water. Drinking water needs of human beings and animals should be the first charge on any available water” (GoI 2002). However, around 22 per cent of households in India lack access to safe drinking water sources, like tap, hand pump and tube well (Census 2001). Hence, significant efforts are being made by the central and state governments for increasing the coverage of households with adequate and safe drinking water supply, along with sanitation services, which coincide with the Millennium Development Goals (UNDP 2003).
While governments attempt to provide adequate and safe drinking water to all households, supply and demand side factors determine the level of water availability. The supply side factors include sustainability of water sources (e.g., rainfall, surface flows, groundwater availability and recharge, surface run-off etc.), quality of available water, kinds of institutions and establishments, operation and maintenance of water supply schemes. Likewise, on the demand side, several factors such as population pressure, use and discharge of water by industries, inefficient land use, wastewater, fertilizer and pesticide flow into water bodies and 1 For instance, over 750 persons per lakh population suffered from diarrhea in India
during 1998, attributable to poor water quality drinking water.

4
soils, inappropriate water pricing mechanisms etc., are contributing to the problems of the deterioration of water quality as well as depletion of the resource per se. Majority of these factors being environmental in nature are directly affected by an increasing pollution, degradation and depletion of resources such as water and land, limited water supply provision and rise in the delivery cost. The present paper, in this context, examines the nature of environmental problems, their causes and impacts on the drinking water supply sector of Karnataka and concludes with some suggestions for rectification of emerging problems.
2. Environmental Problems in Drinking Water Supply
In Karnataka more than 90 per cent of habitations, especially rural, depend upon groundwater and are facing major risks of depletion of the resource. The pressures exerted by supply and demand side factors on water resource have caused several environmental problems in drinking water supply, categorized as: (1) inadequate quantity of drinking water supply, a problem of scarcity and governance; (2) scarcity of drinking water in summer months, a problem of natural factors, seasonality, governance and management; (3) depletion of drinking water sources, a problem of resource management and (4) deteriorating quality of drinking water, a direct environmental problem. This section discusses the nature and magnitude of environmental problems in drinking water supply of rural and urban Karnataka. 2.1 Inadequate Quantity
Inadequacy of safe drinking water supply is the forerunner of several environmental problems. A certain quantity of water is essential for life and maintenance of personal hygiene2, absence of which results in health problems like dehydration, skin diseases, etc. Further, maintenance of a clean environment becomes increasingly difficult with insufficient water use creating blockages in sewerage system or spread of sanitary waste on surface that can increase pollution of resources like soil, water and even air. In rural Karnataka, according to the Rural Development and Panchayat Raj Department3 (RDPR), over 2 lakh drinking water supply schemes4 have been 2 WHO and World Bank propose 40 lpcd of water supply as the norm 3 Nodal agency for providing water supply and sanitation services in rural areas. 4 Borewell with Hand pump Scheme (BWS) - 1,77,879; Mini Water Supply Scheme
5
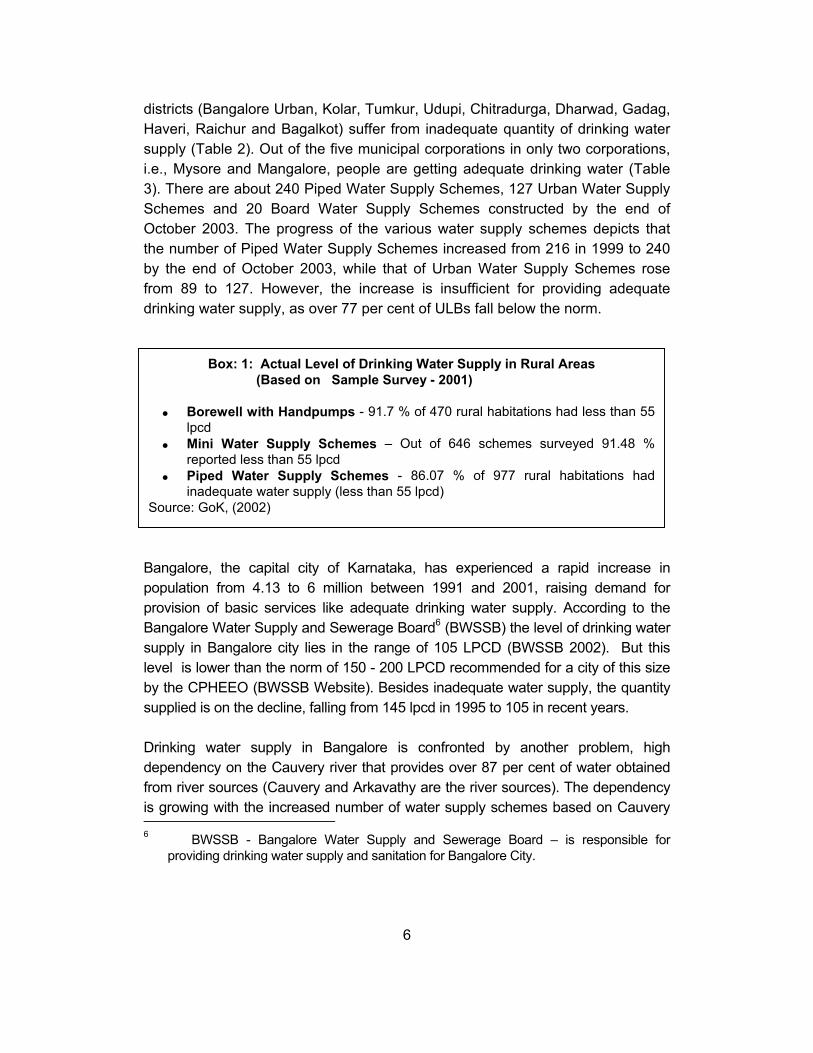
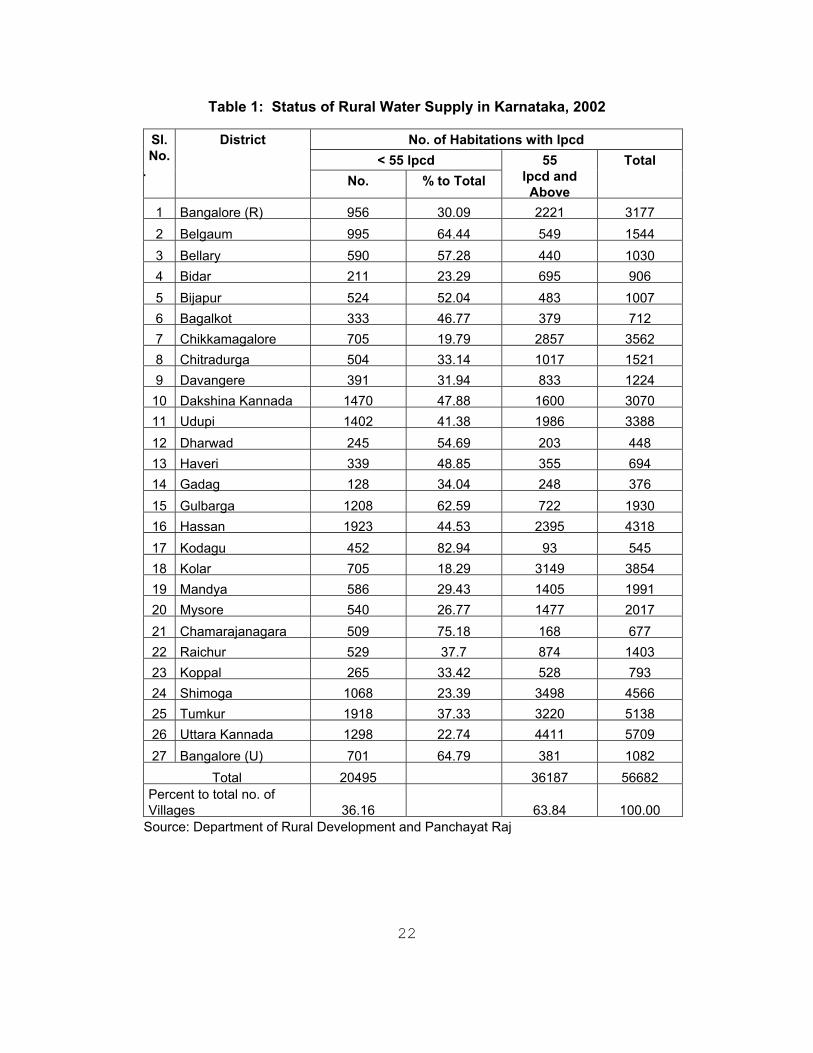
created by the end of the year 2003, covering 64.7 per cent of the 56682 rural habitations following the norm of 55 liters per capita per day (LPCD) of water supply (GoK 2003). Coverage of habitations with adequate drinking water supply increased from 54 per cent in 1999 to 64.7 in 2003, at an annual rate of 4.51 per cent. However, over 35 per cent of the rural habitations are yet to be covered with adequate drinking water supply. The problem of inadequate drinking water supply is more acute in drought prone districts5, where more than 30 per cent rural habitations lack access to adequate water supply (Table 1).
In addition to inadequate coverage, it is important to examine if the adequacy norm stipulated is actually realized; and the water supply schemes already created are functioning. Generally, the claim of having covered habitations with adequate water supply appears to relate to the pumping and distribution capacity created under various water supply schemes rather than the actual service provided to villagers (GoK 2002). A survey by the Directorate of Economics and Statistics (GoK) evidenced that majority of habitations had below 55 lpcd of drinking water supply (Box 1), an indication of lacunae in engineering plan, capacity installation and satisfaction derived by people. With regard to non-functionality of water supply systems RDPR (2001) found that nearly 21 per cent of borewell schemes, 7 per cent of mini water schemes and another 7 per cent of piped water supply schemes were defunct, emphasizing the necessity to ensure functioning of water supply systems besides infrastructure creation.
Inadequate quantity of drinking water is an important issue in urban Karnataka also. Higher urbanization in the state (34 per cent against 31 per cent at the national level as per Census 2001) has increased the task of providing drinking water and basic services to people. The Karnataka Urban Water Supply and Drainage Board (KUWS&DB), nodal agency for creating water supply and sanitation facilities to urban areas, except Bangalore, has adopted an adequacy norm stipulated by the Central Public Health Engineering and Environmental Organisation (CPHEEO), ranging from 70 to 135 LPCD of water supply based on population size of the urban area. The state has 226 urban local bodies (ULBs) and the KUWS&DB has taken up drinking water supply works in about 208 ULBs, of which only about 23 per cent satisfy the adequacy norm. All towns in 10
(MWS) - 19,541; and Piped Water Supply Scheme (PWS) - 15,712. 5 Bellary, Bijapur, Bidar, Baglkot, Dharwad, Gulbarga, Banglaore Urban,
Chitraduga, Davanagere, Tumkur, Koppal, Raichur, Gadag and Bangalore Rural.
6
Box: 1: Actual Level of Drinking Water Supply in Rural Areas (Based on Sample Survey - 2001)
• Borewell with Handpumps - 91.7 % of 470 rural habitations had less than 55
lpcd • Mini Water Supply Schemes – Out of 646 schemes surveyed 91.48 %
reported less than 55 lpcd • Piped Water Supply Schemes - 86.07 % of 977 rural habitations had
inadequate water supply (less than 55 lpcd) Source: GoK, (2002)
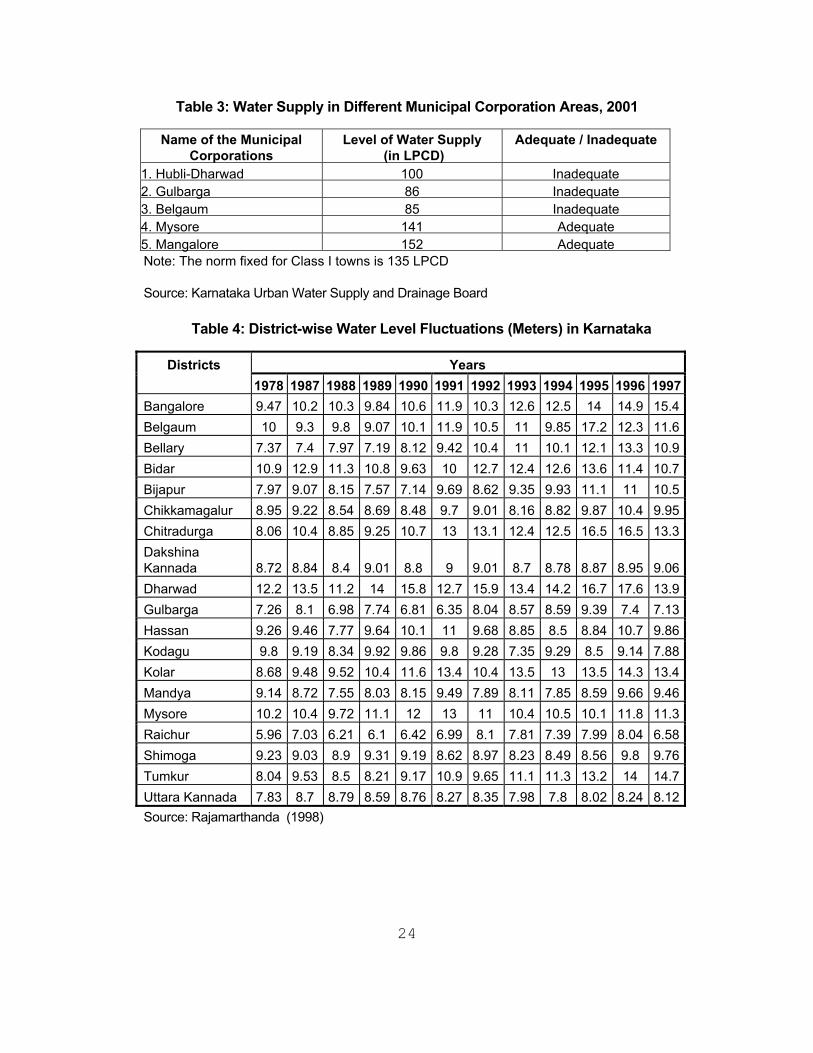
districts (Bangalore Urban, Kolar, Tumkur, Udupi, Chitradurga, Dharwad, Gadag, Haveri, Raichur and Bagalkot) suffer from inadequate quantity of drinking water supply (Table 2). Out of the five municipal corporations in only two corporations, i.e., Mysore and Mangalore, people are getting adequate drinking water (Table 3). There are about 240 Piped Water Supply Schemes, 127 Urban Water Supply Schemes and 20 Board Water Supply Schemes constructed by the end of October 2003. The progress of the various water supply schemes depicts that the number of Piped Water Supply Schemes increased from 216 in 1999 to 240 by the end of October 2003, while that of Urban Water Supply Schemes rose from 89 to 127. However, the increase is insufficient for providing adequate drinking water supply, as over 77 per cent of ULBs fall below the norm.
Bangalore, the capital city of Karnataka, has experienced a rapid increase in population from 4.13 to 6 million between 1991 and 2001, raising demand for provision of basic services like adequate drinking water supply. According to the Bangalore Water Supply and Sewerage Board6 (BWSSB) the level of drinking water supply in Bangalore city lies in the range of 105 LPCD (BWSSB 2002). But this level is lower than the norm of 150 - 200 LPCD recommended for a city of this size by the CPHEEO (BWSSB Website). Besides inadequate water supply, the quantity supplied is on the decline, falling from 145 lpcd in 1995 to 105 in recent years.
Drinking water supply in Bangalore is confronted by another problem, high dependency on the Cauvery river that provides over 87 per cent of water obtained from river sources (Cauvery and Arkavathy are the river sources). The dependency is growing with the increased number of water supply schemes based on Cauvery 6 BWSSB - Bangalore Water Supply and Sewerage Board – is responsible for
providing drinking water supply and sanitation for Bangalore City.

7
water7. The increased dependency has its own demerits of high cost, maintenance problem, etc., due to long distance from source. The Arkavathy river, another source, is contributing about 12 per cent of water to Bangalore, but dries up during low rainfall years. In recent years frequency of Thippagondanahalli Reservoir on river Arkavathy drying up has increased owing to low rainfall. Groundwater forms another major source of drinking water to Bangalore in addition to the rivers. The BWSSB maintains over 7000 bore wells, while citizens extract water from around 80000 privately owned bore wells. Extraction of groundwater is about 103000 million liters per year as estimated by the BWSSB, constituting 28 per cent of drinking water in 2001-02. Consequently, the groundwater level is fast declining and the inadequate measures for groundwater recharging and conserving rainwater have added to the problem. All these indicate that drinking water is an important issue for a large metropolitan city like Bangalore. 2.2 Scarcity in Summer Season
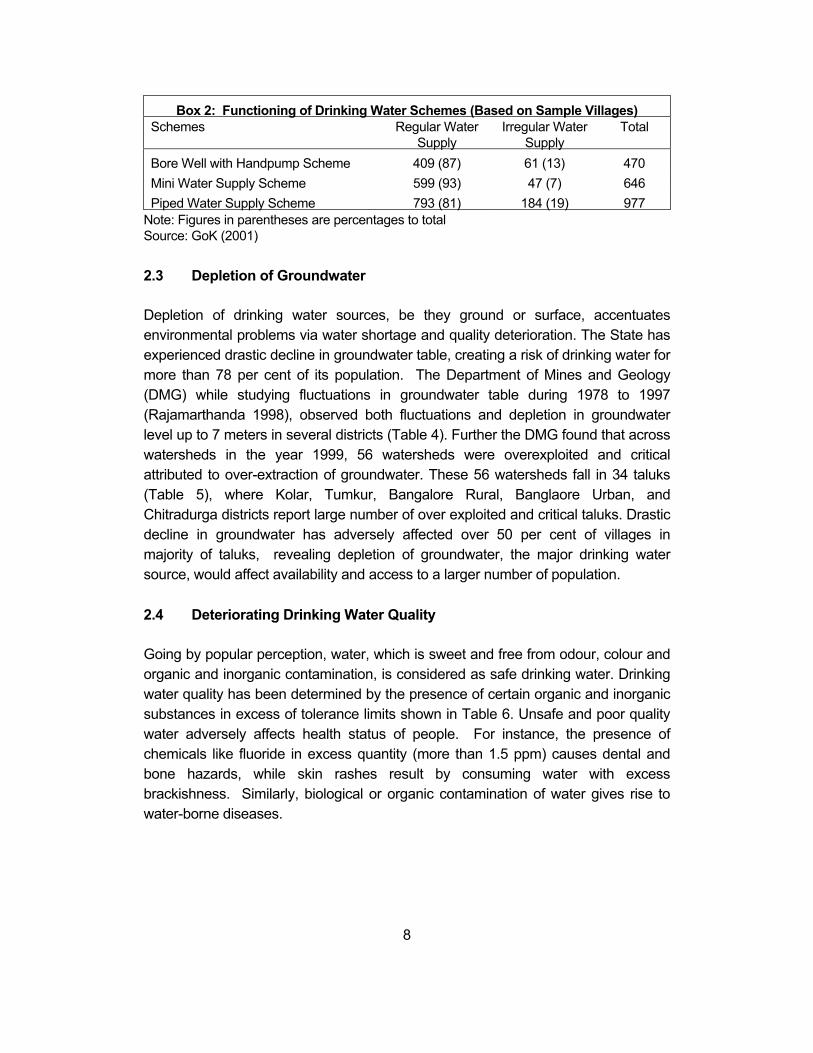
Water scarcity or limited availability, particularly during the summer months results in fluctuations, irregularity and reduction in per capita availability. Fluctuations in water supply cause unexpected water contamination in distributional network attributable to rustiness developed in pipes due to reduced water flow, which lead to health and environmental problems. In Karnataka, the level of supply of rural drinking water schemes declined by 50 to 75 per cent of the intended level during summer months according to GoK (2001). Further, the High Power Committee8 observes that irregular water supply is a serious issue as about 13 per cent of 470 villages based on bore well water supply scheme, 7 per cent of 646 villages depending on mini water supply schemes, and 19 per cent of 977 villages depend on piped water supply schemes had irregular water supply (GoK 2002). Water scarcity is high in drought prone districts indicating the severity of inaccessibility to drinking water.
7 Already three schemes i.e., Cauvery Water Supply Stage (CWSS) I, II and III have
been completed and CWSS IV is in progress. 8 High Power Committee – Karnataka Government had constituted this committee
for studying the redressal of regional imbalances in Karnataka.
8
Box 2: Functioning of Drinking Water Schemes (Based on Sample Villages) Schemes Regular Water
Supply Irregular Water
Supply Total
Bore Well with Handpump Scheme 409 (87) 61 (13) 470 Mini Water Supply Scheme 599 (93) 47 (7) 646 Piped Water Supply Scheme 793 (81) 184 (19) 977
Note: Figures in parentheses are percentages to total Source: GoK (2001) 2.3 Depletion of Groundwater Depletion of drinking water sources, be they ground or surface, accentuates environmental problems via water shortage and quality deterioration. The State has experienced drastic decline in groundwater table, creating a risk of drinking water for more than 78 per cent of its population. The Department of Mines and Geology (DMG) while studying fluctuations in groundwater table during 1978 to 1997 (Rajamarthanda 1998), observed both fluctuations and depletion in groundwater level up to 7 meters in several districts (Table 4). Further the DMG found that across watersheds in the year 1999, 56 watersheds were overexploited and critical attributed to over-extraction of groundwater. These 56 watersheds fall in 34 taluks (Table 5), where Kolar, Tumkur, Bangalore Rural, Banglaore Urban, and Chitradurga districts report large number of over exploited and critical taluks. Drastic decline in groundwater has adversely affected over 50 per cent of villages in majority of taluks, revealing depletion of groundwater, the major drinking water source, would affect availability and access to a larger number of population. 2.4 Deteriorating Drinking Water Quality
Going by popular perception, water, which is sweet and free from odour, colour and organic and inorganic contamination, is considered as safe drinking water. Drinking water quality has been determined by the presence of certain organic and inorganic substances in excess of tolerance limits shown in Table 6. Unsafe and poor quality water adversely affects health status of people. For instance, the presence of chemicals like fluoride in excess quantity (more than 1.5 ppm) causes dental and bone hazards, while skin rashes result by consuming water with excess brackishness. Similarly, biological or organic contamination of water gives rise to water-borne diseases.
9
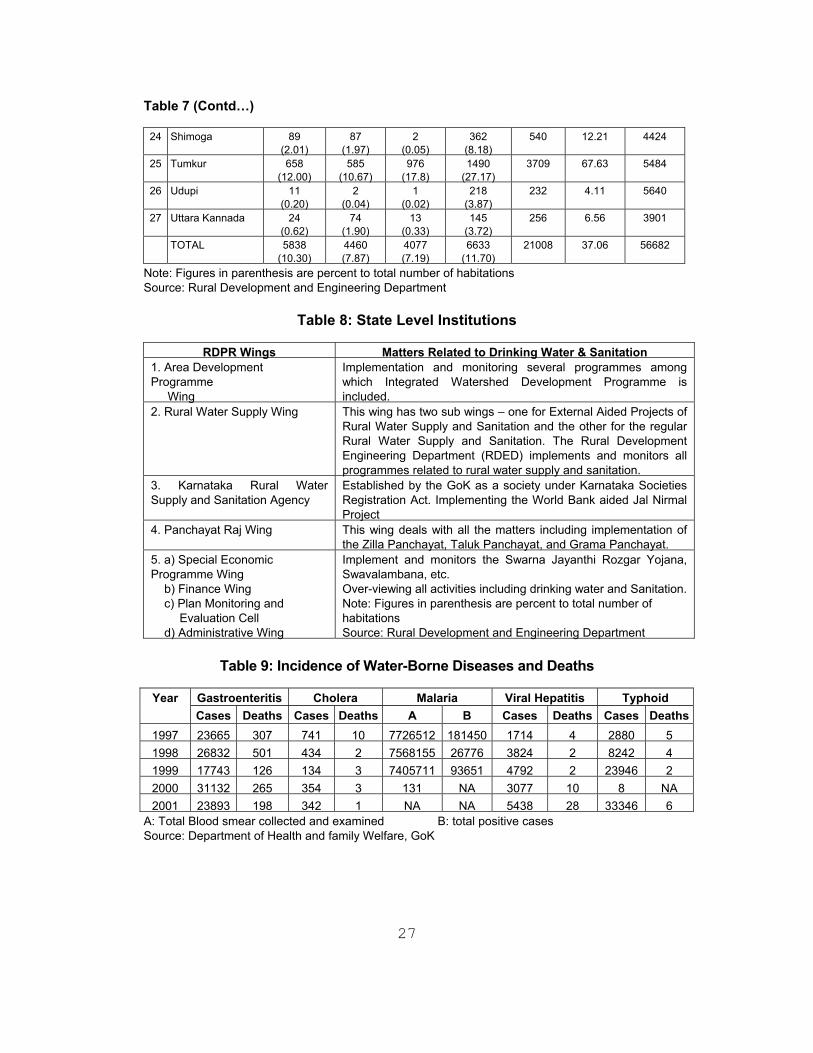
In Karnataka, groundwater in more than 37 per cent of rural habitations (Table 7) and surface water in some rivers around points of effluent discharge and urban areas is contaminated. Habitations in Bagalkot, Bangalore Urban, Bijapur, Chamarajnagar, Chitradurga, Haveri, Mandya, Tumkur, Bellary, Davanagere, Kodagu, Kolar, Raichur and Koppal districts have serious groundwater quality problems, ranging from 50 to 79 per cent of habitations. More specifically, excess fluoride in groundwater is a major problem in 14 districts, ranging from 10 to 67 per cent of total habitations in each district. Similarly, excess brackishness in 13 districts (10 to 27 per cent of habitations), excess nitrate in 8 districts (10 to 51 per cent of habitations) and excess iron in 12 districts ( 10 to 63 per cent of habitations) have adversely affected drinking water quality.
Drinking water quality problem is not just restricted to rural areas only as majority of urban areas also suffer due to contamination of ground and surface water at source and pollution occurred in the transmission and distribution systems. This is pointed out in a survey conducted by the High Power Committee (GoK 2002). Out of 76 towns surveyed for bore well water supply scheme 16 per cent reported water as unfit for drinking; 5 per cent of towns reported saltishness, 5 per cent hardness and 3 per cent contamination. Among the districts saltishness is a major problem in 33 per cent of towns in Raichur, 20 per cent in Bangalore Rural, 15 per cent of towns in Kolar, while hardness in water was reported in 50 per cent of towns in Shimoga, 40 per cent in Bangalore Rural and 17 per cent in Haveri districts. In Davanagere and Tumkur water was contaminated, respectively, in 33 and 12 per cent of towns. Similarly the test conducted for tank based drinking water schemes showed that in 8 per cent of 28 towns surveyed, water quality was low with high salt and hardness in water.
Surface water contamination is yet another environmental problem in Karnataka as water has been polluted at certain pockets of some rivers and other water bodies. For instance, water in the river Bhadra is turbid and contaminated at the point of effluent discharge by the Mysore Paper Mills and Vishweshvaraiah Iron and Steel Limited. Similarly, in Kabini and Cauvery rivers water is polluted around townships situated on the banks (Deccan Herald, 24 February 2001). Additionally, mining activities too affect surface water quality, for instance in intensive mining areas of Bellary district water has been reported to contain neutral pH, high turbidity and suspended solids (NEERI 2002). All these evidences indicate that the quality of surface water is deteriorating in the state.

10
As observed above environmental pressures are rising on drinking water sources, both ground and surface, and also in the distribution system. Problems of depletion and deterioration of quantity and quality respectively result either in sub-optimal or non-functioning of drinking water supply systems, ultimately crippling the process of providing adequate safe drinking water to people. 3. Causes for Environmental Problems in Drinking Water Supply
Environmental problems in drinking water supply are caused by both supply and demand side factors. Two major supply factors are depletion and deterioration in water quantity and quality, which are aggravated by demand factors like over extraction and pollution as they are interdependent. This section examines some of the causes for environmental problems in drinking water supply sector in Karnataka. Major environmental factors causing inadequate drinking water supply include non-availability of perennial water sources and high dependency on groundwater. Groundwater has been experiencing wide fluctuations and cyclically declining in many districts due to geographical and geological conditions, rainfall fluctuations, low recharge rate, etc. It is important to note that like depletion of groundwater (a supply factor), over extraction (a demand factor) also contributes significantly to this depletion. The rapid and accelerated drawal of groundwater to meet competing demands from agriculture, industry and other sectors has led to decline in the groundwater table.
Another related cause for inadequate drinking water supply is reduction in availability of surface water, particularly during the summer season. Supply capacity of surface sources like rivers, lakes, reservoirs and tanks decrease owing to forest degradation, siltation, uncertainty and fluctuations in rainfall, etc. (GoK 2004). The general neglect in conserving rainwater has resulted in waste of rainfall by way of run-off and evaporation. Finally, human made factors like discharging untreated waste, sewage flow, etc., to water bodies also have caused depletion and deterioration of water resources.
Increasing demand and overexploitation are the other demand based causal factors leading to inadequate drinking water availability. Groundwater extraction is growing rapidly as it is used for drinking, irrigation and industrial needs. The agriculture sector demand for groundwater has risen significantly with increased number of
11
wells in the state, from 78503 in 1987-88 to 885814 during 1999-2000, which is the major source of drafting groundwater. All these factors reduce groundwater availability in aquifers, particularly during summer season, creating wide fluctuations in drinking water supply. Besides the above supply and demand driven factors, lack of operation and maintenance of water supply schemes (a matter of management and governance) is another important cause for inadequate drinking water supply as rightly pointed out in GoK (2000). Other management related causes, attributable to variations in water supply, are leakages in the distribution network and power fluctuations, which make water supply schemes sub-optimal (GoK, HPC, 2002). Leakages and unaccounted for water cause disparity in distribution reducing the actual quantity of drinking water supplied. In urban areas water loss through leakage is a major factor reducing the quantity9, but precise information on the quantity of water lost in distribution network10 in the state is not available. However, the enormity of the leakage problem can be visualized from the data on water leakage according to BWSSB engineers in Bangalore City, which is around 35 per cent of the flow. The leakage occurs mainly due to corroded pipes in distribution network, damages caused during road widening and repair works and also use of poor quality pipes in majority of household connections. Deterioration in drinking water quality either at source or in the distribution system has been caused by factors such as natural, human made (or demand driven) and institutional (like lack of monitoring system). Natural factors such as geological and geographical characteristics lead to inorganic contamination with excess fluoride, iron, nitrate, etc., while human made factors like over extraction of groundwater, discharging pollutants to surface and ground water bodies, inadequate and improperly designed drainage and sewerage systems too add their share of pollution. In addition, the common practice of using open places for defecation, washing clothes and animals, bathing around water bodies, also pollute water 9 Out of 161 ULBs with inadequate water supply, 40 ULBs have adequate supply
at bulk level, but faulty distribution system has caused leakage and thus reduction in the quantity supplied at consumer end. (KUWS&DB)
10 A nationwide study conducted by National Environmental Engineering Research
Institute (NEERI) showed that about 17 to 44 per cent of the total flow in the distribution system is lost through leakages in main, communication and service pipes and leaking valves (quoted in Suresh: Website).
12
sources. Industrial effluents discharged to open place and water bodies is another major cause for decline in water quality. Studies conducted by the DMG on water quality around major industrial locations11 in the state revealed that in 93 per cent of these groundwater quality had exceeded the IS:10500-1991 (drinking water standards) permissible limits for Total Dissolved Solids (500 mg/l). Another study by Bangalore University – Civil Engineering Department, found groundwater contamination with excess nitrates and chlorides in urban areas of Chikkaballapur and Mandya, because of inadequate and improper design of sanitation facilities (Indian Express, December 22, 1998). The Central Ground Water Board observed higher nitrate level, between 147 mg/liter to 550 mg/liter in groundwater around some rural habitations of Bangalore Rural district. Experts opine that improper sanitation has caused high level of nitrate in groundwater (Deccan Herald, March 14, 2003). Surface water quality is also adversely affected by many of the above factors. Industrial effluents, urban wastes, etc., have contaminated water at several places in rivers Bhadra, Cauvery, Kali and others in the state.
Drinking water apart from source level, is also likely to get contaminated in the distribution network when sewage or other waste materials enter through broken or leaking pipes. In urban areas with inadequate sanitation system this becomes a major cause. Further, improper siting of water collection points particularly in low lying areas, unhygienic practice of collecting water by households, etc., also adversely affect water quality. Referring to institutional factors, lack of drinking water quality monitoring system is a major cause for quality deterioration. In the State, even now there is no agency with a well-defined mandate for routine water quality monitoring, particularly in rural areas. While multiple institutions (details are given in the following section) are all involved in testing water quality, many of these lack either adequate equipment for testing chemical and bacteriological contamination of water, trained staff, etc., or there is serious coordination problem. 4. Institutional Arrangement in Drinking Water Supply In the provision of drinking water supply different institutions are involved, in both rural and urban areas, in activities ranging from creation of infrastructure to 11 Attibele and Jigani in Bangalore Urban district, Devanahalli and Bidadi in
Bangalore Rural district, Malur in Kolar district, and Nanjanagud in Mysore.

13
operation and maintenance; water quality testing and monitoring, etc. It might be useful to take a close look at the institutions involved, their functions and limitations in dealing with environmental problems. 4.1 Institutions in Rural Drinking Water Supply 4.1.1 State Level Institutions
The Rural Development and Panchayat Raj Department (RDPR), the nodal agency in planning, implementing, monitoring and evaluating all rural development activities in the State, is responsible for providing drinking water in rural areas. The RDPR has different wings to carry out its programmes as shown in Table 8.
4.1.2 Institutions at District and Lower Levels At the district and lower level the following Panchayat Raj Institutions are responsible in implementing the programmes of drinking water supply, along with other developmental works.
Zilla Panchayat: ZP, the first tier in Panchayat Raj institutions, is responsible for planning, implementing and monitoring all the developmental programmes in the district which are being carried out by the departments such as PWD. District Project Monitoring Unit formed at district level under Project Planning and Monitoring Unit of ZP is responsible to oversee the activities at district level. It has technical, administrative personnel and also a social scientist. Taluk Panchayat: Taluk Panchayat liaisons between ZP and Grama Panchayat, and responsible for implementing and monitoring developmental works at taluk level. Grama Panchayat: As the lowest tier of Panchayat Raj institution prepares its own plan and implements after getting approval from Taluk Panchayat. It is also responsible for collecting water charges, operations and maintenance of water supply schemes.

14
Village Water and Sanitation Committee (VWSC): VWSCs are developed to involve the local community participation in the project villages of the World Bank assisted Integrated Rural Water Supply and Sanitation. VWSCs play a crucial role in planning, implementation and operation and maintenance of the assets created. 4.1.3 Other Institutions Department of Mines and Geology: The Groundwater Division of the Department conducts the activities of: (1) assessment of ground water resources in all the taluks; (2) periodic monitoring of groundwater levels; (3) monitoring of the ground water quality for various purposes; (4) determination of aquifer characteristics; (5) selection of sites and construction of artificial recharge structures; (6) selection of suitable sites for drilling borewells; (7) issue of feasibility reports/certificates; and (8) regulate development of groundwater resources in a systematic and scientific manner. Directorate of Health and Family Welfare: This department apart from implementing various health programmes, conducts water quality testing for bacteriological contamination with its District Surveillance Unit. A district level coordination committee headed by the Deputy Commissioner of the district coordinates with all departments and reviews the surveillance of the communicable diseases including water borne diseases. Directorate of Watershed Development: This department is concerned with carrying out activities like recharging ground water, along with several other activities like soil conservation, etc. Irrigation Department: The irrigation department is the nodal agency for major and minor irrigation projects. Although major portion of water is used for agriculture purpose, it is also used for drinking purpose. Hence, the irrigation department is also involved in the provision of drinking water supply. NGOs and Community Based Organisations (CBOs): NGOs and CBOs play a crucial role in creating awareness among the communities to involve in planning, implementation and monitoring activities of drinking water projects.

15
4.1.4 Institutions in Operation and Maintenance In Karnataka, with the introduction of Panchayat Raj institutions, the responsibility of operation and maintenance of drinking water supply schemes is entrusted to Grama Panchayats. The GPs appoint pump operator and other personnel for the operation of the systems from the local villages. The maintenance of the schemes is carried out by fixing some amount of tariff for the users on adhoc basis. Taking into account the inadequate attention given by the ZPs in maintenance activities of drinking water supply schemes, and to create a sense of ownership among the GPs and users, the Government has transferred the operation and maintenance of all Piped Water Schemes and Mini Water Schemes to the GPs. Although the government is partially meeting the operation and maintenance expenditure, it is proposing to transfer the full responsibility to GPs in the coming years. 4.1.5 Institutions in Water Quality Monitoring At present there is no well defined and conceived agency with a mandate for water quality monitoring in rural areas. The water quality in rural areas is supposed to be tested by the RDED. The RDED tests the quality of water in the newly dug borewells and if the standard (BIS) is met then the water will be supplied for use. But, after the initial testing, no regular monitoring of water quality is done. Apart from RDED, few other institutions have the facility of testing water quality. They are: • Public Health Institute and District level Public Health Laboratories of the
Health and Family Welfare Department has 28 laboratories • Public Health Institute at Bangalore, conducts test for chemical and
bacteriological contamination • Three Divisional Laboratories at Gulbarga, Mysore and Belgaum: Five
Regional Laboratories at Mangalore, Chikkamaglur, Chitradurga, Raichur, and Dharwad – these laboratories mainly conduct food quality testing and cannot be used water quality testing.
• Nineteen District Health Laboratories (before formation of new districts),
16
one at each district – 19 laboratories do not have necessary equipment and trained staff for chemical examination of water, 6 do not have the facility for bacteriological testing of water.
• Department of Mines and Geology has district or regional laboratories for
collection and testing of ground water samples twice a year from its observation wells. But it does not contain facility of testing for bacteriological contents.
• Zilla Panchayats - District level water quality monitoring laboratories have
been set up under ZP in each district. But these laboratories have inadequate staff to conduct tests. According to RDED out of 18 District Level Laboratories 11 are not functioning.
• State Pollution Control Board has laboratories at Mysore, Davanagere,
Dharwad, and Bangalore; these laboratories collect and test ambient water quality.
4.2 Institutions in Urban Drinking Water Supply The responsibility of providing drinking water and sanitation services in urban local bodies, except Bangalore City and 8 City Municipal Councils situated around Bangalore, lies with the Karnataka Urban Water Supply and Drainage Board (KUWS&DB). The Board executes water supply and drainage schemes, and transfers it to local bodies for operation and maintenance by providing technical guidance. While it adopts population base as a norm in selecting different water supply schemes for urban local bodies, for implementing under ground drainage services all urban local bodies irrespective of population size are covered. The Karnataka Urban Infrastructure Development and Finance Corporation (KUIDFC) is also involved in implementing urban water supply and sanitation projects through KUWS&DB. The urban local bodies are responsible for operation and maintenance activities of water supply and sanitation schemes created by KUWS&DB. As per the Government order (G. O. No. UDD 204 UMS 95 dated 15-11-1996) the Board has to hand over the completed projects to ULBs for operation and maintenance

17
activities (KUWS&DB, 1999-2000). The KUWS&DB has the facility of testing for water quality at four places viz., Mysore, Belgaum, Hubli-Dharwad and Mangalore and also two laboratories in Bangalore. 4.2.1 The Slum Clearance Board The Slum Clearance Board, established in 1973, has the responsibility of enabling the slum dwellers to live in hygienic condition by providing basic amenities like drinking water, roads, drains, community bathrooms, storm water drains, street lights, etc. At present the Board is implementing its programmes in 21 Class – I cities of the State. 4.2.2 Institutional Arrangement of BWSSB
The Bangalore Water Supply and Sewerage Board is responsible for providing water supply, sewerage system and sewage disposal services to the Bangalore Metropolitan area. Operation and Maintenance: A separate engineering section headed by a Chief Engineer is responsible for maintenance of water supply and sewerage system. 4.3 Gaps in the Institutional Structure In fact, involvement of different institutions in activities such as creation of water supply structure, operation and maintenance, quality monitoring, groundwater recharging measures, etc., has resulted in various problems. Institutional problems related to environment in drinking water supply are discussed briefly. There is an overlap between state government programmes and those implemented by the externally aided agencies in the provision of drinking water services (Rajasekar 2003). Local organisations are not given adequate importance for operation and maintenance activities of drinking water supply schemes in both rural and urban areas, due to paucity of resources – financial and manpower (Puttaswamaiah and Bhide 2004). While ULBs are responsible for operation and maintenance of water supply schemes, some local bodies have not taken up this responsibility from the KUWS&DB, which points to lack of coordination in responsibility sharing among the organizations.

18
There is lack of an integrated system of water quality testing and monitoring. Since multiple institutions are involved in this activity, utilisation of these different institutions is limited due to various reasons like lack of coordination, high cost, non-functionality, etc. Further, for undertaking groundwater recharging measures various institutions are involved in the absence of an integrated agency to plan and implement programmes for rejuvenating tanks and groundwater. It seems there is no coordination between water users - public, private (for drinking water provision, agriculture, industry, etc) and agencies involved in undertaking groundwater recharging activities. Inadequate institutional mechanism to promote rainwater harvesting particularly in urban areas as most of the agencies are concentrating on rural areas, is another limitation. Although different institutions are involved in providing drinking water supply there is inadequate information or database on problems related to quantity of water supplied, water quality at source, distribution and consumer point, and information on health and environmental impacts. 5. Impacts of Environmental Problems in Drinking Water Supply Environmental problems in drinking water supply impact significantly on health status (Box 3) and other resources like water and land. Consumption of inadequate water results in ‘water washed diseases’ like scabies, fungal infections, trachoma, etc. Many rural habitations in Karnataka are facing health problems due to inadequate water use. For instance, people in a few villages of Jagalur Taluk in Davanagere district reported skin diseases after they stopped bathing due to shortage of water (Deccan Herald, March 12, 2003). Inadequate water use further creates blocks in sewage flow, which could contaminate water sources. Irregular water supply causes pollution in distributional pipes due to rusting and back-syphonage of water because of low pressure and insufficient water flow. Apart from health effects, inadequate water supply increases hardship on women and children, compelling them to spend more time and energy in collecting water. Impact of water loss in the distribution system would be severe on poor and people living in outlying areas.

19
Box 3: Diseases Transmitted through Water 1. Water Washed Diseases: scabies, trachoma, with inadequate water for personal
hygiene causing spread to occur through water used for bathing 2. Water Based Diseases: infections transmitted through aquatic invertebrate animals
e.g., Leptosopirosis and guinea worm 3. Water Related Vector Borne Diseases: infections spread by insects that depend on
water through vector breeding in water, malaria, filariasis, dengue fever, Japanese encephalitis.
4. Water Borne Diseases: through faecal contamination – gastroenteritis, cholera, typhoid, Hepatitis A, etc.
Source: Adapted from Gleik (1998) Impact of depleting water resources, i.e., unsustainable drinking water sources can be seen in the decreased water availability, which is being witnessed in several parts of the state in recent years due to continued spell of drought. Particularly, decline in groundwater level has resulted in non-functioning of many of the already created drinking water supply schemes.
Poor quality water has serious implications on health and environment. Adverse health impacts of contaminated water include disorder of teeth, bones, skin allergies, birth defects and premature infant death, water borne diseases, etc. Groundwater with excess fluoride has caused fluorosis to more than 1.54 lakh people in Gulbarga, Tumkur and Kolar districts (The Hindu, April 5, 2002; and Vijaya Karnataka, Kannada Daily, October 2, 2000). Polluted groundwater around Bangalore peri-urban areas resulted in health problems like skin irritation, throat infection, vomiting, jaundice for children, etc., and increased health expenditure of about Rs. 3000 per year per family (Diwakar and Nagaraj 2002). Contamination of river water has led to no aquatic life like fish up to 2 Kms. range in river Bhadra from the point of effluents discharge by Mysore Paper Mills. This indicates that in general river and tank aquatic life is severely affected due to low quality water. The common diseases occurring due to unsafe drinking water are gastroenteritis, cholera, typhoid and others. Table 9 presents the incidence of these diseases in the state. Gastroenteritis is the major disease with nearly 24 thousand of incidences and about 200 deaths in 2001. It should be noted that viral hepatitis is increasing rapidly in the state from 1714 cases in 1997 to 5438 in 2001. Malaria also has its sway as more than 93 thousand cases were found positive during
20
1999. Even these are gross underestimates as the data on incidence of water borne diseases is from the Department of Health and Family Welfare, which does not include the incidence reported in private health centers. 6. Concluding Remarks Safe and adequate quantity of drinking water is an essential input for life. However, the efforts made by the state government and other organisations have not been enough in covering all habitations. Provision of drinking water supply, mainly depending upon groundwater, has been confronting several resource specific problems such as depletion, deterioration in quality, lack of operation and maintenance, etc., which are related to both supply and demand side factors. Majority of the environmental problems are caused by both natural and human-made factors. Decline in quantity and quality of water has serious implications on health and environment as discussed in this paper. Considering the status of and problems in drinking water supply the following points might be considered to resolve problems and augment services. Partially covered habitations, in both rural and urban areas, should be brought under full coverage of water supply. Drought prone districts should be given high priority to resolve the problem of inadequate water supply.
Drinking water quality affected habitations should be taken on first priority basis to provide safe drinking water, through alternative sources or by treating water. Operation and maintenance is a major problem in water supply system; hence, priority needs to be attached to these activities for efficient working of the system. ULBs can consider privatisation of operation and maintenance of water supply schemes, but by protecting poor and vulnerable groups. In villages, Village Water Supply and Sanitation Committees (VWSCs) based on the World Bank project experiences in Karnataka can be established to supervise the operation and maintenance activities of water supply schemes. Maintenance of water quality is an important issue. A single water quality-testing agency should be promoted for both rural and urban areas, and should be informed to people on a transparent basis. A vigilance group might be created to report on quantity and quality of water supplied functioning for regular and efficient functioning of the system. Water quality awareness camps should be promoted, particularly in rural areas, where groundwater quality is a serious problem. Attention may be given to dual water supply system in water quality affected areas (i) one for drinking (ii) another for
21
washing, bathing and cleaning purposes. Measures need to be initiated and implemented against water polluting industries and ULBs for treating wastewater before discharging.
An integrated institutional system for groundwater conservation and recharging measures needs to be promoted to conserve the major source of drinking water. Institutional initiatives need to be promoted for rainwater harvesting in both urban and rural areas. Utilisation of treated wastewater needs to be promoted for purposes like industrial and gardening activities, for which incentives in terms of subsidized price may be considered.
22
Table 1: Status of Rural Water Supply in Karnataka, 2002
No. of Habitations with lpcd < 55 lpcd
Sl. No.
.
District
No. % to Total 55
lpcd and Above
Total
1 Bangalore (R) 956 30.09 2221 3177 2 Belgaum 995 64.44 549 1544 3 Bellary 590 57.28 440 1030 4 Bidar 211 23.29 695 906 5 Bijapur 524 52.04 483 1007 6 Bagalkot 333 46.77 379 712 7 Chikkamagalore 705 19.79 2857 3562 8 Chitradurga 504 33.14 1017 1521 9 Davangere 391 31.94 833 1224
10 Dakshina Kannada 1470 47.88 1600 3070 11 Udupi 1402 41.38 1986 3388 12 Dharwad 245 54.69 203 448 13 Haveri 339 48.85 355 694 14 Gadag 128 34.04 248 376 15 Gulbarga 1208 62.59 722 1930 16 Hassan 1923 44.53 2395 4318 17 Kodagu 452 82.94 93 545 18 Kolar 705 18.29 3149 3854 19 Mandya 586 29.43 1405 1991 20 Mysore 540 26.77 1477 2017 21 Chamarajanagara 509 75.18 168 677 22 Raichur 529 37.7 874 1403 23 Koppal 265 33.42 528 793 24 Shimoga 1068 23.39 3498 4566 25 Tumkur 1918 37.33 3220 5138 26 Uttara Kannada 1298 22.74 4411 5709 27 Bangalore (U) 701 64.79 381 1082
Total 20495 36187 56682 Percent to total no. of Villages 36.16 63.84 100.00
Source: Department of Rural Development and Panchayat Raj

23
Table 2: Distribution of Towns by Level of Water Supply during 2001
Sl. No
Districts No. of Towns with Adequate Water Supply
No. of Towns with
Inadequate Water Supply
Percent of Towns with Inadequate
Water Supply
Total No. of Towns
1 Bangalore (U) 0 1 100 1 2 Bangalore (R) 2 7 78 9 3 Kolar 0 12 100 12 4 Tumkur 0 10 100 10 5 Chamarajanagar 1 3 75 4 6 Mysore 2 6 75 8 7 Mandya 1 6 86 7 8 Hassan 1 7 88 8 9 Chikkamagalur 2 6 75 8 10 Kodagu 2 2 50 4 11 Dakshina Kannada 4 4 50 8 12 Udupi 0 4 100 4 13 Shimoga 6 2 25 8 14 Davanagere 2 4 67 6 15 Chitradurga 0 6 100 6 16 Dharwad 0 6 100 6 17 Gadag 0 9 100 9 18 Haveri 0 7 100 7 19 Uttara Kannada 5 6 55 11 20 Belgaum 6 10 63 16 21 Bijapur 2 4 67 6 22 Bagalkot 1 11 92 12 23 Gulbarga 4 8 67 12 24 Bidar 2 4 67 6 25 Bellary 3 7 70 10 26 Raichur 0 6 100 6 27 Koppal 1 3 75 4
Total 47 161 77 208 Source: Karnataka Urban Water Supply and Drainage Board
24
Table 3: Water Supply in Different Municipal Corporation Areas, 2001
Name of the Municipal Corporations
Level of Water Supply (in LPCD)
Adequate / Inadequate
1. Hubli-Dharwad 100 Inadequate 2. Gulbarga 86 Inadequate 3. Belgaum 85 Inadequate 4. Mysore 141 Adequate 5. Mangalore 152 Adequate Note: The norm fixed for Class I towns is 135 LPCD Source: Karnataka Urban Water Supply and Drainage Board
Table 4: District-wise Water Level Fluctuations (Meters) in Karnataka
Years Districts
1978 1987 1988 1989 1990 1991 1992 1993 1994 1995 1996 1997Bangalore 9.47 10.2 10.3 9.84 10.6 11.9 10.3 12.6 12.5 14 14.9 15.4Belgaum 10 9.3 9.8 9.07 10.1 11.9 10.5 11 9.85 17.2 12.3 11.6Bellary 7.37 7.4 7.97 7.19 8.12 9.42 10.4 11 10.1 12.1 13.3 10.9Bidar 10.9 12.9 11.3 10.8 9.63 10 12.7 12.4 12.6 13.6 11.4 10.7Bijapur 7.97 9.07 8.15 7.57 7.14 9.69 8.62 9.35 9.93 11.1 11 10.5Chikkamagalur 8.95 9.22 8.54 8.69 8.48 9.7 9.01 8.16 8.82 9.87 10.4 9.95Chitradurga 8.06 10.4 8.85 9.25 10.7 13 13.1 12.4 12.5 16.5 16.5 13.3Dakshina Kannada 8.72 8.84 8.4 9.01 8.8 9 9.01 8.7 8.78 8.87 8.95 9.06Dharwad 12.2 13.5 11.2 14 15.8 12.7 15.9 13.4 14.2 16.7 17.6 13.9Gulbarga 7.26 8.1 6.98 7.74 6.81 6.35 8.04 8.57 8.59 9.39 7.4 7.13Hassan 9.26 9.46 7.77 9.64 10.1 11 9.68 8.85 8.5 8.84 10.7 9.86Kodagu 9.8 9.19 8.34 9.92 9.86 9.8 9.28 7.35 9.29 8.5 9.14 7.88Kolar 8.68 9.48 9.52 10.4 11.6 13.4 10.4 13.5 13 13.5 14.3 13.4Mandya 9.14 8.72 7.55 8.03 8.15 9.49 7.89 8.11 7.85 8.59 9.66 9.46Mysore 10.2 10.4 9.72 11.1 12 13 11 10.4 10.5 10.1 11.8 11.3Raichur 5.96 7.03 6.21 6.1 6.42 6.99 8.1 7.81 7.39 7.99 8.04 6.58Shimoga 9.23 9.03 8.9 9.31 9.19 8.62 8.97 8.23 8.49 8.56 9.8 9.76Tumkur 8.04 9.53 8.5 8.21 9.17 10.9 9.65 11.1 11.3 13.2 14 14.7Uttara Kannada 7.83 8.7 8.79 8.59 8.76 8.27 8.35 7.98 7.8 8.02 8.24 8.12Source: Rajamarthanda (1998)

25
Table 5: Groundwater Overdeveloped Taluks in Karnataka
Sl. No
Districts Taluks No. of Over Developed Taluks
% of Villages Affected
1 Bangalore (U) Anekal, Bangalore (N), Bangalore (S) 3 75 2 Bangalore (R) Devanahalli, Hosakote,
Doddaballapur, Ramanagar, Magadi, Nelamangala
6 79
3 Bellary H B Hally 1 82 4 Chitradurga Hiriyur, Holalkere, Hosadurga 3 52 5 Kolar Chikkaballapura, Kolar, Malur,
Chintamani, Gouribidanur, Mulbagal, Sidlaghatta, Srinivaspura, Bagepalli, Bangarpet, Gudibande
11 76
6 Chamaraja Nagar Kollegal 1 28 7 Tumkur Koratagere, Gubbi, Madhugiri, Tiptur,
Tumkur, Chikkanayakanahalli 6 70
8 Gulbarga Afzalpur 1 57 9 Haveri Ranebennur 1 55 10 Davangere Channagiri 1 52
Total 34 63 Source: Department of Mines and Geology
Table 6: Standards Prescribed for Drinking Water in India Sl. No.
Substance / Characteristics
Desirable/ Essential
Highest Desirable
Limit (ppm)
Maximum Permissible Limit in Absence of
Alternative Source (ppm)1 Calcium Desirable 75 200 2 Magnesium Desirable 30 100 3 Iron Essential 0.3 1 4 Chloride Essential 250 1000 5 Sulphate Desirable 200 400 6 Nitrate Desirable 45 100 7 Fluoride Desirable 1 1.5 8 Total Dissolved Solids Desirable 500 2000 9 PH Essential 6.5-8.5 No relaxation
10 Total Hardness Essential 300 600 Source: Bureau of Indian Standards: IS 10500:1991

26
Table 7: Status of Water Quality by Habitations in Karnataka State – 2002
No. of Habitations Affected by Sl No
District Excess Fluoride
Bracki Shness
Excess Nitrate
Excess Iron
Total No. of
Habita-tions
Affected
% of Affected Habita-tions
Total No. of Habita-
tions
1 Bagalkote 135 (21.29)
158 (24.92)
33 (5.21)
88 (13.88)
414 65.30 624
2 Bangalore (U) 262 (20.39)
224 (17.43)
0 (0.00)
318 (24.75)
804 62.57 1285
3 Bangalore ( R) 406 (11.96)
148 (4.36)
411 (12.1)
189 (5.57)
1154 34.00 3394
4 Belgaum 134 (8.9)
159 (10.56)
1 (0.07)
419 (27.82)
713 47.34 1506
5 Bellary 489 (41.87)
91 (7.79)
38 (3.25)
26 (2.23)
644 55.14 1168
6 Bidar 37 (4.56)
56 (6.90)
123 (15.2)
1 (0.12)
217 26.72 812
7 Bijapur 200 (21.55)
241 (25.97)
19 (2.05)
113 (12.18)
573 61.75 928
8 Chamaraja Nagar 34 (4.10)
27 (3.25)
425 (51.20)
173 (20.84)
659 79.40 830
9 Chikkmagalore 51 (1.52)
77 (2.29)
136 (4.04)
524 (15.57)
788 23.41 3366
10 Chitradurga 519 (37.91)
345 (25.20)
126 (9.20)
87 (6.36)
1077 78.67 1369
11 Dakshina Kannada 2 (0.06)
4 (0.13)
0 294 (9.37)
300 9.56 3137
12 Davangere 358 (33.03)
156 (14.39)
288 (26.57)
1 (0.09)
803 74.08 1084
13 Dharwad 49 (9.92)
115 (23.28)
1 (0.20)
74 (14.98)
239 48.38 494
14 Gadag 127 (36.29)
42 (12.00)
0 0 169 48.29 350
15 Gulbarga 443 (19.29)
59 (2.57)
3 (0.13)
148 (6.45)
653 28.44 2296
16 Hassan 159 (4.08)
181 (4.64)
39 (1.00)
323 (8.28)
702 18.00 3900
17 Haveri 77 (12.22)
113 (17.94)
130 (20.63)
198 (31.43)
518 82.22 630
18 Kodagu 3 (0.52)
0 (0.00)
6 (1.05)
306 (53.40)
315 54.97 573
19 Kolar 509 (13.60)
319 (8.52)
1005 (26.86)
109 (2.91)
1942 51.90 3742
20 Koppal 477 (67.28)
50 (7.05)
0 4 (0.56)
531 74.89 709
21 Mandya 158 (8.44)
518 (27.66)
51 (2.72)
684 (36.52)
1411 75.33 1873
22 Mysore 105 (5.43)
434 (22.44)
121 (6.26)
288 (14.89)
948 49.02 1934
23 Raichur 322 (26.42)
195 (16.00)
129 (10.58)
51 (4.18)
697 57.18 1219
27
Table 7 (Contd…)
24 Shimoga 89 (2.01)
87 (1.97)
2 (0.05)
362 (8.18)
540 12.21 4424
25 Tumkur 658 (12.00)
585 (10.67)
976 (17.8)
1490 (27.17)
3709 67.63 5484
26 Udupi 11 (0.20)
2 (0.04)
1 (0.02)
218 (3.87)
232 4.11 5640
27 Uttara Kannada 24 (0.62)
74 (1.90)
13 (0.33)
145 (3.72)
256 6.56 3901
TOTAL 5838 (10.30)
4460 (7.87)
4077 (7.19)
6633 (11.70)
21008 37.06 56682
Note: Figures in parenthesis are percent to total number of habitations Source: Rural Development and Engineering Department
Table 8: State Level Institutions
RDPR Wings Matters Related to Drinking Water & Sanitation
1. Area Development Programme Wing
Implementation and monitoring several programmes among which Integrated Watershed Development Programme is included.
2. Rural Water Supply Wing This wing has two sub wings – one for External Aided Projects of Rural Water Supply and Sanitation and the other for the regular Rural Water Supply and Sanitation. The Rural Development Engineering Department (RDED) implements and monitors all programmes related to rural water supply and sanitation.
3. Karnataka Rural Water Supply and Sanitation Agency
Established by the GoK as a society under Karnataka Societies Registration Act. Implementing the World Bank aided Jal Nirmal Project
4. Panchayat Raj Wing This wing deals with all the matters including implementation of the Zilla Panchayat, Taluk Panchayat, and Grama Panchayat.
5. a) Special Economic Programme Wing b) Finance Wing c) Plan Monitoring and
Evaluation Cell d) Administrative Wing
Implement and monitors the Swarna Jayanthi Rozgar Yojana, Swavalambana, etc. Over-viewing all activities including drinking water and Sanitation. Note: Figures in parenthesis are percent to total number of habitations Source: Rural Development and Engineering Department
Table 9: Incidence of Water-Borne Diseases and Deaths
Gastroenteritis Cholera Malaria Viral Hepatitis Typhoid Year Cases Deaths Cases Deaths A B Cases Deaths Cases Deaths
1997 23665 307 741 10 7726512 181450 1714 4 2880 5 1998 26832 501 434 2 7568155 26776 3824 2 8242 4 1999 17743 126 134 3 7405711 93651 4792 2 23946 2 2000 31132 265 354 3 131 NA 3077 10 8 NA 2001 23893 198 342 1 NA NA 5438 28 33346 6
A: Total Blood smear collected and examined B: total positive cases Source: Department of Health and family Welfare, GoK
28
References
Bangalore Water Supply and Sewerage Board (BWSSB) (2001-02), Annual Performance Report, Bangalore.
Census of India (2001), 'Tables on Houses, Household Amenities and Assets', Registrar General of India, Government of India, New Delhi.
Diwakar H and N Nagaraj (2002), Impact of Water Pollution on Food Security and Environment: Bearing the Brunt, Wasteland News, August – October.
Gleick, Peter H (1998), Water and Human Health in Water Resources and Economic Development Edited by R. Maria Seleth, Edward Elgar Pvt. Ltd. United Kingdom.
Government of India (2002), The National Water Policy, Ministry of Water Resources, New Delhi.
Government of Karnataka (2002-03), Annual Report, Rural Development and Panchayat Raj Department, Bangalore.
Government of Karnataka (2002), Report of the High Power Committee (HPC) for Redressal of Regional Imbalances, Bangalore.
Government of Karnataka (2004), State of Environment Report and Action Plan, Department of Ecology, Environment and Forest, Bangalore.
Government of Karnataka (2000), Rural Water Supply and Sanitation in Karnataka – Strategy Paper 2000-2005, Rural Development and Panchayat Raj Department, Bangalore.
Government of Karnataka (2001), Study on Rapid Sector Assessment in Karnataka, Project Planning Monitoring Unit, Rural Development and Panchayat Raj Department, Bangalore.
Karnataka Urban Water Supply and Drainage Board (KUWS&DB) (2000-01), Annual Report, Bangalore.
NEERI (2002), Rapid Environmental Impact Assessment for Mining Operations in Bellary; Hospet Region Karnataka, Department of Mines and Geology, Bangalore.
Puttaswamaiah S and Shashanka Bhide (2004), ‘Grama Panchayats and Basic Public Health Services: Expenditure Analysis in Two Districts of Karnataka’, project report 'Restructuring Local Environment Management for Better Health Outcomes: Towards A District Pilot in Karnataka', Institute for Social and Economic Change, Bangalore.
Rajamarthanda (1998), Behavior of Depth to Water Level between 1978-97 in Karnataka State, Department of Mines and Geology, Bangalore.
29
Rajasekar D. (2003), ‘Roles of Rural Local Organizations’, research project report at the Institute for Social and Economic Change, Bangalore.
United Nations Development Programme (UNDP) (2003), Human Development Report 2003: Millennium Development Goals - A Compact Among Nations to End Human Poverty, published by UNDP.