Embed Size (px)
Citation preview
Istituto nazionale per la valutazione del sistema educativo di istruzione e di formazione
WORKING PAPER N. 11/2011
_________________________________________________________
A Rating Scale Model for a scale of test anxiety in Italy
Donatella Poliandri, National Institute for the Educational Evaluation of Instruction and Training
(INVALSI), Italy, [email protected]
Michele Cardone, National Institute for the Educational Evaluation of Instruction and Training (INVALSI), Italy, [email protected]
Paola Muzzioli, National Institute for the Educational Evaluation of Instruction and Training
(INVALSI), Italy, [email protected]
Sara Romiti, National Institute for the Educational Evaluation of Instruction and Training (INVALSI), Italy, [email protected]
10/01/2011
Le opinioni espresse nei lavori sono attribuibili esclusivamente agli autori e non impegnano in alcun modo la responsabilità dell’Istituto. Nel citare i temi, non è, pertanto, corretto
attribuire le argomentazioni ivi espresse all’INVALSI o ai suoi Vertici.
The views expressed in the articles are those of the authors and do not involve the responsibility of the INVALSI - National Institute for the Educational Evaluation of Instruction and Training
A RATING SCALE MODEL FOR A SCALE OF TEST ANXIETY IN ITALY
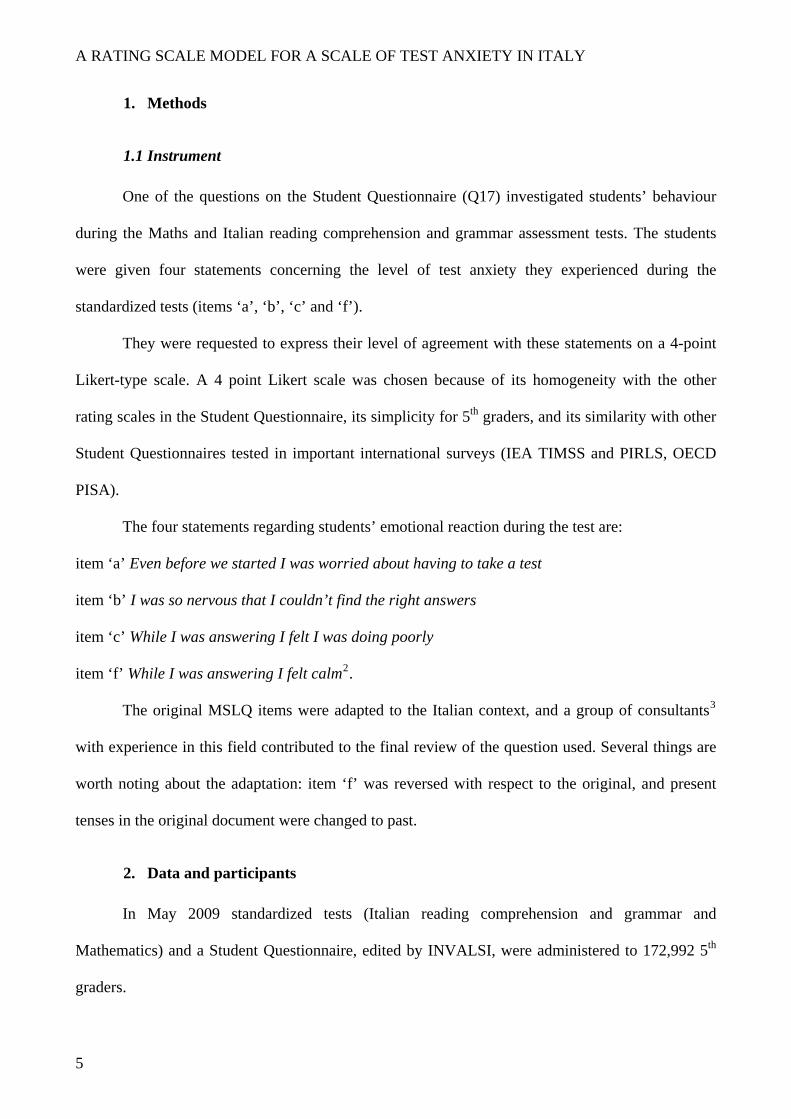
Abstract
The purpose of this study is to validate a test anxiety scale for Italian students. The scale is part of a
questionnaire administered after the students’ annual competence test by the National Institute for
the Educational Evaluation of Instruction and Training (INVALSI). The aim of the scale is to
explore the anxiety levels of Italian students during the administration of the standardized tests at
the end of the school year. A test anxiety scale has been adapted from the Motivational and Self-
Regulated Learning Competence Questionnaire. In May 2009 the tests (Reading comprehension and
Grammar, Math) and questionnaire were administered to a sample of 42,929 5th graders. According
to Classical Test Theory, Cronbach's alpha coefficient of reliability (0.71) evaluates internal
consistency of the scale. Anxiety level estimates for students, items and item thresholds – according
to the Andrich Rating Scale Model (1978) – are obtained using software ConQuest. Results show
that item threshold estimates are monotonous and well separated from each other, so that the more
anxiety levels increase, the more the students’ agreement with each item increases. Applied across
gender groups the RSM (DIF analysis) reveals that gender should be taken into account in detecting
test anxiety: females are more anxious than males (the model fits better for the female sample). At
the same time, two of the items seem to work differently by gender.
Keywords: test anxiety, Italian version, item response theory, test reliability, rating scale
model, gender differences
2

A RATING SCALE MODEL FOR A SCALE OF TEST ANXIETY IN ITALY
Introduction
Italian students are not as accustomed to performing written tests as students of many other
countries. An Italian survey confirms that teachers use mostly traditional evaluation techniques
(written compositions, oral examinations) while assessment tests are less common or not used at all
(Cavalli, 2000).
National school tests in Mathematics and Italian, administered by the National Institute for
the Educational Evaluation of Instruction and Training for 2nd graders, 5th graders, 6th graders and
8th graders, have been used systematically only since 2007.
In international assessments of student achievement, Italian students tend to leave blank
answers more often than students from many other countries. In PISA (Programme for International
Student Assessment) Italy has one of the highest numbers of missing values and a total score lower
than the OECD average, along with Greece, Turkey and Mexico (Pozio, 2006). The correlation
between the Mathematics total average and the percentage of missing values is relevant (-0.76).
Public opinion and school workers in Italy often maintain that students’ performance is worse on
the tests than in their usual schoolwork due to their having had less practice with standardized tests.
Is it possible that Italian students’ aptitude is related to test anxiety resulting from their lack of
practice?
The test anxiety construct was developed in the 50s. It is well known that test anxiety and
academic performance are significantly related at all educational levels, from primary school to
university (Hembree, 1988). Both the anxiety construct and the test anxiety construct present two
main components, a cognitive component conceptualized as ‘worry’ and a physiological
component, defined as ‘emotionality’. The first of these tends to interfere more with performance
(Morris et al., 1981; Seipp, 1991).
The aim of the present study is to validate a test anxiety scale administered to Italian
students, to be used with test scores in future analysis to answer to the research question: how
strong is the relation between test anxiety and student performance?
3

A RATING SCALE MODEL FOR A SCALE OF TEST ANXIETY IN ITALY
A test anxiety scale was included in a Student Questionnaire administered after an Italian
reading comprehension and grammar test and a Maths test at the end of primary school. The
Student Questionnaire was developed as a tool for investigating many factors that can affect student
performance (family background, time spent in different activities after school, self-assessment in
Italian and Mathematics, attributed causes of performance and locus of control, interest in learning
and motivation to learn, willingness to expend effort to achieve at school, students’ perception of
their own safety at school).
The administration context, involving 10- and 11-year-old students who had already taken
the Maths test, required a simple and brief Student Questionnaire. Furthermore, a brief
questionnaire suits the purpose of the test anxiety scale1 (and of the other constructs in the
questionnaire), which is to reveal general trends in the student population rather than to make a
detailed individual diagnosis.
After a literature review regarding test anxiety instruments (Sarason, 1978; Spielberger,
1980; Sarason, 1984, Benson et al., 1992) the research team decided to adapt the 4 item scale on test
anxiety included in the Motivated Strategies for Learning Questionnaire (MSLQ).
The MSLQ, developed by Paul R. Pintrich and his colleagues (Pintrich & De Groot, 1990),
is a well-established and broadly used instrument for measuring students’ motivational beliefs and
learning strategies in self-regulated learning. The MSLQ theoretical framework for conceptualizing
student motivation identifies three motivational components: an expectancy component, a value
component and an affective component, which includes students’ emotional reactions to the task. A
variety of affective reactions might be relevant in a school context, but one of the most important
seems to be test anxiety.
In the present study the test anxiety component has been detached. As Pintrich and De Groot
(1990, p. 34) say “Test anxiety has been shown to be related to perception of competence, but it can
be theoretically and empirically distinct.”.
4
A RATING SCALE MODEL FOR A SCALE OF TEST ANXIETY IN ITALY
1. Methods
1.1 Instrument
One of the questions on the Student Questionnaire (Q17) investigated students’ behaviour
during the Maths and Italian reading comprehension and grammar assessment tests. The students
were given four statements concerning the level of test anxiety they experienced during the
standardized tests (items ‘a’, ‘b’, ‘c’ and ‘f’).
They were requested to express their level of agreement with these statements on a 4-point
Likert-type scale. A 4 point Likert scale was chosen because of its homogeneity with the other
rating scales in the Student Questionnaire, its simplicity for 5th graders, and its similarity with other
Student Questionnaires tested in important international surveys (IEA TIMSS and PIRLS, OECD
PISA).
The four statements regarding students’ emotional reaction during the test are:
item ‘a’ Even before we started I was worried about having to take a test
item ‘b’ I was so nervous that I couldn’t find the right answers
item ‘c’ While I was answering I felt I was doing poorly
item ‘f’ While I was answering I felt calm2.
The original MSLQ items were adapted to the Italian context, and a group of consultants3
with experience in this field contributed to the final review of the question used. Several things are
worth noting about the adaptation: item ‘f’ was reversed with respect to the original, and present
tenses in the original document were changed to past.
2. Data and participants
In May 2009 standardized tests (Italian reading comprehension and grammar and
Mathematics) and a Student Questionnaire, edited by INVALSI, were administered to 172,992 5th
graders.
5

A RATING SCALE MODEL FOR A SCALE OF TEST ANXIETY IN ITALY
The common Italian 5th graders’ age is 10 or 11, and 98.3% of the subjects considered fell
into this age group.
In order to ensure data and procedure quality, a sample design with two separate “strata”
was defined. In first stratum were considered the 20 Italian regions and the type of schools (public
or not public); in second stratum was considered the dimension of each school represented by the
number of students of 2nd and 5th graders enrolled. After that, a number of pupils sampled in each
school is likely to guarantee an error of estimate of 2% for the mean and 3% for the quartiles.
The administration of the test for the sample students was carried out in the presence of
external test administrators, whose principal task was to ascertain the correctness of the procedures.
The completion of the two tests took approximately 60 minutes each, while the Student
Questionnaire took 30 minutes.
The sample consisted of 45,979 5th graders, and it is representative at both the national and
regional levels (National Institute for the Educational Evaluation of Instruction and Training, 2009).
Excluding those who were not given the Student Questionnaire (6%), and those who did not
compile any of the four test anxiety items (0.6%), the data set consists of 42,929 5th graders.
Since it represents the first attempt to evaluate test anxiety for such a large number of
students during an official assessment, the administration of the questionnaire can serve as a pre-test
for use in constructing a reliable instrument that can be administered in the future under the same
conditions (time and procedures).
Before proceeding to the analysis, some practical implications of the data set used are worth
noting:
1) given the huge amount of data, all the response options for all of the items were used, which
means there is no problem applying polytomous Rasch Models or differentiating the
analysis for group subjects such as gender, using DIF analysis (Differential Item
Functioning);
6
A RATING SCALE MODEL FOR A SCALE OF TEST ANXIETY IN ITALY
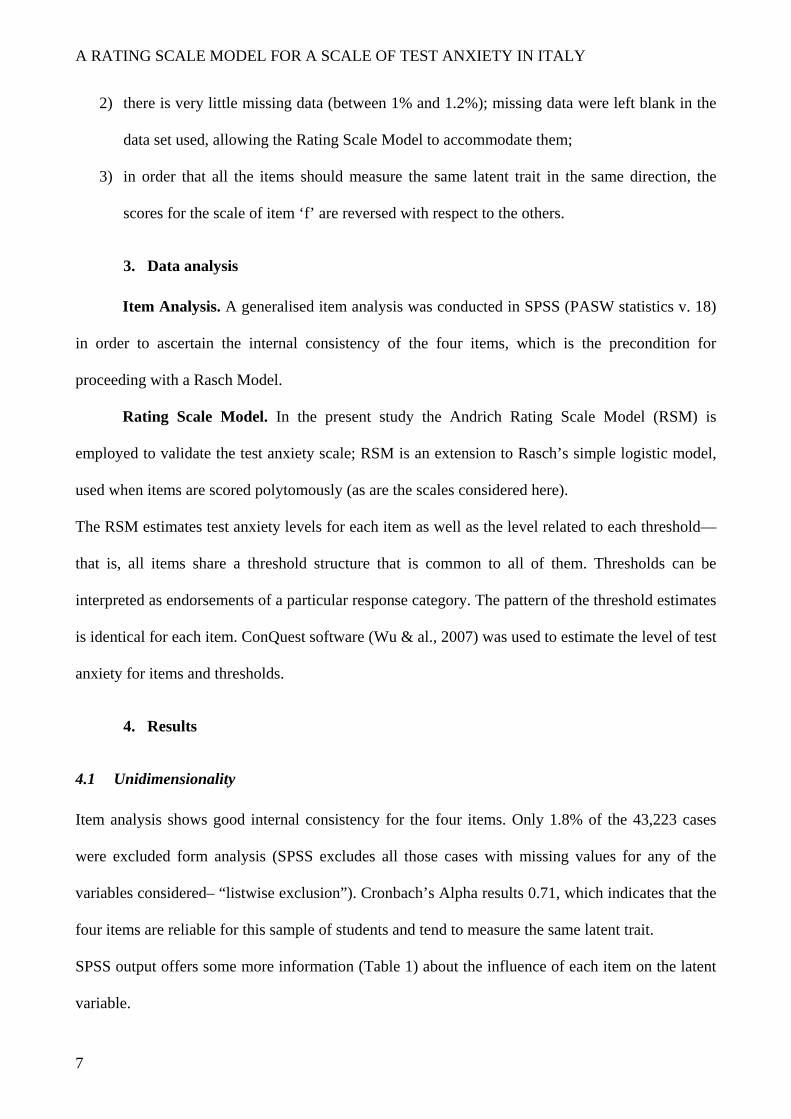
2) there is very little missing data (between 1% and 1.2%); missing data were left blank in the
data set used, allowing the Rating Scale Model to accommodate them;
3) in order that all the items should measure the same latent trait in the same direction, the
scores for the scale of item ‘f’ are reversed with respect to the others.
3. Data analysis
Item Analysis. A generalised item analysis was conducted in SPSS (PASW statistics v. 18)
in order to ascertain the internal consistency of the four items, which is the precondition for
proceeding with a Rasch Model.
Rating Scale Model. In the present study the Andrich Rating Scale Model (RSM) is
employed to validate the test anxiety scale; RSM is an extension to Rasch’s simple logistic model,
used when items are scored polytomously (as are the scales considered here).
The RSM estimates test anxiety levels for each item as well as the level related to each threshold—
that is, all items share a threshold structure that is common to all of them. Thresholds can be
interpreted as endorsements of a particular response category. The pattern of the threshold estimates
is identical for each item. ConQuest software (Wu & al., 2007) was used to estimate the level of test
anxiety for items and thresholds.
4. Results
4.1 Unidimensionality
Item analysis shows good internal consistency for the four items. Only 1.8% of the 43,223 cases
were excluded form analysis (SPSS excludes all those cases with missing values for any of the
variables considered– “listwise exclusion”). Cronbach’s Alpha results 0.71, which indicates that the
four items are reliable for this sample of students and tend to measure the same latent trait.
SPSS output offers some more information (Table 1) about the influence of each item on the latent
variable.
7
A RATING SCALE MODEL FOR A SCALE OF TEST ANXIETY IN ITALY
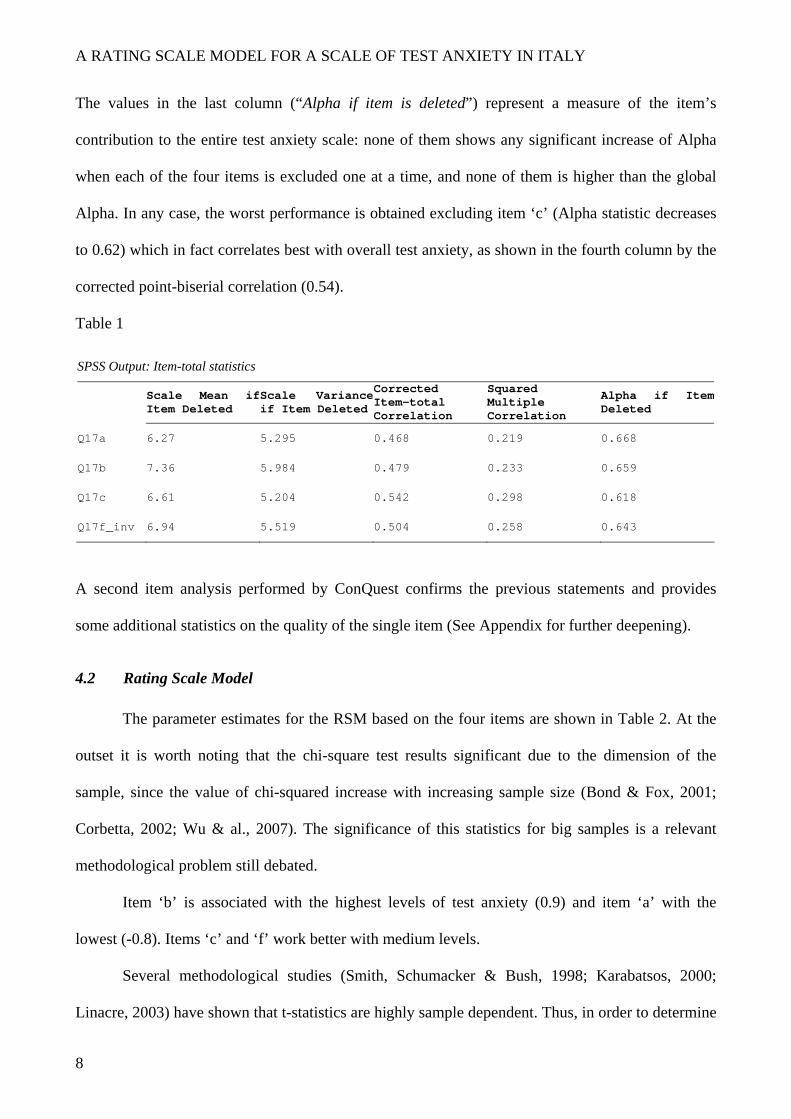
The values in the last column (“Alpha if item is deleted”) represent a measure of the item’s
contribution to the entire test anxiety scale: none of them shows any significant increase of Alpha
when each of the four items is excluded one at a time, and none of them is higher than the global
Alpha. In any case, the worst performance is obtained excluding item ‘c’ (Alpha statistic decreases
to 0.62) which in fact correlates best with overall test anxiety, as shown in the fourth column by the
corrected point-biserial correlation (0.54).
Table 1
SPSS Output: Item-total statistics
Scale Mean if Item Deleted
Scale Varianceif Item Deleted
Corrected Item-total Correlation
Squared Multiple Correlation
Alpha if Item Deleted
Q17a 6.27 5.295 0.468 0.219 0.668
Q17b 7.36 5.984 0.479 0.233 0.659
Q17c 6.61 5.204 0.542 0.298 0.618
Q17f_inv 6.94 5.519 0.504 0.258 0.643
A second item analysis performed by ConQuest confirms the previous statements and provides
some additional statistics on the quality of the single item (See Appendix for further deepening).
4.2 Rating Scale Model
The parameter estimates for the RSM based on the four items are shown in Table 2. At the
outset it is worth noting that the chi-square test results significant due to the dimension of the
sample, since the value of chi-squared increase with increasing sample size (Bond & Fox, 2001;
Corbetta, 2002; Wu & al., 2007). The significance of this statistics for big samples is a relevant
methodological problem still debated.
Item ‘b’ is associated with the highest levels of test anxiety (0.9) and item ‘a’ with the
lowest (-0.8). Items ‘c’ and ‘f’ work better with medium levels.
Several methodological studies (Smith, Schumacker & Bush, 1998; Karabatsos, 2000;
Linacre, 2003) have shown that t-statistics are highly sample dependent. Thus, in order to determine
8

A RATING SCALE MODEL FOR A SCALE OF TEST ANXIETY IN ITALY
the model’s goodness of fit and considering the sample width of the data set used, MNSQ values for
each item-step parameter are preferred to t-values. MNSQ values ranging from 0.93 to 1.17,
indicating that the model is a good fit: MNSQ values are reported as mean squares in the form of
chi-square divided by their degrees of freedom (Bond & Fox, 2001; p. 177) so that they have an
expected value of 1; both infit (weighted fit statistics) and outfit (unweighted fit statistics) are close
to 1 – indicating very little distortion – and in any case are not larger than 1.1, the limit value
proposed for samples larger than 1,000 (Smith, Schumacker & Bush, 1995). Only item ‘a’ falls a
little out of that range.
Table 2
ConQuest Output for the RSM – Table of response model parameter estimates
Term 1: item
Variables UNWEIGHTED FIT WEIGHTED FIT
item ESTIMATE ERROR^ MNSQ MNSQ
1 Q17a -0.801 0.004 1.10 1.11
2 Q17b 0.914 0.005 0.98 1.03
3 Q17c -0.308 0.004 0.94 0.93
4 Q17f 0.195* 0.007 0.97 0.96
NOTE. Separation Reliability = 1.000
Chi-square test of parameter equality = 82089.44, df = 3, Sig Level = 0.000
Term 2: step
Variables UNWEIGHTED FIT WEIGHTED FIT
step ESTIMATE ERROR^ MNSQ MNSQ
0 1.13 1.12
1 -0.744 0.005 1.05 1.06
2 -0.006 0.006 1.02 1.04
3 0.750* 1.17 1.12
* parameter estimate constrained
^ Quick standard errors have been used
9

A RATING SCALE MODEL FOR A SCALE OF TEST ANXIETY IN ITALY
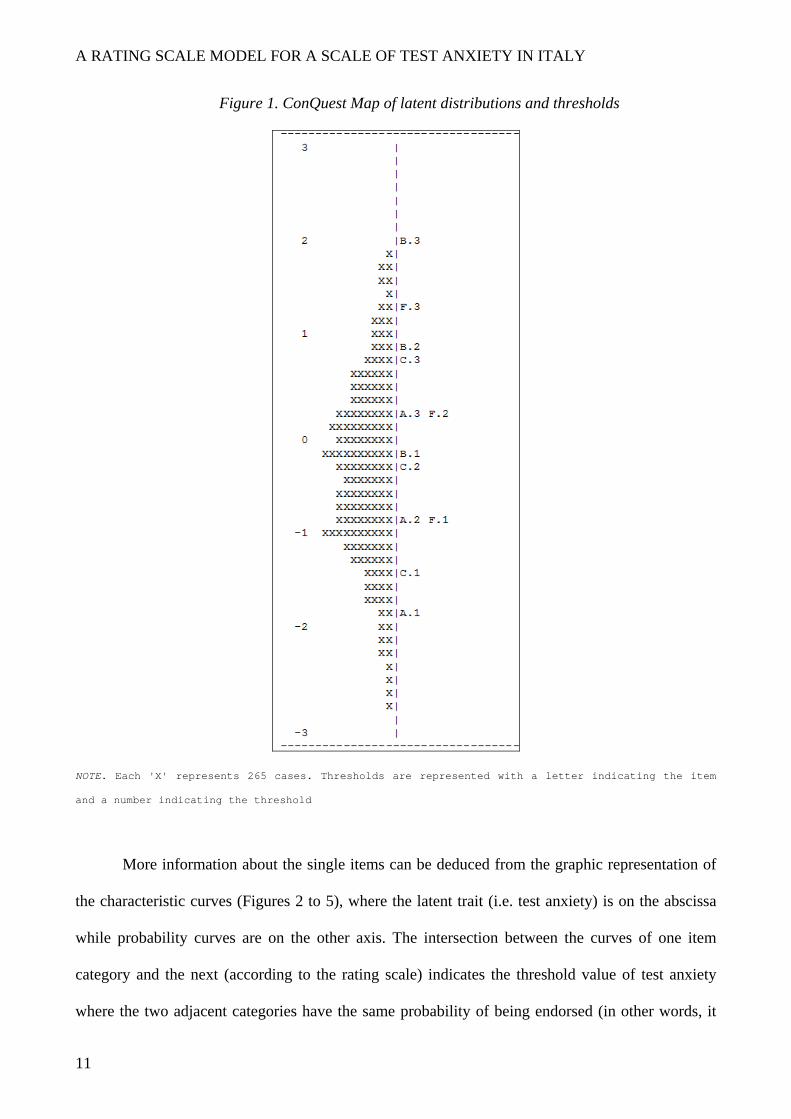
The person-item map shown in Fig. 1 illustrates the test anxiety estimates and associated
item thresholds on the same logit scale: students are on the left side of the map and thresholds on
the right. Thresholds are represented with a letter and a number, the first indicating the item and the
second the threshold (e.g. A.2 indicates the second threshold related to the item ‘a’). in the Figure,
each ‘X’ represents 265 students.
Thresholds related to disagreement with the statements about worry, nervousness, etc. are all
located in the lower part of the item-map representation where test anxiety is lower, whereas
thresholds related to agreement are all in the upper part of the graph (strongly agree in item ‘b’
expresses the highest level of test anxiety).
Once the coherence of all the thresholds has been ascertained—i.e., none of the steps are
close together and they increase according to the logical order principle required by the RSM—the
analysis of the items’ fit for the 5th graders sample can be developed further.
According to this model the students are well distributed in a range between 2 and -3 logits,
while the spread of thresholds is a little higher on the scale, between 2 and -2 logits. That is, while
the test anxiety of most of the subjects is precisely measured, their distribution has a tail of
approximately 2.500 (each X represents 265 students) hanging below the lowest levels of item
thresholds, where test anxiety levels will be less precisely measured by our model.
10
A RATING SCALE MODEL FOR A SCALE OF TEST ANXIETY IN ITALY
Figure 1. ConQuest Map of latent distributions and thresholds
NOTE. Each 'X' represents 265 cases. Thresholds are represented with a letter indicating the item
and a number indicating the threshold
More information about the single items can be deduced from the graphic representation of
the characteristic curves (Figures 2 to 5), where the latent trait (i.e. test anxiety) is on the abscissa
while probability curves are on the other axis. The intersection between the curves of one item
category and the next (according to the rating scale) indicates the threshold value of test anxiety
where the two adjacent categories have the same probability of being endorsed (in other words, it
11

A RATING SCALE MODEL FOR A SCALE OF TEST ANXIETY IN ITALY
corresponds to the level of the latent trait in logit where the subsequent item category starts to have
more likelihood of being endorsed than the previous category).
All four graphs show that each category has a peak in the probability curve (i.e. each
category is the most probable response category for a portion of the measured variable), and that the
model probability curves fit well with the observed values. In other words, there are no flat
categories on the graph nor disordered thresholds overlapping with others. It is worth noting only
that item ‘a’ fits less well than the other three items, as shown by its MNSQ values and
characteristic curves.
Each interval between two adjacent thresholds indicates an interval of the test anxiety
continuum where an item-category has more probability of being endorsed than the others.
12

A RATING SCALE MODEL FOR A SCALE OF TEST ANXIETY IN ITALY
Figure 2. Characteristic Curves Item 1 – Q17a
Figure 3. Characteristic Curves Item 2 – Q17b
13

A RATING SCALE MODEL FOR A SCALE OF TEST ANXIETY IN ITALY
Figure 4. Characteristic Curves Item 3 – Q17c
Figure 5. Characteristic Curves Item 4 – Q17f
14

A RATING SCALE MODEL FOR A SCALE OF TEST ANXIETY IN ITALY
5. Differential Item Functioning by gender
Several studies show that test anxiety differs by gender (Putwain, 2007; Metallidou &
Vlachou, 2007). An analysis was therefore carried out to find out whether there is DIF (Differential
Item Functioning) for the items across the gender groups—that is, if the four items have the same
relationship to the latent trait considering males and females as separate samples. Table 3 shows
parameter estimates more than twice their standard errors. The model detects a higher test anxiety
level for females (0.43 logit more than males) and seems to confirm the results from other studies.
Table 3
ConQuest Output for the RSM – Table of response model parameter estimates, DIF for gender
Term 2: (-) gender
Variables UNWEIGHTED FIT WEIGHTED FIT
gender ESTIMATE ERROR^ MNSQ CI T MNSQ CI T
1 F 0.216 0.003 1.01 ( 0.98, 1.02) 1.2 1.11 ( 0.98, 1.02) 0.1
2 M -0.216* 0.003 1.00 ( 0.98, 1.02) 0.4 1.03 ( 0.98, 1.02) -1.4
NOTE. Separation Reliability Not Applicable.
^ Quick standard errors have been used
* parameter estimate constrained
Considering each item across gender groups and its relationship to the latent trait (Table 4), the
different test anxiety level detected is to be explained by item ‘a’ and item ‘b’: their logit difference
between males and females is 0.26 and 0.23 respectively (with MNSQ values still acceptable).
15

A RATING SCALE MODEL FOR A SCALE OF TEST ANXIETY IN ITALY
Table 4
ConQuest Output for the RSM – DIF for gender
Term 3: item*gender
Variables UNWEIGHTED FIT WEIGHTED FIT
item gender ESTIMATE ERROR^ MNSQ CI T MNSQ CI T
1 Q17a F -0.132 0.004 1.08 (0.98, 1.02) 7.8 1.10 (0.98, 1.02) 9.8
2 Q17b F 0.116 0.005 0.99 (0.98, 1.02) -1.3 1.02 (0.98, 1.02) 1.8
3 Q17c F 0.006 0.004 0.94 (0.98, 1.02) -5.8 0.94 (0.98, 1.02) -6.2
4 Q17f F 0.009* 0.008 0.96 (0.98, 1.02) -3.5 0.95 (0.98, 1.02) -5.2
1 Q17a M 0.132* 0.004 1.12 (0.98, 1.02) 11.2 1.13 (0.98, 1.02) 13.4
2 Q17b M -0.216* 0.005 0.97 (0.98, 1.02) -3.4 1.04 (0.98, 1.02) 3.4
3 Q17c M -0.006* 0.004 0.94 (0.98, 1.02) -5.7 0.93 (0.98, 1.02) -7.3
4 Q17f M -0.009* 0.008 0.97 (0.98, 1.02) -3.4 0.96 (0.98, 1.02) -4.6
NOTE. Separation Reliability = 0.999. Chi-square test of parameter equality = 1470.28, df = 3, Sig Level = 0.000
Term 4: (-) step*gender
Variables UNWEIGHTED FIT WEIGHTED FIT
step gender ESTIMATE ERROR^ MNSQ CI T MNSQ CI T
0 F 1.10 (0.98, 1.02) 9.1 1.11 (0.98, 1.02) 9.6
1 F 0.878 0.008 1.02 (0.98, 1.02) 1.8 1.03 (0.98, 1.02) 2.7
2 F -0.020 0.009 1.02 (0.98, 1.02) 2.4 1.04 (0.98, 1.02) 4.0
3 F -0.858* 1.17 (0.98, 1.02) 16.1 1.11 (0.98, 1.02) 9.6
0 M 1.14 (0.98, 1.02) 13.1 1.13 (0.98, 1.02) 12.1
1 M 0.645 0.008 1.09 (0.98, 1.02) 8.5 1.10 (0.98, 1.02) 10.1
2 M 0.020 0.009 1.01 (0.98, 1.02) 0.5 1.04 (0.98, 1.02) 3.6
3 M -0.655* 1.28 (0.98, 1.02) 25.8 1.12 (0.98, 1.02) 9.3
^ Quick standard errors have been used
* parameter estimate constrained
Females reach higher levels on item ‘a’ and lower on item ‘b’—that is, as shown in Fig. 6,
thresholds for item ‘a’ (1.A.1, 1.A.2, .1.A.3 on the graph) are located lower for females than for
males on the logit test anxiety scale, while the opposite is true for the thresholds for item ‘b’.
This results in a set of items that is more widely distributed on the test anxiety continuum for
females than for males. In other words, female test anxiety is more precisely measured by the RSM
considered.
16

A RATING SCALE MODEL FOR A SCALE OF TEST ANXIETY IN ITALY
Figure 6. ConQuest Item-thresholds map for the RSM – Dif for gender
NOTE. Each 'X' represents 266.1 cases. The labels for thresholds show the levels of gender, item,
and step, respectively. The first digit is: 1 for female (highlighted), 2 for males
17

A RATING SCALE MODEL FOR A SCALE OF TEST ANXIETY IN ITALY
6. Discussion
The results of the study provide empirical support for the validation of a test anxiety scale. The
pre-test measurements demonstrated good overall reliability. The low presence of missing data
(between 1% and 1,2%) confirmed that all four items were semantically well understood by the
students in the 5th grade.
Item analysis shows good internal consistency of the four items so that, at least for 5th graders,
the four items can be considered quite reliable and tend to measure the same latent trait.
Specifically, item ‘c’ seems to correlate better than the others with overall test anxiety and thus
makes the greatest contribution to the measurement.
The Rating Scale Model shows a good fit to the dataset (the fit statistics are reasonably good)
but it also suggests that another item should be included for a better evaluation of the lower levels
of anxiety (a tail of subjects hangs below the lowest level item thresholds).
As in other studies, the RSM used here detects a higher test anxiety level for females (DIF is
statistically significant) and in general it fits better for the female sample as the thresholds are
spread more widely than for males on the logit test anxiety continuum. Moreover the single items
emphasise different characteristics in the DIF analysis.
Item ‘c’ seems to be the most stable for several reasons: it correlates best with the overall
anxiety level, it is located in the central portion of the test anxiety continuum and, finally, it doesn’t
show any significant DIF by gender.
Item ‘a’ makes a slightly lower contribution to the latent trait investigated and it has a
significant DIF by gender—that is, male thresholds are located higher than female: perhaps it is less
connected with a personal state of anxiety during the tests and more related to the school or class
climate.
Finally, the way item ‘b’ works is the opposite of item ‘a’: it fits the more anxious students and
female thresholds are located higher than those of males.
18

A RATING SCALE MODEL FOR A SCALE OF TEST ANXIETY IN ITALY
The validated scale can be used for future surveys regarding student assessment administered by
National Institute for the Educational Evaluation of Instruction and Training. There is a need to
accumulate some basic data for test anxiety scores in order to establish whether international
research findings may generalize to Italian schoolchildren.
Students’ socio-demographic characteristics and other theoretical constructs investigated in the
Student Questionnaire can be related to test anxiety, which, in turn, is correlated with student
scores in Reading comprehension and Grammar and in Mathematics.
On the basis of the present data, future research could focus on subject matter variations and
gender differences in test anxiety. According to relevant research (Wolters & Pintrich, 1998) female
students are identified as the group with higher test anxiety ratings even when their performance is
equal to or better than that of males. Furthermore, females report higher levels of anxiety in
Mathematics than in other subjects, while males report similar levels of test anxiety in different
school subjects.
For future developments the relationships of test anxiety to related constructs such as cognitive
strategy use and self-regulation (Pintrich & De Groot, 1990), attributions of success and failure
(Rapaport, 1984; Cassidy, 2004), academic self-concept (Putwain et al., 2010) and student
motivation (Bembenutty et al., 1998) have to be investigated. Some of these constructs were
examined in the Student Questionnaire administered to 5th graders; others were newly introduced in
the 2009-2010 version for 6th graders. For this same school year it will be possible to take into
account both the school and the classroom level using multilevel analysis.
19

A RATING SCALE MODEL FOR A SCALE OF TEST ANXIETY IN ITALY
References
Baumert J. et al. (2000). Self-Regulated Learning as a Cross-Curricular Competence, Max
Planck Institut für Bildungsforschung, OECD PISA Deutschland, 2000. Available:
http://www.mpib-berlin.mpg.de/en/pisa/pdfs/cccengl.pdf. Accessed: September 9, 2010.
Bembenutty, H., McKeachie, W. J., Karabenick, S. A., Lin, Y. (1998). The Relationship
between Test Anxiety and Self-Regulation on Students' Motivation and Learning. Paper presented
at the Annual Meeting of the American Psychological Society (Washington, DC, May 1998).
Bond, T. G., and Fox, C. M. (2001). Applying the Rasch model: fundamental measurement
in the human sciences. Mahwah, New Jersey: L. Erlbaum.
Cassady, J. C. (2004). The Influence of Cognitive Test Anxiety across the Learning-Testing
Cycle. Learning and Instruction, 14 (6), 569-592.
Cavalli, A. (2000). Gli insegnanti nella scuola che cambia: seconda indagine IARD sulle
condizioni di vita e di lavoro nella scuola italiana. Bologna: il Mulino.
Corbetta, P. (2002). Metodi di analisi multivariata per le scienze sociali: i modelli di
equazioni strutturali. Bologna: il Mulino.
Giampaglia, G. (2008). Il modello di Rasch nella ricerca sociale. Napoli: Liguori Editore.
Hembree, R. (1988). Correlates, causes, effects, and treatment of test anxiety. Review of
Educational Research, 58 (Spring), 47-77.
Karabatsos, G. (2000). A critique of Rasch residual fit statistics. Journal of Applied
Measurement, Vol. 1 (2), 152-176.
Law, Y., Chan, C. K. K., and John Sachs, J. (2008). Beliefs about learning, self-regulated
strategies and text comprehension among Chinese children. British Journal of Educational
Psychology, 78, 51–73.
Lee, J. C., Yin, H. and Zhang, Z. (2010). Adaptation and Analysis of Motivaded Strategies
for Learning Questionnaire in Chinese Setting. International Journal of Testing, 10 (2), 149-165.
20
A RATING SCALE MODEL FOR A SCALE OF TEST ANXIETY IN ITALY
Linacre, J. M., and Wright, B. D. (1994). Reasonable mean-square fit values. Rasch
measurement Transactions, 8 (3), 370. Available: http://www.rasch.org/rmt/rmt83b.htm. Accessed:
September 9, 2010.
Linacre, J. M.. (2003). Rasch Power Analysis: Size vs. Significance: Infit and Outfit Mean-
Square and Standardized Chi-Square Fit Statistic. Rasch measurement Transactions, 17 (1), 918.
Available: http://www.rasch.org/rmt/rmt171n.htm. Accessed: September 9, 2010.
McDonald, Angus S. (2001). The prevalence and effects of test anxiety in school children.
Educational psychology, 21 (1), 89-101.
Metallidou, P., and Vlachou, A. (2007). Motivational beliefs, cognitive engagement, and
achievement in language and mathematics in elementary school children. International journal of
psychology, 42 (1), 2-15.
Morris L. W., Davis M. A., and Hutchings, C. H. (1981). Cognitive and emotional
components of anxiety: Literature review and a revised worry-emotionality scale. Journal of.
Educational Psychology, 73 (4), 541-55.
National Institute for the Educational Evaluation of Instruction and Training (2009).
Rilevazione degli apprendimenti scuola primaria. Prime analisi. Available:
http://www.invalsi.it/download/Rapporto_SNV_08_09.pdf. Accessed: September 9, 2010.
Pintrich, P. R., and De Groot, E. V. (1990). Motivational and Self-Regulated Learning
Components of Classroom Academic Performance. Journal of Educational Psychology, 82 (1), 33-
40.
Pozio, S. (2010). Il problema delle omissioni in PISA. In INVALSI (Ed.). PISA 2006.
Approfondimenti tematici e metodologici. Roma, Italy: Armando.
Putwain, D. W. (2007). Test anxiety in UK schoolchildren: Prevalence and demographic
patterns. British Journal of Educational Psychology, 77, 579–593.
21

A RATING SCALE MODEL FOR A SCALE OF TEST ANXIETY IN ITALY
Putwain, D. W., Woods, K. A., and Symes, W. (2010). Personal and situational predictors of
test anxiety of students in post-compulsory education. British Journal of Educational Psychology,
80, 137-160.
Rapaport, R. J. (1984). Test Anxiety and Causal Attributions Following Success and Failure
in an Achievement Situation. Paper presented at the Annual Meeting of the Midwestern
Psychological Association (55th, Chicago, IL, May 3-5, 1984).
Sarason, I. G. (1978). The Test Anxiety Scale: Concept and research. In C. D. Spielberger &
I. G. Sarason (Eds.), Stress and anxiety (Vol. 5, pp. 193-216). Washington, DC: Hemisphere.
Sarason, I. (1984). Stress, anxiety and Cognitive Interference: Reactions to tests. Journal of
Personality and Social Psychology, 46 (4), 929-938.
Seipp, B. (1991). Anxiety and academic performance: A meta-analysis of findings. Anxiety
Research, 4 (1), 27-41.
Smith, R. M., Schumacker, R. E., and Bush, M. J. (1998). Using item mean squares to
evaluate fit to the Rasch model. Journal of Outcome Measurement, Vol. 2 (1), 66-78.
Spielberger, C. D. (1980) Preliminary Professional Manual for the Test Anxiety Inventory.
Palo Alto, CA: Consulting Psychologists Press.
Spielberger C.D., Comunian A. L. (Eds.) (1989). T.A.I. (Test Anxiety Inventory). Firenze:
Organizzazioni Speciali
Wolters, C. A., and Pintrich, P. R. (1998). Contextual Differences in Student Motivation and
Self-Regulated Learning in Mathematics, English, and Social Studies Classrooms. Instructional
Science, 26 (1-2), 27-47.
Wu, M. L., Adams, R. J., Wilson, M. R., Haldane, S. A. (2007). ACER ConQuest version
2.0: Generalised item response modelling software. Camberwell, Victoria: ACER Press.
22
A RATING SCALE MODEL FOR A SCALE OF TEST ANXIETY IN ITALY
APPENDIX - ConQuest Item Analysis output
Table A1
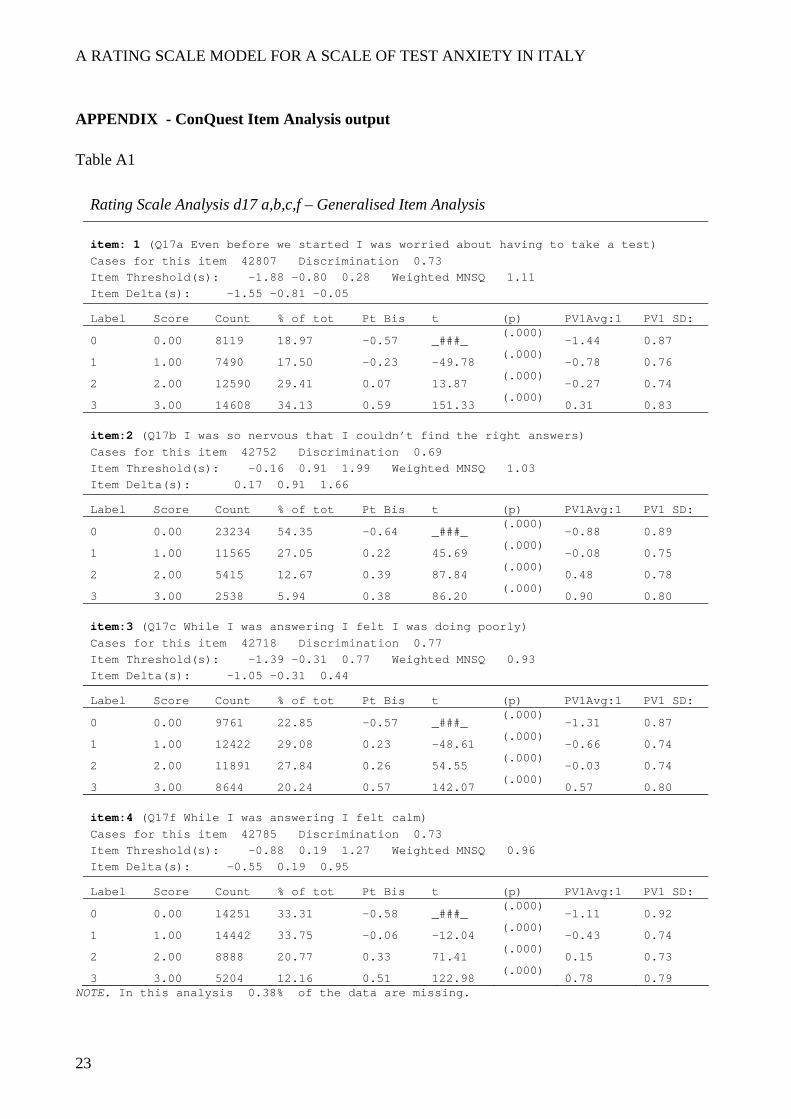
Rating Scale Analysis d17 a,b,c,f – Generalised Item Analysis
item: 1 (Q17a Even before we started I was worried about having to take a test) Cases for this item 42807 Discrimination 0.73 Item Threshold(s): -1.88 -0.80 0.28 Weighted MNSQ 1.11 Item Delta(s): -1.55 -0.81 -0.05
Label Score Count % of tot Pt Bis t (p) PV1Avg:1 PV1 SD:
0 0.00 8119 18.97 -0.57 _###_ (.000)
-1.44 0.87
1 1.00 7490 17.50 -0.23 -49.78 (.000)
-0.78 0.76
2 2.00 12590 29.41 0.07 13.87 (.000)
-0.27 0.74
3 3.00 14608 34.13 0.59 151.33 (.000)
0.31 0.83 item:2 (Q17b I was so nervous that I couldn’t find the right answers) Cases for this item 42752 Discrimination 0.69 Item Threshold(s): -0.16 0.91 1.99 Weighted MNSQ 1.03 Item Delta(s): 0.17 0.91 1.66
Label Score Count % of tot Pt Bis t (p) PV1Avg:1 PV1 SD:
0 0.00 23234 54.35 -0.64 _###_ (.000)
-0.88 0.89
1 1.00 11565 27.05 0.22 45.69 (.000)
-0.08 0.75
2 2.00 5415 12.67 0.39 87.84 (.000)
0.48 0.78
3 3.00 2538 5.94 0.38 86.20 (.000)
0.90 0.80 item:3 (Q17c While I was answering I felt I was doing poorly) Cases for this item 42718 Discrimination 0.77 Item Threshold(s): -1.39 -0.31 0.77 Weighted MNSQ 0.93 Item Delta(s): -1.05 -0.31 0.44
Label Score Count % of tot Pt Bis t (p) PV1Avg:1 PV1 SD:
0 0.00 9761 22.85 -0.57 _###_ (.000)
-1.31 0.87
1 1.00 12422 29.08 0.23 -48.61 (.000)
-0.66 0.74
2 2.00 11891 27.84 0.26 54.55 (.000)
-0.03 0.74
3 3.00 8644 20.24 0.57 142.07 (.000)
0.57 0.80 item:4 (Q17f While I was answering I felt calm) Cases for this item 42785 Discrimination 0.73 Item Threshold(s): -0.88 0.19 1.27 Weighted MNSQ 0.96 Item Delta(s): -0.55 0.19 0.95
Label Score Count % of tot Pt Bis t (p) PV1Avg:1 PV1 SD:
0 0.00 14251 33.31 -0.58 _###_ (.000)
-1.11 0.92
1 1.00 14442 33.75 -0.06 -12.04 (.000)
-0.43 0.74
2 2.00 8888 20.77 0.33 71.41 (.000)
0.15 0.73
3 3.00 5204 12.16 0.51 122.98 (.000)
0.78 0.79 NOTE. In this analysis 0.38% of the data are missing.
23

A RATING SCALE MODEL FOR A SCALE OF TEST ANXIETY IN ITALY
Table A2
Item analysis results scaled to assume that a single response was provided for each item
N 42929
Mean 5.07
Standard Deviation 2.99
Variance 8.96
Skewness 0.18
Kurtosis -0.69
Standard error of mean 0.01
Standard error of measurement 1.67
Coefficient Alpha 0.69
Note that the different number of valid cases considered in ConQuest (42,929) and in SPSS
(42,460) is due to the different treatment of missing values: ConQuest estimates missing values
while SPSS excludes all those cases with missing values for any of the variables considered
(“listwise exclusion”).
24
A RATING SCALE MODEL FOR A SCALE OF TEST ANXIETY IN ITALY
25
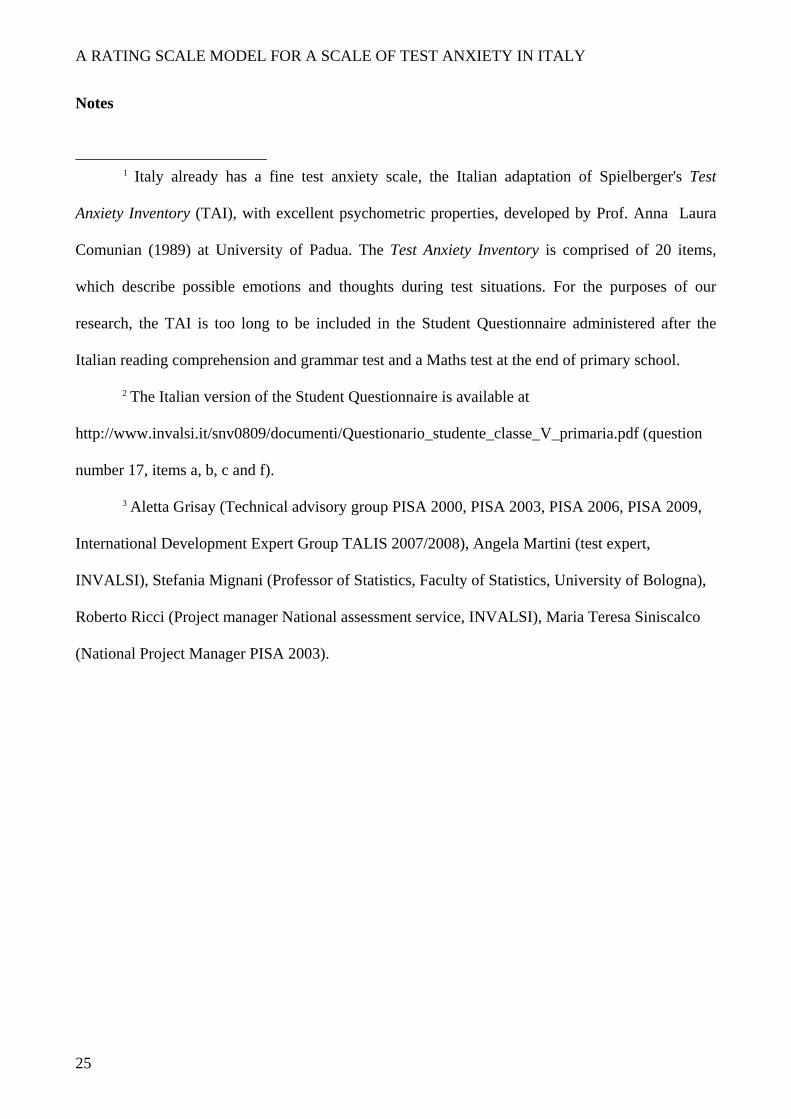
Notes
1 Italy already has a fine test anxiety scale, the Italian adaptation of Spielberger's Test
Anxiety Inventory (TAI), with excellent psychometric properties, developed by Prof. Anna Laura
Comunian (1989) at University of Padua. The Test Anxiety Inventory is comprised of 20 items,
which describe possible emotions and thoughts during test situations. For the purposes of our
research, the TAI is too long to be included in the Student Questionnaire administered after the
Italian reading comprehension and grammar test and a Maths test at the end of primary school.
2 The Italian version of the Student Questionnaire is available at
http://www.invalsi.it/snv0809/documenti/Questionario_studente_classe_V_primaria.pdf (question
number 17, items a, b, c and f).
3 Aletta Grisay (Technical advisory group PISA 2000, PISA 2003, PISA 2006, PISA 2009,
International Development Expert Group TALIS 2007/2008), Angela Martini (test expert,
INVALSI), Stefania Mignani (Professor of Statistics, Faculty of Statistics, University of Bologna),
Roberto Ricci (Project manager National assessment service, INVALSI), Maria Teresa Siniscalco
(National Project Manager PISA 2003).