Embed Size (px)
Citation preview
THE FISCAL IMPACT OF K–12 EDUCATIONAL CHOICEUsing Random Assignment Studies of Private School Choice Programs
to Infer Student Switcher Rates
Martin F. Lueken, [email protected]
August 9, 2019
Working Paper 2019-3
1
ABOUT EDCHOICE EdChoice is a nonprofit, nonpartisan organization dedicated to advancing full and unencumbered educational choice as the best pathway to successful lives and a stronger society. EdChoice believes that families, not bureaucrats, are best equipped to make K–12 schooling decisions for their children. The organization works at the state level to educate diverse audiences, train advocates and engage policymakers on the benefits of high-quality school choice programs. EdChoice is the intellectual legacy of Milton and Rose D. Friedman, who founded the organization in 1996 as the Friedman Foundation for Educational Choice. The contents of this publication are intended to provide empirical information and should not be construed as lobbying for any position related to any legislation. EdChoice Working Papers are meant for wide circulation, inviting reader feedback, and for informing national and state conversations about reform ideas, policymaking, and implementation, driven by educational choice. EdChoice internally reviews each paper but does not necessarily send out for external reviews. We welcome and encourage hearing from you. Please feel free to contact the authors directly or Paul DiPerna, our Vice President of Research—about your impressions and comments. Martin Lueken: [email protected] Paul DiPerna: [email protected] Authors are responsible for the content provided in EdChoice working papers.

2
Table of Contents Executive Summary 4
Introduction 6
Difficulty in Identifying Switcher Rates 8
Fiscal Analyses of Private School Choice Programs 9
School Voucher Programs 10
Tax-Credit Scholarship Programs 11
Summarizing Data on Switcher Rates from Random Assignment Research 12
Switcher Rates Among Minority Students 17
Switcher Rates By Year in Choice Program 18
Applying Switcher Information to Fiscal Impact Analyses 19
Discussion 20
Conclusion 22
References 23
About the Author 27
Acknowledgments 27
List of Tables Table 1: Summary of Findings About Switcher Rates
from Random Assignment Studies 14
Table 2: Summary of Findings about Minority Students
from Random Assignment Studies 18
Table 3: Switcher Rates form Random Assignment Studies
Observed by Year After Students Applied for Program 19
3
Executive Summary
Critics of private school choice programs argue that they drain resources from public schools and
increase taxpayer costs,i Supporters of these programs, on the other hand, argue that these
programs save taxpayers money because the average amount of scholarships is less than per
pupil spending in public schools. Given these fiscal concerns, when legislators introduce a
private school choice bill in a state, policymakers want to know about the potential fiscal effects
of these programs on their state and local public schools’ budgets.
The rate of students receiving scholarships who switch from attending public schools to private
schools (i.e., “switchers”) is an integral factor for reliably estimating the net fiscal impact of
private school choice programs. Switchers lower the taxpayer cost of funding public schools and
therefore represent an offset to the cost of funding choice programs. If choice programs serve a
high rate of students who would have been enrolled in a public school if the choice programs did
not exist (a high rate of switchers), then any fiscal savings will be larger when compared to
choice programs with low switcher rates.
Analysts, however, do not observe the counterfactual, i.e., what sector school students would be
enrolled (public or private) if the choice program did not exist. Some argue that without data
identifying which type of school a choice program participant attended prior to receiving a
scholarship, “the process of calculating switchers is unverifiable and opaque,”iiEven with good
data collection by states, scholarship organizations, or program administrative organizations,
estimating switcher rates pose a challenge for analysts. Estimates based on observational data on
where students in choice programs were enrolled prior to participating in the program can yield
biased estimates of the true switcher rate.
i Martin F. Lueken (2018), Fiscal Effects of School Vouchers: Examining the Savings and Costs of America’s Private School Voucher Programs, retrieved from EdChoice website: https://www.edchoice.org/wp-content/uploads/2018/09/Fiscal-Effects-of-School-Vouchers-by-Martin-Lueken.pdf ii Luis A. Huerta and Steven Koutsavlis (2017), NEPC Review: The Tax-Credit Scholarship Audit: Do Publicly Funded Private School Choice Programs Save Money? Retrieved from National Education Policy Center website: https://nepc.colorado.edu/sites/default/files/reviews/TTR%20Huerta%20Tax%20Credits_2.pdf

4
Fortunately, there is a body of evidence that can provide unbiased estimates for switcher rates.
Some researchers have observed the counterfactual for programs that were oversubscribed and
conducted random assignment lotteries. The switcher rates observed in these studies are
remarkably stable across time and states and can provide useful information for inferring
switcher rates when conducting fiscal analyses.
This paper identifies 27 distinct estimates of switcher rates from nine lottery-based studies of six
private school choice programs in the United States that report information about which types of
schools students enroll in after they apply to a choice program and do not win a lottery (the
control group). That is, students whose families apply for a scholarship, but are randomly denied,
are observed attending either a public or private school. The proportion of students attending a
public school after losing a scholarship lottery provide a good estimate of the switcher rate as
their families desired participation in a choice program.
Switcher rates in these lottery-based school choice programs, for both full samples and
subgroups of students, ranged from 79 percent to 98 percent. The weighted average and median
switcher rates from these studies are 91 percent and 90 percent, respectively.
Switcher rates are slightly higher for African American students participating in three privately
funded school choice programs (New York City, Dayton, and Washington, D.C.), where the
average switcher rate for these students is 93 percent and the media is 94 percent.
When examining switcher rates by year after students applying to the program, mean and median
switcher rates observed among students in the control groups overall is about 90 percent each
year.
These findings align well with assumptions about switcher rates employed in some fiscal
analyses of private school choice programs. However, assumed switcher rates used in other
analyses are well below the range of switcher rates observed in the body of random assignment
studies, suggesting that these latter estimates of net fiscal effects are significantly understated.
For example, Lueken estimated the fiscal effects of 10 tax-credit scholarship programs using 60

5
percent and 90 percent switcher rates.iii The estimated net fiscal impact per scholarship ranged
from $1,650 (60 percent switcher rate) to $3,000 (90 percent switcher rate), suggesting that the
low-end estimates are significantly understated.
iii Martin F. Lueken (2018), The Fiscal Effects of Tax-Credit Scholarship Programs in the United States, Journal of School Choice, 12(2), pp. 181–215, https://dx.doi.org/10.1080/15582159.2018.1447725
6
Introduction
Critics of private school choice programs argue that they drain resources from public schools and
increase taxpayer costs (Lueken, 2018a). Supporters of these programs, on the other hand, argue
that these programs save taxpayers money because the average amount of scholarships is less
than per pupil spending in public schools. Given this fiscal question, when legislators introduce a
private school choice bill in a state, policymakers want to know about the potential fiscal effects
of these programs on their state and local public schools’ budgets.1
There is a direct fiscal cost from private school choice programs because they fund education
savings accounts and vouchers, and tax credits reduce the amount of revenue for the state.
Choice programs, however, also yield a direct fiscal savings from not having to pay the cost of
enrolling students in public schools.2 Thus, any net fiscal impact of a choice program is
determined by the cost to fund these programs relative to the savings.
Net Fiscal Impact = Expenditures Avoided – Program Costs
“Switchers” represent a central determinant of the fiscal effects of these programs, where
switchers are students who would be enrolled in a public school without the financial assistance
from the choice program. When students switch from public schools to private schools via
choice programs, costs are reduced for both the state and public schools. Non-switchers are
students who would have enrolled in a non-public school environment even without the program
in place and represent a pure cost for a program. Switchers represent savings that offset all or
part of the costs of a choice program.
1 For example, one media outlet reported that different analyses for a tax-credit scholarship bill in Kentucky, one conducted by the Legislative Research Commission and state’s budget director were presented during testimony for the House Appropriations and Revenue Committee. “Private school tax bill: Here's what legislators, Bevin are saying,” by Mandy McIaren, Louisville Courier Journal, March 5, 2019, https://www.courier-journal.com/story/news/politics/ky-legislature/2019/03/05/hb-205-kentucky-what-legislators-say-private-school-tax/3064086002/ 2 The term “public school,” as used throughout the present paper, refers to both traditional (district) public schools and public charter schools.

7
Estimates of the net fiscal effects of private school choice programs are very sensitive to
assumptions about switchers. Thus, the switcher rate is a crucial factor for any fiscal analysis of a
choice program. Accounting for switchers, however, presents a challenge for fiscal analyses
because analysts do not observe where scholarship students would have attended school—if they
were not using scholarships.
Some argue that without data identifying which type of school a choice program participant
attended prior to receiving a scholarship, “the process of calculating switchers is unverifiable and
opaque” (Huerta & Koutsavlis, 2017). Even with good data collection by states or scholarship
organizations, however, estimating switcher rates pose a challenge for analysts. Estimates based
on observational data on where students in choice programs were enrolled prior to participating
in the program can yield biased estimates of the true switcher rate. Fortunately, there is a body of
evidence that can provide unbiased estimates for switcher rates.
In the absence of data on switcher rates, one of the most reliable sources of information for
informing this area comes from random assignment studies (Costrell, 2008), where students
whose families apply for a choice program that is oversubscribed are entered into a lottery. Some
researchers have observed the counterfactual for programs that were oversubscribed and
conducted random assignment lotteries. The offer of a scholarship is determined by random
assignment where some students are randomly assigned a scholarship to a private school while
others are randomly denied a scholarship offer. The switcher rates observed in these studies are
remarkably stable across time and states and can provide useful information for inferring
switcher rates when conducting fiscal analyses.
Generally speaking, random assignment offers the best research methods for answering questions
about the causal effects of education programs and policies (Cook & Payne, 2002). Random
assignment of scholarships also provides the best method for addressing a key question about the
counterfactual for any fiscal analysis: what share of students participating in a given choice
program would have enrolled in a public school without the program in place? Specifically,
evidence to address this question can be obtained from random assignment studies by observing
where students in the control group (the lottery losers) enrolled after not receiving an offer to

8
participate in the program. The percent of students who lost the lottery and then enrolled in a
public school in subsequent years is a reliable measure of what percent of those students would
have been switchers—students who switched from a public to a private school after receiving a
scholarship. This paper summarizes this valuable information on switching rates gathered from
random assignment research on private school choice programs.
The remainder of this paper is organized as follows: the next section discusses challenges with
obtaining information about switchers when doing a fiscal analysis of a proposed choice
program. Next, it reviews prior fiscal analyses and discusses their assumptions about switching.
Then the paper summarizes data from random assignment studies that can help inform questions
about switching. The paper finishes with a discussion of these findings and concluding remarks.
Difficulty in Identifying Switcher Rates
Estimating the true switcher rate of a choice program poses a challenge for analysts because they
typically do not observe the counterfactual. That is, analysts normally do not observe where
scholarship recipients would be enrolled if a choice program did not exist.
Collecting even useful data does not ameliorate this problem of not observing the counterfactual.
There is considerable variation in the extent to which private school choice program
administrative organizations such as government agencies or tax-credit scholarship organizations
publicly report data that can help analysts infer switching rates. Some agencies report
information about the type of schooling environment students were enrolled prior to participating
in a program. For example, the Alabama Department of Revenue reports this information
annually for the state’s tax-credit scholarship program.3 Most tax-credit scholarship programs do
not track or publicly report such information.
3 For each year of the program, the Alabama Department of Revenue reports the total number and percentage “of first time recipients continuously enrolled in a public school for the entire previous year.” Alabama Department of Revenue, Alabama Accountability Act, retrieved 5/22/2019 from: https://revenue.alabama.gov/legal/alabama-accountability-act/
9
Some fiscal analyses of school choice programs use the types of schools where students were
enrolled prior to participating in a choice program as a proxy for switching. If a student was
enrolled in a public school setting prior to participating in a choice program, then he or she
would be counted as a switcher. One issue with this approach is that some students are entering
school for the first time and do not actually have the opportunity to “switch” from a public
school. This could be the case with kindergarten or first grade students. Without any adjustments
applied to this group of students, all students entering school for the first time would by default
be counted as non-switchers—even when most or even all of them would have been enrolled in a
public school if the choice program did not exist. Estimates from random assignment studies
provide a significant improvement over these approaches because they yield unbiased estimates
of the counterfactual.
Generally, it is impossible to know with certainty if a student is a switcher at any given point in
time—even with excellent data collection efforts. For example, if we observe a student in a
nonpublic school before receiving a scholarship, it could be the case that she would have entered
a public school sometime in the future (e.g., beginning of high school) without the financial
assistance from the program. In this case, he or she would generate savings from the point she
switches from public school. It is also possible to observe a student in public school before
receiving a scholarship who would have enrolled in a private school sometime in the future even
without financial assistance from a scholarship. Such a student in a private school choice
program would generate costs from the point she leaves public school. These examples are
indicative of the complexity and limitations associated with precisely estimating the fiscal impact
of school choice programs. Given such challenges, fiscal analyses have employed various of
approaches to estimating switcher rates.
Fiscal Analyses of Private School Choice Programs
This section discusses methods and assumptions about switcher rates used in fiscal analyses of
private school choice programs. A large body of research has examined the fiscal effects of these
programs. Some fiscal analyses cite evidence from random assignment research to infer switcher
10
rates. Other work estimates break-even switcher rates for private school choice programs. These
are switcher rates under which a program is revenue neutral, i.e. the rate that equalizes a
program’s costs with benefits.
School Voucher Programs
Lueken (2018a) estimated the fiscal effects of 16 school voucher programs in 10 states. When
possible, he attempted to obtain data on prior enrollment from choice program administrative
agencies to generate fiscal effects estimates. When such data was not available, he relied on
findings from research on those programs. Estimates for break-even switcher rates range from 15
percent for Louisiana’s School Choice Program for Certain Students with Exceptionalities to 80
percent for the Racine (Wisconsin) Parental Private School Choice Program. The average break-
even switcher rate, weighted by participation, for programs studied in the analysis is 60 percent.
Trivitt and DeAngelis (2016) estimated the cost of eliminating the Louisiana Scholarship
Program to the state.4 They estimated that for the program’s removal to be cost-neutral, between
13 percent and 25 percent of LSP students would need to remain in private schools, implying
break-even switcher rates of 75 percent to 87 percent. They note that early random assignment
studies of the LSP found that 9 percent of students in the control group remained in private
schools even without program assistance, implying a switcher rate of around 91 percent. Given
that requirements for students to remain in public schools are greater than 9 percent for removal
of the LSP to be fiscally neutral for the state, eliminating the program would generate a net fiscal
cost for the state.
Costrell (2010) uses evidence from random assignment studies to infer switcher rates in
analyzing the fiscal effects of the Milwaukee Parental Choice Program on different groups of
taxpayers.5 While his main estimates are based on a 90 percent switcher rate assumption, he also
produces estimates using a 70 percent switcher rate.
4 The LSP was not actually eliminated and currently remains in operation. 5 Costrell’s estimate is based on evidence from random assignment studies of the DCOSP and privately funded voucher programs in New York City, Washington, D.C., and Dayton, OH.
11
Tax-Credit Scholarship Programs
Lueken (2018b) conducted a fiscal analysis of 10 tax-credit scholarship programs in seven states
and used a very broad range of switcher rates, from 60 percent to 90 percent, to generate his
estimates. The high-end rate was informed by Costrell (2010) while the low-end range was based
on parental survey data about their stated preferences for their child’s schooling.
An analysis conducted by another governmental agency, the Iowa Department of Revenue,
estimated the fiscal impact of Iowa’s School Tuition Organization Tax Credit Program (Girardi
& Gullickson, 2017). The analysis generated estimates based on a 30 percent switcher rate and
also estimated a break-even switcher rate of 15 percent.
In an analysis of Georgia’s tax-credit scholarship program, Buschman & Sjoquist (2014)
estimated a very wide range of break-even switcher rates under a range of different values for the
state grant and amount of tax credits awarded per scholarship recipient. They report break-even
switcher rate estimates ranging from 37 percent to 98 percent.6
Two reports by the Florida legislature’s Office of Program Policy Analysis and Government
Accountability estimated the fiscal impact of the Florida Tax Credit Scholarship Program on
state taxpayers for FY 2008 and FY 2009 (OPPAGA, 2008; OPPAGA, 2010). The two analyses
assumed that the switcher rate was 90 percent and 95 percent, respectively.
Lips and Jacoby (2001) estimated the fiscal impact of Arizona’s Original Individual Tax Credit
Program from 1998 to 2000. Based on interviews with SGOs and data about students from low-
income families, they assumed a switcher rate of 20 percent.
6 Buschman and Sjoquist engaged in an exchange with Benjamin Scafidi, who critiqued their methods. For a summary of this exchange, please see Lueken (2018b).

12
Summarizing Data on Switcher Rates from Random Assignment Research
The counterfactual of interest for a fiscal analysis of school choice programs, the sector school
where students would enroll (public or private) if the choice program did not exist, cannot be
observed. This poses a challenge for analysts. Estimates of switcher rates based on good data
collection on where students were enrolled prior to participating in a choice program would
likely be biased. And break-even switcher rates are very limited in that they can provide a very
general sense about the cost or savings potential of a school choice program. Evidence from
random assignment studies about where students enroll after applying to a choice program and
being denied a scholarship offer can provide analysts with unbiased estimates of the
counterfactual of interest.
I reviewed 22 studies that used random assignment to evaluate private school choice programs in
the United States and identified 27 unique estimates of switcher rates from nine studies of six
private school choice programs that observed switcher rates for students who lost random
assignment lotteries. Specifically, these studies reported where students in the control group were
enrolled after applying to a program and losing a lottery. These studies cover six programs in
Louisiana; Washington, D.C.; Toledo, Ohio; New York City; and Dayton, Ohio. Some studies
were part of longitudinal evaluations that conducted analyses on an annual basis and reported
results each year. For these evaluations, I reviewed all papers and reports from these evaluations
and sought data on switcher rates for each year studied.7 Two longitudinal evaluations of the
federally funded program in Washington, D.C. have been conducted, one of which is currently
ongoing.
Taken together, these studies offer the best evidence available on switcher rates and should be
used in fiscal analyses of choice programs. This evidence is ideal because these are the only
studies that actually observe the counterfactual—where students who wanted to exercise choice
7 I report switcher rates from the most recent publication. For example, if switcher rates observed in the second year of a program were reported in a year two report and a final report, and if they differ, then I report estimates from the final report. Any observed differences from different reports of the same program were very small.

13
would have been enrolled if the choice program were not available to them (because they lost a
random lottery). Table 1 summarizes the findings on switcher rates from these random
assignment studies.
Overall, switcher rates in these programs range from 79 percent to 98 percent. The average
switcher rate, weighted by the number of students in the control group, is 91 percent. The median
switcher rate is 90 percent.
Mills and Wolf (2019) conducted an evaluation of the effects of the Louisiana Scholarship
Program (LSP) on student math and reading test scores. For each of the four years studied in the
evaluation, they report the number of students in the control group that attended public and
private schools. During the study period, between 84 percent and 92 percent of students who did
not receive a voucher offer enrolled in a public school. Another team of researchers studied the
effects of the LSP program on student test scores during the program’s first year
(Abdulkadiroglu, Pathak, and Walters, 2018). Of the students not offered a voucher, 14 percent
attended a public charter school and 77 percent attended a public non-charter school. Just five
percent of students in the control group enrolled in a private school, and four percent attended a
school of an unknown type. After adjusting for students who attended schools of an unknown
type, the estimated switcher rate is 95 percent.
In 2011, the United States Congress re-authorized the Washington, D.C. Opportunity
Scholarship Program (DCOSP). Over the program’s existence, two longitudinal evaluations have
been conducted, one completed prior to 2011 and one that started evaluating the program post-
2011 and currently ongoing.
A team of researchers conducted the first longitudinal evaluation of the DCOSP and evaluated
the experiences of students from the 2004 and 2005 cohorts. They reported where students in the
control group were enrolled during each of the four years of the program. By the end of the first
year, 60 percent were attending traditional public schools, 27 percent were attending public
charter schools, and 13 percent were enrolled in private schools (Wolf et al., 2008). By the fourth
year of the program, 89 percent of students were in public schools (Wolf et al., 2013).

14
Table 1: Summary of Findings About Switchers from Random Assignment Studies
Study Location (evaluation)
Type of program What analysis says about switchers Switcher
rate
Mills & Wolf (2019)
Louisiana (4-year longitudinal evaluation, completed)
V
In Year 4 of the program, 89 percent of students who did not receive LSP to their first choice school enrolled in a public school. 89 percent
In Year 3 of the program, 87 percent of students who did not receive LSP to their first choice school enrolled in a public school. 87 percent
In Year 2 of the program, 84 percent of students who did not receive LSP to their first choice school enrolled in a public school. 84 percent
In Year 1 of the program, 92 percent of students who did not receive LSP to their first choice school enrolled in a public school. 92 percent
Abdulkadiroglu, Pathak, & Walters (2018)
Louisiana V
Of applicants not offered a voucher, 14 percent attended a public charter school, 77 percent attended a non-charter public school, 5 percent attended a voucher school, and 4 percent attended a school of unknown type.
95 percent
Webber et al. (2019)
Washington, D.C. (Longitudinal evaluation of DCOSP after 2011 reauthorization, ongoing)
V
Of students not offered a voucher, 89 percent were enrolled in traditional public or public charter schools three years after applying to the program. 89 percent
Dynarski et al. (2018)
Of students not offered a voucher, 90 percent were enrolled in traditional public or public charter schools two years after applying to the program; Of students in the control group, 9 percent either enrolled in a private school or changed between public and private schools during the first two years in the program.
90 percent
Dynarski et al. (2017)
Of students in the control group, 10 percent were enrolled in a participating private school while 90 percent were enrolled in traditional public or public charter schools one year after applying to the program.
90 percent
Wolf et al. (2013) Washington, D.C. (First longitudinal evaluation of DCOSP, completed)
V
Of students assigned to the control group in 2004 or 2005, 53 percent were attending traditional public schools in 2009, 35 percent were attending public charter schools in 2009, and 11 percent were enrolled in private schools in 2009 after their fourth year in the program.
89 percent
Wolf et al. (2009)
During the third year of the program, of students assigned to the control group in 2004 or 2005, 54 percent were attending traditional public schools, 34 percent were attending public charter schools, and 12 percent were enrolled in private schools after their third year in the program.
88 percent

15
Wolf et al. (2008)
Of students assigned to the control group in 2004 or 2005, 51 percent were attending traditional public schools, 35 percent were attending public charter schools, and 14 percent were enrolled in private schools during their second year in the program.
86 percent
Of students assigned to the control group in 2004 or 2005, 60 percent were attending traditional public schools, 27 percent were attending public charter schools, and 13 percent were enrolled in private schools after their first year in the program.
87 percent
Bettinger & Slonim (2006) Toledo, OH P
At the time of the survey 3-4 years after applications were made to the voucher program, 21 percent of unsuccessful voucher applicants were attending private school.
79 percent
Howell, Wolf, Campbel, & Peterson (2002); Howell & Peterson (2002)
New York City, NY P
Of students not offered a voucher, 5 percent attended a private school in the first year after applying for the program.* 95 percent
Of students not offered a voucher, 3 percent attended a private school in both the first and second years after applying for the program.* 97 percent
Of students not offered a voucher, 2 percent attended a private school during the first three years after applying for the program.** 98 percent
Dayton, OH P
Of students not offered a voucher, 18 percent attended a private school in the first year after applying for the program.* 82 percent
Of students not offered a voucher, 10 percent attended a private school in both the first and second years after applying for the program.* 90 percent
Washington, D.C. P
Of students not offered a voucher, 11 percent attended a private school in the first year after applying for the program.* 89 percent
Of students not offered a voucher, 8 percent attended a private school in both the first and second years after applying for the program.* 92 percent
Of students not offered a voucher, 3 percent attended a private school during the first three years after applying for the program.** 97 percent
V=Voucher; P=Private scholarship * Howell, Wolf, Campbell, & Peterson (2002) ** Howell & Peterson (2002)

16
A different team of researchers studied the DCOSP after Congress reauthorized the program in
2011. They examined where the 2012, 2013, and 2014 student cohorts were enrolled after one
year, two years, and three years since re-authorization of the program. At the end of both the first
and second years, 90 percent of students in the control group were enrolled in traditional public
schools or public charter schools (Dynarski et al., 2017). The Year Two evaluation took a closer
look at switching with the two year period after students applied to the program (Dynarski et al.,
2018). Of students in the control group, 90 percent were enrolled in public schools two years
after applying to the program. During the first two years of the program, 9 percent of students in
the control group either enrolled in a private school or changed between public and private
schools. The Year Three evaluation reported that 89 percent of student cohorts in the control
group were enrolled in traditional public schools or public charter schools three years of applying
to the program (Webber et al., 2019).
Overall, there was very little variation in switcher rates observed during multiple longitudinal
evaluations of the DCOSP. Over a sample period of seven years, switcher rates ranged from 86
percent to 90 percent.
Bettinger and Slonim (2006) conducted a survey of a random sample of families who applied to
participate in a privately funded school voucher program in Toledo, Ohio. The survey was
administered three to four years after application to the program by both successful and
unsuccessful applicants. Part of the survey asked about the school students were currently
enrolled at the time of survey. Results indicate that 21 percent of respondents’ children who were
not offered scholarships were enrolled in private schools, suggesting a longer-term switcher rate
of at least 79 percent.
Howell, Wolf, Campbell, and Peterson (2002) and Howell and Peterson (2002) studied privately
funded voucher programs in New York City, Dayton, and Washington, D.C. They reported the
proportion of the treatment and control groups that attended a private school during the first year
of the programs, during the first and second years of the program, and during the first three
17
consecutive years of the program.8 The switcher rates are particularly high, especially in New
York City. Five percent of the students not offered a voucher in New York City attended a
private school in the first year and three percent attended a private school in both years, implying
switcher rates of 95 percent to 97 percent.
The switcher rates were between 82 percent and 90 percent in Dayton. Results from the analysis
of a privately funded scholarship program in Washington, D.C., align very closely with the
results reported from the two longitudinal evaluations of the federally funded DCOSP. Observed
switcher rates range from 89 percent to 97 percent.
Notably, Rouse (1998) used random assignment methods to study the effects of the Milwaukee
Parental Choice Program and noted that 1 percent of students not selected to attend a choice
school in the MPCP enrolled in a choice school anyway. Private schools participating in the
MPCP (“choice schools”), however, represent a very small portion of all private schools in
Milwaukee. If 99 percent of students in the control group not enrolling in choice schools all
enrolled in district schools, then the switcher rate would be 99 percent. To the extent, however,
that some students enrolled in religious private schools that were not enrolled in the MPCP, the
switcher rate would be less than 99 percent. Because of this uncertainty, I do not include this
study in the analysis.
Switcher Rates Among Minority Students
Howell, Wolf, Campbell, and Peterson (2002) also reported enrollment results for a subsample of
African American students in their analyses of privately funded school choice programs in New
York City, Dayton, and Washington, D.C. Table 2 reports these results. Switcher rates observed
among African American students tended to be higher than the rates observed for the full control
groups. The weighted average for these students is 93 percent and median switcher rate is 94
percent.
8 The proportions of students in the control group that attended private school during the first three consecutive
years in the New York City and D.C. programs were reported by Howell and Peterson (2002).

18
Table 2: Summary of Findings About Minority Student Switchers from Random Assignment Studies
Study Location (evaluation)
Type of program What analysis says about switchers Switcher
rate
Howell,
Wolf,
Campbell,
and
Peterson
(2002)
New York
City, NY P
Of African American students not offered a voucher, 4
percent attended a private school in the first year after
applying for the program.
96
percent
Of African American students not offered a voucher, 1
percent attended a private school in both the first and
second years after applying for the program.
99
percent
Dayton, OH P
Of African American students not offered a voucher, 15
percent attended a private school in the first year after
applying for the program.
85
percent
Of African American students not offered a voucher, 7
percent attended a private school in both the first and
second years after applying for the program.
93
percent
Washington,
D.C. P
Of African American students not offered a voucher, 11
percent attended a private school in the first year after
applying for the program.
89
percent
Of African American students not offered a voucher, 6
percent attended a private school in both the first and
second years after applying for the program.
94
percent
P=Private scholarship
In New York City, four percent of the African American students not offered a voucher attended
a private school in the first year and one percent attended a private school in both years, implying
switcher rates between 96 percent and 99 percent. As with New York City, switcher rates
observed among the group of African American students were slightly higher, up to 93 percent.
Switcher rates observed among African American students in the control group were comparable
to rates observed for the full sample. These results add to the face validity of the findings
because less advantaged student populations are less likely to attend private schools without
program assistance.
Switcher Rates By Year in Choice Program
The switcher rates observed across programs and locations appear remarkably stable. It may be
the case that switcher rates from private school choice programs vary by the number of years
students are in the program. Six evaluations of private school choice programs observed
enrollment patters by groups of students for at least two years. Evaluations of two programs, the
LSP (Mills & Wolf, 2019) and DCOSP pre-2011 reauthorization (Wolf et al., 2013), observed
19
switcher rates among students who applied for vouchers and did not receive them. Table 3
reports switcher rates reported in each study by year after students applied for voucher programs.
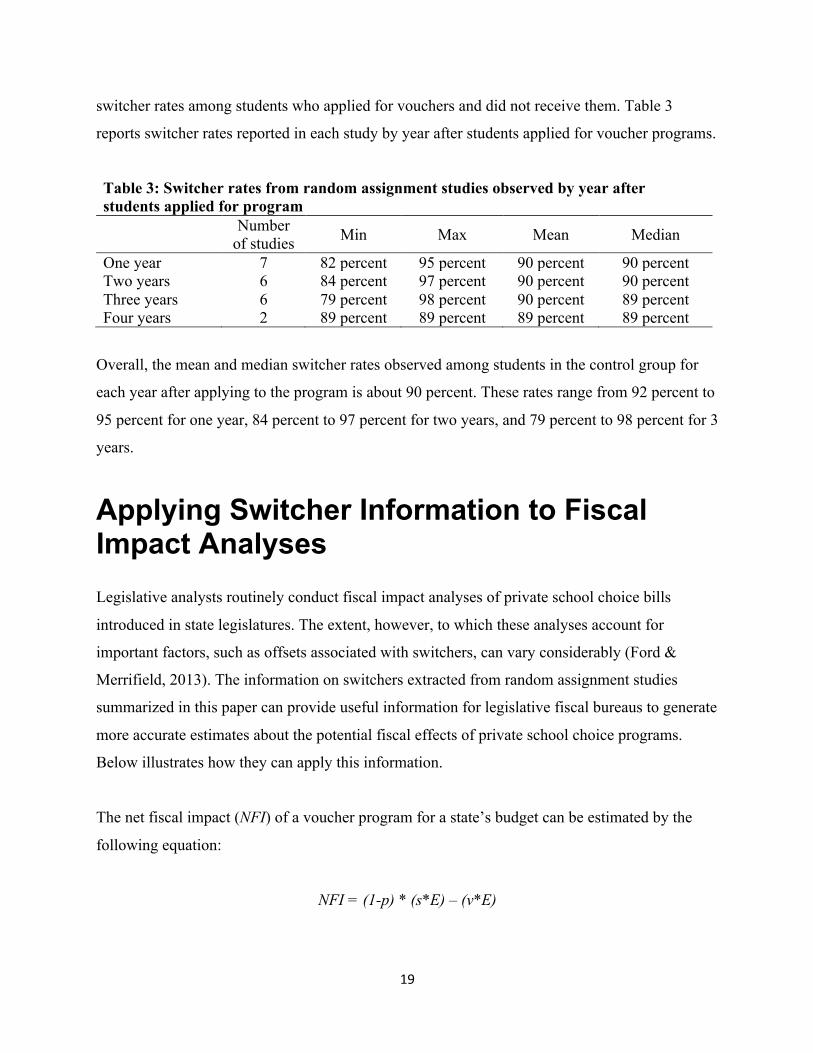
Table 3: Switcher rates from random assignment studies observed by year after students applied for program
Number of studies Min Max Mean Median
One year 7 82 percent 95 percent 90 percent 90 percent Two years 6 84 percent 97 percent 90 percent 90 percent Three years 6 79 percent 98 percent 90 percent 89 percent Four years 2 89 percent 89 percent 89 percent 89 percent
Overall, the mean and median switcher rates observed among students in the control group for
each year after applying to the program is about 90 percent. These rates range from 92 percent to
95 percent for one year, 84 percent to 97 percent for two years, and 79 percent to 98 percent for 3
years.
Applying Switcher Information to Fiscal Impact Analyses
Legislative analysts routinely conduct fiscal impact analyses of private school choice bills
introduced in state legislatures. The extent, however, to which these analyses account for
important factors, such as offsets associated with switchers, can vary considerably (Ford &
Merrifield, 2013). The information on switchers extracted from random assignment studies
summarized in this paper can provide useful information for legislative fiscal bureaus to generate
more accurate estimates about the potential fiscal effects of private school choice programs.
Below illustrates how they can apply this information.
The net fiscal impact (NFI) of a voucher program for a state’s budget can be estimated by the
following equation:
NFI = (1-p) * (s*E) – (v*E)
20
where p denotes the share of students receiving vouchers who would have enrolled in a non-
public school even without financial assistance from the voucher program; s denotes the average
per-pupil cost to the state for funding students in the voucher program had they enrolled in a
public school; E is the number of students who use a voucher; and v is the average cost of the
voucher. The term (1-p) is the switcher rate. Thus, the term on the right hand side represents the
estimated cost to the state to fund vouchers while the left hand side represents the estimated
savings from students receiving vouchers who would likely enroll in public schools if without
financial assistance from the choice program.
Consider a hypothetical example. A voucher program is introduced in a state for students from
low income families. The average state cost to fund students enrolled in public schools is $5,000.
School vouchers are equal to the state’s cost, $5,000. In the program’s first year, 2,5000 students
participate in the program. The cost to the state to provide this assistance for students
participating in the choice program is $12,500,000. Assuming that 90 percent of these students
would have enrolled in public schools without the program in place, as suggested overall by
switcher data from random assignment studies discussed in this paper, cost offsets for the state
from having 90 percent of students using vouchers not in the public school system is
$11,250,000, implying a net fiscal impact of ($1,250,000).
If the voucher amount is set at 90 percent of the state’s cost, and if 90 percent of students using
voucher are switchers, then the program would be revenue neutral for the state.
Discussion
Nine random assignment studies of private school choice programs have reported 27 unique
estimates of the share of students in control groups who enrolled in public schools after not
receiving a voucher offer. That is, these studies actually observed what percent of students whose
families endeavored to exercise choice would have truly been switchers from public to private
schools as a result of the opportunity afforded by the choice programs. The switcher rates they
observed align well with assumptions about switcher rates employed in many fiscal analyses of
private school choice programs. For example, Florida’s Office of Program Policy Analysis and
21
Government Accountability conducted analyses to estimate the fiscal impact of the Florida Tax
Credit Scholarship Program on the state’s budget in FY 2008 and FY 2009 (OPPAGA, 2008;
OPPAGA, 2010). These analyses assume 90 percent and 95 percent switcher rates, respectively.
Costrell (2010) assumed a 90 percent switcher rate in his study of the fiscal effects of the
Milwaukee Parental Choice Program. He based his assumption on a number of factors, including
random assignment research conducted on voucher programs, though he acknowledged at the
time that the research to address switchers was “thin.”
Switcher rates observed in a privately funded program and publicly funded program in
Washington, D.C. also tend to be around 90 percent. It was even higher for a privately funded
program in New York City, at least 95 percent. Taken together, this suggests that switchers in
urban settings may be particularly high. Data from a four-year study of a statewide program, the
Louisiana Scholarship Program, suggest switcher rates ranging from 84 percent to 92 percent.
In addition to the geographic scope of a program, family income may be another potential key
determinant to switching. All of the programs discussed above are targeted to students from low-
income families. For example, students must be eligible for the federal free and reduced price
lunch program to be eligible for the school voucher program in Toledo. To be eligible for the
DCOSP, one’s family income must be below 185 percent of the federal poverty level, about
$36,000 in 2012 (Wolf et al., 2013).9
Without any source of financial assistance, students from resource-constrained households are
more likely to enroll in public schools than families with more resources. Thus, if programs
expand to include families with higher income, then the rate of switching will likely decrease. As
programs continue to be introduced and expanded, more research will be needed to study the
effects of program design on switching.
9 This estimate is equivalent to about $40,000 in 2019 USD. (Bureau of Labor Statistics, Inflation Calculator, accessed 5/21/2019 at https://data.bls.gov/cgi-bin/cpicalc.pl)
22
Assumptions about switcher rates used in other fiscal analyses are well below the range of
switcher rates that were actually observed in random assignment studies, suggesting that some
estimates of net fiscal effects may be significantly understated. For example, the Iowa
Department of Revenue conducted an analysis to estimate the fiscal impact of Iowa’s School
Tuition Organization Tax Credit Program (Girardi & Gullickson, 2017). The analysis generates
estimates based on a 30 percent switcher rate. It also estimated a break-even switcher rate of 15
percent. Students from households with income below 300 percent of the federal poverty limit
are eligible to participate in the program. Although this income threshold is higher than many of
the other programs examined by random assignment studies, the differences aren’t great and
likely do not justify a switcher rate that is about one-third the rates actually observed in random
assignment studies.
Lueken (2018b) used a very broad range of switcher rates, from 60 percent to 90 percent, to
generate estimates for the fiscal effects of tax-credit scholarship programs. Evidence from
random assignment studies summarized in the present paper suggests that true switcher rates are
closer to the high-end assumed rates. This evidence also runs contrary to criticisms by Huerta
and Koutsavlis (2017), who argued that “due to an over-estimate of ‘switchers’… the calculated
savings are inflated” (p. 3) without providing any evidence to support their argument. Evidence
from random assignment studies suggest that low-end estimates of fiscal effects reported by
Lueken are significantly understated.
Conclusion
Analysts do not observe what sector school students would be enrolled (public or private) if the
choice program did not exist. Even with good data collection by states or scholarship
organizations, estimating switcher rates pose a challenge for analysts and may be biased. This
paper summarizes data from random assignment studies to infer the extent to which students
participating in private school choice programs are likely to enroll in public schools without
these programs in place. Data from studies employing random assignment methods provide
unbiased estimates of this counterfactual because they allow us to observe what type of school
students enrolled in after they applied for a program and were denied a scholarship enroll.

23
Obtaining reliable estimates for switchers is important for fiscal analyses of choice programs, as
estimates for the fiscal impact of a choice program are sensitive to this factor.
I reviewed 22 studies that used random assignment to evaluate private school choice programs in
the United States and identified 27 unique estimates of switcher rates from nine studies of six
private school choice programs that observed switcher rates for students who lost random
assignment lotteries. Overall, switcher rates in these programs range from 79 percent to 98
percent. The weighted average is 91 percent, and the median is 90 percent. Switcher rates were
similar for African American students participating in three privately funded school choice
programs (New York City, Dayton, and Washington, D.C.), where the weighted average is 93
percent and median is 94 percent. Switcher rates used in some analyses of the fiscal effects of
private school choice programs are well below the range of switcher rates observed in the body
of random assignment studies, suggesting their estimates of net fiscal effects are significantly
understated. Because switcher rates observed in the random assignment studies reviewed in this
paper are remarkably stable across time and states, they provide reliable information for analysts
to infer switcher rates when doing fiscal analyses elsewhere.

24
References
Atila Abdulkadiroglu, Parag A. Pathak, and Christopher R. Walters (2018). Free to Choose: Can
School Choice Reduce Student Achievement? American Economic Journal: Applied
Economics, 10(1), pp. 175– 206. https://dx.doi.org/10.1257/app.20160634
Eric Bettinger and Robert Slonim (2006). Using Experimental Economics to Measure the Effects
of a Natural Educational Experiment on Altruism. Journal of Public Economics, 90(8–9),
pp. 1625–1648. https://dx.doi.org/10.1016/j.jpubeco.2005.10.006
Robert Buschman and David L. Sjoquist (2014). Georgia’s tax credit scholarship program
(Report No. 268). Retreived from https://coles.kennesaw.edu/education-economics-
center/docs/Critique-of-FRC-Fiscal-Analysis-document-1.pdf
Thomas D. Cook and M. R. Payne(2002). Objecting to the objections to using random
assignment in educational research. In F. Mosteller & R. Boruch (Eds.), Evidence
matters: Randomized trials in education research (pp. 150–178). Washington, DC:
Brookings.
Robert M. Costrell (2010). The Fiscal Impact of the Milwaukee Parental Choice Program: 2010-
2011 Update and Policy Options (SCDP Milwaukee Evaluation Report 22). Retrieved
from University of Arkansas Department of Education Reform website:
http://www.uaedreform.org/downloads/2011/03/report-22-the-fiscal-impact-of-the-
milwaukee-parental-choice-program-2010-2011-update-and-policy-options.pdf
Robert M. Costrell (2008). The Fiscal Impact of the Milwaukee Parental Choice Program in
Milwaukee and Wisconsin, 1993-2008 (SCDP Milwaukee Evaluation Report 2).
Retrieved from University of Arkansas Department of Education Reform website:
http://www.uaedreform.org/downloads/2008/02/report-2-the-fiscal-impact-of-the-
milwaukee-parental-choice-program-in-milwaukee-and-wisconsin-1993-2008.pdf
Carrie Lips and Jennifer Jacoby (2001). The Arizona scholarship tax credit, giving parents
choices, saving taxpayers money (Policy Analysis No. 414). Retrieved from Cato
Institute website: https://www.cato.org/publications/policy-analysis/arizona-scholarship-
tax-credit-giving-parents-choices-saving-taxpayers-money
Mark Dynarski, Ning Rui, Ann Webber, and Babette Gutmann (2018). Evaluation of the DC
Opportunity Scholarship Program: Impacts Two Years After Students Applied (NCEE
25
2018-4010). Retrieved from Institute of Education Sciences website:
https://ies.ed.gov/ncee/pubs/20184010/pdf/20184010.pdf
Mark Dynarski, Ning Rui, Ann Webber, and Babette Gutmann (2017). Evaluation of the DC
Opportunity Scholarship Program: Impacts After One Year (NCEE 2017-4022).
Retrieved from Institute of Education Sciences website:
https://ies.ed.gov/ncee/pubs/20174022/pdf/20174022.pdf
Anthony G. Girardi and Angela Gullickson (2017). Iowa’s School Tuition Organization Tax
Credits Program Evaluation Study. Retrieved from Iowa Department of Revenue
website:
https://tax.iowa.gov/sites/files/idr/2017%20STO%20Tax%20Credit%20Evaluation%20St
udy%20%281%29.pdf
Luis A. Huerta and Steven Koutsavlis (2017). NEPC Review: The Tax-Credit Scholarship Audit:
Do Publicly Funded Private School Choice Programs Save Money? Retrieved from
National Education Policy Center website:
https://nepc.colorado.edu/sites/default/files/reviews/TTR%20Huerta%20Tax%20Credits_
2.pdf
Martin F. Lueken (2018a). Fiscal Effects of School Vouchers: Examining the Savings and Costs
of America’s Private School Voucher Programs. Retrieved from EdChoice website:
https://www.edchoice.org/wp-content/uploads/2018/09/Fiscal-Effects-of-School-
Vouchers-by-Martin-Lueken.pdf
Martin F. Lueken (2018b). The Fiscal Effects of Tax-Credit Scholarship Programs in the United
States. Journal of School Choice, 12(2), pp. 181–215.
https://dx.doi.org/10.1080/15582159.2018.1447725
William G. Howell and Paul E. Peterson (2002). The Education Gap: Vouchers and Urban
Schools, Brookings Institution Press. Retrieved from
https://www.jstor.org/stable/10.7864/j.ctt128086
William G. Howell, Patrick J. Wolf, David E. Campbell, and Paul E. Peterson (2002). School
Vouchers and Academic Performance: Results from Three Randomized Field Trials.
Journal of Policy Analysis and Management, 21(2), pp. 191–217.
https://dx.doi.org/10.1002/pam.10023

26
Jonathan N. Mills and Patrick J. Wolf (2019). The Effects of the Louisiana Scholarship Program
on Student Achievement After Four Years (Louisiana Scholarship Program Evaluation
Report 10), University of Arkansas, EDRE Working Paper No. 2019-10.
https://dx.doi.org/10.2139/ssrn.3376230
Office of Program Policy Analysis and Government Accountability (2010). Florida Tax Credit
Scholarship Program Fiscal Year 2008-09 Fiscal Impact. Retrieved from
http://www.oppaga.state.fl.us/MonitorDocs/Reports/pdf/0868_1rpt.pdf
Office of Program Policy Analysis and Government Accountability (2008). The Corporate Tax
Credit Scholarship Program Saves State Dollars (Report 08-68). Retrieved from
http://www.oppaga.state.fl.us/reports/pdf/0868rpt.pdf
Cecilia E. Rouse (1998). Private School Vouchers and Student Achievement: An Evaluation of
the Milwaukee Parental Choice Program. Quarterly Journal of Economics, 113(2), pp.
553–602. https://dx.doi.org/10.1162/003355398555685
Julie R. Trivitt and Corey A. DeAngelis (2016). The Fiscal Effect of Eliminating the Louisiana
Scholarship Program on State Education Expenditures (EDRE Working Paper 2016-06).
https://dx.doi.org/10.2139/ssrn.2768956
Ann Webber, Ning Rui, Roberta Garrison-Mogren, Robert B. Olsen, and Babette Gutmann
(2019). Evaluation of the DC Opportunity Scholarship Program: Impacts Three Years
After Students Applied. Technical Appendix (NCEE 2019-4006). Washington, DC:
National Center for Education Evaluation and Regional Assistance, Institute of Education
Sciences, U.S. Department of Education Retrieved from Institute of Education Sciences
website: https://ies.ed.gov/ncee/pubs/20194006/pdf/20194006_Technical_Appendix.pdf
Patrick J. Wolf, Brian Kisida, Babette Gutmann, Michael Puma, Nada Eissa, and Lou Rizo
(2013). School Vouchers and Student Outcomes: Experimental Evidence from
Washington, D.C. Journal of Policy Analysis and Management, 32(2), pp. 246–270.
https://dx.doi.org/10.1002/pam.21691
Patrick Wolf, Babette Gutmann, Michael Puma, Brian Kisida, Lou Rizzo, and Nada Eissa
(2009). Evaluation of the DC Opportunity Scholarship Program: Impacts After Three
Years (NCEE 2009-4050). Retrieved from Institute of Education Sciences website:
https://ies.ed.gov/ncee/pubs/20094050/pdf/20094050.pdf
27
Patrick Wolf, Babette Gutmann, Michael Puma, Brian Kisida, Lou Rizzo, and Nada Eissa
(2008). Evaluation of the DC Opportunity Scholarship Program: Impacts After Two
Years (NCEE 2008-4023). Retrieved from Institute of Education Sciences website:
https://ies.ed.gov/ncee/pdf/20084023.pdf

28
About the Author Martin Lueken is the director of fiscal policy and analysis at EdChoice, where he
focuses on research and analysis of issues that pertain to school choice bills, current programs, and school funding. His work includes providing expert support and advice for policy makers in helping understand the fiscal impact of current school choice programs and potential fiscal effects of programs introduced in state legislatures. Marty received his doctorate in Education Policy from the University of Arkansas and master’s degree in Economics from the University of Missouri. He holds a bachelor’s degree in Physical Education, with an emphasis in sports medicine, from Eastern Illinois University.
Acknowledgments This manuscript benefited from very helpful feedback from Corey DeAngelis and
Benjamin Scafidi. Paul DiPerna provided useful comments and guidance. Any errors are the author’s.