Embed Size (px)
Citation preview

Remittances and their Macroeconomic Impact: Evidence from Africa
Mthuli Ncube and Zuzana Brixiova
No 188 – November 2013
Correct citation: Ncube, M. and Brixiova, Z. (2013), Remittances and Their Macroeconomic Impact:
Evidence From Africa, Working Paper Series N° 188 African Development Bank, Tunis, Tunisia.
Steve Kayizzi-Mugerwa (Chair) Anyanwu, John C. Faye, Issa Ngaruko, Floribert Shimeles, Abebe Salami, Adeleke Verdier-Chouchane, Audrey
Coordinator
Working Papers are available online at
http:/www.afdb.org/
Copyright © 2013
African Development Bank
Angle de l’avenue du Ghana et des rues
Pierre de Coubertin et Hédi Nouira
BP 323 -1002 TUNIS Belvédère (Tunisia)
Tel: +216 71 333 511
Fax: +216 71 351 933
E-mail: [email protected]
Salami, Adeleke
Editorial Committee Rights and Permissions
All rights reserved.
The text and data in this publication may be
reproduced as long as the source is cited.
Reproduction for commercial purposes is
forbidden.
The Working Paper Series (WPS) is produced
by the Development Research Department
of the African Development Bank. The WPS
disseminates the findings of work in progress,
preliminary research results, and development
experience and lessons, to encourage the
exchange of ideas and innovative thinking
among researchers, development
practitioners, policy makers, and donors. The
findings, interpretations, and conclusions
expressed in the Bank’s WPS are entirely
those of the author(s) and do not necessarily
represent the view of the African Development
Bank, its Board of Directors, or the countries
they represent.

Remittances and Their Macroeconomic Impact:
Evidence from Africa
Mthuli Ncube1 and Zuzana Brixiova2 3
1 Chief Economist and Vice President of the African Development Bank. E-mail address: [email protected] .
2 Advisor to the Chief Economist and Vice President of the African Development Bank. E-mail address: [email protected] . 3 The authors are especially thankful to Qingwei Meng for quantitative inputs and helpful comments. They also thank Basil Jones and
Zorobabel Bicaba for insightful discussions. The views expressed are those of the authors and do not necessarily reflect those of the
African Development Bank.
AFRICAN DEVELOPMENT BANK GROUP
Working Paper No. 188
November 2013
Office of the Chief Economist

Abstract
This paper examines macroeconomic
trends, drivers and impact of remittances in
Africa. First, it documents the increasing
share of remittances relative to other
foreign capital flows to Africa, distribution
of remittance inflows across countries, and
some key properties. This is followed by
some analysis of the macroeconomic drivers
of remittances in recipient countries, such as
the level of income, inflation and nominal
exchange rate depreciation. Specifically,
remittances are positively impacted by
higher income, but deterred by an unstable
macroeconomic environment, pointing to
the investment motive in remitting to
Africa. The paper also examines the role of
remittances in funding Africa’s external
balances. Finally, drawing on the case of
Egypt, the paper shows the positive impact
that rising remittances can have on public
debt sustainability.
Keywords: African economies, remittances, savings, external balances, debt
sustainability
JEL classification: E2, O1, F24, F34

1
I. Introduction
After decades of slow pace, Africa’s growth accelerated during 2000–12. Currently, the continent is
one of the fastest growing in the world. Concomitant with the growth take-off were changes in net
private capital inflows, especially FDI, and remittances: FDI and remittance inflows tripled during
2000–08 and continue to outperform official aid in the aftermath of the global financial crisis. This
high growth as well as rising FDI and remittance inflows, in addition to debt relief, contributed to
reducing Africa’s debt burden. In contrast to the late 1990s, many African countries today are thus
characterized by low or moderate risk of debt distress. Besides favourable external conditions,
improved macroeconomic policies and the business environment in Africa contributed to these positive
developments.
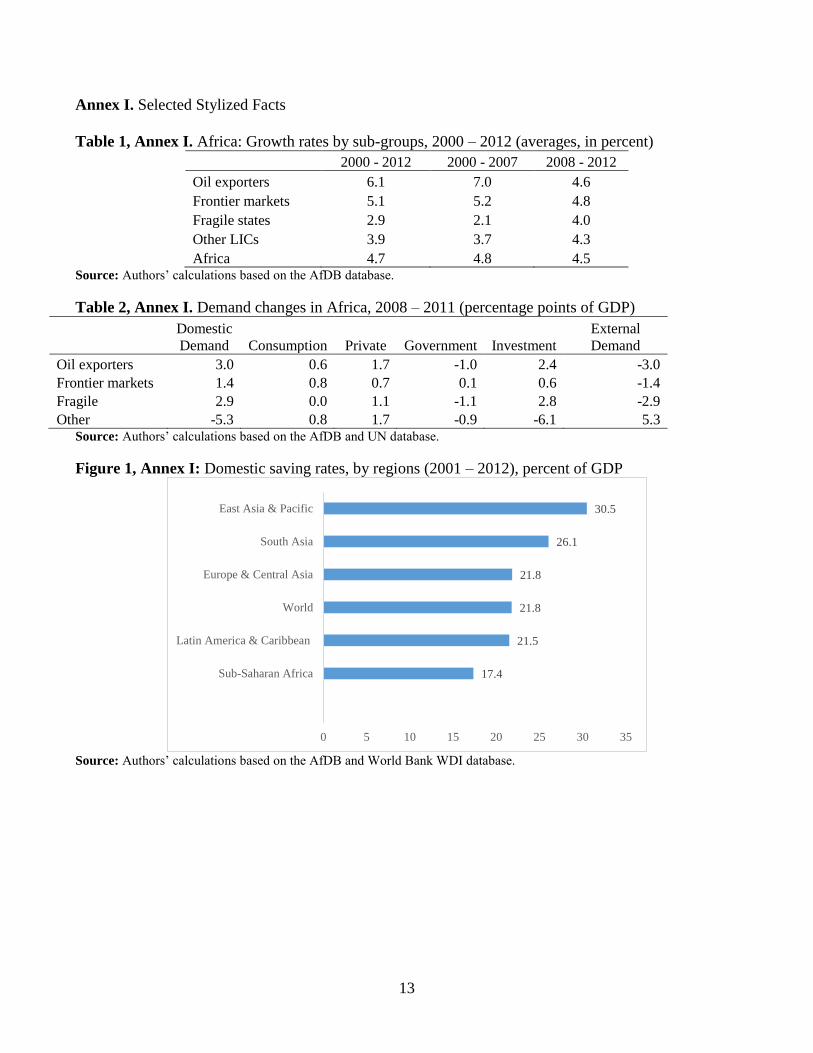
While Africa’s growth has been broad-based – with more than 60 percent of countries growing on
average at 4 percent or more a year during 2000 - 2012 – marked differences have emerged across sub-
groups and countries (AfDB et al., 2013 and Table 1, Annex I). The drivers of growth also varied. For
example, during the post-crisis recovery, growth in oil exporters, frontier markets, and fragile states
was mostly due to domestic demand, especially private consumption and investment (Table 2, Annex
I). In contrast, the external demand drove growth in these groups in the past as well as in other low
income countries after the crisis. The increased role of domestic demand together with rising
remittances thus points to likely contribution of these transfers to Africa’s recovery.
Remittances are typically defined as unrequited, nonmarket financial transfers between individuals
living in different countries, mostly associated with migration (Chami et al. 2008; Barbone et al., 2012
and others).4 Over the past decade, remittances sent to Africa and developing countries through formal
channels grew rapidly, driven by increased migration and reduced transaction costs. Currently,
remittances are the largest international flow of financial resources to Africa (AfDB et al., 2013). They
are often ‘finance of the last resort’ in low income countries and a source of financial diversification in
middle income ones (Julca, 2012). Official figures are far from capturing the full remittance volume –
unrecorded remittances, sent to the continent informally, are estimated to amount to up to 75 percent of
the recorded flows – above the global ratio (Freund and Spatafora, 2005; Gupta, Pattillo and Wangh,
2007 and 2009).
The increased financial weight of remittances in external flows to Africa and the positive role that
remittances can play in Africa’s development have brought about heightened attention to the topic
among policymakers. Still, Africa has received limited attention in the recent literature on remittances,
probably because of its relatively small – albeit rising – share in global remittances received. Research
on the macroeconomic aspects of remittance inflow has been particularly sparse, creating a gap in the
literature. Yet for Africa’s policymakers, understanding determinants and impact of this source of
foreign exchange and income is key for bringing their countries on a path of high and inclusive growth.
This paper contributes to closing this knowledge gap and adds to the growing stream of literature on
remittances and development by (i) highlighting the recent macroeconomic trends, properties, and
determinants of remittance inflows to Africa; (ii) pointing out the role that remittances can play in
4 Since 2009, the IMF balance of payment records remittances as: (i) compensations of employees; that is the gross earnings
of workers residing abroad for less than 12 months, including the value of in-kind benefits; and (ii) personal transfers, which
are the value of monetary transfers sent home by workers residing abroad for more than one year. The income of short‐term
migrants (abroad for less than 12 months) is included in the definition.
2
closing resource gap in Africa; and (iii) analysing the impact of remittances on debt sustainability in a
selected African country (Egypt). By focusing on external balance and debt sustainability aspects of
remittances, the paper complements the literature on the impact of remittances on income distribution
and poverty reduction.
The rest of the paper is organized as follows. After this Introduction, Section II examined trend,
properties and macroeconomic determinants of remittances to Africa. Section III examines impact of
remittances on external balance and debt sustainability. Section IV concludes with policy
recommendations.
II. Remittances to Africa: Trends, Properties and Macroeconomic Determinants
1. Trends
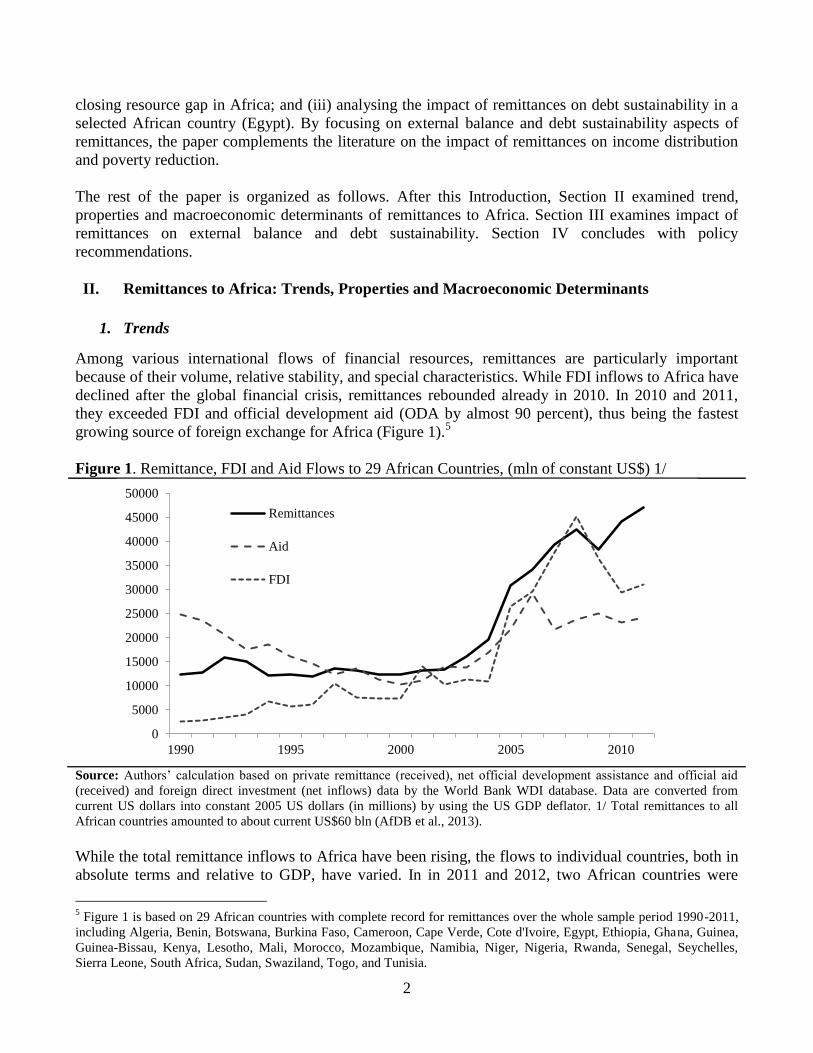
Among various international flows of financial resources, remittances are particularly important
because of their volume, relative stability, and special characteristics. While FDI inflows to Africa have
declined after the global financial crisis, remittances rebounded already in 2010. In 2010 and 2011,
they exceeded FDI and official development aid (ODA by almost 90 percent), thus being the fastest
growing source of foreign exchange for Africa (Figure 1).5
Figure 1. Remittance, FDI and Aid Flows to 29 African Countries, (mln of constant US$) 1/
Source: Authors’ calculation based on private remittance (received), net official development assistance and official aid
(received) and foreign direct investment (net inflows) data by the World Bank WDI database. Data are converted from
current US dollars into constant 2005 US dollars (in millions) by using the US GDP deflator. 1/ Total remittances to all
African countries amounted to about current US$60 bln (AfDB et al., 2013).
While the total remittance inflows to Africa have been rising, the flows to individual countries, both in
absolute terms and relative to GDP, have varied. In in 2011 and 2012, two African countries were
5 Figure 1 is based on 29 African countries with complete record for remittances over the whole sample period 1990-2011,
including Algeria, Benin, Botswana, Burkina Faso, Cameroon, Cape Verde, Cote d'Ivoire, Egypt, Ethiopia, Ghana, Guinea,
Guinea-Bissau, Kenya, Lesotho, Mali, Morocco, Mozambique, Namibia, Niger, Nigeria, Rwanda, Senegal, Seychelles,
Sierra Leone, South Africa, Sudan, Swaziland, Togo, and Tunisia.
0
5000
10000
15000
20000
25000
30000
35000
40000
45000
50000
1990 1995 2000 2005 2010
Remittances
Aid
FDI

3
among the top ten remittance recipients globally: Nigeria ($20.6 and $21 bln, respectively) and Egypt
($14.3 and $21 bln, respectively). Regionally, almost 60 percent of remittances sent to Africa went to
North African countries, especially Egypt and Morocco. Within sub-Saharan Africa, Western Africa
(Nigeria in particular) received most of the remaining remittance flows to the continent. Nigeria and
Egypt together accounted for almost two thirds of all private remittances received in Africa in 2011.6
When measured in terms of size of the economy, Liberia (with remittances amounting to 23 and 31
percent of GDP in 2011 and 2012, respectively) and Lesotho (26 and 27 percent of GDP) were among
top ten receiving countries globally (World Bank, 2012). While volumes and shares for other countries
may not be as striking, they are still substantial. Among 29 countries in our panel, 8 received formal
remittances amounting to 5 percent of GDP in the run up to the global financial crisis, while 9 countries
received these amounts after the crisis (Figure 2).
Figure 2. Top Ten Recipients of Remittances in Africa
Average for 2000-2007 Average for 2008-2011
Panel A. Total Remittances Received (millions of constant US dollars)
Panel B. Total Remittances Received to GDP Ratio (%)
Source: Authors’ calculation based on personal remittance (received) data provided by the World Bank WDI database.
Remittances are converted from current into constant 2005 US dollars by using the US GDP deflator. Note: While data for
Liberia are not available for the entire period, the remittances received by the country in 2012 amounted to 31 percent of
GDP (World Bank, 2012).
6 Authors’ calculations based on WDI database as of September 2013 and World Bank (2012).
507
555
560
622
954
1,146
1,295
4,193
4,195
6,900
0 2,000 4,000 6,000 8,000
South Africa
Lesotho
Kenya
Senegal
Algeria
Sudan
Tunisia
Egypt
Morocco
Nigeria
413
538
658
873
1,307
1,810
1,833
6,064
9,600
17,622
0 5,000 10,000 15,000 20,000
Mali
Lesotho
Kenya
South Africa
Senegal
Tunisia
Sudan
Morocco
Egypt
Nigeria
4.2
4.4
5.2
5.2
5.9
7.7
7.8
8.0
13.3 51.6
0.0 20.0 40.0 60.0
Egypt
Tunisia
Guinea-Bissau
Sudan
Nigeria
Morocco
Senegal
Togo
Cape Verde
Lesotho
4.5
4.9
5.2
5.5
7.3
8.9
9.3
10.2
10.8
30.2
0 10 20 30 40
Tunisia
Mali
Egypt
Guinea-Bissau
Morocco
Cape Verde
Nigeria
Togo
Senegal
Lesotho

4
2. Properties
Remittances are less volatile source of foreign exchange than FDI and other private capital flows. This
steadiness makes them suitable for longer-term development purposes such as securitization of future
flows and financial sector development (Ncube, 2013). When well utilized, they can also positively
influence credit ratings. Further, remittances are less pro-cyclical than FDI (Figure 3), even though they
can transmit shocks – especially in downturns – from sending to receiving countries (Abdih et al., 2012
and Barajas et al., 2012).7
The rapid increase and low volatility of remittance inflows to the continent notwithstanding, Africa’s
full potential to attract formal remittances has not been fully tapped. For example, the share of Africa in
global remittances received has remained unchanged since 2000, amounting to only about 8 percent of
the global flows – below 12 percent of the continent’s share in world population. Still, Africa’s shares
of remittances received are higher than the shares of capital flows and FDI flows to Africa in the total
flows to developing countries. Specifically, during 2000 - 11; capital flows and FDI to Africa
amounted to 8 and 10 percent of total flows to developing and transition countries, respectively. This
was below 14 percent Africa’s share in remittances received by developing and transition countries
(Blanke et al., 2011 and UNCTAD 2013 database).
Figure 3. Volatility and Cyclicality of External Flows to Africa, 1990 - 2011
Panel A. GDP-weighted Average of Coefficients of Variation across Countries
Panel B. GDP-weighted Average of Correlation Coefficients
between External Flows and GDP
Source: Authors’ calculation based on personal remittance (received), ODA and foreign direct investment (net inflows)
data from the World Bank WDI database. Data are converted from current US dollars into constant 2005 US dollars (in
millions) by using the US GDP deflator. Note: Volatility of external flows to Africa is measured by the coefficient of
variation for each indicator by country. Cyclicality of external flows is measured by the correlation coefficients between
each indicator and GDP by country. The coefficients of variation for each indicator are averaged across all sample countries
with weights.
7 As Chami et al. (2008) and Vargas-Silva (2008) show, the cyclicality properties of remittances vary with different types of
these flows. Here we use the IMF and the World Bank definition adopted in 2009.
0.0
0.2
0.4
0.6
0.8
1.0
1.2
1990-2011 1990-1999 2000-2011
Remittances Aid FDI
-0.2
-0.1
0.0
0.1
0.2
0.3
0.4
0.5
0.6
0.7
0.8
1990-2011 1990-1999 2000-2011
Remittances Aid FDI

5
In Africa, as elsewhere, development potential of remittances has so far not been fully utilized.
Household surveys indicate that remittances are used mostly for basic consumption (Gupta et al., 2007;
IOM, 2010). While this contributes to poverty reduction (Adams and Page, 2005),8 the impact on
building sustainable livelihoods is less clear. As households often allocate only marginal amounts to
savings or investment in human and productive capital, more needs to be done so that remittances can
contribute effectively to inclusive growth and development. By smoothing consumption, remittances
may also reduce government incentives to collect revenues and establish social protection systems
against income shocks and poverty.
On a positive side, since remittances in Africa have been spent mostly on consumption (both domestic
and imported), they have likely contributed to the increased domestic demand and Africa’s growth
recovery from the global financial crisis.9 Remittances have been also shown to impact other
macroeconomic outcomes beyond income distribution and consumption, including real exchange and
external balance. The role of remittances in debt sustainability through broadened tax base, in fiscal
consolidation and as a buffer against food prices shocks has also been studied (Gnangnon, 2014;
Combes et al., 2014).
3. Macroeconomic Determinants
In light of the importance of remittance inflows for African economies, policy makers need to
understand domestic factors that drive these inflows so they can create enabling framework conditions
for attracting and utilizing them. Yet so far, no comprehensive theory of remittance determinants has
been developed (Stark, 1991; Chami et al., 2008). Drivers of remittance inflows are complex and
combine factors from both sending and receiving countries. Moreover, factors in receiving countries
can be grouped further into micro-factors and macro-factors. Given this complexity, most studies have
so far provided only partial explanation and have been confined to particular geographical or socio-
cultural areas (OECD, 2006). The macroeconomic drivers of remittances to Africa have been
particularly understudied.
Below, we therefore examine empirically the key macroeconomic factors driving remittances from the
perspective of receiving countries in Africa during 1990 - 2011. Specifically, we look at the following
variables as potential drivers of remittance inflows: (i) GDP per capita in OECD countries; (ii)
domestic GDP; (iii) inflation in remittance-receiving African countries and (iv) nominal exchange rate
depreciation in remittance-receiving African countries. Drawing on El-Sakka (2004), we use the
following general approach to study the macroeconomic determinants of remittances received by
African countries:10
),( 21 FFfRt (1)
8 Adams and Page (2005) found that a 10 percent increase in remittances from abroad per capita will lead to a 3.5 percent
decline in the share of people living in poverty. 9 This is consistent with findings in the literature that remittances tend to help the recipients maintain a higher level of
consumption during economic adversity (Chami, Hakura, and Montiel, 2012). 10
Micro approaches to remittance inflows look into various socio-economic factors including age, gender, education,
marital status, wage levels, per capita consumption of remitters and heads of households left at home.

6
where tR is the level of remittances received by African countries at time t, 1F denotes the non-policy
variables set (e.g., income level in both sending and receiving country), and 2F denotes the policy
variables set (e.g., inflation, exchange rate depreciation).11
Among non-policy variables, income levels in the host countries are expected to positively impact the
remittance flows to Africa. However, the level of income in the receiving country could have either a
positive or a negative impact on the inflows of remittances, depending on motives behind their
sending. Under the ‘altruistic motive’, the remittance inflows would rise with lower per capita income.
If ‘investment’ or ‘portfolio management’ motives prevail, inflows would increase with higher per
capita income. Since remittances to the home country depend also on last year’s incomes, lagged GDPs
are also included in regressions.
Among policy variables inflation would impact remittance flows positively under the altruistic motive
and negatively under the investment motive, as senders would be hesitant to send remittances to
countries with unstable macroeconomic environments. Regarding exchange rate depreciation,
remittance inflows would be impacted negatively under both altruistic and investment motives. With
depreciation of local currency, remitters would send less cash under the altruistic motive because of the
increased purchasing power of their foreign currency—denominated remittances. They would send
fewer remittances even when motivated by investment possibilities, since depreciation may reflect
weaknesses in macroeconomic policies.
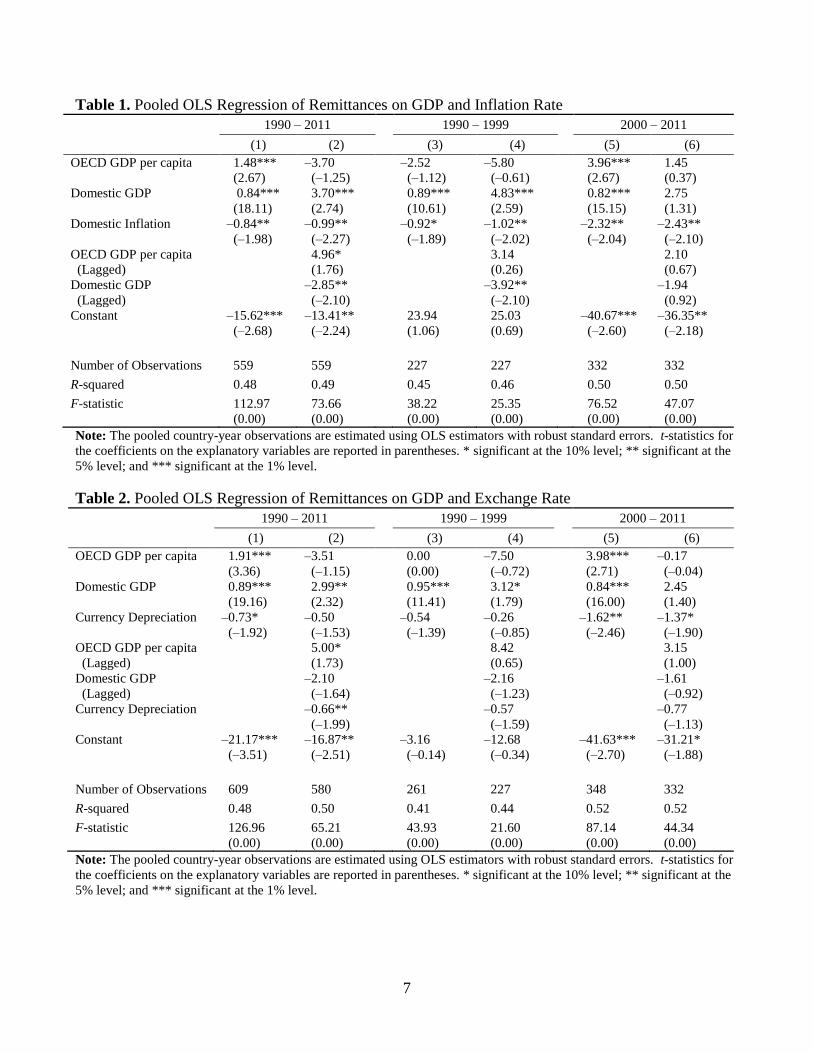
Results of our pooled OLS regressions in Tables 1 and 2 point to a statistically significant positive
relationship between the level of income in receiving African countries and the remittance inflows.
Specifically, the volume of remittances through formal channels increases with higher income and vice
versa. This, by itself, would indicate that the majority of remittance flows to Africa are for investment
purposes rather than family support, as rising income indicates higher rates of return. However, it is
also likely that countries with lower income receive a higher share of remittances via informal
channels, in part because of less developed financial markets. Hence higher economic growth is
conducive both for domestic mobilization of resources and for attracting foreign capital and capital-like
flows, including remittances. In turn, these inflows are beneficial for external and fiscal balances, thus
contributing to closing resource gaps (below).
Since migrants are sensitive to failures of macroeconomic policies, inflation and depreciation of
nominal exchange rate have significant, but negative, impact on formal remittances. Inflation in
particular seems to repel all forms of foreign capital, including remittances (Tables 1 and 2). Stable
macroeconomic environment and consistent policies are thus essential for bringing in not only capital,
but also remittance inflows. The role of remittances as a source of external balance funding, savings
and investment is elaborated below.
11
These variables are defined as follows: (i) remittances are defined as logarithm of total personal remittances received in
2005 US$; (ii) OECD GDP per capita is logarithm of average GDP per capita in OECD countries in 2005 US$; (iii)
domestic GDP is logarithm of domestic GDP in 2005 US$; (iv) domestic inflation is first difference of logarithms of
domestic CPI; and (v) exchange rate depreciation is first difference of logarithm of official exchange rate (local currency
per US$).
7
Table 1. Pooled OLS Regression of Remittances on GDP and Inflation Rate
1990 – 2011 1990 – 1999 2000 – 2011
(1) (2) (3) (4) (5) (6)
OECD GDP per capita 1.48***
(2.67)
–3.70
(–1.25)
–2.52
(–1.12)
–5.80
(–0.61)
3.96***
(2.67)
1.45
(0.37)
Domestic GDP 0.84***
(18.11)
3.70***
(2.74)
0.89***
(10.61)
4.83***
(2.59)
0.82***
(15.15)
2.75
(1.31)
Domestic Inflation –0.84**
(–1.98)
–0.99**
(–2.27)
–0.92*
(–1.89)
–1.02**
(–2.02)
–2.32**
(–2.04)
–2.43**
(–2.10)
OECD GDP per capita
(Lagged)
4.96*
(1.76)
3.14
(0.26)
2.10
(0.67)
Domestic GDP
(Lagged)
–2.85**
(–2.10)
–3.92**
(–2.10)
–1.94
(0.92)
Constant –15.62***
(–2.68)
–13.41**
(–2.24)
23.94
(1.06)
25.03
(0.69)
–40.67***
(–2.60)
–36.35**
(–2.18)
Number of Observations 559 559 227 227 332 332
R-squared 0.48 0.49 0.45 0.46 0.50 0.50
F-statistic 112.97
(0.00)
73.66
(0.00)
38.22
(0.00)
25.35
(0.00)
76.52
(0.00)
47.07
(0.00)
Note: The pooled country-year observations are estimated using OLS estimators with robust standard errors. t-statistics for
the coefficients on the explanatory variables are reported in parentheses. * significant at the 10% level; ** significant at the
5% level; and *** significant at the 1% level.
Table 2. Pooled OLS Regression of Remittances on GDP and Exchange Rate
1990 – 2011 1990 – 1999 2000 – 2011
(1) (2) (3) (4) (5) (6)
OECD GDP per capita 1.91***
(3.36)
–3.51
(–1.15)
0.00
(0.00)
–7.50
(–0.72)
3.98***
(2.71)
–0.17
(–0.04)
Domestic GDP 0.89***
(19.16)
2.99**
(2.32)
0.95***
(11.41)
3.12*
(1.79)
0.84***
(16.00)
2.45
(1.40)
Currency Depreciation –0.73*
(–1.92)
–0.50
(–1.53)
–0.54
(–1.39)
–0.26
(–0.85)
–1.62**
(–2.46)
–1.37*
(–1.90)
OECD GDP per capita
(Lagged)
5.00*
(1.73)
8.42
(0.65)
3.15
(1.00)
Domestic GDP
(Lagged)
–2.10
(–1.64)
–2.16
(–1.23)
–1.61
(–0.92)
Currency Depreciation –0.66**
(–1.99)
–0.57
(–1.59)
–0.77
(–1.13)
Constant –21.17***
(–3.51)
–16.87**
(–2.51)
–3.16
(–0.14)
–12.68
(–0.34)
–41.63***
(–2.70)
–31.21*
(–1.88)
Number of Observations 609 580 261 227 348 332
R-squared 0.48 0.50 0.41 0.44 0.52 0.52
F-statistic 126.96
(0.00)
65.21
(0.00)
43.93
(0.00)
21.60
(0.00)
87.14
(0.00)
44.34
(0.00)
Note: The pooled country-year observations are estimated using OLS estimators with robust standard errors. t-statistics for
the coefficients on the explanatory variables are reported in parentheses. * significant at the 10% level; ** significant at the
5% level; and *** significant at the 1% level.

8
III. Impact of Remittances on External Balance and Debt Sustainability
This section discusses the role of remittances as a source of funding of the external balances and, more
broadly, resource gaps of the African countries. It also illustrates the impact of remittances on public
debt sustainability for the case of Egypt, a country facing major public debt challenges while at the
same time receiving one of the largest – and rising – volumes of remittances in Africa in recent years.
Together, these perspectives illustrate some of the impacts that remittances can have on key
macroeconomic variables such as trade and current account balance, savings, investment, and public
debt sustainability.
1. Remittances and the Aggregate Resource Gap
Given that African countries are predominantly small open economies, crucial interactions occur
between the domestic economies, the continent, as well as country groups and the rest of the world.
International trade plays particularly important part in these interactions. By contributing to funding of
the trade balance, remittances reduce current account deficits and the need for external borrowing.
They also raise the low savings rate prevailing across Africa.
The relation between real domestic economy and the rest of the world through trade balance can be
described as:
MXTBISd (2)
where MXICGDPSd is domestic saving, that is gross domestic product net of
consumption; I is investment and MXTB is trade balance, defined as exports of goods and
services less imports. Modifying (2) so that Africa, its sub-regions or countries are linked to the rest of
the world through the current account balance yields:
ff TRYMXCABIS (3)
where S is national savings, which comprises domestic savings dS , net foreign factor income fY , and
net foreign transfers fTR . Financing sources of domestic investment I consist of national savings S
(including net foreign unrequited transfers and factor income) and net capital flows, which comprise
foreign direct investment (FDI), portfolio equity investment and borrowing as recorded in the
countries’ capital and financial accounts. The trade deficit, TD, is financed by the sum of capital flows,
KAB, net foreign transfers fTR , including remittances, net foreign factor income fY , and the change in
foreign reserves:12
RTRYKABTD ff (4)
Equations (2) – (4) form a basis of Table 4, which traces domestic savings, investment, remittances,
capital and other flows, and changes in reserves in Africa over time, and compares them with those in
developing Asia. Table 3 highlights the rising role of remittances in national savings and as a source of
external (trade) balance financing. It shows that remittances are an important source of financing for
12
In (4), an increase in foreign reserves is recorded as negative .R

9
the trade balance. In fact in the period during and after the global financial crisis, average volumes of
remittances exceeded all capital flows combined, not only its individual parts such as FDI or ODA.13
Recent research has reiterated the importance of high savings and investment rates for growth
(Commission on Growth and Development, 2008).14
However, except for oil exporters and some non-
oil resource-rich countries (e.g. Botswana), many sub-Saharan Africa countries post low domestic
savings rates, especially in comparison to developing Asia (Table 3 and Figure 1, Annex I). The rise in
savings rates in sub-Saharan Africa before the crisis notwithstanding, the rates were still almost 10
percentage points of GDP below the average of emerging and developing economies in 2008. Because
of the low domestic savings rates, underdeveloped domestic financial sectors and limited access to
international capital markets, Africa’s investment depends on attracting foreign savings and capital.
Ensuing low investment rates raise questions about sustainability of Africa’s growth.
Table 3. Savings, Investment, External Balances and Remittances, % of GDP
Sub-Saharan Africa 1990 - 1999 2000 - 2007 2008 - 2011 1990 - 2011
Domestic savings 1/ 15.8 17.6 17.1
16.7
Investment 17.0 17.1 20.0
17.5
Trade balance -1.2 0.5 -2.9
-0.9
Remittances 1.0 2.3 2.9
1.8
Factor income and other transfers -2.1 -3.3 -1.5
-2.5
Capital flows 2/ 3.0 2.7 2.2
2.7
Change in reserves -0.7 -2.2 -0.6 -1.2
Developing Asia 1990 - 1999 2000 - 2007 2008 - 2011 1990 - 2011
Domestic savings 1/ 38.2 40.8 46.7
40.7
Investment 36.7 36.2 41.8
37.4
Trade balance 1.5 4.6 4.8
3.3
Remittances 0.7 1.2 1.0
0.9
Other factor income and transfers -2.6 -2.4 -2.4
-2.5
Capital flows 2/ 2.2 2.2 2.3
2.2
Change in reserves -1.8 -5.6 -5.7 -3.9 Source: Authors’ calculations based on the AfDB, IMF and World Bank databases. 1/ Domestic savings rates, excluding
international transfers and factor income. 2/ Includes errors and omissions.
Given the role of savings and remittances in growth of African economies, a related issue of concern to
policymakers is whether remittance inflows complement or crowd out domestic savings on the
continent. While the overall literature on the topic is abundant – and findings are mixed – research on
Africa is relatively scarce. Among exceptions is Balde (2011), who examines 37 sub-Saharan Africa
countries during 1980 – 2004 and finds a strong positive relation between remittances, foreign aid and
13
Some of the offsetting impacts that contribute to widening trade and current account balances may be the increased
imports financed from remittances and appreciation of real exchange rate. At the same time, remittances lower probability
of current account reversals (Bugamelli and Paterno, 2009). 14
The report found that high national savings rates – around 20-25 percent of GDP or above -- were associated with high
and sustained growth, pointing out that foreign savings (capital flows) are an imperfect substitute for national savings. Since
remittances can contribute to national savings, they can raise investment and growth.
10
domestic savings.15
Policies aimed at creating financial products that would bring remittances into
formal banking sectors are also likely to raise savings among the impacted households.
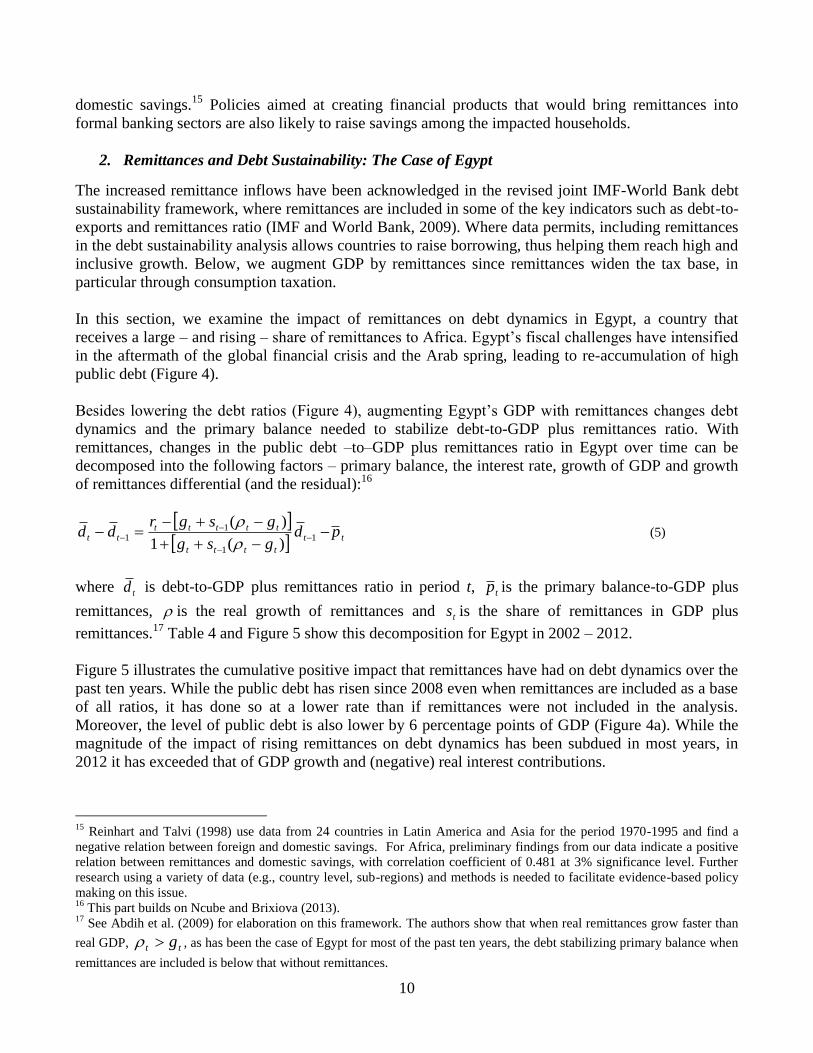
2. Remittances and Debt Sustainability: The Case of Egypt
The increased remittance inflows have been acknowledged in the revised joint IMF-World Bank debt
sustainability framework, where remittances are included in some of the key indicators such as debt-to-
exports and remittances ratio (IMF and World Bank, 2009). Where data permits, including remittances
in the debt sustainability analysis allows countries to raise borrowing, thus helping them reach high and
inclusive growth. Below, we augment GDP by remittances since remittances widen the tax base, in
particular through consumption taxation.
In this section, we examine the impact of remittances on debt dynamics in Egypt, a country that
receives a large – and rising – share of remittances to Africa. Egypt’s fiscal challenges have intensified
in the aftermath of the global financial crisis and the Arab spring, leading to re-accumulation of high
public debt (Figure 4).
Besides lowering the debt ratios (Figure 4), augmenting Egypt’s GDP with remittances changes debt
dynamics and the primary balance needed to stabilize debt-to-GDP plus remittances ratio. With
remittances, changes in the public debt –to–GDP plus remittances ratio in Egypt over time can be
decomposed into the following factors – primary balance, the interest rate, growth of GDP and growth
of remittances differential (and the residual):16
tt
tttt
ttttttt pd
gsg
gsgrdd
1
1
11
)(1
)(
(5)
where td is debt-to-GDP plus remittances ratio in period t, tp is the primary balance-to-GDP plus
remittances, is the real growth of remittances and ts is the share of remittances in GDP plus
remittances.17
Table 4 and Figure 5 show this decomposition for Egypt in 2002 – 2012.
Figure 5 illustrates the cumulative positive impact that remittances have had on debt dynamics over the
past ten years. While the public debt has risen since 2008 even when remittances are included as a base
of all ratios, it has done so at a lower rate than if remittances were not included in the analysis.
Moreover, the level of public debt is also lower by 6 percentage points of GDP (Figure 4a). While the
magnitude of the impact of rising remittances on debt dynamics has been subdued in most years, in
2012 it has exceeded that of GDP growth and (negative) real interest contributions.
15
Reinhart and Talvi (1998) use data from 24 countries in Latin America and Asia for the period 1970-1995 and find a
negative relation between foreign and domestic savings. For Africa, preliminary findings from our data indicate a positive
relation between remittances and domestic savings, with correlation coefficient of 0.481 at 3% significance level. Further
research using a variety of data (e.g., country level, sub-regions) and methods is needed to facilitate evidence-based policy
making on this issue. 16
This part builds on Ncube and Brixiova (2013). 17
See Abdih et al. (2009) for elaboration on this framework. The authors show that when real remittances grow faster than
real GDP, tt g , as has been the case of Egypt for most of the past ten years, the debt stabilizing primary balance when
remittances are included is below that without remittances.

11
Figure 4. Egypt: evolution of public debt, percent, 2002 – 2012
4a. Egypt: debt ratios 4b. Egypt: debt by type
Source: Authors’ calculations based on AfDB and IMF databases.
Figure 5. Egypt: Public debt–to-GDP + remittances dynamics, cumulative, 2002 – 2012
(% of GDP and remittances)
Source: Authors’ calculations based on AfDB and IMF databases.
It also needs to be underscored that Egypt’s debt-to-GDP ratio as well as debt-to-GDP plus remittances
ratio have risen during 2008 – 2012, rapid increase in remittances notwithstanding.18
For the most part,
this reflects weakening fiscal and overall macroeconomic stance. The example of Egypt thus also
illustrates that rising remittances can make an important contribution to a more sustainable debt path,
but cannot substitute for prudent fiscal and debt management policies. Clearly, putting Egypt’s debt on
18
Further, the country’s credit rating was downgraded in 2013.
65
70
75
80
85
90
95
100
105
debt-to-GDP ratio
debt-to-GDP plus remittances ratio
0
20
40
60
80
100
120
domestic debt-to-GDP plus remittances ratio
external debt-to-GDP plus remittances ratio
-70
-50
-30
-10
10
30
50
2003 2004 2005 2006 2007 2008 2009 2010 2011 2012
Other
Primary balance contribution
Real remittance contribution
Real GDP contribution
Real interest rate contribution
Change in public sector debt (as % of GDP and remittances)

12
sustainable footing will require fiscal adjustment. Nevertheless, such adjustment should be gradual so
as to avoid ‘austerity measures’ and further drop in real GDP growth and employment.
Table 4. Egypt: Change in public debt-to-GDP and remittances ratio,
% of GDP and remittances
2003 2004 2005 2006 2007 2008 2009 2010 2011 2012
Change in public sector debt 11.2 -1.4 0.5 -11.8 -10.3 -9.1 3.7 -1.1 3.0 1.9
Real interest rate contribution 1/ 0.0 -5.2 0.3 -0.3 -5.0 -4.2 -3.5 -1.6 -2.1 -1.0
Real GDP growth contribution -2.7 -3.9 -4.1 -6.3 -5.6 -5.1 -3.0 -3.4 -1.2 -1.5
Real remittance growth
contribution -0.2 -0.7 -1.6 0.5 -0.9 0.3 0.7 -1.9 -0.3 -1.9
Primary balance contribution 4.3 3.6 3.6 4.0 2.8 3.7 3.6 3.6 4.4 4.8
Other (incl. exchange rate) 9.7 4.7 2.4 -9.7 -1.7 -3.9 6.0 2.1 2.2 1.5
Source: Authors’ calculations based on AfDB and IMF databases. 1/ Estimates based on the IMF Country Report No. 10/94
IV. Conclusions and Policy Recommendations
In this paper, we have documented recent trends in remittance flows to Africa, their key
macroeconomic properties such as relatively low pro-cyclicality and volatility, and some of the
determinants in receiving countries, namely growth and stable macroeconomic environment. We have
then illustrated the rising role for remittances as a source of trade balance financing and their possible
positive impact on public debt sustainability. Our analysis has the following policy implications:
Since level of income seems to be an important determinant of remittances, policy makers
should strive to create environment conducive to growth. This will then increase inflows of
remittances and other foreign capital, including FDI, easing the pressures on external balance
financing.
However, African policymakers need to do more to leverage foreign savings into increased
overall saving and higher investment. This is particularly important in light of the persistent
evidence on links between the investment rates and growth.
Given the low domestic savings in Africa, policy makers and the private sector should strive to
incentivize receiving households to either save larger shares of their remittance income in the
formal financial sector or invest it in productive capital;
The case of Egypt shows that rising remittances can somewhat ease debt sustainability
pressures. However, remittances cannot substitute for prudent fiscal policies.
13
Annex I. Selected Stylized Facts
Table 1, Annex I. Africa: Growth rates by sub-groups, 2000 – 2012 (averages, in percent)
2000 - 2012 2000 - 2007 2008 - 2012
Oil exporters 6.1 7.0 4.6
Frontier markets 5.1 5.2 4.8
Fragile states 2.9 2.1 4.0
Other LICs 3.9 3.7 4.3
Africa 4.7 4.8 4.5 Source: Authors’ calculations based on the AfDB database.
Table 2, Annex I. Demand changes in Africa, 2008 – 2011 (percentage points of GDP)
Domestic
Demand Consumption Private Government Investment
External
Demand
Oil exporters 3.0 0.6 1.7 -1.0 2.4 -3.0
Frontier markets 1.4 0.8 0.7 0.1 0.6 -1.4
Fragile 2.9 0.0 1.1 -1.1 2.8 -2.9
Other -5.3 0.8 1.7 -0.9 -6.1 5.3 Source: Authors’ calculations based on the AfDB and UN database.
Figure 1, Annex I: Domestic saving rates, by regions (2001 – 2012), percent of GDP
Source: Authors’ calculations based on the AfDB and World Bank WDI database.
17.4
21.5
21.8
21.8
26.1
30.5
0 5 10 15 20 25 30 35
Sub-Saharan Africa
Latin America & Caribbean
World
Europe & Central Asia
South Asia
East Asia & Pacific

14
References
Abdih, Y., R. Chami, M. Gapen, and A. Mati (2009), ‘Fiscal Sustainability in Remittance Dependent
Economies’, IMF Working Paper WP/09/190.
Abdih, Y.; Barajas, A.; Chami, R. and Ebeke, C. (2012), ‘Remittances Channel and Fiscal Impact in
the Middle East, North Africa, and Central Asia’, IMF Working Paper WP/12/104.
Adams, R. J. R. and Page, J. (2005), ‘Do International Migration and Remittances Reduce
Poverty in Developing Countries?’, World Development, Vol. 33 (10), 1645–1669.
African Development Bank, Organization for Economic Cooperation, United Nations Development
Program and Economic Commission for Africa (2013), African Economic Outlook 2013, AfDB: Tunis,
OECD: Paris, UNDP: New York and ECA: Paris.
Balde, Y. (2011), ‘The Impact of Remittances and Foreign Aid on Savings/Investment in Sub-Saharan
Africa’, African Development Review, 23(2), 247-262.
Barajas, A.; Chami, R.; Ebeke, C. and Tapsoba, S. J. A. (2012), ‘Workers’ Remittances: An
Overlooked Channel of International Business Cycle Transmission?’, IMF Working Paper WP/12/251.
Barbone, L.; Pietka-Kosinska, K. and Topinska, I. (2012), ‘The Impact of Remittances on Poland’s
Economy’, CASE Network E-Brief, No. 12/2012.
Blanke, J.; Brixiova, Z.; Dadush, U.; Gurcanlar, T. and Iarossi, G. (2011), ‘Exports, FDI and
Competitiveness in Africa’, in 2011 Africa Competitiveness Report, World Economic Forum: Geneva,
World Bank: Washington, DC and African Development Bank: Tunis.
Bugamelli, M. and Paterno, F. (2009), ‘Do Workers’ Remittances Reduce the Probability of Current
Account Reversals?’, World Development, Vol. 37 (12), 1821–1838.
Chami, R.; Barajas, A.; Cosimano, T.; Fullenkamp, T.; Gapne, M. and Montiel, M. (2008),
Macroeconomic Consequences of Remittances, IMF Occasional Paper No. 259, IMF: Washington DC.
Chami, R.; Hakura, D. and Montiel, P. (2012), ‘Do Worker Remittances Reduce Output Volatility in
Developing Countries?’ Journal of Globalization and Development, Vol. 3, 1–25.
Combes, J.; Ebebeke, C. H.; Etoundi, S. M. N., and Yogo, T. U. (2014), ‘Are Remittances and Foreign
Aid a Hedge Against Food Price Shocks in Developing Countries?’, World Development, Vol. 54, 81 –
98, forthcoming.
Commission on Growth and Development (2008), The Growth Report: Strategies for Sustained
Growth and Inclusive Development, Washington, DC.
El-Sakka (2004), ‘Migrant Remittances and Macroeconomic Policy in Jordan’, University of Kuwait,
unpublished paper.
15
Freund, C. and Spatafora, N. (2005), ‘Remittances: Transaction Costs, Determinants and Informal
Flows,’ World Bank Policy Research Paper No. 3704, World Bank: Washington DC.
Gnangnon, S. K. (2014), ‘The Effect of Development Aid Unpredictability and Migrants’ Remittances
on Fiscal Consolidation in Developing Countries’, World Development, Vol. 54, 168 – 190,
forthcoming.
Gupta, S.; Pattillo, C., and Wangh, S. (2007), ‘Making Remittances Work for Africa’, Finance &
Development, Vol. 44(2), www.imf.org/external/pubs/ft/fandd/2007/06/gupta.htm
Gupta, S., Pattillo, C. and Wagh, S. (2009), ‘Impact of Remittances on Poverty and Financial
Development in Sub-Saharan Africa’, World Development, Vol. 31, No. 1, 104–115.
International Monetary Fund and World Bank (2009), A Review of Some Aspects of the Low-Income
Country Debt Sustainability Framework, IMF and World Bank: Washington DC.
International Organization for Migration (2010), A Study on Remittances and Investment Opportunities
for Egyptian Migrants, IOM: Cairo.
Julca, A. (2012), ‘Can Remittances Support Development Finance in Developing Countries?’
Background paper for UN World Economic and Social Survey 2012, UN: New York.
Organization for Economic Cooperation and Development (2006), International Migrant Remittances
and Their Role in Development, OECD: Paris.
Ncube, M. (2013), ‘Harnessing Remittances for Africa’s Development’, AfDB blog,
www.howwemadeitinafrica.com/harnessing-remittances-for-africas-development/24843/ (last accessed
on October 23, 2013).
Ncube, M. and Brixiova, Z. (2013), ‘Public Debt Sustainability in Africa: Building Resilience and
Challenges Ahead’, William Davidson Institute at the University of Michigan Working Paper No.
1053.
Reinhart, C. M., and Talvi, E. (1998), ‘Capital Flows and Saving in Latin America and Asia: A
Reinterpretation’, Journal of Development Economics, 57(1), 45-66.
Stark, O. (1991), The Migration of Labour, Blackwell: Oxford and Cambridge, Massachusetts.
UNCTAD (2013), Database of External Financial Resources, http://unctad.org/en/Pages/Statistics.aspx (last
accessed on October 23, 2013).
Vargas-Silva, C. (2008), ‘Are Remittances Manna from Heaven? A Look at the Business Cycle
Properties of Remittances’, North American Journal of Economics and Finance, Vol. 19, 290–303.
World Bank (2012), ‘Migration and Development Brief 19’, World Bank: Washington, DC.

16
Recent Publications in the Series
nº Year Author(s) Title
187 2013 Zuzana Brixiova, Balázs Égert, and
Thouraya Hadj Amor Essid
The Real Exchange Rate and External Competitiveness in
Egypt, Morocco and Tunisia
186 2013 Yannis Arvanitis, Marco Stampini, and
Desiré Vencatachellum
Project Quality-At-Entry Frameworks: Evidence from the
African Development Bank’s Experience
185 2013 Christian Ebeke and Thierry Yogo Remittances and the Voter Turnout in Sub-Saharan Africa:
Evidence from Macro and Micro Level Data
184 2013 John C. Anyanwu and Andrew E. O.
Erhijakpor Does Oil Wealth Affect Democracy in Africa?
183 2013 Daniel Zerfu Gurara and Ncube Mthuli Global Economic Spillovers to Africa- A GVAR Approach
182 2013 Abebe Shimeles and Andinet Delelegn Rising Food Prices and Household Welfare in Ethiopia:
Evidence from Micro Data
181 2013 John C. Anyanwu Determining The Correlates Of Poverty For Inclusive Growth
In Africa
180 2013 John C. Anyanwu Marital Status, Household Size And Poverty In Nigeria:
Evidence From The 2009/2010 Survey Data
179 2013 Douzounet Mallaye & Yogo Urbain
Thierry
Heterogeneity Of The Effects Of Aid On Economic Growth In
Sub-Saharan Africa: Comparative Evidences From Stable
And Post-Conflict Countries
178 2013 Cédric Achille Mbeng Mezui And Uche
Duru
Holding Excess Foreign Reserves Versus Infrastructure
Finance: What Should Africa Do?