Embed Size (px)
Citation preview
WORKING IN COLLEGE: AN EXPLORATORY STUDY
OF UNDERGRADUATE STUDENT EMPLOYMENT
CHARACTERISTICS AND BEHAVIORS
by
TYNAN MARIE KOZAK
A THESIS
Submitted in partial fulfillment of the requirements for the degree of Master of Arts
in the Department of Educational Leadership, Policy, and Technology Studies
in the Graduate School of The University of Alabama
TUSCALOOSA, ALABAMA
2010

Copyright Tynan Marie Kozak 2010 ALL RIGHTS RESERVED

ABSTRACT
The employment of college students is an important issue for higher education since the
impact of working during the academic year is not clear. The current literature base shows
conflicting findings about the impact of employment on academic success and engagement
mainly because research results vary depending on the type of work, the location of employment,
number of hours worked, and the time management skills of the individual students.
Investigating the characteristics of full-time undergraduate students at The University of
Alabama holding paid positions of employment during the fall 2009 semester is the focus of this
study.
The survey instrument for this study was designed utilizing variables common with the
National Postsecondary Student Aid Study (NPSAS) and variables targeted to gather information
about the impact of employment on academic engagement, social experiences and overall
student well-being. Findings were compared to the national data from the 2008 NPSAS to
explore similarities between national trends and The University of Alabama full-time
undergraduate students. Additionally, the motivation for working during the academic year and
the impact of this work is explored.
A descriptive and comparative analysis of the data was used to answer the eight research
questions guiding this study. Findings and conclusions are presented along with
recommendations for policy, practice and future research.
ii

ACKNOWLEDGEMENTS
Over the past year, this research project has been a great learning opportunity, not only
for academic work, but for my personal and professional development. Through this process, I
have discovered personal characteristics and have continued to learn how to balance my roles as
a wife, a student, and an employee. To my husband, Chris, thank you for encouraging me to
chase my dreams and pursue this degree. I especially thank you for your understanding as this
project consumed much of my free time. To my family and friends, thank you for your constant
support and interest in this project.
As a working student, I would like to thank my supervisors, Kelli Knox-Hall, Carl Bacon,
Dr. Kathleen Cramer and Molly Lawrence. Thank you for your encouragement and your advice
as I have pursed this degree over the past four years. Additionally, I thank the wonderful ladies
in the Women’s Thesis and Dissertation Group for sharing their experiences and for providing
emotional support through this process. Dr. Rebecca Ballard, thank you for your time in editing
this document.
To my committee members, Dr. Margaret King and Dr. Ross Bryan, thank you for your
service and insight on this research project and to my committee chair and advisor, Dr. David
Hardy, thank you for encouraging me and guiding me through this project. You have supported
my research idea fully and I could not have completed this project without your help.
iii
Ultimately, I thank God for the strength and determination to complete this project and
for the inspiration to express the ideas and knowledge gained through this study in writing. I
prayerfully continue to seek God’s direction for my purpose in life with the understanding that
with God all things are possible.
iv

CONTENTS
ABSTRACT .................................................................................................................................... ii
ACKNOWLEDGEMENTS ........................................................................................................... iii
LIST OF TABLES ........................................................................................................................ vii
CHAPTER I: INTRODUCTION ................................................................................................... 1
Purpose of the Study ........................................................................................................... 1
Research Questions ............................................................................................................. 2
Review of Literature ........................................................................................................... 3
Understanding Why Students Work ....................................................................... 3
Impact of Work on Academic Success ................................................................... 9
Impact of Work on Personal Development………………………………………14
Characteristics of Student Employment Opportunities ......................................... 17
Conclusion ........................................................................................................................ 22
CHAPTER II: METHODOLOGY .............................................................................................. 24
Research Questions ........................................................................................................... 24
Survey Population and Sample ......................................................................................... 25
Materials and Data Collection .......................................................................................... 26
Data Analysis .................................................................................................................... 26
v

CHAPTER III: SURVEY RESULTS AND PRESENTATION OF PERCENTAGE
DISTRIBUTION .......................................................................................................................... 27
Response Rate and Representativeness of Sample ........................................................... 27
Demographic Characteristics of the Participants .............................................................. 29
Comparison to National Trends ........................................................................................ 33
Motivation to Work and Impact of Work ......................................................................... 37
Job Location: On-Campus and Off-Campus..................................................................... 42
CHAPTER IV: FINDINGS, CONCLUSIONS, AND RECOMMENDATIONS ........................ 46
Introduction ....................................................................................................................... 46
Findings............................................................................................................................. 47
Conclusions from Research Questions ............................................................................. 51
Research Question One ......................................................................................... 52
Research Question Two ........................................................................................ 53
Research Question Three ...................................................................................... 53
Research Question Four ........................................................................................ 54
Research Question Five ........................................................................................ 55
Research Question Six .......................................................................................... 55
Research Question Seven ...................................................................................... 56
Research Question Eight ....................................................................................... 56
Recommendations ............................................................................................................. 57
Concluding Observations .................................................................................................. 62
REFERENCES ............................................................................................................................. 63
APPENDICES .............................................................................................................................. 67
vi

LIST OF TABLES
1. Representativeness of Participant Population Compared to University of Alabama Full-Time Undergraduate Students Fall 2009 .......................................................29 2. Demographic Characteristics of Participants and Employment Status.................................30 3. Educational Attainment of Participants’ Parents and Employment Status ...........................31 4. Financial Aid and/or Scholarships of Participants and Employment Status .........................32 5. Participant Employment Status and Income Levels .............................................................32 6. Comparison of National Population and University of Alabama Undergraduate Non-working and Working Students ...........................................................33 7. Comparison of National Population and University of Alabama Undergraduate Working Students by Gender .......................................................................34 8. Comparison of National Population and University of Alabama Undergraduate Working Students by Race ...........................................................................34 9. Comparison of National Population and University of Alabama Undergraduate Working Students by Motivation to Work ...................................................35 10. Comparison of National Population and University of Alabama Undergraduate Working Students by Job Location ..............................................................36 11. Comparison of National Population and University of Alabama Undergraduate Working Students by Hours Worked per Week ...........................................36 12. Comparison of National Population and University of Alabama Undergraduate Working Students Number of Hours Worked per Week by Grade Point Average ........................................................................................................37 13. Participant Motivation to Work During the Academic Year ................................................38 14. Career Preparation Resulting from Job Held ........................................................................39 15. Impact of Working on Academic Success and Engagement ................................................40
vii
viii
16. Impact of Working on Social Experiences ...........................................................................41 17. Impact of Working on Participant Life Balance and Well Being .........................................42 18. Number of Hours per Week Spent Studying or Preparing for Classes by Job Location ......43 19. Impact of Work on Academic Success and Engagement by Job Location ...........................44 20. Number of Student Organizations Participated in by Job Location .....................................45 21. Impact of Work on Social Engagement by Job Location .....................................................45
CHAPTER I:
INTRODUCTION
The employment of college students is not a new trend; however, as students continue to
allocate a significant portion of their time and energy to employment there may be less available
time for academic work, engagement in educational activities, and maintaining a social life
during their college career (Pike et al., 2008; Stern & Nakata, 1991). Current trends in student
employment should be examined to gain a better understanding of the motivation to work and
how working during the academic year impacts academic achievement, student development and
employment opportunities after graduation. Several studies have been conducted to research the
impact of working during the academic year and the results vary depending on the type of work,
the location of employment, number of hours per day and per week worked, and the time
management skills of the individual student (Pike et al., 2008; Dundes & Marx, 2006; Kulm &
Cramer, 2006; Furr & Elling, 2000; Hood et al., 1992; Van de Water, 1989). In order to gain an
understanding of the employment characteristics of the undergraduate student population at The
University of Alabama and to compare these characteristics to the national trends, this study
employed a survey of full-time undergraduate students who were enrolled during the fall 2009
semester.
Purpose of the Study
The purpose of this study was to investigate the characteristics of full-time undergraduate
students at The University of Alabama (UA) who hold positions of paid employment during the
1

academic year. The results of the study were compared to the findings from the 2008 National
Postsecondary Student Aid Study (NPSAS) to determine how the employment of UA
undergraduate students compares to the national student employment trends. The investigator
determined the percentage of undergraduate students that must work to pay for some aspect of
their education at UA and how their work obligations impact their academic performance, their
involvement on campus, and their overall personal well being.
Research Questions
To facilitate the purpose of this study, the researcher explored the following questions:
1. How does the percentage of UA undergraduate students that hold positions of paid
employment during the academic semesters compare with the national trends found in the
2008 NPSAS;
2. How do the characteristics of UA undergraduate students compare to the national data
regarding on campus jobs, off campus jobs and number of hours per week worked during
the academic year;
3. What are the primary reasons and/or motivations for UA undergraduate students to hold
positions of paid employment;
4. How does working for pay during the academic year affect students’ academic
engagement and success;
5. How does working for pay during the academic year affect students’ social experiences?
6. How do the demands of school, work, family and personal life affect students’ well
being;
7. What differences exist between students who work on campus and off campus in terms of
academic engagement; and
2
8. What differences exist between students who work on campus and off campus in terms of
social engagement?
Review of Literature
This section will review the literature that examines student employment from the
perspective of student involvement and student engagement. The students’ motivation for
working during the academic year will first be reviewed. In addition, the review of literature will
discuss research findings in the area of student employment and what impact working during the
academic term has on students’ academic success, retention, campus involvement and
engagement, and overall well being. Finally, the characteristics of employment options will be
explored and general recommendations for employment type, job location and hours worked per
week will be discussed.
Understanding Why Students Work
The number of college students who hold paid positions of employment during the
academic year has steadily increased over the past few decades (McCartan, 1988; Stern &
Nakata, 1991). According to the 2008 National Center for Education Statistics (NCES)
Condition of Education report, 46.5% of full-time college students were employed in 2006 and
approximately half of those students work 20-34 hours a week while maintaining a full-time
course load. The motivations to work vary from student to student; however, the employment of
college students is becoming more of a norm and this trend has implications for students,
colleges and employers alike. Before exploring how work impacts each constituent, we need to
gain an understanding of why students work.
The current research shows various reasons for college undergraduate students to hold
positions of employment including career preparation, social involvement, and financial gains.
3

When we consider the current economic climate, the motivation to hold a job while pursuing a
college degree may be mostly financial. King and Bannon (2002), in their analysis of the
National Postsecondary Student Aid Survey (NPSAS) data from 1999-2000, reported that 63%
of students who work more than 25 hours per week could not afford to attend college without
working. Affordability continues to be an issue for many students. In the 2003-2004 National
Postsecondary Student Aid Survey (NPSAS), 81% of working students confirmed that, if they
did not work, they could not afford to attend college. Tuition costs are on the rise. For example,
the average cost of in-state tuition and fees at a four year public university will “range from
$5,412 in the South and $8,602 in New England” (College Board, 2008, p. 2). Even with
financial aid packages, many students must work to fill the gap between the aid they receive and
the actual cost of attendance.
Many students from lower income families must work to help cover the estimated family
contribution (EFC) amount determined by the Free Application for Federal Student Aid
(FAFSA) because there are families that simply cannot afford to pay this expected amount.
Almost half of low-income working students confirm that they would not be able to afford
college if they did not work (King & Bannon, 2002). In general, low-income students typically
work 25 hours a week or more (King & Bannon, 2002).
Even at some of the relatively lower cost public universities, students must work to pay
their education expenses. A student attending Wright State University in Ohio explained that he
has to work 30 hours a week at his on campus job to pay his education and living expenses, and
although he is working to finance his education, he is unable to allocate sufficient time to his
coursework due to his extensive work schedule. Further, most of the students at Wright State
4
said that their families could only pay a small portion of their tuition costs and they were
working long hours to cover the difference (Schmidt, 2004).
One additional factor that may be contributing to student employment is an aversion to
borrowing funds for college. The 1996 data from the National Center for Education Statistics
(NCES) shows that “80% of undergraduates worked, but only 25% took out a student loan”
(King, 1999, p. 19). Additionally, our attention is brought to the fact that many students who are
working 15 or more hours per week choose not to borrow funds for college and many of these
students do not even apply for financial aid (King, 1999). Although there is a percentage of
students who are not borrowing funds for their education, overall, there is a significant
population of students taking out loans and receiving financial aid that still need to work to pay
for college (King & Bannon, 2002).
The current literature indicates that the majority of students are working during college,
but not all of them are working to pay for college. The financial classification of each student,
independent of parents or dependent on parents, may offer insight on how some working
students spend their earnings. Data from the 2003-2004 NPSAS indicates that independent
students generally work to pay their tuition and living expenses, while dependent students are
more likely to work for spending money and to build their employment experience (King, 2007).
In addition, dependent students from low-income families are more likely to apply their earnings
to educational costs than dependent students from wealthy families. Financial classification is
one indicator of the type of spending, as is family income level but, regardless of how students
are spending their earnings, the fact is that the majority of them are working during the academic
year (King & Bannon, 2002).
5

Without controlling for the financial classification of independent or dependent, Dundes
and Marx (2006) studied a population of students at a small private liberal arts college and found
that 80% of working students are motivated to work for spending money, 65% work to pay basic
living expenses, and only 29% are working to pay for tuition. Generally speaking, based on the
results of this study, the majority of traditional-aged college students apply their salary dollars to
their personal spending. Having available funds is important because much of the student
experience includes activities that involve spending money such as attending cultural and athletic
events, weekend dining and entertainment and purchasing the consumer electronics such as
laptops and smart phones that allow students to maintain their social networking (Brooks, 2006;
Epstein, 2009). Ultimately, students need to have money during their college experience to
support their personal, educational and social expenses.
Parental influence is another factor of student employment decisions. The 2003-2004
NPSAS data reported by King (2007) indicates that 63% of the working students classified as
dependent confirm that their parents’ expectation is that they work during the academic year.
Additionally, this parental expectation does not notably vary by income category, which suggests
that parents at low and upper income levels share the employment expectation (King, 2007).
This may indicate that, although there may not be a financial need to work, parents are expecting
their children to work perhaps for non-financial benefits.
Still, while students may or may not be working for financial benefits such as having
spending money or actually paying for their education, they are also developing practical skills
that will prepare them for employment opportunities after graduation. This type of career
preparation is another reason students choose to work during college; they understand that
having work experience is necessary to securing employment post commencement. A 1992
6

national student employment survey was conducted at 21 institutions with approximately 4400
respondents and addressed various questions about student perceptions of work, their
experiences and why they chose to work. Results from the study indicate that some of the top
reasons students choose to work include career exploration, gaining job experience and
establishing contacts for references (Mulugetta & Chavez, 1994). Most students are actively
building their resumes while they are in college to get a jump start on the job market.
The type of during college work experience is an important consideration for career
preparation because specific experience will contribute not only to securing a job after
graduation but also to determining the initial responsibility level of that job. Employment during
college, especially in an area related to the student’s major field of study or future career
aspiration, has been found to increase the responsibility level reached early in one’s career
(Pascarella & Terenzini, 1991, 2005). Additionally, the development of career related skills has
also been found to be enhanced by employment during college (Pascarella & Terenzini, 2005).
Thus, the student is more likely to secure employment after graduation at a level appropriate to
one with an earned bachelor’s degree, and if their work during college is related to their career
plan or academic major, the post-graduation employment potential is enhanced (Pascarella &
Terenzini, 2005).
Employers concur and they are looking for candidates who have developed specific skills
and characteristics in their work positions during college (Kincaid, 1996). In 1991, Bob
Foreman from the United Parcel Service corporate human resources department, conducted a
nationwide survey of 2000 human resource managers. The participants were asked how much
consideration they place on part-time work experience and how they weighted applicant grade
point average (GPA) as an indicator of success. The majority of respondents indicated that
7

employers view student employment experience to be as important as grades. In addition, if they
are considering candidates with equal academic qualities, they would choose the candidate with
part-time work experience (Foreman, 1993).
Although students are deliberately choosing to work for financial or career reasons, they
may not realize that they are developing personal skills that will prepare them for life after
college. Kuh (1995) reports on a study conducted at 12 institutions where 149 seniors responded
to interview questions about their college experience and how they have changed during their
tenure. The majority of students indicated that their out of class experiences contributed to
developing their leadership skills. Additionally, nearly half of the students reported that their
employment, whether on campus or off campus improved their interpersonal skills.
Similar findings were reported by Lewis (2008) in a study of college union student
employees at Northwestern University. The students indicated they learned more from work
experience where they had informal interaction and discussion with peers, faculty and staff. In
addition, job duties that involve team projects and group meetings provided an opportunity to
further develop leadership, communication and interpersonal skills. Lewis (2008) also notes
that, through their work experience, students build leadership skills, focus their career paths, and
learn how to balance the multiple demands of work, school and personal life.
Overall, the results of these two studies by Kuh (1995) and Lewis (2008) indicate that out
of class experiences, including employment, allow students to develop skills, interact with peers
and apply what they are learning in the classroom to their employment or their role within a
campus organization. This type of experience and skill development is expected for career
opportunities (Foreman, 1993).
8

As has been discussed, students choose to work for various reasons including financial
need, parental influence, work experience, and career preparation. Understanding the general
reasons why students work provides the background information necessary to discuss how
employment during the academic term impacts academic success.
Impact of Work on Academic Success
As previously discussed, students work for a variety of reasons including financial need
and skill development. Understanding why most students want or need to work will provide
insight as we review the impact of working while managing the role of full-time college student.
The current literature has mixed conclusions concerning whether working will negatively or
positively impact the student and her or his academic success. These conclusions vary based on
the characteristics of employment such as full-time work versus part-time work, hours worked
per day and per week, and on-campus versus off-campus employment. The impact of work on
academic success will be discussed within the theoretical framework of Alexander Astin’s
(1999) theory of student involvement and George Kuh’s (2009) construct and assessment of
student engagement.
Astin (1999) describes student involvement as a construct of developmental theory that
“refers to the quantity and quality of the physical and psychological energy that students invest
in the college experience” (p. 528). One postulate of this theory indicates that time and energy
allocated in one area diminishes time and energy spent in another area. Specifically, students
only have a certain amount of time and energy to devote to their academic pursuits and, as time
is allocated to family, friends, activities and work, the time for studying and academic
development is reduced. Astin also explains that involvement is considered an action or
behavior, and that students are more likely to succeed and learn if they are active participants in
9

the learning process. Astin (1999) summarizes his theory by stating “the greater the student’s
involvement in college, the greater will be the amount of student learning and personal
development” (p. 529).
Academic involvement in the college experience can be viewed as a form of student
behavior that includes interacting with faculty, spending time preparing for class, and
participating in campus organizations or athletic teams. Environmental factors that support
involvement include residing on campus in residence halls, utilizing campus facilities and
working on campus. In both, there are several benefits associated with student involvement.
Astin (1996) discusses his research with the Higher Education Research Institute and their
findings suggest that involvement is strongly correlated with enhancing the cognitive
development of undergraduate students. He found the most powerful forms of involvement to be
“academic involvement, involvement with faculty and involvement with student peer groups” (p.
126). Of these three, Astin finds that involvement with student peers has the most impact on the
overall educational experience for students due to the influence students have on each other and
how the relationships they build support their mutual academic and co-curricular goals.
George D. Kuh (2009) explains that the engagement principle has been discussed in the
literature for more than seven decades, but the concept of student engagement only more recently
has been introduced as “an organizing construct for institutional assessment, accountability, and
improvement efforts” (p. 5). He clarifies that “Today engagement is the term usually used to
represent constructs such as quality of effort and involvement in productive learning activities”
(p. 6). Such educationally purposeful activities include faculty and peer interaction, time spent
studying and participation in co-curricular activities and employment.
10

Kuh and his colleagues (2001) designed the National Survey of Student Engagement
(NSSE) that “annually assesses the extent to which students at hundreds of four-year colleges
and universities are participating in educational practices that are strongly associated with high
levels of learning and personal development” (p. 12). The NSSE findings from 2000 through
2003 indicate that students who are engaged in educationally purposeful activities are more
likely to have academic success in terms of GPA and are more likely to persist from their first
year into their second year (Kuh et al., 2008). Overall, student engagement has been found to
support student academic success.
The research on the amount of student involvement in college and student engagement in
educationally purposeful activities has concluded that both support academic success. There are
various ways students can be involved and engaged in their academic work and co-curricular
experience. On campus employment has been found to support student involvement and
engagement at their institution for several reasons. Students physically spend more time on
campus, and thus they build relationships with their co-workers and the knowledge gained about
the institution through their employment supports campus affinity and belongingness in the
campus community (Astin, 1999; Lingrosso, 2007; Cermak & Filkins, 2007; Noel, 1996). In
addition, students who work on campus together are able to build relationships and participate in
other involvement opportunities that positively contribute to identification with their institution,
which also positively impacts persistence (Astin, 1975).
Not only does on campus employment support student involvement and engagement, in
itself it is a form of involvement and engagement (Wilkie & Jones, 1996; Cheng & Alcàntara,
2007). Students who have an opportunity to work for their institution, perhaps in an academic
department or in a student affairs department, are likely to be achieving learning outcomes in
11

their work responsibilities, even if the outcomes are not officially defined. For example, students
working in a student union are often involved in planning and executing campus events and
programs. Through their work responsibilities, students are learning about their institution,
becoming involved in the campus community and are developing and practicing communication
and leadership skills (Perozzi, 2009; Lewis, 2008).
Under the involvement and engagement frameworks, two main considerations are the
amount of available time and how an individual student allocates their time. Since students have
a limited amount of time during the academic experience, when they are committing a
signification portion of their time to a job, there may be less opportunity to be academically
engaged. Pike et al. (2008) describe how available time impacts grades and suggest that working
more hours may decrease the available time students have to engage in educational activities.
Kuh (2003) questions whether students are expending enough effort on academics when some
NSSE data shows that other commitments, such as work, limit the study time of respondents.
Additionally, Pascarella et al. (1994) found that working off campus negatively impacts the
amount of time spent studying. In general, the concern about student employment is whether
students have enough time to devote to their academic college experience if they are allocating
too much time to work commitments.
The employment of college students presents concerns about how their work
commitments impact their academic performance. Astin (1993) found that students who work
full-time while enrolled experience a negative impact on their academic achievement in terms of
student GPA, receiving honors at graduation, and enrollment in graduate school. Conversely,
research by Van De Water indicates that there is no relationship between working and academic
success (Van De Water, 1989). Hood et.al (1992) researched the effect of athletics, employment
12
and activities on academic achievement and found that students working in moderation
performed better than those students who do not work at all and those working a substantial
number of hours. Their results also show that a moderate work schedule does not negatively
impact GPA.
Kulm and Cramer (2006) conducted a web-based survey at a mid-western university and
found that, as students work more hours, work interferes with their study time and consequently,
their GPA declines. King (2007) confirms that at most institutions, working more than a part-
time schedule negatively impacts student grades. In contrast, Canabal (2008) performed an
analysis of the data collected from the spring 1990 Illinois Undergraduate Student Survey and
the findings confirm a positive correlation between student employment and GPA. In fact, the
more hours the students worked in the labor force, the greater their GPA.
Holding employment during the college years also has an impact on student persistence
and retention. Astin (1975) concludes that holding a part-time job working under 25 hours per
week, either on-campus or off-campus, generally increases the persistence rate and likelihood of
degree completion. In a study of first year students, it was determined that engagement in
educationally purposeful activities, including employment, has a significant, positive effect on
persistence to the second year of college and on grades (Kuh et.al. 2008). A study at Indiana
University Bloomington found that less engaged students are more likely to not return for their
sophomore year (Hayek & Kuh, 2004).
More specifically, an on-campus part-time job has a positive effect on retention and
completion of a bachelor’s degree (Astin, 1993; Cermak & Filkins, 2007; Wilkie & Jones, 1996).
This is likely due to the fact that on-campus employment can be considered a form of student
involvement and engagement because of the employment characteristics and physical location of
13

the job. In general, researchers of student employment conclude that off-campus employment
negatively impacts persistence and degree completion while part-time, on-campus employment
has a positive impact on these factors (Pascarella and Terenzini, 1991).
The indicators of academic success previously discussed include student grade point
average, student persistence and student retention. How student employment impacts these
indicators depends on the type of employment, location of employment and hours spent working.
Although the literature reviewed represents mixed conclusions about the impact of work on
academic success, the findings reach a consensus that working part-time (20 or fewer hours per
week), on campus has a positive effect on student involvement, engagement and academic
success in general. While these findings indicate positive results from working during the
academic year, working students must be able to balance all of the demands on their time and
energy in order to succeed academically.
Impact of Work on Personal Development
Student employment opportunities often contribute to the personal development of
students by providing situations for exploring career goals and developing skills. Chickering et
al. (1996) suggest that, through their work experience, students move through the developmental
stages of ego. For example, a student’s first job typically is for financial gain and may not be
related to their career goals, however, as he or she moves through different positions of
employment, a development of ego occurs and the student targets jobs that are related to future
plans and begins to understand how he or she is an important part of an overall organization. In
this way, student employment supports student development.
Employment during the academic year has also been found to support the cognitive
development of students. Astin (1993) concludes that holding a part-time job on campus has a
14

positive effect on “self-reported cognitive and affective growth” (p. 388). Pascarella et al. (1994)
studied the impact of on-campus and off-campus work on students’ first year cognitive
development in math, reading and critical thinking skills and whether the number of hours
worked impacts this development. The results of this study indicated that when compared to non-
working students, students working either on campus or off campus have the same level of
achievement in cognitive development areas.
Employment opportunities, specifically on-campus employment, also provide an
opportunity for student learning. Kuh (1995) discusses the importance of what he calls the other
curriculum, out-of-class experiences that support student learning and development. One of the
components of this other curriculum is part-time employment, and Kuh reported on one student
who was able to determine future career plans based on his employment with the university
newspaper. Although the student decided not to pursue a career in newspaper journalism, his job
with the university newspaper allowed him a true to life opportunity to work in the field and
determine if this was what he wanted to pursue after graduation. By providing a place for
students to test their career intentions before graduation, on-campus employers support the
personal development of students as they come to understand their identity and their life
passions.
Another benefit of on-campus employment is the development of the relationship
between employee and supervisor. A positive student/supervisor relationship encourages the
development of skills and an understanding of a workplace environment. In a study of first year
students at Loyola Marymount University, the majority of students reported that they were “very
satisfied with the working relationship they had with their supervisor” (Lingrosso, 2007, p. 5).
The study also determined that, with appropriate supervisor support, students develop skills that
15

improve their opportunities for subsequent employment, internships and academic opportunities
(Lingrosso, 2007). Working students also benefit by establishing a network of referral contacts
for future educational and employment opportunities (Mulugetta & Chavez, 1994).
The development of transferrable skills is another benefit of student employment.
Working students often indicate that, through their work experience, they have developed time
management skills that have helped them manage the multiple demands of academics and
employment (Lingrosso, 2007). The improvement of organizational skills and greater efficiency
are also reported as benefits attributed to working students (Dundes & Marx, 2006).
Additionally, working students report they are able to develop and exercise leadership and
communication skills in their out-of-class and work experiences (Kuh, 1995). All of these skills
and attributes are important and likely essential to securing employment after graduation.
Although students are learning and developing personal skills and attributes through their
academic work, their out-of-class experiences, including employment, offer students a place to
put their knowledge and abilities into action. Employment opportunities enhance and often
demand that students use their leadership, organization, communication and teamwork skills to
accomplish their job responsibilities. Working students are able to experience a workplace
environment while they are still enrolled in college and this experience often shapes their
personal development and guides them through the career selection process (Kuh, 1995). This
type of real world experience supports student development through the identity defining stages
of personal awareness. Student employment, in addition to the overall college experience,
creates an opportunity for personal development, identity development and an awareness of
individual worth in the scope of an organization, a community, and a global culture (Chickering
et al., 1996).
16

Characteristics of Student Employment Opportunities
Employment opportunities for students exist in a variety of settings, either on campus or
off campus, and both locations provide different opportunities for student development.
However, as previously discussed, on campus work opportunities support student involvement
and engagement in educationally purposeful activities (Astin, 1999; Kuh et al., 1991). In
addition to job location, the number of hours worked is another characteristic of employment that
has been linked to impacting academic engagement and student involvement (Astin, 1975;
Dundes & Marx, 2006). The type of work students are performing is another characteristic to
review since the specific job functions will develop specific skills. With these various
characteristics considered, best practices for student employment opportunities derived from
literature findings will be reviewed.
There are many benefits associated with student employment and the occurrence of
student development and identity shaping is an important benefit as students are moving toward
developing life passions and a sense of belonging within an organization (Chickering et al.,
1996). Additionally, the attainment of job experience is often essential to a successful
employment offer upon graduation because employers are looking for candidates who have
developed career skills and had the opportunity to apply them in a practical setting (Kincaid,
1996; Foreman, 1993). Student employment experience in an area related to individual major
and degree also increases the responsibility level reached early in ones career (Pascarella &
Terenzini, 1991, 2005). Ultimately, working students have an advantage over non-working
students when they are seeking employment upon graduation.
While student employment supports development and experience attainment, the physical
location of the job is an important consideration as it impacts the overall academic success of the
17

student. Generally, researchers of student employment conclude that off-campus employment
negatively impacts persistence and degree completion while part-time, on-campus employment
positively impacts these factors (Pascarella & Terenzini, 1991). As discussed previously,
students who work on campus are more likely to be involved and engaged in their academic
work due to the physical location of their job and the opportunities they are exposed to through
their work experience (Astin, 1996; Kuh, 2009).
The physical location of the students’ job has been found also to impact campus
involvement. Furr and Elling (2000) have been able to show that the more time students are
spending in off-campus employment the less involved they are on campus. This decrease in
campus involvement negatively affects students’ participation in activities, interaction with
faculty and classmates, and opportunities for learning experiences. Students who must work off
campus often are not able to participate in student involvement opportunities because they must
work instead. Given these findings, on-campus employment opportunities are preferred since
they not only provide necessary job experience; they are also supporting academic success and
campus involvement.
On campus employment programs are expensive to support, but many institutions do
receive federal funding for campus employment programs. The Federal Work-Study Program is
beneficial to the students who qualify for this financial aid source because they are often assisted
by the Student Employment Office in finding an on-campus job and hiring departments are more
likely to select work-study students since their salaries are funded by financial aid. In addition,
“income from a regular job may diminish a student’s future aid eligibility: None of a student’s
earnings from a work-study job factor into the federal financial-aid formula’s estimated family
contribution, but in certain cases, 50 percent of earnings from a regular part-time job are
18
expected to go toward college costs” (Lipka, 2007, p. A40). Not only do students benefit from
this federal funding; for institutions, this funding allows for the existence or expansion of on
campus employment opportunities.
The location of work is important to working students and Cheng and Alcàntara (2007)
found that most of the students in their study preferred to work on campus rather than off campus
because it was more convenient. Students also indicate that, with their work place being
centrally located on campus, they are able to work a few hours during the day in between their
classes. On campus student workers report that many of their jobs allow them time for
homework and reading when other job responsibilities have been completed (Lipka, 2007).
Given that many students prefer to work on campus and understanding that on-campus
employment supports academic success and student involvement, higher education institutions
have an opportunity to support students in their holistic development. Institutions that are able to
provide on-campus employment programs, especially for urban settings, help to improve
opportunities for student involvement (Kuh et al., 1991). Given these findings, universities like
the University of Maine at Farmington are creating and investing in on-campus student
employment initiatives that connect students to the campus and provide a true to life work
experience that prepares them for employment after graduation (Kuh et al., 2005).
There are opportunities to work in various campus divisions and departments but, at the
University of California, Davis, the majority of student employment is housed within the 30
departments under Student Affairs (Sturgean, 2006). Students are responsible for many things
including running buildings, driving campus vehicles and providing clerical support. The student
employment responsibility level is increased at California State University, Chico where the
student body owns and manages the Union which includes a retail bookstore and marketplace
19

(Sturgean, 2006). These types of on-campus jobs require a high level of responsibility from the
student employees, but they are providing an opportunity for students to develop skills essential
to securing a higher level of employment upon graduation.
Many students are also working in academic affairs areas, commonly as office support or
directly working with faculty in laboratory work or on other research projects. Some students
indicate that the most meaningful work is the work conducted with faculty members in the
laboratory or on research projects. This type of work allows students to apply what they are
learning in the classroom and it also strengthens their decisions about career plans or further
graduate study. Students working with faculty may also have an opportunity for professional
development as they are enhancing their research skills (Cheng & Alcàntara, 2007).
Another benefit of on-campus employment is that students have the ability to utilize the
services of a career center and a student employment office as they begin their job search.
Student employment professionals may serve as employment advisors and work with students to
find jobs that match their skills and interests. Student employment professionals can also help
the student transition to the workplace by acting as a liaison between the student and the
employer. Additionally, Student employment professionals may also assist employing
departments in developing training programs for student staff (Noel, 1996).
On-campus employment options, whether housed in academic affairs or student affairs or
elsewhere, allow students an opportunity to apply their coursework in a practical setting which
reinforces student learning. Campus jobs also provide a flexible work environment because
faculty and staff supervisors understand that their student employees are students first and their
academic schedule holds a priority. Additionally, campus employers benefit from providing job
opportunities to the best and brightest students since they bring cutting edge knowledge from
20
their classrooms to the work place (Sturgean, 2006). Since the faculty and staff within student
affairs interact with students where they spend the majority of their time, it is important for
academic affairs and student affairs to collaborate and improve the overall educational
experience for students (Banta & Kuh, 1998).
Whether students are working on campus of off campus, the time allocated to work is not
available to allocate to academic demands. While most students do work part-time hours under
20 hours per week, there are exceptions, some students work in multiple positions or they may
work more than 20 hours a week at their job (King, 2006). The decision to work more than part-
time hours varies from financial need to job satisfaction (Cheng & Alcàntara, 2007). The
students’ place of residence has shown to be a factor in the number of hours worked. Furr and
Elling (2000) found that students who reside off campus work more hours per week than
residential students.
Since we understand that large populations of college students work during the academic
semesters and the overall impact of these hours spent working is questionable, some researchers
have studied the relationships between the number of hours worked per week and academic
success to determine if there is range of hours worked per week that support student success.
Astin (1975) concludes that working 25 or more hours per week negatively impacts persistence.
Pike et al. (2008) confirm that working more than 20 hours per week negatively impacts student
grades. Dundes and Marx (2006) surveyed a population of students at a private liberal arts
college to study the employment characteristics of this group. The results of their study indicate
the students who work between 10 and 19 hours per week are the most successful academically.
Their grades are higher than non-working students and students working less than 10 hours and
21
more than 19 hours. Kulm and Cramer (2006) found that, as students work more hours, their
employment interferes with their study time and as more hours are worked, the GPA declines.
However, other researchers have found there to be no relationship between hours worked
per week and GPA (Van de Water, 1989). Findings also indicate that students limit their
personal, social and sleep time to accommodate the demands of work and academics (Cheng &
Alcàntara, 2007). Additionally, many students report that working has improved their time
management skills and that a work schedule has provided structure for their overall daily
schedule (Cheng & Alcàntara, 2007; Kulm & Cramer, 2006). Students who are working during
the academic year are finding ways to accomplish their tasks and balance the multiple demands
of work and school.
The ability to balance multiple demands is reviewed from the perspective of recent
university graduates and they reflected on how combining work and school impacted their
degree progress and plans for future learning. These graduates felt their college employment
helped them integrate with other students and into the university lifestyle, motivated them to
persist with academic work, and helped them balance different activities (Brooks, 2006).
Additionally, this study finds that students who have combined work and learning during college
have continued this pattern to their lives post-graduation, which suggests that combining work
and school may lead to a pattern of lifelong learning.
Conclusion
Since the majority of students work during their college careers, it is important develop
an understanding of why they work, how their work impacts academic success and social
engagement, and the job characteristics that best support student success. As has been discussed,
there are mixed conclusions about how student employment impacts academic success, campus
22

involvement and overall well being, due to the variables found in different work environments
(Pike et al., 2008; Dundes & Marx, 2006; Kulm & Cramer, 2006; Furr & Elling, 2000; Hood et
al., 1992; Van de Water, 1989). However, general conclusions indicate that part-time on-campus
employment, with a schedule between 10 and 20 hours per week is ideal (King, 2006).
Employment under these conditions supports academic success, student involvement and
engagement, and a balanced schedule of academics, work and personal life. Additionally, on-
campus positions that support future career goals and provide a true to life work experience
contribute to student development and successful career preparation (Perozzi, 2009; Kuh, 1995).
23
CHAPTER II:
METHODOLOGY
As discussed in the previous section, there are conflicting findings about the impact of
student employment on academic success and the overall college experience. Given the current
economic climate and importance of a well-rounded college experience for career preparation, it
is important to hear how undergraduate students at The University of Alabama are managing the
pressures of academic success, co-curricular commitments, personal life and a position of paid
employment. By surveying a sample of UA undergraduate students who are currently facing
these multiple demands, a more precise understanding of the issues employment may cause may
be achieved. The feedback from a sample of full-time undergraduate students attending The
University of Alabama will address the research questions proposed in this study.
Research Questions
To facilitate the purpose of this study, the researcher explored the following questions:
9. How does the percentage of UA undergraduate students that hold positions of paid
employment during the academic semesters compare with the national trends found in the
2008 NPSAS;
10. How do the characteristics of UA undergraduate students compare to the national data
regarding on campus jobs, off campus jobs and number of hours per week worked during
the academic year;
24
11. What are the primary reasons and/or motivations for UA undergraduate students to hold
positions of paid employment;
12. How does working for pay during the academic year affect students’ academic
engagement and success;
13. How does working for pay during the academic year affect students’ social experiences?
14. How do the demands of school, work, family and personal life affect students’ well
being;
15. What differences exist between students who work on campus and off campus in terms of
academic engagement; and
16. What differences exist between students who work on campus and off campus in terms of
social engagement?
Survey Population and Sample
The University of Alabama Factbook reports that during the fall 2009 semester, 21,738
full-time undergraduate on-campus students were enrolled (University of Alabama, 2009). From
this total count of enrolled students, 10% were invited to participate in this study. Participants
were recruited from the general undergraduate student population of the University of Alabama
who met specific qualifications for this study. A request was made to the University Registrar
for a list of CrimsonMail email addresses for all students age 19 or older classified as full-time
undergraduate students for the fall 2009 semester and enrolled during the spring 2010 semester.
These parameters retuned a total count of 14,612 potential participants and a random selection of
2100 participants representing 10% of the total UA full-time undergraduate on-campus
population was utilized for the survey participant population.
25

Materials and Data Collection
The study used a survey methodology to collect demographic and descriptive data related
to the research questions. The survey was created and administered using the Survey Monkey®
online survey tool. The survey contained a total of 37 questions, of which there were nine
demographic questions, six student information questions, fifteen employment questions, and
five Likert scale questions designed to allow participants to share their perspectives on the
impact of their employment. In addition, the use of one open-ended question was incorporated to
gather feedback on overall student well-being and the ability to balance multiple demands. A
copy of the survey instrument is included as Appendix D.
Using the email addresses supplied by the University Registrar, an invitation email was
sent to the 2100 subjects with a hyperlink to the online survey tool. After the initial invitation
email was sent, two follow-up emails were sent to the individuals that had not yet responded to
the survey. At that point a final email reminder was sent in an attempt to collect responses from
the remaining population. Data was collected during January, 2010. Copies of the initial email
invitation and subsequent follow-up emails are included here as Appendix C.
Data Analysis
Once the data collection period had ended, the researcher utilized the data analysis tools
on the Survey Monkey® website for a base line review of the data, and exported the survey
response data from Survey Monkey® to an Excel spreadsheet file for further analysis. Using the
tools available in Survey Monkey® and Excel, the researcher created cross-tabulations and
conducted a descriptive and comparative analysis of the data in order to answer the research
questions guiding this study.
26
CHAPTER III:
SURVEY RESULTS AND PRESENTATION OF PERCENTAGE DISTRIBUTION
In this section the results from the survey data will be reviewed. First, the characteristics
of the participant sample will be compared to the underlying University of Alabama
undergraduate population characteristics to determine the representativeness of the sample
population. In addition, the demographic characteristics of the survey participants will be
reviewed. Next, the survey participant characteristics will be compared to the national trends
found in the 2008 National Postsecondary Student Aid Study (NPSAS). The employment status
of the participants will be utilized to discuss motivations for working, comparative data between
working and non-working students, and a discussion of the comparative data between students
working on campus and off campus will be presented. Finally, the impact of working during the
academic year will be discussed in terms of overall well-being and balancing the multiple
demands of work and academics.
Response Rate and Representativeness of Sample
As previously discussed, the researcher obtained a report of the CrimsonMail email
addresses for a population of students who were 19 years of age and older, classified as full-time
undergraduate students for the fall 2009 semester, and enrolled during the spring 2010 semester.
Although the total undergraduate enrollment count for fall 2009 was 21,738, these parameters
returned a total count of 14,612 potential participants. A random selection of 2100 participants
representing 10% of the total UA full-time undergraduate on-campus population was utilized for
27
the survey participant population. The participant recruitment resulted in 239 beginning the
survey, 237 accepting and agreeing to the informed consent statement, and 207 participants
completing the survey. Based on the 2100 invited, the response rate was 11.38% with an
acceptance rate of 11.29% and a completion rate of 9.86%.
Being that the survey participants were selected randomly from a report of all eligible
students, it is important to discuss how the survey participants compare to the underlying
undergraduate population at The University of Alabama. As shown in Table 1, the
demographics of the survey participants are fairly representative of the UA undergraduate
population. However, ages 20 and 21 show a difference of approximately 17% which may be
attributed to more than half of the survey participants being aged 20 - 21.
When comparing the participants to the UA undergraduate population in terms of gender,
the difference is only 8.7%. Slight differences, under 5%, appear in the racial comparisons as
well with the highest difference in the other minority category. This discrepancy is likely due to
the multiple racial categories from the survey respondents being consolidated into the other
minority category. Classification of the survey participants also shows a large difference in the
Freshman category and this is likely a result of the minimum participation age of 19. The
University of Alabama data includes students in the freshman classification who are under age
19. Although there are differences in the sophomore, junior and senior classifications, they are
under 10%. Overall, the participants of this study seem to be a fair representation of the overall
underlying University of Alabama undergraduate population.
28

Table 1
Representativeness of Participant Population Compared to University of Alabama Full-Time Undergraduate Students Fall 2009
Participants UA Full-Time UndergraduatesAge
19 20.3% 19.7% 20 and 21 55.6% 38.5%
22 to 24 19.9% 14.9% 25 and older 4.4% 4.0%
Gender Female 61.1% 52.4% Male 38.9% 47.6%
Race White 87.2% 82.9% African American 9.7% 11.8% Other Minority 8.4% 3.9%
Classification Freshmen 11.7% 32.0% Sophomore 26.5% 20.5% Junior 29.6% 21.1% Senior 32.3% 24.0% Unclassified - 2.3%
Data Source for UA FT Undergrads: The University of Alabama 2009-2010 Factbook
Note. UA UG percentage of age 19 provided by the UA Office of Institutional Research & Assessment per information request 6/21/2010. Note. Participants who responded as Asian American/Pacific Islander, Hispanic or Latino/a, Native American or Alaskan Native, and Other are included in the Other Minority category.
Demographic Characteristics of Participants
The employment status of the participants has been utilized to determine the differences
that may be present in the demographic data of the participants. The majority of the participants
in this study are working students representing 77.2% of the participants and the remaining
22.8% are non-working students. More than half of the participants are aged 19 to 21 with
percentages decreasing with ages above 21. Additionally, at 60.3% the majority of the
participants are female. Race and ethnicity categories show the survey participants are
29

predominately White (non-Hispanic) at 86.9% and this is representative of the University of
Alabama underlying population.
Table 2 Demographic Characteristics of Participants and Employment Status Age Non-Working Working Total Percent 19 18 26 44 20.5% 20 20 44 64 29.8%
21 8 46 54 25.1% 22 2 28 30 14.0% 23 1 9 10 4.7% 24 0 3 3 1.4% 25 or older 0 10 10 4.7%
Gender Female 27 102 129 60.3% Male 22 63 85 39.7%
Race/Ethnicity African American or 6 14 20 9.3% Asian American/ Pacific Islander 1 0 1 0.5% Hispanic or Latino/a 1 11 12 5.6% Native American or Alaskan Native 0 3 3 1.4% White (non-Hispanic) 41 145 186 86.9% Other 2 0 2 0.9%
The educational attainment of the participants’ parents was another demographic
category explored in this study as seen in Table 3. The majority of the participants are non-first
generation students with 34.4% of students indicating their mother attained a bachelor’s degree
and 20.0% citing their mother had completed some college courses. Additionally, 27.9% cited
that their father attained a bachelor’s degree and 27.4% report their father completed graduate
study. Thus, a relatively small portion of the survey participants would be considered first
generation college students.
30

Table 3 Educational Attainment of Participants’ Parents and Employment Status
Non-Working Working Total Percent
Educational Attainment of Mother Elementary School or less 0 1 1 0.5% Some High School 0 3 3 1.4% High School Graduate 9 30 39 18.1% Some College 9 34 43 20.0% Associate’s Degree 2 10 12 5.6% Bachelor’s Degree 15 59 74 34.4% Some Graduate School 1 4 5 2.3% Graduate Degree 13 25 38 17.7% Unknown 0 0 0 0.0%
Educational Attainment of Father Elementary School or less 0 0 0 0.0% Some High School 0 6 6 2.8% High School Graduate 4 38 42 19.5% Some College 7 22 29 13.5% Associate’s Degree 2 10 12 5.6% Bachelor’s Degree 13 47 60 27.9% Some Graduate School 1 4 5 2.3% Graduate Degree 22 37 59 27.4% Unknown 0 2 2 0.9% Participants were also asked to report the types of financial aid they had received for the
fall 2009 semester. As shown in Table 4, more than half (53.8%) of the participants have taken
out student loans and the majority of these participants are working students. However, only
3.5% of the participants have a need-based UA Scholarship. Additionally, the next largest
financial aid category, at 46.8%, is participants who received a Merit-based UA Scholarship,
followed by 25.7% receiving a Pell Grant. Although the majority of the survey participants are
working students, only 7.6% reported having a Work Study award for the fall 2009 semester.
31
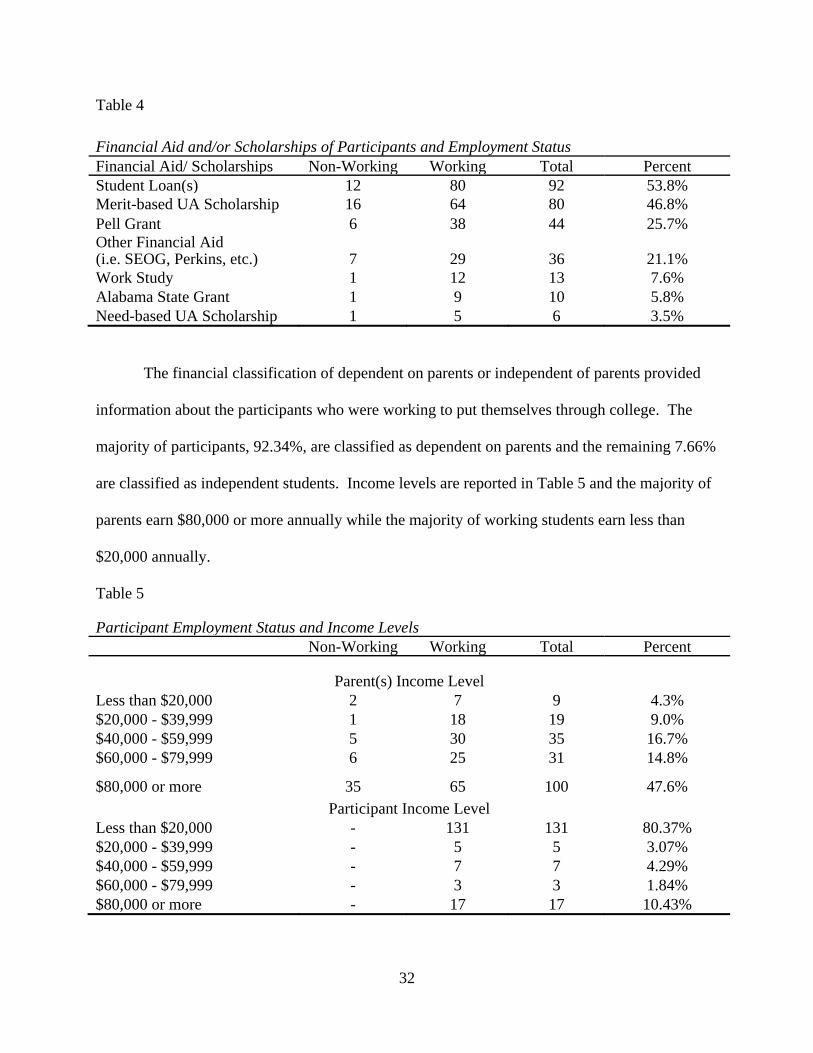
Table 4 Financial Aid and/or Scholarships of Participants and Employment Status Financial Aid/ Scholarships Non-Working Working Total PercentStudent Loan(s) 12 80 92 53.8%Merit-based UA Scholarship 16 64 80 46.8% Pell Grant 6 38 44 25.7% Other Financial Aid (i.e. SEOG, Perkins, etc.) 7 29 36 21.1%Work Study 1 12 13 7.6% Alabama State Grant 1 9 10 5.8% Need-based UA Scholarship 1 5 6 3.5%
The financial classification of dependent on parents or independent of parents provided
information about the participants who were working to put themselves through college. The
majority of participants, 92.34%, are classified as dependent on parents and the remaining 7.66%
are classified as independent students. Income levels are reported in Table 5 and the majority of
parents earn $80,000 or more annually while the majority of working students earn less than
$20,000 annually.
Table 5 Participant Employment Status and Income Levels
Non-Working Working Total Percent
Parent(s) Income Level Less than $20,000 2 7 9 4.3% $20,000 - $39,999 1 18 19 9.0% $40,000 - $59,999 5 30 35 16.7% $60,000 - $79,999 6 25 31 14.8%
$80,000 or more 35 65 100 47.6% Participant Income Level
Less than $20,000 - 131 131 80.37% $20,000 - $39,999 - 5 5 3.07% $40,000 - $59,999 - 7 7 4.29% $60,000 - $79,999 - 3 3 1.84% $80,000 or more - 17 17 10.43%
32

Comparison to National Trends
With the representativeness of the survey population being established and the basic
demographic characteristics of the participants being discussed, the data will now be discussed in
terms of comparison to national trends found in the 2007-08 National Postsecondary Student Aid
Study (NPSAS). As shown in Table 6, the percentage distribution of University of Alabama
non-working and working students is comparable to the national population with a percentage
distribution differing by only 6.9%.
Table 6 Comparison of National Population and University of Alabama Undergraduate Non-working and Working Students
Non-Working Working Number Percent Number Percent
National Population (NPSAS) - 29.7% - 70.3% University of Alabama 49 22.8% 166 77.2% Data Source for National data: U.S Department of Education, National Center for Education Statistics, 2007-08 National Postsecondary Student Aid Study (NPSAS:08)Note. Dashes indicate that NPSAS actual numbers were undeterminable based on weighted sample scheme.
The participant population of working students has been compared to the national
population of working students, and Table 7 shows the comparison based on gender
classification. Female working students show a percentage distribution difference of 8.6%
between the UA population and the national population while the difference for male working
students is only 2.08%. Thus, the working student percentage distribution by gender is very
comparable to national trends. Additionally, the working students are compared to national data
in racial classification. As shown in Table 8, the majority of working students both nationally
and at The University of Alabama are identified as White (non-Hispanic). While the national
population is more diverse than the survey participant population, both show the same top three
33
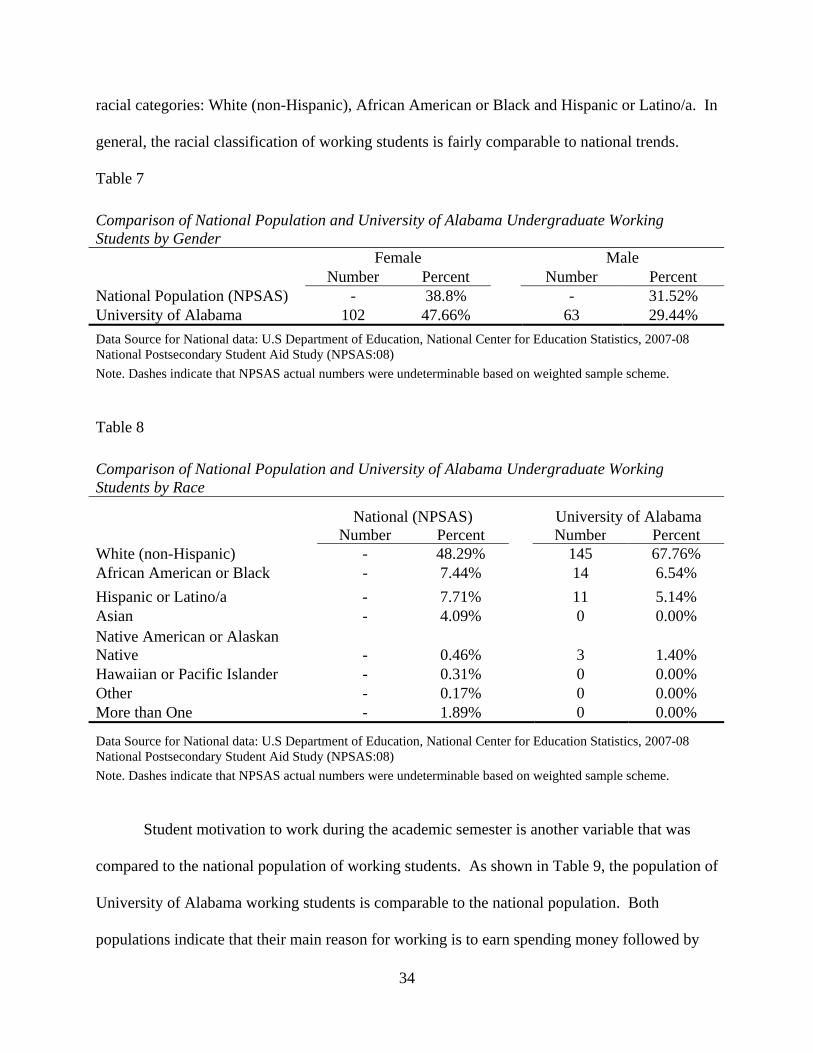
racial categories: White (non-Hispanic), African American or Black and Hispanic or Latino/a. In
general, the racial classification of working students is fairly comparable to national trends.
Table 7 Comparison of National Population and University of Alabama Undergraduate Working Students by Gender
Female Male Number Percent Number Percent
National Population (NPSAS) - 38.8% - 31.52% University of Alabama 102 47.66% 63 29.44% Data Source for National data: U.S Department of Education, National Center for Education Statistics, 2007-08 National Postsecondary Student Aid Study (NPSAS:08)Note. Dashes indicate that NPSAS actual numbers were undeterminable based on weighted sample scheme.
Table 8 Comparison of National Population and University of Alabama Undergraduate Working Students by Race
National (NPSAS) University of Alabama Number Percent Number Percent
White (non-Hispanic) - 48.29% 145 67.76% African American or Black - 7.44% 14 6.54% Hispanic or Latino/a - 7.71% 11 5.14% Asian - 4.09% 0 0.00% Native American or Alaskan Native - 0.46% 3 1.40% Hawaiian or Pacific Islander - 0.31% 0 0.00% Other - 0.17% 0 0.00% More than One - 1.89% 0 0.00%
Data Source for National data: U.S Department of Education, National Center for Education Statistics, 2007-08 National Postsecondary Student Aid Study (NPSAS:08)Note. Dashes indicate that NPSAS actual numbers were undeterminable based on weighted sample scheme.
Student motivation to work during the academic semester is another variable that was
compared to the national population of working students. As shown in Table 9, the population of
University of Alabama working students is comparable to the national population. Both
populations indicate that their main reason for working is to earn spending money followed by
34

working to pay living expenses. Although the national population gives working to pay for
educational expenses as their third reason for working while the UA population indicates gaining
job experience as their third reason, both populations show the same top four motivations for
working during the academic year. In this case, the motivations to work are rather comparable.
Table 9
Comparison of National Population and University of Alabama Undergraduate Working Students by Motivation to Work Motivation to Work National (NPSAS) University of Alabama To earn spending money 85.99% 59.33% To pay living expenses 74.60% 48.03% To pay education expenses 65.21% 25.34% To gain job experience 55.79% 44.37% Data Source for National data: U.S Department of Education, National Center for Education Statistics, 2007-08 National Postsecondary Student Aid Study (NPSAS:08)
The University of Alabama population is also compared to the national population in
terms of job location and number of hours worked per week. As shown in Table 10 below, the
majority of the working students in the national population work in off-campus jobs, while the
survey participants at UA work equally in off-campus and on-campus jobs with a small
percentage of students working both on and off campus. The job location variable is not as
comparable with the national trends as the other variables discussed previously. Number of
hours worked per week is another characteristic utilized for comparison purposes and the data is
shown below in Table 11. The percentage distribution difference between the national
population and the UA population is within ten percentage points with the exception of working
30 or more hours per week at a 10.37% difference. Additionally, working 1-10 hours per week
has the closest comparative percentage distribution with the national population at 21.0% and the
35

UA population at 21.34%. Overall, the number of hours worked per week by both populations is
fairly comparable.
Table 10 Comparison of National Population and University of Alabama Undergraduate Working Students by Job Location
National (NPSAS) University of Alabama Number Percent Number Percent
Working On Campus - 14.50% 74 45.12% Working Off Campus - 79.80% 74 45.12% Working Both On and Off Campus - 5.70% 16 9.76% Data Source for National data: U.S Department of Education, National Center for Education Statistics, 2007-08 National Postsecondary Student Aid Study (NPSAS:08)
Note. Dashes indicate that NPSAS actual numbers were undeterminable based on weighted sample scheme.
Table 11 Comparison of National Population and University of Alabama Undergraduate Working Students by Hours Worked per Week
National (NPSAS) University of Alabama Number Percent Number Percent
1-10 hours - 21.00% 35 21.34% 11-15 hours - 15.80% 35 21.34% 16-20 hours - 21.70% 50 30.49% 21-30 hours - 23.20% 31 18.90% 30 or more hours - 18.3% 13 7.93% Data Source for National data: U.S Department of Education, National Center for Education Statistics, 2007-08 National Postsecondary Student Aid Study (NPSAS:08)Note. Dashes indicate that NPSAS actual numbers were undeterminable based on weighted sample scheme.
A cross-tabulation comparison of hours worked per week by grade point average is
summarized below in Table 12. The national population shows the majority of students are
within the 3.5 to 3.0 grade point average regardless of the number of hours worked per week.
The data is slightly different in the UA population where the majority of students working 15 or
36

less hours per week are within the 4.0 to 3.6 grade point average and as the hours per week
increases to 16 to 30, the majority of students earn a grade point average of 3.5 to 3.0. In
addition, the small percentage of UA students working 30 or more hours per week is within the
4.0 to 3.6 grade point average. In general, the majority of students in both populations are
attaining at or above a 3.0 grade point average regardless of the number of hours worked per
week.
Table 12
Comparison of National Population and University of Alabama Undergraduate Working Students Number of Hours Worked per Week by Grade Point Average Grade Point Average 4.0 – 3.6 3.5 – 3.0 2.9 – 2.6 2.5 – 2.0 1.9 – 0.0
National Population (NPSAS)
1-10 hours 25.70% 36.20% 18.80% 14.20% 5.10% 11-15 hours 18.80% 38.20% 20.10% 17.70% 5.20% 16-20 hours 19.20% 35.60% 21.60% 18.30% 5.30% 21-30 hours 15.50% 35.40% 20.90% 21.60% 6.60% 30 or more hours 14.50% 32.40% 22.20% 24.40% 6.50%
University of Alabama
1-10 hours 71.43% 17.14% 5.71% 5.71% 0.00% 11-15 hours 57.14% 25.71% 14.29% 0.00% 2.86% 16-20 hours 24.00% 46.00% 18.00% 10.00% 2.00% 21-30 hours 41.94% 48.39% 3.23% 6.45% 0.00% 30 or more hours 54.55% 0.00% 9.09% 27.27% 9.09% Data Source for National data: U.S Department of Education, National Center for Education Statistics, 2007-08 National Postsecondary Student Aid Study (NPSAS:08)
Motivation to Work and Impact of Work As the survey participants were responding to questions about working during the
academic year, it was important to find out what why they were motivated to work. Table 13
shows the percentage distribution of the Likert scale question asking why the students chose to
work during the fall 2009 semester, and this question allowed the participants to select multiple
reasons for working. The majority of participants indicate that they are working to earn spending
37
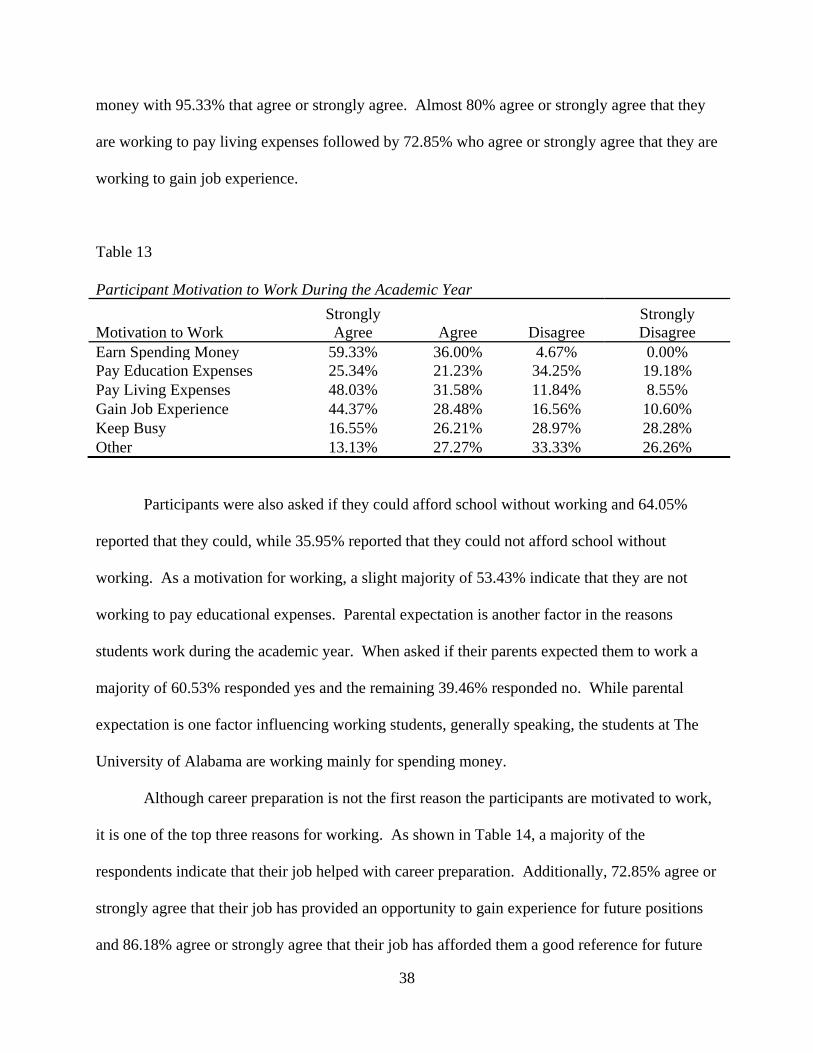
money with 95.33% that agree or strongly agree. Almost 80% agree or strongly agree that they
are working to pay living expenses followed by 72.85% who agree or strongly agree that they are
working to gain job experience.
Table 13 Participant Motivation to Work During the Academic Year
Motivation to Work Strongly Agree Agree Disagree
Strongly Disagree
Earn Spending Money 59.33% 36.00% 4.67% 0.00%Pay Education Expenses 25.34% 21.23% 34.25% 19.18% Pay Living Expenses 48.03% 31.58% 11.84% 8.55% Gain Job Experience 44.37% 28.48% 16.56% 10.60% Keep Busy 16.55% 26.21% 28.97% 28.28% Other 13.13% 27.27% 33.33% 26.26%
Participants were also asked if they could afford school without working and 64.05%
reported that they could, while 35.95% reported that they could not afford school without
working. As a motivation for working, a slight majority of 53.43% indicate that they are not
working to pay educational expenses. Parental expectation is another factor in the reasons
students work during the academic year. When asked if their parents expected them to work a
majority of 60.53% responded yes and the remaining 39.46% responded no. While parental
expectation is one factor influencing working students, generally speaking, the students at The
University of Alabama are working mainly for spending money.
Although career preparation is not the first reason the participants are motivated to work,
it is one of the top three reasons for working. As shown in Table 14, a majority of the
respondents indicate that their job helped with career preparation. Additionally, 72.85% agree or
strongly agree that their job has provided an opportunity to gain experience for future positions
and 86.18% agree or strongly agree that their job has afforded them a good reference for future
38

employment opportunities. The majority of participants also agree that their job will provide a
good reference for educational opportunities in the future.
Table 14
Career Preparation Resulting from Job Held
The job held… Strongly Agree Agree Disagree
Strongly Disagree
Helped with career preparation 31.58% 26.97% 23.03% 18.42% Was related to my career/education plans after graduation 21.19% 18.54% 37.09% 23.18% Allowed me to gain experience for future positions 27.15% 45.70% 17.88% 9.27%
Provided a good reference for future employment opportunities 37.50% 48.68% 10.53% 3.29%
Provided a good reference for future educational opportunities 26.85% 40.27% 22.82% 10.07%
Since the majority of students indicated that they are working during the academic year,
it is important to consider the impact of work on academic success and engagement. The data
shown in Table 15 is a summary of the Likert scale questions that address the specific job impact
and the general impact of work on academic success and engagement. While most of the
respondents reported that their job did not help with coursework or understanding course content,
a majority of the respondents indicate that their jobs were not related to their coursework or
major. Additionally, more than three quarters of the participants indicate that their jobs did not
restrict or limit their choice of classes, number of classes, or their academic schedule. For most
of the students, working also did not appear to negatively impact academic engagement.
39

Table 15
Impact of Working on Academic Success and Engagement The job held… Strongly Agree/Agree Strongly Disagree/Disagree Helped with coursework 33.11% 66.89% Improved understanding of course content 29.33% 70.67% Restricted class choice 19.21% 80.79% Limited class schedule 25.00% 75.00% Limited number of classes 17.88% 82.12% Related to coursework 32.67% 67.33% Related to major 36.67% 63.33%
Working limited ability to… Interact with other students 38.16% 61.84% Prepare for classes 39.87% 60.13% Communicate with Professors 22.88% 77.12%
The participants who were working during the fall 2009 academic semester also
responded to questions about the impact of working on their social experiences. A summary of
the Likert scale questions addressing how working may have limited certain social experiences is
displayed in Table 16. The percentage difference between the agree and disagree responses is
relatively small with the largest difference shown at 36.84 percentage points in the ability to
utilize campus facilities. Although a majority of 59.87% agrees that working limits their
participation in student organizations, the remaining majority of the participants do not find that
working limits their other social experiences identified in this question.
40

Table 16
Impact of Working on Social Experiences Working limited ability to… Strongly Agree/Agree Strongly Disagree/Disagree Participate in Student organizations 59.87% 40.13% Join an athletic team 41.33% 58.67% Interact with other students 38.16% 61.84% Attend fine arts events 41.72% 58.28% Attend athletic events 37.50% 62.50% Utilize campus facilities 31.58% 68.42%
Since the participants in this study are full-time students and the majority of them
indicate that they were working during the fall 2009 academic semester, the impact of these
multiple demands were addressed in a Likert scale question on the survey. Two of the
statements specifically concentrate on time limitations, and in Table 17, a majority of the
respondents indicate that both academic and work demands limit their time spent with family and
friends. On the other hand, a majority of students report that they have developed friendships
and have emotional support from their co-workers and supervisors at their workplace. Most
participants agree that their job is not stressful and that they are able to study and prepare for
classes at their job. Although combining work and school does limit the participants available
time for family, friends, and some academic and social experiences, 70.39% report that
combining work and school has made them more organized.
Participants also explained how they are able to balance the demands of school, work and
personal life in an open ended response. The major themes include time management,
organizational skills, setting school as their priority, studying during work time and limiting
activities outside of work and school. Full individual response statements are shown in
Appendix E.
41

Table 17
Impact of Working on Participant Life Balance and Well Being
Strongly Agree/
Agree Strongly Disagree/
Disagree Academic demands limit my time with family and friends 67.33% 32.67% Work demands limit my time with family and friends 61.59% 38.41% Work provides a means of emotional support and friendships with co-workers and supervisors 60.93% 39.07% My job is stressful 35.10% 64.91% My job allows time for me to study and prepare for my classes 61.33% 38.66% Combining work and school has made me more organized 70.39% 29.60%
Job Location: On-Campus and Off-Campus
The survey participants answered a variety of questions about working during the
academic semester and how their work impacted their academic success, engagement and their
social experiences. Once the participants indicated that they held at least one job while enrolled
during the academic semester, they progressed through the survey to report whether they worked
on-campus, off-campus or both. If they held more than one job during the academic semester,
the participants were asked to indicate whether the job where they worked the most hours was
located on or off campus. The respondents answered the remaining questions in the survey
based on the job location where they worked the most hours.
Job location data was utilized to determine if there were any trends in the comparison of
on-campus jobs and off-campus jobs. As previously shown in Table 10, the respondents that
work on-campus and off-campus are equally distributed at 45.12% each and the remaining
9.76% indicated they work both on and off campus. After the respondents reported the location
42

of the job where the most hours were worked, the on-campus and off-campus distribution
resulted in an even division of 50.0% each.
The initial comparison of job location and academic success was analyzed in terms of the
number of hours per week the participants spent studying or preparing for classes. As shown in
Table 18, the percentage distribution is fairly comparable for those participants studying 1-15
hours per week with the largest percentage distribution difference of 4.52 percentage points in
the 1-5 hour studying category. As the participants reported study time 16 hours per week or
more, the off-campus workers held a slight majority.
Table 18
Number of Hours per Week Spent Studying or Preparing for Classes by Job Location Study Hours per Week On Campus Off Campus 1 - 5 34.15% 29.63% 6 - 10 34.15% 34.57% 11 - 15 18.29% 18.52% 16 - 20 9.76% 12.35% More than 20 3.66% 4.94%
As discussed previously, participants were asked to respond to Likert scale questions that
addressed the impact work on academic success and engagement. Some of the initial responses
to these questions were shown previously in Table 15; however, these variables are presented
with a cross-tabulation by job location in Table 19. The majority of participants, regardless of
job location report that they do not have to modify or reduce their academic schedule in order to
combine work and school. While more on-campus workers report that their job helped with their
coursework than off-campus workers, in contrast, more off-campus workers than on-campus
workers indicate that their job improved their understanding of course content and their job was
related to their coursework and major. More than half of the off-campus workers report that
43
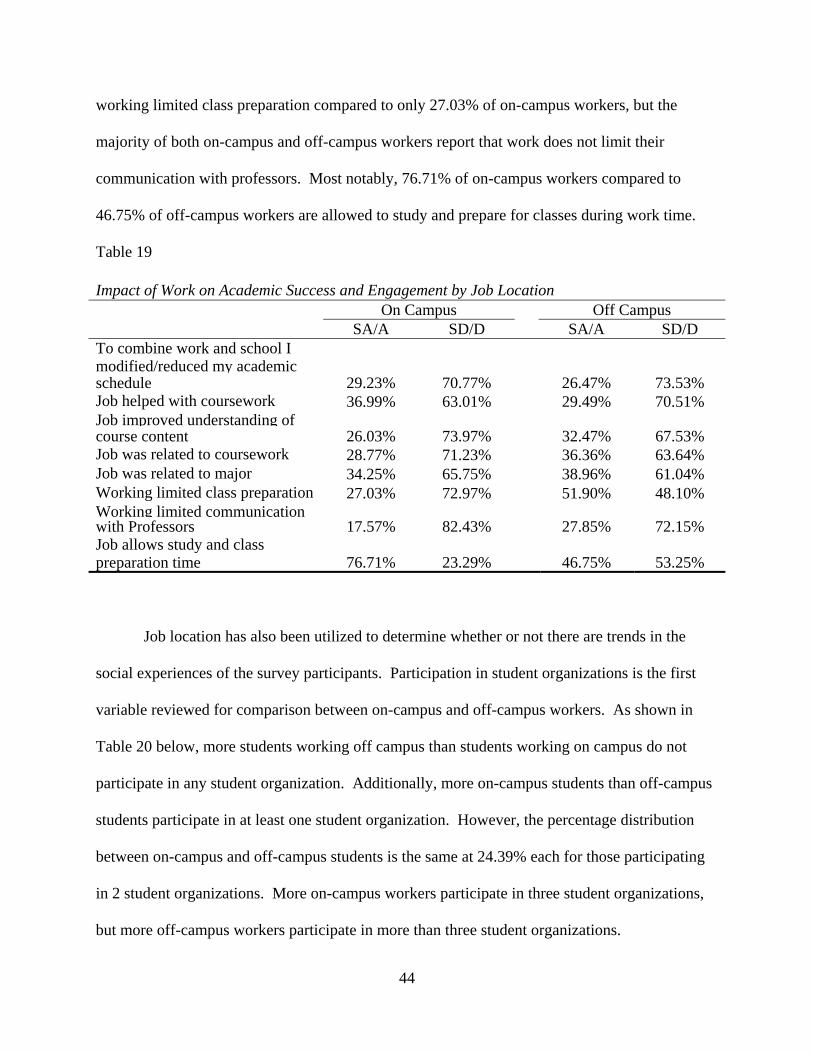
working limited class preparation compared to only 27.03% of on-campus workers, but the
majority of both on-campus and off-campus workers report that work does not limit their
communication with professors. Most notably, 76.71% of on-campus workers compared to
46.75% of off-campus workers are allowed to study and prepare for classes during work time.
Table 19
Impact of Work on Academic Success and Engagement by Job Location On Campus Off Campus SA/A SD/D SA/A SD/D
To combine work and school I modified/reduced my academic schedule 29.23% 70.77% 26.47% 73.53%Job helped with coursework 36.99% 63.01% 29.49% 70.51% Job improved understanding of course content 26.03% 73.97% 32.47% 67.53%Job was related to coursework 28.77% 71.23% 36.36% 63.64% Job was related to major 34.25% 65.75% 38.96% 61.04% Working limited class preparation 27.03% 72.97% 51.90% 48.10% Working limited communication with Professors 17.57% 82.43% 27.85% 72.15%Job allows study and class preparation time 76.71% 23.29% 46.75% 53.25%
Job location has also been utilized to determine whether or not there are trends in the
social experiences of the survey participants. Participation in student organizations is the first
variable reviewed for comparison between on-campus and off-campus workers. As shown in
Table 20 below, more students working off campus than students working on campus do not
participate in any student organization. Additionally, more on-campus students than off-campus
students participate in at least one student organization. However, the percentage distribution
between on-campus and off-campus students is the same at 24.39% each for those participating
in 2 student organizations. More on-campus workers participate in three student organizations,
but more off-campus workers participate in more than three student organizations.
44
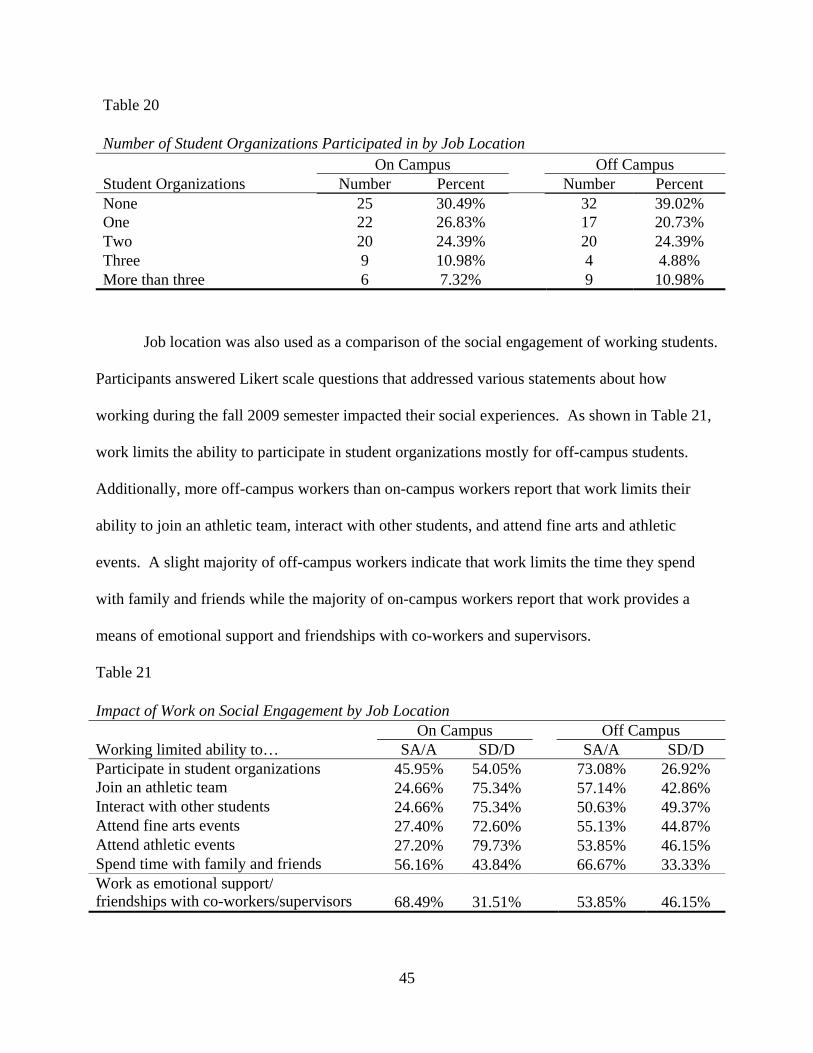
Table 20
Number of Student Organizations Participated in by Job Location On Campus Off Campus Student Organizations Number Percent Number Percent None 25 30.49% 32 39.02%One 22 26.83% 17 20.73% Two 20 24.39% 20 24.39% Three 9 10.98% 4 4.88% More than three 6 7.32% 9 10.98%
Job location was also used as a comparison of the social engagement of working students.
Participants answered Likert scale questions that addressed various statements about how
working during the fall 2009 semester impacted their social experiences. As shown in Table 21,
work limits the ability to participate in student organizations mostly for off-campus students.
Additionally, more off-campus workers than on-campus workers report that work limits their
ability to join an athletic team, interact with other students, and attend fine arts and athletic
events. A slight majority of off-campus workers indicate that work limits the time they spend
with family and friends while the majority of on-campus workers report that work provides a
means of emotional support and friendships with co-workers and supervisors.
Table 21
Impact of Work on Social Engagement by Job Location On Campus Off Campus
Working limited ability to… SA/A SD/D SA/A SD/D Participate in student organizations 45.95% 54.05% 73.08% 26.92% Join an athletic team 24.66% 75.34% 57.14% 42.86% Interact with other students 24.66% 75.34% 50.63% 49.37% Attend fine arts events 27.40% 72.60% 55.13% 44.87% Attend athletic events 27.20% 79.73% 53.85% 46.15% Spend time with family and friends 56.16% 43.84% 66.67% 33.33% Work as emotional support/ friendships with co-workers/supervisors 68.49% 31.51% 53.85% 46.15%
45

CHAPTER IV:
FINDINGS, CONCLUSIONS, AND RECOMMENDATIONS
Introduction
The purpose of this study was to investigate the characteristics of full-time undergraduate
students at The University of Alabama who hold positions of paid employment during the
academic year. The results of this study have been compared to the findings from the 2008
National Postsecondary Student Aid Study (NPSAS) to determine how the student employee
population at The University of Alabama compares to national trends. Additionally, the study
intended to determine what motivated the students to hold employment during the academic
semester and how the demands of working affected the academic success and engagement, the
social engagement and the overall life balance and well being of these undergraduate student
employees. Finally, the study reviewed job location, on campus or off campus, to determine
how the academic success and social engagement of the participants may be different in relation
to the physical location of their work place.
The participants in the student employment study were randomly selected from a report
from The University of Alabama, Office of the Registrar. This report was a listing of the
Crimson Mail email addresses for full-time undergraduate students that were at least 19 years of
age or older, enrolled during the fall 2009 semester and confirmed for enrollment in the spring
2010 semester. These parameters returned a total count of 14,612 potential participants from the
46
21,738 total undergraduate count for fall 2009, and 2100 were invited to participate in the study.
The recruitment resulted in 239 beginning the survey, 237 agreeing to participate and 207 who
completed the survey. Based on the 2100 invited, the response rate was 11.38% with an
acceptance rate of 11.29% and a completion rate of 9.86%. The survey participation rate was not
ideal, but the information gleaned from these participants is important and will add to the current
literature regarding student employment.
Findings
In order to determine the representativeness of the sample, the participant demographic
characteristics were compared to The University of Alabama undergraduate student
demographics as reported in The University of Alabama 2009-2010 Factbook. When compared
to the overall underlying undergraduate student population at UA, the survey participants are
fairly representative. Slight variations are seen in age, gender and racial categories. In terms of
age, the percentage distribution difference between the UA population and the participants is
fairly moderate with the exception of the 20 and 21 age category. Those aged 20 and 21 show a
percentage difference of approximately 17% which may be attributed to more than half of the
survey participants being aged 20-21. Age categories 19, 22 to 24 and 25 and over are more
comparable than the 20-21 age group.
Representativeness of the sample is very close in terms of gender. The University of
Alabama undergraduate population is 52.4% female and 47.6% male, while the participants are
61.1% female and 38.9% male. The percentage difference overall is 8.7% with more female
students responding to the study than male students. Racial classification is very comparable
between the participants and the UA population with all percentage distribution differences
under 5%. The highest discrepancy is seen in the “other” minority category and this is likely due
47

to the multiple racial categories within the survey participants being consolidated into the other
minority category for comparison to the UA population. Student classification is the final
category used to determine representativeness of the sample and, in general, the classifications
are fairly representative. The largest difference is in the freshman category and this is likely
resulting from the minimum study participation age of 19, as where the UA population of
Freshman students would typically include those who are 18 years of age. Overall, the
participants of this study seem to be a fair representation of the overall underlying University of
Alabama undergraduate population.
The demographic characteristics of the participants were also compared based on their
employment status and this comparison was completed based on a cross-tabulation of the
responses to survey question number 17, which asks the respondent to select the number of jobs
held during the fall 2009 semester. Those that responded none were listed as non-working and
those responding that they held at least 1 job were listed as working. The findings show that
77.2% of the respondents are working students and 22.8% are non-working students. Overall,
the majority of the study participants are White (non-Hispanic), female, working students.
Participants were also asked to report on the educational attainment of their parents and
this data was reviewed to determine whether the respondents are first generation college students
or not. The majority of the participants are non-first generation students with 34.4% of the
students indicating their mother attained a bachelor’s degree. In addition, 27.9% of the students
reported that their father attained a bachelor’s degree and 27.4% of fathers completed graduate
study. Only 21.13% percent of the participants are considered first generation college students
whose parents that did not enroll in post-secondary education.
48
Financial characteristics were the final demographic categories reported by the
participants. The types of financial aid and/or scholarships received during the fall 2009
semester were reported and the results were cross-tabulated by employment status. More than
half of the participants indicated they have taken out a student loan, followed by 46.8% who
report receiving a merit-based UA scholarship. The financial classification of the students as
independent of parents or dependent on parents was derived from the questions about income
levels for parents and individual students. The majority of the participants (92.34%) are
considered dependent. Additionally, the majority of the respondents’ parents earn $80,000 or
more annually and the majority of the working students have individual incomes of less than
$20,000 annually.
The findings of this study suggest that The University of Alabama undergraduate student
population is comparable to the overall national population of undergraduate students in terms of
their employment status. Nationally, 70.3% of undergraduate students at four-year public
universities work during the academic year while 77.2% of the UA study participants are
working. In terms of gender comparison, the national population of working students is 38.8%
female and 31.52% male, and respectively, the participants are 47.66% female and 29.44% male.
This is likely due to the study participants being 61% female, where there is a closer gender
distribution in the national data. Racial classifications are also comparable with the majority of
the national population and the UA study participants being White (non-Hispanic), followed by
African American or Black and then Hispanic or Latino/a. Although the national population
represents a more diverse population, both the national and the UA population share the same top
three racial categories. Motivation to work during the academic year was also compared to the
49

national trends and both populations cite working for spending money as their first reason,
followed by working to paying living expenses.
The study participants were asked to answer questions that related to the impact of
working during the academic semester on their academic success and engagement. Most of the
respondents indicated that their job did not help with coursework or their understanding of
course content, a majority also reported that their job was not related to their coursework or
major. Further, more than three quarters of the participants indicated that their job did not limit
their choice of classes, number of classes or their academic schedule. Overall, for most of the
students, working did not impact their academic success and engagement in a negative way.
The impact of working during the academic semester on social engagement was
examined in this study and the general findings indicate that, for the majority of the respondents,
work has not impacted their social experience aside from the ability to participate in student
organizations with 59.87% reporting work did limit this outlet. Although the majority of
students would agree that working does not limit their social experiences, the largest percentage
difference between those who agree and disagree about the limitations is 36.84 percentage
points, and this indicates that there is a significant population of students who feel that work does
limit their social experiences.
For students who are attempting to balance the multiple demands of school, work and
personal life, available time is a factor. The majority of the participants indicate that both
academic and work demands limit their time spent with family and friends. However, many of
the participants agree that work provides valuable friendships and emotional support. Overall,
combining work and school limits the participants available time for family, friends and some
50

academic and social experiences. However, 70.39% report that balancing these multiple
demands has made them more organized.
To further analyze the survey data, employment questions were compared based on the
job location reported by the participant. The percentage of students working on campus and off
campus is equally distributed at 50% in each location. For the most part, job location did not
influence the number of study hours per week reported by the participants. Job location also did
not impact academic scheduling. However, differences are found in comparing class preparation
and study time. More than half of the off campus workers report that working limited their
preparation for classes while 76.71% of the on campus workers are allowed to study and prepare
for classes during work time. In terms of social experiences, most of the participants working off
campus report that work limits their ability to participate in student organizations, with a slight
majority indicating that work limits their ability join athletic teams, interact with other students
and attend athletic and fine arts events.
Conclusions from Research Questions
As discussed previously, the purpose of this study was to glean a basic understanding of
the undergraduate students at The University of Alabama in terms of their status as working or
non-working students. In general, the study focused on determining the percentage of
undergraduate students that work during the academic year, uncovering the motivation to work
while enrolled full-time, and discovering how working during the academic year impacts
academic success, social engagement and overall student well being. These results are discussed
below as each of the eight research questions guiding this study are answered.
51

Research Question One
How does the percentage of UA undergraduate students that hold positions of paid employment
during the academic semesters compare with the national trends found in the 2008 NPSAS?
To determine the national population for comparison purposes, the researcher utilized the
U.S. Department of Education, National Center for Education Statistics (NCES) to review the
2008 National Postsecondary Student Aid Study (NPSAS) data. Utilizing the data tools
available on the NCES website, the data from the 2008 NPSAS was filtered to return only
responses from full-time undergraduate students at four year public universities. Based on these
parameters, the data indicates that 70.3% of students work during the academic year. The
University of Alabama percentage of undergraduate student workers found is this study is
77.2%. In terms of gender, the national data shows 38.8% female and 31.52% male, while the
UA population is 47.66% female and 29.44% male. In the total percentage of working students
and the gender comparison scenarios, the percentage difference between the national data and the
study participants is less than 10%.
Additionally, both the national population and the UA population hold the same top three
racial categories, with the majority of the respondents being White (non-Hispanic). The
comparison of racial characteristics shows a larger percentage distribution difference in the
White (non-Hispanic) category, 48.29% nationally and 67.76% in the study population. This
difference is likely a result of the national population being more diverse than the UA
population. Although the sample size for this study was less than ideal, overall, the percentage of
UA students holding positions of paid employment during the academic year and their
demographic characteristics are comparable to national trends.
52
Research Question Two
How do the characteristics of UA undergraduate students compare to the national data
regarding on campus jobs, off campus jobs and number of hours per week worked during the
academic year?
When the UA population is compared to the national population in terms of job location,
the results are not as comparable. The majority of the respondents to the national study work off
campus at 79.80%. This study finds that the job location of the UA respondents is evenly
distributed with on campus workers and off campus workers being 50% each. Although job
location is not comparable with the national trends, the literature indicates that on-campus work
supports student involvement and engagement (Astin, 1999; Kuh et al., 1991) and it is a positive
finding that half of the UA students do work on campus. The number of hours worked per week
by the national population and the UA population are fairly comparable with the largest
percentage distribution difference being with students working 30 or more hours per week,
18.3% nationally and 7.93% at UA. Again, although this category in not as comparable, it is an
encouraging finding since the literature indicates that as students work more hours, their
academic success and social engagement decreases (Astin, 1993; Kulm & Cramer, 2006; King,
2007)
Research Question Three
What are the primary reasons and/or motivations for UA undergraduate students to hold
positions of paid employment?
The study participants were directly asked to indicate their primary motivation to work
during the academic year and they were allowed to respond to multiple reasons. Overall, the vast
majority of the respondents (95.33%) report they are working primarily for spending money,
53
followed by 80% who are working to pay their living expenses, and 72.85% who indicate they
are working to gain job experience. When asked specifically about their job, the majority of the
respondents indicate their job allowed them to gain experience for future positions and provided
a good reference for employment opportunities in the future. Additionally, 60.53% of the
participants agree that their parents expect them to work during the academic year, but the reason
for this expectation was not captured. Also, 35.95% of the population reports that they could not
afford school if they did not work.
Research Question Four
How does working for pay during the academic year affect students’ academic engagement and
success?
The effect of working for pay during the academic year was determined by a series of
Likert scale items addressing how working limited various academically engaging behaviors.
The majority of the participants indicate that their job did not restrict or limit their choice of
classes, number of classes or their academic schedule. Additionally, for most of the respondents,
their job did not limit interaction with other students, communication with professors or class
preparation. Although many of the respondents indicate that their job did not help with
coursework or their understanding of course content, most also indicate that their jobs were not
related to their coursework or major. Participants also self reported their grade point average and
80% of the working students have a GPA of 3.0 or above. For the population of students at The
University of Alabama, working during the academic year does not appear to have impacted
academic engagement in a negative way.
54
Research Question Five
How does working for pay during the academic year affect students’ social experiences?
The impact of working during the academic year on students’ social experiences was also
determined through a series of Likert scale questions addressing what behaviors working has
limited. For 60% of the students, work limits their ability to participate in student organizations.
Although most students indicate that work does not limit their participation in athletics or their
attendance of fine arts and athletic events, around 40% of the participants indicated that it did.
Research Question Six
How do the demands of school, work, family and personal life affect students’ well being?
The effect of combining school and work was addressed through a series of Likert scale
questions addressing various statements about academic demands, work demands, and personal
life. The majority of the participants indicate that both academic demands and work demands
limit the time they spend with family and friends. However, most of the participants report that
work provides them with friendships and emotional support. Although time may be limited for
family and friends outside of work, many of the participants are developing relationships with
co-workers and supervisors. Additionally, 70.39% report that combining work and school has
made them more organized.
Participants were also asked to describe how they have been able to balance the demands
of school, work and personal life through an open ended response. The most common responses
include time management, organizational skills, and setting their academic work as their first
priority. Additionally, some participants, more often those who work on campus, indicate that
they are allowed to complete academic assignments during their work hours. Limiting time for
55

activities outside of school and work is another way students are balancing these multiple
demands. Appendix E provides the full statements from the participants.
Research Question Seven
What differences exist between students who work on campus and off campus in terms of
academic engagement?
Utilizing the responses to questions that address academic engagement, a cross-tabulation
by job location was performed to determine if differences appear for students who work on
campus compared to those who work off campus. A comparison of the number of hours spent
studying or preparing for classes shows little difference based on job location, however, 76.71%
of on campus workers compared to 46.75% of off campus workers are allowed to study and
prepare for classes during work time. Job location seems to impact items addressing courses and
major with more on-campus workers reporting their job helped with coursework. Conversely,
more off-campus workers indicate that their jobs improved their understanding of course content
and that their job was related to their major. The most significant difference is seen in class
preparation. While the majority of on-campus workers can study during work time, workers
with off-campus jobs report that these jobs limit class preparation time. This difference may
result from the perspective of supervisors and the nature of work, with on-campus supervisors
understanding that students should make their academic work a priority.
Research Question Eight
What differences exist between students who work on campus and off campus in terms of social
engagement?
Again, the responses to questions addressing social engagement were cross-tabulated by
job location to determine if differences are seen between students who work on campus
56
compared to those who work off campus. Participation in student organizations was one
indicator of social engagement, and more off campus workers than on campus workers do not
participate at all. However, as participants reported the number of student organizations, the
results change and the same percentage of off campus and on campus workers participate in two
organizations. Surprisingly more off campus workers than on campus workers participate in
more than three organizations. The caveat is the term participate, and this potentially has
different meaning for the respondents. For some, they may just be members, where others may
be more active members or perhaps organization officers.
Likert scale responses to statements about the effect of work on social experiences were
analyzed and, for more off campus workers than on campus workers, their job limited their
ability to join an athletic team, interact with other students and attend fine arts and athletic
events. These findings are consistent with the literature regarding student involvement and
engagement since on campus employment has been found to better support student involvement
and engagement (Astin, 1999; Kuh et al., 1991). Additionally, more on campus workers report
that work provides a means of emotional support and friendships with co-workers and
supervisors. This could be a result of a shared perspective between individuals within the
academic community. The findings also show that work limits time spent with friends and
family for both on campus and off campus workers.
Recommendations
Although the literature about student employment has mixed conclusions regarding the
impact of working during the academic year, general best practices have been identified. In
terms of the number of hours worked, recommendations suggest limiting the number of hours
worked per week to 20 (Pike et al., 2008; Dundes & Marx, 2006). Additionally, it is
57
recommended that students work on campus rather than off campus because on campus
employment supports academic success and engagement while off campus work tends to limit
student opportunities for academic engagement. Students who are physically spending more
time on campus are more likely to be involved and participate in campus life experiences (Astin,
1999; Lingrosso, 2007; Cermak & Filkins, 2007; Noel, 1996).
Institutions of higher education have a unique opportunity to expand student learning
through practical application of coursework in an on campus employment opportunity.
Additionally, on campus student employment opportunities would benefit from the development
of learning outcomes that match the overall mission of the institution, each division and the
individual operating departments. As more institutions are advertising student employee
positions within their human resources department, there is a need for detailed job descriptions
and expectations. Student employment programs provide an opportunity for faculty and staff
collaboration since both parties are focused on student success and the attainment of knowledge.
Another opportunity for collaboration exists between human resources and the
departments that have students in their employ. As a partner with employing departments,
human resources could develop training and professional development programs specifically for
student employees. In addition to training targeted toward professional development, workshops
that address stress management would also be beneficial to working students as they cope with
the pressures of balancing their academic work and their job demands. Since the majority of
students are working during the academic year, it is important to address the issues of life
balance and stress management.
Given that on campus employment opportunities can be utilized to further student
learning and development, further research should specifically investigate on campus student
58
employment programs. At many institutions, the Division of Student Affairs is a leader in
providing work experience for students (Perozzi, 2009; Sturgean, 2006). Areas such as student
union management, student recreation and student housing and residential communities are
beginning to develop specific job descriptions and learning objectives. Some institutions are also
beginning to develop student employment programs at the divisional level where students are
developing leadership and communication skills within a broader scope. A comparison study of
the student employment programs at various institutions may result in determining how
consistent learning objectives can be developed and best practices for these programs.
A limitation to this study is the minimum participation age of 19. Although there are
full-time undergraduate students attending The University of Alabama who are under the age of
19, the legal age of majority in the state of Alabama is 19 years of age. If participants under age
19 were recruited, they would need parental consent to participate in this study.
Although the survey instrument for this study provided a basic level of knowledge about
the student employment trends at The University of Alabama, adjustments to the instrument and
the overall study design are recommended if the study were to be replicated in the future.
Addressing the response rate, potential participants may have decided the study did not apply to
them since the study title was Student Employment Study. If the recruited students are not
employed, they may dismiss participation so it is important that the invitation email address the
need for all students to respond whether they are working or not. Additionally, the survey was
designed with logic that automatically moves the participants along based on responses to
previous questions. In this study, the skip question logic did not work as expected, and
participants who should have exited the survey based on their response to the first employment
59
question remained in the survey. This required additional manual organization of the data prior
to analysis.
It is also recommended that some of the survey questions be worded more precisely to
limit possible interpretation from both participant and researcher. For example, in question
number 16 the respondents were asked to indicate the number of student organizations they
participated in, but the term participate does not indicate the level of activity with these
organizations. Students may have counted organizations that they simply joined but did not
actively participate in. Another example of imprecise question wording is shown in question
number 35. One of the variables asks if their job allows time for me to study and prepare for my
classes and this could be interpreted as allowing studying during work hours or that the job held
allows for available time outside of work to study.
Additionally, the instrument addresses characteristics such as first generation college
student status and dependent or independent student status by deriving information from other
related questions. It is recommended that these specific characteristics be directly addressed.
Employment status and job location were determined through a series of three questions, which
was cumbersome. Although by reporting the number of jobs held, the participants were
confirming whether they worked or not, employment status would be better determined from a
yes or no question. In the analysis of the data, the number of jobs was not considered since the
participants were asked to answer the employment questions based on the job where they worked
the most hours.
When collecting the income levels of parents, the highest annual combined income
category available to select was $80,000 or more. It is recommended to add additional income
60
levels up to $150,000 to this variable because this data may provide new information about
working students from high income families.
In this study, only the data that determined representativeness of the sample population
and data that answered the eight research questions were analyzed. There are opportunities for
further analysis of the collected data that include comparisons of employment status by first
generation college students, comparisons of students who cannot afford school without working
by financial aid received, comparisons of job location by type of work performed and cross-
tabulating the data by class rank. Other variables such as place of residence, number of credit
hours completed in the semester, and skills developed through job experience could provide
additional findings outside of the research questions addressed in this study.
Additionally, an in-depth qualitative analysis of the responses to question number 37 is
recommended since there seem to be trends in the way students describe their ability to balance
the demands of school, work and personal life. Several respondents mention utilizing
organization and time management skills to balance multiple demands. Respondents also
indicate they have to limit sleeping hours to complete all of their tasks, while others state they
are allowed to study and read on the job. A qualitative analysis of this data could provide
additional findings about life balance and well being of student employees.
The findings in this study can provide insight on the characteristics of full-time
undergraduate working students at The University of Alabama. However, as the data is
reviewed, it is important to consider the interpretation of the data within the context of this
university specifically. There are various stakeholders in the issue of student employment at The
University of Alabama including students, faculty, staff and administrators, and it is important to
consider their perspective when analyzing and interpreting the findings from this study.
61
Concluding Observations
The employment of college students is not a new trend, and with the majority of the
undergraduates reporting that they are working during the academic semester, it is an important
issue in higher education. Although there are mixed conclusions about whether working
supports or undermines academic success and engagement in the campus community, many
studies suggest best practices for work conditions. Students are working for a variety of reasons
from financial need to career preparation and it is important to support them as they balance the
multiple demands on their time. As a working student myself, I have continued to develop my
time management and organizational skills as I have implemented them in my academic life,
professional life and personal life. Overall, the concern with student employment is the
allocation of time and, as time is allocated toward work commitments, less time is available for
academic work and campus life opportunities. As we continue to progress as a multi-tasking
culture, it will be critical to educate students about the importance of stress management, life
balance and their overall personal well being.
62
REFERENCES
Astin, A. W. (1999). Student involvement: A developmental theory for higher education. Journal of College Student Development, 40(5), 518-529.
Astin, A. W. (1996). Involvement in learning revisited: Lessons we have learned. Journal of
College Student Development, 37(2), 123-134. Astin, A. W. (1993). What matters in college? Four critical years revisited. San Francisco:
Jossey-Bass. Astin, A. W. (1975). Preventing students from dropping out. San Francisco: Jossey-Bass. Banta, T. W., & Kuh, G. D. (1998). A missing link in assessment. Change, 30(2), 40-47. Baum, S. & Ma, J. (2008). Trends in college pricing. Retrieved on May 1, 2010, from
http://www.collegeboard.com Brooks, R. (2006). Learning and work in the lives of young adults. International Journal of
Lifelong Education, 25(3), 271-289 Canabal, M. E. (1998). College student degree of participation in the labor force: Determinants
and relationship to school performance. College Student Journal, 32(4), 597-605. Cermak, K., & Filkins, J. (2007). On-campus employment as a factor of student retention and
graduation. The Journal of Student Employment, 11(1), 10-14. Cheng, D. X., & Alcàntara, L. (2007). Assessing working students’ college experiences: A
grounded theory approach. Assessment & Evaluation in Higher Education, 32(3), 301-311.
Chickering, A. W., Frank, I. & Robinson, V. (1996). Encouraging student development through
student employment [Monograph]. In R. Kincaid (Ed.), Student Employment: Linking College and the Workplace (pp. 11-24). Columbia, SC: National Resource Center for The Freshman Year Experience & Students in Transition.
Dundes, L., & Marx, J. (2006). Balancing work and academics in college: Why do students
working 10 to 19 hours per week excel? Journal of College Student Retention, 8(1),107-120.
Epstein, J. (2009, October 8). Will work for beer. Inside Higher Ed. Retrieved December 8,
2009, from http://www.insidehighered.com/layout/set/print/news/2009/10/08/work
63

Foreman, R. (1993). UPS study relates student employment to job hunting success after
graduation. Journal of Student Employment, Special Edition. Furr, S. R., & Elling, T. W. (2000). The influence of work on college student development.
NASPA Journal, 37(2), 454-470. Hayek, J., & Kuh, G. D. (2004). Principles for assessing student engagement in the first year of
college. Assessment Update, 16(2), 11-13. Hood, A. B., Craig, A. F., Ferguson, B. W. (1992). The impact of athletics, part-time
employment and other activities on academic achievement. Journal of College Student Development, 33(5), 447-453.
Kincaid, R. (1996). Using your student employment experience in the job search [Monograph].
In R. Kincaid (Ed.), Student Employment: Linking College and the Workplace (pp. 11-24). Columbia, SC: National Resource Center for The Freshman Year Experience & Students in Transition.
King, J. E. (2007). Working their way through college: Student employment and its impact on
the college experience. The Journal of Student Employment, 11(1), 15-27. King, J. E. (1999). Helping students balance work, borrowing and college. About Campus, 4(4),
17-22. King, T. & Bannon, E. (2002). At What Cost? The Price That Working Students Pay For A
College Education. The State PIRGs’ Higher Education Project. United States Public Interest Research Group, Washington, DC.
Kuh, G. D. (2009). The national survey of student engagement: Conceptual and empirical
foundations. New Directions for Institutional Research, 2009 (141), 5-20. Kuh, G. D. (2003). What we’re learning about student engagement from NSSE. Change, 35(2).
24-32. Kuh, G. D. (2001). Assessing what really matters to student learning. Change, 33(3), 10-17, 66. Kuh, G. D. (1995). The other curriculum: Out-of-class experiences associated with student
learning and personal development. Journal of Higher Education, 66(2), 123-133. Kuh, G. D., Cruce, T M., Shoup, R., Kinzie, J., Gonyea, R. M. (2008). Unmasking the effects of
student engagement on first-year college grades and persistence. The Journal of Higher Education, 79(5), 540-563.
64
Kuh, G. D., Kinzie, J., Schuh, J. H., Whitt, E. J., & Associates. (2005). Student success in college, creating conditions that matter. San Francisco: Jossey-Bass.
Kuh, G. D., Schuh, J. H., Whitt, E. J., & Associates (1991). Involving colleges, successful
approaches to fostering student learning and development outside the classroom. San Francisco: Jossey-Bass.
Kulm, T. L. & Cramer, S. (2006). The relationship of student employment to student role, family
relationships, social interactions and persistence. College Student Journal, 40(4), 927-938.
Lewis, J. S. (2008). Student workers can learn more on the job. The Chronicle of Higher
Education, 54(1), A-56. Lingrosso, C. S. (2007). Student engagement and career development through the first year
student employment experience. Journal of Student Employment, 11(1), 4-9. Lipka, S. (2007). More students seek campus jobs as work-study positions dwindle. The
Chronicle of Higher Education, 53(21), A40-A41. McCartan, A. (1988). Students who work: Are they paying too high a price? Change, 20(5), 10-
20. Mulugetta, Y., & Chavez, D. (1994). National student employment survey: A review of why
students choose to work and students’ overall perceptions of the academic year work experiences. Journal of Student Employment, 6(1), 1-12.
National Center for Education Statistics. (2008). National postsecondary student aid study, 2008
[Data File]. Retrieved May 1, 2010, from http://nces.ed.gov/surveys/npsas/ National Center for Education Statistics. (2004). National postsecondary student aid study, 2004
[Data File]. Retrieved May 1, 2010, from http://nces.ed.gov/surveys/npsas/ Noel, L. (1996). The student employment professional – An emerging partner in student success
[Monograph]. In R. Kincaid (Ed.), Student Employment: Linking College and the Workplace (pp. 79-89). Columbia, SC: National Resource Center for The Freshman Year Experience & Students in Transition.
Pascarella, E., Bohr, L., Nora, A., Desler, M., & Zusman, B. (1994). Impacts of on-campus and
off-campus work on first year cognitive outcomes. Journal of College Student Development, 35 (5), 364-370.
Pascarella, E., & Terenzini, P. (2005). How college affects students. San Francisco: Jossey-
Bass.
65

Pascarella, E., & Terenzini, P. (1991). How college affects students. San Francisco: Jossey- Bass.
Perozzi, B. (Ed.). (2009). Enhancing student learning through college employment.
Bloomington, IN: Association of College Unions International. Pike, G. R., Kuh, G. D., Massa-McKinley, R. (2008). First-year students’ employment,
engagement, and academic achievement: Untangling the relationship between work and grades. NASPA Journal, 45(4), 560-582.
Planty, M., Hussar, W., Synder, T., Provasnik,S., Kena, G., Dinkes, R., Kewal-Ramani, A., &
Kemp, J. (2008). The Condition of Education 2008 (NCES 2008-031). Washington, DC: National Center for Education Statistics, Institute of Education Sciences, U.S. Department of Education.
Schmidt, P. (2004). Paying the price for tuition increases. Chronicle of Higher Education, 51
(3), A20-A22. Stern D. & Nakata, Y. (1991). Paid employment among U.S. college students. The Journal of
Higher Education, 62(1), 25-43. Sturgeon, J. (2006). Working for a living. College Planning & Management, 38-41. University of Alabama, Tuscaloosa, Office of Institutional Research & Assessment. (2009). The
University of Alabama Factbook 2009-2010. Retrieved April 27, 2010, from http://oira.ua.edu/factbook/2009-2010/UA_2009_2010_Factbook.html
Van De Water, G. (1989). The effect of part-time work on academic performance and progress.
Journal of Student Employment, 1(1), 5-12 Wilike, C., & Jones, M. (2006). Academic benefits of on-campus employment to first-year
developmental education students [Monograph]. In R. Kincaid (Ed.), Student Employment: Linking College and the Workplace (pp. 79-89). Columbia, SC: National Resource Center for The Freshman Year Experience & Students in Transition.
66

APPENDICES
67

Appendix A
Institutional Review Board (IRB) Approval Letter
68

Appendix B
Informed Consent Form
69
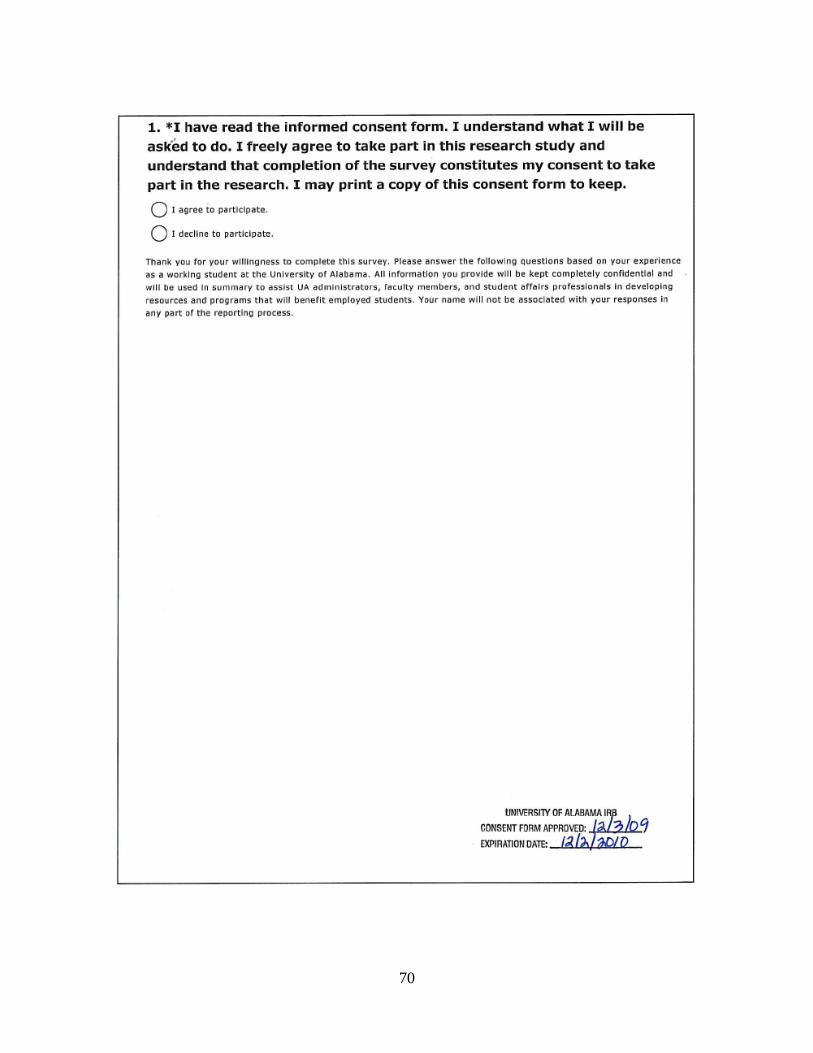
70

Appendix C
Email Invitation and Follow-up Emails
71
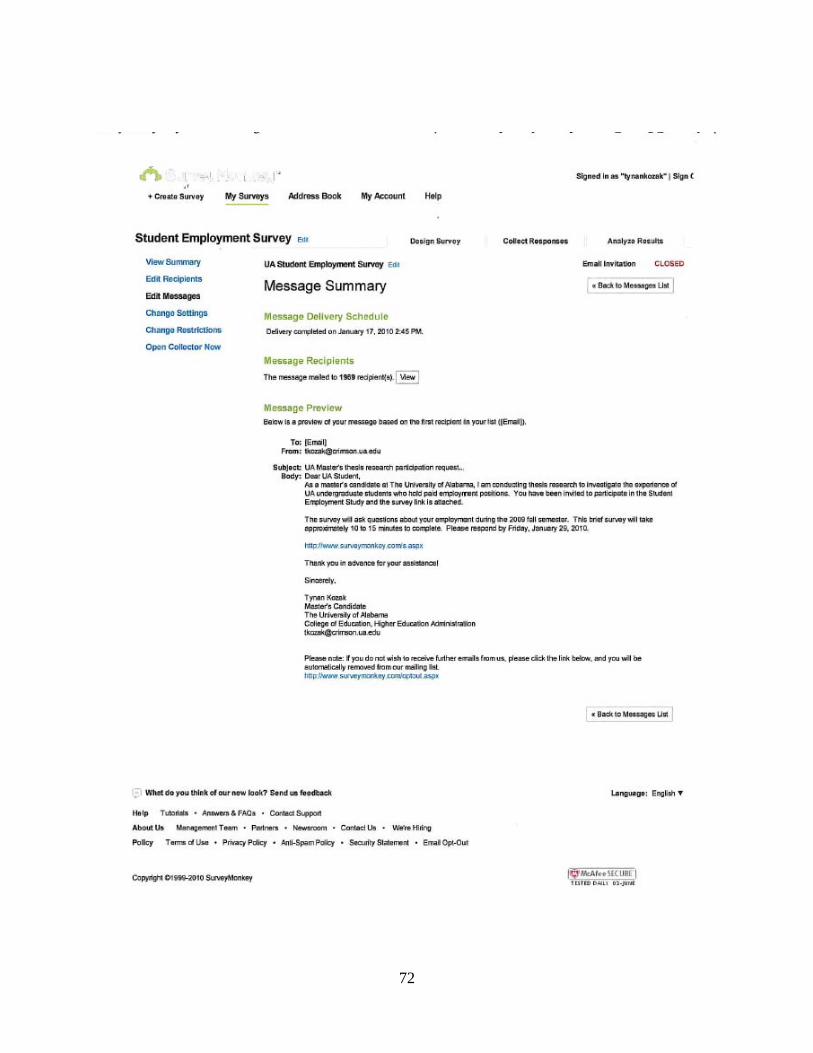
72

73
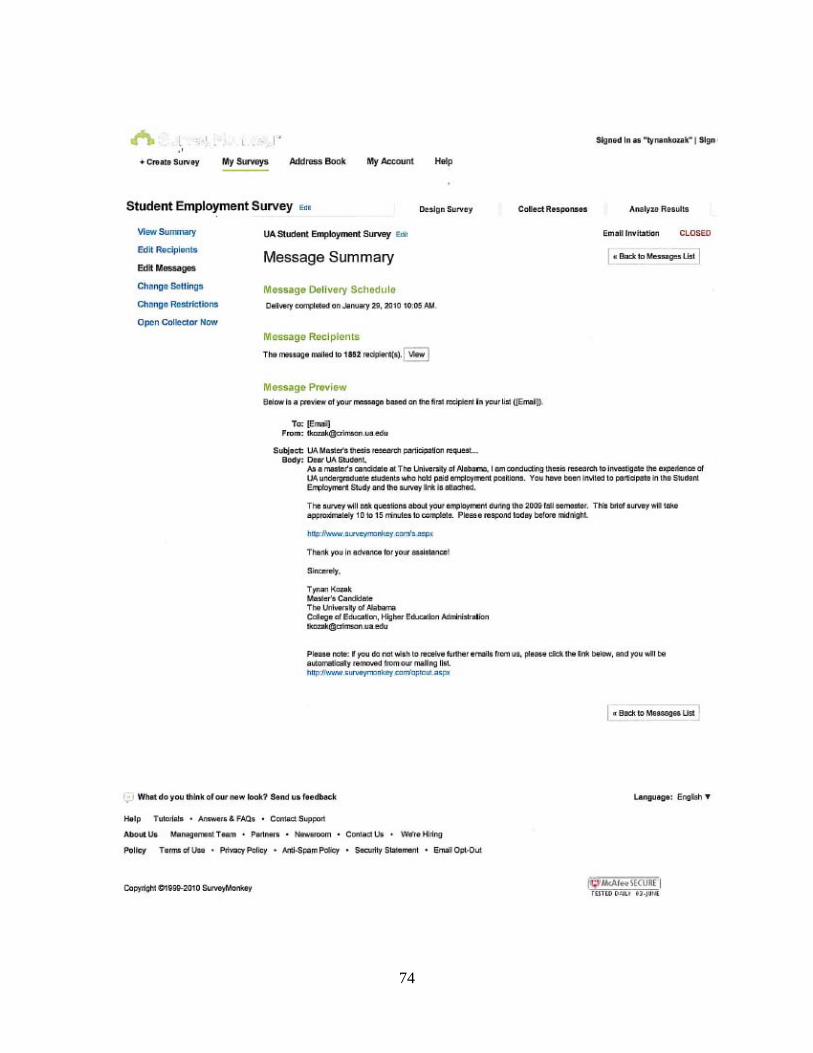
74
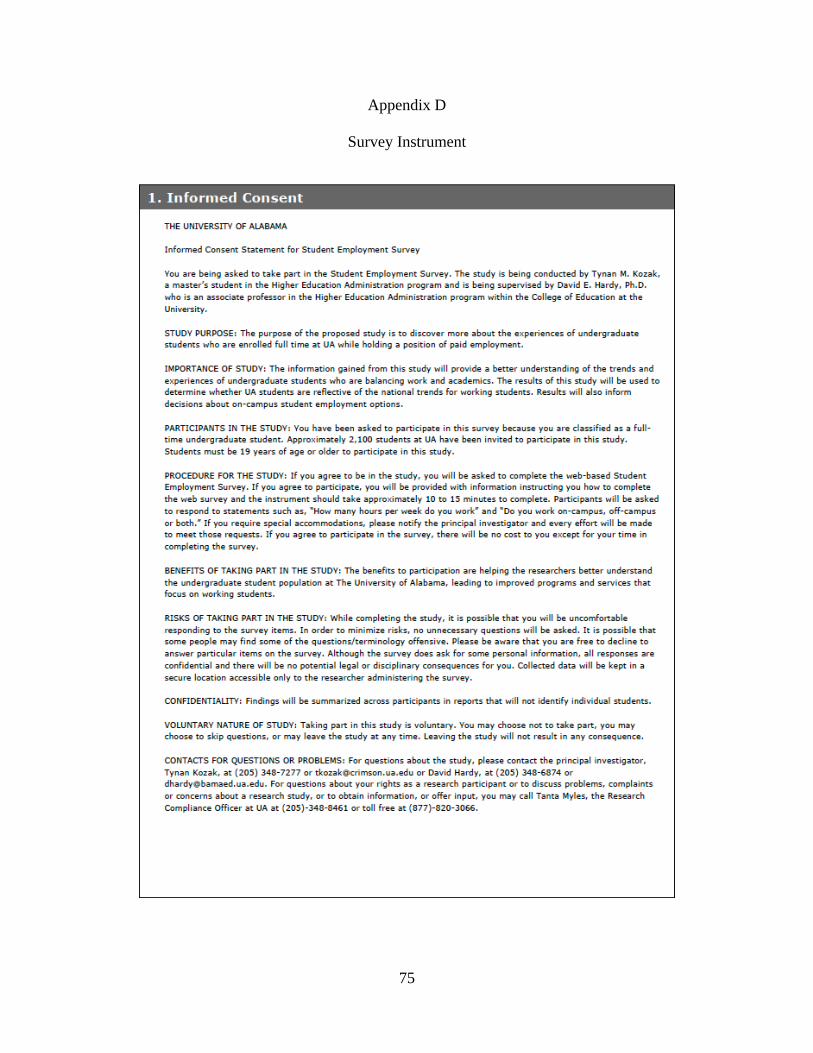
Appendix D
Survey Instrument
75

76

77

78

79

80

81

82
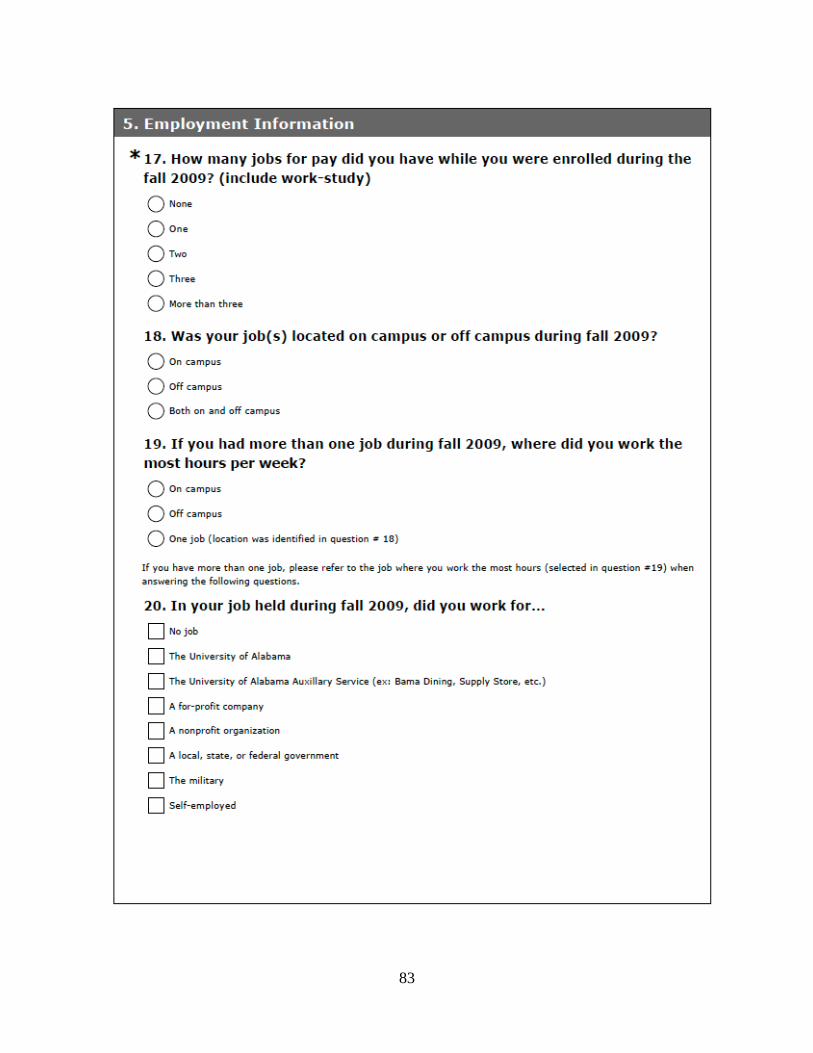
83
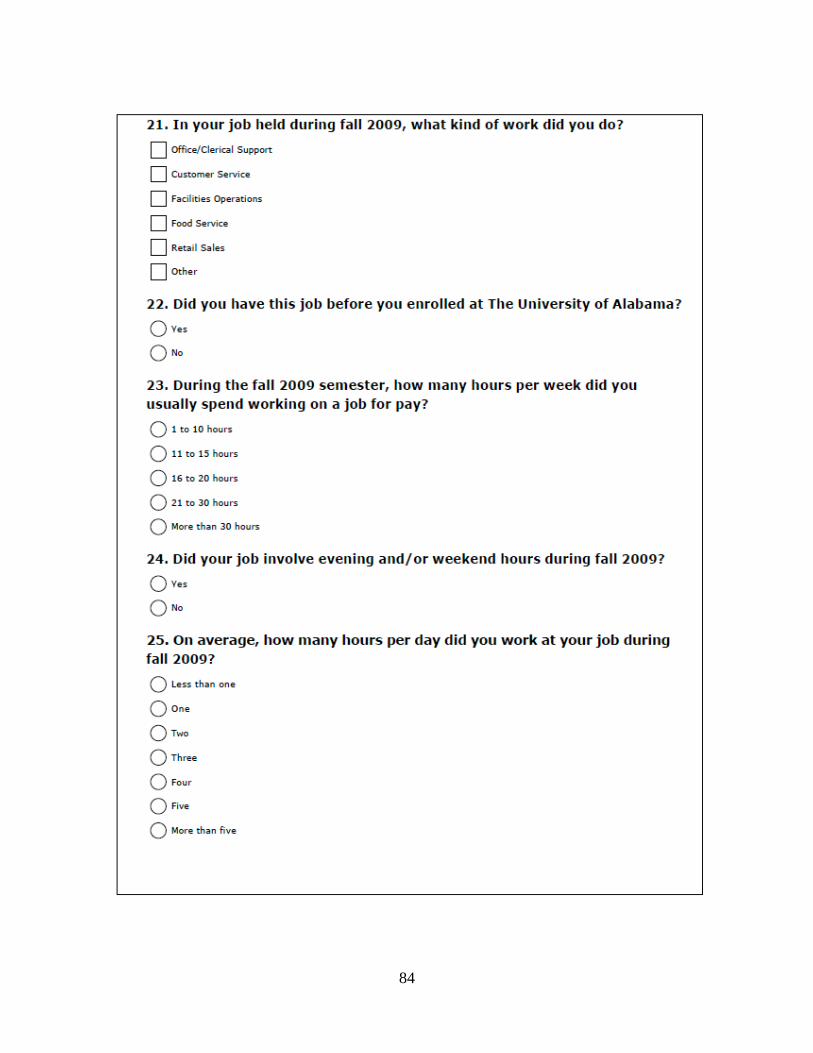
84

85

86

87

88

89

Appendix E
Participant Responses to Survey Question # 37
Survey Question #37 Please describe how you have been able to balance the demands of school, work and personal life. TIME MANAGEMENT!!!! I have always been busy and been able to handle a lot on my plate. So I just worked hard when I worked and relaxed otherwise. I only work a number of hours that do not meddle with my college work I give my personal life too much of a priority over work and school. with lots of time management By evaluating priorities and allocating proper time to each priority. I get a kit done while I am at work. It is very difficult to balance school, work, and a social life. It takes a lot of time management skills and a lot of hard work. It also demands a lot of stress and a lot of time. I work as a tutor (for an agency) and spent the fall semester working one-on-one with local girls 7th-10th grade. Balancing school, work, and a social life hasn't been too difficult because my tutoring hours are usually in the evening. Extracurricular activities have been the only real causality of my work schedule because after-school tutoring hours clash with student organization meeting times. School comes first for me, even though it shouldn't. I love my job and I know that working hard now will pay off in the long run even if school takes longer to complete. I work out of state so I only work when at home, when I do have studying to do I am able to work around it I work later in the evening or use the weekend to work. If I do not work on the weekends, i splurge and use it as time to do things around my apartment as well as get homework done. I also live with my girlfriend so I am able to see her much more often than most which helps balance time with her.
It's simple, my job knows that school comes first, they work around my schedule! If I could afford to pay my bills without having to work I would because balancing school and work is difficult. I am currently a Marine Corps Reservist, so one weekend a month (Fri, Sat and Sun) I have to travel 150 miles to Huntsville, AL, to train. I get a little money from this, but not much. My tuition has already been paid for through the PACT program up until this semester (Spring 2010), so I took out a loan for the tuition so I could graduate. My parents business did absolutely horrible last year and they are basically broke so I took a job last semester to earn some of my own money in order to help my parents. The job sucked and had nothing to do with my career field. If anything, I learned that I will never have a job in sales or customer service.
90

because m job is a student job, i am a student first and foremost and it allows me to work on bettering my education while at work.
It is somewhat hard to work 30 hours per week, and attend 15 hours of classes. It was really exhausting, but I pretty much had to eliminate all other activities besides work and school. My job simply requires me to sit at a desk and sign visitors to the dorm in. This time forces me to work on my homework since there is nothing else to do. I also work early mornings which allows me to work on homework before I go to class that day. I procrastinate a lot so this gives me time to cram before class. It also forces me to do things in advance because I have time allocated to just do homework. The busier you are, the more adept you become at time management. I feel like I'm doing what I'm supposed to be doing and don't feel like I waste much time at all. My work hours are flexible so that really helps for things like doing job interviews, going to the games on Saturdays, and generally having weekends off. I'd rather push hard during the week and not have to think about it on the weekend, although this past semester my only true day off was Saturday...on Sundays, I almost always did school work to stay caught up. I am just an organized person, that doesn't have much free time.
stay organized and keep a planner of scheduled events and use to-do lists Although I wish I could have worked more to earn more money, I put school first on my priorities list. No matter what decisions I made, school was always first. The shift I worked during the fall ended at 8pm so I had plenty of time for my personal life. I quit the job in December due to student teaching starting in January. I work during the afternoon and never at nights or weekends. This allows for me to have time for school after eating supper but before doing anything for the night. I have worked out my schedule to allow enough time for school, work, and study time. The only way I can make my schedule work is to give my employer my academic schedule and let them prepare my work schedule from that information. I try to study when I can and sometimes I am able to study at work. But because of work and class, either my study time or personal/social time really takes a hit.
use a calendar to organize everything going on a day, a week, or even a month in advance Just to try to fit everything into a schedule. If something doesn't fit right, there really isn't a whole lot you can do about it. I like to keep busy so working 30 hours and being enrolled full time was not that difficult. At times it was stressful because of exams and such, but my employer was always understanding and allowed me to put school first. Well, it definitely has not been easy. The only way I can honestly say that I made it through this past semester was by the grace of God. I have learned how to balance all of them. But with God all things is possible. Its simple, prioritize. Before bills life went something like school, personal life, and lastly work. With a slow economy that order is now work, work, and school. Its hard being a student worker who slips between the guidelines for federal aid and winds up getting the shaft. It's all about time management. Having a job forces me to make better use of my time. I've always felt that the busier I am the more likely I am to be more organized. Having little or nothing to do usually results in me procrastinating.
91
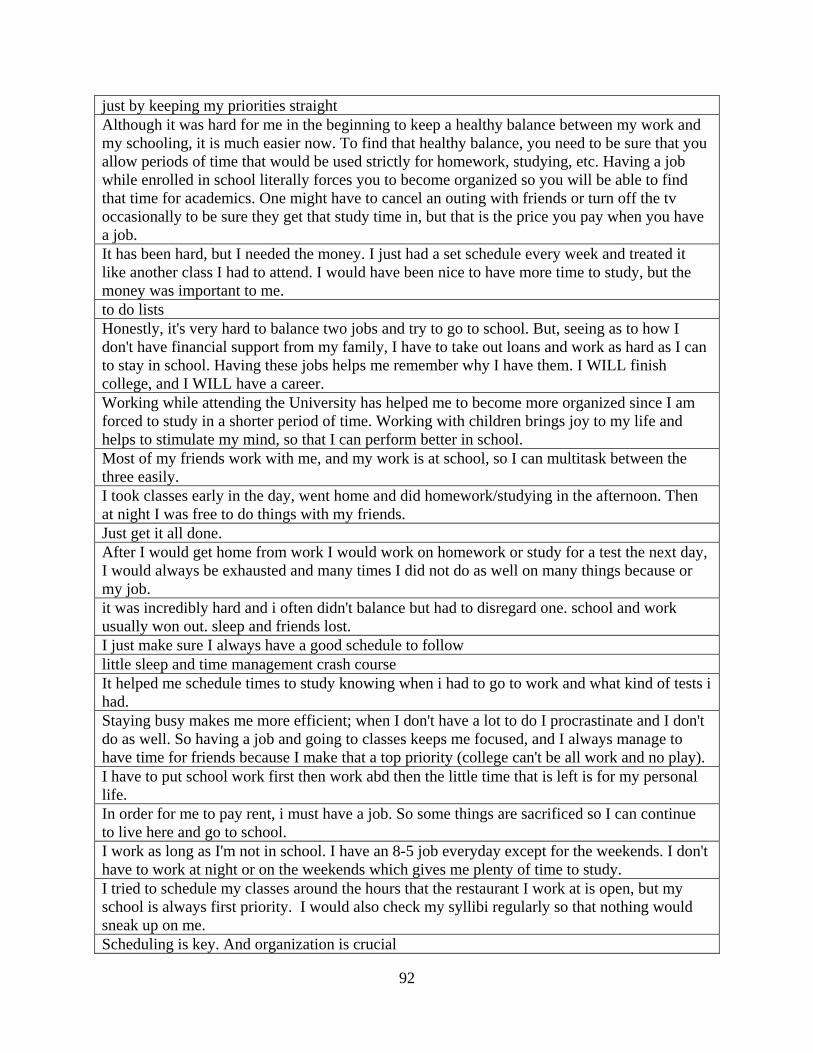
just by keeping my priorities straight Although it was hard for me in the beginning to keep a healthy balance between my work and my schooling, it is much easier now. To find that healthy balance, you need to be sure that you allow periods of time that would be used strictly for homework, studying, etc. Having a job while enrolled in school literally forces you to become organized so you will be able to find that time for academics. One might have to cancel an outing with friends or turn off the tv occasionally to be sure they get that study time in, but that is the price you pay when you have a job. It has been hard, but I needed the money. I just had a set schedule every week and treated it like another class I had to attend. I would have been nice to have more time to study, but the money was important to me. to do lists Honestly, it's very hard to balance two jobs and try to go to school. But, seeing as to how I don't have financial support from my family, I have to take out loans and work as hard as I can to stay in school. Having these jobs helps me remember why I have them. I WILL finish college, and I WILL have a career. Working while attending the University has helped me to become more organized since I am forced to study in a shorter period of time. Working with children brings joy to my life and helps to stimulate my mind, so that I can perform better in school. Most of my friends work with me, and my work is at school, so I can multitask between the three easily. I took classes early in the day, went home and did homework/studying in the afternoon. Then at night I was free to do things with my friends. Just get it all done. After I would get home from work I would work on homework or study for a test the next day, I would always be exhausted and many times I did not do as well on many things because or my job. it was incredibly hard and i often didn't balance but had to disregard one. school and work usually won out. sleep and friends lost. I just make sure I always have a good schedule to follow little sleep and time management crash course It helped me schedule times to study knowing when i had to go to work and what kind of tests i had. Staying busy makes me more efficient; when I don't have a lot to do I procrastinate and I don't do as well. So having a job and going to classes keeps me focused, and I always manage to have time for friends because I make that a top priority (college can't be all work and no play). I have to put school work first then work abd then the little time that is left is for my personal life. In order for me to pay rent, i must have a job. So some things are sacrificed so I can continue to live here and go to school. I work as long as I'm not in school. I have an 8-5 job everyday except for the weekends. I don't have to work at night or on the weekends which gives me plenty of time to study. I tried to schedule my classes around the hours that the restaurant I work at is open, but my school is always first priority. I would also check my syllibi regularly so that nothing would sneak up on me. Scheduling is key. And organization is crucial
92

Through time management, I have been able to balance the demands of school, work, and personal life. It's been very difficult and I have definitely let school work slack the most. I have a very strong tie to my family so trying to work, do school, and keep up good grades has been a big struggle. Don't sleep A lot of patience and work buck up and get it done... that's it... nothing else matters. There's no excuses. Just get done what you need to get done. go to class, take notes, work a few days a week and see friends when I'm not doing either of those Using calendar. I haven't been able to I just go to school then straight to work and home to study personal life gets cancelled a lot. always had a planner I had to drop some classes in order to make enough money to pay for school. I did not have much of a social/personal life during the semester. I focus on one day at a time, on one thing at a time. I attended the University previously and have a degree. I am currently working on a second one. I have to work so you just make it work. I try to schedule my classes that I have time to work as well as time to study. I usually will schedule classes with a break between them and study during that time. You just have to be really organized and plan ahead. I make sure that my work schedule does not interfere with my class schedule and I don't work after five. I just do what I have to do to get by. Usually I sacrifice sleep to get things for school taken care of. Time management is the only good answer I could give! i get off work at 5 so i have plenty of time to do school work and i have no friends Constantly on the move. Staying ahead of the game and being mentally, physically, and emotionally prepared on a daily basis. By not doing the best I could at my job. Engineering students who are dedicated to their grades should NOT be RA's. I have had to start putting daily events down in a calendar to keep a clear schedule of all I had to do. Having both school and job responsibilities helps you learn how to be responsible. It teaches you time management and help you become a better person. WORKING AND GOING TO SCHOOL IS HARD SOMETIMES BECAUSE I CANT CALL OUT OF WORK BECAUSE I HAVE A PAPER OR A PROJECT DUE YET I AM STILL REQUIRED TO GET IT DONE BY THE SAME DEADLINE AS EVERYONE ELSE AS WOULD BE EXECTED. SO IT HAS MADE ME START ON THINGS EARLIER TO BE ABLE TO FINISH THEM BEFORE WORK AND BY THE DEADLINE. HANGING OUT WITH FRIENDS IS HARD SOMETIMES TO BECAUSE EVERYONES SCHEDULES DON'T MESH TOGETHER AND THE BUSIER SOMEONE IS THE HARDER IT IS TO PLAN THINGS. ALSO WHEN FRIENDS GO OUT LATE AT NIGHT I CAN'T ALWAYS GO BECAUSE I HAVE TO BE AT WORK EARLY THE NEXT MORNING.
93

Neither my coursework nor work was overly demanding during this particular semester, so balancing the three was not difficult at all. keeping a detailed planner so i can plan ahead each day. I love my job. Thus, it's not difficult to do it. Plus, it is part-time. I've learned how to balance my time. You can't make it to every party and hangout everything. Sometimes you just have to work and study!! Balancing school, work, and personal life is not a skill I obtained while in college. I have always had to work, starting with babysitting fulltime when I was 13, working throughout high school, and now college. I have never minded working. Coming from a low-income family its something I had to do if I wanted the basics necessities such as clothes and shoes, and I had to work to help out my family. When its something you have to due for the basic necessities of life, food, rent, clothes, etc, you make the demands of school, work, and personal life balance. little sleep! I am able to balance because i put my personal life on the back burner, sort of. I rest on the notion that I can party and have fun respectfully after I graduate. Hard work I have an amazing planner that I always have with me. By planning out schedules ahead of time to ensure that I could be able to complete all the work was required. pretty well I always put classes and studying first. I prioritize in this way and then fill in the rest of my schedule with how much I think I can work and still have some down time to socialize and hang out with my friends. By setting a higher priority on studies in the time I have left after class and work I have made better grades. I work with many friends so my social life is not hurt really. Prioritizing and asking for time off when I need it to study. I really do not have a personal life. I attend class and go to work. It's hard at times but the way I work it out is to mainly spend a few nights a week studying and then a few nights out with my friends. I plan for weeks ahead of time so I know when school things are due, when I have to work, and the time left over is spent with friends. i have been using a daily planner to plan out class time, study time, and work time I try my best to balance school and work. I attend classes in the morning, go to work most of the afternoon, and then try to get my homework done at night. It leaves little room for anything else. A social and or personal life is almost nonexistent. Easily organization and prioritization I worked few hours and scheduled activities and school before or after work. I make sure to dedicated enough time to each aspect of my life. Have to work to continue attending UA, no other choice. ROLL TIDE School and work come first, then personal life. It is not easy!!! Through my job, I have learned how to manage my time more efficiently. It has not been a burden to my life, whether it be academic, social, or involvement on campus. I have had the opportunity to get to know the professors in the department in which I work better than I had
94
prior to my job. I would recommend working to any student if they have the time in their schedules. Gotta do what I gotta do. Gotta work to pay for this ridiculous tuition, that’s going up every year. If they keep going, they are going to have another student revolution on their hands. My employer is reasonable and understands that school comes first. I usually will sign up for classes in a manner that will allow for a decent work schedule. Last semester, however, I felt that I did not have a personal life because I had difficult classes, work, and was the social chair for my sorority. My friends got to relax and have their "me" time while I was working, so it was hard for them to understand why I might not want to go out afterwards. All the hours I work is essentially time I could have been using towards school work. I have made a schedule that balances work and class successfully. Since my place of work is in the middle of campus, I am able to work for a few hours in between my classes. You just need to figure out what your priorities are and balance them out to the importance to yourself. i allot time slots for everything, it has basically taught me organization I hated having to balance the demands of school work and my personal life. I take school very seriously and work interfered with my ability to be organized and prepared for classes. That is why I ended up quitting my job is because I decided putting school first was more important than being paid minimum wage. I have a planner. Hype it. I also just got a Droid. Hype that. It's been tough, but my job was usually fun, therefore I was not too stressed out there! time management I haven't balanced them. I chose one or the other and almost always neglected something else. My time management skills are terrible. Pick which is more important to get accomplished, when. I just had to make a schedule for myself and stick to it. Scheduling time for each event. Keeping a to do list. Proper organization. I know my priorities and I give myself adequate time to rest while restoring and recalibrating my focus so that I do not work myself too much. You just do it. You have no choice sometimes when your parents are extremely rich but refuse to help you emotionally or financially. i have become better at time management with my studies You always have to be organized and you must be able to think on your feet. Tasks can be thrown at you from any direction, but you have to stay calm to survive. This is how I stay balanced with school, work, personal life I take it one day at a time but majority of the time I break down and cry because I have to support myself. It's hard. Whatever I have time for that's what I do. It was all about time management. I was determined to master my time management skills prior to taking on this job. Stay up late and work smarter I was pregnant while I worked at the Rec and took a full load of classes. Balance of life was a necessity. I keep a schedule. I make daily to do lists so that I know exactly what needs to be done on a given day. I have
95
96
since quit my second job, but I still work as a designer at the Crimson White newspaper. Having one job has given me more time for a social life and when there is nothing to do at the CW one day, I can work on homework or organize my personal life Time management and keeping your goals and priorities in check. In order to balance these demands, I plan out time each day for school and work and whatever leftover time I have left I use for personal life. I developed insomnia. Keep going. I work at the Northport DCH hospital and am a nursing major so I have found that my co-workers are a great source of information in relation to my school work. The hospital is very flexible with my work and school schedule and they allow me to work when I want and have never stressed me to choose work over school. I feel better prepared for my classes because I learn so much at work. It takes a lot of organization skills. As well as patience I know what I have to do when it comes to having a job and working. I know that sacrifices have to made and that is just a part of life. Self discipline and not always being able to do the 'fun' things that I would possibly otherwise have done. You have to be more selective in what extra activities you are going to participate in and still be able to keep up with course work and be at work on time and be alert and productive while there. By not sleeping enough Set priorities. being organized I worked late at night. It did not interfere with anything. I have had to become more organized which has had a positive effect on my life as a whole. A lot of late nights and studying on weekends. It was simple have a schedule. I scheduled my school classes and then applied for a job and told them which hours I was willing to work around my school. Personal time was usually in the evenings after classes and work. I'm allowed to do my homework at my job. As long as I pay attention to people seeking my assistance, I can use my work time to study. Also 2 of my closest friends are employed by the same people in an office in the same building. Therefore, I have time to see them before/after/during work. Also my shift only requires me to work every other weekend so I can see my friends on the weekends. Luckily, I have always been a great student and therefore do not have to study a lot. The other people I work with struggle to balance school and work. I worked in part of the co-op program so there was no pressure of school work I plan ahead, knowing how much time I have and how much of that time needs to be devoted to academics I have a job that is willing to work with my school schedule.