Embed Size (px)
Citation preview

Working Group 1: Impact simulations
Imagecredit:ESA

Working Group 1: Impact simulations
Chairs: Kai Wünnemann / Martin Jutzi
Members of planetary science / astronomy community (cratering, collisions, small bodies, etc.)
• Modelling• Grid-based codes• SPH codes• Scaling-laws
• Experiments
Impact modeling + experiments by hypervelocity impact and engineering community
• Frauenhofer EMI• SimChoc• CEA
In collaboration with DART team

Goals of impact working group
Can we predict the efficiency of momentum transfer?
momentum
Didymoon mass x ∆V Efficiency β =
momentum
Predict impact outcome • Efficiency of momentum transfer • Range of expected crater morphologies and properties of
the surrounding surfacesComplimentary to DART studies

Examples of ongoing modeling & experiments
Al sphere on Al half space modelling (Based on AIDA benchmark studies)
LULI2000 facility, 1.7 TW/cm2 , 5ns at w irradiation focused onto 1mm thick Al
target
Laser
Impact simulation code : RADIOSS®
3
SimChoc S.A.S. Didier ZAGOURI Michel BOUSTIE
64, rue Galliéni 92240 MALAKOFF [email protected] / 06.43.65.91.03 [email protected] / 06.89.71.73.72
Impact Simulation Benchmarks for AIDA Al sphere on Al half space
November 2018

Examples of ongoing modeling & experiments

Initial impact modeling study
• Test case: ‣ Target (Asteroid Didymos B):
- Diameter ≈160m- other physical properties such as density, porosity
or strength are not well constraint so far)
‣ Impactor: - Impact velocity: 6 km/s- Impactor mass: 500 kg- Impact angle: head-on / 45° (3D models only)
Goal: illustrate differences due to different model approaches and assumptions regarding material properties

Initial impact modeling study
• Various groups using various methods
‣ iSale shock physics code- Raducan et al.- Luther et al.
‣ SPH shock physics codes- Maindl and Schäfer- Jutzi et al.

Initial results
Benchmark requirements iSALE simulations methods Results: Crater size Results: Ejecta distribution Summary Conclusions
Results: Ejecta distribution for Y0 = 1 - 100 kPa, �0 = 20% and f = 0.6
Figure 11: Mass-velocity-launch position distribution of ejecta for three differentstrengths: 1, 10 and 100 kPa, for a target with �0 = 20% and f = 0.6.
Sabina D. Raducan, Gareth S. Collins, Thomas M. Davison
HERA Benchmark
iSale modeling by Raducan et al.

Initial results
iSale modeling by Raducan et al.
Benchmark requirements iSALE simulations methods Results: Crater size Results: Ejecta distribution Summary Conclusions
Summary: Beta-1
Figure 17: �-1 as a function of porosity and coefficient of internal friction, for three dif-ferent cohesional strengths: Y0 = 1, 10 and 100 kPa.
Sabina D. Raducan, Gareth S. Collins, Thomas M. Davison
HERA Benchmark
Strong dependence of momentum transfer efficiency on material properties (strength, porosity)!
iSale modeling by Luther et al. (Y0 = 1kPa; same conditions)
Overall good agreement, small difference due to different analysis of simulation data
Initial results
10-1
100
101
102
10-4 10-3 10-2 10-1 100
avg. slope = -3µ ≈ -1.07
M(>
v)/m
pM
ass
eje
cted a
t ve
loci
ty g
reate
r th
an v
Ejecta velocityv/vp
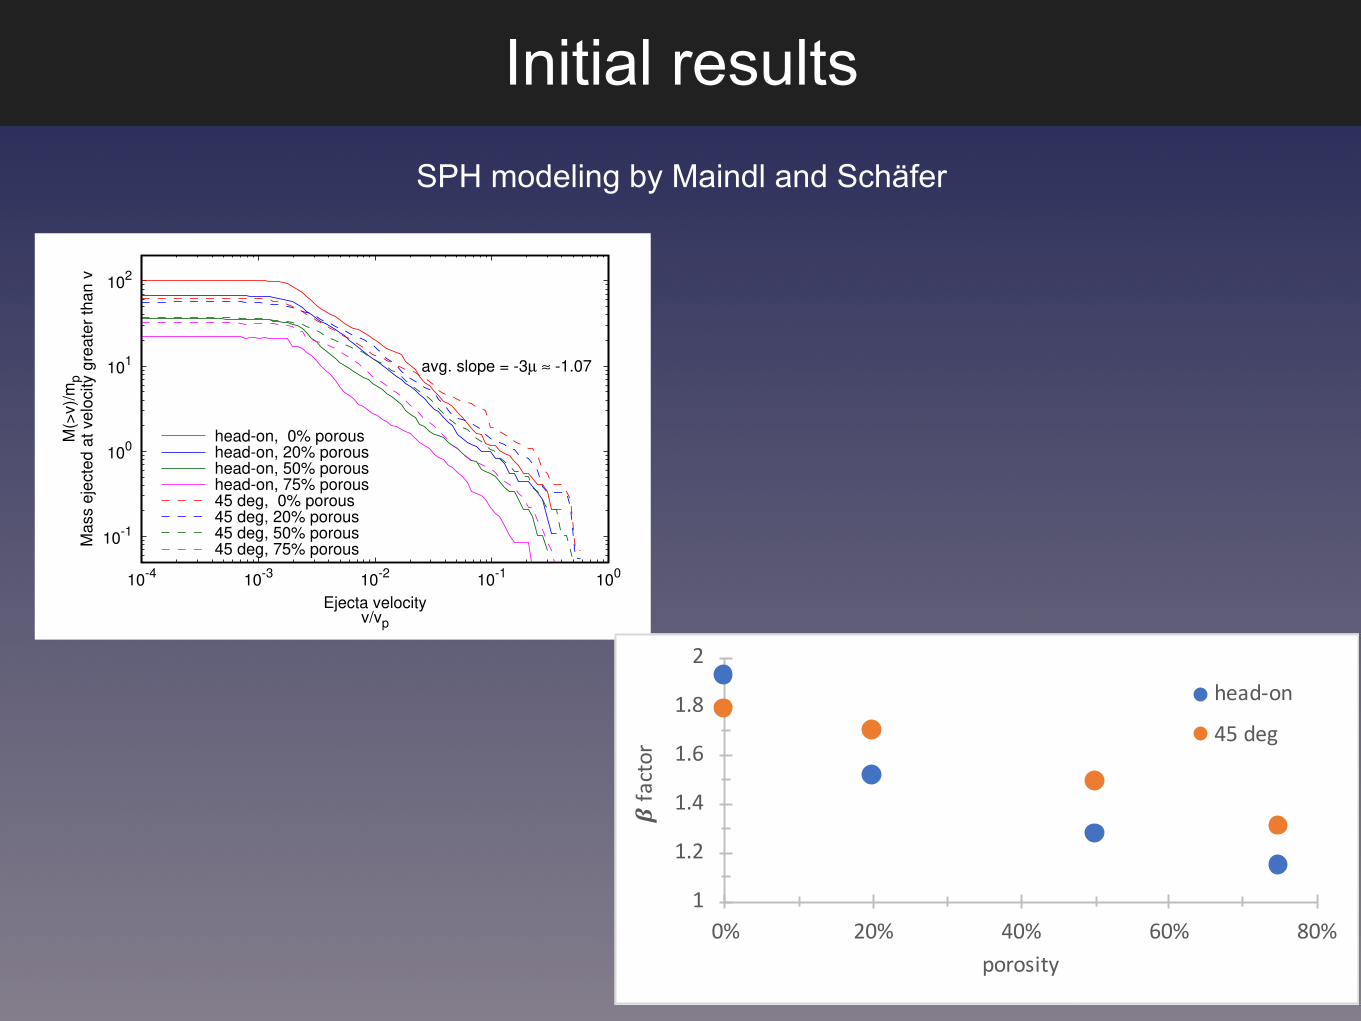
head-on, 0% poroushead-on, 20% poroushead-on, 50% poroushead-on, 75% porous45 deg, 0% porous45 deg, 20% porous45 deg, 50% porous45 deg, 75% porous
Figure 2: Cumulative distribution of ejected mass versus velocity (cf. Holsappleand Housen, 2012).
4
Table 3: � values for head-on and 45 deg impact scenarios and di↵erent targetporosity.
Target porosity � �
(%) head-on 45�
0 1.93 1.7920 1.52 1.7050 1.27 1.4975 1.15 1.31
1
1.2
1.4
1.6
1.8
2
0% 20% 40% 60% 80%
!fa
ctor
porosity
head-on
45 deg
Figure 3: � values for head-on and 45 deg impact scenarios and di↵erent targetporosity.
Using the method outlined in Sect. 2.2 we find the � values given in Table 3and Fig. 3. As we expected from prior studies of others, momentum enhance-ment factors are larger for compact targets as opposed to material with highporosity. The � factors decrease from 1.93 (non-porous) down to 1.15 (75%porous).
References
W. Benz and E. Asphaug. Impact simulations with fracture. I - Method andtests. Icarus, 107:98, Jan. 1994. doi: 10.1006/icar.1994.1009.
W. Benz and E. Asphaug. Catastrophic Disruptions Revisited. Icarus, 142:5–20, Nov. 1999. doi: 10.1006/icar.1999.6204.
D. E. Grady and M. E. Kipp. Continuum modelling of explosive frac-
5
SPH modeling by Maindl and Schäfer

iSale vs. SPH comparison of initial results
Table 3: � values for head-on and 45 deg impact scenarios and di↵erent targetporosity.
Target porosity � �
(%) head-on 45�
0 1.93 1.7920 1.52 1.7050 1.27 1.4975 1.15 1.31
1
1.2
1.4
1.6
1.8
2
0% 20% 40% 60% 80%
!fa
ctor
porosity
head-on
45 deg
Figure 3: � values for head-on and 45 deg impact scenarios and di↵erent targetporosity.
Using the method outlined in Sect. 2.2 we find the � values given in Table 3and Fig. 3. As we expected from prior studies of others, momentum enhance-ment factors are larger for compact targets as opposed to material with highporosity. The � factors decrease from 1.93 (non-porous) down to 1.15 (75%porous).
References
W. Benz and E. Asphaug. Impact simulations with fracture. I - Method andtests. Icarus, 107:98, Jan. 1994. doi: 10.1006/icar.1994.1009.
W. Benz and E. Asphaug. Catastrophic Disruptions Revisited. Icarus, 142:5–20, Nov. 1999. doi: 10.1006/icar.1999.6204.
D. E. Grady and M. E. Kipp. Continuum modelling of explosive frac-
5
Benchmark requirements iSALE simulations methods Results: Crater size Results: Ejecta distribution Summary Conclusions
Summary: Beta-1
Figure 17: �-1 as a function of porosity and coefficient of internal friction, for three dif-ferent cohesional strengths: Y0 = 1, 10 and 100 kPa.
Sabina D. Raducan, Gareth S. Collins, Thomas M. Davison
HERA Benchmark
Our investigation of the effect of target inhomogeneities in theform of macroscopic cracks indicates that at high impact veloci-ties (v imp P 5 km=s), there is a negligible effect on b. Our resultstherefore suggest that in this regime, the target porosity is wellrepresented by a microporous model. However, it is importantto point out that only a certain size scale of inhomogeneities(<1 m) has been investigated and larger scale inhomogeneitiessuch as large voids, boulders on the surface or existing cratersmight have a stronger effect. This will be investigated in a futurestudy.
While the effect of target inhomogeneities on the momentummultiplication factor b was found to be quite small, the effect ofvarious material properties such as tensile strength was found to
be much more significant. Using a target with a strength corre-sponding to laboratory scale leads to a significantly smaller b thanthe one found for a target with a strength corresponding to a 300 mobject (which is about !20 times smaller).
For both the high and low strength cases, the slopes of the b" 1vs. scaled impact velocity curves seem to converge to l ! 0:62 athigh velocities when plotted in a strength scaled form. This is high-er than the value l ! 0:4 predicted by scaling theories (Eq. (8)) forporous materials (HH2012). Interestingly, a very high value ofl ¼ 0:85 was found for ‘‘pumice sand’’ in experiments which di-rectly measure the b factor as a function of impact velocity (Hols-apple and Housen, 2013).
An important question is how to scale strength (tensile strengthand crush-curve parameters) of a porous material to larger sizes.Also, scaling laws for b are based on an idealized form of the ejectadistribution curve (HH2012), which is determined by the (con-stant) slope n, the total mass of ejecta Me and the knee velocityv$ (see Fig. 10 in HH2012). Experimentally, the knee velocity andthe corresponding total mass of ejecta are difficult to determine.Therefore, experiments measuring the momentum transferdirectly and which investigate a large range of impact velocitiesusing the same target material are required to determine the scal-ing of b with impact velocity. First results of such experimentswere presented by Holsapple and Housen (2013), and furtherexperiments will be also performed in the context of the NEO-Shield project. These experiments will then also allow us to furthertest and validate the numerical models used in this study.
The strength properties of real asteroid materials and their sizedependency are not well constrained (e.g., what is the crush-curveof a 300 m asteroid with 50% porosity?), while they have a signif-icant effect on the momentum transfer efficiency. Sample returnspace missions, such as the JAXA Hayabusa mission that returneda sample from the asteroid Itokawa and its following Hayabusa 2mission that will be launched in 2014–2015, the NASA OSIRIS-REx mission that will be launched in 2016, and the MarcoPolo-Rthat is competing in the Cosmic Vision Program of the EuropeanSpace Agency for a launch in 2022–2023, are needed to betterquantify asteroid material properties. Missions that investigatethe internal properties using techniques such as radar tomographyand/or seismic experiment are also required to have direct infor-mation on asteroid interiors. Moreover, an actual deflection mis-sion designed to study b (such as the AIDA and ISIS missions)will provide the b factor from a large scale experiment, which willin turn provide important constraints on scaling of impact pro-cesses to asteroid scales.
Acknowledgments
We thank Erik Asphaug and Kevin Housen for their insightfulreviews. This study was performed in the context of the EuropeanNEOShield project funded under the EU FP7 program agreementNo. 282703. M.J. acknowledges support from the Ambizione pro-gramme of the Swiss National Science Foundation. Most simula-tions were performed on the computer cluster SIGAMM at theCote d’Azur Observatory in Nice (France).
References
Asphaug, E., 2008. Critical crater diameter and asteroid impact seismology.Meteorit. Planet. Sci. 43 (6), 1075–1084.
Benz, W., Asphaug, E., 1995. Simulations of brittle solids using smooth particlehydrodynamics. Comput. Phys. Commun. 87, 253–265.
Bottke, W.F., Nolan, M.C., Greenberg, R., Kolvoord, R.A., 1994. Velocity distributionsamong colliding asteroids. Icarus 107, 255–268.
Britt, D.T., Consolmagno, G.J., 2000. The porosity of dark meteorites and thestructure of low-albedo asteroids. Icarus 146, 213–219.
Cheng, A.F., 2012. Asteroid deflection by spacecraft impact. Asteroids, Comets,Meteors 2012, Proceedings. LPI Contribution No. 1667.
0.1
1
1 10
- 1
Impact velocity (km/s)
micro porousmicro + macro porous
Fig. 5. Momentum multiplication factor b" 1 as a function of impact velocity forthe two considered structures ((a) homogeneous microporous, and (b) heteroge-neous, micro and macroporous). The nominal values for Yt and Pe; Ps are used (seeTable 1).
0.1
1
1 10
- 1
Impact velocity (km/s)
50% porosity, 300 m asteroid50% porosity, laboratory scale: Yt,lab50% porosity, Yt,30m50% porosity, Pe,low, Ps,low70% porosity17% porosityExperiment (HH2012b)
Fig. 6. Momentum multiplication factor b" 1 as a function of impact velocity usingtarget structure (a) and considering various strengths and porosities. Unlessindicated, the nominal values for Yt and Pe; Ps are used (see Table 1). The result of animpact experiment using a pumice target (Housen and Holsapple, 2012) is alsoshown.
0.1
1
100 1000
- 1
Scaled velocity U/(Y/ )1/2
50% porosity, 300 m asteroid50% porosity, laboratory scale
Fig. 7. Momentum multiplication factor b" 1 as a function of scaled impactvelocity using target structure (a). The results for the laboratory scale target and forthe 300 m object with a lower tensile strength are shown. The dashed black line hasa slope which corresponds to l ¼ 0:62 (Eq. (8)).
252 M. Jutzi, P. Michel / Icarus 229 (2014) 247–253
~ 1 MPa
6 km/s
~ 100 kPa
Both methods show similar dependence on porosity and strength
For ~ 100 kPa, ~ 50 % porosity, head-on impact: (Beta - 1) ~ 0.3-0.5 -> good agreement
Jutzi and Michel, 2014
Raducan et al., this study
Maindl and Schäfer, this study

Conclusions of initial modeling study
• Preliminary results indicate an overall good agreement between iSale and SPH calculations
• Results (beta factor, crater etc.) are very strongly depended on material properties‣ strength is most important‣ porosity and friction properties play also a role
• These properties need to be better constraint‣ Laboratory experiments‣ In-situ measurements at the actual scale!
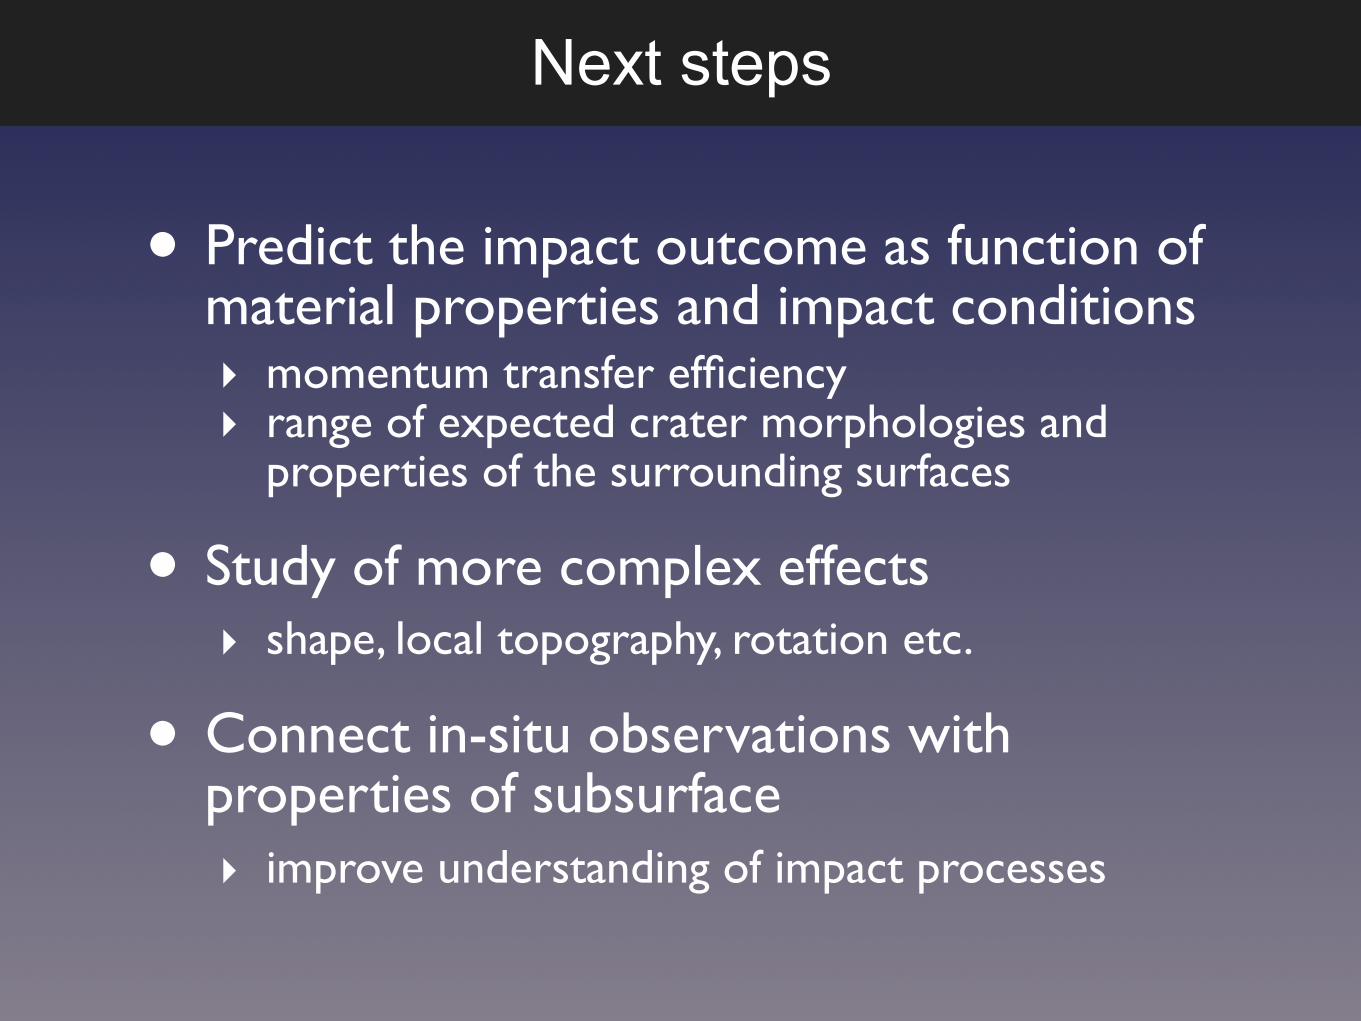
Next steps
• Predict the impact outcome as function of material properties and impact conditions‣ momentum transfer efficiency‣ range of expected crater morphologies and
properties of the surrounding surfaces
• Study of more complex effects‣ shape, local topography, rotation etc.
• Connect in-situ observations with properties of subsurface ‣ improve understanding of impact processes