Embed Size (px)
Citation preview

1
Workforce Differentiation and Workforce Analytics
DI Global HR Masterclass11 October 2016
Dr. Mark Huselid
Director, Center for Workforce Analytics
D’Amore‐McKim School of Business
Northeastern University
Boston, MA
2
About Mark Huselid
Dr. Mark Huselid the is Distinguished Professor of Workforce Analytics and the Director of the Center for Workforce Analytics at the D’Amore‐McKim School of Business at Northeastern University. He holds a Ph.D. in Human Resource Management, an M.B.A., an M.A. in Industrial and Organizational Psychology, and a B.A. in Psychology. Mark joined the D’Amore‐McKim faculty in 2014; he was on the faculty of Rutgers School of Management and Labor Relations from 1992 to 2014. At D’Amore‐McKim teaches courses in the design and implementation of workforce measurement systems, workforce analytics, and HR and workforce strategy.
Mark’s current academic research and consulting activities focus on the linkages between HR management systems, corporate strategy, and firm performance. In addition, he also has an active research and consulting program focused on the development of workforce analytics to reflect the contribution of the workforce, workforce management systems, and the HR management function to strategy execution and business success.
Mark is a frequent speaker to professional and academic audiences, having delivered more than 600 presentations throughout the U.S., Europe, Africa, and Asia. In addition, he has consulted on the topics of HR measurement and HR strategy with many Fortune 500 companies. Mark was the Editor of the Human Resource Management Journal from 2000‐2004, and is a current or former member of many academic and professional boards. He is among the most frequently cited scholars in the social sciences.
Mark has been the recipient of numerous grants, awards and honors, and his 2001 international bestseller, The HR Scorecard: Linking People, Strategy & Performance (with Brian Becker and Dave Ulrich), has been translated into ten languages. The follow‐up publication (also now in ten languages), The Workforce Scorecard: Managing Human Capital to Execute Strategy (with Brian Becker and Dick Beatty), was published to similar acclaim by the Harvard Business Press in 2005. His latest book (also with Brian Becker and Dick Beatty), The Differentiated Workforce: Translating Talent into Strategic Impact was published in early 2009 by the Harvard Business Press. Huselid’s new book Disrupting Workforce Competition is currently in development.

2
3
New Workforce Realities
• Old sources of competitive advantage no longer differentiate firms in the global marketplace.
• Effectively responding to globalization requires flexibility, speed and innovation…..and talent.
• Market for talent becoming much more “efficient”.
• Intense focus within firms on workforce strategy, differentiation, and execution.
3
4
The Digital Disruption...Has Already Happened!
• The world’s largest taxi company owns no taxis (Uber)
• The largest accommodation provider owns no real estate (Airbnb)
• The largest phone companies own no telco infrastructure (Skype)
• The most valuable retailer has no inventory (Alibaba)
• The most popular media owner creates no content (Facebook)
• The fastest growing banks have no actual money (SocietyOne)
• The largest movie house owns no cinemas (Netflix)
• The largest software vendor doesn’t write its own apps (Apple)
Source: www.ibmforentrepreneurs.com (2015)

3
5
Issues/Innovations Challenged Firms
• Internet Postal systems/US Postal System
• Cloud computing Routers, servers/Cisco, Dell, HP
• IPADs, “Dumb” terminals Personal computers/HP, Dell, Lenovo
• Ecommerce Travel, retail/Wal‐Mart, Tesco, Carrefour, Amex
• Electronic readers Bookstores, publishers/Barnes & Noble, Books‐a‐Million
• Working at home Office furniture/Steelcase, Herman Miller
• Digitalization Photographic film/Kodak, Fuji
• New material sciences Steel, Metal Fabrication/US Steel, Alcoa
• Mobile phones Credit cards, traditional telecoms/Nokia, Ericsson, Motorola
• Newsprint
• Funeral/Crematories
Newspapers/Garnett, New York Times
Caskets / Batesville, Astral, Mathews, Chinese, Wal‐Mart, Costco
• Your firm? What is the Magnitude of Shift in Your Industry?
5
Challenged Industries – Strategic Shifts
6
New Developments in Talent Management and Analytics
• Segmentation – Customer, supplier, workforce
• Workforce Differentiation – A players in A
positions for A customers
• Zero Based Work Budgeting – Designing work
from the customer back
• Line Manager Accountability for Talent
• Big Data and Workforce Analytics
6

4
7
A Focus on the Design, Implementation, and Measurement of Workforce Strategy
8
25 Companies in 36 Months:The Workforce Disruption Project

5
9
Disrupting Workforce Competition:
How Strategic Work, Workforce Differentiation, and Big Data are Changing
the Way that you Work – and Win
9
Our New Book:
10
Investing in differentiated management systems that support that work (strategic focus not best practices)
Workforce Differentiation
Identifying the strategic work that is truly necessary to execute your strategy
(work not jobs)
Strategic Work
Business Strategy:
How Grow?
Where Play?
How Win?
The Three Disruptions of Workforce Strategy
Designing and implementing targeted measurement systems that help to hold line managers accountable
for strategic talent
Workforce Analytics

6
11
Workforce Management Disruption 1:Strategic Work
Workforce Management Disruption 1:Strategic Work
11
12
The Quest for Competitive Advantage
Unfair
Fights
Reengineering Processesand ContinuousImprovement
Restructuring thePortfolio and
Downsizing Headcount
Reinventing Industriesand Regenerating
Strategies
Smaller Better Different

7
13
What is Strategic Work?
14
Value Creation vs. Avoidance of Value Destruction
THINKING ABOUT STRATEGIC POSITIONS
AND WORK

8
15
15
Strategic Positions Are Found Within Strategic Capabilities (VPC)
Strategic Positions Are Found Within Strategic Capabilities (VPC)
16
Wealth Creating Positions in the Airline Industry
Performance in Strategic Positions

9
17
Airline Industry
Positions Primary Financial Impact Revenue Cost Neutral
Events Manager
Corporate Client Manager
Airline Pilot
Airline Fuel Hedge Fund Manager
Director Seat Capacity Management
18
18
Desired Performance Variability
Str
ateg
ic Im
pac
t Hig
hLo
w
Meets Standard Exceptional
Position: Manager Airline Fuel Hedge Fund
Player Upgraded (or ?...)(“B” Player in “A” Position)
Position Eliminated(“A” Players in “C” Position)
Position: Airline Pilot

10
19
Strategic Positions Should Pass VPC
20
Identifying Strategic Work
VPC
1. A bundle of information, technology and people uniquely arrayed to create a competitive advantage in a targeted market
2. Has a direct impact on the firm’s strategic success (impacts success with customers) and creates wealth for the firm.
3. Delivers the customer and economic success of the Firm’s business model — as intended!
11
21
Strategic Position Impact Assessment
VPC Is this a
Strategic Position?
Impact Customer’s Perception
of Value
Enables us to change
our desired price
Enables us to produce
at our desired cost Yes No
1. Government Expertise
1. Exec. Dir. Gov (??)
2. Bid Manager (??)
3. GAIRD Lobbyist (?)
4. Sales Manager WSM
5. Underwriting Specialist (?)
6. Legal Bidding Support
7. Bidding Leaders (Public and Legal)
8. Union’s Relations Director
9. Federal & Parestatal Director
2. Alliance Management
1. Alliance Director – BS Development
2. Product Manager (Life, MM)
3. Implementation Head
4. Strategy Officer (includes M&A)
5. New Business Development
3. Business Relation Management
1. Sales Subdirector
2. Sales Manager (Insurance, AFORE)
3. Process Owner
4. CRM Analyst
5. CEO
6. Distribution Officer
7. Strategy Officer
4. Business Process Excellence
1. Issuing Manager
2. Claims Manager
2.1 Claims Analysts/ Medical “Dictaminadores”
3. MM Network Manager
4. Service Center Manager
5. Process Owner / QMS Officer
6. BSA
7. IT Arch.
An Example
22
Strategic Position Impact Assessment
VPC Is this a Strategic
Capability?
Impact Customer’s Perception
of Value
Enables us to
charge our
desired price
Enables us to produce
at our desired
cost Yes No A. Capability Positions: 1. 2. 3. 4. 5.
B. Capability Positions: 1. 2. 3. 4. 5..
C. Capability Positions: 1. 2. 3. 4. 5.
AN
EXERCISE

12
23
FIX KEEP
HighStrategic V
alue
Understanding the Impact of Work Quality
VPC
Low
ELIMINATE!Low Low
High
24
Zero‐Based Work Budgeting
Compliance / Regulatory Work
Low HighPresent Work Quality
High
Low
Low High
Desired Work Quality
High
Low
Imp
act on
Cu
sto
mer a
nd
Eco
no
mic
Valu
e Creatio
n (V
PC
Wo
rk)Compliance / Regulatory Work
Continually Expanded VPC
Work

13
25
Performance Planning and Strategy Execution
Work Quality
Str
ateg
ic V
alu
e
Low High
Hig
h
High Value Work –Poorly Performed
What Work Can You Start Doing?
High Value Work – Well Performed
Keep Doing This Work
Low
Low Value Work –Poorly Performed
Eliminate This Work
Low Value Work – Very Well Performed
What Work Can You Stop Doing?
V P C
26
Business Strategy Strategic Capabilities Strategic Capability Gaps Strategic Work
How Grow?• Where play?• How win?
Operational Excellence Product Leadership Customer Intimacy
Value Creation• Customer • Economic
At what must we be great?
“Bundles of technology, information, and people uniquely arrayed to create or extend a competitive advantage”
V = Impacts customer’s perception of value
P = Enables charging our desired price
C = Enables producing at our desired cost
How good do we need to be? vs. How good are we?
Destination Target
Progress Metric
What work must be done to achieve our strategic capability targets?
What work is essential to close our capability gaps?
What work has strategic value?
Strategic Workforce Planning: A Process Overview
Present
Desired
GAP
Work Quality
Strategic V
alue
Low
Low
High
Present
Desired
GAP

14
27
Workforce Management Disruption 2:
Workforce Differentiation
Workforce Management Disruption 2:
Workforce Differentiation
27
28Markets
Offerings
NOW NEW
NOW
NEW New product creation:Innovative
New market creation:Disruptive
Commoditization Geographic expansion
• Consumer insight• Speed• M&A
Capability examples:
• R&D• Joint ventures & acquisitions
• Process improvement
• Manufacturing excellence
Capability examples :
• Supply chain management
• Purchasing
• R&D• Consumer insight• Marketing excellence
Capability examples :
• Licensing• Alliances/joint ventures
• Real estate• Supply chain/ channel management
Capability examples :
• Logistics/ distribution
• Information systems
Where Do We go From Here?: The Growth Strategy Matrix
28

15
29
Did We Say “Talent Matters”?
10,000X.”Nathan Myhrvold, former Chief Scientist, Microsoft
“The top software developers are more productive than average software developers not by a factor of 10X or 100X, or even 1,000X,
but
30
There are Substantial Differences in Economic Returns Across Jobs

16
31
Performance Variability Is Critical for a Position to Be Strategic
+100%
+88%
+77%
+71%
+61%
+40%
+27%
2%
14% Bottom 10%
Bottom 5%
Bottom 1%
Bottom 3 reps
Total 7 reps
Top 1%
Top 5%
Top 10%
Top Quartile
2nd Quartile
3rd Quartile
Lowest Quartile
THE BEST
31%
100%
63%
Source: Gallup, Inc.
This company, highly regarded for its customer service, surveyed about 45,000 customers to gauge the impact of its 4,583 service reps. It discovered that the top 10% had a positive effect on customer attitudes with 71% of the customers they talked to; the top 7 reps created a positive effect with every customer. In sharp contrast, the bottom 10% had a net negative impact of 14% on customer attitude scores, while the bottom 3 employees alienated every customer they spoke with.
Impact on Customer Attitude ScoresTH
E WORST
32
Company Wealth Creating People: Retailing
Best solution
Fashion forward
Professional expertise
Personalized service
Best value
Convenient
Variety
Speed
NORDSTROM STRATEGIC CHOICE CUSTOMER INTIMACY
COSTCO STRATEGIC CHOICE OPERATIONAL EXCELLENCE
Strategic Capabilities 1. Real Estate 2. Purchasing
3. Logistics, Distribution & Info. Systems
4. Merchandising 5. Membership
Maintenance
Strategic Positions
Customer Impact
Wealth Impact Performance
Variability
1.A. Site Locating Analysts
2.A. Category Purchasing Specialists
3.A. Logistics Analysts
3.B. Distribution Contract Negotiators
4.A. Layout Specialists
4.B. Store Managers
4.C. Promotions Specialists
5.A. Membership Marketing Specialists
5.B. Membership Systems Manager
Strategic
Capabilities 1. Consumer-facing
Sales 2. Buying 3. Supply Chain 4. Marketing 5. Leadership
Strategic Positions
Customer impact
Wealth Impact Performance
Variability
1.A. Sales Counselors
1.B. Category Supervisors
2.A. Fashion Buyers
2.B. Purchasing Contractors
3.A. Systems Designers
3.B. Logistics Engineers
4.A. VP-Marketing
4.B. Consumer Insight Specialists
4.C. Brand Managers
5.A. CEO
5.B. Store Managers
Customer Perception of
Firm Attributes
Customer Perception of
Firm Attributes

17
33
Reward leaders who develop talent
Hold leaders accountable for strategy talent turnover
Interview 3 externals for every strategic position before
filling the position
Build a performance/compa-ratio grid
Conduct a talent auction
Others?
Workforce Governance/Rules
Possible HR Actions— A Few Ideas —
34
Workforce Management Disruption 3:
Workforce Analytics
Workforce Management Disruption 3:
Workforce Analytics
34

18
35
New Developments in Big Data and Business Analytics
• Academic and practitioner interest is substantial:
—Firms are spending billions on data and infrastructure across all functional areas
—Hundreds of books and thousands of articles have been written on this topic, and the pace seems to be accelerating
• Big Data are everywhere!
36
But……Big Data Require Bigger Theory!
• Ironically, more data isn’t necessarily always a good thing…..
• Moving from data to actionable information requires that we understand behavioral science theory and ask the right questions about how the workforce contributes to your success.
• Data collection and infrastructure is not your biggest problem – knowing what to measure and how to measure it is!

19
37
What Do We Mean by Workforce Analytics?
1. Calculating the ROI of individual practices (e.g., training, selection, etc.)?
2. Reporting activity metrics within the HR function (e.g., cost per hire, days to fill)?
3. Developing an HR Scorecard or Workforce Scorecard as a tool to help implement strategy more quickly & effectively?
4. External reporting (to shareholders) of human capital investments?
5. Developing predictive talent analytics to help execute our strategy?
38
Two Primary Uses of People Measurement Systems
1. Measuring Levels: How can we identify and reliably track the performance of our key human capital indicators?, and
2. Measuring Relationships: How can we begin to understand how much an improvement in these human capital indicators will affect the bottom line?

20
39
How do we decide what we need to measure?
Measures provide answers to questions!
How do we know what questions to ask?
We need to let our strategy dictate the metrics we adopt
We’ve got to focus on the data we need, not the data we have.
40
Measures Provide Answers to Questions!
• How do we identify and quantify the strategic capabilities – bundles of information, technology, and people – that drive our strategic success?
• What are the key strategic positions in our firm and how should they be managed?
• How do we identify and quantify the strategic work that has a major impact on value creation in our firm?

21
41
• How well is our strategic work currently being performed? What work needs to be added or deleted?
• How do we develop strategic talent inventories that help us identify 1) the talent we have, 2) the talent we need, and 3) what actions will close this gap?
• How do we design and implement measurement systems (HR and Workforce Scorecards) that ensure managerial accountability for firm’s most expensive resource, the workforce?
Questions (Con’t)
42
Questions (Con’t)
• How well does our current performance management system help us execute our business strategy? Our compensation system?
• How effective is our pipeline at producing “A” level strategic leadership talent?
• How can we equip both HR and Line managers to use data and analytics to improve the quality of decision‐making?

22
43
Three Issues:
Asking the Right Questions
Conducting the Right Analyses
Influencing the Right Decisions
Workforce analytics as derived demand: If talent doesn’t matter, analytics won’t either
44
Asking the Right Questions
Too often the focus is on the technical issues associated with data, often at the expense of clearly operationalizing the questions that we are trying to answer
Analytics doesn’t always just mean statistics – key emphasis should be on developing a cause-effect a conceptual understanding of what you are trying to measure, before you begin to think about data, measures, or inferential statistics
Don’t start with the data: Start with the question
Must begin with a review of prior research and the development of plausible hypotheses!

23
45
The Role of Theory
“Nothing so practical as a good theory” Kurt Lewin
“Every good regulator of that system must be a model of that system (Conant & Ashby, 1970)
“Every good solution must be a model of the problem that it solves. (Scholten, 2010)
45
46
Using Strategy Maps to Identify Strategic Workforce Metrics
24
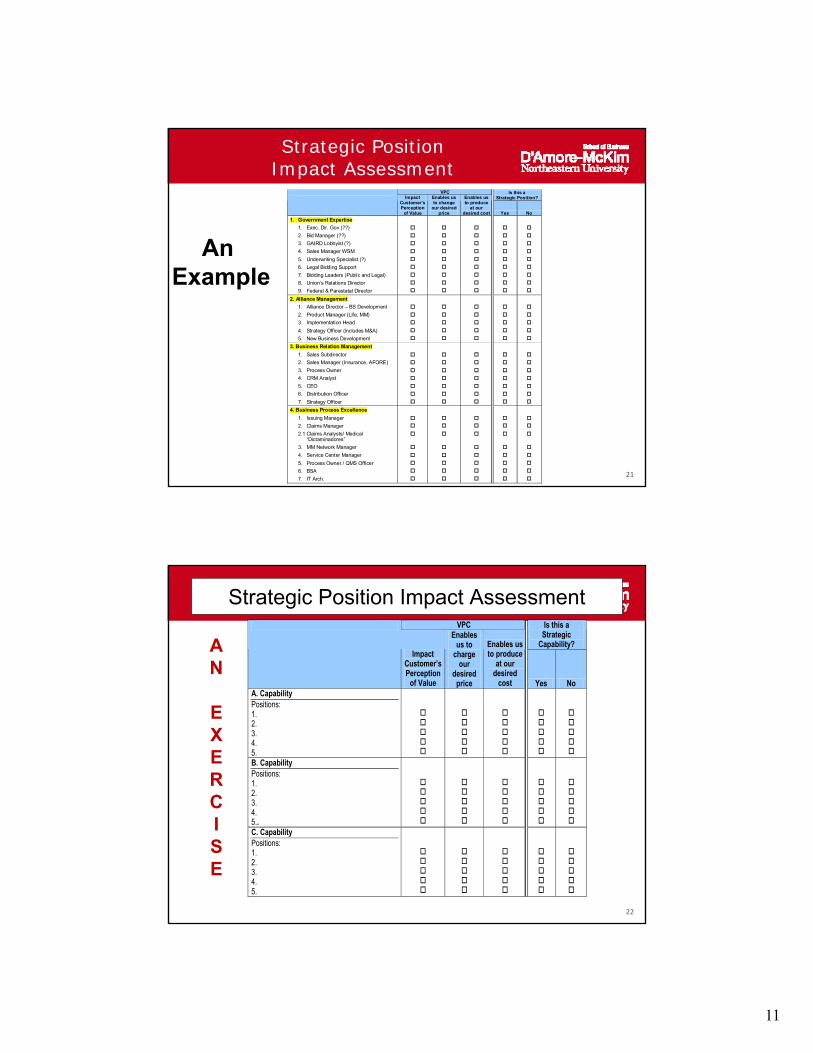
47
Strategy Map –Competency Skill Attainment Focus
Fin
anci
cal
Cu
sto
mer
Op
erat
ion
sS
trat
egic
SalesCompetencies
UnderstandEmployee Skill
Gaps
Service Partnership
Revenue fromCurrent
Customers
Increase Shareholder
Value
Provide TargetTraining &Services
Establish OngoingAssessment of
Targeted Employees
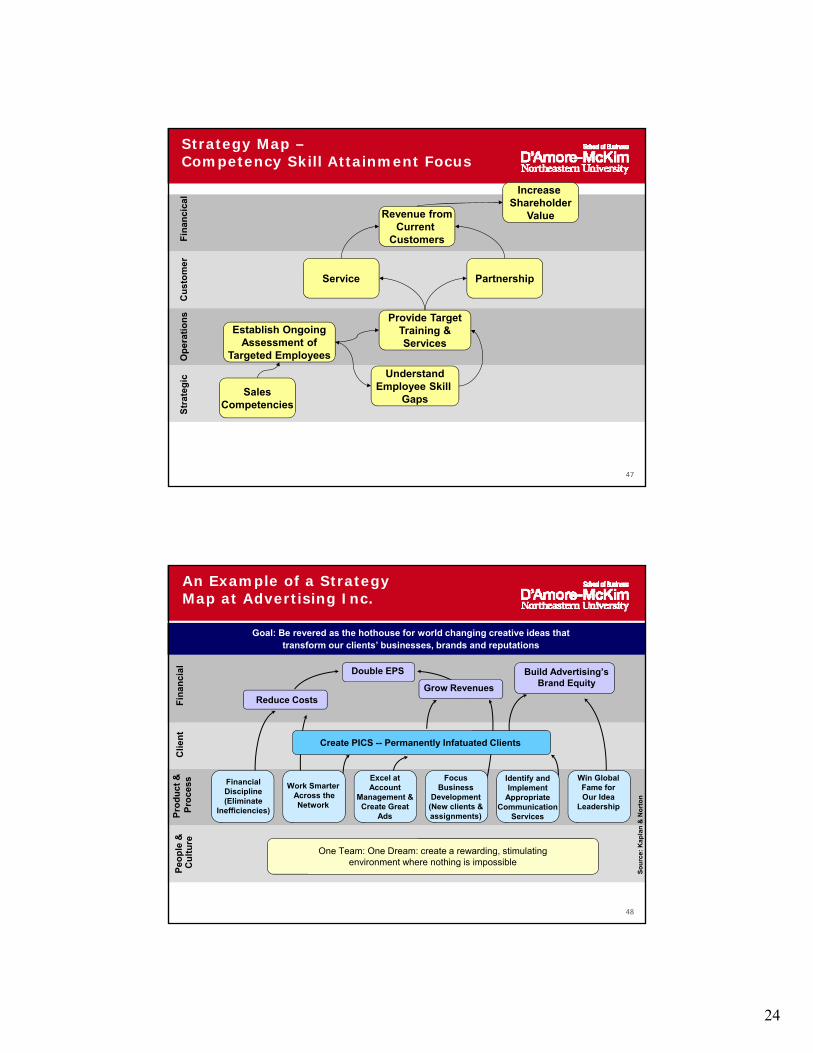
48
An Example of a Strategy Map at Advertising Inc.
Goal: Be revered as the hothouse for world changing creative ideas that transform our clients’ businesses, brands and reputations
So
urc
e: K
apla
n &
No
rto
n
Pro
du
ct &
P
roce
ssP
eop
le &
C
ult
ure
Cli
ent
Fin
anci
al
One Team: One Dream: create a rewarding, stimulatingenvironment where nothing is impossible
Financial Discipline(Eliminate
Inefficiencies)
Work SmarterAcross the Network
Excel at Account
Management & Create Great
Ads
Focus Business
Development (New clients & assignments)
Identify and Implement
Appropriate Communication
Services
Win Global Fame for Our Idea
Leadership
Create PICS -- Permanently Infatuated Clients
Reduce Costs
Double EPS
Grow Revenues
Build Advertising’s Brand Equity

25
49
Pro
du
ct &
P
roce
ssP
eop
le &
C
ult
ure
Cli
ent
Fin
anci
al
More Detail at Advertising, Inc.
Create Big Fabulous Ideas
Sell Ideas Generate
Ideas
Excel at Account Management & Create Great Ads
Be revered as the hothouse for world changing creative ideas thattransform our clients’ businesses, brands and reputations.
Develop skills and competencies Drive Motivation
Create stimulating work environment
One Team: One Dream: Create a Rewarding, Stimulating Environment Where Nothing is Impossible
Financial Discipline
Work SmarterAcross the Network
Identify Appropriate
Communication Services
Create PICS -- Permanently Infatuated Clients
Grow RevenueReduce Cost
Maximize Profit
So
urc
e: K
apla
n &
No
rto
n
50
Third-Order Strategy Map at Advertising, Inc.
Theme: “Excel at Account Management & Create Great Ads”Objective: Big Fabulous Idea (BFI) Objective
Internal Perspective
So
urc
e: K
apla
n &
No
rto
n
Create Big Fabulous Ideas (BFI)
Generate Idea
Challenge meeting brief process
Get physical engagement
of right people
Organize marketing
Leaders with a point of view
Generate interest
Select type of account working on
Develop position accountability
Sell ideas
Build Benefit Case Build relationship with client
State DeliverableSuccess with
Advertising, Inc.
Knowledge of business (company, product, market, etc.)
Anticipate client issues “Tell clients what they have not thought of yet”

26
51
Old Focus New Focus
Question
Asked
Question
Asked
Communication • Is our workforce satisfied / happy?
• Is our top talent in strategic positions thrilled with our firm?
Work Design • How do we do our work? • Are we focusing on value creation in every job?
Selection • Are we “fair” in our selection process?
• How well does our top talent in strategic roles compare to the labor supply?
Training/ Development
• How did our participants feel about our training?
• How can we accelerate the skills of our emerging talent in strategic roles?
Performance Management
• Are performance appraisals completed and on time?
• Is our performance management system a tool to help execute our business strategy?
Rewards • Is our program fair? • Are we adequately rewarding our value creators for their success?
What Do You Want to Know About Your Workforce?
52
Workforce Focus Workforce Practitioner
OrganizationWide
Workforce HR Function
• What do we want our workforce to understand about our company?
• How effective are our HR practices in delivering the workforce to win in the markets we choose to compete in?
Strategic Talent Leaders/Line Managers
Individual
• What is our level of top talent in strategic positions?
• How effective are our leaders in delivering HR policies and practices in managing their workforces to leverage our firm’s competitive advantage?
Focus
Basic HR / Workforce Metrics Questions
27
53
Toxic HR Measures: Calculations and Consequences
for Common HR Metrics
Why are Conventional HR Metrics Such a Problem?
54
Common HR Metrics
1. Cost per Hire / Days to Fill
2. HR Expense Factor
3. Revenue Factor
4. Training Investment Factor
5. Turnover Rate (Annual

28
55
Key Questions:
How are these metrics calculated?
How should they be interpreted?
Are they linked with firm performance? What does the research literature say?
What is the potential for unintended consequences as a result of their use?
What is our overall evaluation of each of these metrics?
Should we collect and benchmark these data?
Are better metrics available?
56
1. Cost Per Hire
Research Literature: All else equal, the correlation between cost per hire (as well as time to fill an open position) and firm performance is positive (more profitable firms spend more and take longer to fill positions). This is exactly opposite of how this measure is most often interpreted.
Unintended Consequences: Holding recruiters accountable for time to fill can cause them to be less selective in recruiting and selecting candidates. In the long run, this can increase direct workforce costs (and more importantly opportunity costs) exponentially.
Overall Evaluation: Don’t use it!
A Better Alternative: Time to promotion (and/or retention rates) for A players in A positions.

29
57
2. HR Expense Factor
Research Literature: More profitable firms actually spend more money on HR administration than do low profit firms.
Unintended Consequences: Efforts to HR administrative costs (e.g., from 100:1 to 200:1) – as would be expected based on the use of this measure - can shift cost savings in the HR function to operational and strategic losses throughout the workforce.
Overall Evaluation: Don’t use it!
A Better Alternative: Focus on common sense. Begin by asking: What are our strategic objectives for the workforce? Then: How do we need to structure the HR function to deliver these outcomes? Finally, develop a budget and strategic plan for HR that ensures we place A players in A positions for A customers. Efforts to develop a benchmark for such a highly idiosyncratic measure are unlikely to be successful.
58
3. Revenue Factor
Research Literature: Revenue per employee is a highly firm specific measure, exhibiting large cross-industry differences. Is also highly influenced by the definition of an “employee,” (e.g, FT permanent vs. FT temps).
Unintended Consequences: Can encourage managers to shift the composition of the workforce from permanent full time to temps and consultants (which are often more expensive).
Unintended Consequences: Same as Human Capital Value Added.
Overall Evaluation: Don’t use it!
A Better Alternative: Develop a clear understanding of the differences in economic returns for strategic vs. non-strategic positions, and then invest disproportionately in the strategic roles. Measurement should then help us understand our progress on these goals.

30
59
4. Training Investment Factor
Research Literature: While there is a modest link between training dollars and firm performance, most studies do not have quality data on the type or quality of training that is employed.
Unintended Consequences: Encourages managers to focus on the overall training budget, not the type and quality of capabilities being developed.
Overall Evaluation: Don’t use it!
A Better Alternative: Training effort and outcomes for high performing employees in strategic positions vs. low performing employees in non-strategic roles (maximize the former; minimize the latter).
60
5. Turnover Rate
Research Literature: While there is a modest link between overall turnover and firm performance, most studies do not have data on the type or quality turnover that is needed for effective managerial intervention.
Unintended Consequences: There is no such thing as “overall” turnover (see next slide). Managing as if there is can cause managers to focus their retention efforts on low performing employees.
Overall Evaluation: Don’t use it!
A Better Alternative: Need to minimize controllable turnover among high performers and maximize turnover among low performers –especially in in strategic positions.

31
61
Determining the True Cost of Employee Turnover
Types of turnover:
Undesirable, controllable
Undesirable, uncontrollable
Desirable, controllable
Desirable, uncontrollable
62
Types of Turnover
Con
trol
led
(or
Con
trol
labl
e)?
Oops!
Spouse Relocation
Fired (Managed out)
Happy Accident
Desirable?
Yes
No
YesNo

32
63
Time
35%
Average Turnover
The Perils of Benchmarking:
25%
15%
5%
Alternate Name: Losing your winners and winning your losers
64
A Better Way to Calculate the Impact of Employee Turnover

33
65
Imagine that you are considering the development and implementation of a new integrated performance management and incentive compensation program. The total development costs for this program will be $250,000. You estimate that this program will increase annual cash flow from operations a total of $270,000 each year for the next five years. However, because the program involves incentive pay, wages will increase a total of $130,000 per year for the five-year period. Assuming the firm’s marginal cost of capital is 14 percent, should your firm roll out the new program? An NPV analysis of this situation would look as follows (note: The present value “factors” shown in the example below are taken from an Introduction to Financial Analysis textbook. Alternatively, these values can be calculated via a spreadsheet or financial calculator).
Calculating Benefits Less Costs (An Example)
66
Year Explanation Amount X Factor =Present value
1 Program Development -$250,000 1 -$250,000Cost
1-5 Increased wages -$130,000 3.433 -$446,290
1-5 Increase in annual +$270,000 3.433 $926,910cash flow from operations
Net present value: $ 280,620
Based on these analyses, the program should be developed and implemented.
Calculating Benefits Less Costs (Examples)

34
67
Cost Estimate of Replacing 120 High-Potential Managers
$60,000$900,000$900,000$600,000$1,200,000$3,000,000
$6,660,000
Year #1 (hire 120 new managers)
Separation costsRecruiting costsSelection costs Training and acculturation costsLower productivity – acculturationLower productivity – long run
TOTAL
68
Cost Estimate of Reducing Turnover from 30 Percent to 15 Percent
Year #1 (400 Employees) Increased variable pay for high performersEnhanced promotional opportunitiesAdditional training (competency development)
$1,200,000$360,000$600,000
Year #2 (400 Employees)Increased variable pay for high performersEnhanced promotional opportunitiesAdditional training (competency development)
$1,200,000$360,000$600,000
Year #3 (400 Employees)Increased variable pay for high performersEnhanced promotional opportunitiesAdditional training (competency development)
$1,200,000$360,000$600,000
Present Value of Costs(3 years @ 10%)
$5,858,381

35
69
Benefits Estimate of Reducing Turnover from 30 Percent to 15 Percent
Year #1 (60 Employees)Enhanced productivity
Year #2 (120 Employees)Enhanced productivity (current and prior years’ retained employees)
Year #3 (180 Employees)Enhanced productivity (current and prior years’ retained employees)
Present Value of Benefits (3 yrs @ 10%)
$9,000,000
$6,000,000
$13,320,929
$3,000,000
70
Net Present Value of Reducing Turnover from 30 Percent to 15 Percent
PV of Benefits $13,320,929
PV of Costs -$5,858,381
PV of Benefits Less PV of Costs $7,462,548

36
71
Metrics with Impact
1. The percent of “A” players in “A” positions2. The percent of “B” players with “A” potential in “A” positions3. The percent of “C” players in “A” positions.4. The percent of overpaid “A” players in “C” positions5. The level of strategic understanding of the firm by its workforce6. The percent of wealth-creating positions (direct revenue or cost
impact on the firm’s business model) identified7. The number of unsuccessfully performing individuals in wealth-
creating positions removed from the organization8. The percentile of individuals in customer service roles that have
performed successfully as assessed by customers9. The time-to-fill rate for high performers in strategic/wealth-creating “A”
positions10. The time-to-exit of “C” players in “A” positions
72
An Example Workforce Scorecard
for Big Pharma

37
73
HR SYSTEMS
• Align • Differentiate
• Integrate
HR PRACTICES
• Work design• Staffing• Development• Rewards
• Communication • Performancemanagement
HR WORKFORCECOMPETENCIES
• Strategic Partner
• Administrative Expert
• Change Agent• Employee Advocate
WORKFORCE MINDSET AND CULTURE
Does the workforce understand our strategy and embrace it, and
do we have the culture we need to support strategy execution?
WORKFORCE COMPETENCIES
Does the workforce, especially in the key or “A” positions, have the skills it
needs to execute out strategy.
WORKFORCE SUCCESS
Has the workforce accomplished the key strategic objectives for the
business?
LEADERSHIP AND WORKFORCE BEHAVIORS
Are the leadership team and workforce consistently behaving in ways that will
lead to achieving our strategic objectives?
CUSTOMER SUCCESS
What specific customer desires and expectations must be satisfied?
FINANCIAL SUCCESS
What specific financial commitments must be met?
OPERATIONAL SUCCESS
What specific internal operational processes must be optimized?
HR Scorecard
Workforce Scorecard
Balanced Scorecard
Managing Human Capital To Execute Strategy
74
Overall Strategy Map at Pharma, Inc.
• Shareholder Value• ROCE
New Product Revenue Customer Profitability Cost per Unit Asset UtilizationFin
anci
al
Pe
rsp
ect
ive
Cu
sto
mer
P
ers
pe
ctiv
eIn
tern
al
Pe
rsp
ect
ive
Lea
rnin
g &
G
row
th
Pe
rsp
ect
ive
Customer Value Proposition
Customer Intimacy
Product Leadership
Customer Satisfaction
Customer Acquisition Customer Retention
Product/Service Attributes
Op Excellence
Relationship Image
- Skills- Knowledge Sharing
So
urc
e: K
apla
n &
No
rto
n
Strategic Competencies
- Awareness- Alignment- Incentives
Climate for Action
InfrastructureApplications
Strategic Technologies
A Motivated and Prepared Workforce
“Build the Franchise”(Innovation Processes)
“Increase Customer Value”
(Customer Management
Process)
“Good Neighbor”(Regulatory & Environmental
Processes)
“Operational Excellence”
(Operations & Logistics Process)
Price Quality Time Function Service Relations Brand
Enhance the Franchise Enhance Customer Value Improve Cost Structure Improve Asset Utilization
Revenue Growth Strategy Productivity Strategy
Improve Shareholder Value

38
75
Strategic Capabilities at Big Pharma
Current Desired
World Class 5
Elite 4
Highly 3Competitive
Competent 2
Abysmal 1
R&D Licensing/Acquisitions
Sales/ Marketing GovernmentRelations
Quality Leadership
76
Workforce Scorecard for R&D at Big Pharma
Workforce Behaviors
Workforce Success
WorkforceCompetencies
Total % “A” players% B players with A potential% T&D for A players% pay at risk and % options and % bonus to for A Players Bench strength rating on 360
# of new compounds generated that progress to Phase IBreadth and depth of therapeutic area knowledgeIntroduction of new discovery and development technologiesCycle-time from discovery to Phase I
Knowledge-sharing indexTeam performance indexLeadership Profile IndexRetention % of “A” players and exit % of “C” players
% of workforce with a clear understanding of firm strategy% of workforce that is committing to executing this strategy% of the workforce that has the skills needed to execute strategy% of the workforce feeling that culture supports strategy execution
WorkforceMindset/Culture
39
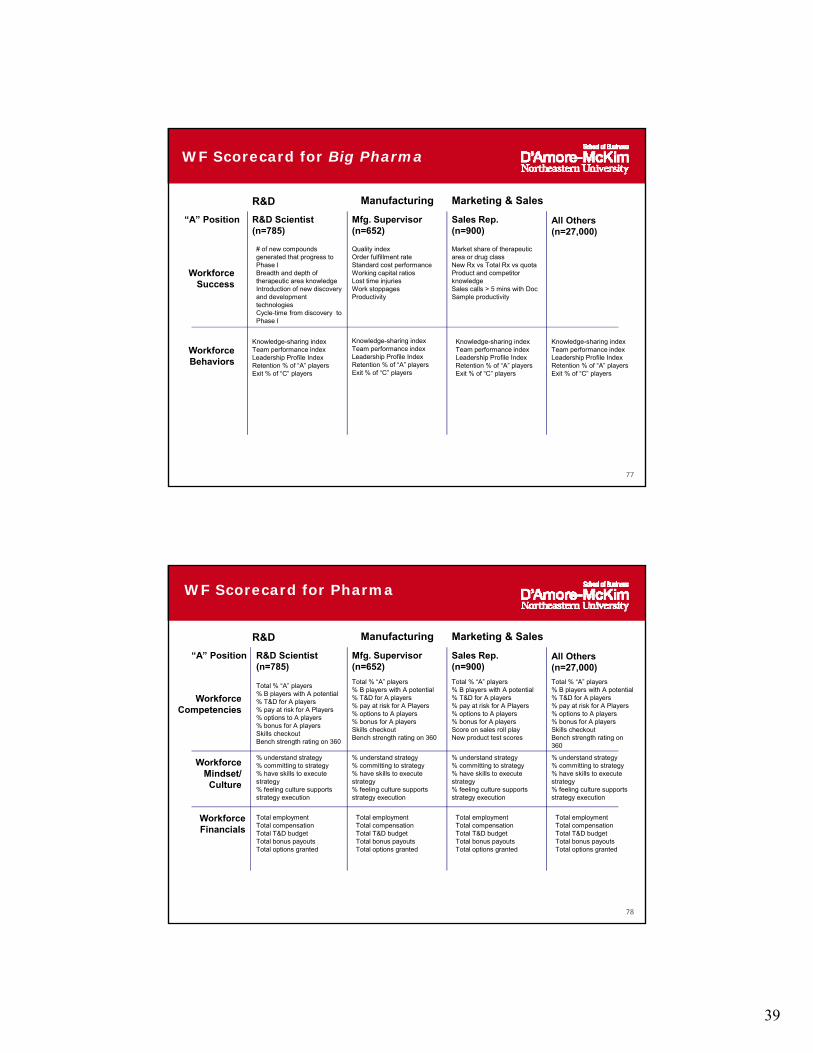
77
WF Scorecard for Big Pharma
R&D Manufacturing Marketing & Sales
“A” Position R&D Scientist (n=785)
Mfg. Supervisor (n=652)
Sales Rep.(n=900)
All Others(n=27,000)
Workforce Success
# of new compounds generated that progress to Phase IBreadth and depth of therapeutic area knowledgeIntroduction of new discovery and development technologiesCycle-time from discovery to Phase I
Quality indexOrder fulfillment rateStandard cost performanceWorking capital ratiosLost time injuriesWork stoppagesProductivity
Market share of therapeutic area or drug classNew Rx vs Total Rx vs quotaProduct and competitor knowledgeSales calls > 5 mins with Doc Sample productivity
Workforce Behaviors
Knowledge-sharing indexTeam performance indexLeadership Profile IndexRetention % of “A” playersExit % of “C” players
Knowledge-sharing indexTeam performance indexLeadership Profile IndexRetention % of “A” playersExit % of “C” players
Knowledge-sharing indexTeam performance indexLeadership Profile IndexRetention % of “A” playersExit % of “C” players
Knowledge-sharing indexTeam performance indexLeadership Profile IndexRetention % of “A” playersExit % of “C” players
78
“A” Position R&D Scientist (n=785)
Mfg. Supervisor (n=652)
Sales Rep.(n=900)
All Others(n=27,000)
Workforce Competencies
Workforce Mindset/Culture
Total % “A” players% B players with A potential% T&D for A players% pay at risk for A Players % options to A players% bonus for A players Skills checkout Bench strength rating on 360
Total % “A” players% B players with A potential% T&D for A players% pay at risk for A Players % options to A players% bonus for A players Skills checkout Bench strength rating on 360
Total % “A” players% B players with A potential% T&D for A players% pay at risk for A Players % options to A players% bonus for A players Score on sales roll playNew product test scores
Total % “A” players% B players with A potential% T&D for A players% pay at risk for A Players % options to A players% bonus for A players Skills checkout Bench strength rating on 360
% understand strategy% committing to strategy% have skills to execute strategy% feeling culture supports strategy execution
% understand strategy% committing to strategy% have skills to execute strategy% feeling culture supports strategy execution
% understand strategy% committing to strategy% have skills to execute strategy% feeling culture supports strategy execution
% understand strategy% committing to strategy% have skills to execute strategy% feeling culture supports strategy execution
WorkforceFinancials
Total employmentTotal compensationTotal T&D budgetTotal bonus payoutsTotal options granted
Total employmentTotal compensationTotal T&D budgetTotal bonus payoutsTotal options granted
Total employmentTotal compensationTotal T&D budgetTotal bonus payoutsTotal options granted
Total employmentTotal compensationTotal T&D budgetTotal bonus payoutsTotal options granted
R&D Manufacturing Marketing & Sales
WF Scorecard for Pharma

40
79
From Metrics to Action –Using Analytics to Drive
Strategy Execution
80
Workforce Strategy: Process Flow for HR Practices
Current StateHR Practice
ChangesStrategic
Differentiation
• Same process for all positions• Recruit on demand• HR Driven
• Once a year• Leaders not skilled with development planning & feedback• Reluctance to address issues
• Most development offered to all employees• Some differentiation for “Key talent”• “Random” approach to career pathing
• Pay at market• Pay for Performance• Universal Retention Strategy
• No assessment or process for key positions• Success factors not well defined• “Tough” calls are sometimes avoided
• Messaging for HR & Leadership is unclear
Staffing
Performance Management
Compensation
Development
Talent Management
Communications
• Constant recruiting for key positions• Line Ownership• Competency-based
• Ongoing/proactive for key positions• Leaders well trained and accountable• Performance issues managed
• Leadership development programs & assessments well-defined• Success factors well-defined for key positions• Process ensures that key talent occupies key positions
• Greater differentiation of investment to build strategic capabilities• More career guidance for key areas/positions• Competency approach
• Increase pay for key positions• Pay for performance - greater at risk pay for key positions• Targeted Retention Plans
• Processes are well-defined and communicated to HR & Leadership

41
81
Current HR PracticesHR Practices for
Strategic Positions
Staffing
Performance Management
Compensation
Development
Talent Management
Communications
HR Practices for Support
Roles
Workforce Strategy: Process Flow for HR Practices
82
HCP Strategic Talent Responsibility Matrix
Initiatives Required Line Manager HR FunctionExecutive Leadership.
We need to strength executive talentbench strength. We should review our"top talent" in sales and marketing andbegin cross-functional rotations andexternal, university-based programs tobroaden them through finance andmanufacturing experience/ education.
Manufacturing Excellence.
We need to develop manufacturingtalent faster and provide openings toacquire "top talent" manufacturingprofessionals. We must reduce thenumber of the CLs and moves (38 of48) to provide space for hiringmanufacturing talent. Of our 64employees in strategic manufacturingpositions, 47 are at career level oridentified as "moves." This situationmust be quickly corrected.
The President of this division mustassume responsibility for thedevelopment of "top talent" for executiveleadership positions. Tracking of thedevelopment of these individuals'progress through rotations, externalprograms and mentoring is essential.Two "ready now" executive caliberleaders are expected within 18 months.
The President of this division and the VPof Mfg. must devise a plan to significantlyenhance manufacturing talent and trackthe results. At least a dozen "top talent"hires from the best schools or bestpractice firms must be accomplished inthe next year. The hires must be familiarwith the latest manufacturing tools (e.g.,Six Sigma, etc.). The President and VPMfg. are responsible for significantprogress in the next two years. At leastone-half of the 47 must be addressed.This will be a significant part of theirperformance evaluation.
Corporate HR must be involved indevelopmental efforts and explore potentialexecutive "top talent" available for thisdivision. CHR must also assess andsuggest external programs to develop theavailable talent. CHR must be involved inthe hiring of at least one external "toptalent" executive this year.
Corporate HR must begin both a collegerecruiting program (6 hires) formanufacturing positions and develop aManufacturing Leadership Program (MLP)for the new hires. They must also identify,recruit and be involved in the selection ofexternal manufacturing talent with "cuttingedge" skills. CHR must also develop amanufacturing skills training program toupdate all manufacturing supervisors.Significant overall competency enhancementis expected in manufacturing in the very nearfuture, and HR must be up to this challenge!

42
83
Initiatives Required Line Manager HR Function
Sales/Marketing.We must exit our "move" individualsand significantly upgrade our brandmanagement talent from ourconsumer insight talent. We shouldalso develop better merchandisingtalent. Fifty percent of thesepositions are staffed with CL ormove incumbents.
R&D/New Product Development.There are way too many careerlevel individuals in this group andnot enough top talent. We need atleast four new design engineerswho can develop new products andimprove old products, especially our"hardy perennial" in-serviceproblems.
VP Sales & Marketing is to initiate thehiring of two marketing directors andprovide developmental plans for brandmanagement and consumer insightspecialists targeted on marketingdirector positions. The leadership ofsales and marketing is accountable formeasurable progress in workforcedevelopment in the next two years.
VP Marketing and VP Manu-facturing must be honest in theassessment of talent in this groupand devise a plan to achieve "toptalent" status to not only bettermarket new products, but also toreduce the cost of productionthrough design.
CHR must develop career growthmodels for the brand manager andconsumer insight series to acceleratethe development of "top talent" inthese positions. CHR, in conjunctionwith VP Marketing, mustacquire/develop at least one newbrand manager and exit all "move"individuals.
CHR must explore how they may beinvolved and help this group, even if itis merely referrals to externalrecruiting sources. Perhaps they mightdesign new product idea businessproposal process (for all employees) to"jump start" product ideation.
HCP Strategic Talent Responsibility Matrix
84
Aligning HR Practices to Deliver Strategic Talent at FridgeCo
Selection Performance Management Rewards
A PositionsTarget: Attracting, growing, and retaining candidates/ employees from the top 10% of the available labor market for strategicpositions.
Talent is constantly topgraded Never wait for a vacancy to recruit Constantly in the market for top candidates Seek referrals from very top performersAssiduously screen all referrals using specific, high- expectation criteria
Set performance expectations at very high levels; among the highest in the industry or establish world class standards using both outcome and behavioral standardsPerformance is continuously monitored and employees given frequent feedback on the status of their contributionsImmediately separate employees in strategic positions who are not performing at very high levels
Base compensation is well above the third quintile in the market; may even have internal midpoint as high as the ninetieth percentileSignificant “at risk” variable pay is used as an incentive with top performing employees, often doubling or tripling their base compensation (or even higher in many instances)Incentive pay does not become a part of base pay
B PositionsTarget: Attracting and growing candidates/ employees from the middle of the labor market for positions which support the success of the strategic workforce.
A vacancy must occur before recruiting beginsUse an agency for recruitingAllow screening to be conducted by recruiterPermit only referrals from recruiters who are below the market midpoint in compensationPositions eliminated if not contributing to the strategic success of the firm
“Success” is defined as meeting a market standard for performanceOutstanding performance is slightly above what is considered the market standardOccasional feedback provided for standard and above-standard employeesEmployees performing very poorly are removed
Base compensation is about the midpoint of the marketIncentive pay is provided based on the range of market movement for the position (e.g., 3-4%) with top performers getting twice the maximum increase if they are below marketGainsharing/goalsharing is encouragedLow performers receive no increase in pay
C PositionsTarget: Attracting candidates from below the midpoint of the labor market for necessary positions which are neither strategic nor support strategic positions.
Each vacancy scrutinized for its necessityRecruit with newspaper adsUse an agency screen and hire from applicationsPositions eliminated if adding little or no value.
Standard performance is at or below market midpointFeedback is given only if employees fall significantly below standard performanceIf employees in this position continue to come to work and meet minimum standards, they are retained.
Base compensation is set with the midpoint at the lowest quartile or the market for the positionIncreases are based on market movement for the positionsProductivity incentives (and technology) which reduce cost of this work are encouraged.

43
85
Strategic Talent at FridgeCo (Con’t)
Development Communications Work Design
A PositionsTarget: Attracting, growing, and retaining candidates/ employees from the top 10% of the available labor market for strategicpositions.
Significant developmental resources are set aside for investing in individuals in these positions Each employee in these positions has a mentor (or external coach); is considered for rotational assignments and provided internal and external training opportunities Best practices are encouraged and efforts devoted to the development, identification and sharing of best practice examples Funds are readily available for attending professional conferences and best practice audits Attendance at a special orientation designed for strategic positions is mandatory
Messages acknowledge employee’s value to the firm and that their roles make the firm’s business strategy become a reality They are often in contact with “stretch” customers to learn new ways of enhancing the value of their efforts in meeting customer requirements Messages from top management make them intimately familiar with the firm’s business strategy Supervisors consistently assure top performers in these positions their value to the firm now and in the future
New and improved ways of adding strategic value are demanded and revered Efforts are designed to remove all bureaucratic non-value-added work from these positions All work is constantly assessed for its strategic value, work once considered highly valuable but devalued in competitive markets will be eliminated regardless of who designed the work or work processes Special “best practices” training sessions are developed to train the strategic workforce in new, improved ways of creating customer and economic value for the firm No work is sacred. If it does not leverage the firm’s competitive advantage in these positions, it is eliminated
B PositionsTarget: Attracting and growing candidates/ employees from the middle of the labor market for positions which support the success of the strategic workforce.
Employees are encouraged to attend programs designed to enhance their skills in their specific area of expertise Leaders/managers in these roles are encouraged to attend the leadership development offerings provided by the firm Attendance at organization –wide orientation is mandatory
Incumbents are informed that their role is to support the strategy of the business by enabling strategic roles to deliver more value to customers and leverage the firm’s margins in doing so They are to understand that their value is focusing on work that makes strategic roles successful They are admonished that creativity and innovation in providing support to strategic roles is encouraged and recognized
Improving work processes which reduce costs and/or deliver enhanced levels of strategic support to the firm’s business strategy are highly encouraged Monitoring internal and external best practices is encouraged and suggestions to audit best practices taken seriously and implemented All non-value-added strategic work is to be eliminated Offshoring/outsourcing may be implemented when it provides sufficient value to the firm’s strategy
C PositionsTarget: Attracting candi-dates from below the mid-point of the labor market for necessary positions which are neither strategic nor support strategic positions.
Employees are expected to attend training efforts designed to enable them to meet the minimum performance standards Managers/supervisors can attend company-wide developmental programs when space is available Attendance at organization –wide orientation is optional
Messages are designed to indicate that these roles are designed to provide a stable, safe, and secure work environment for the organization Unacceptable performance will not be tolerated Exceptional performance may not be recognized
New ways to eliminate work are encouraged and acted upon immediately All unnecessary work is to be eliminated Outsourcing and offshoring are constantly considered for these positions
FridgeCo Workforce Plan HR Leader Strategic Talent RecapSTRATEGIC CAPABILITY:Manufacturing Excellence
STRATEGIC POSITIONS:• Plant Managers • Area Supervisors
ACTION PLANS:• Exit moves and “careerists.” • Hire developing talent. • Hire and move “top talent” into 38 career level/move positions.
HR PRACTICE ACTIONS Work Design Selection Development Performance Mgt. Rewards Communication
• Redesign area supervisor positions to assume more of the plant manager’s roles earlier in their careers.
• Exit/move at least 25% of career-level (CL) staff.
• Move more of the developing manufacturing talent into the 37 CL/”move” area supervisor positions.
• Hire at least 12 top-talent hires from the best schools or best-practice firms within next 12 months.
• Reassign and replace at least ½ CL and move mfg. staff incumbents.
• Replace with top-talent hires or individuals designated as emerging talent elsewhere in the firm.
• Initiate a manufacturing college recruiting program.
• Develop a manu-facturing leadership program for all new mfg. hires.
• Develop a mfg. skill training program to update all mfg. supervisors.
• Add competency acquisition as a significant component in the appraisal of manufacturing supervisors. Weight as 25% of the evaluation of these individuals.
• Evaluate all mfg. staff in company-sponsored mfg. training programs on their progress using a competency-development model developed by HR.
• Develop a pool of “spot awards” to reward extraordinary competency growth by mfg. talent (especially for area supervisors).
• Develop productivity incentives as plant-wide awards for all employees.
• Communicate to ALL managers and supervisors in this area that they must significantly grow their manufacturing competencies annually.

44
FridgeCo Workforce Plan HR Leader Strategic Talent RecapSTRATEGIC CAPABILITY:Sales/Marketing
STRATEGIC POSITIONS:•Marketing Director •Brand Managers •Consumer Insight Specialists •Merchandising Managers
ACTION PLANS:• Exit “moves” and initiate campus recruiting and career development plans to strengthen marketing talent at all levels.
HR PRACTICE ACTIONS Work Design Selection Development Performance Mgt. Rewards Communication
• Conduct a best practice study outside our industry on offshoring and growing consumer insight talent. Visit at least 3 “qualified” best practice firms and develop consumer insight career growth model.
• Exit “moves” and initiate campus recruiting and career development plans to strengthen marketing at all levels. Reduce number of Career Level’s (CL) and “moves” (12) to provide opportunities for talent we intend to hire.
• Upgrade our brand-management and consumer insight talent. Acknowledge that 50% of these positions are staffed with CL or move incumbents.
• Hire 2 marketing directors in next 12 months.
• Develop career growth models for brand mana-ger/consumer insight series. Work with Corporate HR to develop a career development profile that details the specific responsibilities, competencies, and metrics indicative of competency acquisition in each position within the series.
• Provide developmen-tal plans for all brand manager and consumer insight positions.
• Sales/Marketing will be primarily account-able for assessing development of competency growth as a regular part of the performance management process. HR must design these systems. Line management must be trained in the use of these systems.
• Exits from this group, especially merchan-dise managers, are essential. New blood is critical here!
• Begin to reward competency growth and provide progressions in addition to promotion incentives as individuals check out on competency acquisitions
• Work with marketing executives to assure that they have communicated with all emerging marketing talent on their future value to the firm and the developments we have for them.
FridgeCo Workforce PlanSTRATEGIC CAPABILITY: STRATEGIC POSITIONS: ACTION PLANS:
HR PRACTICE ACTIONS Work Design Selection Development Performance Mgt. Rewards Communication
HR Leader Strategic Talent Recap
R&D/New Product Development •Design Engineers •Cooling Specialists •Laundry Specialists
•Initiate external hiring programs for “top talent” at all levels. •Begin to exit careerists – so we have 14 of 20 in this category.
• Assign our best facilitators (change agent from CHR) to work with the new product design team and manufacturing to significantly enhance new product design process and better assure product quality.
• Initiate external hiring program for top talent at all levels of R&D/NPD.
• Exit careerists (14 of 20 in this category). We need at least 4 new design engineers who can develop new products and improve
old products, especially our hardy perennial in-service problem products.
• Design selection process
for new design engineers.
• Develop a referral network with external recruiting sources for design engineers.
• Devise a plan to achieve top-talent status to reduce the cost of production.
• Design a new product/idea business proposal process to jump start new product ideas/ creativity process.
Executive leadership must honestly assess talent in this group.
• Design competency growth reward system
• HR and line management must communicate to top talent how much they are valued and our developmental plans for them.

45
FridgeCo Workforce Plan
HR PRACTICE ACTIONS
HR Leader Strategic Talent Recap
OTHER HR ACTIONS — HR DELIVERABLES — STRATEGIC TALENT METRICS
• Assure that all employee benefit information requests are referred to our vendor.
• Reduce efforts with employees on HR self-services as we end our transition to our vendor.
• To access markets in China, India and perhaps Russia we need to establish facilities there to enable us to have inroads and manufacture for those markets, with basic supply coming from North America. These issues need to be explored within the next 6 months and possible site locations determined.
• Assign significant staff to help staff our offshore manufacturing efforts.
• Play a significant role in site selection, workforce analysis, and staffing
• Automate more of customer service to enhance accuracy and efficiency, with more complex and detailed inquiries handled by employees. Voice imaging/automation has advanced to the extent that we believe we can improve our customer interface through automation.
• Serve on team to automate at least 75% of customer service call center by yearend.
• Design the roles necessary to serve this role and with corporate recruiting hire the staff to maintain this effort.
• Significantly reduce employee advocate efforts for non strategic positions.
• Severe relationship with chronic underperformers and provide list of these individuals to their boss’s boss.
• Time devoted to employee advocacy should be reduced by 30% this year.
• Initiate major HR effort to eliminate all low-value HR work (e.g., unnecessary reports, approvals, meetings, policies, procedures, etc.)
HR DELIVERABLESEFFECTIVENESS: Assure all strategic position targets in Workforce Plan are met by yearend.
EFFICIENCY: Reduce HR cost as a percent of payroll by 3%. STRATEGIC TALENT TARGET METRICS
Strategic Capability Strategic Positions Top/Emerging Talent Percent Target Percent Career Levels & Moves
Exit /Move New Hires
Exec. Leadership 3 2 67% 100% 1 1 1
Manufacturing 64 17 27% 50% 47 15 15
Sales/Marketing 24 12 50% 75% 12 6 6
R&D/New Product Development
20 6 30% 50% 14 7 4
IMPLICATIONS FOR CORPORATE HRCenters of Excellence Service Centers Other
• Unique recruiting efforts focusing on “A” positions• Design exit programs for “C” player transition• Redesign survey instruments to shorten and focus on strategic understanding and firm/LOB product knowledge• Redesign corporate leadership development program
• Redeploy investments to “A” positions• Improve efficiency of all HR transaction process• Being major outsourcing of all HR transaction processing
• Screen automation candidates for customer service delivery system
Strategic Talent as a Sustainable Source of Competitive Advantage: Alignment for Value Creation
Old Focus New Focus
Question Asked
Data Needed Decisions Made
Question Asked
DataNeeded
Decisions Made
Communication Is our workforce satisfied / happy?
Traditional job satisfaction survey
Give the workforce more “satisfiers”
Is our top talent in strategy position thrilled with our firm?
Strategic engagement survey
Provide top talent what is needed to retain and motivate them
Work Design How do we do our work?
Job descriptions Did we accurately capture how work was done?
Are we focusing on value creation in every job?
Performance Appraisal data/ information
What work is strategic? Support? Surplus?
Selection Are we “fair” in our selection process?
Adverse impact analysis
Remove all selection tools that have an adverse impact
How well does our top talent in strategic roles compare to the labor supply?
External market assessment of our talent
Keep and reward top talent that benchmarks well against the external labor supply
Training/ Development
How did our participants feel about our training?
Conduct post training “smile” surveys
Remove unpopular instructions
How can we accelerate the skills of our emerging talent in strategic roles?
Identification of developmental needs of emerging talent
Develop rotational, mentors / coaches and training programs for emerging talent in strategic positions
Performance Management
Are performance appraisals completed and on time?
Submission on due date and complete
Withhold increases until performance appraisal forms are completed
Is our performance management system a tool to execute business strategy?
Analysis of alignment of performance management systems
Use zero-based strategic work planning/ budgeting
Rewards Is our program fair?
Analysis of distribution of increases
Everyone gets a raise
Are we adequately rewarding our value creators for their success?
Assess relationship between strategic performance and extraordinary rewards vs. lower performers
Assure that we never abuse our best performers with inadequate rewards (or over reward our poor performers)
Transitioning HR Practices

46
Strategic Questions for Every HR Practice: A quick audit of how strategic your HR function is and what to do about it!
To what extent is your HR function doing the following?
Communication Work Design Performance Management Selection Development Rewards
Strategic Questions(s)
Does our workforce know our firm’s strategy and how they can contribute to value creation?
What work is strategic?
What work impacts value creation?
What work is surplus?
Are we expecting and inspecting the creation of customer and economic value for every job in our firm?
Are we selecting top talent for our strategic roles?
Are we selecting the right candidates for strategic roles?
Are we rapidly exiting low performers in strategic roles?
Are we growing strategic talent at an inordinate rate?
Do we have the best bench strength of strategic talent in our industry?
Are we over rewarding our under-performers and under-rewarding top performing, strategic talent?
To What Extent…? Low 1 2 3 4 5 High Low 1 2 3 4 5 High Low 1 2 3 4 5 High Low 1 2 3 4 5 High Low 1 2 3 4 5 High Low 1 2 3 4 5 High
Action Needed Communicate business strategy and the firm’s status, especially relative to competitors
Focus on eliminating all non-value added work and engaging only in work our customers are willing to pay for
Use zero-based work budgeting for all jobs—never use job descriptions or standard performance management formats for performance planning
Select from the top 10-15% of the available labor market for all strategic positions. Build an inventory of strategic talent outside your firm to minimize time to fill vacancies in strategic roles
Build career development models to accelerate growth in all strategic roles with a substantial number of incumbents
Reward top performers well above the market and non-strategic work at and near Q1. Reward career development achievements by strategic players inordinately
Success Metric Surveys to measure the extent our workforce knows your firm’s strategy and how successful you are in achieving your strategic objectives
Measure financial savings of work eliminated
Measure the revenue impact of customer valued work added
Measure performance variability across incumbents. Objective: high performance with little variability
Assess leaders on their efforts to manage the performance of
Minimize time to fill all strategic position vacancies to within 24 hours, including all internal replacements
Depth of bench strength for each strategic position should achieve a 3:1 ratio
Percentage of top talent paid at Q3 or above, even Q4 if they make outstanding value creation contributions
LINE MANAGEMENT’S WORKFORCE RESPONSIBILITY: The Manager’s HR Roles Manager’s Rating
PERFORMANCE MANAGEMENT: How well does my manager… Not at all Somewhat Well Very well Extremely
well
1. detail what is expected of me in my job? 1 2 3 4 5
2. provide feedback on how well I am performing throughout the year? 1 2 3 4 5
3. provide equitable rewards and recognition based on my performance? 1 2 3 4 5
4. demonstrate interest in my professional development and provide me with stretch experiences? 1 2 3 4 5
SELECTION/STAFFING: How well does this manager…
1. detail performance and competency expectations in preparing to make staffing/selection decisions? 1 2 3 4 5
2. interview candidates and provide detailed feedback to HR? 1 2 3 4 5
3. ask HR for a list of internal candidates? 1 2 3 4 5
4. review internal candidates and provide feedback on each? 1 2 3 4 5
DEVELOPMENT: How well does this manager…
1. hold individual one-on-one development sessions separate from performance appraisals? 1 2 3 4 5
2. discuss career opportunities and offer developmental assignments to enhance eligibility? 1 2 3 4 5
3. contacts their manager to aid in employees’ career growth? 1 2 3 4 5
4. provide candid feedback about reality of career advancement? 1 2 3 4 5
WORK DESIGN/REDESIGN: How well does this manager…
1. continually redesign work to add greater strategic value? 1 2 3 4 5
2. eliminate work which no longer adds value? 1 2 3 4 5
COMMUNICATIONS: How well does this manager…
1. provide strategic direction for our group? 1 2 3 4 5
2. continually remind us how we must grow (improve our group’s contributions)? 1 2 3 4 5
3. remind us of our obstacles and what we need to do to remove them? 1 2 3 4 5
4. admonish us of the metrics indicative of our success and where we stand? 1 2 3 4 5
REWARDS AND RECOGNITION: How well does this manager… 1. provide me recognition throughout the performance period? 1 2 3 4 5
2. inform me of what more I need to do to get more rewards? 1 2 3 4 5
3. make recognition of outstanding performance in public? 1 2 3 4 5
4. communicates the value of our team incentive and why we receive it? 1 2 3 4 5

47
STRATEGIC HR Planning: How well does my manager…
1. Identify strategic wealth-creating positions? 1 2 3 4 5
2. Identify strategic positions which have a significant impact on customers?
1 2 3 4 5
3. Assure that we have “top talent” in these strategic positions?
1 2 3 4 5
4. Remove “C” and “B” players from these strategic roles? 1 2 3 4 5
5. Identify emerging strategic talent and enable their rapid growth into “top talent”?
1 2 3 4 5
6. Assure that “career level” talent in strategic positions are outstanding performers?
1 2 3 4 5
Assessed by HR or the Firm’s “Chief Talent Officer”
Six Month Target
XYZ Corp. Human Capital Plan Strategic Talent HCP Business Leader Recap Position Scorecard Line of Business: Retail Appliance Division Business Strategy: Low cost producer and major provider to "Big Box" retailers for highly price sensitive retail customers
STRATEGIC CAPABILITIES:
STATUS Abysmal
(1) Less Competitive
(2) Competitive
(3) Very Competitive
(4) World Class
(5)
Executive Leadership 3
Manufacturing Excellence 4
Sales/Marketing 4
R&D/New Product Development 2
STRATEGIC POSITIONS:
Number Top Talent Emerging
Talent Career Level
Move
Action Plans
Executive Leadership
– VP Marketing 1 1 Develop more talent from sales and marketing
1 1
– VP Mfg. 1 0 Consider early replacement of VP Mfg. 1 1 0
– CFO 1 1 1
Manufacturing
– Plant Managers 16 4 2 7 2 Exit moves and "careerists." Hire developing talent.
Hire and move "top talent" into the 38 career level/move positions
15 9 5 5
– Area Supervisors 48 7 3 33 5
42 15 12 15
Sales/Marketing
– Marketing Directors 6 2 1 1 2 Exit moves and initiate campus recruiting and career
development plans to strengthen marketing talent at all levels
4 4
– Brand Managers 5 1 1 3 0 5 3 1 1
– Consumer Insight Specialists 7 2 4 0 1 7 5 2
– Merchandising Managers 6 1 0 5 0 6 3 3 0
R&D/New Product Development
– Design Engineers 11 3 0 8 0 Initiate external hiring program for "top talent" at
all levels. Begin to exit careerists – we have 14 of 20 in this category.
11 9 2
– Cooling Specialists 4 1 1 2 0 3 3
– Laundry Specialists 5 1 0 4 0 6 4 1
111 = 37 64 103
Mentors needed
Key: Today = Black. 12 month target = Red

48
XYZ Corp. Human Capital Plan Strategic Talent HCP Business Leader Recap Position Scorecard Line of Business: Retail Appliance Division Business Strategy: Low cost producer and major provider to "Big Box" retailers for highly price sensitive retail customers
STATUS
STRATEGIC CAPABILITIES: Abysmal (1)
Less Competitive (2)
Competitive (3)
Very Competitive (4)
World Class (5)
Executive Leadership 3
Manufacturing Excellence 4
Sales/Marketing 4
R&D/New Product Development 2
STRATEGIC POSITIONS:
Number Top Talent Emerging
Talent Career Level
Move
Action Plans
Executive Leadership 1 1
– VP Marketing 1 1 Develop more talent from sales and marketing
2 – VP Mfg. 1 1
0 Consider early replacement of VP Mfg.
1 1 – CFO 1
Manufacturing 16 4 2 7 2
– Plant Managers 15 9 5 5 48 7 3 33 5
– Area Supervisors 36 15 15
Exit moves and "careerists." Hire developing talent. Hire and move "top talent" into the 38 career level/move positions
Sales/Marketing 6 2 1 1 2 – Marketing Directors 4 4 5 1 1 3 0
– Brand Managers 4 3 1 1 7 2 4 1 – Consumer Insight Specialists 7 5 2
0
6 1 0 5 0 – Merchandising Managers 6 3 3 0
Exit moves and initiate campus recruiting and career development plans to strengthen marketing talent at all levels
R&D/New Product Development 11 3 8 – Design Engineers 9 7
0 2
0
4 1 1 2 – Cooling Specialists 3 3
0
5 1 4 – Laundry Specialists 6 4 0
1 0
Initiate external hiring program for "top talent" at all levels. Begin to exit careerists – we have 14 of 20 in this category.
111 92
= 37 64
Mentors needed
Key: Today = Black. 12 month target = Red
One Year Target
96
What Have We Learned?What Have We Learned?
96

49
97
Key Conclusions and Takeaways
First and foremost: do no harm. The most commonly used measures of HR function performance are often negatively related to firm performance. Seemingly innocuous measures can in fact be hazardous to your firm’s success.
Generic HR measures are unlikely to ever be strategic.
Some of the most common measures (time to fill, cost per hire) are so highly correlated that they represent essentially the same information.
The problem with this list is as much what is here as much as what isn’t. The factors which differentiate firm success are talent and ability to execute strategy, not HR transactions.
Measuring the 1% vs. the 67% - focus on measuring the workforce, not the HR function.
98
Conclusions
• There are many, many roles that can destroy wealth in organizations. But only a very few roles that can actually create great wealth.
• In contrast to the conventional wisdom, you probably don’t need – and truly can’t afford – world class talent in all positions.
• All (or at least most) jobs are important, but only a few jobs are truly strategic.

50
99
Conclusions (Con’t)
• “A” or strategic positions are those which impact strategy and exhibit high variability in employee performance.
• Strategic capabilities provide the context for improvement: Variability in employee performance provides the opportunity for improvement.
• Strategic positions can appear at any level in the firm.
100
Conclusions (Con’t)
• Great firms manage their workforces like a portfolio and leverage its return – investing disproportionately in the highest return strategic work and strategic positions.
• But…..Most organizations invest in talent by hierarchical level, not by strategic impact.
• As a result, over time firms tend to underinvest in strategic work and over‐invest in nonstrategic work.

51
101
• What does this mean? The greatest potential opportunity to impact firm performance is likely to be located in (some, very specific) strategic positions.
• But we’ll never know unless we build an analytical framework and collect the data we need to help us understand how talent makes a difference.
• And then act on these insights!
Conclusions (Con’t)
102
Key Steps in Successful Analytics Initiatives
• Read the research and build a theory or model that shows what causes what in your organization
• First determine what to measure – then collect reliable and valid data
• Use analytical tools to estimate the impact of talent on the organizational outcomes you care about:
– Regression
– Network analysis
– Swarm analysis
• Focus on data for decision‐making, and hold managers accountable for enacting evidenced‐based management
102

52
103
Influencing the Right Decisions
Critical causal thinking
Principles of good measurement
Estimating causal relationships
Communicating HR strategic performance results to senior line managers
104

53
105
Questions
and
Comments?