Embed Size (px)
Citation preview
July 2011
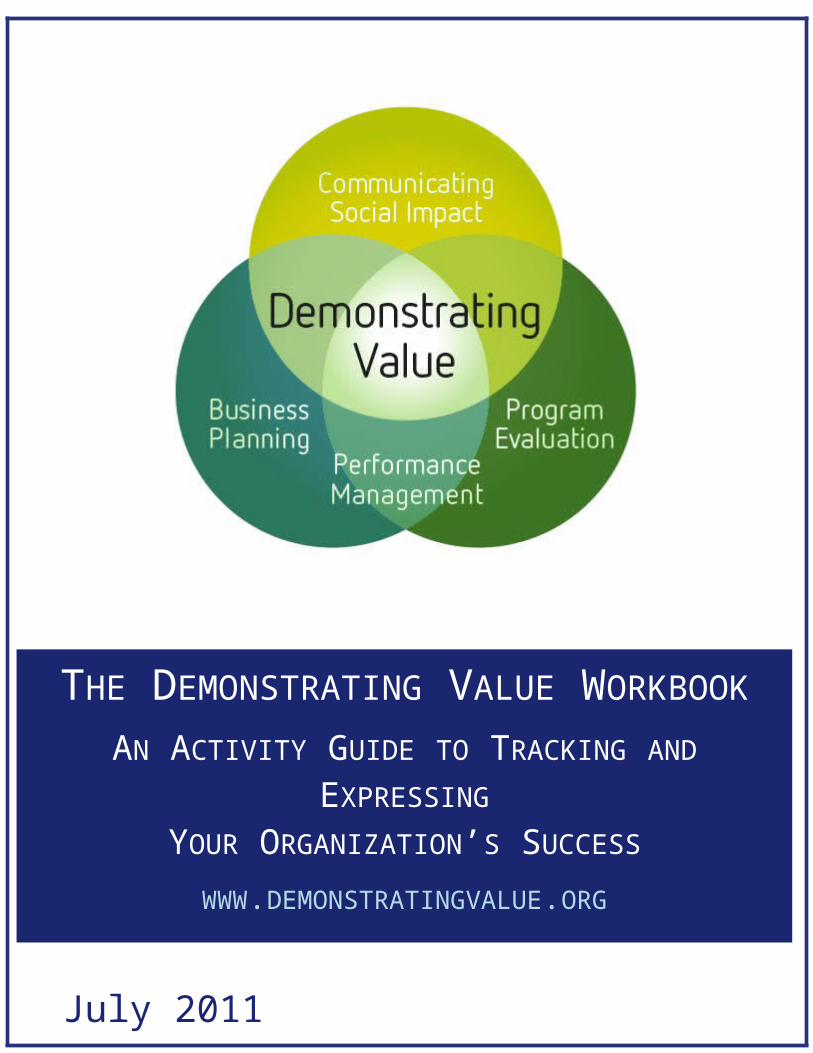
THE DEMONSTRATING VALUE WORKBOOK
AN ACTIVITY GUIDE TO TRACKING AND EXPRESSING YOUR ORGANIZATION’S SUCCESS
WWW.DEMONSTRATINGVALUE.ORG
NOVEMBER 2015

AcknowledgmentsThis workbook was developed by Bryn Sadownik as part of the Demonstrating Value Initiative at Vancity Community Foundation. The workbook was originally developed in December 2010 by combining several earlier Demonstrating Value resources. The workbook is updated annually. Further copies can be downloaded at www.demonstratingvalue.org.The Demonstrating Value Initiative is a collaboration of a community sector organizations, united by the common interest of developing more accessible performance measurement and impact assessment methodologies specifically geared to social enterprises. The initiative engaged 20 social enterprise investors and operators between 2007-2009 in a process to develop and pilot a measurement framework. This workbook and other tools on the Demonstrating Value website are based on this framework.The Demonstrating Value Initiative is based at Vancity Community Foundation and has received financial and technical support from the following organizations: Coast Capital Savings, Community Economic Development Technical Assistance Program (CEDTAP), Enterprising Non-Profits (enp), Human Resources and Social Development Canada (HRSDC) and Renewal Partners, SAP Canada and Vancity Credit Union.
ContentsAcknowledgments........................................................................................................................1
Contents......................................................................................................................................3
Introduction.................................................................................................................................1
Step 1 Define your Audiences and their Needs..............................................................................4
Step 2: Develop a Vision of your Performance Snapshot...............................................................7
Step 3 Map out your Information Needs.....................................................................................13
Step 4. Design your Snapshot.....................................................................................................21
Step 5: Define Additional Content Development........................................................................25
Appendix A: In-depth Information Mapping..............................................................................29
The Demonstrating Value Workbook
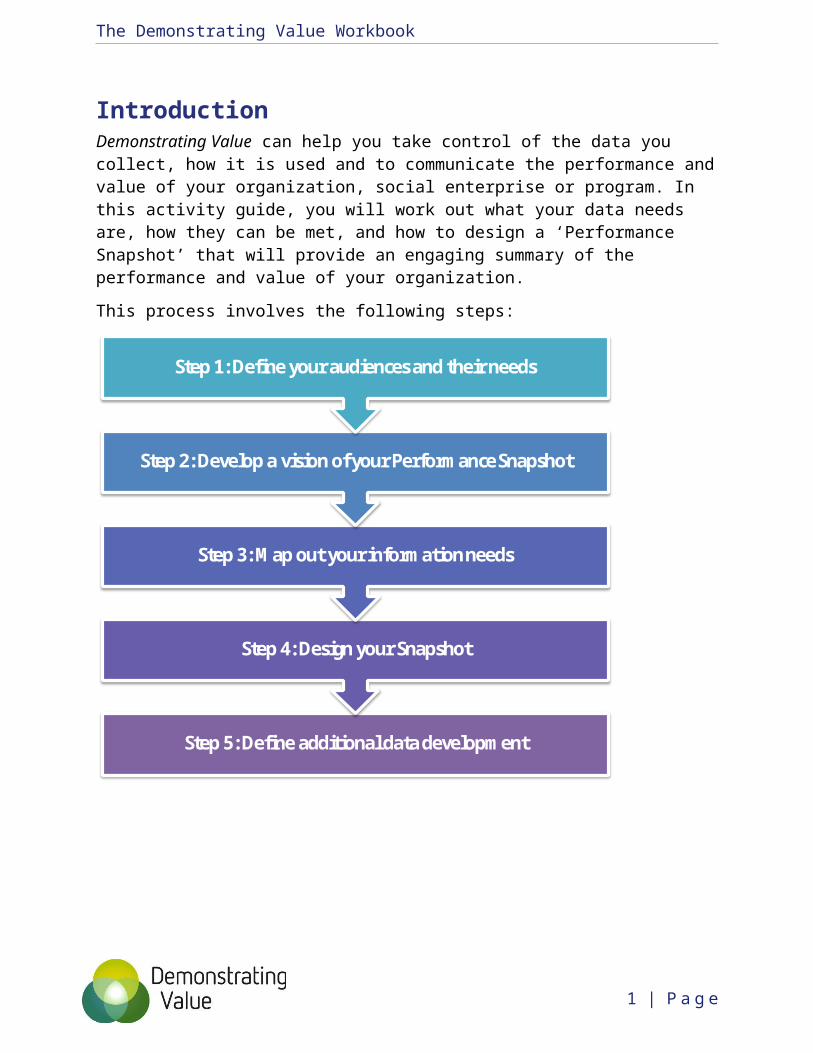
IntroductionDemonstrating Value can help you take control of the data you collect, how it is used and to communicate the performance and value of your organization, social enterprise or program. In this activity guide, you will work out what your data needs are, how they can be met, and how to design a ‘Performance Snapshot’ that will provide an engaging summary of the performance and value of your organization. This process involves the following steps:
Step 5: Define additional data development
Step 4: Design your Snapshot
Step 3: Map out your information needs
Step 2: Develop a vision of your Performance Snapshot
Step 1: Define your audiences and their needs
1 | P a g e

The Demonstrating Value Workbook
Structure of this Activity Book
The remainder of this activity book will guide you through these steps. The purpose of each step is first described, followed by specific activities for you to do. These activities are indicated with the following symbol: In some cases you will be refered to other Demonstrating Value tools that can be found on the Tools and Resources page of www.demonstratingvalue.org. Because no single person has the full picture of what’s really going on, and the information that is needed for different purposes, we recommend working through this workbook with a cross-section of people in the organization. You can do this in a workshop, a series of meetings, or through targeted consultations.
Demonstrating Value’s philosophy about measurement and its guiding framework
This guide (and all other Demonstrating Value tools) are based on the premise that the information you gather in your organization has to be directly relevant to the decisions you make and be compelling for others to learn about your value. To work out what information is most useful, always keep the following simple question in mind: 'What do we want to know and show?' In essence, you need to think about the story you want to tell and the decisions that can be better supported by data. Determining what information is useful and to whom is a big task, but it can be simplified by looking at it from a few different perspectives.The two lenses shown below can help focus the answer, and are reflected in the exercises in this workbook. The first asks: ‘What information is useful?' and the second asks ‘How will information be used?'
2 | P a g e

The Demonstrating Value Workbook
An Organizational Sustainability Perspective - What information can help you understand whether you are developing and maintaining resources to meet your purpose in the long run?
A Community Impact Perspective - What information can tell you about the ability of the organization to successfully contribute towards the social, cultural and environmental objectives set out in its mission?
A Business Performance Perspective - What information can tell you about the success of the organization from a financial or ‘business’ perspective?
3 | P a g e
The Demonstrating Value Workbook
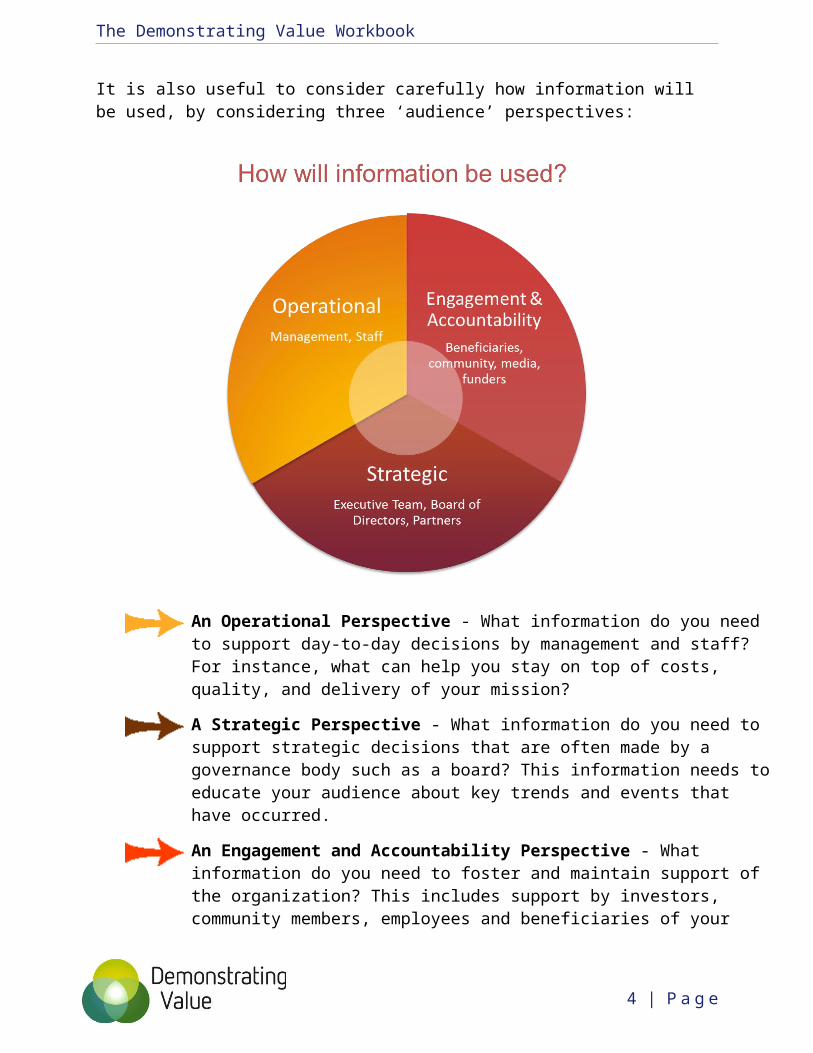
It is also useful to consider carefully how information will be used, by considering three ‘audience’ perspectives:
An Operational Perspective - What information do you need to support day-to-day decisions by management and staff? For instance, what can help you stay on top of costs, quality, and delivery of your mission?
A Strategic Perspective - What information do you need to support strategic decisions that are often made by a governance body such as a board? This information needs to educate your audience about key trends and events that have occurred.
An Engagement and Accountability Perspective - What information do you need to foster and maintain support of the organization? This includes support by investors, community members, employees and beneficiaries of your mission. This audience may have very limited knowledge of who you are and what you are trying to accomplish so the data that you present will need context and interpretation.
4 | P a g e

The Demonstrating Value Workbook
Step 1 Define your Audiences and their Needs Your organization is important for many different groups of people, and in different ways. These are your stakeholders. Understanding who these people are and what they care about is critical for developing effective monitoring and reporting capabilities. Common stakeholders include:
– Employees– Volunteers– Management– A governance body (e.g.
Board of Directors)
– Constituent group – those in whose name you are working
– Customers – Investors, funders, donors – Peers and partners– The community at large
What does each stakeholder need to know about the organization in order to manage, plan or to provide support? 1a) In the table below identify your stakeholders and describe what information they need to have to do their job effectively. Don’t be too specific or name individual people. Rather think of the key groups of people that matter in and around the organization. Add or delete rows as required.Stakeholder Information needs - what they need to
knowe.g. Advisory board Need to be clearly informed (in a succinct way)
about what is happening with the enterprise so they can offer the best advice possible.
5 | P a g e
The Demonstrating Value Workbook
1b) Assess how you can better engage your stakeholdersLook at the needs you’ve described. Where do you feel you can do a better job in meeting those needs? What's your biggest priority?
6 | P a g e
The Demonstrating Value Workbook
Step 2: Develop a Vision of your Performance SnapshotA Performance Snapshot is a communication tool that you can develop to present the performance and value of your organization to boards, investors/funders and staff. It is tailored to your needs and the audiences you want to connect with.
The snapshot can be a printed document or an electronic 'dashboard', which allows you to actively engage with the information. This tool will give you a clear picture of your organization to help you plan and manage your day-to-day activities, demonstrate your value to others, and ensure the long-term sustainability of your organization. Examples of performance snapshots can be found at: www.demonstratingvalue.org/snapshots
Advantages of developing a snapshot include: Saving valuable time finding and pulling together data and other
information for reports. Seeing key trends and relationships in data, so you can get the most
from the data you collect. Combining different types of information effectively to engage your
audience. The exact content and format of the Snapshot depends on the audience you want to reach and the issues that are important. The design process
7 | P a g e

The Demonstrating Value Workbook
includes thinking about who the audience is, what decisions they are making and the messages you want to convey, and the information that can be presented (numeric, narrative, pictures, quotes, video) to tell your story. This depends on your needs and audience. For example, the layout and content for a bi-monthly board presentation might be very different from a Snapshot designed to be part of your public website to engage volunteers and donors. In this step, you will picture what your Snapshot will look like. 2a) Review Snapshot Designs To help work out the structure of the snapshot you’d like to develop, look at the snapshot designs below. You are not limited to these designs, but they can serve as useful starting points for thinking about how to communicate your value to others and to review performance. It may also be helpful to look at examples of snapshots at www.demonstratingvalue.org/snapshots. Once you have worked out structure, the layout and graphics can be improved at a later stage.
8 | P a g e

Design 1: Challenge/Approach/Impact
This structure is useful for communicating the value of what you are doing to those outside of your immediate day-to-day interactions. This could be within your organization, to partners, to funders/investors and to the public.

Design 2: Multiple Impacts
This template is also useful for communicating the value of what you are doing to those outside of of your immediate day-to-day interactions. This could be within your organization, to partners, to funders and to the public.

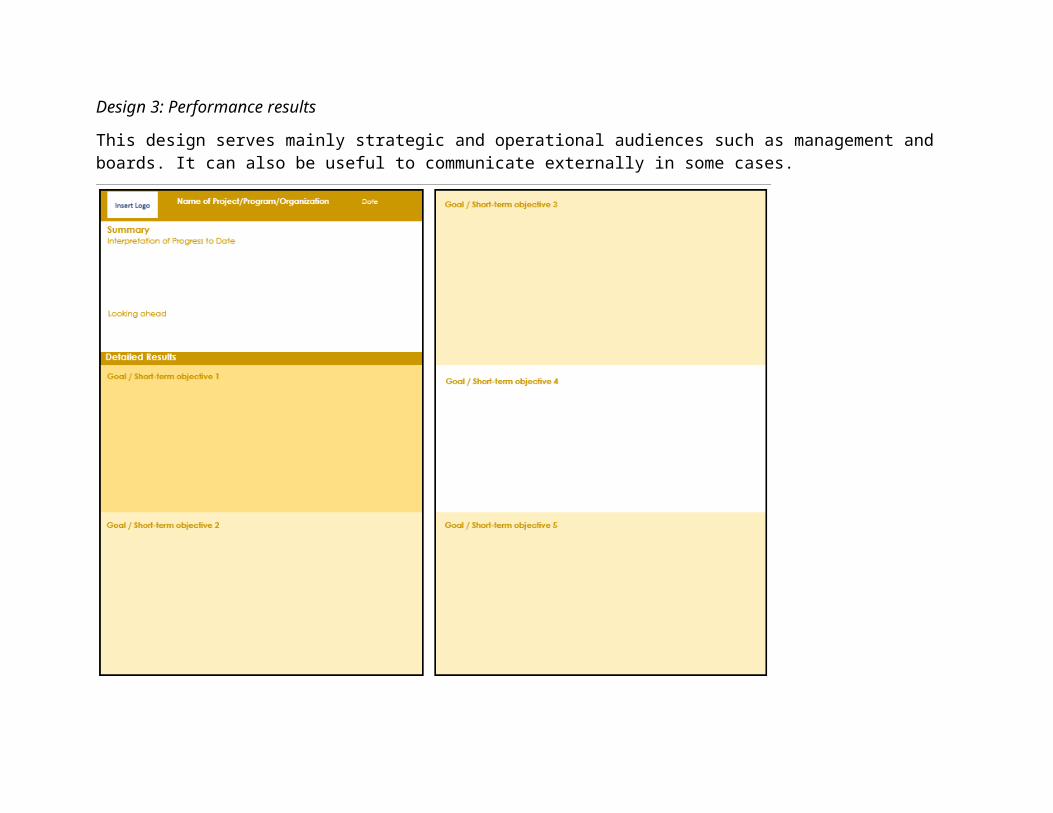
Design 3: Performance results
This design serves mainly strategic and operational audiences such as management and boards. It can also be useful to communicate externally in some cases.
2b) Describe the purpose and look of your Snapshot In the table below describe the key audience, purpose and the design/format of your snapshot.To help define an audience and purpose, look at the previous step. Who are your stakeholders and what did you define as the biggest area for improvement? You may be able to connect with many audiences with your Snapshot but to guide the initial development, identify a primary audience. Key Audience
Purpose Design & Format
i.e. Who will see the Snapshot?
i.e. How will this audience interact with the information in the Snapshot?
i.e. What design would you like to develop? When will the snapshot be used? What format will it be in? How often will it be updated?

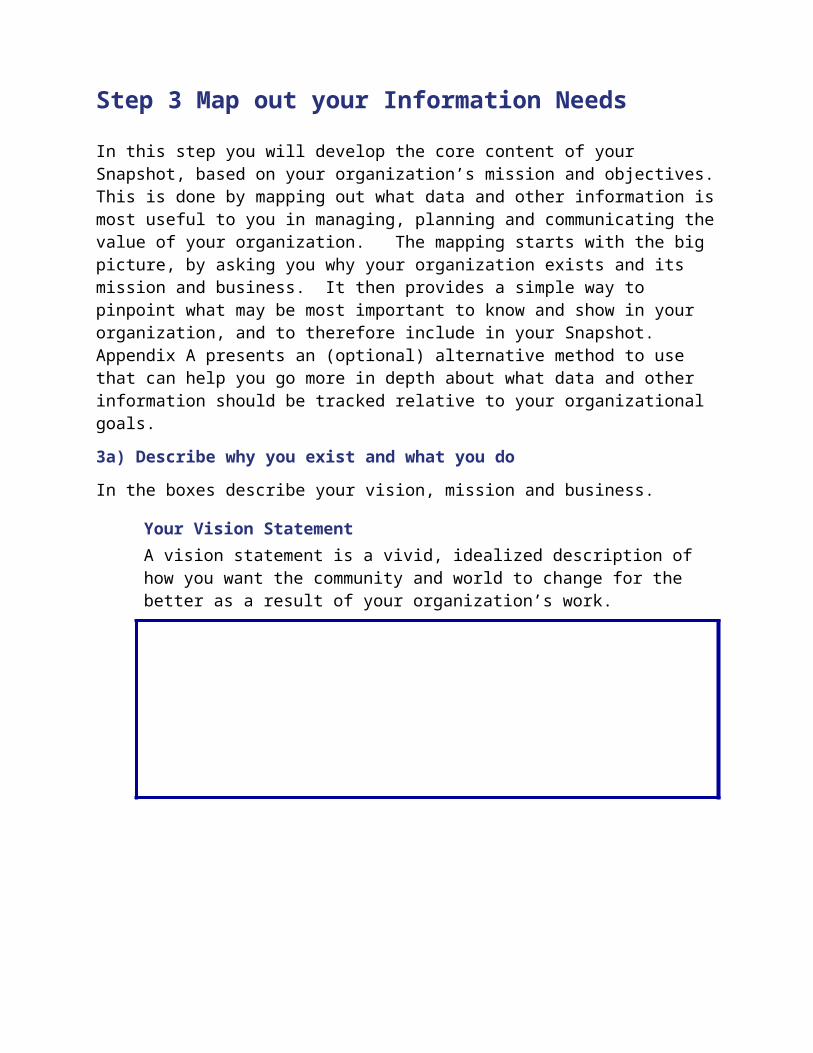
Step 3 Map out your Information NeedsIn this step you will develop the core content of your Snapshot, based on your organization’s mission and objectives. This is done by mapping out what data and other information is most useful to you in managing, planning and communicating the value of your organization. The mapping starts with the big picture, by asking you why your organization exists and its mission and business. It then provides a simple way to pinpoint what may be most important to know and show in your organization, and to therefore include in your Snapshot. Appendix A presents an (optional) alternative method to use that can help you go more in depth about what data and other information should be tracked relative to your organizational goals.3a) Describe why you exist and what you do In the boxes describe your vision, mission and business.
Your Vision StatementA vision statement is a vivid, idealized description of how you want the community and world to change for the better as a result of your organization’s work.
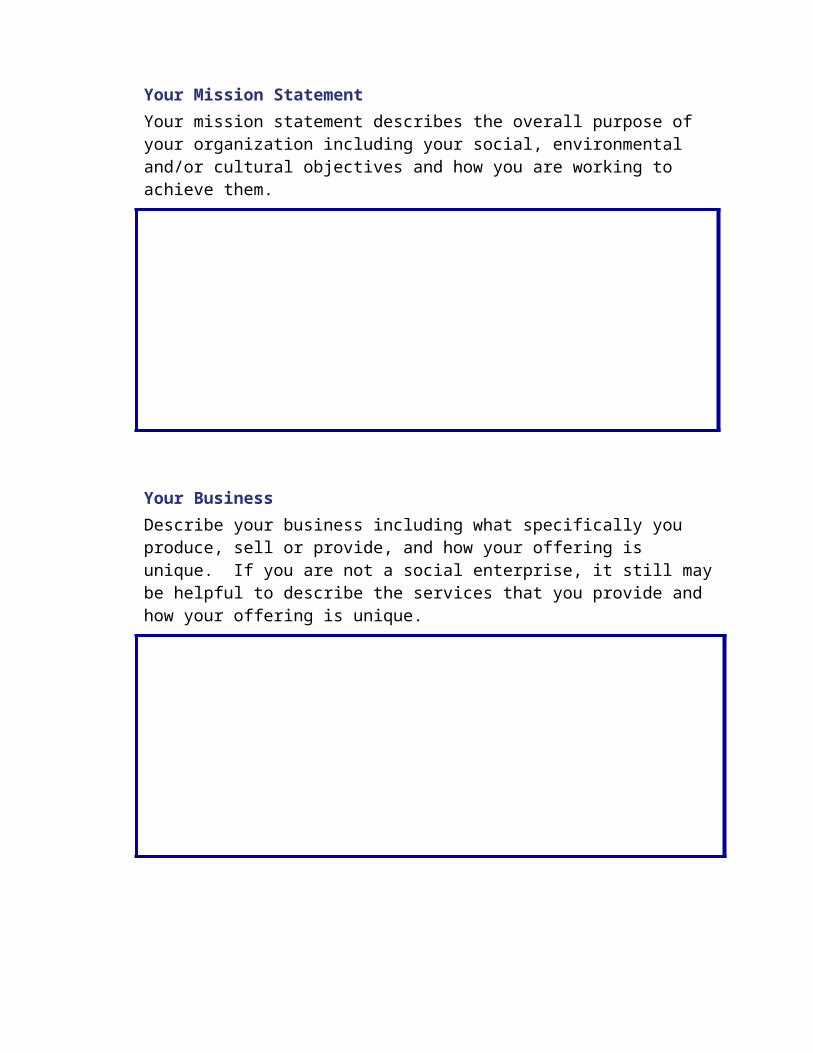
Your Mission StatementYour mission statement describes the overall purpose of your organization including your social, environmental and/or cultural objectives and how you are working to achieve them.
Your Business Describe your business including what specifically you produce, sell or provide, and how your offering is unique. If you are not a social enterprise, it still may be helpful to describe the services that you provide and how your offering is unique.
3b) Map out your information needs.Write down the top things that you want to know about in your organization that would assist your ability to manage and plan. Think about this in terms of your community impact, business performance and organizational sustainability, and be as specific as possible. Also consider your operational decisions as well as your longer term strategies. Once you are done, indicate the top 3 things that you would like to show. Examples: We want to know if we are…
improving public awareness of our programenhancing the quality of our serviceimproving our cash-flow retaining staff, etc.
Your turn: We want to know if we are…

Write down the key things that you want to show others about the value of your organization. Think about your organization’s strengths and how you make a difference, and be as specific as possible. Once you are done, indicate the top 3 things that you would like to show. Examples. We want to show that we…
reach people that fall through the cracks of other programs have highly qualified staff provide flexible and individualized servicegetting people out of their carsare increasing wildlife habitat
Your turn: We want to show that we…:

3b) Identify what information is useful to present in your SnapshotIn the previous section, you defined key information needs. In this section, come up with a list of ways that you can address the most important information needs that you described. This may be specific data that you collect or want to collect in the future. It can also be excerpts from research, testimonials, narrative, images, short diagrams and other forms of information that can be useful in supporting what you want to show. Don’t worry about being exhaustive and very detailed – we will refine this more in another exercise.
Information Need What is Useful to Track?e.g. We want to show that we reach people that aren’t serviced by other programs
Demographic information about who accesses our program (age, gender, ethnicity)

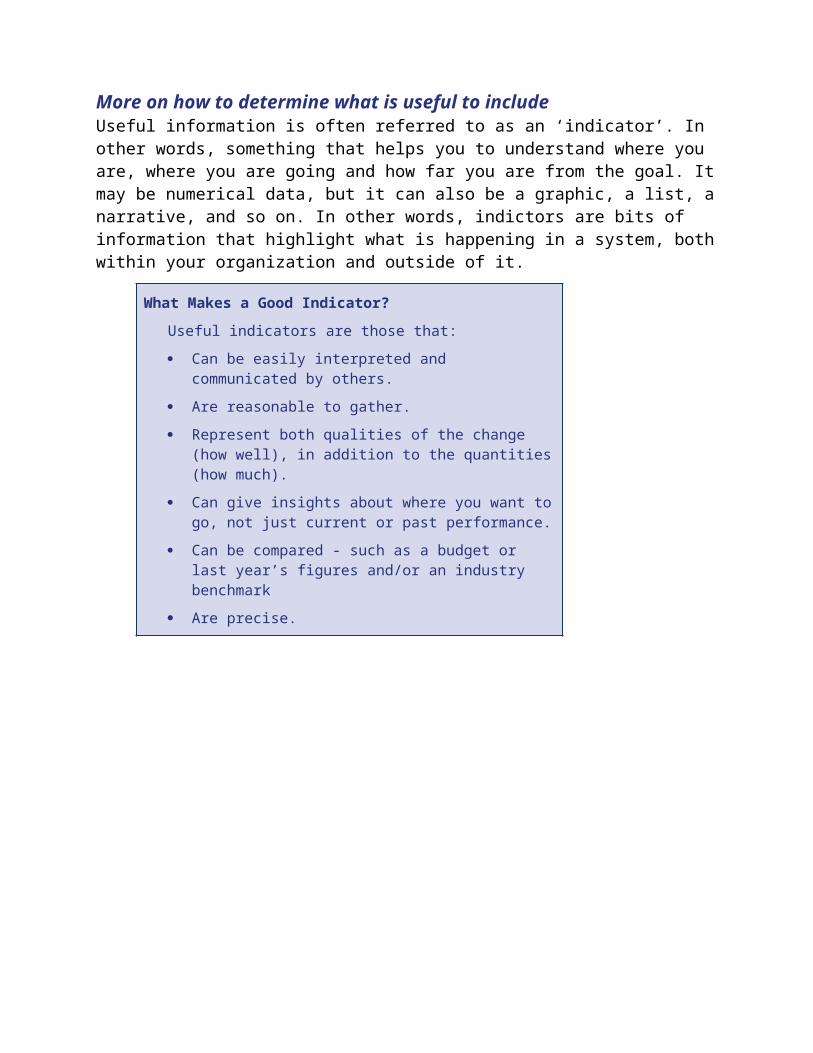
More on how to determine what is useful to include Useful information is often referred to as an ‘indicator’. In other words, something that helps you to understand where you are, where you are going and how far you are from the goal. It may be numerical data, but it can also be a graphic, a list, a narrative, and so on. In other words, indictors are bits of information that highlight what is happening in a system, both within your organization and outside of it.
What Makes a Good Indicator? Useful indicators are those that: Can be easily interpreted and communicated by
others. Are reasonable to gather. Represent both qualities of the change (how
well), in addition to the quantities (how much). Can give insights about where you want to go,
not just current or past performance. Can be compared - such as a budget or last
year’s figures and/or an industry benchmark Are precise.
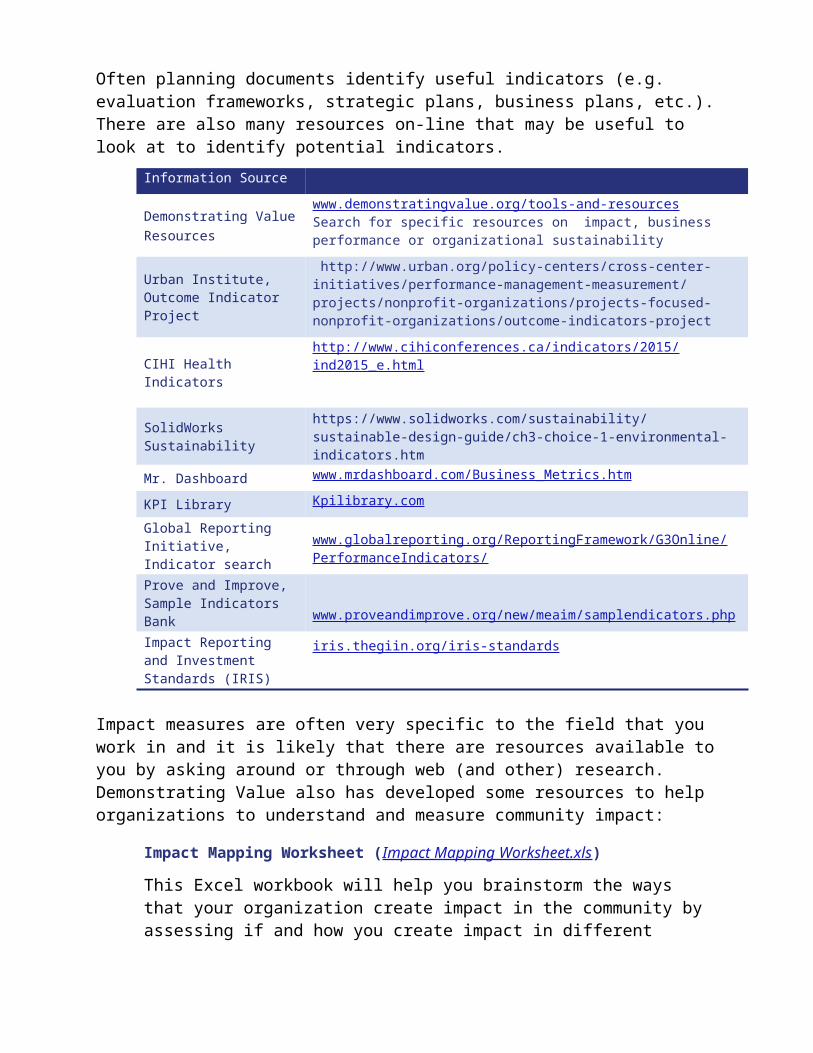
Often planning documents identify useful indicators (e.g. evaluation frameworks, strategic plans, business plans, etc.). There are also many resources on-line that may be useful to look at to identify potential indicators.
Information Source
Demonstrating Value Resources
www.demonstratingvalue.org/tools-and-resources Search for specific resources on impact, business performance or organizational sustainability
Urban Institute, Outcome Indicator Project
http://www.urban.org/policy-centers/cross-center-initiatives/performance-management-measurement/projects/nonprofit-organizations/projects-focused-nonprofit-organizations/outcome-indicators-project
CIHI Health Indicatorshttp://www.cihiconferences.ca/indicators/2015/ind2015_e.html
SolidWorks Sustainability
https://www.solidworks.com/sustainability/sustainable-design-guide/ch3-choice-1-environmental-indicators.htm
Mr. Dashboard www.mrdashboard.com/Business_Metrics.htmKPI Library Kpilibrary.comGlobal Reporting Initiative, Indicator search
www.globalreporting.org/ReportingFramework/G3Online/PerformanceIndicators/
Prove and Improve, Sample Indicators Bank www.proveandimprove.org/new/meaim/samplendicators.phpImpact Reporting and Investment Standards (IRIS)
iris.thegiin.org/iris-standards
Impact measures are often very specific to the field that you work in and it is likely that there are resources available to you by asking around or through web (and other) research. Demonstrating Value also has developed some resources to help organizations to understand and measure community impact:
Impact Mapping Worksheet (Impact Mapping Worksheet.xls)This Excel workbook will help you brainstorm the ways that your organization create impact in the community by assessing if and how you create impact in different social and environmental areas. It also includes templates for commonly used impact mapping tools – Logic Model, Theory of Change & Outcome Mapping. Short Resource GuidesThe Demonstrating Value website includes short resource guides with specific measures and resource links that relate to the following mission areas:
Affordable HousingCultural Empowerment and AwarenessNeighbourhood RevitalizationDirect Income, Material and Food SupportRecycling and Waste ReductionGreen BuildingEmployment Support
This list represents short resource guides available as of December 2015. Check the website for any new mission areas.In-depth Resource GuidesThe Demonstrating Value website includes a detailed toolkit for Farmers’ markets Farmers Market Impact Toolkit. A Snapshot template is also available that can support organizations that work in health promotion and other areas of community health. (Please contact Demonstrating Value directly for this).DV BlogThe Demonstrating Value blog on our website includes commentary and guidance for measuring impact. Subscribe to our blog, or check past blogs. Here are few examples that may be useful.
Is measuring impact possible? How to build impact
measurement into core business systems?
10 Ways to Show Your Impact: Part 1
10 Ways to Show Your Impact: Part 2
Expressing Your Organizational Value: Quantifying Value
Expressing Your Organizational Value: Monetizing Value
Expressing Your Organizational Value: Describing Value
Logic Models & the Outcome Indicators Project
Connecting the Dots: Helpful Frameworks for Measuring Action and Impact (Part 1: The Environment)
Part 2: Quality of Life and Well- being
Part 3: the Value of Arts and Culture

Step 4. Design your SnapshotIn the previous step, you identified the information that is important for you to collect and potentially show in a snapshot, based on your organization’s goals. You will now design your snapshot with the information that you collect currently, or can easily develop.
4a) Review Snapshot Design
Look at the snapshot design that you identified earlier as your model. You may want to follow it closely or make changes that fits better with your audience and purpose.
What do you like about this snapshot? What do you dislike? What sections would you change or add?
4b) Define the broad sections
Sketch out roughly how you’d like to organize the information in a snapshot based on the snapshot designs, your information maps or other ideas. Make sure to define the sections in which you’d group information. e.g. Section 1 to show that "we address an important and meaningful community issue"Supporting information:
Estimate of the societal cost of poverty in Ontario quotes from the people we work with that highlight the challenge /
issue area # of people affected by housing insecurity

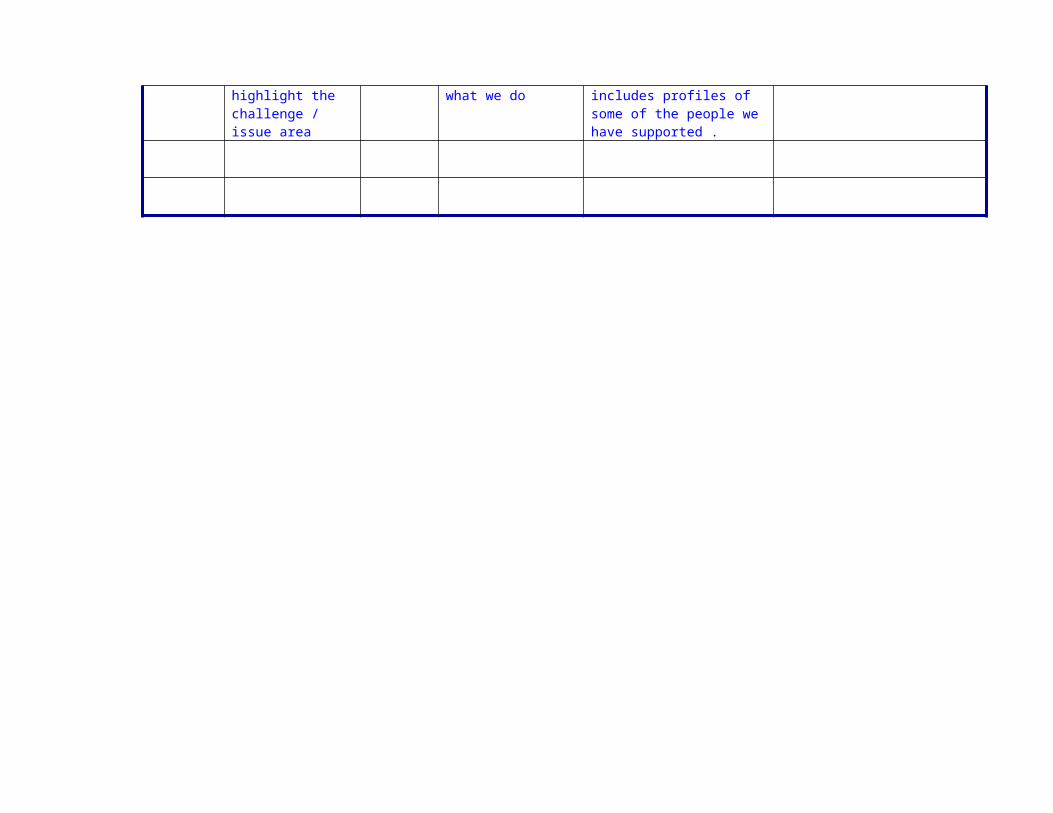
4c) Review your information sources
In your information maps, you defined information you’d like to include in your snapshot that supports what you want to know and show. In this step, you will review your information needs against what you currently have available, or need to develop. Do this in the table below, or in the Excel worksheet: Indicator Record.xls, available in the Tools and Resources section of the Demonstrating Value website. (Using Indicator Record.xls will make it easier for you to sort and organize this information.) For each piece of information that you’ve identified (‘indicator’), identify the snapshot section it relates to, how frequently it will be updated, any guidance on how it should be interpreted including any targets you may have, and finally its current availability and relevant data source. A few examples are shown in blue. Add in as many rows as you need. Indicator Record
Snapshot Section
Indicator Reporting Frequency
Interpretation(e.g. why this would be collected, how it should be interpreted & targets where relevant)
Current Availability Source
1 Estimate of the societal cost of poverty in Ontario
Single estimate
Useful to contextualize why our program is important to the community as a whole.
Ontario Association of Foodbanks estimated the cost in a 2008 study
http://www.oafb.ca/assets/pdfs/CostofPoverty.pdf
1 Quotes from the people we work with that highlight the challenge / issue area
Annual Helps people to make a personal connection with what we do
We have a story bank that is updated annually that includes profiles of some of the people we have supported .
In G: folder on Shared drive

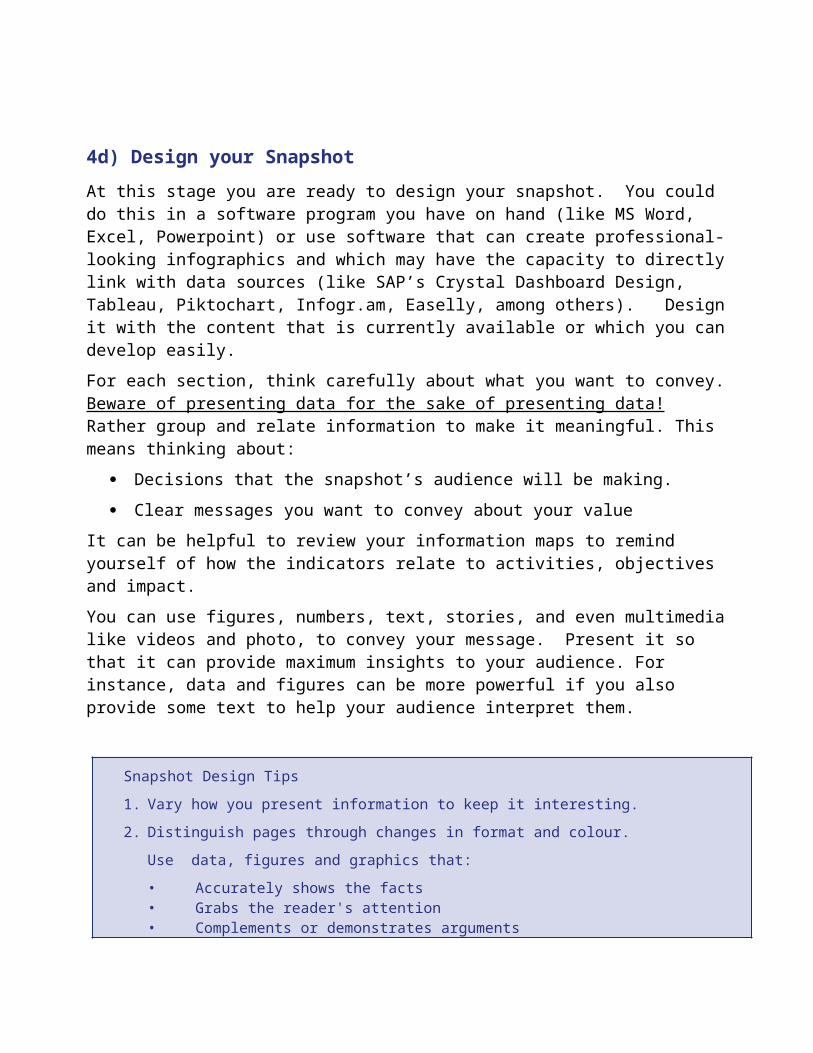
4d) Design your Snapshot
At this stage you are ready to design your snapshot. You could do this in a software program you have on hand (like MS Word, Excel, Powerpoint) or use software that can create professional-looking infographics and which may have the capacity to directly link with data sources (like SAP’s Crystal Dashboard Design, Tableau, Piktochart, Infogr.am, Easelly, among others). Design it with the content that is currently available or which you can develop easily.For each section, think carefully about what you want to convey. Beware of presenting data for the sake of presenting data! Rather group and relate information to make it meaningful. This means thinking about:
Decisions that the snapshot’s audience will be making. Clear messages you want to convey about your value
It can be helpful to review your information maps to remind yourself of how the indicators relate to activities, objectives and impact. You can use figures, numbers, text, stories, and even multimedia like videos and photo, to convey your message. Present it so that it can provide maximum insights to your audience. For instance, data and figures can be more powerful if you also provide some text to help your audience interpret them.
Snapshot Design Tips1. Vary how you present information to keep it interesting.2. Distinguish pages through changes in format and colour.
Use data, figures and graphics that:• Accurately shows the facts • Grabs the reader's attention • Complements or demonstrates arguments• Has a title , labels and units• Is simple and uncluttered • Clearly shows any trends or differences in the data
5. Present information in an engaging and appropriate way. Different types of graphs show different things (a line graph shows trends, a bar chart highlights comparisons, a pie chart shows shares, etc.). Helpful resources for portraying data include:
Statistics Canada, “Using Graphs www.statcan.gc.ca/edu/power-pouvoir/ch9/using-utilisation/5214829-eng.htm

Adobe Illustrator, “Put the Art in Charts” www.adobe.com/designcenter/illustrator/articles/illcs2at_chart_07.html
Step 5: Define Additional Content DevelopmentThe snapshot which you’ve now developed is something that you can add to over time as your organization grows. In this step, you will plan out how you can develop additional indicators that you identified in your information maps for your snapshot.
5a) Prioritize new information development
List up to 5 high priority indicators from your information maps that you’d like to develop in the next 2 years. (Refer to your Indicator Record).
If you have a hard time prioritizing, consider: What is of most benefit to gather? Consider this from the
perspective of all stakeholders who defined the information. Are there things that are logical to do first? Are there things that would be nice to have, but are not critical?
How much effort will it take to develop this data? Do you have a mechanism already in place, or can you develop one easily? What are the time and skills required collect, manage, and analyze the information? Will gathering these data be seen as intrusive by participants? Are there language or literacy challenges? Are you trained in the method, or will you need help from an outside consultant?
The following grid can help you prioritize. Collection Challenge
Importance of Information
Easy Feasible DifficultHigh 3
Definitely Collect
2Worth
Collecting
2Consider
an Alternative
Medium 2Worth
Collecting
1Collect if
have time
1Collect if
have time
Low 1Collect if
have time
1Collect if
have time
0Ignore
5a) Develop a Data Development Plan
For your priority indicators, develop a plan for how you will develop them in the tables that follow. First, list the indicator. Then propose a method for developing it. Additional guidance and resources described on the next few pages may be helpful for defining the method. Once you’ve proposed one, develop a concrete development timeline and designate somebody to lead its development. A comments section is included for any additional comments. Copy and paste more tables to meet the number of indicators you plan to develop. Indicator: Method
Development TimelineResponsibilityComments
Monitoring MethodsThe following list describes common methods to collect information
Activity LogStaff report of daily activities.
Anecdotal recordsStories and narratives about an event, an experience, or an individual, described by staff or participants.
DocumentationAdministrative records of activities (e.g., inventory software, reports, minutes of meetings etc.).
Evaluation Form A set of questions that determine the participants’ opinions, attitudes, and understanding once an activity is complete.
Focus GroupGroup discussions with a relatively small number of selected people about certain questions.
InterviewA set of questions (could be predetermined or not) about certain topics that are posed to a target audience and followed by additional questions and conversations.
Journal RecordingSelf report of daily activities by participants.
Knowledge/ Skill Tests SurveyA set of predetermined questions about certain topics that are answered by a target audience.
A set of questions that determine the level of knowledge or skills in participants. On-site visits
A combination of observation and interviews that occur in the participant’s environment.
Observation notesNotes taken through direct observation of verbal and nonverbal behaviours that occur in activities.
This list is based on definitions in: Zarinpoush, F. Project Evaluation Guide for Nonprofit Organizations: Fundamental Methods and

Steps for Conducting Project Evaluation. Toronto, Ontario: Imagine Canada, 2006.
.
Resources for Data CollectionSurvey Research
Downloadable Guides, University of Wisconsin-Extension learningstore.uwex.edu
Collecting Evaluation Data: Surveys (Ellen Taylor-Powell, Carol Hermann) Questionnaire Design: Asking Questions with a Purpose (Ellen Taylor-Powell) Sampling (Ellen Taylor-Powell)
What is a Survey. www.whatisasurvey.info/Initially published by the American Statistical AssociationResearch Methods Knowledge Base. www.socialresearchmethods.net/kb/survey.htmWilliam M.K. Trochim. Department of Policy Analysis and Management at Cornell University.A Brief Guide to Questionnaire Development, Dr. Robert Frary, Virginia Tech www.testscoring.vt.edu/questionaire_dev.htmlSurvey Design Material, National Statistical Services, www.nss.gov.au/nss/home.NSF/sdm?OpenViewDeveloping On-line Surveys The following are a few popular survey sites: Survey Monkey www.surveymonkey.com; SurveyZ www.surveyz.com; Inquisite www.inquisite.com; Hosted Survey ww.hostedsurvey.comFor a useful reference for evaluating these alternatives see: Rose M. Marra, Barbara Bogue, A Critical Assessment of Online Survey Tools, University of Missouri -- Columbia/ The Pennsylvania State University.
Focus Group
Focus Group Research Planning Guide, Wyoming Market Research Centre www.uwadmnweb.uwyo.edu\wmrc\Focus Group Research - Planning Guide - Revised.pdf/ Using Focus Groups, Health Communication Unit, Centre for Health Promotion, University of Toronto www.thcu.ca/infoandresources/publications/Focus_Groups_Master_Wkbk_Complete_v2_content_06.30.00_format_aug03.pdf
Observation
Downloadable Guides University of Wisconsin-ExtensionCollecting Evaluation Data: Direct Observation learningstore.uwex.edu

The Demonstrating Value Workbook
Appendix A: In-depth Information MappingIn the tables that follow, map out what information you need to know and show in your organization based on the goals you’re pursuing. Develop information maps using the following three steps:
1. Write down your organization’s key goals. Base this on:o Information in your strategic plans, business plans, grant applications, and in
marketing and other communications materials.o Examples of goals we’ve provided.
2. Describe the activities you’re doing to achieve these goals and your desired impact.
3. Determine what information you should be collecting to show that you are successful. Start by brainstorming around the question: ‘What do you want to know and show about this goal?’ Then write down specific indicators you’d include in your snapshot that would address what you want to know and show. Don’t limit yourself to data and other information that you can provide right now, but describe what you’d ideally like. Maps are provided for three different perspectives: Mission, Business Performance and Organizational Sustainability.
30 | P a g e

The Demonstrating Value Workbook
Community Impact Perspective - What information can tell you about your success in contributing towards your social, cultural and environmental mission?
List up to 3 goals you have relating to your mission (your social, environmental and/or cultural objectives)
Examples of goals in this area: Improve awareness and engagement (around a specific issue) Shift people’s behavior and practices so they are more _________________ Build community capacity to ________________ Improve livelihoods and well-being More effectively engage different cultural groups, ages and gendersFor examples of mission-related goals that relate to different program areas, see Appendix B.
Sample Activities:
Desired Impact:
What is useful to track and why? Think about what you want to ‘to know and show’ about the goals, activities and impacts you’ve described, and what you could then measure.
31 | P a g e

The Demonstrating Value Workbook
Business Performance Perspective - What information can tell you about the success of the organization from a ‘business’ perspective?
Market and Customers List up to 3 goals you have relating to your market and customers
Examples of customer-related goals: Exceed customer expectations about products and/or service quality Expand services into new geographic area. Develop more effective marketing promotions Renew your brand image; differentiate your image in the market
Sample Activities:
Desired Impact:
What is useful to track and why? Think about what you want to ‘to know and show’ about the goals, activities and impacts you’ve described, and what you could then measure.
32 | P a g e
The Demonstrating Value Workbook
Operations
List up to 3 goals you have relating to your operations
Examples of operational goals: Deliver products and services on time and on budget Increase product/service quality Improve safety of operations Green operations; reduce waste
Sample Activities:
Desired Impact:
What is useful to track and why? Think about what you want to ‘to know and show’ about the goals, activities and impacts you’ve described, and what you could then measure.
33 | P a g e

The Demonstrating Value Workbook
Financial Performance List up to 3 goals you have relating to your financial performance
Examples of goals in this area: Improve ability to pay expenses in a timely manner Increase the revenue obtained from each customer Obtain sufficient income Reduce dependence on short-term grants Reduce debt to a manageable level Control key costs that affect profitability
Sample Activities:
Desired Impact:
What is useful to track and why? Think about what you want to ‘to know and show’ about the goals, activities and impacts you’ve described, and what you could then measure.
34 | P a g e

The Demonstrating Value Workbook
An Organizational Sustainability Perspective - What information can help you understand how you are managing long-term risks to your organization?
List up to 3 goals you have relating to your organizational sustainability (e.g. building strong human resources, relationships, systems, financial capital, expertise and knowledge)Examples of goals in this area:
Retain and support staff and/or volunteers Provide training, skill development and other learning opportunities for employees and/or volunteers Reduce dependence on short-term grants Create an inclusive environment where learning is shared Enhance profile and leadership in the community
Sample Activities:
Desired Impact:
What is useful to track and why? Think about what you want to ‘to know and show’ about the goals, activities and impacts you’ve described, and what you could then measure.
35 | P a g e

The Demonstrating Value Workbook
36 | P a g e