Embed Size (px)
Citation preview

IZA DP No. 1689
Women-Led Firms and the Gender Gapin Top Executive Jobs
Linda A. Bell
DI
SC
US
SI
ON
PA
PE
R S
ER
IE
S
Forschungsinstitutzur Zukunft der ArbeitInstitute for the Studyof Labor
July 2005

Women-Led Firms and the Gender Gap
in Top Executive Jobs
Linda A. Bell Haverford College
and IZA Bonn
Discussion Paper No. 1689 July 2005
IZA
P.O. Box 7240 53072 Bonn
Germany
Phone: +49-228-3894-0 Fax: +49-228-3894-180
Email: [email protected]
Any opinions expressed here are those of the author(s) and not those of the institute. Research disseminated by IZA may include views on policy, but the institute itself takes no institutional policy positions. The Institute for the Study of Labor (IZA) in Bonn is a local and virtual international research center and a place of communication between science, politics and business. IZA is an independent nonprofit company supported by Deutsche Post World Net. The center is associated with the University of Bonn and offers a stimulating research environment through its research networks, research support, and visitors and doctoral programs. IZA engages in (i) original and internationally competitive research in all fields of labor economics, (ii) development of policy concepts, and (iii) dissemination of research results and concepts to the interested public. IZA Discussion Papers often represent preliminary work and are circulated to encourage discussion. Citation of such a paper should account for its provisional character. A revised version may be available directly from the author.

IZA Discussion Paper No. 1689 July 2005
ABSTRACT
Women-Led Firms and the Gender Gap in Top Executive Jobs∗
Using data on Executive Compensation from Standard and Poor's ExecuComp, this paper explores the gender gap in top executive jobs and the effect of women CEOs, Chairs, and Directors on the pay of other women executives. The results show a narrowing of the uncorrected gender pay gap from the mid-1990s. Women top executives earn between 8% to 25% less than male executives after controlling for differences in company size, occupational title, and industry. The magnitude of the gender pay gap is statistically related to the gender of the Chief Executive and Corporate Board Chair. Women CEO and Board Chairs bring more top women and at higher pay than is found in non-women-led firms. Specifically, female executives in women-led firms earn between 10-20% more than comparable executive women in male-led firms and are between 3-18% more likely to be among the highest five paid executives in these firms as well. The paper thereby provides strong empirical evidence that women leaders are associated with positive outcomes for women executives in substantive and important ways. JEL Classification: J11, J16, J33, J70, J71, J78 Keywords: executive compensation, gender discrimination, labor market institutions Corresponding author: Linda A. Bell Haverford College 370 Lancaster Avenue Haverford, Pa 19041-1392 USA Email: [email protected] ∗ The author thanks Caitlin Coslett, Spencer Walters, and Donald Grunewald for outstanding research support throughout this project. Special acknowledgment is owed to Michael Bolton at Wharton Data Services for generously providing the data for this paper. I thank Robin Ely, Anne Preston, and seminar participants at Harvard Business School for helpful comments on an earlier draft.

2
There is substantial theoretical and institutional support for the notion that women are
more likely to be promoted into a particular job level and paid more in that job when
there are a higher proportion of women already there and particularly in decision-making
positions. The positive influence of women on other women’s labor market outcomes
can occur for a variety of institutional and theoretical reasons. First, women may pull
women into firms and positions because they prefer to work with similar individuals, as
consistent with the discrimination models developed by Becker (1957), or the
organizational behavioral case-based and institutions-based literature (for example,
Brass 1985, Ibarra 1992, Lincoln and Miller 1979). Second, as women advance through
ranks, differences in the treatment of men and women that arise from imperfect
information about women’s abilities, as in “statistical discrimination” models (Phelps
1972, Aigner and Cane 1977) and “pollution” models of discrimination (Goldin 2002), will
narrow as more and better individual specific information is obtained. Third,
advancement of women may occur through mentoring which may pull women faster into
organizational hierarchies, give women better access to job-specific human capital, and
thereby increase their productivity and marketability, and the more-so the more senior
are the women (Catalyst 1996, 2004, Preston 2004). Finally, networks may operate to
the advantage of women if women have greater social ties to women than men (Ely
1994).
Traditionally, economic analyses of the gender pay gap and occupational
segregation have focused on either gender differences in qualification, as in the human
capital model (Mincer and Polachek 1974), or in the labor market treatment of similarly
qualified individuals. While differences in labor market treatment may arise from
discrimination, unmeasured differences –such as differences in effort, motivation, or skill
– are often used to explain the residual impact of gender on earnings or promotion,
3
especially where human capital is difficult to measure. The more homogeneous is the
cohort of men and women the less important are unmeasured differences likely to be as
an explanation for a gender pay or occupational attainment gap. A substantial body of
literature has focused on comparing similar men and women based on educational
attainment (as in Wood, Corcoran, and Courant 1993, for example) or on industry and
job rank (as in Cohen, Broschak, Haveman 1998).
The best case therefore for estimating gender differences independent of quality
is the case of workers with similar education, skills, and motivation. In this paper, I make
use of Standard and Poor’s ExecuComp database, which contains information on
compensation for the top five executives for a large set of public companies of varying
size. To the extent that top executive men and women share common ambition, skills
and abilities as reflected in their professional success, top executives are an ideal group
to use for exploring the gender gap in pay since unmeasured differences are likely to be
small. Although female representation is low among top executives (on average 4.45
percent representation over the sample period), the representation of women has been
increasing consistently through time and the data set is quite large (over 25,000 unique
executives in the data). The gender gap in top executive pay is evaluated over time and
after controlling for a variety of executive, firm, and industry specific factors.
This paper extends the work on the gender pay gap in top executive jobs in
several ways. First, the executive gender pay gap is studied through 2003, thereby
extending analysis to a period of greater participation of women executives generally
and specifically at higher ranks. Second, because of the large sample size of firms and
the tripled representation of women at high levels in later years, I am able to test
empirically the impact of women-leaders on the careers of other executive women. I do
so by merging the ExecuComp data with an independent Institutional Investor Research
Center (IRRC) data set on Corporate Directors. By combining the data in this way, I am
4
able to differentiate between the effect of a woman-leader inside the firm and a female-
friendly corporate board. Exploiting the panel nature of the data using firm and
individual-specific fixed effects further differentiates the role of female executives from
female-friendly firms.
My results strongly support the view that women executives fare better in
women-led firms. Specifically, women-executives working in women-led firms earn
between 15-20% more in total compensation than women working in other firms after
correcting for important executive, firm, and industry characteristics that might affect the
magnitude of this relationship, and this effect appears even stronger in a sub-sample of
women only using fixed-effects estimation methods. In addition, women-led firms have
statistically significantly greater numbers of top women executives, suggesting that
women-leaders help to bring women into the highest ranks of the firm. Firms with a
relatively high representation of women Board members are also associated with
positive outcomes for women executives.
Taken together, these findings support the contention that women leaders are
instrumental to the success of top executive women in quantifiable and significant ways.
II. The Gender Pay Gap among Top Executives
Means and Trends
The key data set used in this analysis is Standard and Poor’s ExecuComp data
for the years 1992-2003. These data contain information on compensation and the
individual components of compensation for the top five executives for all firms in the
S&P 500, S&P Midcap 400, and S&P Smallcap 600. In total, there are 2,194 unique firm
observations and 25,529 unique executive observations over the twelve year period.
These data are ideal for evaluating the gender gap in executive pay for a variety of
reasons. First, the data offer information on different components of executive pay such

5
as salary, annual bonus, long-term incentive bonus, and the value of stock options.
Since salary is a more discretionary component of executive compensation than
executive bonus which is often formulaic (Murphy 1999), it is reasonable to evaluate the
gender pay gap in specific components of pay. Second, ExecuComp provides firm-
specific information such as assets, market value, employment, stock price growth, and
other financial variables for each firm-year observation and thereby allows the
researcher to control for gender differences in pay that may arise from differences in the
gender distribution of executives across firms by size or performance. Third, the
ExecuComp data provides some limited information on each executive such as title, age,
and tenure, as well as the detailed title of the executive, which allows for an investigation
of the importance of pay differences independent of key executive characteristics.
Fourth, the firms in the ExecuComp data constitute over 80% of the total market
capitalization of US Public firms (Bebchuk and Grinstein 2005), and thereby offer the
most broad view of the gender pay gap among top US executives in publicly traded
firms. Finally, the large sample of firms allows for a test of the influence of the highest
paid women on the career outcomes of the women below them, although women CEOs
and Chairs constitute only a small share of the executive sample. Whereas empirical
evaluation of the role of top women in the careers of women below them has tended to
focus on specific firms and with limited data (Beckman and Phillips 2005, Cohen,
Broschak, Haveman 1998), this data allows for a broad systematic study across widely
varying firms and industries over time.
Table 1 summarizes key statistics on the representation of men and women
executives, their relative pay, and their age and tenure from the ExecuComp data over
the 1992-2003 period. Several facts emerge from the table. First, there are 1,369
unique observations of women top executives in these data and these women
executives are younger and have less tenure on average than their male executive
6
counterparts, consistent with other data and sources (Cappelli and Hamori 2004).
Second, women are underrepresented at the highest rank of CEO and Chair and
somewhat underrepresented at the President levels but are more likely to be Chief
Financial Officers and General Counsels than are men. Gender differences in
representation are in all cases statistically significant. Gender patterns by title are
consistent with outcomes for the earlier period (Bertrand and Hallock 2001).
Table 2 looks at trends in the data over time. Column 1 of the table shows that
the percent of top women executives has been increasing consistently through time,
although at somewhat slower rate more recently. Column 2 shows that despite the low
numbers of women CEO and Chairs (roughly 2 percent of the sample since 2000), their
numbers have been increasing at roughly the same rate as the rate of increase in top
women executives overall, and have nearly tripled since 1992. Column 3 shows that the
percent of directors in the data that are female is roughly equal to the percent of CEOs
and Chairs in the data that are female with similar upward trend. Columns 4 and 5 show
the percentages of ExecuComp executives that are Board members by gender, and
reveal that top executive men are twice as likely as women to be a corporate board
director. This ratio has moreover, been roughly constant through the twelve year period
covered by this data.
Table 3 looks at the raw gap in compensation between women and men
executives using three measures of compensation, namely total gross compensation
(salary plus bonuses, long-term and annual incentive pay, the Black-Scholes value of
options, and the value of restricted stock), cash compensation (salary plus bonus), and
salary. All compensation is expressed in 1992 real values. The raw gap in pay between
men and women executives is $462,406, and the ratio of female to male total
compensation is .720. The fact that the gender gap in compensation was significantly
larger using the same data for 1992-1997 (Bertrand and Hallock 2001), indicates that the
7
uncompensated gender gap in executive compensation has narrowed considerably
through the late 1990s and early 2000s period. The gender gap in cash compensation is
somewhat larger and in salary somewhat smaller than in gross compensation, and
statistically significant in all cases.
Regression Analysis
Earlier empirical work on the gender gap in executive compensation using the
ExecuComp data found that executive women earned 45% less than executive men,
and that roughly ¾ of this gap was explained by two factors, namely that women work in
smaller firms and are less likely to be CEO, Chair, or Company President (Bertrand and
Hallock 2001). The analysis in this section updates this work.
The standard approach for analyzing the impact of gender on compensation is to
evaluate the residual affect of gender on pay after controlling for characteristics of the
individual, firm, and industry that might affect the way in which men and women are
compensated by the firm.1 We know, for example, that women are relatively under-
represented in the top ranks of Corporate CEOs and Board Chairs (although their
representation has been increasing through time), and that this adversely impacts their
relative pay. We know as well that women are under-represented in larger firms and in
high-paying industries like financial services (Bertrand and Hallock 2001). In any case,
there is a great deal of heterogeneity in pay practices across firms (Murphy 1999) that
must be accounted for when determining pay.
Table 4 looks at the uncorrected- and corrected-gender gap in executive pay
using the updated ExecuComp data through 2003. The dependent variable for the first
four columns of Table 4 is the natural log of real gross compensation, a measure which
1 See for example Blau, Ferber, and Winkler (2002) for a thorough summary of the voluminous literature on this topic.

8
includes the sum of salary, annual incentive bonus, longer-term bonuses, and the value
of options and restricted stock. Column 5-8 of the table use the natural log of real salary
(columns 5-6) and salary plus annual bonus (columns 7-8), in order to test for gender
differences by component of executive pay.
Column 1 shows that there is a 25.4% difference in the gross compensation of
male and female top executives in these data. This is substantially smaller than the 45%
difference reported by Bertrand and Hallock (2001) for 1992-1997. The decline in the
gender gap in executive compensation is consistent with a decline in the gender pay gap
more generally over this period (Blau and Kahn 2000). Column 2 adds controls for firm
size and valuation (employment and real market capitalization), for occupational title (for
CEO or Chair), as well as fixed effects for industry and year. The gender pay gap falls to
10.8% after the inclusion of these variables. Consistent with the theory, the elasticity of
compensation with respect to firm-size is roughly .35 and is statistically significant in all
cases (Murphy 1999). Column 3 uses detailed occupational titles controls2 and this
reduces the unexplained gap to 7.8 percent. Grouping of executive titles is tenuous in
that grouping is difficult and titles convey different responsibility and status across firms.
In addition, if women are less likely to be offered a high-powered title than comparable
men (and commensurate of course with responsibility and pay), then the inclusion of
these detailed titles may result in an underestimation of the true magnitude of the gender
pay gap. The inclusion of age (column 4) leaves the results qualitatively unchanged, but
2 Occupational categories were constructed based on the “executive title” variable in ExecuComp. There are more than 6,000 unique occupational titles in the data, so the construction of these controls was quite cumbersome. While certain executive titles were easily converted and grouped (such as “vice president” and “vp” and “vice pres”), other groupings were significantly more complicated. In cases where executives were given two titles, the executive’s highest rank in title (based on average pay) was used. From the ExecuComp data the following titles were constructed: CEO, CEO and Chair, CEO and Vice-Chair, CEO and President, Chair, Vice Chair, President, Chief Financial Officer, Chief Operating Officer, Chief Accounting Officer, Chief Technology Officer, Chief “Other” Officer, General Counsel, Controller, Senior Executive Vice President, Executive Vice President, Senior Vice President, General Vice President, and Vice-President. All other titles were treated under type “All Other.”
9
reduces the number of observations by over 50 percent, and age is therefore excluded
from the reported analysis that follows.3 In sum, the estimates suggest that between 7-
11% of the gender gap in executive compensation is unexplained.
Columns 5-8 of Table 4 report results for real salary and cash compensation
(salary plus bonus) and reveal a similar gap between the pay of top women and men
executives in the range of 10-13% after correcting for firm size, time, industry, and title.
In sum, the regression results reveal several important facts. First, the
uncorrected gender gap in compensation among top corporate executives, while large
(roughly 25%), has narrowed considerably over time as women executives increased
their representation among top corporate executives at all ranks. Second, firm size and
the under-representation of women at CEO, Chair and other executive titles explains
about 50-60% of the differences in pay, less than the 75% contribution cited by Bertrand
and Hallock (2001) over the 1992-1997 period. Finally, after controlling for firm size,
executive title, industry, and time, there remains a substantial gap (7-13%) in the pay of
top executive women that is true for all components of pay.4
Statistical Discrimination and the Role of Unmeasured Human Capital Factors
The traditional approach to explaining the residual gender gap in pay has been to
focus on either differences in the unmeasured qualifications by gender or on differences
in their market treatment. Gender differences in qualifications presumably result from
differences in human capital that might derive from acquired endowments (education 3 Robustness tests for the effect of both age and tenure (which reduces the number of observations by 65% show no qualitative impact of either variable on the magnitude or significance of the gender pay gap in any of the reported regression results. 4 Bertrand and Hallock (2001) find a gap of similar magnitude over the earlier period using roughly the same specification. After controlling for age and tenure (and reducing the number of observations from over 42,000 to just over 7,000), they find that the unexplained gender compensation gap falls to below 5 percent and is no longer statistically significant. These results are difficult to interpret however, as in the case here, because they are imprecisely estimated with a small sample that is not necessarily random with respect to the population of executives in the data base.

10
and job-training), or other more difficult to measure factors (ambition or motivation). The
reasonable presumption in this particular case -- a unique sample of top-paid public
company executives – is that unmeasured differences in both endowment and
motivation are small and don’t account for unexplained gender differences in
compensation. Indeed, it is certainly possible that, if anything, the women in this sample
are even more motivated than the men in that they have succeeded against presumably
greater odds.
In any case, while data on education and motivation are not available on a broad
basis for the women and men executives in my sample, I was able to obtain some
information on education for a sub-sample of executives that sheds some limited light on
the magnitude of any difference. Specifically, I obtained information on education and
career/family decisions for a sub-sample of 3054 men and 296 women executives in the
ExecuComp data through online sources such as Forbes, Hoover, and Lexis-Nexus, as
well as archived company websites.5 The data in Table 5 are unremarkable in that
except for the greater tendency of executive men in the sample to obtain MBA degrees
and of women to obtain JD degrees there are small and statistically insignificant
differences in the educational experiences of the men and women executives in all
cases.6 The point is that to the extent that these results hold up to a larger sampling of
executives across industry differences in education are not surprisingly unlikely to
explain the observed gap in pay.
5 Women were over-sampled in this application, as were executives in the technology and financial services sector. Note as well that the education-specific data over-samples executives from 2002 and 2003 since data for the most recent executives is more readily available. 6 Since the education-linked data over-sample financial services executives and given the greater tendency of financial services executives to obtain MBAs and the smaller percentages of female executives in financial services (about 2.5% of the financial services executives) the higher frequency of MBAs among male executives may be somewhat overstated.

11
II. Women-Led Firms and the Impact on Women Executives
The under representation of women executives on corporate boards and in the
highest corporate positions has been well documented elsewhere (see for example,
Catalyst 2000, 2003), and at least some of the implications of this gap are well
understood. Indeed, Bertrand and Hallock (2001), using ExecuComp data through
1997, show that 47% of the mean difference in the overall compensation of top women
and men executives can by explained by the scarcity of women in the top four
occupations of Chair, CEO, Vice Chair, and President.
Is there a spillover effect to other lower-ranked women executives associated
with the under-representation of women in the ranks of Chair/CEO and on Corporate
Boards?
Tables 6 and 7 begin to address this issue in the simplest of terms, looking at the
means of salary, total cash compensation, and total gross compensation, for women and
men in companies that are “led” by women executives as compared with those that are
not. “Women-led companies” are defined in one of two ways. The less restrictive
definition defines women-led companies to be those with a CEO and/or Chair who is a
woman. A somewhat more restrictive definition imposes the additional constraint that
the female CEO leader be a member of the Corporate Board.7 Since top corporate
compensation (and promotion decisions) are usually discussed and determined through
an internal-process before subsequent recommendation to the compensation committee
of the board (Murphy 1999), the CEO has obvious influence at both internal and Board-
stages and is therefore more likely to be determinative of outcome when she sits on the
Corporate Board. Also, there is evidence that women directors are accepted as
legitimate leaders more often than women in other top positions due to the relatively
7 There are 79 women executives in the data set who are CEOs or Chairs of their firms. Of these 79 women, 29 also hold a title on the Board of Directors.

12
greater prevalence of women directors and additional evidence that this greater
acceptance increases their influence (Beckman and Phillips 2005).
Table 6 shows that women fare better in terms of salary and total cash
compensation in female-led companies where the CEO and/or Chair is female. The
difference in pay between women executives in female-led and other firms is statistically
significant in all cases, and exceeds the differences in male pay in female-led and other
firms in all cases as well. The top row of the table shows that the unadjusted difference
between the salary of women and male executives in female-led and other firms is
$126,693, a greater than 50% premium to women in women-led firms. The difference to
men in women-led and other firms is considerably smaller (Row 2). Row 4 of the table
excludes all executives with the title of CEO and/or Chair from the analysis since the
female-led firm is defined in this way and to avoid over-sampling of the highest paid
women. As is clear from the analysis, the difference between female salaries in female-
led and other firms is still statistically significant and large, exceeds the difference in
salary to men in female-led and other firms, and indicates a roughly 13% premium to
women in women-led firms. Rows 7 and 8 of the table perform the same analysis using
real cash compensation (salary plus incentive bonus), and show that using this measure
of compensation, women continue to fare relatively better in women-led companies. Not
surprisingly, the magnitude of the relative advantage is smaller in the case of cash
compensation (10.9%), since salary is a more discretionary component of pay than is
the executive performance bonus (Murphy 1999). Finally, rows 10 and 11 complete the
analysis using total gross compensation as the measure of pay and show a nearly
$300,000 advantage to women in women-led firms that is nearly twice as big as the
advantage to men.
Table 7 performs the same analysis using the more restrictive definition of a
female-led company that restricts the female CEO to be a member of the Corporate

13
Board. The results are qualitatively unchanged, in that women in women-led companies
enjoy a pay premium in salary and total compensation that does not extend to men. It is
interesting that in women-led companies in this more restrictive case (where women
leaders arguably have greater control over compensation by virtue of both title and
board stature), there is no statistical difference between what female and male top
executives are paid.
The literature suggests that women executives support other women not
exclusively in terms of better relative pay, but in terms of representation and positions as
well. To what extent then do the data support the claim that women-leaders bring more
women executives to top positions in their company?
Table 8 begins to answer this question by comparing women-led firms and the
incidence of women executives. The uncorrected results lend impressive support to the
claim that women-leaders help women beneath them to rise to the top of the corporate
ranks. Row 1 shows that the incidence of top women corporate executives is over four-
times greater in women led companies than in male led companies in the ExecuComp
data. Row 2 excludes all executives with the CEO and/or Chair title (since women-led
companies are defined this way) and shows that in this case, women are still over two-
times more likely to rise to the top of their corporations in firms in which women are the
decision makers. Rows 3 and 4 of the table show that the same trends emerge when
the more restrictive definition of a women-led company is applied. It is perhaps worth
noting that in the more restrictive case where the influence of the women-leader is
higher by virtue of her Board representation (Rows 3 and 4), there are even more
women in the top-five ranked executives in terms of pay (compared with Rows 1 and 2),
and that this difference in affect is statistically significant in all cases.
Multivariate Analysis

14
While there is a considerably body of case-based evidence suggesting that top
women can be critical for the success of women below them (Cohen, Broschak,
Haveman 1998, Catalyst 1996, 2002, Beckman and Phillips 2005), the empirical
economics literature finds little evidence of a positive effect of women mentoring women
(Canes and Rosen 1995, Neumark and Gardecki 1998, Preston 2004), although the
importance of white-male mentoring in perpetuating segregation in the workplace is well-
understood at a theoretical level (Athey, Avery, and Zemsky 2000).
To better evaluate the significance of women on the careers of women below
them independent of other factors, I rerun the regressions in Table 4 including an
interaction term for females that work in female-led companies. These results are
presented in Table 9. Column 1 of the Table shows a clear compensation advantage to
women in firms with a female CEO and/or Chair of 46.5% percent which fully
compensates for the 34.1% pay disadvantage to women generally. Column 2 of the
table controls for firm size and valuation, CEO/Chair Occupational Title, Year, and
Industry, and shows a continued positive effect for females working in a female-led
company of 8.0 percent. Column 3 adds detailed occupational controls which reduces
the magnitude and statistical significance. If women executives are disadvantaged in
title/occupational attainment within firms or if women-leaders more readily promote
talented women into higher titled positions, then the inclusion of detailed occupational
controls may lead to an under-prediction of the effect of women-led companies on
executive women’s wages.
Columns 4 and 5 provide robustness checks on the results above. Specifically,
Column 4 excludes all CEO/Chairs from the analysis and thereby looks at the effect of a
woman CEO/Chair on all other employee wages. The table shows a continued positive
effect for females working in a female-led company of 8.5 percent, although this effect is
statistically significant at only 90% confidence levels. Column 5 controls for the

15
executives age (which is available for only a sub-sample of the executives) and shows
an even bigger impact on women of working in female-led companies after controlling for
age.
Columns 6-10 of the table perform the same analysis using the more restrictive
definition of female-led firms that includes leadership in the firm (CEO) and membership
on the Board. Not surprisingly, the impact on women of working in women-led
companies is stronger in magnitude and in significance using this definition and offers
qualitatively similar conclusions.
The literature suggests that women-leaders are instrumental in promoting women
within the organization (Cohen, Broschak, Haveman 1998, Beckman and Phillips 2005,
Athey, Avery, and Zemsky 2000). To test this effect, I use the women-led company
dummy variable as a proxy for the effect of having a women decision maker in the top
ranks of the firm, and the female executive dummy variable as a measure of the
representation of top ranked – among the highest five paid – women executives in these
firms. Roughly four and a half percent of the executives in ExecuComp are female. The
difference in the percentages of female executives in women-led companies as opposed
to male-led companies can therefore be estimated after controlling for characteristics of
the firm or industry that might influence the presence of women executives at the firm.
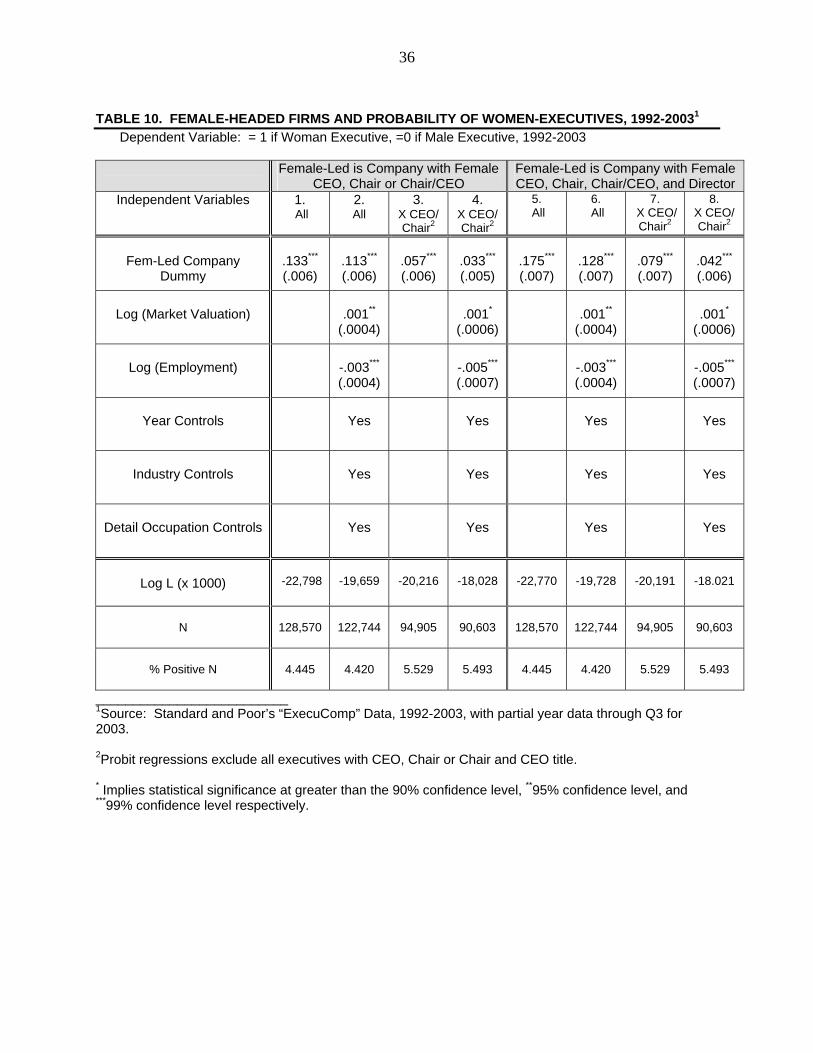
Table 10 presents the results from a probit-analysis of the dichotomous female
variable. All coefficients are the probability of a female executive in the company
evaluated at the mean of the independent variable. The odd-numbered columns include
only the female-headed company dummy variable using the less-restrictive (columns 1-
4) and more-restrictive (columns 5-8) definitions, and excluding executives with the
CEO/Chair title (Columns 3 and 7). The even numbered columns give results with the
inclusion of specified covariates. The specifications for the regressions using the two
definitions of female-headed firms use identical covariates.

16
The results show strong evidence that there are more women executives in
women-led firms. In all models, top women were significantly more likely to be in
women-led firms. The exclusion of executives with the CEO and Chair title from the
analysis dilutes the effect of women-leadership in the firm since women are over-
represented in this group by virtue of how these firms are assigned. The estimates
defining women-led firms based on the title of CEO or Chair without accounting for
Board membership (columns 1-4) suggest that women-leaders increase the probability
of other top ranking women in the firm from between 13.3% to 3.3%, depending whether
CEOs and Chairs are omitted from the sample for analysis and whether firm size, year,
industry, and detailed occupation, is added as control.
The estimates using the more restrictive definition of women-led firms in which
the female CEO is also a Board member (columns 5-8) are somewhat stronger for the
overall impact of women-leaders on other top women at the firm. Specifically, the results
show that the presence of a woman CEO who is also a director increases the probability
that women will be in the top-five paid executives in the firm by between 17.5% and
4.2% depending on sample and covariates.
In sum, the empirical evidence shows that women who work in women-led firms
are compensated higher and more likely to be in the top-five paid executives in the firm
than are comparable women in non-women-led firms.
III. Firm Board Structure
There are several possible explanations for the statistically strong link between
women-led firms and the positive compensation and representation effects on the
women that work in them. It has been observed, for example, that a high and increasing
proportion of women in a firm may lead to more women in that firm and especially when
the women are in high positions. This may occur for at least three reasons. First,

17
women may obtain more human capital and better access through mentoring (Catalyst
1996, 2004, Preston 2004). Second, the distaste (and discrimination) for women as co-
workers may fall as their proportion rises (Becker 1957). Third, better information about
women may correct informational biases and asymmetries that lead to more hiring and
promotion of women in high ranks (Phelps 1972, Aigner and Cane 1977, Goldin 2002).
To the extent that the there is better mentoring of women in women-led firms, it
should be the case that the positive relationship between female
compensation/representation and women-led firms is independent of other factors that
might influence the pay and numbers of female executives in these firms. For example,
firms with a relatively high proportion of women executives tend to be younger and to
have flatter hierarchies (Capelli and Hamori 2004) and this may influence the relative
pay and representation of women. Similarly, it is reasonable to assume that firms with a
relatively high representation of women on their corporate board will have more women
executives since the presence of high-level women is important for the outcomes of
other women (Beckman and Phillips 2005). If a high share of women corporate board
members is also positively correlated with the probability of a women-leader at the firm,
then the omission of board demographics may lead to spurious conclusions on the
effects of the women-leader.
Data on the share of female directors on the Corporate Board was obtained from
the IRRC and made available through Wharton Data Services. These data, available
from 1997-2001, contain valuable information on Corporate Board representation such
as gender, insider-outsider status, age, and committee responsibilities. From these data
I was able to construct a variable that measures the share of female executives on the
corporate board in each firm annually from 1997-2001. Since the representation of
women on corporate boards has increased through time, I retain the annual component
18
of the data, and merged the director’s data by company and year with the ExecuComp
data.8
The full merged database therefore contains information from the two sources,
namely compensation data and data on company size and executives from ExecuComp,
and data on directors measured at the company and year level and available from the
IRRC from 1997 to 2001.
What effect then, if any, does the gender composition of a firm’s Board have on
the pay and representation of top women executives?
To begin to analyze this question, Tables 11 looks at the average values of
compensation and female representation in firms with a high-share of female directors
(in the top-quartile with greater than 13.33% female directors), and those with no female
directors (in the bottom quartile of firms). Table 11 shows a clear effect of the share of
female directors and the high-level representation of its top female executives, although
the effect of board composition on female pay is somewhat more ambiguous. For
example, while there is over twice the representation of top female executives on firms
that have a high-share of corporate directors than on those that have none, the
differences in pay to women executives in the two types of firms is not significant. While
women are paid over $800,000 more in firms with a high share of female board
members men are paid over $975,000 more in these firms, implying that the differences
between the pay of men and women in companies with a high share of women board
members are even larger than in firms with no female members.
Gender Compensation Differences
8 Data were merged by CUSIP number. There were missing data for 734 ExecuComp firms for the 1997-2001 period.

19
The obvious next step is to evaluate the effect of the gender composition of the
board on the relationship between female-led firms and both female executive
compensation and representation. Table 12 evaluates the impact of female-leadership
on the compensation of female executives after controlling for the gender composition of
the board of directors of the firm, as well as other covariates analyzed above. Column 1
shows that while top women executives in general earn 40% less than comparable men,
this disadvantage is erased for female executive in female-led firms. The estimates
further suggest that if the share of female board members increases by one percentage
point the impact will be to increase salary by 2.20 percent, a large effect consistent with
the results from the means tables above. The results show that there is no effect on
women who work in firms with a high share of female directors after controlling for the
female-led firm interaction.
Columns 2-5 perform the same analysis adding various covariates. Column 2
presents the results after adding controls for year, industry, and firm size. In this case,
the effect of working in a female-led company for women remains qualitatively
unchanged. The interaction on the firm’s share of female directors shows that female
representation on the board works to the advantage of women executives, who enjoy a
premium over women working in companies with low female board representation.9
Columns 3 and 4 add controls for aggregated (controlling for CEO and Chair positions)
and detailed occupation respectively, and show that the positive impact of female-led
firms on the pay of female executives is not independent of occupational title as defined
in this way, although the impact of female board member share on female executive pay
appears independent of title at least in the aggregated case (column 3). Finally, column
9 The mean on the share of female directors is .081. A doubling in the share of female directors in the firm from 8% to 16% would in this case, imply an increase in the compensation of women in these firms of 4.5 percent.

20
5 of the table omits all executives with the title of CEO and Chair from the analysis after
the addition of all covariates with qualitatively similar results.
Columns 6-9 of the table employ the more restrictive definition of women-led
firms. As before, the positive impact on women executives of working in women-led firms
is stronger, ranging from a 60% advantage after controlling for company size, year, and
sic (column 6) to a 13.6% advantage (column 9) after accounting for characteristics of
the firm, year, industry, detailed occupational title, and after omitting all executives with
the title of CEO and Chair from the analysis. Similarly the results show that female
executives in firms with a high share of female board representatives fare better than
other female executives.
In sum, the empirical results in Table 12 suggest the following. First, there is
considerable evidence that women executives earn higher pay when they work in firms
in which there is a female CEO or Chair. Second, the impact of women-leaders on top
women executives seems to be related at least in part to the fact that women who work
in women-led firms are promoted more readily into higher paying occupations, since the
inclusion of detailed occupation impacts the magnitude and in some cases the statistical
significance of both the female-led company and share of female director interactions.
Third, women executives also earn higher pay when they work in firms that have a
greater representation of women on their corporate board. The magnitude of the
coefficients implies that if the share of women on the corporate board was doubled from
its mean of .08, the compensation of women in these firms would increase by between
3.6 and 5.1 percent. Finally, the positive impact on women executives of working in a
female-led company and/or in a company that has a high proportion of female board
members is robust to the exclusion of the top CEOs and Chairs where the impact might,
of course, be expected to be the greatest.
21
Women Leaders v. Women-Friendly Firms
While the persistently strong impact of women-leaders suggests that women-
leaders are helping the women below them, the possibility remains that it is “women-
friendly” firms and not the female corporate heads that are responsible for the positive
gender results. For example, if women-friendly firms are more likely to have both a
woman CEO and/or Board Chair and more top women employees at higher pay, then
the association between women-leaders and the gender pay gap might be due to
unmeasured characteristics of companies and incorrectly attributed to the leaders that
head them.
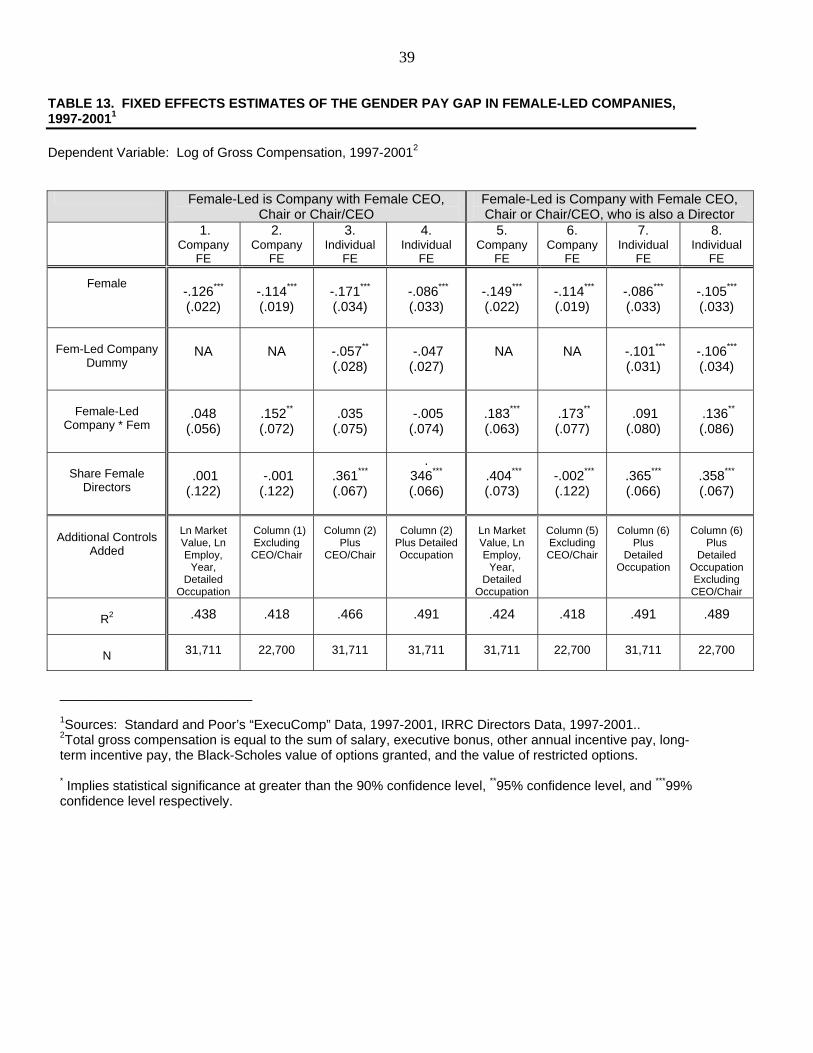
To test for the potential impact of “women-friendly” companies, Table 13 presents
estimates from regressions using firm and individual fixed effects, and thereby
abstracting from characteristics of firms that may be associated with executive pay and
from the effect of individual executive leaders on executive pay during and after their
tenure as chief executive or chair. Columns 1-2 present the company fixed effects
estimates and Columns 3-4 present the individual fixed effects estimates. The fixed
effects results lend strong empirical support to the documented empirical finding that
women-leaders increase the pay of women executives since the female-led firm
interactions are statistically significant in both firm and individual fixed effects when
excluding the CEOs and Chairs.
What do the results from Tables 12 and 13 imply, if anything, about the role of
women-leaders in the careers of other top women executives? Since the impact on top
women executives of working in a female-led company is in most cases independent of
the gender composition of the board (Table 12), and of unmeasured characteristics of
firms and individual leaders over time (Table 13), the results offer one clear conclusion,
namely, that women-leaders play a critical equalizing role in the compensation received
by other women executives who are fortunate to work for them.

22
Gender Representation Effects
Does the presence of women board members imply greater numbers of women
executives? Table 14 presents the results from a probit-analysis similar to that above,
but adding additional covariates for the firm’s female representation on its board.
Coefficients are the probability of a female executive in the company evaluated at the
mean of the independent variable. Odd-numbered columns include the female-headed
company dummy variables and the female director variable. Even numbered columns
add controls for firm-size and market capitalization, industry, year, and executive title.
The results offer consistent and strong confirmation that women executives are
more likely to fare better in companies that are headed by a female CEO/Chair. The
impact of a female-led company on the probability that a woman will be among the top
five highest paid executives in the company ranges from between 13% and 2.4%
depending on the definition of female-led company and the various covariates, but these
effects are statistically significant at greater than the 99% level in all cases. Similarly, a
high proportion of female board directors impacts positively the probability of a top
woman executive in the firm. The implied magnitude of the coefficients suggests that a
doubling in the share of female directors from its mean of .08 to .16 would increases the
representation of women at the top of the firm by 1% to 1.6%, and this effect is
statistically independent of the characteristics of the firm, industry, and executive title in
all cases. Finally, democratic companies have a greater representation of top female
executives, and while small in magnitude, the impact of democratic structure is
statistically significant in all cases.
In sum, OLS, fixed effects, and probit results are broadly consistent with the view
that women decision makers (CEOs, Chairs, and Directors) help the women working
beneath them.
23
IV. Conclusions and Implications
This paper has documented several important facts. First, using a data set of the
highest 5 ranking executives in a sample of publicly traded firms shows that top women
executives are paid between 8% to 25% less than male executives, and that this effect is
statistically independent of characteristics of the firm (market valuation, employment),
executive (age, tenure, and title), and industry known to influence compensation. To the
extent that these executives are similar in their educational background and motivation,
and to the extent that women executives may face hurdles that exceed those faced by
men, it is unlikely that much of this gap can be explained by unmeasured differences in
human capital.
Second, the results offered here present strong evidence in support of the notion
that women executives fare better – both in terms of their relative compensation and
numbers – in companies that have a female CEO or Chair and especially if the female
CEO is a member of the Board. This effect is statistically significant in nearly all cases,
and is independent of important characteristics of the executive, firm, and industry that
are known to influence compensation and representation by rank.
Third, there is a statistically strong link between the share of female board
directors in the company and the relative compensation and representation of women
executives.
The fact that top women executives fare better in firms that are led by women
either internally or at the board level is at least consistent with the argument that the help
of women by women is an important factor in the career outcomes of women. To judge
how much weight should be placed on this interpretation, it must of course be compared
to alternative reasons for the observed correlations.
24
One alternative interpretation of the link between women’s outcomes and the
female leadership of the firm is that it reflects not a mentoring or supporting relationship
per se, but instead the degree of “women-friendliness” of the firm. It is certainly possible,
for example, that women-friendly firms might have greater numbers of women
executives and offer them better pay, while at the same be more likely to have greater
numbers of women board members and a women CEO. The association between
female leadership and representation and compensation might not be causal in this
case. As best as the data allow, this does not appear to be what is going on. Instead,
the empirical evidence strongly supports that working in a female-headed is good for
female executives independent of the characteristics of the firm.
A second plausible interpretation of the link between women-led firms and the
outcomes for women executives is that higher quality women are sorted into women-led
firms. If for example, women prefer working in women-led firms, and therefore a greater
numbers of high-quality women are drawn to these firms, then differences in the pay of
women in women-led firms might reflect differences in the ability/productivity of these
higher quality women. There is no evidence to support sorting of this kind. Indeed, while
an industry like apparel and retail has a relatively high representation of women
executives, the industry is generally not associated with high pay or an especially high-
skilled workforce, although it is associated with a great deal of uniformity in pay.
Indeed, there is very strong empirical evidence supportive of the fact that women
leaders are associated with positive compensation outcomes and for bringing women to
the highest ranks of the corporate hierarchy. It seems a logical conclusion to infer that
women-leaders are important to the careers of women below them. If equity for high-
skilled executive women is a policy goal then the one obvious instrument is affirmative
action at the very top of the corporate hierarchy.

25
REFERENCES
Arrow, Keneth (1972). Models of Job Discrimination. New York: Lexington Books. Athey, Susan, Christopher Avery, and Peter Zemsky (2000). “Mentoring and Diversity.”
American Economic Review 90 (4), pp. 765-86. Baron, James N., Michael T. Hannan, Greta Hsu, and Ozgecan Kocak (2003). “In the
Company of Women: Determinatns of the Gender Mix in Young High-Tech Firms.” Mimeo, Stanford University, June.
Bebchuk, Lucian and Yaniv Grinstein (2005). “The Growth of US Executive Pay,”
Mimeo, January. Bebchuk, Lucian, Alma Cohen, and Allen Ferrell (2004). “What Matters in Corporate
Governance?” Harvard Law School Discussion Paper No. 491, September. Becker, Gary. The Economics of Discrimination (1971). Chicago: Chicago University
Press. Becker, Gary (1985). “Human Capital, Effort, and the Sexual Division of Labor.” Journal
of Labor Economics, 3 (1, part 2), pp. S33-S58. Beckman, Christine M. and Damon J. Phillips (2005). “Interorganizational Determinants
of Promotion: Client Leadership and the Attainment of Women Attorneys.” Mimeo, February.
Bertrand, Marianne and Kevin F. Hallock (2001). “The Gender Gap in Top Corporate
Jobs,” Industrial and Labor Relations Review, Vol. 55, No. 1, October. Blair-Loy, Mary (1999). “Career Patterns of Executive Women in Finance: An Optimal
Matching Analysis.” American Journal of Sociology, Vol. 104, No. 5, March, pp. 1346-97.
Blair-Loy, Mary (2001). “Cultural Constuctions of Family Schemas: The Case of Women
Finance Executives.” Gender and Society, Vol. 15, No. 5, October, pp. 687-709. Blau, Francine and Lawrence Kahn (2005). “Changes in the Labor Supply Behavior of
Married Women: 1980-2000,” NBER Working Paper No. 11230, March. Blau, Francine and Lawrence Kahn (2000). “Gender Differences in Pay,” Journal of
Economic Perspectives, Vol. 14, No. 4, Autumn, pp. 75-99. Blau, Francine, Marianne Ferber, and Anne Winkler (2002). The Economics of Women,
Men, and Work. New Jersey: Prentice Hall, 4th edition. Capelli, Peter and Monika Hamori (2005). “The New Road to the Top.” Harvard
Business Review, January.

26
Capelli, Peter and Monika Hamori (2004). “The Path to the Top: Changes in the Attributes and Careers of Corporate Executives, 1980-2001,” NBER Working Paper No. 10507, March.
Cohen, Lisa E., Joseph P. Broschak, and Heather A. Haveman (1998). “And Then There
Were More? The Effect of Organizational Sex Composition on the Hiring and Promotion of Managers.” American Sociological Review, Vol. 63, October.
Ellwood, David, Ty Wilde and Lily Batchelder (2004). “The Mommy Track Divides: The
Impact of Childbearing on Wages of Women of Differing Skill Levels,” Harvard University Mimeo, March.
Fuchs, Victor (1989). “Women’s Quest for Economic Equality.” Journal of Economic
Perspectives, Vol. 3, No. 1, Winter, pp. 25-41. Goldin, Claudia (2002). “A Pollution Theory of Discrimination: Male and Female
Differences in Occupations and Earnings,” NBER Working Paper No. 8985. Gompers, Paul A., Joy Ishii, and Andrew Metrick. “Corporate Governance and Equity
Prices, Quarterly Journal of Economics, Vol. 118, No. 1, February, pp. 107-155. Murphy, Kevin J. (1999). “Executive Compensation,” in Orley Ashenfelter, ed.,
Handbook of Labor Economics, Vol. 3, North Holland. Preston, Anne (2004). Leaving Science: Occupational Exit from Scientific Careers. New
York: Russell Sage Foundation. Waldfogel, Jane (1997). “The Effect of Children on Women’s Wages.” American
Sociological Review, Vol. 62, April, pp. 209-217. Waldfogel, Jane (1998). “Understanding the ‘Family Gap’ in Pay for Women with Children.” Journal of Economic Perspectives, Vol. 12, No. 1, Winter, pp. 137-156.

27
TABLE 1. CHARACTERISTICS OF THE EXECUCOMP DATA1
All Executives Women Executives Men Executives
Number of Unique Executives
25,529
1,369
24,160
Average Age
53.18 (.135)
49.00 (.526)
53.38 (.138)
Average Tenure
10.048 (.054)
6.454 (.188)
10.217 (.056)
Percent with Title
Chair and/or CEO
9.33
(.182)
2.34
(.409)
9.73
(.191)
President
15.86 (.229)
12.64 (.898)
16.05 (.236)
Chief Financial Officer
11.25 (.112)
14.10 (.941)
11.09 (.202)
Chief Operating Officer
2.48
(.097)
1.46
(.324)
2.53
(.101)
General Council
4.68
(.132)
10.01 (.811)
4.38
(.132)
Percent with Pay Rank
Rank 1 (Highest Pay)
9.14
(.180)
2.78
(.262)
9.50
(.189)
Rank Below 5 (Lowest
Pay)
2.83
(.104)
4.46
(.558)
2.74
(.105)
_______________________ 1Source: Standard and Poor’s ExecuComp Data, 1992-2003 with partial year data through Q3 for 2003.

28
TABLE 2. REPRESENTATION OF WOMEN EXECUTIVES BY YEAR, 1992-20031
Percent of Top
Executives That Are Female
Percent of CEO/Chair Title That
Are Female
Percent of Directors That Are Female
Percent of Female
Executives that are
Directors
Percent of Male
Executives That Are Directors
1992
1.67
0.61
0.91
18.66
30.90
1993
2.08
0.65
0.96
16.67
28.67
1994
2.80
0.79
0.97
11.71
27.76
1995
3.47
0.96
1.15
10.85
27.89
1996
3.83
1.13
1.37
11.61
27.88
1997
4.29
1.15
1.45
10.64
27.50
1998
4.72
1.40
1.66
10.72
26.84
1999
5.32
1.93
1.94
10.94
25.97
2000
5.82
2.01
2.10
10.73
25.62
2001
6.32
2.15
2.28
10.37
24.76
2002
6.35
2.10
2.37
10.92
25.05
20032
6.18
2.16
2.45
12.42
25.99
Unique
Observations
1,369
84
147
147
4,476
Average
4.45
1.39
1.61
11.39
27.02
_______________________ 1Source: Standard and Poor’s ExecuComp Data, 1992-2003 with partial year data through Q3 for 2003.

29
TABLE 3. SALARY AND COMPENSATION FOR MEN AND WOMEN EXECUTIVES, 1992-20031
Women
Men
Difference
Ratio of
Female to Male Pay
Real Gross Compensation,2
Thousands of 1992 Dollars
1,186.560
1,648.966
$462.406***
.720
Real Cash Compensation,3 Thousands of 1992 Dollars
372.146
525.761
$153.615***
.708
Real Salary, Thousands of 1992 Dollars
221.086
282.816
$61.730***
.782
________________________ 1Source: Standard and Poor’s ExecuComp Data, 1992-2003 with partial year data through Q3 for 2003. 2 Real gross compensation is equal to the sum of salary, executive bonus, other annual incentive pay, long-term incentive pay, the Black-Scholes value of potions granted, and the value of restricted options. 3Cash Compensation includes salary plus executive bonus. *** Implies statistical significance at greater than the 99% confidence level.

30
TABLE 4. GENDER PAY GAP FOR WOMEN EXECUTIVES1
(White-Corrected Standard Errors in Parentheses) Dependent Variable: Log of Real Salary, Total Cash Compensation, Gross Compensation, 1992-20032
Independent Variables 1.
Comp.2 2.
Comp.2 3.
Comp.2 4.
Comp.2 5.
Salary 6.
Salary 7.
Cash-Comp.3
8. Cash-
Comp.3
Female
-.254***
(.016)
-.108*** (.013)
-.078*** (.012)
-.111*** (.032)
-.119*** (.007)
-.100*** (.007)
-.137*** (.008)
-.111*** (.008)
Log (Market Valuation)
.338*** (.003)
.328*** (.003)
.362*** (.005)
.085*** (.002)
.078*** (.001)
.169*** (.002)
.161*** (.002)
Log (Employment)
.063*** (.003)
.045*** (.003)
.059*** (.005)
.120*** (.002)
.108*** (.002)
.123*** (.002)
.109*** (.002)
Year Controls
Yes
Yes
Yes
Yes
Yes
Yes
Yes
Industry Controls
Yes
Yes
Yes
Yes
Yes
Yes
Yes
Detail Occupation Controls
Yes
Yes
Yes
Pay Rank Controls
Yes
Yes
Yes
Yes
CEO/Chair Controls
Yes
Yes
Yes
Yes
Age
.048
(.005)
Age-Squared
-.0005 (.0000)
R2
.002
.477
.489
.429
.362
.380
.465
.479
N
108,509
104,445
104,445
40,003
122,766
122,766
122,868
122,868
__________________________ 1Source: Standard and Poor’s “ExecuComp” Data, 1992-2003, with partial year data through Q3 for 2003. 2Total gross compensation is equal to the sum of salary, executive bonus, other annual incentive pay, long-term incentive pay, the Black-Scholes value of options granted, and the value of restricted options. 3Cash compensation is equal to salary plus executive bonus. * Implies statistical significance at greater than the 90% confidence level, **95% confidence level, and ***99% confidence level respectively.

31
TABLE 5. EDUCATIONAL BACKGROUND OF EXECUCOMP TECHNOLOGY EXECUTIVES1
Men (n=3054)
Women (n=296)
Percent with Terminal Undergraduate Degree
42.1
(0.90)
40.6
(2.90)
Percent with Degree from Private College
50.2
(0.93)
52.9
(3.00)
Percent with Degree from Top University2
19.3
(0.73)
19.9
(2.25)
Percent with MBA
34.6
(0.86)
29.1
(2.64)
Percent with PhD
7.8
(0.49)
5.7
(1.35)
Percent with JD
7.2
(0.47)
14.9
(2.07)
Percent with Multiple Advanced Degrees
8.3
(0.50)
7.8
(1.56)
_____________________ 1 Sample: Technology Executives from ExecuComp, 1992-2001. 2Top University is Defined as a Top-20 University or a Top-20 Liberal Arts College from US News and World Reports College Rankings, 2005.

32
TABLE 6. SALARY DIFFERENCES BY GENDER OF COMPANY HEAD (LESS-RESTRICTIVE)1
Firm with Female CEO/ Chair2
Other Firms2
Difference
1
Real Salary, All Women Executives
329.711
203.018
126.693***
2
Real Salary, All Male Executives
313.908
281.798
32.11***
3
Difference
15.803***
-78.780***
X
4
Real Salary, Women Executives
Excluding CEO/Chair
229.159
203.018
26.141***
5
Real Salary, Male Executives
Excluding CEO/Chair
251.823
230.026
21.797***
6
Difference
-22.664***
-27.008***
X
7
Real Cash Compensation3, Women
Executives Excluding CEO/Chair
376.275
339.285
36.990***
8
Real Cash Compensation3, Male Executives Excluding CEO/Chair
430.163
405.177
24.986***
9
Difference
-53.888***
-65.892***
X
10
Real Gross Compensation4, Women
Executives Excluding CEO/Chair
1,261.901
969.737
292.164**
11
Real Gross Compensation4, Male Executives Excluding CEO/Chair
1,298.602
1,126.305
172.297***
12
Difference
36.701
-156.568**
X
___________________________________ 1Source: Standard and Poor’s ExecuComp Data, 1997-2003 with data through Q3 for 2003. 2Firms with a Chair, CEO, Chair/CEO who is female; other firms are firms that do not have a female Chair, CEO, or Chair/CEO. 3Cash Compensation includes salary plus executive bonus. 4Real gross compensation is equal to the sum of salary, executive bonus, other annual incentive pay, long-term incentive pay, the Black-Scholes value of options granted, and the value of restricted options. *** All differences statistically significant at greater than the 99% level.

33
TABLE 7. SALARY DIFFERENCES BY GENDER OF COMPANY HEAD (MORE-RESTRICTIVE)1
Firm with Female CEO/Chair &
Director2
Other Firms2
Difference
1
Real Salary, All Women Executives
336.663
205.554
131.109***
2
Real Salary, All Male Executives
263.803
283.206
-19.403
3
Difference
72.860***
-77.652***
X
4
Real Salary, Women Executives
Excluding CEO/Chair
218.837
203.878
14.959**
5
Real Salary, Male Executives
Excluding CEO/Chair
226.448
230.806
-4.358
6
Difference
-7.611
-26.928***
X
7
Real Cash Compensation3, Women
Executives Excluding CEO/Chair
329.436
342.490
-13.054***
8
Real Cash Compensation3, Male Executives Excluding CEO/Chair
348.337
407.275
-58.938***
9
Difference
-18.901
-26.930***
X
10
Real Gross Compensation4, Women
Executives Excluding CEO/Chair
1,167.368
977.728
189.640**
11
Real Gross Compensation4, Male Executives Excluding CEO/Chair
1,082.184
1,132.707
-50.523
12
Difference
85.184
-154.979**
X
___________________________________ 1Source: Standard and Poor’s ExecuComp Data, 1997-2003 with data through Q3 for 2003. 2Firms with a Chair, CEO, Chair/CEO who is female and a member of the Board of Directors; All other Firms. 3Cash Compensation includes salary plus executive bonus. 4Real gross compensation is equal to the sum of salary, executive bonus, other annual incentive pay, long-term incentive pay, the Black-Scholes value of options granted, and the value of restricted options. *** All differences statistically significant at greater than the 99% level.

34
TABLE 8. GENDER REPRESENTATION BY GENDER OF COMPANY HEAD1
Firm with Female
CEO/Chair2
Other Firms2
Difference
1
Percent of Executives That Are
Female
17.304
3.957
13.347***
2
Percent of Executives That Are Female Excluding CEO/Chair
11.002
5.340
5.662***
Firm with Female
CEO/Chair & Director2
Other Firms2
3
Percent of Executives That Are
Female
21.499
4.017
17.482***
4
Percent of Executives That Are Female Excluding CEO/Chair
13.226
5.337
7.889***
___________________________________
1Source: Standard and Poor’s ExecuComp Data, 1997-2003 with data through Q3 for 2003 and IRRC Directors Data Set for Director data. 2Firms with a Chair, CEO, Chair/CEO who is female; other firms are firms that do not have a female Chair, CEO, or Chair/CEO.. ***Differences statistically significant at greater than the 99% confidence level.

35
TABLE 9. GENDER PAY GAP FOR WOMEN EXECUTIVES IN WOMEN-LED COMPANIES1
(White-Corrected Standard Errors in Parentheses) Dependent Variable: Log of Gross Compensation, 1992-20032
Female-Led is Company with Female CEO, Chair, Chair/CEO
Female-Led is Company with Female CEO, Chair, Chair/CEO and a Director
Independent Variables
1. All
2. All
3. All
4. No CEOs
Chairs
5. All
6. All
7. All
8. All
9. No CEOs
Chairs
10. All
Female
-.341***
(,017)
-.129*** (.013)
-.082*** (.013)
-.129***
(.013)
-.198***
(.039)
-.330*** (.017)
-.142*** (.013)
-.093*** (.013)
-.129***
(.013)
-.180*** (.038)
Fem-Led Company
-.004 (.014)
-.016 (.015)
-.004 (.014)
-.001 (.016)
.005
(.025)
-.148*** (.024)
-.039** (.018)
-.021 (.018)
-.035*
(.019)
-.062*
(.032)
Female in Fem-Led Company
.465*** (.052)
.080**
(.039)
.025
(.038)
.085*
(.047)
.192**
(.070)
.708*** (.057)
.203*** (.043)
.126*** (.042)
.108**
(.049)
.270*** (.074)
Log
(Market Value)
.336*** (.003)
.329*** (.003)
.338***
(.003)
.359*** (.005)
.336*** (.003)
.328*** (.003)
.338***
(.003)
.362*** (.005)
Log (Employ)
.059*** (.003)
.045*** (.003)
.052***
(.003)
.061*** (.005)
.
.058*** (.003)
.045*** (.003)
.052***
(.003)
.059*** (.005)
Year
Yes
Yes
Yes
Yes
Yes
Yes
Yes
Yes
Industry
Yes
Yes
Yes
Yes
Yes
Yes
Yes
Yes
CEO/Chair
Yes
Yes
Yes
Yes
Detail
Occupation
Yes
Yes
Age
.053*** (.005)
.047*** (.005)
Age2
-.001*** (.000)
-.0004*** (.000)
R2
.004
.441
.489
.446
.418
.005
.465
.489
.446
.429
N
108,509
104,445
104,445
74,259
40,003
108,509
104,445
104,445
74,259
40,003
__________________________ 1Source: Standard and Poor’s “ExecuComp” Data, 1992-2003, with partial year data through Q3 for 2003. 2Total gross compensation is equal to the sum of salary, executive bonus, other annual incentive pay, long-term incentive pay, the Black-Scholes value of options granted, and the value of restricted options. * Implies statistical significance at greater than the 90% confidence level, **95% confidence level, and ***99% confidence level respectively.
36
TABLE 10. FEMALE-HEADED FIRMS AND PROBABILITY OF WOMEN-EXECUTIVES, 1992-20031
Dependent Variable: = 1 if Woman Executive, =0 if Male Executive, 1992-2003
Female-Led is Company with Female CEO, Chair or Chair/CEO
Female-Led is Company with Female CEO, Chair, Chair/CEO, and Director
Independent Variables 1. All
2. All
3. X CEO/ Chair2
4. X CEO/ Chair2
5. All
6. All
7. X CEO/ Chair2
8. X CEO/ Chair2
Fem-Led Company
Dummy
.133***
(.006)
.113*** (.006)
.057*** (.006)
.033*** (.005)
.175*** (.007)
.128*** (.007)
.079*** (.007)
.042*** (.006)
Log (Market Valuation)
.001**
(.0004)
.001*
(.0006)
.001**
(.0004)
.001*
(.0006)
Log (Employment)
-.003***
(.0004)
-.005***
(.0007)
-.003***
(.0004)
-.005***
(.0007)
Year Controls
Yes
Yes
Yes
Yes
Industry Controls
Yes
Yes
Yes
Yes
Detail Occupation Controls
Yes
Yes
Yes
Yes
Log L (x 1000)
-22,798
-19,659
-20,216
-18,028
-22,770
-19,728
-20,191
-18.021
N
128,570
122,744
94,905
90,603
128,570
122,744
94,905
90,603
% Positive N
4.445
4.420
5.529
5.493
4.445
4.420
5.529
5.493
__________________________ 1Source: Standard and Poor’s “ExecuComp” Data, 1992-2003, with partial year data through Q3 for 2003. 2Probit regressions exclude all executives with CEO, Chair or Chair and CEO title. * Implies statistical significance at greater than the 90% confidence level, **95% confidence level, and ***99% confidence level respectively.

37
TABLE 11. COMPENSATION AND GENDER REPRESENTATION BY BOARD COMPOSITION1
PANEL A. COMPENSATION DIFFERENCES
High-Share of Female Directors2
No Female Directors2
Difference
Real Compensation,
All Women Executives
1,881.049
1,045.057
835.992***
Real Compensation, All Male Executives
2,735.228
1,759.492
975.736***
Difference
-854.179***
-714.435***
X
PANEL B. GENDER REPRESENTATION DIFFERENCES
High-Share of Female Directors2
No Female Directors2
Difference
Percent of Executives
That Are Female
8.288
3.812
4.476***
________________ 1Source: IRRC Directors Data, 1997-2001 and ExecuComp Data, 1997-2001. 2The no female directors implies bottom-quartile of data on female Board representation. High share of female directors implies top-quartile of data and greater than or equal to 13.33% of female directors. ***Implies statistically significant differences at greater than 99% confidence level.

38
TABLE 12. THE GENDER PAY GAP IN FEMALE-LED COMPANIES WITH INFORMATION ON DIRECTORS1, 1997-2001 (White-Corrected Standard Errors in Parentheses) Dependent Variable: Log of Gross Compensation, 1997-20012
Female-Led is Company with Female CEO, Chair or
Chair/CEO Female-Led is Company with Female CEO, Chair or Chair/CEO, who is also a Director
1.
2. 3. 4. 5. 6. 7. 8. 9.
Female
-.374***
(.041)
-.380***
(.034)
-.171***
(.034)
-.086***
(.033)
-.105***
(.034)
-.372***
(.034)
-.170***
(.034)
-.086***
(.033)
-.105***
(.033)
Fem-Led Company
Dummy
-.163**
(.041)
-.037
(.030)
-.057** (.028)
-.047 (.027)
-.038 (.029)
-.144***
(.035)
-.112***
(.033)
-.101***
(.031)
-.106***
(.034)
Female-Led
Company * Fem
.512***
(.101)
.574***
(.079)
.035
(.075)
-.005 (.074)
.106
(.082)
.604***
(.088)
.155*
(.082)
.091 (.080)
.136**
(.086)
Share Female
Directors
2.222***
(.083)
.366***
(.074)
.361***
(.067)
. 346***
(.066)
.329***
(.067)
.404***
(.073)
.378***
(.067)
.365***
(.066)
.358***
(.067)
Share Female
Directors * Fem
-.296 (.285)
.562**
(.229)
.641***
(.226)
.256
(.220)
.450**
(.228)
.534***
(.231)
.542**
(.229)
.183
(.221)
.454**
(.229)
Additional Controls
Added
No Ln Market Value, Ln Employ,
Year, SIC2
Column (2) Plus
CEO/Chair
Column (2) Plus
Detailed Occupation
Column (2) Plus
Detailed OccupationExcluding CEO/Chair
Ln Market Value, Ln Employ,
Year, SIC2
Column (6) Plus
CEO/Chair
Column (6) Plus
Detailed Occupation
Column (6) Plus
Detailed Occupation Excluding CEO/Chair
R2 .027 .382 .466 .491 .489 .382 .466 .491 .489
N 32,335 31,711 31,711 31,711 22,700 31,711 31,711 31,711 22,700
__________________________
1Sources: Standard and Poor’s “ExecuComp” Data, 1997-2001, IRRC Directors Data, 1997-2001. 2Total gross compensation is equal to the sum of salary, executive bonus, other annual incentive pay, long-term incentive pay, the Black-Scholes value of options granted, and the value of restricted options.
* Implies statistical significance at greater than the 90% confidence level, **95% confidence level, and ***99% confidence level respectively.
39
TABLE 13. FIXED EFFECTS ESTIMATES OF THE GENDER PAY GAP IN FEMALE-LED COMPANIES, 1997-20011
Dependent Variable: Log of Gross Compensation, 1997-20012
Female-Led is Company with Female CEO,
Chair or Chair/CEO Female-Led is Company with Female CEO, Chair or Chair/CEO, who is also a Director
1. Company
FE
2. Company
FE
3. Individual
FE
4. Individual
FE
5. Company
FE
6. Company
FE
7. Individual
FE 8.
Individual FE
Female
-.126***
(.022)
-.114***
(.019)
-.171***
(.034)
-.086***
(.033)
-.149***
(.022)
-.114***
(.019)
-.086***
(.033)
-.105***
(.033)
Fem-Led Company
Dummy
NA
NA
-.057** (.028)
-.047 (.027)
NA
NA
-.101***
(.031)
-.106***
(.034)
Female-Led
Company * Fem
.048
(.056)
.152**
(.072)
.035
(.075)
-.005 (.074)
.183***
(.063)
.173**
(.077)
.091 (.080)
.136**
(.086)
Share Female
Directors
.001
(.122)
-.001
(.122)
.361***
(.067)
. 346***
(.066)
.404***
(.073)
-.002***
(.122)
.365***
(.066)
.358***
(.067)
Additional Controls
Added
Ln Market Value, Ln Employ,
Year, Detailed
Occupation
Column (1) Excluding CEO/Chair
Column (2) Plus
CEO/Chair
Column (2) Plus Detailed Occupation
Ln Market Value, Ln Employ,
Year, Detailed
Occupation
Column (5) Excluding CEO/Chair
Column (6) Plus
Detailed Occupation
Column (6) Plus
Detailed Occupation Excluding CEO/Chair
R2 .438 .418 .466 .491 .424 .418 .491 .489
N 31,711 22,700 31,711 31,711 31,711 22,700 31,711 22,700
__________________________
1Sources: Standard and Poor’s “ExecuComp” Data, 1997-2001, IRRC Directors Data, 1997-2001.. 2Total gross compensation is equal to the sum of salary, executive bonus, other annual incentive pay, long-term incentive pay, the Black-Scholes value of options granted, and the value of restricted options.
* Implies statistical significance at greater than the 90% confidence level, **95% confidence level, and ***99% confidence level respectively.
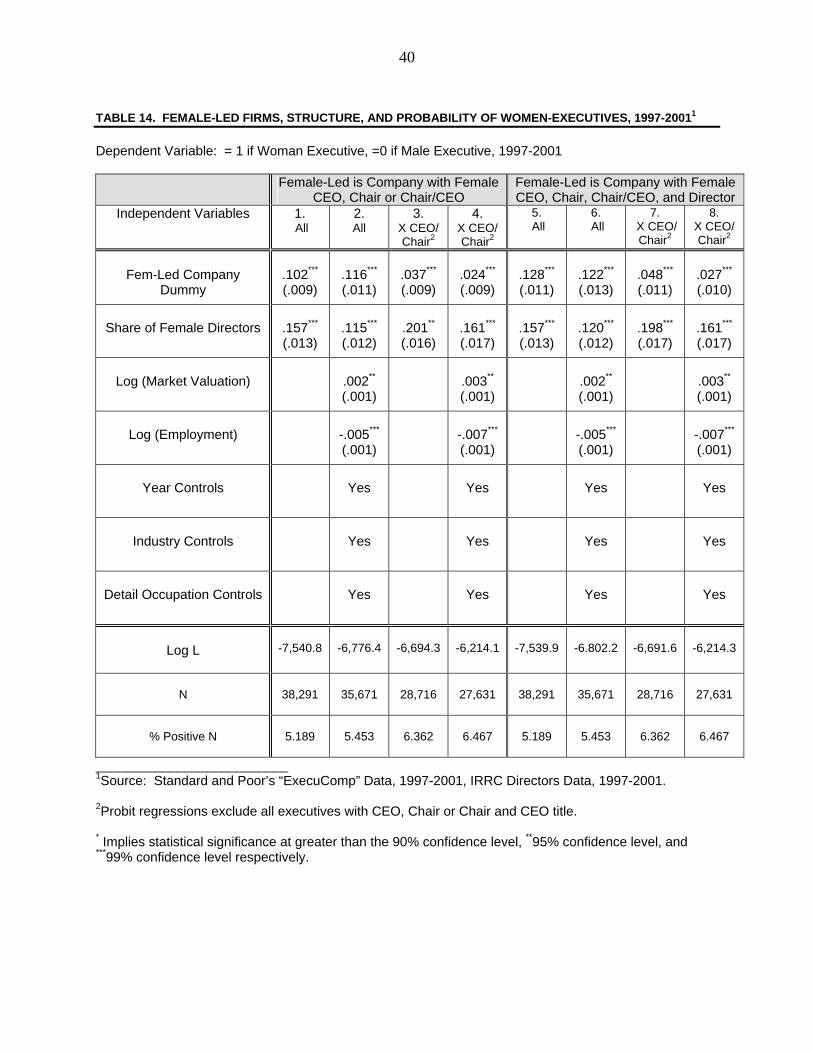
40
TABLE 14. FEMALE-LED FIRMS, STRUCTURE, AND PROBABILITY OF WOMEN-EXECUTIVES, 1997-20011
Dependent Variable: = 1 if Woman Executive, =0 if Male Executive, 1997-2001
Female-Led is Company with Female
CEO, Chair or Chair/CEO Female-Led is Company with Female CEO, Chair, Chair/CEO, and Director
Independent Variables 1. All
2. All
3. X CEO/ Chair2
4. X CEO/ Chair2
5. All
6. All
7. X CEO/ Chair2
8. X CEO/ Chair2
Fem-Led Company
Dummy
.102***
(.009)
.116*** (.011)
.037***
(.009)
.024*** (.009)
.128***
(.011)
.122***
(.013)
.048***
(.011)
.027***
(.010)
Share of Female Directors
.157***
(.013)
.115***
(.012)
.201**
(.016)
.161*** (.017)
.157***
(.013)
.120***
(.012)
.198***
(.017)
.161***
(.017)
Log (Market Valuation)
.002**
(.001)
.003**
(.001)
.002**
(.001)
.003**
(.001)
Log (Employment)
-.005***
(.001)
-.007***
(.001)
-.005***
(.001)
-.007***
(.001)
Year Controls
Yes
Yes
Yes
Yes
Industry Controls
Yes
Yes
Yes
Yes
Detail Occupation Controls
Yes
Yes
Yes
Yes
Log L
-7,540.8
-6,776.4
-6,694.3
-6,214.1
-7,539.9
-6.802.2
-6,691.6
-6,214.3
N
38,291
35,671
28,716
27,631
38,291
35,671
28,716
27,631
% Positive N
5.189
5.453
6.362
6.467
5.189
5.453
6.362
6.467
__________________________ 1Source: Standard and Poor’s “ExecuComp” Data, 1997-2001, IRRC Directors Data, 1997-2001. 2Probit regressions exclude all executives with CEO, Chair or Chair and CEO title.
* Implies statistical significance at greater than the 90% confidence level, **95% confidence level, and ***99% confidence level respectively.