Embed Size (px)
Citation preview

1
WECHSLER INTELLIGENCE SCALE FOR CHILDREN® – FOURTH EDITION
Technical Report #4.1 General Ability Index
Canadian Norms January 2005
Donald H. Saklofske, PhD Lawrence G. Weiss, PhD Jianjun Zhu, PhD Eric Rolfhus, PhD
Susan E. Raiford, PhD Diane Coalson, PhD
Overview This technical report is the fourth in a series intended to introduce the Wechsler Intelligence Scale for Children–Fourth Edition (WISC–IV; Wechsler, 2003). This version of Report #4 (4.1) has been created with tables derived from the Wechsler Intelligence Scale for Children: Fourth Edition: Canadian Manual (WISC–IVCDN; Wechsler, 2004) and thus all tables contained within this report reflect Canadian norms. Technical Report #1 (Williams, Weiss, & Rolfhus, 2003a) presented the theoretical structure and test blueprint for the WISC–IV, as well as subtest changes from the Wechsler Intelligence Scale for Children—Third Edition (WISC–III; Wechsler, 1991). Technical Report #2 (Williams, Weiss, & Rolfhus, 2003b) presented the psychometric properties of the WISC–IV. Technical Report #3 (Williams, Weiss, & Rolfhus, 2003c) addressed the instrument’s clinical validity.
This report provides information about the derivation and uses of the General Ability Index (GAI). The GAI is a composite score that is based on 3 Verbal Comprehension and 3 Perceptual Reasoning subtests, and does not include the Working Memory or Processing Speed subtests included in the Full Scale IQ (FSIQ). Detailed information about the GAI, beyond what is covered in this technical report, is available in a chapter by Saklofske, Prifitera, Weiss, Rolfhus, and Zhu in WISC–IV Clinical Use and Interpretation: Scientist-Practitioner Perspectives (Prifitera, Saklofske, & Weiss, 2005).
Background and History of the Wechsler Composites and the GAI The original Wechsler Intelligence Scale for Children (WISC; Wechsler, 1949), the Wechsler Intelligence Scale for Children—Revised (WISC–R; Wechsler, 1974), and the WISC–III included an FSIQ as well as a Verbal IQ (VIQ) and a Performance IQ (PIQ). The WISC–III introduced four index scores to represent more narrow domains of cognitive function: the Verbal Comprehension Index (VCI), the Perceptual Organization Index (POI), the Freedom from Distractibility Index (FDI), and the Processing Speed Index
CDN
Copyright © 2008 by Pearson Education, Inc. or its affiliate(s). All rights reserved.

. 2
(PSI). With the introduction of these index scores, a total of seven composite scores could be derived with the WISC–III: the FSIQ, VIQ, PIQ, VCI, POI, FDI, and PSI.
The introduction of the index scores gave practitioners the ability to select the composite scores that best described verbal and perceptual ability, based on the outcome of the assessment. When necessary to aid in interpretation, the practitioner could describe verbal abilities using the VCI in place of the VIQ, and describe perceptual abilities using the POI in place of the PIQ. This flexibility was particularly useful when scores for certain subtests contributing to the VIQ or PIQ were discrepant at a significant and unusual level. In particular, the index scores were preferable for cases in which the VIQ was considered less descriptive of verbal ability than the VCI because Arithmetic—a subtest from the working memory domain—was discrepant from the verbal comprehension subtests at a level that was unusual in the standardization sample and for cases in which the PIQ was considered less descriptive of perceptual ability than the POI because Coding—a subtest drawn from the processing speed domain—was discrepant from the perceptual organization subtests at a level that was unusual in the standardization sample.
The GAI was first developed for use with the WISC–III by Prifitera, Weiss, and Saklofske (1998) to offer additional flexibility in describing broad intellectual ability. The WISC–III GAI provided a measure of general cognitive ability that did not include the influence of Arithmetic or Coding on FSIQ. The WISC–III GAI was based on the sum of scaled scores for all subtests that contributed to the traditional ten-subtest FSIQ, with the exception of Arithmetic and Coding. The eight contributing subtests were all drawn from the verbal comprehension and perceptual organization domains, and included Picture Completion, Information, Similarities, Picture Arrangement, Block Design, Vocabulary, Object Assembly, and Comprehension. The WISC–III GAI was recommended as a useful composite to estimate overall ability if a great deal of variability existed within VIQ and/or PIQ due to low scores on Arithmetic and/or Coding (Prifitera et al., 1998). The GAI was subsequently applied for use with the WISC–III using Canadian norms (Weiss, Saklofske, Prifitera, Chen, & Hildebrand, 1999), the WAIS–III (Tulsky, Saklofske, Wilkins, & Weiss, 2001), and the WAIS–III using Canadian norms (Saklofske, Gorsuch, Weiss, Zhu, & Patterson, 2005).
The WISC–IV provides an FSIQ and a four-index framework similar to that of the WISC–III. The framework is based on theory and supported by clinical research and factor-analytic results. As noted in the WISC–IV Technical and Interpretive Manual (Wechsler, 2003), the WISC–IVCDN Canadian Manual (Wechsler, 2004), and in Technical Report #1 (Williams et al., 2003a), the POI was renamed the Perceptual Reasoning Index (PRI) to reflect more accurately the increased emphasis on fluid reasoning abilities in this index, and the FDI was renamed the Working Memory Index (WMI), which more accurately describes the abilities measured. In addition, the dual IQ and Index score structure was no longer utilized. The elimination of the dual structure reduced concerns about the influence of working memory and processing speed when summarizing verbal comprehension and perceptual reasoning abilities, respectively. The WISC–IV FSIQ, however, includes (to a greater extent than the WISC–III FSIQ) the influence of working memory and processing speed, to reflect research that suggests both working memory and processing speed are important factors that contribute to overall intellectual functioning (Engle, Laughlin, Tuholski, & Conway, 1999; Fry & Hale, 1996, 2000; Heinz-Martin, Oberauer, Wittmann, Wilhelm, & Schulze, 2002; Miller & Vernon, 1996; Vigil-Colet & Codorniu-Raga, 2002). Recent research continues to confirm the importance of working memory and processing speed to cognitive ability and to refine knowledge about the nature of these relations (Colom, Rebollo, Palacios, Juan-Espinosa, & Kyllonen, 2004; Mackintosh & Bennett, 2003; Schweizer & Moosbrugger, 2004).
The FSIQ is used most frequently to describe an underlying, global aspect of general intelligence, or g. The FSIQ is utilized for a number of purposes in clinical practice. The FSIQ can serve as a summary of performance across a number of specific cognitive ability domains (i.e., verbal comprehension, perceptual reasoning, working memory, and processing speed). It is used most often in conjunction with other information as part of a diagnostic evaluation in clinics and hospital settings, to determine eligibility to receive special education services in public school settings, or to make decisions about level of care and placement in residential settings.
Copyright © 2008 by Pearson Education, Inc. or its affiliate(s). All rights reserved.

3
The FSIQ is an aggregate score that summarizes performance across multiple cognitive abilities in a single number. When unusual variability is observed within the set of subtests that comprise the FSIQ, clinical interpretation should characterize this diversity of abilities in order to be most useful for parents, teachers, and other professionals.
Introduction to the WISC–IV GAI As with the WISC–III GAI and the WAIS–III GAI, the WISC–IV GAI provides the practitioner a summary score that is less sensitive to the influence of working memory and processing speed. For children with neuropsychological issues such as learning disorders, Attention-Deficit/Hyperactivity Disorder, and other similar issues, difficulties with working memory and processing speed may result in lower FSIQ scores (Wechsler, 2003). In children with intact neuropsychological functioning, the GAI may provide a comparable approximation of overall intellectual ability as represented by the FSIQ (Prifitera et al., 2005; Weiss et al., 1999).
The GAI can be used as a substitute for the FSIQ to determine eligibility for special education services and placement classification. The GAI increases flexibility in this respect, because it is sensitive to cases in which working memory performance is discrepant from verbal comprehension performance and/or processing speed performance is discrepant from perceptual reasoning performance at an unusual level. It can also be compared to the FSIQ to assess the effects of working memory and processing speed on the expression of cognitive ability.
Various sources for GAI tables are available; however, those sources differ according to the method by which they were created. Four such sources are (a) the US Technical Report #4 and this Canadian version #4.1, (b) Prifitera et al. (2005), (c) Flanagan and Kaufman (2004), and (d) Dumont and Willis (2004). The GAI tables provided in the US Technical Report #4 and this Canadian Technical Report #4.1, as well as in Prifitera et al. (2005) are the only GAI tables supported by Pearson Education, Inc. (formerly known as The Psychological Corporation). These tables were created using the actual WISC–IV standardization sample (n = 2200 in the US; n = 1100 in Canada), whereas the GAI tables provided in other sources were created using statistical approximation. The calculations in Flanagan and Kaufman (2004), and Dumont and Willis (2004) were based on a statistical technique for linear equating that was developed by Tellegen and Briggs (1967, Formula 4), which allowed the GAI to be calculated based on intercorrelations among the VCI and the PRI. In contrast, tables in this technical report provide values for the GAI based on the standardization sample, and the sum of subtest scaled scores that contribute to the index. The Tellegen and Briggs formula underestimates scores in the upper portion of the distribution and overestimates scores in the lower portion of the distribution. On average, this difference is approximately 2–3 points, but can be as much as 6 points for some children with mental retardation or some gifted children. The Tellegen and Briggs formula is appropriate for use if the actual standardization data are not available: The tables provided by Flanagan and Kaufman (2004) and by Dumont and Willis (2004) were generated while practitioners were waiting for the tables based on the standardization sample to be created. As the tables based on the standardization sample are now available, those GAI tables should be considered out of date. Thus, practitioners are advised to use the GAI tables in Technical Report #4, which are the same (within rounding variance) as the tables in Prifitera et al. (2005), when American norms are required. Canadian practitioners are advised to use the tables included in this Technical Report #4.1 which are based on the Canadian norms described in the WISC–IVCDN Canadian Manual (Wechsler, 2004).
When to Use the GAI Established practice currently includes the use of ability–achievement discrepancies (AAD) as general screeners for nonspecific learning problems. The WISC–IV Integrated Technical and Interpretive Manual (Wechsler et al., 2004) outlines a number of concerns with the isolated use of the AAD model for identifying learning disabilities. Others have defended the role of cognitive assessment in the evaluation of individuals with brain-based learning disorders, while not necessarily advocating strict adherence to AAD as the only method for classification (Hale, Naglieri, Kaufman, & Kavale, 2004; Scruggs & Mastropieri, 2002).
Copyright © 2008 by Pearson Education, Inc. or its affiliate(s). All rights reserved.

4
An ability–achievement discrepancy indicates that some problem exists, as achievement is not at a level commensurate with cognitive ability. The general finding of such a discrepancy should be followed with additional assessment before a formal diagnosis is rendered. A determination that a learning disability is present requires evidence of impairment in the core cognitive processes underlying the specific academic skill of concern, but an AAD alone may be sufficient evidence to obtain special education services in many public school settings. Although several new models for evaluating learning disorders and learning disabilities have been proposed recently (Berninger, Dunn, & Alper, 2005; Berninger & O’Donnell, 2005), diagnostic markers generally have yet to be established clearly in the literature. Some progress has been made in this area, however. For example, pseudoword decoding and rapid automatized naming appear to predict early reading disorders.
Presently, many school district policies continue to require evidence of an AAD in order to obtain special education services. It was largely for this reason that the GAI was first developed. For some children with learning disabilities, attentional problems, or other neuropsychological issues, concomitant working memory and processing speed deficiencies lower the FSIQ. This is evident in Table 4 (see page 9), which shows that FSIQ < GAI profiles were more often obtained by children in the WISC–IVCDN Canadian special group samples who had been diagnosed with Attention-Deficit/Hyperactivity and Reading and Written Disorders. This contrasts with those Canadian children identified as Intellectually Gifted or with Mild and Moderate Mental Retardation who showed the reverse trend towards FSIQ>GAI. In the US special group samples, the trend toward FSIQ <GAI was noted in more than 70% of children diagnosed with Reading Disorder, Reading and Written Expression Disorders, Reading, Written Expression, and Mathematics Disorders, and Learning Disorder and Attention-Deficit/Hyperactivity Disorder. While potentially clinically meaningful, this reduction in the FSIQ may decrease the magnitude of the AAD for some children with learning disabilities and make them less likely to be found eligible for special education services in educational systems that do not allow consideration of other methods of eligibility determination.
It also may be clinically informative in a number of additional situations to compare the FSIQ and the GAI, to assess the impact of reducing the emphasis on working memory and processing speed on the estimate of general cognitive ability for children with difficulty in those areas due to traumatic brain injury or other neuropsychological difficulties. This comparison may inform rehabilitation programs and/or educational intervention planning.
It is important for practitioners to recognize that the GAI is not necessarily a more valid estimate of overall cognitive ability than the FSIQ. Working memory and processing speed are vital to the comprehensive evaluation of cognitive ability, and excluding these abilities from the evaluation can be misleading. The classroom performance of two children with the same GAI score but very different WMI/PSI scores will likely be quite different. In educational situations where evidence of a significant AAD is required to obtain services, the GAI may be used as the ability score; however, the WMI and PSI should still be reported and interpreted. Refer to chapters 2 and 3 of WISC–IV Clinical Use and Interpretation: Scientist-Practitioner Perspectives (Prifitera et al., 2005) for additional discussion on the issue.
The practitioner may wish to consider using the GAI in a number of clinical situations, not limited to, but including the following:
• a significant and unusual discrepancy exists between VCI and WMI; • a significant and unusual discrepancy exists between PRI and PSI; • a significant and unusual discrepancy exists between WMI and PSI; or • a significant and unusual intersubtest scatter exists within WMI and/or PSI.
To review index discrepancies, consult the discrepancy comparison critical value and base rate tables B.1–B.6 of the WISC–IVCDN Canadian Manual (Wechsler, 2004) using the procedures outlined in chapter 4. The Analysis Page of the WISC–IVCDN Record Form provides space for these pairwise discrepancy comparisons in the Discrepancy Comparisons table. A statistically significant difference between index scores, however, may not indicate that there is a clinically significant difference: The frequency of
Copyright © 2008 by Pearson Education, Inc. or its affiliate(s). All rights reserved.

5
occurrence in the standardization sample (base rate), not just the critical value, should be considered. Consult Table B.2 in the WISC–IVCDN Canadian Manual (Wechsler, 2004) to obtain the base rate for a given discrepancy. Sattler (2001) suggests that differences between scores that occur in less than 10% to 15% of the standardization sample should be judged as unusual. Subtest scatter can be examined within the FSIQ, and within the VCI and PRI, using Table B.6 of the appropriate manual.
The following steps are provided as a guide for calculating the GAI and comparing it to the FSIQ to obtain more information about a child’s cognitive ability.
Calculate the General Ability Sum of Scaled Scores If you have determined that the GAI is important to consider in interpretation, calculate the General Ability Sum of Scaled Scores. The General Ability Sum of Scaled Scores is the sum of scaled scores for three Verbal Comprehension subtests (i.e., Vocabulary, Comprehension, and Similarities) and three Perceptual Reasoning subtests (i.e., Block Design, Matrix Reasoning, and Picture Concepts). Record the General Ability Sum of Scaled Scores.
In some situations, you may choose to substitute a supplemental subtest for a core subtest that contributes to the GAI. Follow the same subtest substitution rules that are outlined in the WISC–IV Administration and Scoring Manual (Wechsler, 2003) or WISC–IVCDN Canadian Manual (Wechsler, 2004) for the FSIQ if you choose to substitute a supplemental subtest for a core subtest that contributes to the GAI. Follow the standard administration order of subtests listed in chapter 2 of the WISC–IV Administration and Scoring Manual (Wechsler, 2003) even when you expect to substitute a supplemental subtest for a core subtest.
Determine the GAI Composite Score Locate the General Ability Sum of Scaled Scores in the extreme left column of Table 1. Read across the row to determine the GAI composite score. Continue to read across the row to find the corresponding percentile rank and confidence intervals. Record the composite score, the percentile rank, and the confidence interval (90% or 95%).
Copyright © 2008 by Pearson Education, Inc. or its affiliate(s). All rights reserved.

6
Table 1 WISC–IVCDN GAI Equivalents of Sums of Scaled Scores: Canadian Norms
Confidence Level Confidence LevelSum of Scaled Scores
GAI Percentile Rank 90% 95%
Sum of Scaled Scores
GAI Percentile Rank 90% 95%
6 40 <0.1 38-48 37-49 60 100 50 95-105 94-106 7 40 <0.1 38-48 37-49 61 101 53 96-106 95-107 8 40 <0.1 38-48 37-49 62 102 55 97-107 96-108 9 40 <0.1 38-48 37-49 63 103 58 98-108 97-109
10 40 <0.1 38-48 37-49 64 104 61 99-109 98-110 11 40 <0.1 38-48 37-49 65 105 63 100-110 99-111 12 40 <0.1 38-48 37-49 66 106 66 100-111 99-112 13 40 <0.1 38-48 37-49 67 107 68 101-112 100-11314 42 <0.1 40-50 39-51 68 108 70 102-113 101-11415 43 <0.1 41-51 40-52 69 110 75 104-115 103-11616 44 <0.1 42-52 41-53 70 111 77 105-116 104-11717 46 <0.1 43-54 42-55 71 113 81 107-118 106-11918 47 <0.1 44-55 43-56 72 115 84 109-119 108-12019 48 <0.1 45-56 44-57 73 116 86 110-120 109-12120 50 <0.1 47-58 46-59 74 117 87 111-121 110-12221 51 0.1 48-59 47-60 75 119 90 113-123 112-12422 52 0.1 49-60 48-61 76 120 91 114-124 113-12523 54 0.1 51-62 50-63 77 121 92 115-125 114-12624 55 0.1 52-62 51-63 78 123 94 117-127 116-12825 56 0.2 53-63 52-64 79 124 95 118-128 117-12926 58 0.3 55-65 54-66 80 125 95 119-129 118-13027 59 0.3 56-66 55-67 81 127 96 120-131 119-13228 60 0.4 57-67 56-68 82 128 97 121-132 120-13329 62 1 59-69 58-70 83 129 97 122-133 121-13430 63 1 60-70 59-71 84 131 98 124-135 123-13631 64 1 61-71 60-72 85 132 98 125-136 124-13732 66 1 62-73 61-74 86 133 99 126-137 125-13833 67 1 63-74 62-75 87 135 99 128-138 127-13934 68 2 64-75 63-76 88 136 99 129-139 128-14035 70 2 66-77 65-78 89 137 99 130-140 129-14136 71 3 67-78 66-79 90 139 99.5 132-142 131-14337 72 3 68-79 67-80 91 140 99.6 133-143 132-14438 73 4 69-80 68-81 92 141 99.7 134-144 133-14539 75 5 71-81 70-82 93 143 99.8 136-146 135-14740 76 5 72-82 71-83 94 144 99.8 137-147 136-14841 77 6 73-83 72-84 95 145 99.9 138-148 137-14942 78 7 74-84 73-85 96 147 99.9 139-150 138-15143 80 9 76-86 75-87 97 148 99.9 140-151 139-15244 81 10 77-87 76-88 98 149 99.9 141-152 140-15345 82 12 78-88 77-89 99 151 >99.9 143-154 142-15546 83 13 79-89 78-90 100 152 >99.9 144-155 143-15647 85 16 81-91 80-92 101 153 >99.9 145-156 144-15748 86 18 81-92 80-93 102 155 >99.9 147-157 146-15849 87 19 82-93 81-94 103 156 >99.9 148-158 147-15950 88 21 83-94 82-95 104 157 >99.9 149-159 148-16051 90 25 85-96 84-97 105 159 >99.9 151-161 150-16252 91 27 86-97 85-98 106 160 >99.9 152-162 151-16353 92 30 87-98 86-99 107 160 >99.9 152-162 151-16354 93 32 88-99 87-100 108 160 >99.9 152-162 151-16355 95 37 90-100 89-101 109 160 >99.9 152-162 151-16356 96 39 91-101 90-102 110 160 >99.9 152-162 151-16357 97 42 92-102 91-103 111 160 >99.9 152-162 151-16358 98 45 93-103 92-104 112 160 >99.9 152-162 151-16359 99 47 94-104 93-105 113 160 >99.9 152-162 151-163
114 160 >99.9 152-162 151-163
Copyright © 2008 by Pearson Education, Inc. or its affiliate(s). All rights reserved.
7
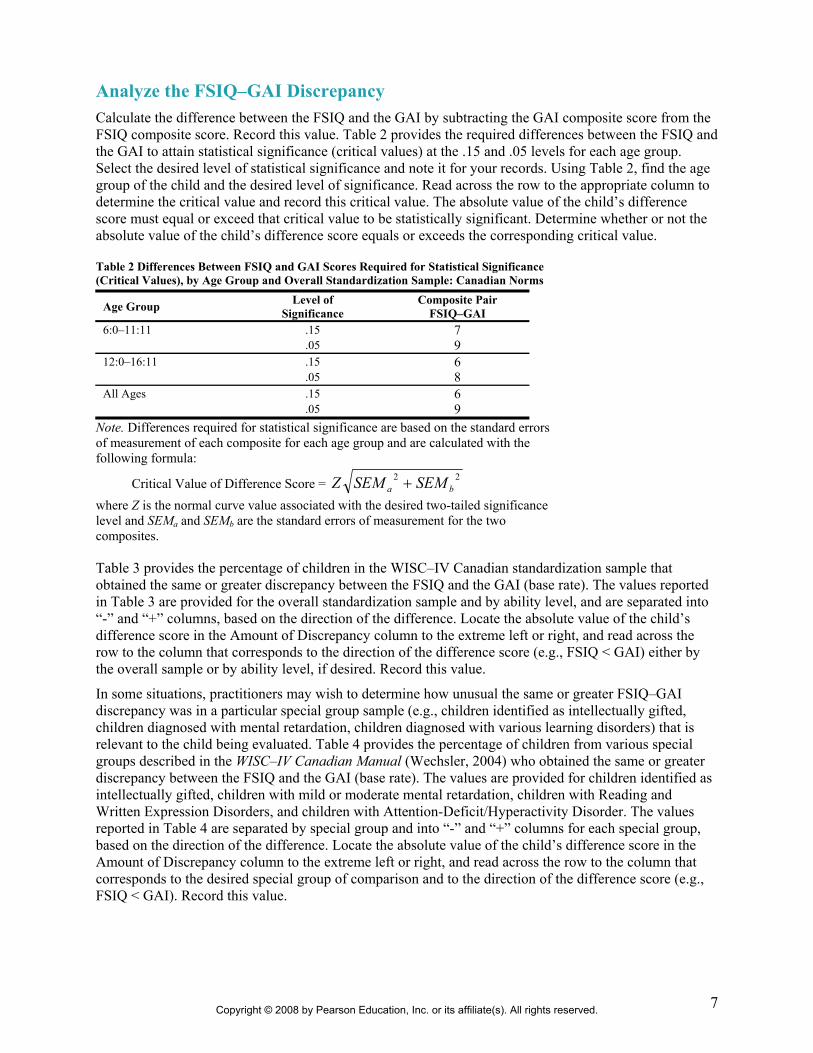
Analyze the FSIQ–GAI Discrepancy Calculate the difference between the FSIQ and the GAI by subtracting the GAI composite score from the FSIQ composite score. Record this value. Table 2 provides the required differences between the FSIQ and the GAI to attain statistical significance (critical values) at the .15 and .05 levels for each age group. Select the desired level of statistical significance and note it for your records. Using Table 2, find the age group of the child and the desired level of significance. Read across the row to the appropriate column to determine the critical value and record this critical value. The absolute value of the child’s difference score must equal or exceed that critical value to be statistically significant. Determine whether or not the absolute value of the child’s difference score equals or exceeds the corresponding critical value.
Table 2 Differences Between FSIQ and GAI Scores Required for Statistical Significance (Critical Values), by Age Group and Overall Standardization Sample: Canadian Norms
Age Group Level of Significance
Composite Pair FSIQ–GAI
6:0–11:11 .15 7 .05 9 12:0–16:11 .15 6 .05 8 All Ages .15 6 .05 9
Note. Differences required for statistical significance are based on the standard errors of measurement of each composite for each age group and are calculated with the following formula:
Critical Value of Difference Score = 22ba SEMSEMZ +
where Z is the normal curve value associated with the desired two-tailed significance level and SEMa and SEMb are the standard errors of measurement for the two composites.
Table 3 provides the percentage of children in the WISC–IV Canadian standardization sample that obtained the same or greater discrepancy between the FSIQ and the GAI (base rate). The values reported in Table 3 are provided for the overall standardization sample and by ability level, and are separated into “-” and “+” columns, based on the direction of the difference. Locate the absolute value of the child’s difference score in the Amount of Discrepancy column to the extreme left or right, and read across the row to the column that corresponds to the direction of the difference score (e.g., FSIQ < GAI) either by the overall sample or by ability level, if desired. Record this value.
In some situations, practitioners may wish to determine how unusual the same or greater FSIQ–GAI discrepancy was in a particular special group sample (e.g., children identified as intellectually gifted, children diagnosed with mental retardation, children diagnosed with various learning disorders) that is relevant to the child being evaluated. Table 4 provides the percentage of children from various special groups described in the WISC–IV Canadian Manual (Wechsler, 2004) who obtained the same or greater discrepancy between the FSIQ and the GAI (base rate). The values are provided for children identified as intellectually gifted, children with mild or moderate mental retardation, children with Reading and Written Expression Disorders, and children with Attention-Deficit/Hyperactivity Disorder. The values reported in Table 4 are separated by special group and into “-” and “+” columns for each special group, based on the direction of the difference. Locate the absolute value of the child’s difference score in the Amount of Discrepancy column to the extreme left or right, and read across the row to the column that corresponds to the desired special group of comparison and to the direction of the difference score (e.g., FSIQ < GAI). Record this value.
Copyright © 2008 by Pearson Education, Inc. or its affiliate(s). All rights reserved.

8
Table 3 Cumulative Percentages of WISC–IVCDN Standardization Sample (Base Rates) Obtaining Various FSIQ–GAI Score Discrepancies, by Overall Sample and Ability Level: Canadian Norms
Overall Sample GAI ≤ 79 80 ≤ GAI ≤ 89 90 ≤ GAI ≤ 109 110 ≤ GAI ≤ 119 GAI ≥ 120
Amount of Discrepancy
FSIQ<GAI (-)
FSIQ>GAI (+)
FSIQ<GAI (-)
FSIQ>GAI (+)
FSIQ<GAI (-)
FSIQ>GAI (+)
FSIQ<GAI (-)
FSIQ>GAI (+)
FSIQ<GAI (-)
FSIQ>GAI (+)
FSIQ<GAI (-)
FSIQ>GAI (+)
Amount of Discrepancy
18 0.1 0.3 0.0 0.0 0.0 0.0 0.0 0.5 0.6 0.0 0.0 0.0 18
17 0.1 0.3 0.0 0.0 0.0 0.0 0.0 0.5 0.6 0.0 0.0 0.0 17
16 0.1 0.3 0.0 0.0 0.0 0.0 0.0 0.5 0.6 0.0 0.0 0.0 16
15 0.2 0.5 0.0 0.0 0.0 0.0 0.0 0.8 0.6 0.0 0.9 0.9 15
14 0.6 0.8 0.0 0.0 0.0 0.0 0.2 1.0 1.9 0.0 2.8 2.8 14
13 1.5 1.2 0.0 1.1 0.0 0.0 0.3 1.5 4.3 0.0 6.5 2.8 13
12 1.8 1.7 0.0 4.3 0.0 0.0 0.5 2.0 4.9 0.0 8.3 2.8 12
11 2.9 3.0 0.0 7.6 0.7 2.2 1.7 3.3 6.8 0.0 9.3 2.8 11
10 4.5 4.5 0.0 12.0 1.5 4.4 2.7 4.5 11.1 1.9 12.0 2.8 10
9 6.5 6.6 2.2 15.2 2.9 6.6 3.7 6.8 13.6 3.1 19.4 3.7 9
8 9.3 9.0 2.2 19.6 4.4 11.7 7.2 8.8 16.7 3.7 22.2 5.6 8
7 12.7 12.3 4.3 28.3 5.1 16.1 10.8 11.6 21.6 5.6 26.9 7.4 7
6 16.9 16.5 4.3 38.0 5.1 21.9 15.1 14.6 27.8 9.9 36.1 11.1 6
5 22.2 22.2 4.3 47.8 5.1 27.0 21.3 20.8 35.8 14.8 43.5 13.0 5
4 26.2 27.2 6.5 52.2 6.6 35.8 25.3 25.8 42.6 19.1 48.1 14.8 4
3 33.7 32.5 8.7 57.6 13.1 45.3 33.4 31.3 50.6 21.0 57.4 18.5 3
2 39.0 38.3 9.8 64.1 17.5 55.5 39.1 37.4 58.0 23.5 62.0 21.3 2
1 45.6 45.7 15.2 71.7 21.9 67.2 45.8 44.6 66.0 30.2 70.4 25.9 1
Mean 4.9 4.9 3.8 5.8 3.8 4.4 4.5 4.9 5.5 4.4 6.1 5.3 Mean
SD 3.2 3.3 3.0 3.2 3.0 2.8 2.8 3.5 3.7 2.7 3.8 4.0 SD
Median 4.0 4.0 3.0 6.0 3.0 4.0 4.0 4.0 5.0 4.0 6.0 4.5 Median
Copyright © 2008 by Pearson Education, Inc. or its affiliate(s). All rights reserved.

9
Table 4 Cumulative Percentages of Various Canadian Special Group Samples (Base Rates) Obtaining Various FSIQ–GAI Score Discrepancies
Clinical Group
GT (N = 25) MR (N = 25) LDRW (N = 25) ADHD (N = 35)
Amount of Discrepancy
FSIQ<GAI (-)
FSIQ>GAI (+)
FSIQ<GAI (-)
FSIQ>GAI (+)
FSIQ<GAI (-)
FSIQ>GAI (+)
FSIQ<GAI (-)
FSIQ>GAI (+)
Amount of Discrepancy
18 0.0 0.0 0.0 0.0 0.0 0.0 0.0 0.0 18
17 0.0 0.0 0.0 0.0 4.3 0.0 0.0 0.0 17
16 0.0 0.0 0.0 0.0 4.3. 0.0 0.0 0.0 16
15 0.0 0.0 0.0 0.0 4.3 0.0 0.0 0.0 15
14 0.0 0.0 0.0 0.0 8.7 0.0 3.0 0.0 14
13 0.0 0.0 0.0 0.0 8.7 0.0 3.0 0.0 13
12 0.0 0.0 0.0 0.0 8.7 0.0 6.1 0.0 12
11 4.0 0.0 0.0 0.0 8.7 0.0 6.1 0.0 11
10 4.0 4.0 0.0 0.0 13.0 0.0 9.1 0.0 10
9 16.0 8.0 8.0 0.0 21.7 4.3 15.2 0.0 9
8 16.0 12.0 8.0 4.0 26.1 8.7 15.2 6.1 8
7 16.0 20.0 12.0 12.0 30.4 13.0 18.2 9.1 7
6 16.0 24.0 12.0 28.0 34.8 17.4 21.2 12.1 6
5 20.0 36.0 12.0 32.0 39.1 17.4 30.3 18.2 5
4 28.0 36.0 20.0 40.0 43.5 17.4 39.4 18.2 4
3 32.0 36.0 20.0 40.0 52.2 21.7 51.5 21.2 3
2 36.0 40.0 20.0 40.0 56.5 30.4 60.6 27.3 2
1 48.0 48.0 20.0 48.0 56.5 39.1 63.6 30.3 1
Mean 4.9 5.5 6.6 5.1 7.5 4.3 5.4 4.7 Mean
SD 3.7 3.0 2.5 2.2 4.4 3.2 3.5 2.6 SD
Median 4.0 5.5 7.0 6.0 7.0 3.0 4.0 5.0 Median
Note. GT = Intellectually Gifted; MR = Mental Retardation; LDRW = Reading and Written Expression Disorders; ADHD = Attention-Deficit/Hyperactivity Disorder.
Copyright © 2008 by Pearson Education, Inc. or its affiliate(s). All rights reserved.

10
Reporting and Describing the GAI Standard Score The GAI is an age-corrected standard score. It can be interpreted similarly to other composite scores, as outlined in chapter 6 of the WISC–IV Technical and Interpretive Manual (Wechsler, 2003) and the WISC–IVCDN Canadian Manual (Wechsler, 2004).
Percentile Rank Age-based percentile ranks are provided for the GAI that indicate a child’s standing relative to other children the same age. Percentile ranks reflect points on a scale at or below which a given percentage of scores lie, based on the standardization sample. The percentile ranks for the GAI are interpreted as are other percentile ranks, as described in chapter 6 of the WISC–IV Technical and Interpretive Manual (Wechsler, 2003) and WISC–IVCDN Canadian Manual (Wechsler, 2004).
Standard Error of Measurement and Confidence Interval Scores on measures of cognitive ability are based on observational data and represent estimates of a child’s true scores. They reflect a child’s true abilities combined with some degree of measurement error. The reliability of the WISC–IVCDN GAI is .95 and the SEM = 3.41. Confidence intervals provide another means of expressing score precision and serve as a reminder that measurement error is inherent in all scores. Refer to chapter 6 of the WISC–IV Technical and Interpretive Manual (Wechsler, 2003) or the WISC–IVCDN Canadian Manual (Wechsler, 2004) for additional information about confidence intervals and their use in interpretation.
Descriptive Classification Composite scores, including the GAI, can be described in qualitative terms according to the child’s level of performance. Refer to chapter 6 of the WISC–IV Technical and Interpretive Manual (Wechsler, 2003) and the WISC–IVCDN Canadian Manual (Wechsler, 2004) for qualitative descriptions of the WISC–IV composite scores, which also may be used to describe the GAI.
Suggested Procedure for Basic Interpretation of the GAI Note that this procedure is supplemental and does not replace any portion of the 10-step procedure outlined in chapter 6 of the WISC–IV Technical and Interpretive Manual (Wechsler, 2003) and WISC–IVCDN Canadian Manual (Wechsler, 2004).
Evaluate the Overall Composite Scores The FSIQ and the GAI are composite scores that should always be evaluated in the context of the subtests that contribute to that composite score. Extreme variability within the subtests that comprise the FSIQ or the GAI indicates that the score represents a summary of diverse abilities. Practitioners should examine closely the relative performance on subtests that contribute to the composite score when interpreting that score. Part of the decision to use the GAI also typically involves reviewing the discrepancies among the four index scores.
Evaluate the FSIQ–GAI Discrepancy The first step in performing a pairwise comparison is aimed at determining whether the absolute value of the score difference is significant. Table 2 provides the minimum differences between the FSIQ and the GAI required for statistical significance (critical values) at the .15 and .05 levels of confidence by age group. When the absolute value of the obtained difference between the FSIQ and the GAI is equal to or
Copyright © 2008 by Pearson Education, Inc. or its affiliate(s). All rights reserved.

11
larger than the critical value, the difference is considered a true difference rather than a difference due to measurement error or random fluctuation. If the two scores are not significantly different, this implies that reducing the influence of working memory and processing speed on the estimate of overall ability resulted in little difference.
If comparison of the FSIQ and the GAI indicates a significant difference, the practitioner should then judge how rare the difference is in the general population. Table 3 provides the cumulative frequency of discrepancies between the FSIQ and the GAI in the WISC–IVCDN standardization sample (base rates). The base rate provides a basis for estimating how rare or common a child’s obtained score difference is compared to the general population. Table 4 provides the cumulative frequency of discrepancies between the FSIQ and the GAI in various WISC–IVCDN special group samples. Refer to chapter 6 of the WISC–IV Technical and Interpretive Manual (Wechsler, 2003) for additional information.
Ability–Achievement Discrepancy When ability–achievement discrepancy assessment is present as part of the learning disability determination process, there are two methods for comparing intellectual ability and academic achievement: the predicted-difference method and the simple-difference method. Although both methods are used, the predicted-difference method is generally preferred because the formula accounts for the reliabilities and the correlations between the two measures. Use of the predicted-difference method requires that the ability and achievement measure were co-normed on the same national sample. The predicted-difference method uses the ability score to predict an achievement score, and then compares the predicted and observed achievement scores. The simple-difference method merely compares the observed ability and achievement scores. The WIAT–II Examiner’s Manual (Pearson Education, Inc., 2002) and the WIAT–IICDN: Canadian Scoring and Normative Supplement for Grades K-16 (Pearson Education formerly known as The Psychological Corporation, 2003) provides additional details related to the rationale for choosing these methods and the statistical procedures involved.
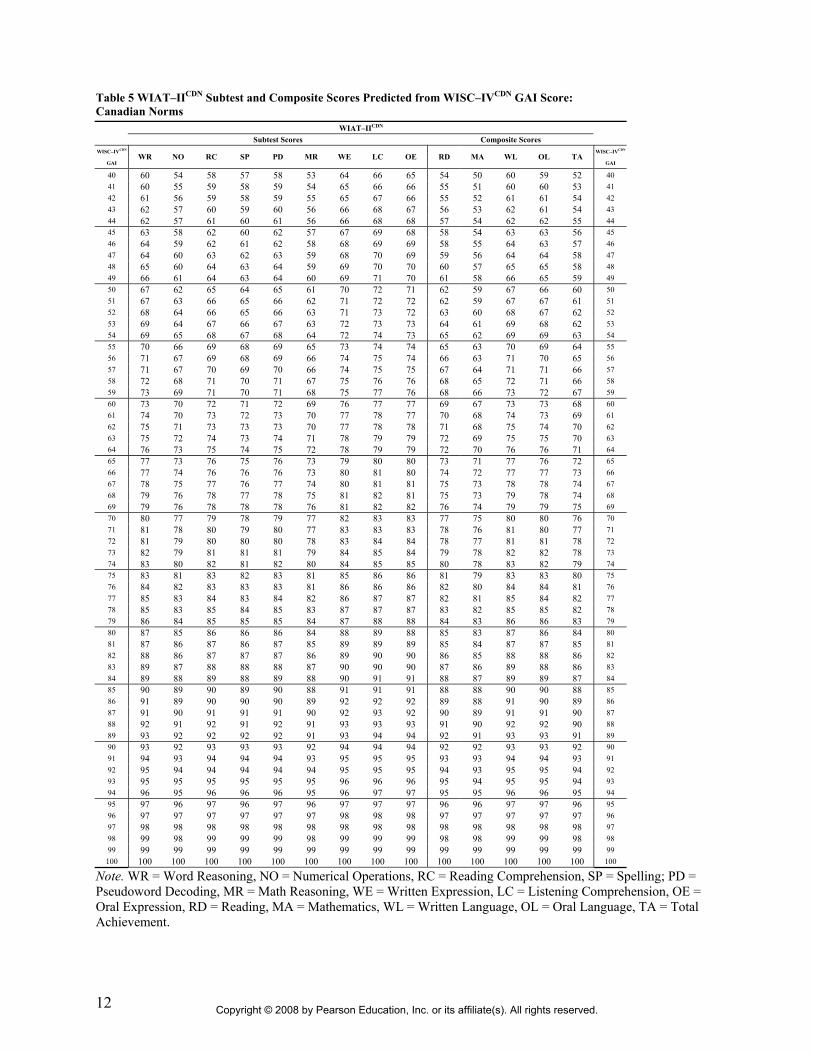
Predicted-Difference Method Table 5 provides WIAT–IICDN subtest and composite scores, employing Canadian standardization data, predicted from WISC–IVCDN GAI scores that are also based on Canadian standardization data. Locate the GAI score in the extreme left or right column, and read across the row to obtain the child’s predicted WIAT–IICDN subtest and composite scores. Record the predicted scores. For each subtest or composite, subtract the child’s predicted score from the obtained score to obtain the difference score. Record these difference scores.
Copyright © 2008 by Pearson Education, Inc. or its affiliate(s). All rights reserved.
12
Table 5 WIAT–IICDN Subtest and Composite Scores Predicted from WISC–IVCDN GAI Score: Canadian Norms WIAT–IICDN
Subtest Scores Composite Scores WISC–IVCDN WISC–IVCDN
GAI WR NO RC SP PD MR WE LC OE RD MA WL OL TA
GAI
40 60 54 58 57 58 53 64 66 65 54 50 60 59 52 40 41 60 55 59 58 59 54 65 66 66 55 51 60 60 53 41 42 61 56 59 58 59 55 65 67 66 55 52 61 61 54 42 43 62 57 60 59 60 56 66 68 67 56 53 62 61 54 43 44 62 57 61 60 61 56 66 68 68 57 54 62 62 55 44 45 63 58 62 60 62 57 67 69 68 58 54 63 63 56 45 46 64 59 62 61 62 58 68 69 69 58 55 64 63 57 46 47 64 60 63 62 63 59 68 70 69 59 56 64 64 58 47 48 65 60 64 63 64 59 69 70 70 60 57 65 65 58 48 49 66 61 64 63 64 60 69 71 70 61 58 66 65 59 49 50 67 62 65 64 65 61 70 72 71 62 59 67 66 60 50 51 67 63 66 65 66 62 71 72 72 62 59 67 67 61 51 52 68 64 66 65 66 63 71 73 72 63 60 68 67 62 52 53 69 64 67 66 67 63 72 73 73 64 61 69 68 62 53 54 69 65 68 67 68 64 72 74 73 65 62 69 69 63 54 55 70 66 69 68 69 65 73 74 74 65 63 70 69 64 55 56 71 67 69 68 69 66 74 75 74 66 63 71 70 65 56 57 71 67 70 69 70 66 74 75 75 67 64 71 71 66 57 58 72 68 71 70 71 67 75 76 76 68 65 72 71 66 58 59 73 69 71 70 71 68 75 77 76 68 66 73 72 67 59 60 73 70 72 71 72 69 76 77 77 69 67 73 73 68 60 61 74 70 73 72 73 70 77 78 77 70 68 74 73 69 61 62 75 71 73 73 73 70 77 78 78 71 68 75 74 70 62 63 75 72 74 73 74 71 78 79 79 72 69 75 75 70 63 64 76 73 75 74 75 72 78 79 79 72 70 76 76 71 64 65 77 73 76 75 76 73 79 80 80 73 71 77 76 72 65 66 77 74 76 76 76 73 80 81 80 74 72 77 77 73 66 67 78 75 77 76 77 74 80 81 81 75 73 78 78 74 67 68 79 76 78 77 78 75 81 82 81 75 73 79 78 74 68 69 79 76 78 78 78 76 81 82 82 76 74 79 79 75 69 70 80 77 79 78 79 77 82 83 83 77 75 80 80 76 70 71 81 78 80 79 80 77 83 83 83 78 76 81 80 77 71 72 81 79 80 80 80 78 83 84 84 78 77 81 81 78 72 73 82 79 81 81 81 79 84 85 84 79 78 82 82 78 73 74 83 80 82 81 82 80 84 85 85 80 78 83 82 79 74 75 83 81 83 82 83 81 85 86 86 81 79 83 83 80 75 76 84 82 83 83 83 81 86 86 86 82 80 84 84 81 76 77 85 83 84 83 84 82 86 87 87 82 81 85 84 82 77 78 85 83 85 84 85 83 87 87 87 83 82 85 85 82 78 79 86 84 85 85 85 84 87 88 88 84 83 86 86 83 79 80 87 85 86 86 86 84 88 89 88 85 83 87 86 84 80 81 87 86 87 86 87 85 89 89 89 85 84 87 87 85 81 82 88 86 87 87 87 86 89 90 90 86 85 88 88 86 82 83 89 87 88 88 88 87 90 90 90 87 86 89 88 86 83 84 89 88 89 88 89 88 90 91 91 88 87 89 89 87 84 85 90 89 90 89 90 88 91 91 91 88 88 90 90 88 85 86 91 89 90 90 90 89 92 92 92 89 88 91 90 89 86 87 91 90 91 91 91 90 92 93 92 90 89 91 91 90 87 88 92 91 92 91 92 91 93 93 93 91 90 92 92 90 88 89 93 92 92 92 92 91 93 94 94 92 91 93 93 91 89 90 93 92 93 93 93 92 94 94 94 92 92 93 93 92 90 91 94 93 94 94 94 93 95 95 95 93 93 94 94 93 91 92 95 94 94 94 94 94 95 95 95 94 93 95 95 94 92 93 95 95 95 95 95 95 96 96 96 95 94 95 95 94 93 94 96 95 96 96 96 95 96 97 97 95 95 96 96 95 94 95 97 96 97 96 97 96 97 97 97 96 96 97 97 96 95 96 97 97 97 97 97 97 98 98 98 97 97 97 97 97 96 97 98 98 98 98 98 98 98 98 98 98 98 98 98 98 97 98 99 98 99 99 99 98 99 99 99 98 98 99 99 98 98 99 99 99 99 99 99 99 99 99 99 99 99 99 99 99 99 100 100 100 100 100 100 100 100 100 100 100 100 100 100 100 100
Note. WR = Word Reasoning, NO = Numerical Operations, RC = Reading Comprehension, SP = Spelling; PD = Pseudoword Decoding, MR = Math Reasoning, WE = Written Expression, LC = Listening Comprehension, OE = Oral Expression, RD = Reading, MA = Mathematics, WL = Written Language, OL = Oral Language, TA = Total Achievement.
Copyright © 2008 by Pearson Education, Inc. or its affiliate(s). All rights reserved.

13
Table 5 WIAT–IICDN Subtest and Composite Scores Predicted from WISC–IVCDN GAI Score: Canadian Norms (continued) WIAT–IICDN
Subtest Scores Composite Scores WISC–IVCDN WISC–IVCDN
GAI WR NO RC SP PD MR WE LC OE RD MA WL OL TA
GAI
101 101 101 101 101 101 101 101 101 101 101 101 101 101 101 101 102 101 102 101 101 101 102 101 101 101 102 102 101 101 102 102 103 102 102 102 102 102 102 102 102 102 102 102 102 102 102 103 104 103 103 103 103 103 103 102 102 102 103 103 103 103 103 104 105 103 104 104 104 104 104 103 103 103 104 104 103 103 104 105 106 104 105 104 104 104 105 104 103 103 105 105 104 104 105 106 107 105 105 105 105 105 105 104 104 104 105 106 105 105 106 107 108 105 106 106 106 106 106 105 105 105 106 107 105 105 106 108 109 106 107 106 106 106 107 105 105 105 107 107 106 106 107 109 110 107 108 107 107 107 108 106 106 106 108 108 107 107 108 110 111 107 108 108 108 108 109 107 106 106 108 109 107 107 109 111 112 108 109 108 109 108 109 107 107 107 109 110 108 108 110 112 113 109 110 109 109 109 110 108 107 108 110 111 109 109 110 113 114 109 111 110 110 110 111 108 108 108 111 112 109 110 111 114 115 110 111 111 111 111 112 109 109 109 112 112 110 110 112 115 116 111 112 111 112 111 112 110 109 109 112 113 111 111 113 116 117 111 113 112 112 112 113 110 110 110 113 114 111 112 114 117 118 112 114 113 113 113 114 111 110 110 114 115 112 112 114 118 119 113 114 113 114 113 115 111 111 111 115 116 113 113 115 119 120 113 115 114 114 114 116 112 111 112 115 117 113 114 116 120 121 114 116 115 115 115 116 113 112 112 116 117 114 114 117 121 122 115 117 115 116 115 117 113 113 113 117 118 115 115 118 122 123 115 117 116 117 116 118 114 113 113 118 119 115 116 118 123 124 116 118 117 117 117 119 114 114 114 118 120 116 116 119 124 125 117 119 118 118 118 120 115 114 115 119 121 117 117 120 125 126 117 120 118 119 118 120 116 115 115 120 122 117 118 121 126 127 118 121 119 119 119 121 116 115 116 121 122 118 118 122 127 128 119 121 120 120 120 122 117 116 116 122 123 119 119 122 128 129 119 122 120 121 120 123 117 117 117 122 124 119 120 123 129 130 120 123 121 122 121 123 118 117 117 123 125 120 120 124 130 131 121 124 122 122 122 124 119 118 118 124 126 121 121 125 131 132 121 124 122 123 122 125 119 118 119 125 127 121 122 126 132 133 122 125 123 124 123 126 120 119 119 125 127 122 122 126 133 134 123 126 124 124 124 127 120 119 120 126 128 123 123 127 134 135 123 127 125 125 125 127 121 120 120 127 129 123 124 128 135 136 124 127 125 126 125 128 122 121 121 128 130 124 124 129 136 137 125 128 126 127 126 129 122 121 121 128 131 125 125 130 137 138 125 129 127 127 127 130 123 122 122 129 132 125 126 130 138 139 126 130 127 128 127 130 123 122 123 130 132 126 127 131 139 140 127 130 128 129 128 131 124 123 123 131 133 127 127 132 140 141 127 131 129 130 129 132 125 123 124 132 134 127 128 133 141 142 128 132 129 130 129 133 125 124 124 132 135 128 129 134 142 143 129 133 130 131 130 134 126 125 125 133 136 129 129 134 143 144 129 133 131 132 131 134 126 125 126 134 137 129 130 135 144 145 130 134 132 132 132 135 127 126 126 135 137 130 131 136 145 146 131 135 132 133 132 136 128 126 127 135 138 131 131 137 146 147 131 136 133 134 133 137 128 127 127 136 139 131 132 138 147 148 132 136 134 135 134 137 129 127 128 137 140 132 133 138 148 149 133 137 134 135 134 138 129 128 128 138 141 133 133 139 149 150 134 138 135 136 135 139 130 129 129 139 142 134 134 140 150 151 134 139 136 137 136 140 131 129 130 139 142 134 135 141 151 152 135 140 136 137 136 141 131 130 130 140 143 135 135 142 152 153 136 140 137 138 137 141 132 130 131 141 144 136 136 142 153 154 136 141 138 139 138 142 132 131 131 142 145 136 137 143 154 155 137 142 139 140 139 143 133 131 132 142 146 137 137 144 155 156 138 143 139 140 139 144 134 132 132 143 146 138 138 145 156 157 138 143 140 141 140 144 134 132 133 144 147 138 139 146 157 158 139 144 141 142 141 145 135 133 134 145 148 139 139 146 158 159 140 145 141 142 141 146 135 134 134 145 149 140 140 147 159 160 140 146 142 143 142 147 136 134 135 146 150 140 141 148 160
Note. WR = Word Reasoning, NO = Numerical Operations, RC = Reading Comprehension, SP = Spelling; PD = Pseudoword Decoding, MR = Math Reasoning, WE = Written Expression, LC = Listening Comprehension, OE = Oral Expression, RD = Reading, MA = Mathematics, WL = Written Language, OL = Oral Language, TA = Total Achievement.
Copyright © 2008 by Pearson Education, Inc. or its affiliate(s). All rights reserved.

14
The practitioner must take into account the statistical significance and the base rate of the difference scores. Table 6 provides the required differences between the predicted and obtained WIAT–IICDN subtest and composite scores to attain statistical significance (critical values) at the .05 and .01 levels for two age groups (ages 6:0–11:11 and ages 12:0–16:11). Select the desired level of statistical significance and note it for your records. Using Table 6, find the age group of the child and the desired level of significance. For each subtest or composite, read across the row to the appropriate column to determine the critical value, and record it. The absolute value of the child’s difference score must equal or exceed that critical value to be statistically significant. Determine whether or not the absolute value of the child’s difference score equals or exceeds the corresponding critical value.
Table 6 Differences Between Predicted and Obtained WIAT–IICDN Subtest and Composite Scores Required for Statistical Significance (Critical Values): Predicted-Difference Method Using WISC–IVCDN GAI: Canadian Norms
Subtest/Composite Significance Level Ages 6–11 Ages 12–16
Word Reading .05 6 9 .01 8 12
Numerical Operations .05 11 9 .01 15 12
Reading Comprehension .05 9 9 .01 12 12
Spelling .05 9 10 .01 12 13
Pseudoword Decoding .05 6 7 .01 8 10
Math Reasoning .05 12 11 .01 15 14
Written Expression .05 12 12 .01 15 16
Listening Comprehension .05 14 15 .01 18 19
Oral Expression .05 12 12 .01 15 15
Reading .05 6 7 .01 8 9
Mathematics .05 10 9 .01 13 11
Written Language .05 8 10 .01 11 13
Oral Language .05 11 12 .01 15 15
Total .05 7 7 .01 9 9
Copyright © 2008 by Pearson Education, Inc. or its affiliate(s). All rights reserved.

15
If comparison of the predicted and obtained WIAT–IICDN subtest and composite scores indicates a significant difference, the practitioner should then judge how rare the difference is in the general population. Table 7 provides the cumulative frequency of discrepancies between the predicted and obtained WIAT–IICDN subtest and composite scores in the WISC–IVCDN standardization sample (base rate). Locate the subtest or composite of interest in the extreme left column, and read across the row to locate the child’s difference score. The column header above the child’s difference score indicates the percentage of the theoretical normal distribution (base rates) that represents the percentage of the sample that obtained WIAT–IICDN scores lower than their WISC–IVCDN GAI scores by the specified amount or more. Table 7 Differences Between Predicted and Obtained WIAT–IICDN Subtest and Composite Scores for Various Percentages of the Theoretical Normal Distribution (Base Rates): Predicted-Difference Method Using WISC–IVCDN GAI: Canadian Norms
Percentage of Theoretical Normal Distribution (Base Rates)
Subtest/Composite 25 20 15 10 5 4 3 2 1
Word Reading 8 10 12 15 19 20 21 23 26
Numerical Operations 7 9 11 13 17 18 19 21 23
Reading Comprehension 8 10 12 14 18 19 21 23 25
Spelling 8 9 11 14 18 19 20 22 25
Pseudoword Decoding 8 10 12 14 18 19 21 23 25
Math Reasoning 7 8 10 13 16 17 18 20 22
Written Expression 9 11 13 16 20 22 23 25 28
Listening Comprehension 9 11 13 16 21 22 24 26 29
Oral Expression 9 11 13 16 21 22 23 26 29
Reading 7 9 10 13 16 17 19 20 23
Mathematics 6 8 9 11 14 15 16 18 20
Written Language 8 10 12 15 19 20 21 23 26
Oral Language 8 10 12 15 19 20 21 23 26
Total 7 8 10 12 15 16 17 19 21
Note. Percentages in Table 7 represent the theoretical proportion of WIAT–IICDN scores lower than WISC–IVCDN GAI scores by the specified amount or more.
Copyright © 2008 by Pearson Education, Inc. or its affiliate(s). All rights reserved.
16
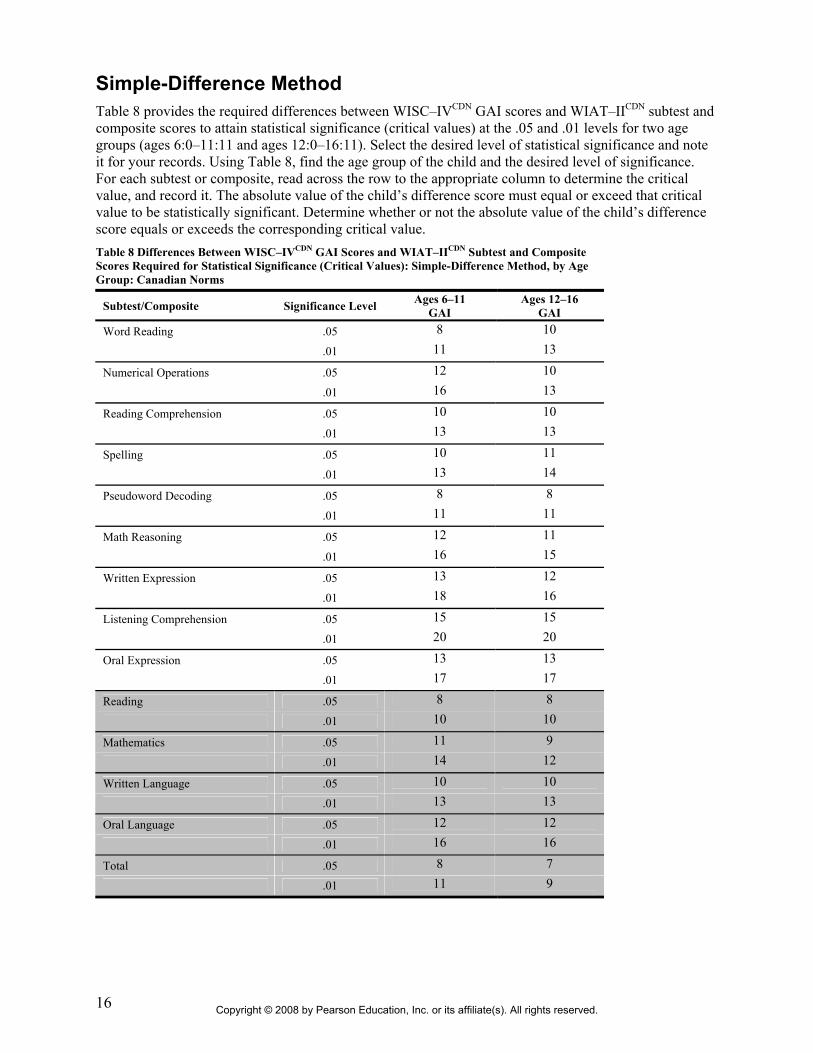
Simple-Difference Method Table 8 provides the required differences between WISC–IVCDN GAI scores and WIAT–IICDN subtest and composite scores to attain statistical significance (critical values) at the .05 and .01 levels for two age groups (ages 6:0–11:11 and ages 12:0–16:11). Select the desired level of statistical significance and note it for your records. Using Table 8, find the age group of the child and the desired level of significance. For each subtest or composite, read across the row to the appropriate column to determine the critical value, and record it. The absolute value of the child’s difference score must equal or exceed that critical value to be statistically significant. Determine whether or not the absolute value of the child’s difference score equals or exceeds the corresponding critical value. Table 8 Differences Between WISC–IVCDN GAI Scores and WIAT–IICDN Subtest and Composite Scores Required for Statistical Significance (Critical Values): Simple-Difference Method, by Age Group: Canadian Norms
Subtest/Composite Significance Level Ages 6–11 GAI
Ages 12–16 GAI
Word Reading .05 8 10 .01 11 13
Numerical Operations .05 12 10 .01 16 13
Reading Comprehension .05 10 10 .01 13 13
Spelling .05 10 11 .01 13 14
Pseudoword Decoding .05 8 8 .01 11 11
Math Reasoning .05 12 11 .01 16 15
Written Expression .05 13 12 .01 18 16
Listening Comprehension .05 15 15 .01 20 20
Oral Expression .05 13 13 .01 17 17
Reading .05 8 8 .01 10 10
Mathematics .05 11 9 .01 14 12
Written Language .05 10 10 .01 13 13
Oral Language .05 12 12 .01 16 16
Total .05 8 7 .01 11 9
Copyright © 2008 by Pearson Education, Inc. or its affiliate(s). All rights reserved.

17
If comparison of the WISC–IVCDN GAI score and the WIAT–IICDN subtest and composite scores indicates a significant difference, the practitioner should then judge how rare the difference is in the general population. Table 9 provides the cumulative frequency of discrepancies between the WISC–IVCDN GAI and WIAT–IICDN subtest and composite scores in the WISC–IVCDN standardization sample (base rates). Locate the subtest or composite of interest in the extreme left column, and read across the row to locate the child’s difference score. The column header above the child’s difference score indicates the percentage of the theoretical normal distribution (base rate) that represents the percentage of the sample that obtained WIAT–IICDN scores lower than their WISC–IVCDN GAI scores by the specified amount or more. Table 9 Differences Between WISC–IVCDN GAI Scores and WIAT–IICDN Subtest and Composite Scores for Various Percentages of the Theoretical Normal Distribution (Base Rates): Simple-Difference Method: Canadian Norms
Percentage of Theoretical Normal Distribution (Base Rates)
Subtest/Composite 25 20 15 10 5 4 3 2 1
Word Reading 9 11 13 16 21 22 23 26 29
Numerical Operations 8 9 11 14 18 19 20 22 25
Reading Comprehension 8 10 13 15 20 21 22 24 28
Spelling 8 10 12 15 19 20 22 24 27
Pseudoword Decoding 8 10 13 15 20 21 22 24 28
Math Reasoning 7 9 11 13 17 18 19 21 24
Written Expression 10 12 14 18 23 24 26 28 32
Listening Comprehension 10 12 15 18 23 25 27 29 33
Oral Expression 10 12 15 18 23 25 26 29 32
Reading 7 9 11 14 17 18 20 21 24
Mathematics 6 8 10 12 15 16 17 18 21
Written Language 9 11 13 16 21 22 23 26 29
Oral Language 9 11 13 16 20 22 23 25 28
Total 7 8 10 13 16 17 18 20 23
Note. Percentages in Table 9 represent the theoretical proportion of WIAT–IICDN scores lower than WISC–IVCDN GAI scores by the specified amount or more.
Conclusion This technical report has provided an overview of the GAI, historical context for the development of the GAI, and recommended procedures for determining and interpreting the GAI. Of particular relevance is that the Canadian standardization data were used to create the GAI tables reported in this Technical Report 4.1. This report also has provided recommended procedures for the use of the GAI in ability–achievement comparisons, again using WIAT–IICDN Canadian standardization data. The GAI provides important information regarding a child’s cognitive functioning, but it should never be interpreted in isolation. It is best interpreted in conjunction with a thorough history and careful clinical observations of the child. Many additional sources of information are typically available to the practitioner: medical, educational, and psychosocial history gathered from both the child and collateral informants, when appropriate; direct behavioral observations; previous test scores; qualitative aspects of test performance; and results from other relevant instruments given in a battery. In addition, the practitioner should evaluate results within the context of the referral question or purpose of the evaluation.
Copyright © 2008 by Pearson Education, Inc. or its affiliate(s). All rights reserved.

18
References Berninger, V. W., Dunn, A., & Alper, T. (2005).
Integrated multilevel model for branching assessment, instructional assessment, and profile assessment. In A. Prifitera, D. H. Saklofske, & L. G. Weiss (Eds.), WISC–IV clinical use and interpretation: Scientist-practitioner perspectives (pp. 151–185). New York: Academic Press.
Berninger, V. W., & O’Donnell, L. (2005). Research-supported differential diagnosis of specific learning disabilities. In A. Prifitera, D. H. Saklofske, & L. G. Weiss (Eds.), WISC–IV clinical use and interpretation: Scientist-practitioner perspectives (pp. 189–233). New York: Academic Press.
Colom, R., Rebollo, I., Palacios, A., Juan-Espinosa, M., & Kyllonen, P. C. (2004). Working memory is (almost) perfectly predicted by g. Intelligence, 32, 277–296.
Dumont, R., & Willis, J. (2004). Use of the Tellegen and Briggs formula to determine the Dumont-Willis Indexes for the WISC–IV. Retrieved December 1, 2004 from http://alpha.fdu.edu/psychology/ WISCIV_DWI.htm
Engle, R. W., Laughlin, J. E., Tuholski, S. W., & Conway, A. R. A. (1999). Working memory, short-term memory, and general fluid intelligence: A latent-variable approach. Journal of Experimental Psychology: General, 128, 309–331.
Flanagan, D. P., & Kaufman, A. S. (2004). Essentials of WISC–IV assessment. Hoboken, NJ: Wiley.
Fry, A. F., & Hale, S. (1996). Processing speed, working memory, and fluid intelligence: Evidence for a developmental cascade. Psychological Science, 7, 237–241.
Fry, A. F., & Hale, S. (2000). Relationships among processing speed, working memory, and fluid intelligence in children. Biological Psychology, 54, 1–34.
Hale, J. B., Naglieri, J. A., Kaufman, A. S., & Kavale, K. A. (2004). Specific learning disability classification in the new Individuals with Disabilities Education Act:
The danger of good ideas. The School Psychologist, 58, 6–13, 29.
Pearson Education, Inc. (2002). Wechsler Individual Achievement Test–Second Edition. San Antonio, TX: Author.
Pearson Education, Inc. (2003). Wechsler Individual Achievement Test-Second Edition: Canadian Scoring and Normative Supplement for Grades K-16. Toronto, Ontario, Canada: PsychCorp.
Heinz-Martin, S., Oberauer, K., Wittmann, W. W., Wilhelm, O., & Schulze, R. (2002). Working-memory capacity explains reasoning ability—and a little bit more. Intelligence, 30, 261–288.
Mackintosh, N. J., & Bennett, E. S. (2003). The fractionation of working memory maps onto different components of intelligence. Intelligence, 31, 519–531.
Miller, L. T., & Vernon, P. A. (1996). Intelligence, reaction time, and working memory in 4- to 6-year-old children. Intelligence, 22, 155–190.
Prifitera, A., Saklofske, D. H., & Weiss, L. G. (Eds.). (2005). WISC–IV clinical use and interpretation: Scientist-practitioner perspectives. New York: Academic Press.
Prifitera, A., Weiss, L. G., & Saklofske, D. H. (1998). The WISC–III in context. In A. Prifitera & D. H. Saklofske (Eds.), WISC–III clinical use and interpretation: Scientist-practitioner perspectives (pp. 1–38). New York: Academic Press.
Saklofske, D. H., Gorsuch, R. L., Weiss, L. G., Zhu, J. J., & Patterson, C. A. (2005). General ability index for the WAIS–III: Canadian norms. Canadian Journal of Behavioural Science, 37, 44–48.
Saklofske, D. H., Prifitera, A., Weiss, L. G., Rolfhus, E., & Zhu, J. (2005). Clinical interpretation of the WISC–IV FSIQ and GAI. In A. Prifitera, D. H. Saklofske, & L. G. Weiss (Eds.), WISC–IV clinical use and interpretation: Scientist-practitioner perspectives (pp. 33–65). New York: Academic Press.
Copyright © 2008 by Pearson Education, Inc. or its affiliate(s). All rights reserved.

19
Sattler J. M. (2001). Assessment of children: Cognitive applications (4th ed.). San Diego, CA: Author.
Schweizer, K., & Moosbrugger, H. (2004). Attention and working memory as predictors of intelligence. Intelligence, 32, 329–347.
Scruggs, T. E., & Mastropieri, M. A. (2002). On babies and bathwater: Addressing the problems of identification of learning disabilities. Learning Disability Quarterly, 25, 155–168.
Tellegen, A., & Briggs, P. (1967). Old wine in new skins: Grouping Wechsler subtests into new scales. Journal of Consulting Psychology, 31, 499-506.
Tulsky, D. S., Saklofske, D. H., Wilkins, C., & Weiss, L. G. (2001). Development of a general ability index for the Wechsler Adult Intelligence Scale—Third Edition. Psychological Assessment, 13, 566–571.
Vigil-Colet, A., & Codorniu-Raga, M. J. (2002). How inspection time and paper and pencil measures of processing speed are related to intelligence. Personality and Individual Differences, 33, 1149–1161.
Wechsler, D. (1949). Wechsler Intelligence Scale for Children. New York: The Psychological Corporation.
Wechsler, D. (1974). Wechsler Intelligence Scale for Children—Revised. San Antonio, TX: The Psychological Corporation.
Wechsler, D. (1991). Wechsler Intelligence Scale for Children—Third Edition. San Antonio, TX: The Psychological Corporation.
Wechsler, D. (2003). Wechsler Intelligence Scale for Children–Fourth Edition. San Antonio, TX: Pearson Education, Inc.
Wechsler, D. (2004). Wechsler Intelligence Scale for Children–Fourth Edition: Canadian Manual. Toronto, Ontario, Canada: PsychCorp.
Wechsler, D., Kaplan, E., Fein, D., Kramer, J., Morris, R., Delis, D., & Maerlender, A. (2004). Wechsler Intelligence Scale for Children–Fourth Edition–Integrated. San Antonio, TX: Pearson Education, Inc.
Weiss, L. G., Saklofske, D. H., Prifitera, A., Chen, H. Y., & Hildebrand, D. K. (1999). The calculation of the WISC–III general ability index using Canadian norms. The Canadian Journal of School Psychology, 14, 1–9.
Williams, P. E., Weiss, L. G., & Rolfhus, E. (2003a). Theoretical model and test blueprint (WISC–IV Technical Report No. 1). Retrieved December 8, 2004, from http://pearsonassess.com/hai/Images/ pdf/wisciv/WISCIVTechReport1.pdf
Williams, P. E., Weiss, L. G., & Rolfhus, E. (2003b). Psychometric properties (WISC–IV Technical Report No. 2). Retrieved December 8, 2004, from http://pearsonassess.com/hai/Images/ pdf/wisciv/WISCIVTechReport2.pdf
Williams, P. E., Weiss, L. G., & Rolfhus, E. (2003c). Clinical validity (WISC–IV Technical Report No. 3). Retrieved December 8, 2004, from http://pearsonassess.com/hai/Images/ pdf/wisciv/WISCIVTechReport3.pdf
Copyright © 2008 by Pearson Education, Inc. or its affiliate(s). All rights reserved.


![Gai Luron - [T11] - La Bataille Navale Ou Gai Luron en Slip](https://img.dokumen.tips/doc/110x75/55cf98fb550346d0339ad6f0/gai-luron-t11-la-bataille-navale-ou-gai-luron-en-slip-568455408fdaf.jpg)